filipino 2040 energy: power security and...
TRANSCRIPT

Working Paper 2016-01R
EPDP Working Papers are preliminary versions disseminated to elicit critical comments. They are protected by Republic Act No. 8293 and are not for quotation or reprinting without prior approval. This study is made possible by the generous support of the American People through the United States Agency for International Development (USAID) under the Energy Policy and Development Program (EPDP). EPDP is a four-year program implemented by the UPecon Foundation, Inc. The contents or opinions expressed in this paper are the authors’ sole responsibility and do not necessarily reflect the views of USAID or the United States Government or the UPecon Foundation, Inc. Any errors of commission or omission are the authors’ and should not be attributed to any of the above.
March 2017
Filipino 2040 Energy: Power Security
and Competitiveness
By
Majah-Leah V. Ravago, Raul V. Fabella, Ruperto P. Alonzo, Rolando A. Danao, Dennis S. Mapa
University of the Philippines and Energy Policy and Development Program (EPDP)
ENERGY POLICY AND DEVELOPMENT PROGRAM (EPDP)
UPecon Foundation

FILIPINO 2040 ENERGY: POWER SECURITY AND COMPETITIVENESS*
Majah-Leah Ravago, Raul Fabella, Ruperto Alonzo, Rolando Danao, and Dennis Mapa † University of the Philippines (UP) and Energy Policy and Development Program (EPDP)
EPDP Working Paper 2016-01R
March 15, 2017
Abstract
The Filipinos’ vision for themselves by 2040 is for them to enjoy a stable and comfortable lifestyle, having enough for their daily needs and unforeseen expenses, so they can plan and prepare for their own and their children’s futures. This paper looks at one major commodity that bears heavily on every Filipino consumer’s expenses: electricity. By focusing on the generation sector, it presents two possible scenarios for the next 25 years and illustrates how policy reforms on fuel mix can potentially reduce blended generation charges that make up 47% of the total electric bill of households. This paper also provides an assessment of the power sector’s performance and suggests broad key reforms and alternative pathways needed for the sector to contribute to the overall vision of a strong-growth economy and improved well-being of Filipinos by 2040.
Keywords: Electricity industry, scenario-building, reforms, Philippines JEL: Q41, Q42, Q43, Q47, Q48
* This paper is made possible by the generous support of the American People through the United StatesAgency for International Development (USAID) to the Energy Policy and Development Program (EPDP).The EPDP is a four-year program implemented by the UPecon Foundation, Inc. The contents oropinions expressed in this paper are the authors’ sole responsibility and do not necessarily reflect theviews of USAID or the United States Government or the UPecon Foundation, Inc. Any errors ofcommission or omission are the authors’ and should not be attributed to any of the above.
† The authors gratefully acknowledge the valuable review and comments of Dr. Francisco Viray that became the basis of the calculation of required generation capacity and blended generation charge. The authors acknowledge the input of Dr. Geoffrey Ducanes in the modeling of electricity consumption. They also thank the excellent research assistance of EPDP’s Shirra de Guia, J.Kat Magadia, Miah Pormon, Tim Guanzon, and Mico del Mundo. Mari-An Santos, Jean Lau Wang, Donna Bajaro, Renzi Frias, and Rainer dela Cruz assisted in the finalization of this paper. The comments and suggestions from the participants of the Filipino 2040 project of NEDA and the participants of the EPDP Lecture Series helped form the final shape of this paper.
1
Energy: Power Security and Competitiveness
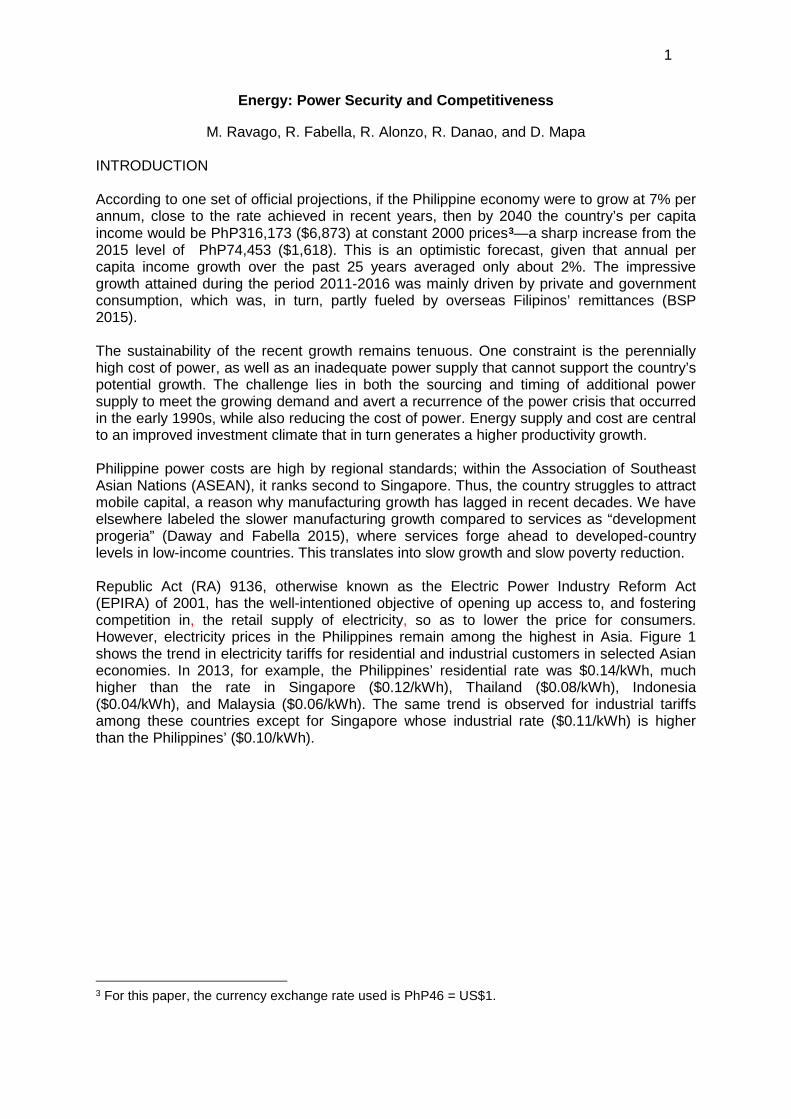
M. Ravago, R. Fabella, R. Alonzo, R. Danao, and D. Mapa INTRODUCTION According to one set of official projections, if the Philippine economy were to grow at 7% per annum, close to the rate achieved in recent years, then by 2040 the country’s per capita income would be PhP316,173 ($6,873) at constant 2000 prices3—a sharp increase from the 2015 level of PhP74,453 ($1,618). This is an optimistic forecast, given that annual per capita income growth over the past 25 years averaged only about 2%. The impressive growth attained during the period 2011-2016 was mainly driven by private and government consumption, which was, in turn, partly fueled by overseas Filipinos’ remittances (BSP 2015). The sustainability of the recent growth remains tenuous. One constraint is the perennially high cost of power, as well as an inadequate power supply that cannot support the country’s potential growth. The challenge lies in both the sourcing and timing of additional power supply to meet the growing demand and avert a recurrence of the power crisis that occurred in the early 1990s, while also reducing the cost of power. Energy supply and cost are central to an improved investment climate that in turn generates a higher productivity growth. Philippine power costs are high by regional standards; within the Association of Southeast Asian Nations (ASEAN), it ranks second to Singapore. Thus, the country struggles to attract mobile capital, a reason why manufacturing growth has lagged in recent decades. We have elsewhere labeled the slower manufacturing growth compared to services as “development progeria” (Daway and Fabella 2015), where services forge ahead to developed-country levels in low-income countries. This translates into slow growth and slow poverty reduction. Republic Act (RA) 9136, otherwise known as the Electric Power Industry Reform Act (EPIRA) of 2001, has the well-intentioned objective of opening up access to, and fostering competition in, the retail supply of electricity, so as to lower the price for consumers. However, electricity prices in the Philippines remain among the highest in Asia. Figure 1 shows the trend in electricity tariffs for residential and industrial customers in selected Asian economies. In 2013, for example, the Philippines’ residential rate was $0.14/kWh, much higher than the rate in Singapore ($0.12/kWh), Thailand ($0.08/kWh), Indonesia ($0.04/kWh), and Malaysia ($0.06/kWh). The same trend is observed for industrial tariffs among these countries except for Singapore whose industrial rate ($0.11/kWh) is higher than the Philippines’ ($0.10/kWh).
3 For this paper, the currency exchange rate used is PhP46 = US$1.
2
Several factors explain the Philippines’ high power cost despite the fact that 25-29% of its fuel source is from relatively lower-cost hydro and geothermal. As will be explained below, these include fuel mix, taxes and subsidies, low reserves and low generation capacity per capita, average size of generation plants, overall efficiency, volatility, and absence of competition in Power Supply Agreement (PSA) contracting (Fabella 2016). The EPIRA mandates all industry participants to unbundle their own operations according to their functions and, consequently, unbundle their rates, charges, and costs. Figure 2 shows the breakdown of Meralco’s (Manila Electric Company) tariff for its residential, commercial, and industrial customers. With regard to the retail price of electricity for residential consumers, a household that consumes about 200 kWh a month in Meralco’s franchise area has a monthly bill of about PhP1,888 ($41), using the average price of PhP9.68/kWh in 2015. This household would typically have a refrigerator, electric fan, flat iron, TV set, and radio. For residential consumers, generation charges make up 47.4% of the bill, followed by distribution charges that include supply and metering at 27.2%. Transmission charges make
Figure 1: Electricity Tariffs in Selected Asian Economies, constant 2005 US$
(a) Residential
(b) Industrial
Source of basic price data: Enerdata. n.d. “Energy data.”
02468
1012141618
2000
2001
2002
2003
2004
2005
2006
2007
2008
2009
2010
2011
2012
2013
2014
US₵/kWh
02468
1012141618
2000
2001
2002
2003
2004
2005
2006
2007
2008
2009
2010
2011
2012
2013
2014
US₵/kWh

3
up about 9%. Transmission losses are about 5%. Taxes and subsidies are 11% and the feed-in tariff (FIT) allowance is 0.4%.
In this paper, we focus on the generation sector. We present two possible forward-looking scenarios running up to 2040 to illustrate how policy reforms with regard to fuel mix can potentially lower power rates. A significant reduction in the blended generation charges that make up 47.4% of the total bill will clearly improve the economic well-being of Filipino consumers. The numerical computation illustrates that to bring the price of power down, the fuel mix would not be constant over time but should exploit the opportunities opened up by less costly resources while taking environmental (including health) costs into account. We also provide an assessment of the power sector’s performance and suggest broad key reforms and alternative pathways needed for the sector to contribute to the overall vision of a strong-growth economy.
Figure 2: Manila Electric Company’s (Meralco) Breakdown of Tariff
Source of basic data: Meralco, 2015, “Average Rates by Customer Class and Billing Component.”
54%47%
55%62%
10%
9%
11%12%5%
5%
4%4%
18%27%
15%10%
12% 11% 14% 12%0.5% 0.4% 0.5% 0.6%
0%
10%
20%
30%
40%
50%
60%
70%
80%
90%
100%
Overall Residential Commercial Industrial
4
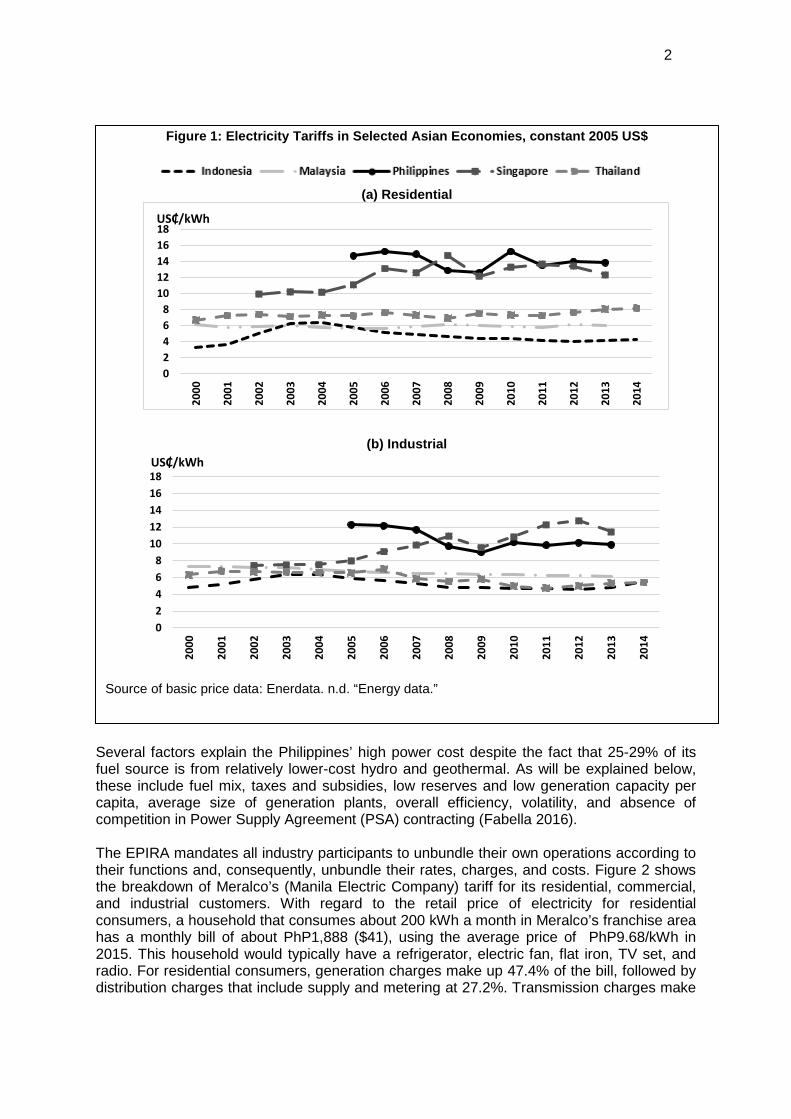
I. BASELINE ASSESSMENT OF POWER SECTOR PERFORMANCE The sustainability of the economic growth during the last four years remains tenuous. The Philippine investment rate has remained at well below 25% of Gross Domestic Product (GDP) while the saving rate is now at 25% of GDP—making the Philippines a net lender to the world. Government investment, as percentage of GDP, remains at less than its target level of 5%. To achieve the Filipino 2040 vision, growth must quickly become investment-driven with the investment rate at 25-27% of GDP. This would mean a government capital outlay of 6-7% and a private investment rate of 21-22%. This is an immense departure from the historical level of approximately 1.5% of GDP for government infrastructure spending and 17% for the private investment rate. These investment targets have not been attained in the last quarter century. On the one hand, the government will be hard-pressed to try to reach this level of government capital outlay unless it addresses the causes of the spending gridlock and miserable absorptive capacity. This problem cannot be addressed by simply creating facile corruption-prone programs of entitlements (e.g. Priority Development Assistance Fund). An increase in Government Contracting Activity (GCA) is a way to address this. On the other hand, the private investment rate will not rise to desired levels unless the known traditional hurdles to investment are cleared: the almost unbearably lengthy, costly licensing procedures; the highly uncertain and sometimes inconsistent nature of regulation; the high cost of doing business; and the closing off of many areas (agriculture and mining) to large-scale investment projects. One sizeable source of investment is Foreign Direct Investment (FDI) which the Philippines has repeatedly rebuffed. The country’s share in total FDI in the ASEAN is only about 1% (Figure 3). Investment-friendliness is far from being the Philippines’ competitive strength.
After the passage of the EPIRA in 2001, the power industry underwent a major shift in structure, from a predominantly government-led monopoly in generation and transmission to
Figure 3: Philippine Share in Net Foreign Direct Investment into the ASEAN (%)
Source of basic data: WDI-WB.
-20%
0%
20%
40%
60%
80%
100%
1990
1991
1992
1993
1994
1995
1996
1997
1998
1999
2000
2001
2002
2003
2004
2005
2006
2007
2008
2009
2010
2011
2012
2013
2014
5
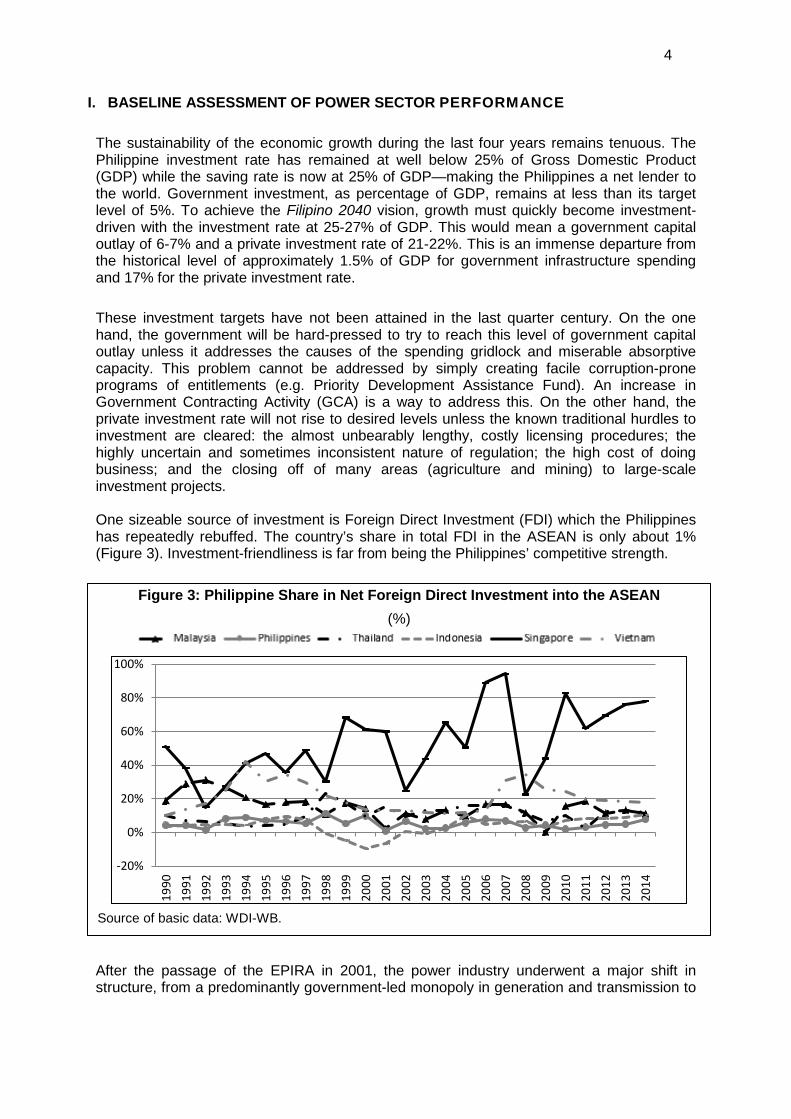
Figure 4: Installed Capacity* by Level, 1991-2015
Source of basic data: DOE. *Installed capacity is the amount of power that a station is able to produce. Note: “Renewables” include hydropower, geothermal, wind, solar, and biomass; “Others” include oil-based products, petroleum, and diesel.
02468
101214161820
1991
1992
1993
1994
1995
1996
1997
1998
1999
2000
2001
2002
2003
2004
2005
2006
2007
2008
2009
2010
2011
2012
2013
2014
2015
GW
a private sector-led and more competitive environment. This has brought expectations that electricity prices will eventually go down due to forthcoming new investments in power generation. Some 14 years after EPIRA (RA 9136) was passed, significant milestones have been achieved, including the establishment of the Wholesale Electricity Spot Market (WESM), the removal of some cross-subsidies and unbundling of functions to reflect their true costs, and the establishment of the Energy Regulatory Commission (ERC) and the Joint Congressional Power Commission to enhance oversight. However, delays in the privatization of assets and transfer of management of the contracted generation companies under Independent Power Producers (IPPs) to IPP administrators have pushed back the end-goal of establishing the Retail Competition and Open Access (RCOA) in the power sector.
A. Resource Availability and Power Consumption Mix
Figure 4 shows the trend in the country’s installed capacity from 1991 to 2015. After the EPIRA, new investments in natural gas and additional coal came online, and the expansion of geothermal and hydro replaced some of the more expensive diesel. The passage of RA 9513 or the Renewable Energy (RE) Law in 2008 triggered the addition of wind and solar power generation sources into the country’s installed capacity.
For the past 20 years, the country has observed a good “green energy” share in its power consumption mix. Green energy refers to the combination of renewable energy sources and natural gas. Figure 5 shows the trend in installed capacity mix by fuel source from 1991 to 2015. In the early 1990s, the capacity mix was composed mostly of renewable energy and diesel. As new sources came online, the mix became more diverse and included natural gas after 2001. By 2015, coal constituted 32% of the mix, renewable energy 33%, natural gas 15%, and the remaining 20% consisted of diesel, bunker fuel, and other oil-based products. The RE Law of 2008 encouraged investments in renewable energy production in solar, wind, biomass, and run-off-river hydro, expanding the green energy share in generation capacity.

6
By grid, the capacity mix varies as may be dictated by location and basic resource availability (see Figure 6a). Following the major island groupings of the country, the national electricity grid is divided into Luzon, Visayas and Mindanao. Natural gas production is found only in Luzon, and constitutes 41% of the grid capacity. Coal production is largest in the Luzon grid at 36%. In the Visayas grid, renewable energy, mainly geothermal, has the largest share at 36% of grid capacity. Coal also occupies a substantial share at 30%, followed by oil-based sources, including diesel and petroleum, at 25%. In Mindanao, renewables have the biggest share at 54%, with hydro dominating at 47% of the total grid capacity. Coal is small at 10%. Figure 6b shows the projected capacity mix in 2019, including the committed and indicative projects in the three grids. When the generation plants all go online, capacity mix on the three grids will be varied, especially in Mindanao where more coal will figure in the mix.
Figure 5: Installed Capacity by Percent Share, 1991-2015
Source of basic data: DOE Note: “Renewables” include hydropower, geothermal, wind, solar, and biomass. “Others” include oil-based products, petroleum, and diesel. Off-grid generator not included in installed capacity.
0%10%20%30%40%50%60%70%80%90%
100%19
9119
9219
9319
9419
9519
9619
9719
9819
9920
0020
0120
0220
0320
0420
0520
0620
0720
0820
0920
1020
1120
1220
1320
1420
15

7
B. Load (Consumption) Profile
In terms of power consumption, Figure 7 shows the monthly load (consumption) curve in 2013, and Figure 8 shows the typical daily load curve in Luzon, Visayas, and Mindanao in 2014. For Luzon, demand usually peaks during the summer season, mainly driven by residential use of air-conditioning units and electricity consumption of industries. On a daily basis, power consumption on weekdays starts to rise at 7:00 a.m., as people prepare for their daily routine, then peaks at around 11 a.m.-12 noon. From the mid-day peak, consumption goes down and reaches a trough between 4:00-5:00 p.m., when people are traveling home, then peaks again at around 7:00 p.m. Daily off-peak is from 1:00-6:00 a.m.
In Visayas, the typical trend is stable from January to December. Geothermal covers most of the base load in the Visayas. Interestingly, unlike Luzon where geothermal generation is constant, Visayas uses some of its geothermal power to meet its peak. Although the region occasionally imports power from Luzon, the direction of trade is usually from Visayas to Luzon. In Mindanao, consumption peaks during the summer and holiday seasons, when people from Mindanao working in either Luzon or Visayas make their way back home. Hydro generation comprises the base load of Mindanao.
Figure 6: Fuel Capacity Mix by Grid and by Source (% Share)
a. 2015 b. 2019 (Estimated)
Note: Renewables include: hydropower, geothermal, wind, solar, and biomass. Others include: oil-based products, diesel, and petroleum. Source of basic data: DOE
0%
20%
40%
60%
80%
100%
Luzon Visayas Mindanao0%
20%
40%
60%
80%
100%
Luzon Visayas Mindanao

8
C. Power Supply and Demand Indicators
Benchmarking power supply and demand indicators of the Philippines relative to other countries indicates that there is limited supply of power in the Philippines vis-à-vis consumption (Table 1). In 2014, the Philippines had 17.95 GW capacity serving 100 million Filipinos. In comparison, its neighbors, Thailand and Malaysia, had 44.83 GW and 32.46 GW of power capacity serving their populations of 68 million and 30 million, respectively.
Figure 7: Luzon, Visayas and Mindanao Monthly Load Curve, 2013
Sources of basic data: DOE. Luzon-Visayas Grid; National Grid Corporation of the Philippines (NGCP)- Mindanao Grid Note: Imports are applicable only for the Luzon and Visayas grids.
0.0
2.0
4.0
6.0
8.0
10.0
12.0
Jan Mar May Jul Sept Nov
GW LUZON
0.00.20.40.60.81.01.21.41.61.82.0
Jan Mar May Jul Sept Nov
GWVisayas
0.0
0.2
0.4
0.6
0.8
1.0
1.2
1.4
1.6
Jan Mar May Jul Sep Nov
GWMindanao
Figure 8: LVM Hourly Load Curve on a Typical Day, 2014
Others
0.01.02.03.04.05.06.07.08.09.0
1:00
AM
4:00
AM
7:00
AM
10:0
0 AM
1:00
PM
4:00
PM
7:00
PM
10:0
0 PM
GW Luzon
0.0
0.2
0.4
0.6
0.8
1.0
1.2
1.4
1.6
1:00
AM
4:00
AM
7:00
AM
10:0
0 AM
1:00
PM
4:00
PM
7:00
PM
10:0
0 PM
GW Visayas
0.0
0.2
0.4
0.6
0.8
1.0
1.2
1.4
1:00
AM
4:00
AM
7:00
AM
10:0
0 AM
1:00
PM
4:00
PM
7:00
PM
10:0
0 PM
GW Mindanao

9
Electricity consumption per capita in the Philippines is the lowest compared to other ASEAN countries. In contrast, the price per KWh is among the highest. It should be noted that Thailand, Malaysia, and Singapore trade in electricity and this potentially helps keep power costs low.
Table 1: Power Supply and Demand Indicators in Selected Asian Countries, 2014 Electricity
Generation per capitaa (kWh/cap)
Per capita electricity
consumptionb (kWh/cap)
Installed Electricity Capacityc
(GW)
Share of renewables in electricity capacitiesd
(%)
Pop’n (in
millions) e
Residential Pricesf
(USc05/kWh) (for 2013)
Industrial Pricesg
(USc05/kWh) (for 2013)
GDP per capitah
(constant 2005 US$)
Electricity T&D
lossesi
(kWh/cap)
Philippines 772 633 17.95 32.86 100 13.84 9.91 1,650 73
Indonesia 901 789 53.87 12.25 253 4.19 4.82 1,878 85
Malaysia 4,773 4,388 32.46 20.06 30 6.07 6.17 7,295 193
Singapore 8,949 8,586 13.18 1.95 6 12.32 11.44 37,203 44
Thailand 2,523 2,508 44.83 18.05 67 8.03 5.33 3,457 157
China 4,153 3,590 1,405.03 30.94 1,364 4.55 6.38 3,826 239
Japan 8,066 7,444 311.53 26.88 127 22.60 16.26 37,607 367
South Korea 10,797 9,928 93.71 11.68 50 8.82 7.87 24,550 364
a. Net Generation is the “amount of gross generation less the electrical energy consumed at the generating station(s) for station service or auxiliaries. Note: Electricity required for pumping at pumped-storage plants is regarded as electricity for the station service and is deducted from gross generation” (Energy Information Agency or EIA, 2015).
b. Net Consumption is the “consumption of electricity computed as generation, plus imports, minus exports, minus transmission and distribution losses” (EIA, 2015).
c. Installed capacity d. Renewables’ share in electricity production or generation (Enerdata) e. World Development Indicators f. In real prices constant at 2005 US$ cents (Enerdata). g. Constant 2005 US$ prices and exchange rate (Enerdata). h. Constant 2005 US$ prices and exchange rate (Enerdata). i. Transmission and Distribution Loss is “electric energy lost due to the transmission and distribution
of electricity. Much of the loss is thermal in nature” (EIA, 2015) The trend in net electricity generation4 and consumption among selected Asian countries is shown in Figure 9. Relative to its neighbors, the Philippines has had low levels of both generation and consumption per capita since 1990. While generation has seen tepid growth, population growth has increased faster in the Philippines compared to its neighbors.
4 Net electricity generation or production is the amount of gross generation less the electrical energy consumed at the generating station(s) for station service or auxiliaries (EIA, 2015).

10
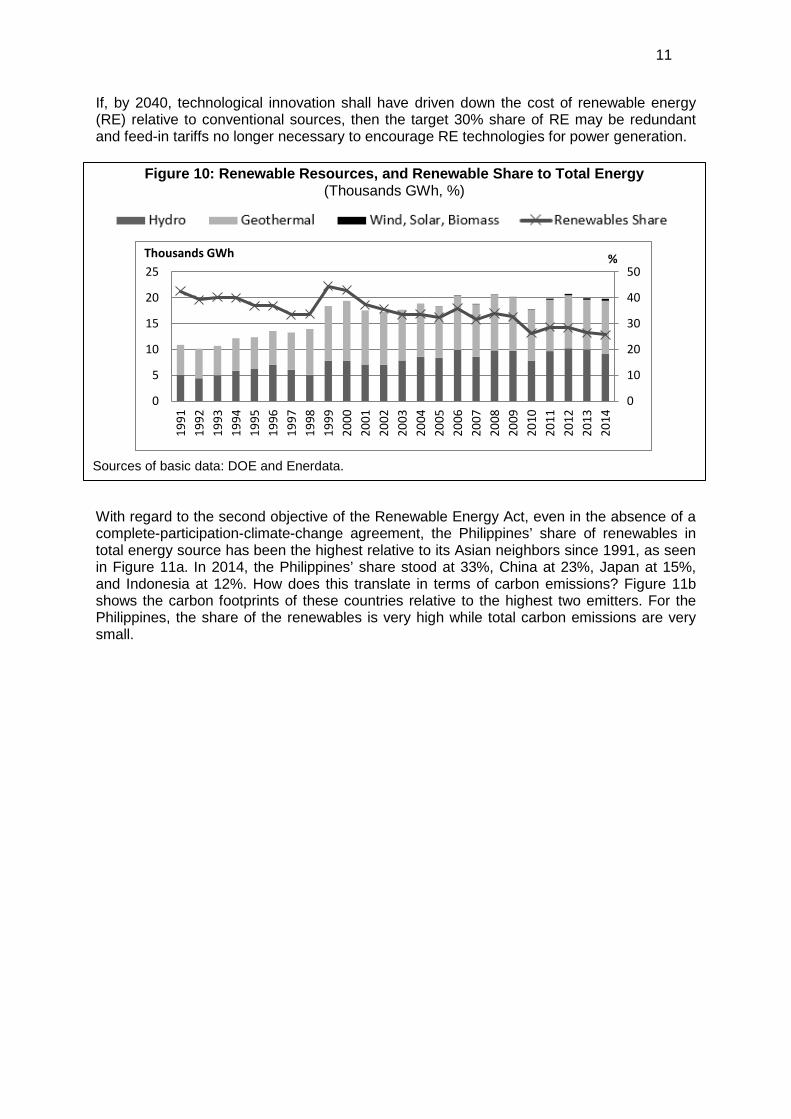
D. Energy and Climate Change In 2008, RA 9513 or the Renewable Energy Act was passed mainly to (i) reduce dependence on fossil fuels, thus, insulating the country’s exposure to price fluctuations in the international markets and (ii) increase the utilization and development of renewable energy resources as tools in preventing harmful emissions. To implement this law, the Department of Energy (DOE) released Circular 2015-07-0014, prescribing the policy for maintaining a fuel mix of 30-30-30-10, i.e., 30% coal, 30% renewables, 30% natural gas, and 10% others. The 30% share of renewable energy resources in the country’s total power-generating capacity is facilitated through the implementation of the feed-in tariff (FIT) system. Given this policy, what is the current status and where is the country heading, in terms of investments in generating capacity? Figure 10 shows the various renewable energy sources in the Philippines from 1991 to 2014. The graph shows that the biggest source is hydropower, followed by geothermal. Other renewable sources include wind, solar, and biomass. The share of renewable energy to total energy has been historically high for the Philippines. The share was about 38% in the 1990s and averaged about 33% in 2011-2014.
Figure 9: Electricity Generation and Consumption
(a) Net Electricity Generation (b) Electricity Consumption per Capita Thousands GWh kWh/ca
Source of basic data: Enerdata.
-
100
200
300
400
500
600
1980
1983
1986
1989
1992
1995
1998
2001
2004
2007
2010
2013
0
2000
4000
6000
8000
10000
12000
11
If, by 2040, technological innovation shall have driven down the cost of renewable energy (RE) relative to conventional sources, then the target 30% share of RE may be redundant and feed-in tariffs no longer necessary to encourage RE technologies for power generation.
With regard to the second objective of the Renewable Energy Act, even in the absence of a complete-participation-climate-change agreement, the Philippines’ share of renewables in total energy source has been the highest relative to its Asian neighbors since 1991, as seen in Figure 11a. In 2014, the Philippines’ share stood at 33%, China at 23%, Japan at 15%, and Indonesia at 12%. How does this translate in terms of carbon emissions? Figure 11b shows the carbon footprints of these countries relative to the highest two emitters. For the Philippines, the share of the renewables is very high while total carbon emissions are very small.
Figure 10: Renewable Resources, and Renewable Share to Total Energy (Thousands GWh, %)
Sources of basic data: DOE and Enerdata.
0
10
20
30
40
50
0
5
10
15
20
25
1991
1992
1993
1994
1995
1996
1997
1998
1999
2000
2001
2002
2003
2004
2005
2006
2007
2008
2009
2010
2011
2012
2013
2014
%Thousands GWh

12
Furthermore, power generation is not the only source of carbon gas emissions in the Philippines. Transport is another major source. Table 2 below shows that, in fact, in the last three decades of the 20th century, transportation was a heavier emitter of greenhouse gases than electricity. By 2012, however, power generation was releasing 60% more carbon dioxide than transport. The search for clean technologies, therefore, holds for these two sectors.
Table 2: Carbon Dioxide Emissions (in Million Metric Tons)
Period Electricity and Heat Production
Transportation
1971-1980 90.13 98.40 1981-1990 108.83 105.43 1991-2000 181.49 216.31 2001-2010 284.72 243.14
Source: World Resources Institute (WRI) (2014). While the share of renewables may already be high, the prescribed target of 30% share for coal is already lower than the 32% share in installed capacity5 in 2015 and the 42% gross 5 Installed capacity is the maximum output, commonly expressed in megawatts (MW), that the generating equipment can supply to the system load, adjusted for ambient conditions (EIA, 2015).
Figure 11: Renewable Resources and CO2 Emissions
a. Renewable Resources b. CO2 Emissions % tCO2/cap
Source of basic data: Enerdata
0
5
10
15
20
25
30
35
40
45
50
1991
1993
1995
1997
1999
2001
2003
2005
2007
2009
2011
2013
11.61
9.69 9.08
7.466.5
4.04
1.810.95

13
generation capacity6 in 2014. These benchmarks will be higher since the new capacity said to be coming on-stream is largely coal (e.g., the Redondo Power Plant in Subic, Zambales). The Asian Development Bank (ADB, 2013) sees coal constituting about 70% of the fuel mix in the Philippines in 2035.
6 Gross generation capacity- the total amount of electric energy produced by generating units and measured at the generating terminal in kilowatthours (kWh) or megawatthours (MWh) (EIA, 2015).

14
II. THE PHILIPPINES IN 2040: STRONG VS. WEAK GROWTH Two scenarios for the Philippine economy up to 2040 are identified in Figure 12. The first scenario, the strong-growth scenario, assumes an average GDP growth rate of about 7% annually from 2016 to 2040. With low population growth that ranges from 1.5% to 0.6% for 2016-2040 (see Table 3), per capita GDP growth would therefore average about 6%.
Accompanying this high economic growth is the well-known demographic dividend. That is, productivity rises due to the increased number of people in the workforce relative to dependents (Lee and Mason 2006). Strong reforms are needed to reduce fertility, including investment in human capital and expanded work opportunities. Reducing the fertility rate is the critical element for the demographic transition. (See Box 1 for notes on the population projections.) Strong political will is also needed to increase the contraceptive prevalence rate (CPR) from the current figure of 55% to 70%. Continuous investment in human capital is important, including the additional two years of schooling with the implementation of the K to 12 Program. The latter is particularly relevant for women, as increased education of women is a strong determinant of lower fertility. In turn, an increase in years of schooling may be expected to boost real wages, particularly for young workers.
Figure 12: Strong and Weak Growth Scenarios of GDP per Capita, 2016-2040
Authors’ calculations. Note: GDP per capita (constant 2000 prices) from 1990 to 2015 (actual) and 2016 to 2050 (projected)

15
Table 3: Strong Growth Scenario Projections for Real GDP, Population, GDP per Capita, and Electricity Consumption, 2015-2040
Year Real GDP at 7% Growth
Rate (PhP Billion)
Population GDP Per Capita Electricity Consumption
(GWh) (‘000) Growth Rate (%)
(PhP) Growth Rate (%)
2015 7,580 101,803 … 74,453 … 81,896 2016 8,110 102,273 1.46% 79,299 5.54% 85,434 2017 8,678 103,675 1.37% 83,702 5.55% 89,436 2018 9,285 105,056 1.33% 88,384 5.59% 93,549 2019 9,935 106,421 1.30% 93,358 5.63% 97,788 2020 10,631 107,771 1.27% 98,641 5.66% 102,165 2021 11,375 109,108 1.24% 104,253 5.69% 106,692 2022 12,171 110,429 1.21% 110,216 5.72% 111,382 2023 13,023 111,735 1.18% 116,553 5.75% 116,246 2024 13,935 113,027 1.16% 123,286 5.78% 121,296 2025 14,910 114,304 1.13% 130,442 5.80% 126,543 2026 15,954 115,567 1.10% 138,048 5.83% 131,998 2027 17,071 116,813 1.08% 146,135 5.86% 137,671 2028 18,265 118,039 1.05% 154,741 5.89% 143,576 2029 19,544 119,240 1.02% 163,906 5.92% 149,721 2030 20,912 120,411 0.98% 173,673 5.96% 156,121 2031 22,376 121,551 0.95% 184,088 6.00% 162,785 2032 23,942 122,658 0.91% 195,196 6.03% 169,728 2033 25,618 123,730 0.87% 207,050 6.07% 176,960 2034 27,412 124,765 0.84% 219,707 6.11% 184,496 2035 29,330 125,760 0.80% 233,225 6.15% 192,348 2036 31,384 126,714 0.76% 247,671 6.19% 200,531 2037 33,580 127,627 0.72% 263,113 6.23% 209,059 2038 35,931 128,498 0.68% 279,624 6.28% 217,946 2039 38,446 129,325 0.64% 297,282 6.32% 227,210 2040 41,137 130,110 0.61% 316,173 6.35% 236,865 Note: Real GDP and GDP per capita are at 2000 constant prices.

16
Box 1: Notes on the Population Projections To project the population until 2100, the United Nations Population Division uses assumptions regarding future trends in fertility, mortality, and international migration. Because future trends cannot be known with certainty, a number of projection variants are produced. The World Population Prospects 2012 Revision uses the same stochastic model for fertility projection as used in the 2010 revision with modifications. The AR1 model used for low-fertility countries is estimated using a Bayesian hierarchical model and future long-term fertility levels are more data-driven and country-specific. Two new stochastic models were also used to project life expectancy at birth for all countries not significantly affected by the HIV/AIDS epidemic. The first model, used for females, is a Bayesian hierarchical approach that models the rate of mortality improvement by level of life expectancy at birth; the second model is used for males, to project the gender gap conditionally on female mortality level. The following projection variants were used to simulate the Philippine population up to 2100.
Projection Variant Assumptions Fertility Mortality Migration
Medium Medium Normal Normal Low Low Normal Normal
The low projection variant is used for the strong growth scenario. The medium variant is used for the weak growth scenario. • Medium Fertility. A country is assumed to have medium total fertility rate (TFR) if its rate has
been declining but the estimated level is above the replacement level of 2.1 children per woman in 2005-2010.(The Philippines will reach a TFR of 2.12 in 2050–2055.)
• Low Fertility. A country is assumed to have low TFR if its rate is half a child lower than that of the medium variant. That is, countries with a TFR of 3 children per woman in the medium variant have a TFR of 2.5 children per woman in the low variant. (The Philippines will reach a TFR of 2.09 in 2025–2030.)
• Normal Mortality. For most countries where mortality was assumed to follow a declining trend starting in 2010, life expectancy was generally assumed to rise over the projection period. In contrast with fertility assumptions, only one variant of future mortality trends (median path) was used for standard projection.
• Normal Migration. Based on past international estimates and considered the policy stance on future international migration flows, the projected levels of net migration are generally kept constant over the next decades. After 2050, it is assumed that net migration will gradually decline and reach zero by 2100.
The following are the data sources in projecting the Philippine population: • Total Population: National censuses from 1960 through 2010, and with estimates of the
subsequent trends in fertility, mortality, and international migration. • Total Fertility: Maternity-history data from the 1993 National Demographic Survey (NDS), and the
National Demographic and Health Surveys (NDHS) of 1998, 2003, 2008, and 2013. • Infant and Child Mortality: Estimates from the 1998, 2003, 2008, and 2013 NDHS; 2006 Family
Planning Survey; and estimates from UNICEF as published in 2014. • Life Expectancy at Birth: Infant and child mortality estimates from the 1998, 2003, 2008, and
2013 NDHS; 2006 Family Planning Survey; official estimates from a life table of 2006; and the West model of the Coale-Demeny Model Life Tables and the Lee-Carter method.
• International Migration: Estimates of net international migration derived as the difference between overall population growth and natural increase through 2010, and on information on Filipino emigrants admitted by the main countries of immigration.

17
The changing age structure due to a reduction in the country’s TFR is a necessary but not a sufficient condition for harvesting the demographic dividend. Reforms must be made in the labor market to provide young workers with higher employment opportunities. The strong-growth scenario simulates increased employment rate, coupled with a lower fertility rate and increased years of schooling (that is, the additional two years). Under the strong-growth scenario, the “support ratio” will be higher than 0.50 starting 2025 and will be highest at 0.55 from 2055 to 2065. This scenario creates a relatively wider demographic window of opportunity. This means that, in 2025, 50 effective workers are supporting themselves and 50 effective consumers. By 2040, 54 effective workers are supporting themselves and 46 other effective consumers, thus providing the economy with additional savings. The alternative “weak-growth scenario” assumes an average annual GDP growth of 4% from 2016 to 2040, similar to the average growth rate of GDP from 1990 to 2012. With this projected economic growth, implying per capita income growth of the country at 2.6%, per capita income is PhP140,791 ($3,061) by 2040 (see Table 4). For the energy sector, the power subsector in particular, long-term visioning is of prime importance as investments in most new facilities for generation and transmission are lumpy in nature. It takes several years to put up a base load power plant, especially when environmental and social impact studies are required. Thus, it is critical to plan ahead and coordinate the power requirement and the corresponding generation and transmission that will support the vision of strong growth. Forecasts of electricity consumption for 2040 under the two scenarios were obtained using a single-equation error correction model—a dynamic model that integrates short-run dynamics with a long-run relationship (see Danao and Ducanes 2016 for details of the model). In the present case, the short-run dynamics is modeled by relating annual growth rates of electricity consumption to growth rates of the predictor variables: GDP, electricity price, and temperature. The long-run relationship between electricity consumption and real GDP appears as an extra term in the model. Because there may be disequilibrium (referred to as “disequilibrium error”) in the short run, this extra term is regarded as the error correction mechanism (ECM), which corrects for the disequilibrium. The ECM was estimated using annual data from 1992 to 2015. The forecast values were computed by assuming that electricity price and temperature follow their historical trends. Figure 13 shows the trend in actual total electricity consumption7 for 1990-2015 together with the forecasts for 2016-2040, both including transmission losses and utilities’ own-consumption. The forecasted trend is the electricity consumption that supports the assumed GDP per capita growth under each scenario. Electricity consumption is expected to grow at an annual average rate of 4.3% under the strong-growth scenario but only 2.4% under weak-growth. We consider the forecasts as lower bounds, if we allow for the possibility of lower electricity prices and higher temperatures. However, electricity consumption will also be influenced by demand-side management through the use of more efficient appliances, lighting fixtures, and smart metering (see e.g. Strbac 2008; Moura and de Almeida 2010; EIA 2014). Thus, the net effect on electricity consumption is unclear. Since electricity consumption in the model is primarily driven by aggregate real GDP, it cannot reflect the effects of changes in GDP’s components. Future modeling efforts should account for the structural changes within the economy, i.e., the gross value added share of agriculture, industry, and services.
7 Total electricity consumption includes transmission losses and utilities’ own consumption.

18
Table 4: Weak-Growth Scenario Projections for Real GDP, Population, GDP per Capita, and Electricity Consumption, 2015-2040
Year Real GDP at 4% Growth
Rate (PhP billion)
Population GDP Per Capita Electricity Consumption
(GWh) (‘000) Growth Rate (%)
(PhP) Growth Rate (%)
2015 7,580 101,803 … 74,453 … 81,896 2016 7,883 103,509 1.68% 76,155 2.29% 83,204 2017 8,198 105,218 1.65% 77,914 2.31% 84,982 2018 8,526 106,934 1.63% 79,731 2.33% 86,852 2019 8,867 108,662 1.62% 81,602 2.35% 88,807 2020 9,222 110,404 1.60% 83,527 2.36% 90,843 2021 9,591 112,160 1.59% 85,508 2.37% 92,954 2022 9,974 113,926 1.57% 87,550 2.39% 95,137 2023 10,373 115,696 1.55% 89,659 2.41% 97,391 2024 10,788 117,462 1.53% 91,843 2.44% 99,713 2025 11,220 119,219 1.50% 94,109 2.47% 102,103 2026 11,668 120,964 1.46% 96,461 2.50% 104,560 2027 12,135 122,696 1.43% 98,904 2.53% 107,085 2028 12,620 124,413 1.40% 101,441 2.56% 109,676 2029 13,125 126,113 1.37% 104,075 2.60% 112,336 2030 13,650 127,797 1.34% 106,812 2.63% 115,063 2031 14,196 129,462 1.30% 109,656 2.66% 117,861 2032 14,764 131,107 1.27% 112,611 2.70% 120,729 2033 15,355 132,732 1.24% 115,682 2.73% 123,668 2034 15,969 134,336 1.21% 118,873 2.76% 126,681 2035 16,608 135,920 1.18% 122,188 2.79% 129,769 2036 17,272 137,482 1.15% 125,631 2.82% 132,932 2037 17,963 139,022 1.12% 129,209 2.85% 136,174 2038 18,681 140,541 1.09% 132,925 2.88% 139,495 2039 19,429 142,039 1.07% 136,784 2.90% 142,897 2040 20,206 143,516 1.04% 140,791 2.93% 146,383 Note: Real GDP and GDP per capita are at 2000 constant prices.

19
What is the needed generating capacity that corresponds to the vision of strong growth and the possibility of weak growth, and at what electricity prices? The policies that the government takes are critical in influencing the outcome. We did a numerical exercise to compute the required generating capacity at each projected electricity consumption level for the two scenarios. Formal modeling requires that supply and demand be determined simultaneously at each point in time. For illustration purposes, electricity consumption is modeled separately when computing the generation requirement. A. Policy Regimes on Fuel Mix To calculate the net generating capacity, estimates are needed for installed capacities from various fuel sources by grid in Luzon, Visayas, and Mindanao. This requires determining the optimal mix of fuel sources over time based on the least-cost rule while taking into account environmental and health concerns. Inasmuch as a fully theoretical and operational model of investment planning and coordination is yet to be developed for the Philippines, we do not compute the optimal fuel mix. We focus instead on the conceptual issues and illustrate how policies with regard to fuel mix might affect the growth trajectory of the country and the well-being of Filipinos– in particular, how fuel mix affects the blended generation charges that constitute 47.4% of the consumers’ electricity bill. For the two scenarios, strong- and weak-growth projections, we consider the policy of the government as stated in the Department of Energy’s (DOE) Department Circular 2015-07-0014, “Guidelines for the Policy of Maintaining the Share of Renewable Energy (RE) in the Country.” The policy statement in Section 2 of the circular is “to maintain the share of (RE) in power generation… by adopting at least 30 percent share of RE in the country’s total power generation capacity….” For the numerical exercise, the fuel mix is pegged at 30% share of RE, 30% natural gas, 30% coal, and 10% others. The 30-30-30-10 fuel mix in the installed capacity is hereinafter referred to as Policy 1.
Figure 13: Strong and Weak Growth Scenarios of Electricity Consumption, 2016-2040 (‘000 GWh)
A th ’ l l ti
20
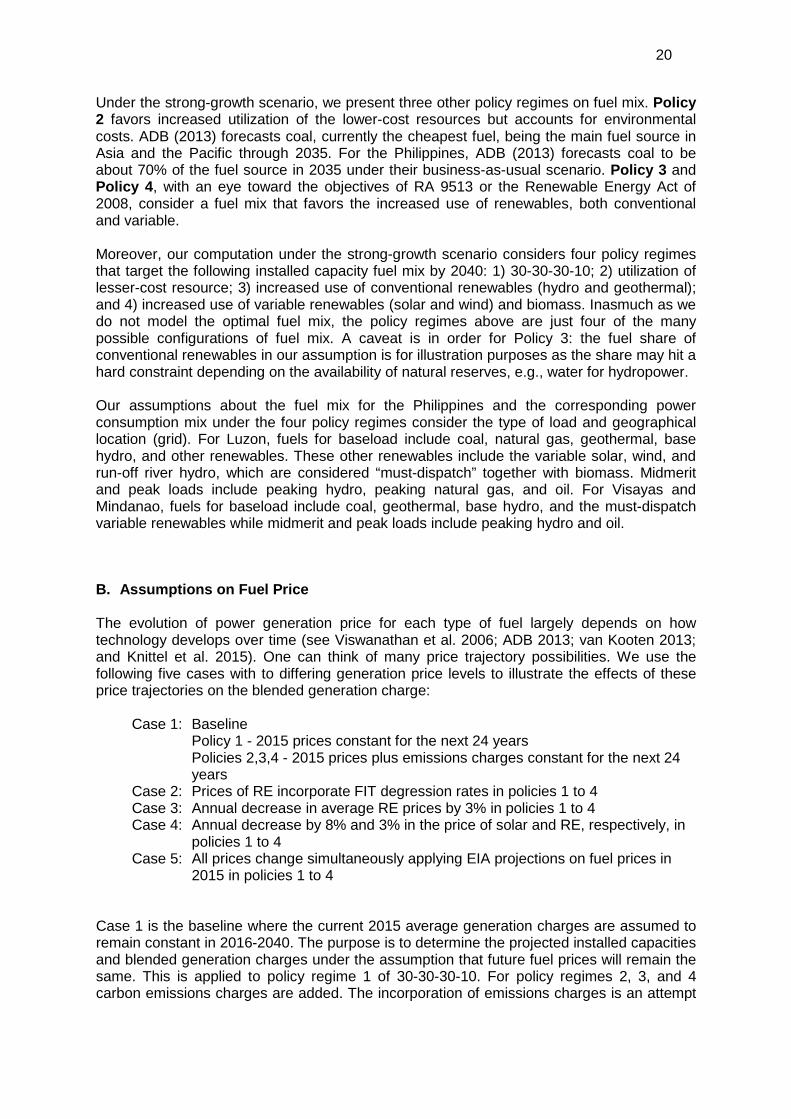
Under the strong-growth scenario, we present three other policy regimes on fuel mix. Policy 2 favors increased utilization of the lower-cost resources but accounts for environmental costs. ADB (2013) forecasts coal, currently the cheapest fuel, being the main fuel source in Asia and the Pacific through 2035. For the Philippines, ADB (2013) forecasts coal to be about 70% of the fuel source in 2035 under their business-as-usual scenario. Policy 3 and Policy 4, with an eye toward the objectives of RA 9513 or the Renewable Energy Act of 2008, consider a fuel mix that favors the increased use of renewables, both conventional and variable. Moreover, our computation under the strong-growth scenario considers four policy regimes that target the following installed capacity fuel mix by 2040: 1) 30-30-30-10; 2) utilization of lesser-cost resource; 3) increased use of conventional renewables (hydro and geothermal); and 4) increased use of variable renewables (solar and wind) and biomass. Inasmuch as we do not model the optimal fuel mix, the policy regimes above are just four of the many possible configurations of fuel mix. A caveat is in order for Policy 3: the fuel share of conventional renewables in our assumption is for illustration purposes as the share may hit a hard constraint depending on the availability of natural reserves, e.g., water for hydropower. Our assumptions about the fuel mix for the Philippines and the corresponding power consumption mix under the four policy regimes consider the type of load and geographical location (grid). For Luzon, fuels for baseload include coal, natural gas, geothermal, base hydro, and other renewables. These other renewables include the variable solar, wind, and run-off river hydro, which are considered “must-dispatch” together with biomass. Midmerit and peak loads include peaking hydro, peaking natural gas, and oil. For Visayas and Mindanao, fuels for baseload include coal, geothermal, base hydro, and the must-dispatch variable renewables while midmerit and peak loads include peaking hydro and oil.
B. Assumptions on Fuel Price The evolution of power generation price for each type of fuel largely depends on how technology develops over time (see Viswanathan et al. 2006; ADB 2013; van Kooten 2013; and Knittel et al. 2015). One can think of many price trajectory possibilities. We use the following five cases with to differing generation price levels to illustrate the effects of these price trajectories on the blended generation charge:
Case 1: Baseline Policy 1 - 2015 prices constant for the next 24 years Policies 2,3,4 - 2015 prices plus emissions charges constant for the next 24
years Case 2: Prices of RE incorporate FIT degression rates in policies 1 to 4 Case 3: Annual decrease in average RE prices by 3% in policies 1 to 4 Case 4: Annual decrease by 8% and 3% in the price of solar and RE, respectively, in
policies 1 to 4 Case 5: All prices change simultaneously applying EIA projections on fuel prices in
2015 in policies 1 to 4 Case 1 is the baseline where the current 2015 average generation charges are assumed to remain constant in 2016-2040. The purpose is to determine the projected installed capacities and blended generation charges under the assumption that future fuel prices will remain the same. This is applied to policy regime 1 of 30-30-30-10. For policy regimes 2, 3, and 4 carbon emissions charges are added. The incorporation of emissions charges is an attempt
21
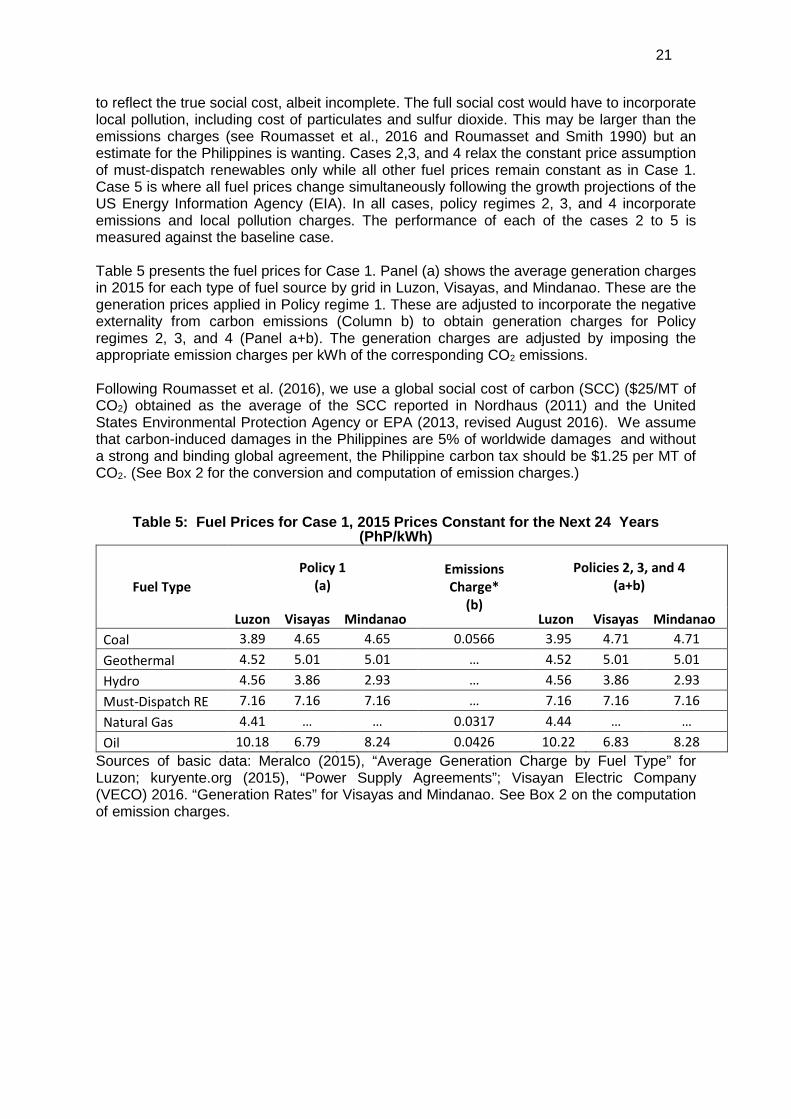
to reflect the true social cost, albeit incomplete. The full social cost would have to incorporate local pollution, including cost of particulates and sulfur dioxide. This may be larger than the emissions charges (see Roumasset et al., 2016 and Roumasset and Smith 1990) but an estimate for the Philippines is wanting. Cases 2,3, and 4 relax the constant price assumption of must-dispatch renewables only while all other fuel prices remain constant as in Case 1. Case 5 is where all fuel prices change simultaneously following the growth projections of the US Energy Information Agency (EIA). In all cases, policy regimes 2, 3, and 4 incorporate emissions and local pollution charges. The performance of each of the cases 2 to 5 is measured against the baseline case. Table 5 presents the fuel prices for Case 1. Panel (a) shows the average generation charges in 2015 for each type of fuel source by grid in Luzon, Visayas, and Mindanao. These are the generation prices applied in Policy regime 1. These are adjusted to incorporate the negative externality from carbon emissions (Column b) to obtain generation charges for Policy regimes 2, 3, and 4 (Panel a+b). The generation charges are adjusted by imposing the appropriate emission charges per kWh of the corresponding CO2 emissions. Following Roumasset et al. (2016), we use a global social cost of carbon (SCC) ($25/MT of CO2) obtained as the average of the SCC reported in Nordhaus (2011) and the United States Environmental Protection Agency or EPA (2013, revised August 2016). We assume that carbon-induced damages in the Philippines are 5% of worldwide damages and without a strong and binding global agreement, the Philippine carbon tax should be $1.25 per MT of CO2. (See Box 2 for the conversion and computation of emission charges.)
Table 5: Fuel Prices for Case 1, 2015 Prices Constant for the Next 24 Years (PhP/kWh)
Fuel Type Policy 1
(a) Emissions Charge*
(b)
Policies 2, 3, and 4 (a+b)
Luzon Visayas Mindanao Luzon Visayas Mindanao Coal 3.89 4.65 4.65 0.0566 3.95 4.71 4.71 Geothermal 4.52 5.01 5.01 … 4.52 5.01 5.01 Hydro 4.56 3.86 2.93 … 4.56 3.86 2.93 Must-Dispatch RE 7.16 7.16 7.16 … 7.16 7.16 7.16 Natural Gas 4.41 … … 0.0317 4.44 … … Oil 10.18 6.79 8.24 0.0426 10.22 6.83 8.28
Sources of basic data: Meralco (2015), “Average Generation Charge by Fuel Type” for Luzon; kuryente.org (2015), “Power Supply Agreements”; Visayan Electric Company (VECO) 2016. “Generation Rates” for Visayas and Mindanao. See Box 2 on the computation of emission charges.
22
The other four cases are the “what-if” analyses relative to the baseline case. Case 2 takes into account the degression rates in the feed-in-tariff (FIT), which is already in place as per ERC Case No. 2011-006 and ERC Resolution 10, Series of 2012. Incorporation of FIT will alter the price of must-dispatch renewables in policy regimes 1 to 4. The FIT degression rates are based on the adjusted 2016 rates as per ERC Case No. 2015-216 RC, where the FIT rates are PhP 7.0508 for biomass, PhP 6.4601 for hydro, PhP 8.69 for solar, and PhP
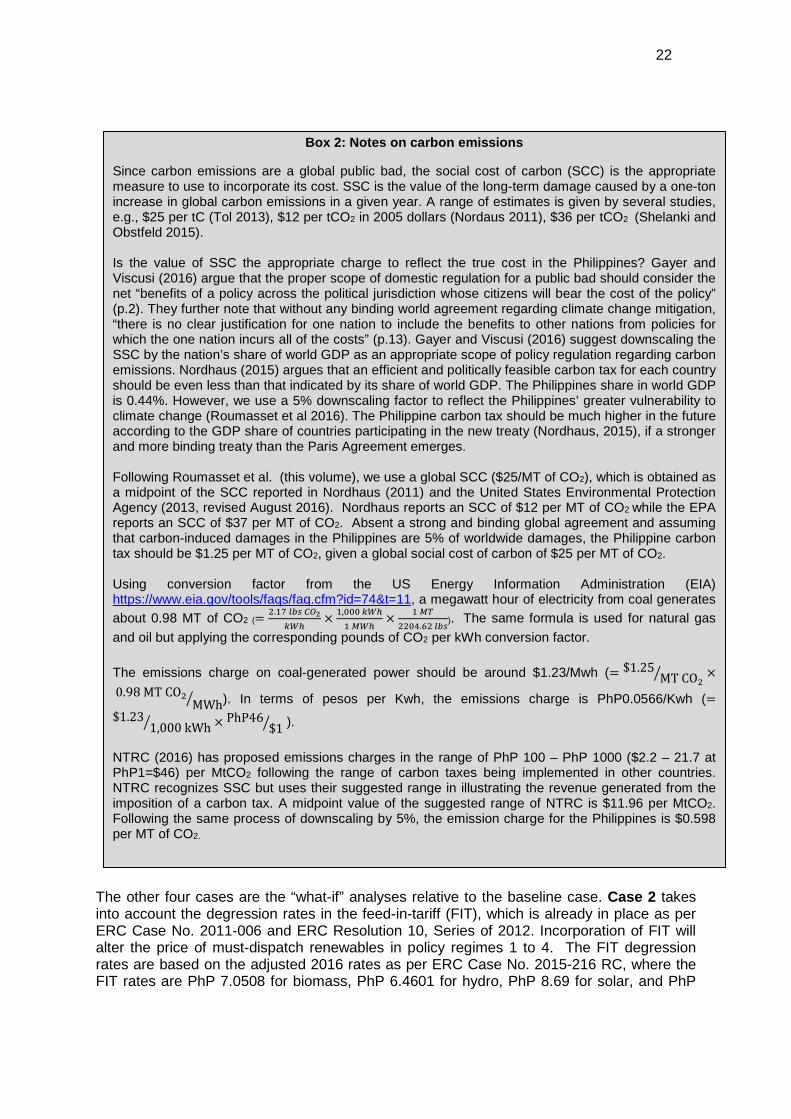
Box 2: Notes on carbon emissions
Since carbon emissions are a global public bad, the social cost of carbon (SCC) is the appropriate measure to use to incorporate its cost. SSC is the value of the long-term damage caused by a one-ton increase in global carbon emissions in a given year. A range of estimates is given by several studies, e.g., $25 per tC (Tol 2013), $12 per tCO2 in 2005 dollars (Nordaus 2011), $36 per tCO2 (Shelanki and Obstfeld 2015). Is the value of SSC the appropriate charge to reflect the true cost in the Philippines? Gayer and Viscusi (2016) argue that the proper scope of domestic regulation for a public bad should consider the net “benefits of a policy across the political jurisdiction whose citizens will bear the cost of the policy” (p.2). They further note that without any binding world agreement regarding climate change mitigation, “there is no clear justification for one nation to include the benefits to other nations from policies for which the one nation incurs all of the costs” (p.13). Gayer and Viscusi (2016) suggest downscaling the SSC by the nation’s share of world GDP as an appropriate scope of policy regulation regarding carbon emissions. Nordhaus (2015) argues that an efficient and politically feasible carbon tax for each country should be even less than that indicated by its share of world GDP. The Philippines share in world GDP is 0.44%. However, we use a 5% downscaling factor to reflect the Philippines’ greater vulnerability to climate change (Roumasset et al 2016). The Philippine carbon tax should be much higher in the future according to the GDP share of countries participating in the new treaty (Nordhaus, 2015), if a stronger and more binding treaty than the Paris Agreement emerges. Following Roumasset et al. (this volume), we use a global SCC ($25/MT of CO2), which is obtained as a midpoint of the SCC reported in Nordhaus (2011) and the United States Environmental Protection Agency (2013, revised August 2016). Nordhaus reports an SCC of $12 per MT of CO2 while the EPA reports an SCC of $37 per MT of CO2. Absent a strong and binding global agreement and assuming that carbon-induced damages in the Philippines are 5% of worldwide damages, the Philippine carbon tax should be $1.25 per MT of CO2, given a global social cost of carbon of $25 per MT of CO2. Using conversion factor from the US Energy Information Administration (EIA) https://www.eia.gov/tools/faqs/faq.cfm?id=74&t=11, a megawatt hour of electricity from coal generates about 0.98 MT of CO2 (= 2.17 𝑙𝑙𝑙𝑙𝑙𝑙 𝐶𝐶𝐶𝐶2
𝑘𝑘𝑘𝑘ℎ× 1,000 𝑘𝑘𝑘𝑘ℎ
1 𝑀𝑀𝑘𝑘ℎ× 1 𝑀𝑀𝑀𝑀
2204.62 𝑙𝑙𝑙𝑙𝑙𝑙). The same formula is used for natural gas and oil but applying the corresponding pounds of CO2 per kWh conversion factor. The emissions charge on coal-generated power should be around $1.23/Mwh (= $1.25
MT CO2� ×
0.98 MT CO2MWh� ). In terms of pesos per Kwh, the emissions charge is PhP0.0566/Kwh (=
$1.231,000 kWh� × PhP46
$1� ). NTRC (2016) has proposed emissions charges in the range of PhP 100 – PhP 1000 ($2.2 – 21.7 at PhP1=$46) per MtCO2 following the range of carbon taxes being implemented in other countries. NTRC recognizes SSC but uses their suggested range in illustrating the revenue generated from the imposition of a carbon tax. A midpoint value of the suggested range of NTRC is $11.96 per MtCO2. Following the same process of downscaling by 5%, the emission charge for the Philippines is $0.598 per MT of CO2.
23
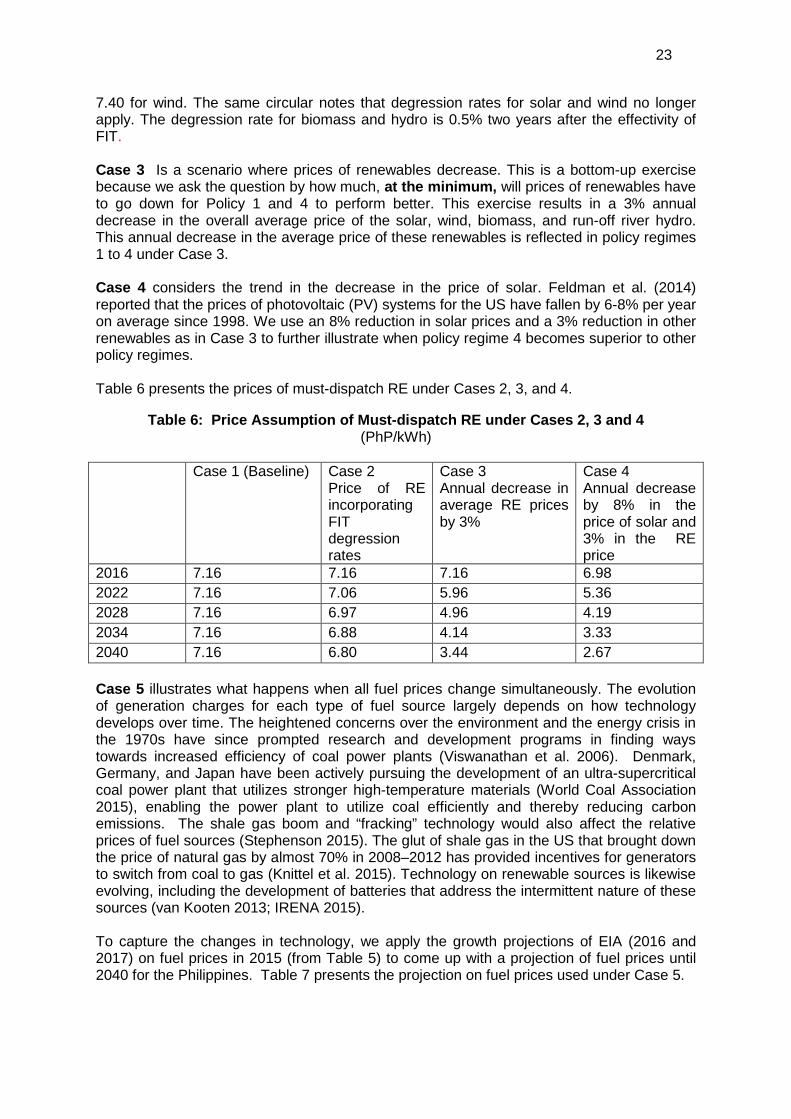
7.40 for wind. The same circular notes that degression rates for solar and wind no longer apply. The degression rate for biomass and hydro is 0.5% two years after the effectivity of FIT. Case 3 Is a scenario where prices of renewables decrease. This is a bottom-up exercise because we ask the question by how much, at the minimum, will prices of renewables have to go down for Policy 1 and 4 to perform better. This exercise results in a 3% annual decrease in the overall average price of the solar, wind, biomass, and run-off river hydro. This annual decrease in the average price of these renewables is reflected in policy regimes 1 to 4 under Case 3. Case 4 considers the trend in the decrease in the price of solar. Feldman et al. (2014) reported that the prices of photovoltaic (PV) systems for the US have fallen by 6-8% per year on average since 1998. We use an 8% reduction in solar prices and a 3% reduction in other renewables as in Case 3 to further illustrate when policy regime 4 becomes superior to other policy regimes. Table 6 presents the prices of must-dispatch RE under Cases 2, 3, and 4.
Table 6: Price Assumption of Must-dispatch RE under Cases 2, 3 and 4 (PhP/kWh)
Case 1 (Baseline) Case 2
Price of RE incorporating FIT degression rates
Case 3 Annual decrease in average RE prices by 3%
Case 4 Annual decrease by 8% in the price of solar and 3% in the RE price
2016 7.16 7.16 7.16 6.98 2022 7.16 7.06 5.96 5.36 2028 7.16 6.97 4.96 4.19 2034 7.16 6.88 4.14 3.33 2040 7.16 6.80 3.44 2.67 Case 5 illustrates what happens when all fuel prices change simultaneously. The evolution of generation charges for each type of fuel source largely depends on how technology develops over time. The heightened concerns over the environment and the energy crisis in the 1970s have since prompted research and development programs in finding ways towards increased efficiency of coal power plants (Viswanathan et al. 2006). Denmark, Germany, and Japan have been actively pursuing the development of an ultra-supercritical coal power plant that utilizes stronger high-temperature materials (World Coal Association 2015), enabling the power plant to utilize coal efficiently and thereby reducing carbon emissions. The shale gas boom and “fracking” technology would also affect the relative prices of fuel sources (Stephenson 2015). The glut of shale gas in the US that brought down the price of natural gas by almost 70% in 2008–2012 has provided incentives for generators to switch from coal to gas (Knittel et al. 2015). Technology on renewable sources is likewise evolving, including the development of batteries that address the intermittent nature of these sources (van Kooten 2013; IRENA 2015). To capture the changes in technology, we apply the growth projections of EIA (2016 and 2017) on fuel prices in 2015 (from Table 5) to come up with a projection of fuel prices until 2040 for the Philippines. Table 7 presents the projection on fuel prices used under Case 5.

24
Table 7: Price Assumption under Case 5 (PhP/kWh)
Grid Fuel
No emission charge With emission charges
Policy 1 Policies 2, 3, and 4
2016 2022 2028 2034 2040 2016 2022 2028 2034 2040
Luzon
Coal 3.89 4.19 4.29 4.43 4.56
3.95 4.24 4.35 4.49 4.62
Geothermal 4.52 4.52 4.89 5.29 5.72
4.52 4.52 4.89 5.29 5.72
Hydro 4.56 4.56 4.50 4.44 4.38
4.56 4.56 4.50 4.44 4.38 Must-Dispatch RE 7.16 7.46 7.14 6.84 6.55
7.16 7.46 7.14 6.84 6.55
Natural Gas 4.41 7.42 8.54 8.46 8.29
4.44 7.46 8.57 8.49 8.32
Oil 10.18 23.39 27.45 32.44 37.64
10.22 23.44 27.49 32.48 37.68
Visayas
Coal 4.65 5.00 5.12 5.29 5.45
4.70 5.06 5.18 5.35 5.50
Geothermal 5.01 5.01 5.42 5.86 6.34
5.01 5.01 5.42 5.86 6.34
Hydro 3.86 3.86 3.80 3.75 3.70
3.86 3.86 3.80 3.75 3.70
Must-Dispatch RE 7.16 7.46 7.14 6.84 6.55
7.16 7.46 7.14 6.84 6.55
Natural Gas … … … … …
… … … … …
Oil 6.79 15.60 18.30 21.63 25.10
6.83 15.64 18.35 21.67 25.14
Mindanao
Coal 4.65 5.00 5.12 5.29 5.45
4.70 5.06 5.18 5.35 5.50
Geothermal 5.01 5.01 5.42 5.86 6.34
5.01 5.01 5.42 5.86 6.34
Hydro 2.93 2.93 2.89 2.85 2.81
2.93 2.93 2.89 2.85 2.81
Must-Dispatch RE 7.16 7.46 7.14 6.84 6.55
7.16 7.46 7.14 6.84 6.55
Natural Gas … … … … …
… … … … …
Oil 8.24 18.93 22.21 26.25 30.46
8.28 18.97 22.25 26.29 30.50 Source of basic data: U.S. EIA (2016) and U.S. EIA (2017) Given the generation price and the fuel mix assumptions under the four illustrative policy regimes and five cases of evolution of fuel price, the required installed capacities for strong- and weak-growth scenarios are calculated using our computation.

25
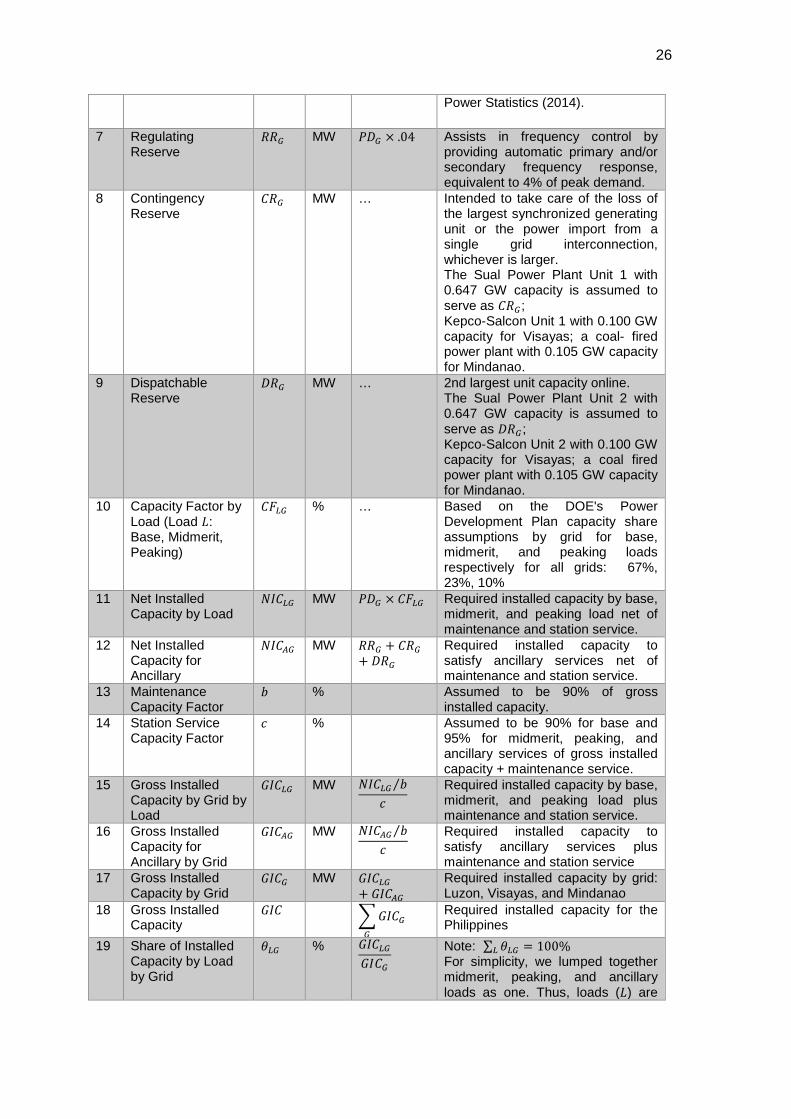
Table 8 provides the parameters, formulas, and assumptions used to estimate the projected installed capacity and gross generation for each grid: Luzon, Visayas, and Mindanao. Summing up the corresponding values for all grids, we obtain the projected installed capacity and gross generation for the country. Using our forecast of electricity consumption (𝐸𝐸𝐸𝐸) for the Philippines in Figure 4, we allocate the consumption by grid (𝐸𝐸𝐸𝐸𝐺𝐺) using the historical average (𝑎𝑎𝐺𝐺) (see Table 8, Lines 1-3). The peak demand for each grid (𝑃𝑃𝑃𝑃𝐺𝐺) is computed by dividing 𝐸𝐸𝐸𝐸𝐺𝐺 by the grid load factor (𝐿𝐿𝐿𝐿𝐺𝐺) times 8760 hours (Table 8, Line 5). The load factor (𝐿𝐿𝐿𝐿𝐺𝐺) is taken from DOE’s Philippine Energy Plan. We then compute the requirement for ancillary services, the regulating reserve (𝑅𝑅𝑅𝑅𝐺𝐺, 4% of peak demand), contingency reserve (𝐸𝐸𝑅𝑅𝐺𝐺, largest unit capacity online for the grid), and dispatchable reserve (𝑃𝑃𝑅𝑅𝐺𝐺, second largest unit capacity online) (IIEE 2014) (see Table 8, Lines 7-9). The installed capacity by load net of maintenance and station service (𝑁𝑁𝑁𝑁𝐸𝐸𝐿𝐿𝐺𝐺) is obtained by multiplying the peak demand (𝑃𝑃𝑃𝑃𝐺𝐺) by the capacity factor (𝐸𝐸𝐿𝐿𝐿𝐿𝐺𝐺) of each load, i.e., baseload, midmerit, and peaking for each grid (Table 8, Lines 10-11). We use capacity factors based on the DOE's Power Development Plan for base, midmerit, and peaking loads for each grid (see Table 8, Line 10). The DOE’s capacity factor is based on “load duration curve (LDC) methodology.” The installed capacity for ancillary services 𝑁𝑁𝑁𝑁𝐸𝐸𝐴𝐴𝐺𝐺 (Table 8, Line 12) net of maintenance and station service is simply the sum of all reserves (𝑅𝑅𝑅𝑅𝐺𝐺 + 𝐸𝐸𝑅𝑅𝐺𝐺 + 𝑃𝑃𝑅𝑅𝐺𝐺) by grid. The gross installed capacities for each load (𝐺𝐺𝑁𝑁𝐸𝐸𝐿𝐿𝐺𝐺) by grid and ancillary services (𝐺𝐺𝑁𝑁𝐸𝐸𝐴𝐴𝐺𝐺) for each grid are simply obtained by including the maintenance and station services (Table 8, Lines 13-16). From here, we get the gross installed capacity by grid (𝐺𝐺𝑁𝑁𝐸𝐸𝐺𝐺), (Table 8, Line 17) by summing up 𝐺𝐺𝑁𝑁𝐸𝐸𝐿𝐿𝐺𝐺 and 𝐺𝐺𝑁𝑁𝐸𝐸𝐴𝐴𝐺𝐺. Table 8: Parameters and Formulas Used in the Computations Parameter Varia
ble Unit Formula Description
1 Electricity Consumption
𝐸𝐸𝐸𝐸 GWh … Projected using error correction model (Figure 13). Equal to Gross Generation.
2 Share of Electricity Consumption by Grid
𝑎𝑎𝐺𝐺 % Historical average from 1991 to 2014: 74% for Luzon, 13% for Visayas, 13% for Mindanao.
3 Electricity Consumption by Grid
𝐸𝐸𝐸𝐸𝐺𝐺 MWh 𝐸𝐸𝐸𝐸 × 𝑎𝑎𝐺𝐺100
× 1000 𝐺𝐺 refers to Grid: Luzon, Visayas, and Mindanao 1 GW = 1000 MW
4 Load Factor 𝐿𝐿𝐿𝐿𝐺𝐺 % This is the average load divided by the peak load in a specified time period. Based on the DOE's Philippine Energy Plan assumptions per grid; 73% for Luzon, 69% for Visayas, 72% for Mindanao. Assumed constant for all years.
5 Peak Demand by Grid (Non-Coincident)
𝑃𝑃𝑃𝑃𝐺𝐺 MW 𝐸𝐸𝐸𝐸𝐺𝐺 𝐿𝐿𝐿𝐿𝐺𝐺 100 ×8,760ℎ𝑟𝑟𝑙𝑙
Based on the DOE's Power Development Plan computation of peak demand
6 Peak Demand (Non-Coincident)
𝑃𝑃𝑃𝑃 �𝑃𝑃𝑃𝑃𝐺𝐺𝐺𝐺
Summing the peak demand across grid to obtain the peak demand for the Philippines is based on the DOE
26
Power Statistics (2014).
7 Regulating Reserve
𝑅𝑅𝑅𝑅𝐺𝐺 MW 𝑃𝑃𝑃𝑃𝐺𝐺 × .04 Assists in frequency control by providing automatic primary and/or secondary frequency response, equivalent to 4% of peak demand.
8 Contingency Reserve
𝐸𝐸𝑅𝑅𝐺𝐺 MW … Intended to take care of the loss of the largest synchronized generating unit or the power import from a single grid interconnection, whichever is larger. The Sual Power Plant Unit 1 with 0.647 GW capacity is assumed to serve as 𝐸𝐸𝑅𝑅𝐺𝐺; Kepco-Salcon Unit 1 with 0.100 GW capacity for Visayas; a coal- fired power plant with 0.105 GW capacity for Mindanao.
9 Dispatchable Reserve
𝑃𝑃𝑅𝑅𝐺𝐺 MW … 2nd largest unit capacity online. The Sual Power Plant Unit 2 with 0.647 GW capacity is assumed to serve as 𝑃𝑃𝑅𝑅𝐺𝐺 ; Kepco-Salcon Unit 2 with 0.100 GW capacity for Visayas; a coal fired power plant with 0.105 GW capacity for Mindanao.
10 Capacity Factor by Load (Load 𝐿𝐿: Base, Midmerit, Peaking)
𝐸𝐸𝐿𝐿𝐿𝐿𝐺𝐺 % … Based on the DOE's Power Development Plan capacity share assumptions by grid for base, midmerit, and peaking loads respectively for all grids: 67%, 23%, 10%
11 Net Installed Capacity by Load
𝑁𝑁𝑁𝑁𝐸𝐸𝐿𝐿𝐺𝐺 MW 𝑃𝑃𝑃𝑃𝐺𝐺 × 𝐸𝐸𝐿𝐿𝐿𝐿𝐺𝐺 Required installed capacity by base, midmerit, and peaking load net of maintenance and station service.
12 Net Installed Capacity for Ancillary
𝑁𝑁𝑁𝑁𝐸𝐸𝐴𝐴𝐺𝐺 MW 𝑅𝑅𝑅𝑅𝐺𝐺 + 𝐸𝐸𝑅𝑅𝐺𝐺+ 𝑃𝑃𝑅𝑅𝐺𝐺
Required installed capacity to satisfy ancillary services net of maintenance and station service.
13 Maintenance Capacity Factor
𝑏𝑏 % Assumed to be 90% of gross installed capacity.
14 Station Service Capacity Factor
𝑐𝑐 % Assumed to be 90% for base and 95% for midmerit, peaking, and ancillary services of gross installed capacity + maintenance service.
15 Gross Installed Capacity by Grid by Load
𝐺𝐺𝑁𝑁𝐸𝐸𝐿𝐿𝐺𝐺 MW 𝑁𝑁𝑁𝑁𝐸𝐸𝐿𝐿𝐺𝐺 𝑏𝑏⁄𝑐𝑐
Required installed capacity by base, midmerit, and peaking load plus maintenance and station service.
16 Gross Installed Capacity for Ancillary by Grid
𝐺𝐺𝑁𝑁𝐸𝐸𝐴𝐴𝐺𝐺 MW 𝑁𝑁𝑁𝑁𝐸𝐸𝐴𝐴𝐺𝐺 𝑏𝑏⁄𝑐𝑐
Required installed capacity to satisfy ancillary services plus maintenance and station service
17 Gross Installed Capacity by Grid
𝐺𝐺𝑁𝑁𝐸𝐸𝐺𝐺 MW 𝐺𝐺𝑁𝑁𝐸𝐸𝐿𝐿𝐺𝐺+ 𝐺𝐺𝑁𝑁𝐸𝐸𝐴𝐴𝐺𝐺
Required installed capacity by grid: Luzon, Visayas, and Mindanao
18 Gross Installed Capacity
𝐺𝐺𝑁𝑁𝐸𝐸 �𝐺𝐺𝑁𝑁𝐸𝐸𝐺𝐺𝐺𝐺
Required installed capacity for the Philippines
19 Share of Installed Capacity by Load by Grid
𝜃𝜃𝐿𝐿𝐺𝐺 % 𝐺𝐺𝑁𝑁𝐸𝐸𝐿𝐿𝐺𝐺𝐺𝐺𝑁𝑁𝐸𝐸𝐺𝐺
Note: ∑ 𝜃𝜃𝐿𝐿𝐺𝐺 = 100%𝐿𝐿 For simplicity, we lumped together midmerit, peaking, and ancillary loads as one. Thus, loads (𝐿𝐿) are

27
reduced to two: (1) base and (2) midmerit-peak-ancillary.
20 Fuel Source (Technology)
𝐿𝐿 … Fuel sources include coal, natural gas, conventional renewables, variable renewables, and oil. Conventional renewables include geothermal and hydro. Variable renewables include the must-dispatch solar, wind, biomass, and run-off river hydro.
21 Fuel Share by Load by Grid as Percent of Installed Capacity
𝛽𝛽𝐹𝐹𝐿𝐿𝐺𝐺 % Share in the fuel mix by grid is given in Box 3 as percent of installed capacity. Note that not all fuel sources or technologies are suitable for all types of load. Geographical location also matters. The following list the technologies by load and by grid: 1. Luzon - Baseload: coal, natural gas, geothermal, base hydro and the must-dispatch variable renewables. Note: 𝜃𝜃𝐿𝐿𝐺𝐺 = ∑ 𝛽𝛽𝐹𝐹𝐿𝐿𝐺𝐺𝐹𝐹 - Midmerit-peak-ancillary: peaking hydro, peaking natural gas, and oil 2. Visayas and Mindanao - Baseload: coal, geothermal, base hydro and the must-dispatch variable renewables - Midmerit-peak-ancillary: peaking hydro, and oil
22 Per-unit Energy by Load by Grid
𝜌𝜌𝐿𝐿𝐺𝐺 % Per-unit energy of baseload is assumed 67% for all grids. Per-unit energy of midmerit-peak-ancillary is assumed 5% for Luzon and Mindanao; and 2% for Visayas.
23 Power Consumption by Load by Grid
𝛿𝛿𝐿𝐿𝐺𝐺 % 𝜌𝜌𝐿𝐿𝐺𝐺𝐿𝐿𝐿𝐿𝐺𝐺
Per-unit Energy by Load/ Load Factor This is the percentage share of power consumption for each type of load.
24 Sum of Load in Peak Demand
𝑑𝑑 % The parameter (𝑑𝑑) is based on the load duration curve in 2014 actual utilization of the different fuel sources. Based on DOE’s data, the shares in peak demand of base, midmerit, and peaking are 67%, 23%, and 10% respectively. Mark-up for ancillary services is 15% of peak demand computed as 𝑁𝑁𝑁𝑁𝐶𝐶𝐴𝐴𝐺𝐺
𝑃𝑃𝑃𝑃𝐺𝐺. Thus,
sum total of load in peak demand, 𝑑𝑑 = 115%
28
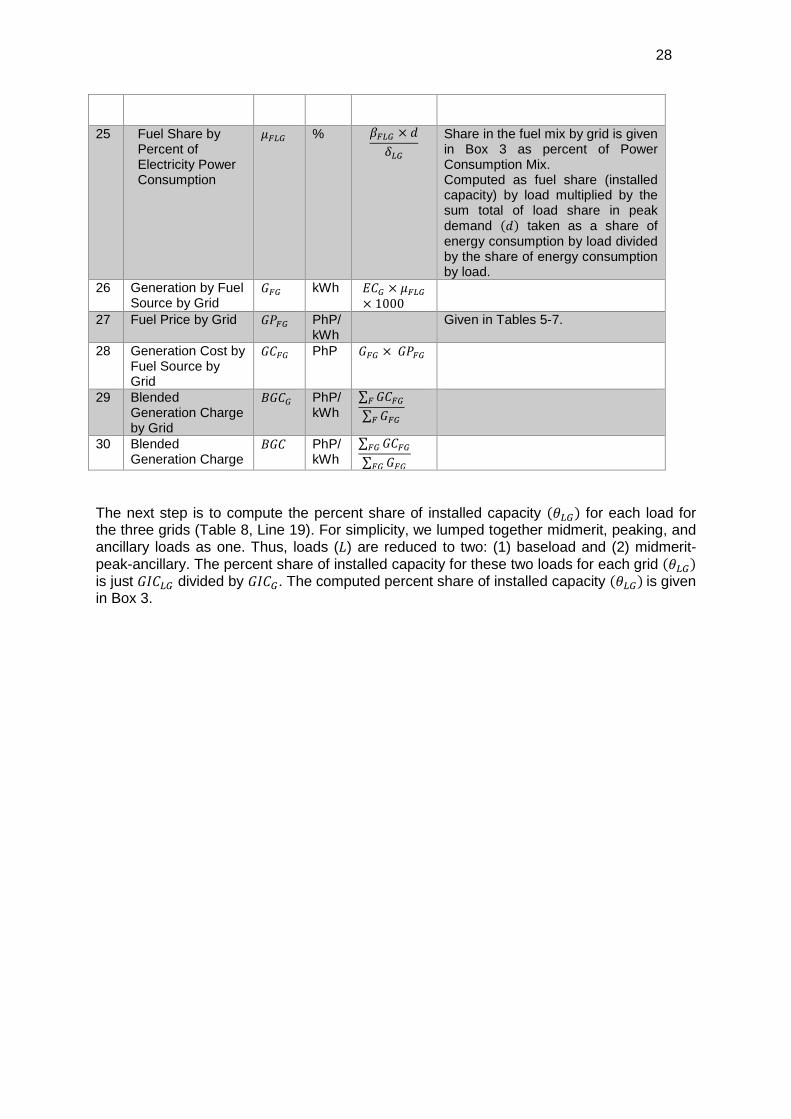
25 Fuel Share by Percent of Electricity Power Consumption
𝜇𝜇𝐹𝐹𝐿𝐿𝐺𝐺 % 𝛽𝛽𝐹𝐹𝐿𝐿𝐺𝐺 × 𝑑𝑑𝛿𝛿𝐿𝐿𝐺𝐺
Share in the fuel mix by grid is given in Box 3 as percent of Power Consumption Mix. Computed as fuel share (installed capacity) by load multiplied by the sum total of load share in peak demand (𝑑𝑑) taken as a share of energy consumption by load divided by the share of energy consumption by load.
26 Generation by Fuel Source by Grid
𝐺𝐺𝐹𝐹𝐺𝐺 kWh 𝐸𝐸𝐸𝐸𝐺𝐺 × 𝜇𝜇𝐹𝐹𝐿𝐿𝐺𝐺× 1000
27 Fuel Price by Grid 𝐺𝐺𝑃𝑃𝐹𝐹𝐺𝐺 PhP/kWh
Given in Tables 5-7.
28 Generation Cost by Fuel Source by Grid
𝐺𝐺𝐸𝐸𝐹𝐹𝐺𝐺 PhP 𝐺𝐺𝐹𝐹𝐺𝐺 × 𝐺𝐺𝑃𝑃𝐹𝐹𝐺𝐺
29 Blended Generation Charge by Grid
𝐵𝐵𝐺𝐺𝐸𝐸𝐺𝐺 PhP/kWh
∑ 𝐺𝐺𝐸𝐸𝐹𝐹𝐺𝐺𝐹𝐹
∑ 𝐺𝐺𝐹𝐹𝐺𝐺𝐹𝐹
30 Blended Generation Charge
𝐵𝐵𝐺𝐺𝐸𝐸 PhP/kWh
∑ 𝐺𝐺𝐸𝐸𝐹𝐹𝐺𝐺𝐹𝐹𝐺𝐺
∑ 𝐺𝐺𝐹𝐹𝐺𝐺𝐹𝐹𝐺𝐺
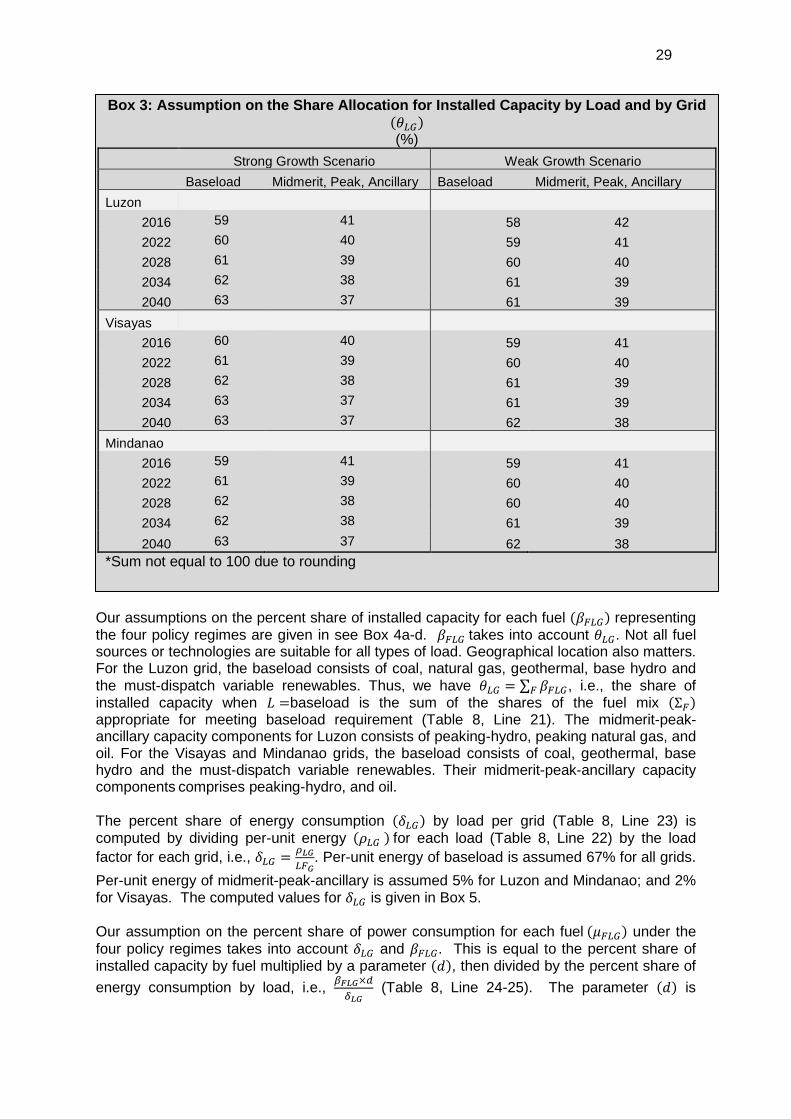
The next step is to compute the percent share of installed capacity (𝜃𝜃𝐿𝐿𝐺𝐺) for each load for the three grids (Table 8, Line 19). For simplicity, we lumped together midmerit, peaking, and ancillary loads as one. Thus, loads (𝐿𝐿) are reduced to two: (1) baseload and (2) midmerit-peak-ancillary. The percent share of installed capacity for these two loads for each grid (𝜃𝜃𝐿𝐿𝐺𝐺) is just 𝐺𝐺𝑁𝑁𝐸𝐸𝐿𝐿𝐺𝐺 divided by 𝐺𝐺𝑁𝑁𝐸𝐸𝐺𝐺. The computed percent share of installed capacity (𝜃𝜃𝐿𝐿𝐺𝐺) is given in Box 3.
29
Our assumptions on the percent share of installed capacity for each fuel (𝛽𝛽𝐹𝐹𝐿𝐿𝐺𝐺) representing the four policy regimes are given in see Box 4a-d. 𝛽𝛽𝐹𝐹𝐿𝐿𝐺𝐺 takes into account 𝜃𝜃𝐿𝐿𝐺𝐺. Not all fuel sources or technologies are suitable for all types of load. Geographical location also matters. For the Luzon grid, the baseload consists of coal, natural gas, geothermal, base hydro and the must-dispatch variable renewables. Thus, we have 𝜃𝜃𝐿𝐿𝐺𝐺 = ∑ 𝛽𝛽𝐹𝐹𝐿𝐿𝐺𝐺𝐹𝐹 , i.e., the share of installed capacity when 𝐿𝐿 =baseload is the sum of the shares of the fuel mix (Σ𝐹𝐹) appropriate for meeting baseload requirement (Table 8, Line 21). The midmerit-peak-ancillary capacity components for Luzon consists of peaking-hydro, peaking natural gas, and oil. For the Visayas and Mindanao grids, the baseload consists of coal, geothermal, base hydro and the must-dispatch variable renewables. Their midmerit-peak-ancillary capacity components comprises peaking-hydro, and oil. The percent share of energy consumption (𝛿𝛿𝐿𝐿𝐺𝐺) by load per grid (Table 8, Line 23) is computed by dividing per-unit energy (𝜌𝜌𝐿𝐿𝐺𝐺 ) for each load (Table 8, Line 22) by the load factor for each grid, i.e., 𝛿𝛿𝐿𝐿𝐺𝐺 = 𝜌𝜌𝐿𝐿𝐺𝐺
𝐿𝐿𝐹𝐹𝐺𝐺. Per-unit energy of baseload is assumed 67% for all grids.
Per-unit energy of midmerit-peak-ancillary is assumed 5% for Luzon and Mindanao; and 2% for Visayas. The computed values for 𝛿𝛿𝐿𝐿𝐺𝐺 is given in Box 5. Our assumption on the percent share of power consumption for each fuel (𝜇𝜇𝐹𝐹𝐿𝐿𝐺𝐺) under the four policy regimes takes into account 𝛿𝛿𝐿𝐿𝐺𝐺 and 𝛽𝛽𝐹𝐹𝐿𝐿𝐺𝐺. This is equal to the percent share of installed capacity by fuel multiplied by a parameter (𝑑𝑑), then divided by the percent share of energy consumption by load, i.e., 𝛽𝛽𝐿𝐿𝐿𝐿𝐺𝐺×𝑑𝑑
𝛿𝛿𝐿𝐿𝐺𝐺 (Table 8, Line 24-25). The parameter (𝑑𝑑) is
Box 3: Assumption on the Share Allocation for Installed Capacity by Load and by Grid (𝜃𝜃𝐿𝐿𝐺𝐺) (%)
Strong Growth Scenario Weak Growth Scenario Baseload Midmerit, Peak, Ancillary Baseload Midmerit, Peak, Ancillary Luzon
2016 59 41 58 42 2022 60 40 59 41 2028 61 39 60 40 2034 62 38 61 39 2040 63 37 61 39
Visayas 2016 60 40 59 41
2022 61 39 60 40 2028 62 38 61 39 2034 63 37 61 39 2040 63 37 62 38
Mindanao 2016 59 41 59 41
2022 61 39 60 40 2028 62 38 60 40 2034 62 38 61 39 2040 63 37 62 38
*Sum not equal to 100 due to rounding
30
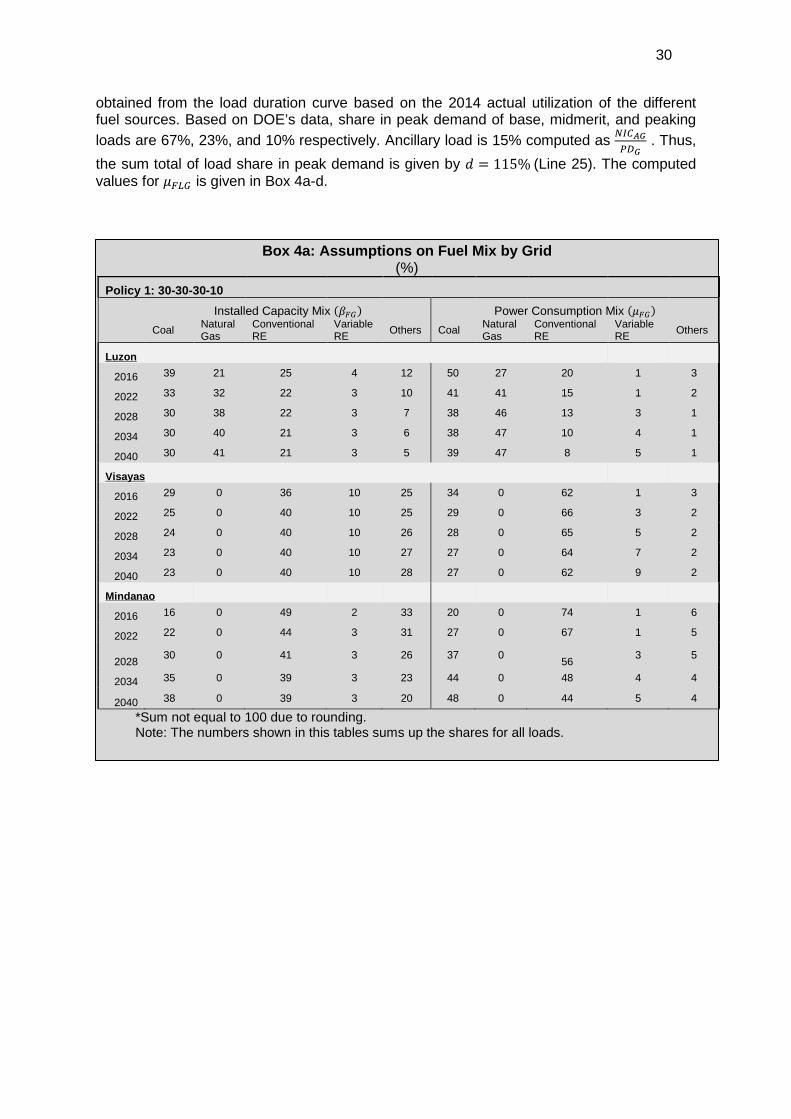
obtained from the load duration curve based on the 2014 actual utilization of the different fuel sources. Based on DOE’s data, share in peak demand of base, midmerit, and peaking loads are 67%, 23%, and 10% respectively. Ancillary load is 15% computed as 𝑁𝑁𝑁𝑁𝐶𝐶𝐴𝐴𝐺𝐺
𝑃𝑃𝑃𝑃𝐺𝐺 . Thus,
the sum total of load share in peak demand is given by 𝑑𝑑 = 115% (Line 25). The computed values for 𝜇𝜇𝐹𝐹𝐿𝐿𝐺𝐺 is given in Box 4a-d.
Box 4a: Assumptions on Fuel Mix by Grid (%)
Policy 1: 30-30-30-10
Installed Capacity Mix (𝛽𝛽𝐹𝐹𝐺𝐺) Power Consumption Mix (𝜇𝜇𝐹𝐹𝐺𝐺)
Coal Natural Gas
Conventional RE
Variable RE Others Coal Natural
Gas Conventional RE
Variable RE Others
Luzon 2016 39 21 25 4 12 50 27 20 1 3
2022 33 32 22 3 10 41 41 15 1 2
2028 30 38 22 3 7 38 46 13 3 1
2034 30 40 21 3 6 38 47 10 4 1
2040 30 41 21 3 5 39 47 8 5 1
Visayas
2016 29 0 36 10 25 34 0 62 1 3
2022 25 0 40 10 25 29 0 66 3 2
2028 24 0 40 10 26 28 0 65 5 2
2034 23 0 40 10 27 27 0 64 7 2
2040 23 0 40 10 28 27 0 62 9 2
Mindanao
2016 16 0 49 2 33 20 0 74 1 6
2022 22 0 44 3 31 27 0 67 1 5
2028 30 0 41 3 26 37 0 56 3 5
2034 35 0 39 3 23 44 0 48 4 4
2040 38 0 39 3 20 48 0 44 5 4
*Sum not equal to 100 due to rounding. Note: The numbers shown in this tables sums up the shares for all loads.

31
Box 4b: Assumptions on Fuel Mix by Grid (%)
Policy 2: Utilization of the lesser-cost resource
Installed Capacity Mix (𝛽𝛽𝐹𝐹𝐺𝐺) Power Consumption Mix (𝜇𝜇𝐹𝐹𝐺𝐺)
Coal Natural Gas
Conventional RE
Variable RE Others Coal Natural
Gas Conventional
RE Variable
RE Others
Luzon
2016 39 21 25 4 12 50 27 20 1 3
2022 42 20 25 2 12 52 29 16 1 2
2028 44 21 25 2 8 55 27 16 1 2
2034 47 20 25 2 6 60 23 16 1 1
2040 53 18 24 2 3 68 15 15 1 1
Visayas
2016 29 0 36 10 25 34 0 62 1 3
2022 30 0 37 8 25 35 0 62 1 2
2028 32 0 39 6 23 37 0 60 1 2
2034 34 0 39 6 21 40 0 57 1 2
2040 35 0 40 6 19 43 0 55 1 1
Mindanao
2016 16 0 49 2 33 20 0 74 1 6
2022 23 0 46 2 30 28 0 66 1 5
2028 28 0 44 2 27 34 0 60 1 5
2034 36 0 39 1 24 45 0 50 1 4
2040 44 0 34 1 21 56 0 40 1 4 *Sum not equal to 100 due to rounding. Note: The numbers shown in this tables sums up the shares for all loads.
32
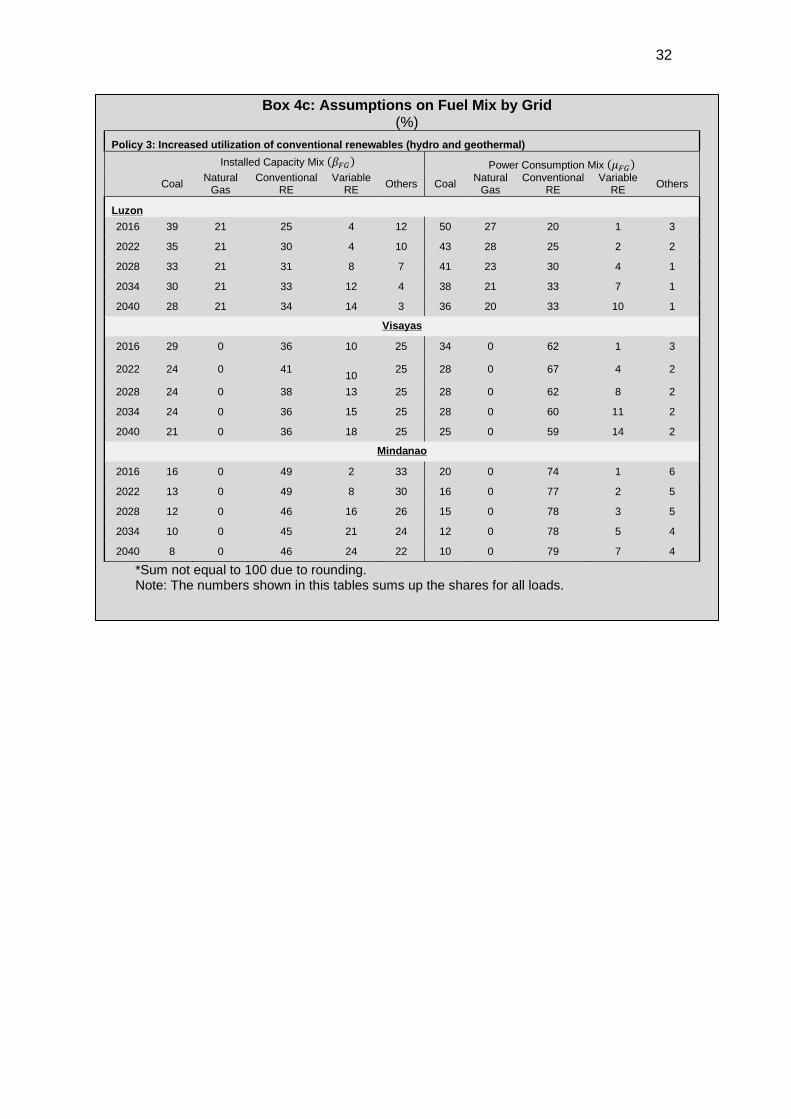
Box 4c: Assumptions on Fuel Mix by Grid (%)
Policy 3: Increased utilization of conventional renewables (hydro and geothermal)
Installed Capacity Mix (𝛽𝛽𝐹𝐹𝐺𝐺) Power Consumption Mix (𝜇𝜇𝐹𝐹𝐺𝐺)
Coal Natural Gas
Conventional RE
Variable RE Others Coal Natural
Gas Conventional
RE Variable
RE Others
Luzon 2016 39 21 25 4 12 50 27 20 1 3
2022 35 21 30 4 10 43 28 25 2 2
2028 33 21 31 8 7 41 23 30 4 1
2034 30 21 33 12 4 38 21 33 7 1
2040 28 21 34 14 3 36 20 33 10 1
Visayas
2016 29 0 36 10 25 34 0 62 1 3
2022 24 0 41 10 25 28 0 67 4 2
2028 24 0 38 13 25 28 0 62 8 2
2034 24 0 36 15 25 28 0 60 11 2
2040 21 0 36 18 25 25 0 59 14 2
Mindanao
2016 16 0 49 2 33 20 0 74 1 6
2022 13 0 49 8 30 16 0 77 2 5
2028 12 0 46 16 26 15 0 78 3 5
2034 10 0 45 21 24 12 0 78 5 4
2040 8 0 46 24 22 10 0 79 7 4
*Sum not equal to 100 due to rounding. Note: The numbers shown in this tables sums up the shares for all loads.
33
In order to obtain the aggregate fuel mix for the country (Table 9), we first compute for the level of gross installed capacity and power consumption for each type of fuel for each grid, i.e., 𝐺𝐺𝑁𝑁𝐸𝐸𝐹𝐹𝐺𝐺 = 𝐺𝐺𝑁𝑁𝐸𝐸𝐺𝐺 × 𝛽𝛽𝐿𝐿𝐺𝐺 and 𝐺𝐺𝐹𝐹𝐺𝐺 = 𝐸𝐸𝐸𝐸𝐺𝐺 × 𝜇𝜇𝐿𝐿𝐺𝐺, respectively. Summing up the required gross installed capacity across all grids for each fuel and dividing by the aggregate gross
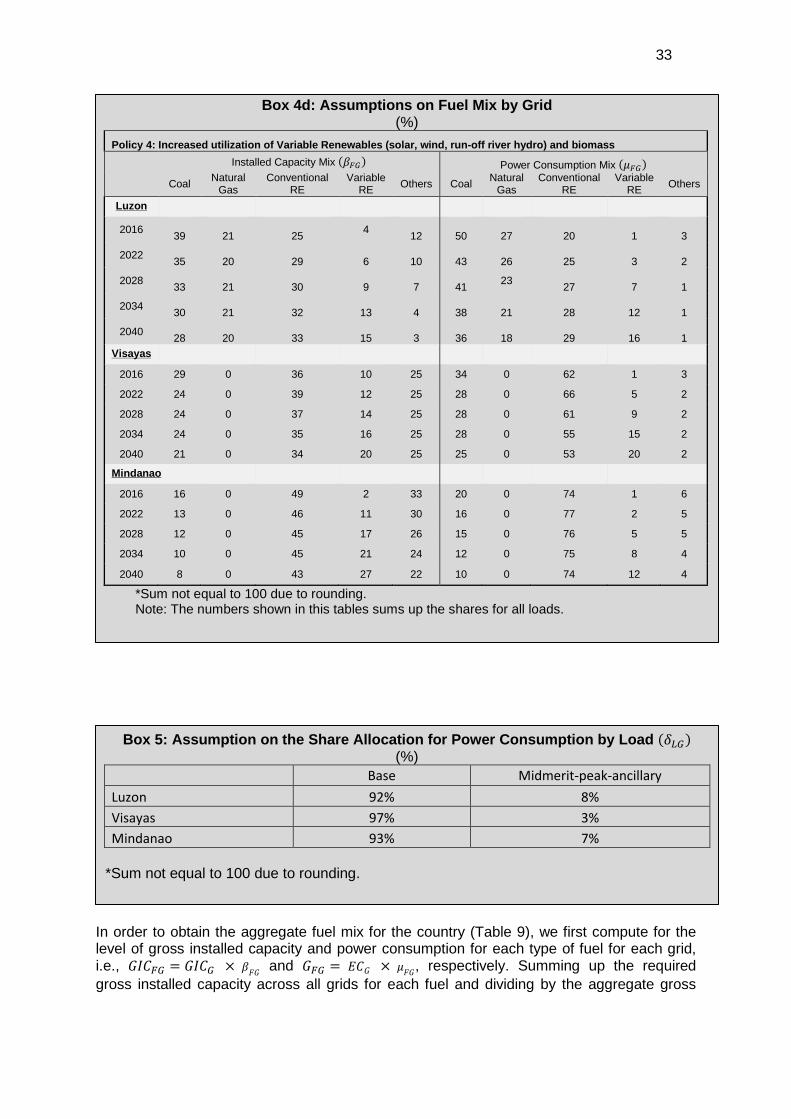
Box 4d: Assumptions on Fuel Mix by Grid (%)
Policy 4: Increased utilization of Variable Renewables (solar, wind, run-off river hydro) and biomass
Installed Capacity Mix (𝛽𝛽𝐹𝐹𝐺𝐺) Power Consumption Mix (𝜇𝜇𝐹𝐹𝐺𝐺)
Coal Natural Gas
Conventional RE
Variable RE Others Coal Natural
Gas Conventional
RE Variable
RE Others
Luzon 2016 39 21 25 4 12 50 27 20 1 3
2022 35 20 29 6 10 43 26 25 3 2
2028 33 21 30 9 7 41 23 27 7 1
2034 30 21 32 13 4 38 21 28 12 1
2040 28 20 33 15 3 36 18 29 16 1 Visayas
2016 29 0 36 10 25 34 0 62 1 3
2022 24 0 39 12 25 28 0 66 5 2
2028 24 0 37 14 25 28 0 61 9 2
2034 24 0 35 16 25 28 0 55 15 2
2040 21 0 34 20 25 25 0 53 20 2
Mindanao 2016 16 0 49 2 33 20 0 74 1 6
2022 13 0 46 11 30 16 0 77 2 5
2028 12 0 45 17 26 15 0 76 5 5
2034 10 0 45 21 24 12 0 75 8 4
2040 8 0 43 27 22 10 0 74 12 4
*Sum not equal to 100 due to rounding. Note: The numbers shown in this tables sums up the shares for all loads.
Box 5: Assumption on the Share Allocation for Power Consumption by Load (𝛿𝛿𝐿𝐿𝐺𝐺) (%)
Base Midmerit-peak-ancillary Luzon 92% 8% Visayas 97% 3% Mindanao 93% 7%
*Sum not equal to 100 due to rounding.
34
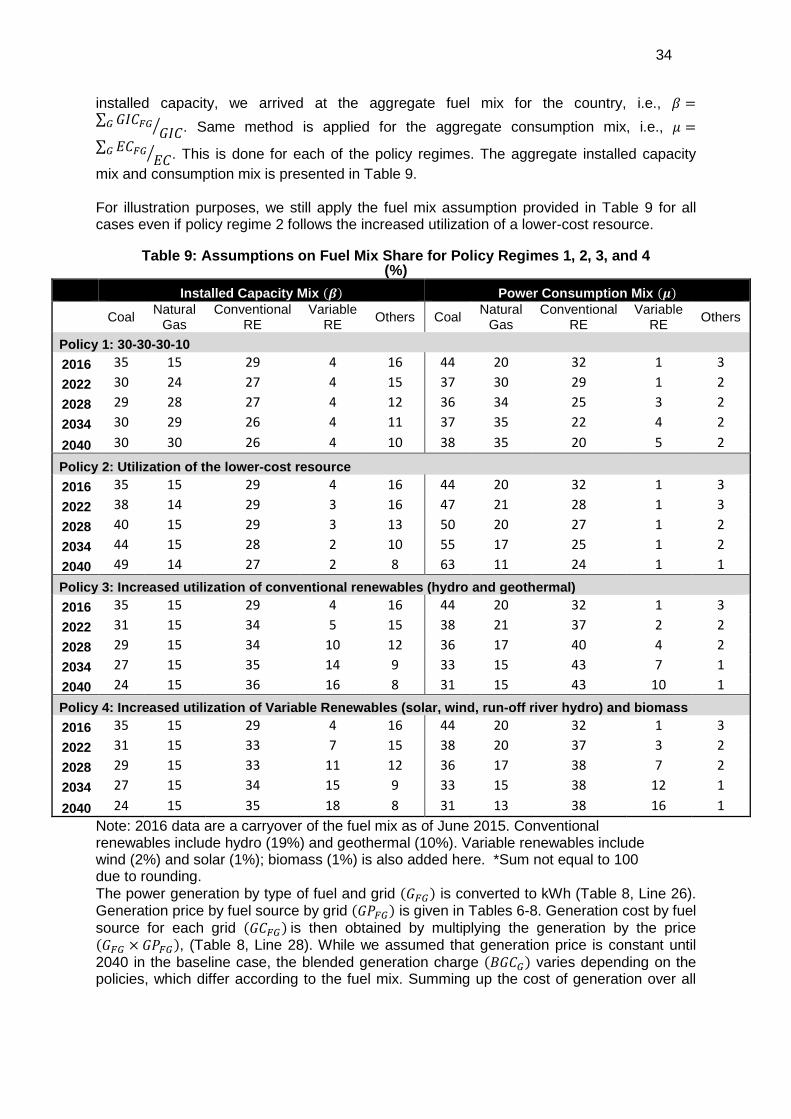
installed capacity, we arrived at the aggregate fuel mix for the country, i.e., 𝛽𝛽 =∑ 𝐺𝐺𝑁𝑁𝐸𝐸𝐹𝐹𝐺𝐺𝐺𝐺
𝐺𝐺𝑁𝑁𝐸𝐸� . Same method is applied for the aggregate consumption mix, i.e., 𝜇𝜇 =∑ 𝐸𝐸𝐸𝐸𝐹𝐹𝐺𝐺𝐺𝐺
𝐸𝐸𝐸𝐸� . This is done for each of the policy regimes. The aggregate installed capacity mix and consumption mix is presented in Table 9.
For illustration purposes, we still apply the fuel mix assumption provided in Table 9 for all cases even if policy regime 2 follows the increased utilization of a lower-cost resource.
Table 9: Assumptions on Fuel Mix Share for Policy Regimes 1, 2, 3, and 4 (%)
Installed Capacity Mix (𝜷𝜷) Power Consumption Mix (𝝁𝝁)
Coal Natural Gas
Conventional RE
Variable RE Others Coal Natural
Gas Conventional
RE Variable
RE Others
Policy 1: 30-30-30-10 2016 35 15 29 4 16 44 20 32 1 3 2022 30 24 27 4 15 37 30 29 1 2 2028 29 28 27 4 12 36 34 25 3 2 2034 30 29 26 4 11 37 35 22 4 2
2040 30 30 26 4 10 38 35 20 5 2
Policy 2: Utilization of the lower-cost resource 2016 35 15 29 4 16 44 20 32 1 3 2022 38 14 29 3 16 47 21 28 1 3 2028 40 15 29 3 13 50 20 27 1 2 2034 44 15 28 2 10 55 17 25 1 2 2040 49 14 27 2 8 63 11 24 1 1
Policy 3: Increased utilization of conventional renewables (hydro and geothermal) 2016 35 15 29 4 16 44 20 32 1 3 2022 31 15 34 5 15 38 21 37 2 2 2028 29 15 34 10 12 36 17 40 4 2 2034 27 15 35 14 9 33 15 43 7 1 2040 24 15 36 16 8 31 15 43 10 1
Policy 4: Increased utilization of Variable Renewables (solar, wind, run-off river hydro) and biomass 2016 35 15 29 4 16 44 20 32 1 3 2022 31 15 33 7 15 38 20 37 3 2 2028 29 15 33 11 12 36 17 38 7 2 2034 27 15 34 15 9 33 15 38 12 1
2040 24 15 35 18 8 31 13 38 16 1 Note: 2016 data are a carryover of the fuel mix as of June 2015. Conventional renewables include hydro (19%) and geothermal (10%). Variable renewables include wind (2%) and solar (1%); biomass (1%) is also added here. *Sum not equal to 100 due to rounding. The power generation by type of fuel and grid (𝐺𝐺𝐹𝐹𝐺𝐺) is converted to kWh (Table 8, Line 26). Generation price by fuel source by grid (𝐺𝐺𝑃𝑃𝐹𝐹𝐺𝐺) is given in Tables 6-8. Generation cost by fuel source for each grid (𝐺𝐺𝐸𝐸𝐹𝐹𝐺𝐺) is then obtained by multiplying the generation by the price (𝐺𝐺𝐹𝐹𝐺𝐺 × 𝐺𝐺𝑃𝑃𝐹𝐹𝐺𝐺), (Table 8, Line 28). While we assumed that generation price is constant until 2040 in the baseline case, the blended generation charge (𝐵𝐵𝐺𝐺𝐸𝐸𝐺𝐺) varies depending on the policies, which differ according to the fuel mix. Summing up the cost of generation over all

35
fuel types and dividing by the total power generation �∑ 𝐺𝐺𝐶𝐶𝐿𝐿𝐺𝐺𝐿𝐿∑ 𝐺𝐺𝐿𝐿𝐺𝐺𝐿𝐿𝐺𝐺
�, we obtain the blended generation charge per kWh for each grid (𝐵𝐵𝐺𝐺𝐸𝐸𝐺𝐺), (Table 8, Line 29). The result of the numerical exercise is presented in Table 10. Gross installed capacities and gross generation are summed across grid (Box 6) to obtain the values for the country corresponding to the four policy regimes under the strong-growth scenario and policy regime 1 under the weak-growth scenario. Table 10: Generation Capacity in Strong and Weak Growth Scenarios, 2015-2040 Indicator 2015 2016 2022 2028 2034 2040
Strong Growth Scenario Population Growth Rate (%) … 1.46 1.21 1.05 0.84 0.61 GDP per Capita (PhP) 74,453 79,299 110,216 154,741 219,707 316,173 GDP per Capita Growth Rate (%) … 6.51 5.72 5.89 6.11 6.35 Electricity Consumption = Gross Generation (MWh) 81,896,000 85,434,660
111,382,600
143,576,000 184,496,300 236,865,100
Installed Capacity (MW) 18,279 18,983 24,143 30,545 38,682 49,096 Blended Generation Charge (PhP/kWh)
Policy 1: 30-30-30-10 Fuel Mix … 4.35 4.38 4.42 4.46 4.47 Policy 2: Least-cost Resource … 4.38 4.37 4.34 4.32 4.29 Policy 3: Increased Conventional RE … 4.38 4.43 4.50 4.58 4.65 Policy 4: Increased Variable RE … 4.38 4.47 4.57 4.70 4.82
Weak Growth Scenario with Policy 1 Population Growth Rate (%) … 1.68 1.57 1.40 1.21 1.04 GDP per Capita (PhP) 74,453 76,155 87,550 101,441 118,873 140,791 GDP per Capita Growth Rate (%) … 2.29 2.39 2.56 2.76 2.93 Electricity Consumption = Gross Generation (MWh) 81,896,000 83,204,540 95,137,580
109,676,600 126,681,700 146,383,200
Installed Capacity (MW) 18,279 18,539 20,912 23,803 27,185 31,103
Blended Generation Charge (PhP/kWh) … 4.35 4.38 4.42 4.46 4.47 Notes: 1. Strong growth scenario has an annual 7% GDP growth rate and low variant population growth rate. 2. Weak growth scenario has an annual 4% GDP growth rate and medium variant population growth rate. 3. Policy 1: 30-30-30-10 mix; Policy 2: increased utilization of the lower-cost resource; Policy 3: increased use of conventional renewables; and Policy 4: increased use of variable renewables. Policies 2, 3 and 4 take account of the emission charge.

36
Box 6: Generation Capacity in Strong- and Weak-Growth Scenarios by Grid, 2015-2040 Indicator 2016 2022 2028 2034 2040
Luzon
Strong Growth Scenario
Electricity Consumption = Gross Generation (MWh) 63,221,648 82,423,124 106,246,240 136,527,262 175,280,174
Peak Demand (MW) 9,886 12,889 16,614 21,350 27,410
Installed Capacity (MW) 13,969 17,753 22,446 28,412 36,047 Case 1 (Base): Blended Generation Charge (P/kWh)
Policy 1: 30-30-30-10 Fuel Mix 4.33 4.36 4.38 4.41 4.40 Policy 2: Least-cost Resource 4.37 4.36 4.31 4.26 4.18 Policy 3: Increased Conventional RE 4.37 4.41 4.45 4.52 4.60 Policy 4: Increased Variable RE 4.37 4.45 4.53 4.65 4.76
Weak Growth Scenario with Policy 1 Electricity Consumption = Gross Generation (MWh) 61,571,360 70,401,809 81,160,684 93,744,458 108,323,568
Peak Demand (MW) 9,628 11,009 12,692 14,659 16,939
Installed Capacity (MW) 13,644 15,384 17,504 19,983 22,855 Blended Generation Charge (P/kWh) 4.33 4.36 4.38 4.41 4.40 Visayas Strong Growth Scenario Electricity Consumption = Gross Generation (MWh) 11,106,506 14,479,738 18,664,880 23,984,519 30,792,463
Peak Demand (MW) 1,837 2,396 3,088 3,968 5,094
Installed Capacity (MW) 2,549 3,252 4,124 5,233 6,652 Case 1 (Base): Blended Generation Charge (P/kWh)
Policy 1: 30-30-30-10 Fuel Mix 4.96 5.00 5.05 5.09 5.13 Policy 2: Least-cost Resource 4.98 4.96 4.93 4.92 4.91 Policy 3: Increased Conventional RE 4.98 5.02 5.12 5.17 5.26 Policy 4: Increased Variable RE 4.98 5.04 5.14 5.27 5.39
Weak Growth Scenario with Policy 1
Electricity Consumption = Gross Generation (MWh) 10,816,590 12,367,885 14,257,958 16,468,621 19,029,816
Peak Demand (MW) 1,790 2,046 2,359 2,725 3,148 Installed Capacity (MW) 2,489 2,812 3,206 3,667 4,201 Blended Generation Charge (P/kWh) 4.96 5.00 5.05 5.09 5.13 Mindanao Strong Growth Scenario Electricity Consumption = Gross Generation (MWh) 11,106,506 14,479,738 18,664,880 23,984,519 30,792,463
Peak Demand (MW) 1,761 2,296 2,959 3,803 4,882
Installed Capacity (MW) 2,464 3,138 3,974 5,037 6,397 Case 1 (Base): Blended Generation Charge (P/kWh)
Policy 1: 30-30-30-10 Fuel Mix 3.82 3.88 4.03 4.12 4.18 Policy 2: Least-cost Resource 3.83 3.88 3.94 4.09 4.27 Policy 3: Increased Conventional RE 3.83 3.95 4.15 4.31 4.36 Policy 4: Increased Variable RE 3.83 4.02 4.23 4.37 4.56
Weak Growth Scenario with Policy 1
Electricity Consumption = Gross Generation (MWh) 10,816,590 12,367,885 14,257,958 16,468,621 19,029,816
Peak Demand (MW) 1,715 1,961 2,261 2,611 3,017
Installed Capacity (MW) 2,406 2,716 3,094 3,535 4,047 Blended Generation Charge (P/kWh) 3.82 3.88 4.03 4.12 4.18

37
Under the strong-growth scenario, regardless of policy regime, the result shows that the country needs to increase its installed capacity from 18.2 GW in 2015 to about 49 GW in 2040, a 169% increase, to support the 7% annual growth from 2016-2040. This required installed capacity in 2040 is close to the 2012 installed capacity of Thailand and Indonesia, which are at about 53 GW and 48 GW, respectively. Gross generation would increase from 81,896 GWh in 2015 to 236,865 GWh in 2040, a 189% increase. Under the weak-growth scenario, the result shows that the country needs to increase its installed capacity from 18.2 GW in 2015 to about 31 GW in 2040; a 70% increase. Gross generation would increase from 81,896 GWh in 2015 to 146,383 GWh in 2040, a 78% increase. Meeting the required installed capacity is a necessary but not a sufficient condition for the improvement of the well-being of Filipinos, which is the main objective of this study. The price consumers pay to access and consume electricity matters. This is reflected in the blended generation charge (𝐵𝐵𝐺𝐺𝐸𝐸), which constitutes 47% of the total bill of residential consumers (Meralco 2015). Therefore, a significant reduction in the blended generation charges will improve the economic well-being of the Filipino consumers. Focusing on the strong-growth scenario, Figures 14–18 show the projected trends for the blended generation charge under the five cases of possible evolution of fuel prices. For each of these cases, we compare the performance of the four policy regimes on fuel mix: Policy 1: 30-30-30-10 mix (the current policy stance of the government), Policy 2: increased utilization of the lower-cost resource, Policy 3: increased use of conventional renewables, and Policy 4: increased use of must-dispatch renewables. Policy regimes 2, 3 and 4 take account of the emission charge. It should be noted that in all the five cases of possible evolution of fuel prices, the fuel mix assumptions under the four policy regimes remain the same as given in Table 5. Holding fuel technology and prices constant at 2015 levels (Case 1), Figure 14 shows that Policy regime 2 performs best, where the blended generation charge will decrease by 2.21%, from PhP4.38 per kWh in 2016 to PhP4.29 per kWh in 2040. On the other hand, maintaining the 30-30-30-10, the “balanced aspiration” would be costly. Following Policy regime 1, the blended generation charge is projected to increase from PhP4.35 per kWh in 2016 to PhP4.47 per kWh in 2040, an increase of 2.77%. Policy regime 3, which increases the fuel share of conventional renewables such as hydro and geothermal, performs better than Policy regime 4, but this may not be a realistic assumption given the hard constraints of natural reserves. Increasing the share of must-dispatch renewables, Policy regime 4, at current generation prices can lead to an increase of 9.87% in the blended generation charge by 2040.
Figure 14: Case 1 (Baseline constant fuel price) - Generation Price Projections
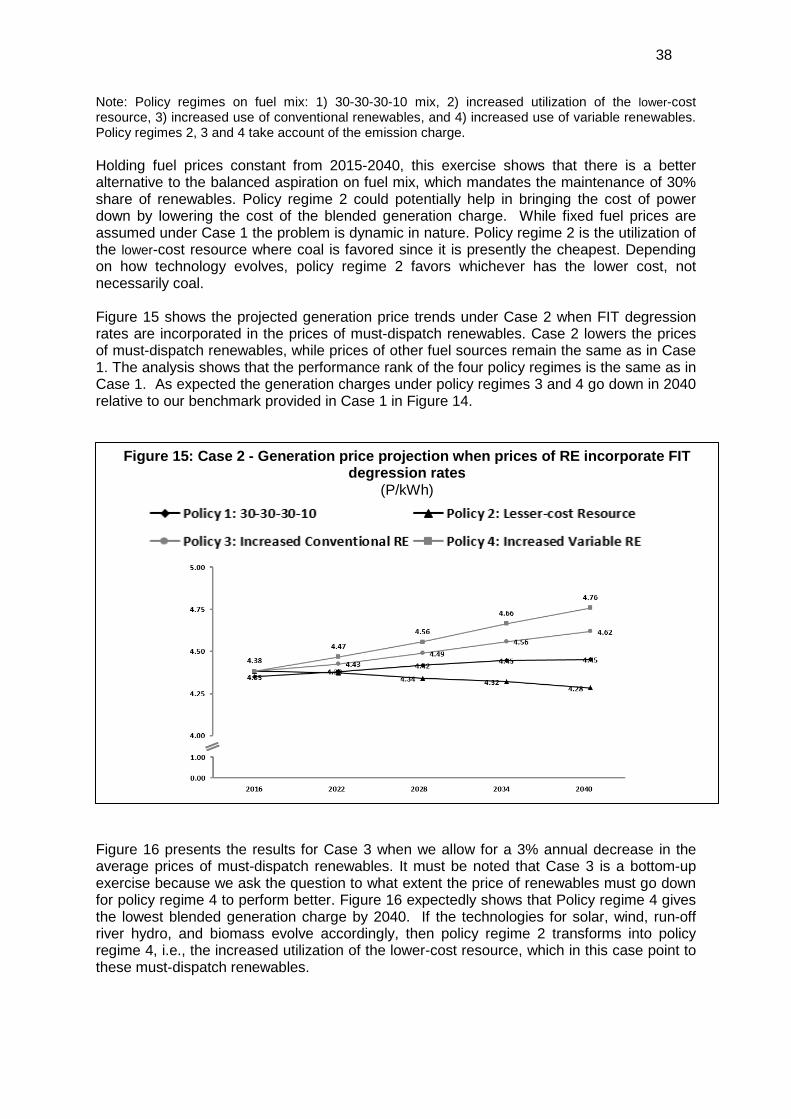
38
Note: Policy regimes on fuel mix: 1) 30-30-30-10 mix, 2) increased utilization of the lower-cost resource, 3) increased use of conventional renewables, and 4) increased use of variable renewables. Policy regimes 2, 3 and 4 take account of the emission charge. Holding fuel prices constant from 2015-2040, this exercise shows that there is a better alternative to the balanced aspiration on fuel mix, which mandates the maintenance of 30% share of renewables. Policy regime 2 could potentially help in bringing the cost of power down by lowering the cost of the blended generation charge. While fixed fuel prices are assumed under Case 1 the problem is dynamic in nature. Policy regime 2 is the utilization of the lower-cost resource where coal is favored since it is presently the cheapest. Depending on how technology evolves, policy regime 2 favors whichever has the lower cost, not necessarily coal. Figure 15 shows the projected generation price trends under Case 2 when FIT degression rates are incorporated in the prices of must-dispatch renewables. Case 2 lowers the prices of must-dispatch renewables, while prices of other fuel sources remain the same as in Case 1. The analysis shows that the performance rank of the four policy regimes is the same as in Case 1. As expected the generation charges under policy regimes 3 and 4 go down in 2040 relative to our benchmark provided in Case 1 in Figure 14.
Figure 16 presents the results for Case 3 when we allow for a 3% annual decrease in the average prices of must-dispatch renewables. It must be noted that Case 3 is a bottom-up exercise because we ask the question to what extent the price of renewables must go down for policy regime 4 to perform better. Figure 16 expectedly shows that Policy regime 4 gives the lowest blended generation charge by 2040. If the technologies for solar, wind, run-off river hydro, and biomass evolve accordingly, then policy regime 2 transforms into policy regime 4, i.e., the increased utilization of the lower-cost resource, which in this case point to these must-dispatch renewables.
Figure 15: Case 2 - Generation price projection when prices of RE incorporate FIT degression rates
(P/kWh)
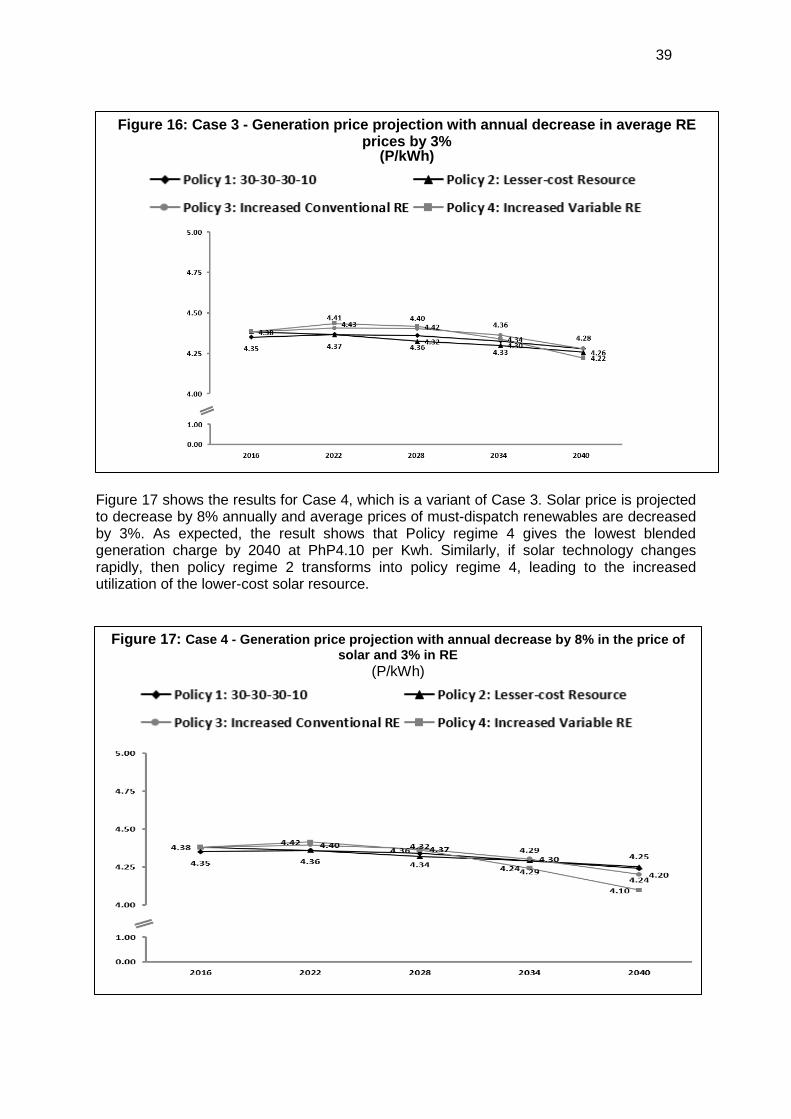
39
Figure 17 shows the results for Case 4, which is a variant of Case 3. Solar price is projected to decrease by 8% annually and average prices of must-dispatch renewables are decreased by 3%. As expected, the result shows that Policy regime 4 gives the lowest blended generation charge by 2040 at PhP4.10 per Kwh. Similarly, if solar technology changes rapidly, then policy regime 2 transforms into policy regime 4, leading to the increased utilization of the lower-cost solar resource.
Figure 16: Case 3 - Generation price projection with annual decrease in average RE prices by 3%
(P/kWh)
Figure 17: Case 4 - Generation price projection with annual decrease by 8% in the price of solar and 3% in RE
(P/kWh)

40
Figure 18 shows the results for Case 5, where all fuel prices are assumed to change simultaneously. Projections of the EIA (2016) were applied to the 2015 fuel prices for the Philippines in the conduct of this exercise. The EIA annual average growth projection for coal up to 2040 is at 0.50%, which is relatively lower than that for other fuel sources, i.e., at 2.50% for natural gas, 4% for oil and -0.64% for must-dispatch renewables . Policy regime 2, the utilization of the lesser-cost resource, performs best, posting a blended generation charge of PhP5.63 per Kwh by 2040.
Since the objective is to improve the well-being of the Filipinos, it is not enough to meet the required generating capacity under strong-growth scenario. We also consider the cost. Given the projection on prices under the five cases, we then compute how much it would cost to generate the electricity that would support the consumption of 236,865 GWh under the Strong-growth scenario. Figure 19 compares the total generation cost of the four policy regimes under the five possible cases of the evolution of fuel prices. Policy regime 2 costs the least specifically under cases 1(PhP1,015 billion), 2 (PhP1,014 billion), and 5 (PhP1,345 billion). With case 3, policy regime 4 is the least cost at PhP1,000 billion. Note that policy regime 2 stipulates increased utilization of the lesser-cost resource. Thus, under case 3, policy regime 2 effectively transforms into policy regime 4.
Figure 18: Case 5 - Generation price projection when all fuel price changes simultaneously (P/kWh)

41
Figure 19: Total Generation Cost in 2040 (PhP Billions)
-
200
400
600
800
1,000
1,200
1,400
1,600
Case 1 Case 2 Case 3 Case 4 Case 5
Billi
ons
To reiterate, our overriding objective is to improve the well-being of Filipinos by lowering the price of electricity in an economically efficient manner. The numerical exercise illustrates that the optimal fuel mix is not constant over time but should exploit the opportunities opened up by less costly resources while taking environmental and health costs8 into account. An important caveat is that the fuel mix in the four policy regimes is based on current and projected prices and the current situation. This does not account for the intermittency cost of renewable generation capacity and the cost of integrating renewables into the grid, which may require additional investment. For example, a 16 MW wind turbine in Scotland requires a grid investment of ₤4 billion (House of Lords 2008, II 252). In Britain, a 34% share of renewables in their generation and transmission imposes a likely cost of ₤6.8 billion a year, or an extra 38% increase (House of Lords 2008, I 252). The intermittent nature of renewable generation, such as in wind and solar, requires additional investment in new capacity from reliable conventional sources (or even in nuclear energy) to serve as back-up sources (Van Kooten 2010). In the United Kingdom, the pursuit of a 15% renewables target requires roughly doubling the requirement for new capacity.
8 Our numerical exercise did not include health costs. A study for the Philippines is wanting.

42
III. PROPOSED TARGETS FROM 2016 TO 2040 We have translated the government’s ‘2040 vision’ in terms of per capita income growing to PhP316,173 ($6,873) in 2040 at constant 2000 prices from the 2015 level of PhP74,453 ($1,618). This meant that per capita income had to grow at 6% per year. In section I, we built strong- and weak-growth scenarios. The vision for 2040 was realized in the strong-growth scenario whereas a business-as-usual case was illustrated in the weak-growth scenario. We then asked what was required from the energy sector to attain the vision by focusing on the fuel mix policy and how it could influence the electricity price. Here,we then outline measurable indicators and proposed indicative targets constituting energy security through to 2040 (Table 11). We take energy security to have three dimensions: accessibility, affordability, and reliability. Accessibility is defined as the percentage of the population that has access to electricity. In 2012, 87.5% of Filipinos had access to electricity. The target for the current administration (2016-2022) can be 90%. The indicator for affordability is the price that consumers pay. Our analysis in Section I focused on the generation costs that make up 47% of the electricity bill. Since the EPIRA, the generation sector has already been privatized. The government can facilitate a more competitive environment not by restricting/prohibiting a fuel mix but, rather, by letting the market work. Following market signals, the generation sector will rationally adhere to the utilization of least cost-resource. The targets under affordability correspond to the results presented in Figure 14.
Table 11. Measurable Indicators and Proposed Targets Benchmark
year units 2012/ 2015
2016-2022
2022- 2028
2028-2034
2034-2040
Remarks
1. Accessibility 2012 (% of pop)
87.5 90 92 94 95 2012 is based on WB
2. Affordability: Price (full cost including health & environmental cost) - Generation Charge
2015 PhP/KWh
4.38 4.37 4.34 4.32 4.29 2015 Blended Generation Charge (BGC) based on MERALCO prices. Projection based on authors’ preliminary calculation
3. Reliability: Loss of Load Expectation (LOLE)
2015 day(s)/year
1.2 1.1 1 1 0.9 2015 is based on WB estimates. 1 day optimal LOLE is based on del Mundo 1991.
Sources of basic data: WDI (2014); Meralco (2015); del Mundo (2015). The third dimension for energy security is reliability, which can be measured using the engineering concept called “Loss of Load Expectation” (LOLE). It is defined as the expected number of times in a year that the available generation capacity, considering scheduled- and forced-outages of power plants, will not meet system daily peak demand, i.e., the number of days in a year that there will be “brownouts” (blackouts) caused by unscheduled power plant outages. In the US and Europe, a standard LOLE is approximately 0.3 to 0.1 day per year. In the Philippines, the LOLE has been previously estimated to be 1.2 days per year (Del Mundo 2014). The target for the current administration is to shorten the LOLE to 1.1 days per year.

43
IV. KEY REFORMS AND ALTERNATIVE PATHWAYS A. Investment Coordination in Generation, Transmission, and Distribution Given the long gestation period to build a power plant, the benefits from planning ahead far exceed the costs. Concomitant with investment in generation are the coordinated investments in the transmission and distribution infrastructure. A well-conceived master plan that accounts for the current assessment of the industry and provides incentive-compatible arrangements will attract investors to bet on the country for the long term. Coordination has never been the Philippines’ strong suit, and we have to do much better in this regard in the next 25 years. A master plan coordinating investment in generation, transmission, and distribution infrastructure must be drawn up at the start of the new administration. This is critical if the Philippines wants to sustain economic growth. An equally decisive factor is the coordination between investment in power generation and investment in the upgrade of the grid. Negros Island (Region 18) will soon become a considerable exporter of renewable power. Due to the expanded FIT program, many new solar projects are coming on-stream and many sugar mills are acquiring co-generation capacity to supply power to the open market through the grid. The latter is especially exciting because the feedstock used is bagasse (biomass), which used to be a throwaway waste product of sugar milling and is thus a cheap RE source. The first hurdle is getting the power to the grid. These new RE generation capacities require connection to the grid and those connections are not readily forthcoming, so that some plants (e.g. SONEDCO Milling), which can defray the cost, decided to finance the connection themselves rather than run idle. It is the National Grid Corporation of the Philippines’ (NGCP) obligation to provide these connections, but any financing the NGCP does for a connection project has to be approved by the Energy Regulatory Commission (ERC) for future reimbursement. The ERC, with its limited personnel and expertise complement, is normally swamped with petitions for approval that take time to process, and hence result in delays. The second hurdle occurs after connection to the grid. Negros Island will need to sell this new power to power-deficit regions, including even Luzon. The problem is the limited capacity of the power pipeline connecting Negros to Cebu and, thereafter, to Luzon. If the grid capacity is not upgraded, these new projects will become stranded assets like the Bataan nuclear project. Again, the NGCP is supposed to be involved—but this expensive, though very socially worthwhile project, may have to wait. Our suggestion is for the national government to make the grid upgrade between Negros and Cebu (and, thereafter, its extension from Negros to Mindanao) a priority public-private partnership (PPP) project. Stable and consistent government policies are important to foster and encourage private investment in power generation. Timely implementation is also crucial. The ERC, for example, has to decide on numerous petitions for tariff adjustments. A cumbersome and contentious accounting review process means added costs which the distribution utilities (DU) eventually pass on to captive consumers. The ERC’s recent move to outsource the review process to the market through the Competitive Selection Process (CSP) will free the ERC of considerable burden: it is now the DUs’ responsibility to convince the ERC of the transparency and competitiveness of their power supply agreements (PSA). If the CSP is found wanting, the ERC simply subjects the PSA to a Swiss challenge. As to who determines the acceptability of the CSP, the ERC can coordinate with the Philippine Electricity Market Corporation (PEMC) or the PPP Center that has developed some capability on market testing. As to the issue of the PSA contract template, we recommend

44
that a portfolio approach be developed in lieu of per-plant approach to auctioning. This means that the bidders may not necessarily be power generation plants but may indeed be power supply aggregators (e.g. various power types such as base load and peaking) who can handle the numerous financial minutiae (e.g., risk-sharing among the parties). Uncertainty in the policy environment discourages inflow of private investment in the power sector; the same results draw from gaps and weaknesses in the physical network, such as the grid connection. It is foolhardy to invest in assets that will become stranded. The few investors who may come in are those likely to demand higher returns for higher risks, or those whose comparative advantage is in extracting compensation from the national government and navigating the bureaucratic maze rather than in efficient operations. B. Government Investment in the Transmission Highway Section 8 of the EPIRA created the National Transmission Company (TRANSCO), which assumed the electrical transmission function of the National Power Corporation (NPC). The TRANSCO is owned by the Power Sector Assets and Liabilities Management Corporation (PSALM), which is mandated to privatize its assets either through an outright sale or a concession contract. In December 2008, Congress, through Republic Act (RA) 9511, awarded the franchise to the NGCP, a consortium consisting of Monte Oro Grid, Calaca High Power Corp, and State Grid Corporation of China. The franchise granted the NGCP the authority to engage in the business of conveying or transmitting electricity through a high-voltage backbone system of interconnected transmission lines, substations and related facilities, and for other purposes. The nature and scope of the franchise also granted the NGCP the authority to construct, install, finance, manage, improve, expand, operate, maintain, rehabilitate, repair, and refurbish the present nationwide transmission system. Prior to the congressional franchise, one of the TRANSCO’s responsibilities, as provided in Section 9 of the EPIRA, was to improve and expand its transmission facilities, consistent with the Grid Code and the Transmission Development Plan (TDP). The TRANSCO was also required to submit any plan for expansion or improvement of its facilities for approval of the ERC. One of the TRANSCO’s modes of financing the expansion of its transmission facilities was through loans (e.g. from ADB and JICA).9 With the award of the franchise, these responsibilities now rest solely with the NGCP, along with financing and seeking the approval of ERC for any investment in expanding the transmission facilities. The ERC’s approval of any investment would need to consider the cost implication to consumers as the investment recovery is ultimately passed on to consumers. Our suggestion is that financing and investment should be separate from the regulatory structure of the transmission tariff. Since government owns the transmissions assets, the TRANSCO should play the lead role in planning, investment, and expansion of transmission facilities. Financing, for example, could be in the form of PPP or through the government treasury, depending on the efficacy of the investment. Depending on the mode of financing, consumers can partly finance the expansion, similar to Norway and Chile (Oren et al. 2002). It is critical to make investment in transmission expansion incentive-compatible with key stakeholders, consumers, private sector, and government. in the Philippines, the long wait by the NGCP for ERC’s approval in consideration of the increase in retail cost is likely to inhibit investment in transmission, which could lead to congestion and, ultimately, higher costs for consumers. Investment in transmission expansion offers great potential benefits for 9 See ADB Project Number: 36018, Loan Number: 1984, dated January 2012 and JICA Report in http://www.jica.go.jp/english/our_work/evaluation/oda_loan/post/2007/pdf/project13_full.pdf

45
efficiency by increasing access to low-cost generation, improving reliability, and mitigating market power. Better transmission could potentially reduce the marginal cost of transmission (Joskow 1976), which will eventually lower average wholesale prices. C. Regulatory Oversight Coordination in Support of a Competitive Market The recent passage of the Philippine Competition Act, which provides for a National Competition Policy and the creation of the Philippine Competition Commission (PCC), bodes well for a regulatory regime that has more resources and is more transparent. It should be stressed that the PCC and the ERC must work in harmony to ensure that “forum shopping” is avoided and no industry participant exercises significant market power.10 Agencies should recognize the limitations of their own capacity as well as the strengths of other agencies. It is a positive development that the ERC has now issued a circular mandating CSP. In the interim, DUs are to prove that their PSA contracts went through transparent and open competitive bidding. As part of the EPIRA unbundling of the sector, the NGCP, a private for-profit entity, enjoys a monopoly franchise over grid operations. While the NGCP won its franchise through competitive bidding, the PCC and the ERC should ensure that the NGCP, as system operator, does not engage in monopoly pricing. They should also ensure, together with the DOE, that new investments in transmission facilities are on time to meet future demand and that proper maintenance is in place at all times to avoid system failure. From an economic efficiency and societal welfare viewpoint, the result of regulatory policy should be an industry and an economy where market prices of outputs and inputs faced by consumers and producers reflect their marginal social values and marginal social costs. Moreover, externalities or spillovers should be internalized through corrective tax and subsidy mechanisms to ensure that the market prices faced by consumers and producers more closely reflect their true marginal social values and marginal social costs. D. Reconciling Two Seemingly Contradicting Instruments: EPIRA and RE Law The power industry has two major legal instruments: the EPIRA (RA 9136) and the RE Law (RA 9513). An examination of these two laws suggests that they may be working at cross purposes, with the EPIRA apparently being undermined by the RE Law. Reconciling the disparate objectives is needed preparatory to reforming these laws. The long-term national goals are articulated in the EPIRA. Foremost among them are: to ensure the quality, reliability, security, and affordability of the supply of electric power; to make sure that transparent and reasonable prices of electricity prevail in a regime of free and fair competition, and full public accountability; to promote the utilization of indigenous and new and RE resources in power generation to reduce dependence on imported energy; and to accelerate the total electrification of the country. In 2008, the RE Law was passed seeking to (i) reduce dependence on fossil fuels, thus insulating the country’s exposure to price fluctuations in the international markets and (ii) increase utilization and development of RE resources as tools in preventing harmful emissions. 10 As of September 2016, the PCC and ERC were in the final stage of drawing a Memorandum of Understanding (MOU) in coordinating their work.

46
The main conflict between the two laws lies in how certain provisions of the RE Law seem to run counter to EPIRA’s goals of “affordability of the supply of electric power” and “reasonable prices of electricity.” In particular, the FIT system under the RE Law raises the price of electricity paid by the consumer. One way of reconciling the goals of “economic growth and development” with “the promotion of health and safety, and the protection of the environment” (RA 9513) is to address the negative environmental and health effects of carbon emissions from fossil fuel-based power generation through carbon taxes, i.e., directing policy right at the source of the harmful spillovers. The carbon taxes will internalize the negative externality and the revenues generated can be used to finance investments in environmental and health protection. E. Reform of the Electric Cooperatives One black hole in the power landscape of the Philippines is the operation of some electric cooperatives (ECs), where financial viability is constantly in question. One reason is the role of local politics in the capture of management. Cooperatives are run on the one-member-one-vote modality—a political and inefficient modality. This results in political capture. Cooperatives must move towards the corporatist lines of one-share-one-vote. This incentivizes greater efficiency and attention to the bottom line. Management should then be passed on to the hands of those with most to lose if the company fails. Wresting cooperatives from the claws of politics is tricky and needs political courage. Denial of power to a population as the ultimate weapon is politically costly for the national government. The effort of the National Electrification Administration (NEA) to provide subsidies for corporatization has resulted in meager harvest. The target is the eventual consolidation of small DUs into only a handful of more financially robust DUs run on corporatist lines and open to private investors. This will also greatly unburden the ERC. Problems with the ECs and the rural electrification thrust are probably best illustrated in the raging battle for management control over several ECs between those who want registration with the Cooperative Development Authority (CDA) and those who prefer to remain within the ambit of the NEA. Under Section 57 of the EPIRA, “electric cooperatives are . . . given the option to convert into either stock cooperative under the Cooperatives Development Act or stock corporation under the Corporation Code.” Those in support of registration with the CDA, like the Association of Philippine Electric Cooperatives, claim that doing so would lower electricity tariffs by P0.25/kWh to P0.40/kWh because the 12% expanded value-added tax and local taxes would be waived. Two prominent examples of ECs where bitter disputes between the pro-CDA and pro-NEA camps prevail are the Batangas II Electric Cooperative in Luzon and the Davao del Norte Electric Cooperative in Mindanao. At present, nevertheless, the vast majority of ECs are still registered with NEA, perhaps because NEA is their major source of finance. What is disturbing about the situation is why this turf war between the two national government agencies is being allowed to continue. Many ECs have to put their management and finances in order. A growing perception is that the ECs are “essentially political creatures, where local political control and interference is a feature of governance and management” (Castalla 2004, p. 3). This is an issue that needs to be addressed, for ECs are at the forefront of government’s efforts to expand access to electricity in the countryside. To make ECs more efficient, the EPIRA gives them the option of converting to either a stock cooperative or stock corporation. DOE Circular 2004-06-007 urges ECs to “undertake structural and operational reforms… through collaboration with the private investor-operators to gain access to private sector capital and management expertise.” This initiative needs to

47
be monitored more closely, highlighting “best practices” where private sector participation leads to cheaper, and more reliable electricity services. F. Investment in Research and Development Attention also needs to be directed toward energy research and development (R&D). In fact, the Philippine Development Plan (PDP) 2011-2016 cites the need for a stronger energy R&D, particularly on RE. Current initiatives are focused on nonfood feedstock development for biodiesel and bioethanol in support of the country’s biofuels program. In this regard, partnership among government, academe, and the private sector should be harnessed. Two government agencies are at the forefront of energy R&D: the DOE and the Department of Science and Technology (DOST). The DOE performs their energy research testing and laboratory services through two divisions: the Geo-scientific Research and Testing Laboratory, and the Appliance Testing and Laboratory. As such, they do not really engage in basic research. The DOST’s Philippine Council for Industry, Energy, and Emerging Technology Research and Development (PCIEERD) is the agency that is more closely associated with basic research. Its governing council is composed of seven members from the government (DOST, Department of Public Works and Highways, Department of Transportation and Communication, DOE, Commission on Higher Education or CHED, Board of Investments–Department of Trade and Industry, and Department of Budget and Management) and three from the private sector. The PCIEERD’s Energy, Utilities and Systems Technology Division formulates a science and technology sectoral plan, and “coordinates, evaluates, and monitors R&D programs and projects relating to energy conservation, conventional and non-conventional sources of energy, construction and infrastructure, and transportation sectors”. Again, like the DOE, the DOST-PCIEERD coordinates and funds but does not do energy R&D. It gives “Outstanding R&D” cash awards for completed research. Among the recent recipients for energy were “A Portable Power Generating Apparatus for Irrigation System of Small Scale Farming,” “Solid Waste to Energy, Fertilizer and Wealth,” and “Rapid Electric Vehicle Charging: Charging in Minutes.” Despite the interagency nature of PCIEERD, government resources allocated to energy R&D remain limited, and coordination among government agencies involved in energy R&D is generally lacking. A glaring example of this lack of coordination is in the development of jatropha for biodiesel production in the mid- to late-2000s. While the scientific community was still studying the technical feasibility of using oil from this plant as biodiesel, two competing government-owned and -controlled corporations (i.e., the Philippine Forest Corporation and the Alternative Fuels Corporation) already embarked on a massive jatropha planting program, which eventually went to waste. As academician and former DOST Secretary Emil Javier remarked, the jatropha endeavor was a case where the policy preceded the technology. One yet untapped RE source of power is ocean thermal energy conversion (OTEC). According to the PDP 2011-2016: “to date, the country’s potential sites for deep-ocean power consist of 910 blocks equivalent to 73,710 hectares.” The DOE has signed several OTEC pre-development contracts, but thus far there has been no operating plant set up. One proponent estimates the need for a FIT of P17.65/kWh for a 10-MW plant to be financially viable. Meanwhile, nuclear energy, considered the cheapest source of power, remains untapped. The 600–MW Bataan Nuclear Power Plant (BNPP), construction of which started in 1976, was ready to be commissioned by the mid–1980s, but the Cory Aquino administration
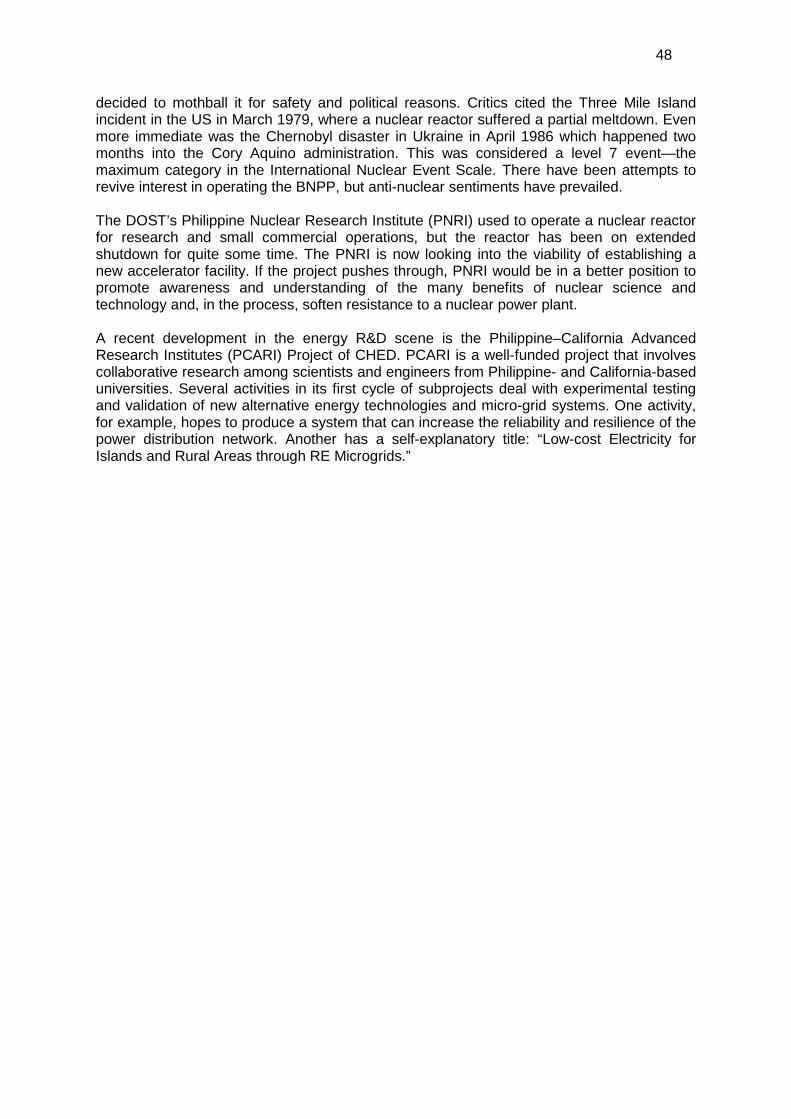
48
decided to mothball it for safety and political reasons. Critics cited the Three Mile Island incident in the US in March 1979, where a nuclear reactor suffered a partial meltdown. Even more immediate was the Chernobyl disaster in Ukraine in April 1986 which happened two months into the Cory Aquino administration. This was considered a level 7 event—the maximum category in the International Nuclear Event Scale. There have been attempts to revive interest in operating the BNPP, but anti-nuclear sentiments have prevailed. The DOST’s Philippine Nuclear Research Institute (PNRI) used to operate a nuclear reactor for research and small commercial operations, but the reactor has been on extended shutdown for quite some time. The PNRI is now looking into the viability of establishing a new accelerator facility. If the project pushes through, PNRI would be in a better position to promote awareness and understanding of the many benefits of nuclear science and technology and, in the process, soften resistance to a nuclear power plant. A recent development in the energy R&D scene is the Philippine–California Advanced Research Institutes (PCARI) Project of CHED. PCARI is a well-funded project that involves collaborative research among scientists and engineers from Philippine- and California-based universities. Several activities in its first cycle of subprojects deal with experimental testing and validation of new alternative energy technologies and micro-grid systems. One activity, for example, hopes to produce a system that can increase the reliability and resilience of the power distribution network. Another has a self-explanatory title: “Low-cost Electricity for Islands and Rural Areas through RE Microgrids.”

49
V. CONCLUDING REMARKS
To attain the goal of strong economic growth, we estimated electricity consumption to grow at an annual average rate of 4.3%. Focusing on the generation sector, we illustrated how policy reforms on fuel mix could potentially reduce blended generation charges that make up 47% of the total electric bill of households. The results of our simulations showed that a policy that supported the increased utilization of less costly resources could potentially decrease the blended generation charge. On the one hand, with the base-case assumption that technology and, hence, fuel prices would remain constant at 2016 prices from 2016-2040, the emergent policy would imply increased utilization of coal as fuel, since this is still by far the cheapest. With this assumption, blended generation charge could potentially decrease in 2040. On the other hand, if technology for variable renewable energy could evolve rapidly to bring fuel prices down by at least 3% from today’s current average prices, then this would point to the increased utilization of variable RE resources.
The paramount objective in our numerical exercises was to improve the well-being of Filipinos by lowering the price of electricity in an economically efficient manner. The results of the five cases with regard to generation price illustrated that the optimal fuel mix would not be constant over time but should exploit the opportunities opened up by less costly resources.
We also assessed the power sector’s performance and suggested broad key reforms and alternative pathways. The current Philippine Energy Plan (PEP) 2012–2030 identifies major policy thrusts as follows: ensure energy security, expand energy access to promote a low-carbon future, climate-proof the energy sector, promote investment in the energy sector, and develop regional energy plans. By 2040, it is hoped that a fully-functioning wholesale electricity market will be in place—one that covers not just spot sales and purchases by generation companies and distribution utilities, but longer-term sales and purchases of different durations as well. The EPIRA itself points out the policy reforms needed to achieve its objectives. For an efficient, competitive electricity market, retail competition and open access (RCOA) should be fully rolled out under a stable policy regime that completes the full implementation of the EPIRA.
The Filipino 2040 encompasses a set of long-term goals based on the standard of living that Filipinos want to have in 25 years. Verily, a comprehensive plan is essential to realizing this vision. With this as our guidepost, we outlined measurable indicators and proposed indicative targets constituting energy security for the next four administrations prior to year 2040.
Looking forward, we take energy security to have three dimensions: accessibility, affordability, and reliability. The indicator for affordability is the price that consumers pay. Our analysis focused on the generation costs that make up 47% of electricity bill. Since the enactment of the EPIRA, the generation sector has mostly been privatized. The government can facilitate a more competitive environment by not mandating a fuel mix but rather by letting the market work. Following market signals, the generation sector will rationally adhere to the utilization of the least cost-resource.
50
ADB (Asian Development Bank). 2013. Energy Outlook for Asia and the Pacific. Mandaluyong City, Philippines: ADB. http://adb.org/sites/default/files/pub/2013/energy-outlook.pdf.
ADB. 2013. Asian Development Outlook 2013: Asia’s Energy Challenge. Mandaluyong City, Philippines: ADB. http://adb.org/sites/default/files/pub/2013/ado2013.pdf.
ADB. 1984. Project Number: 36018, Loan Number: dated January 2012 and JICA Report in http://www.jica.go.jp/english/our_work/evaluation/oda_loan/post/2007/pdf/project13_full.pdf
BSP (Bangko Sentral ng Pilipinas). 2015. “Economic and Financial Statistics: Overseas Filipinos' Remittances.” Accessed October. http://www.bsp.gov.ph/statistics/efs_ext3.asp.
Castalla. 2004. “Draft Final Report on Investment Management Contracts (IMC) for Electricity Cooperatives.” Report for the Government of the Philippines DOE. http://siteresources.worldbank.org/EXTRENENERGYTK/Resources/5138246-1237906527727/5950705-1239137586151/Draft0Final0Re1Department0of0Energy.pdf.
Danao, R. and G., Ducanes. 2016. “An Error Correction Model for Forecasting Philippine Aggregate Electricity Consumption.” EPDP WP 2016-05. http://www.upecon.org.ph/epdp/working-paper-forecasting-05/
Daway, S. and and R. Fabella. 2015. “Development Progeria: The Role of Institutions and the Exchange Rate.” Philippine Review of Economics 52 (2).
Del Mundo, R. 2016. “Competition and Security of Supply in Philippine Electricity Market.” A Presentation at the EPDP Conference 2016: Toward Inclusive and Sustainable Energy Development. Makati. 12-13 January.
DOE (Department of Energy). 2012, 2013, 2014. “Power Statistics.” Manila: DOE. https://www.doe.gov.ph/philippine-power-statistics
DOE. 2014. “Philippine Energy Plan.” Manila: DOE. https://www.doe.gov.ph/pep
DOE. 2015. “Power Development Plan 2009-2030.” Manila: DOE. https://www.doe.gov.ph/2009-2030-PDP
DOE. n.d. “Electric Power Supply Demand Outlook for 2012-2030.” http://www2.doe.gov.ph/Presentations/Visayas%20Power%20Summit%20-%20April%2026.pdf.
DOE. n.d. “Mindanao Outlook.” http://minbizcon.com/wp-content/uploads/2013/08/Department-of-Energy.pdf.
Department of Energy (DOE) Department Circular 2015-07-0014. https://www.doe.gov.ph/department-circular-no-dc2015-07-0014
Department of Energy (DOE) Circular 2004-06-007. https://www.doe.gov.ph/department-circular-no-2004-06-007
EGAT (Electricity Generating Authority of Thailand). n.d. “Electricity Prices.” http://www.egat.co.th/en/.
REFERENCES

51
EIA (Energy International Agency). 2014. “Annual Energy Outlook 2014 with projections to 2040.” http://www.eia.gov/forecasts/aeo/pdf/0383(2014).pdf.
EIA (US Energy Information Administration). 2015. Annual Energy Review. http://www.eia.gov.
EIA (Energy Information Administration). 2016. “How much carbon dioxide is produced per kilowatt hour when generating electricity with fossil fuels?” https://www.eia.gov/tools/faqs/faq.cfm?id=74&t=11
EIA (Energy Information Administration). 2016. Annual Energy Outlook. https://www.eia.gov/outlooks/aeo/data/browser/#/?id=1-AEO2016&cases=ref2016~ref_no_cpp&sourcekey=0
Electric Power Industry Reform Act (EPIRA) of 2001. https://www.doe.gov.ph/epira-ra-9136
ERC (Energy Regulatory Commission). 2016. ERC Case No. 2015-2016 RC. Manila: ERC.
Enerdata. n.d. “Energy Data.” https://yearbook.enerdata.asia/southeast-asia-electricity-production-and-data.html#renewable-in-electricity-production-share-asean-countries.html.
Enerdata. n.d. “Carbon Emissions.” https://yearbook.enerdata.net/#CO2-emissions-data-from-fuel-combustion.html.
Fabella, R. 2016. “The Market Testing of Power Supply Agreements: Rationale and Design Evolution in the Philippines.” EPDP WP 2016-03R. http://www.upecon.org.ph/epdp/working-paper-psa-03/
Feldman, D., G. Barbose, R. Margolis, T. James, S. Weaver, N. Darghouth, R. Fu, C. Davidson, S. Boot, R.Wiser, 2014. “Photovoltaic System Pricing Trends,” US Department of Energy. http://www.nrel.gov/docs/fy14osti/62558.pdf
EMA (Market Authority). n.d. “Electricity Prices.” https://www.ema.gov.sg/index.aspx.
Gayer, T. and K. Viscusi. 2016. “Determining the Proper Scope of Climate Change Benefits in US Regulatory Analysis: Domestic versus Global Approaches.” Review of Environmental Economics and Policy 10(2): 245-263. https://www.brookings.edu/wp-content/uploads/2016/08/rev-environ-econ-policy-2016-gayer-reep-rew002.pdf
House of Lords. 2008. The Economics of Renewable Energy: Volume I Report. http://www.publications.parliament.uk/pa/ld200708/ldselect/ldeconaf/195/195i.pdf.
House of Lords. 2008. The Economics of Renewable Energy: Volume II Evidence. http://www.publications.parliament.uk/pa/ld200708/ldselect/ldeconaf/195/195ii.pdf.
IEA (International Energy Association). n.d. “Electricity Data.” http://www.iea.org/statistics/topics/Electricity/.
IEA. n.d. “Energy Statistics of Non-OECD Countries.” http://www.iea.org/bookshop/662-Energy_Statistics_of_Non-OECD_Countries.
IEA–OECD (Organisation for Economic Co-operation and Development). 2014. “OECD IEA Energy Prices and Taxes.” http://www.iea.org/statistics/topics/pricesandtaxes/.
52
IIEE (Institute of Integrated Electrical Engineers of the Philippines). 2014. “Power Industry Reforms in RCOA and EPIRA.”
IRENA (International Renewable Energy Agency). 2015. “Renewable Power Generation Costs in 2014.” http://www.irena.org/documentdownloads/publications/irena_re_power_costs_2014_report.pdf.
Joskow, P.L. 1976. “Contributions to the Theory of Marginal Cost Pricing.” The Bell Journal of Economics 7 (1), 197–206. doi: 10.2307/3003196.
Knittel, C., K. Metaxoglou, and A. Trindade. 2015. “Natural Gas Prices and Coal Displacement: Evidence from Electricity Markets.” NBER Working Papers. http://www.nber.org/papers/w21627.
Kuryente.org 2015. “Power Supply Agreements.” http://www.kuryente.org.ph/
Korea Stat. “Korea Electricity Prices.” http://kostat.go.kr/portal/english/index.action.
Lee, R. and A. Mason. 2006. “What is the Demographic Dividend?” Finance and Development: A Quarterly Magazine of the International Monetary Fund 43 (3). http://www.imf.org/external/pubs/ft/fandd/2006/09/basics.htm.
MEA (Metropolitan Electricity Authority of Thailand). n.d. “Electricity Prices.” http://www.mea.or.th/home/index.php.
MEIH (Malaysia Energy Information Hub). n.d. “Electricity Prices.” http://meih.st.gov.my/.
Meralco (Manila Electric Company). 2015. “Metro Manila Electricity Prices.” http://www.meralco.com.ph/consumer-information/rates-archive.
Meralco. 2015. “Typical Consumer Rates.” http://www.meralco.com.ph/consumer-information/rates-archive.
Meralco. 2015. “Generation.” http://www.meralco.com.ph/consumer-information/rates-archive.
Moura, P. and A. de Almeida. 2010. “The Role of Demand-side Management in the Grid Integration of Wind Power.” Applied Energy 87 (8): 2581–2588.
NGCP (National Grid Corporation of the Philippines). 2014. “Typical Load Curve by Fuel Source for each Grid during Peak Demand (Wet and Dry Season).”
NGCP. 2014. “Typical Daily Visayas to Luzon Hourly HVDC Loading during Peak Demand (actual data).”
Nordhaus, William. 2011. "Estimates of the Social Cost of Carbon: Background and Results from the RICE-2011 Model." Cowles Foundation Discussion Paper No. 1826. Yale University.
Oren, S., G. Gross, and F. Alvarado. 2002. “Alternative Business Models for Transmission Investment and Operation: National Transmission Grid Study, Appendix C.” Accessed March 2016. http://eetd.lbl.gov/publications/alternative-business-models-for-trans.
53
PLN (Perusahaan Listrik Negra). n.d. “Indonesia Electricity Prices.” http://www.pln.co.id/.
Renewable Energy Law (RA 9513). 2008. https://www.doe.gov.ph/laws-and-issuances/republic-act-no-9513
Republic Act (RA) 9511. http://lia.erc.gov.ph/documents/359
Roumasset, J., M. V. Ravago, K. Jandoc, and C. Arellano. 2016. “Beyond GDP: The Natural Environment, Shocks, Energy and Economic Policy.” EPDP Working Paper 2016-02. http://www.upecon.org.ph/epdp/working-paper-fil-2040-envi-02/
Roumasset, J. A., and K. R. Smith. 1990. “Exposure Trading: An Approach to More Efficient Air Pollution Control.” Journal of Environmental Economics and Management 18 (3): 276–291.
Shelanki and Obstfeld 2015. “Estimating the Benefits from the Carbon Dioxide Emissions Reductions.” https://obamawhitehouse.archives.gov/blog/2015/07/02/estimating-benefits-carbon-dioxide-emissions-reductions
SingStat (Singapore Statistics). “Singapore Electricity Prices.” www.singstat.gov.sg.
Stephenson, M. 2015. Shale Gas and Fracking: The Science Behind the Controversy. First edition. UK: Elsevier.
Strbac, G. 2008. “Demand-Side Management: Benefits and Challenges.” Energy Policy 36 (12): 4419–4426.
Tol, R. 2013. “Targets for Global Climate Policy: An Overview.” Journal of Economic Dynamics and Control 37 (5):911-928. doi:10.1016/j.jedc.2013.01.001.
UN (United Nations). 2014. “UN Data.” http://data.un.org/Data.aspx?d=MDG&f=seriesRowID:751.
UNFCCC (United Nations Framework Convention on Climate Change). 2011. Tracking Greenhouse Gases: An Inventory Manual. http://www.emb.gov.ph/portal/Portals/54/GHG%20Manual%20(1).pdf.
UNPP (United Nations Department of Economic and Social Affairs, Population Division). 2015. World Population Prospects: The 2015 Revision. DVD Edition. http://esa.un.org/unpd/wpp/DVD/
United States Environmental Protection Agency (US EPA). 2013. “The Social Cost of Carbon: Estimating the Benefits of Reducing Greenhouse Gas Emissions”. https://www.epa.gov/climatechange/social-cost-carbon. Accessed: January 10, 2017
US EIA (United States Energy Information Agency). 2016. “Annual Energy Outlook.” Accessed December 2016. https://www.eia.gov/outlooks/aeo/data/browser/#/?id=1-AEO2016&cases=ref2016~ref_no_cpp&sourcekey=0
US EIA. 2017. Annual Energy Outlook. Accessed February 2017. https://www.eia.gov/outlooks/aeo/
Van Kooten, G. 2010. “Wind Power: The Economic Impact of Intermittency.” Letters in Spatial and Resources Sciences 3 (1):1-17.

54
Van Kooten, G. 2013. "Economic Analysis of Feed-in Tariffs for Generating Electricity from Renewable Energy Sources". In Handbook on Energy and Climate Change. Cheltenham, UK: Edward Elgar Publishing. Accessed November 20, 2015. http://www.elgaronline.com/view/9780857933683.00017.xml
Visayan Electric Company (VECO) 2016. Generation Rates for Visayas and Mindanao. http://www.veco.com.ph/
Viswanathan, R., K. Coleman, and U. Rao. 2006. “Materials for Ultra-Supercritical Coal-fired Power Plant Boilers.” International Journal of Pressure Vessels and Piping 83 (11–12):778–783.
World Coal Association. 2015. “Reducing CO2 Emissions.” https://www.worldcoal.org/reducing-co2-emissions/high-efficiency-low-emission-coal.
WDI (World Development Indicators]). 2014. “Development Indicators.” http://databank.worldbank.org/data/reports.aspx?source=world-development-indicators.
WRI (World Resources Institute). 2014. “Data Sets.” http://www.wri.org/resources/data_sets.
WWF (World Wildlife Fund for Nature)–Philippines. 2003. “Power Switch! Scenarios and Strategies for Clean Power Development in the Philippines.”