global and russian energy outlook up to 2040 · pdf fileglobal and russian energy outlook up...
TRANSCRIPT
The Energy Research Institute of the Russian Academy of SciencesAnalyticaI Center for the Govemment of the Russian Federation
GLOBAL AND RUSSIAN ENERGY OUTLOOK UP TO 2040
THE OUTLOOK WAS PREPARED BY:
The Energy Research Institute of the Russian Academy of Sciences (ERI RAS) and the Analytical Centre of the Government of the Russian Federation (ACRF)
Scientific Advisor: A. A. Makarov, academician, director of ERI RAS
Project Manager: T. A. Mitrova, PhD, Head of Oil and Gas Department, ERI RAS
L. M. Grigoryev, PhD, Professor and Senior Advisor to the Head of AC
S. P. Filippov, corresponding member of the Russian Academy of Sciences, Deputy Director of ERI RAS
CORPORATE AUTHORS:
N. Arckhipov, Researcher, ERI RAS
O. Eliseeva, PhD, Head of ERI RAS Laboratory
A. Galkina, Researcher, ERI RAS
E. Gavrilova, Researcher, ERI RAS
E. Geller, Researcher, ERI RAS
S. Goryacheva, Researcher, ERI RAS
E. Grushevenko, Researcher, ERI RAS
D. Grushevenko, Researcher, ERI RAS
A. Horshev, PhD, Head of the Laboratory, ERI RAS
A. Ivashchenko, Independent Expert on Macroeconomics
E. Kozina, Researcher, ERI RAS
V. Kulagin, Head of the Centre for Global Energy Markets, ERI RAS
A. Kurdin, Head of the Directorate of the AC
A. Makarova, PhD, Head of the Laboratory, ERI RAS
V. Malakhov, PhD, Head of the Department of Energy Consumption, ERI RAS
S. Melnikova, Researcher, ERI RAS
I. Mironova, Researcher, ERI RAS
S. Sorokin, Researcher, ERI RAS
V. Strukova, Researcher, ERI RAS
A. Tarasov, PhD, Senior Research Scientist, ERI RAS
L. Urvantsev, Senior Research Scientist, ERI RAS
Key findings . . . . . . . . . . . . . . . . . . . . . . . . . . . . . . . . . . . . . . . . . . . . . . . . . . . . . . . . .3
Introduction . . . . . . . . . . . . . . . . . . . . . . . . . . . . . . . . . . . . . . . . . . . . . . . . . . . . . . . . .5
1. Baseline Scenario – Energy Consumption . . . . . . . . . . . . . . . . . . . . . . . . . . . .9Long-term trends of the world energy . . . . . . . . . . . . . . . . . . . . . . . . . . . . . . .9Demography . . . . . . . . . . . . . . . . . . . . . . . . . . . . . . . . . . . . . . . . . . . . . . . . . . . . 11Economic Growth . . . . . . . . . . . . . . . . . . . . . . . . . . . . . . . . . . . . . . . . . . . . . . . .14Primary Energy Consumption . . . . . . . . . . . . . . . . . . . . . . . . . . . . . . . . . . . . . 18Development of Electricity Generation. . . . . . . . . . . . . . . . . . . . . . . . . . . . . 21International Trade . . . . . . . . . . . . . . . . . . . . . . . . . . . . . . . . . . . . . . . . . . . . . . 23СО2 Emissions . . . . . . . . . . . . . . . . . . . . . . . . . . . . . . . . . . . . . . . . . . . . . . . . . . . .24
2. Baseline Scenario – Energy Markets . . . . . . . . . . . . . . . . . . . . . . . . . . . . . . . 26Liquid Fuel Market . . . . . . . . . . . . . . . . . . . . . . . . . . . . . . . . . . . . . . . . . . . . . . . 26Gas Market . . . . . . . . . . . . . . . . . . . . . . . . . . . . . . . . . . . . . . . . . . . . . . . . . . . . . .41Solid Fuel Market . . . . . . . . . . . . . . . . . . . . . . . . . . . . . . . . . . . . . . . . . . . . . . . . .51Nuclear Energy . . . . . . . . . . . . . . . . . . . . . . . . . . . . . . . . . . . . . . . . . . . . . . . . . . 56Renewable Energy . . . . . . . . . . . . . . . . . . . . . . . . . . . . . . . . . . . . . . . . . . . . . . . 58
3. The Impact of Technological Breakthroughs on the Energy Markets . . 63
The Role of Technologies in the Development of the Energy Sector . . 63«Shale Breakthrough» . . . . . . . . . . . . . . . . . . . . . . . . . . . . . . . . . . . . . . . . . . . 65«Shale Failure» . . . . . . . . . . . . . . . . . . . . . . . . . . . . . . . . . . . . . . . . . . . . . . . . . . 71Gas Use in Transportation . . . . . . . . . . . . . . . . . . . . . . . . . . . . . . . . . . . . . . . . .76Liquid Biofuels . . . . . . . . . . . . . . . . . . . . . . . . . . . . . . . . . . . . . . . . . . . . . . . . . . 78Electric vehicles . . . . . . . . . . . . . . . . . . . . . . . . . . . . . . . . . . . . . . . . . . . . . . . . . 79Gas Hydrates . . . . . . . . . . . . . . . . . . . . . . . . . . . . . . . . . . . . . . . . . . . . . . . . . . . . 84Biogas . . . . . . . . . . . . . . . . . . . . . . . . . . . . . . . . . . . . . . . . . . . . . . . . . . . . . . . . . . 85
4. The Impact of Global Energy Markets on Russia’s Economy and Energy Sector . . . . . . . . . . . . . . . . . . . . . . . . . . . . . . . . . . . . . . . . . . . . . . . 88The Initial Scenario for the Development of the Russian Economy and Energy Sector . . . . . . . . . . . . . . . . . . . . . . . . . . . . . . . . . . . . . . 88Russian resources in the world energy markets: external constraints . . . . . . . . . . . . . . . . . . . . . . . . . . . . . . . . . . . . . . . . . . . . . 89The Forecast Scenario of Russia’s Economy and Energy Sector Development . . . . . . . . . . . . . . . . . . . . . . . . . . . . . . . . . . . . . . . . . . . . . . . . . . . 92
Appendixes . . . . . . . . . . . . . . . . . . . . . . . . . . . . . . . . . . . . . . . . . . . . . . . . . . . . . . . . 96Appendix 1. Methodology . . . . . . . . . . . . . . . . . . . . . . . . . . . . . . . . . . . . . . . . 96Appendix 2. Regional Balances . . . . . . . . . . . . . . . . . . . . . . . . . . . . . . . . . . . 98Appendix 3. Comparison with Other Forecasts . . . . . . . . . . . . . . . . . . . . . 104
Bibliography . . . . . . . . . . . . . . . . . . . . . . . . . . . . . . . . . . . . . . . . . . . . . . . . . . . . . . 105
OUTLINE

GLOBAL AND RUSSIAN ENERGY OUTLOOK UP TO 2040
ERI RAS – ACRF
2
Key Findings
GLOBAL AND RUSSIAN ENERGY OUTLOOK UP TO 2040
ERI RAS – ACRF
3
KEY FINDINGS
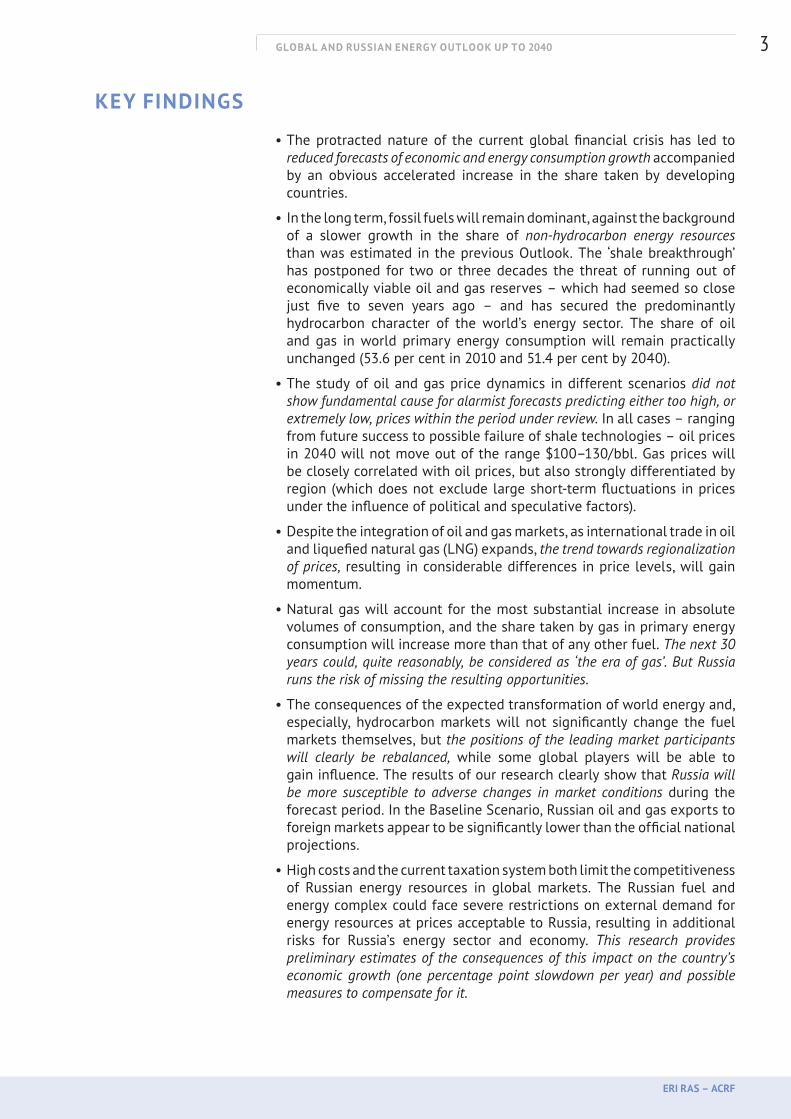
• The protracted nature of the current global financial crisis has led to reduced forecasts of economic and energy consumption growth accompanied by an obvious accelerated increase in the share taken by developing countries.
• In the long term, fossil fuels will remain dominant, against the background of a slower growth in the share of non-hydrocarbon energy resources than was estimated in the previous Outlook. The ‘shale breakthrough’ has postponed for two or three decades the threat of running out of economically viable oil and gas reserves – which had seemed so close just five to seven years ago – and has secured the predominantly hydrocarbon character of the world’s energy sector. The share of oil and gas in world primary energy consumption will remain practically unchanged (53.6 per cent in 2010 and 51.4 per cent by 2040).
• The study of oil and gas price dynamics in different scenarios did not show fundamental cause for alarmist forecasts predicting either too high, or extremely low, prices within the period under review. In all cases – ranging from future success to possible failure of shale technologies – oil prices in 2040 will not move out of the range $100–130/bbl. Gas prices will be closely correlated with oil prices, but also strongly differentiated by region (which does not exclude large short-term fluctuations in prices under the influence of political and speculative factors).
• Despite the integration of oil and gas markets, as international trade in oil and liquefied natural gas (LNG) expands, the trend towards regionalization of prices, resulting in considerable differences in price levels, will gain momentum.
• Natural gas will account for the most substantial increase in absolute volumes of consumption, and the share taken by gas in primary energy consumption will increase more than that of any other fuel. The next 30 years could, quite reasonably, be considered as ‘the era of gas’. But Russia runs the risk of missing the resulting opportunities.
• The consequences of the expected transformation of world energy and, especially, hydrocarbon markets will not significantly change the fuel markets themselves, but the positions of the leading market participants will clearly be rebalanced, while some global players will be able to gain influence. The results of our research clearly show that Russia will be more susceptible to adverse changes in market conditions during the forecast period. In the Baseline Scenario, Russian oil and gas exports to foreign markets appear to be significantly lower than the official national projections.
• High costs and the current taxation system both limit the competitiveness of Russian energy resources in global markets. The Russian fuel and energy complex could face severe restrictions on external demand for energy resources at prices acceptable to Russia, resulting in additional risks for Russia’s energy sector and economy. This research provides preliminary estimates of the consequences of this impact on the country’s economic growth (one percentage point slowdown per year) and possible measures to compensate for it.

GLOBAL AND RUSSIAN ENERGY OUTLOOK UP TO 2040
ERI RAS – ACRF
4
Introduction

GLOBAL AND RUSSIAN ENERGY OUTLOOK UP TO 2040
ERI RAS – ACRF
5
Russia is a leading force in world energy and a major participant in international energy markets. The country’s energy sector, together with exports of its products, is uniquely important; its dynamics directly impact the stability of the national economy. Thus, a satisfactory vision pertaining to the long-term development of this sector is of great importance in predicting and planning the country’s economic development. The study of the world’s energy future is one of the most important external parameters that help to shape the country’s strategy for the development of its economy and energy sector.
The world’s energy situation has undergone significant transformations since the 2008 global financial crisis: prices for hydrocarbons have shown strong volatility; there has been a noticeable slowdown in demand and increased competition in traditional energy markets; most importantly, new technologies have already started to push international energy markets in a direction unfavourable for Russia. Therefore, now more than ever, we need to make a fundamental study of possible turbulence in world energy markets and develop regular world energy outlooks, based on our own research potential.
It was this view that gave impetus to the Energy Research Institute of the Russian Academy of Sciences (ERI RAS) and the Analytical Centre of the RF Government (ACRF) to prepare ‘Global and Russia Energy Outlook up to 2040’. Publication of the 2012 Energy Outlook showed how much demand there was for Russia to produce its own review of the future of world energy. Last year, this information was widely used in the reports of federal government officials and the top management of major Russian companies, and it was also discussed at scientific and other expert events in Russia and abroad.
The new Outlook has an extended time horizon, and a significantly upgraded modelling and methodological approach. It mainly focuses on the study of the fuel market situation (liquid, gas, and solid fuels) not just on forecasting the production and consumption of different energy resources, which is more appropriate given increasing interfuel competition.
The main purpose of Outlook-2013 is the evaluation of actual trends in global hydrocarbon markets, and of the changes resulting from anticipated technological breakthroughs, giving the resulting implications for Russia’s economy and energy sector. In this regard, the following are included:
1) A Baseline Scenario which shows the evolution of world energy and fuel markets based primarily on existing developed energy technologies;
2) Versions of the Baseline Scenario, whose differences relate to the success of required technological breakthroughs in the production and consumption of hydrocarbons and their substitutes;
3) Forecasts for the development of Russia’s energy sector under certain hypothetical transformations of world fuel markets, and the assessment of their impact on the national economy.
The Baseline Scenario for the evolution of fuel markets was developed using the world energy model incorporated in the SCANER modelling and information complex [1], with substantially upgraded models of oil [2, 3] and gas [4] markets. New features of interfuel competition in the
INTRODUCTION
GLOBAL AND RUSSIAN ENERGY OUTLOOK UP TO 2040
ERI RAS – ACRF
6
transportation and power sectors are described with reference to 86 points of liquid fuel consumption (76 countries) and 192 points of gas consumption (147 countries). Production and processing of conventional and unconventional hydrocarbon resources from 778 oil fields and 504 gas fields were modelled. The balance of production and consumption and balancing fuel prices were calculated for all the regional fuel markets; their sensitivity to changes in the most important resource and technological factors was analysed; and the roles of key market players, in particular Russia, were estimated.
For the assessment of potential technological breakthroughs, the model includes variants of changes in volumes of production, consumption, and substitution (for all types of energy resources) relating to the implementation of new technologies for: production of unconventional oil and gas; production of synthetic liquid fuels and biofuels; and the use of efficient electrical power storage in transportation (with estimates for the technical and economic characteristics required for implementation of these new technologies). In accordance with the results of these calculations, we have set out the potential changes in fuel market dynamics.
Projections of Russia’s energy development were made using the modelling system [1] for the baseline and extreme scenarios of the development of world hydrocarbon markets, taking into account their influence on domestic demand, production and export of energy resources, and their consequences for the economy.
The scenarios are exploratory in nature: they show the variety and, most importantly, possible consequences of the development options – the so-called ‘forks in the road’ – which face the energy industry in both Russia and the world.
For several important parameters Outlook-2013 gives new estimates, which are substantially different from our Outlook-2012 and from the results obtained by a number of international organizations. These differences are noted and explained in the text; the most important of them are mentioned below:
• The protracted character of the current global financial crisis has led to reduced forecasts for economic growth and energy consumption, in such a way that last year’s prognosis for the period to 2035 has declined slightly towards 2040, in combination with a simultaneous accelerated economic growth for developing countries.
• Fossil fuels will remain dominant in world energy, with the share of non-carbon energy resources rising more slowly. The production volumes of oil, natural gas, and coal will continue to grow at different rates.
• The ‘shale revolution’ has postponed the threat of exhaustion of economically viable oil and gas resources, which seemed so close just 5–7 years ago. It has also widely diversified these resources by world region, stimulating the regionalization of world oil markets against the background of the integration of gas markets due to the explosive growth of LNG trade. Under these conditions, some global players will have additional possibilities to influence hydrocarbon markets.
• Analysis of the ‘hot issue’ of oil and gas price dynamics has not brought to light any justification for alarmist predictions for the period reviewed;

GLOBAL AND RUSSIAN ENERGY OUTLOOK UP TO 2040
ERI RAS – ACRF
7
there will be no excessively high, or excessively low, deviations in their dynamics. In all scenarios, ranging from the future success to the possible failure of shale technologies, balancing oil prices1 do not exceed US$100–130/bbl (2010 prices) and a good correlation with gas prices, highly differentiated by region. However, up to 2025–30, there could be wider fluctuations of oil price trends.
• Seen objectively, favourable transformations in world energy, especially hydrocarbon, markets bring extra risks for Russia’s economy and energy sector. Preliminary results assessing their impact on economic growth show a slowdown of one percentage point each year, due to decreased energy exports and possible measures for its compensation.
• It has been determined that during the forecast period Russia will be more sensitive to negative market fluctuations – reduced demand, increased supply and, especially, price decline. Therefore, the Baseline Scenario assumes oil and gas export volumes being at significantly lower levels than those determined in national projections. High costs and the current tax system hamper the competitiveness of Russian energy resources in external markets – the first time the Russian energy sector has had to work under such difficult conditions.
Our primary objective is to promote discussion on the future shape of world energy development and options for the adaptation of Russia’s economy and energy sector to the changing environment.
Alexei Makarov, academicianLeonid Grigoryev, professor
Tatiana Mitrova, PhD
1 The balance price of oil is a price at which oil production in conventional and unconventional fields and the commercially viable options of oil substitution will satisfy demand in the particular year of the forecast period (factually reflecting the point of intersection of supply and demand).
GLOBAL AND RUSSIAN ENERGY OUTLOOK UP TO 2040
ERI RAS – ACRF
8
Baseline Scenario – Energy Consumption
GLOBAL AND RUSSIAN ENERGY OUTLOOK UP TO 2040
ERI RAS – ACRF
9
1. BASELINE SCENARIO – ENERGY CONSUMPTIONLong-term trends of the world energy
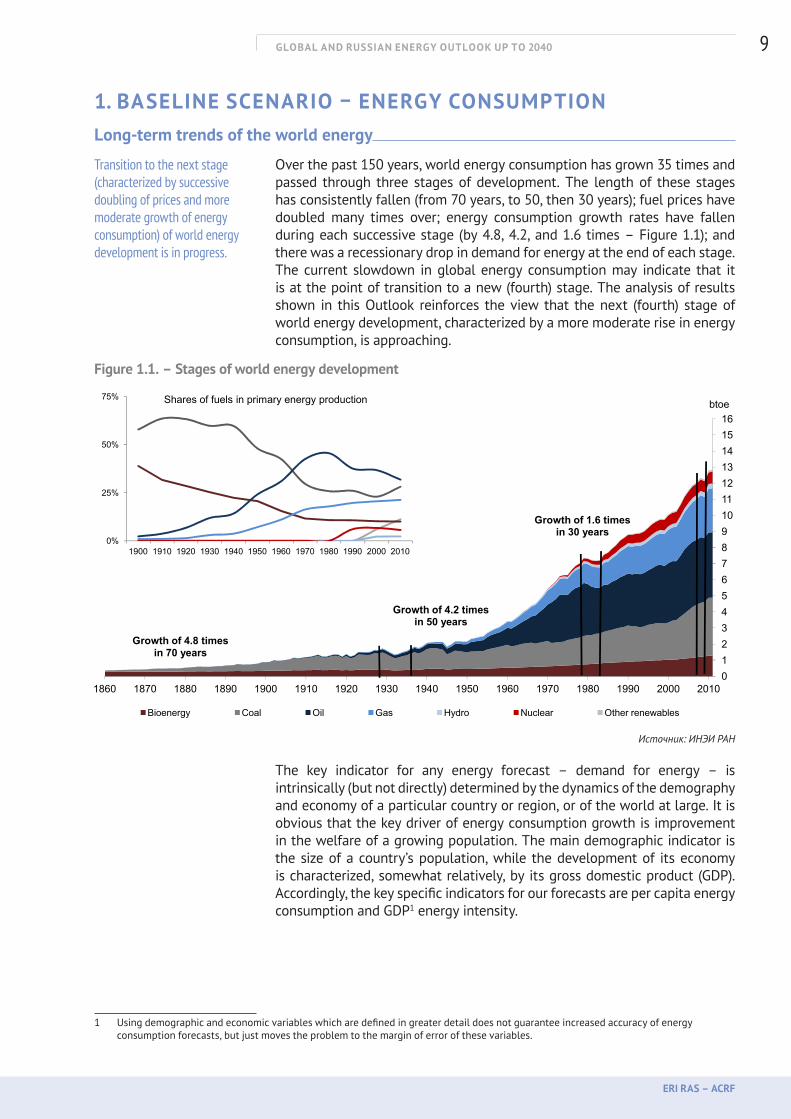
Over the past 150 years, world energy consumption has grown 35 times and passed through three stages of development. The length of these stages has consistently fallen (from 70 years, to 50, then 30 years); fuel prices have doubled many times over; energy consumption growth rates have fallen during each successive stage (by 4.8, 4.2, and 1.6 times – Figure 1.1); and there was a recessionary drop in demand for energy at the end of each stage. The current slowdown in global energy consumption may indicate that it is at the point of transition to a new (fourth) stage. The analysis of results shown in this Outlook reinforces the view that the next (fourth) stage of world energy development, characterized by a more moderate rise in energy consumption, is approaching.
Figure 1.1. – Stages of world energy development
D:\work\cems\прогноз верстка\doc англ\fig.xls Лист Рис 1.1
45678910111213141516
btoe
Growth of 4 2 times
Growth of 1.6 times in 30 years
0%
25%
50%
75%
1900 1910 1920 1930 1940 1950 1960 1970 1980 1990 2000 2010
Shares of fuels in primary energy production
01234
1860 1870 1880 1890 1900 1910 1920 1930 1940 1950 1960 1970 1980 1990 2000 2010
Bioenergy Coal Oil Gas Hydro Nuclear Other renewables
Growth of 4.8 times in 70 years
Growth of 4.2 times in 50 years
Источник: ИНЭИ РАН
The key indicator for any energy forecast – demand for energy – is intrinsically (but not directly) determined by the dynamics of the demography and economy of a particular country or region, or of the world at large. It is obvious that the key driver of energy consumption growth is improvement in the welfare of a growing population. The main demographic indicator is the size of a country’s population, while the development of its economy is characterized, somewhat relatively, by its gross domestic product (GDP). Accordingly, the key specific indicators for our forecasts are per capita energy consumption and GDP1 energy intensity.
1 Using demographic and economic variables which are defined in greater detail does not guarantee increased accuracy of energy consumption forecasts, but just moves the problem to the margin of error of these variables.
Transition to the next stage (characterized by successive doubling of prices and more moderate growth of energy consumption) of world energy development is in progress.

GLOBAL AND RUSSIAN ENERGY OUTLOOK UP TO 2040
ERI RAS – ACRF
10
Our approach combines demographic and economic projections of energy consumption. First, forecasts for each of 67 groups of countries, according to the UN data on population dynamics, are correlated with each other on the basis of: a) per capita energy consumption and b) per capita GDP and GDP energy intensity. The results of forecasts for both methods are ranges within which trends deviate; in this way, the task of optimizing the obtaining of forecast estimates is fulfilled. This task consists of a search for such trends in two ranges, the difference between which is minimal. The sums of the countries’ forecasts are then mutually corrected in accordance with the independent global energy projection.
The Methodology of Forecasting Energy DemandIn forecasting energy consumption, trends in population growth, economy, and the energy sector were considered – for 67 groups of countries and for the world as a whole – for the last 30 years. The UN ‘medium scenario’ served as the basis for population2 for Outlook-2013 (see Figure 1.2.). Figure1.2. – Scheme of convergence of demographic and economic projections of energy consumption
4 8
5,3
5,8
6,3
6,8
7,3
7,8
8,3
8,8
bln people
Range of possible valuesPopulation
7000
9000
11000
13000
15000
17000
19000
21000
23000
25000$2010/cap
Range of possible valuesGDP per capita
4,3
4,8
5,3
1980 1990 2000 2010 2020 2030 2040
1,8
1,9
2,0
2,1
2,2toe/cap
Range of possible
5000
7000
9000
1980 1990 2000 2010 2020 2030 2040
GDP per capita
85
105
125
145
165
185
S trillion
15000
17000
19000mtoe
1,5
1,6
1,7
1980 1990 2000 2010 2020 2030 2040
Range of possible valuesEnergy consumption per capita
25
45
65
85
1980 1990 2000 2010 2020 2030 2040
Range of possible valuesGDP
0,20
0,24
0,28toe/ thous. $
7000
9000
11000
13000
1980 1990 2000 2010 2020 2030 2040
Range of possible valuesEnergy consumption
0,08
0,12
0,16
1980 1990 2000 2010 2020 2030 2040
Range of possible valuesEnergy intensity
Reported information Forecasted ranges
Source: ERI RAS
Based on this, and on extrapolated trends of per capita averages for each group of countries, statistical trends and confidence intervals of future GDP indicators, as well as the consumption of primary energy, electricity, and oil products, were determined. Duplicate demand forecasts were made analogously, based on each country’s trends in GDP volumes and energy intensity.
2 World Population Prospects, the 2010 Revision, UN Population Division.
Our approach combines the demographic and economic projections of energy consumption.
GLOBAL AND RUSSIAN ENERGY OUTLOOK UP TO 2040
ERI RAS – ACRF
11
The indicators assumed for Outlook-2013 were obtained by the alignment (using the minimum criterion of relative deviations from the trends of all forecasting indicators) of energy consumption levels within the confidence intervals. We did this first for each group of countries according to per capita consumption and GDP energy intensity; second for total demand for all the groups of countries and the independent demographic and economic forecasts of world energy consumption. Deviations from historic trends of basic social characteristics of energy use – per capita energy consumption and GDP energy intensity – obtained in Outlook-2013, have given a satisfactory explanation for world trends in general, and for key hydrocarbon markets in particular. Analysis (for the world as a whole) of the predictive properties of the indicators mentioned, based on information collected since 19553 (the period being twice as long as that of our forecast) has highlighted the following problems:World population dynamics are well-described by a linear dependence, and the UN medium case scenario (which we accepted as the baseline for the calculation of energy consumption) starts diverging from it only after the 2030 timestamp. The dynamics of per capita energy consumption are best described by exponential (not so well by linear) dependence, but divergence between the two only reaches 15 per cent by 2040, which made it impossible to rely only on the demographic projection of energy consumption.Conversely, retrospective GDP is well-characterized by exponential dependence, and only satisfactorily so by a linear one, but these trends give more than a twofold divergence of GDP indicators by 2040. The economic forecast of energy consumption cannot be supported by even an excellent predictability of GDP energy intensity – it has been consistently decreasing by 1.2 per cent per year for more than half a century already.
Demography
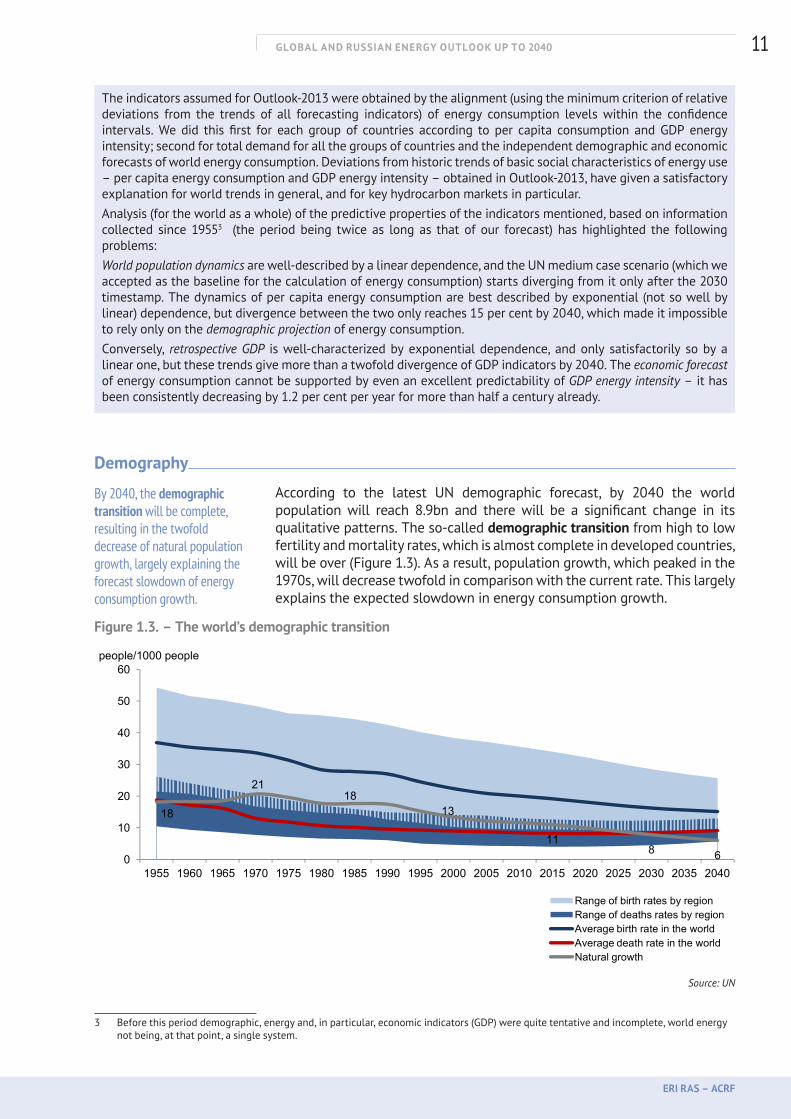
According to the latest UN demographic forecast, by 2040 the world population will reach 8.9bn and there will be a significant change in its qualitative patterns. The so-called demographic transition from high to low fertility and mortality rates, which is almost complete in developed countries, will be over (Figure 1.3). As a result, population growth, which peaked in the 1970s, will decrease twofold in comparison with the current rate. This largely explains the expected slowdown in energy consumption growth.
Figure 1.3. – The world’s demographic transition
18
2118
1310
20
30
40
50
60people/1000 people
118 60
10
1955 1960 1965 1970 1975 1980 1985 1990 1995 2000 2005 2010 2015 2020 2025 2030 2035 2040
Range of birth rates by regionRange of deaths rates by regionAverage birth rate in the worldAverage death rate in the worldNatural growth
Source: UN
3 Before this period demographic, energy and, in particular, economic indicators (GDP) were quite tentative and incomplete, world energy not being, at that point, a single system.
By 2040, the demographic transition will be complete, resulting in the twofold decrease of natural population growth, largely explaining the forecast slowdown of energy consumption growth.
GLOBAL AND RUSSIAN ENERGY OUTLOOK UP TO 2040
ERI RAS – ACRF
12
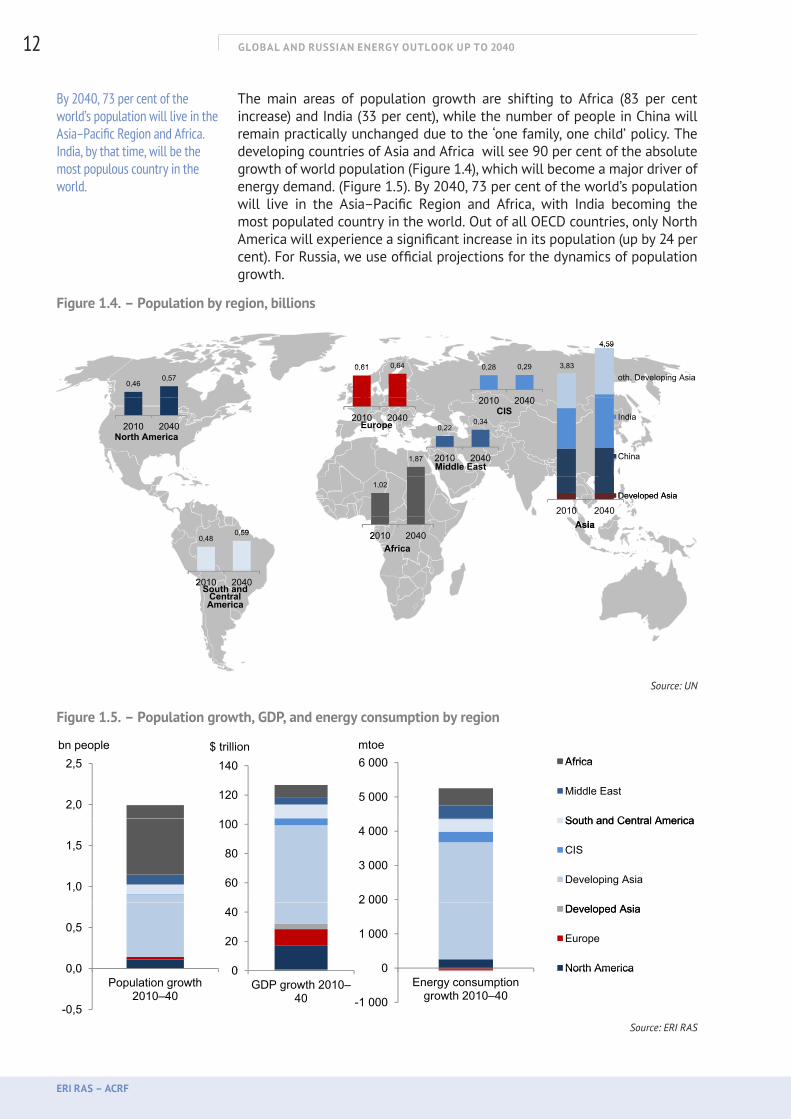
The main areas of population growth are shifting to Africa (83 per cent increase) and India (33 per cent), while the number of people in China will remain practically unchanged due to the ‘one family, one child’ policy. The developing countries of Asia and Africa will see 90 per cent of the absolute growth of world population (Figure 1.4), which will become a major driver of energy demand. (Figure 1.5). By 2040, 73 per cent of the world’s population will live in the Asia–Pacific Region and Africa, with India becoming the most populated country in the world. Out of all OECD countries, only North America will experience a significant increase in its population (up by 24 per cent). For Russia, we use official projections for the dynamics of population growth.
Figure 1.4. – Population by region, billions
0,61 0,64 0,28 0,29 3,83
4,59
0,460,57
2010 2040
0,61 0,64
2010 2040
0,28 0,29
2010 2040
0,34
oth. Developing Asia
IndiaEurope
CIS
3,83
4,59
2010 20402010 2040
1,87
2010 2040
0,220,34
2010 2040
India
China
North AmericaEurope
Middl E t
CIS
1,02
1,87 2010 2040 China
Developed Asia
North America
Middle East
0,480,59
1,02
2010 2040
2010 2040Developed Asia
Asia0,48
0,59
2010 2040
2010 2040Africa
Asia
South and Central
2010 2040South and
Central America
Source: UN
Figure 1.5. – Population growth, GDP, and energy consumption by region
Africa 0,85 8,8 508,7265915164,792232
2,5bn people
140$ trillion
6 000mtoe
Africa
1,5
2,0
2,5bn people
80
100
120
140$ trillion
4 000
5 000
6 000mtoe
Africa
Middle East
South and Central America
CIS
0,5
1,0
1,5
20
40
60
80
100
1 000
2 000
3 000
4 000South and Central America
CIS
Developing Asia
Developed Asia
Europe
0,0
0,5
Population growth 2010–40
0
20
40
GDP growth 2010–40 -1 000
0
1 000
2 000
Energy consumption growth 2010–40
Developed Asia
Europe
North America
-0,5
0,0Population growth
2010–40
0GDP growth 2010–
40 -1 000
0Energy consumption
growth 2010–40
North America
Source: ERI RAS
By 2040, 73 per cent of the world’s population will live in the Asia–Pacific Region and Africa. India, by that time, will be the most populous country in the world.
GLOBAL AND RUSSIAN ENERGY OUTLOOK UP TO 2040
ERI RAS – ACRF
13
Impact of Demographic Factors on GDP and Energy Consumption
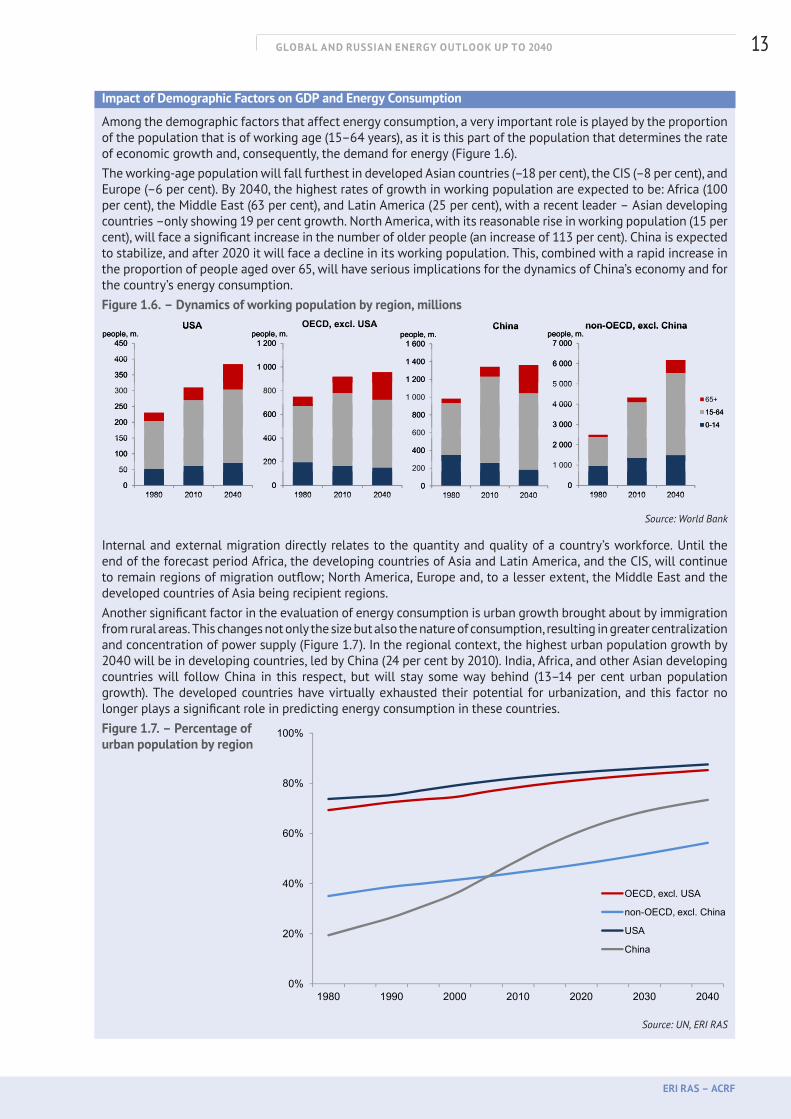
Among the demographic factors that affect energy consumption, a very important role is played by the proportion of the population that is of working age (15–64 years), as it is this part of the population that determines the rate of economic growth and, consequently, the demand for energy (Figure 1.6).The working-age population will fall furthest in developed Asian countries (–18 per cent), the CIS (–8 per cent), and Europe (–6 per cent). By 2040, the highest rates of growth in working population are expected to be: Africa (100 per cent), the Middle East (63 per cent), and Latin America (25 per cent), with a recent leader – Asian developing countries –only showing 19 per cent growth. North America, with its reasonable rise in working population (15 per cent), will face a significant increase in the number of older people (an increase of 113 per cent). China is expected to stabilize, and after 2020 it will face a decline in its working population. This, combined with a rapid increase in the proportion of people aged over 65, will have serious implications for the dynamics of China’s economy and for the country’s energy consumption.Figure 1.6. – Dynamics of working population by region, millions
450people, m.
USA
1 200people, m.
OECD, excl. USA
1 600people, m.
China
7 000people, m.
non-OECD, excl. China
350
400
450people, m.
USA
1 000
1 200people, m.
OECD, excl. USA
1 200
1 400
1 600people, m.
China
5 000
6 000
7 000people, m.
non-OECD, excl. China
200
250
300
350
400
600
800
1 000
800
1 000
1 200
1 400
3 000
4 000
5 000
6 000
65+
15-64
0-14
100
150
200
250
200
400
600
400
600
800
2 000
3 000
4 00015-64
0-14
0
50
100
150
1980 2010 20400
200
400
1980 2010 20400
200
400
1980 2010 20400
1 000
2 000
1980 2010 20400
50
1980 2010 20400
1980 2010 20400
1980 2010 20400
1980 2010 2040 Source: World Bank
Internal and external migration directly relates to the quantity and quality of a country’s workforce. Until the end of the forecast period Africa, the developing countries of Asia and Latin America, and the CIS, will continue to remain regions of migration outflow; North America, Europe and, to a lesser extent, the Middle East and the developed countries of Asia being recipient regions.Another significant factor in the evaluation of energy consumption is urban growth brought about by immigration from rural areas. This changes not only the size but also the nature of consumption, resulting in greater centralization and concentration of power supply (Figure 1.7). In the regional context, the highest urban population growth by 2040 will be in developing countries, led by China (24 per cent by 2010). India, Africa, and other Asian developing countries will follow China in this respect, but will stay some way behind (13–14 per cent urban population growth). The developed countries have virtually exhausted their potential for urbanization, and this factor no longer plays a significant role in predicting energy consumption in these countries.Figure 1.7. – Percentage of urban population by region
Source: UN, ERI RAS
40%
60%
80%
100%
0%
20%
40%
1980 1990 2000 2010 2020 2030 2040
OECD, excl. USA
non-OECD, excl. China
USA
China
GLOBAL AND RUSSIAN ENERGY OUTLOOK UP TO 2040
ERI RAS – ACRF
14
Economic Growth
The forecast of economic development was made in terms of GDP dynamics, based on population forecasts for the reviewed groups of countries and on expected changes, largely associated with the age and types of human settlement, in per capita GDP (Figure 1.2).
In the next 30 years, there is little reason to hope for sustained GDP growth on a world scale, to say nothing of any acceleration, compared to the previous period. Growth is hindered by the declining intensity of the main factors of production, the slowdown of population growth, limited opportunities for territorial expansion, aggravated water supply problems, and rising prices for major natural resources (in particular, the doubling of hydrocarbon prices in comparison to the average over the last 30 years). It is doubtful that even successful technological progress could fully compensate for these negative processes. In this regard, the qualitative and multi-directional economic development of certain countries is of unquestionable importance.
Forecasts of economic growth in developed countries are mainly based on the continuation of trends and parameters of post-industrial development, together with a further shift to services (development of health services, against a background of increasing life expectancy, etc.). Relatively slow growth rates imply the concentration of capital on increasing efficiency and productivity, rather than on expanding capacity. In the case of adopting (political) objectives aimed at climate protection and conservation of resources, development might take the form of combining the maintenance of living standards with more severe resource constraints.
In the long term, the trend towards a levelling-out of global development, on a technological base that will increasingly be shared, will continue, but the degree of convergence will be very different. In the developing world, stratification will remain enormous. Recent years have seen the emergence of a group of fast-growing countries; a group of countries for which take-off is proving problematic; and about 30 countries with a critically low growth rate in relation to per capita GDP.
In the developing world, China stands out with its unique model of population growth reduction. Given the country’s expected doubling of per capita GDP, its social structure is expected to change on the basis of mass ‘welfare’ promised to its people. The degree of success of the proposed model of economic development will be of critical importance for the growth rates of both China and the rest of the world.
Other developing countries have to be brought together for the sake of analytical simplicity, but they are split into several groups. The common indicators of these countries are: GDP growth is above that in developed countries, but lower than that in China (Figure 1.8). These countries represent the majority of the world’s population and their demographic growth continues (above 1 per cent per year), as do their problems of acute poverty and social inequality, as well as difficulties related to the transition to new (high cost) and effective technologies.
Economic growth in developed countries is based on the continuation of trends and parameters of post-industrial development, with a further shift to services.
The future of the Chinese economy – its growth rate, social and political stability, and the levelling-out of its social structure beyond 2020 – is the biggest uncertainty of long-term economic forecasting.
GLOBAL AND RUSSIAN ENERGY OUTLOOK UP TO 2040
ERI RAS – ACRF
15
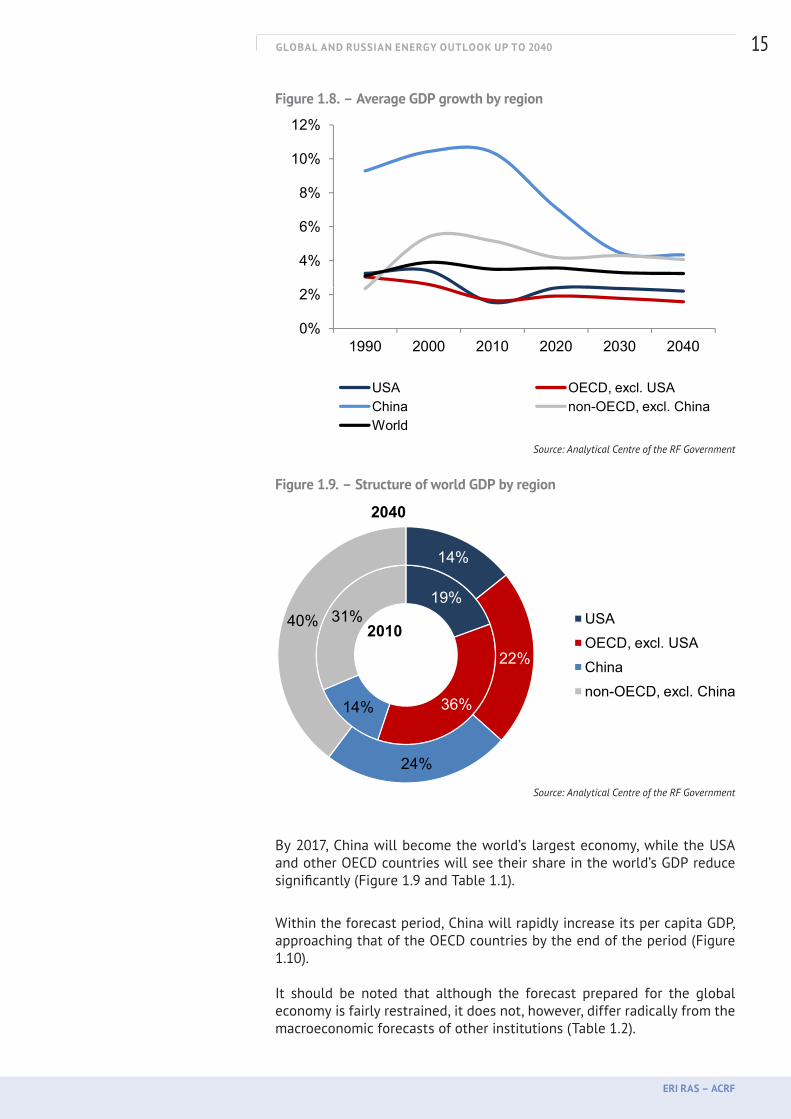
Figure 1.8. – Average GDP growth by region
4%
6%
8%
10%
12%
0%
2%
1990 2000 2010 2020 2030 2040
USA OECD, excl. USAChina non-OECD, excl. ChinaWorld
Source: Analytical Centre of the RF Government
Figure 1.9. – Structure of world GDP by region
19%31%
14%
22%
40% USAOECD, excl. USAChina
2010
2040
36%14%
24%
Chinanon-OECD, excl. China
Source: Analytical Centre of the RF Government
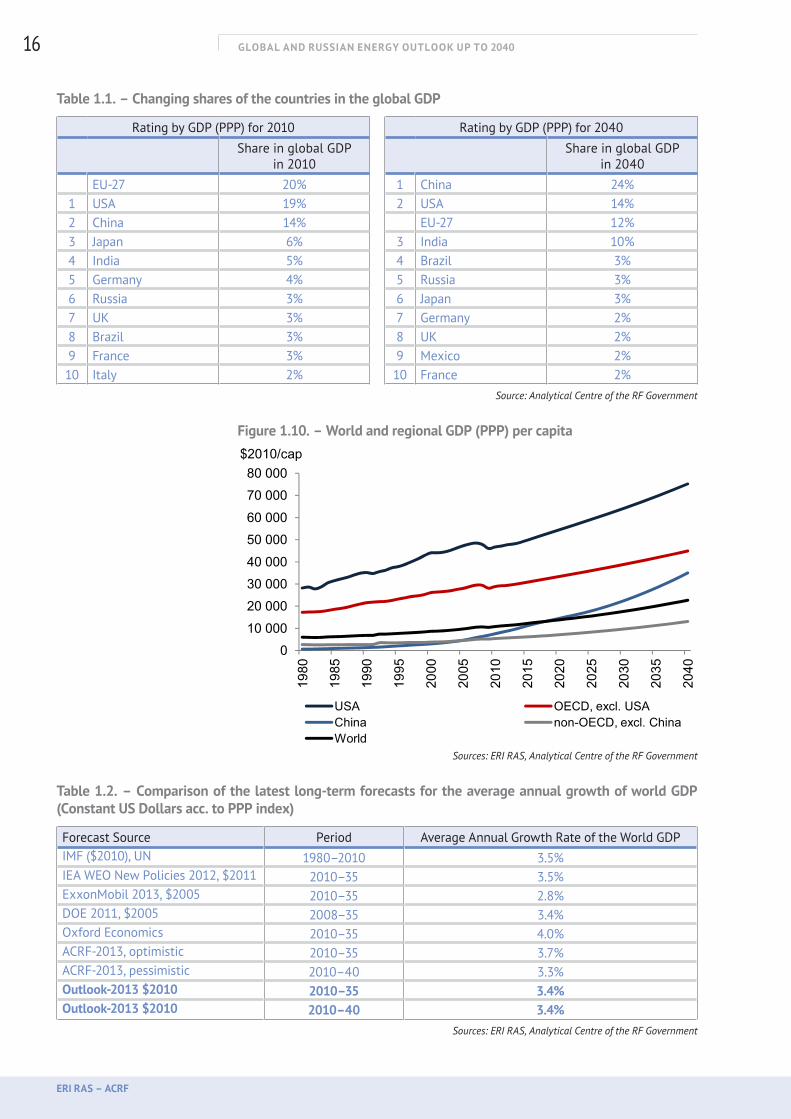
By 2017, China will become the world’s largest economy, while the USA and other OECD countries will see their share in the world’s GDP reduce significantly (Figure 1.9 and Table 1.1).
Within the forecast period, China will rapidly increase its per capita GDP, approaching that of the OECD countries by the end of the period (Figure 1.10).
It should be noted that although the forecast prepared for the global economy is fairly restrained, it does not, however, differ radically from the macroeconomic forecasts of other institutions (Table 1.2).
GLOBAL AND RUSSIAN ENERGY OUTLOOK UP TO 2040
ERI RAS – ACRF
16
Table 1.1. – Changing shares of the countries in the global GDP
Rating by GDP (PPP) for 2010 Rating by GDP (PPP) for 2040
Share in global GDP in 2010
Share in global GDP in 2040
EU-27 20% 1 China 24%1 USA 19% 2 USA 14%2 China 14% EU-27 12%3 Japan 6% 3 India 10%4 India 5% 4 Brazil 3%5 Germany 4% 5 Russia 3%6 Russia 3% 6 Japan 3%7 UK 3% 7 Germany 2%8 Brazil 3% 8 UK 2%9 France 3% 9 Mexico 2%10 Italy 2% 10 France 2%
Source: Analytical Centre of the RF Government
Figure 1.10. – World and regional GDP (PPP) per capita
20 00030 00040 00050 00060 00070 00080 000
$2010/cap
010 000
1980
1985
1990
1995
2000
2005
2010
2015
2020
2025
2030
2035
2040
USA OECD, excl. USAChina non-OECD, excl. ChinaWorld
Sources: ERI RAS, Analytical Centre of the RF Government
Table 1.2. – Comparison of the latest long-term forecasts for the average annual growth of world GDP (Constant US Dollars acc. to PPP index)
Forecast Source Period Average Annual Growth Rate of the World GDPIMF ($2010), UN 1980–2010 3.5%IEA WEO New Policies 2012, $2011 2010–35 3.5%ExxonMobil 2013, $2005 2010–35 2.8%DOE 2011, $2005 2008–35 3.4%Oxford Economics 2010–35 4.0%ACRF-2013, optimistic 2010–35 3.7%ACRF-2013, pessimistic 2010–40 3.3%Outlook-2013 $2010 2010–35 3.4%Outlook-2013 $2010 2010–40 3.4%
Sources: ERI RAS, Analytical Centre of the RF Government
GLOBAL AND RUSSIAN ENERGY OUTLOOK UP TO 2040
ERI RAS – ACRF
17
Assumptions for the Baseline Scenario
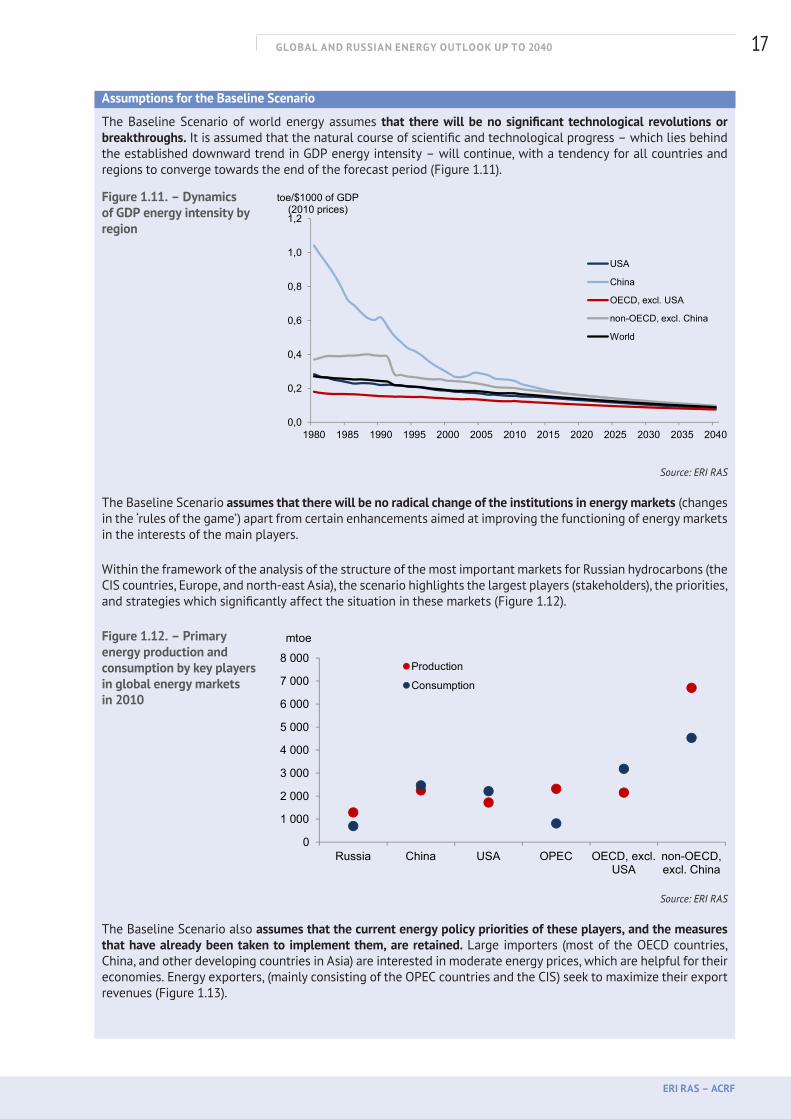
The Baseline Scenario of world energy assumes that there will be no significant technological revolutions or breakthroughs. It is assumed that the natural course of scientific and technological progress – which lies behind the established downward trend in GDP energy intensity – will continue, with a tendency for all countries and regions to converge towards the end of the forecast period (Figure 1.11).
Figure 1.11. – Dynamics of GDP energy intensity by region
Source: ERI RAS
The Baseline Scenario assumes that there will be no radical change of the institutions in energy markets (changes in the ‘rules of the game’) apart from certain enhancements aimed at improving the functioning of energy markets in the interests of the main players.
Within the framework of the analysis of the structure of the most important markets for Russian hydrocarbons (the CIS countries, Europe, and north-east Asia), the scenario highlights the largest players (stakeholders), the priorities, and strategies which significantly affect the situation in these markets (Figure 1.12).
Figure 1.12. – Primary energy production and consumption by key players in global energy markets in 2010
Source: ERI RAS
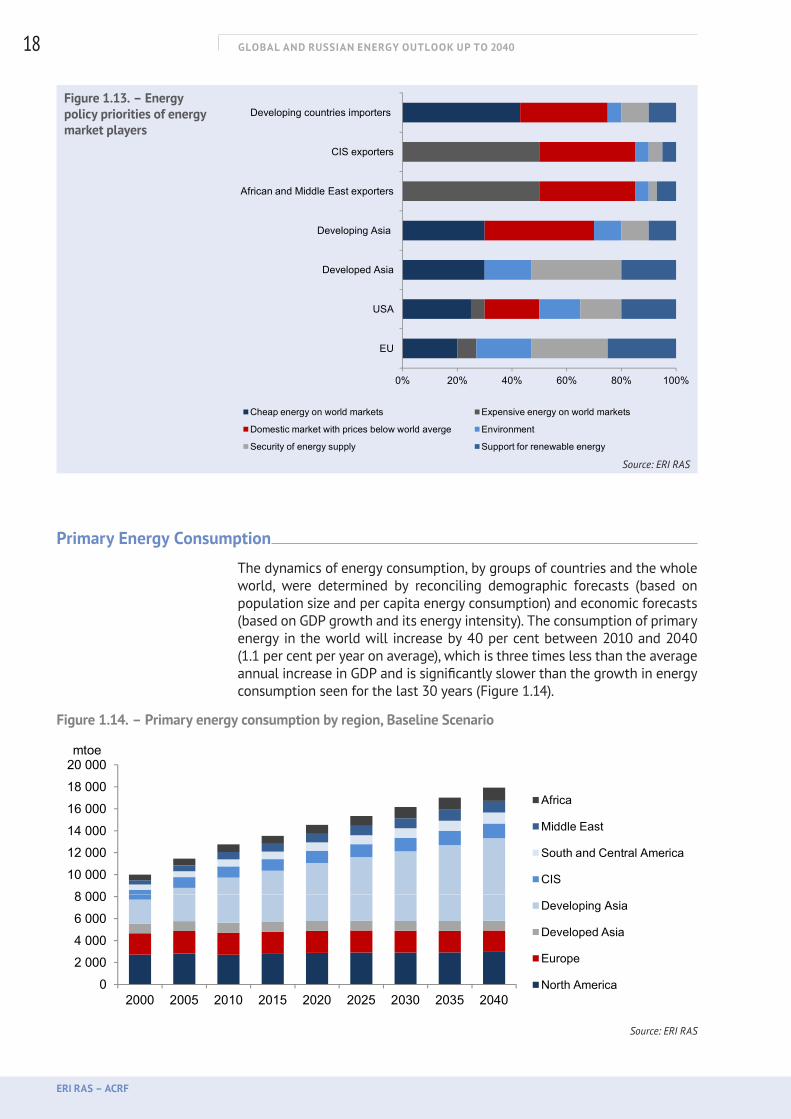
The Baseline Scenario also assumes that the current energy policy priorities of these players, and the measures that have already been taken to implement them, are retained. Large importers (most of the OECD countries, China, and other developing countries in Asia) are interested in moderate energy prices, which are helpful for their economies. Energy exporters, (mainly consisting of the OPEC countries and the CIS) seek to maximize their export revenues (Figure 1.13).
0,6
0,8
1,0
1,2
toe/$1000 of GDP (2010 prices)
USA
China
OECD, excl. USA
non-OECD, excl. China
World
0,0
0,2
0,4
1980 1985 1990 1995 2000 2005 2010 2015 2020 2025 2030 2035 2040
World
3 000
4 000
5 000
6 000
7 000
8 000
mtoe
Production
Consumption
0
1 000
2 000
Russia China USA OPEC OECD, excl. USA
non-OECD, excl. China
GLOBAL AND RUSSIAN ENERGY OUTLOOK UP TO 2040
ERI RAS – ACRF
18
Figure 1.13. – Energy policy priorities of energy market players
Source: ERI RAS
Primary Energy Consumption
The dynamics of energy consumption, by groups of countries and the whole world, were determined by reconciling demographic forecasts (based on population size and per capita energy consumption) and economic forecasts (based on GDP growth and its energy intensity). The consumption of primary energy in the world will increase by 40 per cent between 2010 and 2040 (1.1 per cent per year on average), which is three times less than the average annual increase in GDP and is significantly slower than the growth in energy consumption seen for the last 30 years (Figure 1.14).
Figure 1.14. – Primary energy consumption by region, Baseline Scenario
8 00010 00012 00014 00016 00018 00020 000mtoe
Africa
Middle East
South and Central America
CIS
02 0004 0006 0008 000
2000 2005 2010 2015 2020 2025 2030 2035 2040
Developing Asia
Developed Asia
Europe
North America
Source: ERI RAS
Developed Asia
Developing Asia
African and Middle East exporters
CIS exporters
Developing countries importers
0% 20% 40% 60% 80% 100%
EU
USA
Cheap energy on world markets Expensive energy on world markets
Domestic market with prices below world averge Environment
Security of energy supply Support for renewable energy

GLOBAL AND RUSSIAN ENERGY OUTLOOK UP TO 2040
ERI RAS – ACRF
19
While the USA and other developed countries will reduce their per capita energy consumption, China’s figure, on the other hand, will rapidly increase (Figure 1.15).
Figure 1.15. – Per capita energy consumption by country groups and the world
0
2
4
6
8
10
0 5 0 5 0 5 0 5 0 5 0 5 0
toe/cap
1980
1985
1990
1995
2000
2005
2010
2015
2020
2025
2030
2035
2040
USA OECD, excl. USAChina non-OECD, excl. ChinaWorld
Source: ERI RAS
Centres of energy consumption notably change their location (Figure 1.14): population growth in developing countries is followed by an increasing shift in the centre of energy consumption towards these countries, while developed countries will only increase their energy consumption by 3 per cent by 2040. In the USA and other OECD countries, the increase in energy demand will practically come to a halt after 2020.
In China, absolute growth will continue: while total incremental energy consumption growth for 1980–2010 and 2010–40 is almost equal (1873 and 1847 mtoe, respectively), average annual growth rates will drop from 4.8 per cent to 1.9 per cent. In the other developing countries, primary energy consumption will increase by one and a half times: at decelerating growth rates, absolute growth will increase from 2283 mtoe (1980–2010) to 3120 mtoe by 2040, which represents 60 per cent of the global consumption growth of primary energy. Meeting regional primary energy demand will require increased consumption of all types of fuel (Figure 1.16).
Figure 1.16. – The growth of primary energy consumption by region and type of fuel, Baseline Scenario
0
1 000
2 000
3 000
4 000
5 000
6 000
7 000
8 000
9 000
1980 2010 2040 1980 2010 2040 1980 2010 2040 1980 2010 2040
mtoe USA
Bioenergy
Other renewables
Hydro
Nuclear
Coal
Gas
Oil
OECD, excl. USA China non-OECD, excl. China
Source: ERI RAS
GLOBAL AND RUSSIAN ENERGY OUTLOOK UP TO 2040
ERI RAS – ACRF
20
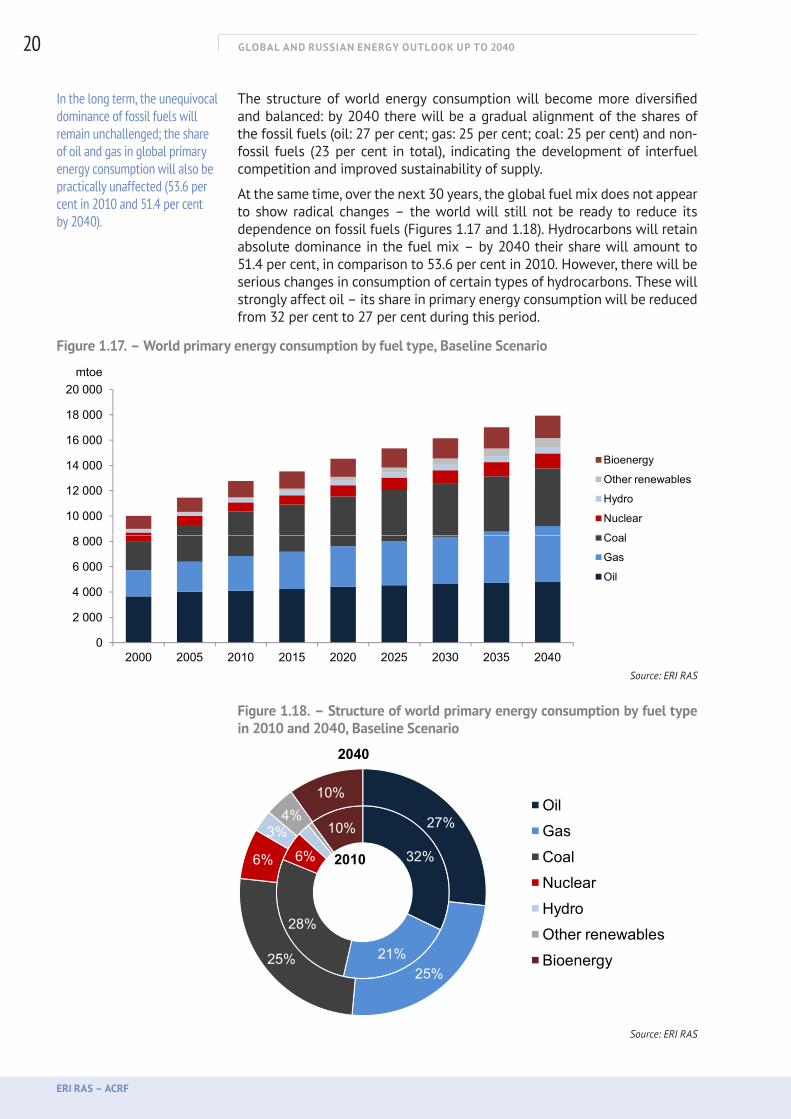
The structure of world energy consumption will become more diversified and balanced: by 2040 there will be a gradual alignment of the shares of the fossil fuels (oil: 27 per cent; gas: 25 per cent; coal: 25 per cent) and non-fossil fuels (23 per cent in total), indicating the development of interfuel competition and improved sustainability of supply.
At the same time, over the next 30 years, the global fuel mix does not appear to show radical changes – the world will still not be ready to reduce its dependence on fossil fuels (Figures 1.17 and 1.18). Hydrocarbons will retain absolute dominance in the fuel mix – by 2040 their share will amount to 51.4 per cent, in comparison to 53.6 per cent in 2010. However, there will be serious changes in consumption of certain types of hydrocarbons. These will strongly affect oil – its share in primary energy consumption will be reduced from 32 per cent to 27 per cent during this period.
Figure 1.17. – World primary energy consumption by fuel type, Baseline Scenario
10 000
12 000
14 000
16 000
18 000
20 000mtoe
Bioenergy
Other renewables
Hydro
Nuclear
Coal
0
2 000
4 000
6 000
8 000
2000 2005 2010 2015 2020 2025 2030 2035 2040
Coal
Gas
Oil
Source: ERI RAS
Figure 1.18. – Structure of world primary energy consumption by fuel type in 2010 and 2040, Baseline Scenario
32%6%
10% 27%
6%
3%4%
10%
OilGasCoalNuclear
2010
2040
21%
28%
25%25%
HydroOther renewablesBioenergy
32%6%
10% 27%
6%
3%4%
10%
OilGasCoalNuclear
2010
2040
21%
28%
25%25%
HydroOther renewablesBioenergy
Source: ERI RAS
In the long term, the unequivocal dominance of fossil fuels will remain unchallenged; the share of oil and gas in global primary energy consumption will also be practically unaffected (53.6 per cent in 2010 and 51.4 per cent by 2040).
GLOBAL AND RUSSIAN ENERGY OUTLOOK UP TO 2040
ERI RAS – ACRF
21
The share of primary energy consumption taken by coal – which showed the highest consumption growth rates in the first decade of the 21st century – will decline from 28 per cent to 25 per cent. This change is mainly due to environmental concerns that would limit the use of coal, not only in developed countries but also in developing ones.
As far as the development of nuclear energy is concerned, we make a moderately optimistic forecast: its share (6 per cent) will not change and there will be a marked increase in absolute volumes.
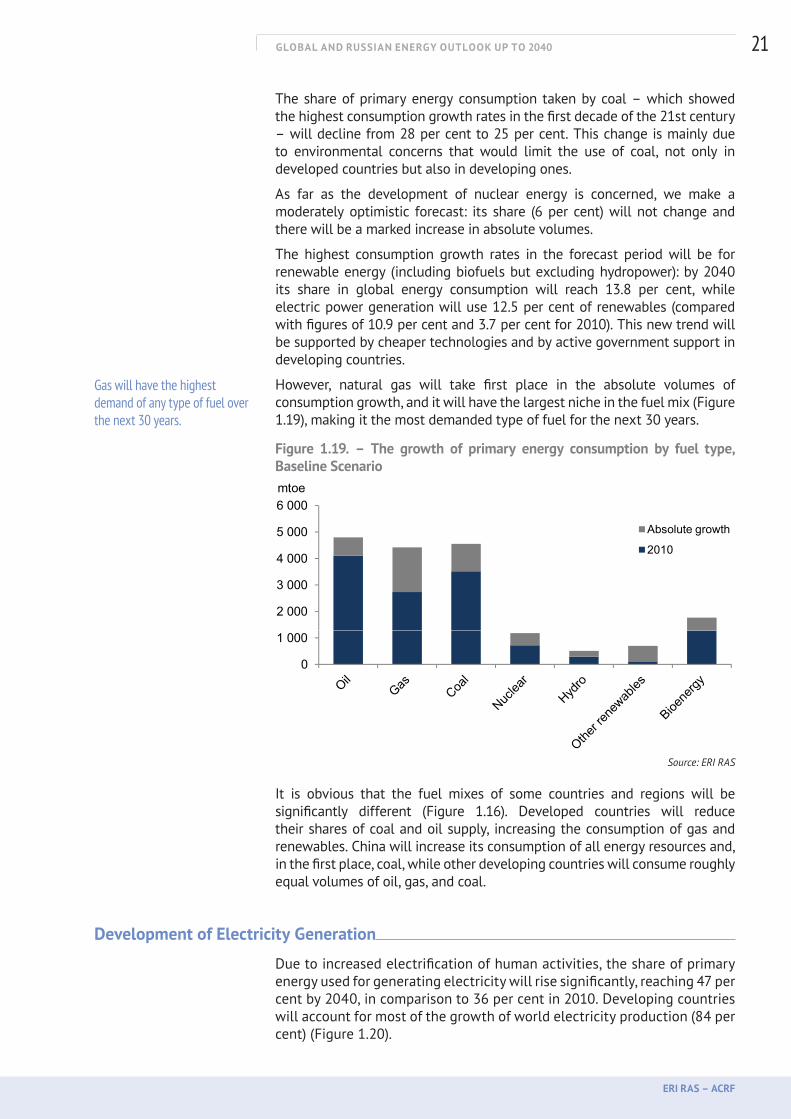
The highest consumption growth rates in the forecast period will be for renewable energy (including biofuels but excluding hydropower): by 2040 its share in global energy consumption will reach 13.8 per cent, while electric power generation will use 12.5 per cent of renewables (compared with figures of 10.9 per cent and 3.7 per cent for 2010). This new trend will be supported by cheaper technologies and by active government support in developing countries.
However, natural gas will take first place in the absolute volumes of consumption growth, and it will have the largest niche in the fuel mix (Figure 1.19), making it the most demanded type of fuel for the next 30 years.
Figure 1.19. – The growth of primary energy consumption by fuel type, Baseline Scenario
2 000
3 000
4 000
5 000
6 000mtoe
Absolute growth
2010
0
1 000
Source: ERI RAS
It is obvious that the fuel mixes of some countries and regions will be significantly different (Figure 1.16). Developed countries will reduce their shares of coal and oil supply, increasing the consumption of gas and renewables. China will increase its consumption of all energy resources and, in the first place, coal, while other developing countries will consume roughly equal volumes of oil, gas, and coal.
Development of Electricity Generation
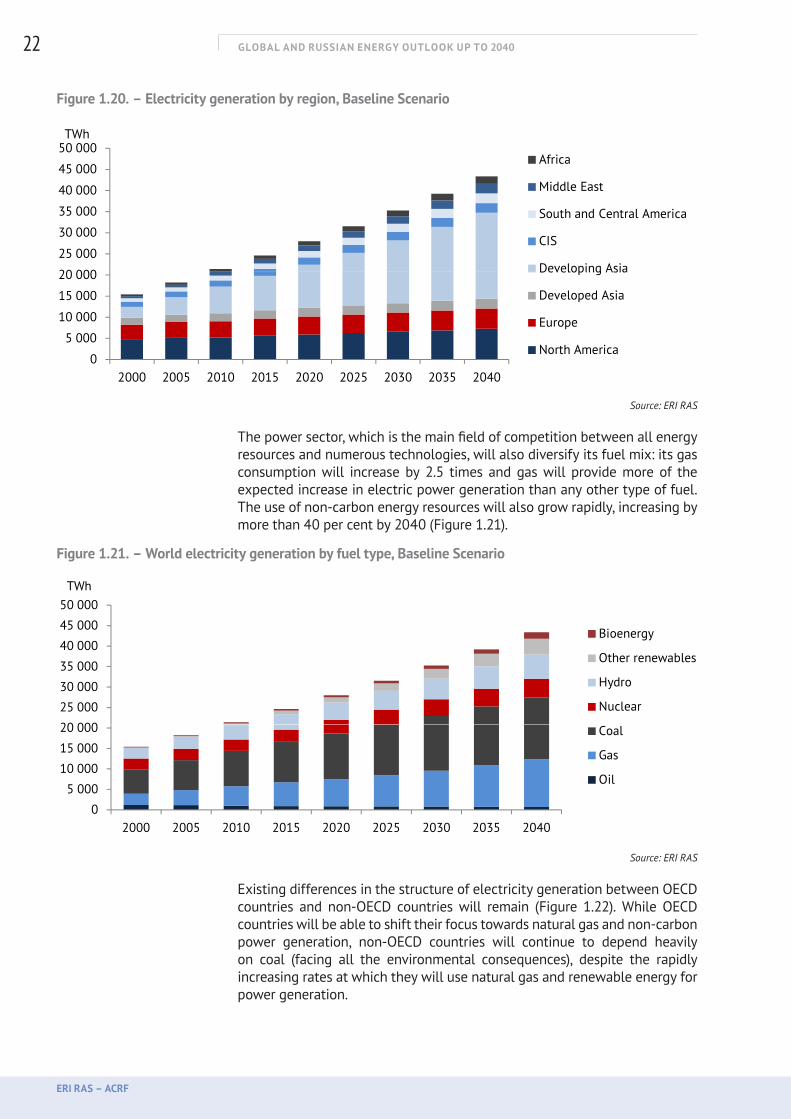
Due to increased electrification of human activities, the share of primary energy used for generating electricity will rise significantly, reaching 47 per cent by 2040, in comparison to 36 per cent in 2010. Developing countries will account for most of the growth of world electricity production (84 per cent) (Figure 1.20).
Gas will have the highest demand of any type of fuel over the next 30 years.
GLOBAL AND RUSSIAN ENERGY OUTLOOK UP TO 2040
ERI RAS – ACRF
22
Figure 1.20. – Electricity generation by region, Baseline Scenario
20 000
25 000
30 000
35 000
40 000
45 000
50 000TWh
Africa
Middle East
South and Central America
CIS
Developing Asia
0
5 000
10 000
15 000
20 000
2000 2005 2010 2015 2020 2025 2030 2035 2040
Developing Asia
Developed Asia
Europe
North America
Source: ERI RAS
The power sector, which is the main field of competition between all energy resources and numerous technologies, will also diversify its fuel mix: its gas consumption will increase by 2.5 times and gas will provide more of the expected increase in electric power generation than any other type of fuel. The use of non-carbon energy resources will also grow rapidly, increasing by more than 40 per cent by 2040 (Figure 1.21).
Figure 1.21. – World electricity generation by fuel type, Baseline Scenario
20 000
25 000
30 000
35 000
40 000
45 000
50 000TWh
Bioenergy
Other renewables
Hydro
Nuclear
0
5 000
10 000
15 000
20 000
2000 2005 2010 2015 2020 2025 2030 2035 2040
Coal
Gas
Oil
Source: ERI RAS
Existing differences in the structure of electricity generation between OECD countries and non-OECD countries will remain (Figure 1.22). While OECD countries will be able to shift their focus towards natural gas and non-carbon power generation, non-OECD countries will continue to depend heavily on coal (facing all the environmental consequences), despite the rapidly increasing rates at which they will use natural gas and renewable energy for power generation.

GLOBAL AND RUSSIAN ENERGY OUTLOOK UP TO 2040
ERI RAS – ACRF
23
Figure 1.22. – Electricity generation in OECD and non-OECD countries by fuel type, Baseline Scenario
8 000
10 000
12 000
14 000
16 000TWh OECD
Bioenergy
Other renewables
Hydro
Nuclear
0
2 000
4 000
6 000
2000 2005 2010 2015 2020 2025 2030 2035 2040
Nuclear
Coal
Gas
Oil
15 000
20 000
25 000
30 000
35 000TWh non-OECD
Bioenergy
Other renewables
Hydro
Nuclear
0
5 000
10 000
15 000
2000 2005 2010 2015 2020 2025 2030 2035 2040
Coal
Gas
Oil
Source: ERI RAS
International Trade
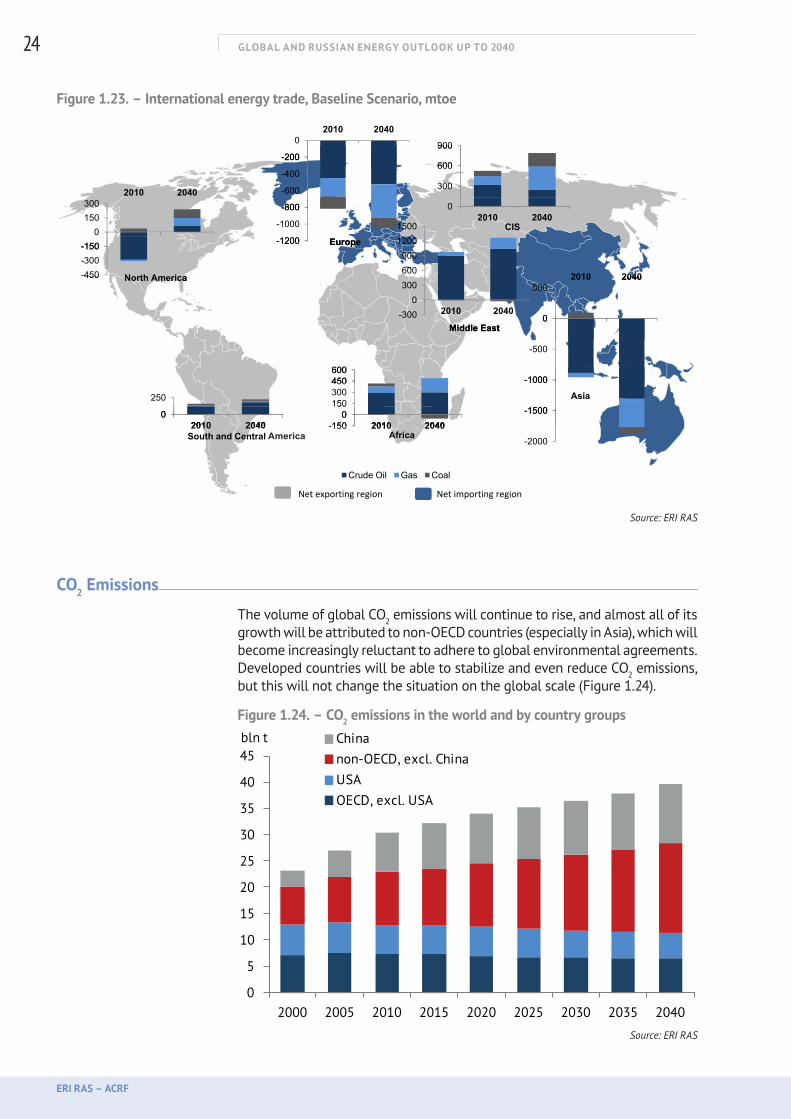
The development of the world’s energy trade will continue against the background of North America’s growing self-sufficiency, due to unconventional oil and gas resources. A significant increase in supply via the Pacific and Indian oceans will change the directions and volumes of inter-regional trade in energy resources.
By 2040, North America will move from being a net importer of oil, coal, and gas to being a net exporter. Imports of energy to Europe will increase by 28 per cent; growth in Europe’s natural gas imports will replace its decreased oil demand. Developing countries in Asia will rapidly increase their imports of all types of energy (Figure 1.23). LNG will prevail in inter-regional gas trade, against the background of rising pipeline gas supply.
GLOBAL AND RUSSIAN ENERGY OUTLOOK UP TO 2040
ERI RAS – ACRF
24
Figure 1.23. – International energy trade, Baseline Scenario, mtoe
2010 2040
400
-200
02010 2040
600
900
150300
2010 2040
-1000
-800
-600
-400
-200
0
300
600
900
2010 2040CIS1500
-300-150
0150300
-1200
-1000
-800 02010 2040
EuropeCIS
90012001500
-450-300-150
5002010 2040
-1200
North America
Europe
0300600900
1200
450
0
5002010 2040North America
Middle East-300
0300
2010 2040
-1000
-500
0
250 300450600
Middle East
Asia
-300
-1500
-1000
0
250
2010 2040 -1500
150300450600
2010 2040Africa
Asia
S th d C t l -2000
-150002010 2040 -150
050
2010 2040
C d Oil G C l
AfricaSouth and Central
Crude Oil Gas Coal
Net exporting region Net importing region Source: ERI RAS
СO2 Emissions
The volume of global СO2 emissions will continue to rise, and almost all of its growth will be attributed to non-OECD countries (especially in Asia), which will become increasingly reluctant to adhere to global environmental agreements. Developed countries will be able to stabilize and even reduce СO2 emissions, but this will not change the situation on the global scale (Figure 1.24).
Figure 1.24. – СO2 emissions in the world and by country groups
0
5
10
15
20
25
30
35
40
45
2000 2005 2010 2015 2020 2025 2030 2035 2040
bln t Chinanon-OECD, excl. ChinaUSAOECD, excl. USA
Source: ERI RAS
America
GLOBAL AND RUSSIAN ENERGY OUTLOOK UP TO 2040
ERI RAS – ACRF
25
Baseline Scenario – Energy Markets
GLOBAL AND RUSSIAN ENERGY OUTLOOK UP TO 2040
ERI RAS – ACRF
26
2. BASELINE SCENARIO – ENERGY MARKETS
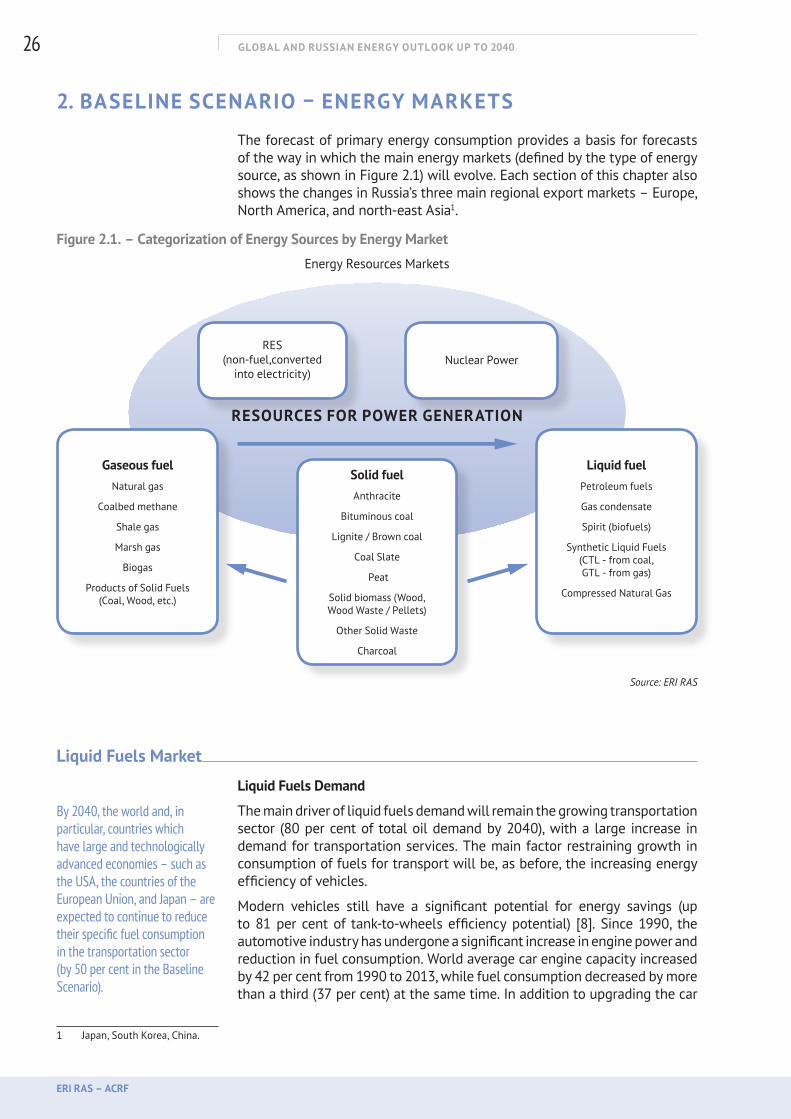
The forecast of primary energy consumption provides a basis for forecasts of the way in which the main energy markets (defined by the type of energy source, as shown in Figure 2.1) will evolve. Each section of this chapter also shows the changes in Russia’s three main regional export markets – Europe, North America, and north-east Asia1.
Figure 2.1. – Categorization of Energy Sources by Energy Market
Gaseous fuelNatural gas
Coalbed methane
Shale gas
Marsh gas
Biogas
Products of Solid Fuels (Coal, Wood, etc.)
Solid fuel Anthracite
Bituminous coal
Lignite / Brown coal
Coal Slate
Peat
Solid biomass (Wood, Wood Waste / Pellets)
Other Solid Waste
Charcoal
Liquid fuelPetroleum fuels
Gas condensate
Spirit (biofuels)
Synthetic Liquid Fuels (CTL - from coal, GTL - from gas)
Compressed Natural Gas
RES(non-fuel,converted
into electricity)Nuclear Power
RESOURCES FOR POWER GENERATION
Energy Resources Markets
Source: ERI RAS
Liquid Fuels Market
Liquid Fuels Demand
The main driver of liquid fuels demand will remain the growing transportation sector (80 per cent of total oil demand by 2040), with a large increase in demand for transportation services. The main factor restraining growth in consumption of fuels for transport will be, as before, the increasing energy efficiency of vehicles.
Modern vehicles still have a significant potential for energy savings (up to 81 per cent of tank-to-wheels efficiency potential) [8]. Since 1990, the automotive industry has undergone a significant increase in engine power and reduction in fuel consumption. World average car engine capacity increased by 42 per cent from 1990 to 2013, while fuel consumption decreased by more than a third (37 per cent) at the same time. In addition to upgrading the car
1 Japan, South Korea, China.
By 2040, the world and, in particular, countries which have large and technologically advanced economies – such as the USA, the countries of the European Union, and Japan – are expected to continue to reduce their specific fuel consumption in the transportation sector (by 50 per cent in the Baseline Scenario).
GLOBAL AND RUSSIAN ENERGY OUTLOOK UP TO 2040
ERI RAS – ACRF
27
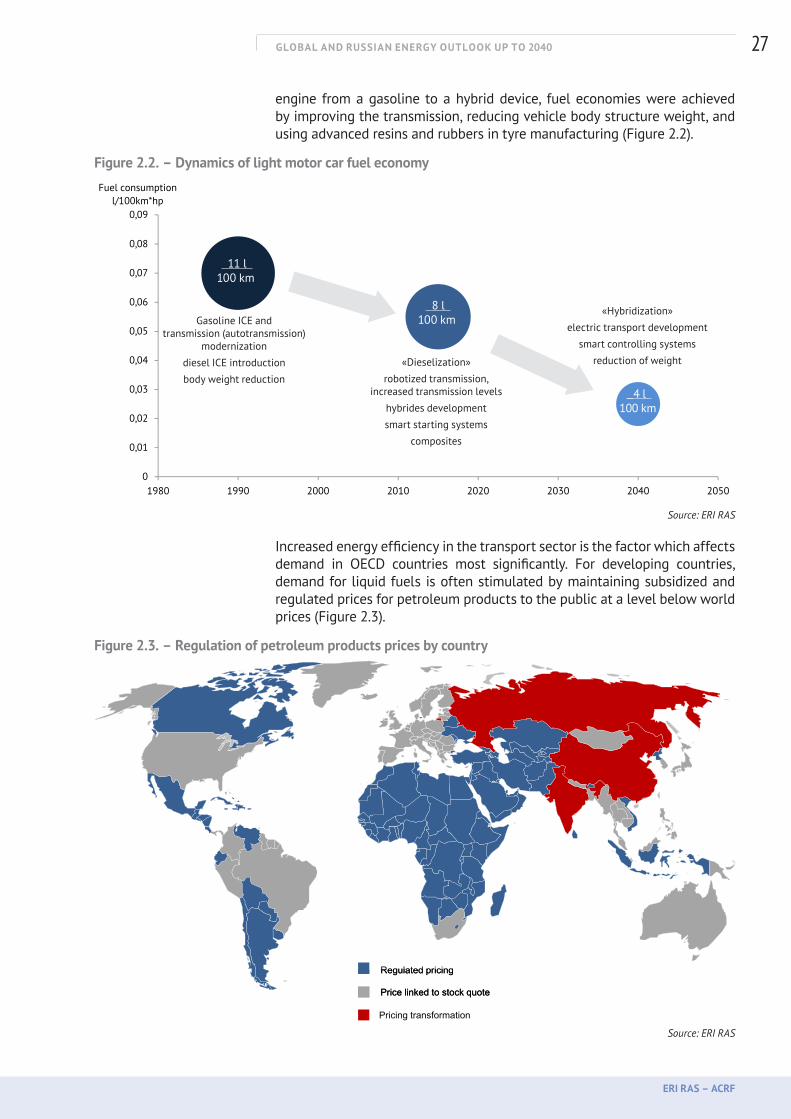
engine from a gasoline to a hybrid device, fuel economies were achieved by improving the transmission, reducing vehicle body structure weight, and using advanced resins and rubbers in tyre manufacturing (Figure 2.2).
Figure 2.2. – Dynamics of light motor car fuel economy
0 04
0,05
0,06
0,07
0,08
0,09
Fuel consumption l/100km*hp
0
0,01
0,02
0,03
0,04
1980 1990 2000 2010 2020 2030 2040 2050
Source: ERI RAS
Increased energy efficiency in the transport sector is the factor which affects demand in OECD countries most significantly. For developing countries, demand for liquid fuels is often stimulated by maintaining subsidized and regulated prices for petroleum products to the public at a level below world prices (Figure 2.3).
Figure 2.3. – Regulation of petroleum products prices by country
Price linked to stock quote
Regulated pricing
Price linked to stock quote
Regulated pricing
Pricing transformation
Source: ERI RAS
11 l 100 km
8 l 100 km
4 l 100 km
Gasoline ICE and transmission (autotransmission)
modernization
diesel ICE introduction
body weight reduction
«Dieselization»
robotized transmission, increased transmission levels
hybrides development
smart starting systems
composites
«Hybridization»
electric transport development
smart controlling systems
reduction of weight
GLOBAL AND RUSSIAN ENERGY OUTLOOK UP TO 2040
ERI RAS – ACRF
28
Given the relatively low oil prices in the Baseline Scenario, demand for liquid non-petroleum fuels will remain low due to their high costs. The only exception is biofuels, demand for which continues to grow due to measures stimulating consumption in Europe, and the low cost of their production in Brazil, Malaysia, and Indonesia.
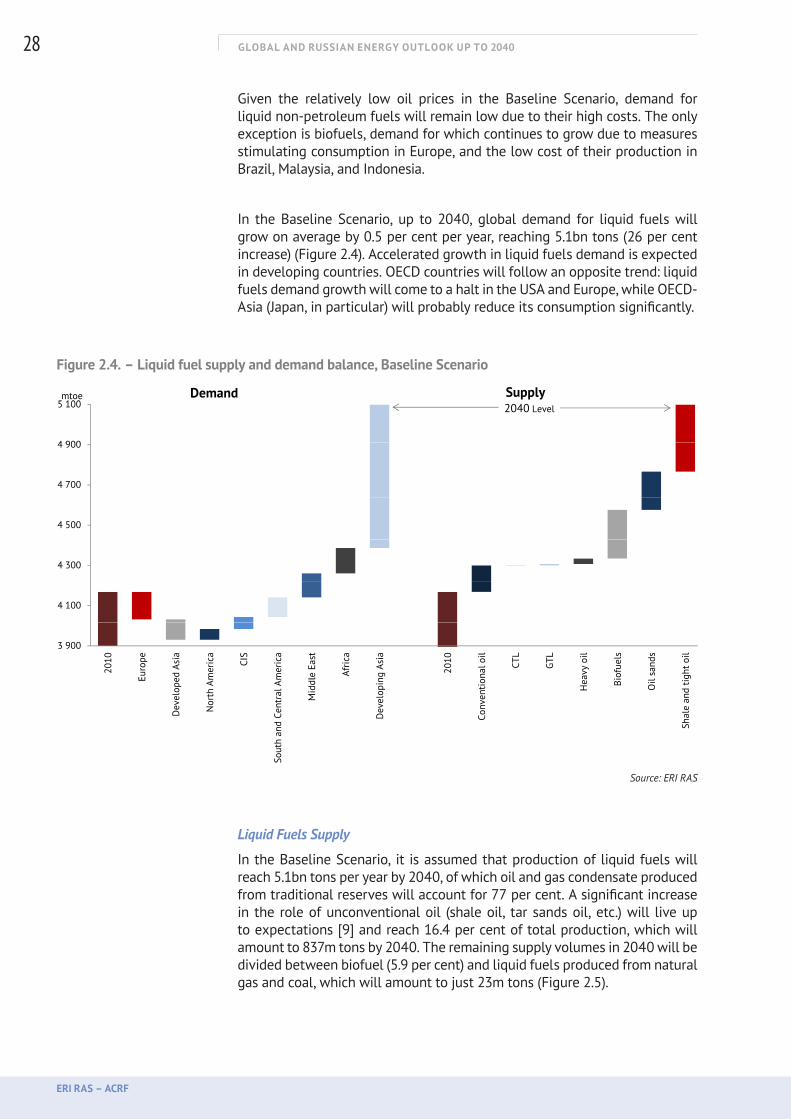
In the Baseline Scenario, up to 2040, global demand for liquid fuels will grow on average by 0.5 per cent per year, reaching 5.1bn tons (26 per cent increase) (Figure 2.4). Accelerated growth in liquid fuels demand is expected in developing countries. OECD countries will follow an opposite trend: liquid fuels demand growth will come to a halt in the USA and Europe, while OECD-Asia (Japan, in particular) will probably reduce its consumption significantly.
Figure 2.4. – Liquid fuel supply and demand balance, Baseline Scenario
GTL 0,71Heavy oil 4300,665Biofuels 6,5Oil d
5 100mtoe Demand Supply
2040 Level Oil sandsShale and tight oil
4 900
5 100 2040 Level
4 500
4 700
4 900
4 300
4 500
4 100
4 300
3 900
4 100
3 900
2010
Euro
pe
evel
oped
Asi
a
Nor
th A
mer
ica
CIS
ntra
l Am
eric
a
Mid
dle
East
Afric
a
velo
ping
Asi
a
2010
nven
tiona
l oil
CTL
GTL
Hea
vy o
il
Biof
uels
Oil
sand
s
e an
d tig
ht o
il
E
Dev
elop
e
Nor
th A
m
uth
and
Cent
ral A
m
Mid
dl
Dev
elop
in
Conv
entio Hea Bi Oil
Shal
e an
d tig
Sout
h an
d C
Sh
Source: ERI RAS
Liquid Fuels Supply
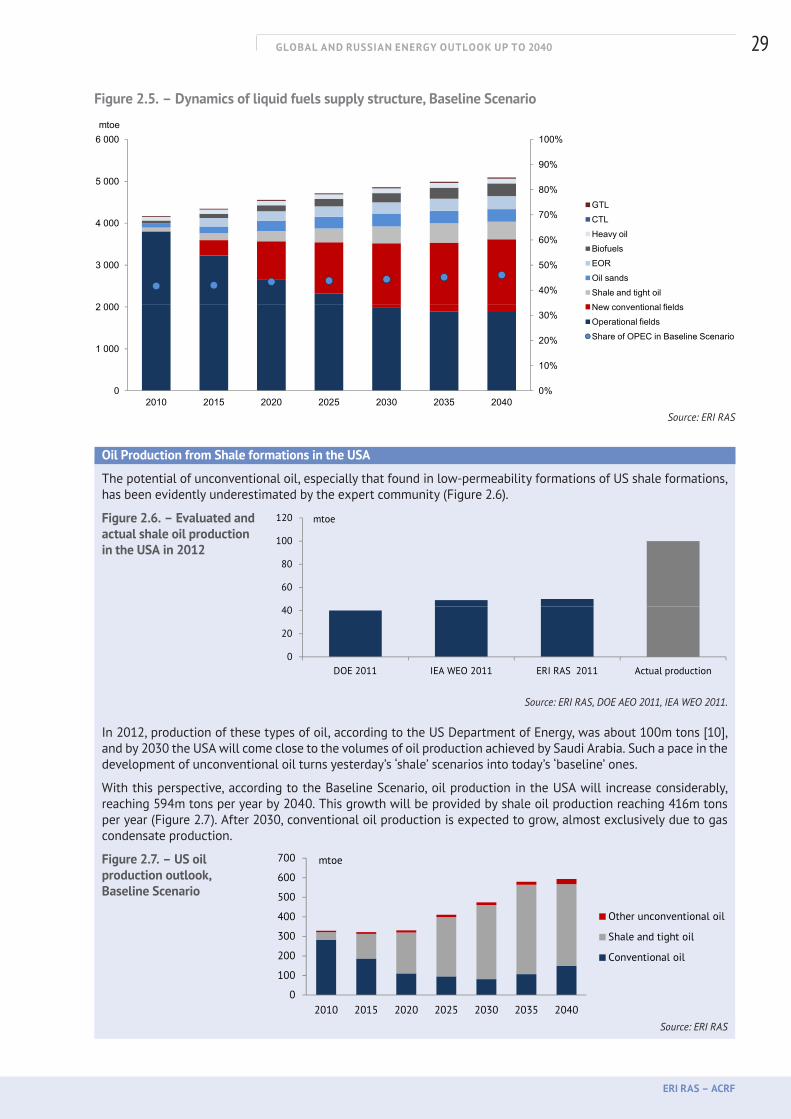
In the Baseline Scenario, it is assumed that production of liquid fuels will reach 5.1bn tons per year by 2040, of which oil and gas condensate produced from traditional reserves will account for 77 per cent. A significant increase in the role of unconventional oil (shale oil, tar sands oil, etc.) will live up to expectations [9] and reach 16.4 per cent of total production, which will amount to 837m tons by 2040. The remaining supply volumes in 2040 will be divided between biofuel (5.9 per cent) and liquid fuels produced from natural gas and coal, which will amount to just 23m tons (Figure 2.5).
GLOBAL AND RUSSIAN ENERGY OUTLOOK UP TO 2040
ERI RAS – ACRF
29
Figure 2.5. – Dynamics of liquid fuels supply structure, Baseline Scenario
40%
50%
60%
70%
80%
90%
100%
2 000
3 000
4 000
5 000
6 000mtoe
GTLCTLHeavy oilBiofuelsEOROil sandsShale and tight oilN ti l fi ld
0%
10%
20%
30%
0
1 000
2 000
2010 2015 2020 2025 2030 2035 2040
New conventional fieldsOperational fieldsShare of OPEC in Baseline Scenario
Source: ERI RAS
Oil Production from Shale formations in the USA
The potential of unconventional oil, especially that found in low-permeability formations of US shale formations, has been evidently underestimated by the expert community (Figure 2.6).
Figure 2.6. – Evaluated and actual shale oil production in the USA in 2012
Source: ERI RAS, DOE AEO 2011, IEA WEO 2011.
In 2012, production of these types of oil, according to the US Department of Energy, was about 100m tons [10], and by 2030 the USA will come close to the volumes of oil production achieved by Saudi Arabia. Such a pace in the development of unconventional oil turns yesterday’s ‘shale’ scenarios into today’s ‘baseline’ ones.
With this perspective, according to the Baseline Scenario, oil production in the USA will increase considerably, reaching 594m tons per year by 2040. This growth will be provided by shale oil production reaching 416m tons per year (Figure 2.7). After 2030, conventional oil production is expected to grow, almost exclusively due to gas condensate production.
Figure 2.7. – US oil production outlook, Baseline Scenario
Source: ERI RAS
60
80
100
120 mtoe
0
20
40
DOE 2011 IEA WEO 2011 ERI RAS 2011 Actual production
300
400
500
600
700 mtoe
Other unconventional oil
Shale and tight oil
0
100
200
2010 2015 2020 2025 2030 2035 2040
Conventional oil
GLOBAL AND RUSSIAN ENERGY OUTLOOK UP TO 2040
ERI RAS – ACRF
30
In the Baseline Scenario, global oil production from shale plays is estimated to reach 420m tons by the end of the forecast period, and it will be mostly provided by the North American plays. The volumes of oil and gas condensate produced from shale plays will be sufficient for the world market not to switch to alternative liquid fuels, derived from natural gas or coal.
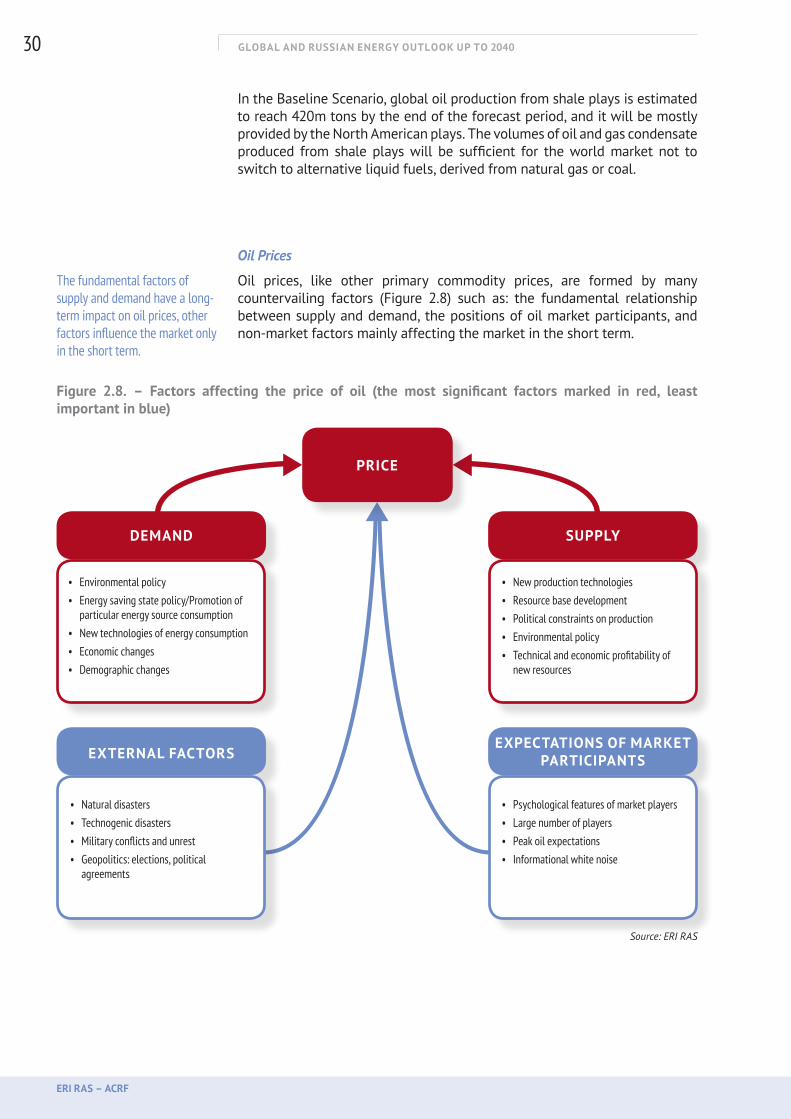
Oil Prices
Oil prices, like other primary commodity prices, are formed by many countervailing factors (Figure 2.8) such as: the fundamental relationship between supply and demand, the positions of oil market participants, and non-market factors mainly affecting the market in the short term.
Figure 2.8. – Factors affecting the price of oil (the most significant factors marked in red, least important in blue)
PRICE
DEMAND
EXTERNAL FACTORS
• Environmental policy • Energy saving state policy/Promotion of
particular energy source consumption • New technologies of energy consumption • Economic changes • Demographic changes
• New production technologies • Resource base development • Political constraints on production • Environmental policy • Technical and economic profitability of
new resources
• Natural disasters • Technogenic disasters • Military conflicts and unrest • Geopolitics: elections, political
agreements
• Psychological features of market players • Large number of players • Peak oil expectations• Informational white noise
SUPPLY
EXPECTATIONS OF MARKET PARTICIPANTS
Source: ERI RAS
The fundamental factors of supply and demand have a long-term impact on oil prices, other factors influence the market only in the short term.
GLOBAL AND RUSSIAN ENERGY OUTLOOK UP TO 2040
ERI RAS – ACRF
31
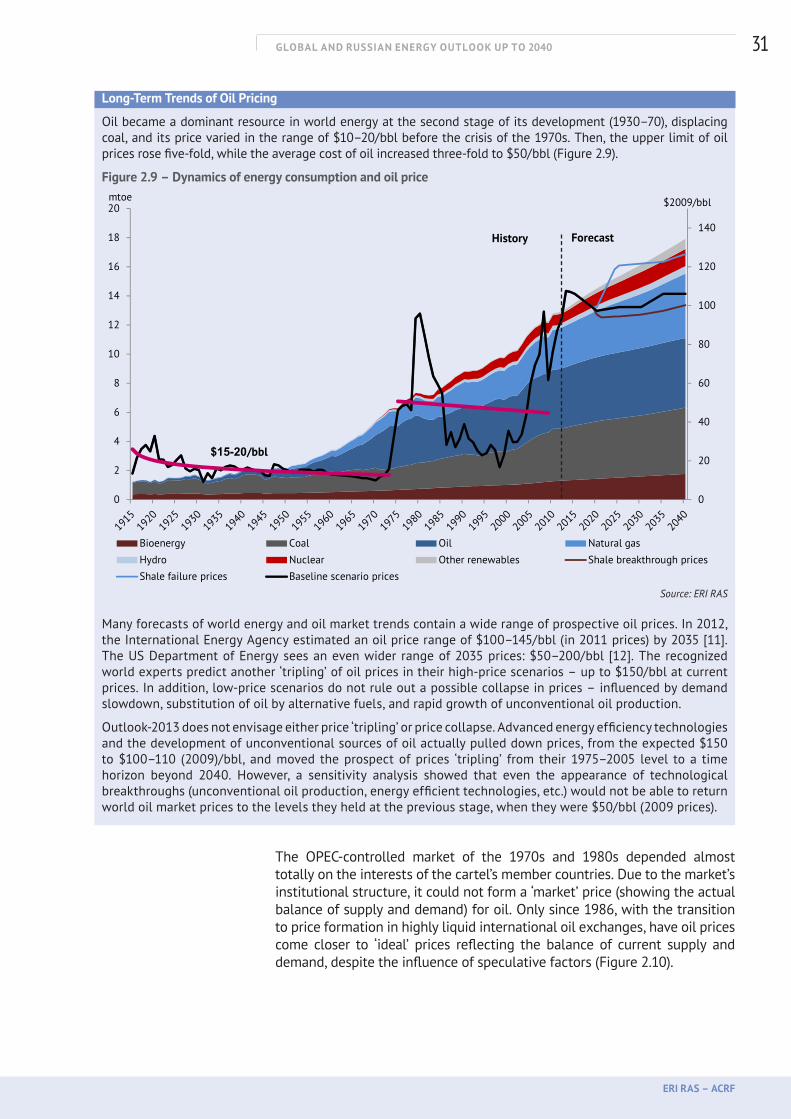
Long-Term Trends of Oil Pricing
Oil became a dominant resource in world energy at the second stage of its development (1930–70), displacing coal, and its price varied in the range of $10–20/bbl before the crisis of the 1970s. Then, the upper limit of oil prices rose five-fold, while the average cost of oil increased three-fold to $50/bbl (Figure 2.9).
Figure 2.9 – Dynamics of energy consumption and oil price
60
80
100
120
140
6
8
10
12
14
16
18
20 $2009/bblmtoe
History Forecast
0
20
40
0
2
4
6
Bioenergy Coal Oil Natural gas
Hydro Nuclear Other renewables Shale breakthrough pricesShale failure prices Baseline scenario prices
$15-20/bbl
Source: ERI RAS
Many forecasts of world energy and oil market trends contain a wide range of prospective oil prices. In 2012, the International Energy Agency estimated an oil price range of $100–145/bbl (in 2011 prices) by 2035 [11]. The US Department of Energy sees an even wider range of 2035 prices: $50–200/bbl [12]. The recognized world experts predict another ‘tripling’ of oil prices in their high-price scenarios – up to $150/bbl at current prices. In addition, low-price scenarios do not rule out a possible collapse in prices – influenced by demand slowdown, substitution of oil by alternative fuels, and rapid growth of unconventional oil production.
Outlook-2013 does not envisage either price ‘tripling’ or price collapse. Advanced energy efficiency technologies and the development of unconventional sources of oil actually pulled down prices, from the expected $150 to $100–110 (2009)/bbl, and moved the prospect of prices ‘tripling’ from their 1975–2005 level to a time horizon beyond 2040. However, a sensitivity analysis showed that even the appearance of technological breakthroughs (unconventional oil production, energy efficient technologies, etc.) would not be able to return world oil market prices to the levels they held at the previous stage, when they were $50/bbl (2009 prices).
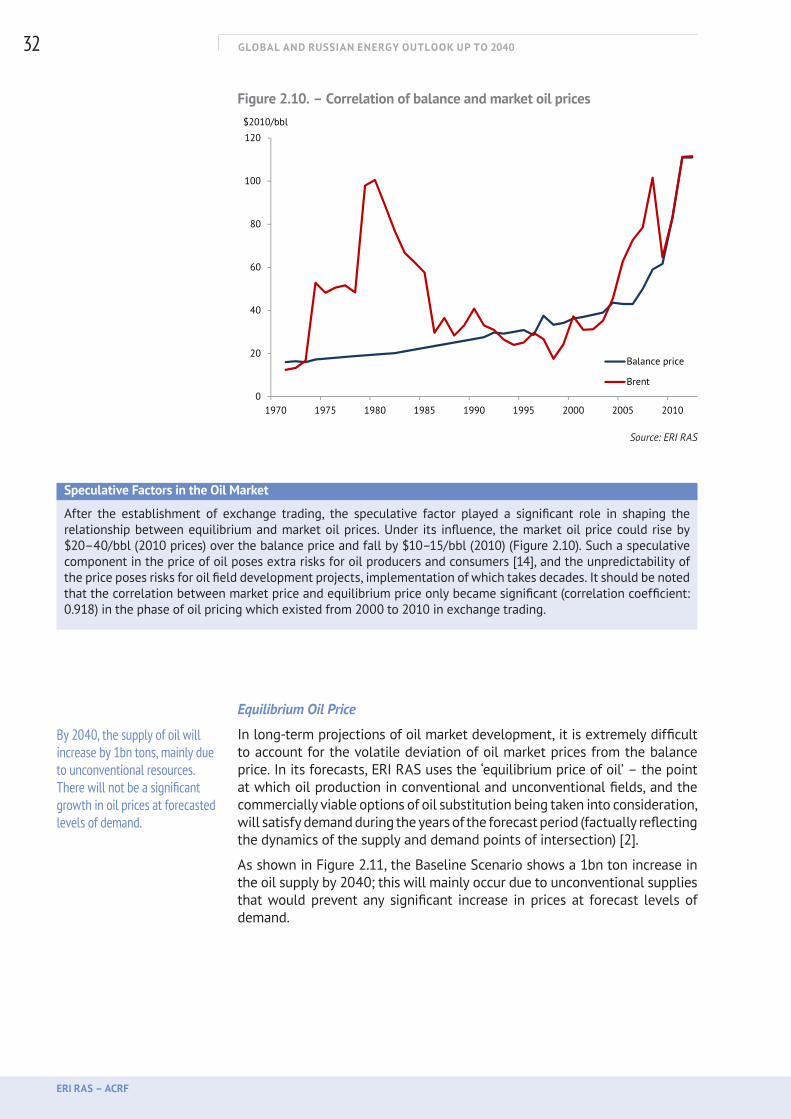
The OPEC-controlled market of the 1970s and 1980s depended almost totally on the interests of the cartel’s member countries. Due to the market’s institutional structure, it could not form a ‘market’ price (showing the actual balance of supply and demand) for oil. Only since 1986, with the transition to price formation in highly liquid international oil exchanges, have oil prices come closer to ‘ideal’ prices reflecting the balance of current supply and demand, despite the influence of speculative factors (Figure 2.10).
GLOBAL AND RUSSIAN ENERGY OUTLOOK UP TO 2040
ERI RAS – ACRF
32
Figure 2.10. – Correlation of balance and market oil prices
60
80
100
120
$2010/bbl
0
20
40
1970 1975 1980 1985 1990 1995 2000 2005 2010
Balance price
Brent
Source: ERI RAS
Speculative Factors in the Oil Market
After the establishment of exchange trading, the speculative factor played a significant role in shaping the relationship between equilibrium and market oil prices. Under its influence, the market oil price could rise by $20–40/bbl (2010 prices) over the balance price and fall by $10–15/bbl (2010) (Figure 2.10). Such a speculative component in the price of oil poses extra risks for oil producers and consumers [14], and the unpredictability of the price poses risks for oil field development projects, implementation of which takes decades. It should be noted that the correlation between market price and equilibrium price only became significant (correlation coefficient: 0.918) in the phase of oil pricing which existed from 2000 to 2010 in exchange trading.
Equilibrium Oil Price
In long-term projections of oil market development, it is extremely difficult to account for the volatile deviation of oil market prices from the balance price. In its forecasts, ERI RAS uses the ‘equilibrium price of oil’ – the point at which oil production in conventional and unconventional fields, and the commercially viable options of oil substitution being taken into consideration, will satisfy demand during the years of the forecast period (factually reflecting the dynamics of the supply and demand points of intersection) [2].
As shown in Figure 2.11, the Baseline Scenario shows a 1bn ton increase in the oil supply by 2040; this will mainly occur due to unconventional supplies that would prevent any significant increase in prices at forecast levels of demand.
By 2040, the supply of oil will increase by 1bn tons, mainly due to unconventional resources. There will not be a significant growth in oil prices at forecasted levels of demand.

GLOBAL AND RUSSIAN ENERGY OUTLOOK UP TO 2040
ERI RAS – ACRF
33
Figure 2.11. – Oil supply (cost of production) curve
0
20
40
60
80
100
120
140
160
0
274
547
821
1096
1369
1643
1917
2192
2465
2738
3013
3288
3561
3834
4108
$2010/bbl
mtoe
2011
Demand
0
20
40
60
80
100
120
140
160
0
274
547
821
1096
1369
1643
1917
2192
2465
2738
3013
3288
3561
3834
4108
4383
4657
4930
5204
$2010/bbl
mtoe
2040
Conventional oil
Oil sands
Shale and tight oil
Heavy oil
Demand
Growth
0
20
40
60
80
100
120
140
160
0
274
547
821
1096
1369
1643
1917
2192
2465
2738
3013
3288
3561
3834
4108
$2010/bbl
mtoe
2011
Demand
0
20
40
60
80
100
120
140
160
0
274
547
821
1096
1369
1643
1917
2192
2465
2738
3013
3288
3561
3834
4108
4383
4657
4930
5204
$2010/bbl
mtoe
2040
Conventional oil
Oil sands
Shale and tight oil
Heavy oil
Demand
Growth
Source: ERI RAS
Influenced by the growing production of shale oil in the USA, there has been a new trend over the last three years – regionalization of the world oil market. Following the production of growing volumes of supply in the USA, trading floor prices in the North American market have started to fall, contradicting European market price dynamics. There has been price differentiation between the two main global markers – WTI and Brent (Figure 2.12).
In the forecast period, the change in the ratio of supply and demand in regional markets, as well as the redistribution of oil flows, will create preconditions for the formation of three oil markets: in North America, with its main marker, WTI; in Europe, where the main marker will be Brent; and in the Asia–Pacific region, where currently several oil markers compete [13].

GLOBAL AND RUSSIAN ENERGY OUTLOOK UP TO 2040
ERI RAS – ACRF
34
Figure 2.12. – Historical WTI and Brent price dynamics
140
160$/bbl
Brent
WTI
100
120
140Brent
WTI
40
60
80
100
10
20
30$/bbl Brent–WTI difference
0
20
40
-10
0
10
20
2009
2010
2011
2012
2013
001.2008 11.2008 09.2009 07.2010 05.2011 03.2012 01.2013
-10 2009
2010
2011
2012
2013
Source: US DOE
The possibility of such a ‘regionalization’ should not be ignored when forming projected balance prices for oil. In the Baseline Scenario, equilibrium oil prices will remain within the price range corridor, defined as the possible deviation of local oil markers in European, North American, and Asian markets from estimated equilibrium prices (in other words, average global prices), taking into account the price dynamics of different markers in recent years (Figure 2.13).
Figure 2.13. – Projected price range of equilibrium oil prices
60
80
100
120
140
$2010/bbl
0
20
40
1970 1975 1980 1985 1990 1995 2000 2005 2010 2015 2020 2025 2030 2035 2040
Probable price range
Balance price
Brent
Source: ERI RAS
The forecast shows the trend for the gap between oil markers widening, reflecting continued regionalization of the oil market.
GLOBAL AND RUSSIAN ENERGY OUTLOOK UP TO 2040
ERI RAS – ACRF
35
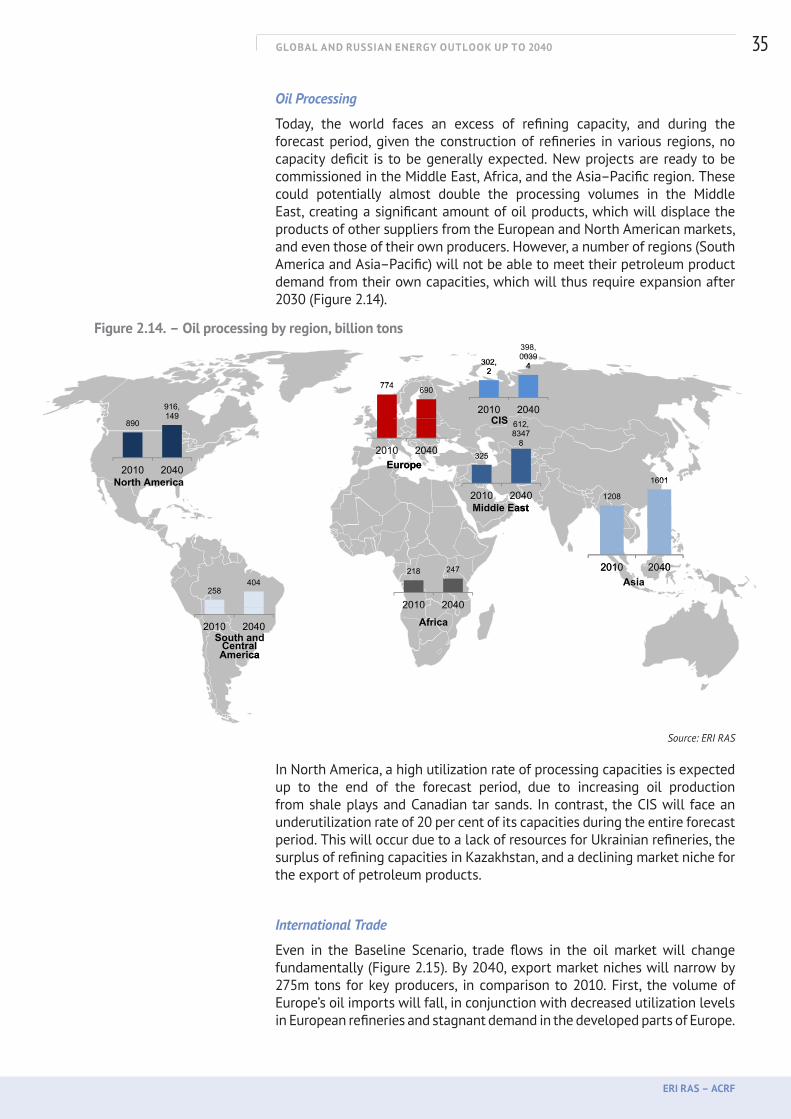
Oil Processing
Today, the world faces an excess of refining capacity, and during the forecast period, given the construction of refineries in various regions, no capacity deficit is to be generally expected. New projects are ready to be commissioned in the Middle East, Africa, and the Asia–Pacific region. These could potentially almost double the processing volumes in the Middle East, creating a significant amount of oil products, which will displace the products of other suppliers from the European and North American markets, and even those of their own producers. However, a number of regions (South America and Asia–Pacific) will not be able to meet their petroleum product demand from their own capacities, which will thus require expansion after 2030 (Figure 2.14).
Figure 2.14. – Oil processing by region, billion tons
Source: ERI RAS
In North America, a high utilization rate of processing capacities is expected up to the end of the forecast period, due to increasing oil production from shale plays and Canadian tar sands. In contrast, the CIS will face an underutilization rate of 20 per cent of its capacities during the entire forecast period. This will occur due to a lack of resources for Ukrainian refineries, the surplus of refining capacities in Kazakhstan, and a declining market niche for the export of petroleum products.
International Trade
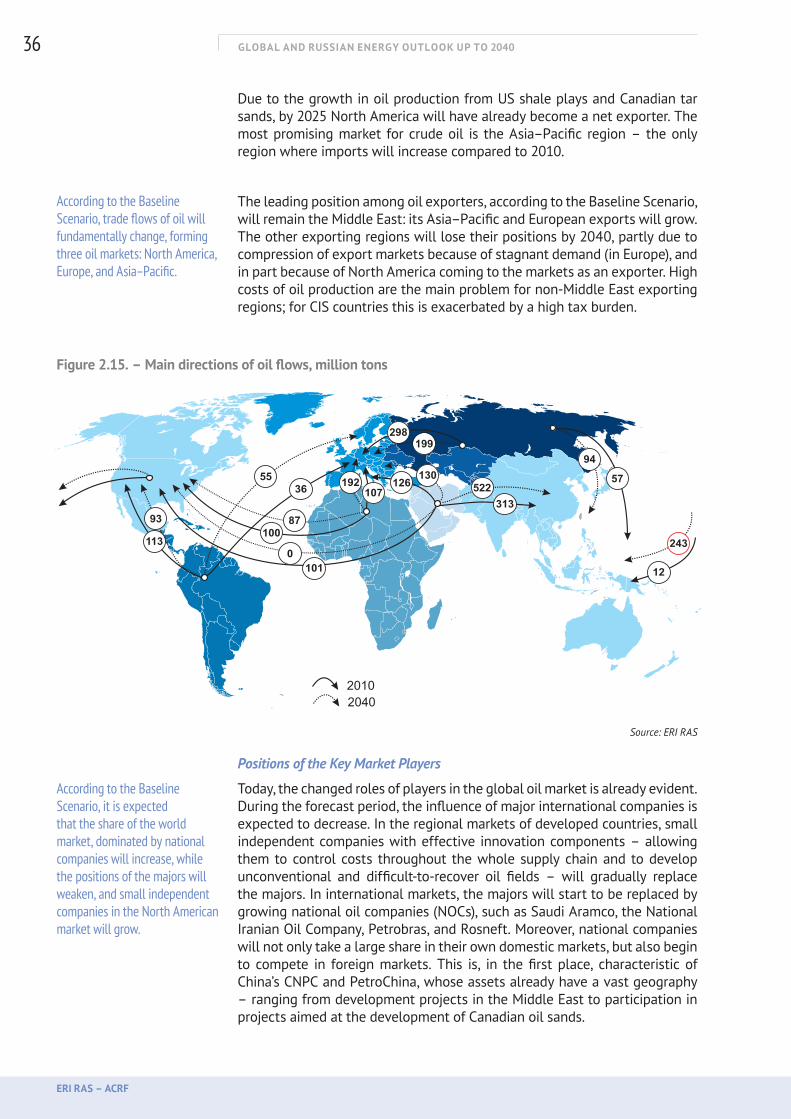
Even in the Baseline Scenario, trade flows in the oil market will change fundamentally (Figure 2.15). By 2040, export market niches will narrow by 275m tons for key producers, in comparison to 2010. First, the volume of Europe’s oil imports will fall, in conjunction with decreased utilization levels in European refineries and stagnant demand in the developed parts of Europe.
398
774 690
302,2
398,00394
890
916,149
774 690
2010 2040
302,2 4
2010 2040612,83478
CIS890149
2010 2040
2010 2040 325
612,83478
2010 20401601North America
Europe
CIS
2010 2040
2010 2040 1208
1601North AmericaEurope
Middle East
404218 247 2010 2040
Middle East
A i258
404
2010 2040
218 247
2010 2040
2010 2040
Africa
Asia
South and2010 2040
2010 2040
AfricaSouth and
Central AmericaAmerica
GLOBAL AND RUSSIAN ENERGY OUTLOOK UP TO 2040
ERI RAS – ACRF
36
Due to the growth in oil production from US shale plays and Canadian tar sands, by 2025 North America will have already become a net exporter. The most promising market for crude oil is the Asia–Pacific region – the only region where imports will increase compared to 2010.
The leading position among oil exporters, according to the Baseline Scenario, will remain the Middle East: its Asia–Pacific and European exports will grow. The other exporting regions will lose their positions by 2040, partly due to compression of export markets because of stagnant demand (in Europe), and in part because of North America coming to the markets as an exporter. High costs of oil production are the main problem for non-Middle East exporting regions; for CIS countries this is exacerbated by a high tax burden.
Figure 2.15. – Main directions of oil flows, million tons
Source: ERI RAS
Positions of the Key Market Players
Today, the changed roles of players in the global oil market is already evident. During the forecast period, the influence of major international companies is expected to decrease. In the regional markets of developed countries, small independent companies with effective innovation components – allowing them to control costs throughout the whole supply chain and to develop unconventional and difficult-to-recover oil fields – will gradually replace the majors. In international markets, the majors will start to be replaced by growing national oil companies (NOCs), such as Saudi Aramco, the National Iranian Oil Company, Petrobras, and Rosneft. Moreover, national companies will not only take a large share in their own domestic markets, but also begin to compete in foreign markets. This is, in the first place, characteristic of China’s CNPC and PetroChina, whose assets already have a vast geography – ranging from development projects in the Middle East to participation in projects aimed at the development of Canadian oil sands.
According to the Baseline Scenario, trade flows of oil will fundamentally change, forming three oil markets: North America, Europe, and Asia–Pacific.
According to the Baseline Scenario, it is expected that the share of the world market, dominated by national companies will increase, while the positions of the majors will weaken, and small independent companies in the North American market will grow.
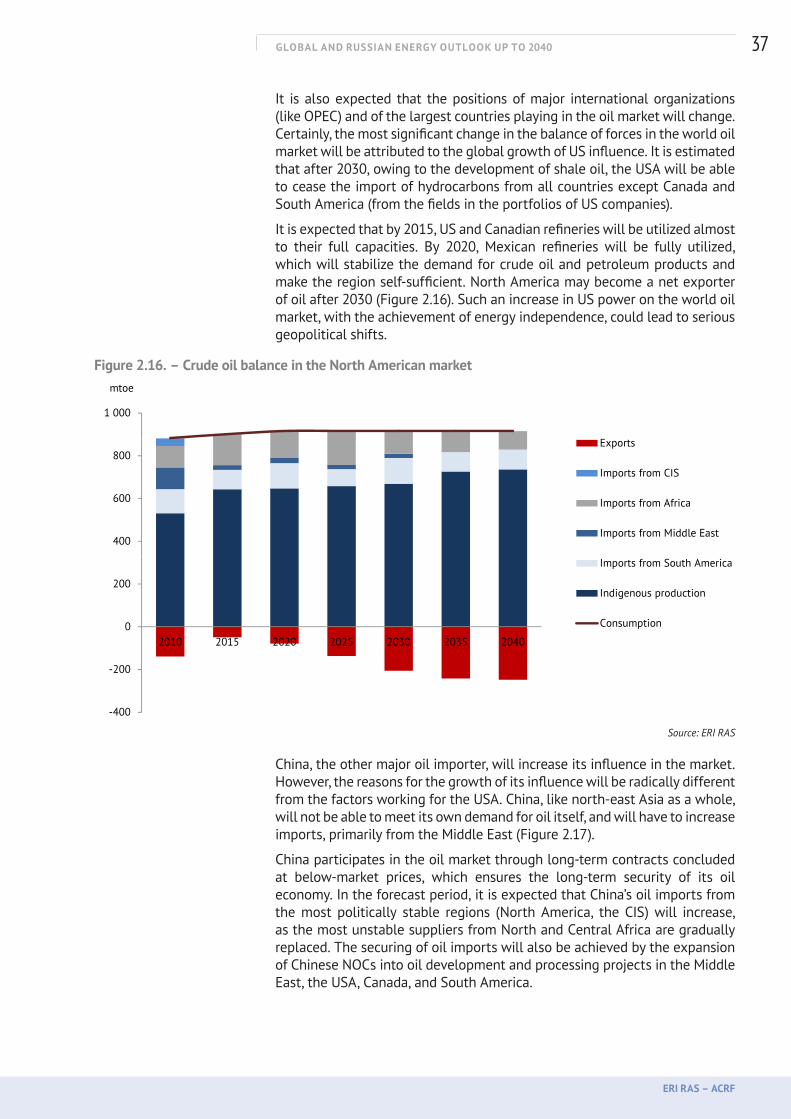
GLOBAL AND RUSSIAN ENERGY OUTLOOK UP TO 2040
ERI RAS – ACRF
37
It is also expected that the positions of major international organizations (like OPEC) and of the largest countries playing in the oil market will change. Certainly, the most significant change in the balance of forces in the world oil market will be attributed to the global growth of US influence. It is estimated that after 2030, owing to the development of shale oil, the USA will be able to cease the import of hydrocarbons from all countries except Canada and South America (from the fields in the portfolios of US companies).
It is expected that by 2015, US and Canadian refineries will be utilized almost to their full capacities. By 2020, Mexican refineries will be fully utilized, which will stabilize the demand for crude oil and petroleum products and make the region self-sufficient. North America may become a net exporter of oil after 2030 (Figure 2.16). Such an increase in US power on the world oil market, with the achievement of energy independence, could lead to serious geopolitical shifts.
Figure 2.16. – Crude oil balance in the North American market
1 000
mtoe
400
600
800Exports
Imports from CIS
Imports from Africa
Imports from Middle East
-200
0
200
2010 2015 2020 2025 2030 2035 2040
Imports from South America
Indigenous production
Consumption
-400
Source: ERI RAS
China, the other major oil importer, will increase its influence in the market. However, the reasons for the growth of its influence will be radically different from the factors working for the USA. China, like north-east Asia as a whole, will not be able to meet its own demand for oil itself, and will have to increase imports, primarily from the Middle East (Figure 2.17).
China participates in the oil market through long-term contracts concluded at below-market prices, which ensures the long-term security of its oil economy. In the forecast period, it is expected that China’s oil imports from the most politically stable regions (North America, the CIS) will increase, as the most unstable suppliers from North and Central Africa are gradually replaced. The securing of oil imports will also be achieved by the expansion of Chinese NOCs into oil development and processing projects in the Middle East, the USA, Canada, and South America.
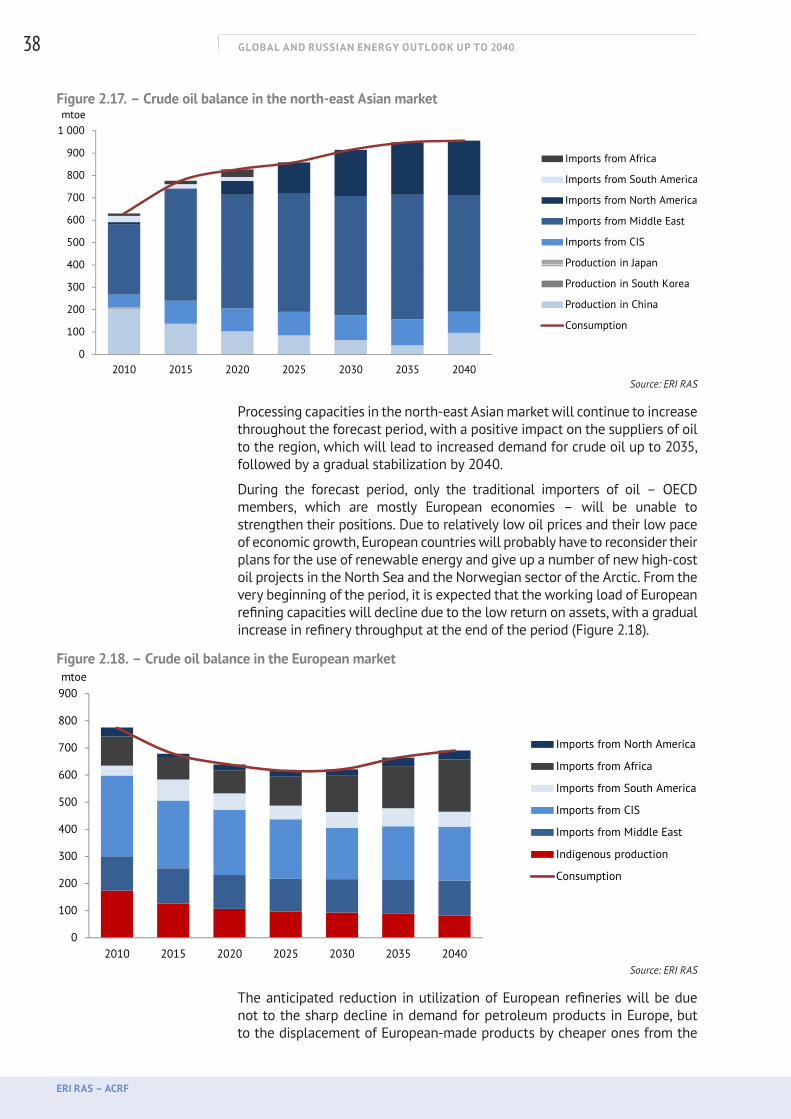
GLOBAL AND RUSSIAN ENERGY OUTLOOK UP TO 2040
ERI RAS – ACRF
38
Figure 2.17. – Crude oil balance in the north-east Asian market
400
500
600
700
800
900
1 000mtoe
Imports from Africa
Imports from South America
Imports from North America
Imports from Middle East
Imports from CIS
Production in Japan
0
100
200
300
400
2010 2015 2020 2025 2030 2035 2040
Production in Japan
Production in South Korea
Production in China
Consumption
Source: ERI RAS
Processing capacities in the north-east Asian market will continue to increase throughout the forecast period, with a positive impact on the suppliers of oil to the region, which will lead to increased demand for crude oil up to 2035, followed by a gradual stabilization by 2040.
During the forecast period, only the traditional importers of oil – OECD members, which are mostly European economies – will be unable to strengthen their positions. Due to relatively low oil prices and their low pace of economic growth, European countries will probably have to reconsider their plans for the use of renewable energy and give up a number of new high-cost oil projects in the North Sea and the Norwegian sector of the Arctic. From the very beginning of the period, it is expected that the working load of European refining capacities will decline due to the low return on assets, with a gradual increase in refinery throughput at the end of the period (Figure 2.18).
Figure 2.18. – Crude oil balance in the European market
900mtoe
500
600
700
800
Imports from North America
Imports from Africa
Imports from South America
Imports from CIS
0
100
200
300
400 Imports from Middle East
Indigenous production
Consumption
02010 2015 2020 2025 2030 2035 2040
Source: ERI RAS
The anticipated reduction in utilization of European refineries will be due not to the sharp decline in demand for petroleum products in Europe, but to the displacement of European-made products by cheaper ones from the
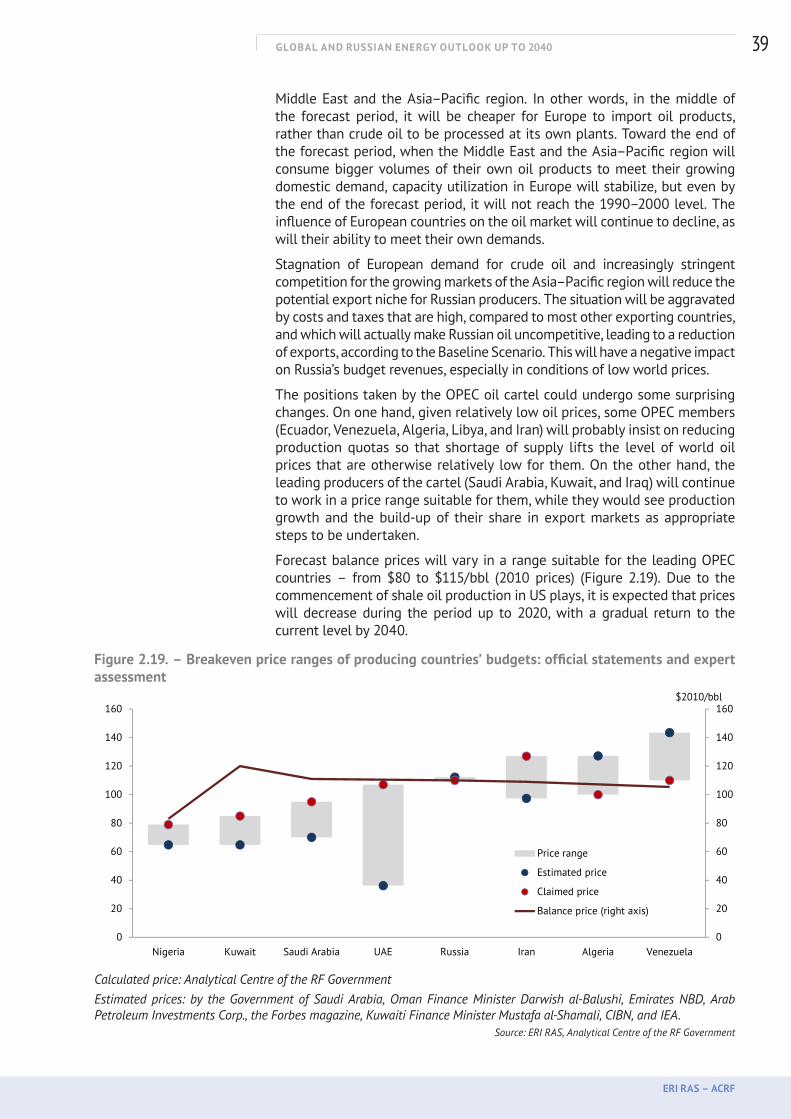
GLOBAL AND RUSSIAN ENERGY OUTLOOK UP TO 2040
ERI RAS – ACRF
39
Middle East and the Asia–Pacific region. In other words, in the middle of the forecast period, it will be cheaper for Europe to import oil products, rather than crude oil to be processed at its own plants. Toward the end of the forecast period, when the Middle East and the Asia–Pacific region will consume bigger volumes of their own oil products to meet their growing domestic demand, capacity utilization in Europe will stabilize, but even by the end of the forecast period, it will not reach the 1990–2000 level. The influence of European countries on the oil market will continue to decline, as will their ability to meet their own demands.
Stagnation of European demand for crude oil and increasingly stringent competition for the growing markets of the Asia–Pacific region will reduce the potential export niche for Russian producers. The situation will be aggravated by costs and taxes that are high, compared to most other exporting countries, and which will actually make Russian oil uncompetitive, leading to a reduction of exports, according to the Baseline Scenario. This will have a negative impact on Russia’s budget revenues, especially in conditions of low world prices.
The positions taken by the OPEC oil cartel could undergo some surprising changes. On one hand, given relatively low oil prices, some OPEC members (Ecuador, Venezuela, Algeria, Libya, and Iran) will probably insist on reducing production quotas so that shortage of supply lifts the level of world oil prices that are otherwise relatively low for them. On the other hand, the leading producers of the cartel (Saudi Arabia, Kuwait, and Iraq) will continue to work in a price range suitable for them, while they would see production growth and the build-up of their share in export markets as appropriate steps to be undertaken.
Forecast balance prices will vary in a range suitable for the leading OPEC countries – from $80 to $115/bbl (2010 prices) (Figure 2.19). Due to the commencement of shale oil production in US plays, it is expected that prices will decrease during the period up to 2020, with a gradual return to the current level by 2040.
Figure 2.19. – Breakeven price ranges of producing countries’ budgets: official statements and expert assessment
$2010/bbl$/bbl
80
100
120
140
160
80
100
120
140
160$2010/bbl$/bbl
0
20
40
60
0
20
40
60
Nigeria Kuwait Saudi Arabia UAE Russia Iran Algeria Venezuela
Price range
Estimated price
Claimed price
Balance price (right axis)
Calculated price: Analytical Centre of the RF GovernmentEstimated prices: by the Government of Saudi Arabia, Oman Finance Minister Darwish al-Balushi, Emirates NBD, Arab Petroleum Investments Corp., the Forbes magazine, Kuwaiti Finance Minister Mustafa al-Shamali, CIBN, and IEA.
Source: ERI RAS, Analytical Centre of the RF Government
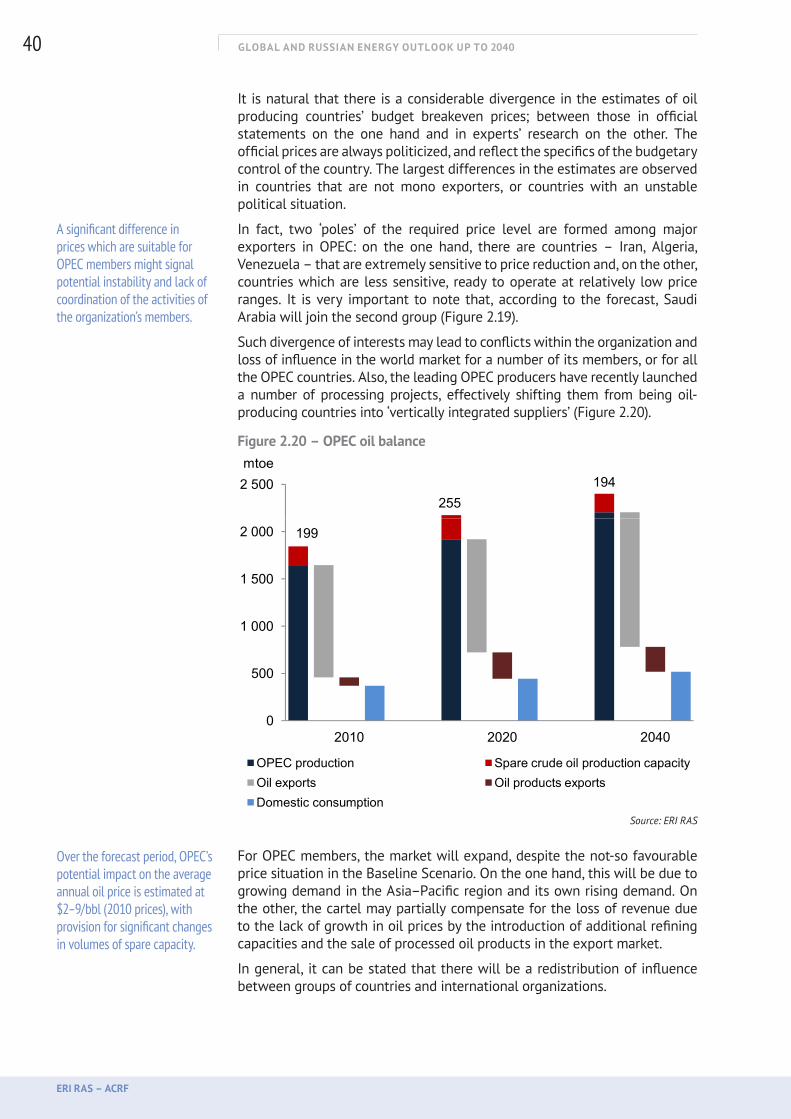
GLOBAL AND RUSSIAN ENERGY OUTLOOK UP TO 2040
ERI RAS – ACRF
40
It is natural that there is a considerable divergence in the estimates of oil producing countries’ budget breakeven prices; between those in official statements on the one hand and in experts’ research on the other. The official prices are always politicized, and reflect the specifics of the budgetary control of the country. The largest differences in the estimates are observed in countries that are not mono exporters, or countries with an unstable political situation.
In fact, two ‘poles’ of the required price level are formed among major exporters in OPEC: on the one hand, there are countries – Iran, Algeria, Venezuela – that are extremely sensitive to price reduction and, on the other, countries which are less sensitive, ready to operate at relatively low price ranges. It is very important to note that, according to the forecast, Saudi Arabia will join the second group (Figure 2.19).
Such divergence of interests may lead to conflicts within the organization and loss of influence in the world market for a number of its members, or for all the OPEC countries. Also, the leading OPEC producers have recently launched a number of processing projects, effectively shifting them from being oil-producing countries into ‘vertically integrated suppliers’ (Figure 2.20).
Figure 2.20 – OPEC oil balance
2551942 500
mtoe
199
1 000
1 500
2 000
0
500
2010 2020 2040
OPEC production Spare crude oil production capacityOil exports Oil products exportsDomestic consumption
Source: ERI RAS
For OPEC members, the market will expand, despite the not-so favourable price situation in the Baseline Scenario. On the one hand, this will be due to growing demand in the Asia–Pacific region and its own rising demand. On the other, the cartel may partially compensate for the loss of revenue due to the lack of growth in oil prices by the introduction of additional refining capacities and the sale of processed oil products in the export market.
In general, it can be stated that there will be a redistribution of influence between groups of countries and international organizations.
A significant difference in prices which are suitable for OPEC members might signal potential instability and lack of coordination of the activities of the organization’s members.
Over the forecast period, OPEC’s potential impact on the average annual oil price is estimated at $2–9/bbl (2010 prices), with provision for significant changes in volumes of spare capacity.
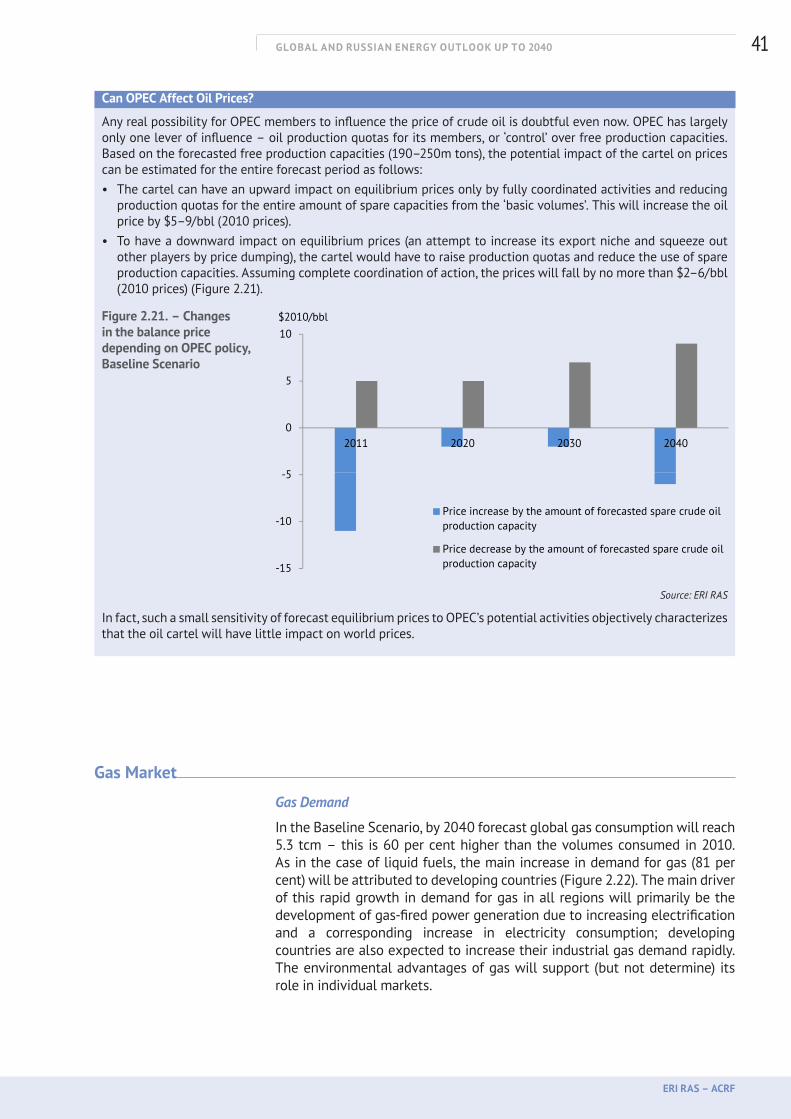
GLOBAL AND RUSSIAN ENERGY OUTLOOK UP TO 2040
ERI RAS – ACRF
41
Can OPEC Affect Oil Prices?
Any real possibility for OPEC members to influence the price of crude oil is doubtful even now. OPEC has largely only one lever of influence – oil production quotas for its members, or ‘control’ over free production capacities. Based on the forecasted free production capacities (190–250m tons), the potential impact of the cartel on prices can be estimated for the entire forecast period as follows:• The cartel can have an upward impact on equilibrium prices only by fully coordinated activities and reducing
production quotas for the entire amount of spare capacities from the ‘basic volumes’. This will increase the oil price by $5–9/bbl (2010 prices).
• To have a downward impact on equilibrium prices (an attempt to increase its export niche and squeeze out other players by price dumping), the cartel would have to raise production quotas and reduce the use of spare production capacities. Assuming complete coordination of action, the prices will fall by no more than $2–6/bbl (2010 prices) (Figure 2.21).
Figure 2.21. – Changes in the balance price depending on OPEC policy, Baseline Scenario
Source: ERI RAS
In fact, such a small sensitivity of forecast equilibrium prices to OPEC’s potential activities objectively characterizes that the oil cartel will have little impact on world prices.
Gas Market
Gas Demand
In the Baseline Scenario, by 2040 forecast global gas consumption will reach 5.3 tcm – this is 60 per cent higher than the volumes consumed in 2010. As in the case of liquid fuels, the main increase in demand for gas (81 per cent) will be attributed to developing countries (Figure 2.22). The main driver of this rapid growth in demand for gas in all regions will primarily be the development of gas-fired power generation due to increasing electrification and a corresponding increase in electricity consumption; developing countries are also expected to increase their industrial gas demand rapidly. The environmental advantages of gas will support (but not determine) its role in individual markets.
5
0
5
10
2011 2020 2030 2040
$2010/bbl
-15
-10
-5
Price increase by the amount of forecasted spare crude oil production capacity
Price decrease by the amount of forecasted spare crude oil production capacity
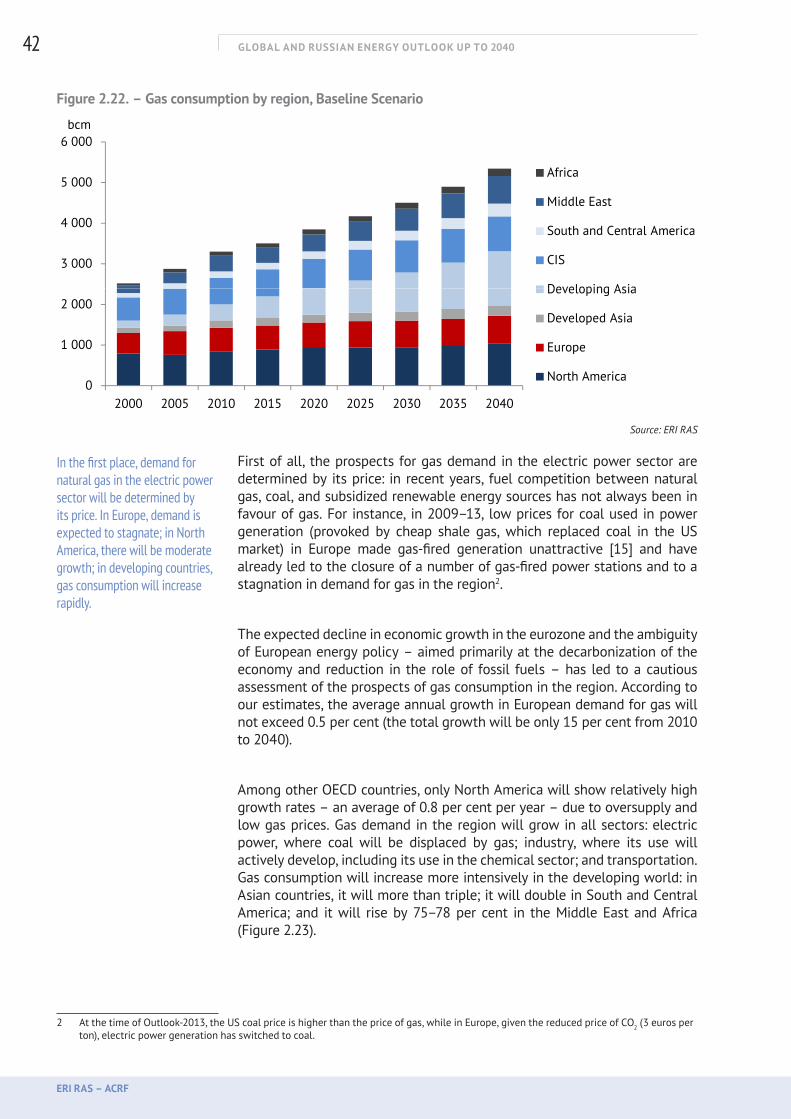
GLOBAL AND RUSSIAN ENERGY OUTLOOK UP TO 2040
ERI RAS – ACRF
42
Figure 2.22. – Gas consumption by region, Baseline Scenario
3 000
4 000
5 000
6 000bcm
Africa
Middle East
South and Central America
CIS
Developing Asia
0
1 000
2 000
2000 2005 2010 2015 2020 2025 2030 2035 2040
Developing Asia
Developed Asia
Europe
North America
Source: ERI RAS
First of all, the prospects for gas demand in the electric power sector are determined by its price: in recent years, fuel competition between natural gas, coal, and subsidized renewable energy sources has not always been in favour of gas. For instance, in 2009–13, low prices for coal used in power generation (provoked by cheap shale gas, which replaced coal in the US market) in Europe made gas-fired generation unattractive [15] and have already led to the closure of a number of gas-fired power stations and to a stagnation in demand for gas in the region2.
The expected decline in economic growth in the eurozone and the ambiguity of European energy policy – aimed primarily at the decarbonization of the economy and reduction in the role of fossil fuels – has led to a cautious assessment of the prospects of gas consumption in the region. According to our estimates, the average annual growth in European demand for gas will not exceed 0.5 per cent (the total growth will be only 15 per cent from 2010 to 2040).
Among other OECD countries, only North America will show relatively high growth rates – an average of 0.8 per cent per year – due to oversupply and low gas prices. Gas demand in the region will grow in all sectors: electric power, where coal will be displaced by gas; industry, where its use will actively develop, including its use in the chemical sector; and transportation. Gas consumption will increase more intensively in the developing world: in Asian countries, it will more than triple; it will double in South and Central America; and it will rise by 75–78 per cent in the Middle East and Africa (Figure 2.23).
2 At the time of Outlook-2013, the US coal price is higher than the price of gas, while in Europe, given the reduced price of CO2 (3 euros per ton), electric power generation has switched to coal.
In the first place, demand for natural gas in the electric power sector will be determined by its price. In Europe, demand is expected to stagnate; in North America, there will be moderate growth; in developing countries, gas consumption will increase rapidly.
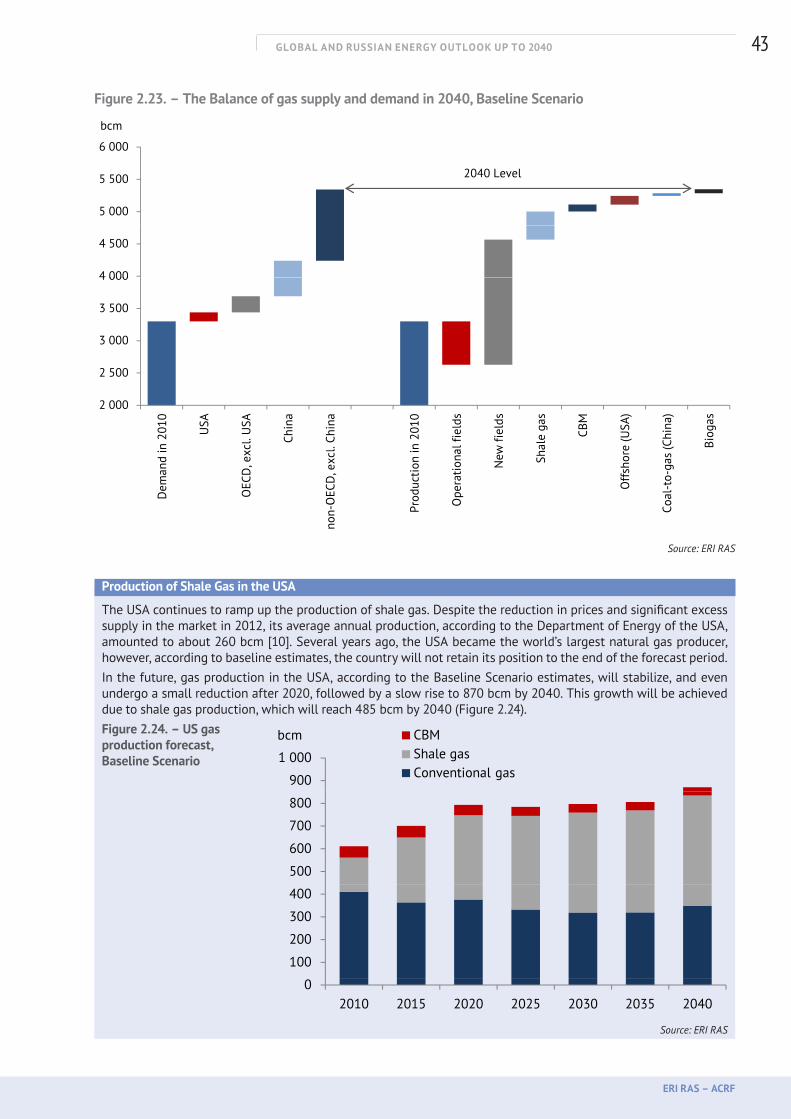
GLOBAL AND RUSSIAN ENERGY OUTLOOK UP TO 2040
ERI RAS – ACRF
43
Figure 2.23. – The Balance of gas supply and demand in 2040, Baseline Scenario
bcm
5 500
6 000
bcm
2040 Level
4 500
5 000
5 500 2040 Level
3 500
4 000
4 500
3 000
3 500
4 000
2 000
2 500
3 000
0 A A a a 0 s s s M A) a) s
2 000
eman
d in
201
0
USA
ECD
, exc
l. U
SA
Chin
a
CD, e
xcl.
Chin
a
uctio
n in
201
0
erat
iona
l fie
lds
New
fiel
ds
Shal
e ga
s
CBM
Off
shor
e (U
SA)
-to-
gas
(Chi
na)
Biog
as
Dem
and
i
OEC
D, e
x
non-
OEC
D, e
xc
Prod
uctio
n i
Ope
ratio
na New Sh
Off
shor
Coal
-to-
gas
non-
O Pr O Co
Source: ERI RAS
Production of Shale Gas in the USA
The USA continues to ramp up the production of shale gas. Despite the reduction in prices and significant excess supply in the market in 2012, its average annual production, according to the Department of Energy of the USA, amounted to about 260 bcm [10]. Several years ago, the USA became the world’s largest natural gas producer, however, according to baseline estimates, the country will not retain its position to the end of the forecast period.In the future, gas production in the USA, according to the Baseline Scenario estimates, will stabilize, and even undergo a small reduction after 2020, followed by a slow rise to 870 bcm by 2040. This growth will be achieved due to shale gas production, which will reach 485 bcm by 2040 (Figure 2.24).Figure 2.24. – US gas production forecast, Baseline Scenario
Source: ERI RAS
900
1 000
bcm CBMShale gasConventional gas
500
600
700
800
100
200
300
400
02010 2015 2020 2025 2030 2035 2040
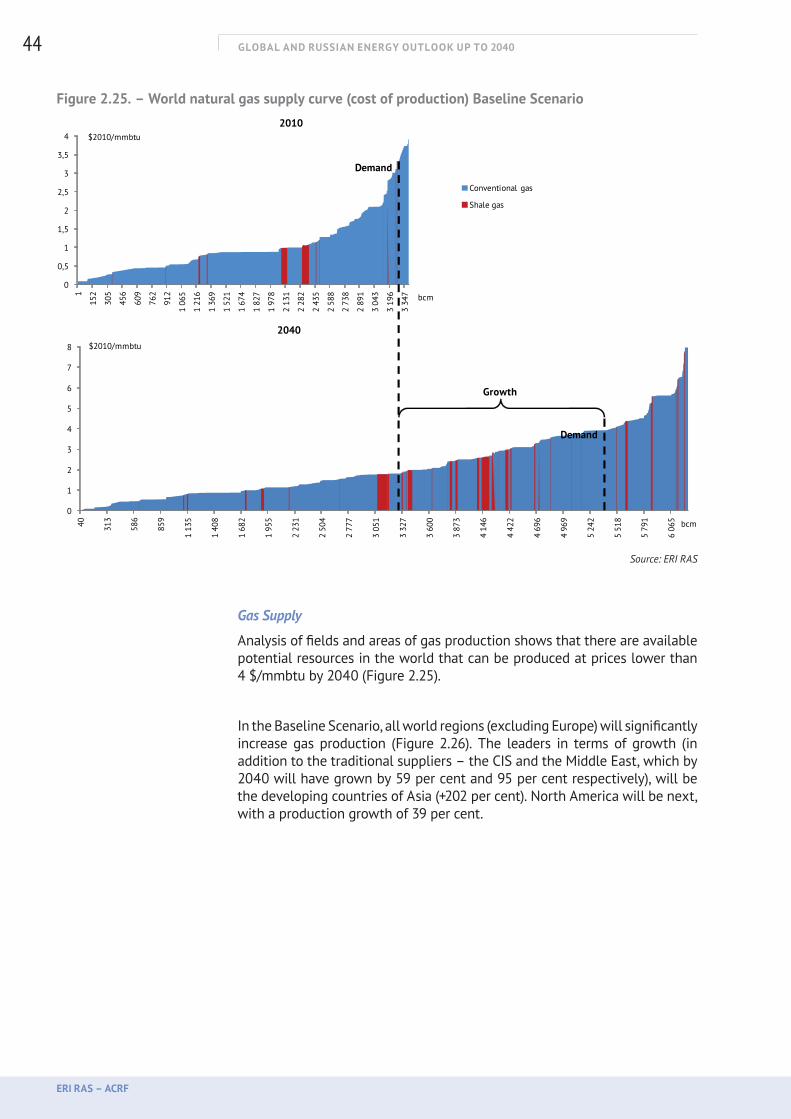
GLOBAL AND RUSSIAN ENERGY OUTLOOK UP TO 2040
ERI RAS – ACRF
44
Figure 2.25. – World natural gas supply curve (cost of production) Baseline Scenario
0
1
2
3
4
5
6
7
8
40 313
586
859
1 13
5
1 40
8
1 68
2
1 95
5
2 23
1
2 50
4
2 77
7
3 05
1
3 32
7
3 60
0
3 87
3
4 14
6
4 42
2
4 69
6
4 96
9
5 24
2
5 51
8
5 79
1
6 06
5
$2010/mmbtu
bcm
2040
0
0,5
1
1,5
2
2,5
3
3,5
4
1
152
305
456
609
762
912
1 06
5
1 21
6
1 36
9
1 52
1
1 67
4
1 82
7
1 97
8
2 13
1
2 28
2
2 43
5
2 58
8
2 73
8
2 89
1
3 04
3
3 19
6
3 34
7
$2010/mmbtu
bcm
2010
Conventional gas
Shale gas
Growth
Demand
Demand
Source: ERI RAS
Gas Supply
Analysis of fields and areas of gas production shows that there are available potential resources in the world that can be produced at prices lower than 4 $/mmbtu by 2040 (Figure 2.25).
In the Baseline Scenario, all world regions (excluding Europe) will significantly increase gas production (Figure 2.26). The leaders in terms of growth (in addition to the traditional suppliers – the CIS and the Middle East, which by 2040 will have grown by 59 per cent and 95 per cent respectively), will be the developing countries of Asia (+202 per cent). North America will be next, with a production growth of 39 per cent.

GLOBAL AND RUSSIAN ENERGY OUTLOOK UP TO 2040
ERI RAS – ACRF
45
Figure 2.26. – Gas production by region, Baseline Scenario
6 000bcm
3 000
4 000
5 000
Africa
Middle East
South and Central America
CIS
0
1 000
2 000Developing Asia
Developed Asia
Europe
North America
2000 2005 2010 2015 2020 2025 2030 2035 2040
Source: ERI RAS
Major production gains will be provided by new reserves of conventional gas and by further expansion of unconventional gas, which by the end of the forecast period will account for 15 per cent of world gas production (shale gas: 11 per cent; coal-bed methane: 3 per cent; and biogas: 1 per cent) (Figure 2.27).
Figure 2.27. – Gas production by source, Baseline Scenario
6 000bcm
3 000
4 000
5 000Biogas
Coal-to-gas (China)
Offshore (USA)
Shale
1 000
2 000
CBM
Associated Gas
New fields
Operational fields
02010 2015 2020 2025 2030 2035 2040
Source: ERI RAS
North America will achieve the largest increase in unconventional gas production. Other world regions are only in the initial stages of geological exploration, and this entails great uncertainty regarding the potential of shale gas production and, in certain regions, regulatory constraints. It is assumed in the Baseline Scenario that aside from North America, shale gas production will be carried out only in Argentina, China, India, South Africa, Australia, and Europe, and will not exceed 70 bcm in total by 2040.

GLOBAL AND RUSSIAN ENERGY OUTLOOK UP TO 2040
ERI RAS – ACRF
46
At the same time, gas production from new traditional fields will become more high-tech. There will be the need for development of deepwater fields, those with more complex geological structures, and fields located in harsh climatic conditions.
Gas Price
Currently, the world is witnessing a transformation of the various regional gas pricing systems, primarily due to the gradual expansion of trade based on ‘gas-to-gas’ competition. However, more than 60 per cent of gas in the world is still sold at regulated prices, or at prices related to oil indexes, or by other mechanisms (Figure фa).
Figure 2.28. – Current world pricing of gas and its changes in 2005–10
Source: ERI RAS, IGU 2009-2012 Triennium Work Report, June 2012
Currently, the regionalization of gas market prices is becoming more pronounced, due not only to the mechanisms of regulation and pricing, but also by price levels:
• Low prices have been established in recent years in the US spot market, due to cheap domestic production;
• Medium price levels have been established in the European market, with hybrid pricing (around half the gas is supplied at spot-indexed prices and the other half linked to the prices of petroleum products), and due to a temporary excess supply of gas;
• The highest prices are observed in the Asian market, where trading is carried out mainly with reference to the price of crude oil;
• The governments of most countries that are net exporters of gas, and also many importing developing countries, are eager to keep domestic prices below the world level, to support other sectors of the economy and to reduce social tensions.

GLOBAL AND RUSSIAN ENERGY OUTLOOK UP TO 2040
ERI RAS – ACRF
47
Further changes in regional pricing mechanisms will be driven, apparently, in the direction of increasing the proportion of spot-indexed supplies in all markets. The rapid development of the LNG market and its globalization will reinforce this process, not only in Europe but also in the Asia–Pacific region, where consumers, against the background of high prices, look for any opportunity to reduce their bills. Most developing countries will obviously retain pricing based on government regulation for significant volumes of gas trade in their domestic markets; there could be limited competition in the closed domestic market, or prices linked to those in the international market with some lowering coefficients.
Calculations using the model have confirmed that, in the Baseline Scenario, the significant differences between regional gas prices seen in 2006–8 will remain. The main reason for this is the high price of gas transportation, which for intercontinental shipments, adds more than 4 $/mmbtu to the price of gas. Accordingly, this high cost of transportation supports the regionalization of gas markets and prevents the creation of a single liquid market. In this situation, the limited ability to redirect routes, the high mutual dependence of suppliers and customers on pipeline supply, and the continuing limitations of LNG market flexibility still give some advantages to the traditional mechanism of linking to alternative fuels, which would increase predictability, reduce investment risks for producers, and simplify the process of project funding.
It is estimated that by the end of the forecast period, Europe and the Asia–Pacific region will experience a noticeable price increase (Figure 2.29), due to the need to develop new and more expensive fields to meet demand. In these circumstances, the North American market will find itself in a price range determined by its own production; the USA, for the forecast period, will retain the lowest prices which, however, will also increase by the end of the period. In 2015–30, Europe will experience a decline in prices due to sluggish demand and oversupply of gas, while there will be rapid demand growth in the Asia–Pacific region which will stimulate the development of a large number of new, quite expensive, gas supply projects and, in contrast, an additional price premium will prevail here until 2020–25.
Figure 2.29. – Forecast weighted average price* of gas by regional market, Baseline Scenario
12
14 $2010/mmbtu
6
8
10
0
2
4
Europe (average weighted) China (average weighted)Japan (average weighted) USA (Henry Hub)
02000 2005 2010 2015 2020 2025 2030 2035 2040
* Weighted average price between the prices of long-term contracts linked to alternative fuels, and spot prices.
Source: ERI RAS
For the period to 2040, conditions will not be right for the formation of a single global gas market and a unified gas price.
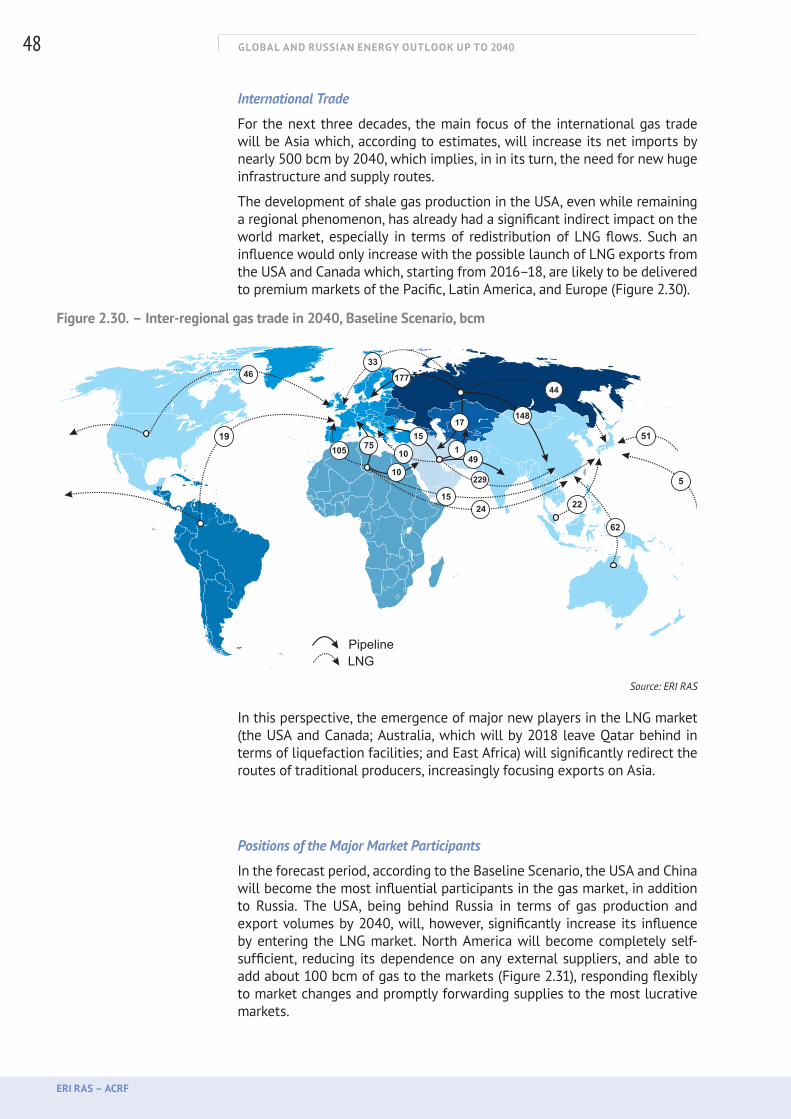
GLOBAL AND RUSSIAN ENERGY OUTLOOK UP TO 2040
ERI RAS – ACRF
48
International Trade
For the next three decades, the main focus of the international gas trade will be Asia which, according to estimates, will increase its net imports by nearly 500 bcm by 2040, which implies, in in its turn, the need for new huge infrastructure and supply routes.
The development of shale gas production in the USA, even while remaining a regional phenomenon, has already had a significant indirect impact on the world market, especially in terms of redistribution of LNG flows. Such an influence would only increase with the possible launch of LNG exports from the USA and Canada which, starting from 2016–18, are likely to be delivered to premium markets of the Pacific, Latin America, and Europe (Figure 2.30).
Figure 2.30. – Inter-regional gas trade in 2040, Baseline Scenario, bcm
Source: ERI RAS
In this perspective, the emergence of major new players in the LNG market (the USA and Canada; Australia, which will by 2018 leave Qatar behind in terms of liquefaction facilities; and East Africa) will significantly redirect the routes of traditional producers, increasingly focusing exports on Asia.
Positions of the Major Market Participants
In the forecast period, according to the Baseline Scenario, the USA and China will become the most influential participants in the gas market, in addition to Russia. The USA, being behind Russia in terms of gas production and export volumes by 2040, will, however, significantly increase its influence by entering the LNG market. North America will become completely self-sufficient, reducing its dependence on any external suppliers, and able to add about 100 bcm of gas to the markets (Figure 2.31), responding flexibly to market changes and promptly forwarding supplies to the most lucrative markets.
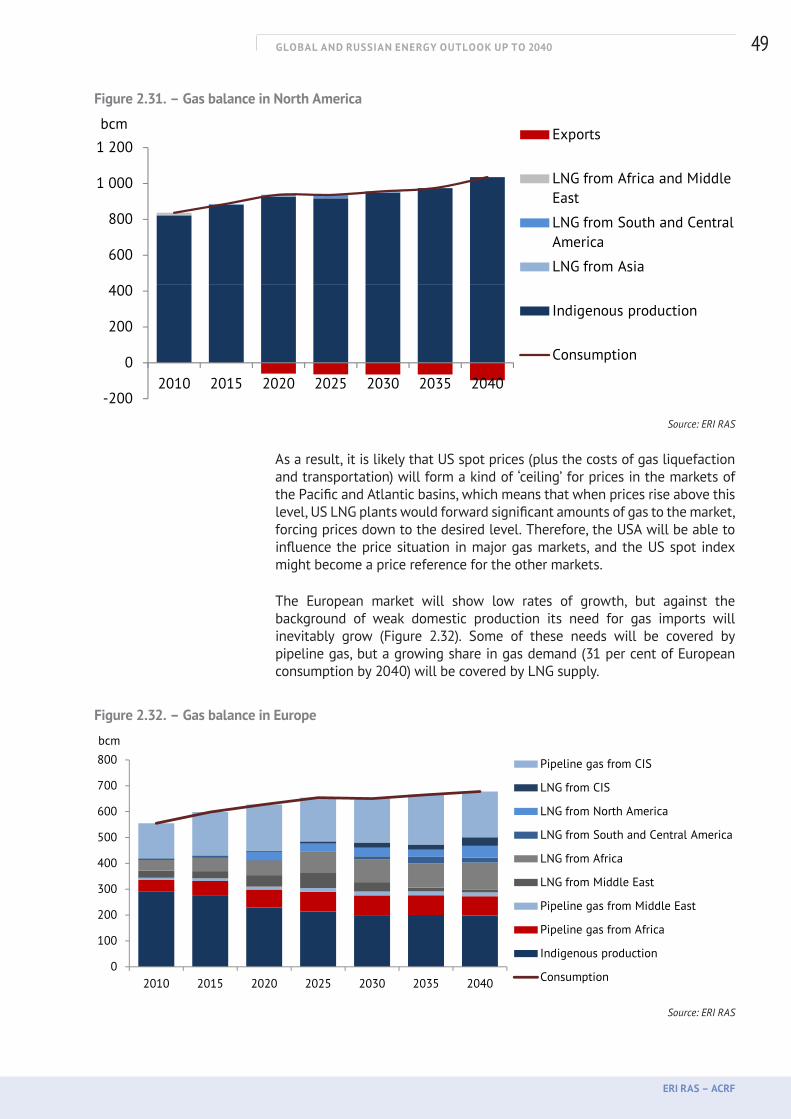
GLOBAL AND RUSSIAN ENERGY OUTLOOK UP TO 2040
ERI RAS – ACRF
49
Figure 2.31. – Gas balance in North America
600
800
1 000
1 200bcm
Exports
LNG from Africa and Middle East
LNG from South and Central America
LNG from Asia
-200
0
200
400
2010 2015 2020 2025 2030 2035 2040
Indigenous production
Consumption
Source: ERI RAS
As a result, it is likely that US spot prices (plus the costs of gas liquefaction and transportation) will form a kind of ‘ceiling’ for prices in the markets of the Pacific and Atlantic basins, which means that when prices rise above this level, US LNG plants would forward significant amounts of gas to the market, forcing prices down to the desired level. Therefore, the USA will be able to influence the price situation in major gas markets, and the US spot index might become a price reference for the other markets.
The European market will show low rates of growth, but against the background of weak domestic production its need for gas imports will inevitably grow (Figure 2.32). Some of these needs will be covered by pipeline gas, but a growing share in gas demand (31 per cent of European consumption by 2040) will be covered by LNG supply.
Figure 2.32. – Gas balance in Europe
800
bcm
400
500
600
700
800 Pipeline gas from CIS
LNG from CIS
LNG from North America
LNG from South and Central America
LNG from Africa
0
100
200
300
2010 2015 2020 2025 2030 2035 2040
LNG from Middle East
Pipeline gas from Middle East
Pipeline gas from Africa
Indigenous production
Consumption2010 2015 2020 2025 2030 2035 2040 p
Source: ERI RAS
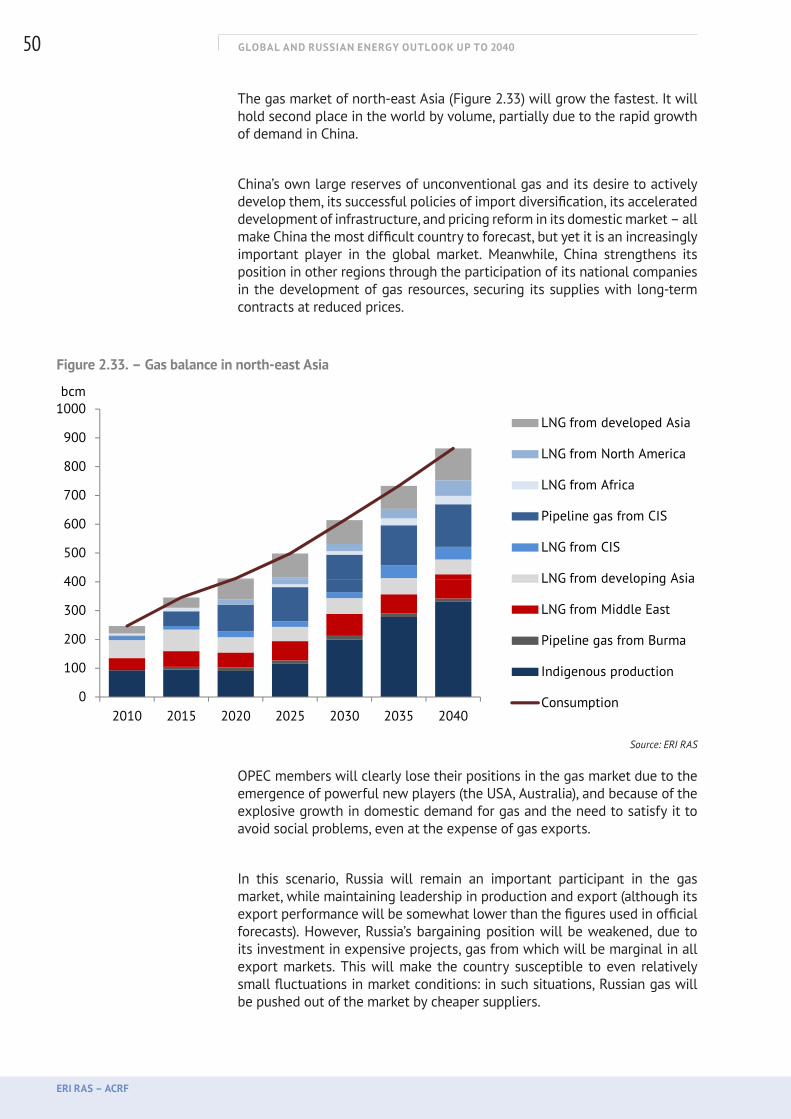
GLOBAL AND RUSSIAN ENERGY OUTLOOK UP TO 2040
ERI RAS – ACRF
50
The gas market of north-east Asia (Figure 2.33) will grow the fastest. It will hold second place in the world by volume, partially due to the rapid growth of demand in China.
China’s own large reserves of unconventional gas and its desire to actively develop them, its successful policies of import diversification, its accelerated development of infrastructure, and pricing reform in its domestic market – all make China the most difficult country to forecast, but yet it is an increasingly important player in the global market. Meanwhile, China strengthens its position in other regions through the participation of its national companies in the development of gas resources, securing its supplies with long-term contracts at reduced prices.
Figure 2.33. – Gas balance in north-east Asia
400
500
600
700
800
900
1000bcm
LNG from developed Asia
LNG from North America
LNG from Africa
Pipeline gas from CIS
LNG from CIS
LNG from developing Asia
0
100
200
300
400
2010 2015 2020 2025 2030 2035 2040
LNG from developing Asia
LNG from Middle East
Pipeline gas from Burma
Indigenous production
Consumption
Source: ERI RAS
OPEC members will clearly lose their positions in the gas market due to the emergence of powerful new players (the USA, Australia), and because of the explosive growth in domestic demand for gas and the need to satisfy it to avoid social problems, even at the expense of gas exports.
In this scenario, Russia will remain an important participant in the gas market, while maintaining leadership in production and export (although its export performance will be somewhat lower than the figures used in official forecasts). However, Russia’s bargaining position will be weakened, due to its investment in expensive projects, gas from which will be marginal in all export markets. This will make the country susceptible to even relatively small fluctuations in market conditions: in such situations, Russian gas will be pushed out of the market by cheaper suppliers.

GLOBAL AND RUSSIAN ENERGY OUTLOOK UP TO 2040
ERI RAS – ACRF
51
Solid Fuel Market
Until 1960, solid fuels (mainly coal) provided the bulk of energy consumed in the world, due to their economic and technological accessibility; from 1960 to 1980, the share of solid fuels in global energy consumption fell. However, during the last 30 years, solid fuels have stabilized at around 25 per cent of primary energy consumption, and during 2000–10 solid fuels showed the highest absolute levels of growth (almost half of total energy consumption growth), increasing their share to 28 per cent.
According to our estimates, during the next three decades, solid fuels will maintain their significance in the energy sector and will satisfy about a quarter of global energy demand. In this sector, coal will continue to play the key role.
Coal
During the forecast period up to 2040, the main increase in world coal consumption will be attributed to the developing Asia–Pacific countries (especially China and India) (Figure 2.34). The OECD countries, mainly Europe and the USA, will reduce their demand for coal.
Figure 2.34. – Coal consumption by region, Baseline Scenario
7 000
8 000mt
5 000
6 000
7 000
AfricaMiddle EastSouth and Central America
2 000
3 000
4 000 CISDeveloping AsiaDeveloped AsiaEurope
0
1 000
2 000EuropeNorth America
2000 2005 2010 2015 2020 2025 2030 2035 2040
Source: ERI RAS
The power sector in the developing countries of Asia will provide the main growth in coal consumption. Currently, the leaders in coal-fired generation capacity are China, the USA, Russia, and India; the planned new generation facilities in China and India (over 500 GW per country) will make them absolute leaders (Figure 2.35) with an aggregate share of 77 per cent of the world’s total coal-fired generating capacity.

GLOBAL AND RUSSIAN ENERGY OUTLOOK UP TO 2040
ERI RAS – ACRF
52
Figure 2.35. – Installed and planned coal-fired capacity
400
600
800
1 000
1 200
1 400
1 600
1 800
GWh
Planned capacity commissioning
Installed capacity
0
200
Source: ERI RAS
By 2040, developing countries in Asia will have strengthened their leadership not only in coal consumption but also in coal production (Figure 2.36). Coal production in Europe will drop by half, which, despite the declining demand for coal in European countries, will lead to additional imports of coal being needed.
Figure 2.36. – Coal production by region, Baseline Scenario
3 000
4 000
5 000
6 000
7 000
8 000mt
Africa
Middle East
South and Central America
CIS
Developing Asia
D l d A i
0
1 000
2 000
2000 2005 2010 2015 2020 2025 2030 2035 2040
Developed Asia
Europe
North America
Source: ERI RAS
Under the Baseline Scenario, international steam coal trade will reach 1.4bn tons by 2040. The equilibrium price of traded coal, calculated in accordance with the balance of supply and demand (Figure 2.37), will be at least $120/ton (2010 prices).
Non-OECD Asia will retain its leadership in coal consumption; its share by 2040 will amount to 75 per cent.
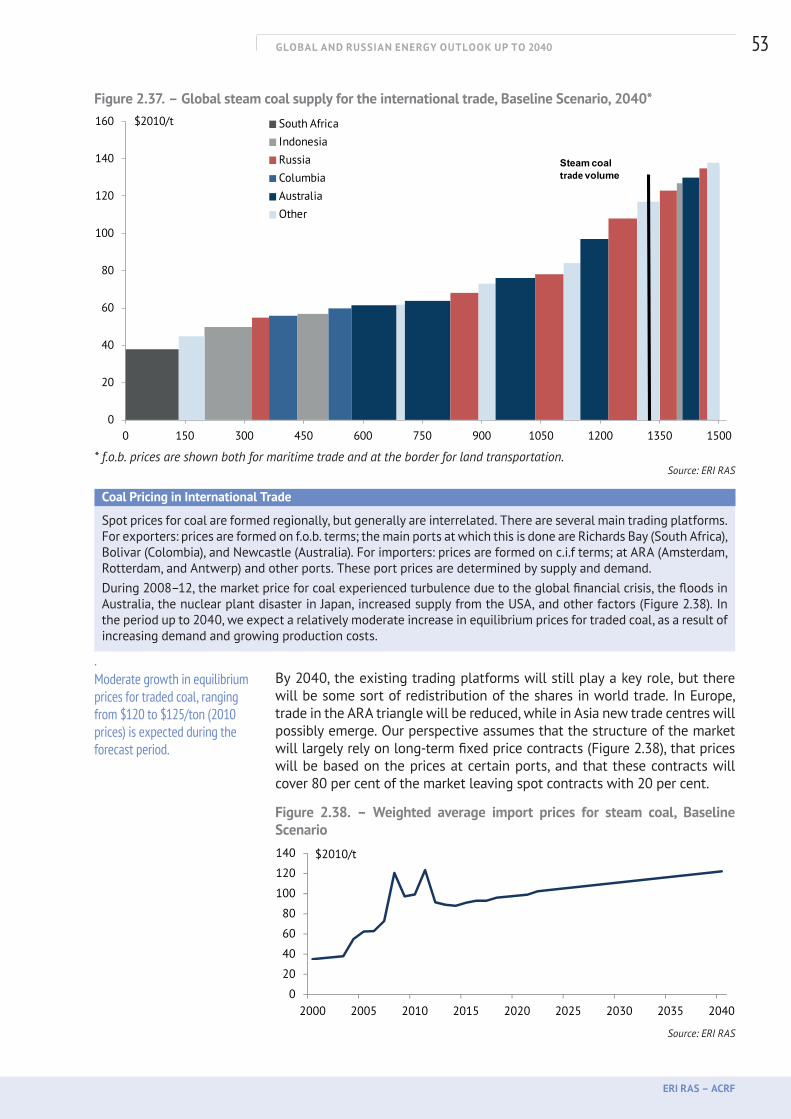
GLOBAL AND RUSSIAN ENERGY OUTLOOK UP TO 2040
ERI RAS – ACRF
53
Figure 2.37. – Global steam coal supply for the international trade, Baseline Scenario, 2040*
0
20
40
60
80
100
120
140
160
0 150 300 450 600 750 900 1050 1200 1350 1500
$2010/t South AfricaIndonesiaRussiaColumbiaAustraliaOther
Steam coal trade volume
* f.o.b. prices are shown both for maritime trade and at the border for land transportation.
Source: ERI RAS
Coal Pricing in International Trade
Spot prices for coal are formed regionally, but generally are interrelated. There are several main trading platforms. For exporters: prices are formed on f.o.b. terms; the main ports at which this is done are Richards Bay (South Africa), Bolivar (Colombia), and Newcastle (Australia). For importers: prices are formed on c.i.f terms; at ARA (Amsterdam, Rotterdam, and Antwerp) and other ports. These port prices are determined by supply and demand.During 2008–12, the market price for coal experienced turbulence due to the global financial crisis, the floods in Australia, the nuclear plant disaster in Japan, increased supply from the USA, and other factors (Figure 2.38). In the period up to 2040, we expect a relatively moderate increase in equilibrium prices for traded coal, as a result of increasing demand and growing production costs.
.By 2040, the existing trading platforms will still play a key role, but there will be some sort of redistribution of the shares in world trade. In Europe, trade in the ARA triangle will be reduced, while in Asia new trade centres will possibly emerge. Our perspective assumes that the structure of the market will largely rely on long-term fixed price contracts (Figure 2.38), that prices will be based on the prices at certain ports, and that these contracts will cover 80 per cent of the market leaving spot contracts with 20 per cent.
Figure 2.38. – Weighted average import prices for steam coal, Baseline Scenario
40
60
80
100
120
140 $2010/t
0
20
2000 2005 2010 2015 2020 2025 2030 2035 2040 Source: ERI RAS
Moderate growth in equilibrium prices for traded coal, ranging from $120 to $125/ton (2010 prices) is expected during the forecast period.
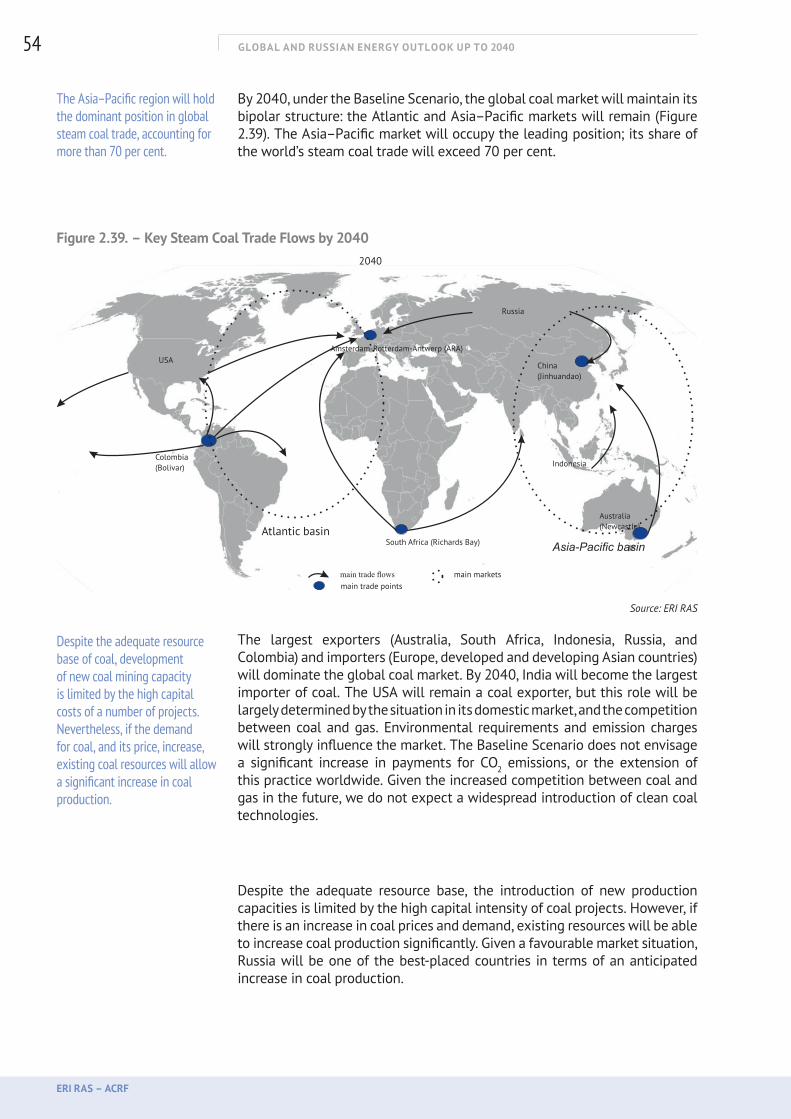
GLOBAL AND RUSSIAN ENERGY OUTLOOK UP TO 2040
ERI RAS – ACRF
54
By 2040, under the Baseline Scenario, the global coal market will maintain its bipolar structure: the Atlantic and Asia–Pacific markets will remain (Figure 2.39). The Asia–Pacific market will occupy the leading position; its share of the world’s steam coal trade will exceed 70 per cent.
Figure 2.39. – Key Steam Coal Trade Flows by 2040
Source: ERI RAS
The largest exporters (Australia, South Africa, Indonesia, Russia, and Colombia) and importers (Europe, developed and developing Asian countries) will dominate the global coal market. By 2040, India will become the largest importer of coal. The USA will remain a coal exporter, but this role will be largely determined by the situation in its domestic market, and the competition between coal and gas. Environmental requirements and emission charges will strongly influence the market. The Baseline Scenario does not envisage a significant increase in payments for CO2 emissions, or the extension of this practice worldwide. Given the increased competition between coal and gas in the future, we do not expect a widespread introduction of clean coal technologies.
Despite the adequate resource base, the introduction of new production capacities is limited by the high capital intensity of coal projects. However, if there is an increase in coal prices and demand, existing resources will be able to increase coal production significantly. Given a favourable market situation, Russia will be one of the best-placed countries in terms of an anticipated increase in coal production.
The Asia–Pacific region will hold the dominant position in global steam coal trade, accounting for more than 70 per cent.
Despite the adequate resource base of coal, development of new coal mining capacity is limited by the high capital costs of a number of projects. Nevertheless, if the demand for coal, and its price, increase, existing coal resources will allow a significant increase in coal production.
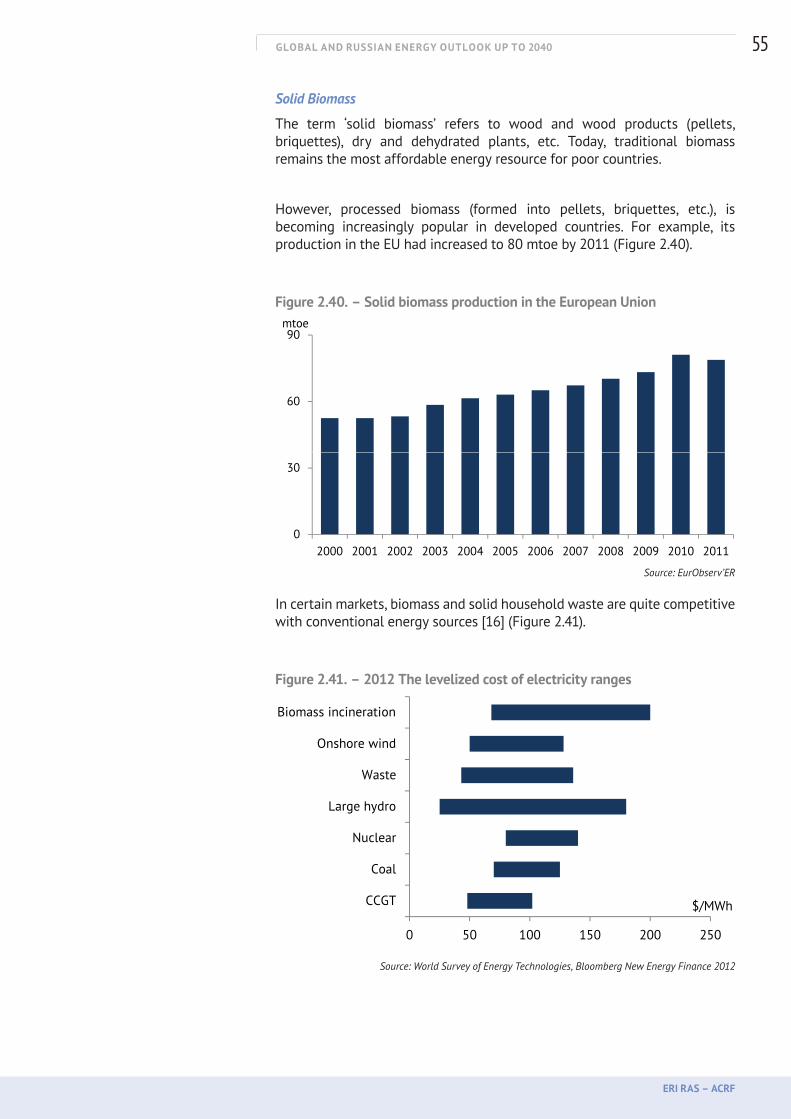
GLOBAL AND RUSSIAN ENERGY OUTLOOK UP TO 2040
ERI RAS – ACRF
55
Solid Biomass
The term ‘solid biomass’ refers to wood and wood products (pellets, briquettes), dry and dehydrated plants, etc. Today, traditional biomass remains the most affordable energy resource for poor countries.
However, processed biomass (formed into pellets, briquettes, etc.), is becoming increasingly popular in developed countries. For example, its production in the EU had increased to 80 mtoe by 2011 (Figure 2.40).
Figure 2.40. – Solid biomass production in the European Union
60
90mtoe
0
30
2000 2001 2002 2003 2004 2005 2006 2007 2008 2009 2010 2011 Source: EurObserv’ER
In certain markets, biomass and solid household waste are quite competitive with conventional energy sources [16] (Figure 2.41).
Figure 2.41. – 2012 The levelized cost of electricity ranges
Large hydro
Waste
Onshore wind
Biomass incineration
0 50 100 150 200 250
CCGT
Coal
Nuclear
$/MWh
Source: World Survey of Energy Technologies, Bloomberg New Energy Finance 2012
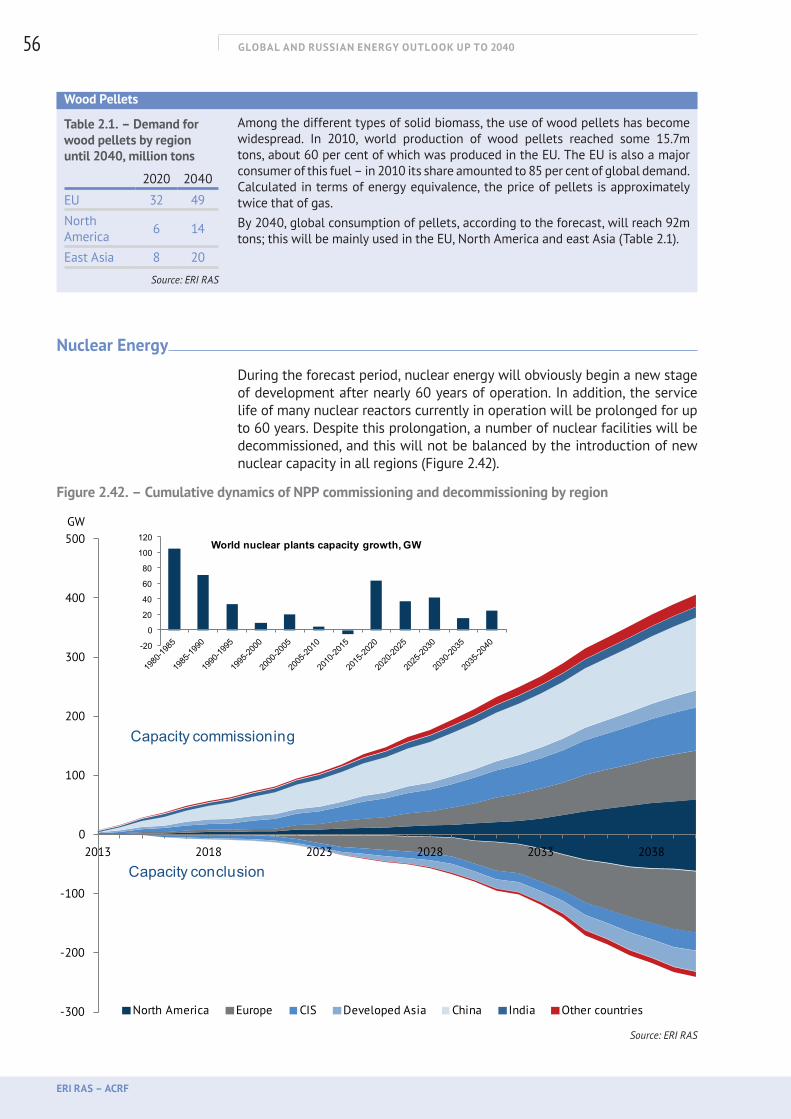
GLOBAL AND RUSSIAN ENERGY OUTLOOK UP TO 2040
ERI RAS – ACRF
56
Wood Pellets
Among the different types of solid biomass, the use of wood pellets has become widespread. In 2010, world production of wood pellets reached some 15.7m tons, about 60 per cent of which was produced in the EU. The EU is also a major consumer of this fuel – in 2010 its share amounted to 85 per cent of global demand. Calculated in terms of energy equivalence, the price of pellets is approximately twice that of gas.By 2040, global consumption of pellets, according to the forecast, will reach 92m tons; this will be mainly used in the EU, North America and east Asia (Table 2.1).
Nuclear Energy
During the forecast period, nuclear energy will obviously begin a new stage of development after nearly 60 years of operation. In addition, the service life of many nuclear reactors currently in operation will be prolonged for up to 60 years. Despite this prolongation, a number of nuclear facilities will be decommissioned, and this will not be balanced by the introduction of new nuclear capacity in all regions (Figure 2.42).
Figure 2.42. – Cumulative dynamics of NPP commissioning and decommissioning by region
-300
-200
-100
0
100
200
300
400
500
2013 2018 2023 2028 2033 2038
GW
North America Europe CIS Developed Asia China India Other countries
Capacity commissioning
Capacity conclusion
-20
0
20
40
60
80
100
120World nuclear plants capacity growth, GW
-300
-200
-100
0
100
200
300
400
500
2013 2018 2023 2028 2033 2038
GW
North America Europe CIS Developed Asia China India Other countries
Capacity commissioning
Capacity conclusion
-20
0
20
40
60
80
100
120World nuclear plants capacity growth, GW
Source: ERI RAS
Table 2.1. – Demand for wood pellets by region until 2040, million tons
2020 2040
EU 32 49
North America 6 14
East Asia 8 20
Source: ERI RAS
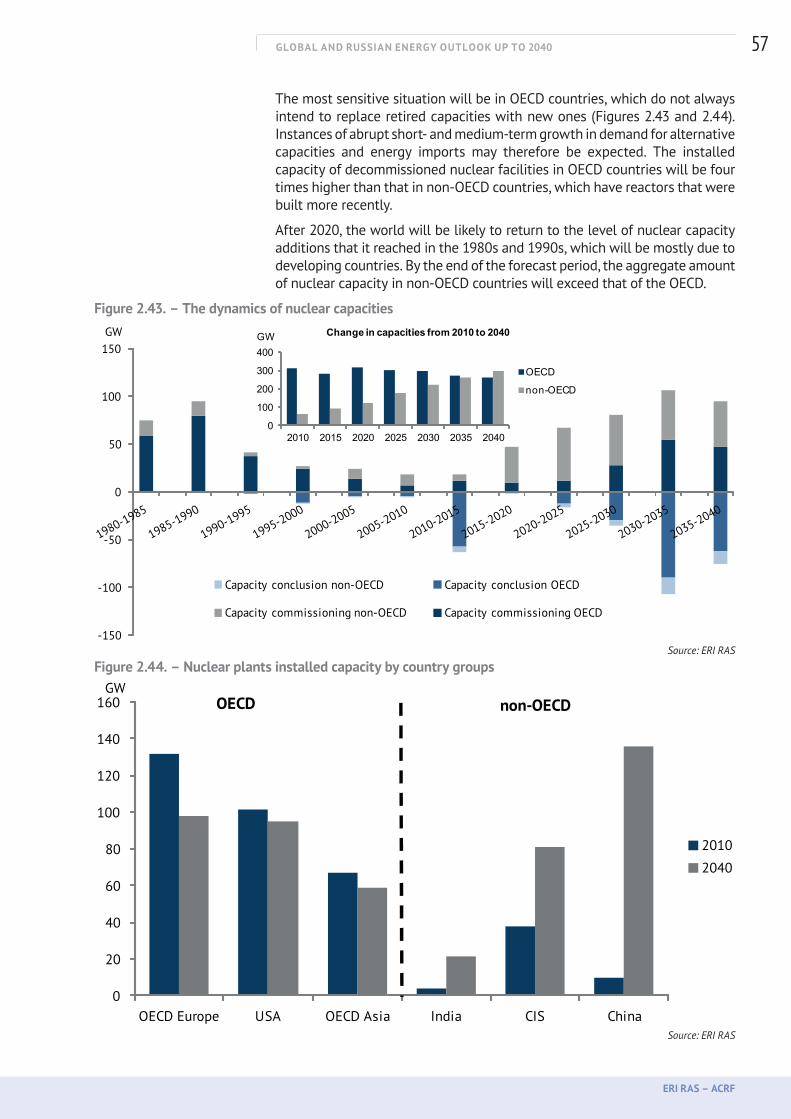
GLOBAL AND RUSSIAN ENERGY OUTLOOK UP TO 2040
ERI RAS – ACRF
57
The most sensitive situation will be in OECD countries, which do not always intend to replace retired capacities with new ones (Figures 2.43 and 2.44). Instances of abrupt short- and medium-term growth in demand for alternative capacities and energy imports may therefore be expected. The installed capacity of decommissioned nuclear facilities in OECD countries will be four times higher than that in non-OECD countries, which have reactors that were built more recently.
After 2020, the world will be likely to return to the level of nuclear capacity additions that it reached in the 1980s and 1990s, which will be mostly due to developing countries. By the end of the forecast period, the aggregate amount of nuclear capacity in non-OECD countries will exceed that of the OECD.
Figure 2.43. – The dynamics of nuclear capacities
-150
-100
-50
0
50
100
150GW
Capacity conclusion non-OECD Capacity conclusion OECD
Capacity commissioning non-OECD Capacity commissioning OECD
0
100
200
300
400
2010 2015 2020 2025 2030 2035 2040
GW Change in capacities from 2010 to 2040
OECD
non-OECD
Source: ERI RAS
Figure 2.44. – Nuclear plants installed capacity by country groups
0
20
40
60
80
100
120
140
160
OECD Europe USA OECD Asia India CIS China
GW
2010
2040
OECD non-OECD
Source: ERI RAS
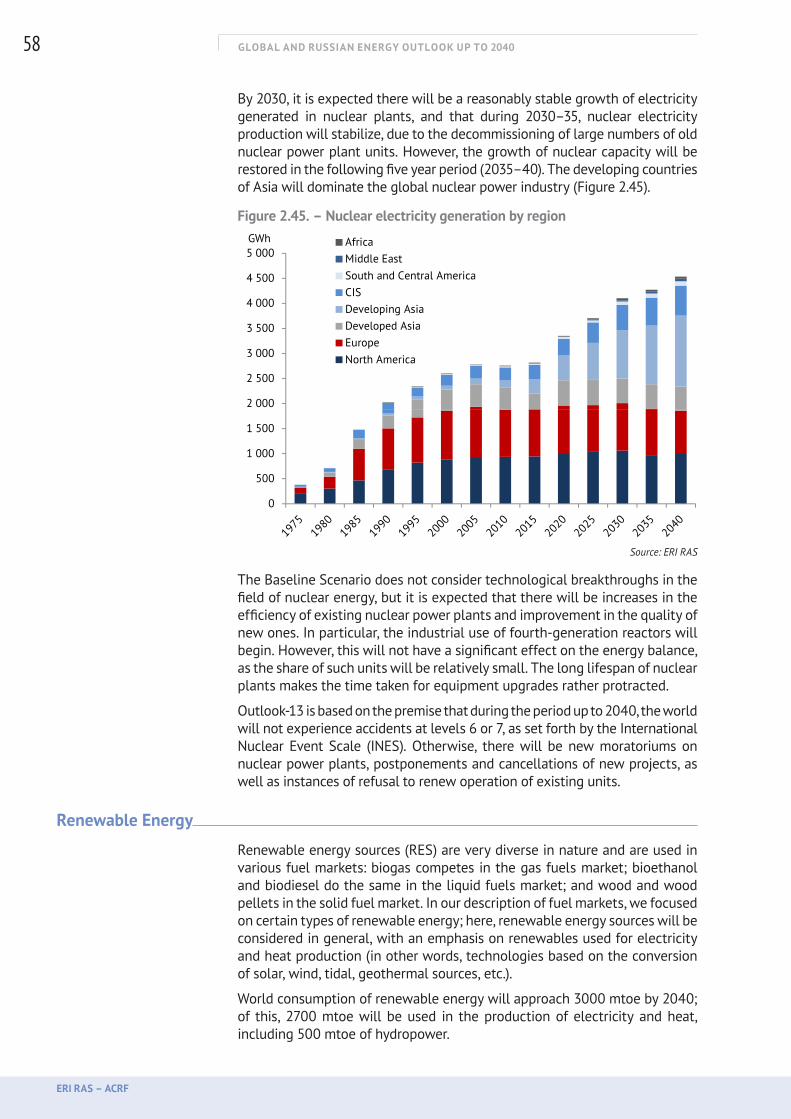
GLOBAL AND RUSSIAN ENERGY OUTLOOK UP TO 2040
ERI RAS – ACRF
58
By 2030, it is expected there will be a reasonably stable growth of electricity generated in nuclear plants, and that during 2030–35, nuclear electricity production will stabilize, due to the decommissioning of large numbers of old nuclear power plant units. However, the growth of nuclear capacity will be restored in the following five year period (2035–40). The developing countries of Asia will dominate the global nuclear power industry (Figure 2.45).
Figure 2.45. – Nuclear electricity generation by region
2 000
2 500
3 000
3 500
4 000
4 500
5 000GWh Africa
Middle EastSouth and Central AmericaCISDeveloping AsiaDeveloped AsiaEuropeNorth America
0
500
1 000
1 500
Source: ERI RAS
The Baseline Scenario does not consider technological breakthroughs in the field of nuclear energy, but it is expected that there will be increases in the efficiency of existing nuclear power plants and improvement in the quality of new ones. In particular, the industrial use of fourth-generation reactors will begin. However, this will not have a significant effect on the energy balance, as the share of such units will be relatively small. The long lifespan of nuclear plants makes the time taken for equipment upgrades rather protracted.
Outlook-13 is based on the premise that during the period up to 2040, the world will not experience accidents at levels 6 or 7, as set forth by the International Nuclear Event Scale (INES). Otherwise, there will be new moratoriums on nuclear power plants, postponements and cancellations of new projects, as well as instances of refusal to renew operation of existing units.
Renewable Energy
Renewable energy sources (RES) are very diverse in nature and are used in various fuel markets: biogas competes in the gas fuels market; bioethanol and biodiesel do the same in the liquid fuels market; and wood and wood pellets in the solid fuel market. In our description of fuel markets, we focused on certain types of renewable energy; here, renewable energy sources will be considered in general, with an emphasis on renewables used for electricity and heat production (in other words, technologies based on the conversion of solar, wind, tidal, geothermal sources, etc.).
World consumption of renewable energy will approach 3000 mtoe by 2040; of this, 2700 mtoe will be used in the production of electricity and heat, including 500 mtoe of hydropower.
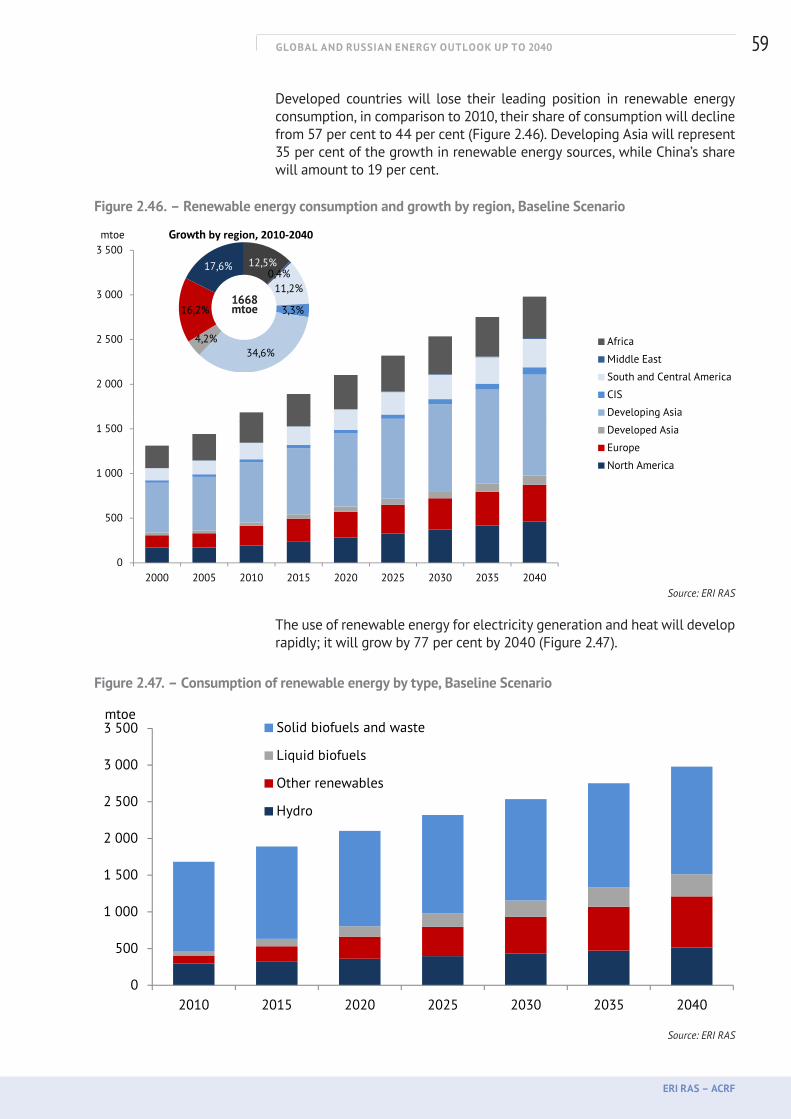
GLOBAL AND RUSSIAN ENERGY OUTLOOK UP TO 2040
ERI RAS – ACRF
59
Developed countries will lose their leading position in renewable energy consumption, in comparison to 2010, their share of consumption will decline from 57 per cent to 44 per cent (Figure 2.46). Developing Asia will represent 35 per cent of the growth in renewable energy sources, while China’s share will amount to 19 per cent.
Figure 2.46. – Renewable energy consumption and growth by region, Baseline Scenario
3 500mtoe Growth by region, 2010‐2040
3 000
3 500mtoe
12,5%0,4%
11,2%
17,6%
Growth by region, 2010‐2040
2 500
3 000
Africa
Middle East
12,5%0,4%
11,2%
3,3%
34,6%4,2%
16,2%
17,6%
1668
2 000
2 500 Africa
Middle East
South and Central America
CIS
34,6%4,2%
1 500
2 000South and Central America
CIS
Developing Asia
Developed Asia
Europe
1 000
1 500 Developed Asia
Europe
North America
0
500
1 000North America
02000 2005 2010 2015 2020 2025 2030 2035 2040
Source: ERI RAS
The use of renewable energy for electricity generation and heat will develop rapidly; it will grow by 77 per cent by 2040 (Figure 2.47).
Figure 2.47. – Consumption of renewable energy by type, Baseline Scenario
1 500
2 000
2 500
3 000
3 500mtoe
Solid biofuels and waste
Liquid biofuels
Other renewables
Hydro
0
500
1 000
2010 2015 2020 2025 2030 2035 2040 Source: ERI RAS
1668 mtoe
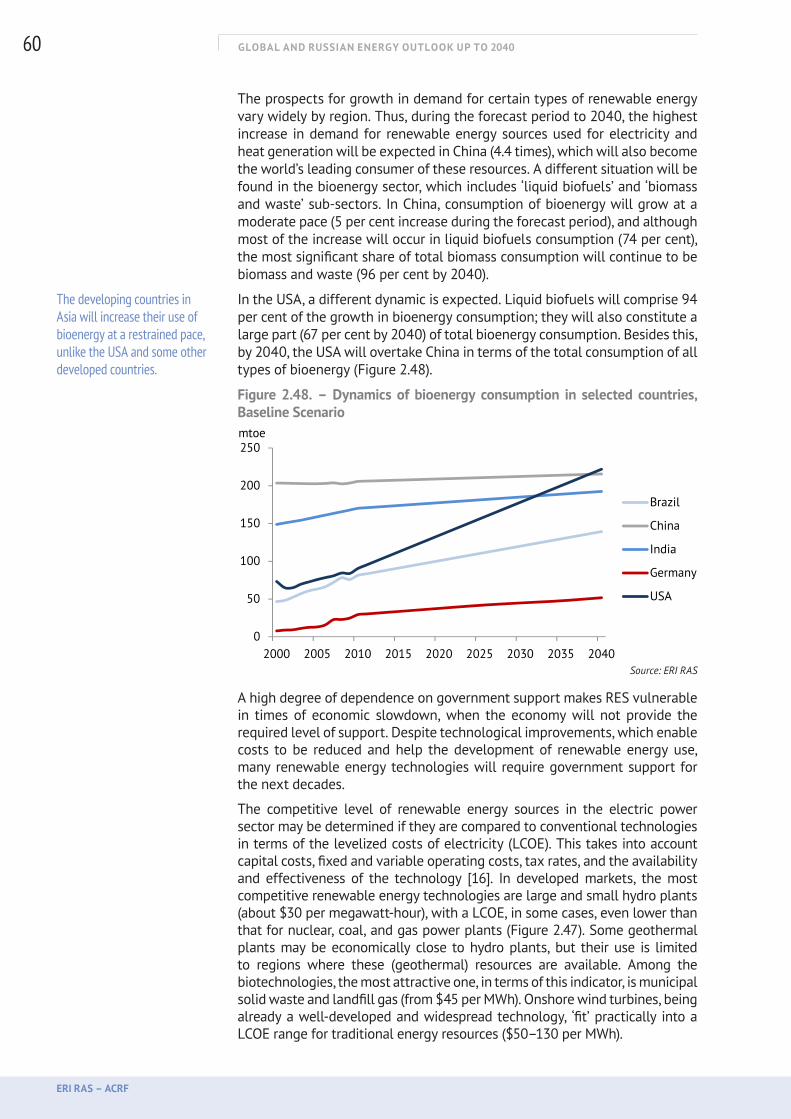
GLOBAL AND RUSSIAN ENERGY OUTLOOK UP TO 2040
ERI RAS – ACRF
60
The prospects for growth in demand for certain types of renewable energy vary widely by region. Thus, during the forecast period to 2040, the highest increase in demand for renewable energy sources used for electricity and heat generation will be expected in China (4.4 times), which will also become the world’s leading consumer of these resources. A different situation will be found in the bioenergy sector, which includes ‘liquid biofuels’ and ‘biomass and waste’ sub-sectors. In China, consumption of bioenergy will grow at a moderate pace (5 per cent increase during the forecast period), and although most of the increase will occur in liquid biofuels consumption (74 per cent), the most significant share of total biomass consumption will continue to be biomass and waste (96 per cent by 2040).
In the USA, a different dynamic is expected. Liquid biofuels will comprise 94 per cent of the growth in bioenergy consumption; they will also constitute a large part (67 per cent by 2040) of total bioenergy consumption. Besides this, by 2040, the USA will overtake China in terms of the total consumption of all types of bioenergy (Figure 2.48).
Figure 2.48. – Dynamics of bioenergy consumption in selected countries, Baseline Scenario
100
150
200
250mtoe
Brazil
China
India
0
50
2000 2005 2010 2015 2020 2025 2030 2035 2040
Germany
USA
Source: ERI RAS
A high degree of dependence on government support makes RES vulnerable in times of economic slowdown, when the economy will not provide the required level of support. Despite technological improvements, which enable costs to be reduced and help the development of renewable energy use, many renewable energy technologies will require government support for the next decades.
The competitive level of renewable energy sources in the electric power sector may be determined if they are compared to conventional technologies in terms of the levelized costs of electricity (LCOE). This takes into account capital costs, fixed and variable operating costs, tax rates, and the availability and effectiveness of the technology [16]. In developed markets, the most competitive renewable energy technologies are large and small hydro plants (about $30 per megawatt-hour), with a LCOE, in some cases, even lower than that for nuclear, coal, and gas power plants (Figure 2.47). Some geothermal plants may be economically close to hydro plants, but their use is limited to regions where these (geothermal) resources are available. Among the biotechnologies, the most attractive one, in terms of this indicator, is municipal solid waste and landfill gas (from $45 per MWh). Onshore wind turbines, being already a well-developed and widespread technology, ‘fit’ practically into a LCOE range for traditional energy resources ($50–130 per MWh).
The developing countries in Asia will increase their use of bioenergy at a restrained pace, unlike the USA and some other developed countries.
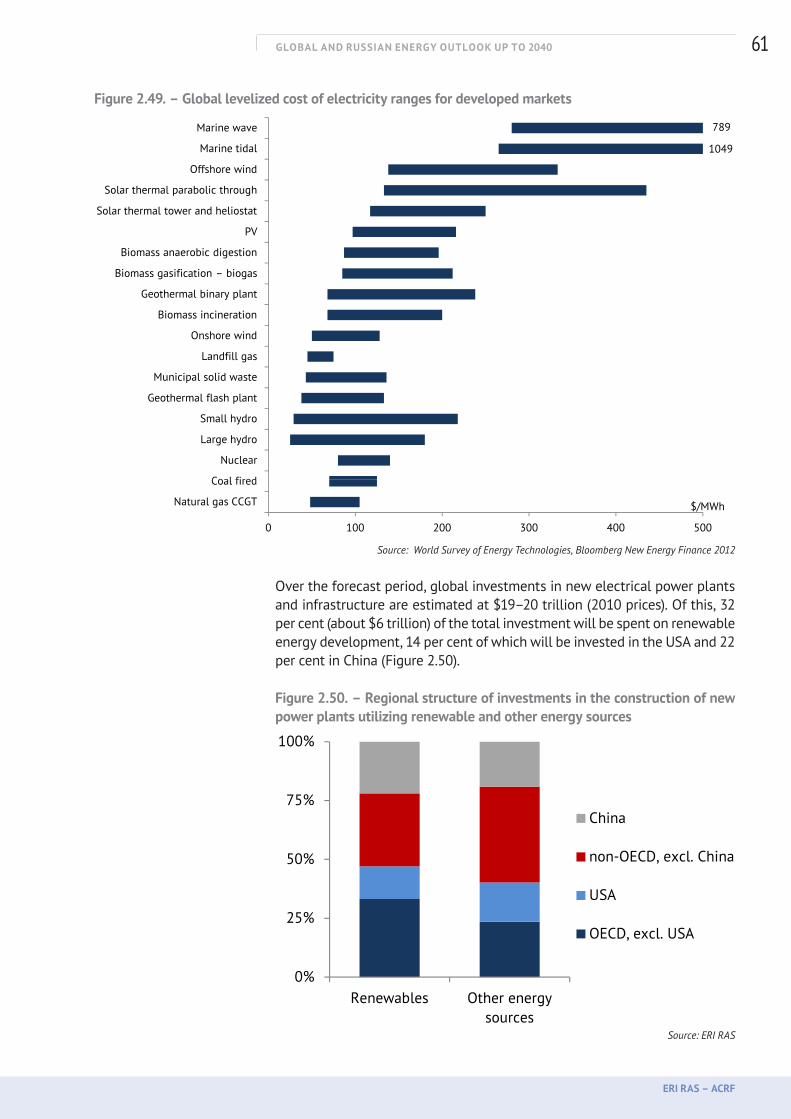
GLOBAL AND RUSSIAN ENERGY OUTLOOK UP TO 2040
ERI RAS – ACRF
61
Figure 2.49. – Global levelized cost of electricity ranges for developed markets
1049
789
Geothermal binary plant
Biomass gasification – biogas
Biomass anaerobic digestion
PV
Solar thermal tower and heliostat
Solar thermal parabolic through
Offshore wind
Marine tidal
Marine wave
Natural gas CCGT
Coal fired
Nuclear
Large hydro
Small hydro
Geothermal flash plant
Municipal solid waste
Landfill gas
Onshore wind
Biomass incineration
Geothermal binary plant
Biomass gasification – biogas
$/MWh
0 100 200 300 400 500
Natural gas CCGT
Coal fired
$/MWh
Source: World Survey of Energy Technologies, Bloomberg New Energy Finance 2012
Over the forecast period, global investments in new electrical power plants and infrastructure are estimated at $19–20 trillion (2010 prices). Of this, 32 per cent (about $6 trillion) of the total investment will be spent on renewable energy development, 14 per cent of which will be invested in the USA and 22 per cent in China (Figure 2.50).
Figure 2.50. – Regional structure of investments in the construction of new power plants utilizing renewable and other energy sources
50%
75%
100%
China
non-OECD, excl. China
USA
0%
25%
Renewables Other energy sources
USA
OECD, excl. USA
Source: ERI RAS
GLOBAL AND RUSSIAN ENERGY OUTLOOK UP TO 2040
ERI RAS – ACRF
62
The Impact of Technological Breakthroughs on Energy Markets
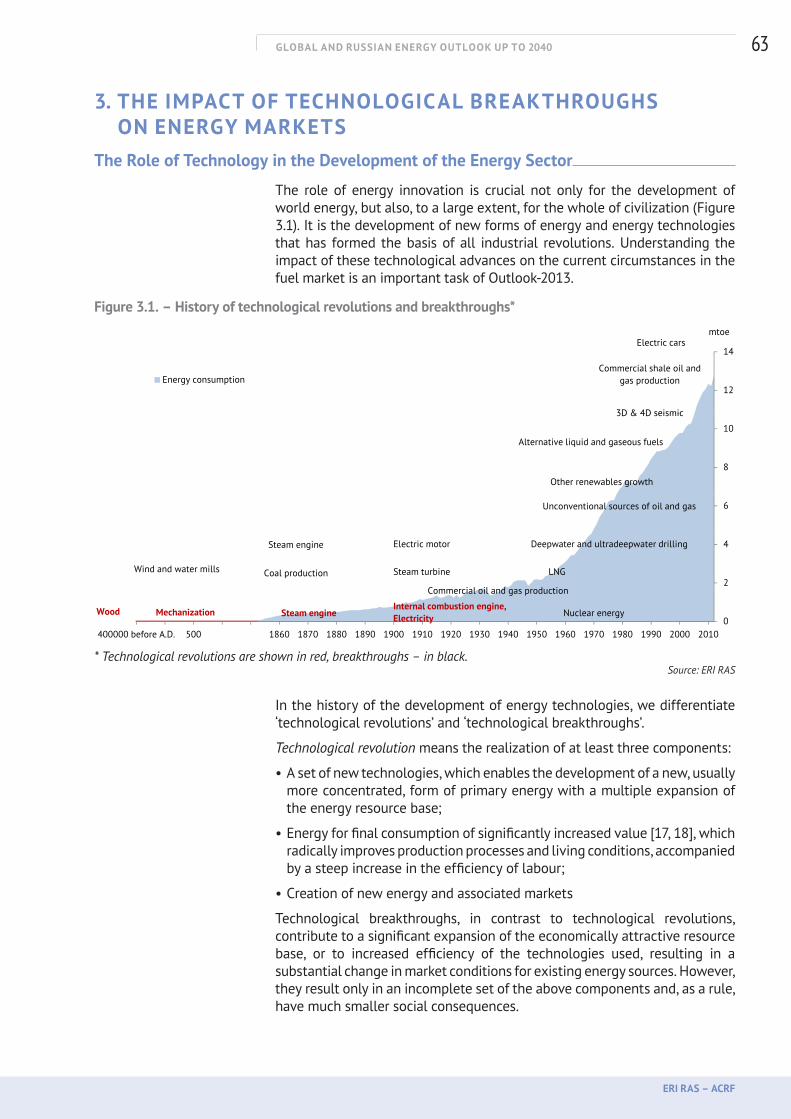
GLOBAL AND RUSSIAN ENERGY OUTLOOK UP TO 2040
ERI RAS – ACRF
63
3. THE IMPACT OF TECHNOLOGICAL BREAKTHROUGHS ON ENERGY MARKETS
The Role of Technology in the Development of the Energy Sector
The role of energy innovation is crucial not only for the development of world energy, but also, to a large extent, for the whole of civilization (Figure 3.1). It is the development of new forms of energy and energy technologies that has formed the basis of all industrial revolutions. Understanding the impact of these technological advances on the current circumstances in the fuel market is an important task of Outlook-2013.
Figure 3.1. – History of technological revolutions and breakthroughs*mtoe
Electric cars
12
14
mtoe
Energy consumption
Electric cars
Commercial shale oil and gas production
10
12Energy consumption
3D & 4D seismic
Commercial shale oil and gas production
Alternative liquid and gaseous fuels
8
10
3D & 4D seismic
Other renewables growth
Alternative liquid and gaseous fuels
6
8
Other renewables growth
Unconventional sources of oil and gas
4
6
Steam engine Electric motor Deepwater and ultradeepwater drilling
Unconventional sources of oil and gas
2
4
Wood Mechanization Steam engineInternal combustion engine, Electricity
Wind and water mills LNG
Commercial oil and gas production
Steam engine
Steam turbine
Nuclear energy
Electric motor
Coal production
Deepwater and ultradeepwater drilling
0400000 before A.D. 500 1860 1870 1880 1890 1900 1910 1920 1930 1940 1950 1960 1970 1980 1990 2000 2010
Wood Mechanization Steam engineInternal combustion engine, Electricity
Commercial oil and gas production
Nuclear energy
400000 before A.D. 500 1860 1870 1880 1890 1900 1910 1920 1930 1940 1950 1960 1970 1980 1990 2000 2010
* Technological revolutions are shown in red, breakthroughs – in black.Source: ERI RAS
In the history of the development of energy technologies, we differentiate ‘technological revolutions’ and ‘technological breakthroughs’.
Technological revolution means the realization of at least three components:
• A set of new technologies, which enables the development of a new, usually more concentrated, form of primary energy with a multiple expansion of the energy resource base;
• Energy for final consumption of significantly increased value [17, 18], which radically improves production processes and living conditions, accompanied by a steep increase in the efficiency of labour;
• Creation of new energy and associated markets
Technological breakthroughs, in contrast to technological revolutions, contribute to a significant expansion of the economically attractive resource base, or to increased efficiency of the technologies used, resulting in a substantial change in market conditions for existing energy sources. However, they result only in an incomplete set of the above components and, as a rule, have much smaller social consequences.
GLOBAL AND RUSSIAN ENERGY OUTLOOK UP TO 2040
ERI RAS – ACRF
64
Technological Revolutions and Breakthroughs in the 20th Century
For a period of about 30 years around the turn of the 19th century, two truly revolutionary technologies were created which are now at the heart of the world’s need for energy – the internal combustion engine (ICE) and the electrical power industry. The invention of the ICE marked the sunset of the coal and steam century, and gave both a powerful impetus to the era of oil and a thousand-fold increase in decentralized (including individual) mobile energy. Large-scale generation of electricity by thermal and hydro power plants, long-distance power transmission, and electrification of all spheres of life created the energy fundamentals not only for industrial but also for post-industrial society. Electric machines and alternating current transformers revolutionized the structure of stationary energy production: powerful centralized energy systems, using every single type of primary energy resource, were created.Later on, up to the end of the 20th century, energy technologies continued to improve, on the basis of a series of technological breakthroughs. Gas turbines, jets, and rocket engines appeared in addition to the ICE. The electrical power industry increased in size many times more than the parameters and capacities of facilities and networks, and made possible the creation of transcontinental systems. There was an explosive growth of electrical technologies – ranging from electrolysis, computing technology, telecommunications, and control systems to efficient lighting. Gas turbines gave new impetus to the development of aviation and formed the demand for jet fuel. In many instances, due to the gas turbine, modern gas transportation systems were created, together with the gas industry as such. The development of high-power gas turbines, and their use in stationary power facilities, enabled a switch from the steam cycle to the more efficient gas–steam cycle. The efficiency of the best types of combined-cycle gas turbines reached 60 per cent, which is close to the maximum values for the heat engine.It became possible to increase the hydrocarbon resource base, on account of technical advances in exploration and production of liquid and gaseous hydrocarbons and coals: 3D and 4D geological surveys and numerical modelling by supercomputers; methods of impacting, physically and chemically, on surrounding rocks and extracted fluid, which change their structure and properties; technical means of hydrocarbon extraction in extreme conditions (deep sea, deep water shelf, drift ice, etc.); robotic systems with remote control for underground mining from thin coal layers; and other techniques.In the second half of the 20th century, the world waited for another revolution in the development of nuclear energy, which became a ‘by product’ of nuclear defence projects. The energy intensity of nuclear fuel is three times higher than that of any organic fuel, but it is still used very ineffectively – in the steam turbine cycle with low steam parameters, efficiency levels of only 32–33 per cent are attained. Thus, nuclear power has failed to fulfil the second criterion of a technological revolution. Moreover, the technical difficulty of providing guaranteed nuclear safety, unresolved problems with disposal of radioactive waste, and the incomplete nature of the nuclear fuel cycle have made it impossible for nuclear generation to occupy a dominant position in the energy sector, as was predicted in the 1970s.
In the next 30 years we do not expect a new technological revolution in the energy sector (for example, the development of cheap nuclear fusion, or of harnessing energy from gravity), but there may be major technological breakthroughs. They are already evident in the development of unconventional oil and gas resources and the emergence of new types of motor fuel, which are capable of satisfying growing demand and of substantially curbing the growth of hydrocarbons prices. Such an expansion of the resource base and improvement of oil and gas production will lead to radical changes in the situation in fuel markets.
New electrical technologies, which are less certain but potentially more significant, are becoming more widespread: storage units (accumulator batteries and super capacitors) and fuel cells (which utilize the direct conversion of chemical energy in hydrogen compounds to electrical energy). They will give an impetus to the mass usage of electric power in mobile applications, and substantially improve the circumstances for using renewable energy resources. This will shift the boundaries between centralized and decentralized energy supply: individual vehicles will be refuelled from the
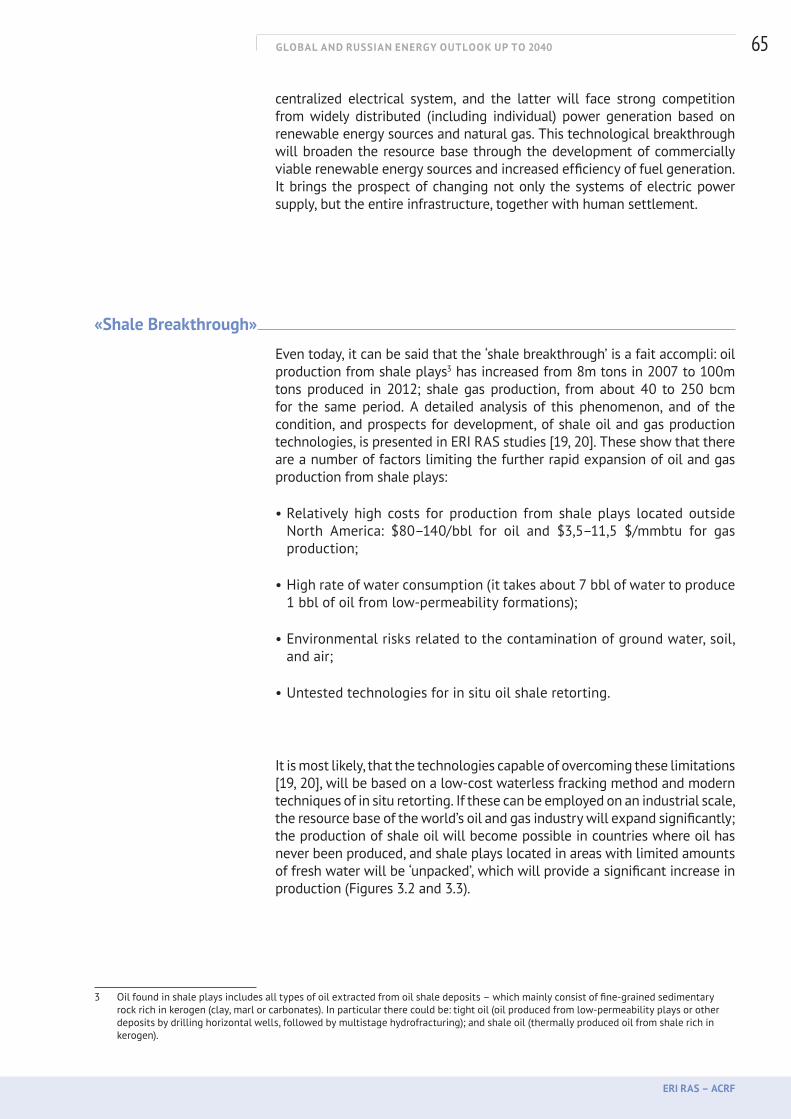
GLOBAL AND RUSSIAN ENERGY OUTLOOK UP TO 2040
ERI RAS – ACRF
65
centralized electrical system, and the latter will face strong competition from widely distributed (including individual) power generation based on renewable energy sources and natural gas. This technological breakthrough will broaden the resource base through the development of commercially viable renewable energy sources and increased efficiency of fuel generation. It brings the prospect of changing not only the systems of electric power supply, but the entire infrastructure, together with human settlement.
«Shale Breakthrough»
Even today, it can be said that the ‘shale breakthrough’ is a fait accompli: oil production from shale plays3 has increased from 8m tons in 2007 to 100m tons produced in 2012; shale gas production, from about 40 to 250 bcm for the same period. A detailed analysis of this phenomenon, and of the condition, and prospects for development, of shale oil and gas production technologies, is presented in ERI RAS studies [19, 20]. These show that there are a number of factors limiting the further rapid expansion of oil and gas production from shale plays:
• Relatively high costs for production from shale plays located outside North America: $80–140/bbl for oil and $3,5–11,5 $/mmbtu for gas production;
• High rate of water consumption (it takes about 7 bbl of water to produce 1 bbl of oil from low-permeability formations);
• Environmental risks related to the contamination of ground water, soil, and air;
• Untested technologies for in situ oil shale retorting.
It is most likely, that the technologies capable of overcoming these limitations [19, 20], will be based on a low-cost waterless fracking method and modern techniques of in situ retorting. If these can be employed on an industrial scale, the resource base of the world’s oil and gas industry will expand significantly; the production of shale oil will become possible in countries where oil has never been produced, and shale plays located in areas with limited amounts of fresh water will be ‘unpacked’, which will provide a significant increase in production (Figures 3.2 and 3.3).
3 Oil found in shale plays includes all types of oil extracted from oil shale deposits – which mainly consist of fine-grained sedimentary rock rich in kerogen (clay, marl or carbonates). In particular there could be: tight oil (oil produced from low-permeability plays or other deposits by drilling horizontal wells, followed by multistage hydrofracturing); and shale oil (thermally produced oil from shale rich in kerogen).
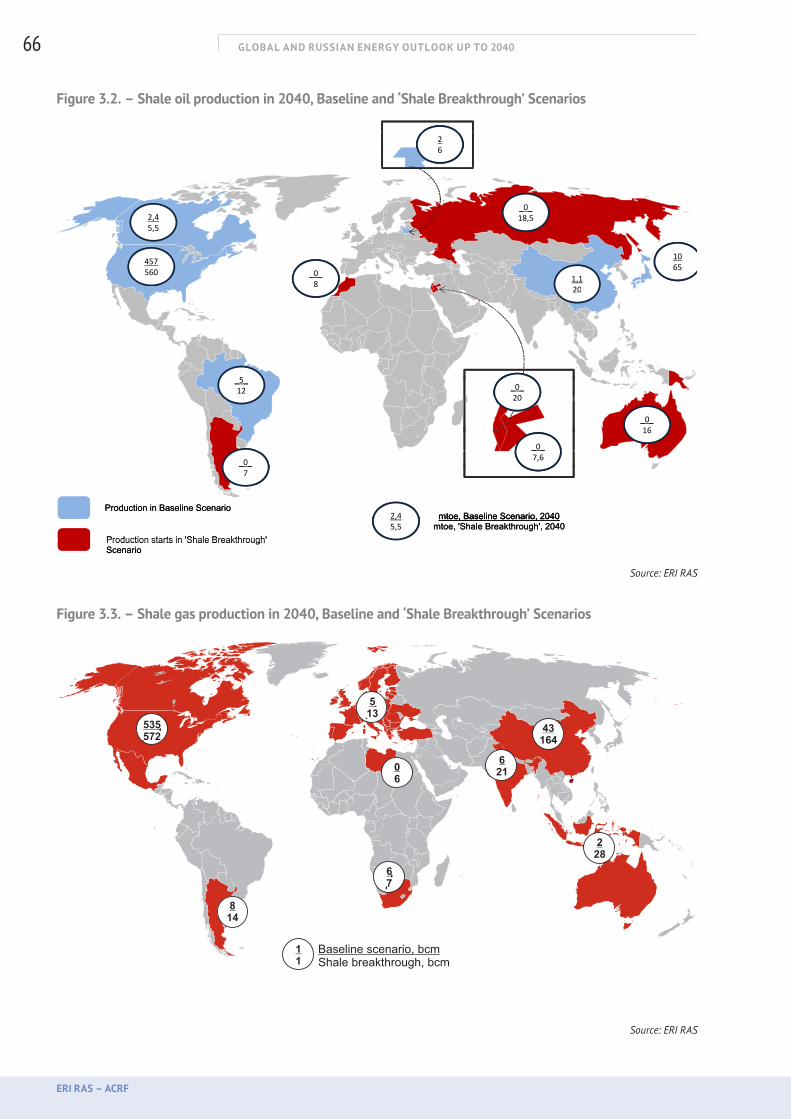
GLOBAL AND RUSSIAN ENERGY OUTLOOK UP TO 2040
ERI RAS – ACRF
66
Figure 3.2. – Shale oil production in 2040, Baseline and ‘Shale Breakthrough’ Scenarios
26266
02,4
_0_18,52,4
5,5
_0_18,5
5,5
457 10457560
1065
0457560
1,120
1065
_0_8
5601,120
_0_8 208
_5_12 0_5_12 _0_
20
_5_12
_0_16
_0_20
_0_16_0_16
_0_
16
_0_7,6_0_
7
7,6_0_7
_ _7
Production in Baseline Scenario 2 4 mtoe Baseline Scenario 2040
Production in Baseline Scenario 2,45,5
mtoe, Baseline Scenario, 2040mtoe, 'Shale Breakthrough', 2040
Production in Baseline Scenario
Production starts in 'Shale Breakthrough'
2,45,5
mtoe, Baseline Scenario, 2040mtoe, 'Shale Breakthrough', 2040
Production starts in 'Shale Breakthrough' Scenario
2,45,5
mtoe, Baseline Scenario, 2040mtoe, 'Shale Breakthrough', 2040
Production starts in Shale Breakthrough Scenario
Source: ERI RAS
Figure 3.3. – Shale gas production in 2040, Baseline and ‘Shale Breakthrough’ Scenarios
Source: ERI RAS
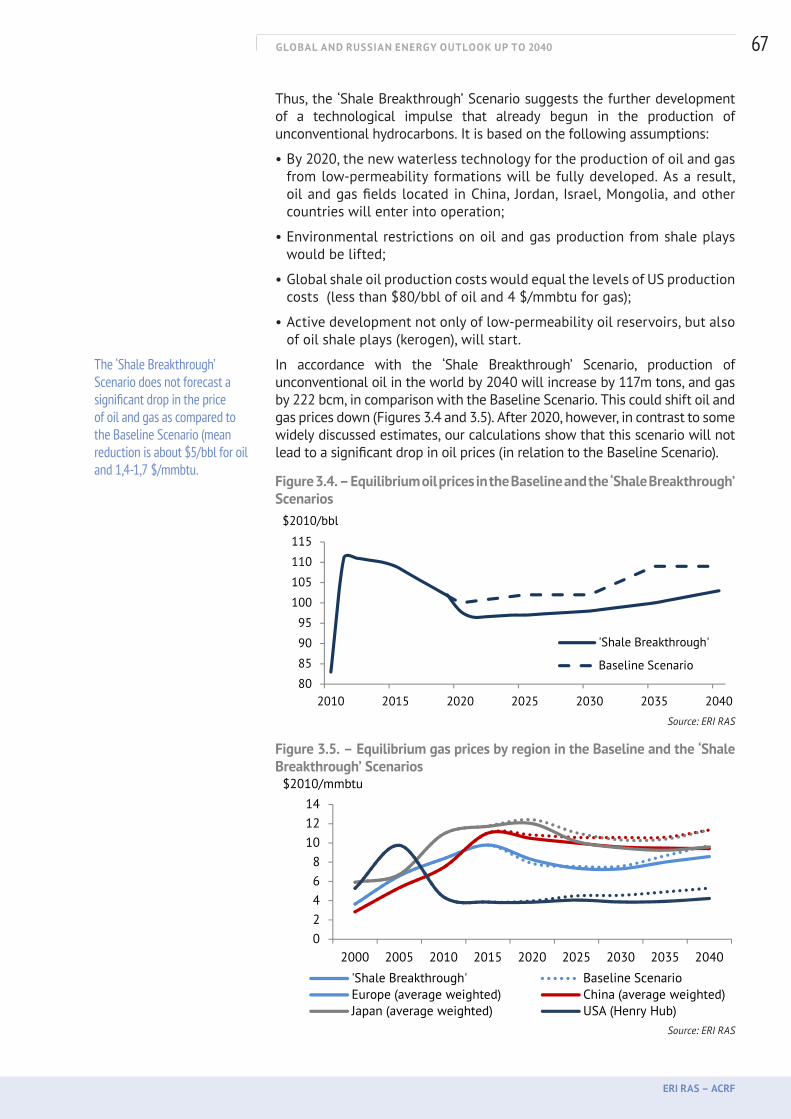
GLOBAL AND RUSSIAN ENERGY OUTLOOK UP TO 2040
ERI RAS – ACRF
67
Thus, the ‘Shale Breakthrough’ Scenario suggests the further development of a technological impulse that already begun in the production of unconventional hydrocarbons. It is based on the following assumptions:
• By 2020, the new waterless technology for the production of oil and gas from low-permeability formations will be fully developed. As a result, oil and gas fields located in China, Jordan, Israel, Mongolia, and other countries will enter into operation;
• Environmental restrictions on oil and gas production from shale plays would be lifted;
• Global shale oil production costs would equal the levels of US production costs (less than $80/bbl of oil and 4 $/mmbtu for gas);
• Active development not only of low-permeability oil reservoirs, but also of oil shale plays (kerogen), will start.
In accordance with the ‘Shale Breakthrough’ Scenario, production of unconventional oil in the world by 2040 will increase by 117m tons, and gas by 222 bcm, in comparison with the Baseline Scenario. This could shift oil and gas prices down (Figures 3.4 and 3.5). After 2020, however, in contrast to some widely discussed estimates, our calculations show that this scenario will not lead to a significant drop in oil prices (in relation to the Baseline Scenario).
Figure 3.4. – Equilibrium oil prices in the Baseline and the ‘Shale Breakthrough’ Scenarios
80
85
90
95
100
105
110
115
$2010/bbl
'Shale Breakthrough'
Baseline Scenario
2010 2015 2020 2025 2030 2035 2040
Source: ERI RAS
Figure 3.5. – Equilibrium gas prices by region in the Baseline and the ‘Shale Breakthrough’ Scenarios
02468
101214
2000 2005 2010 2015 2020 2025 2030 2035 2040
$2010/mmbtu
'Shale Breakthrough' Baseline ScenarioEurope (average weighted) China (average weighted)Japan (average weighted) USA (Henry Hub)
Source: ERI RAS
The ‘Shale Breakthrough’ Scenario does not forecast a significant drop in the price of oil and gas as compared to the Baseline Scenario (mean reduction is about $5/bbl for oil and 1,4-1,7 $/mmbtu.
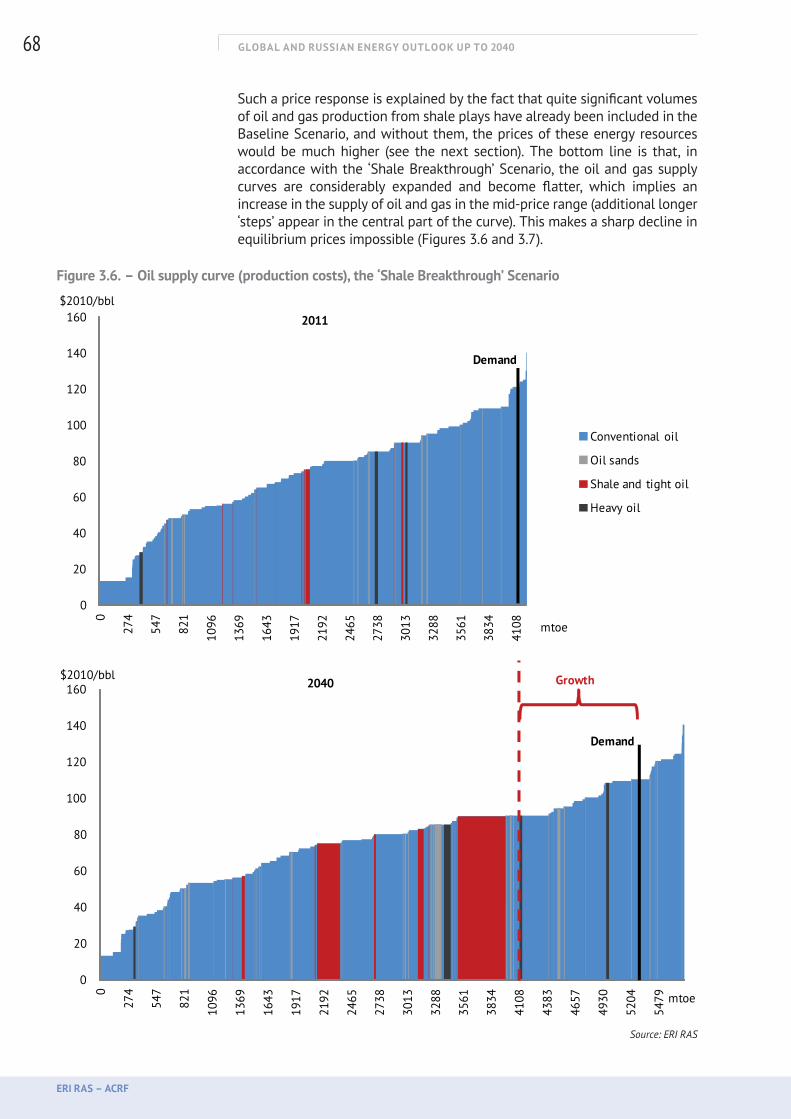
GLOBAL AND RUSSIAN ENERGY OUTLOOK UP TO 2040
ERI RAS – ACRF
68
Such a price response is explained by the fact that quite significant volumes of oil and gas production from shale plays have already been included in the Baseline Scenario, and without them, the prices of these energy resources would be much higher (see the next section). The bottom line is that, in accordance with the ‘Shale Breakthrough’ Scenario, the oil and gas supply curves are considerably expanded and become flatter, which implies an increase in the supply of oil and gas in the mid-price range (additional longer ‘steps’ appear in the central part of the curve). This makes a sharp decline in equilibrium prices impossible (Figures 3.6 and 3.7).
Figure 3.6. – Oil supply curve (production costs), the ‘Shale Breakthrough’ Scenario
0
20
40
60
80
100
120
140
160
0
274
547
821
1096
1369
1643
1917
2192
2465
2738
3013
3288
3561
3834
4108
$2010/bbl
mtoe
Conventional oil
Oil sands
Shale and tight oil
Heavy oil
Demand
0
20
40
60
80
100
120
140
160
0
274
547
821
1096
1369
1643
1917
2192
2465
2738
3013
3288
3561
3834
4108
4383
4657
4930
5204
5479
$2010/bbl
mtoe
Demand
Growth
2011
2040
Source: ERI RAS
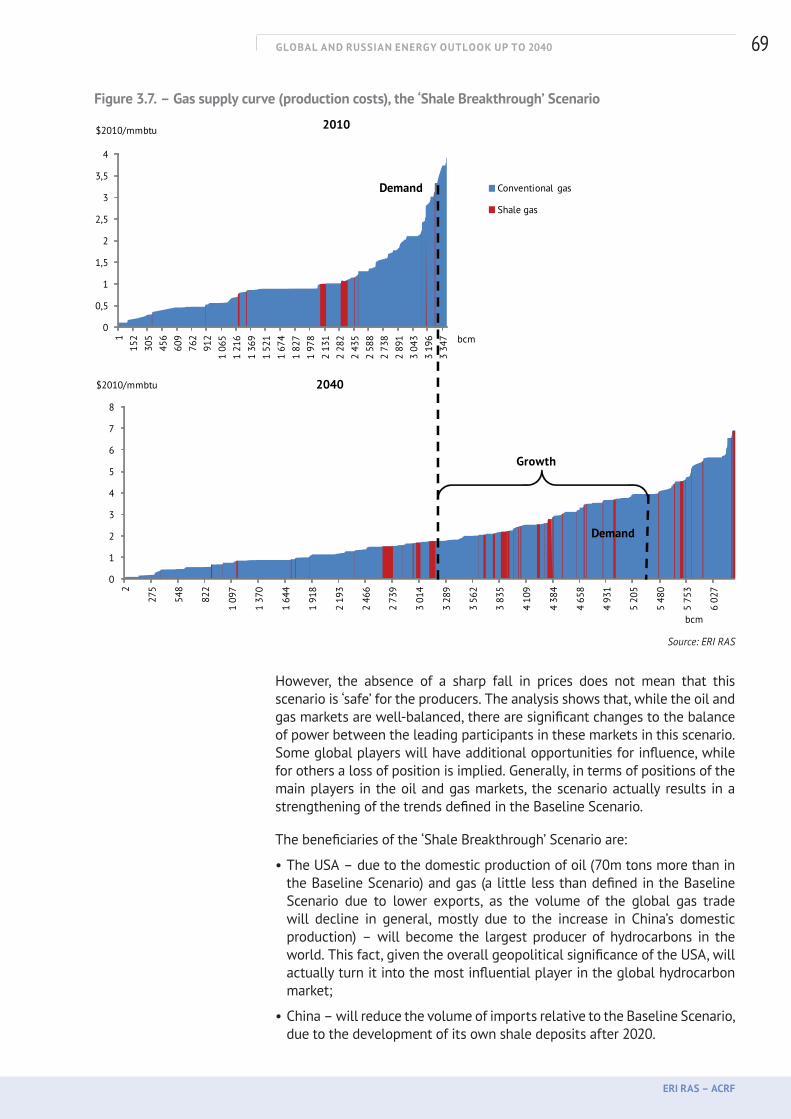
GLOBAL AND RUSSIAN ENERGY OUTLOOK UP TO 2040
ERI RAS – ACRF
69
Figure 3.7. – Gas supply curve (production costs), the ‘Shale Breakthrough’ Scenario
0
1
2
3
4
5
6
7
8
2
275
548
822
1 09
7
1 37
0
1 64
4
1 91
8
2 19
3
2 46
6
2 73
9
3 01
4
3 28
9
3 56
2
3 83
5
4 10
9
4 38
4
4 65
8
4 93
1
5 20
5
5 48
0
5 75
3
6 02
7
$2010/mmbtu
bcm
2040
0
0,5
1
1,5
2
2,5
3
3,5
4
115
230
545
660
976
291
21
065
1 21
61
369
1 52
11
674
1 82
71
978
2 13
12
282
2 43
52
588
2 73
82
891
3 04
33
196
3 34
7
$2010/mmbtu
bcm
2010
Conventional gas
Shale gas
Demand
Demand
Growth
Source: ERI RAS
However, the absence of a sharp fall in prices does not mean that this scenario is ‘safe’ for the producers. The analysis shows that, while the oil and gas markets are well-balanced, there are significant changes to the balance of power between the leading participants in these markets in this scenario. Some global players will have additional opportunities for influence, while for others a loss of position is implied. Generally, in terms of positions of the main players in the oil and gas markets, the scenario actually results in a strengthening of the trends defined in the Baseline Scenario.
The beneficiaries of the ‘Shale Breakthrough’ Scenario are:
• The USA – due to the domestic production of oil (70m tons more than in the Baseline Scenario) and gas (a little less than defined in the Baseline Scenario due to lower exports, as the volume of the global gas trade will decline in general, mostly due to the increase in China’s domestic production) – will become the largest producer of hydrocarbons in the world. This fact, given the overall geopolitical significance of the USA, will actually turn it into the most influential player in the global hydrocarbon market;
• China – will reduce the volume of imports relative to the Baseline Scenario, due to the development of its own shale deposits after 2020.

GLOBAL AND RUSSIAN ENERGY OUTLOOK UP TO 2040
ERI RAS – ACRF
70
The losers in this scenario are:
• The developed European countries – at lower levels of oil prices (compared to the Baseline Scenario) even greater volumes of European oil will be displaced from the market; North Sea shelf projects will not be put into operation; the attractiveness of renewable energy will be reduced in relation to hydrocarbon fuels; and energy dependence on suppliers will grow;
• OPEC countries will almost inevitably face a decline in production and a reduction of their market share in 2025–35. The ‘shale breakthrough’ will apparently force the cartel to tighten control over production costs, reduce the tax burden on the industry (which may destabilize the economic and political situation in some countries), and create a shortage of supply by introducing quotas. However, even in the ‘Extreme’ Scenario, coherence of actions by OPEC members can hardly be expected, because of the difference in oil price levels which these countries need, and the potential destabilization of a number of ‘oil-dependent’ economies. This means that the ‘shale breakthrough’ is likely to weaken OPEC further. By the end of the forecast period, OPEC’s market niche will stabilize somewhat, but if the ‘Shale Breakthrough’ Scenario is realized, it would practically deprive the cartel of any possibility of influencing the world price of oil in the middle of the forecast period;
• The CIS countries and Russia – the CIS would be forced to cut a substantial part of its oil exports in this scenario. Russia’s production by 2020 would be 50m tons lower than in the Baseline Scenario, and its exports would decline by the same amount, due to its narrowed niche in the Asian market (Figure 3.8). Russian gas exports in this scenario would be 70 bcm lower than in the Baseline Scenario (Figure 3.9). Results show that during the forecast period the CIS would be more sensitive than any other country to this scenario.
Figure 3.8. – Changes of oil net export and import volumes in 2040 relative to 2010, Baseline and ‘Shale Breakthrough’ Scenarios
-250
-200
-150
-100
-50
0
50
100
150
South and Central
America
CIS Middle East North America
mtoeExports
Baseline Scenario
'Shale Breakthrough'
-100
0
100
200
300
400
Europe Asia
mtoe ImportsBaseline Scenario
'Shale Breakthrough'
Source: ERI RAS
The ‘Shale Breakthrough’ Scenario significantly alters the power balance of key players in the global hydrocarbon market, and the CIS turns out to be the most vulnerable.
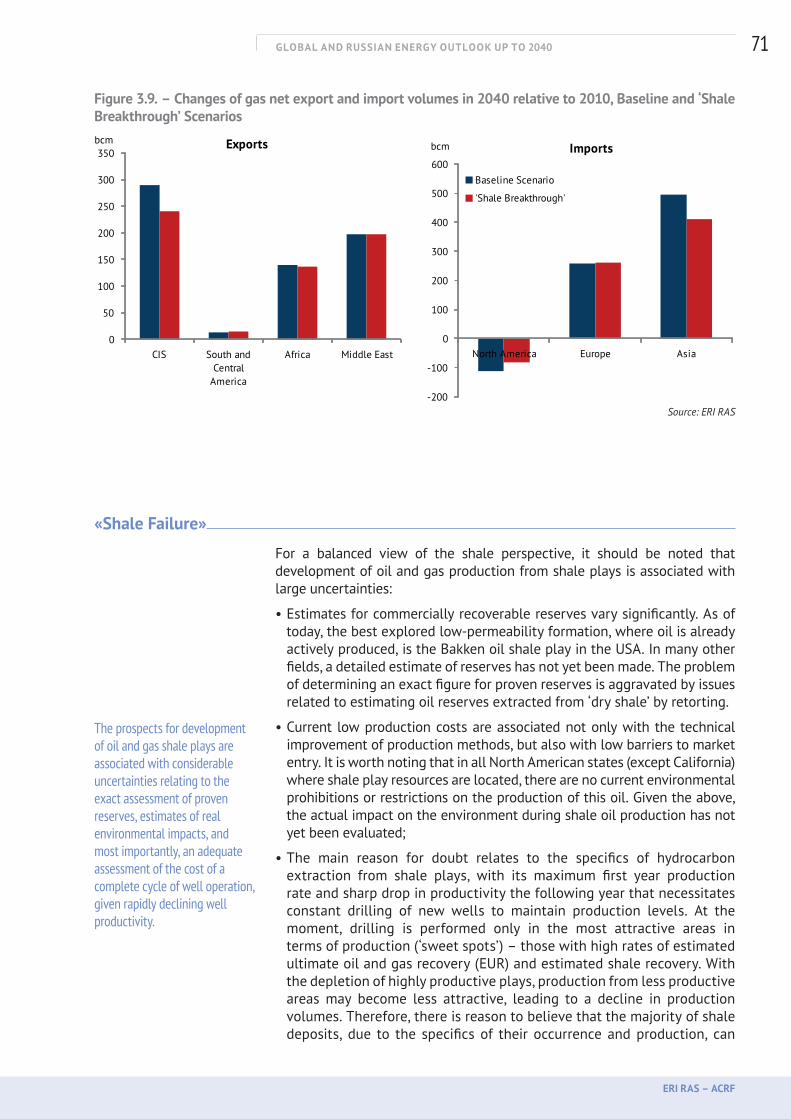
GLOBAL AND RUSSIAN ENERGY OUTLOOK UP TO 2040
ERI RAS – ACRF
71
Figure 3.9. – Changes of gas net export and import volumes in 2040 relative to 2010, Baseline and ‘Shale Breakthrough’ Scenarios
0
50
100
150
200
250
300
350
CIS South and Central
America
Africa Middle East
bcm Exports Baseline Scenario
'Shale Breakthrough'
-200
-100
0
100
200
300
400
500
600
North America Europe Asia
bcm Imports
Baseline Scenario
'Shale Breakthrough'
Source: ERI RAS
«Shale Failure»
For a balanced view of the shale perspective, it should be noted that development of oil and gas production from shale plays is associated with large uncertainties:
• Estimates for commercially recoverable reserves vary significantly. As of today, the best explored low-permeability formation, where oil is already actively produced, is the Bakken oil shale play in the USA. In many other fields, a detailed estimate of reserves has not yet been made. The problem of determining an exact figure for proven reserves is aggravated by issues related to estimating oil reserves extracted from ‘dry shale’ by retorting.
• Current low production costs are associated not only with the technical improvement of production methods, but also with low barriers to market entry. It is worth noting that in all North American states (except California) where shale play resources are located, there are no current environmental prohibitions or restrictions on the production of this oil. Given the above, the actual impact on the environment during shale oil production has not yet been evaluated;
• The main reason for doubt relates to the specifics of hydrocarbon extraction from shale plays, with its maximum first year production rate and sharp drop in productivity the following year that necessitates constant drilling of new wells to maintain production levels. At the moment, drilling is performed only in the most attractive areas in terms of production (‘sweet spots’) – those with high rates of estimated ultimate oil and gas recovery (EUR) and estimated shale recovery. With the depletion of highly productive plays, production from less productive areas may become less attractive, leading to a decline in production volumes. Therefore, there is reason to believe that the majority of shale deposits, due to the specifics of their occurrence and production, can
The prospects for development of oil and gas shale plays are associated with considerable uncertainties relating to the exact assessment of proven reserves, estimates of real environmental impacts, and most importantly, an adequate assessment of the cost of a complete cycle of well operation, given rapidly declining well productivity.
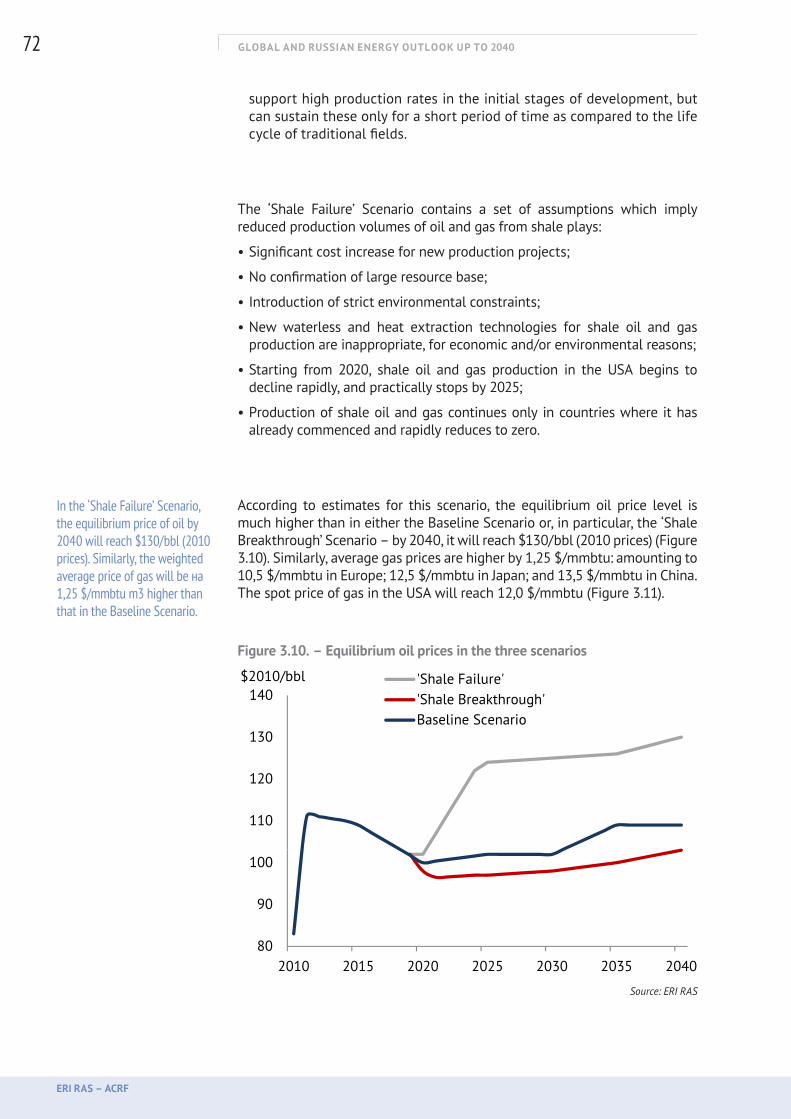
GLOBAL AND RUSSIAN ENERGY OUTLOOK UP TO 2040
ERI RAS – ACRF
72
support high production rates in the initial stages of development, but can sustain these only for a short period of time as compared to the life cycle of traditional fields.
The ‘Shale Failure’ Scenario contains a set of assumptions which imply reduced production volumes of oil and gas from shale plays:
• Significant cost increase for new production projects;
• No confirmation of large resource base;
• Introduction of strict environmental constraints;
• New waterless and heat extraction technologies for shale oil and gas production are inappropriate, for economic and/or environmental reasons;
• Starting from 2020, shale oil and gas production in the USA begins to decline rapidly, and practically stops by 2025;
• Production of shale oil and gas continues only in countries where it has already commenced and rapidly reduces to zero.
According to estimates for this scenario, the equilibrium oil price level is much higher than in either the Baseline Scenario or, in particular, the ‘Shale Breakthrough’ Scenario – by 2040, it will reach $130/bbl (2010 prices) (Figure 3.10). Similarly, average gas prices are higher by 1,25 $/mmbtu: amounting to 10,5 $/mmbtu in Europe; 12,5 $/mmbtu in Japan; and 13,5 $/mmbtu in China. The spot price of gas in the USA will reach 12,0 $/mmbtu (Figure 3.11).
Figure 3.10. – Equilibrium oil prices in the three scenarios
110
120
130
140$2010/bbl 'Shale Failure'
'Shale Breakthrough'Baseline Scenario
80
90
100
2010 2015 2020 2025 2030 2035 2040 Source: ERI RAS
In the ‘Shale Failure’ Scenario, the equilibrium price of oil by 2040 will reach $130/bbl (2010 prices). Similarly, the weighted average price of gas will be на 1,25 $/mmbtu m3 higher than that in the Baseline Scenario.
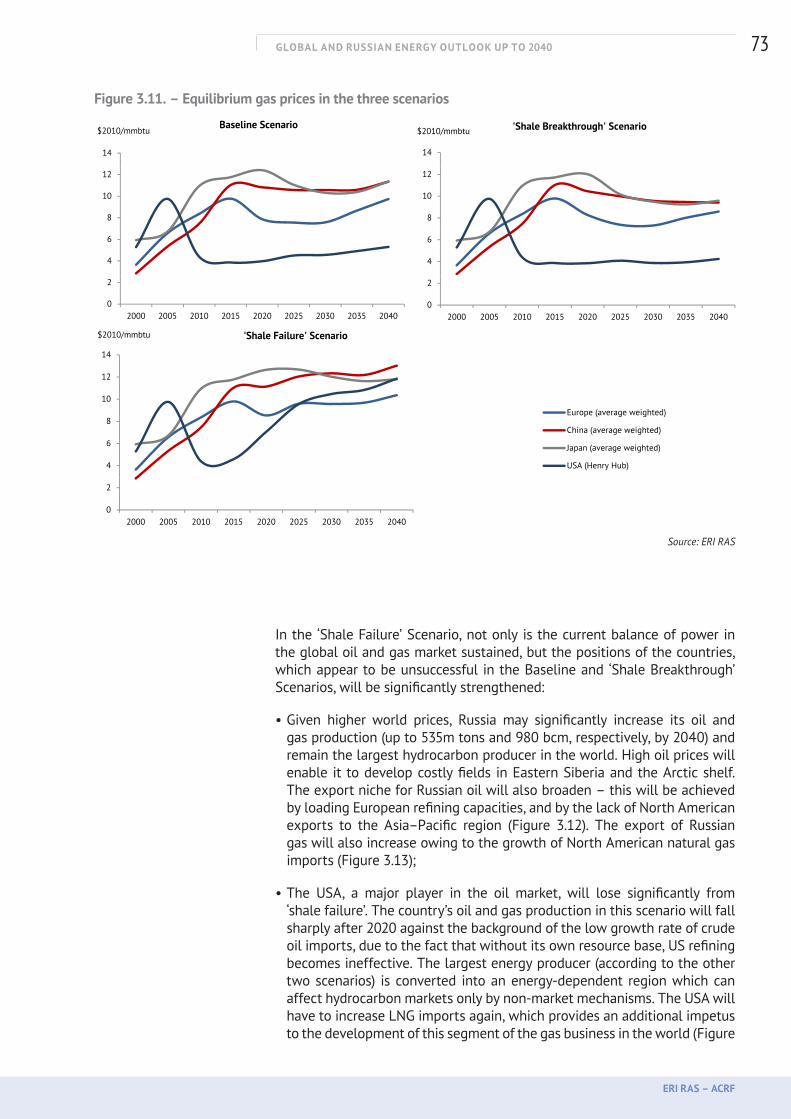
GLOBAL AND RUSSIAN ENERGY OUTLOOK UP TO 2040
ERI RAS – ACRF
73
Figure 3.11. – Equilibrium gas prices in the three scenarios
14
$2010/mmbtuBaseline Scenario
14
$2010/mmbtu 'Shale Breakthrough' Scenario
10
12
14
$2010/mmbtuBaseline Scenario
10
12
14
$2010/mmbtu 'Shale Breakthrough' Scenario
4
6
8
10
12
4
6
8
10
12
0
2
4
6
0
2
4
6
0
2
2000 2005 2010 2015 2020 2025 2030 2035 20400
2
2000 2005 2010 2015 2020 2025 2030 2035 2040
14
$2010/mmbtu 'Shale Failure' Scenario
10
12
14
$2010/mmbtu 'Shale Failure' Scenario
4
6
8
10
12
Europe (average weighted)
China (average weighted)
Japan (average weighted)
USA (H H b)
0
2
4
6China (average weighted)
Japan (average weighted)
USA (Henry Hub)
0
2
2000 2005 2010 2015 2020 2025 2030 2035 2040 Source: ERI RAS
In the ‘Shale Failure’ Scenario, not only is the current balance of power in the global oil and gas market sustained, but the positions of the countries, which appear to be unsuccessful in the Baseline and ‘Shale Breakthrough’ Scenarios, will be significantly strengthened:
• Given higher world prices, Russia may significantly increase its oil and gas production (up to 535m tons and 980 bcm, respectively, by 2040) and remain the largest hydrocarbon producer in the world. High oil prices will enable it to develop costly fields in Eastern Siberia and the Arctic shelf. The export niche for Russian oil will also broaden – this will be achieved by loading European refining capacities, and by the lack of North American exports to the Asia–Pacific region (Figure 3.12). The export of Russian gas will also increase owing to the growth of North American natural gas imports (Figure 3.13);
• The USA, a major player in the oil market, will lose significantly from ‘shale failure’. The country’s oil and gas production in this scenario will fall sharply after 2020 against the background of the low growth rate of crude oil imports, due to the fact that without its own resource base, US refining becomes ineffective. The largest energy producer (according to the other two scenarios) is converted into an energy-dependent region which can affect hydrocarbon markets only by non-market mechanisms. The USA will have to increase LNG imports again, which provides an additional impetus to the development of this segment of the gas business in the world (Figure
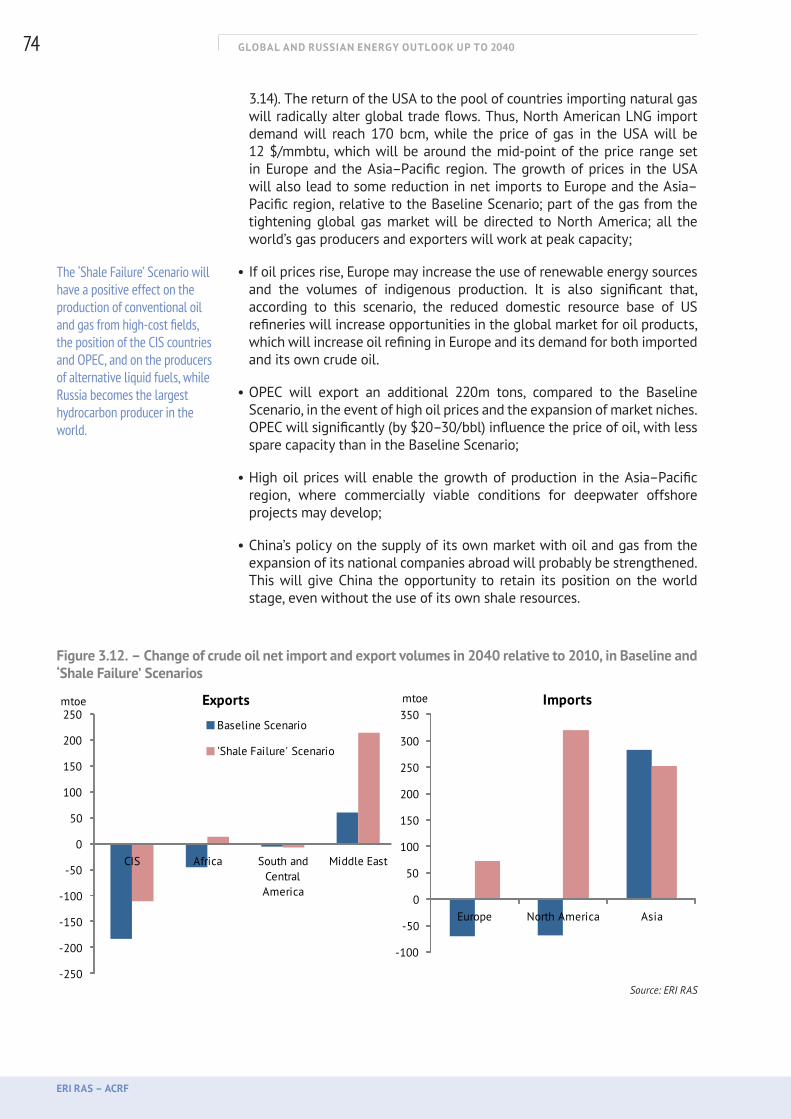
GLOBAL AND RUSSIAN ENERGY OUTLOOK UP TO 2040
ERI RAS – ACRF
74
3.14). The return of the USA to the pool of countries importing natural gas will radically alter global trade flows. Thus, North American LNG import demand will reach 170 bcm, while the price of gas in the USA will be 12 $/mmbtu, which will be around the mid-point of the price range set in Europe and the Asia–Pacific region. The growth of prices in the USA will also lead to some reduction in net imports to Europe and the Asia–Pacific region, relative to the Baseline Scenario; part of the gas from the tightening global gas market will be directed to North America; all the world’s gas producers and exporters will work at peak capacity;
• If oil prices rise, Europe may increase the use of renewable energy sources and the volumes of indigenous production. It is also significant that, according to this scenario, the reduced domestic resource base of US refineries will increase opportunities in the global market for oil products, which will increase oil refining in Europe and its demand for both imported and its own crude oil.
• OPEC will export an additional 220m tons, compared to the Baseline Scenario, in the event of high oil prices and the expansion of market niches. OPEC will significantly (by $20–30/bbl) influence the price of oil, with less spare capacity than in the Baseline Scenario;
• High oil prices will enable the growth of production in the Asia–Pacific region, where commercially viable conditions for deepwater offshore projects may develop;
• China’s policy on the supply of its own market with oil and gas from the expansion of its national companies abroad will probably be strengthened. This will give China the opportunity to retain its position on the world stage, even without the use of its own shale resources.
Figure 3.12. – Change of crude oil net import and export volumes in 2040 relative to 2010, in Baseline and ‘Shale Failure’ Scenarios
-250
-200
-150
-100
-50
0
50
100
150
200
250
CIS Africa South and Central America
Middle East
mtoe Exports
Baseline Scenario
'Shale Failure' Scenario
-100
-50
0
50
100
150
200
250
300
350
Europe North America Asia
mtoe Imports
Source: ERI RAS
The ‘Shale Failure’ Scenario will have a positive effect on the production of conventional oil and gas from high-cost fields, the position of the CIS countries and OPEC, and on the producers of alternative liquid fuels, while Russia becomes the largest hydrocarbon producer in the world.
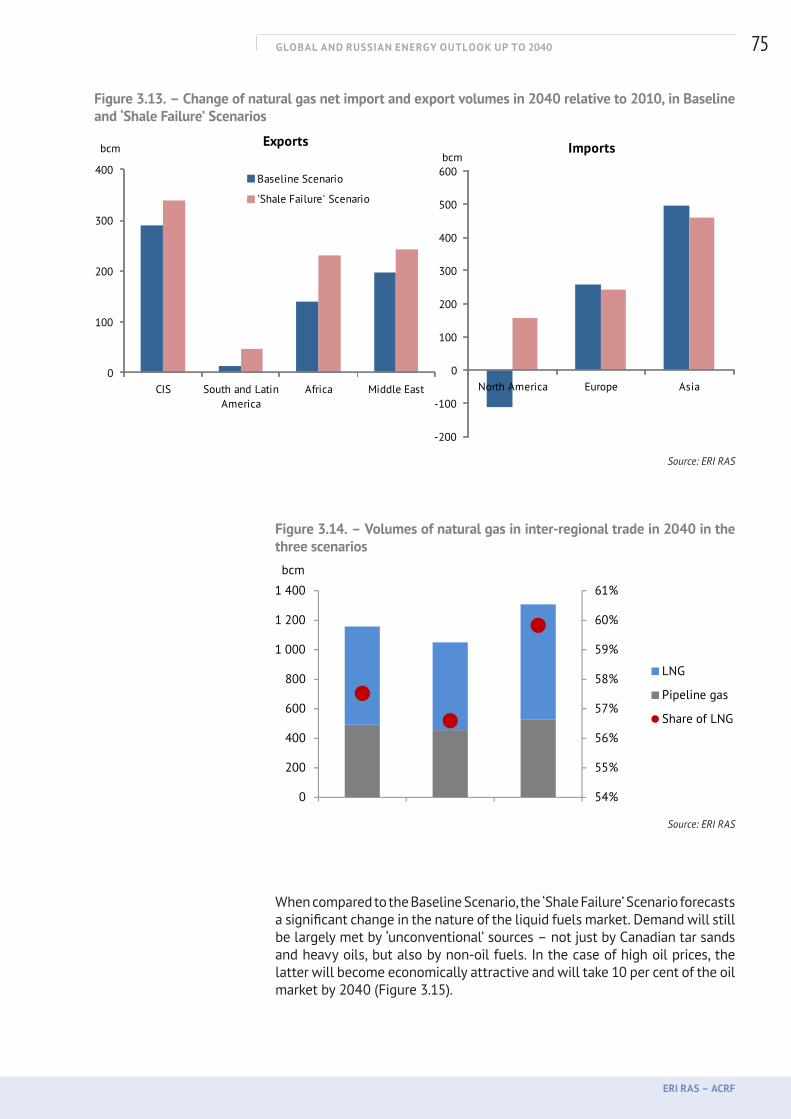
GLOBAL AND RUSSIAN ENERGY OUTLOOK UP TO 2040
ERI RAS – ACRF
75
Figure 3.13. – Change of natural gas net import and export volumes in 2040 relative to 2010, in Baseline and ‘Shale Failure’ Scenarios
0
100
200
300
400
CIS South and Latin America
Africa Middle East
bcm Exports
Baseline Scenario
'Shale Failure' Scenario
-200
-100
0
100
200
300
400
500
600
North America Europe Asia
bcmImports
Source: ERI RAS
Figure 3.14. – Volumes of natural gas in inter-regional trade in 2040 in the three scenarios
57%
58%
59%
60%
61%
600
800
1 000
1 200
1 400
bcm
LNG
Pipeline gas
54%
55%
56%
57%
0
200
400
600
Baseline Scenario'Shale Breakthrough''Shale Failure'
Share of LNG
Source: ERI RAS
When compared to the Baseline Scenario, the ‘Shale Failure’ Scenario forecasts a significant change in the nature of the liquid fuels market. Demand will still be largely met by ‘unconventional’ sources – not just by Canadian tar sands and heavy oils, but also by non-oil fuels. In the case of high oil prices, the latter will become economically attractive and will take 10 per cent of the oil market by 2040 (Figure 3.15).
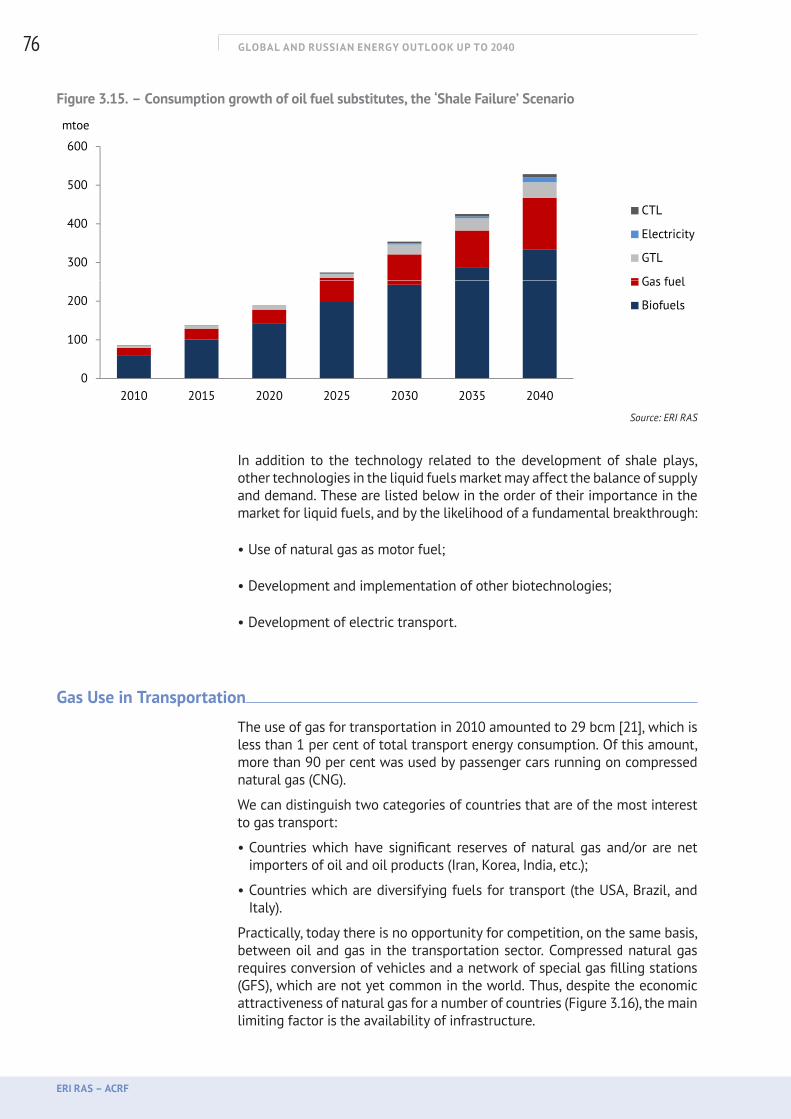
GLOBAL AND RUSSIAN ENERGY OUTLOOK UP TO 2040
ERI RAS – ACRF
76
Figure 3.15. – Consumption growth of oil fuel substitutes, the ‘Shale Failure’ Scenario
300
400
500
600
mtoe
CTL
Electricity
GTL
Gas fuel
0
100
200
2010 2015 2020 2025 2030 2035 2040
Gas fuel
Biofuels
Source: ERI RAS
In addition to the technology related to the development of shale plays, other technologies in the liquid fuels market may affect the balance of supply and demand. These are listed below in the order of their importance in the market for liquid fuels, and by the likelihood of a fundamental breakthrough:
• Use of natural gas as motor fuel;
• Development and implementation of other biotechnologies;
• Development of electric transport.
Gas Use in Transportation
The use of gas for transportation in 2010 amounted to 29 bcm [21], which is less than 1 per cent of total transport energy consumption. Of this amount, more than 90 per cent was used by passenger cars running on compressed natural gas (CNG).
We can distinguish two categories of countries that are of the most interest to gas transport:
• Countries which have significant reserves of natural gas and/or are net importers of oil and oil products (Iran, Korea, India, etc.);
• Countries which are diversifying fuels for transport (the USA, Brazil, and Italy).
Practically, today there is no opportunity for competition, on the same basis, between oil and gas in the transportation sector. Compressed natural gas requires conversion of vehicles and a network of special gas filling stations (GFS), which are not yet common in the world. Thus, despite the economic attractiveness of natural gas for a number of countries (Figure 3.16), the main limiting factor is the availability of infrastructure.

GLOBAL AND RUSSIAN ENERGY OUTLOOK UP TO 2040
ERI RAS – ACRF
77
Figure 3.16. – Marginal gas prices ensuring gas motor fuel efficiency for private transport, oil price at $110/ bbl.*
0
2
4
6
8
10
12
Russia Europe North America
China India Japan
$2010/mmbtu
Gas price needed to switch to gas fuelNatural gas price in 2010Gas price needed to switch to gas fuel without retting of carsNatural gas price in 2040
* The areas in the oval are the countries, where, due to the mass production of cars powered by gas, a potential and effective competition between oil and natural gas motor fuels is feasible.
Source: ERI RAS
Synthetic Liquid Fuels Obtained from Gas
Direct competition between natural gas and oil in transport is possible with the use of ‘gas to liquid’ technology (GTL), which produces gasoline and diesel fuel, similar in quality to the fuels made from oil. Today, however, the cost of production of synthetic fuels from gas amounts to $110–140/bbl, assuming a gas price not higher than 2,1 $/mmbtu, implying that the projected price of oil and gas makes these projects uneconomic.
Prospects for the use of gas in the transport sector will depend directly on:
• The environmental policies of countries (for example, the use of LNG for fuelling will depend on tightening the regulations on sulphur content in fuel);
• Development of infrastructure for CNG;
• Reducing the costs of synthetic fuels produced from gas.
In the forecast period, at relatively low oil prices, the competitiveness of gas transport is low. However, if consumers do not have to re-equip their cars with gas equipment, and this is done by the car industry, the market for gas fuel could greatly expand. In the Baseline Scenario, gas consumption in the transport sector will reach 80–85 bcm by 2040, and if the above measures are implemented, it will increase to 110 bcm (Figure 3.17).
Gas use in transportation is a promising prospect for some regions, but it requires the support of government and business interested in it.
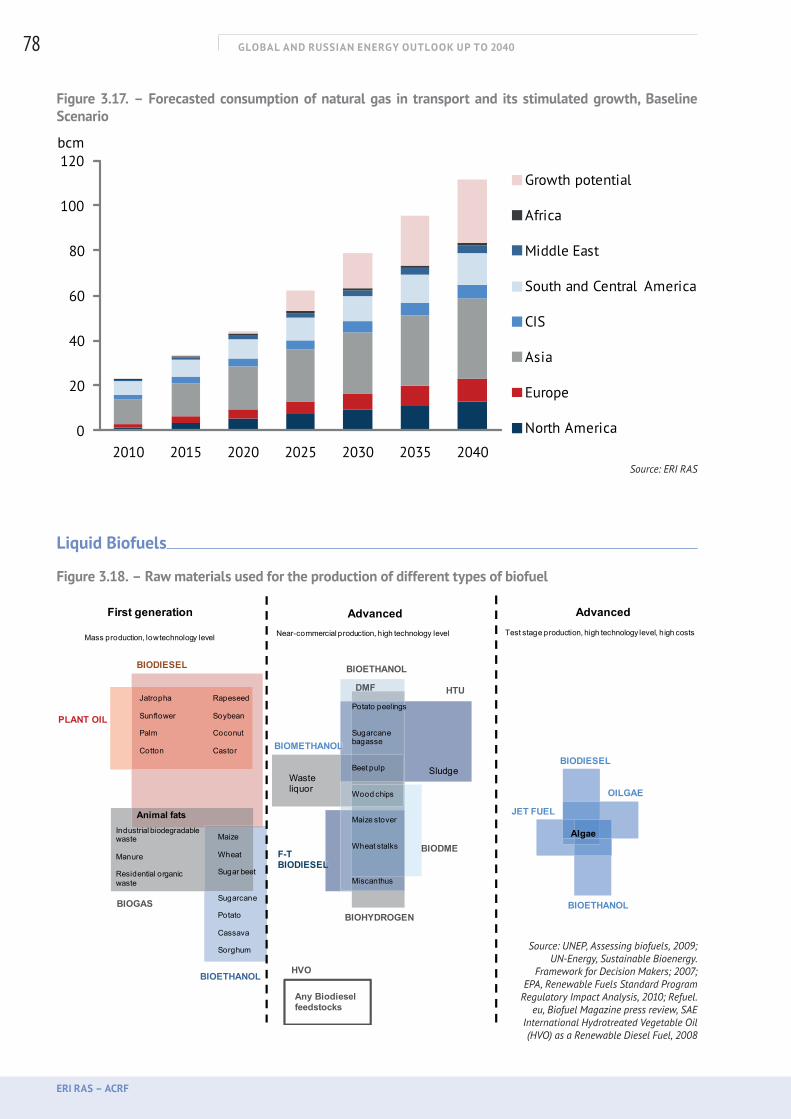
GLOBAL AND RUSSIAN ENERGY OUTLOOK UP TO 2040
ERI RAS – ACRF
78
Figure 3.17. – Forecasted consumption of natural gas in transport and its stimulated growth, Baseline Scenario
0
20
40
60
80
100
120
2010 2015 2020 2025 2030 2035 2040
bcm
Growth potential
Africa
Middle East
South and Central America
CIS
Asia
Europe
North America
Source: ERI RAS
Liquid Biofuels
Figure 3.18. – Raw materials used for the production of different types of biofuel
BIOGAS
AdvancedTest stage production, high technology level, high costs
Algae
BIODIESEL
JET FUEL
OILGAE
BIOETHANOL
First generation
Mass production, low technology level
BIODIESEL
PLANT OIL
Jatropha
Sunflower
Palm
Cotton
Rapeseed
Soybean
Coconut
Castor
Industrial biodegradablewaste
Manure
Residential organicwaste
Maize
Wheat
Sugar beet
Sugarcane
Potato
Cassava
Sorghum
BIOETHANOL
Animal fats
HTU
Near-commercial production, high technology level
Wasteliquor
HVO
Any Biodiesel feedstocks
F-TBIODIESEL
BIOMETHANOL
Advanced
L
L
BIODME
BIOHYDROGEN
Sludge
Potato peelings
Sugarcane bagasse
Beet pulp
Wood chips
Maize stover
Wheat stalks
Miscanthus
BIOETHANOL
DMF
Source: UNEP, Assessing biofuels, 2009; UN-Energy, Sustainable Bioenergy.
Framework for Decision Makers; 2007; EPA, Renewable Fuels Standard Program
Regulatory Impact Analysis, 2010; Refuel.eu, Biofuel Magazine press review, SAE
International Hydrotreated Vegetable Oil (HVO) as a Renewable Diesel Fuel, 2008
GLOBAL AND RUSSIAN ENERGY OUTLOOK UP TO 2040
ERI RAS – ACRF
79
It is widely believed that biofuels can play a significant role in meeting the demand for fuel – reducing pollution and greenhouse gas emissions. Figure 3.18 illustrates various raw materials that can be converted into biofuels for transportation, and technologies used for this.
According to our estimates, liquid biofuels could only, realistically, meet less than 10 per cent of the growing demand in the transport sector, and they remain a complex and controversial issue. In recent years, debates about the impact of biofuels on the food market, and their potential for adverse effects on environmental biodiversity, soil, and water have intensified.
Today, industrial-scale production is only possible for first-generation biofuels from agricultural crops, but the availability of cultivated land and increasing competition from food manufacturers directly limit their production. Moreover, biofuels have twice been partly responsible for food crises.
The European Union has set a target to increase the share of biofuels in the transport sector to 10 per cent by 2020, but a bill is pending, based on studies made in 2012, which limits the use of biofuels extracted from crops to 5 per cent. As an alternative, the European Commission is trying to accelerate the spread of electric vehicles by passing regulations on the mandatory number of available specialized charging stations.
For now, biofuels are competitive only in regions with tropical and subtropical climates (where crops are harvested several times each year) at oil prices of $100–110/bbl. In other regions, their cost rises to $120–140/bbl which, given oil prices in the Baseline Scenario (which will not exceed $110/bbl by the end of the period), would require a special incentive for bioethanol and biodiesel producers.
Electric vehicles
The technological breakthrough that could change energy use in the transportation sector, and thus the energy balance, is a large-scale penetration of electric vehicles.
Today, OECD countries are actively developing electric mobility technologies. In electric vehicles, lithium ion batteries are mainly used with 100–200 Wh/kg power capacity, capable of 1000–3000 charge–discharge cycles – considerably higher than that of conventional lead–acid and alkali accumulator batteries. Such fully charged batteries provide an average range of 120–160 km; full charging requires 4–8 hours or more. The cost of batteries (together with peripheral equipment and a control system) is $600–900/kWh (2010 prices), depending on their characteristics. Their cost thus accounts for 65 per cent of the total cost of the electric vehicle. The performance of affordable batteries limits their usability, in consumers’ terms, meaning that electric vehicles cannot yet compete with conventional cars.
Electric transport has two development paths – the use of accumulator batteries and fuel cells. However, neither of these technologies has, so far, been able to compete with the conventional internal combustion engine and both require significant modernization in certain areas (Figure 3.19).
The growth potential for liquid biofuels is strictly limited by the food market and the availability of arable land.
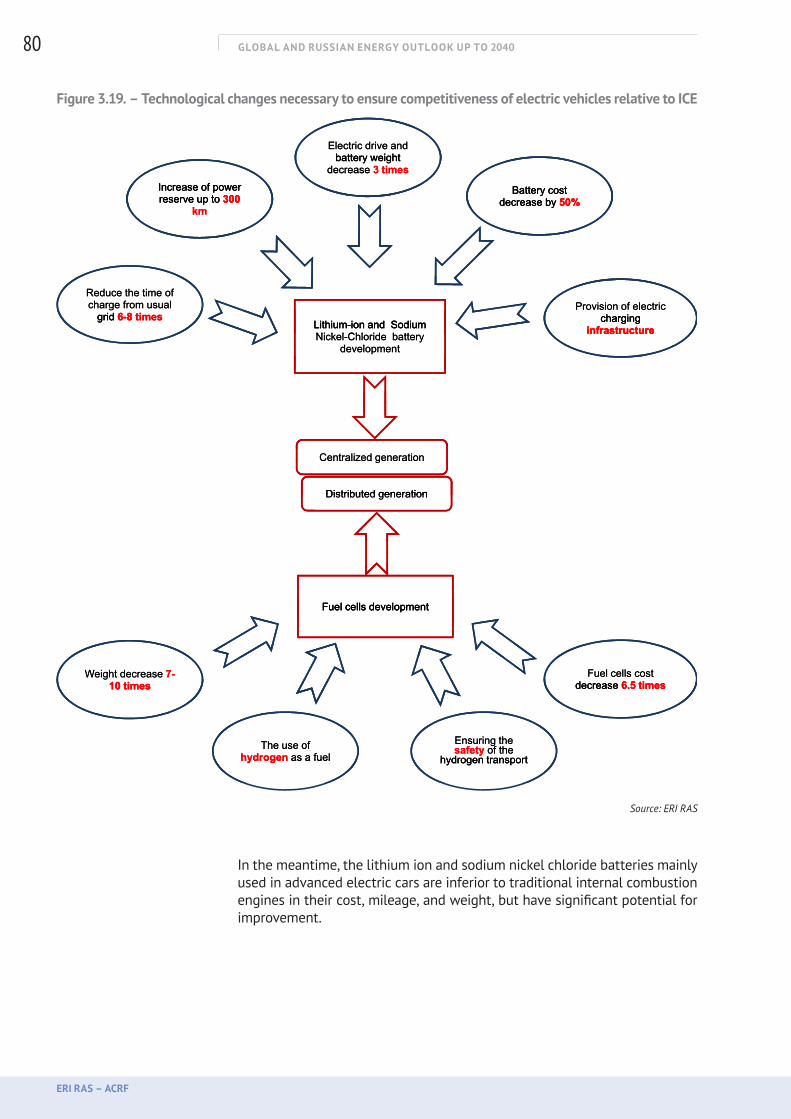
GLOBAL AND RUSSIAN ENERGY OUTLOOK UP TO 2040
ERI RAS – ACRF
80
Figure 3.19. – Technological changes necessary to ensure competitiveness of electric vehicles relative to ICE
Electric drive and battery weight
Electric drive and battery weight
decrease 3 times
Battery cost
battery weight decrease 3 times
Increase of power t 300
Battery cost decrease by 50%
decrease 3 timesIncrease of power reserve up to 300
k
Battery cost decrease by 50%
Increase of power reserve up to 300
km
ydecrease by 50% reserve up to 300
km
Reduce the time of
Lithium ion and Sodium
Reduce the time of charge from usual
grid 6-8 timesProvision of electric
chargingLithium-ion and Sodium Ni k l Chl id b tt
charge from usual grid 6-8 times
Provision of electric charging
infrastructureLithium-ion and Sodium Nickel-Chloride battery
d l t
grid 6-8 times charginginfrastructureLithium-ion and Sodium
Nickel-Chloride battery development
g g ginfrastructure
development
Centralized generationCentralized generationCentralized generation
Distributed generationDistributed generationDistributed generation
Fuel cells developmentFuel cells developmentFuel cells developmentFuel cells development
Fuel cells cost decrease 6.5 times
Weight decrease 7-10 times
Fuel cells costdecrease 6.5 times
Weight decrease 7-10 times decrease 6.5 times
g10 times
E i thEnsuring the safety of theThe use of Ensuring the safety of the
hydrogen transportThe use of
hydrogen as a fuelsafety of the
hydrogen transportThe use of
hydrogen as a fuel hydrogen transporthydrogen as a fuel
Source: ERI RAS
In the meantime, the lithium ion and sodium nickel chloride batteries mainly used in advanced electric cars are inferior to traditional internal combustion engines in their cost, mileage, and weight, but have significant potential for improvement.
GLOBAL AND RUSSIAN ENERGY OUTLOOK UP TO 2040
ERI RAS – ACRF
81
Prospects for the Development of Electrochemical Batteries
Results of intensive global research and development suggest that the power capacity of accumulator batteries will multiply, and that by 2020 their cost will drop to $400/kWh, and by 2030 to $200/kWh. In the longer perspective, it may be possible to reduce battery cost to $100/kWh. It should be noted that the US Department of Energy (DOE) has set a target that by 2025 the cost of batteries should decrease to $250/kWh, and charging time should be reduced to 6–10 minutes, making it comparable with the time of fuelling a conventional vehicle. If these requirements are met, electric cars will become cost-competitive with vehicles equipped with internal combustion engines.
Lithium ion batteries have improved more rapidly than any others. The search for substances to be used for electrodes and electrolyte, and for new technologies used in their manufacture, is under way. The most promising approach is considered to be the use of nanostructured high-porosity composite materials: in particular nanocomposites based on lithium and iron phosphate or lithium sulphite and carbon used for the manufacture of cathodes; and nanostructured silicon instead of graphite for anodes, etc. This should increase battery power several times, expand the per charge mileage up to 600–800 km, reduce charging time to 10 minutes or less, and extend battery service life to 8–10 years.
Promising prospects can be expected from the development of lithium air batteries. Their theoretical energy output is 8–10 times higher than that of lithium ion ones. The cruising range of electric vehicles on a single charge could reach 800–1000 km. These batteries are being developed by many organizations, one of which is the consortium of companies which includes America’s IBM and Japan’s Asahi Kasei and Central Glass companies, supported scientifically by a number of US national laboratories (primarily by the Argonne National Laboratory) in the ambitious Battery 500 Project. This battery would meet all future DOE requirements, and its power output is expected to reach 1700 Wh/kg. It is likely to appear on the market in 8–10 years.
Active research for the creation of even more efficient batteries is in progress. For instance, at Stanford University scientists are considering potassium ions as charge carriers instead of lithium and make electrodes from nanomaterials based on iron and copper, which would increase the number of battery ‘charge–discharge’ cycles to 40 000. At the University of Massachusetts, an air vanadium boride element (vanadium boride air cell) has been developed which will be able to surpass the energy intensity of gasoline and diesel fuel. The theoretical energy capacity of this element is 27 kWh/kg. However, researchers estimated a practicable achievable energy capacity of 5 kWh/kg, while the energy capacity of gasoline is 12.1 kWh/kg and diesel fuel is 11.8 kWh/kg. Taking into account motor efficiency (30–40 per cent), these values amount to 3.6–4.7 kWh/kg. One of the major problems related to this accumulator, however, is severe corrosion of the element leading to the rapid loss of its capacity and release of hydrogen, which makes the battery explosive. The research team hopes to resolve this issue quickly, by stabilizing the vanadium boride anode by coating it with a thin layer of zirconium dioxide.
Scientists from the universities of Miami, Tokyo, and Tohoku have discovered the phenomenon of generation of an electromotive force (EMF) in a static magnetic field. EMF has a spin origin, which is created by the spin-dependent effects in a specially prepared nanostructure consisting of quantum nanomagnets of specific composition. The technical implementation of this phenomenon may open the way for the creation of so-called spin batteries – accumulators with fantastic energy capacity and power, which would store ‘quanta of energy’. However, the implementation of ‘spin’ batteries by 2040 is not expected.
The improvement of control systems can bring about further upgrades of accumulator batteries. This is achieved by new methods and technical tools for monitoring the condition of electrochemical cells, and efficient algorithms to optimise charging strategies and subsequent battery usage, depending on the physical condition of the cells. The implementation of this project by the University of California, in conjunction with the companies Bosch and Cobasys, supported by the Advanced Research Projects Agency-Energy (ARPA-E) of the USA with a 9.6m dollar grant, is expected to reduce the cost of lithium ion batteries by 25 per cent and halve the time of charging.
In parallel with the development of accumulator batteries, the improvement of electrical equipment in the electric car, which would reduce its power consumption per km, is also in progress. For example, Yasa Motors has unveiled an ultra-light and powerful electric motor – the DD500 developed at the University of Oxford. The motor size is 50 per cent smaller than conventional traction motors, its specific peak torque is twice as large (30 Nm/kg), and Yasa Motors intends to increase it to 40 Nm/kg.
GLOBAL AND RUSSIAN ENERGY OUTLOOK UP TO 2040
ERI RAS – ACRF
82
The prospects for fuel cell vehicles based on hydrogen or hydrogen-containing fuel – natural gas, ammonia, methanol, or gasoline, are still vague. All tested versions of fuel cell vehicles run on hydrogen; some prototypes use methanol, but this technology has not yet been approved. The main problem of existing hydrogen cars is the high level of fire and explosion hazard (hydrogen molecules can penetrate the car’s metal body or fuel tank and leak outside the vehicle, which can lead to detonation). Therefore, in scenarios for energy change in transport, the most promising perspective for the period to 2040 is expected to be in battery improvement; the use of fuel cells is likely to be postponed to a more distant future.
The objectives of individual countries for promotion of electric vehicles and methods for their stimulation
Already today, many countries have government support in place for the development of electric vehicles; their owners are directly subsidized or get tax benefits. For example, in the UK and the USA, buyers of electric cars are compensated from the state budget for 25–50 per cent of the car’s value, with a top limit of US$7500. Japan, Belgium, Italy, China, and Canada have developed a system of tax credits and deductions, with other benefits (free registration plates in China, infrastructure financing, subsidies for producers), saving the customer up to a third of the electric vehicle’s cost.
The Chinese government plans to increase the production of electric and hybrid cars to 2 million per year by 2020. The USA wants to increase the number of electric vehicles to one million by 2015.
The share taken by electric vehicles in total energy consumption in the road transport sector may reach 5 per cent by 2030 (the equivalent of 293m tons of motor fuel); by 2040, it could reach 10 per cent (600m tons), provided:
1) OECD countries and China continue to support ‘green transport’ and subsidize electric vehicles up to 2025;
2) Improvement of battery technology will provide:
• up to 300 km cruising range on one charge,
• reduction in battery cost by 50 per cent (from 20 to 10 thousand dollars in 2010 prices),
• battery life of at least 7 years,
• threefold reduction in weight (to100 kg),
• reduction of time (to 30–40 minutes) for full battery charge from 220V supply;
3) Governments, energy companies, and automakers will finance the development of infrastructure, which will make electric cars available to all.
If this electric transportation breakthrough is implemented by the end of the forecast period, the size of the oil market will fall by up to 600m tons of oil, and the price of oil will drop to $102/bbl. This will reduce production and export of oil in a number of regions with high costs of production, particularly in Europe and the CIS countries (Figure 3.20).
Implementation of the ‘Electric Vehicles’ Scenario requires full state support, or electric cars will not be able to compete with conventional vehicles.
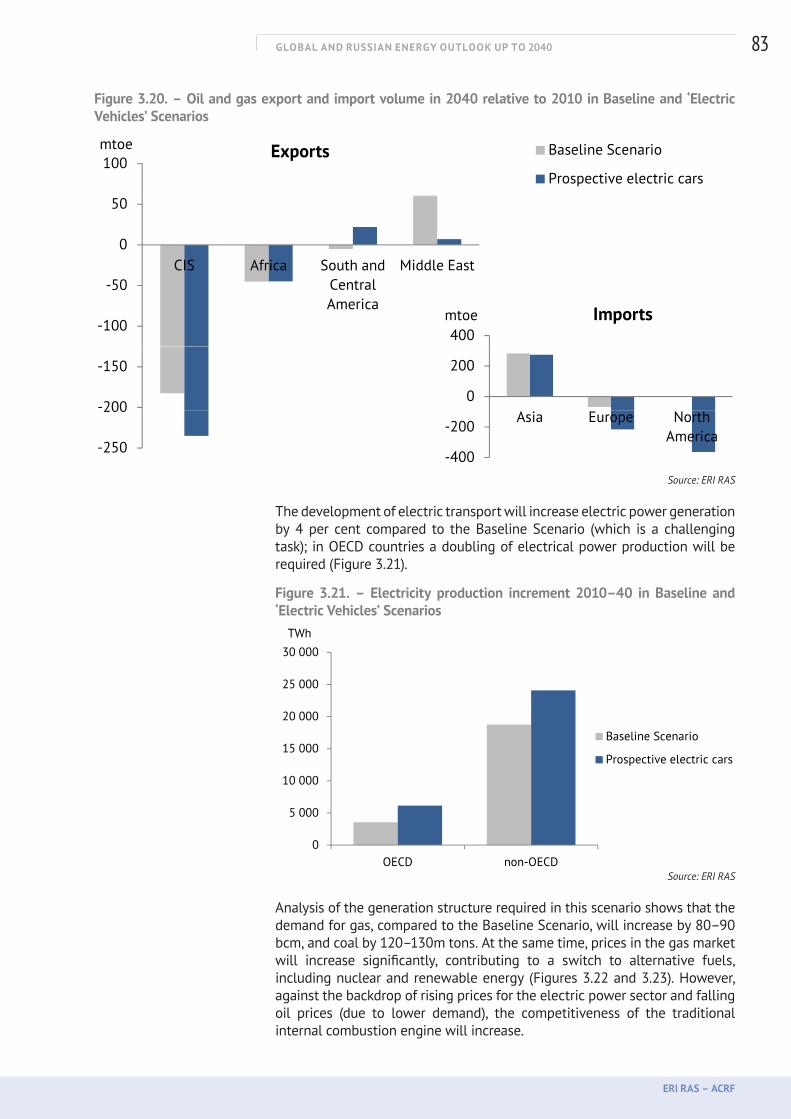
GLOBAL AND RUSSIAN ENERGY OUTLOOK UP TO 2040
ERI RAS – ACRF
83
Figure 3.20. – Oil and gas export and import volume in 2040 relative to 2010 in Baseline and ‘Electric Vehicles’ Scenarios
60,6 7
100mtoe Exports Baseline Scenario
Prospective electric cars
0
50
100mtoe Exports Baseline Scenario
Prospective electric cars
-100
-50
0
50
CIS Africa South and Central America
Middle East
mtoe Imports
-150
-100
-50 Central America
0
200
400mtoe Imports
-250
-200
-150
400
-200
0
200
Asia Europe North America
-250
200
-400
-200Asia Europe North
America
Source: ERI RAS
The development of electric transport will increase electric power generation by 4 per cent compared to the Baseline Scenario (which is a challenging task); in OECD countries a doubling of electrical power production will be required (Figure 3.21).
Figure 3.21. – Electricity production increment 2010–40 in Baseline and ‘Electric Vehicles’ Scenarios
15 000
20 000
25 000
30 000TWh
Baseline Scenario
Prospective electric cars
0
5 000
10 000
OECD non-OECD
p
Source: ERI RAS
Analysis of the generation structure required in this scenario shows that the demand for gas, compared to the Baseline Scenario, will increase by 80–90 bcm, and coal by 120–130m tons. At the same time, prices in the gas market will increase significantly, contributing to a switch to alternative fuels, including nuclear and renewable energy (Figures 3.22 and 3.23). However, against the backdrop of rising prices for the electric power sector and falling oil prices (due to lower demand), the competitiveness of the traditional internal combustion engine will increase.
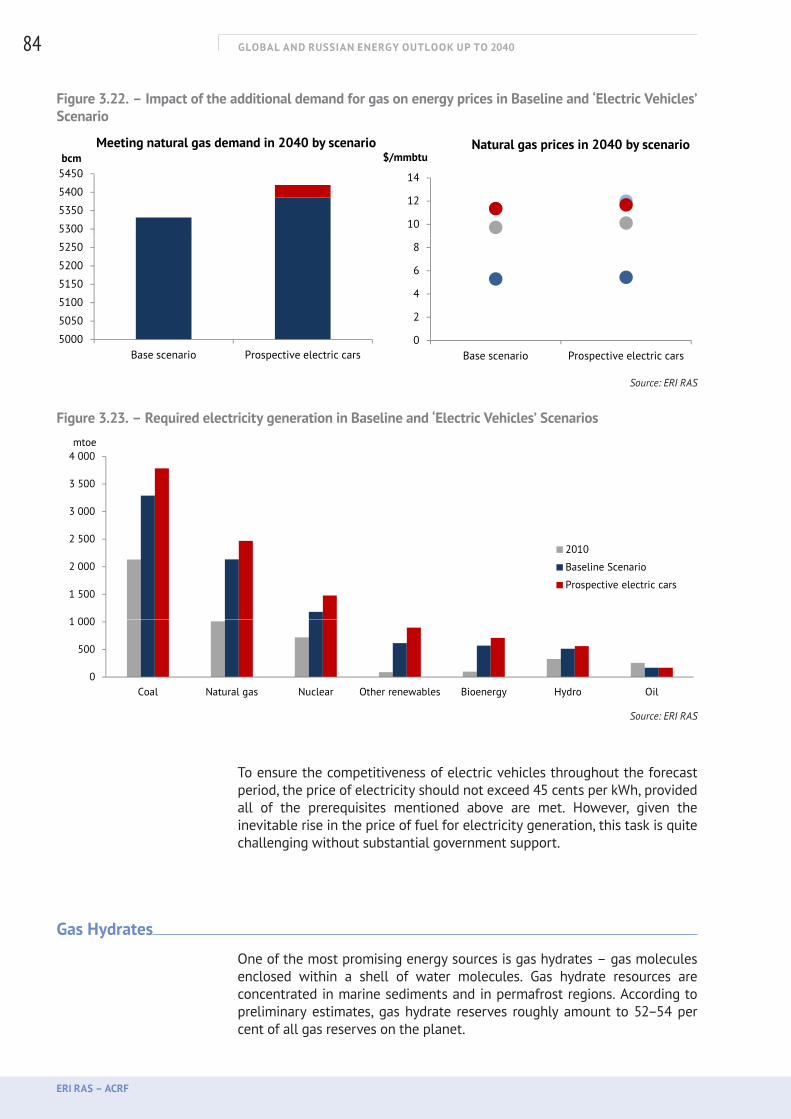
GLOBAL AND RUSSIAN ENERGY OUTLOOK UP TO 2040
ERI RAS – ACRF
84
Figure 3.22. – Impact of the additional demand for gas on energy prices in Baseline and ‘Electric Vehicles’ Scenario
bcmMeeting natural gas demand in 2040 by scenario
$/mmbtuNatural gas prices in 2040 by scenario
5350
5400
5450bcm
Meeting natural gas demand in 2040 by scenario
12
14
$/mmbtuNatural gas prices in 2040 by scenario
5200
5250
5300
5350
5400
5450
6
8
10
12
14
5050
5100
5150
5200
5250
2
4
6
8
5000
5050
5100
5150
Base scenario Prospective electric cars
N l d i S i h hi l i f l
0
2
4
Base scenario Prospective electric cars5000
Base scenario Prospective electric cars
Natural gas production Swithching to alternative fuels
0Base scenario Prospective electric cars
Europe (average weighted) China (average weighted)Japan (average weighted) USA (Henry Hub)
Source: ERI RAS
Figure 3.23. – Required electricity generation in Baseline and ‘Electric Vehicles’ Scenarios
1 000
1 500
2 000
2 500
3 000
3 500
4 000mtoe
2010
Baseline Scenario
Prospective electric cars
0
500
1 000
Coal Natural gas Nuclear Other renewables Bioenergy Hydro Oil Source: ERI RAS
To ensure the competitiveness of electric vehicles throughout the forecast period, the price of electricity should not exceed 45 cents per kWh, provided all of the prerequisites mentioned above are met. However, given the inevitable rise in the price of fuel for electricity generation, this task is quite challenging without substantial government support.
Gas Hydrates
One of the most promising energy sources is gas hydrates – gas molecules enclosed within a shell of water molecules. Gas hydrate resources are concentrated in marine sediments and in permafrost regions. According to preliminary estimates, gas hydrate reserves roughly amount to 52–54 per cent of all gas reserves on the planet.
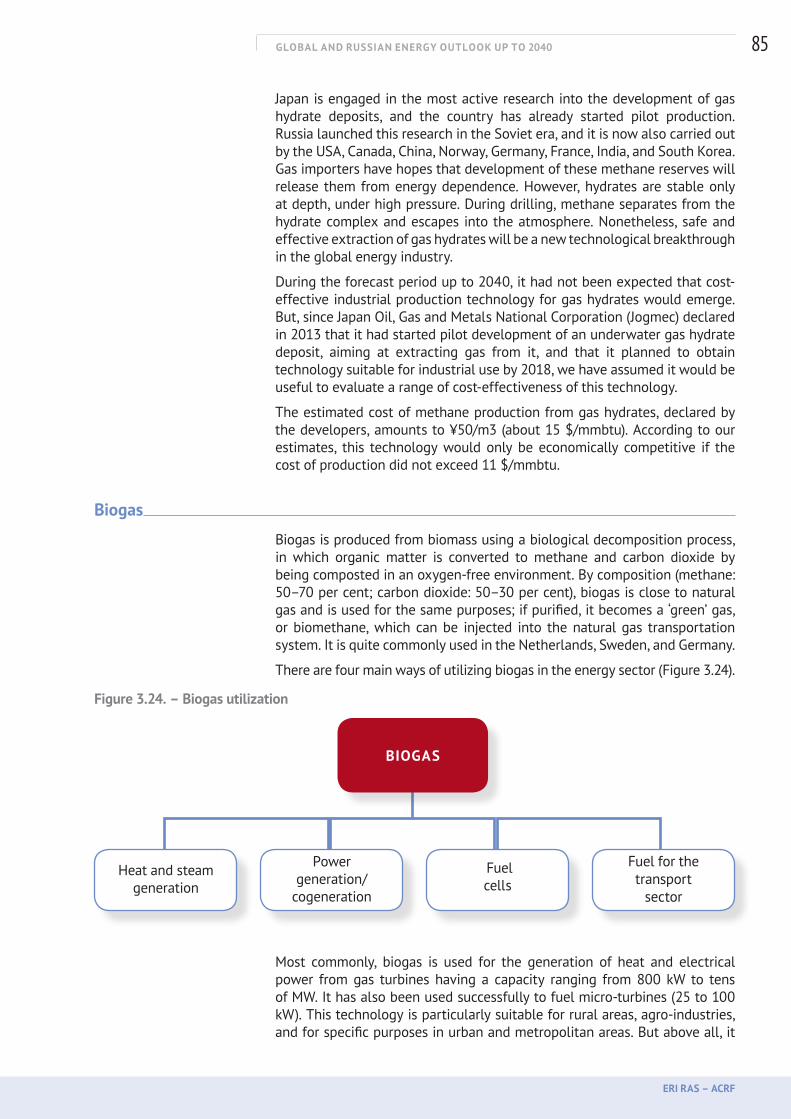
GLOBAL AND RUSSIAN ENERGY OUTLOOK UP TO 2040
ERI RAS – ACRF
85
Japan is engaged in the most active research into the development of gas hydrate deposits, and the country has already started pilot production. Russia launched this research in the Soviet era, and it is now also carried out by the USA, Canada, China, Norway, Germany, France, India, and South Korea. Gas importers have hopes that development of these methane reserves will release them from energy dependence. However, hydrates are stable only at depth, under high pressure. During drilling, methane separates from the hydrate complex and escapes into the atmosphere. Nonetheless, safe and effective extraction of gas hydrates will be a new technological breakthrough in the global energy industry.
During the forecast period up to 2040, it had not been expected that cost-effective industrial production technology for gas hydrates would emerge. But, since Japan Oil, Gas and Metals National Corporation (Jogmec) declared in 2013 that it had started pilot development of an underwater gas hydrate deposit, aiming at extracting gas from it, and that it planned to obtain technology suitable for industrial use by 2018, we have assumed it would be useful to evaluate a range of cost-effectiveness of this technology.
The estimated cost of methane production from gas hydrates, declared by the developers, amounts to ¥50/m3 (about 15 $/mmbtu). According to our estimates, this technology would only be economically competitive if the cost of production did not exceed 11 $/mmbtu.
Biogas
Biogas is produced from biomass using a biological decomposition process, in which organic matter is converted to methane and carbon dioxide by being composted in an oxygen-free environment. By composition (methane: 50–70 per cent; carbon dioxide: 50–30 per cent), biogas is close to natural gas and is used for the same purposes; if purified, it becomes a ‘green’ gas, or biomethane, which can be injected into the natural gas transportation system. It is quite commonly used in the Netherlands, Sweden, and Germany.
There are four main ways of utilizing biogas in the energy sector (Figure 3.24).
Figure 3.24. – Biogas utilization
BIOGAS
Heat and steam generation
Power generation/
cogeneration
Fuel cells
Fuel for the transport
sector
Most commonly, biogas is used for the generation of heat and electrical power from gas turbines having a capacity ranging from 800 kW to tens of MW. It has also been used successfully to fuel micro-turbines (25 to 100 kW). This technology is particularly suitable for rural areas, agro-industries, and for specific purposes in urban and metropolitan areas. But above all, it
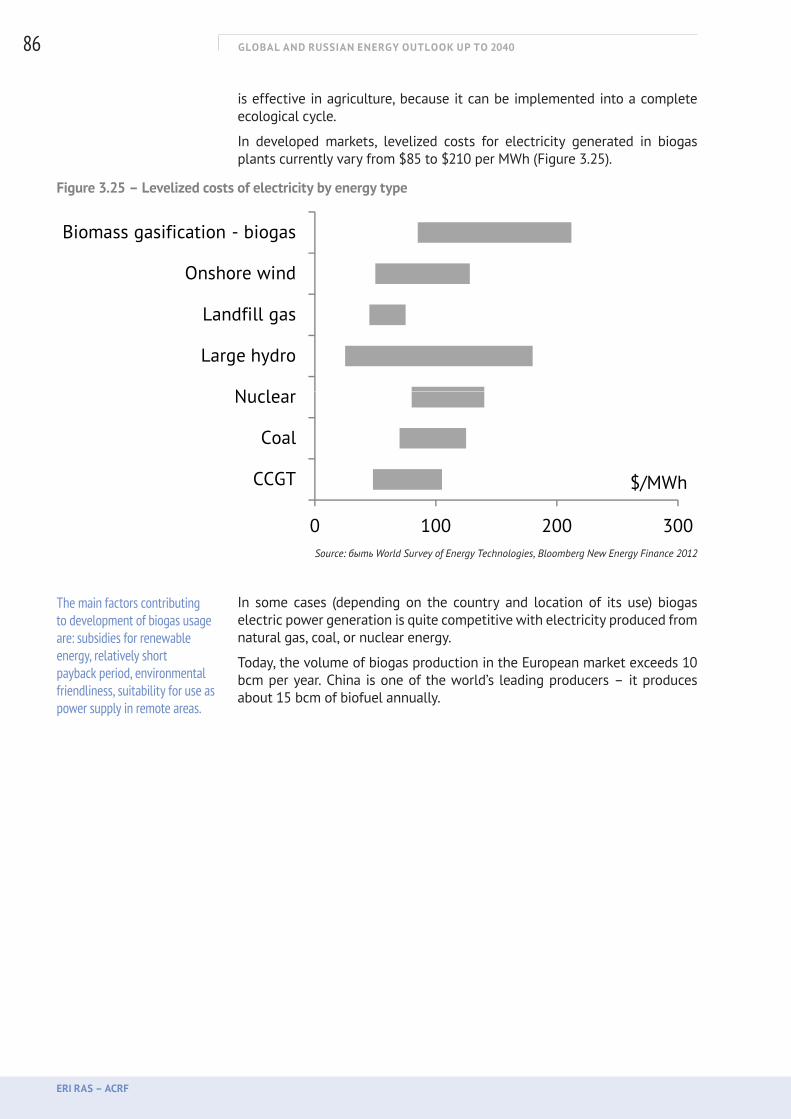
GLOBAL AND RUSSIAN ENERGY OUTLOOK UP TO 2040
ERI RAS – ACRF
86
is effective in agriculture, because it can be implemented into a complete ecological cycle.
In developed markets, levelized costs for electricity generated in biogas plants currently vary from $85 to $210 per MWh (Figure 3.25).
Figure 3.25 – Levelized costs of electricity by energy type
N l
Large hydro
Landfill gas
Onshore wind
Biomass gasification - biogas
0 100 200 300
CCGT
Coal
Nuclear
$/MWh
Source: быть World Survey of Energy Technologies, Bloomberg New Energy Finance 2012
In some cases (depending on the country and location of its use) biogas electric power generation is quite competitive with electricity produced from natural gas, coal, or nuclear energy.
Today, the volume of biogas production in the European market exceeds 10 bcm per year. China is one of the world’s leading producers – it produces about 15 bcm of biofuel annually.
The main factors contributing to development of biogas usage are: subsidies for renewable energy, relatively short payback period, environmental friendliness, suitability for use as power supply in remote areas.
GLOBAL AND RUSSIAN ENERGY OUTLOOK UP TO 2040
ERI RAS – ACRF
87
The Impact of Global Energy Markets on Russia’s Economy and Energy Sector
GLOBAL AND RUSSIAN ENERGY OUTLOOK UP TO 2040
ERI RAS – ACRF
88
4. THE IMPACT OF GLOBAL ENERGY MARKETS ON RUSSIA’S ECONOMY AND ENERGY SECTOR
The Initial Scenario for the Development of the Russian Economy and Energy SectorThe Outlook-2013 Initial Scenario for Russia (and the input parameters for the optimization models of the world’s energy markets) uses development indicators which, for the period up to 2030, are consistent with the Innovation Scenario of the long-term forecast of the Ministry of Economic Development of the Russian Federation, issued in early 2013. Outlook-2013 then retains the above trends for the whole period of the forecast. According to this official scenario, the country’s population will rise slightly, to 144m people by 2020, after which there will be an accelerated decline, to 138m people by 2040. Russia’s GDP will increase 3.2 times by 2040 (an average of 3.4 per cent per year) and per capita income will increase by 3.3 times. Up to 2030, Russia will hold sixth place in GDP ratings among the countries of the world and, by 2040, it will overtake Japan and rise to fifth place in the world, which would strengthen Russia’s geopolitical position.Figure 4.1 shows the dynamics and components of GDP for this Initial Scenario of Russia’s economic and energy development (bars labelled ‘1’). Such dynamics, when applied to the population and economy, correspond to a 39 per cent growth in domestic energy demand by 2040, 40 per cent of which is produced by electric power stations. Half of this demand is covered by natural gas (Figure 4.2, bars labelled ‘1’).This scenario assumes that the energy intensity of Russia’s GDP will decline by 57 per cent by 2040 – a faster rate than the world average. However, despite the high rate of this decline, the energy intensity of the Russian economy will still remain 75 per cent higher than the world average (in 2010, it exceeded the world average by 90 per cent).The Initial Scenario predicts a slight increase in energy exports by 2020, followed by stagnation and decline in total export volumes. The volume of oil and petroleum product exports will fall, while gas exports (especially LNG) will rise, (Figure 4.3, bars labelled ‘1’). Moreover, according to this scenario, even in 30 years’ time, Russia will be not only the world’s largest exporter of oil and gas, but also the largest producer.Such a position of internal and external demand corresponds to an increase in the production of primary energy by 20 per cent; this is mainly represented by gas, renewables, and nuclear energy production, while the share of oil will fall and the share of coal will stay unchanged (Figure 4.4, bars labelled ‘1’). Gas production, according to the Initial Scenario, will exceed 900 bcm per year, which is comparable only with US production. By 2030, oil production will stabilize at close to current volumes – 500m tons per year – comparable with Saudi Arabia and the USA.The parameters of the Initial Scenario namely: the dynamics of consumption and energy resource production in Russia; the costs of production, processing, and transport of oil and gas; the existing current export duties; and the taxation system in these industries – were extrapolated using optimization models of world energy markets. This was done for: (a) a feasibility analysis of these Initial Scenario parameters under severe
restrictions on the demand side, and competing suppliers in global energy markets;
(b) the identification of possible consequences (which could have an impact on Russia) of different outcomes of world energy development.

GLOBAL AND RUSSIAN ENERGY OUTLOOK UP TO 2040
ERI RAS – ACRF
89
Russian resources in world energy markets: external constraints
This modelling showed a significant decrease in Russian hydrocarbon export volumes to external markets, in comparison with Initial Scenario indicators.
In the Baseline Scenario forecast of volumes and prices in world markets, Russian oil was valued according to the costs of field and transport development (according to Goldman Sachs and oil companies’ estimates), and with applicable taxes taken into account. According to the results of the simulation, Russia turned out to be among the most expensive suppliers in the world market, being left with underutilized potential production (Figure 2.11). As a result, and taking into account the external market situation, Russian exports of oil and petroleum products will decline by 25–30 per cent after 2015 according to the Baseline Scenario, compared to the Initial Scenario, with a loss of $100–150bn of GDP per year (Figure 4.5, bars labelled ‘2’).
If oil export duties were to be lowered by 35 per cent (to $255/t), then the production and export of Russian oil would almost correspond to that in the Initial Scenario. However, the contribution of the oil sector to GDP would be reduced even further than if it operated tax free (Figure 4.5, bars labelled ‘3’). Thus, the preservation of the volume of Russian oil exports would not compensate for the loss in GDP caused by the necessary reduction in the export duty.
The country will lose another $20–25bn of GDP each year from decreased oil prices in the ‘Shale Breakthrough’ Scenario (Figure 4.5, bars labelled ‘4’).
In Baseline Scenario figures for volumes and prices on world markets, Russian gas was valued according to corporate publications on the cost of major investment projects, with applicable taxes taken into account. According to the results of global gas market modelling, Russia was among the suppliers that were lagging the furthest, and facing underutilization of potential production, in European and Asian regional markets (Figure 2.25). Taking into account the difficult situation in external markets, together with increased competition from other gas suppliers, after 2015 Russian gas exports will decline by 15–20 per cent more than estimated in the Initial variant of the Baseline Scenario. This implies a loss of $40–50bn of GDP per year (Figure 4.5, bars labelled ‘2’).
If Russia abolishes the current export duty for pipeline gas (30 per cent), the production and export of Russian gas will increase, but would not reach the levels seen in the Initial Scenario. In this case, as seen above in the case for oil, the gas sector’s contribution to GDP would be reduced by even more than if exports were tax free (Figure 4.5, bars labelled ‘3’), that is, the results of a fiscal stimulus of Russian gas exports would not compensate for the abolishment of the export duty.
GDP will be reduced by another $20–25bn per year as a result of lower gas prices in the ‘Shale Breakthrough’ Scenario (Figure 4.5, bars labelled ‘4’).
It is interesting to note that – even taking into account its possible new impetus – the negative consequences of the ‘shale revolution’ will have their greatest impact on Russia during the next 10–15 years, and they will gradually weaken by 2040.
Estimates of conditions in external markets show a decrease of 25–30 per cent in forecast volumes of Russian exports of oil and petroleum products after 2015, relative to the Initial Scenario, resulting in a loss of $100–150bn of GDP per year.
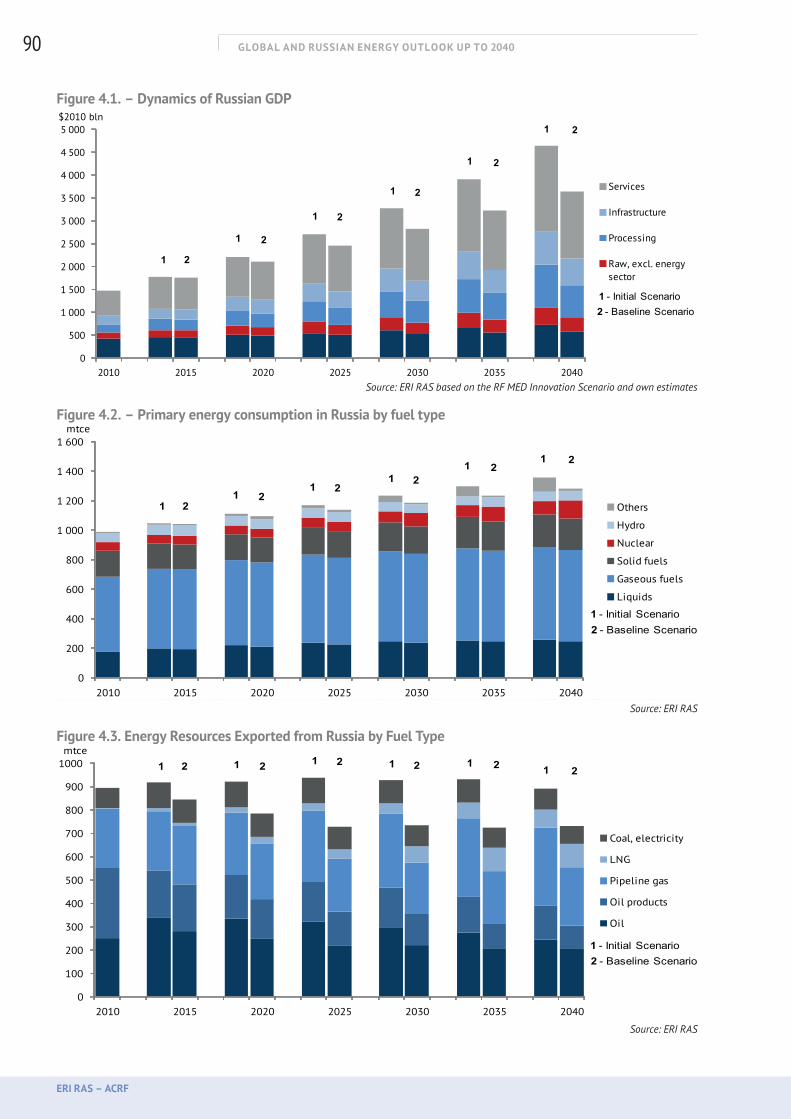
GLOBAL AND RUSSIAN ENERGY OUTLOOK UP TO 2040
ERI RAS – ACRF
90
Figure 4.1. – Dynamics of Russian GDP
0
500
1 000
1 500
2 000
2 500
3 000
3 500
4 000
4 500
5 000
2010 2015 2020 2025 2030 2035 2040
$2010 bln
Services
Infrastructure
Processing
Raw, excl. energy sector
1
2
2
2
2
2
2
1
1
1
1
1
2 - Baseline Scenario1 - Initial Scenario
Source: ERI RAS based on the RF MED Innovation Scenario and own estimates
Figure 4.2. – Primary energy consumption in Russia by fuel type
0
200
400
600
800
1 000
1 200
1 400
1 600
2010 2015 2020 2025 2030 2035 2040
mtce
Others
Hydro
Nuclear
Solid fuels
Gaseous fuels
Liquids
1 2
2121
2121
21
2 - Baseline Scenario1 - Initial Scenario
Source: ERI RAS
Figure 4.3. Energy Resources Exported from Russia by Fuel Type
0
100
200
300
400
500
600
700
800
900
1000
2010 2015 2020 2025 2030 2035 2040
mtce
Coal, electricity
LNG
Pipeline gas
Oil products
Oil
1 2 2121212121
2 - Baseline Scenario1 - Initial Scenario
Source: ERI RAS
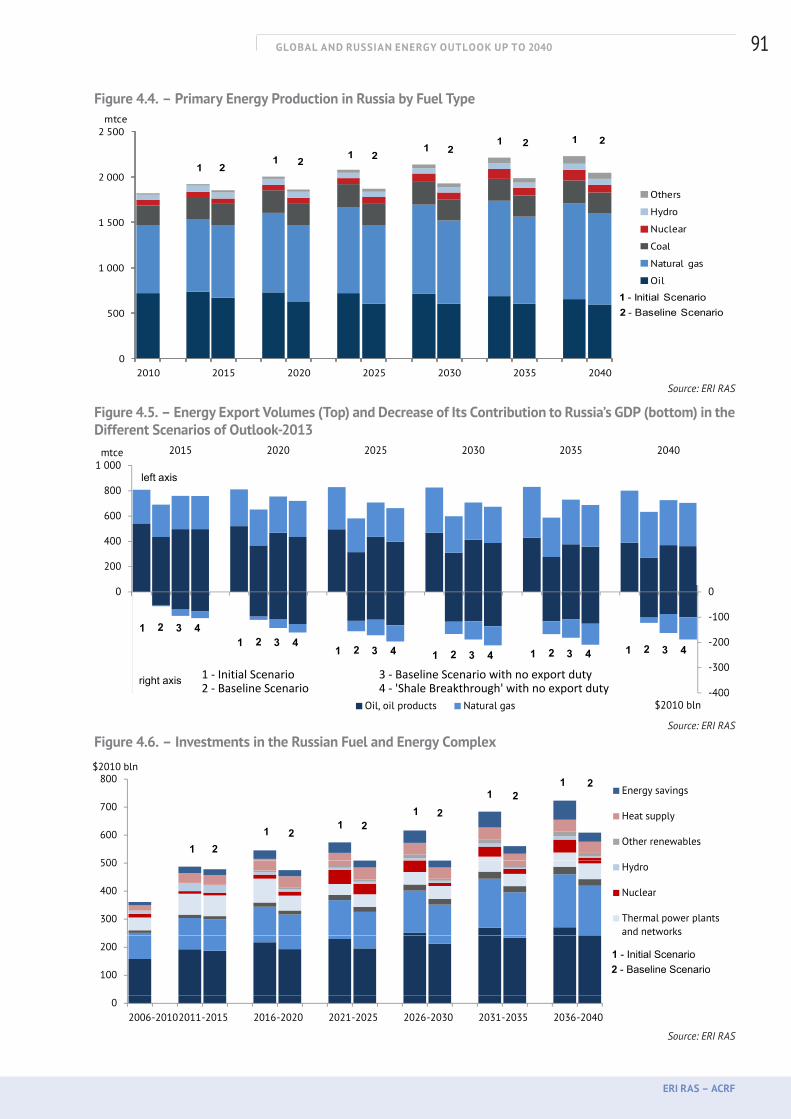
GLOBAL AND RUSSIAN ENERGY OUTLOOK UP TO 2040
ERI RAS – ACRF
91
Figure 4.4. – Primary Energy Production in Russia by Fuel Type
0
500
1 000
1 500
2 000
2 500
2010 2015 2020 2025 2030 2035 2040
mtce
Others
Hydro
Nuclear
Coal
Natural gas
Oil
1 2
212121
2121
2 - Baseline Scenario1 - Initial Scenario
Source: ERI RAS
Figure 4.5. – Energy Export Volumes (Top) and Decrease of Its Contribution to Russia’s GDP (bottom) in the Different Scenarios of Outlook-2013
-400
-300
-200
-100
0
100
200
300
400
500
-800
-600
-400
-200
0
200
400
600
800
1 0002015 2020 2025 2030 2035 2040
$2010 bln
mtce
Oil, oil products Natural gas
1 2 3 4
left axis
right axis
1 2 3 41 2 3 41 2 3 41 2 3 4
1 2 3 4
1 ‐ Initial Scenario 3 ‐ Baseline Scenario with no export duty2 ‐ Baseline Scenario 4 ‐ 'Shale Breakthrough' with no export duty
-400-800$2010 blnOil, oil products Natural gas
Source: ERI RAS
Figure 4.6. – Investments in the Russian Fuel and Energy Complex
700
800$2010 bln
Energy savings
Heat supply
2121
21
400
500
600
700
Energy savings
Heat supply
Other renewables
Hydro
Nuclear
1 2
221
2121
21
200
300
400
500 Hydro
Nuclear
Thermal power plants and networks
2 B li S i1 - Initial Scenario
0
100
200
2006-20102011-2015 2016-2020 2021-2025 2026-2030 2031-2035 2036-2040
2 - Baseline Scenario1 - Initial Scenario
02006-20102011-2015 2016-2020 2021-2025 2026-2030 2031-2035 2036-2040
Source: ERI RAS
-400
-300
-200
-100
0
100
200
300
400
500
-800
-600
-400
-200
0
200
400
600
800
1 0002015 2020 2025 2030 2035 2040
$2010 bln
mtce
Oil, oil products Natural gas
1 2 3 4
left axis
right axis
1 2 3 41 2 3 41 2 3 41 2 3 4
1 2 3 4
1 ‐ Initial Scenario 3 ‐ Baseline Scenario with no export duty2 ‐ Baseline Scenario 4 ‐ 'Shale Breakthrough' with no export duty
-400-800$2010 blnOil, oil products Natural gas
-400
-300
-200
-100
0
100
200
300
400
500
-800
-600
-400
-200
0
200
400
600
800
1 0002015 2020 2025 2030 2035 2040
$2010 bln
mtce
Oil, oil products Natural gas
1 2 3 4
left axis
right axis
1 2 3 41 2 3 41 2 3 41 2 3 4
1 2 3 4
1 ‐ Initial Scenario 3 ‐ Baseline Scenario with no export duty2 ‐ Baseline Scenario 4 ‐ 'Shale Breakthrough' with no export duty
-400-800$2010 blnOil, oil products Natural gas
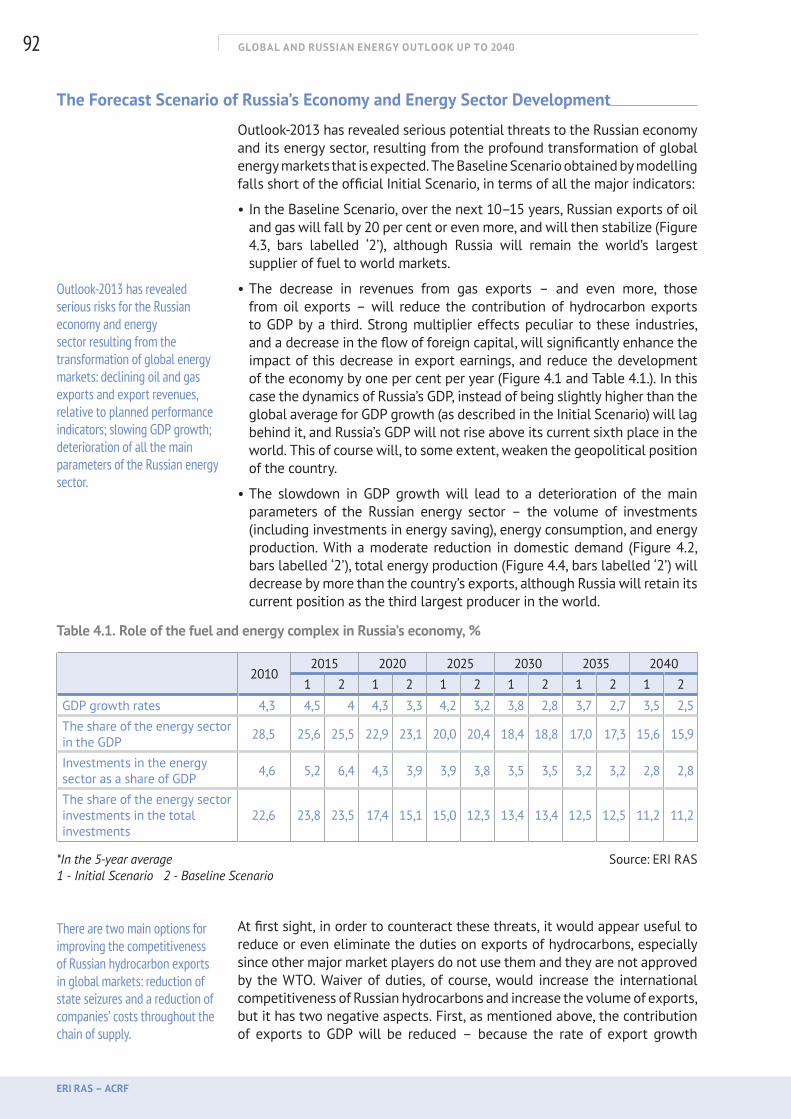
GLOBAL AND RUSSIAN ENERGY OUTLOOK UP TO 2040
ERI RAS – ACRF
92
The Forecast Scenario of Russia’s Economy and Energy Sector Development
Outlook-2013 has revealed serious potential threats to the Russian economy and its energy sector, resulting from the profound transformation of global energy markets that is expected. The Baseline Scenario obtained by modelling falls short of the official Initial Scenario, in terms of all the major indicators:
• In the Baseline Scenario, over the next 10–15 years, Russian exports of oil and gas will fall by 20 per cent or even more, and will then stabilize (Figure 4.3, bars labelled ‘2’), although Russia will remain the world’s largest supplier of fuel to world markets.
• The decrease in revenues from gas exports – and even more, those from oil exports – will reduce the contribution of hydrocarbon exports to GDP by a third. Strong multiplier effects peculiar to these industries, and a decrease in the flow of foreign capital, will significantly enhance the impact of this decrease in export earnings, and reduce the development of the economy by one per cent per year (Figure 4.1 and Table 4.1.). In this case the dynamics of Russia’s GDP, instead of being slightly higher than the global average for GDP growth (as described in the Initial Scenario) will lag behind it, and Russia’s GDP will not rise above its current sixth place in the world. This of course will, to some extent, weaken the geopolitical position of the country.
• The slowdown in GDP growth will lead to a deterioration of the main parameters of the Russian energy sector – the volume of investments (including investments in energy saving), energy consumption, and energy production. With a moderate reduction in domestic demand (Figure 4.2, bars labelled ‘2’), total energy production (Figure 4.4, bars labelled ‘2’) will decrease by more than the country’s exports, although Russia will retain its current position as the third largest producer in the world.
Table 4.1. Role of the fuel and energy complex in Russia’s economy, %
2010
2015 2020 2025 2030 2035 2040
1 2 1 2 1 2 1 2 1 2 1 2
GDP growth rates 4,3 4,5 4 4,3 3,3 4,2 3,2 3,8 2,8 3,7 2,7 3,5 2,5
The share of the energy sector in the GDP 28,5 25,6 25,5 22,9 23,1 20,0 20,4 18,4 18,8 17,0 17,3 15,6 15,9
Investments in the energy sector as a share of GDP 4,6 5,2 6,4 4,3 3,9 3,9 3,8 3,5 3,5 3,2 3,2 2,8 2,8
The share of the energy sector investments in the total investments
22,6 23,8 23,5 17,4 15,1 15,0 12,3 13,4 13,4 12,5 12,5 11,2 11,2
*In the 5-year average Source: ERI RAS1 - Initial Scenario 2 - Baseline Scenario
At first sight, in order to counteract these threats, it would appear useful to reduce or even eliminate the duties on exports of hydrocarbons, especially since other major market players do not use them and they are not approved by the WTO. Waiver of duties, of course, would increase the international competitiveness of Russian hydrocarbons and increase the volume of exports, but it has two negative aspects. First, as mentioned above, the contribution of exports to GDP will be reduced – because the rate of export growth
Outlook-2013 has revealed serious risks for the Russian economy and energy sector resulting from the transformation of global energy markets: declining oil and gas exports and export revenues, relative to planned performance indicators; slowing GDP growth; deterioration of all the main parameters of the Russian energy sector.
There are two main options for improving the competitiveness of Russian hydrocarbon exports in global markets: reduction of state seizures and a reduction of companies’ costs throughout the chain of supply.
GLOBAL AND RUSSIAN ENERGY OUTLOOK UP TO 2040
ERI RAS – ACRF
93
would be less than the loss incurred due to the decrease of duties imposed on the entire export volume. Second, it would lead to an increase in domestic prices for gas and oil products, which would curb economic development and reduce the added value of most types of economic activities, which in turn would further slow down the country’s economy.
A truly effective means of countering external challenges would be a dramatic increase in both the investment efficiency of the Russian energy sector and in the energy efficiency of the economy as a whole. Russia has a number of unique potentialities in respect of both these courses of action. Indeed, the Russian energy sector has already undertaken huge capital investments and it will grow, in accordance with approved plans for the development of energy industries, to reach an unprecedented 6–7 per cent of GDP (Table 4.1) (the global average is about 1.3–1.5 per cent of GDP).
However, Russia’s national economy has one of the world’s lowest indicators of GDP production per unit of consumed energy (three times less than the global average), and by 2040, according to this Outlook, this gap will hardly have been reduced.
The elimination of such wastage would require two concerted groups of measures – innovative-technological and economic-organizational. The first one is strategic and requires long-term, continuous application. The second group of measures could produce quite rapid and efficient results – which are required for the expected global turbulence.
The first goal of the Russian energy industry’s economic and organizational measures should be a radical reduction in the cost of investment projects, together with a thorough evaluation of their cost-effectiveness and potential risks. It is advisable to rank investment projects – including those aimed at the diversification of routes, products, and markets – and reject or postpone the implementation of inefficient ones. This is confirmed by the results of work done by foreign and Russian experts, who analysed the cost of domestic energy projects, showing that they were typically several times more expensive compared to existing analogous projects found elsewhere4, while those projects that were completed were underutilized for years5.
The second necessary, but not sufficient, prerequisite for improving the efficiency and reducing the risks of investment projects is extensive study of the prospects for foreign and domestic energy markets. The new publication of this research demonstrates possible approaches, enhanced instruments, and new results, but it is still insufficient to fully assess the economic and, especially, commercial viability of certain projects. Russia certainly needs a mechanism for continuous monitoring and alignment of export policies (followed by precise tactical actions), and the creation of a Russian system for forecasting the prospects of energy market developments, armed with the ability to analyse their sensitivity to a variety of factors, including the behaviour of the main market players, would be a great step forward.
Nevertheless, the main condition for increasing the competitiveness of the Russian fuel and energy complex is a radical improvement in the quality of public, and especially corporate, governance. The latter can play an important role in attracting foreign partners into the consortia engaged
4 For instance, the costs of Russian gas investment projects used in our estimates (taken from corporate publications), exceed twofold their international assessment simulated by the NEXANT gas model.
5 For instance, the ‘Blue Stream’ gas pipeline, intended for the supply of natural gas across the Black Sea to Turkey, has operated at less than 50 per cent of its throughput capacity for 10 years.
The main goal should be a radical reduction in the cost of investment projects – it is advisable to rank investment projects, declining or postponing the implementation of inefficient plans.
GLOBAL AND RUSSIAN ENERGY OUTLOOK UP TO 2040
ERI RAS – ACRF
94
in resource development (this refers especially to the eastern part of the country, the coastal shelf, and deposits of unconventional hydrocarbons). If properly managed, it would enable the country to:
• attract foreign investment and apply advanced technology;
• develop types of business activities with potential, under new conditions;
• ensure tight control over costs and other business results;
• obtain additional assurances for product sales; and
• facilitate access to logistics and adapt to the rules of international markets.
Preliminary estimates show that if such measures are taken in a timely manner, it will be possible to compensate for the negative effects of the forthcoming transformations of global energy markets, and return the Russian economy and energy sector to the ambitious indicators of the Initial Scenario.

GLOBAL AND RUSSIAN ENERGY OUTLOOK UP TO 2040
ERI RAS – ACRF
95
Appendixes
GLOBAL AND RUSSIAN ENERGY OUTLOOK UP TO 2040
ERI RAS – ACRF
96
APPENDIXES Appendix 1. Methodology
The world energy model incorporated in the SCANER modelling and information complex consists of a group of interconnected modules that enable the performance of a consistent computation of indicators on the basis of optimization, econometric analysis, and balance approach.The calculation base is very detailed: it contains 12 CIS countries, 37 European countries – in total 192 nodes. The world forecast is linked with a detailed prognosis for the Russian fuel and energy complex, which makes it possible to assess the risks and prospects for the functioning of the Russian energy sector in the global context.The basis of the retrospective information on the majority of energy indicators is International Energy Agency (IEA) data.The demand for primary energy, electricity, and liquid fuels (oil products, etc.) is calculated based on the forecasted indicators of economic development (GDP) and demography (Figure P1). The resulting demand for electrical power is transferred to the electric power generation module, where it is combined with appropriate fuel types, and with a factor relating to energy efficiency. The results are directed then to the balance module, whose task is to find a rational option for supplying existing energy demand.Energy policy has a significant impact on the future development of renewable energy (for generation) and the use of nuclear energy. Therefore, these indicators are calculated in separate modules. These include the structure of existing, under construction, and planned capacities, and assumptions for economic efficiency and energy policies of individual countries.The main objective of all the resource modules is to find solutions to the optimization objective of minimizing the total costs of meeting energy demand, taking into account the economic feasibility of fuel substitutions. The volumes and economic parameters of the potential substitution of liquid and gaseous fuels are set out in threshold volumes for each node. The competitive potential of natural gas is estimated in relation to coal, nuclear energy, and renewable energy in electricity production; the competitiveness of oil fuels is compared with biofuels, natural gas, and coal (GTL, CNG, CTL), and with electricity (transition to electric vehicles).The model of the liquid fuels market, based on the results of the optimization, determines: demand for oil and other alternative fuels by node; the volume of capacities involved in production, transportation, and processing; and the total specific costs required for meeting the demand (balance prices). Oil production is displayed in accordance with the type of oil (conventional, shale, etc.); oil products are divided into six types. The model contains more than 2000 routes of pipeline, rail, and sea transportation, as well as data on 872 refineries.The gas model encompasses the market for all gas fuels. The model, based on the results of optimization, determines: how much gas and other fuels, in accordance with the nodes, will be in demand; gas production volumes; the rate of utilization of transport capacities and prices (spot, and associated with long-term oil-linked contracts). The model contains 393 gas transportation corridors connecting the nodes in all regions of the world, and 1916 routes of LNG delivered by tankers.The coal model covers the entire market of solid fuels. The model determines the required amounts of fuel production in accordance with the nodes, their prices, and supply routes.For large countries, the resource modules integrate several nodes.After determining the consumption amounts for each type of fuel, CO2 emissions are estimated.
Calculation is conducted for each country (node). The resource modules are more detailed.
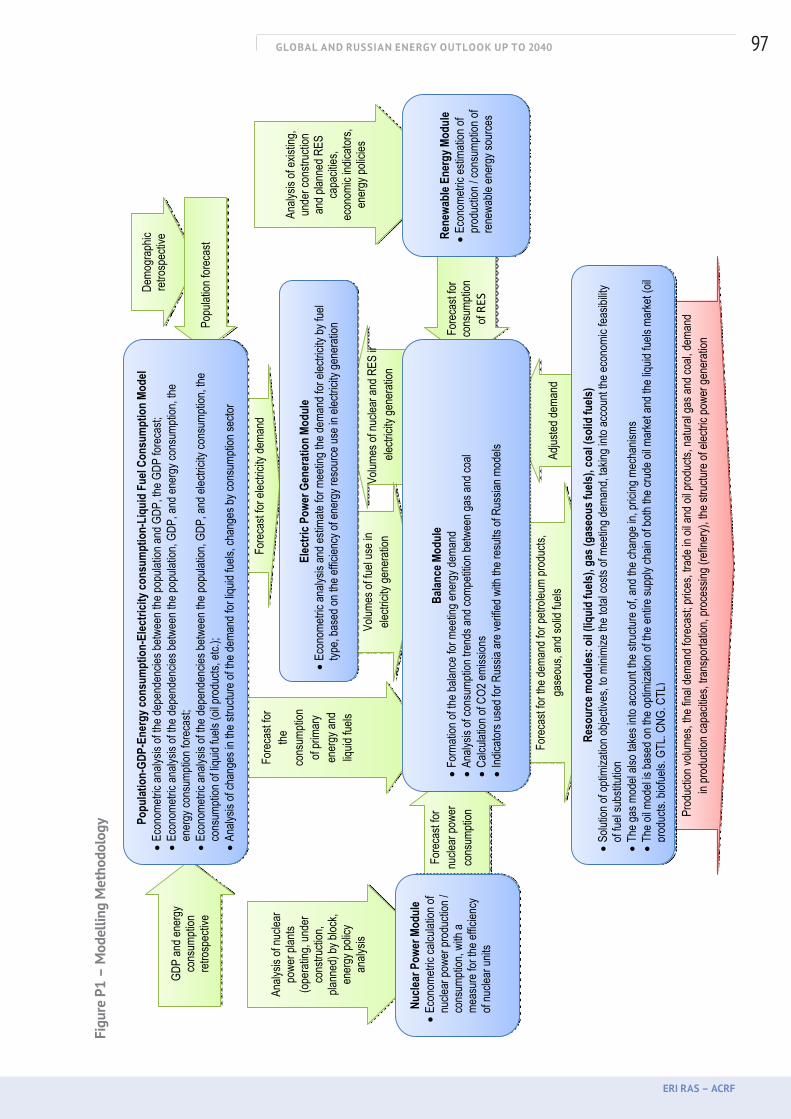
GLOBAL AND RUSSIAN ENERGY OUTLOOK UP TO 2040
ERI RAS – ACRF
97
Volum
es of
nucle
ar an
d RES
inele
ctrici
ty ge
nera
tion
Analy
sis of
exist
ing,
unde
r con
struc
tion
and p
lanne
d RES
ca
pacit
ies,
econ
omic
indica
tors,
ener
gy po
licies
Fore
cast
for
cons
umpti
on
of RE
S
Analy
sis of
nucle
ar
powe
r plan
ts (o
pera
ting,
unde
r co
nstru
ction
, pla
nned
) by b
lock,
ener
gy p
olicy
an
alysis
Vo
lumes
of fu
el us
e in
electr
icity
gene
ratio
n
Fore
cast
for el
ectric
ity de
mand
Demo
grap
hic
retro
spec
tive
Popu
lation
fore
cast
Adjus
ted de
mand
Fo
reca
st for
the d
eman
d for
petro
leum
prod
ucts,
ga
seou
s, an
d soli
d fue
ls
GDP
and e
nerg
y co
nsum
ption
re
trosp
ectiv
e
Fore
cast
for
nucle
ar po
wer
cons
umpti
on
Fore
cast
for
the
cons
umpti
on
of pr
imar
y en
ergy
and
liquid
fuels
Popu
latio
n-GD
P-En
ergy
cons
umpt
ion-
Elec
tricit
y con
sum
ptio
n-Li
quid
Fue
l Con
sum
ptio
n Mo
del
Ec
onom
etric
analy
sis of
the d
epen
denc
ies be
twee
n the
popu
lation
and G
DP, th
e GDP
fore
cast;
Econ
ometr
ic an
alysis
of th
e dep
ende
ncies
betw
een t
he po
pulat
ion, G
DP, a
nd en
ergy
cons
umpti
on, th
e en
ergy
cons
umpti
on fo
reca
st;
Ec
onom
etric
analy
sis of
the d
epen
denc
ies be
twee
n the
popu
lation
, GDP
, and
elec
tricity
cons
umpti
on, th
e co
nsum
ption
of liq
uid fu
els (o
il pro
ducts
, etc.
);
Analy
sis of
chan
ges i
n the
stru
cture
of th
e dem
and f
or liq
uid fu
els, c
hang
es by
cons
umpti
on se
ctor
Balan
ce M
odul
e
Form
ation
of th
e bala
nce f
or m
eetin
g ene
rgy d
eman
d
Analy
sis of
cons
umpti
on tr
ends
and c
ompe
tition
betw
een g
as an
d coa
l
Calcu
lation
of C
O2 em
ission
s
Indica
tors u
sed f
or R
ussia
are v
erifie
d with
the r
esult
s of R
ussia
n mod
els
Prod
uctio
n volu
mes,
the fin
al de
mand
fore
cast;
price
s, tra
de in
oil a
nd oi
l pro
ducts
, natu
ral g
as an
d coa
l, dem
and
in pr
oduc
tion c
apac
ities,
trans
porta
tion,
proc
essin
g (re
finer
y), th
e stru
cture
of el
ectric
powe
r gen
erati
on
Reso
urce
mod
ules
: oil (
liqui
d fu
els),
gas (
gase
ous f
uels)
, coa
l (so
lid fu
els)
So
lution
of op
timiza
tion o
bjecti
ves,
to mi
nimize
the t
otal c
osts
of me
eting
dema
nd, ta
king i
nto ac
coun
t the e
cono
mic f
easib
ility
of fue
l sub
stitut
ion
Th
e gas
mod
el als
o tak
es in
to ac
coun
t the s
tructu
re of
, and
the c
hang
e in,
prici
ng m
echa
nisms
The o
il mod
el is
base
d on t
he op
timiza
tion o
f the e
ntire
supp
ly ch
ain of
both
the cr
ude o
il mar
ket a
nd th
e liqu
id fue
ls ma
rket (
oil
prod
ucts,
biofu
els, G
TL, C
NG, C
TL)
Elec
tric P
ower
Gen
erat
ion
Modu
le
Ec
onom
etric
analy
sis an
d esti
mate
for m
eetin
g the
dema
nd fo
r elec
tricity
by fu
el typ
e, ba
sed o
n the
effic
iency
of en
ergy
reso
urce
use i
n elec
tricity
gene
ratio
n
Nucle
ar P
ower
Mod
ule
Ec
onom
etric
calcu
lation
of
nucle
ar po
wer p
rodu
ction
/ co
nsum
ption
, with
a me
asur
e for
the e
fficien
cy
of nu
clear
units
Rene
wabl
e Ene
rgy M
odul
e
Econ
ometr
ic es
timati
on of
pr
oduc
tion /
cons
umpti
on of
re
newa
ble en
ergy
sour
ces
Figu
re P
1 –
Mod
ellin
g M
etho
dolo
gy
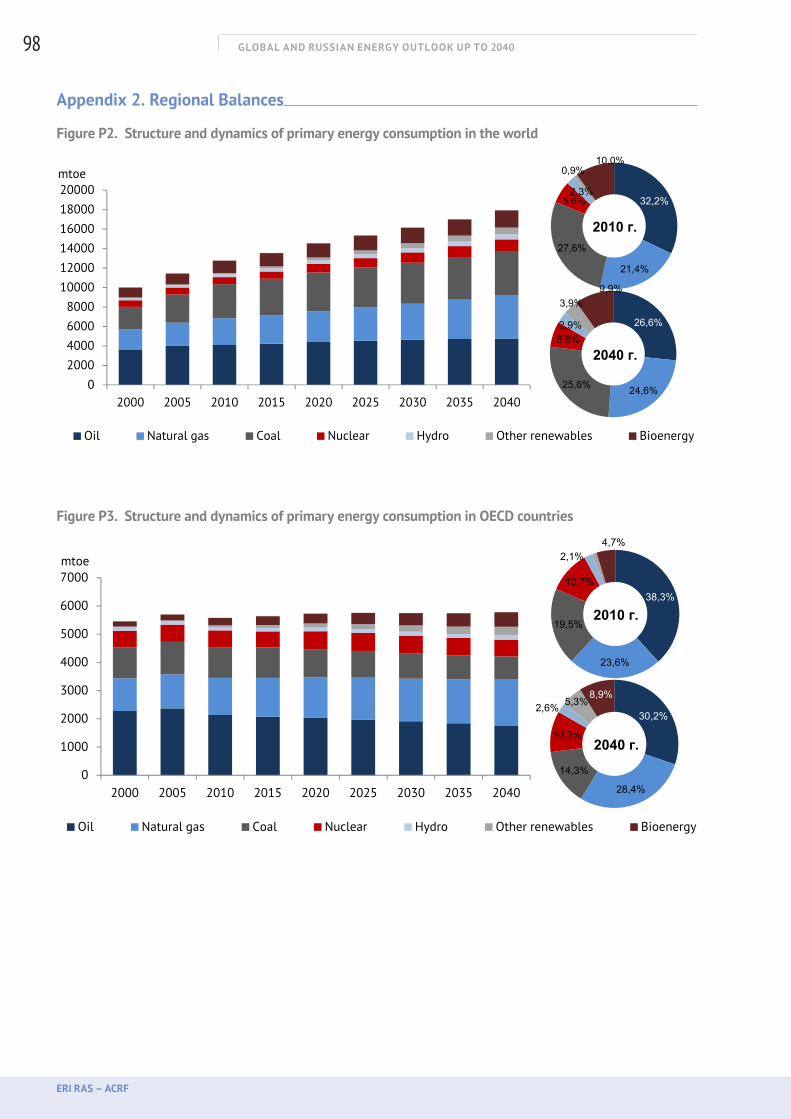
GLOBAL AND RUSSIAN ENERGY OUTLOOK UP TO 2040
ERI RAS – ACRF
98
Appendix 2. Regional Balances
Figure P2. Structure and dynamics of primary energy consumption in the world4405,1644587,8071181,288513 2527
20000mtoe 0,9%
10,0%
513,2527698,13411768,877
160001800020000mtoe
32,2%5,6%2,3%
0,9%10,0%
2010 г.
80001000012000140001600018000
32,2%
21,4%
27,6%
5,6%
2010 г.
3,9%9,9%
2000400060008000
10000
26,6%6,6%2,9%
3,9%9,9%
2040 г.млн. т н.э.
020004000
2000 2005 2010 2015 2020 2025 2030 2035 204024,6%25,6%
6,6%2040 г.
02000 2005 2010 2015 2020 2025 2030 2035 2040
Oil Natural gas Coal Nuclear Hydro Other renewables Bioenergy
24,6%25,6%
Figure P3. Structure and dynamics of primary energy consumption in OECD countries2040
1744,3561642,688825 026
mtoe 2,1%4,7%
825,026597,8375147,3302304 7933 6000
7000mtoe
38,3%10,7%
2,1%4,7%
2010 г304,7933514,65082957,939
3000
4000
5000
6000
700038,3%
23,6%
19,5%
10,7%
2010 г.
1000
2000
3000
4000 23,6%
30,2%
10,3%
2,6% 5,3%8,9%
2040 г
0
1000
2000
2000 2005 2010 2015 2020 2025 2030 2035 2040
30,2%
28,4%
14,3%
10,3%
2,6% ,
2040 г.
02000 2005 2010 2015 2020 2025 2030 2035 2040
Oil Natural gas Coal Nuclear Hydro Other renewables Bioenergy
28,4%
14,3%
Oil Natural gas Coal Nuclear Hydro Other renewables Bioenergy
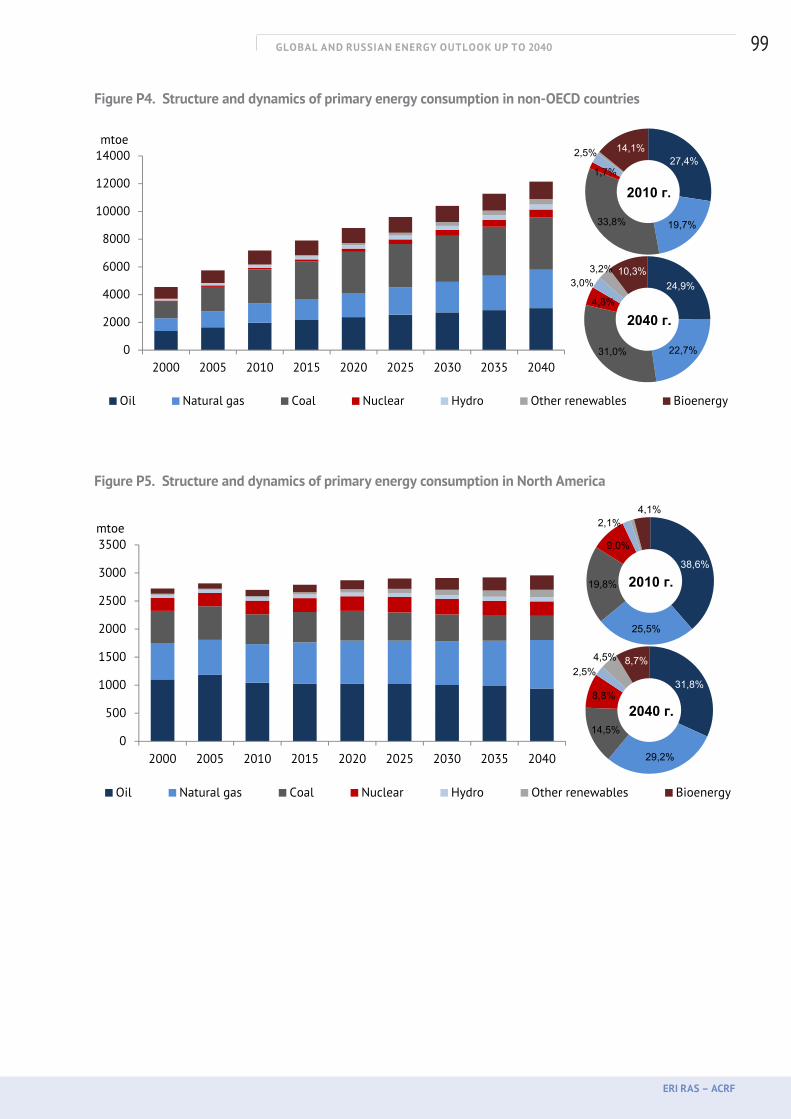
GLOBAL AND RUSSIAN ENERGY OUTLOOK UP TO 2040
ERI RAS – ACRF
99
Figure P4. Structure and dynamics of primary energy consumption in non-OECD countries
20403028,95
2762,4763762 7813762,781583,4503365,9225393 3408
12000
14000mtoe
27,4%1,7%
2,5% 14,1%
393,34081254,22612151,15
8000
10000
12000
14000mtoe
27,4%
19,7%33,8%
1,7%
2,5% 14,1%
2010 г.
4000
6000
800019,7%33,8%
24,9%4,8%
3,0%3,2% 10,3%
0
2000
4000
600024,9%
22,7%31,0%
4,8%
3,0%3,2% 10,3%
2040 г.
0
2000
2000 2005 2010 2015 2020 2025 2030 2035 2040
Oil Natural gas Coal Nuclear Hydro Other renewables Bioenergy
22,7%31,0%
2040 г.
Oil Natural gas Coal Nuclear Hydro Other renewables Bioenergy
Figure P5. Structure and dynamics of primary energy consumption in North America2040
940,9368864 4105 4,1%864,4105430,1252259,175274 5851
3000
3500mtoe
38,6%
9,0%
2,1%4,1%
74,5851131,8518256,85482957,939
2000
2500
3000
3500mtoe
38,6%
25,5%
19,8%
9,0%
2010 г.
,
1000
1500
2000
2500
25,5%
31,8%8 8%
2,5%4,5% 8,7%
0
500
1000
1500
31,8%
14,5%
8,8%
2,5%4,5% 8,7%
2040 г.
0
500
2000 2005 2010 2015 2020 2025 2030 2035 2040
Oil Natural gas Coal Nuclear Hydro Other renewables Bioenergy
29,2%
14,5%
2040 г.
Oil Natural gas Coal Nuclear Hydro Other renewables Bioenergy
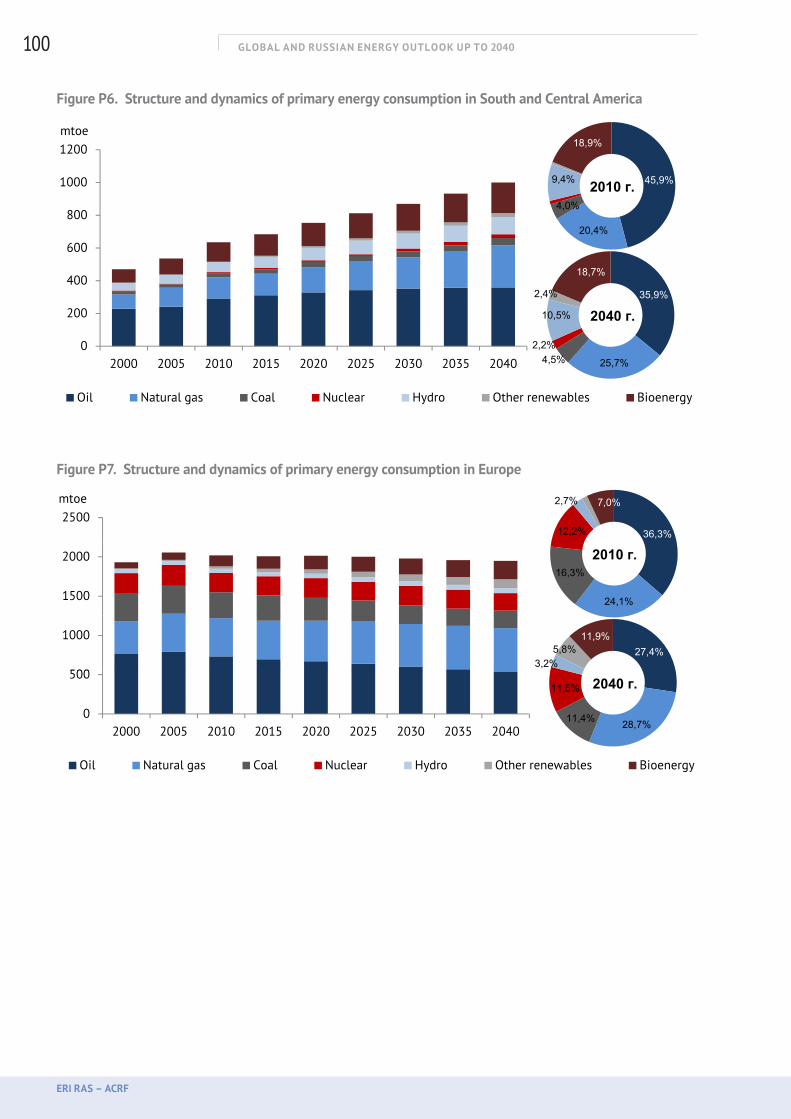
GLOBAL AND RUSSIAN ENERGY OUTLOOK UP TO 2040
ERI RAS – ACRF
100
Figure P6. Structure and dynamics of primary energy consumption in South and Central America2040
359,2923256 5869 1200
mtoe18,9%256,5869
45,269922,45434105 4226
1000
1200mtoe
45,9%
4 0%
9,4%
18,9%
2010 г.105,4226
24,265186,81551000,107
400
600
800
1000 45,9%
20,4%
4,0%
9,4% 2010 г.
18,7%,
200
400
600
35,9%
10,5%
2,4%
18,7%
2040 г.
0
200
2000 2005 2010 2015 2020 2025 2030 2035 2040
35,9%
25,7%4,5%2,2%
10,5%
,
2040 г.
2000 2005 2010 2015 2020 2025 2030 2035 2040
Oil Natural gas Coal Nuclear Hydro Other renewables Bioenergy
25,7%4,5%
Figure P7. Structure and dynamics of primary energy consumption in Europe2040
533,865559 213 2500
mtoe 2,7% 7,0%559,213
221,9529224,231662 81722
2000
2500mtoe
36,3%
16,3%
12,2%
2,7% 7,0%
2010 г.62,81722113,5738232,76471948,418
1000
1500
2000
24,1%
16,3%2010 г.
27 4%5,8%11,9%
,
500
100027,4%
11,5%
3,2%5,8%
11,9%
2040 г.
0
500
2000 2005 2010 2015 2020 2025 2030 2035 2040
Oil Natural gas Coal Nuclear Hydro Other renewables Bioenergy
28,7%11,4%
11,5% 2040 г.
2000 2005 2010 2015 2020 2025 2030 2035 2040
Oil Natural gas Coal Nuclear Hydro Other renewables Bioenergy
28,7%

GLOBAL AND RUSSIAN ENERGY OUTLOOK UP TO 2040
ERI RAS – ACRF
101
Figure P8. Structure and dynamics of primary energy consumption in the CIS2040
260,9246698 4154 1600
mtoe19,4%6,6%
2,0% 1,0%
698,4154149,4079156,458229 14123 1200
1400
1600mtoe
19,4%
18,2%
6,6%
2,0% ,
2010 г.29,1412317,4052636,5031
1348,256600
800
1000
1200
1400
52,7%
2010 г.
19,4%11,6%
2,2% 2,7%,
200
400
600
800
19,4%
11,1%
11,6%
2,2% 2,7%
2040 г.
0
200
00
2000 2005 2010 2015 2020 2025 2030 2035 2040
Oil N t l C l N l H d Oth bl Bi
51,8%
11,1% 2040 г.
2000 2005 2010 2015 2020 2025 2030 2035 2040
Oil Natural gas Coal Nuclear Hydro Other renewables Bioenergy
51,8%
Figure P9. Structure and dynamics of primary energy consumption in OECD Asia
1000mtoe
12,4%
1,2% 1,9%
700800900
1000mtoe
40,6%
26,3%
12,4%
1,2% ,
2010 г.
300400500600700800900 40,6%
16,9%
26,3%2010 г.
29 7%
1,4% 6,5%
3,4%
100200300400500
29,7%14,1%
1,4% 6,5%
3,4%
2040 г.
0100200
2000 2005 2010 2015 2020 2025 2030 2035 2040
Oil N t l C l N l H d Oth bl Bi
24,1%20,8%
2040 г.
2000 2005 2010 2015 2020 2025 2030 2035 2040
Oil Natural gas Coal Nuclear Hydro Other renewables Bioenergy
24,1%
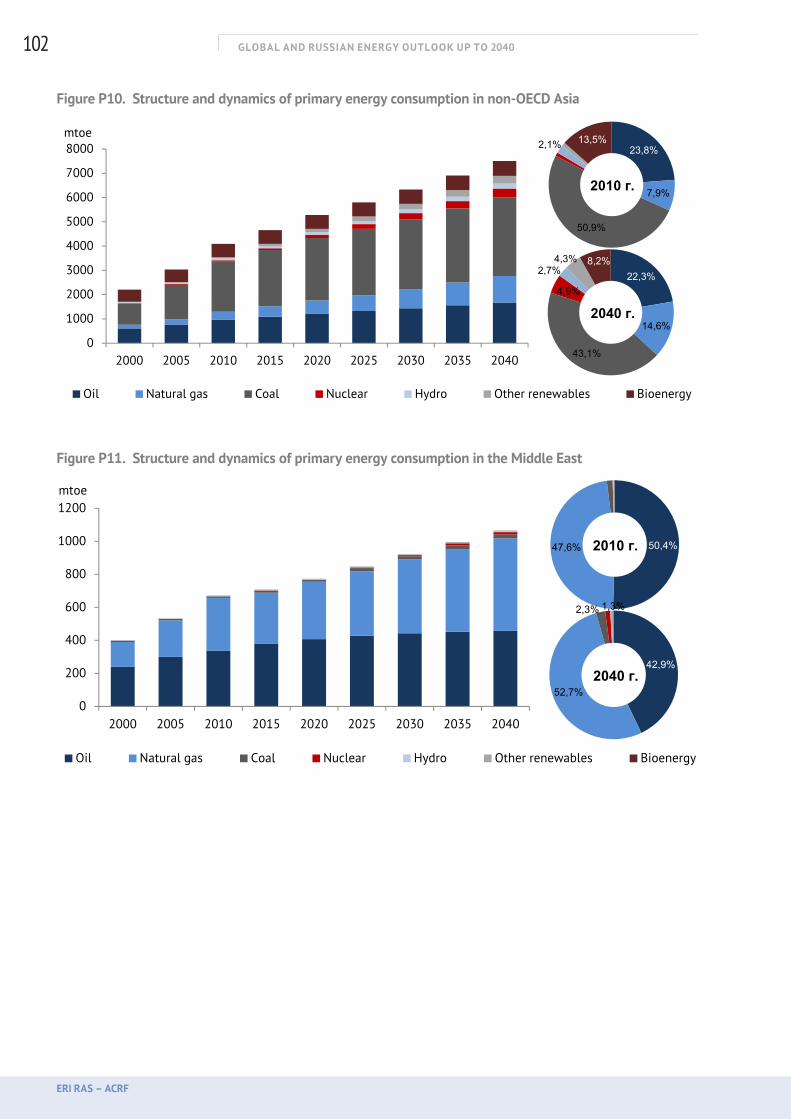
GLOBAL AND RUSSIAN ENERGY OUTLOOK UP TO 2040
ERI RAS – ACRF
102
Figure P10. Structure and dynamics of primary energy consumption in non-OECD Asia
8000mtoe
23,8%2,1% 13,5%
6000
7000
8000mtoe
23,8%
7,9%
2,1% 13,5%
2010 г.
3000
4000
5000
6000
70007,9%
50,9%
2010 г.
22,3%2,7%4,3% 8,2%
1000
2000
3000
4000
22,3%
14,6%
4,9%
2,7%4,3% 8,2%
2040 г.
0
1000
000
2000 2005 2010 2015 2020 2025 2030 2035 2040
Oil N t l C l N l H d Oth bl Bi
14,6%
43,1%
2040 г.
2000 2005 2010 2015 2020 2025 2030 2035 2040
Oil Natural gas Coal Nuclear Hydro Other renewables Bioenergy
43,1%
Figure P11. Structure and dynamics of primary energy consumption in the Middle East
mtoe
1000
1200mtoe
50,4%47,6% 2010 г.
600
800
1000 50,4%47,6% 2010 г.
2,3% 1,3%
200
400
600
42,9%
2,3% 1,3%
2040 г.
0
200
400
2000 2005 2010 2015 2020 2025 2030 2035 2040
42,9%
52,7%2040 г.
02000 2005 2010 2015 2020 2025 2030 2035 2040
Oil Natural gas Coal Nuclear Hydro Other renewables Bioenergy

GLOBAL AND RUSSIAN ENERGY OUTLOOK UP TO 2040
ERI RAS – ACRF
103
Figure P12. Structure and dynamics of primary energy consumption in Africa
mtoe
1200
1400
mtoe22,5%
47,4% 2010 г.
600
800
1000
1200
,
12,5%
15,7%
47,4% 2010 г.
200
400
600
800 15,7%
23,4%34,2%
2040 г.
0
200
400
2000 2005 2010 2015 2020 2025 2030 2035 2040
23,4%
12,9%
24,1%2,0%
2,4%
34,2%
2040 г.
02000 2005 2010 2015 2020 2025 2030 2035 2040
Oil Natural gas Coal Nuclear Hydro Other renewables Bioenergy
24,1%2,0%
2,4%
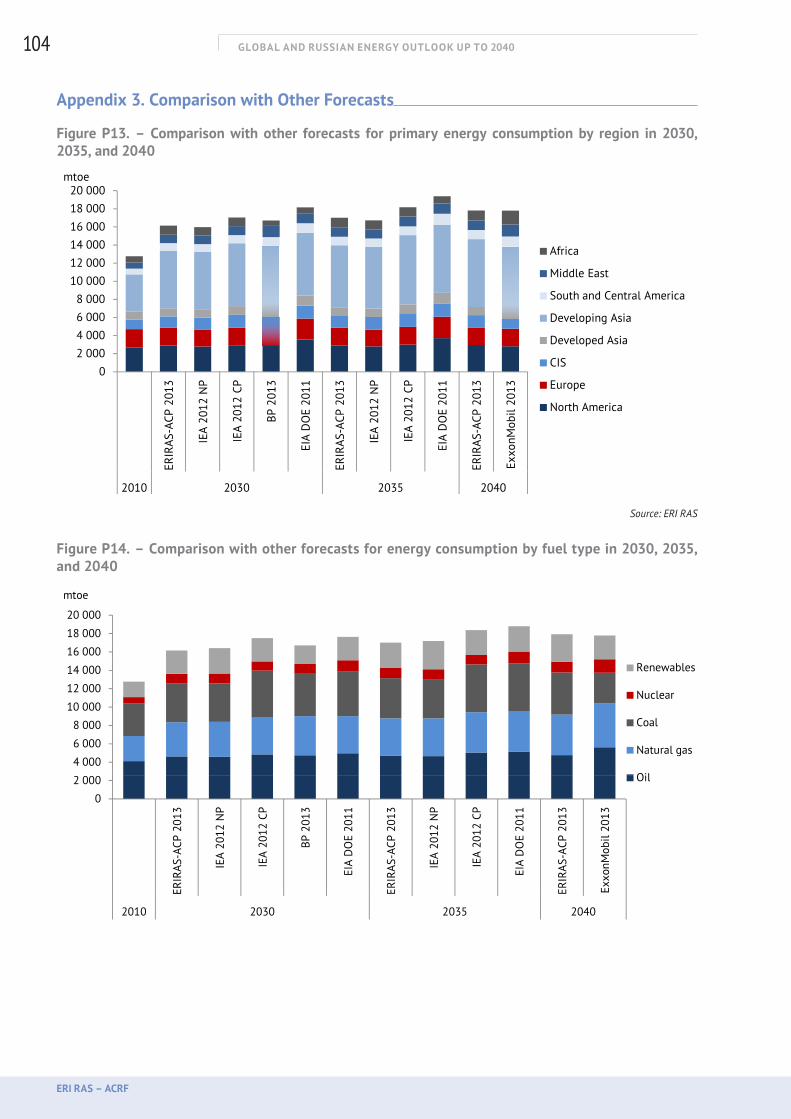
GLOBAL AND RUSSIAN ENERGY OUTLOOK UP TO 2040
ERI RAS – ACRF
104
Appendix 3. Comparison with Other Forecasts
Figure P13. – Comparison with other forecasts for primary energy consumption by region in 2030, 2035, and 2040
2 0004 0006 0008 000
10 00012 00014 00016 00018 00020 000
mtoe
Africa
Middle East
South and Central America
Developing Asia
Developed Asia
02 000
ERIR
AS-A
CP 2
013
IEA
2012
NP
IEA
2012
CP
ВР 2
013
EIA
DO
E 20
11
ERIR
AS-A
CP 2
013
IEA
2012
NP
IEA
2012
CP
EIA
DO
E 20
11
ERIR
AS-A
CP 2
013
Exxo
nMob
il 20
13
2010 2030 2035 2040
CIS
Europe
North America
Source: ERI RAS
Figure P14. – Comparison with other forecasts for energy consumption by fuel type in 2030, 2035, and 2040
4 000
6 000
8 000
10 000
12 000
14 000
16 000
18 000
20 000
mtoe
Renewables
Nuclear
Coal
Natural gas
Oil
0
2 000
ERIR
AS-A
CP 2
013
IEA
2012
NP
IEA
2012
CP
ВР 2
013
EIA
DO
E 20
11
ERIR
AS-A
CP 2
013
IEA
2012
NP
IEA
2012
CP
EIA
DO
E 20
11
ERIR
AS-A
CP 2
013
Exxo
nMob
il 20
13
2010 2030 2035 2040
Oil
GLOBAL AND RUSSIAN ENERGY OUTLOOK UP TO 2040
ERI RAS – ACRF
105
Bibliography
[1] – A. A. Makarov, F. V. Veselov, O. A. Eliseeva, V. A. Kulagin, V. A. Malakhov, T. A. Mitrova, S. P. Filippov, Scanner – a Modelling Information Complex, ERI RAS, 2011, P. 14–25.
[2] – E. V. Grushevenko, D. A. Grushevenko, Unconventional Oil Potential Tends to Change the World Oil Market, CS Canada Energy Science and Technology, 2012, Vol.4, №1, 68–74.
[3] – A. O. Goryachev, E. V. Grushevenko, D. A. Grushevenko, Assessment of the Impact of Potential Shocks to the World Oil Market Using a Forecast Model of the World Oil Market, Oil, Gas and Business Journal, № 6, 2013 (in press).
[4] – A. A. Makarov, T. A. Mitrova, V. A. Kulagin, Long-Term Forecast for the Global and Russia’s Energy Development, HSE Economic Journal, № 2, 2012.
[5] – World Population Prospects, the 2010 Revision, UN Population Division.
[6] – A. A. Makarov, World Energy and the Eurasian Energy Space, Energoatomizdat, Moscow, 1998.
[7] – A. A. Makarov, Energetics: Dependences and Patterns, Energy: Economy, Technology, Ecology Journal, № 5, 1986.
[8] – F. Schlachter, J. Scofield, J. Dawson, Energy Future: Think Efficiency, American Physical Society, 2008, September, 44–5.
[9] – E. V. Grushevenko, D. A. Grushevenko, Unconventional Oil: Prospects and Development, FEC. Development Strategies, № 1, 2012, 58–63.
[10] – А. Sieminski, Outlook for Shale Gas and Tight Oil Development in the U.S., FLAME Natural Gas & LNG Conference, Amsterdam, 13 March 2013.
[11] – International Energy Agency. World Energy Outlook 2012, Paris, 2012, ISBN: 978-92-64-18084-0, 41.
[12] – U.S. Energy Information Administration. International Energy Outlook 2011, Washington, DC, 2011.
[13] – T. Leaver, DME and the Role of Oil Price Benchmarks, Presentation at the DIFC Oil / Trade and Finance Conference, Dubai, 28 March 2011.
[14] – E. V. Grushevenko, Development of the Price Indicator Formula for Motor Fuels during the Transitional Phase from the Contract to the Exchange Market with Provision for the Criteria of Oil Quality, Oil Gas and Business Journal, № 7, 2012, 16–20.
[15] – S. Melnikova, A. Goryacheva, American Coal Almost Overwhelmed Europe’s ‘Green Energetics’, Russian Ecological Bulletin, 2013 № 04, 18.
[16] – World Survey of Energy Technologies, Bloomberg New Energy Finance, 2012.
[17] – A. A. Makarov, A.A. Makarov, Laws of Power Industry Development: Elusory Essence, Thermal Engineering, №13, Vol. 57, 2010.
[18] – A. A. Makarov, Quality of Energy: Way to the Global Problems, CEES, Princeton University, Proceedings of Summer School, 1990.

GLOBAL AND RUSSIAN ENERGY OUTLOOK UP TO 2040
ERI RAS – ACRF
106
[19] – Under the editorship: A. A. Makarov, T. A. Mitrova, V. A. Kulagin; Authors: S. I. Melnikova, S. Sorokin, A. Goryacheva, A. A. Galkina, The First 5 Years of the ‘Shale Revolution’ – What Do We Know Now for Sure?, ERI RAS, Moscow, November, 2012.
[20] – Under the editorship: A. A. Makarov, T. A. Mitrova, V. A. Kulagin; Authors: D. A. Grushevenko, E. V. Grushevenko, Shale Play Oil – A New Challenge for the Energy Market?, ERI RAS, Moscow, November, 2012.
[21] – IGU UN ECE NGV June 2012 IGU Working Committee 5 – Utilization Of Gas. Study Group 5.3.
GLOBAL AND RUSSIAN ENERGY OUTLOOK UP TO 2040
ERI RAS – ACRF
107
Energy Research Institute of the Russian Academy of Sciences (ERI RAS) is Russia’s leading independent research centre in the field of integrated energy research.
The institute was established in 1985 for the provision of fundamental research within the framework of the development and implementation of the country’s energy policy. The Institute combines the advantages of academic science – in-depth study of tasks and rigorous methodological apparatus – with a dynamic and customer-oriented approach.
During more than 25 years of operation, the Institute has obtained extensive practical experience, developed powerful mathematical tools, and has accumulated unique databases on world energy, the energy industries of the world, CIS countries, Russia, and its regions.
The main scientific objective of the Institute is the development of the theory and methodology of systems research and energy development forecasting. The main objectives of applied research are: the fuel and energy industries of the world, countries and regions; Russia’s Unified Gas Supply System and power grid (including the nuclear sector); the country’s oil and coal industries; scientific and technical progress of its energy sector; and the energy industry in CIS countries.
Analytical Centre of the Government of the Russian Federation (ACRF) is a multifunctional expert and analytical agency working in the field of operational analytics and advanced research, organizing training using management by objectives (MBO).
The Centre was established in accordance with a Resolution of the Government of the Russian Federation as of 20 December 2005. The purpose of its activity is to provide reliable and timely information that provides anticipatory warnings to the Government of the Russian Federation relating to material circumstances that help or hinder the achievement of final results – identified as being the primary focus of government programs under development or implementation, and projects for the country’s social and economic development.
The task of the Analytical Centre is the improvement of data quality used for analysis and forecasting of socioeconomic phenomena and processes, the management of government projects and programs, as well as the expansion and deepening of cooperation with think tanks, expert groups, and individuals for the development of an external expertise base. Special attention is given to cooperation with Russian regions, international organizations, and research centres, with the goal of achieving best practice in operational and strategic monitoring of socioeconomic development.

The copyright for all material published in this forecast, except where noted, belongs to ERI RAS and the ACRF. Illegal copying and distribution of information protected by copyright will be prosecuted. All material presented in this document is for informational purposes only and is solely the private judgment of the authors; it is not intended as the offer or recommendation for the commission of any action. ERI RAS and the ACRF are not responsible for any loss, damage, or other adverse effects that may result from the use of information contained in this publication, for any direct or consequential loss arising from the use of this information, or for the accuracy of information obtained from external sources. Any use of the material is permitted only with proper reference to the publication.
© ERI RAS, ACRF, 2013. All rights reserved.
ISBN 978-5-91438-013-4