fifteen years of ers and envisat dinsar observations at … · more specifically, the sum is...
TRANSCRIPT

FIFTEEN YEARS OF ERS AND ENVISAT DInSAR OBSERVATIONS AT
MT. ETNA (ITALY) BY USING THE SBAS APPROACH
Francesco Casu(1,2), Giuseppe Solaro(1), Susi Pepe(1), Paul Lundgren(3), Mariarosaria Manzo(1,4), Antonio Pepe(1),
Paolo Berardino(1), Eugenio Sansosti(1), Riccardo Lanari(1)
(1) Istituto per il Rilevamento Elettromagnetico dell'Ambiente, CNR, Via Diocleziano 328, 80124 Napoli, Italy
(2) Dipartimento di Ingegneria Elettrica ed Elettronica, Università degli Studi di Cagliari, Piazza d’Armi, 09123 Cagliari, Italy
(3) JPL, California Institute of Technology, 4800 Oak Drive, Pasadena, CA 91109, USA (4) Dipartimento di Ingegneria e Fisica dell'Ambiente, Università degli Studi della Basilicata, Viale dell'Ateneo
Lucano 10, 85100 Potenza, Italy
ABSTRACT
We exploited the Small BAseline Subset (SBAS) technique and computed ground displacement maps and time series by inverting 283 interferograms generated from the ascending and 289 from the descending orbits to reveal Mt. Etna surface deformation from 1992 to 2006. Our analysis shows that the volcano experienced magmatic inflation/deflation and radial spreading of the west, south and east flanks. In particular, the summit area vertical deformation inverted its sign after 2000 and clearly shows a deflation effect related to the 2001 and 2002 eruptive and seismic events. On the contrary, the horizontal signals revealed on the eastern and western flanks present significant and consistent motions toward east and west, respectively, during the investigated interval. Overall, the presented results show the complex and articulated deformation behavior of Mt. Etna and remark the possible coexistence of both gravity and magma forcing.
1. INTRODUCTION
Mt. Etna is a large basaltic stratovolcano located on the eastern coast of Sicily (southern Italy). It developed between the Apennine-Maghrebian chain to the north and the Hyblean-Maltese foreland to the south and arose from a succession of central vents and flank eruptions in the last 200 ka. In particular, during the historical times, the Mt. Etna activity has been essentially effusive and the most part of lavas has been erupted from vents outside the summit cone, aligned along three main structural trends NNW-SSE, N-S and NE-SW oriented. Recent volcanic activity was located at the summit craters and occurred on the July–August 2001, October 2002 - January 2003 and September 2004 – March 2005 eruptions..The volcano is currently characterized by a continuous seaward motion of the eastern and southern flanks that produces extension on its upper part, thus facilitating shallow magma intrusions, and a pronounced bulge along the south-eastern base [1]. A simplified geological map of the volcano is shown in Fig. 1.
Figure 1. Simplified geological map.
2. SAR DATA
Mt. Etna has been the object of several conventional [2-4] and advanced Differential SAR Interferometry (DInSAR) studies, aimed to detect and analyze its deformation dynamics. In this work we extend, with respect to the investigated time interval, the analysis proposed in [4], by applying the Small BAseline Subset (SBAS) approach [5-6] to a 15 years SAR data set, acquired by the ERS and ENVISAT sensors form 1992 to the end of 2006. In particular, we consider 107 ascending (Track 129, Frame 747) and 102 descending (Track 222, Frame 2853) ERS-1/2 and ENVISAT SAR images. By exploiting these data, 283 interferograms from the ascending orbits and 289 from the descending ones, were computed.
Moreover, we take advantage of the SBAS DInSAR multi-sensor capability [6] which allows us to generate mean deformation velocity maps and corresponding time series by jointly exploiting two different set of SAR images collected by the ERS and the ENVISAT radar sensors. We also benefit from the use of multi-orbit (ascending and descending) data to discriminate the vertical and east-west components of the volcano edifice displacement.
3. DINSAR RESULTS
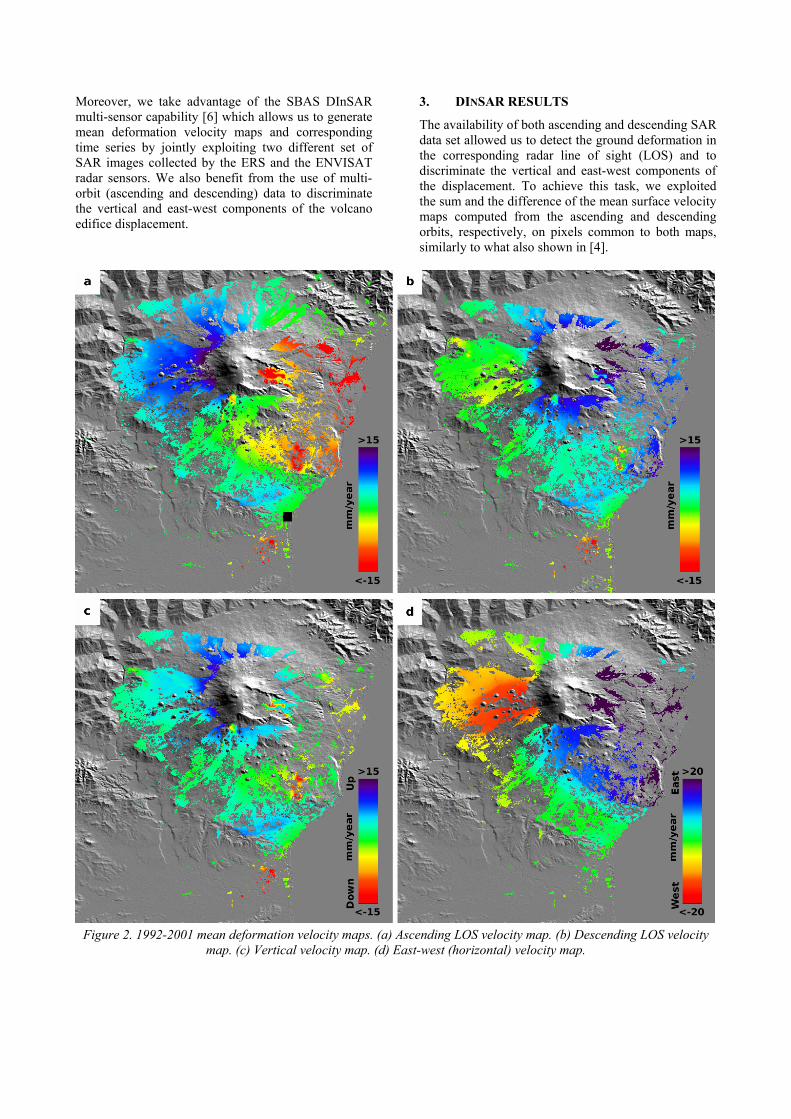
The availability of both ascending and descending SAR data set allowed us to detect the ground deformation in the corresponding radar line of sight (LOS) and to discriminate the vertical and east-west components of the displacement. To achieve this task, we exploited the sum and the difference of the mean surface velocity maps computed from the ascending and descending orbits, respectively, on pixels common to both maps, similarly to what also shown in [4].
Figure 2. 1992-2001 mean deformation velocity maps. (a) Ascending LOS velocity map. (b) Descending LOS velocity
map. (c) Vertical velocity map. (d) East-west (horizontal) velocity map.
More specifically, the sum is related to the vertical component of the ground deformation, while the difference accounts for the east-west displacement component, only. Note that, because of the nearly polar direction of the sensor orbits, the north-south deformation component can not be effectively analyzed. Firstly, we present in Fig. 2 the mean surface velocities for either ascending (Fig. 2a) and descending orbits (Fig. 2b), and the achieved vertical (Fig. 2c) and east-west velocity (Fig. 2d) maps, evaluated with respect to a pixel located in correspondence to Catania (identified with a black square in Fig. 2) and superimposed on a shaded relief DEM of the study area for the 1992 – 2001 time interval (see also [4]). The vertical velocity map (Fig. 2c) clearly shows: 1) a pronounced bulge along the basal anticline; 2) a significant uplift of the summit region, northern and
north-eastern sectors of the volcano, consistent with an inflation of the volcano; 3) a subsidence pattern in the Valle del Bove area due to a lava flow compaction, with a maximum velocity value of about 2.4 cm/year. For what concerns the east-west velocity map, shown in Fig. 2d, we can observe two main deformation phenomena. The first is relevant to the motion of the western flank toward west and of the eastern flank toward east; the second accounts for the deformation across the southern and eastern sectors, partitioned between the Trecastagni–Mascalucia and the Ragalna transtensional faults (see Figs. 1 and 2d) as also recently shown by [7]. The observed deformation pattern is not limited to its eastern and southern flanks but also involves the western sector [4] and is in agreement with the symmetric spreading model proposed by [8].
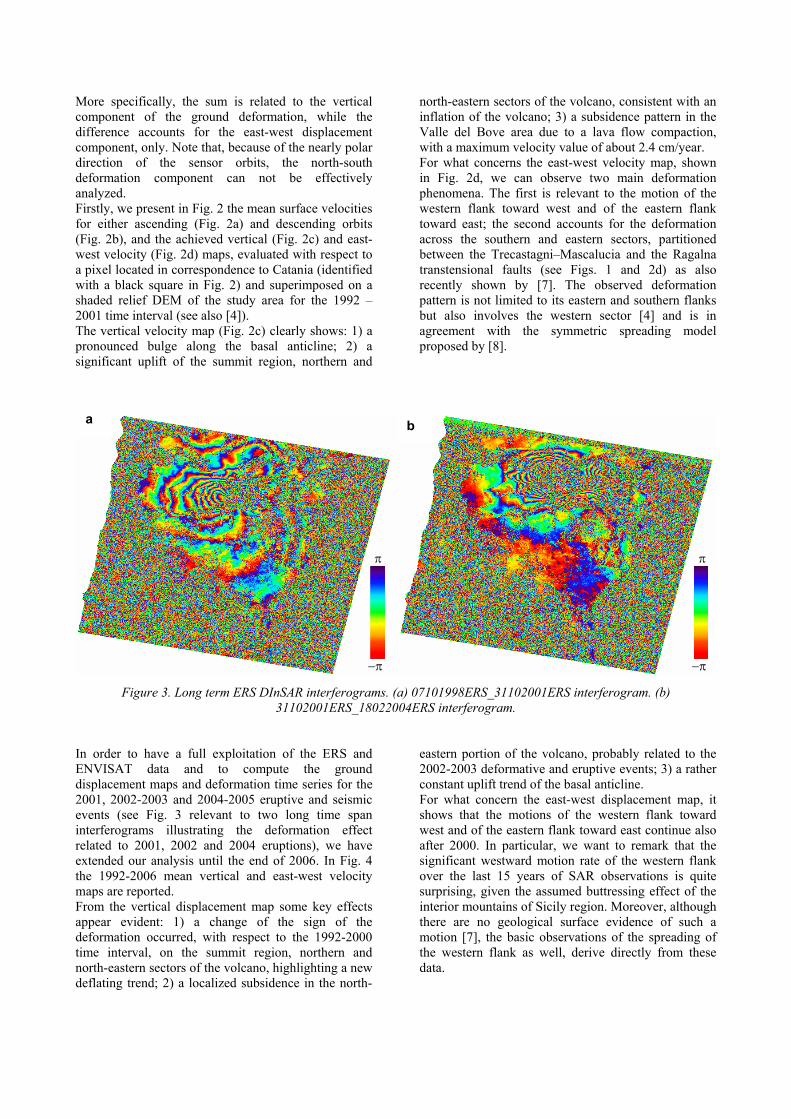
Figure 3. Long term ERS DInSAR interferograms. (a) 07101998ERS_31102001ERS interferogram. (b)
31102001ERS_18022004ERS interferogram. In order to have a full exploitation of the ERS and ENVISAT data and to compute the ground displacement maps and deformation time series for the 2001, 2002-2003 and 2004-2005 eruptive and seismic events (see Fig. 3 relevant to two long time span interferograms illustrating the deformation effect related to 2001, 2002 and 2004 eruptions), we have extended our analysis until the end of 2006. In Fig. 4 the 1992-2006 mean vertical and east-west velocity maps are reported. From the vertical displacement map some key effects appear evident: 1) a change of the sign of the deformation occurred, with respect to the 1992-2000 time interval, on the summit region, northern and north-eastern sectors of the volcano, highlighting a new deflating trend; 2) a localized subsidence in the north-
eastern portion of the volcano, probably related to the 2002-2003 deformative and eruptive events; 3) a rather constant uplift trend of the basal anticline. For what concern the east-west displacement map, it shows that the motions of the western flank toward west and of the eastern flank toward east continue also after 2000. In particular, we want to remark that the significant westward motion rate of the western flank over the last 15 years of SAR observations is quite surprising, given the assumed buttressing effect of the interior mountains of Sicily region. Moreover, although there are no geological surface evidence of such a motion [7], the basic observations of the spreading of the western flank as well, derive directly from these data.
−π
π
−π
π
a b

Figure 4. 1992-2006 mean deformation velocity maps. (a) Vertical velocity map. (b) East-west velocity map.
4. CONCLUSIONS
The DInSAR results presented in this study provide one of the most spatially and temporally complete data sets of ERS-ENVISAT DInSAR observations, showing the complex and articulated deformation behavior of Mt. Etna. In particular, our measurements highlight that the symmetrical spreading of the volcano is the driving process of the observed deformation field. Moreover, our analysis also reveals that this process accelerated in the last 5 years, thus facilitating shallow magma intrusions and consequently summit eruptions. The possibility to invert the retrieved DInSAR products, in order to model both deep geological structures and magmatic sources, represents a relevant future issue to be carefully exploited in order to better understand the volcano dynamics.
5. ACKNOWLEDGEMENTS
This work has been partially sponsored by ESA, ASI, and EU under the EURORISK-preview, SRV and CRdC-AMRA projects, respectively. Precise satellite orbits are provided by the University of Delft (The Netherlands). The DEM of the investigated zone was acquired through the SRTM archive.
6. REFERENCES
1. Behncke, B. (2001). Volcanism in the Southern Apennines and Sicily, in VAI G.B. and MARTINI I.P. (eds) Anatomy of an orogen: the Apennines and adjacent Mediterranean basins, Kluwer Academic Publishers, Dordrecht-Boston-London, 105-120.
2. Massonnet, D., Briole, P. & Arnaud, A. (1995). Deflation of Mount Etna monitored by spaceborne radar interferometry. Nature, 375, 567–570.
3. Borgia, A., Lanari, R., Sansosti, E., Tesauro, M., Berardino, P., Fornaro, G., Neri, M. & Murray, J. (2000). Actively growing anticlines beneath Catania from the distal motion of Mount Etna’s decollement measured by SAR interferometry and GPS. Geophys. Res. Lett., 27, 3409–3412.
4. Lundgren, P., Casu, F., Manzo, M., Pepe, A., Berardino, P., Sansosti, E. & Lanari, R. (2004). Gravity and magma induced spreading of Mount Etna volcano revealed by satellite radar interferometry. Geophys. Res. Lett. 31, L04602.
5. Berardino, P., Fornaro, G., Lanari, R. &. Sansosti, E. (2002). A new Algorithm for Surface Deformation Monitoring based on Small Baseline Differential SAR Interferograms. IEEE Trans. Geosci. Remote Sens., 40, 2375-2383.
6. Pepe, A., Sansosti, E., Berardino, P. & Lanari, R. (2005). On the Generation of ERS/ENVISAT DInSAR Time-Series via the SBAS technique. IEEE on Geoscience and Remote Sensing Letters, 2(3), 265−269.
7. Neri, M., Guglielmino, F. & Rust, D. (2007). Flank instability on Mount Etna: radon, radar interferometry, and geodetic data from the southwestern boundary of the unstable sector, J. Geophys. Res, 12, b04410. doi: 10.1029/2006jb004756.
8. Merle, O. & Borgia, A. (1996). Scaled experiments of volcano spreading, J. Geophys. Res., 101, 13,805–13,817.