envisat aatsr instrument performance - end -
TRANSCRIPT
Report
Doc No: PO-RP-RAL-AT-0621 Issue: 1.0 Date: 08-Oct-2012 Page: 1 of 69
© STFC 2012
ENVISAT AATSR Instrument Performance - End of Mission Report
Prepared by: D.L. Smith Date Checked By:
J.A. Abolins Date Project Management:
B.J. Maddison Date
Report
Doc No: PO-RP-RAL-AT-0621 Issue: 1.0 Date: 08-Oct-2012 Page: 2 of 69
© STFC 2012
Distribution List RAL B. Maddison
J.A. Abolins C.T. Mutlow C. Cox Space ConneXions H. Kelliher Vega S. O’Hara
H. Clarke G. Davies
DECC A. Chalmers Leicester University D. Llewellyn-Jones G. Corlett ESA P. Goryl P. Vogel M. Canella J.N. Berger Cover Picture: The flight model Advanced Along-Track Scanning Radiometer
Host system Windows 7 Word Processor Microsoft Word 2010 File ENVISAT AATSR Instrument Performance - End of Mission Report - Issue 1.0.docx
Report
Doc No: PO-RP-RAL-AT-0621 Issue: 1.0 Date: 08-Oct-2012 Page: 3 of 69
© STFC 2012
Document Change Record Issue Date Affected Pages Comments Draft 0.1 27-Sep-2012 All Initial draft for comment Draft 0.2 07-Oct-2012 All Updates incorporating comments from
AATSR QWG and operations team. Issue 1.0 08-Oct-2012 All Issued
Report
Doc No: PO-RP-RAL-AT-0621 Issue: 1.0 Date: 08-Oct-2012 Page: 4 of 69
© STFC 2012
Contents 1 Scope of the Document ................................................................................................................... 5 2 Documents ....................................................................................................................................... 5
2.1 Applicable Documents .............................................................................................................. 5 2.2 Reference Documents .............................................................................................................. 5
3 Acronyms ......................................................................................................................................... 6 4 Overall Instrument Status ................................................................................................................ 8
4.1 Overall Performance ................................................................................................................. 8 4.2 Hardware/Software Configuration Changes since Launch ...................................................... 8 4.3 Operations Summary ................................................................................................................ 9 4.4 Instrument Outages and Anomalies since Launch ................................................................. 12 4.5 Water Ice Contamination ........................................................................................................ 13
5 Instrument Performance Evolution and Trend Analysis ................................................................ 15 5.1 Power ...................................................................................................................................... 15 5.2 Thermal ................................................................................................................................... 18 5.3 Mechanisms ............................................................................................................................ 19
5.3.1 Stirling Cycle Cooler ........................................................................................................ 19 5.3.2 Scan Mirror Unit............................................................................................................... 23
5.4 Optical Performance ............................................................................................................... 25 5.4.1 TIR Channels ................................................................................................................... 25 5.4.2 VIS-SWIR Channels ........................................................................................................ 30
5.5 Calibration Systems ................................................................................................................ 38 5.5.1 Blackbodies ..................................................................................................................... 38 5.5.2 VISCAL ............................................................................................................................ 42
5.6 Electronics .............................................................................................................................. 46 6 Anomaly Investigations held since launch ..................................................................................... 47 7 Lessons Learnt .............................................................................................................................. 53 8 Delivered Items .............................................................................................................................. 57 Appendix A – AATSR Instrument Operations Timeline ........................................................................ 58
PO-RP-RAL-AT-0621 Issue 1.0
08-October-2012 Page: 5 of 69
© STFC 2012
1 Scope of the Document This document contains a summary of the AATSR instrument performance for the ENVISAT mission. It is an input to the mission closeout review. The report contains the following:
Overall instrument status comprising a summary of the overall performance, configuration evolution, operations summary and list of instrument outages.
Instrument performance evolution and trend analysis. A summary of the anomaly investigations held since launch. Lessons learned. A list of the delivered items. Instrument Operations Timeline
2 Documents 2.1 Applicable Documents
AD 1 PO-MA-MMB-AT-0002 Instrument Operations Manual – Issue 5.2
2.2 Reference Documents
RD 1 PO-TN-MMB-AT-077 Thermal Test Predictions – Issue 1.0
RD 2 PO-RP-RAL-AT-0511 AATSR Commissioning Report – July 2003
RD 3 PO-TN-RAL-AT-0553 Impact of AATSR on ENVISAT mission extension options
RD 4 PO-RP-RAL-AT-0024 AATSR Infra-Red Radiometric Calibration Report
RD5 N/A D.L. Smith and C.V. Cox, (A)ATSR SOLAR CHANNEL ON-ORBIT RADIOMETRIC CALIBRATION, submitted to Transactions on Geoscience and Remote Sensing
RD6 N/A CEOS IVOS Working Group 4: Intercomparison of vicarious calibration methodologies over pseudo invariant calibration sites.
RD7 N/A
Závody, A. M., P. D. Watts, D. L. Smith, C. T. Mutlow, 1998: A Novel Method for Calibrating the ATSR-2 1.6-μm Channel Using Simultaneous Measurements Made in the 3.7-μm Channel in Sun Glint. J. Atmos. Oceanic Technol., 15, 1243–1252
PO-RP-RAL-AT-0621 Issue 1.0
08-October-2012 Page: 6 of 69
© STFC 2012
3 Acronyms AATSR Advanced Along Track Scanning Radiometer AD Applicable Document AGO Auto Gain Offset AIT Assembly Integration and Test AVHRR Advanced Very High Resolution Radiometer BB Blackbody BBU Blackbody Unit BOL Beginning Of Life BRDF Bidirectional Reflectance Distribution Function BS Beam Splitter CCU Cooler Control Unit CRC Cyclic Redundancy Check DBU Data Bus Unit DDS Data Dissemination System DECC Department of Energy and Climate Change DEU Digital Electronics Unit EDAC Error Detection and Correction EDS Engineering Data System EDS-S EDS ‘S’ band system EDS-X EDS ‘X’ band system EOL EIU
End Of Life Electronic Interface Unit
EQ SOL Equipment Switch Off Line ERS Earth Resources Satellite ESOC European Space Operations Centre FOCC Flight Operations Control Centre FOP Flight Operations Procedure FPA Focal Plane Assembly GPP Ground Prototype Processor HK Housekeeping HSM High Speed Multiplexer HW Hardware ICU Instrument Control Unit IDF Instrument Data Formatter IDL Interactive Data Language IEU Instrument Electronics Unit IFOV Instantaneous Field of View IOM Instrument Operations Manual IOR Instrument Operations Request IR-FPA Infra Red Focal Plane Assembly IRR Infra Red Radiometer ISP Instrument Source Packet ITS-90 International Temperature Scale of 1990 MERIS Medium Resolution Imaging Spectrometer MLI Multi-Layer Insulation MLST Mean Local Solar Time MPS Mission Planning System NET Noise Equivalent Brightness Temperature Difference NEDR Noise Equivalent Difference Reflectance NIR Near Infra Red NRT Near Real Time OCM Orbit Control Manoeuvre OOL Out Of Limits PCSU Power Conditioning and Switching Unit PL SOL PayLoad Switch Off Line PM Platform
PO-RP-RAL-AT-0621 Issue 1.0
08-October-2012 Page: 7 of 69
© STFC 2012
PMC Platform Macro Command PRT Platinum Resistance Thermometer RAL Rutherford Appleton Laboratory RAM RMS
Random Access Memory Root Mean Square
RD Reference Document SAA South Atlantic Anomaly SCC Sterling Cycle Cooler SCP Signal Channel Processor SEU Single Event Upset SFCM Spacecraft Fine Control Manoeuvre SNR Signal to Noise Ratio SMU Scan Mechanism Unit SODAP Switch On and Data Acquisition Phase SPA Signal Preamplifier Unit SST Sea Surface Temperature SW Software SWIR Short Wave Infra Red TBC To Be Confirmed TBD To Be Defined TIR Thermal Infra Red TM Telemetry TOA Top Of Atmosphere UV Ultra Violet VC1 Visible Calibration file VFPA Visible Focal Plane Assembly VIS Visible VISCAL VISible CALibration System
PO-RP-RAL-AT-0621 Issue 1.0
08-October-2012 Page: 8 of 69
© STFC 2012
4 Overall Instrument Status 4.1 Overall Performance As described in this document, AATSR performed exceptionally well over the mission lifetime and generated the high quality data needed for accurate SST retrievals. Based on the assessment of the housekeeping and science data, AATSR would have continued to operate beyond 2014 with clear margins. A summary of the performance of the key subsystems is given below.
The Stirling Cycle Cooler operated well within the design limits with clear margins on the compressor and displacer drive levels. No adjustments to the operational parameters were needed during the mission.
The scan mirror completed approximately 2.1 billion revolutions since being activated on 15th
March 2002 with no anomalies reported. Jitter rates were typically <1% per orbit throughout the mission with low impact on the quality of the science data.
The IR channels performed well within specifications with very limited degradation over the mission lifetime.
The VIS-SWIR channels performed well over the mission. Although there was a loss of optical throughput due to degradation of the optical components, the signal to noise ratio remained within specification throughout.
The blackbodies used for the calibration of the TIR channels remained stable throughout the mission. Trend analyses of the thermometers, and periodic cross-over tests indicated that the calibration drifts were negligible.
The VISCAL system provided a stable calibration source for the VIS-SWIR channels. Using vicarious calibration results to correct for expected long term degradation of the diffuser and optics, the signal channels could be calibrated to an uncertainty <3%.
The electronics units (IEU, CCU, DEU) performed exceptionally well throughout the mission. There was negligible loss of instrument data throughout the mission due to AATSR anomalies. Only three significant anomalies occurred during nominal operations, each of which was easily recovered.
The instrument thermal design ensured that the temperatures of the optical enclosure remained stable throughout the mission.
Excluding the main commissioning phase up to 23rd July 2002, AATSR measurement data were available for >95% of the mission.
4.2 Hardware/Software Configuration Changes since Launch No flight hardware or software configuration changes were made to AATSR throughout the mission.
PO-RP-RAL-AT-0621 Issue 1.0
08-October-2012 Page: 9 of 69
© STFC 2012
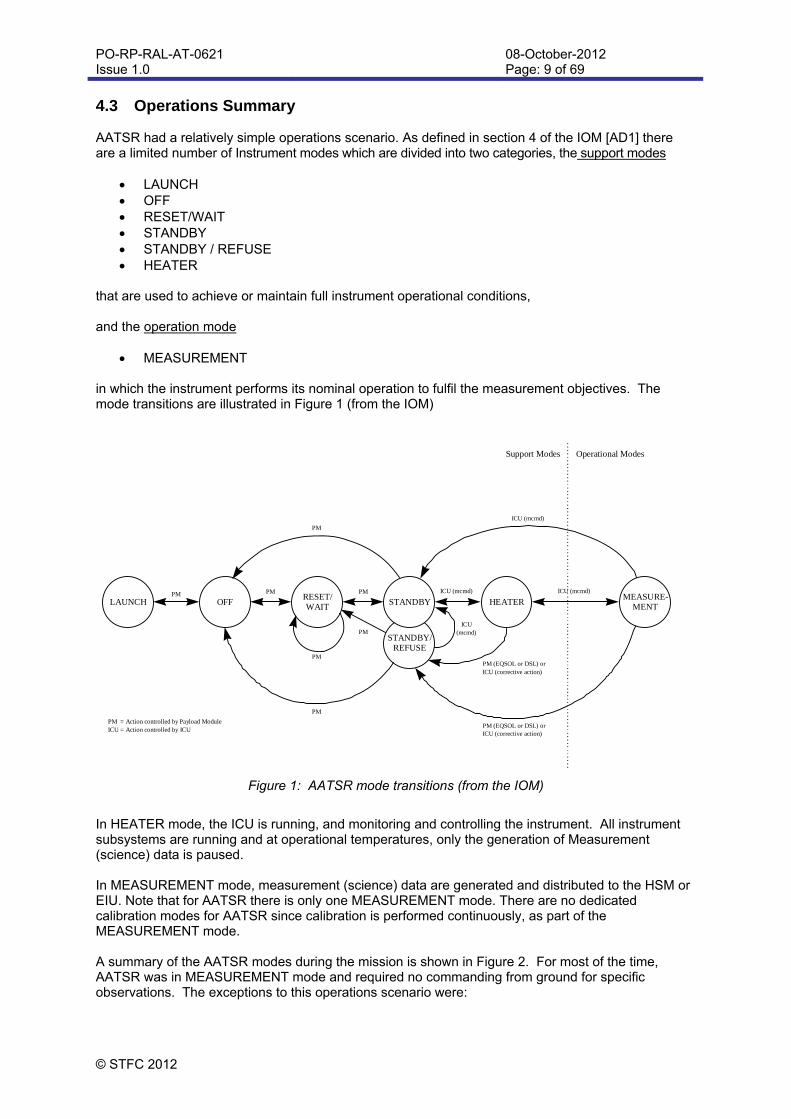
4.3 Operations Summary AATSR had a relatively simple operations scenario. As defined in section 4 of the IOM [AD1] there are a limited number of Instrument modes which are divided into two categories, the support modes
LAUNCH OFF RESET/WAIT STANDBY STANDBY / REFUSE HEATER
that are used to achieve or maintain full instrument operational conditions, and the operation mode
MEASUREMENT in which the instrument performs its nominal operation to fulfil the measurement objectives. The mode transitions are illustrated in Figure 1 (from the IOM)
LAUNCHRESET/WAIT STANDBY HEATEROFF
STANDBY/REFUSE
MEASURE-MENT
Operational ModesSupport Modes
PM
PM
PM
PM
PM
PM
ICU (mcmd)
ICU (mcmd) ICU (mcmd)
ICU(mcmd)
PM (EQSOL or DSL) orICU (corrective action)
PM (EQSOL or DSL) orICU (corrective action)
PM = Action controlled by Payload ModuleICU = Action controlled by ICU
PM
Figure 1: AATSR mode transitions (from the IOM)
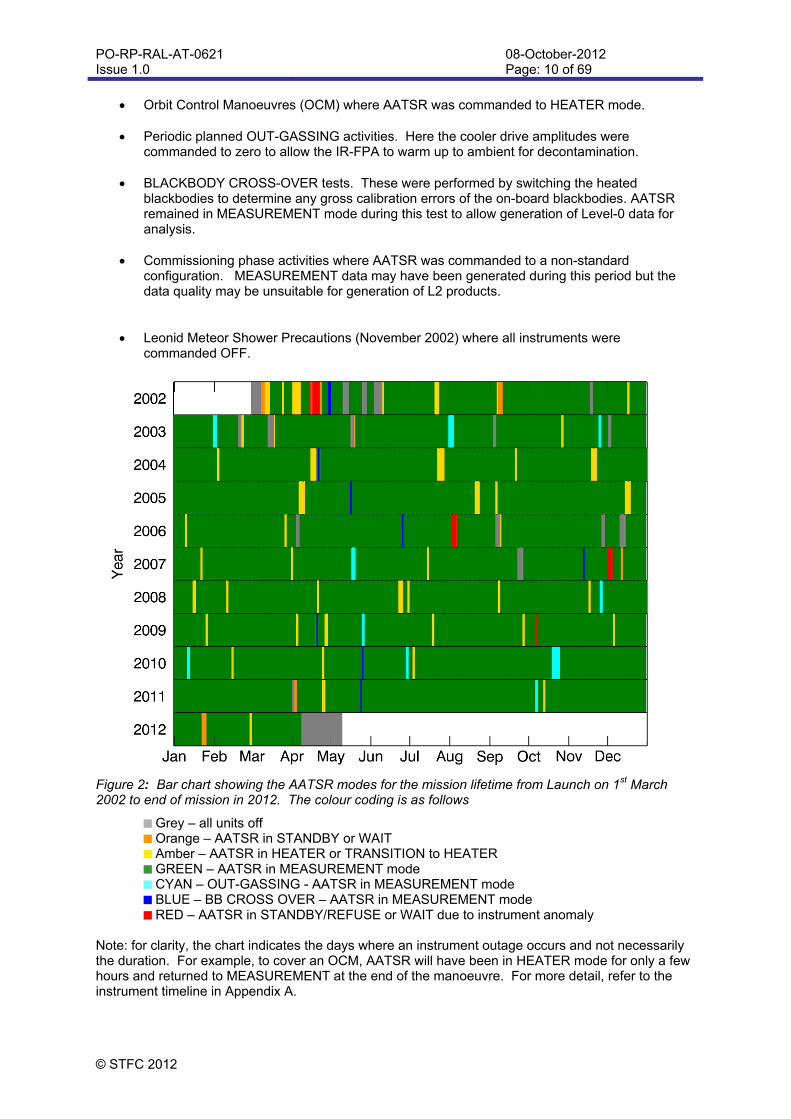
In HEATER mode, the ICU is running, and monitoring and controlling the instrument. All instrument subsystems are running and at operational temperatures, only the generation of Measurement (science) data is paused. In MEASUREMENT mode, measurement (science) data are generated and distributed to the HSM or EIU. Note that for AATSR there is only one MEASUREMENT mode. There are no dedicated calibration modes for AATSR since calibration is performed continuously, as part of the MEASUREMENT mode. A summary of the AATSR modes during the mission is shown in Figure 2. For most of the time, AATSR was in MEASUREMENT mode and required no commanding from ground for specific observations. The exceptions to this operations scenario were:
PO-RP-RAL-AT-0621 Issue 1.0
08-October-2012 Page: 10 of 69
© STFC 2012
Orbit Control Manoeuvres (OCM) where AATSR was commanded to HEATER mode.
Periodic planned OUT-GASSING activities. Here the cooler drive amplitudes were commanded to zero to allow the IR-FPA to warm up to ambient for decontamination.
BLACKBODY CROSS-OVER tests. These were performed by switching the heated
blackbodies to determine any gross calibration errors of the on-board blackbodies. AATSR remained in MEASUREMENT mode during this test to allow generation of Level-0 data for analysis.
Commissioning phase activities where AATSR was commanded to a non-standard configuration. MEASUREMENT data may have been generated during this period but the data quality may be unsuitable for generation of L2 products.
Leonid Meteor Shower Precautions (November 2002) where all instruments were
commanded OFF.
Figure 2: Bar chart showing the AATSR modes for the mission lifetime from Launch on 1st March 2002 to end of mission in 2012. The colour coding is as follows
Grey – all units off Orange – AATSR in STANDBY or WAIT Amber – AATSR in HEATER or TRANSITION to HEATER GREEN – AATSR in MEASUREMENT mode CYAN – OUT-GASSING - AATSR in MEASUREMENT mode BLUE – BB CROSS OVER – AATSR in MEASUREMENT mode RED – AATSR in STANDBY/REFUSE or WAIT due to instrument anomaly Note: for clarity, the chart indicates the days where an instrument outage occurs and not necessarily the duration. For example, to cover an OCM, AATSR will have been in HEATER mode for only a few hours and returned to MEASUREMENT at the end of the manoeuvre. For more detail, refer to the instrument timeline in Appendix A.
PO-RP-RAL-AT-0621 Issue 1.0
08-October-2012 Page: 11 of 69
© STFC 2012
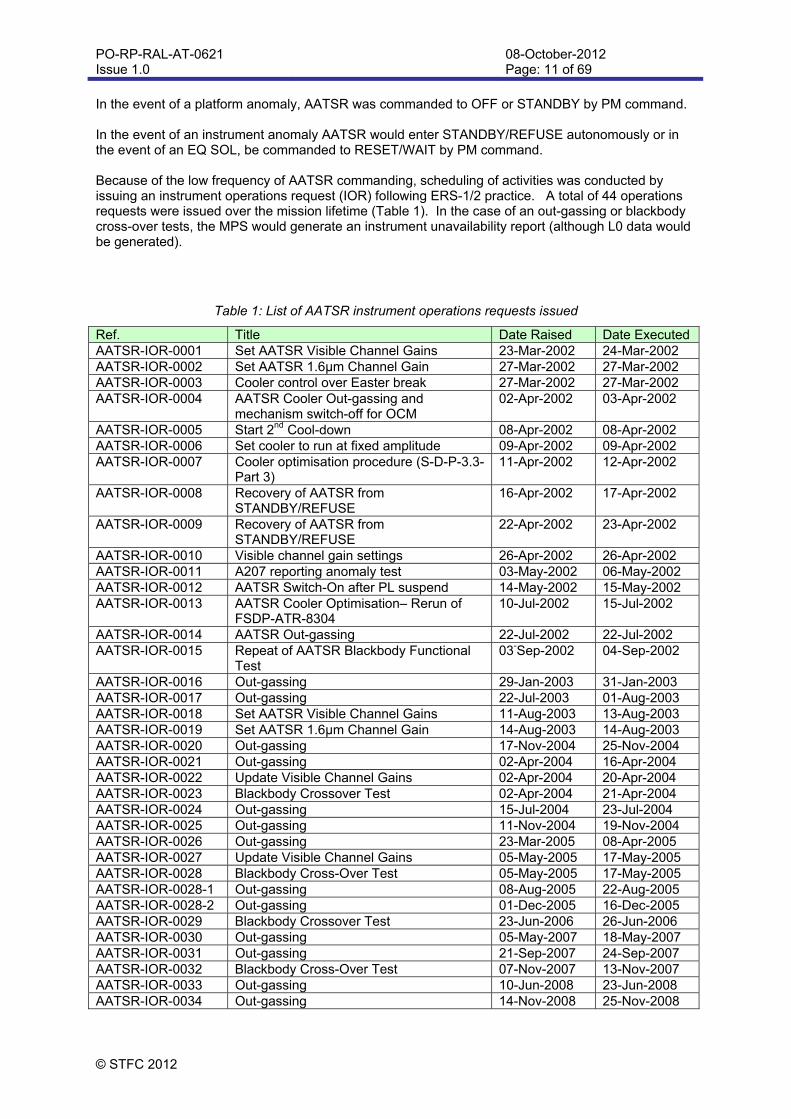
In the event of a platform anomaly, AATSR was commanded to OFF or STANDBY by PM command. In the event of an instrument anomaly AATSR would enter STANDBY/REFUSE autonomously or in the event of an EQ SOL, be commanded to RESET/WAIT by PM command. Because of the low frequency of AATSR commanding, scheduling of activities was conducted by issuing an instrument operations request (IOR) following ERS-1/2 practice. A total of 44 operations requests were issued over the mission lifetime (Table 1). In the case of an out-gassing or blackbody cross-over tests, the MPS would generate an instrument unavailability report (although L0 data would be generated).
Table 1: List of AATSR instrument operations requests issued
Ref. Title Date Raised Date Executed AATSR-IOR-0001 Set AATSR Visible Channel Gains 23-Mar-2002 24-Mar-2002 AATSR-IOR-0002 Set AATSR 1.6µm Channel Gain 27-Mar-2002 27-Mar-2002 AATSR-IOR-0003 Cooler control over Easter break 27-Mar-2002 27-Mar-2002 AATSR-IOR-0004 AATSR Cooler Out-gassing and
mechanism switch-off for OCM 02-Apr-2002 03-Apr-2002
AATSR-IOR-0005 Start 2nd Cool-down 08-Apr-2002 08-Apr-2002 AATSR-IOR-0006 Set cooler to run at fixed amplitude 09-Apr-2002 09-Apr-2002 AATSR-IOR-0007 Cooler optimisation procedure (S-D-P-3.3-
Part 3) 11-Apr-2002 12-Apr-2002
AATSR-IOR-0008 Recovery of AATSR from STANDBY/REFUSE
16-Apr-2002 17-Apr-2002
AATSR-IOR-0009 Recovery of AATSR from STANDBY/REFUSE
22-Apr-2002 23-Apr-2002
AATSR-IOR-0010 Visible channel gain settings 26-Apr-2002 26-Apr-2002 AATSR-IOR-0011 A207 reporting anomaly test 03-May-2002 06-May-2002 AATSR-IOR-0012 AATSR Switch-On after PL suspend 14-May-2002 15-May-2002 AATSR-IOR-0013 AATSR Cooler Optimisation– Rerun of
FSDP-ATR-8304 10-Jul-2002 15-Jul-2002
AATSR-IOR-0014 AATSR Out-gassing 22-Jul-2002 22-Jul-2002 AATSR-IOR-0015 Repeat of AATSR Blackbody Functional
Test 03-Sep-2002 04-Sep-2002
AATSR-IOR-0016 Out-gassing 29-Jan-2003 31-Jan-2003 AATSR-IOR-0017 Out-gassing 22-Jul-2003 01-Aug-2003 AATSR-IOR-0018 Set AATSR Visible Channel Gains 11-Aug-2003 13-Aug-2003 AATSR-IOR-0019 Set AATSR 1.6µm Channel Gain 14-Aug-2003 14-Aug-2003 AATSR-IOR-0020 Out-gassing 17-Nov-2004 25-Nov-2004 AATSR-IOR-0021 Out-gassing 02-Apr-2004 16-Apr-2004 AATSR-IOR-0022 Update Visible Channel Gains 02-Apr-2004 20-Apr-2004 AATSR-IOR-0023 Blackbody Crossover Test 02-Apr-2004 21-Apr-2004 AATSR-IOR-0024 Out-gassing 15-Jul-2004 23-Jul-2004 AATSR-IOR-0025 Out-gassing 11-Nov-2004 19-Nov-2004 AATSR-IOR-0026 Out-gassing 23-Mar-2005 08-Apr-2005 AATSR-IOR-0027 Update Visible Channel Gains 05-May-2005 17-May-2005 AATSR-IOR-0028 Blackbody Cross-Over Test 05-May-2005 17-May-2005 AATSR-IOR-0028-1 Out-gassing 08-Aug-2005 22-Aug-2005 AATSR-IOR-0028-2 Out-gassing 01-Dec-2005 16-Dec-2005 AATSR-IOR-0029 Blackbody Crossover Test 23-Jun-2006 26-Jun-2006 AATSR-IOR-0030 Out-gassing 05-May-2007 18-May-2007 AATSR-IOR-0031 Out-gassing 21-Sep-2007 24-Sep-2007 AATSR-IOR-0032 Blackbody Cross-Over Test 07-Nov-2007 13-Nov-2007 AATSR-IOR-0033 Out-gassing 10-Jun-2008 23-Jun-2008 AATSR-IOR-0034 Out-gassing 14-Nov-2008 25-Nov-2008
PO-RP-RAL-AT-0621 Issue 1.0
08-October-2012 Page: 12 of 69
© STFC 2012
AATSR-IOR-0035 Blackbody Cross-Over Test 06-April-2009 21-April-2009 AATSR-IOR-0036 Out-gassing 19-May-2009 26-May-2009 AATSR-IOR-0037 Out-gassing 04-Jan-2010 11-Jan-2010 AATSR-IOR-0038 Blackbody Cross-Over Test 20-May-2010 26-May-2010 AATSR-IOR-0039 Out-gassing 18-Jun-2010 29-Jun-2010 AATSR-IOR-0040 Out-gassing 12-Oct-2010 20-Oct-2010 AATSR-IOR-0041 Blackbody Crossover Test 17-May-2011 25-May-2011 AATSR-IOR-0042 Out-gassing 27-Sep-2011 07-Oct-2011 4.4 Instrument Outages and Anomalies since Launch
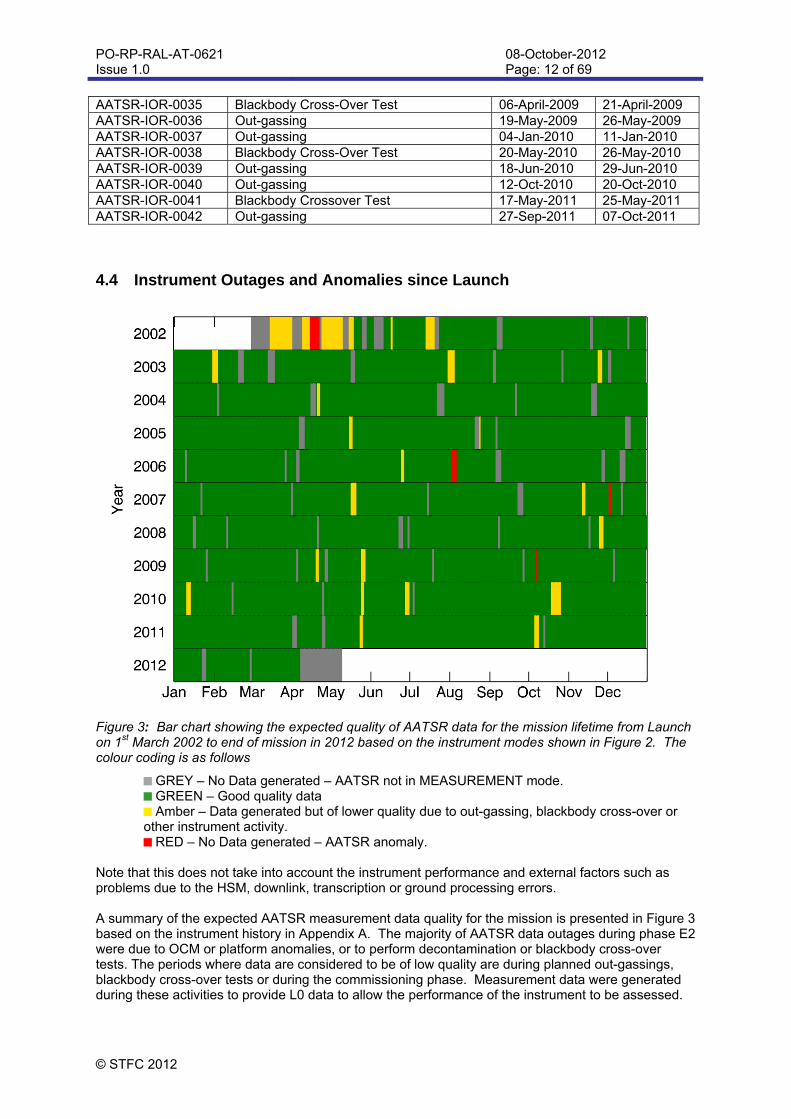
Figure 3: Bar chart showing the expected quality of AATSR data for the mission lifetime from Launch on 1st March 2002 to end of mission in 2012 based on the instrument modes shown in Figure 2. The colour coding is as follows
GREY – No Data generated – AATSR not in MEASUREMENT mode. GREEN – Good quality data
Amber – Data generated but of lower quality due to out-gassing, blackbody cross-over or other instrument activity.
RED – No Data generated – AATSR anomaly. Note that this does not take into account the instrument performance and external factors such as problems due to the HSM, downlink, transcription or ground processing errors. A summary of the expected AATSR measurement data quality for the mission is presented in Figure 3 based on the instrument history in Appendix A. The majority of AATSR data outages during phase E2 were due to OCM or platform anomalies, or to perform decontamination or blackbody cross-over tests. The periods where data are considered to be of low quality are during planned out-gassings, blackbody cross-over tests or during the commissioning phase. Measurement data were generated during these activities to provide L0 data to allow the performance of the instrument to be assessed.
PO-RP-RAL-AT-0621 Issue 1.0
08-October-2012 Page: 13 of 69
© STFC 2012
However, the MPS did not disable processing to L1 during these activities; hence products which were of a low quality were generated and distributed to users, albeit with an appropriate disclaimer. A complete list of AATSR anomalies and a summary of the conclusions to the investigations is contained in section 6. The majority of these occurred during the commissioning phase and were mainly due to procedural or database errors rather than a problem with the flight HW or SW. No instrument HW failures occurred during the mission. A total of four AATSR-specific anomalies occurred that led to a disruption of operations. These are summarised as follows:
15-April-2002 - AATSR entered STANDBY/REFUSE mode after a cooler body temperature fell below the lower switch-down limit of -2010C. This was caused by the cooler heater thermostat being set too low, allowing temperatures to fall below the switch on limits. The problem was corrected by a modification to the switch-on procedure to ensure that the instrument was only switched on when the cooler body temperature was above the switch-on limits.
04-Aug-2006 - AATSR was switched into RESET/WAIT mode by the PMC following 2 or more
consecutive TM Format Errors. Analysis of the diagnostic dumps indicated that the anomaly was most likely caused by a SEU (the dump shows a whole sequence of Scheduler Overrun errors)
03-Dec-2007 - AATSR was commanded into STANDBY mode during an ENVISAT memory
maintenance activity. On restarting the IRR, the instrument went into STANDBY/REFUSE mode at 08:10 on 05-Dec-2007. A possible explanation for the anomaly is that when commanded into STANDBY mode for the maintenance activity, the instrument was left in a state expecting the scan mechanism still running. Thus when the command to run up to HEATER mode was sent, no synch pulse was generated by the IEU and hence no data was being transmitted between the IEU and DEU, thereby causing the instrument to enter STANDBY/REFUSE mode. In order to avoid this situation it was necessary to perform a more controlled shutdown by first commanding the scan mirror and cooler off before sending the STANDBY command. This ensured that the DEU was in the same state in STANDBY as for a cold restart.
8-October 2009 - AATSR switched into RESET/WAIT mode following consecutive ICU
FORMAT header errors. Analysis of the diagnostic dumps indicated that the anomaly was most likely caused by a SEU (the dump showed a whole sequence of Scheduler Overrun errors). At the time of the anomaly, ENVISAT was in the middle of the South Atlantic Anomaly (SAA).
In each case AATSR was recovered successfully and operations continued as before. Excluding the main commissioning phase up to 23rd July 2002, AATSR measurement data were available for >95% of the mission. 4.5 Water Ice Contamination Because the AATSR IR-FPA operates at 80K, it is to be expected that some level of water ice contamination would occur and affect the cooler performance and throughput of the cold optics as described in detail in sections 5.3.1, 5.4.1 and 5.4.2. It became apparent during the commissioning phase that the levels of water ice contamination were much higher than anticipated, resulting in significant loss of optical throughput on the VIS channels. Similar effects were also reported for SCIAMACHY with a signal loss approaching 90% at 2µm after 2 months of operation. The source was most likely to be water vapour from the ENVISAT structure. Fortunately for AATSR, water ice contamination could be removed and the throughput recovered by warming the FPA to the ambient spacecraft temperature (~250K). Also, the on-board calibration systems enabled any variation in the
PO-RP-RAL-AT-0621 Issue 1.0
08-October-2012 Page: 14 of 69
© STFC 2012
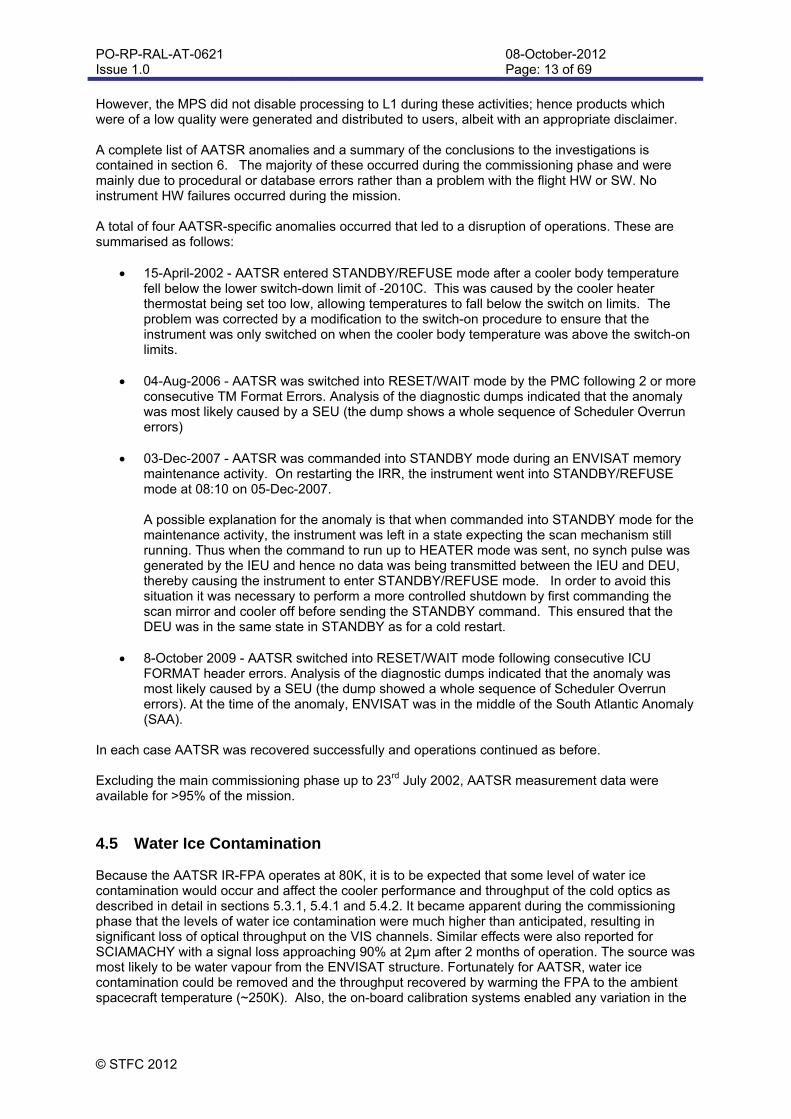
signal channel throughput to be compensated, thereby ensuring that the science data products should not be affected. An estimation of the contamination build up could be obtained from the variations of the 1600nm channel signal. The main assumption is that the loss of signal following an Out-gassing is due to build-up of condensation around the field stop such that 1600nm Signal A = A0(1-x)2 where A is the amplitude of the signal with a condensation layer of x on the surface of the relay lens and A0 is the amplitude with no condensation. For the later part of the mission, the condensation layer thickness could be measured from oscillations in the 860nm, 660nm and 560nm channels that occurred at x = nλ/2, nλ, 3nλ/2 etc. The results for AATSR in Figure 4 show that after the first few days of operation, the condensation layer reached a thickness of 7µm. For ATSR-2 the same layer thickness was achieved after several weeks. Regular Out-gassings have prevented the layer thickness from exceeding 10µm. The deposition rate for AATSR was an order of magnitude higher than observed at the start of the ATSR-2 mission, which would explain the signal loss observed in the short wavelength channels. By October 2003 the rate had reached the rate measured at the start of the ATSR-2 mission, but then levelled off to ~0.07nm/day and did not improve as originally hoped. This meant that Out-gassings needed to be performed at regular intervals throughout the mission. Normally an out-gassing cycle would be scheduled by a mission operations request. However opportunities to perform an out-gassing sometimes arose whenever the instrument was shut down either through maintenance activities or platform anomalies.
Figure 4: Contamination layer thickness on AATSR IR-FPA derived from the 1600nm channel signal loss (top) and the deposition rate (bottom). For comparison, the ATSR-2 contamination levels from the start of the ERS-2 mission are shown in blue.
PO-RP-RAL-AT-0621 Issue 1.0
08-October-2012 Page: 15 of 69
© STFC 2012
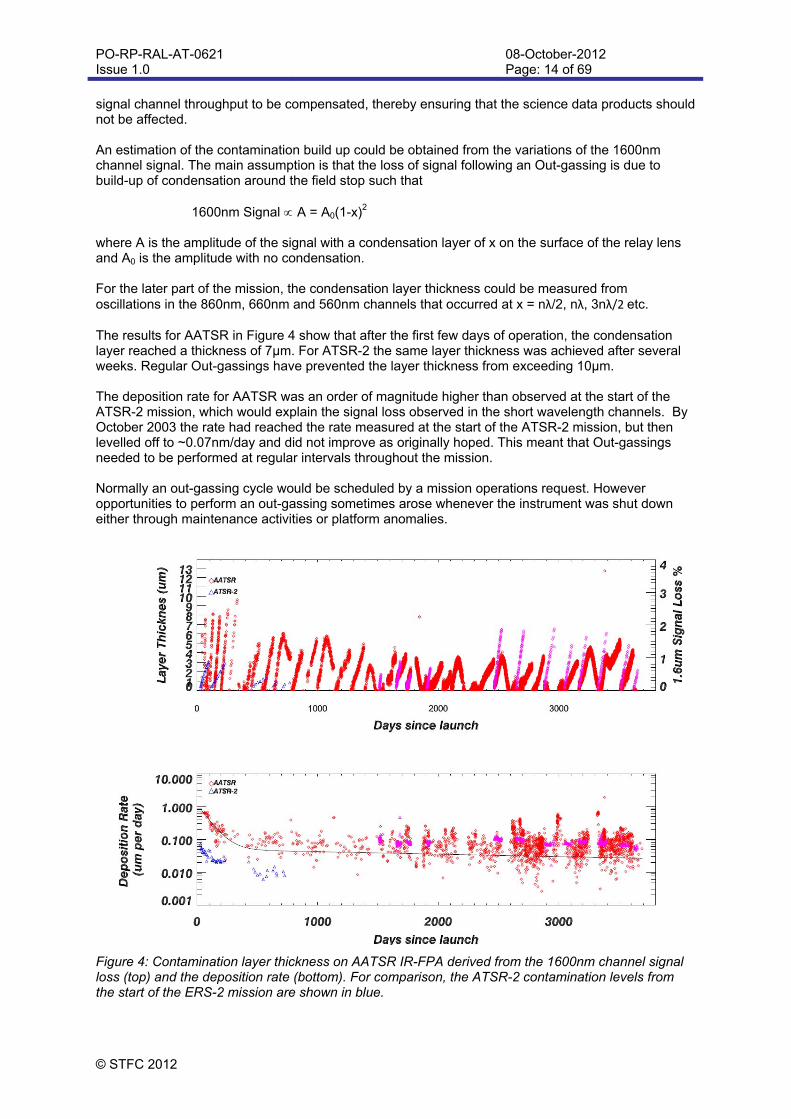
5 Instrument Performance Evolution and Trend Analysis This chapter contains a summary of the results of the telemetry analysis for the different instrument Units / Subsystems. For completeness, a block diagram of the main AATSR subsystems is reproduced from the AATSR product handbook below.
Figure 5: AATSR functional block diagram for the IVR.
5.1 Power The ENVISAT platform power services utilised by AATSR are listed below [AD 1]:
Equipment Power 200 W – regulated supply providing power to the instrument subsystems via the PCSU.
ICU Power (including DBU) Auxiliary Power – unregulated supply providing power to the cooler via the CCU. Heater Power for Equipment Heater Power for ICU
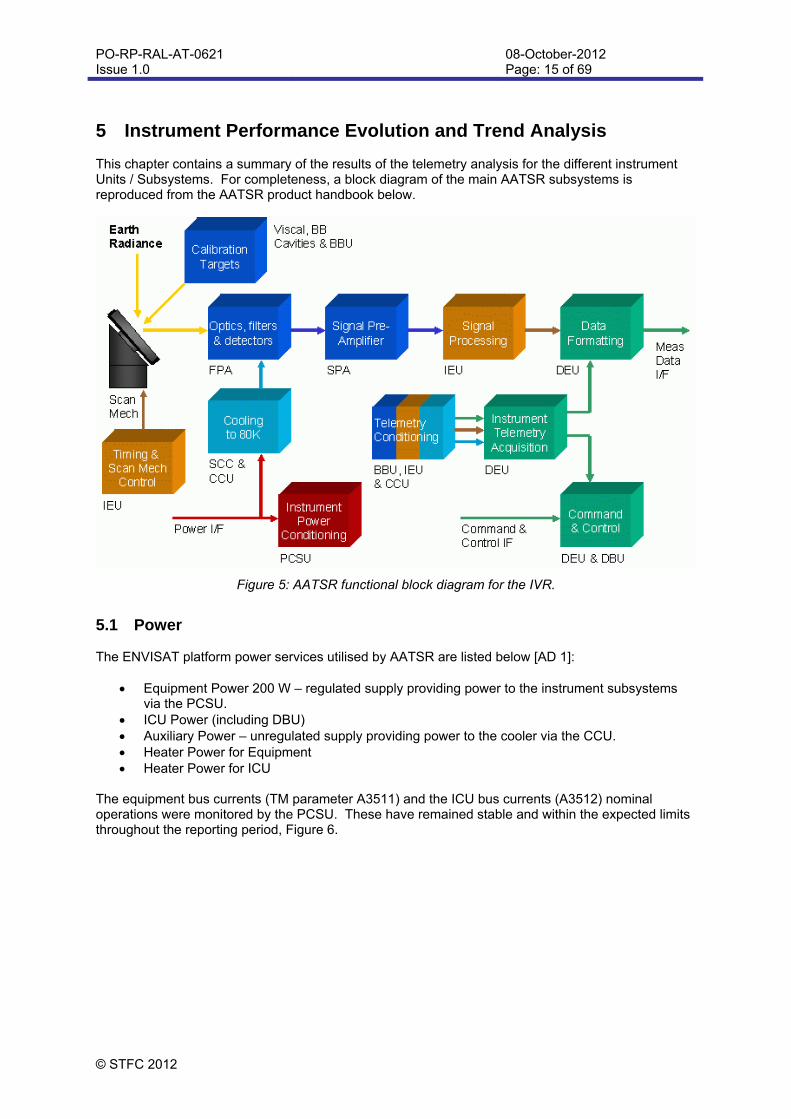
The equipment bus currents (TM parameter A3511) and the ICU bus currents (A3512) nominal operations were monitored by the PCSU. These have remained stable and within the expected limits throughout the reporting period, Figure 6.
PO-RP-RAL-AT-0621 Issue 1.0
08-October-2012 Page: 16 of 69
© STFC 2012
Figure 6: Time series for Equipment and ICU bus currents for the period from March 2002 to March 2012. Mean daily values are shown in black, maximum daily values in red and minimum daily values in green.
In preparation for the OCM performed in October 2010 to allow for the ENVISAT mission extension (see RD3), an estimate of the expected power consumption at March 2012 and March 2014 were produced based on a linear least squares fit to the data from a starting time of March 2003 up to March 2008. The actual data for 2012 were well within the range of uncertainty for the predictions.
Table 2: Predicted bus currents for AATSR for ENVISAT mission target dates based on 2008 analysis.
Actual 2008 Predictions March-2012 March 2012 March 2014 A3511 – EQ Bus 1.582A 1.575A 1.572A A3512 – ICU Bus 0.486A 0.493A 0.495A
PO-RP-RAL-AT-0621 Issue 1.0
08-October-2012 Page: 17 of 69
© STFC 2012
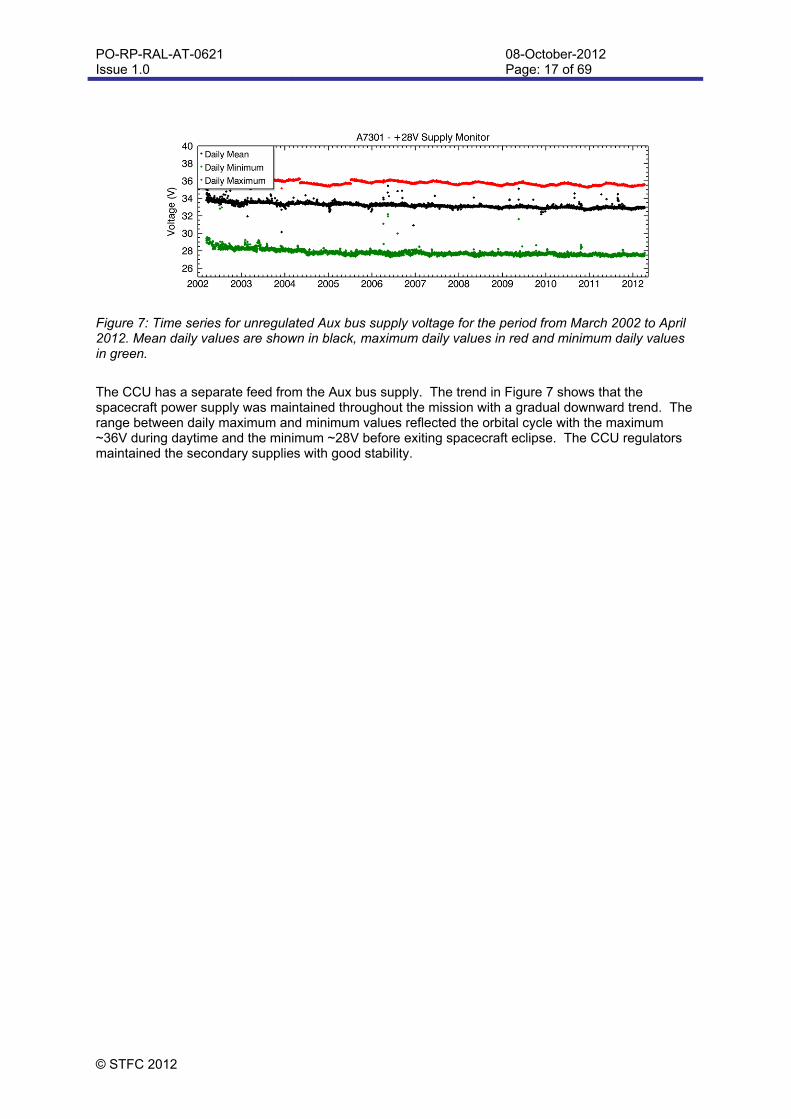
Figure 7: Time series for unregulated Aux bus supply voltage for the period from March 2002 to April 2012. Mean daily values are shown in black, maximum daily values in red and minimum daily values in green.
The CCU has a separate feed from the Aux bus supply. The trend in Figure 7 shows that the spacecraft power supply was maintained throughout the mission with a gradual downward trend. The range between daily maximum and minimum values reflected the orbital cycle with the maximum ~36V during daytime and the minimum ~28V before exiting spacecraft eclipse. The CCU regulators maintained the secondary supplies with good stability.
PO-RP-RAL-AT-0621 Issue 1.0
08-October-2012 Page: 18 of 69
© STFC 2012
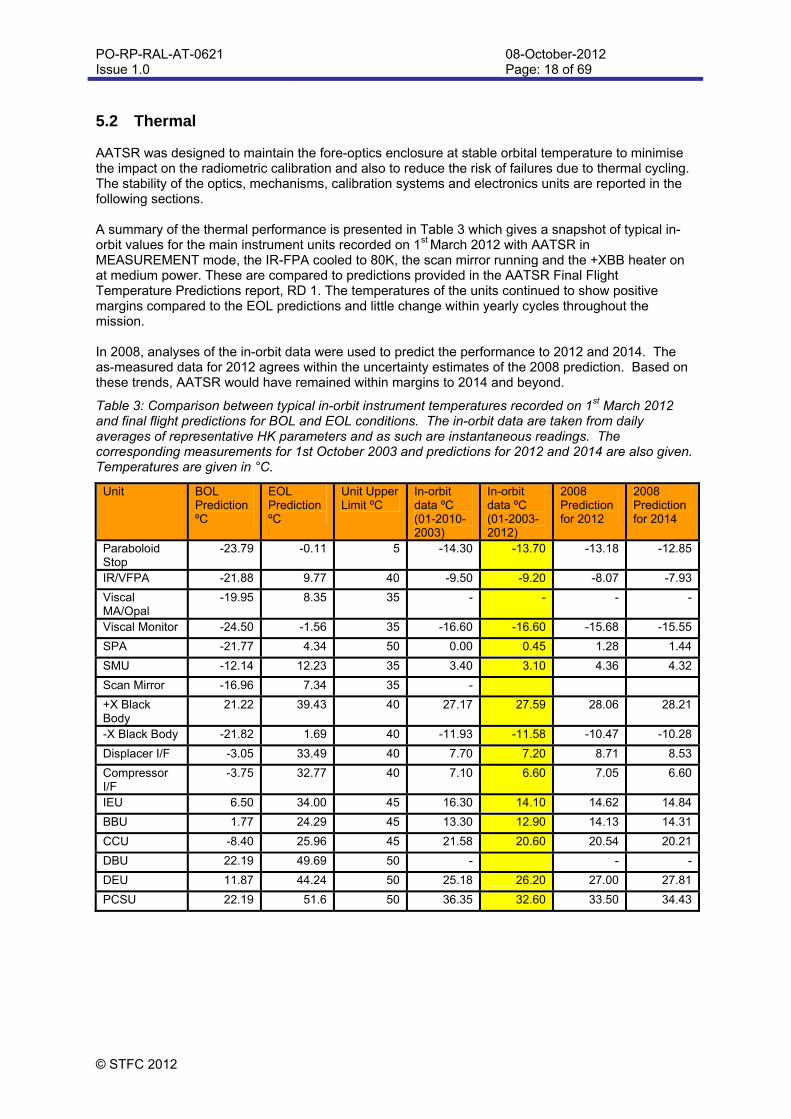
5.2 Thermal AATSR was designed to maintain the fore-optics enclosure at stable orbital temperature to minimise the impact on the radiometric calibration and also to reduce the risk of failures due to thermal cycling. The stability of the optics, mechanisms, calibration systems and electronics units are reported in the following sections. A summary of the thermal performance is presented in Table 3 which gives a snapshot of typical in-orbit values for the main instrument units recorded on 1st March 2012 with AATSR in MEASUREMENT mode, the IR-FPA cooled to 80K, the scan mirror running and the +XBB heater on at medium power. These are compared to predictions provided in the AATSR Final Flight Temperature Predictions report, RD 1. The temperatures of the units continued to show positive margins compared to the EOL predictions and little change within yearly cycles throughout the mission. In 2008, analyses of the in-orbit data were used to predict the performance to 2012 and 2014. The as-measured data for 2012 agrees within the uncertainty estimates of the 2008 prediction. Based on these trends, AATSR would have remained within margins to 2014 and beyond.
Table 3: Comparison between typical in-orbit instrument temperatures recorded on 1st March 2012 and final flight predictions for BOL and EOL conditions. The in-orbit data are taken from daily averages of representative HK parameters and as such are instantaneous readings. The corresponding measurements for 1st October 2003 and predictions for 2012 and 2014 are also given. Temperatures are given in °C.
Unit BOL Prediction ºC
EOL Prediction ºC
Unit Upper Limit ºC
In-orbit data ºC (01-2010-2003)
In-orbit data ºC (01-2003-2012)
2008 Prediction for 2012
2008 Prediction for 2014
Paraboloid Stop
-23.79 -0.11 5 -14.30 -13.70 -13.18 -12.85
IR/VFPA -21.88 9.77 40 -9.50 -9.20 -8.07 -7.93
Viscal MA/Opal
-19.95 8.35 35 - - - -
Viscal Monitor -24.50 -1.56 35 -16.60 -16.60 -15.68 -15.55
SPA -21.77 4.34 50 0.00 0.45 1.28 1.44
SMU -12.14 12.23 35 3.40 3.10 4.36 4.32
Scan Mirror -16.96 7.34 35 -
+X Black Body
21.22 39.43 40 27.17 27.59 28.06 28.21
-X Black Body -21.82 1.69 40 -11.93 -11.58 -10.47 -10.28
Displacer I/F -3.05 33.49 40 7.70 7.20 8.71 8.53
Compressor I/F
-3.75 32.77 40 7.10 6.60 7.05 6.60
IEU 6.50 34.00 45 16.30 14.10 14.62 14.84
BBU 1.77 24.29 45 13.30 12.90 14.13 14.31
CCU -8.40 25.96 45 21.58 20.60 20.54 20.21
DBU 22.19 49.69 50 - - -
DEU 11.87 44.24 50 25.18 26.20 27.00 27.81
PCSU 22.19 51.6 50 36.35 32.60 33.50 34.43

PO-RP-RAL-AT-0621 Issue 1.0
08-October-2012 Page: 19 of 69
© STFC 2012
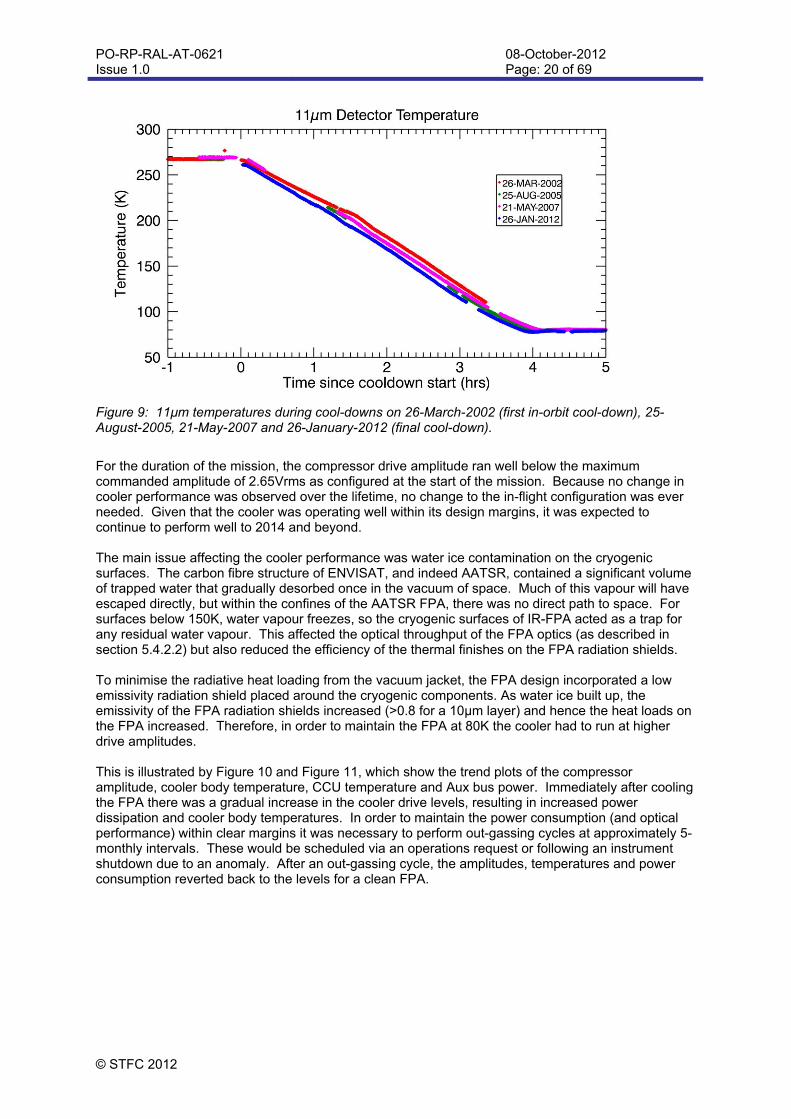
5.3 Mechanisms 5.3.1 Stirling Cycle Cooler The cooler performed well throughout the mission and maintained the infrared focal plane assembly at 80±0.5K during normal operations, Error! Reference source not found.. Figure 9 shows the Cool-down profiles for the Cool-downs on 26th March 2002, 25th August 2005, 21st May 2007 and the final Cool-down on 26th January 2012. A typical Cool-down took 4 hours to complete, and based on the profiles for each example, there was no deterioration in performance over the mission. (It could be argued that there was an improvement in the cool-down rate over the mission lifetime, but the differences in the profiles are most likely due to improved efficiency of execution of the Cool-down procedure as the operations team became more familiar with the instrument).
Figure 8: AATSR IR Detector temperatures during ENVISAT mission1.
1 The outliers in the plot are due to biases introduced by the conversion function rather than variations in the detector temperatures. The conversion functions for some of the HK parameters are dependent on the IEU temperature as given by parameter A4161 which is only available in RTTF. Since RTTF are requested by telecommand and were not automatically generated, a valid reading of this parameter was only available for the HK conversion after receiving and processing a RTTF. When the FOCC database was updated (for any reason), the latest reading of A4161 was cleared and the default value of 0°C was used. This resulted in a lower reading of the detector temperatures for part of the day until the first RTTF was received containing the actual IEU temperature.
PO-RP-RAL-AT-0621 Issue 1.0
08-October-2012 Page: 20 of 69
© STFC 2012
Figure 9: 11μm temperatures during cool-downs on 26-March-2002 (first in-orbit cool-down), 25-August-2005, 21-May-2007 and 26-January-2012 (final cool-down).
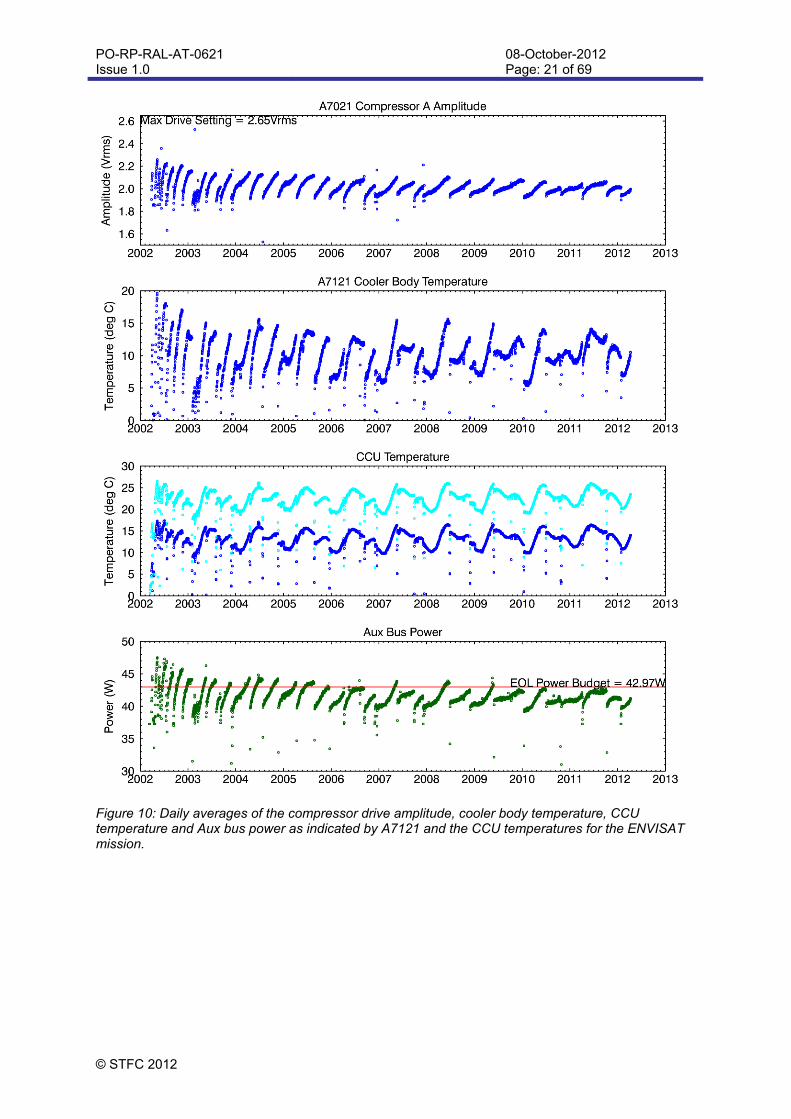
For the duration of the mission, the compressor drive amplitude ran well below the maximum commanded amplitude of 2.65Vrms as configured at the start of the mission. Because no change in cooler performance was observed over the lifetime, no change to the in-flight configuration was ever needed. Given that the cooler was operating well within its design margins, it was expected to continue to perform well to 2014 and beyond. The main issue affecting the cooler performance was water ice contamination on the cryogenic surfaces. The carbon fibre structure of ENVISAT, and indeed AATSR, contained a significant volume of trapped water that gradually desorbed once in the vacuum of space. Much of this vapour will have escaped directly, but within the confines of the AATSR FPA, there was no direct path to space. For surfaces below 150K, water vapour freezes, so the cryogenic surfaces of IR-FPA acted as a trap for any residual water vapour. This affected the optical throughput of the FPA optics (as described in section 5.4.2.2) but also reduced the efficiency of the thermal finishes on the FPA radiation shields. To minimise the radiative heat loading from the vacuum jacket, the FPA design incorporated a low emissivity radiation shield placed around the cryogenic components. As water ice built up, the emissivity of the FPA radiation shields increased (>0.8 for a 10μm layer) and hence the heat loads on the FPA increased. Therefore, in order to maintain the FPA at 80K the cooler had to run at higher drive amplitudes. This is illustrated by Figure 10 and Figure 11, which show the trend plots of the compressor amplitude, cooler body temperature, CCU temperature and Aux bus power. Immediately after cooling the FPA there was a gradual increase in the cooler drive levels, resulting in increased power dissipation and cooler body temperatures. In order to maintain the power consumption (and optical performance) within clear margins it was necessary to perform out-gassing cycles at approximately 5-monthly intervals. These would be scheduled via an operations request or following an instrument shutdown due to an anomaly. After an out-gassing cycle, the amplitudes, temperatures and power consumption reverted back to the levels for a clean FPA.
PO-RP-RAL-AT-0621 Issue 1.0
08-October-2012 Page: 21 of 69
© STFC 2012
Figure 10: Daily averages of the compressor drive amplitude, cooler body temperature, CCU temperature and Aux bus power as indicated by A7121 and the CCU temperatures for the ENVISAT mission.

PO-RP-RAL-AT-0621 Issue 1.0
08-October-2012 Page: 22 of 69
© STFC 2012
Figure 11: Daily averages of the compressor drive amplitude, cooler body temperature, CCU temperature and Aux bus power as indicated by A7121 and the CCU temperatures for 2004. This shows more clearly the increase in compressor amplitude needed to maintain the FPA at 80K and the corresponding rise in cooler body temperature as a consequence of the increased power demand.

PO-RP-RAL-AT-0621 Issue 1.0
08-October-2012 Page: 23 of 69
© STFC 2012
5.3.2 Scan Mirror Unit The SMU provided both the mechanical location and rotation of the scan mirror. The mechanism rotated the mirror at 400 rpm, with a scan velocity accuracy such that the instantaneous rotational positional error (sum of all velocity error contributions) was less than 1 arc minute (1RMS) over any 150 millisecond scan period in vacuum (based on the results of in-air measurements). Since being activated on 15th March 2002, the scan mechanism completed an estimated 2.1 billion revolutions with no anomalies reported. Daily monitoring of the scan counters typically showed the counter to be incrementing linearly with time, indicating that the scan period was maintained at 150ms. Within each 150ms scan, there should be exactly 2000 75µs pixels. Occasionally a scan mirror ‘jitter’ occurred due to an electronic race condition between the pixel clock and the scan synch pulse or mechanical friction, resulting in more than 2000 pixels per scan. To detect these jitters, a pixel snapshot register within the DEU was set to monitor the radiometric counts for pixel 2001. Normally, the values in this register should remain unchanged as long as the number of pixels per scan remains at 2000. When a ‘jitter’ occurs giving rise to 2001 pixels in a scan, i.e. one more than expected, the values held within the snapshot register will change. The Engineering Data System (EDS-X) checked the snapshot values in the Instrument Source Packets (ISPs), and registered when the snapshot values have changed. For each orbit of data processed the average, maximum and minimum jitters per second were computed and saved to a text file available on the AATSR operations web site: http://www.aatsrops.rl.ac.uk/EDSX/MissionTrends/JitterHistory/Jitter_History.dat. The time series of the detected jitters is shown in Figure 12. Note that the maximum rate of jitter detection should be 3 per second (50%), since for each occurrence of 2001 pixels there should be a corresponding scan with 1999.
Figure 12: Scan mirror jitter, encoder temperature and equipment bus current for the ENVISAT mission. The solid lines represent the fitted trend to the data.
PO-RP-RAL-AT-0621 Issue 1.0
08-October-2012 Page: 24 of 69
© STFC 2012
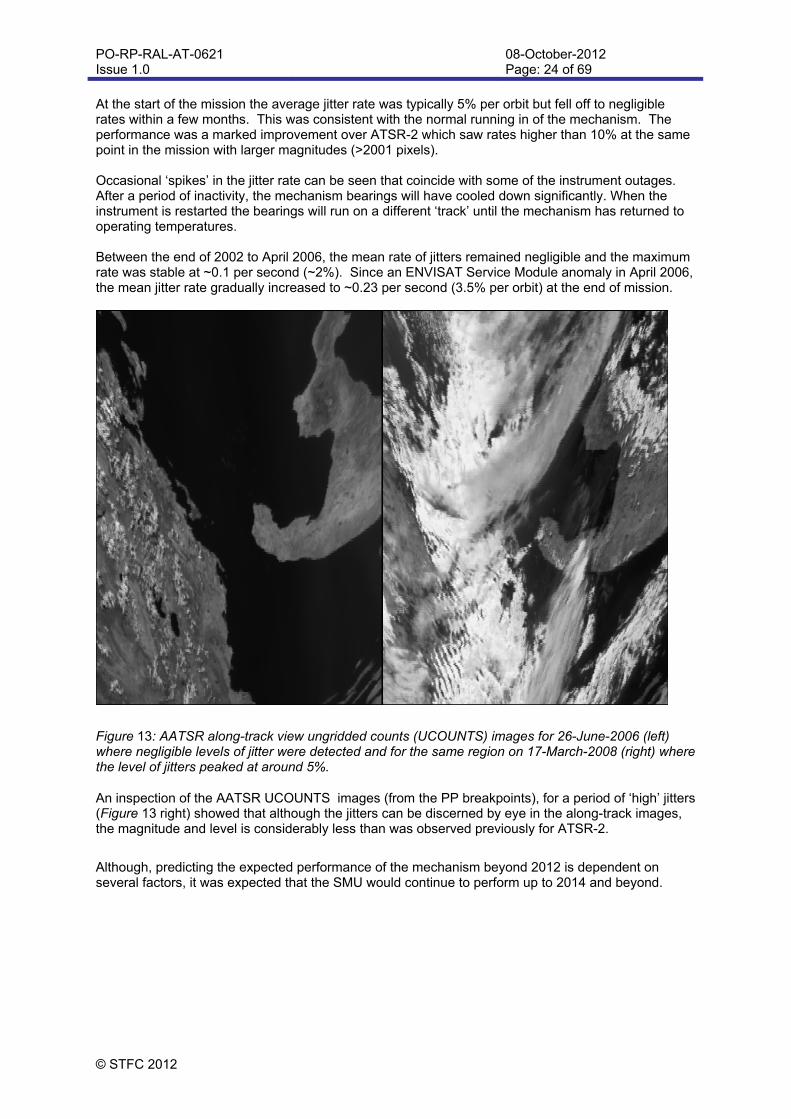
At the start of the mission the average jitter rate was typically 5% per orbit but fell off to negligible rates within a few months. This was consistent with the normal running in of the mechanism. The performance was a marked improvement over ATSR-2 which saw rates higher than 10% at the same point in the mission with larger magnitudes (>2001 pixels). Occasional ‘spikes’ in the jitter rate can be seen that coincide with some of the instrument outages. After a period of inactivity, the mechanism bearings will have cooled down significantly. When the instrument is restarted the bearings will run on a different ‘track’ until the mechanism has returned to operating temperatures. Between the end of 2002 to April 2006, the mean rate of jitters remained negligible and the maximum rate was stable at ~0.1 per second (~2%). Since an ENVISAT Service Module anomaly in April 2006, the mean jitter rate gradually increased to ~0.23 per second (3.5% per orbit) at the end of mission.
Figure 13: AATSR along-track view ungridded counts (UCOUNTS) images for 26-June-2006 (left) where negligible levels of jitter were detected and for the same region on 17-March-2008 (right) where the level of jitters peaked at around 5%.
An inspection of the AATSR UCOUNTS images (from the PP breakpoints), for a period of ‘high’ jitters (Figure 13 right) showed that although the jitters can be discerned by eye in the along-track images, the magnitude and level is considerably less than was observed previously for ATSR-2.
Although, predicting the expected performance of the mechanism beyond 2012 is dependent on several factors, it was expected that the SMU would continue to perform up to 2014 and beyond.
PO-RP-RAL-AT-0621 Issue 1.0
08-October-2012 Page: 25 of 69
© STFC 2012
5.4 Optical Performance 5.4.1 TIR Channels
From
Sce
ne
Along
-Tra
ck B
affle
T?
BS2
BS1
BS3
12um Detector +
Filter
11um Detector +
Filter3.7um
Detector + Filter
To 1.6um and VIS
Ellipsoid Mirror
Ellipsoid Mirror
Ellipsoid Mirror
ScanMirror
Off-Axis ParaboloidMirror
Paraboloid StopT ~ 255K
RF Baffle
Field Stop
80K
From Scene
Nadir Baffle
T?
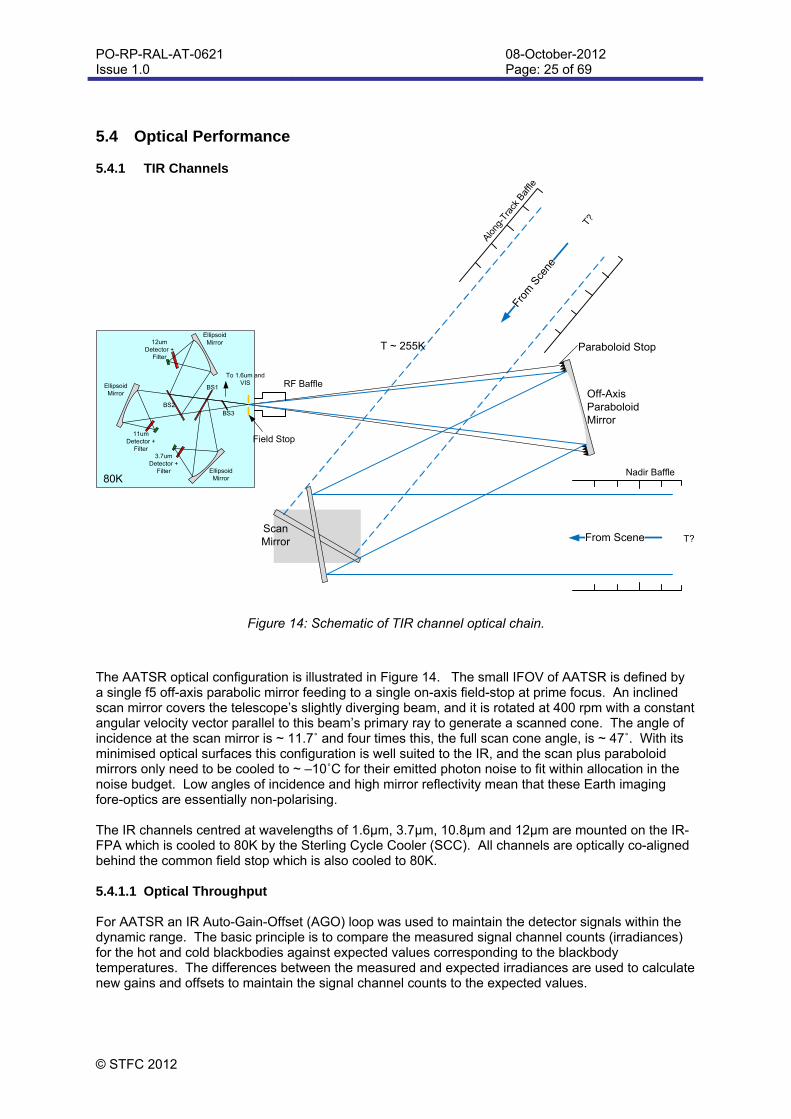
Figure 14: Schematic of TIR channel optical chain.
The AATSR optical configuration is illustrated in Figure 14. The small IFOV of AATSR is defined by a single f5 off-axis parabolic mirror feeding to a single on-axis field-stop at prime focus. An inclined scan mirror covers the telescope’s slightly diverging beam, and it is rotated at 400 rpm with a constant angular velocity vector parallel to this beam’s primary ray to generate a scanned cone. The angle of incidence at the scan mirror is ~ 11.7˚ and four times this, the full scan cone angle, is ~ 47˚. With its minimised optical surfaces this configuration is well suited to the IR, and the scan plus paraboloid mirrors only need to be cooled to ~ –10˚C for their emitted photon noise to fit within allocation in the noise budget. Low angles of incidence and high mirror reflectivity mean that these Earth imaging fore-optics are essentially non-polarising. The IR channels centred at wavelengths of 1.6μm, 3.7μm, 10.8μm and 12μm are mounted on the IR-FPA which is cooled to 80K by the Sterling Cycle Cooler (SCC). All channels are optically co-aligned behind the common field stop which is also cooled to 80K. 5.4.1.1 Optical Throughput For AATSR an IR Auto-Gain-Offset (AGO) loop was used to maintain the detector signals within the dynamic range. The basic principle is to compare the measured signal channel counts (irradiances) for the hot and cold blackbodies against expected values corresponding to the blackbody temperatures. The differences between the measured and expected irradiances are used to calculate new gains and offsets to maintain the signal channel counts to the expected values.
PO-RP-RAL-AT-0621 Issue 1.0
08-October-2012 Page: 26 of 69
© STFC 2012
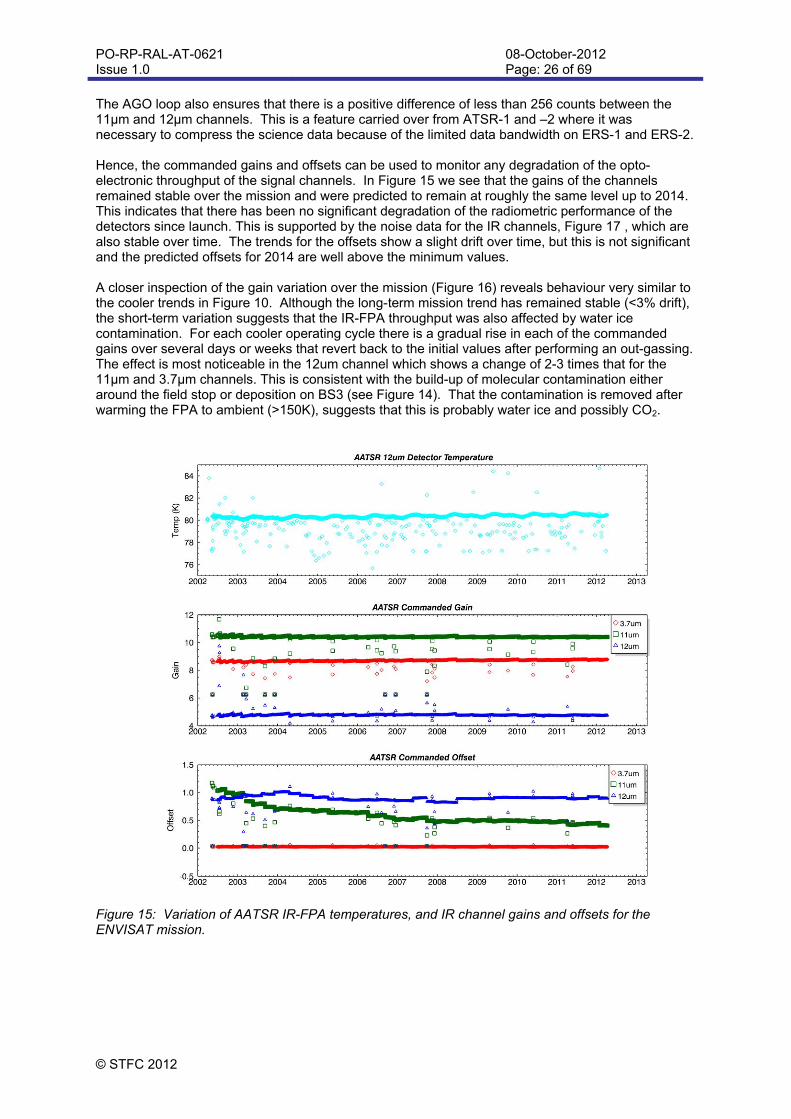
The AGO loop also ensures that there is a positive difference of less than 256 counts between the 11µm and 12µm channels. This is a feature carried over from ATSR-1 and –2 where it was necessary to compress the science data because of the limited data bandwidth on ERS-1 and ERS-2. Hence, the commanded gains and offsets can be used to monitor any degradation of the opto-electronic throughput of the signal channels. In Figure 15 we see that the gains of the channels remained stable over the mission and were predicted to remain at roughly the same level up to 2014. This indicates that there has been no significant degradation of the radiometric performance of the detectors since launch. This is supported by the noise data for the IR channels, Figure 17 , which are also stable over time. The trends for the offsets show a slight drift over time, but this is not significant and the predicted offsets for 2014 are well above the minimum values. A closer inspection of the gain variation over the mission (Figure 16) reveals behaviour very similar to the cooler trends in Figure 10. Although the long-term mission trend has remained stable (<3% drift), the short-term variation suggests that the IR-FPA throughput was also affected by water ice contamination. For each cooler operating cycle there is a gradual rise in each of the commanded gains over several days or weeks that revert back to the initial values after performing an out-gassing. The effect is most noticeable in the 12um channel which shows a change of 2-3 times that for the 11µm and 3.7µm channels. This is consistent with the build-up of molecular contamination either around the field stop or deposition on BS3 (see Figure 14). That the contamination is removed after warming the FPA to ambient (>150K), suggests that this is probably water ice and possibly CO2.
Figure 15: Variation of AATSR IR-FPA temperatures, and IR channel gains and offsets for the ENVISAT mission.
PO-RP-RAL-AT-0621 Issue 1.0
08-October-2012 Page: 27 of 69
© STFC 2012
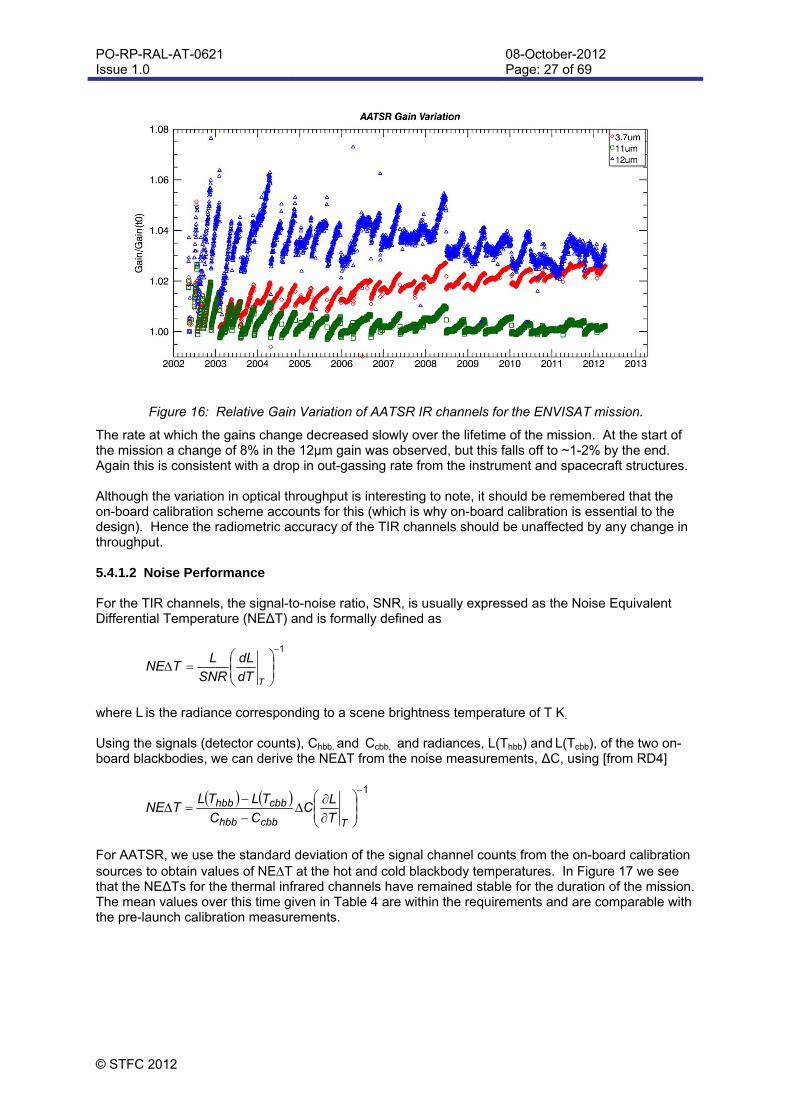
Figure 16: Relative Gain Variation of AATSR IR channels for the ENVISAT mission.
The rate at which the gains change decreased slowly over the lifetime of the mission. At the start of the mission a change of 8% in the 12µm gain was observed, but this falls off to ~1-2% by the end. Again this is consistent with a drop in out-gassing rate from the instrument and spacecraft structures. Although the variation in optical throughput is interesting to note, it should be remembered that the on-board calibration scheme accounts for this (which is why on-board calibration is essential to the design). Hence the radiometric accuracy of the TIR channels should be unaffected by any change in throughput. 5.4.1.2 Noise Performance For the TIR channels, the signal-to-noise ratio, SNR, is usually expressed as the Noise Equivalent Differential Temperature (NE∆T) and is formally defined as
1
TdT
dL
SNR
LTNE
where L is the radiance corresponding to a scene brightness temperature of T K.
Using the signals (detector counts), Chbb, and Ccbb, and radiances, L(Thbb) and L(Tcbb), of the two on-board blackbodies, we can derive the NE∆T from the noise measurements, ∆C, using [from RD4]
1
Tcbbhbb
cbbhbb
T
LC
CC
TLTLTNE
For AATSR, we use the standard deviation of the signal channel counts from the on-board calibration sources to obtain values of NET at the hot and cold blackbody temperatures. In Figure 17 we see that the NE∆Ts for the thermal infrared channels have remained stable for the duration of the mission. The mean values over this time given in Table 4 are within the requirements and are comparable with the pre-launch calibration measurements.
PO-RP-RAL-AT-0621 Issue 1.0
08-October-2012 Page: 28 of 69
© STFC 2012
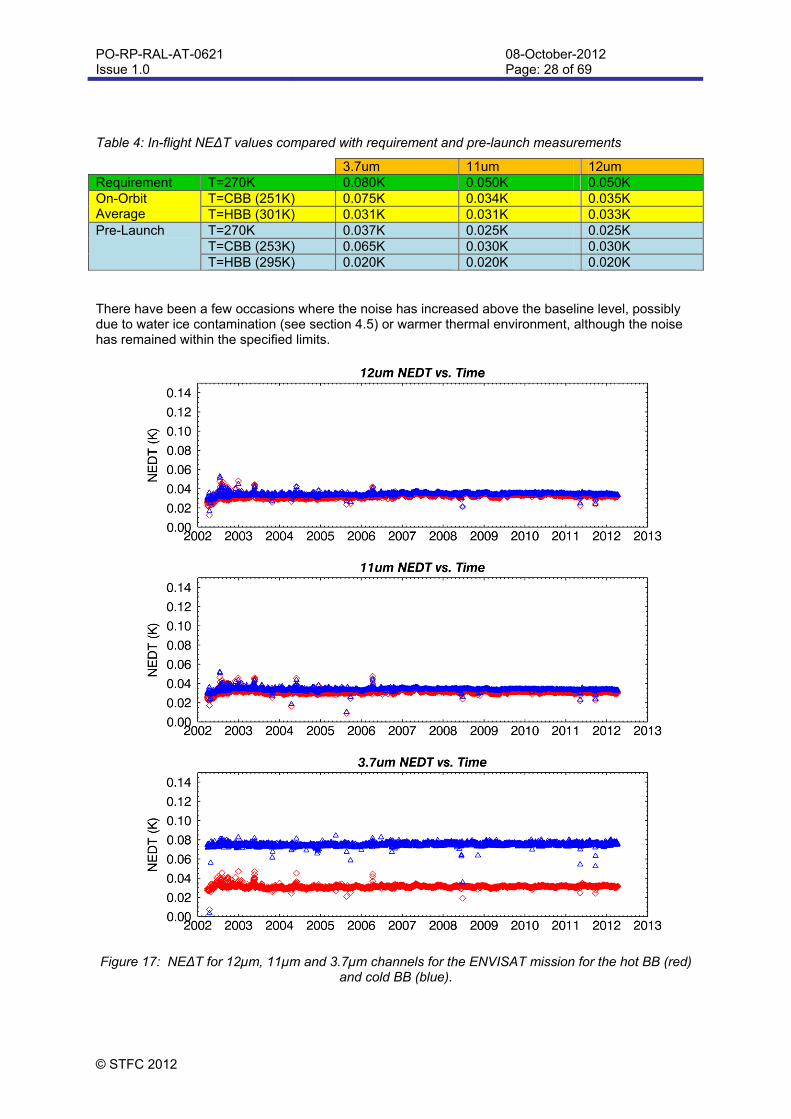
Table 4: In-flight NE∆T values compared with requirement and pre-launch measurements
3.7um 11um 12um Requirement T=270K 0.080K 0.050K 0.050K On-Orbit Average
T=CBB (251K) 0.075K 0.034K 0.035K T=HBB (301K) 0.031K 0.031K 0.033K
Pre-Launch T=270K 0.037K 0.025K 0.025K T=CBB (253K) 0.065K 0.030K 0.030K T=HBB (295K) 0.020K 0.020K 0.020K
There have been a few occasions where the noise has increased above the baseline level, possibly due to water ice contamination (see section 4.5) or warmer thermal environment, although the noise has remained within the specified limits.
Figure 17: NE∆T for 12µm, 11µm and 3.7µm channels for the ENVISAT mission for the hot BB (red) and cold BB (blue).
PO-RP-RAL-AT-0621 Issue 1.0
08-October-2012 Page: 29 of 69
© STFC 2012
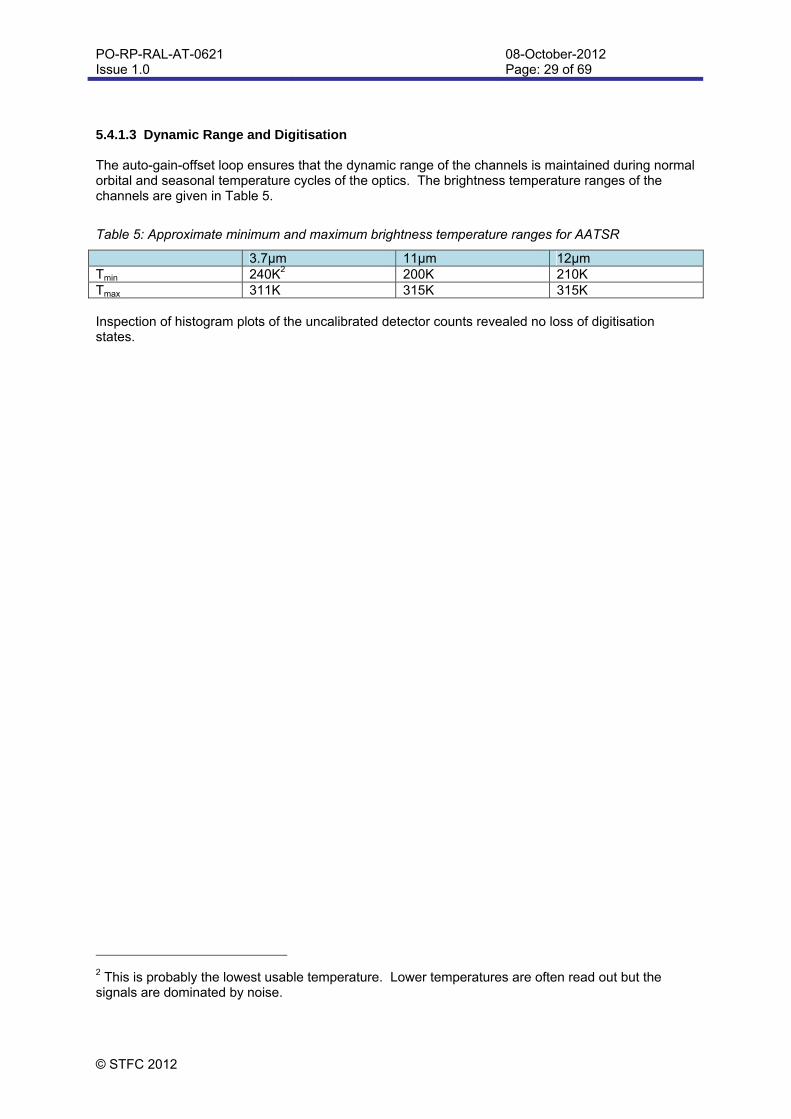
5.4.1.3 Dynamic Range and Digitisation The auto-gain-offset loop ensures that the dynamic range of the channels is maintained during normal orbital and seasonal temperature cycles of the optics. The brightness temperature ranges of the channels are given in Table 5.
Table 5: Approximate minimum and maximum brightness temperature ranges for AATSR
3.7µm 11µm 12µm Tmin 240K2 200K 210K Tmax 311K 315K 315K Inspection of histogram plots of the uncalibrated detector counts revealed no loss of digitisation states.
2 This is probably the lowest usable temperature. Lower temperatures are often read out but the signals are dominated by noise.
PO-RP-RAL-AT-0621 Issue 1.0
08-October-2012 Page: 30 of 69
© STFC 2012
5.4.2 VIS-SWIR Channels 5.4.2.1 Background of VIS-SWIR channels
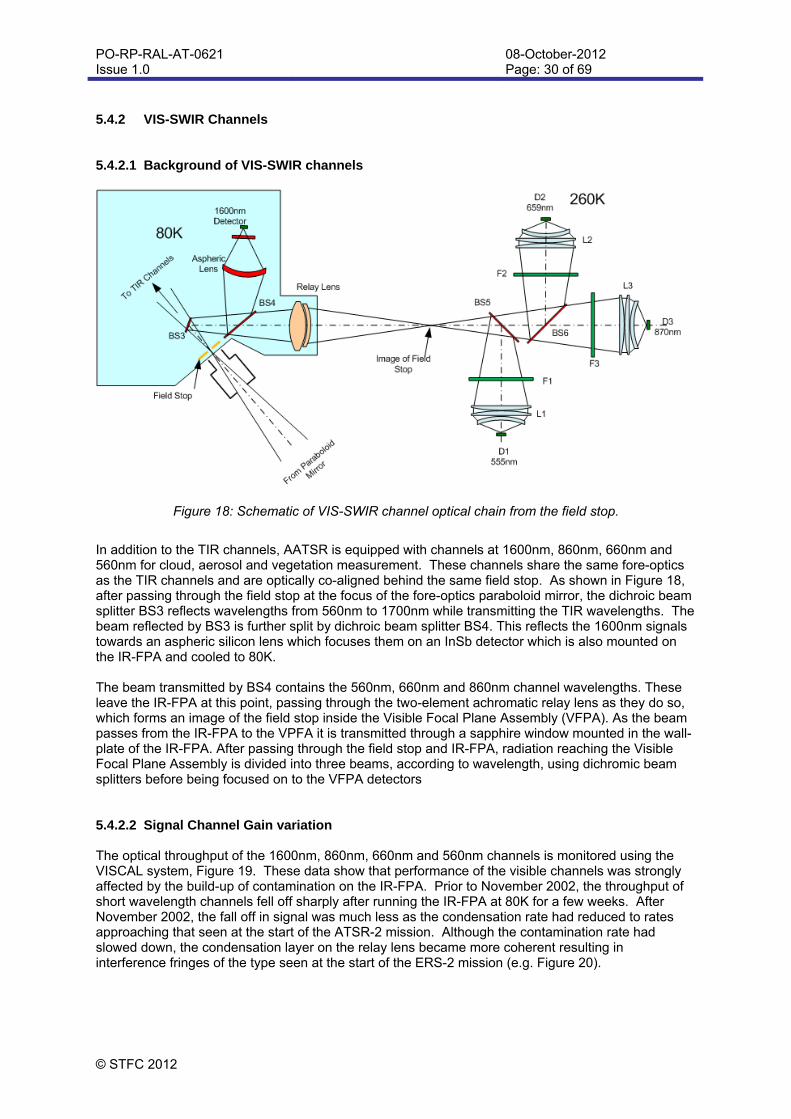
Figure 18: Schematic of VIS-SWIR channel optical chain from the field stop.
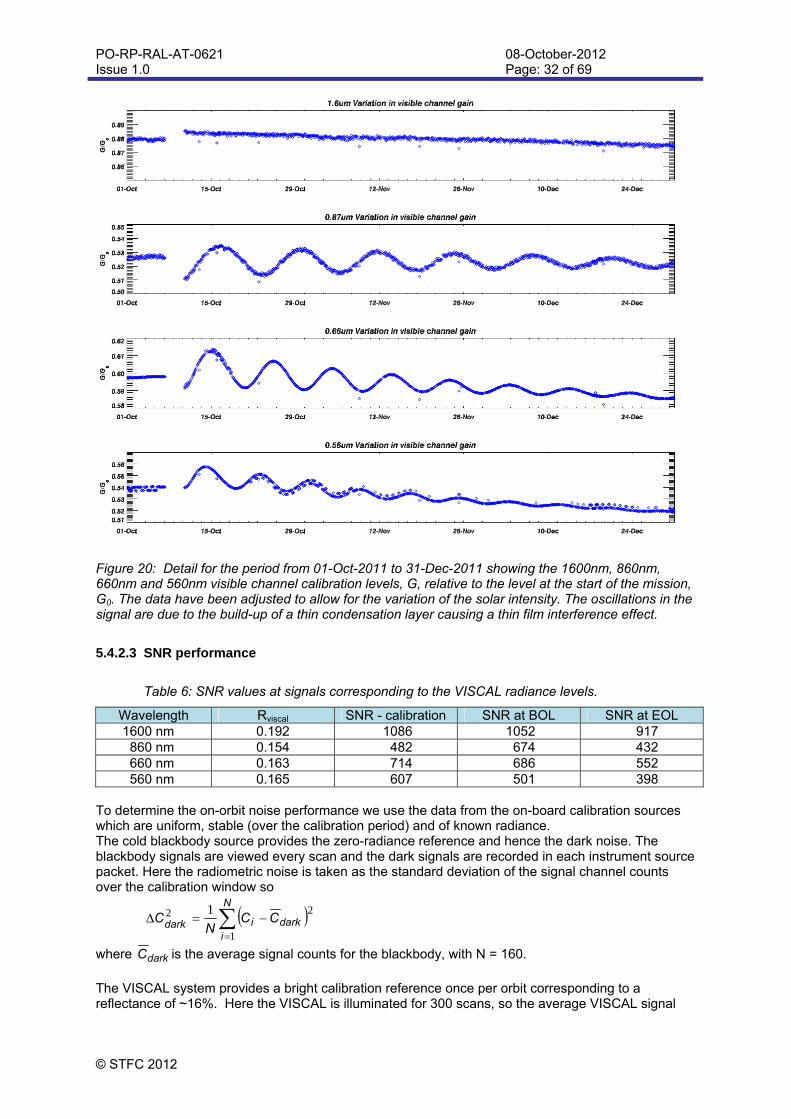
In addition to the TIR channels, AATSR is equipped with channels at 1600nm, 860nm, 660nm and 560nm for cloud, aerosol and vegetation measurement. These channels share the same fore-optics as the TIR channels and are optically co-aligned behind the same field stop. As shown in Figure 18, after passing through the field stop at the focus of the fore-optics paraboloid mirror, the dichroic beam splitter BS3 reflects wavelengths from 560nm to 1700nm while transmitting the TIR wavelengths. The beam reflected by BS3 is further split by dichroic beam splitter BS4. This reflects the 1600nm signals towards an aspheric silicon lens which focuses them on an InSb detector which is also mounted on the IR-FPA and cooled to 80K. The beam transmitted by BS4 contains the 560nm, 660nm and 860nm channel wavelengths. These leave the IR-FPA at this point, passing through the two-element achromatic relay lens as they do so, which forms an image of the field stop inside the Visible Focal Plane Assembly (VFPA). As the beam passes from the IR-FPA to the VPFA it is transmitted through a sapphire window mounted in the wall-plate of the IR-FPA. After passing through the field stop and IR-FPA, radiation reaching the Visible Focal Plane Assembly is divided into three beams, according to wavelength, using dichromic beam splitters before being focused on to the VFPA detectors 5.4.2.2 Signal Channel Gain variation The optical throughput of the 1600nm, 860nm, 660nm and 560nm channels is monitored using the VISCAL system, Figure 19. These data show that performance of the visible channels was strongly affected by the build-up of contamination on the IR-FPA. Prior to November 2002, the throughput of short wavelength channels fell off sharply after running the IR-FPA at 80K for a few weeks. After November 2002, the fall off in signal was much less as the condensation rate had reduced to rates approaching that seen at the start of the ATSR-2 mission. Although the contamination rate had slowed down, the condensation layer on the relay lens became more coherent resulting in interference fringes of the type seen at the start of the ERS-2 mission (e.g. Figure 20).

PO-RP-RAL-AT-0621 Issue 1.0
08-October-2012 Page: 31 of 69
© STFC 2012
Figure 19: The 1600nm, 860nm, 660nm and 560nm visible channel calibration levels, G, relative to the level at the start of the mission, G0. The data have been adjusted to allow for the variation of the solar intensity.
PO-RP-RAL-AT-0621 Issue 1.0
08-October-2012 Page: 32 of 69
© STFC 2012
Figure 20: Detail for the period from 01-Oct-2011 to 31-Dec-2011 showing the 1600nm, 860nm, 660nm and 560nm visible channel calibration levels, G, relative to the level at the start of the mission, G0. The data have been adjusted to allow for the variation of the solar intensity. The oscillations in the signal are due to the build-up of a thin condensation layer causing a thin film interference effect.
5.4.2.3 SNR performance
Table 6: SNR values at signals corresponding to the VISCAL radiance levels.
Wavelength Rviscal SNR - calibration SNR at BOL SNR at EOL 1600 nm 0.192 1086 1052 917
860 nm 0.154 482 674 432 660 nm 0.163 714 686 552 560 nm 0.165 607 501 398
To determine the on-orbit noise performance we use the data from the on-board calibration sources which are uniform, stable (over the calibration period) and of known radiance. The cold blackbody source provides the zero-radiance reference and hence the dark noise. The blackbody signals are viewed every scan and the dark signals are recorded in each instrument source packet. Here the radiometric noise is taken as the standard deviation of the signal channel counts over the calibration window so
N
idarkidark CC
NC
1
22 1
where darkC is the average signal counts for the blackbody, with N = 160.
The VISCAL system provides a bright calibration reference once per orbit corresponding to a reflectance of ~16%. Here the VISCAL is illuminated for 300 scans, so the average VISCAL signal
PO-RP-RAL-AT-0621 Issue 1.0
08-October-2012 Page: 33 of 69
© STFC 2012
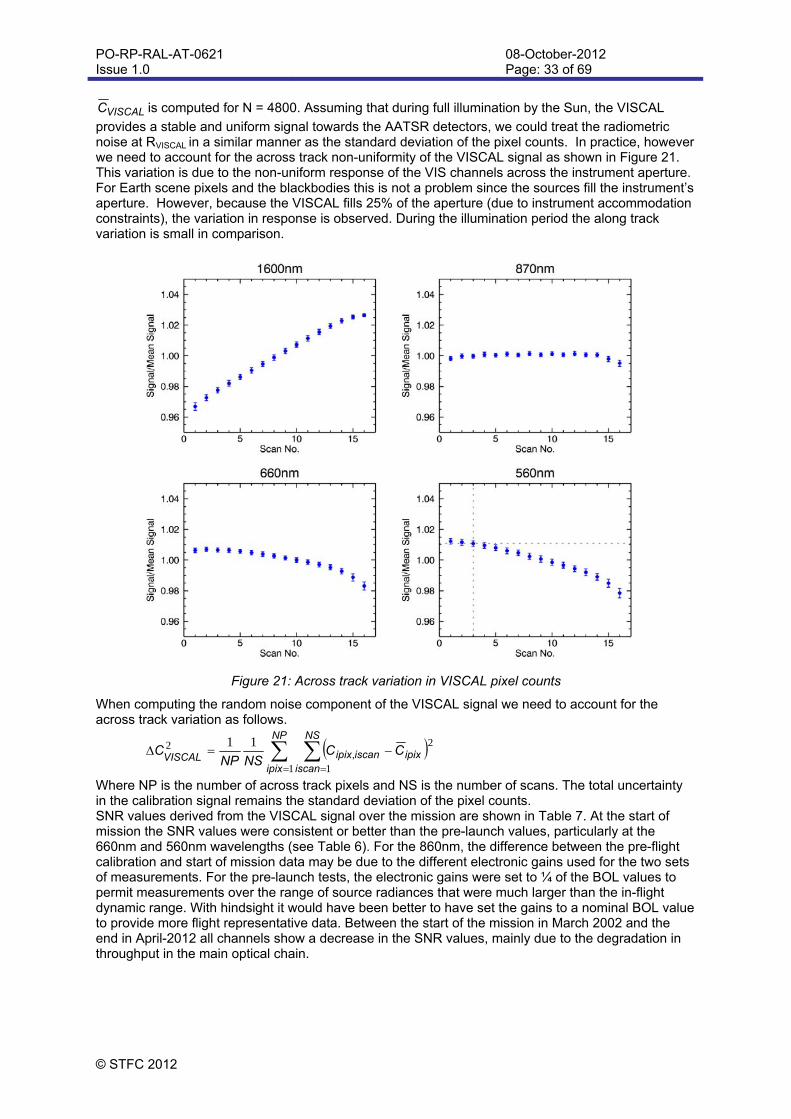
VISCALC is computed for N = 4800. Assuming that during full illumination by the Sun, the VISCAL
provides a stable and uniform signal towards the AATSR detectors, we could treat the radiometric noise at RVISCAL in a similar manner as the standard deviation of the pixel counts. In practice, however we need to account for the across track non-uniformity of the VISCAL signal as shown in Figure 21. This variation is due to the non-uniform response of the VIS channels across the instrument aperture. For Earth scene pixels and the blackbodies this is not a problem since the sources fill the instrument’s aperture. However, because the VISCAL fills 25% of the aperture (due to instrument accommodation constraints), the variation in response is observed. During the illumination period the along track variation is small in comparison.
Figure 21: Across track variation in VISCAL pixel counts
When computing the random noise component of the VISCAL signal we need to account for the across track variation as follows.
NP
ipix
NS
iscanipixiscanipixVISCAL
CCNSNP
C1 1
22 11,
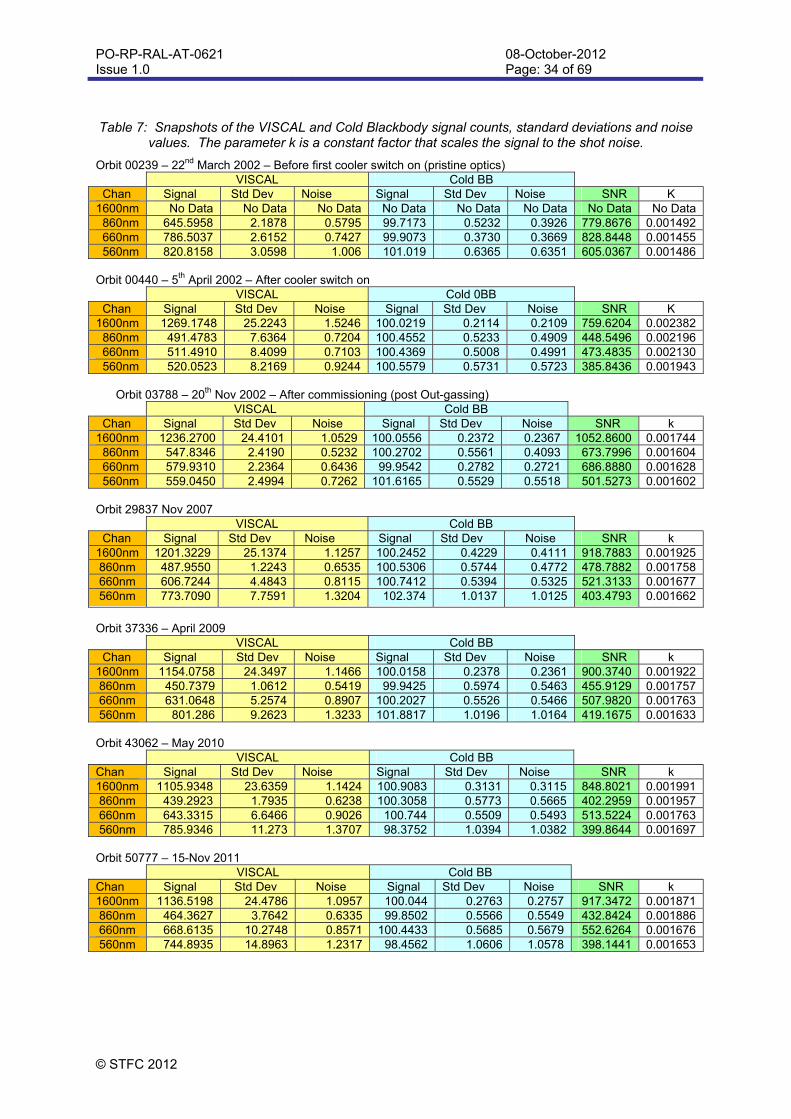
Where NP is the number of across track pixels and NS is the number of scans. The total uncertainty in the calibration signal remains the standard deviation of the pixel counts. SNR values derived from the VISCAL signal over the mission are shown in Table 7. At the start of mission the SNR values were consistent or better than the pre-launch values, particularly at the 660nm and 560nm wavelengths (see Table 6). For the 860nm, the difference between the pre-flight calibration and start of mission data may be due to the different electronic gains used for the two sets of measurements. For the pre-launch tests, the electronic gains were set to ¼ of the BOL values to permit measurements over the range of source radiances that were much larger than the in-flight dynamic range. With hindsight it would have been better to have set the gains to a nominal BOL value to provide more flight representative data. Between the start of the mission in March 2002 and the end in April-2012 all channels show a decrease in the SNR values, mainly due to the degradation in throughput in the main optical chain.
PO-RP-RAL-AT-0621 Issue 1.0
08-October-2012 Page: 34 of 69
© STFC 2012
Table 7: Snapshots of the VISCAL and Cold Blackbody signal counts, standard deviations and noise values. The parameter k is a constant factor that scales the signal to the shot noise.
Orbit 00239 – 22nd March 2002 – Before first cooler switch on (pristine optics) VISCAL Cold BB Chan Signal Std Dev Noise Signal Std Dev Noise SNR K 1600nm No Data No Data No Data No Data No Data No Data No Data No Data 860nm 645.5958 2.1878 0.5795 99.7173 0.5232 0.3926 779.8676 0.001492 660nm 786.5037 2.6152 0.7427 99.9073 0.3730 0.3669 828.8448 0.001455 560nm 820.8158 3.0598 1.006 101.019 0.6365 0.6351 605.0367 0.001486
Orbit 00440 – 5th April 2002 – After cooler switch on VISCAL Cold 0BB Chan Signal Std Dev Noise Signal Std Dev Noise SNR K 1600nm 1269.1748 25.2243 1.5246 100.0219 0.2114 0.2109 759.6204 0.002382 860nm 491.4783 7.6364 0.7204 100.4552 0.5233 0.4909 448.5496 0.002196 660nm 511.4910 8.4099 0.7103 100.4369 0.5008 0.4991 473.4835 0.002130 560nm 520.0523 8.2169 0.9244 100.5579 0.5731 0.5723 385.8436 0.001943
Orbit 03788 – 20th Nov 2002 – After commissioning (post Out-gassing) VISCAL Cold BB Chan Signal Std Dev Noise Signal Std Dev Noise SNR k 1600nm 1236.2700 24.4101 1.0529 100.0556 0.2372 0.2367 1052.8600 0.001744 860nm 547.8346 2.4190 0.5232 100.2702 0.5561 0.4093 673.7996 0.001604 660nm 579.9310 2.2364 0.6436 99.9542 0.2782 0.2721 686.8880 0.001628 560nm 559.0450 2.4994 0.7262 101.6165 0.5529 0.5518 501.5273 0.001602
Orbit 29837 Nov 2007 VISCAL Cold BB Chan Signal Std Dev Noise Signal Std Dev Noise SNR k 1600nm 1201.3229 25.1374 1.1257 100.2452 0.4229 0.4111 918.7883 0.001925 860nm 487.9550 1.2243 0.6535 100.5306 0.5744 0.4772 478.7882 0.001758 660nm 606.7244 4.4843 0.8115 100.7412 0.5394 0.5325 521.3133 0.001677 560nm 773.7090 7.7591 1.3204 102.374 1.0137 1.0125 403.4793 0.001662
Orbit 37336 – April 2009 VISCAL Cold BB Chan Signal Std Dev Noise Signal Std Dev Noise SNR k 1600nm 1154.0758 24.3497 1.1466 100.0158 0.2378 0.2361 900.3740 0.001922 860nm 450.7379 1.0612 0.5419 99.9425 0.5974 0.5463 455.9129 0.001757 660nm 631.0648 5.2574 0.8907 100.2027 0.5526 0.5466 507.9820 0.001763 560nm 801.286 9.2623 1.3233 101.8817 1.0196 1.0164 419.1675 0.001633 Orbit 43062 – May 2010 VISCAL Cold BB Chan Signal Std Dev Noise Signal Std Dev Noise SNR k 1600nm 1105.9348 23.6359 1.1424 100.9083 0.3131 0.3115 848.8021 0.001991 860nm 439.2923 1.7935 0.6238 100.3058 0.5773 0.5665 402.2959 0.001957 660nm 643.3315 6.6466 0.9026 100.744 0.5509 0.5493 513.5224 0.001763 560nm 785.9346 11.273 1.3707 98.3752 1.0394 1.0382 399.8644 0.001697 Orbit 50777 – 15-Nov 2011 VISCAL Cold BB Chan Signal Std Dev Noise Signal Std Dev Noise SNR k 1600nm 1136.5198 24.4786 1.0957 100.044 0.2763 0.2757 917.3472 0.001871 860nm 464.3627 3.7642 0.6335 99.8502 0.5566 0.5549 432.8424 0.001886 660nm 668.6135 10.2748 0.8571 100.4433 0.5685 0.5679 552.6264 0.001676 560nm 744.8935 14.8963 1.2317 98.4562 1.0606 1.0578 398.1441 0.001653
PO-RP-RAL-AT-0621 Issue 1.0
08-October-2012 Page: 35 of 69
© STFC 2012
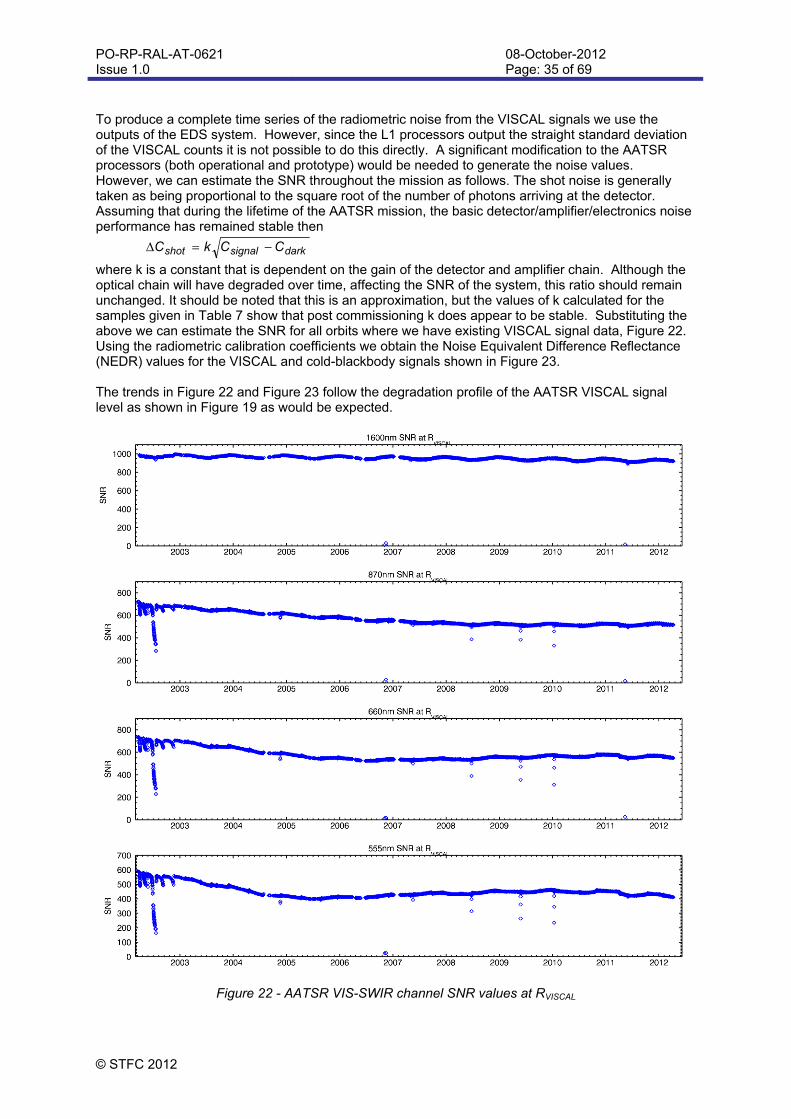
To produce a complete time series of the radiometric noise from the VISCAL signals we use the outputs of the EDS system. However, since the L1 processors output the straight standard deviation of the VISCAL counts it is not possible to do this directly. A significant modification to the AATSR processors (both operational and prototype) would be needed to generate the noise values. However, we can estimate the SNR throughout the mission as follows. The shot noise is generally taken as being proportional to the square root of the number of photons arriving at the detector. Assuming that during the lifetime of the AATSR mission, the basic detector/amplifier/electronics noise performance has remained stable then
darksignalshot CCkC
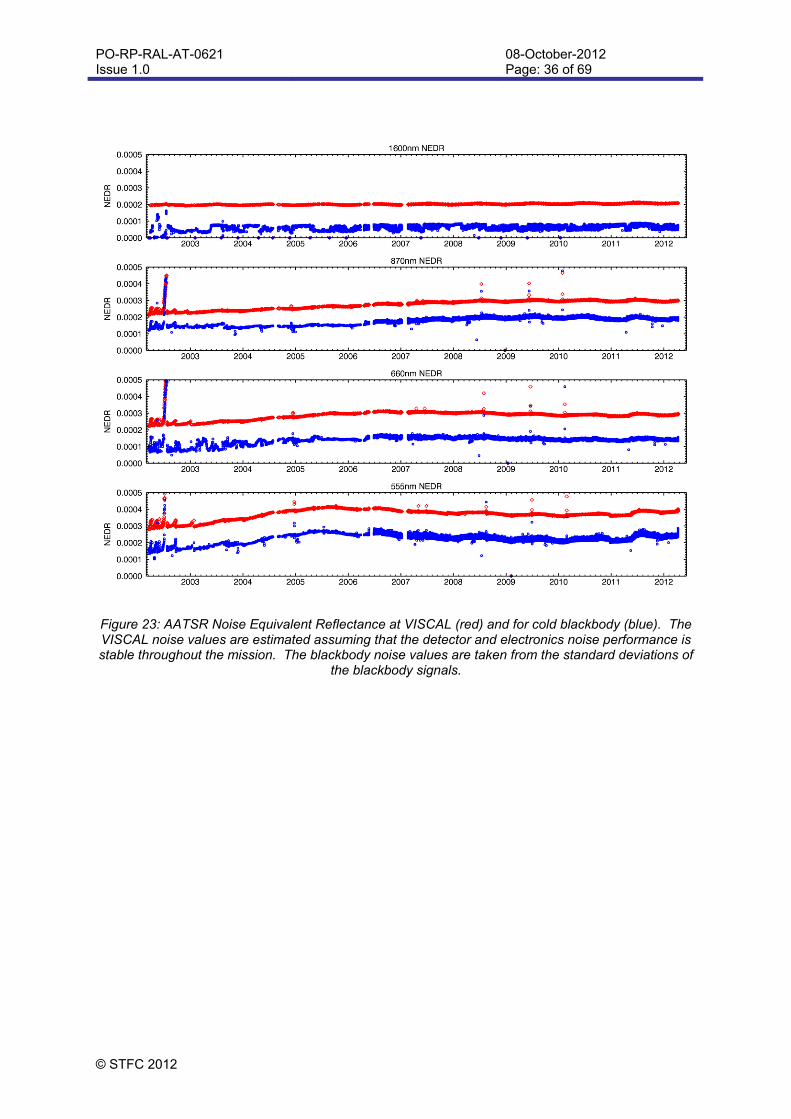
where k is a constant that is dependent on the gain of the detector and amplifier chain. Although the optical chain will have degraded over time, affecting the SNR of the system, this ratio should remain unchanged. It should be noted that this is an approximation, but the values of k calculated for the samples given in Table 7 show that post commissioning k does appear to be stable. Substituting the above we can estimate the SNR for all orbits where we have existing VISCAL signal data, Figure 22. Using the radiometric calibration coefficients we obtain the Noise Equivalent Difference Reflectance (NEDR) values for the VISCAL and cold-blackbody signals shown in Figure 23. The trends in Figure 22 and Figure 23 follow the degradation profile of the AATSR VISCAL signal level as shown in Figure 19 as would be expected.
Figure 22 - AATSR VIS-SWIR channel SNR values at RVISCAL
PO-RP-RAL-AT-0621 Issue 1.0
08-October-2012 Page: 36 of 69
© STFC 2012
Figure 23: AATSR Noise Equivalent Reflectance at VISCAL (red) and for cold blackbody (blue). The VISCAL noise values are estimated assuming that the detector and electronics noise performance is stable throughout the mission. The blackbody noise values are taken from the standard deviations of
the blackbody signals.
PO-RP-RAL-AT-0621 Issue 1.0
08-October-2012 Page: 37 of 69
© STFC 2012
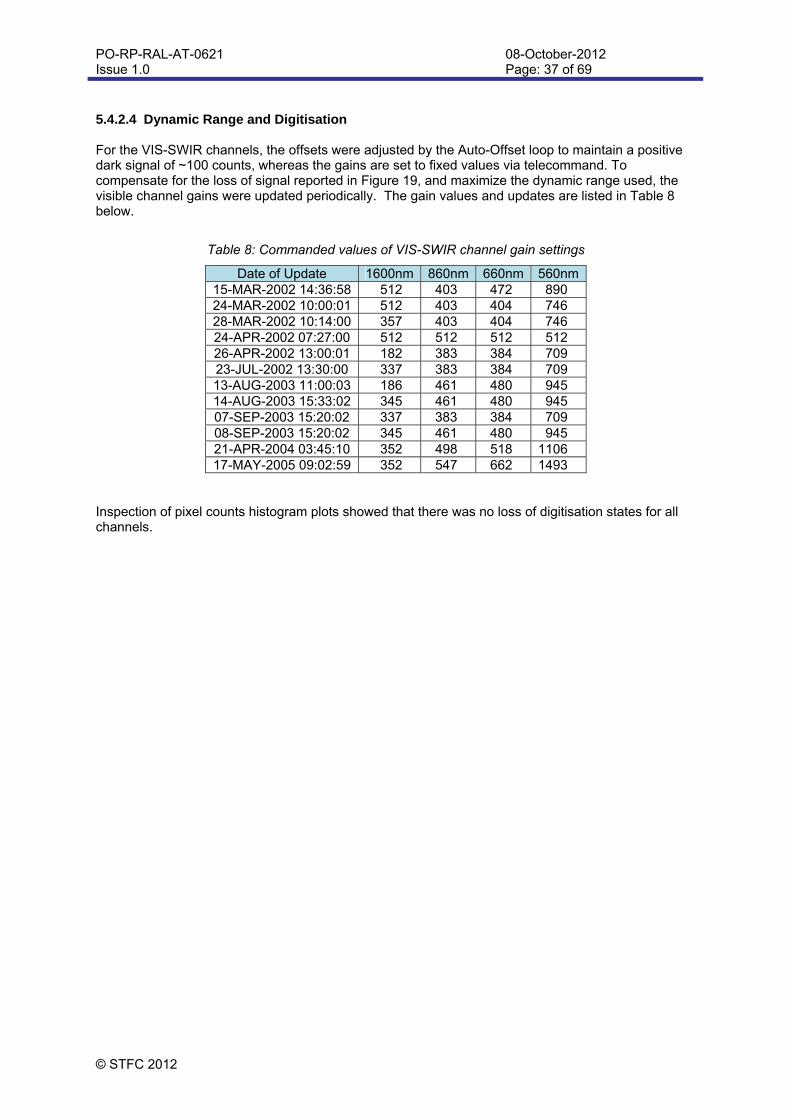
5.4.2.4 Dynamic Range and Digitisation For the VIS-SWIR channels, the offsets were adjusted by the Auto-Offset loop to maintain a positive dark signal of ~100 counts, whereas the gains are set to fixed values via telecommand. To compensate for the loss of signal reported in Figure 19, and maximize the dynamic range used, the visible channel gains were updated periodically. The gain values and updates are listed in Table 8 below.
Table 8: Commanded values of VIS-SWIR channel gain settings
Date of Update 1600nm 860nm 660nm 560nm 15-MAR-2002 14:36:58 512 403 472 890 24-MAR-2002 10:00:01 512 403 404 746 28-MAR-2002 10:14:00 357 403 404 746 24-APR-2002 07:27:00 512 512 512 512 26-APR-2002 13:00:01 182 383 384 709 23-JUL-2002 13:30:00 337 383 384 709 13-AUG-2003 11:00:03 186 461 480 945 14-AUG-2003 15:33:02 345 461 480 945 07-SEP-2003 15:20:02 337 383 384 709 08-SEP-2003 15:20:02 345 461 480 945 21-APR-2004 03:45:10 352 498 518 1106 17-MAY-2005 09:02:59 352 547 662 1493
Inspection of pixel counts histogram plots showed that there was no loss of digitisation states for all channels.
PO-RP-RAL-AT-0621 Issue 1.0
08-October-2012 Page: 38 of 69
© STFC 2012
5.5 Calibration Systems 5.5.1 Blackbodies
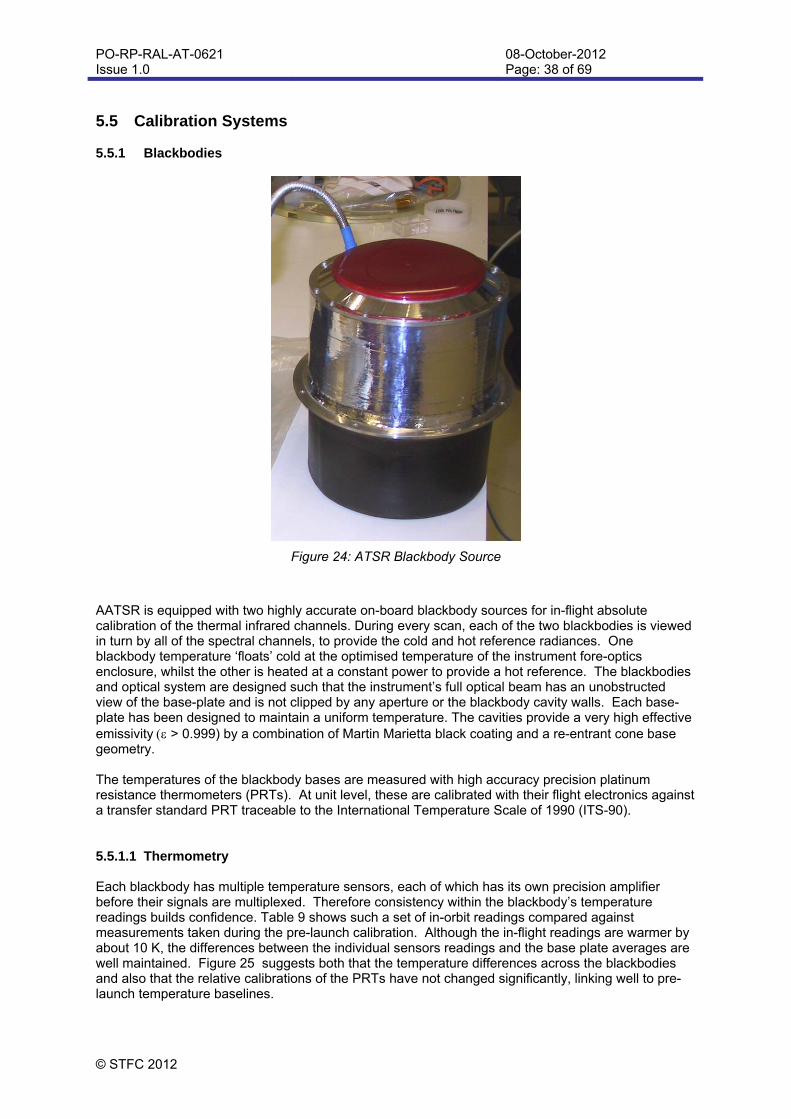
Figure 24: ATSR Blackbody Source
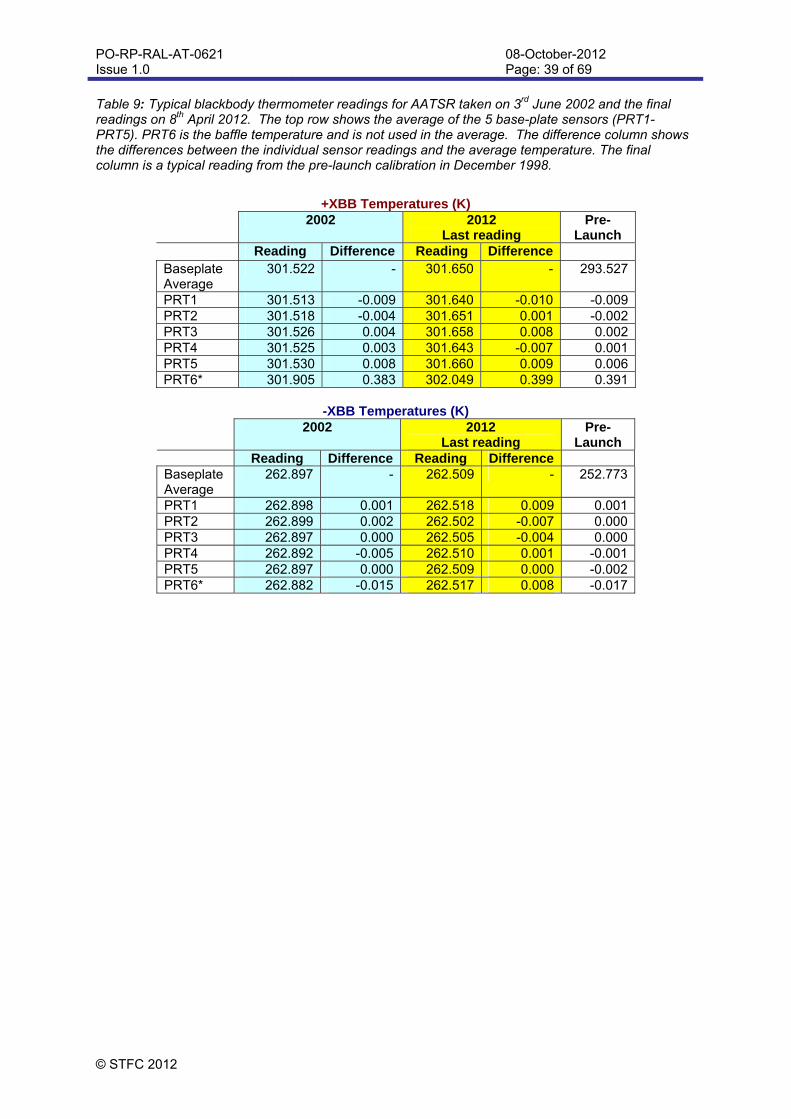
AATSR is equipped with two highly accurate on-board blackbody sources for in-flight absolute calibration of the thermal infrared channels. During every scan, each of the two blackbodies is viewed in turn by all of the spectral channels, to provide the cold and hot reference radiances. One blackbody temperature ‘floats’ cold at the optimised temperature of the instrument fore-optics enclosure, whilst the other is heated at a constant power to provide a hot reference. The blackbodies and optical system are designed such that the instrument’s full optical beam has an unobstructed view of the base-plate and is not clipped by any aperture or the blackbody cavity walls. Each base-plate has been designed to maintain a uniform temperature. The cavities provide a very high effective emissivity > 0.999) by a combination of Martin Marietta black coating and a re-entrant cone base geometry. The temperatures of the blackbody bases are measured with high accuracy precision platinum resistance thermometers (PRTs). At unit level, these are calibrated with their flight electronics against a transfer standard PRT traceable to the International Temperature Scale of 1990 (ITS-90). 5.5.1.1 Thermometry Each blackbody has multiple temperature sensors, each of which has its own precision amplifier before their signals are multiplexed. Therefore consistency within the blackbody’s temperature readings builds confidence. Table 9 shows such a set of in-orbit readings compared against measurements taken during the pre-launch calibration. Although the in-flight readings are warmer by about 10 K, the differences between the individual sensors readings and the base plate averages are well maintained. Figure 25 suggests both that the temperature differences across the blackbodies and also that the relative calibrations of the PRTs have not changed significantly, linking well to pre-launch temperature baselines.
PO-RP-RAL-AT-0621 Issue 1.0
08-October-2012 Page: 39 of 69
© STFC 2012
Table 9: Typical blackbody thermometer readings for AATSR taken on 3rd June 2002 and the final readings on 8th April 2012. The top row shows the average of the 5 base-plate sensors (PRT1-PRT5). PRT6 is the baffle temperature and is not used in the average. The difference column shows the differences between the individual sensor readings and the average temperature. The final column is a typical reading from the pre-launch calibration in December 1998.
+XBB Temperatures (K)
2002 2012 Last reading
Pre-Launch
Reading Difference Reading Difference Baseplate Average
301.522 - 301.650 - 293.527
PRT1 301.513 -0.009 301.640 -0.010 -0.009 PRT2 301.518 -0.004 301.651 0.001 -0.002 PRT3 301.526 0.004 301.658 0.008 0.002 PRT4 301.525 0.003 301.643 -0.007 0.001 PRT5 301.530 0.008 301.660 0.009 0.006 PRT6* 301.905 0.383 302.049 0.399 0.391
-XBB Temperatures (K)
2002 2012 Last reading
Pre-Launch
Reading Difference Reading Difference Baseplate Average
262.897 - 262.509 - 252.773
PRT1 262.898 0.001 262.518 0.009 0.001 PRT2 262.899 0.002 262.502 -0.007 0.000 PRT3 262.897 0.000 262.505 -0.004 0.000 PRT4 262.892 -0.005 262.510 0.001 -0.001 PRT5 262.897 0.000 262.509 0.000 -0.002 PRT6* 262.882 -0.015 262.517 0.008 -0.017
PO-RP-RAL-AT-0621 Issue 1.0
08-October-2012 Page: 40 of 69
© STFC 2012
Figure 25: Trends for the AATSR mission of daily averages of the +XBB and –XBB base-plate mean temperatures, and the differences from the mean of the individual sensor readings.
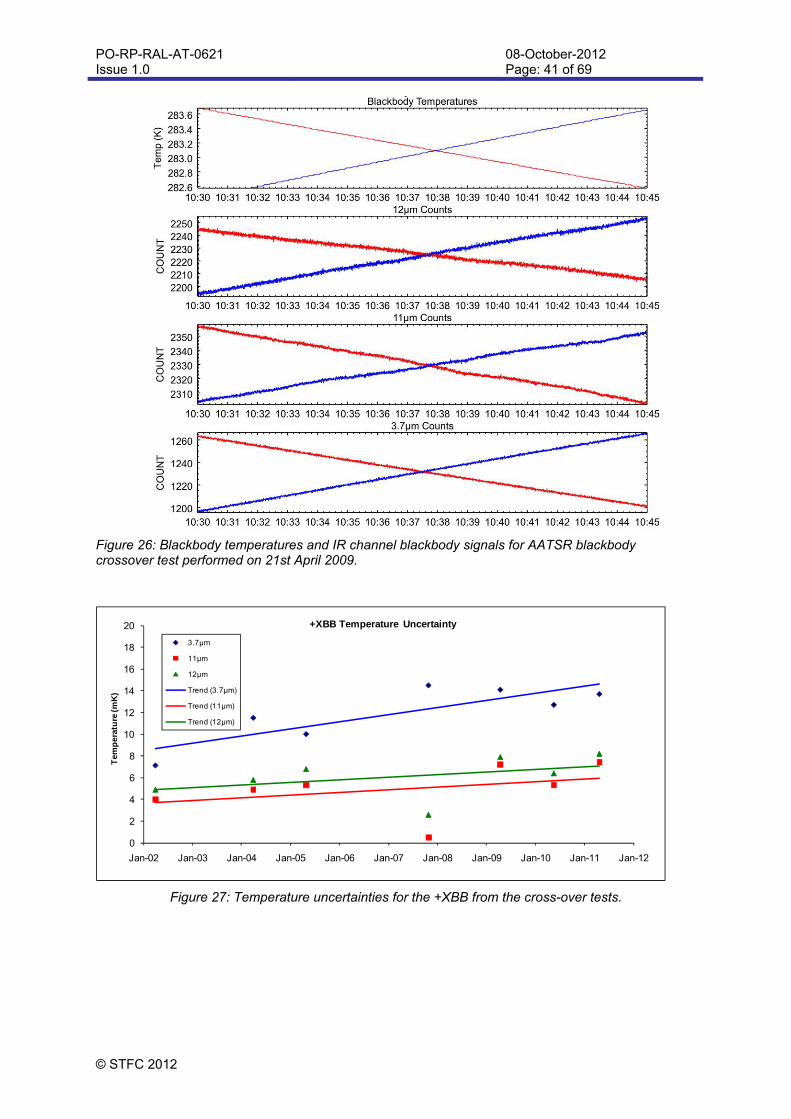
5.5.1.2 BB Cross-Over Tests A useful technique to monitor the radiometric stability is a ‘blackbody -cross-over test’. This test is performed by switching the heated blackbody from the +XBB to the –XBB (and vice versa) and allowing the temperatures to cross over and stabilise. The basic idea is to compare the radiometric signals in the thermal channels when the two blackbodies are at identical temperatures. Any significant difference would imply a drift in the blackbody thermometer calibration or change in target emissivity caused by a deterioration of the black surface finish. The blackbody temperatures and radiometric signals during a typical cross over test are shown in Figure 26. The test was performed during commissioning and roughly annually. The results for AATSR indicate that, relative to each other, the brightness temperature errors from the blackbodies were typically less than 10 mK at 11 and 12 µm, and below 20 mK at 3.7 µm. Comparing with earlier measurements, Figure 27, it can be seen that the 11 and 12 µm channels are stable over time, while there appears to be a very slow increase in the 3.7 µm channel of approximately 6 mK over the mission. Even for the trend in this channel, the one with the lowest blackbody emissivity, the apparent brightness temperature difference is still much smaller than the radiometric noise. It should be noted that the test is a comparison of one blackbody against the other on the assumption that the reference is stable, and therefore does not provide an absolute calibration of the blackbodies. The radiometric calibration of the TIR channels is linked to the pre-launch tests and characterisation of the instrument. After launch there is no direct method to verify the absolute radiometric calibration of the on-board blackbody thermometry and emissivity.
PO-RP-RAL-AT-0621 Issue 1.0
08-October-2012 Page: 41 of 69
© STFC 2012
Figure 26: Blackbody temperatures and IR channel blackbody signals for AATSR blackbody crossover test performed on 21st April 2009.
0
2
4
6
8
10
12
14
16
18
20
Jan-02 Jan-03 Jan-04 Jan-05 Jan-06 Jan-07 Jan-08 Jan-09 Jan-10 Jan-11 Jan-12
Tem
per
atu
re (m
K)
+XBB Temperature Uncertainty
3.7µm
11µm
12µm
Trend (3.7µm)
Trend (11µm)
Trend (12µm)
Figure 27: Temperature uncertainties for the +XBB from the cross-over tests.
PO-RP-RAL-AT-0621 Issue 1.0
08-October-2012 Page: 42 of 69
© STFC 2012
5.5.2 VISCAL
BaffleUV Filter
Black-Body
Nadir View
Along-TrackView
VISCAL
Sun
M2
FPAField Stop
Opal
M1Off-Axis Paraboloid
(f = 540mm)
Scan Mirror
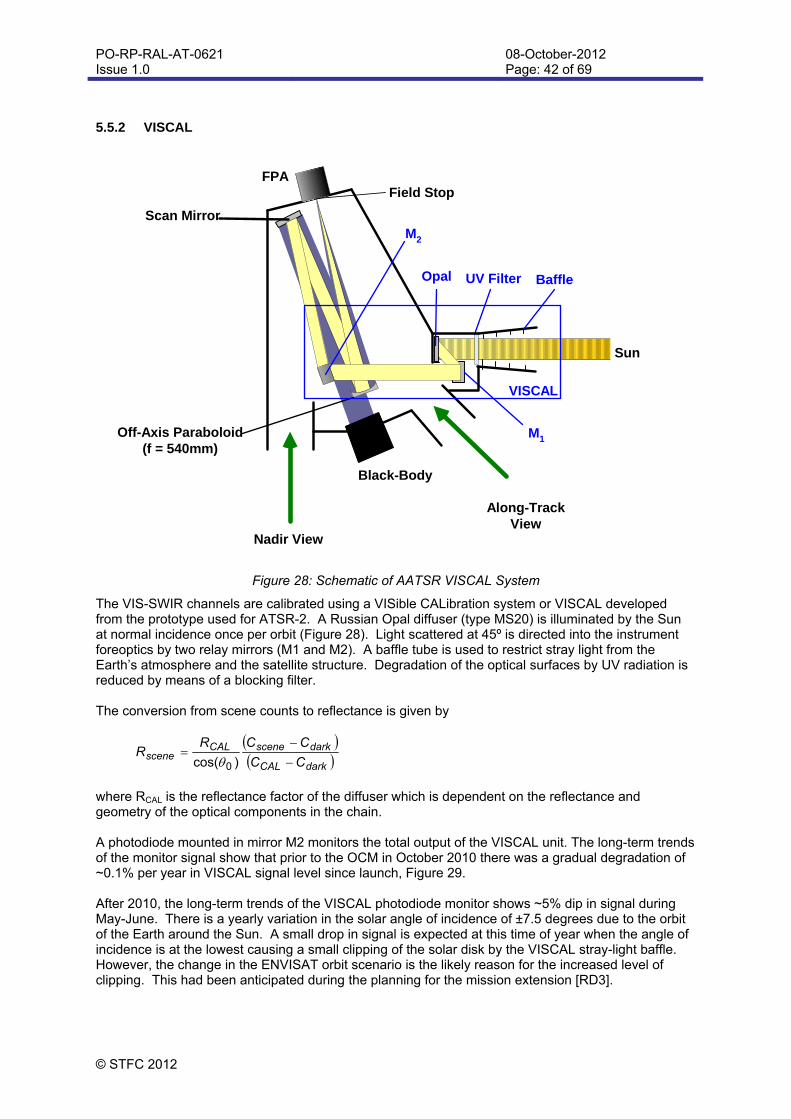
Figure 28: Schematic of AATSR VISCAL System
The VIS-SWIR channels are calibrated using a VISible CALibration system or VISCAL developed from the prototype used for ATSR-2. A Russian Opal diffuser (type MS20) is illuminated by the Sun at normal incidence once per orbit (Figure 28). Light scattered at 45º is directed into the instrument foreoptics by two relay mirrors (M1 and M2). A baffle tube is used to restrict stray light from the Earth’s atmosphere and the satellite structure. Degradation of the optical surfaces by UV radiation is reduced by means of a blocking filter. The conversion from scene counts to reflectance is given by
darkCAL
darksceneCALscene CC
CCRR
)cos( 0
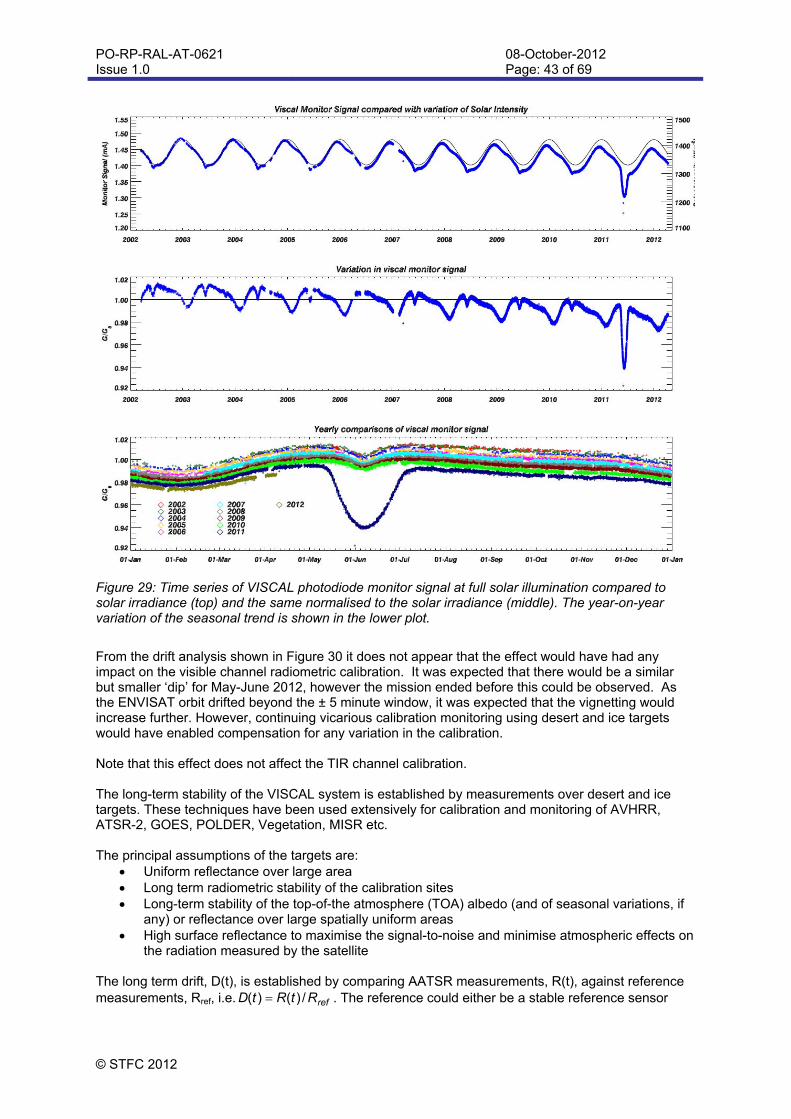
where RCAL is the reflectance factor of the diffuser which is dependent on the reflectance and geometry of the optical components in the chain. A photodiode mounted in mirror M2 monitors the total output of the VISCAL unit. The long-term trends of the monitor signal show that prior to the OCM in October 2010 there was a gradual degradation of ~0.1% per year in VISCAL signal level since launch, Figure 29. After 2010, the long-term trends of the VISCAL photodiode monitor shows ~5% dip in signal during May-June. There is a yearly variation in the solar angle of incidence of ±7.5 degrees due to the orbit of the Earth around the Sun. A small drop in signal is expected at this time of year when the angle of incidence is at the lowest causing a small clipping of the solar disk by the VISCAL stray-light baffle. However, the change in the ENVISAT orbit scenario is the likely reason for the increased level of clipping. This had been anticipated during the planning for the mission extension [RD3].
PO-RP-RAL-AT-0621 Issue 1.0
08-October-2012 Page: 43 of 69
© STFC 2012
Figure 29: Time series of VISCAL photodiode monitor signal at full solar illumination compared to solar irradiance (top) and the same normalised to the solar irradiance (middle). The year-on-year variation of the seasonal trend is shown in the lower plot.
From the drift analysis shown in Figure 30 it does not appear that the effect would have had any impact on the visible channel radiometric calibration. It was expected that there would be a similar but smaller ‘dip’ for May-June 2012, however the mission ended before this could be observed. As the ENVISAT orbit drifted beyond the ± 5 minute window, it was expected that the vignetting would increase further. However, continuing vicarious calibration monitoring using desert and ice targets would have enabled compensation for any variation in the calibration. Note that this effect does not affect the TIR channel calibration. The long-term stability of the VISCAL system is established by measurements over desert and ice targets. These techniques have been used extensively for calibration and monitoring of AVHRR, ATSR-2, GOES, POLDER, Vegetation, MISR etc. The principal assumptions of the targets are:
Uniform reflectance over large area Long term radiometric stability of the calibration sites Long-term stability of the top-of-the atmosphere (TOA) albedo (and of seasonal variations, if
any) or reflectance over large spatially uniform areas High surface reflectance to maximise the signal-to-noise and minimise atmospheric effects on
the radiation measured by the satellite The long term drift, D(t), is established by comparing AATSR measurements, R(t), against reference measurements, Rref, i.e. refRtRtD /)()( . The reference could either be a stable reference sensor
PO-RP-RAL-AT-0621 Issue 1.0
08-October-2012 Page: 44 of 69
© STFC 2012
such as MERIS or the reference Bidirectional Reflectance Distribution Function (BRDF) derived from early ground measurements and/or models.
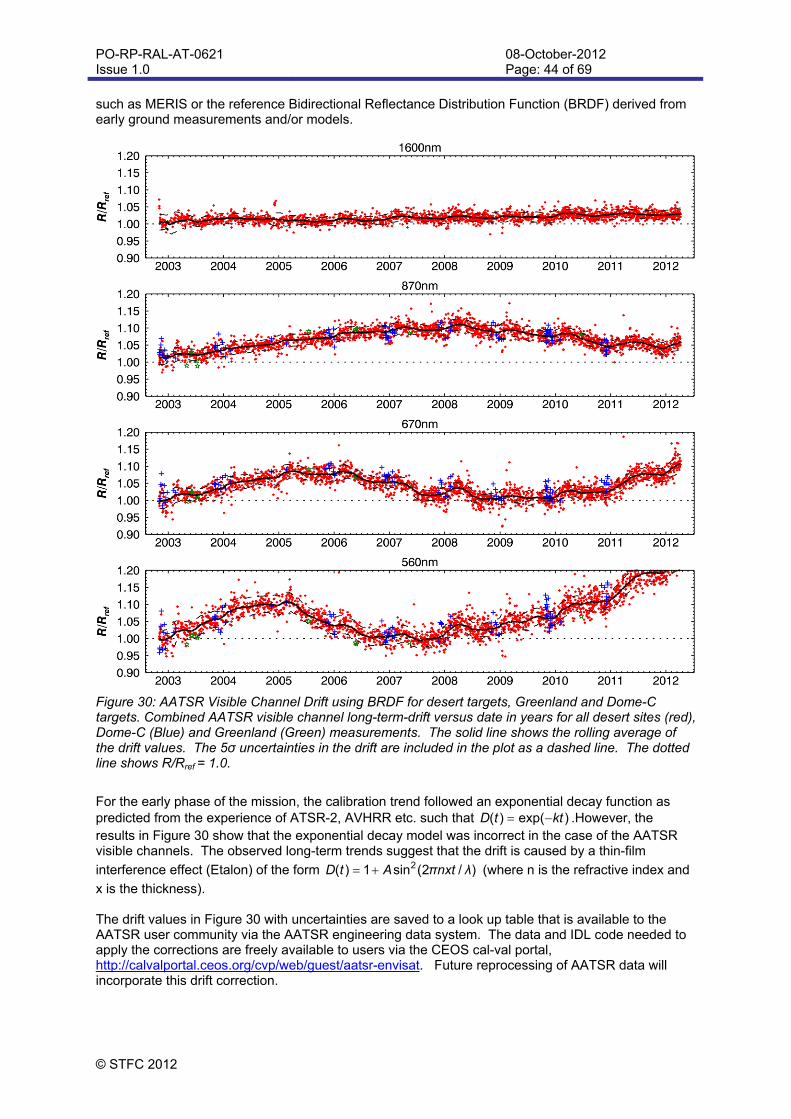
Figure 30: AATSR Visible Channel Drift using BRDF for desert targets, Greenland and Dome-C targets. Combined AATSR visible channel long-term-drift versus date in years for all desert sites (red), Dome-C (Blue) and Greenland (Green) measurements. The solid line shows the rolling average of the drift values. The 5σ uncertainties in the drift are included in the plot as a dashed line. The dotted line shows R/Rref = 1.0.
For the early phase of the mission, the calibration trend followed an exponential decay function as predicted from the experience of ATSR-2, AVHRR etc. such that )exp()( kttD .However, the results in Figure 30 show that the exponential decay model was incorrect in the case of the AATSR visible channels. The observed long-term trends suggest that the drift is caused by a thin-film
interference effect (Etalon) of the form )/2(sin1)( 2 λnxtπAtD (where n is the refractive index and
x is the thickness). The drift values in Figure 30 with uncertainties are saved to a look up table that is available to the AATSR user community via the AATSR engineering data system. The data and IDL code needed to apply the corrections are freely available to users via the CEOS cal-val portal, http://calvalportal.ceos.org/cvp/web/guest/aatsr-envisat. Future reprocessing of AATSR data will incorporate this drift correction.
PO-RP-RAL-AT-0621 Issue 1.0
08-October-2012 Page: 45 of 69
© STFC 2012
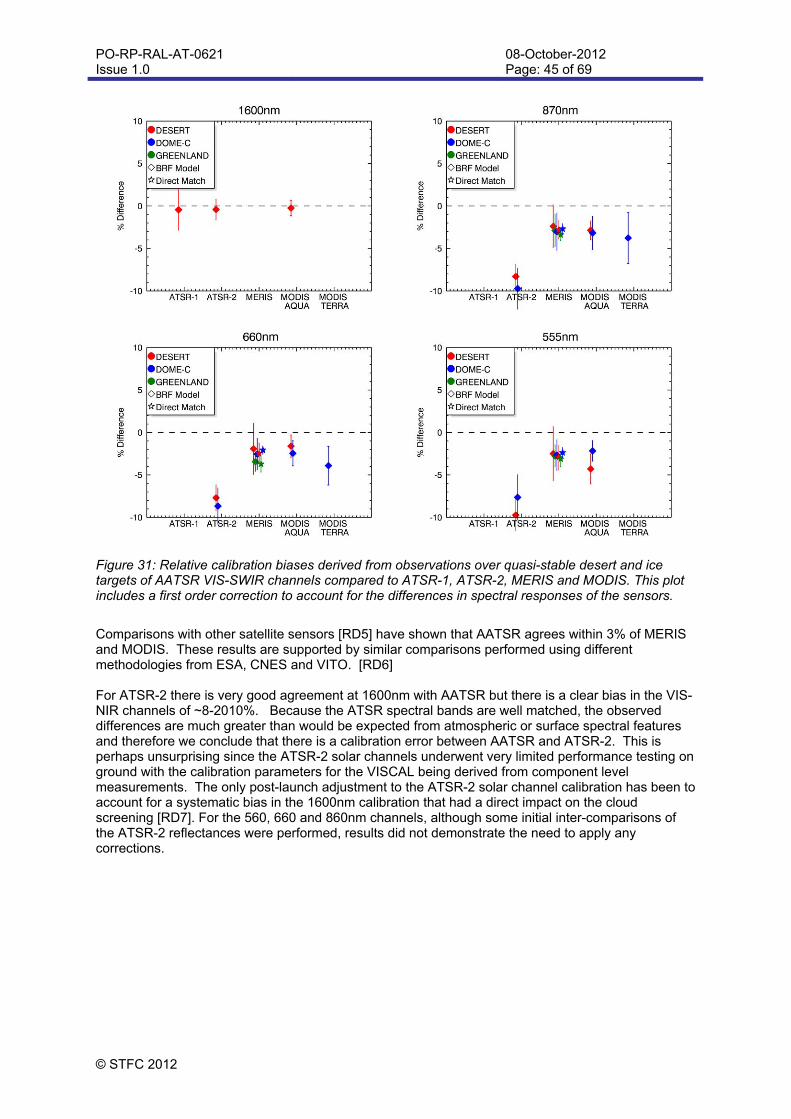
Figure 31: Relative calibration biases derived from observations over quasi-stable desert and ice targets of AATSR VIS-SWIR channels compared to ATSR-1, ATSR-2, MERIS and MODIS. This plot includes a first order correction to account for the differences in spectral responses of the sensors.
Comparisons with other satellite sensors [RD5] have shown that AATSR agrees within 3% of MERIS and MODIS. These results are supported by similar comparisons performed using different methodologies from ESA, CNES and VITO. [RD6] For ATSR-2 there is very good agreement at 1600nm with AATSR but there is a clear bias in the VIS-NIR channels of ~8-2010%. Because the ATSR spectral bands are well matched, the observed differences are much greater than would be expected from atmospheric or surface spectral features and therefore we conclude that there is a calibration error between AATSR and ATSR-2. This is perhaps unsurprising since the ATSR-2 solar channels underwent very limited performance testing on ground with the calibration parameters for the VISCAL being derived from component level measurements. The only post-launch adjustment to the ATSR-2 solar channel calibration has been to account for a systematic bias in the 1600nm calibration that had a direct impact on the cloud screening [RD7]. For the 560, 660 and 860nm channels, although some initial inter-comparisons of the ATSR-2 reflectances were performed, results did not demonstrate the need to apply any corrections.
PO-RP-RAL-AT-0621 Issue 1.0
08-October-2012 Page: 46 of 69
© STFC 2012
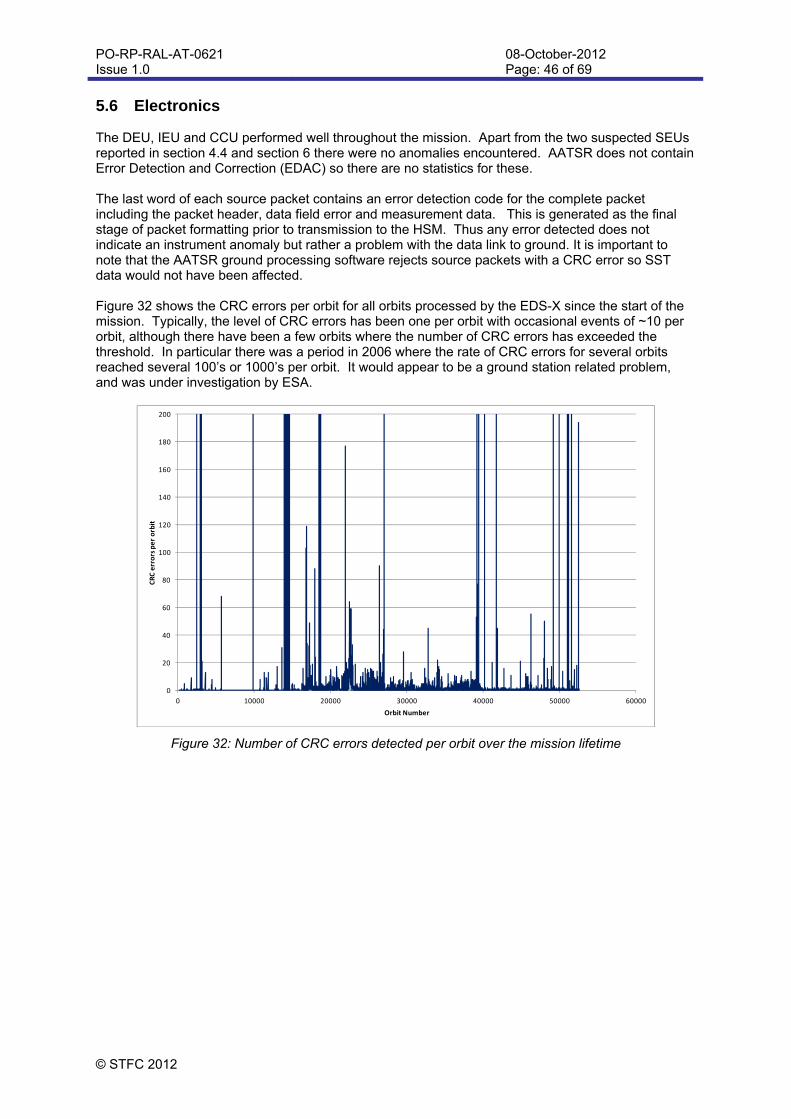
5.6 Electronics The DEU, IEU and CCU performed well throughout the mission. Apart from the two suspected SEUs reported in section 4.4 and section 6 there were no anomalies encountered. AATSR does not contain Error Detection and Correction (EDAC) so there are no statistics for these. The last word of each source packet contains an error detection code for the complete packet including the packet header, data field error and measurement data. This is generated as the final stage of packet formatting prior to transmission to the HSM. Thus any error detected does not indicate an instrument anomaly but rather a problem with the data link to ground. It is important to note that the AATSR ground processing software rejects source packets with a CRC error so SST data would not have been affected. Figure 32 shows the CRC errors per orbit for all orbits processed by the EDS-X since the start of the mission. Typically, the level of CRC errors has been one per orbit with occasional events of ~10 per orbit, although there have been a few orbits where the number of CRC errors has exceeded the threshold. In particular there was a period in 2006 where the rate of CRC errors for several orbits reached several 100’s or 1000’s per orbit. It would appear to be a ground station related problem, and was under investigation by ESA.
0
20
40
60
80
100
120
140
160
180
200
0 10000 20000 30000 40000 50000 60000
CRC errors per orbit
Orbit Number
Figure 32: Number of CRC errors detected per orbit over the mission lifetime
PO-RP-RAL-AT-0621 Issue 1.0
08-Oct-2012 Page: 47 of 69
© STFC 2012
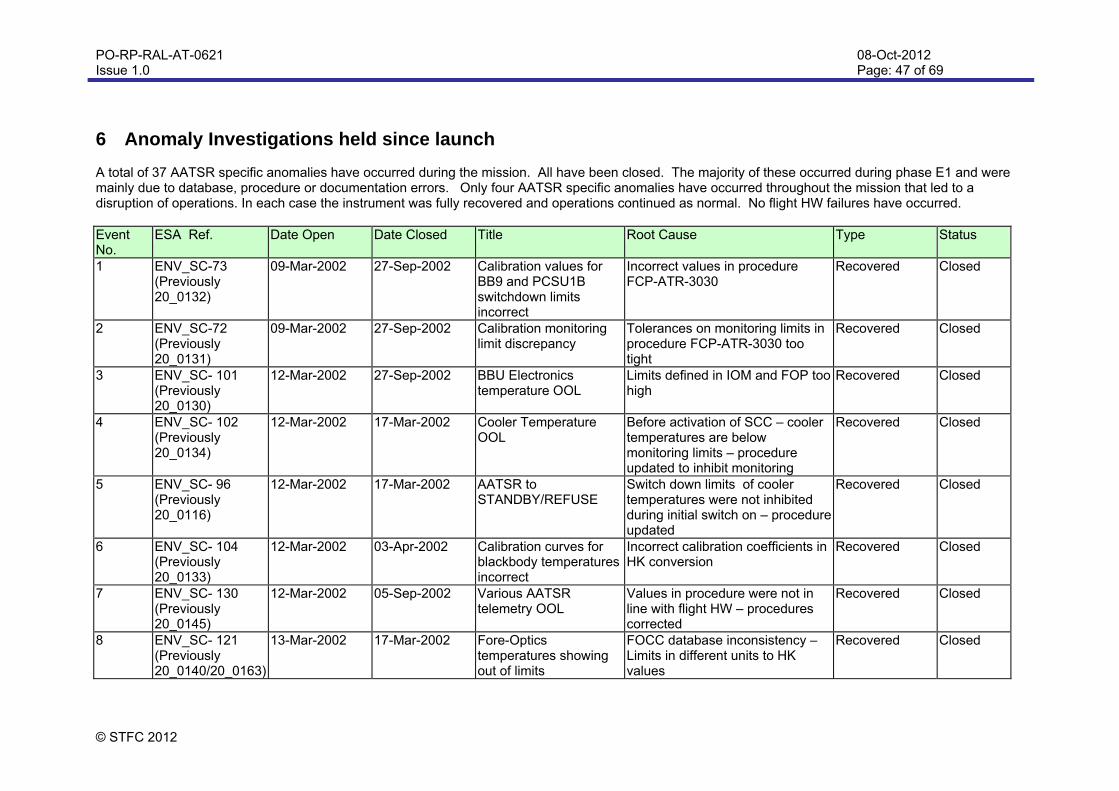
6 Anomaly Investigations held since launch A total of 37 AATSR specific anomalies have occurred during the mission. All have been closed. The majority of these occurred during phase E1 and were mainly due to database, procedure or documentation errors. Only four AATSR specific anomalies have occurred throughout the mission that led to a disruption of operations. In each case the instrument was fully recovered and operations continued as normal. No flight HW failures have occurred. Event No.
ESA Ref. Date Open Date Closed Title Root Cause Type Status
1 ENV_SC-73 (Previously 20_0132)
09-Mar-2002 27-Sep-2002 Calibration values for BB9 and PCSU1B switchdown limits incorrect
Incorrect values in procedure FCP-ATR-3030
Recovered Closed
2 ENV_SC-72 (Previously 20_0131)
09-Mar-2002 27-Sep-2002 Calibration monitoring limit discrepancy
Tolerances on monitoring limits in procedure FCP-ATR-3030 too tight
Recovered Closed
3 ENV_SC- 101 (Previously 20_0130)
12-Mar-2002 27-Sep-2002 BBU Electronics temperature OOL
Limits defined in IOM and FOP too high
Recovered Closed
4 ENV_SC- 102 (Previously 20_0134)
12-Mar-2002 17-Mar-2002 Cooler Temperature OOL
Before activation of SCC – cooler temperatures are below monitoring limits – procedure updated to inhibit monitoring
Recovered Closed
5 ENV_SC- 96 (Previously 20_0116)
12-Mar-2002 17-Mar-2002 AATSR to STANDBY/REFUSE
Switch down limits of cooler temperatures were not inhibited during initial switch on – procedure updated
Recovered Closed
6 ENV_SC- 104 (Previously 20_0133)
12-Mar-2002 03-Apr-2002 Calibration curves for blackbody temperatures incorrect
Incorrect calibration coefficients in HK conversion
Recovered Closed
7 ENV_SC- 130 (Previously 20_0145)
12-Mar-2002 05-Sep-2002 Various AATSR telemetry OOL
Values in procedure were not in line with flight HW – procedures corrected
Recovered Closed
8 ENV_SC- 121 (Previously 20_0140/20_0163)
13-Mar-2002 17-Mar-2002 Fore-Optics temperatures showing out of limits
FOCC database inconsistency – Limits in different units to HK values
Recovered Closed
PO-RP-RAL-AT-0621 Issue 1.0
08-Oct-2012 Page: 48 of 69
© STFC 2012
Event No.
ESA Ref. Date Open Date Closed Title Root Cause Type Status
9 ENV_SC- 128 (Previously 20_0143/20_0158)
14-Mar-2002 28-May-2002 Missing Entries in AATSR report format log
FOCC database did not contain complete list of type 15 entries
Recovered Closed
10 ENV_SC- 120 (Previously 20_0161)
15-Mar-2002 17-Mar-2002 Report Format Anomalies During BB test
Error in SODAP procedure Recovered Closed
11 ENV_SC- 163 (Previously 20_0160)
16-Mar-2002 05-Sep-2002 EQ Bus Current check limits (Affects subsequent procedures)
Error in IOM and FOP Recovered Closed
12 ENV_SC- 144 (Previously 20_0149)
15-Mar-2002 17-Mar-2002 Database update for BB calibration
FOCC calibration database Recovered Closed
13 ENV_SC- 159 (Previously 20_0164)
17-Mar-2002 28-May-2002 Derived calibration of SCP6
Calibration curve of SCP6 – not critical
Recovered Closed
14 ENV_SC- 142 (Previously 20_0150)
15-Mar-2002 17-Mar-2002 Expected instrument status not as procedure
Procedure FSDP-ATR-8102 run out of sequence
Recovered Closed
15 ENV_SC- 135 (Previously ENV-S222)
15-Mar-2002 03-Apr-2002 Red-lined procedure for AATSR scan mirror switch on
Procedure updates
Recovered Closed
16 ENV_SC- ??? (Previously 20_0162)
15-Mar-2002 17-Mar-2002 Snapshot-2 register not set to 501
Commanding error Recovered Closed
17 ENV_SC- 235 (Previously ENV-2000001)
26-Mar-2002 05-Mar-2002 Anomaly counter Incremented on transition to HEATER mode
Error in FOP procedure Recovered Closed
18 ENV_SC- 234 (Previously ENV-2000002)
27-Mar-2002 03-Apr-2002 1.6µm auto-gain offset re-enabled by error
Error in procedure - correct command sent on the next pass - no further action required
Recovered Closed
19 ENV_SC- 189 (Previously ENV - S178)
19-Mar-2002 21-Mar-2002 AATSR HSM input closed
Occurred during MERIS High Resolution mode Resulted in loss of AATSR data for single orbit
Recovered Closed
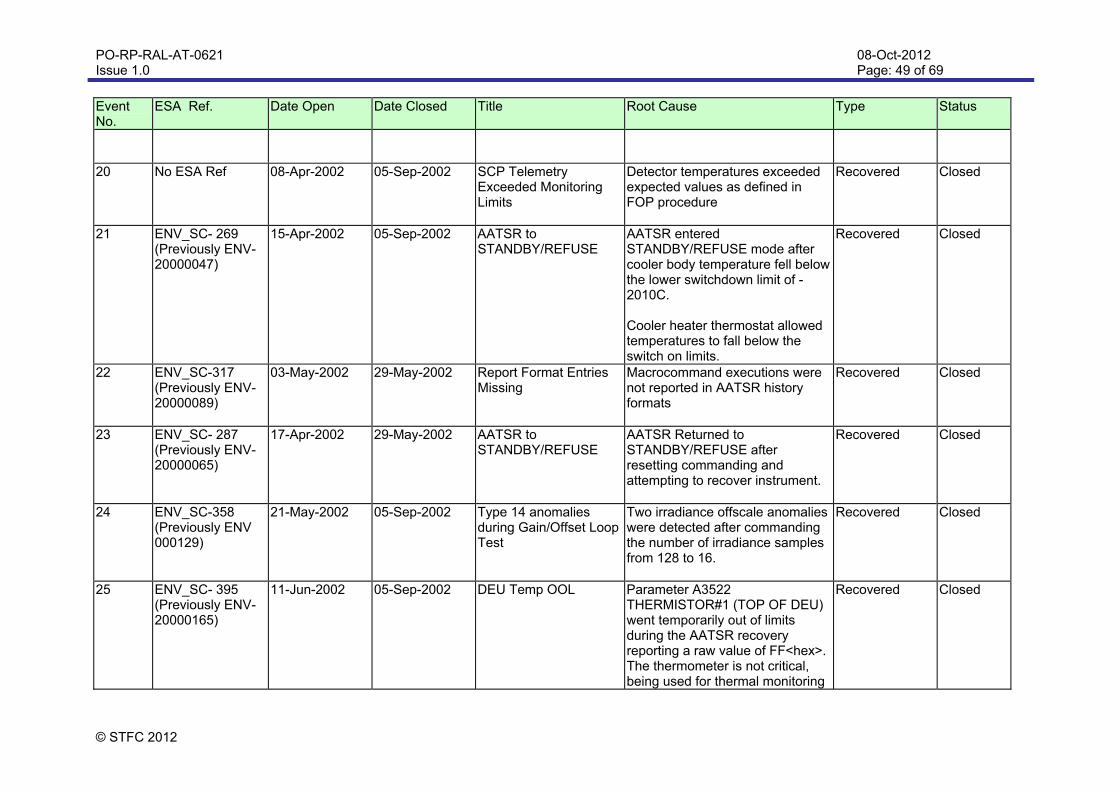
PO-RP-RAL-AT-0621 Issue 1.0
08-Oct-2012 Page: 49 of 69
© STFC 2012
Event No.
ESA Ref. Date Open Date Closed Title Root Cause Type Status
20 No ESA Ref 08-Apr-2002 05-Sep-2002 SCP Telemetry Exceeded Monitoring Limits
Detector temperatures exceeded expected values as defined in FOP procedure
Recovered Closed
21 ENV_SC- 269 (Previously ENV-20000047)
15-Apr-2002 05-Sep-2002 AATSR to STANDBY/REFUSE
AATSR entered STANDBY/REFUSE mode after cooler body temperature fell below the lower switchdown limit of -2010C. Cooler heater thermostat allowed temperatures to fall below the switch on limits.
Recovered Closed
22 ENV_SC-317 (Previously ENV-20000089)
03-May-2002 29-May-2002 Report Format Entries Missing
Macrocommand executions were not reported in AATSR history formats
Recovered Closed
23 ENV_SC- 287 (Previously ENV-20000065)
17-Apr-2002 29-May-2002 AATSR to STANDBY/REFUSE
AATSR Returned to STANDBY/REFUSE after resetting commanding and attempting to recover instrument.
Recovered Closed
24 ENV_SC-358 (Previously ENV 000129)
21-May-2002 05-Sep-2002 Type 14 anomalies during Gain/Offset Loop Test
Two irradiance offscale anomalies were detected after commanding the number of irradiance samples from 128 to 16.
Recovered Closed
25 ENV_SC- 395 (Previously ENV-20000165)
11-Jun-2002 05-Sep-2002 DEU Temp OOL Parameter A3522 THERMISTOR#1 (TOP OF DEU) went temporarily out of limits during the AATSR recovery reporting a raw value of FF<hex>. The thermometer is not critical, being used for thermal monitoring
Recovered Closed
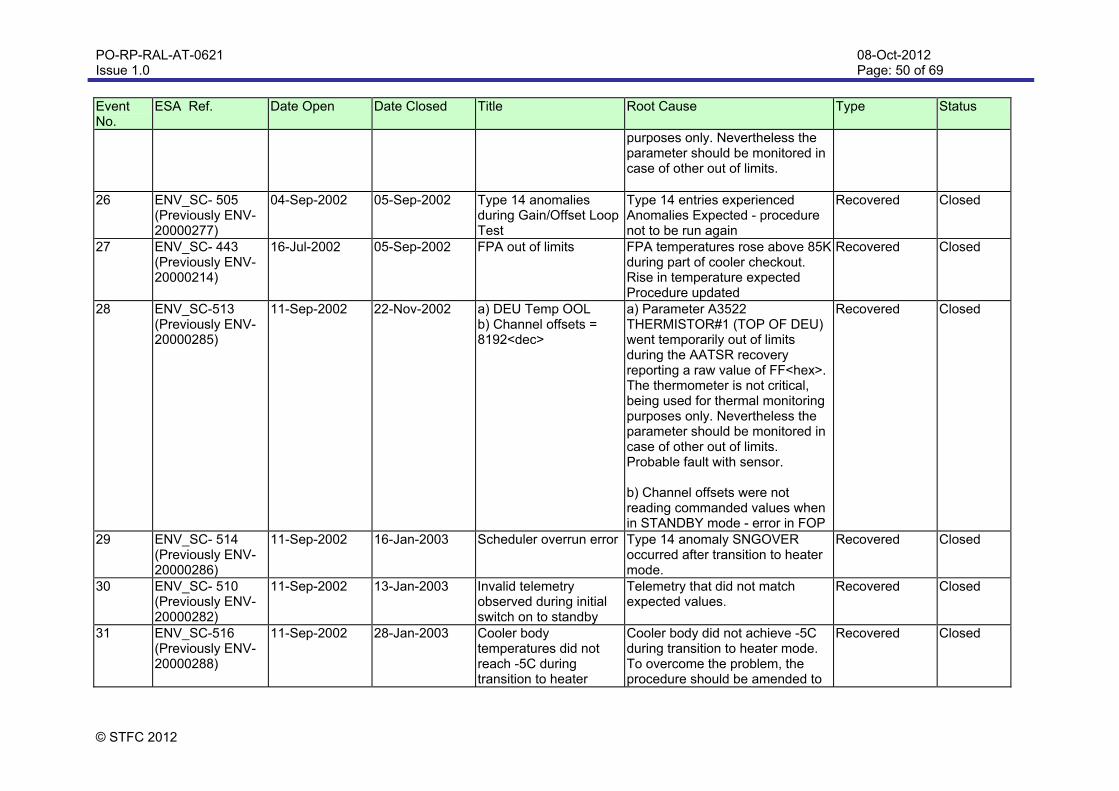
PO-RP-RAL-AT-0621 Issue 1.0
08-Oct-2012 Page: 50 of 69
© STFC 2012
Event No.
ESA Ref. Date Open Date Closed Title Root Cause Type Status
purposes only. Nevertheless the parameter should be monitored in case of other out of limits.
26 ENV_SC- 505 (Previously ENV-20000277)
04-Sep-2002 05-Sep-2002 Type 14 anomalies during Gain/Offset Loop Test
Type 14 entries experienced Anomalies Expected - procedure not to be run again
Recovered Closed
27 ENV_SC- 443 (Previously ENV-20000214)
16-Jul-2002 05-Sep-2002 FPA out of limits FPA temperatures rose above 85K during part of cooler checkout. Rise in temperature expected Procedure updated
Recovered Closed
28 ENV_SC-513 (Previously ENV-20000285)
11-Sep-2002 22-Nov-2002
a) DEU Temp OOL b) Channel offsets = 8192<dec>
a) Parameter A3522 THERMISTOR#1 (TOP OF DEU) went temporarily out of limits during the AATSR recovery reporting a raw value of FF<hex>. The thermometer is not critical, being used for thermal monitoring purposes only. Nevertheless the parameter should be monitored in case of other out of limits. Probable fault with sensor. b) Channel offsets were not reading commanded values when in STANDBY mode - error in FOP
Recovered Closed
29 ENV_SC- 514 (Previously ENV-20000286)
11-Sep-2002 16-Jan-2003 Scheduler overrun error Type 14 anomaly SNGOVER occurred after transition to heater mode.
Recovered Closed
30 ENV_SC- 510 (Previously ENV-20000282)
11-Sep-2002 13-Jan-2003 Invalid telemetry observed during initial switch on to standby
Telemetry that did not match expected values.
Recovered Closed
31 ENV_SC-516 (Previously ENV-20000288)
11-Sep-2002 28-Jan-2003 Cooler body temperatures did not reach -5C during transition to heater
Cooler body did not achieve -5C during transition to heater mode. To overcome the problem, the procedure should be amended to
Recovered Closed
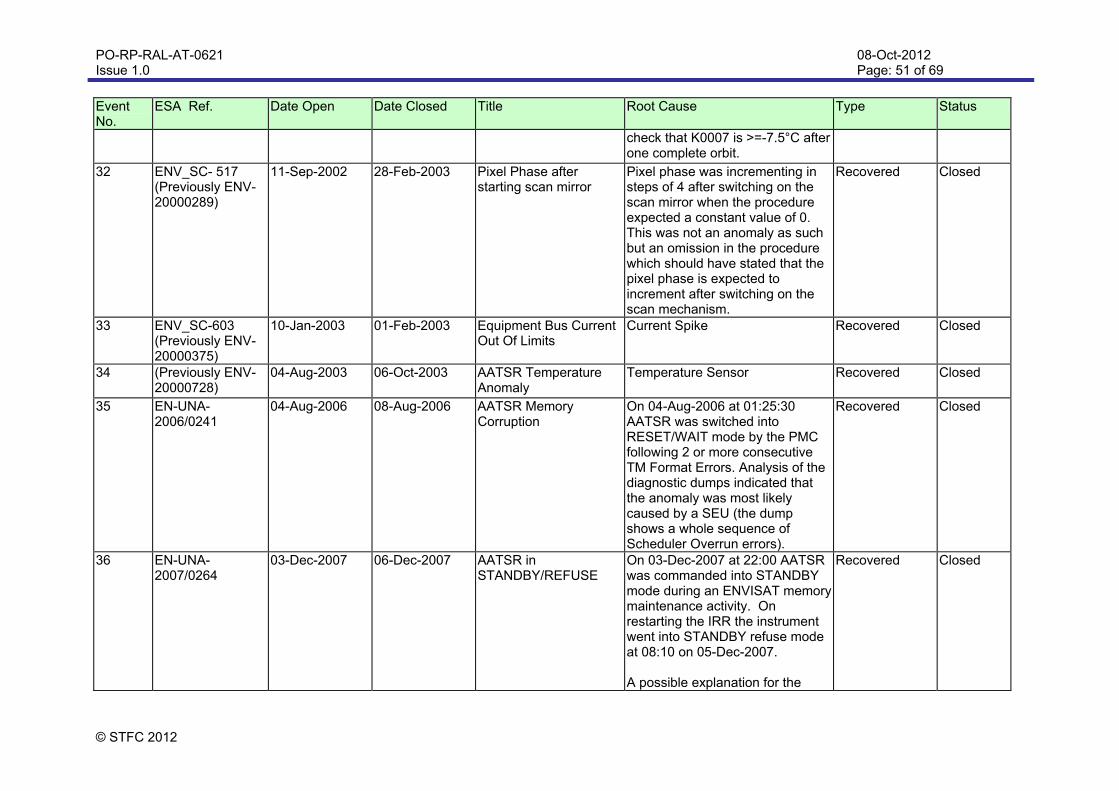
PO-RP-RAL-AT-0621 Issue 1.0
08-Oct-2012 Page: 51 of 69
© STFC 2012
Event No.
ESA Ref. Date Open Date Closed Title Root Cause Type Status
check that K0007 is >=-7.5°C after one complete orbit.
32 ENV_SC- 517 (Previously ENV-20000289)
11-Sep-2002 28-Feb-2003 Pixel Phase after starting scan mirror
Pixel phase was incrementing in steps of 4 after switching on the scan mirror when the procedure expected a constant value of 0. This was not an anomaly as such but an omission in the procedure which should have stated that the pixel phase is expected to increment after switching on the scan mechanism.
Recovered Closed
33 ENV_SC-603 (Previously ENV-20000375)
10-Jan-2003 01-Feb-2003 Equipment Bus Current Out Of Limits
Current Spike Recovered Closed
34 (Previously ENV-20000728)
04-Aug-2003 06-Oct-2003 AATSR Temperature Anomaly
Temperature Sensor Recovered Closed
35 EN-UNA-2006/0241
04-Aug-2006 08-Aug-2006 AATSR Memory Corruption
On 04-Aug-2006 at 01:25:30 AATSR was switched into RESET/WAIT mode by the PMC following 2 or more consecutive TM Format Errors. Analysis of the diagnostic dumps indicated that the anomaly was most likely caused by a SEU (the dump shows a whole sequence of Scheduler Overrun errors).
Recovered Closed
36 EN-UNA-2007/0264
03-Dec-2007 06-Dec-2007 AATSR in STANDBY/REFUSE
On 03-Dec-2007 at 22:00 AATSR was commanded into STANDBY mode during an ENVISAT memory maintenance activity. On restarting the IRR the instrument went into STANDBY refuse mode at 08:10 on 05-Dec-2007. A possible explanation for the
Recovered Closed
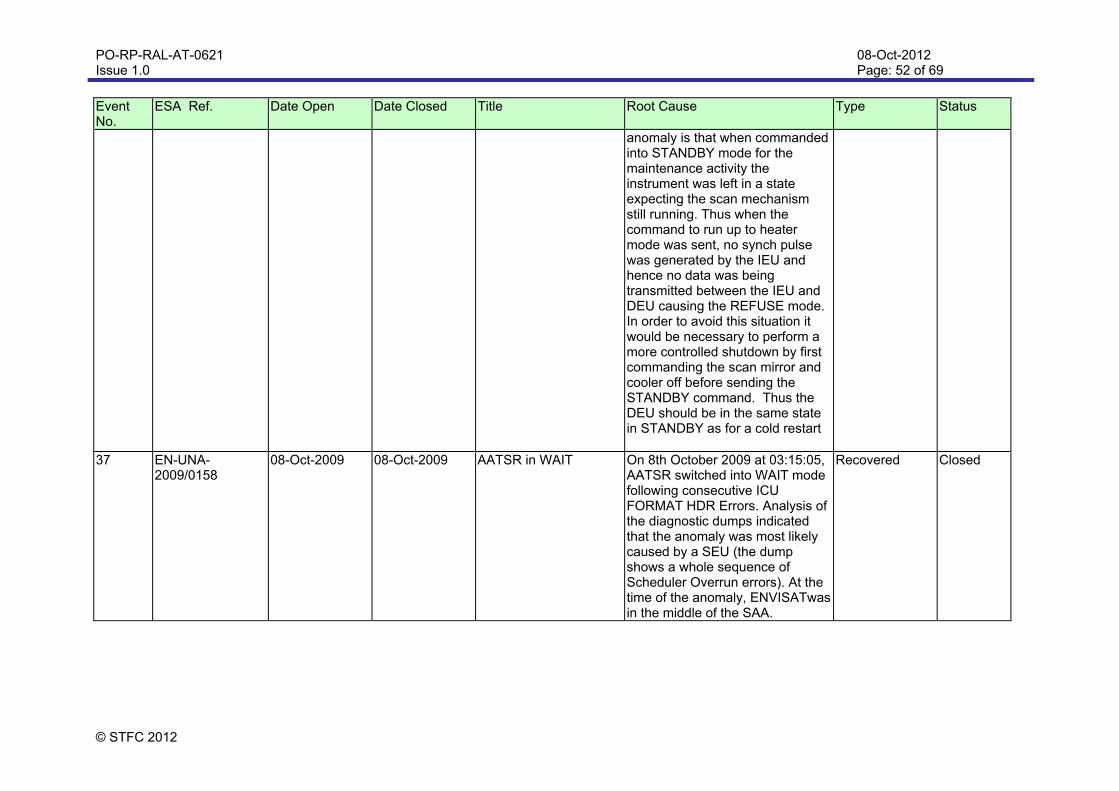
PO-RP-RAL-AT-0621 Issue 1.0
08-Oct-2012 Page: 52 of 69
© STFC 2012
Event No.
ESA Ref. Date Open Date Closed Title Root Cause Type Status
anomaly is that when commanded into STANDBY mode for the maintenance activity the instrument was left in a state expecting the scan mechanism still running. Thus when the command to run up to heater mode was sent, no synch pulse was generated by the IEU and hence no data was being transmitted between the IEU and DEU causing the REFUSE mode. In order to avoid this situation it would be necessary to perform a more controlled shutdown by first commanding the scan mirror and cooler off before sending the STANDBY command. Thus the DEU should be in the same state in STANDBY as for a cold restart
37 EN-UNA-2009/0158
08-Oct-2009 08-Oct-2009 AATSR in WAIT On 8th October 2009 at 03:15:05, AATSR switched into WAIT mode following consecutive ICU FORMAT HDR Errors. Analysis of the diagnostic dumps indicated that the anomaly was most likely caused by a SEU (the dump shows a whole sequence of Scheduler Overrun errors). At the time of the anomaly, ENVISATwas in the middle of the SAA.
Recovered Closed
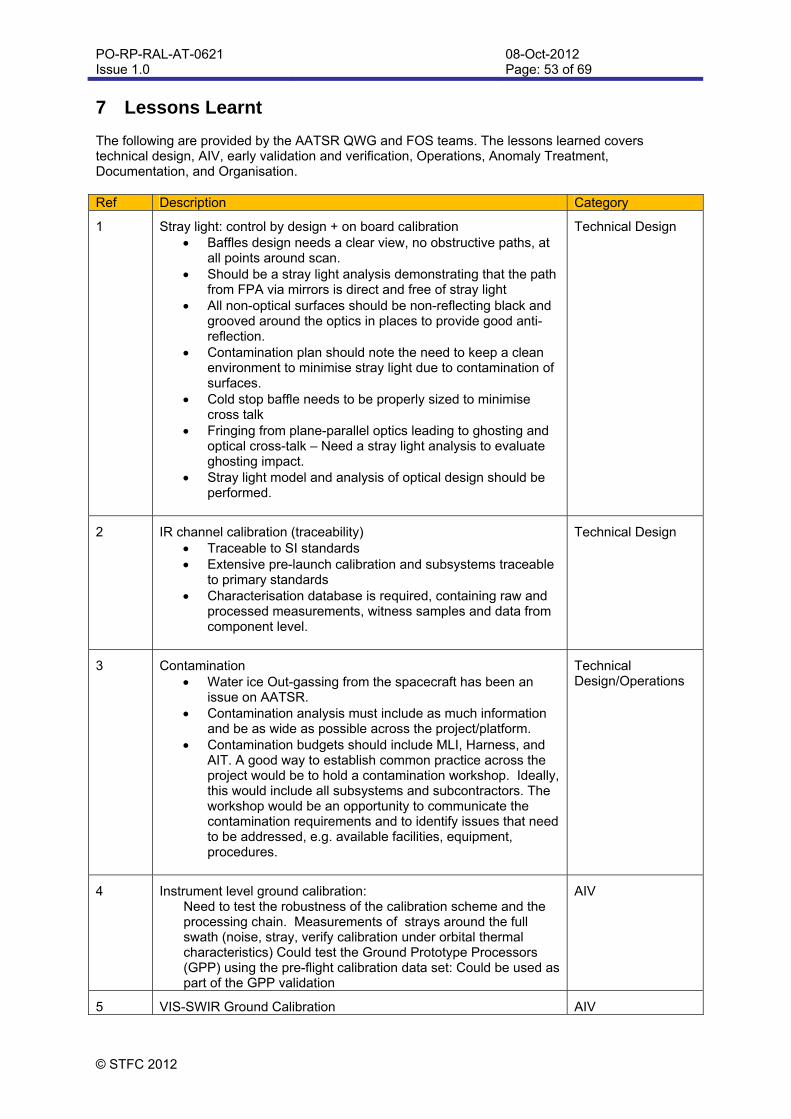
PO-RP-RAL-AT-0621 Issue 1.0
08-Oct-2012 Page: 53 of 69
© STFC 2012
7 Lessons Learnt The following are provided by the AATSR QWG and FOS teams. The lessons learned covers technical design, AIV, early validation and verification, Operations, Anomaly Treatment, Documentation, and Organisation. Ref Description Category
1 Stray light: control by design + on board calibration Baffles design needs a clear view, no obstructive paths, at
all points around scan. Should be a stray light analysis demonstrating that the path
from FPA via mirrors is direct and free of stray light All non-optical surfaces should be non-reflecting black and
grooved around the optics in places to provide good anti-reflection.
Contamination plan should note the need to keep a clean environment to minimise stray light due to contamination of surfaces.
Cold stop baffle needs to be properly sized to minimise cross talk
Fringing from plane-parallel optics leading to ghosting and optical cross-talk – Need a stray light analysis to evaluate ghosting impact.
Stray light model and analysis of optical design should be performed.
Technical Design
2 IR channel calibration (traceability) Traceable to SI standards Extensive pre-launch calibration and subsystems traceable
to primary standards Characterisation database is required, containing raw and
processed measurements, witness samples and data from component level.
Technical Design
3 Contamination Water ice Out-gassing from the spacecraft has been an
issue on AATSR. Contamination analysis must include as much information
and be as wide as possible across the project/platform. Contamination budgets should include MLI, Harness, and
AIT. A good way to establish common practice across the project would be to hold a contamination workshop. Ideally, this would include all subsystems and subcontractors. The workshop would be an opportunity to communicate the contamination requirements and to identify issues that need to be addressed, e.g. available facilities, equipment, procedures.
Technical Design/Operations
4 Instrument level ground calibration: Need to test the robustness of the calibration scheme and the processing chain. Measurements of strays around the full swath (noise, stray, verify calibration under orbital thermal characteristics) Could test the Ground Prototype Processors (GPP) using the pre-flight calibration data set: Could be used as part of the GPP validation
AIV
5 VIS-SWIR Ground Calibration AIV
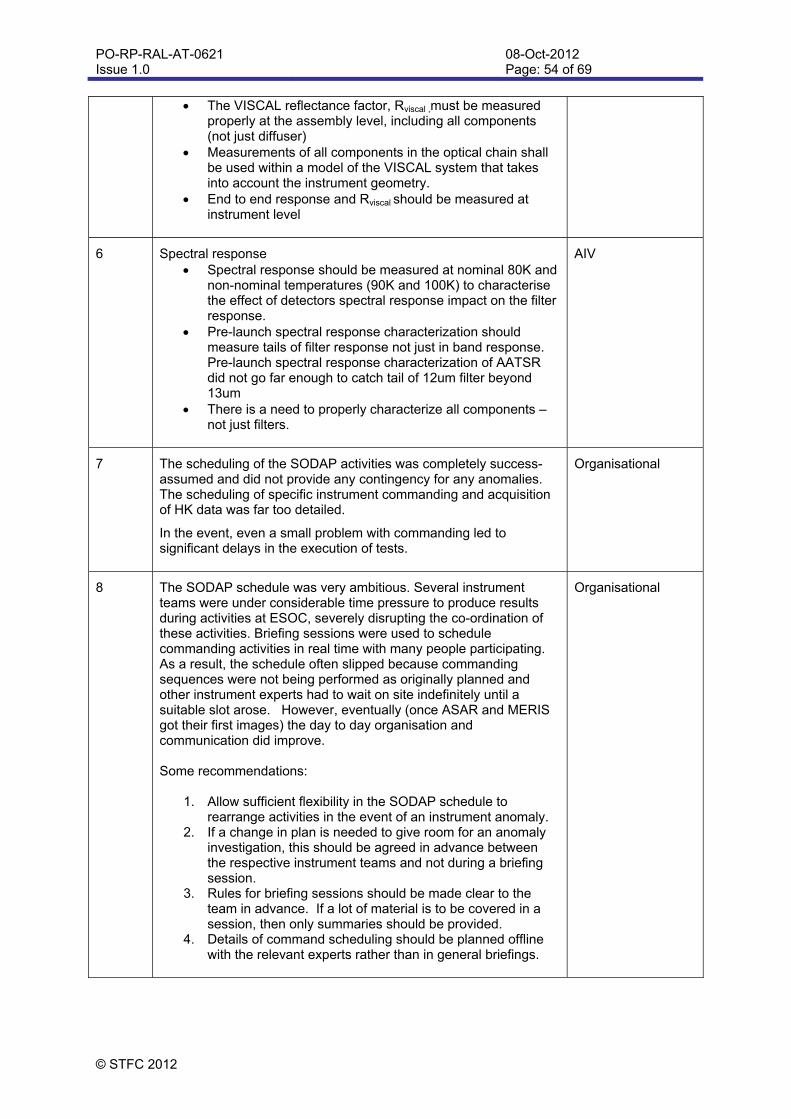
PO-RP-RAL-AT-0621 Issue 1.0
08-Oct-2012 Page: 54 of 69
© STFC 2012
The VISCAL reflectance factor, Rviscal ,must be measured properly at the assembly level, including all components (not just diffuser)
Measurements of all components in the optical chain shall be used within a model of the VISCAL system that takes into account the instrument geometry.
End to end response and Rviscal should be measured at instrument level
6 Spectral response Spectral response should be measured at nominal 80K and
non-nominal temperatures (90K and 100K) to characterise the effect of detectors spectral response impact on the filter response.
Pre-launch spectral response characterization should measure tails of filter response not just in band response. Pre-launch spectral response characterization of AATSR did not go far enough to catch tail of 12um filter beyond 13um
There is a need to properly characterize all components – not just filters.
AIV
7 The scheduling of the SODAP activities was completely success-assumed and did not provide any contingency for any anomalies. The scheduling of specific instrument commanding and acquisition of HK data was far too detailed.
In the event, even a small problem with commanding led to significant delays in the execution of tests.
Organisational
8 The SODAP schedule was very ambitious. Several instrument teams were under considerable time pressure to produce results during activities at ESOC, severely disrupting the co-ordination of these activities. Briefing sessions were used to schedule commanding activities in real time with many people participating. As a result, the schedule often slipped because commanding sequences were not being performed as originally planned and other instrument experts had to wait on site indefinitely until a suitable slot arose. However, eventually (once ASAR and MERIS got their first images) the day to day organisation and communication did improve. Some recommendations:
1. Allow sufficient flexibility in the SODAP schedule to rearrange activities in the event of an instrument anomaly.
2. If a change in plan is needed to give room for an anomaly investigation, this should be agreed in advance between the respective instrument teams and not during a briefing session.
3. Rules for briefing sessions should be made clear to the team in advance. If a lot of material is to be covered in a session, then only summaries should be provided.
4. Details of command scheduling should be planned offline with the relevant experts rather than in general briefings.
Organisational

PO-RP-RAL-AT-0621 Issue 1.0
08-Oct-2012 Page: 55 of 69
© STFC 2012
9 Some critical HK parameters were only available in RTTF and were therefore only available on demand. These included parameters used for calibration of the other HK parameters.
Technical Design/AIV
10 The cooler heaters thermostat was set below the safe switch on limits of the cooler. This led to a complicated switch on procedure that relied on timing the cooler commanding to coincide with the peak of the orbital temperature cycles to avoid entering STANDBY/REFUSE.
We need to ensure that survival heaters maintain the temperatures of critical components above their minimum operating temperatures. This should be tested on ground.
Technical Design/Operations
11 The efficient running and timely data analysis of the AATSR commissioning phase and operations monitoring activities was made possible with the Engineering Data System (EDS) that was developed by RAL Space (http://www.aatsrops.rl.ac.uk/).
The system acquired ‘Real Time’ telemetry from the ESOC FOCC, and NRT Level-0 data from Kiruna via DDS to provide orbital, daily and long term trends of key parameters, in particular BB temperatures, signal channel counts, radiometric noise, scan mirror jitter and VISCAL performance.
This system was web based and allowed engineers and scientists to access key information remotely. A similar approach should be considered for future missions, e.g. Sentinel-3 SLSTR“
Operations
12 Having the key instrument experts available is essential for diagnosing and fixing a problem in timely manner.
Anomaly Investigations
13 Clear records of previous anomaly investigations are vital, particularly as the team composition evolves over the life of a mission. There were at least 3 ESA systems during the mission and access to the ESA records is not easy, particularly for those outside ESA.
Anomaly Investigations
14 QC of data should be carried out at all stages of processing, including after the generation of Level 0 products. Even basic checks (file size, not corrupt) would have reduced the number of NRT processing failures seen for AATSR data. It should also start as early as possible into the mission (ideally forming part of the commissioning phase).
Data Quality
15 The involvement of instrument/data experts, at least as a consultation, for any updates planned to the ground segment that could have an effect on the processing of the instrument would prevent any unintentional impacts on data quality. In the long run this avoids unnecessary effort, from having to roll back to a previous system configuration for instance
Data Quality/Operations
16 Having a log of instrument activities allows users to diagnose data quality issues. For example where data are being used during orbit manoeuvres, Out-gassings.
Operations/Data Quality
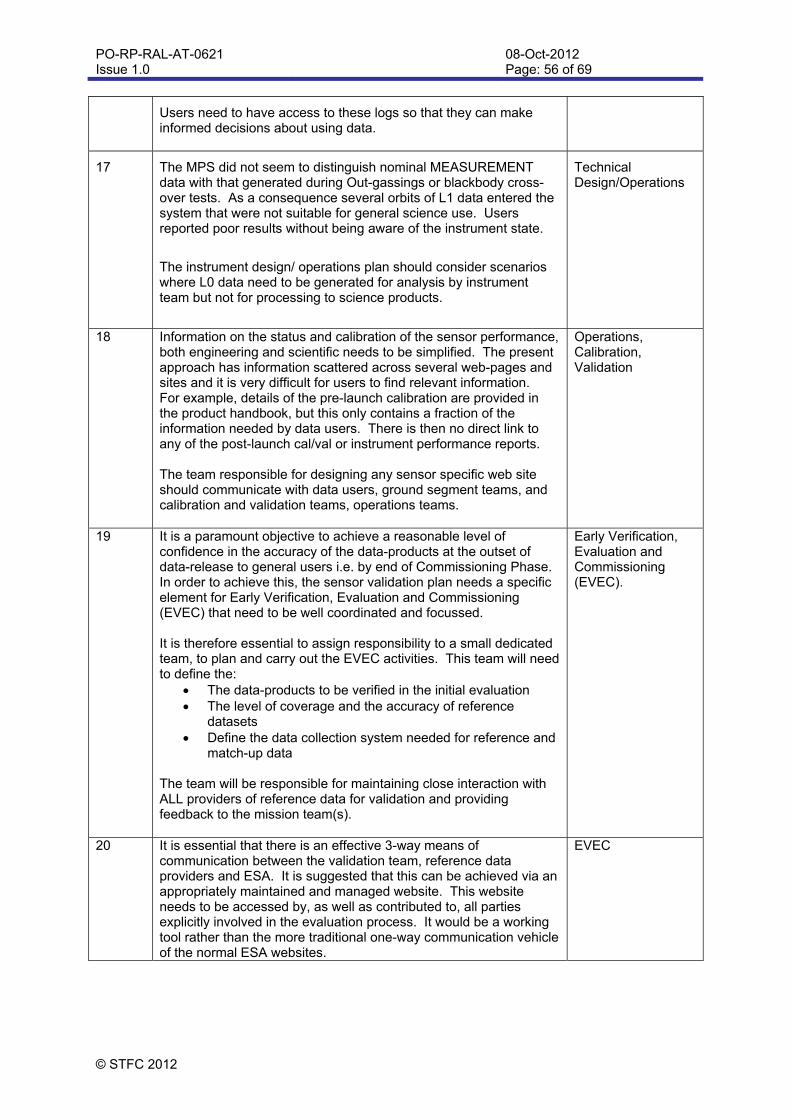
PO-RP-RAL-AT-0621 Issue 1.0
08-Oct-2012 Page: 56 of 69
© STFC 2012
Users need to have access to these logs so that they can make informed decisions about using data.
17 The MPS did not seem to distinguish nominal MEASUREMENT data with that generated during Out-gassings or blackbody cross-over tests. As a consequence several orbits of L1 data entered the system that were not suitable for general science use. Users reported poor results without being aware of the instrument state.
The instrument design/ operations plan should consider scenarios where L0 data need to be generated for analysis by instrument team but not for processing to science products.
Technical Design/Operations
18 Information on the status and calibration of the sensor performance, both engineering and scientific needs to be simplified. The present approach has information scattered across several web-pages and sites and it is very difficult for users to find relevant information. For example, details of the pre-launch calibration are provided in the product handbook, but this only contains a fraction of the information needed by data users. There is then no direct link to any of the post-launch cal/val or instrument performance reports. The team responsible for designing any sensor specific web site should communicate with data users, ground segment teams, and calibration and validation teams, operations teams.
Operations, Calibration, Validation
19 It is a paramount objective to achieve a reasonable level of confidence in the accuracy of the data-products at the outset of data-release to general users i.e. by end of Commissioning Phase. In order to achieve this, the sensor validation plan needs a specific element for Early Verification, Evaluation and Commissioning (EVEC) that need to be well coordinated and focussed. It is therefore essential to assign responsibility to a small dedicated team, to plan and carry out the EVEC activities. This team will need to define the:
The data-products to be verified in the initial evaluation The level of coverage and the accuracy of reference
datasets Define the data collection system needed for reference and
match-up data The team will be responsible for maintaining close interaction with ALL providers of reference data for validation and providing feedback to the mission team(s).
Early Verification, Evaluation and Commissioning (EVEC).
20 It is essential that there is an effective 3-way means of communication between the validation team, reference data providers and ESA. It is suggested that this can be achieved via an appropriately maintained and managed website. This website needs to be accessed by, as well as contributed to, all parties explicitly involved in the evaluation process. It would be a working tool rather than the more traditional one-way communication vehicle of the normal ESA websites.
EVEC
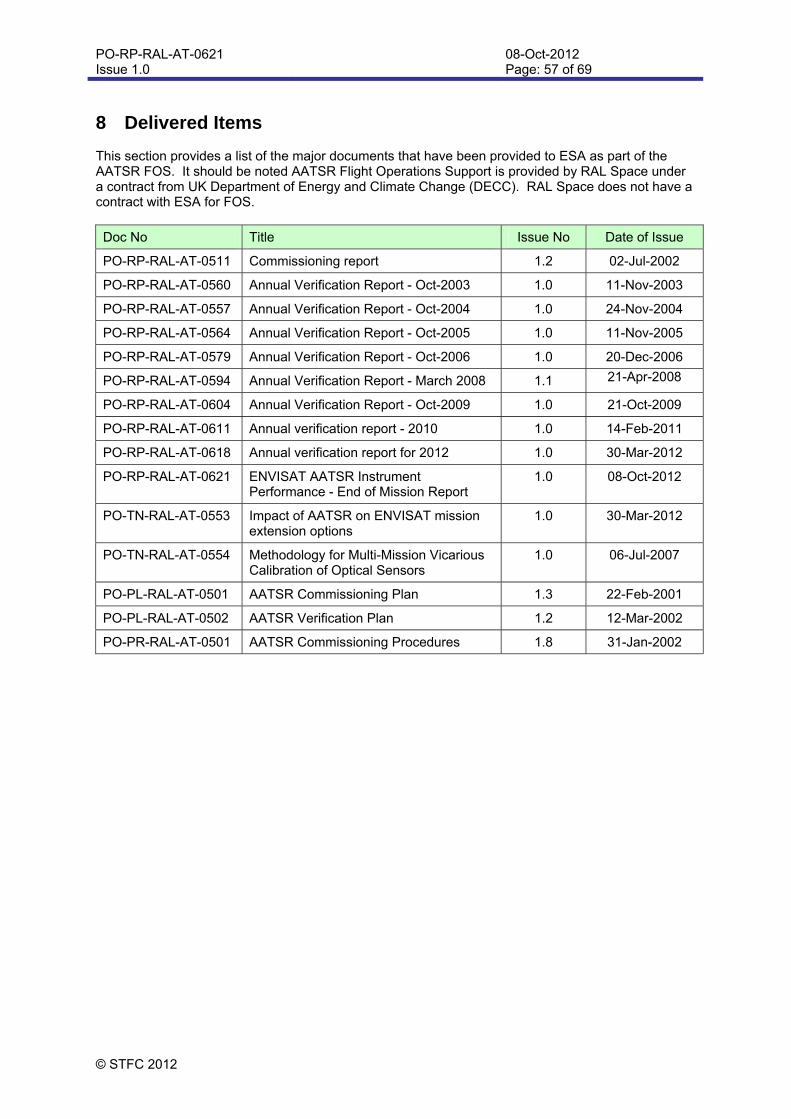
PO-RP-RAL-AT-0621 Issue 1.0
08-Oct-2012 Page: 57 of 69
© STFC 2012
8 Delivered Items This section provides a list of the major documents that have been provided to ESA as part of the AATSR FOS. It should be noted AATSR Flight Operations Support is provided by RAL Space under a contract from UK Department of Energy and Climate Change (DECC). RAL Space does not have a contract with ESA for FOS.
Doc No Title Issue No Date of Issue
PO-RP-RAL-AT-0511 Commissioning report 1.2 02-Jul-2002
PO-RP-RAL-AT-0560 Annual Verification Report - Oct-2003 1.0 11-Nov-2003
PO-RP-RAL-AT-0557 Annual Verification Report - Oct-2004 1.0 24-Nov-2004
PO-RP-RAL-AT-0564 Annual Verification Report - Oct-2005 1.0 11-Nov-2005
PO-RP-RAL-AT-0579 Annual Verification Report - Oct-2006 1.0 20-Dec-2006
PO-RP-RAL-AT-0594 Annual Verification Report - March 2008 1.1 21-Apr-2008
PO-RP-RAL-AT-0604 Annual Verification Report - Oct-2009 1.0 21-Oct-2009
PO-RP-RAL-AT-0611 Annual verification report - 2010 1.0 14-Feb-2011
PO-RP-RAL-AT-0618 Annual verification report for 2012 1.0 30-Mar-2012
PO-RP-RAL-AT-0621 ENVISAT AATSR Instrument Performance - End of Mission Report
1.0 08-Oct-2012
PO-TN-RAL-AT-0553 Impact of AATSR on ENVISAT mission extension options
1.0 30-Mar-2012
PO-TN-RAL-AT-0554 Methodology for Multi-Mission Vicarious Calibration of Optical Sensors
1.0 06-Jul-2007
PO-PL-RAL-AT-0501 AATSR Commissioning Plan 1.3 22-Feb-2001
PO-PL-RAL-AT-0502 AATSR Verification Plan 1.2 12-Mar-2002
PO-PR-RAL-AT-0501 AATSR Commissioning Procedures 1.8 31-Jan-2002
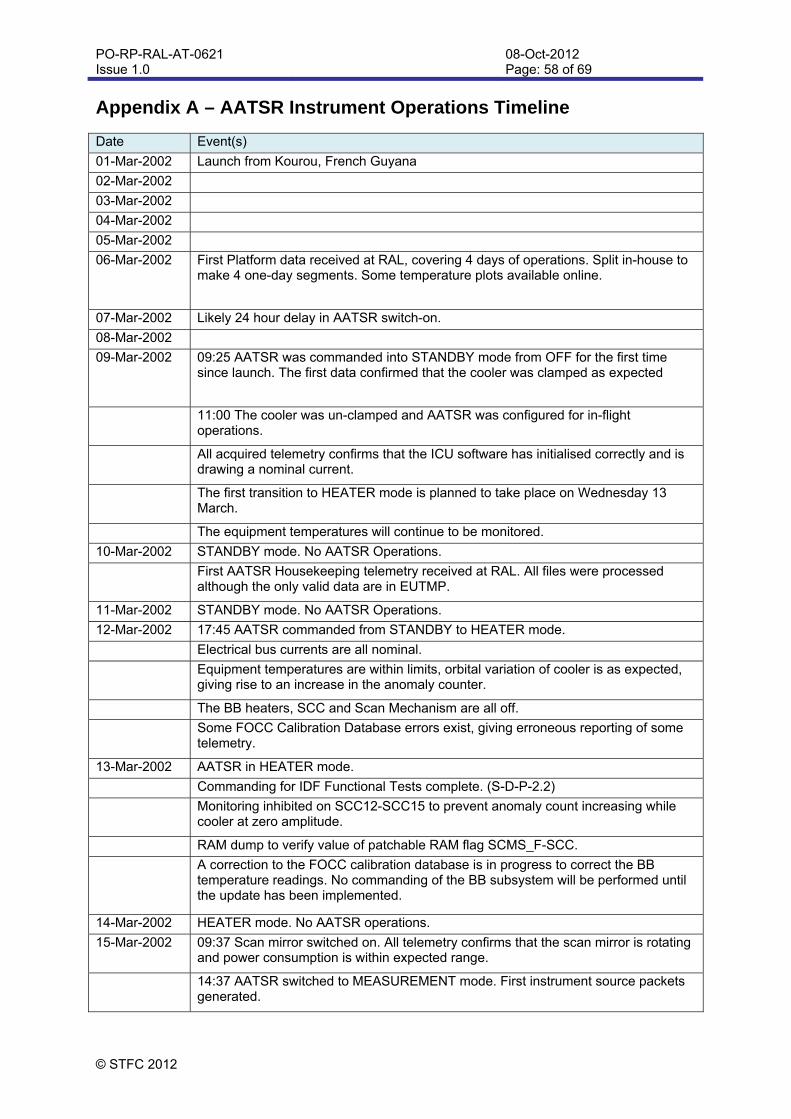
PO-RP-RAL-AT-0621 Issue 1.0
08-Oct-2012 Page: 58 of 69
© STFC 2012
Appendix A – AATSR Instrument Operations Timeline Date Event(s)
01-Mar-2002 Launch from Kourou, French Guyana
02-Mar-2002
03-Mar-2002
04-Mar-2002
05-Mar-2002
06-Mar-2002 First Platform data received at RAL, covering 4 days of operations. Split in-house to make 4 one-day segments. Some temperature plots available online.
07-Mar-2002 Likely 24 hour delay in AATSR switch-on.
08-Mar-2002
09-Mar-2002 09:25 AATSR was commanded into STANDBY mode from OFF for the first time since launch. The first data confirmed that the cooler was clamped as expected
11:00 The cooler was un-clamped and AATSR was configured for in-flight operations.
All acquired telemetry confirms that the ICU software has initialised correctly and is drawing a nominal current.
The first transition to HEATER mode is planned to take place on Wednesday 13 March.
The equipment temperatures will continue to be monitored.
10-Mar-2002 STANDBY mode. No AATSR Operations.
First AATSR Housekeeping telemetry received at RAL. All files were processed although the only valid data are in EUTMP.
11-Mar-2002 STANDBY mode. No AATSR Operations.
12-Mar-2002 17:45 AATSR commanded from STANDBY to HEATER mode.
Electrical bus currents are all nominal.
Equipment temperatures are within limits, orbital variation of cooler is as expected, giving rise to an increase in the anomaly counter.
The BB heaters, SCC and Scan Mechanism are all off.
Some FOCC Calibration Database errors exist, giving erroneous reporting of some telemetry.
13-Mar-2002 AATSR in HEATER mode.
Commanding for IDF Functional Tests complete. (S-D-P-2.2)
Monitoring inhibited on SCC12-SCC15 to prevent anomaly count increasing while cooler at zero amplitude.
RAM dump to verify value of patchable RAM flag SCMS_F-SCC.
A correction to the FOCC calibration database is in progress to correct the BB temperature readings. No commanding of the BB subsystem will be performed until the update has been implemented.
14-Mar-2002 HEATER mode. No AATSR operations.
15-Mar-2002 09:37 Scan mirror switched on. All telemetry confirms that the scan mirror is rotating and power consumption is within expected range.
14:37 AATSR switched to MEASUREMENT mode. First instrument source packets generated.
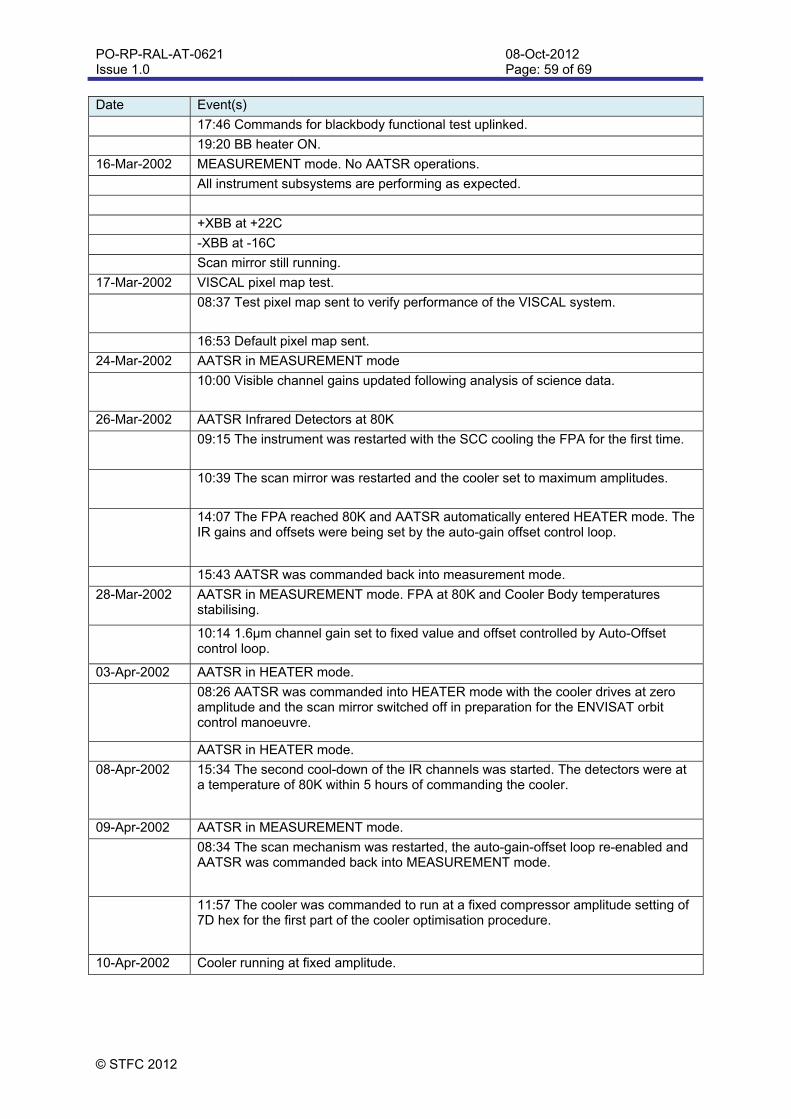
PO-RP-RAL-AT-0621 Issue 1.0
08-Oct-2012 Page: 59 of 69
© STFC 2012
Date Event(s)
17:46 Commands for blackbody functional test uplinked.
19:20 BB heater ON.
16-Mar-2002 MEASUREMENT mode. No AATSR operations.
All instrument subsystems are performing as expected.
+XBB at +22C
-XBB at -16C
Scan mirror still running.
17-Mar-2002 VISCAL pixel map test.
08:37 Test pixel map sent to verify performance of the VISCAL system.
16:53 Default pixel map sent.
24-Mar-2002 AATSR in MEASUREMENT mode
10:00 Visible channel gains updated following analysis of science data.
26-Mar-2002 AATSR Infrared Detectors at 80K
09:15 The instrument was restarted with the SCC cooling the FPA for the first time.
10:39 The scan mirror was restarted and the cooler set to maximum amplitudes.
14:07 The FPA reached 80K and AATSR automatically entered HEATER mode. The IR gains and offsets were being set by the auto-gain offset control loop.
15:43 AATSR was commanded back into measurement mode.
28-Mar-2002 AATSR in MEASUREMENT mode. FPA at 80K and Cooler Body temperatures stabilising.
10:14 1.6µm channel gain set to fixed value and offset controlled by Auto-Offset control loop.
03-Apr-2002 AATSR in HEATER mode.
08:26 AATSR was commanded into HEATER mode with the cooler drives at zero amplitude and the scan mirror switched off in preparation for the ENVISAT orbit control manoeuvre.
AATSR in HEATER mode.
08-Apr-2002 15:34 The second cool-down of the IR channels was started. The detectors were at a temperature of 80K within 5 hours of commanding the cooler.
09-Apr-2002 AATSR in MEASUREMENT mode.
08:34 The scan mechanism was restarted, the auto-gain-offset loop re-enabled and AATSR was commanded back into MEASUREMENT mode.
11:57 The cooler was commanded to run at a fixed compressor amplitude setting of 7D hex for the first part of the cooler optimisation procedure.
10-Apr-2002 Cooler running at fixed amplitude.
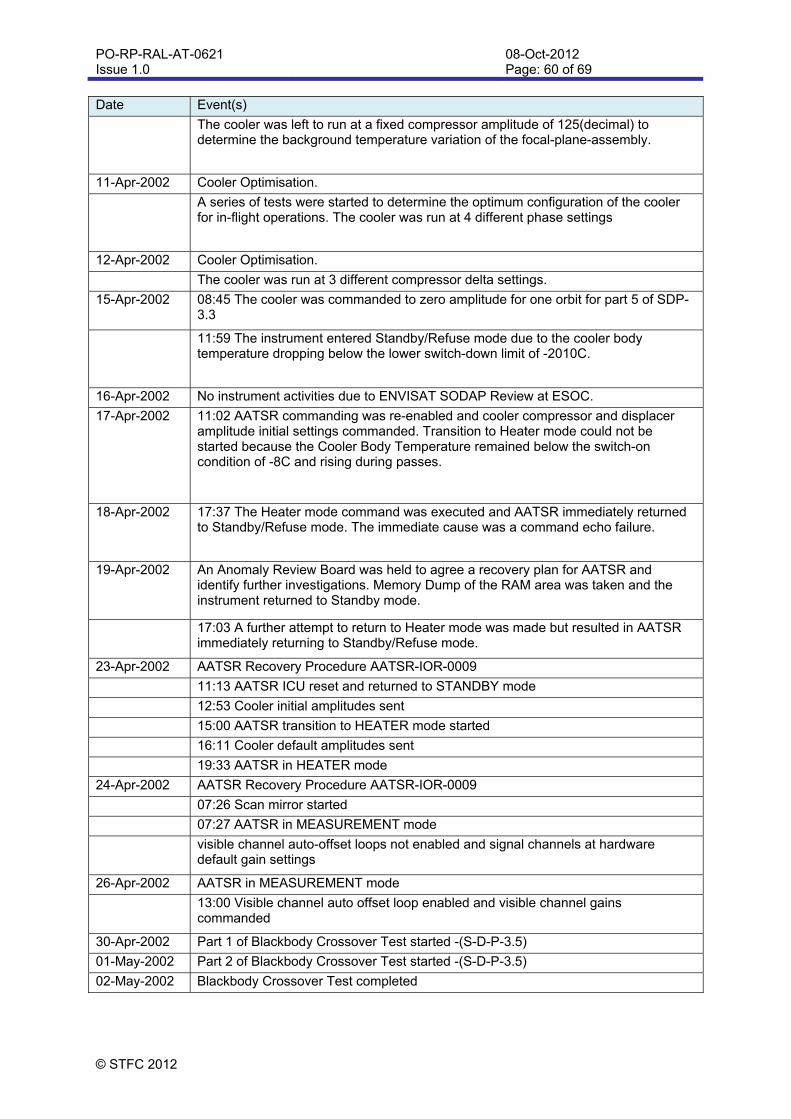
PO-RP-RAL-AT-0621 Issue 1.0
08-Oct-2012 Page: 60 of 69
© STFC 2012
Date Event(s)
The cooler was left to run at a fixed compressor amplitude of 125(decimal) to determine the background temperature variation of the focal-plane-assembly.
11-Apr-2002 Cooler Optimisation.
A series of tests were started to determine the optimum configuration of the cooler for in-flight operations. The cooler was run at 4 different phase settings
12-Apr-2002 Cooler Optimisation.
The cooler was run at 3 different compressor delta settings.
15-Apr-2002 08:45 The cooler was commanded to zero amplitude for one orbit for part 5 of SDP-3.3
11:59 The instrument entered Standby/Refuse mode due to the cooler body temperature dropping below the lower switch-down limit of -2010C.
16-Apr-2002 No instrument activities due to ENVISAT SODAP Review at ESOC.
17-Apr-2002 11:02 AATSR commanding was re-enabled and cooler compressor and displacer amplitude initial settings commanded. Transition to Heater mode could not be started because the Cooler Body Temperature remained below the switch-on condition of -8C and rising during passes.
18-Apr-2002 17:37 The Heater mode command was executed and AATSR immediately returned to Standby/Refuse mode. The immediate cause was a command echo failure.
19-Apr-2002 An Anomaly Review Board was held to agree a recovery plan for AATSR and identify further investigations. Memory Dump of the RAM area was taken and the instrument returned to Standby mode.
17:03 A further attempt to return to Heater mode was made but resulted in AATSR immediately returning to Standby/Refuse mode.
23-Apr-2002 AATSR Recovery Procedure AATSR-IOR-0009
11:13 AATSR ICU reset and returned to STANDBY mode
12:53 Cooler initial amplitudes sent
15:00 AATSR transition to HEATER mode started
16:11 Cooler default amplitudes sent
19:33 AATSR in HEATER mode
24-Apr-2002 AATSR Recovery Procedure AATSR-IOR-0009
07:26 Scan mirror started
07:27 AATSR in MEASUREMENT mode
visible channel auto-offset loops not enabled and signal channels at hardware default gain settings
26-Apr-2002 AATSR in MEASUREMENT mode
13:00 Visible channel auto offset loop enabled and visible channel gains commanded
30-Apr-2002 Part 1 of Blackbody Crossover Test started -(S-D-P-3.5)
01-May-2002 Part 2 of Blackbody Crossover Test started -(S-D-P-3.5)
02-May-2002 Blackbody Crossover Test completed
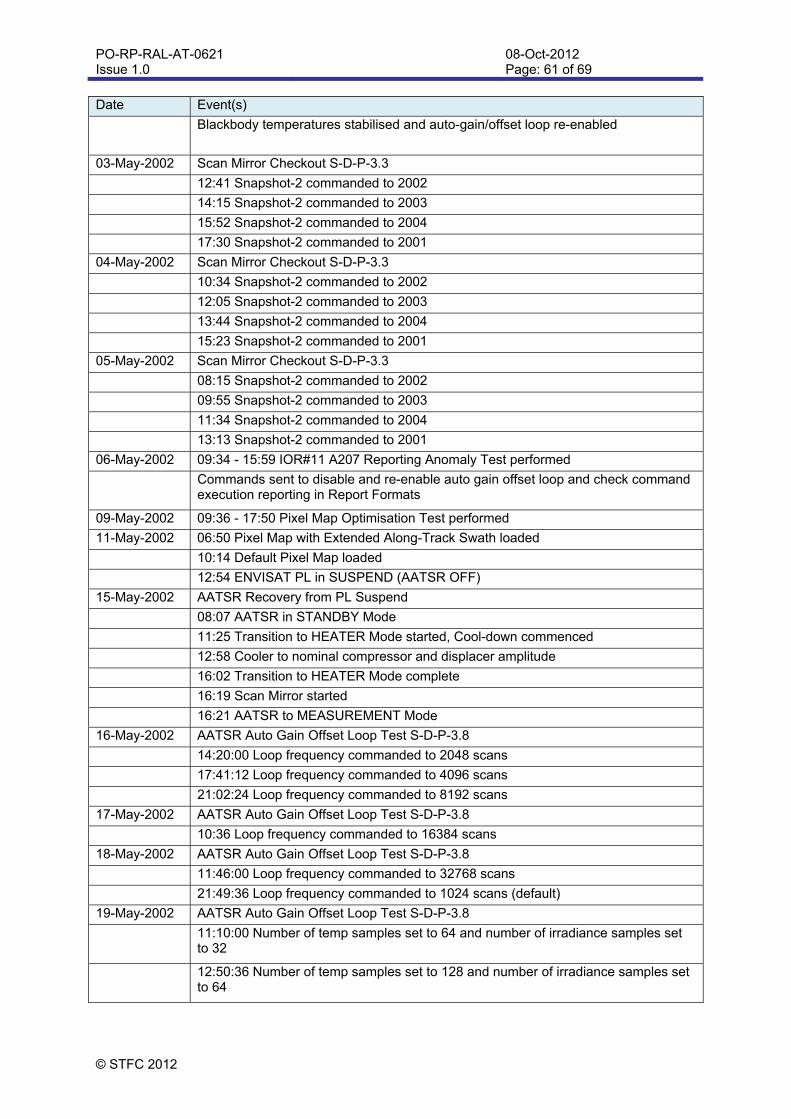
PO-RP-RAL-AT-0621 Issue 1.0
08-Oct-2012 Page: 61 of 69
© STFC 2012
Date Event(s)
Blackbody temperatures stabilised and auto-gain/offset loop re-enabled
03-May-2002 Scan Mirror Checkout S-D-P-3.3
12:41 Snapshot-2 commanded to 2002
14:15 Snapshot-2 commanded to 2003
15:52 Snapshot-2 commanded to 2004
17:30 Snapshot-2 commanded to 2001
04-May-2002 Scan Mirror Checkout S-D-P-3.3
10:34 Snapshot-2 commanded to 2002
12:05 Snapshot-2 commanded to 2003
13:44 Snapshot-2 commanded to 2004
15:23 Snapshot-2 commanded to 2001
05-May-2002 Scan Mirror Checkout S-D-P-3.3
08:15 Snapshot-2 commanded to 2002
09:55 Snapshot-2 commanded to 2003
11:34 Snapshot-2 commanded to 2004
13:13 Snapshot-2 commanded to 2001
06-May-2002 09:34 - 15:59 IOR#11 A207 Reporting Anomaly Test performed
Commands sent to disable and re-enable auto gain offset loop and check command execution reporting in Report Formats
09-May-2002 09:36 - 17:50 Pixel Map Optimisation Test performed
11-May-2002 06:50 Pixel Map with Extended Along-Track Swath loaded
10:14 Default Pixel Map loaded
12:54 ENVISAT PL in SUSPEND (AATSR OFF)
15-May-2002 AATSR Recovery from PL Suspend
08:07 AATSR in STANDBY Mode
11:25 Transition to HEATER Mode started, Cool-down commenced
12:58 Cooler to nominal compressor and displacer amplitude
16:02 Transition to HEATER Mode complete
16:19 Scan Mirror started
16:21 AATSR to MEASUREMENT Mode
16-May-2002 AATSR Auto Gain Offset Loop Test S-D-P-3.8
14:20:00 Loop frequency commanded to 2048 scans
17:41:12 Loop frequency commanded to 4096 scans
21:02:24 Loop frequency commanded to 8192 scans
17-May-2002 AATSR Auto Gain Offset Loop Test S-D-P-3.8
10:36 Loop frequency commanded to 16384 scans
18-May-2002 AATSR Auto Gain Offset Loop Test S-D-P-3.8
11:46:00 Loop frequency commanded to 32768 scans
21:49:36 Loop frequency commanded to 1024 scans (default)
19-May-2002 AATSR Auto Gain Offset Loop Test S-D-P-3.8
11:10:00 Number of temp samples set to 64 and number of irradiance samples set to 32
12:50:36 Number of temp samples set to 128 and number of irradiance samples set to 64

PO-RP-RAL-AT-0621 Issue 1.0
08-Oct-2012 Page: 62 of 69
© STFC 2012
Date Event(s)
14:31:12 Number of temp samples set to 16 and number of irradiance samples set to 8
16:11:48 Number of temp samples set to 8 and number of irradiance samples set to 4
17:52:24 Number of temp samples set to 32 and number of irradiance samples set to 16 (default)
27-May-2002 AATSR OFF due to ENVISAT PL-SOL for all instruments
28-May-2002 ENVISAT recovery started
29-May-2002 AATSR Recovery from PL-SOL
09:06 AATSR in STANDBY
10:42 Transition to HEATER Mode started
15:22 AATSR in HEATER Mode
18:51 Scan Mirror started
18:53 AATSR in MEASUREMENT Mode
05-Jun-2002 21:18:20 Payload in SUSPEND due to Level 3 PROTOCOL INTERRUPT
10-Jun-2002 AATSR recovery started
15:30:38 AATSR in STANDBY Mode
17:59:45 Transition to HEATER Mode started
22:33:24 AATSR in HEATER Mode
11-Jun-2002 AATSR recovery continued
12:48:59 AATSR in MEASUREMENT Mode
18-Jun-2002 AATSR Low-Gain Mode
07:04:45 AATSR switched to low-gain mode over desert
15-Jul-2002 Rerun of Cooler Optimisation Procedure S-D-P-3.3
07:45 Cooler commanded to run at fixed amplitude of 7D(hex)
16-Jul-2002 Cooler Optimisation - Cooler at different phase settings
08:55 Cooler Phase commanded to 30(dec)
11:57 Cooler Phase commanded to 31(dec)
14:57 Cooler Phase commanded to 32(dec)
17:57 Cooler Phase commanded to 33(dec)
20:57 Cooler Phase commanded to 29(dec) Default Setting
17-Jul-2002 Cooler Optimisation - Cooler at different balance settings
08:24 Compressor Delta setting commanded 118(dec)
11:24 Compressor Delta setting commanded 120(dec) Default Setting
14:24 Compressor Delta setting commanded 122(dec)
17:24 Compressor Delta setting commanded 128(dec) Default Setting
18-Jul-2002 Cooler returned to amplitude control
09:35 Cooler Compressor and Displacer commanded to zero amplitude
13:45 FPA at 80K
19-Jul-2002 Cooler Optimisation - control temperature at different settings
08:59 Set Point Temperature commanded to 81K
13:58 Set Point Temperature commanded to 84K
18:52 Set Point Temperature commanded to 83K
23:57 Set Point Temperature commanded to 80K Default Setting
22-Jul-2002 FPA Out-gassing
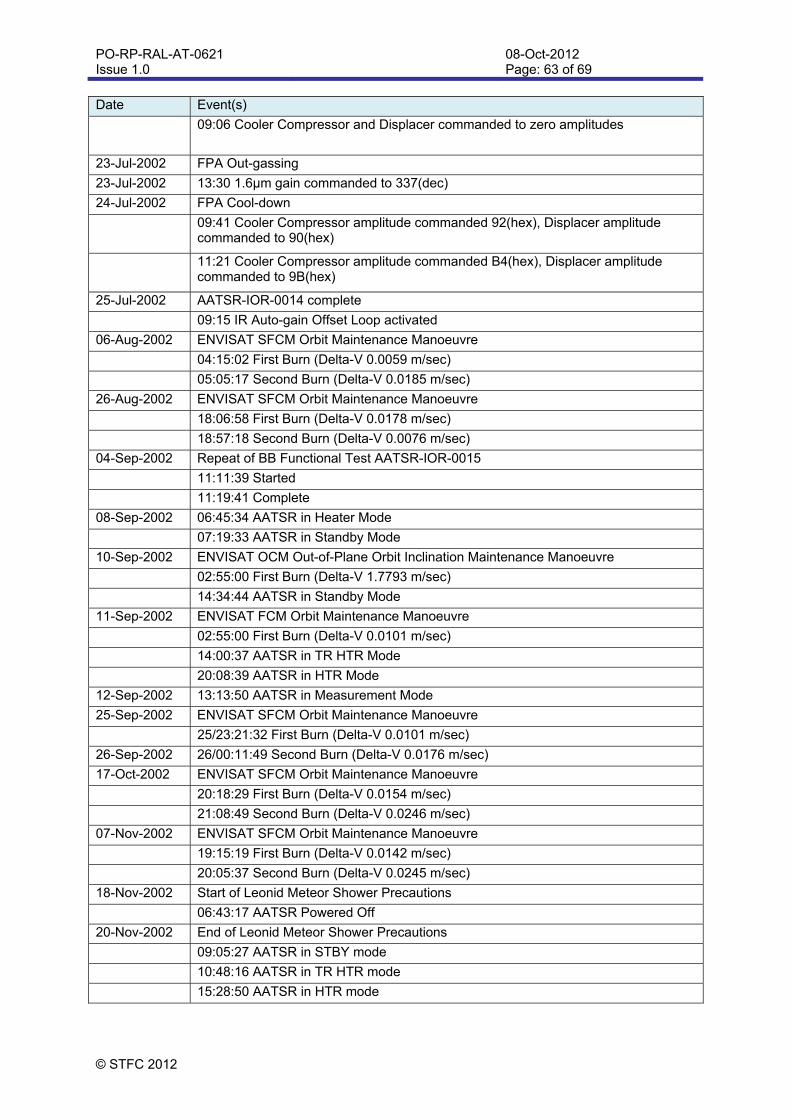
PO-RP-RAL-AT-0621 Issue 1.0
08-Oct-2012 Page: 63 of 69
© STFC 2012
Date Event(s)
09:06 Cooler Compressor and Displacer commanded to zero amplitudes
23-Jul-2002 FPA Out-gassing
23-Jul-2002 13:30 1.6µm gain commanded to 337(dec)
24-Jul-2002 FPA Cool-down
09:41 Cooler Compressor amplitude commanded 92(hex), Displacer amplitude commanded to 90(hex)
11:21 Cooler Compressor amplitude commanded B4(hex), Displacer amplitude commanded to 9B(hex)
25-Jul-2002 AATSR-IOR-0014 complete
09:15 IR Auto-gain Offset Loop activated
06-Aug-2002 ENVISAT SFCM Orbit Maintenance Manoeuvre
04:15:02 First Burn (Delta-V 0.0059 m/sec)
05:05:17 Second Burn (Delta-V 0.0185 m/sec)
26-Aug-2002 ENVISAT SFCM Orbit Maintenance Manoeuvre
18:06:58 First Burn (Delta-V 0.0178 m/sec)
18:57:18 Second Burn (Delta-V 0.0076 m/sec)
04-Sep-2002 Repeat of BB Functional Test AATSR-IOR-0015
11:11:39 Started
11:19:41 Complete
08-Sep-2002 06:45:34 AATSR in Heater Mode
07:19:33 AATSR in Standby Mode
10-Sep-2002 ENVISAT OCM Out-of-Plane Orbit Inclination Maintenance Manoeuvre
02:55:00 First Burn (Delta-V 1.7793 m/sec)
14:34:44 AATSR in Standby Mode
11-Sep-2002 ENVISAT FCM Orbit Maintenance Manoeuvre
02:55:00 First Burn (Delta-V 0.0101 m/sec)
14:00:37 AATSR in TR HTR Mode
20:08:39 AATSR in HTR Mode
12-Sep-2002 13:13:50 AATSR in Measurement Mode
25-Sep-2002 ENVISAT SFCM Orbit Maintenance Manoeuvre
25/23:21:32 First Burn (Delta-V 0.0101 m/sec)
26-Sep-2002 26/00:11:49 Second Burn (Delta-V 0.0176 m/sec)
17-Oct-2002 ENVISAT SFCM Orbit Maintenance Manoeuvre
20:18:29 First Burn (Delta-V 0.0154 m/sec)
21:08:49 Second Burn (Delta-V 0.0246 m/sec)
07-Nov-2002 ENVISAT SFCM Orbit Maintenance Manoeuvre
19:15:19 First Burn (Delta-V 0.0142 m/sec)
20:05:37 Second Burn (Delta-V 0.0245 m/sec)
18-Nov-2002 Start of Leonid Meteor Shower Precautions
06:43:17 AATSR Powered Off
20-Nov-2002 End of Leonid Meteor Shower Precautions
09:05:27 AATSR in STBY mode
10:48:16 AATSR in TR HTR mode
15:28:50 AATSR in HTR mode
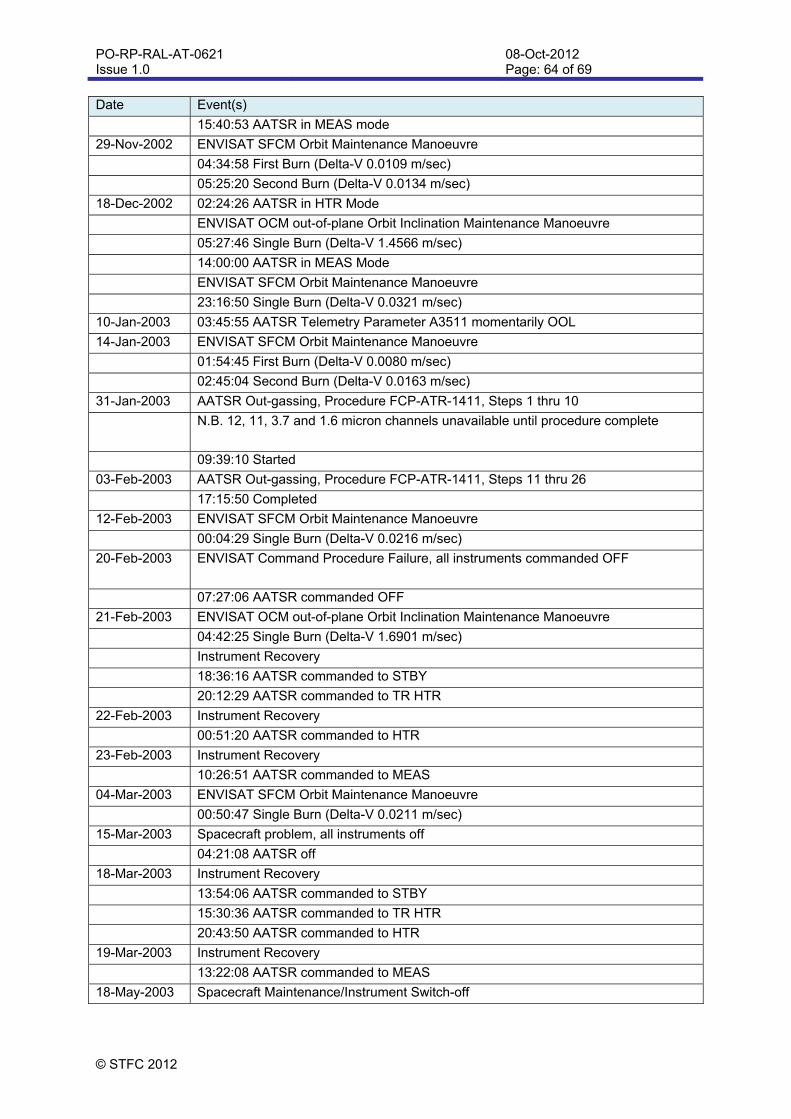
PO-RP-RAL-AT-0621 Issue 1.0
08-Oct-2012 Page: 64 of 69
© STFC 2012
Date Event(s)
15:40:53 AATSR in MEAS mode
29-Nov-2002 ENVISAT SFCM Orbit Maintenance Manoeuvre
04:34:58 First Burn (Delta-V 0.0109 m/sec)
05:25:20 Second Burn (Delta-V 0.0134 m/sec)
18-Dec-2002 02:24:26 AATSR in HTR Mode
ENVISAT OCM out-of-plane Orbit Inclination Maintenance Manoeuvre
05:27:46 Single Burn (Delta-V 1.4566 m/sec)
14:00:00 AATSR in MEAS Mode
ENVISAT SFCM Orbit Maintenance Manoeuvre
23:16:50 Single Burn (Delta-V 0.0321 m/sec)
10-Jan-2003 03:45:55 AATSR Telemetry Parameter A3511 momentarily OOL
14-Jan-2003 ENVISAT SFCM Orbit Maintenance Manoeuvre
01:54:45 First Burn (Delta-V 0.0080 m/sec)
02:45:04 Second Burn (Delta-V 0.0163 m/sec)
31-Jan-2003 AATSR Out-gassing, Procedure FCP-ATR-1411, Steps 1 thru 10
N.B. 12, 11, 3.7 and 1.6 micron channels unavailable until procedure complete
09:39:10 Started
03-Feb-2003 AATSR Out-gassing, Procedure FCP-ATR-1411, Steps 11 thru 26
17:15:50 Completed
12-Feb-2003 ENVISAT SFCM Orbit Maintenance Manoeuvre
00:04:29 Single Burn (Delta-V 0.0216 m/sec)
20-Feb-2003 ENVISAT Command Procedure Failure, all instruments commanded OFF
07:27:06 AATSR commanded OFF
21-Feb-2003 ENVISAT OCM out-of-plane Orbit Inclination Maintenance Manoeuvre
04:42:25 Single Burn (Delta-V 1.6901 m/sec)
Instrument Recovery
18:36:16 AATSR commanded to STBY
20:12:29 AATSR commanded to TR HTR
22-Feb-2003 Instrument Recovery
00:51:20 AATSR commanded to HTR
23-Feb-2003 Instrument Recovery
10:26:51 AATSR commanded to MEAS
04-Mar-2003 ENVISAT SFCM Orbit Maintenance Manoeuvre
00:50:47 Single Burn (Delta-V 0.0211 m/sec)
15-Mar-2003 Spacecraft problem, all instruments off
04:21:08 AATSR off
18-Mar-2003 Instrument Recovery
13:54:06 AATSR commanded to STBY
15:30:36 AATSR commanded to TR HTR
20:43:50 AATSR commanded to HTR
19-Mar-2003 Instrument Recovery
13:22:08 AATSR commanded to MEAS
18-May-2003 Spacecraft Maintenance/Instrument Switch-off
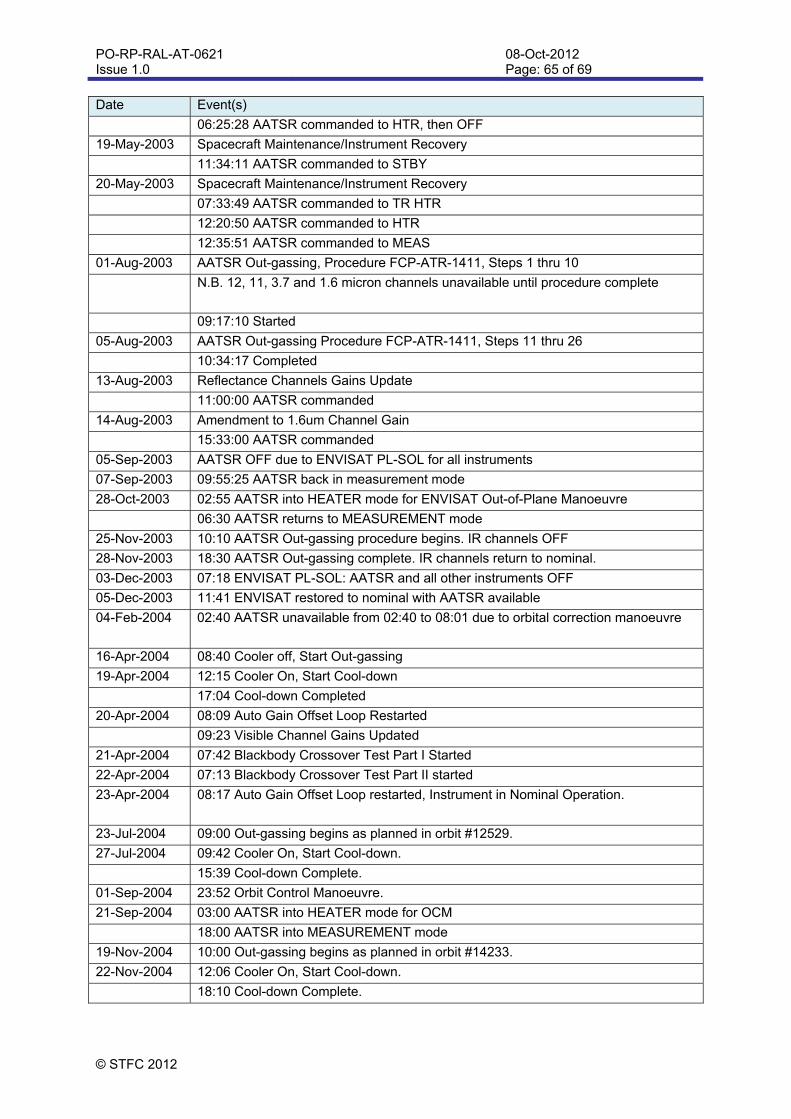
PO-RP-RAL-AT-0621 Issue 1.0
08-Oct-2012 Page: 65 of 69
© STFC 2012
Date Event(s)
06:25:28 AATSR commanded to HTR, then OFF
19-May-2003 Spacecraft Maintenance/Instrument Recovery
11:34:11 AATSR commanded to STBY
20-May-2003 Spacecraft Maintenance/Instrument Recovery
07:33:49 AATSR commanded to TR HTR
12:20:50 AATSR commanded to HTR
12:35:51 AATSR commanded to MEAS
01-Aug-2003 AATSR Out-gassing, Procedure FCP-ATR-1411, Steps 1 thru 10
N.B. 12, 11, 3.7 and 1.6 micron channels unavailable until procedure complete
09:17:10 Started
05-Aug-2003 AATSR Out-gassing Procedure FCP-ATR-1411, Steps 11 thru 26
10:34:17 Completed
13-Aug-2003 Reflectance Channels Gains Update
11:00:00 AATSR commanded
14-Aug-2003 Amendment to 1.6um Channel Gain
15:33:00 AATSR commanded
05-Sep-2003 AATSR OFF due to ENVISAT PL-SOL for all instruments
07-Sep-2003 09:55:25 AATSR back in measurement mode
28-Oct-2003 02:55 AATSR into HEATER mode for ENVISAT Out-of-Plane Manoeuvre
06:30 AATSR returns to MEASUREMENT mode
25-Nov-2003 10:10 AATSR Out-gassing procedure begins. IR channels OFF
28-Nov-2003 18:30 AATSR Out-gassing complete. IR channels return to nominal.
03-Dec-2003 07:18 ENVISAT PL-SOL: AATSR and all other instruments OFF
05-Dec-2003 11:41 ENVISAT restored to nominal with AATSR available
04-Feb-2004 02:40 AATSR unavailable from 02:40 to 08:01 due to orbital correction manoeuvre
16-Apr-2004 08:40 Cooler off, Start Out-gassing
19-Apr-2004 12:15 Cooler On, Start Cool-down
17:04 Cool-down Completed
20-Apr-2004 08:09 Auto Gain Offset Loop Restarted
09:23 Visible Channel Gains Updated
21-Apr-2004 07:42 Blackbody Crossover Test Part I Started
22-Apr-2004 07:13 Blackbody Crossover Test Part II started
23-Apr-2004 08:17 Auto Gain Offset Loop restarted, Instrument in Nominal Operation.
23-Jul-2004 09:00 Out-gassing begins as planned in orbit #12529.
27-Jul-2004 09:42 Cooler On, Start Cool-down.
15:39 Cool-down Complete.
01-Sep-2004 23:52 Orbit Control Manoeuvre.
21-Sep-2004 03:00 AATSR into HEATER mode for OCM
18:00 AATSR into MEASUREMENT mode
19-Nov-2004 10:00 Out-gassing begins as planned in orbit #14233.
22-Nov-2004 12:06 Cooler On, Start Cool-down.
18:10 Cool-down Complete.
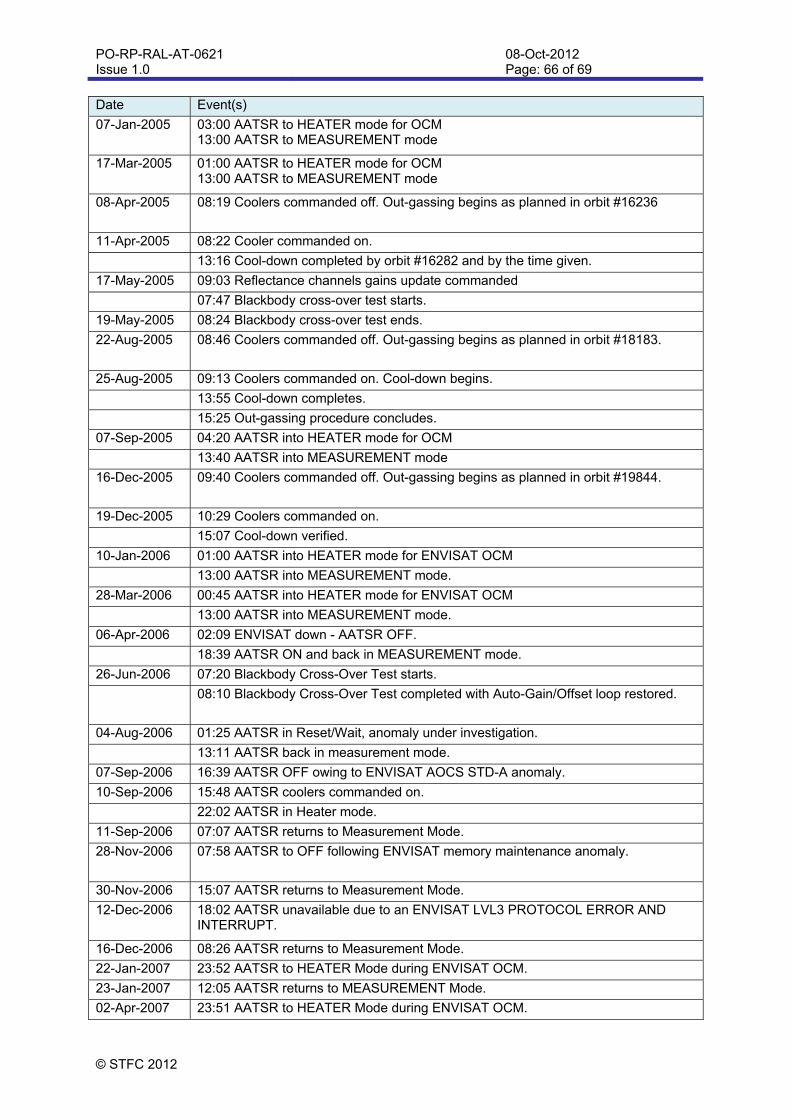
PO-RP-RAL-AT-0621 Issue 1.0
08-Oct-2012 Page: 66 of 69
© STFC 2012
Date Event(s)
07-Jan-2005 03:00 AATSR to HEATER mode for OCM 13:00 AATSR to MEASUREMENT mode
17-Mar-2005 01:00 AATSR to HEATER mode for OCM 13:00 AATSR to MEASUREMENT mode
08-Apr-2005 08:19 Coolers commanded off. Out-gassing begins as planned in orbit #16236
11-Apr-2005 08:22 Cooler commanded on.
13:16 Cool-down completed by orbit #16282 and by the time given.
17-May-2005 09:03 Reflectance channels gains update commanded
07:47 Blackbody cross-over test starts.
19-May-2005 08:24 Blackbody cross-over test ends.
22-Aug-2005 08:46 Coolers commanded off. Out-gassing begins as planned in orbit #18183.
25-Aug-2005 09:13 Coolers commanded on. Cool-down begins.
13:55 Cool-down completes.
15:25 Out-gassing procedure concludes.
07-Sep-2005 04:20 AATSR into HEATER mode for OCM
13:40 AATSR into MEASUREMENT mode
16-Dec-2005 09:40 Coolers commanded off. Out-gassing begins as planned in orbit #19844.
19-Dec-2005 10:29 Coolers commanded on.
15:07 Cool-down verified.
10-Jan-2006 01:00 AATSR into HEATER mode for ENVISAT OCM
13:00 AATSR into MEASUREMENT mode.
28-Mar-2006 00:45 AATSR into HEATER mode for ENVISAT OCM
13:00 AATSR into MEASUREMENT mode.
06-Apr-2006 02:09 ENVISAT down - AATSR OFF.
18:39 AATSR ON and back in MEASUREMENT mode.
26-Jun-2006 07:20 Blackbody Cross-Over Test starts.
08:10 Blackbody Cross-Over Test completed with Auto-Gain/Offset loop restored.
04-Aug-2006 01:25 AATSR in Reset/Wait, anomaly under investigation.
13:11 AATSR back in measurement mode.
07-Sep-2006 16:39 AATSR OFF owing to ENVISAT AOCS STD-A anomaly.
10-Sep-2006 15:48 AATSR coolers commanded on.
22:02 AATSR in Heater mode.
11-Sep-2006 07:07 AATSR returns to Measurement Mode.
28-Nov-2006 07:58 AATSR to OFF following ENVISAT memory maintenance anomaly.
30-Nov-2006 15:07 AATSR returns to Measurement Mode.
12-Dec-2006 18:02 AATSR unavailable due to an ENVISAT LVL3 PROTOCOL ERROR AND INTERRUPT.
16-Dec-2006 08:26 AATSR returns to Measurement Mode.
22-Jan-2007 23:52 AATSR to HEATER Mode during ENVISAT OCM.
23-Jan-2007 12:05 AATSR returns to MEASUREMENT Mode.
02-Apr-2007 23:51 AATSR to HEATER Mode during ENVISAT OCM.
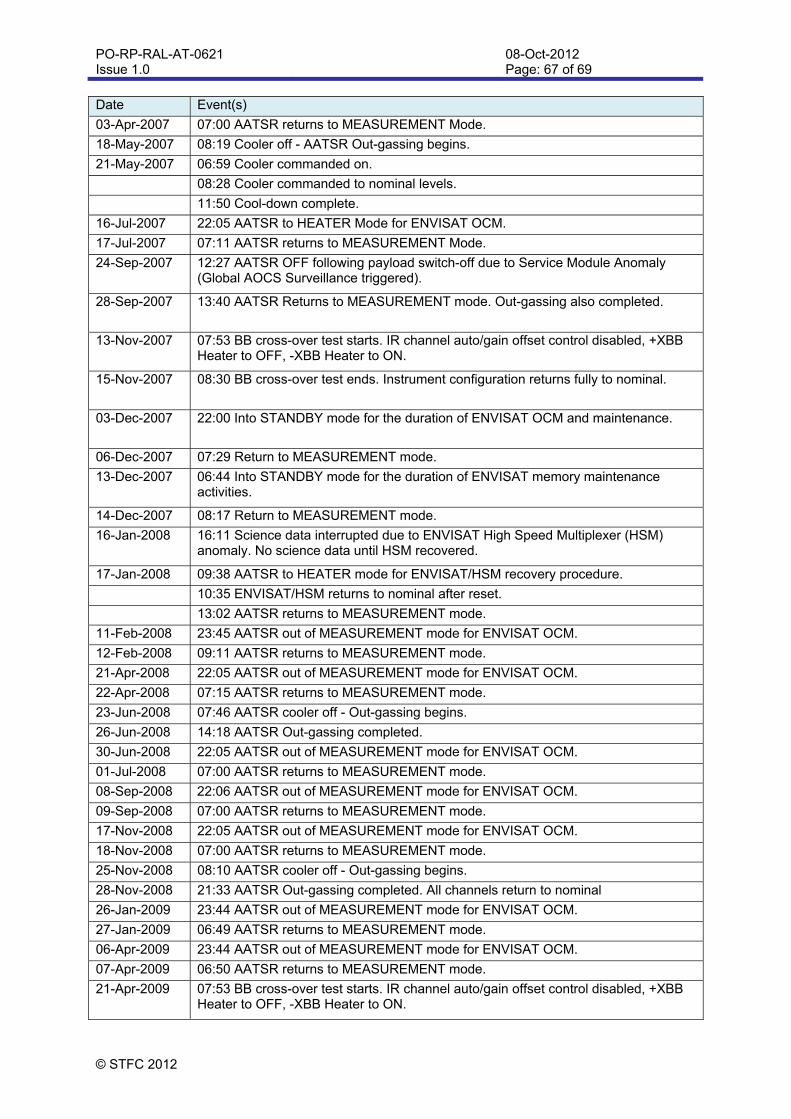
PO-RP-RAL-AT-0621 Issue 1.0
08-Oct-2012 Page: 67 of 69
© STFC 2012
Date Event(s)
03-Apr-2007 07:00 AATSR returns to MEASUREMENT Mode.
18-May-2007 08:19 Cooler off - AATSR Out-gassing begins.
21-May-2007 06:59 Cooler commanded on.
08:28 Cooler commanded to nominal levels.
11:50 Cool-down complete.
16-Jul-2007 22:05 AATSR to HEATER Mode for ENVISAT OCM.
17-Jul-2007 07:11 AATSR returns to MEASUREMENT Mode.
24-Sep-2007 12:27 AATSR OFF following payload switch-off due to Service Module Anomaly (Global AOCS Surveillance triggered).
28-Sep-2007 13:40 AATSR Returns to MEASUREMENT mode. Out-gassing also completed.
13-Nov-2007 07:53 BB cross-over test starts. IR channel auto/gain offset control disabled, +XBB Heater to OFF, -XBB Heater to ON.
15-Nov-2007 08:30 BB cross-over test ends. Instrument configuration returns fully to nominal.
03-Dec-2007 22:00 Into STANDBY mode for the duration of ENVISAT OCM and maintenance.
06-Dec-2007 07:29 Return to MEASUREMENT mode.
13-Dec-2007 06:44 Into STANDBY mode for the duration of ENVISAT memory maintenance activities.
14-Dec-2007 08:17 Return to MEASUREMENT mode.
16-Jan-2008 16:11 Science data interrupted due to ENVISAT High Speed Multiplexer (HSM) anomaly. No science data until HSM recovered.
17-Jan-2008 09:38 AATSR to HEATER mode for ENVISAT/HSM recovery procedure.
10:35 ENVISAT/HSM returns to nominal after reset.
13:02 AATSR returns to MEASUREMENT mode.
11-Feb-2008 23:45 AATSR out of MEASUREMENT mode for ENVISAT OCM.
12-Feb-2008 09:11 AATSR returns to MEASUREMENT mode.
21-Apr-2008 22:05 AATSR out of MEASUREMENT mode for ENVISAT OCM.
22-Apr-2008 07:15 AATSR returns to MEASUREMENT mode.
23-Jun-2008 07:46 AATSR cooler off - Out-gassing begins.
26-Jun-2008 14:18 AATSR Out-gassing completed.
30-Jun-2008 22:05 AATSR out of MEASUREMENT mode for ENVISAT OCM.
01-Jul-2008 07:00 AATSR returns to MEASUREMENT mode.
08-Sep-2008 22:06 AATSR out of MEASUREMENT mode for ENVISAT OCM.
09-Sep-2008 07:00 AATSR returns to MEASUREMENT mode.
17-Nov-2008 22:05 AATSR out of MEASUREMENT mode for ENVISAT OCM.
18-Nov-2008 07:00 AATSR returns to MEASUREMENT mode.
25-Nov-2008 08:10 AATSR cooler off - Out-gassing begins.
28-Nov-2008 21:33 AATSR Out-gassing completed. All channels return to nominal
26-Jan-2009 23:44 AATSR out of MEASUREMENT mode for ENVISAT OCM.
27-Jan-2009 06:49 AATSR returns to MEASUREMENT mode.
06-Apr-2009 23:44 AATSR out of MEASUREMENT mode for ENVISAT OCM.
07-Apr-2009 06:50 AATSR returns to MEASUREMENT mode.
21-Apr-2009 07:53 BB cross-over test starts. IR channel auto/gain offset control disabled, +XBB Heater to OFF, -XBB Heater to ON.
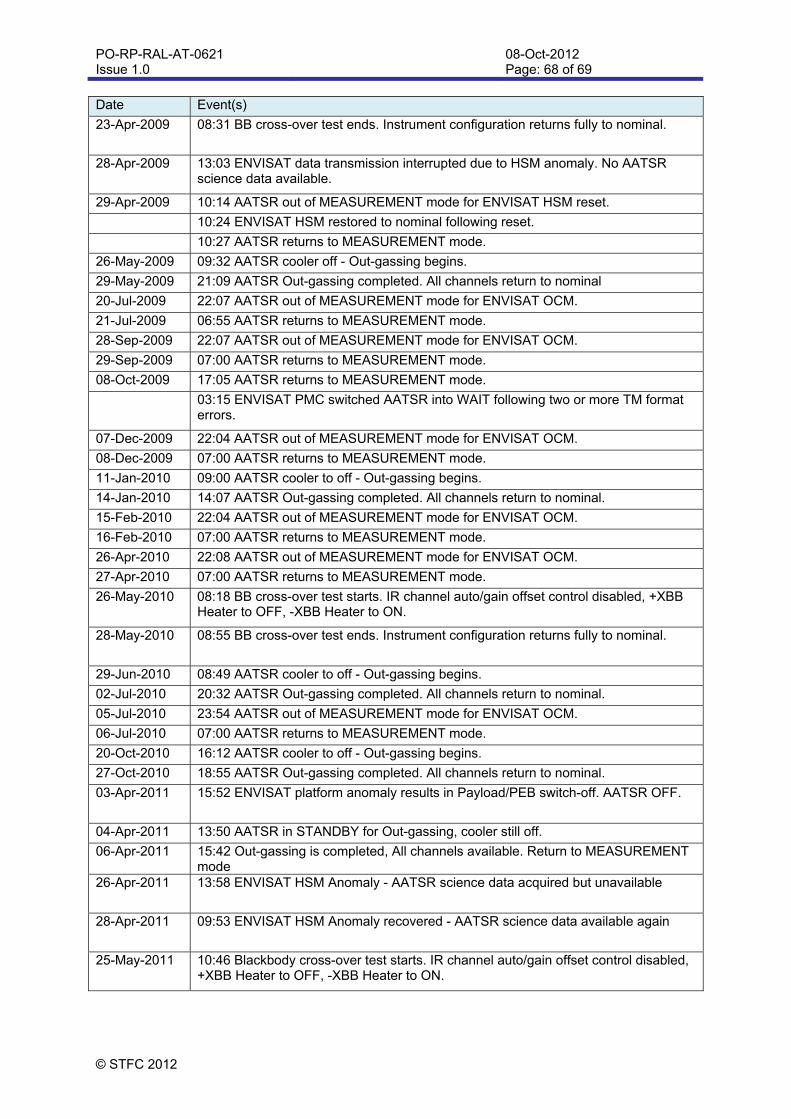
PO-RP-RAL-AT-0621 Issue 1.0
08-Oct-2012 Page: 68 of 69
© STFC 2012
Date Event(s)
23-Apr-2009 08:31 BB cross-over test ends. Instrument configuration returns fully to nominal.
28-Apr-2009 13:03 ENVISAT data transmission interrupted due to HSM anomaly. No AATSR science data available.
29-Apr-2009 10:14 AATSR out of MEASUREMENT mode for ENVISAT HSM reset.
10:24 ENVISAT HSM restored to nominal following reset.
10:27 AATSR returns to MEASUREMENT mode.
26-May-2009 09:32 AATSR cooler off - Out-gassing begins.
29-May-2009 21:09 AATSR Out-gassing completed. All channels return to nominal
20-Jul-2009 22:07 AATSR out of MEASUREMENT mode for ENVISAT OCM.
21-Jul-2009 06:55 AATSR returns to MEASUREMENT mode.
28-Sep-2009 22:07 AATSR out of MEASUREMENT mode for ENVISAT OCM.
29-Sep-2009 07:00 AATSR returns to MEASUREMENT mode.
08-Oct-2009 17:05 AATSR returns to MEASUREMENT mode.
03:15 ENVISAT PMC switched AATSR into WAIT following two or more TM format errors.
07-Dec-2009 22:04 AATSR out of MEASUREMENT mode for ENVISAT OCM.
08-Dec-2009 07:00 AATSR returns to MEASUREMENT mode.
11-Jan-2010 09:00 AATSR cooler to off - Out-gassing begins.
14-Jan-2010 14:07 AATSR Out-gassing completed. All channels return to nominal.
15-Feb-2010 22:04 AATSR out of MEASUREMENT mode for ENVISAT OCM.
16-Feb-2010 07:00 AATSR returns to MEASUREMENT mode.
26-Apr-2010 22:08 AATSR out of MEASUREMENT mode for ENVISAT OCM.
27-Apr-2010 07:00 AATSR returns to MEASUREMENT mode.
26-May-2010 08:18 BB cross-over test starts. IR channel auto/gain offset control disabled, +XBB Heater to OFF, -XBB Heater to ON.
28-May-2010 08:55 BB cross-over test ends. Instrument configuration returns fully to nominal.
29-Jun-2010 08:49 AATSR cooler to off - Out-gassing begins.
02-Jul-2010 20:32 AATSR Out-gassing completed. All channels return to nominal.
05-Jul-2010 23:54 AATSR out of MEASUREMENT mode for ENVISAT OCM.
06-Jul-2010 07:00 AATSR returns to MEASUREMENT mode.
20-Oct-2010 16:12 AATSR cooler to off - Out-gassing begins.
27-Oct-2010 18:55 AATSR Out-gassing completed. All channels return to nominal.
03-Apr-2011 15:52 ENVISAT platform anomaly results in Payload/PEB switch-off. AATSR OFF.
04-Apr-2011 13:50 AATSR in STANDBY for Out-gassing, cooler still off.
06-Apr-2011 15:42 Out-gassing is completed, All channels available. Return to MEASUREMENT mode
26-Apr-2011 13:58 ENVISAT HSM Anomaly - AATSR science data acquired but unavailable
28-Apr-2011 09:53 ENVISAT HSM Anomaly recovered - AATSR science data available again
25-May-2011 10:46 Blackbody cross-over test starts. IR channel auto/gain offset control disabled, +XBB Heater to OFF, -XBB Heater to ON.
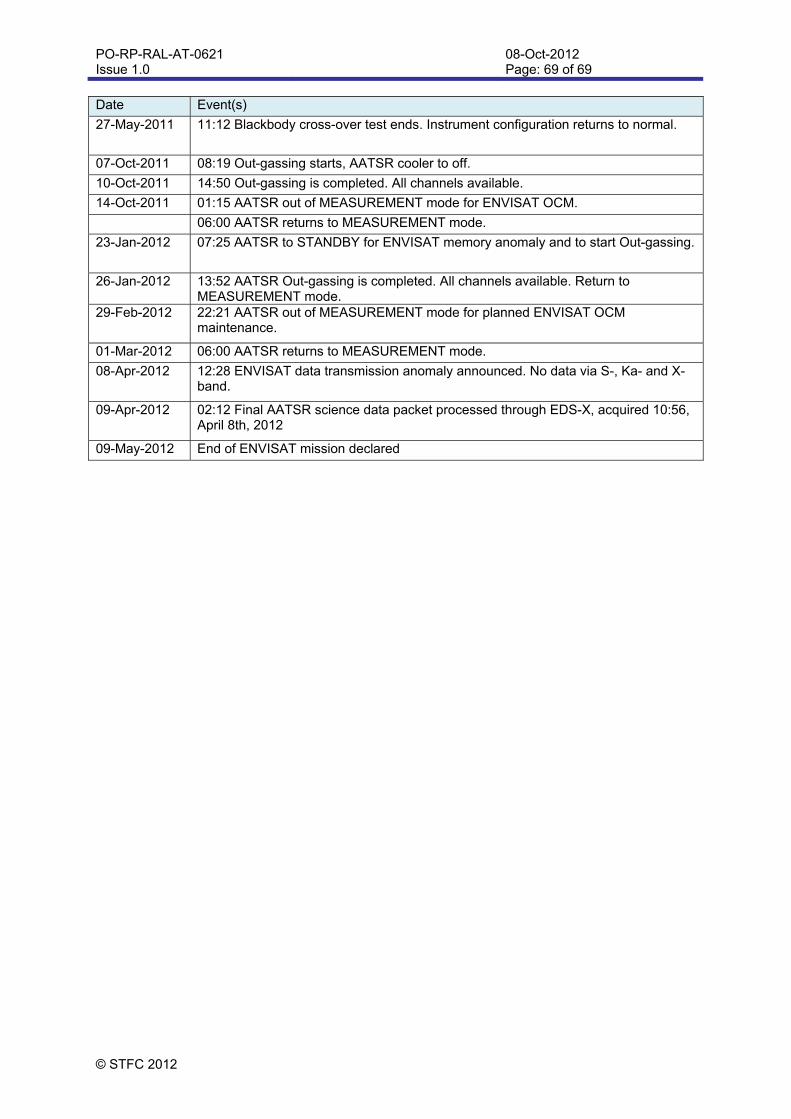
PO-RP-RAL-AT-0621 Issue 1.0
08-Oct-2012 Page: 69 of 69
© STFC 2012
Date Event(s)
27-May-2011 11:12 Blackbody cross-over test ends. Instrument configuration returns to normal.
07-Oct-2011 08:19 Out-gassing starts, AATSR cooler to off.
10-Oct-2011 14:50 Out-gassing is completed. All channels available.
14-Oct-2011 01:15 AATSR out of MEASUREMENT mode for ENVISAT OCM.
06:00 AATSR returns to MEASUREMENT mode.
23-Jan-2012 07:25 AATSR to STANDBY for ENVISAT memory anomaly and to start Out-gassing.
26-Jan-2012 13:52 AATSR Out-gassing is completed. All channels available. Return to MEASUREMENT mode.
29-Feb-2012 22:21 AATSR out of MEASUREMENT mode for planned ENVISAT OCM maintenance.
01-Mar-2012 06:00 AATSR returns to MEASUREMENT mode.
08-Apr-2012 12:28 ENVISAT data transmission anomaly announced. No data via S-, Ka- and X-band.
09-Apr-2012 02:12 Final AATSR science data packet processed through EDS-X, acquired 10:56, April 8th, 2012
09-May-2012 End of ENVISAT mission declared