field collection and geochemical characterization of ... · field collection and geochemical...
TRANSCRIPT

Field Collection and Geochemical Characterization of Potential Mesozoic Source Rocks
on Northern Vancouver Island and the Queen Charlotte Islands
Report prepared for
University of Victoria (UVic) –
Ministry of Energy and Mines (MEM)
Partnership Program
Dr. Torge Schuemann
School of Earth and Ocean Sciences
University of Victoria
2005
1

Introduction
The Tertiary Queen Charlotte Basin (QCB) is located immediately inboard of the Pacific - North American plate boundary and comprises Dixon Entrance, Hecate Strait, and Queen Charlotte Sound from north to south (Figure 3). A network of fault-bound sub-basins in Hecate Strait and Queen Charlotte Sound contain up to 5 km of sandstones, siltstones and conglomerates with some coals, which are known as the Skonun Formation (Figure 1). Based on reflection seismic and well data the Skonun Formation has been divided into syn-rift and post-rift successions. Fossils indicate Miocene and Pliocene ages. At many locations, the basal sediments either interfinger or overly extensional basaltic rocks of the Masset Formation (Hickson, 1992; Hyndman & Hamilton, 1993). Masset rocks on Graham Island have yielded ages of 35-12 Ma; most fall between 25-20 Ma (Figure 1). Unfortunately no reliable dates are available from basalts drilled in the wells.
Upper Triassic / Lower Jurassic potential source rocks, mainly in the Peril, Sandilands and Ghost Creek formations from the Kunga and Maude groups as well as Cretaceous formations, are exposed on the Queen Charlotte Islands (QCI). Both the Sandilands and Ghost Creek formations comprise significant organic-rich petroleum source rocks in the region, which reach up to 600m in thickness with Total Organic Carbon (TOC) up to 6.1%, comprising oil-prone Type I and oil and gas-prone Type II kerogens with Hydrogen Index (HI) values ranging up to 589 mg HC/g Corg (Bustin & Mastalerz, 1995; Macauley, 1983; Snowdon etal., 2002, see also Figure 2). Organic-rich shales with 5 to 10% TOC occur in beds up to 10m thick (Dietrich, 1995). At least the Sandilands Formation is likely to occur in most parts of Hecate Strait and Queen Charlotte Sound (Cameron & Tipper, 1985, Woodsworth, 1988, Thompson et al., 1991, and Bustin & Mastalerz, 1995).
Most of the oil occurrences so far encountered in the region appear as surface seeps in Tertiary volcanic rocks of the Masset Formation on Graham Island (Hamilton & Cameron, 1989), but oil stains have also been encountered in Tertiary sandstones within the Sockeye B-10 well. Chemical compositions of these oils appear related to a Lower Jurassic source (Fowler et al., 1988, Snowdon et al., 1988, Hamilton and Cameron, 1989, Bustin and Mastalerz, 1995), which underlines the necessity to include Mesozoic strata into hydrocarbon assessment of the QCB.
Previous basin modeling studies of the hydrocarbon potential within the region of the Queen Charlotte Basin have shown the importance of the distribution and characterization of source rocks (e.g., Macauley, 1983, Vellutini and Bustin, 1991, Bustin, 1997, Whiticar et. al., 2003). Especially determination of type and kinetics of kerogen (constrain how it reacts to heating over time) dominant in the various source rocks has been proven to be crucial to generation and timing of hydrocarbons in the QCB (Whiticar et al., 2004). To establish better knowledge of such kerogen kinetics in the Mesozoic section source rock intervals have been sampled onshore during two field campaigns in 2004.
2

Figure 1. Generalized stratigraphy of Mesozoic (Triassic, Jurassic and Cretaceous) and
Cenozoic (Tertiary) of the QCB (after Haggart etal., 2005).
Motivation for sampling campaign
It is important to note that the offshore wells are largely limited in depth to Tertiary units. It is anticipated that deeper in the basin there are Mesozoic (Triassic / Jurassic) units that have oil and gas prone Type II kerogens. Indirect evidence for this comes from:
3

1. Latest Triassic and Early Jurassic marine mud rocks of the Sandilands and Ghost Creek formations from the Kunga and Maude groups are found on the Queen Charlotte Islands. The Sandilands Formation is likely to occur in Hecate Strait and Queen Charlotte Sound (Cameron & Tipper, 1985, Woodsworth, 1988, Thompson et al., 1991)
2. Both Sandilands and Ghost Creek formations have high %TOC and have evidence of Type I and II kerogens with HI values ranging up to 589 mg HC/g Corg (Macauley, 1983; Bustin & Mastalerz, 1995; Dietrich, 1995, Snowdon etal., 2002).
3. Onshore oil shows have chemical compositions that appear related to a Lower Jurassic source (Fowler et al., 1988, Snowdon et al., 1988, Hamilton and Cameron, 1989, Bustin and Mastalerz, 1995).
Sediments of the Kunga and Maude groups comprise Latest Triassic and Early Jurassic organic-rich marine mud rocks (Peril, Sandilands, and Ghost Creek Fms.) which reach up to 600m in thickness, containing up to 10% TOC in some cases (Dietrich, 1995). The amount of organic matter present is critical to determine if sufficient generation will occur to make economic accumulations of petroleum, provided migration, trapping and preservation criteria are also met.
The compositional quality of the organic matter is critical to determine the type of petroleum formed, e.g., oil vs. gas. The proportion of hydrogen in the kerogen is an excellent measure of this proneness. Hydrogen-rich kerogen (Type I or II), as found in aqueous source rocks, forms oil more abundantly than low hydrogen or oxygen rich kerogens (Type III). The hydrogen index is frequently used to quantify the relative amount of hydrogen in the organic matter, and hence determine the kerogen type.
Data published for some source rock intervals reported from the QCI (Macauley, 1983 and Snowdon et al., 2002) reveal HI values in the range of 200 to 600, which clearly places them on typical trends for Type I/II kerogen (Figure 2).
4

Figure 2. Published data for the source rock intervals reported from
the Queen Charlotte Islands (Macauley, 1983 and Snowdon et al., 2002) reveal that the Mesozoic Kunga and Maude source rocks contain marine, Type II-dominated kerogens.
To furthermore characterize kerogen multi-compositional kinetics can be used, which enable to describe generated hydrocarbons as a function of activation energy (temperature). Such kinetic models allow an improved prediction of petroleum phases and composition, leading to better estimates for volumes and qualities (i.e. API gravity) of generated products, as calculated by Petroleum Systems Modeling (PSM).
Previous Petroleum Systems Modeling by UVic
Whiticar etal. (2003, 2004) have shown that younger sediments of the Skonun Formation are not likely to have produced extensive amounts of hydrocarbon, mainly due to insufficient burial and based on the assumed type of organic matter which requires higher activation energies (Type III, as determined by Bustin, 1997).
Older Mesozoic strata has only been encountered as bottom formation in one of the 8 offshore wells, which are largely limited in depth to Tertiary units. However, it is anticipated that deeper in the basin Mesozoic (Triassic/Jurassic) source rock intervals are present.
5

Whiticar etal. (2004) have recognized that older units in the basin, such as the late Triassic and Jurassic, may have suitable marine source rocks (Type II kerogen) for the substantial generation of oil and gas. As such, they are important to the petroleum situation of the QCB and therefore have been included their Petroleum Systems Model.
The lack of well control, coupled with poor seismic imaging of the older units, are serious constraints on the interpretation of Jurassic and Cretaceous sequences. Although the information base on Mesozoic sediments is much more limited than for the younger units Whiticar etal. (2004) have shown potential for hydrocarbon plays fed from Mesozoic sources.
As no source rock material from those older units has been available for detailed analysis previously, available characteristics from similar source around the world had to be used in accordance to data summarized in Bustin and Masterlerz (1995). Source rocks of the Ghost Creek and Sandilands formations were considered to be marine and their organic material has been assumed to be primarily type II kerogen (Whiticar etal., 2004). Distribution of activation energies was derived from well established comparable “literature kerogens” (see Whiticar etal., 2004 for details). While such an approach is common for frontier exploration areas, it is preferable to use kinetics tailored specifically to the investigated area, based on samples from the area.
Sampling campaigns in 2004
To improve understanding of hydrocarbon generation from Mesozoic sources two sampling campaigns were conducted in 2004. Apart from sampling locations on the Queen Charlotte Islands (QCI), locations on Northern Vancouver Island (NVI), Parson Island (PI), Harbledown Island (HI), and Swanson Island (SI) have been sampled. Late Triassic/Early Jurassic organic rich rocks from these areas have been correlated to known Kunga/Maude source rock sequence on Queen Charlotte Islands (e.g. Tipper, 1977).
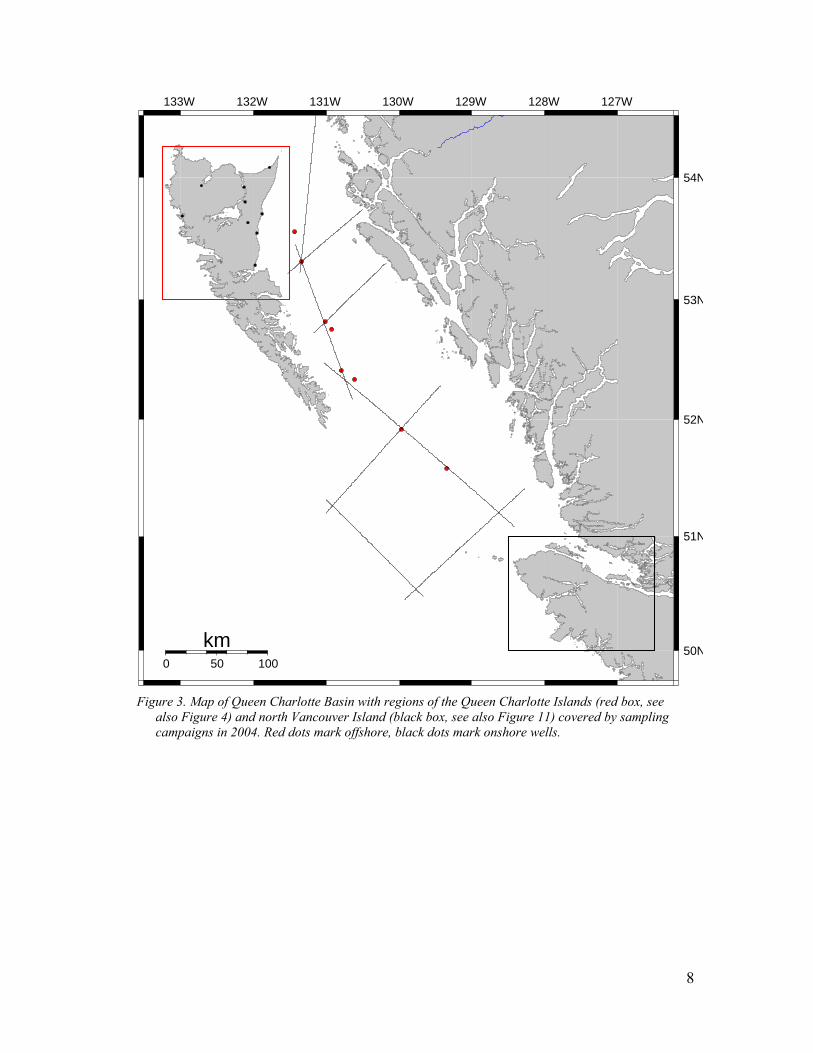
The two investigated areas are shown in Figure 3:
1. Queen Charlotte Islands – predominantly on Graham Island, but with local sampling on Moresby and adjacent islands. Samples were taken in September 2004 from the Kunga and Maude Group (Late Triassic / Early Jurassic).
2. North Vancouver Island as defined in this study – includes Parson, Harbledown, and Swanson Island east of Port McNeill (Figure 3). Organic rich sediments of the Parson Bay and Harbledown Fms., equivalent to Late Triassic/Early Jurassic source rocks occurring on the QCI (Tipper, 1977) and inferred to underlay the QCB have been sampled in May 2004.
6

Table 1. Queen Charlotte islands Rock Eval 6 sampling locations. Sample QCI 1-5 was further analyzed to establish multi-component kinetics.
sample Location Formation UTM (zone 08N) Figure 1-7 Moresby Island Whiteaves 698984E 5897966N
1-6 Graham Island Fannin 679386E 5920527N
1-8 Graham Island Ghost Creek 679476E 5920996N
1-5 Graham Island 679070E 5921449N Figure 6 2-1 Sandilands Island
Sandilands693813E 5895144N
1-3 Graham Island 671519E 5913326N
4-4 Maude Island Peril
696097E 5897942N Figure 10
Rock Eval-6 analysis (subcontracted to GSC-Calgary) provides the essential geochemical source rock parameters to characterize the investigated potential Mesozoic source rocks (e.g., TOC, Tmax, S1, S2, S3, HI, OI, PI). Detailed multi-component kinetic studies on one suitable sample from the Sandilands formation was also performed by the GSC-Calgary. This analysis provides valuable input parameters towards future basin modeling at the School of Earth and Ocean Sciences, University of Victoria.
7
50N
51N
52N
53N
54N
0 50 100
km
133W 132W 131W 130W 129W 128W 127W
Figure 3. Map of Queen Charlotte Basin with regions of the Queen Charlotte Islands (red box, see also Figure 4) and north Vancouver Island (black box, see also Figure 11) covered by sampling campaigns in 2004. Red dots mark offshore, black dots mark onshore wells.
8

Masset
Queen CharlotteCity Sandspitt
53 00'N
53 30'N
54 00'N
0 50
km
133 00'W 132 30'W 132 00'W 131 30'W
Figure 4. Sampling locations for Rock Eval 6 analysis on the Queen Charlotte islands. Inset shows relief map of sampling locations (Google Earth).
9

Figure 5. 3D view looking north of Queen Charlotte sampling locations (Google Earth).
10

Figure 6. Sandilands Fm. (QCI 1-5) in Flagstone
Quarry (south central Graham Island).
Figure 7. Peril Fm. (QCI 1-3) in
Shields Bay (south western Graham Island).
Figure 8. Fannin Fm. (QCI 1-6) in Fannin Formation Quarry (south central Graham Island).
11

Figure 9. Sandilands Fm. (QCI 2-1) at beach on south
Sandilands Island.
Figure 10. Peril Fm.(QCI 4-4) at
shoreline on south Maude Island.
12

Table 2. North Vancouver Island sampling locations. Samples marked in bold were analyzed using Rock Eval 6.
Location Formation Sample UTM (zone 09N) Figure NVI-1 625350E 5577745N
NVI-2 625370E 5577740N
NVI-3 625380E 5577735N
NVI-4 625397E 5577730N Figure 13NVI-5 625422E 5577726N
NVI-6 625478E 5577714N
NVI-7 625495E 5577700N
NVI-8 625500E 5577695N
NVI-9 625507E 5577692N
NVI-10 625350E 5577745N Figure 14NVI-11 625350E 5577745N
NVI-12 625350E 5577745N
NVI-13 625350E 5577745N
NVI-14 625350E 5577745N
NVI-15 625350E 5577745N
NVI-16 625350E 5577745N
NVI-17 625350E 5577745N
NVI-18 625350E 5577745N
NVI-19 625350E 5577745N
NVI-20 625350E 5577745N
NVI-21 625350E 5577745N
NVI-22 625350E 5577745N
Rai
nier
Cre
ek
Pars
on B
ay (e
quiv
alen
t to
Peri
l Fm
.)
NVI-23 625350E 5577745N
HI-1 664192E 5606344N Figure 15HI-2 664256E 5606320N Figure 16HI-3 664732E 5606187N Figure 17
Harbledown Island
Harbledown (equivalent to
Ghost Creek Fm.)HI-4 665225E 5606266N
PI-1 664466E 5605320N Figure 18PI-2 664560E 5604932N
PI-3 664600E 5604936N
PI-4 664643E 5604940N
PI-5 664653E 5604940N
Parson Island
Parson Bay (equivalent to
Peril Fm.)
PI-6 664858E 5604898N Figure 19
SI-1 661192E 5608608N
SI-2 661192E 5608608N
SI-3 661192E 5608608N Swanson
Island
Parson Bay (equivalent to
Peril Fm.) SI-4 661192E 5608608N
13

128 30'W 128 00'W 127 30'W 127 00'W 126 30'W
50 00'N
50 30'N
51 00'N0 50km
Port McNeill
Port Hardy
Figure 11. North Vancouver island sampling locations for Rock Eval 6 analysis. Inset shows
relief map of sampling locations (Google Earth). sample locations. Figure 12 shows a more detailed representation of Harbledown, Parson, and Swanson Island sampling locations in a 3D view.
14

Figure 12. 3D view looking north over Parson (foreground), Harbledown(middle), and Swanson
Island (upper left) sampling locations (Google Earth).
15

Figure 13. Parson Bay Fm. (NVI-4) at
Rainier Creek (central northern Vancouver Island).
Figure 15. Harbledown Fm. (HI-1) on south shore of north west Harbledown Island.
Figure 14. Parson Bay Fm. (NVI-10) at
Rainier Creek (central northern Vancouver Island).
Figure 16. Harbledown Fm. (HI-2) on south shore of north west Harbledown Island
16

Figure 18. Parson Bay Fm. (PI-1) on north
shore of Parson Island.
Figure 17. Harbledown Fm. (HI-31) on south shore of north west Harbledown Island.
Figure 19. Parson Bay Fm. (PI-6) on north shore of Parson Island.Results of the analytical work.
17
Rock-Eval/TOC analysis was contracted to by GSC Calgary. It provides fast and reliable characterization of the quantity and quality of sedimentary organic matter, as well as its thermal maturity.
Method
A typical Rock-Eval experiment is initiated with heating of a pulverized rock sample at 300ºC for 3 min in helium atmosphere, when naturally occurring hydrocarbons (free and adsorbed) are volatilized.During the next stage, the oven temperature is steadily increased to 600ºC at a rate of 25ºC/min and decomposition of kerogen occurs. The final stage involves oxidation and combustion of the residual organic matter at 600ºC.
The amount of hydrocarbons volatilized at 300ºC and evolved from kerogen at 300ºC to 600ºC is quantitatively determined by a flame ionization detector, and recorded as the S1 and S2 peaks, respectively. The temperature measured at the maximum of the S2 peak is referred to as Tmax. The quantity of organic CO2 generated from 300ºC to 390ºC, determined by a thermal conductivity detector, comprises the S3 peak. The percentage of carbon in CO2 formed during oxidation at 600ºC and in the hydrocarbon peaks S1 and S2 is used to define the total organic carbon content (TOC), expressed as a weight percentage.
The determination of the quality of organic matter is based upon the calculation of Hydrogen (HI) and Oxygen (OI) indices (HI=S2/TOCx100, OI=S3/TOCx100) which are related to the atomic H/C and O/C ratios (Espitalie et al., 1977). The OI versus HI cross plots ("pseudo van Krevelen diagrams") can be used as an organic matter type indicator at low and moderate maturities.
The Tmax is an indicator of relative thermal maturity. According to Espitalie et al. (1985) the oil window is defined by the following Tmax ranges: 440º-448ºC (Type I), 430º-455ºC (Type II) and 430º-470ºC (Type III). A cross plot of Tmax versus HI is used to constrain estimations of organic matter type and its thermal maturity, while the Production Index PI=S1/[S1+S2]) is used to indicate staining of a sample or as an additional maturity parameter.
Data
Although high, maturation level at the locations visited on the QCI allowed to analyze source rocks spanning the Peril to the Whiteaves Fm. (Norian – Pliensbachian, see also Figure 1). Maturation of samples derived form North Vancouver Island locations were generally too high (hornfels facies) to reveal valuable Rock Eval analysis and only two samples from the Rainier Creek location (Parson Bay Fm.) were analysed. Due to the high maturation level only one source rock sample was chosen for multi component kinetic analysis (Sandilands Fm., QCI 1-5)
18

Table 4 in the appendix shows the results of the Rock Eval 6 analysis. Tmax values vary between 297 and 486°C, PI between 0.09 and 0.67, and TOC between 0.40 and 4.33wt% for the QCI samples. HI and OI are recorded to lie between 3 - 396 and 5 - 40, respectively. Note: Parson Bay Fm. Samples from Rainier Creek seem unrealistic, most likely due to weathering and / or high maturation.
Figure 20 shows the classification of the investigated source rocks according to type of kerogen and maturation level using a pseudo van Krevelen diagram. Sandilands and Fannin Fm. source rocks mainly contain type I/II kerogen, while type III kerogen seems to outweigh in Peril and Ghost Creek sources, which generally confirms findings by Macauley (1983) and Snodwon etal. (2002) presented in Figure 2. Low values for OI confirm the generally high maturation level.
0
100
200
300
400
500
600
700
800
0 20 40 60 80 100 120 140 160 180
900
PerilSandilandsGhost CreekFanninWhiteheaves
Rainier Creek
Type I
Type II
Type III
Oxygen Index
Hyd
roge
n In
dex
TOC: 2.85Tmax: 326
TOC: 1.60Tmax: 401
TOC: 1.10Tmax: 486
TOC: 4.34Tmax: 437
TOC: 0.40Tmax: 297
TOC: 0.59Tmax: 427
TOC: 1.32Tmax: 485
Figure 20. Pseudo van Krevelen diagram for investigated Queen Charlotte Island
samples. (Note: Characterization of Rainier Creek (Parson Bay Fm.) samples from North Vancouver Island is impossible, due to heavy weathering and / or high levels of maturation,, which inhibits correct Rock Eval measurements.)
19

oil window definition(Espitalite, 1986)
Type I
Type II
Type III
PerilSandilandsGhost CreekFanninWhiteheaves
Type I
Type II
Type III
0
100
200
300
400
500
600
700
800
280 300 320 340 360 380 400 420 440 460 480 500
Ro=0.5%
Ro=1.35%
Tmax
Hyd
roge
n In
dex
900
TOC: 1.32Tmax: 485
TOC: 0.59Tmax: 427
TOC: 0.40Tmax: 297
TOC: 1.10Tmax: 486
TOC: 4.34Tmax: 437
TOC: 2.85Tmax: 326
TOC: 1.60Tmax: 401
Figure 21. HI versus Tmax diagram of QCI samples. Sandilands and Fannin Fm.
samples show type II kerogen characteristics, whereas Peril and Ghost Creek Fm. samples resemble type III kerogen. Oil window definition for different kerogen types according to Espitalité (1986) is represented by gray shaded areas. Stippled lines represent iso-maturity levels.
Figure 21 shows the classification of the investigated source rocks according to type of kerogen and maturation level using a Hydrogen Index versus Tmax temperature diagram. Sandilands and Fannin Fm. source rocks repesent type II kerogen evolution. As already seen in Figure 20 Peril and Ghost Creek source rocks are mainly comprised of type III kerogen. Stippled lines represent iso-maturation levels of 0.5 and 1.35%Ro. Definition of oil window dependant on type of kerogen according to Espitalité (1986) is given.
Due to the limited quality or high stages of maturation only sample (QCI 1-5) showing lower maturation levels (Tmax: 437°C) combined with high oranic content (TOC: 4.34wt%) was further investigated to establish multi-component kinetics for hydrocarbon maturation (Table 3 and Figure 22).
The multi-component analysis reveals similarities to the type II kerogen used in Whiticar etal. (2003, 2004). However, due to maturation level the profile only reveals the remaining reactions to higher activation energies (Figure 22).
20

Table 3. Multicomponent kinetics of sample QCI 1-5 (Sandilands Fm.). Activation Energy
[ cal / mol ] 44 46 48 50 52 54 56 58 60 62 64
Percent 0.02 0.14 0.20 0.00 0.00 68.83 22.15 8.00 0.85 0.43 0.00
0
10
20
30
40
44 46 48 50 52 54 56 58 60 62 64 66 68 70 72 74
Type III
0
10
20
30
40
50
44 46 48 50 52 54 56 58 60 62 64 66 68 70 72 74
Type II
0
10
20
30
40
50
60
70
44 46 48 50 52 54 56 58 60 62 64 66 68 70 72 74
Sandilands
Figure 22. Comparison of kinetic characteristics of investigated Sandilands kerogen (top panel) and Type II and Type III kerogens used in previous basin modeling (Whiticar etal, 2003 & 2004). Sandilands organics as measured here resemble a matured type II kerogen.
21

Implications for basin modeling
Multicomponent kinetic analysis of the available kerogen enable more precise calculations of amount and quality of generated hydrocarbon and time of generation as well as behavior during migration. For prediction of hydrocarbon accumulation such information is essential.
Analysis of Mesozoic source rocks presented here, confirm the choice of kerogen employed during previous petroleum systems modeling of the Queen Charlotte Basin area (Whiticar etal., 2003, 2004). Due to maturation levels of Mesozoic source rocks outcropping on the Queen Charlotte Islands and Vancouver Island an exact determination of the kinetic behavior during lower stages of maturation could not easily be determined and follow up work on less mature samples would be desirable, if such samples became available.
Outlook
Apart from oil prone Mesozoic (type I/II) gas prone Tertiary (type III) source rocks are reported from the Skonun Formation in the Queen Charlotte Basin area. To better define potential gas plays in the Queen Charlotte area multi-component kinetic analysis of Skonun source rocks should be undertaken. Petroleum systems modeling so far has employed literature values for these gas-prone type III kerogens. With respect to the known high variability of various type III kerogen establishing a kinetic profile specifically tailored to the Queen Charlotte Basin seems essential to any future petroleum systems modeling work addressing potential gas plays in the area.
22

References
Bustin, R.M. and Mastalerz, M. (1995). Organic petrology and geochemistry of organic-rich rocks of the Late Triassic and Early Jurassic Sandilands and Ghost Creek Formations, Queen Charlotte Islands, British Columbia. Marine and Petroleum Geology, v. 12, p. 70-81.
Bustin, R. M. (1997). Petroleum source rocks, organic maturation and thermal history of the Queen Charlotte Basin, British Columbia. Bulletin of Canadian Petroleum Geology 45(3), p. 255-278.
Cameron, B.E.B. and Tipper, H.W. (1985): Jurassic stratigraphy of the Queen Charlotte Islands, Queen Charlotte Islands, British Columbia. Geological Survey of Canada. Bulletin, 365, 49pp.
Dietrich, J. R. (1995). Petroleum resource potential of the Queen Charlotte Basin and environs, west coast Canada. Bulletin of Canadian Petroleum Geology, v. 43(1), p. 20-34.
Espitalité, J. (1986). Use of Tmax as a maturation index for different types of organic matter. Comparison with vitrinite reflectance. In: Thermal modeling in sedimentary basins. (edited by J. Burrus), vol. 44. Ed. Technip, 475-496.
Fowler, M.G., Snowdon, L.R., Brooks, P.W., and Hamilton, T.S. (1988). Biomarker characterization and hydrous pyrolysis of bitumen from Tertiary volcanics, Queen Charlotte Islands, British Columbia. Organic Geochemistry, v. 13, p. 715-725.
Haggart etal (2005)
Hamilton, T. S., and Cameron, B.E.B. (1989). Hydrocarbon occurrences on the Western Margin of the Queen Charlotte Basin. Bulletin of Canadian Petroleum Geology, v. 37(4), p. 443-466.
Hickson, C. J. (1992). The Masset formation on Graham Island, Queen Charlotte Islands, British Columbia. In: Evolution and Hydrocarbon Potential of the Queen Charlotte Basin, British Columbia. G.J. Woodsworth (ed.). Geological Survey of Canada, Paper 90-10, p. 305-324.
Hyndman, R.D. and Hamilton, T.S. (1991). Cenozoic relative plate motions along the northeastern Pacific Margin and their association with Queen Charlotte area tectonics and volcanism. In Evolution and Hydrocarbon Potential of the Queen Charlotte Basin, British Columbia, Geological Survey of Canada, Paper 90-10, p. 107-126.
Macauley, G. (1983). Source Rock - Oil Shale Potential of the Jurassic Kunga Formation, Queen Charlotte Islands. Geological Survey of Canada Open File 921: 52 p.
Snowdon, L.R., Fowler, M.G., and Hamilton, T.S. (1988). Sources and seeps: organic geochemical results from the Queen Charlotte Islands. In: Some Aspects of the Petroleum Geology of the Queen Charlotte Islands. Canadian Society of Petroleum Geologists, Field Trip Guide, p. 37-43.
23

Snowdon, L.R., Fowler, K.G., Osadetz, K.G., and Obermajer, M. (2002). Organic geochemical sources and shows in the Queen Charlotte Basin and adjacent areas of the pacific margin of Canada. Geological Survey of Canada Open File 4367.
Tipper, H.W. (1977). Jurassic studies in Queen Charlotte Islands, Harbledown Island, and Taseko Lakes area, British Columbia. In: Report of activities, Part A; Geol. Surv. Can., Paper 77-1A.
Thompson, R.I., Haggart, J.W., and Lewis, P.D. (1991). Late Triassic through early Tertiary evolution of the Queen Charlotte Basin, British Columbia. In: Evolution and Hydrocarbon Potential of the Queen Charlotte Basin, British Columbia. G.J. Woodsworth (ed.). Geological Survey of Canada, Paper 90-10, p. 3-29.
Vellutini, D. and Bustin, R.M. (1991) Source rock potential of Mesozoic and Tertiary strata of the Queen Charlotte Islands. In: Evolution and Hydrocarbon Potential of the Queen Charlotte Basin, British Columbia. G.J. Woodsworth (ed.). Geological Survey of Canada, Paper 90-10, p. 381-409.
Whiticar, M.J., Schuemann, T. Niemann, M., Rohr, K., Johns, M. 2003. Delineation of Prospective Sectors in Hecate Strait with Offshore Petroleum Potential - Phase I Report - Broad-Scale Basin Regionalization. For Offshore Oil and Gas Branch Ministry of Energy and Mines, Government of British Columbia, June 25, 2003, 132 p.
Whiticar, M.J., Schuemann, T. Niemann, M., Rohr, K., 2004. Delineation of Prospective Sectors in Hecate Strait with Offshore Petroleum Potential - Phase II Report - 2D Petroleum System Modeling Broad. For Offshore Oil and Gas Branch Ministry of Energy and Mines, Government of British Columbia, March 02, 2004, 123 p.
Woodsworth, G.J. (1988). Karmutsen formation and the east boundary of Wrangellia, Queen Charlotte Basin, British Columbia. In: Current Research Part E, Geological Survey of Canada, Paper 88-1E, p. 209-212.
24

Appendix
Table 4. Rock Eval 6 data for Queen Charlotte Islands (QCI) and North Vancouver Island (NVI) samples. (Note unrealistic S1, S2, and S3 values for NVI samples. Most likely due to either overmaturation or heavy weathering of samples. These samples do therefore plot not correctly in the modified van Krevelen diagram, see Figure 20).
Queen Charlotte Islands Sample Formation Qty S1 S2 S'2 PI S3CO2 Tmax Tpeak S3CO PC(%) TOC RC% HI OICO OICO2 OIRE6 MINC% S4CO S4CO2 RCCO(%) S4CO2 S5aCO2 S5bCO2 KFID RCCO2(%)QCI 1-3 70.0 0.06 0.09 0.00 0.41 0.62 326 366 0.01 0.01 2.58 2.57 3 0 24 17 2.1 13.3 73.3 0.570 72.8 18.7 52.3 1520.275 2.00QCI 4-4
Peril 71.0 0.11 0.51 0.01 0.18 0.69 401 441 0.19 0.06 1.60 1.54 33 12 43 38 0.5 11.3 38.6 0.484 36.9 3.0 13.2 1520.275 1.05
QCI 1-5 69.8 1.64 17.16 0.04 0.09 0.23 437 477 0.15 1.57 4.34 2.77 396 3 5 5 2.0 14.3 78.9 0.613 71.9 15.0 54.2 1382.449 2.15QCI 2-1
Sandilands 70.8 0.18 0.48 0.01 0.27 0.18 486 526 0.15 0.06 1.10 1.04 45 14 16 20 0.1 7.5 26.5 0.321 25.3 0.8 0.7 1520.275 0.72
QCI 1-8 Ghost Creek 70.9 0.35 0.17 0.00 0.67 0.17 297 337 0.06 0.05 0.40 0.35 43 15 43 40 0.7 1.7 10.2 0.073 9.6 8.2 16.4 1520.275 0.28QCI 1-6 Fannin 70.0 0.95 2.01 0.00 0.32 0.12 427 467 0.03 0.25 0.59 0.34 341 5 20 17 4.6 2.0 9.2 0.086 8.1 14.6 148.5 1520.275 0.25QCI 1-7 Whiteheaves 70.4 0.02 0.02 0.00 0.53 0.19 485 525 0.09 0.01 1.32 1.31 2 7 14 14 0.1 8.4 34.8 0.360 33.1 1.1 1.0 1520.275 0.95
North Vancouver Island Sample Formation Qty S1 S2 S'2 PI S3CO2 Tmax Tpeak S3CO PC(%) TOC RC% HI OICO OICO2 OIRE6 MINC% S4CO S4CO2 RCCO(%) S4CO2 S5aCO2 S5bCO2 KFID RCCO2(%)
NVI-4 70.3 0.00 0.00 0.00 0.00 0.15 607 647 0.02 0.00 4.33 4.33 0 0 3 2 4.5 30.3 111.0 1.299 110.4 12.0 143.3 1520.275 3.03NVI-10
Parson Bay 70.0 0.00 0.00 0.00 1.00 0.03 -40 0 0.01 0.00 1.80 1.80 0 1 2 2 0.0 12.5 46.5 0.536 46.2 0.2 0.2 1520.275 1.27
25