optimizing co2 sweep based on geochemical, and reservoir characterization of …...
TRANSCRIPT

Optimizing CO2 Sweep based on Geochemical, and Reservoir Characterization of the Residual
Oil Zone of Hess’s Seminole Unit Project Number: DE-FE0024375
Eric Potter Associate Director
Bureau of Economic Geology, University of Texas at Austin
U.S. Department of Energy National Energy Technology Laboratory
DE-FOA0001110 Kickoff Meeting December 4, 2014
2
Presentation Outline • Benefit to the Program • Project Overview: Goals and Objectives • Methodology • Expected Outcomes • Communication Plan • Task/Subtask Breakdown • Deliverables / Milestones / Decision Points • Risk Matrix • Proposed Schedule • Summary

3
Benefit to the Program
• Supports DOE’s Programmatic goal No. 2, to “Develop technologies to improve reservoir storage efficiency while ensuring containment effectiveness”.

4
Project Overview: Goals and Objectives
Project objective: “To improve the understanding of how much CO2 can be stored in residual oil zones (ROZ) given current practice and how much this could be increased, by using strategies to increase sweep efficiency”. These same strategies will increase the efficiency of oil production.

5
Project Overview: Goals and Objectives
Other objectives include improving understanding of: (1) stratigraphic faces variations,
(2) the impact of diagenesis on the ROZ,
(3) the variation fluid and oil chemistry within the
reservoir (4) The impact reaction transfer in the ROZ on
multi-phase fluid flow.

6
Project Overview: Goals and Objectives
Melzer and Trentham refer to the Seminole Unit as… “The Gold Standard for ROZ fields” Our project sets out to create a detailed model for the reservoir character, geochemistry, fluid flow properties etc. of the reservoir

7
Project Overview: Goals and Objectives
ARI have estimated that on the order of 12 billion barrels of oil could be extracted from ROZ in the Permian Basin of Texas alone…. Assuming 2.5 barrels of oil for each metric ton of CO2 stored this will result in: 4.8 billion metric tons of CO2 stored….

Methodology
• Only through a better understanding of the nature of ROZ reservoirs can we make accurate estimate of the CO2 storage potential. A detailed reservoir characterization of the largest producing ROZ, Hess’s Seminole San Andres Unit is proposed.
• To support the reservoir simulation modelling to investigate sweep efficiency (and hence CO2 storage) in the ROZ
8
GEOLOGY of SEMINOLE UNIT
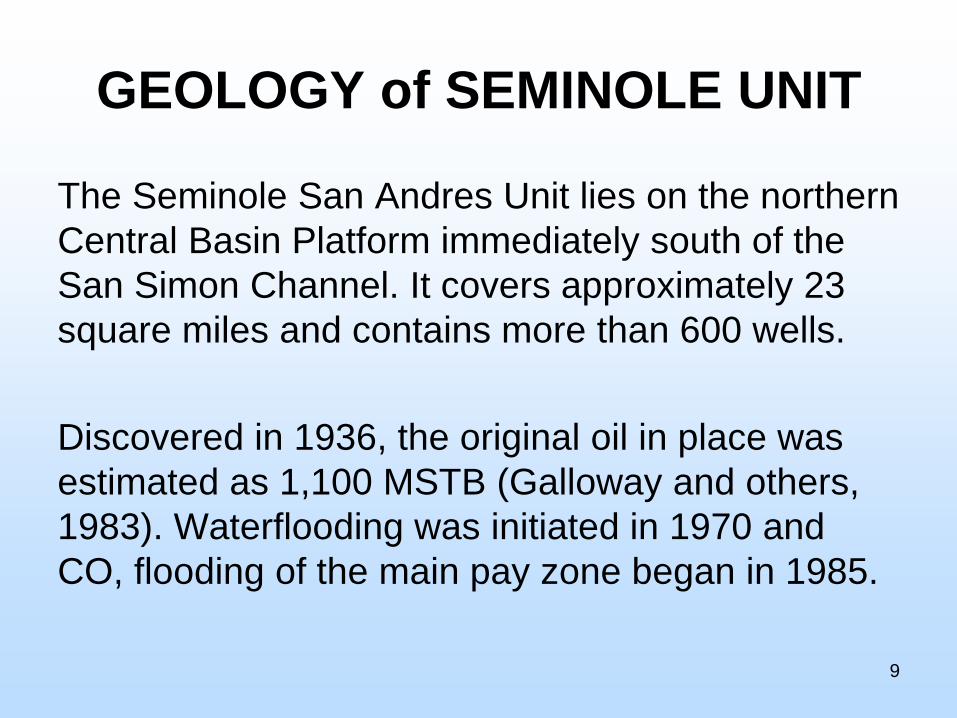
The Seminole San Andres Unit lies on the northern Central Basin Platform immediately south of the San Simon Channel. It covers approximately 23 square miles and contains more than 600 wells. Discovered in 1936, the original oil in place was estimated as 1,100 MSTB (Galloway and others, 1983). Waterflooding was initiated in 1970 and CO, flooding of the main pay zone began in 1985.
9

10 From: Koperna (2006)

GEOLOGY of SEMINOLE UNIT
Seismic and geological analysis show that Seminole a carbonate ramp reservoir, one of several isolated platforms built during the lower San Andres and became linked with the rest of the platform during progradation of the upper San Andres sequence. The lower 750 ft. of the San Andres contains skeletal grainstone and packstone and an open-marine fauna. The highstand systems tract is represented by (1) 300 ft. of fusulinid wackestones and packstones, and (2) 150 ft. of upward-shallowing, peloidal, shallow subtidal to peritidal cycles. The upper 350 ft. of the San Andres at Seminole is largely anhydritic peritidal deposits. 11

From Hess Unpublished
data 12
13

Sloping Oil/Water Contact Seminole Field
14

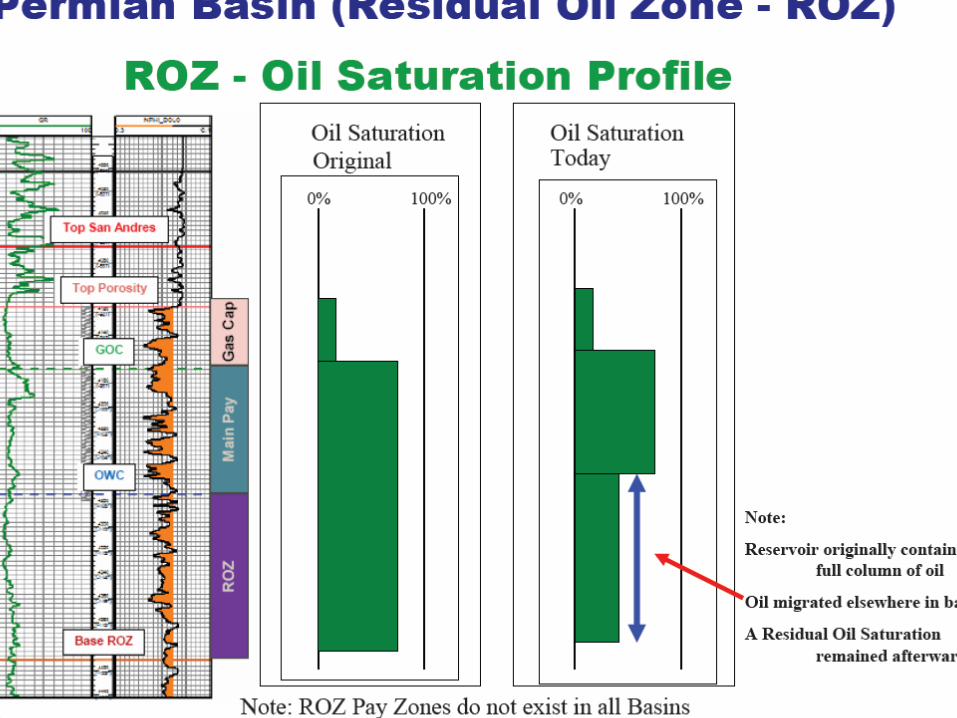
Seminole Main Pay Zone versus ROZ
15

Water flooded Main Pay 20 to 40% So
Brine reservoir fluids Enhanced high perm streaks Mixed wettability Residual Oil Zone 20 to 40% So
Sulfur water – lower TDS Potentially more homogeneous Wettability uncertain Modified from: Trentham (2011)

17

18

Estimating Ancillary Storage CO2
• For traditional WAG based CO2-EOR, one metric ton of CO2 stored for every 2.5 barrels oil recovered
• If the Seminole ROZ ultimately produces 200 to 300 million barrels of oil, then estimated CO2 storage would be:
80 to 120 million metric tons.
19

Expected Outcomes
There is currently no detailed, publicly- available geologic description of a ROZ… this project will supply a detailed characterization. There is currently no detailed multi-phase, fluid flow modelling to evaluate the nature of CO2 storage in Permian Basin ROZs.
20
Expected Outcomes
• Include expected outcomes and results of the project.
• Include the ‘products’ of the project (i.e. new technique, data, new modeling tools, etc.)
• Be specific and include discussion of how this project furthers the overall body of work within the research community.
21

Expected Outcomes
Products from the Project 1) Digital static reservoir model 2) Evaluation of different injection geometries on
optimizing CO2 sweep 3) Evaluation of different CO2 injection strategies
such as WAG, continuous CO2 injection etc. on optimizing CO2 sweep
4) Evaluation of the chemistry of oils and reservoir fluids from ROZ as possible tracers of fluid flow.
22

23
Organization Chart
Project Director
Ian Duncan
Task 1 Management
Task 2 through 6
Task Leader/Back-up Duncan/Ambrose
Task Leader/Back-up Duncan/Loucks/Ambrose

24
Communication Plan
The PI and the project team will communicate with DOE/NETL project manager on an ongoing basis on all aspects of the project. Quarterly Progress Reports will include the status of project milestones. Quarterly reports will include: (1) the actual status and progress of the project; (2) progress made on project’s milestones; and (3) any proposed changes in the project’s schedule required to complete milestones.

25
Communication Plan
We will have at least monthly communications with Hess either by phone or face-to-face. We will communicate with other stakeholders through presentations at SPE meetings and the annual CO2 Conference in Midland. We will also post talks, reports and papers generated by the project on our web site.

Task/Subtask Breakdown
26
Task 1.0 – Project Management and Planning Task 2 – Detailed Site Characterization of the San Andres Seminole Unit detailed site characterization of the San Andreas Seminole Unit including geological core logging, improved interpretation of wireline logs, analyses of oil geochemistry, analyses of diagenetic changes, analyses of formation brines for geochemical and microbiological activity/impacts. Subtask 2.1 – Geological Core Logging Subtask 2.2 -- Improved Interpretation of Wireline Logs Subtask 2.3 – Characterization of Oil Geochemistry of Hydrocarbons in ROZ Subtask 2.4 – Diagenetic Characterization of ROZ Subtask 2.5 – Geochemical and Microbiological Characterization of In-Situ Brine Fluids in ROZ

Task/Subtask Breakdown
27
Task 3- 3D static reservoir model: utilizing characterization data gathered in Task 2 to create a detailed three dimensional stratigraphic and porosity-permeability model of the ROZ volume Task 4 – Fluid Flow Reservoir Simulations of CO2 mobility controls: Use the static reservoir model to perform numerical simulations of CO2 injection, using commercial software to model increased oil production due to the injection of CO2, and the pattern of CO2 storage in the reservoir. Subtask 4.1 Simulation of wellbore configuration on CO2 mobility controls: Subtask 4.2 Simulations of Operational CO2 Mobility Controls: Task 5– Reaction Transfer Simulations

Deliverables / Milestones
28
Task 1 Deliverable 1: Project Management Plan (PMP) (Year 1 Q1) Task 1 Deliverable 2: Data Submitted to NETL-EDX. Will include:1) various datasets and files as appropriate, 2) metadata, 3) software/tools, and 4) articles (Year 3 Q4) Task 2 Deliverable 3: Core Logging Summary Report (Year 1 end Q3) Task 3 Deliverable 4: Draft reservoir model paper (Year 2 end Q1)
Deliverables / Milestones
29
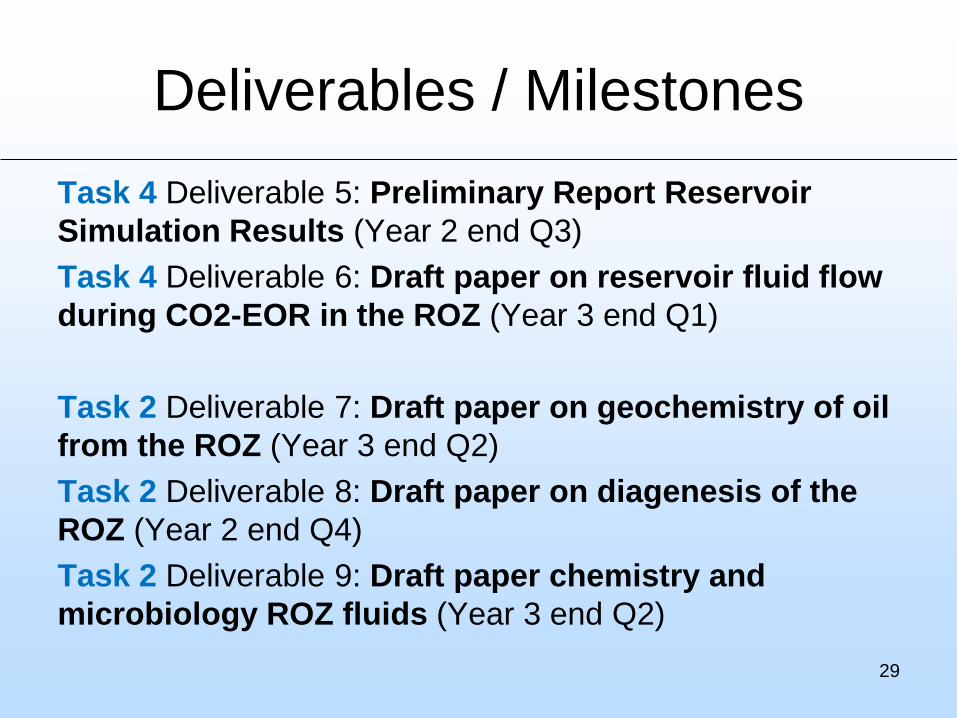
Task 4 Deliverable 5: Preliminary Report Reservoir Simulation Results (Year 2 end Q3) Task 4 Deliverable 6: Draft paper on reservoir fluid flow during CO2-EOR in the ROZ (Year 3 end Q1) Task 2 Deliverable 7: Draft paper on geochemistry of oil from the ROZ (Year 3 end Q2) Task 2 Deliverable 8: Draft paper on diagenesis of the ROZ (Year 2 end Q4) Task 2 Deliverable 9: Draft paper chemistry and microbiology ROZ fluids (Year 3 end Q2)

Deliverables / Milestones / Decision Points
30
Task 5 Deliverable 10: Draft paper on reaction transfer within the ROZ (Year 3 end Q3) Task 2 Deliverable 11: Draft paper improved wireline log interpretation of the ROZ (Year 2, end Q2) Task 6 Deliverable 12: At least 4 preliminary recommendations to improve sweep efficiency made to industry partner (Year 2 Q4) Task 6 Deliverable 13: Draft paper on sweep efficiency and controls over CO2 storage in the ROZ (Year 3,Q4)

Risk Matrix
31
Risk (1): Possible Failure to complete the static reservoir model in time for fluid flow simulation- We believe that this is a very low risk because of our Teams extensive experience in core logging and creating reservoir models. If this happened our risk mitigation plan is to add some more STARR research geologists to the task to get this done. Risk (2): Possible failure to focus project resources on the tasks that require the most attention- We will proactively manage this risk through our monthly project meetings. Risk (3): Possible Loss of PI- If the PI (Duncan) becomes unavailable then Ambrose and Loucks could readily take over as PI’s of the project.

Risk Matrix
32
Risk (4) Breakdown of the cooperative Agreement with Hess to allow us access to core and reservoir data- We judge this risk to be low. We are confident that we could get one of several other operating large San Andres ROZ-CO2 injections. Risk (5) Numerical Fluid Flow Modeling will not prove useful in investigating CO2 sweep- Our risk management strategy would be to access help and advice of the very talented and experienced modeling groups on our campus. Risk (6) Failure to adequately communicate results to stakeholders and to do effective outreach- A major problem with some research projects is that the results do not get effectively communicated to the stakeholders. We have a strong communications plan based on targeted presentations at venues attended by industry.

33
Proposed Schedule
Shown in next slide

34
Yr1 Q1 Yr1 Q2 Yr1 Q3 Yr1 Q4 Yr2 Q1 Yr2 Q2 Yr2 Q3 Yr2 Q4 Yr3 Q1 Yr3 Q2 Yr3 Q3
Yr3 Q4
2 X X X X X X X X X X D7 X
2.1 x x X D3 x x x x x
2.2 x x x x X D11 x x
2.3 x x x x x x x 2.4 x x x x X D8
2.5 x x x x x x X D9
3 X X X X D4
4 X X X X X X D5 X X D6 X X
4.1 x x x 4.2 x x x x x 5 X X X X X X X X X X
D10
6
X X X
D12
X X X X
D13

Summary
• First detailed characterization of a ROZ
• Application of oil chemistry and fluid chemistry as tracers of fluid movement
• Optimization of CO2 sweep for a ROZ based on detailed reservoir model 35

Thanks!
36

Appendix: Funding Tables
37

38
Federal Project Costs (Only DOE Costs)
(Fill in Budget Period Spaces Below will Automatically Populate Total Federal Project Costs)Category Task No. 1.0 Task No. 2.0 Task No. 3.0 Task No. 4.0 Task No. 5.0 Task No. 6.0 Total
Personnel $13,673.69 $207,326.92 $145,329.85 $147,082.40 $44,578.75 $86,933.75 $644,925.35
Fringe Benefits $3,965.37 $60,124.81 $42,145.66 $42,653.90 $12,927.84 $25,210.79 $187,028.35
Travel $35,183.00 $0.00 $0.00 $0.00 $0.00 $10,409.00 $45,592.00
Supplies $500.00 $30,744.08 $0.00 $0.00 $0.00 $0.00 $31,244.08
Other $291.00 $9,290.40 $6,925.20 $7,371.60 $1,882.80 $3,999.00 $29,760.00
Total Direct Charges $53,613.05 $307,486.21 $194,400.70 $197,107.90 $59,389.39 $126,552.53 $938,549.78
Indirect Charges $29,487.18 $169,117.41 $106,920.39 $108,409.35 $32,664.16 $69,603.89 $516,202.38
TOTAL AWARD BUDGET $83,100.23 $476,603.62 $301,321.09 $305,517.25 $92,053.55 $196,156.42 $1,454,752.16
TOTAL ESTIMATED PROJECT COST $83,100.23 $476,603.62 $301,321.09 $305,517.25 $92,053.55 $196,156.42 $1,454,752.16

39
Budget Period 1 CostsCategory Task No. 1.0 Task No. 2.0 Task No. 3.0 Task No. 4.0 Task No. 5.0 Task No. 6.0 Total
Personnel $8,491.32 $153,731.08 $101,689.30 $101,932.92 $20,475.40 $27,531.67 $413,851.68
Fringe Benefits $2,462.48 $44,582.01 $29,489.90 $29,560.55 $5,937.86 $7,984.18 $120,016.99
Travel $35,183.00 $0.00 $0.00 $0.00 $0.00 $0.00 $35,183.00
Supplies $0.00 $30,744.08 $0.00 $0.00 $0.00 $0.00 $30,744.08
Other $184.80 $7,069.20 $4,914.00 $5,224.20 $890.40 $1,265.40 $19,548.00
Total Direct Charges $46,321.60 $236,126.38 $136,093.20 $136,717.67 $27,303.66 $36,781.25 $619,343.75
Indirect Charges $25,476.88 $129,869.51 $74,851.26 $75,194.72 $15,017.01 $20,229.69 $340,639.06
TOTAL AWARD BUDGET $71,798.48 $365,995.88 $210,944.46 $211,912.38 $42,320.67 $57,010.93 $959,982.81
TOTAL ESTIMATED PROJECT COST $71,798.48 $365,995.88 $210,944.46 $211,912.38 $42,320.67 $57,010.93 $959,982.81
40
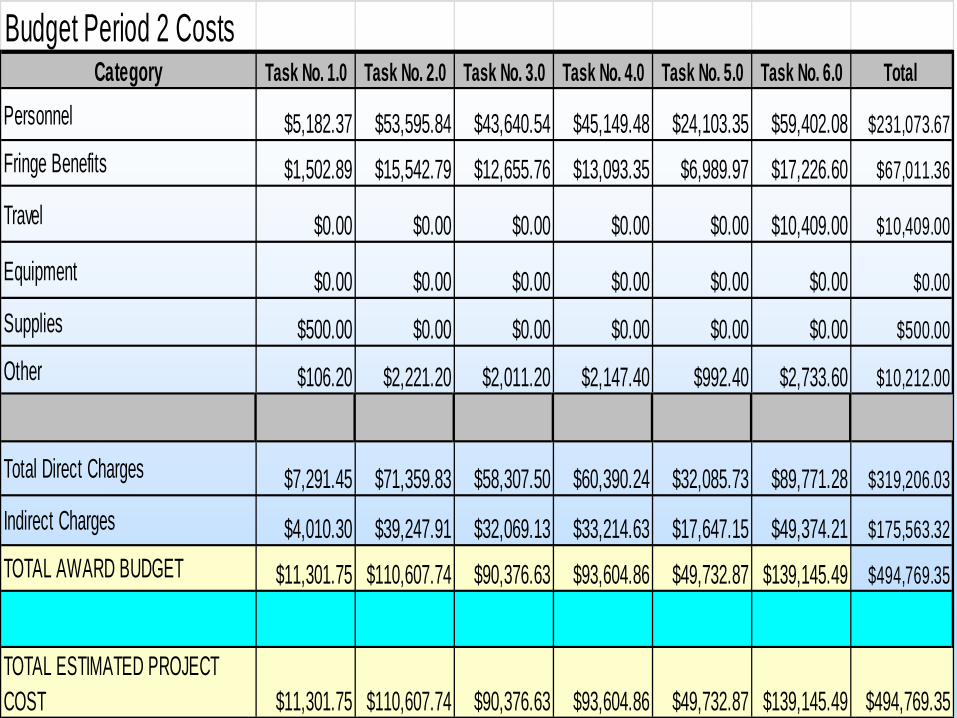
Budget Period 2 CostsCategory Task No. 1.0 Task No. 2.0 Task No. 3.0 Task No. 4.0 Task No. 5.0 Task No. 6.0 Total
Personnel $5,182.37 $53,595.84 $43,640.54 $45,149.48 $24,103.35 $59,402.08 $231,073.67Fringe Benefits $1,502.89 $15,542.79 $12,655.76 $13,093.35 $6,989.97 $17,226.60 $67,011.36
Travel $0.00 $0.00 $0.00 $0.00 $0.00 $10,409.00 $10,409.00
Equipment $0.00 $0.00 $0.00 $0.00 $0.00 $0.00 $0.00
Supplies $500.00 $0.00 $0.00 $0.00 $0.00 $0.00 $500.00
Other $106.20 $2,221.20 $2,011.20 $2,147.40 $992.40 $2,733.60 $10,212.00
Total Direct Charges $7,291.45 $71,359.83 $58,307.50 $60,390.24 $32,085.73 $89,771.28 $319,206.03
Indirect Charges $4,010.30 $39,247.91 $32,069.13 $33,214.63 $17,647.15 $49,374.21 $175,563.32TOTAL AWARD BUDGET $11,301.75 $110,607.74 $90,376.63 $93,604.86 $49,732.87 $139,145.49 $494,769.35
TOTAL ESTIMATED PROJECT COST $11,301.75 $110,607.74 $90,376.63 $93,604.86 $49,732.87 $139,145.49 $494,769.35

41
Cost Share Project Costs Only Cost Share Costs)
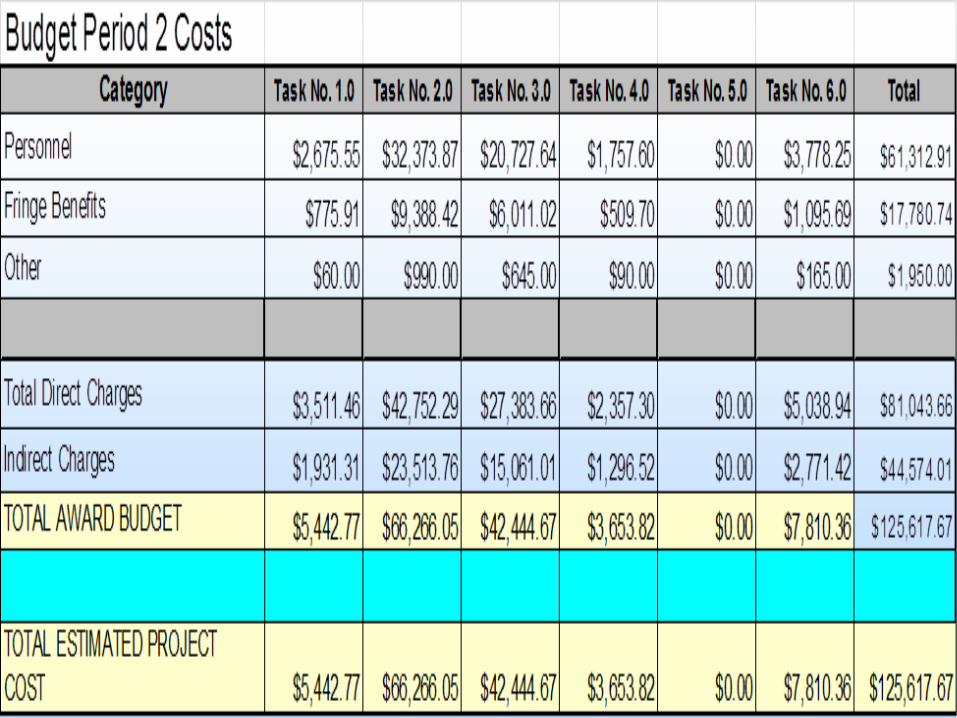
(Fill in Budget Period Spaces Below will Automatically Populate Total Cost Share Project Costs)Category Task No. 1.0 Task No. 2.0 Task No. 3.0 Task No. 4.0 Task No. 5.0 Task No. 6.0 Total
Personnel $10,195.60 $98,784.35 $58,761.31 $4,530.93 $0.00 $6,284.52 $178,556.71
Fringe Benefits $2,956.72 $28,647.46 $17,040.78 $1,313.97 $0.00 $1,822.51 $51,781.45
Other $240.00 $3,150.00 $1,800.00 $240.00 $0.00 $270.00 $5,700.00
Total Direct Charges $13,392.33 $130,581.81 $77,602.10 $6,084.90 $0.00 $8,377.03 $236,038.16
Indirect Charges $7,365.78 $71,820.00 $42,681.15 $3,346.69 $0.00 $4,607.37 $129,820.99
TOTAL AWARD BUDGET $20,758.11 $202,401.80 $120,283.25 $9,431.59 $0.00 $12,984.39 $365,859.14
TOTAL ESTIMATED PROJECT COST $20,758.11 $202,401.80 $120,283.25 $9,431.59 $0.00 $12,984.39 $365,859.14

42
43