fiban's business angel training "business angel returns" by robert wiltbank -...
TRANSCRIPT


-
10
20
30
40
50
60
<1X 1X to 5X 5X to 10X 10X to 30X >30X
Exit Multiple
Percent of Exits
Distribution of Returns by Venture Investment
Red Bars: U.K. % of exits in that Category
Blue bars: U.S. % of exits in that Category
UK: Overall Multiple: 2.2X
Holding Period: 3.6 years
US: Overall Multiple: 2.6X
Holding Period: 3.5 years
Approx 22% IRR
Approx 27% IRR
Hold: 3.0 yrs.
Hold: 3.3 yrs.
Hold: 4.6 yrs.
Hold: 4.9 yrs. Hold: 6.0+ yrs.
0
10
20
30
40
50
60
< 1X 1X to 5X 5X to 10X 10X to 30X > 30X
Exit Multiples
Percent of Total Exits
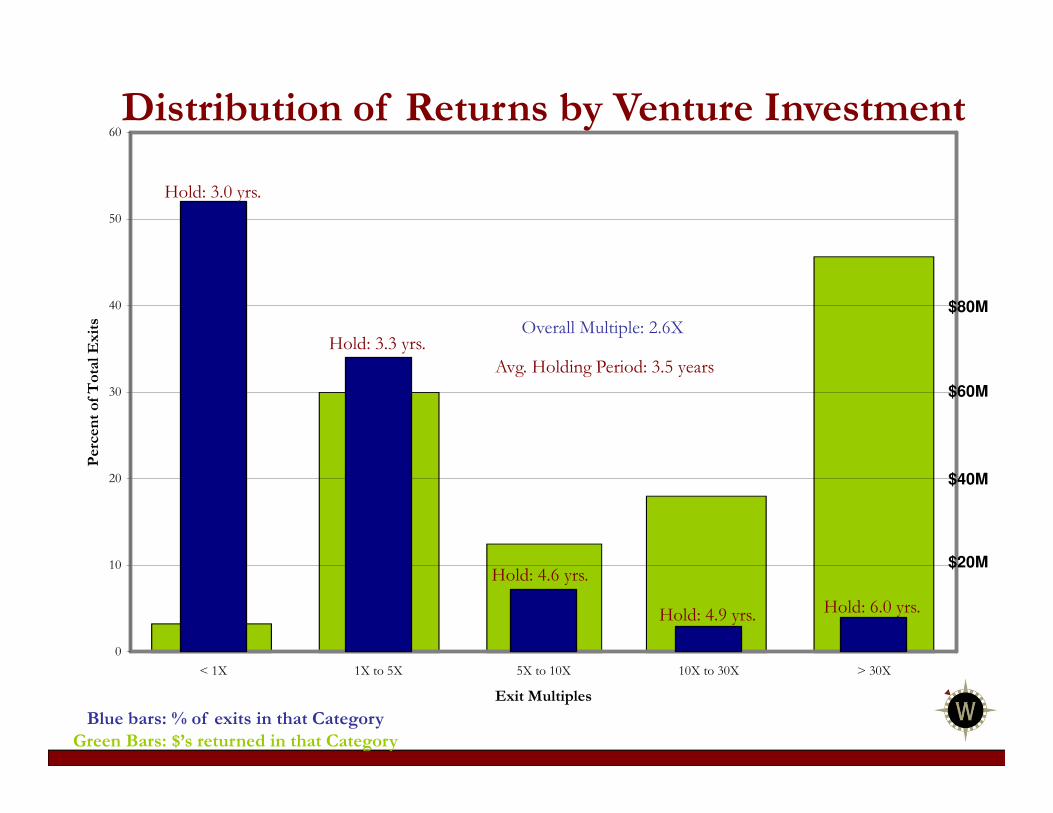
Distribution of Returns by Venture Investment
Overall Multiple: 2.6X
Avg. Holding Period: 3.5 years
$20M
$40M
$60M
$80M
Blue bars: % of exits in that Category
Green Bars: $’s returned in that Category
Hold: 3.0 yrs.
Hold: 3.3 yrs.
Hold: 4.6 yrs.
Hold: 4.9 yrs. Hold: 6.0 yrs.
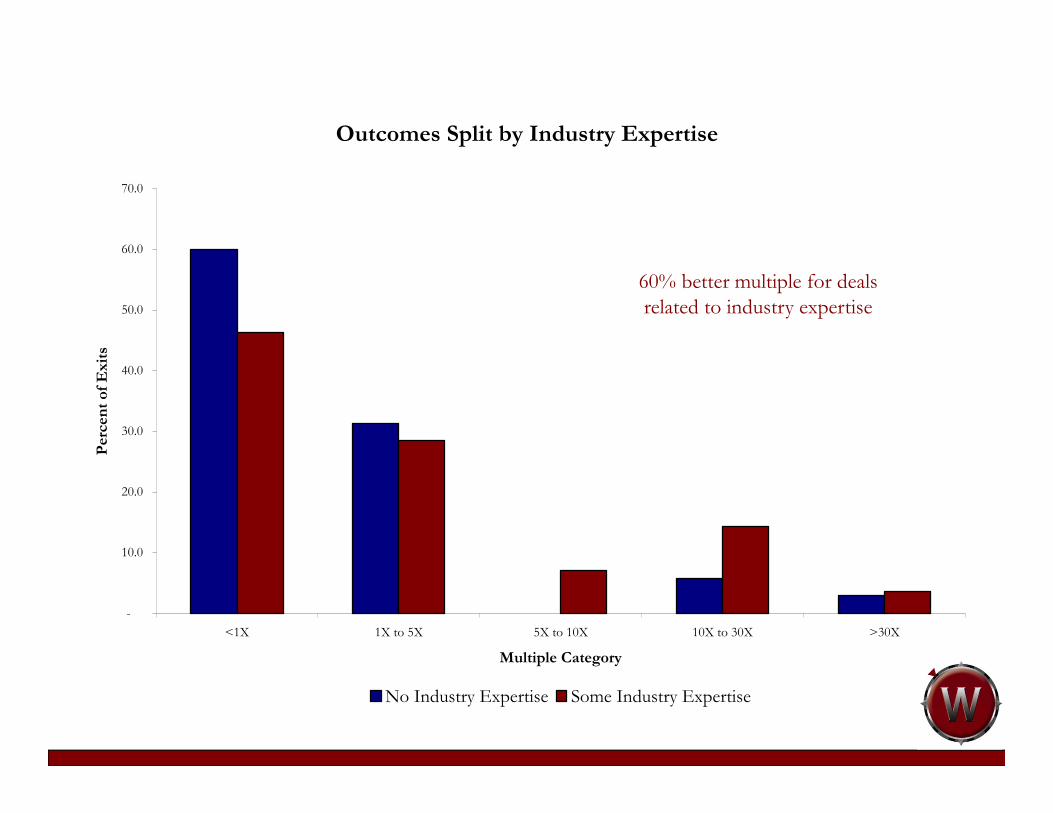
Outcomes Split by Industry Expertise
-
10.0
20.0
30.0
40.0
50.0
60.0
70.0
<1X 1X to 5X 5X to 10X 10X to 30X >30X
Multiple Category
Percent of Exits
No Industry Expertise Some Industry Expertise
60% better multiple for deals
related to industry expertise

Outcomes Split by Due Diligence
-
10.0
20.0
30.0
40.0
50.0
60.0
70.0
<1X 1X to 5X 5X to 10X 10X to 30X >30X
Multiple Category
Percent of Exits
Less Than 20 Hours 20+ Hours
2X better multiple
for 20+ due diligence
-
10.0
20.0
30.0
40.0
50.0
60.0
70.0
80.0
< 1X 1X to 5X 5X to 10X 10X to 30X > 30X
Exit Multiples
Percent of Exits
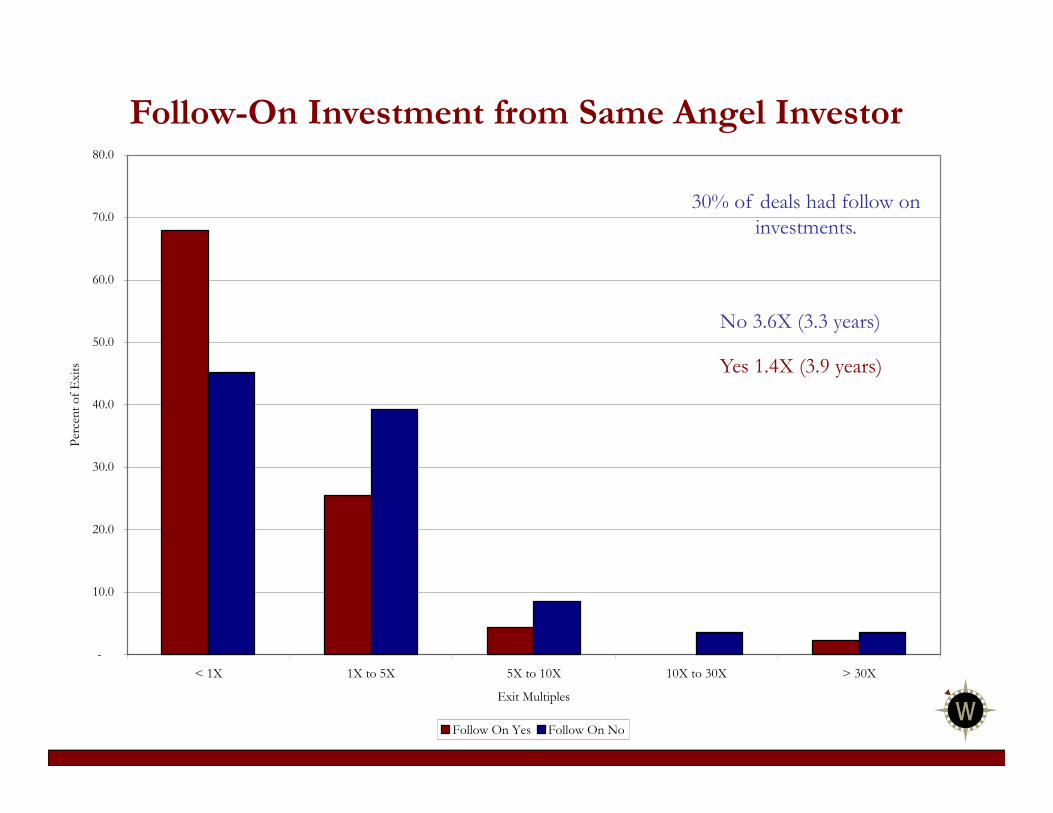
Follow On Yes Follow On No
Follow-On Investment from Same Angel Investor
No 3.6X (3.3 years)
Yes 1.4X (3.9 years)
30% of deals had follow on
investments.
-
10.0
20.0
30.0
40.0
50.0
60.0
70.0
< 1X 1X to 5X 5X to 10X 10X to 30X > 30X
Exit Multiples
Percent of Exits
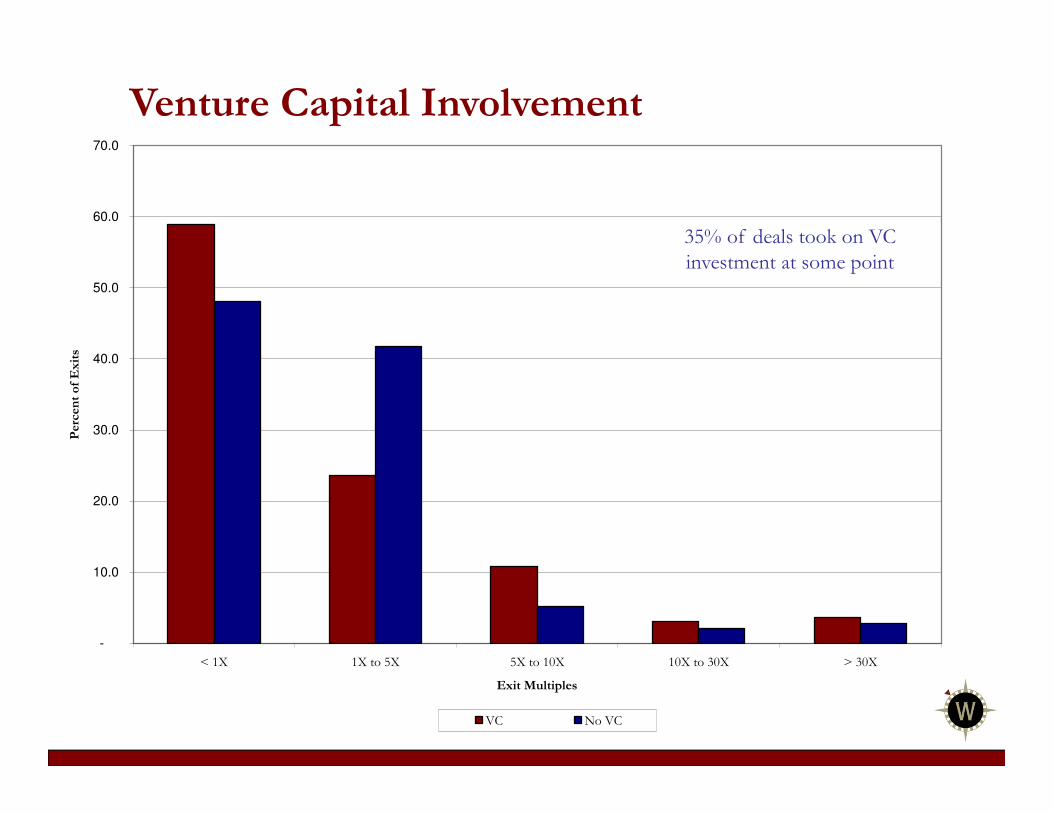
VC No VC
Venture Capital Involvement
35% of deals took on VC
investment at some point
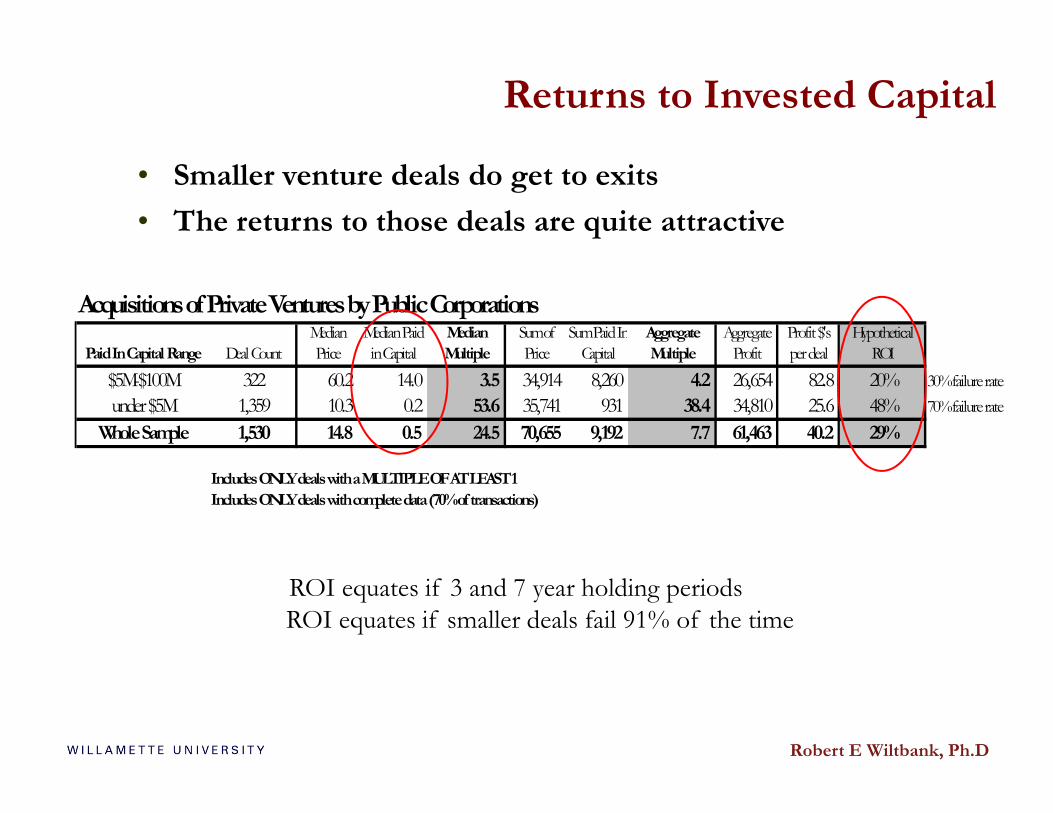
• Smaller venture deals do get to exits
• The returns to those deals are quite attractive
ROI equates if 3 and 7 year holding periods
Returns to Invested Capital
ROI equates if smaller deals fail 91% of the time
Acquisitions of Private Ventures by Public Corporations
Paid In Capital Range Deal Count
Median
Price
Median Paid
in Capital
Median
Multiple
Sum of
Price
Sum Paid In
Capital
Aggregate
Multiple
Aggregate
Profit
Profit $'s
per deal
Hypothetical
ROI
$5M-$100M 322 60.2 14.0 3.5 34,914 8,260 4.2 26,654 82.8 20% 30% failure rate
under $5M 1,359 10.3 0.2 53.6 35,741 931 38.4 34,810 25.6 48% 70% failure rate
Whole Sample 1,530 14.8 0.5 24.5 70,655 9,192 7.7 61,463 40.2 29%
Includes ONLY deals with a MULTIPLE OF AT LEAST 1
Includes ONLY deals with complete data (70% of transactions)
Robert E Wiltbank, Ph.D
• Transaction Economics vs. Macro EconomicsPrice Cost T.A.M.
Contribution Margin Predicted Market shares
Historical Data
Cost of Customer Acq Comparables
Customer ROI
Key Target List
• Cash to Cash cycles & Capital Intensity
Longest lead time supply Production cycle
Sales Cycle Order/Shipment gap
Days in AP
Details in Due Diligence
– Select ventures that appear most capable of influencing critical market elements.
Create and influence localized markets OR Compete in large growing markets
– Emphasize the current means and capabilities of the venture rather than on plans for acquiring the “best” means to reach their original goals.
Adjust goals to use current means OR Acquire means critical to insightful goals
– Encourage the venture to make smaller investments that get to cash flow positive rather than investing in the resources suggested by market research to “hit plan.”
Overhead trails growth OR Pre-position assets to time great opportunity
– Avoid prediction as the basis for investment decisions.
Emphasize affordable loss OR Maximize expected values
Early stage investing perspectives

Investors prefer opportunities:
in large and fast growing marketswith customers lined up waiting to repeatedly buy a high margin productwhere no powerful competitors existwith the potential to ‘keep others out’ of the marketled by experts in the field who have prior entrepreneurial success
The problem is the sequence; prioritizationi.e. insightful market research to demonstrate market potential,
or win a great beta customer?i.e. win a new great team member
or finish the prototype to demonstrate claims?
Selecting ventures for investment
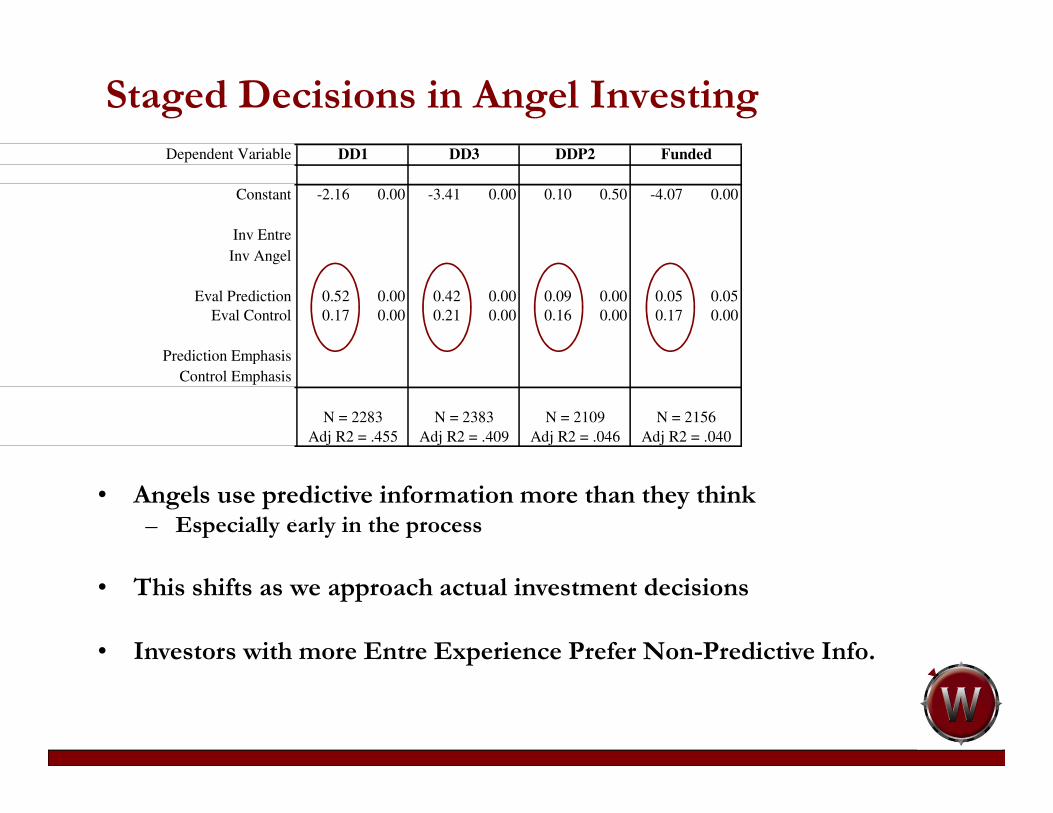
Staged Decisions in Angel Investing
• Angels use predictive information more than they think– Especially early in the process
• This shifts as we approach actual investment decisions
• Investors with more Entre Experience Prefer Non-Predictive Info.
-2.16 0.00 -3.41 0.00 0.10 0.50 -4.07 0.00
0.52 0.00 0.42 0.00 0.09 0.00 0.05 0.05
0.17 0.00 0.21 0.00 0.16 0.00 0.17 0.00
are essentially identical between OLS and multinomial or binary logistic regression.
N = 2156
Adj R2 = .040Adj R2 = .455
N = 2383
Adj R2 = .409
N = 2109
Adj R2 = .046
N = 2283
DD1 DD3 DDP2 FundedDependent Variable
Constant
Inv Entre
Inv Angel
Eval Prediction
Eval Control
Prediction Emphasis
Control Emphasis
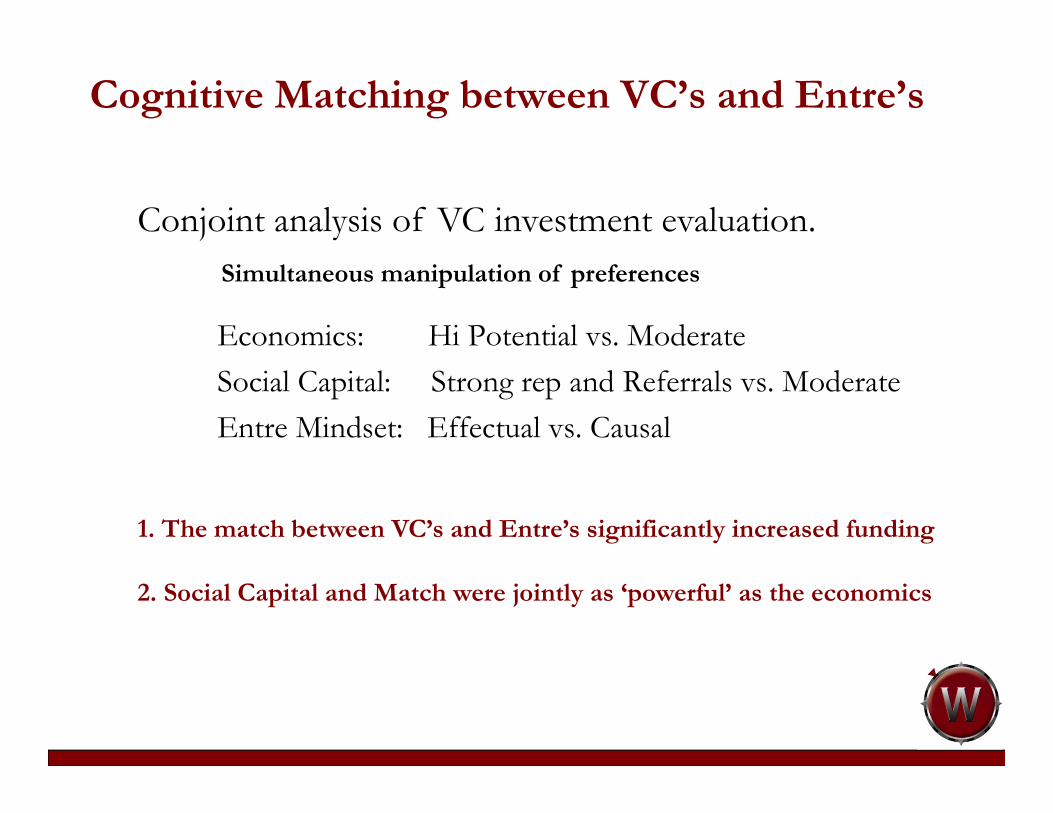
Cognitive Matching between VC’s and Entre’s
Conjoint analysis of VC investment evaluation.
Simultaneous manipulation of preferences
1. The match between VC’s and Entre’s significantly increased funding
2. Social Capital and Match were jointly as ‘powerful’ as the economics
Economics: Hi Potential vs. Moderate
Social Capital: Strong rep and Referrals vs. Moderate
Entre Mindset: Effectual vs. Causal
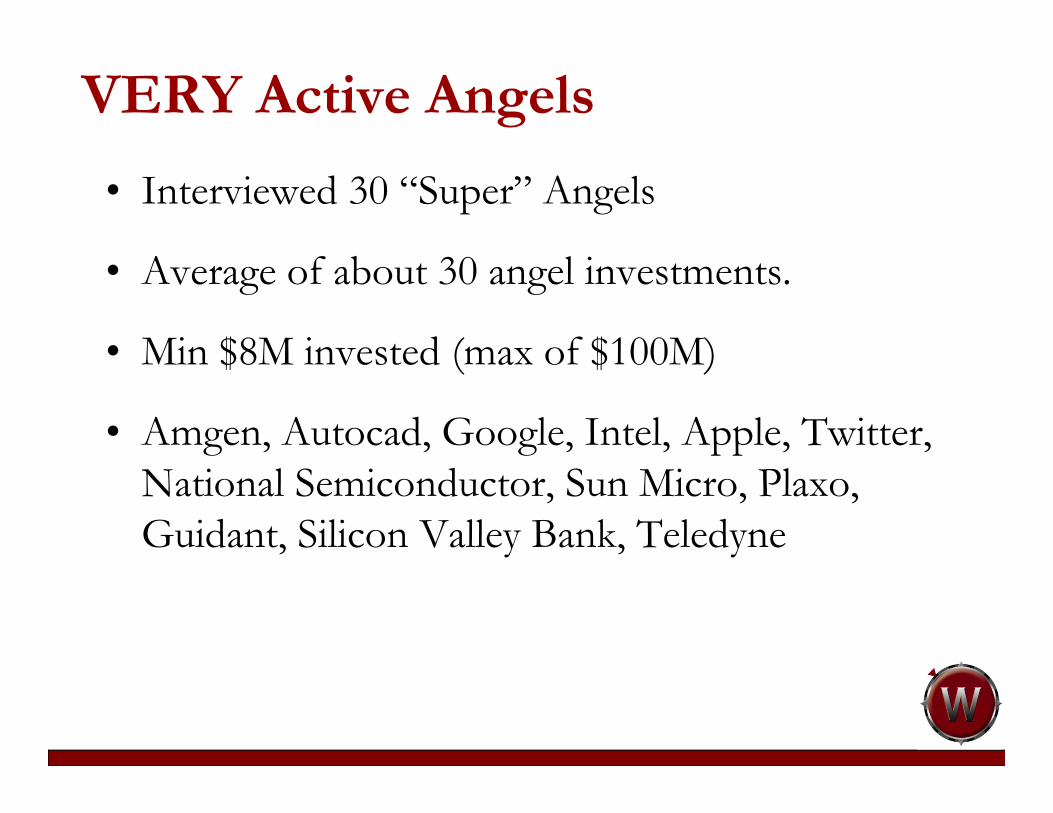
VERY Active Angels
• Interviewed 30 “Super” Angels
• Average of about 30 angel investments.
• Min $8M invested (max of $100M)
• Amgen, Autocad, Google, Intel, Apple, Twitter, National Semiconductor, Sun Micro, Plaxo, Guidant, Silicon Valley Bank, Teledyne

Searching For Something
• What role does their network play in their investing?
• What is their approach to angel investing?
Criteria, Strategy, Process, “Rules” etc.
• How do they manage investments after the fact?
• What have they learned along the way?
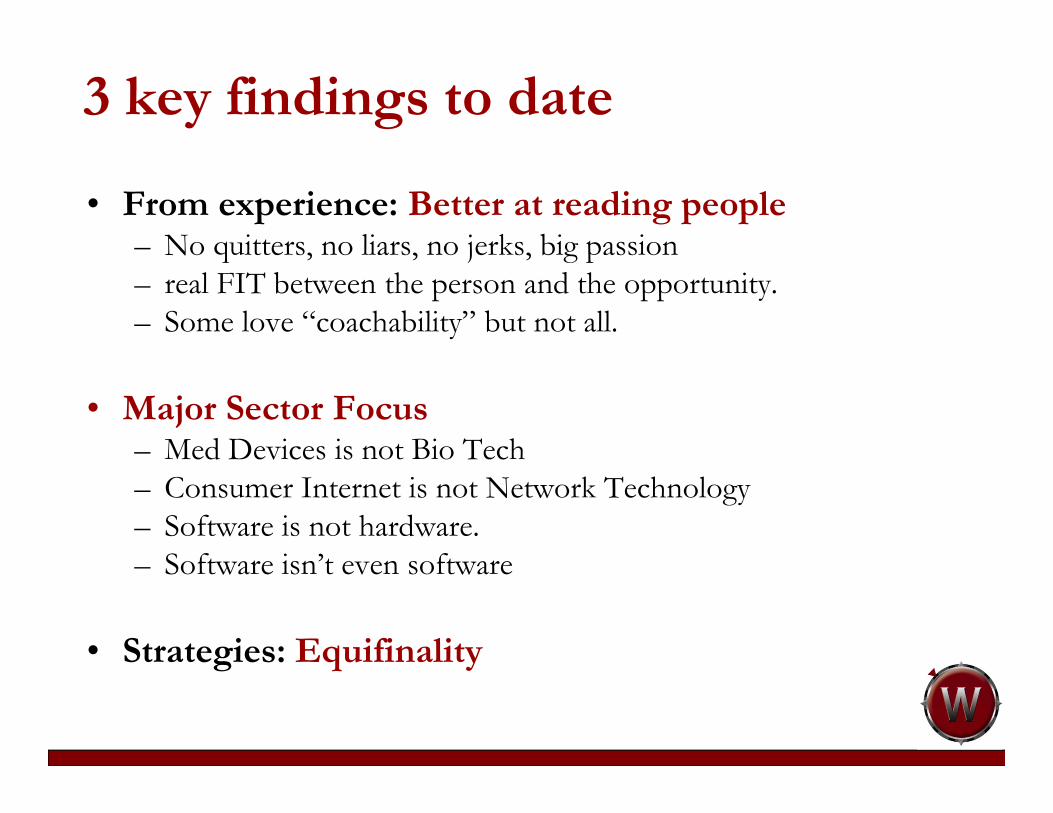
3 key findings to date
• From experience: Better at reading people– No quitters, no liars, no jerks, big passion
– real FIT between the person and the opportunity.
– Some love “coachability” but not all.
• Major Sector Focus– Med Devices is not Bio Tech
– Consumer Internet is not Network Technology
– Software is not hardware.
– Software isn’t even software
• Strategies: Equifinality
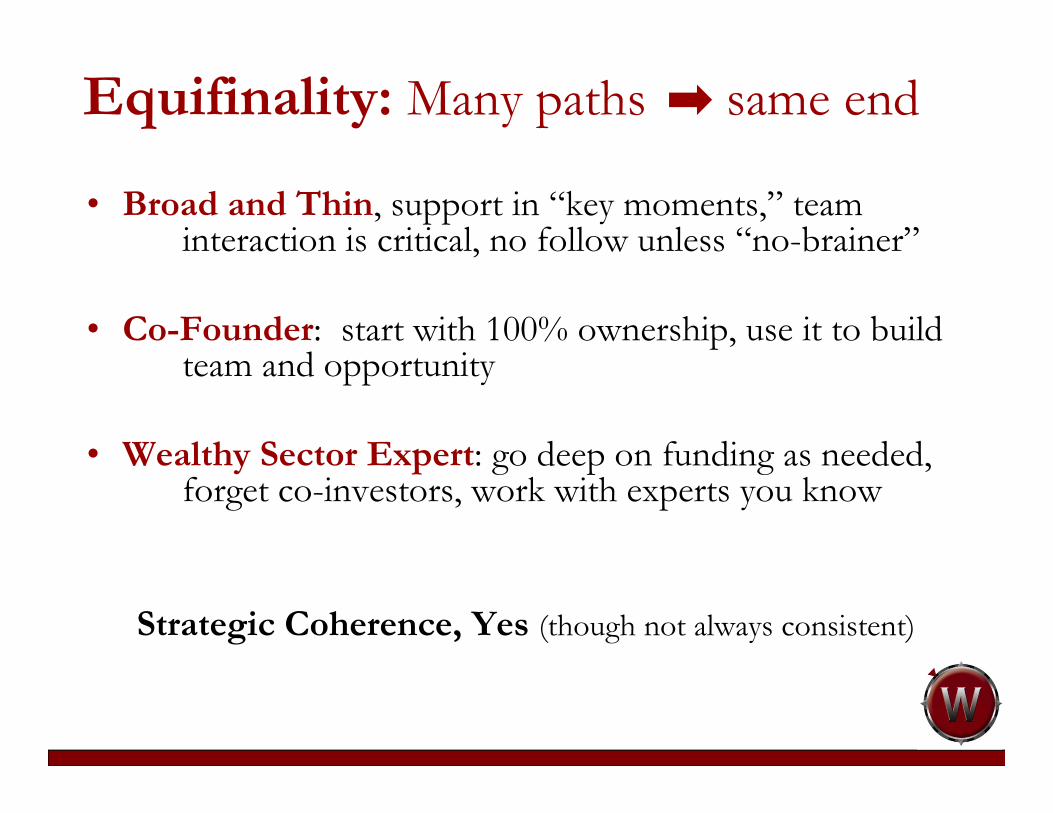
Equifinality: Many paths same end
• Broad and Thin, support in “key moments,” team interaction is critical, no follow unless “no-brainer”
• Co-Founder: start with 100% ownership, use it to build team and opportunity
• Wealthy Sector Expert: go deep on funding as needed, forget co-investors, work with experts you know
Strategic Coherence, Yes (though not always consistent)


Effectual vs. Predictive Logic
Given
Goals
M1
M2
M3
M4
M5
Distinguishing Characteristic Of Predictive Logic:
Selecting various means to achieve pre-determined goals
New means may be generated over time
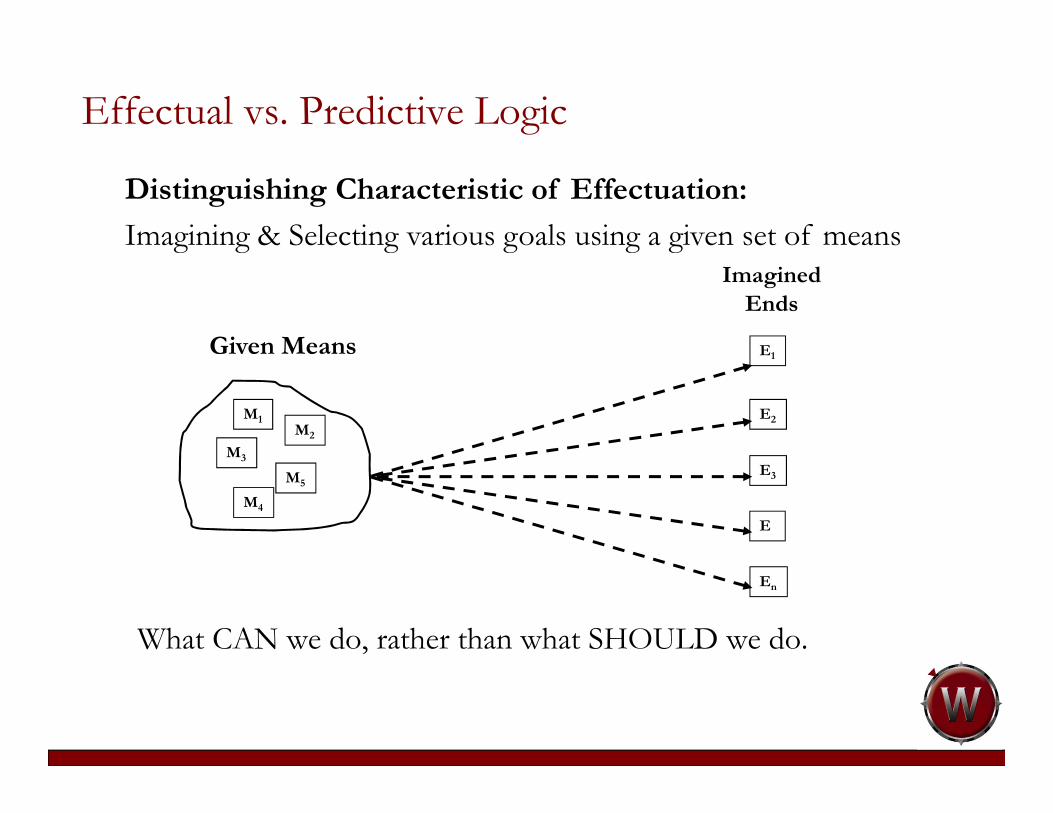
Distinguishing Characteristic of Effectuation:
Imagining & Selecting various goals using a given set of means
E2
E3
E
En
Given Means
M1M2
M3
M4
M5
E1
Imagined
Ends
Effectual vs. Predictive Logic
What CAN we do, rather than what SHOULD we do.
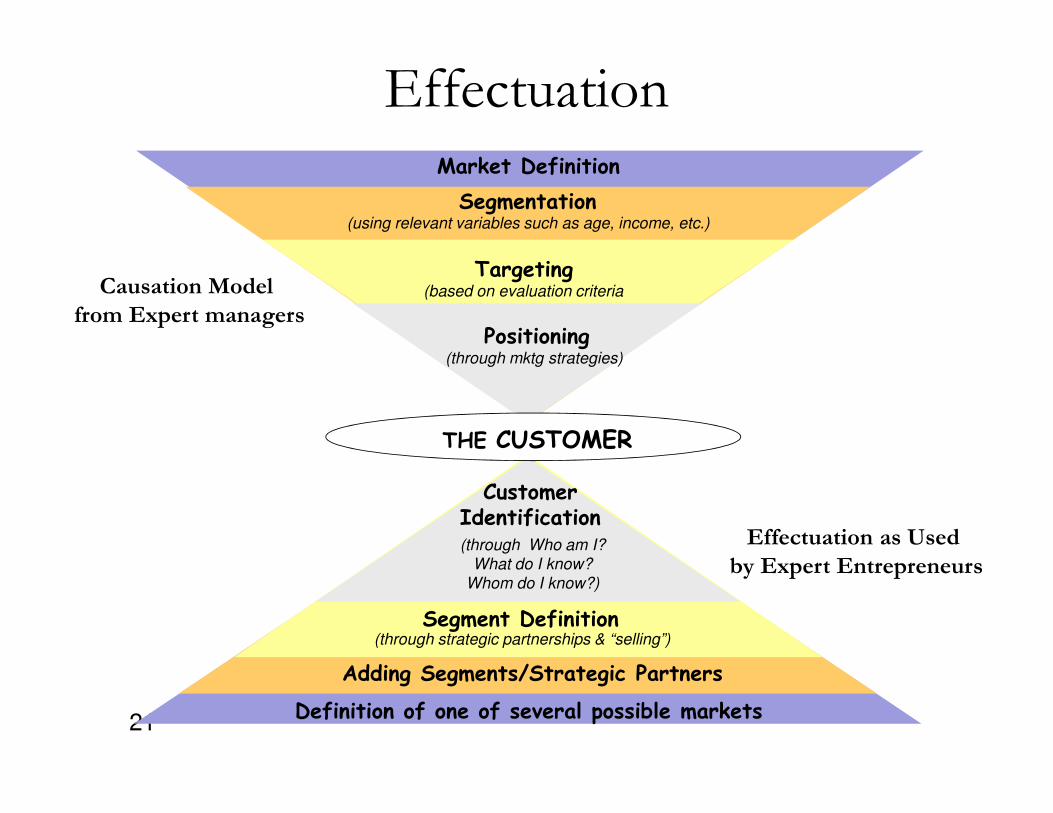
21Definition of one of several possible markets
Adding Segments/Strategic Partners
Segment Definition(through strategic partnerships & “selling”)
Market Definition
Segmentation(using relevant variables such as age, income, etc.)
Effectuation
Causation Model
from Expert managers
Targeting(based on evaluation criteria
such as expected return)
Positioning(through mktg strategies)
Effectuation as Used
by Expert Entrepreneurs
CustomerIdentification(through Who am I?
What do I know?
Whom do I know?)
THE CUSTOMER
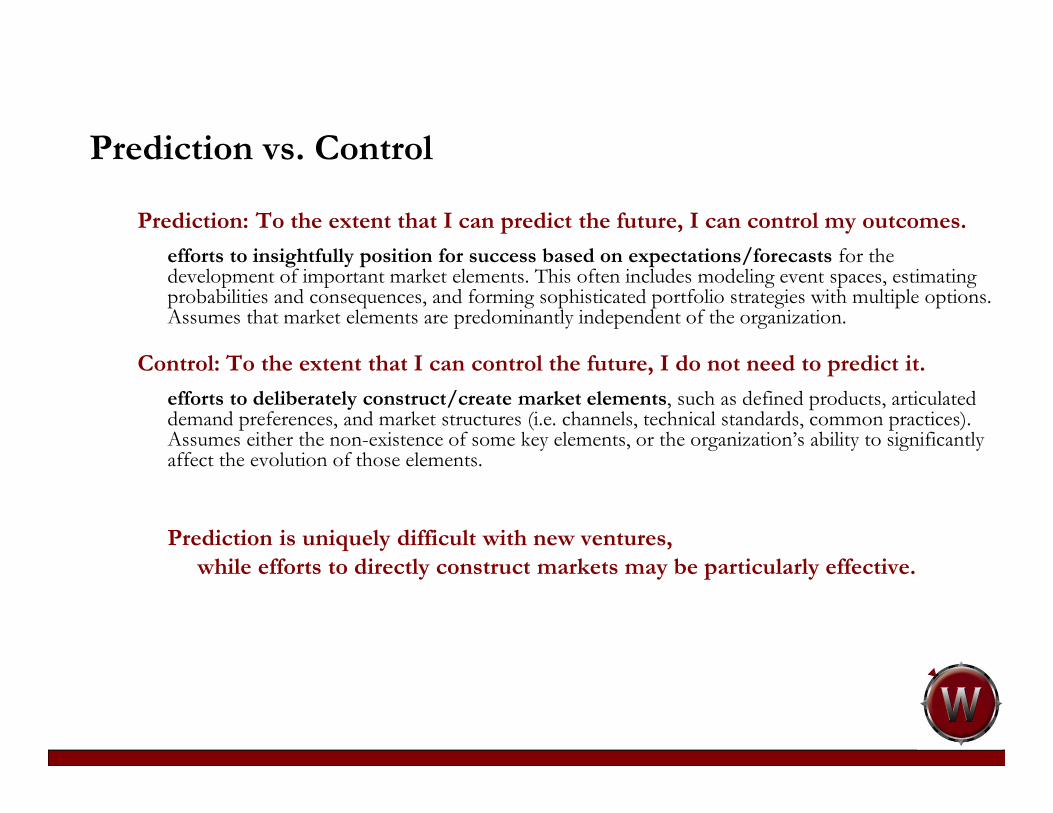
Prediction vs. Control
Prediction: To the extent that I can predict the future, I can control my outcomes.
efforts to insightfully position for success based on expectations/forecasts for the development of important market elements. This often includes modeling event spaces, estimating probabilities and consequences, and forming sophisticated portfolio strategies with multiple options. Assumes that market elements are predominantly independent of the organization.
Control: To the extent that I can control the future, I do not need to predict it.
efforts to deliberately construct/create market elements, such as defined products, articulated demand preferences, and market structures (i.e. channels, technical standards, common practices). Assumes either the non-existence of some key elements, or the organization’s ability to significantly affect the evolution of those elements.
Prediction is uniquely difficult with new ventures,
while efforts to directly construct markets may be particularly effective.

Predictive. The future is a reliable
continuation of the past. Accurate
prediction is possible and useful.
Transformative. The future as shaped (at least
partially) by actions of all players. Prediction is
neither easy nor useful.
5. Approach
Avoid Contingencies. Surprises are
bad. Contingencies are managed by
careful planning and focus on
targets.
Leverage Contingencies. Surprises are good.
New developments encourage imaginative re-
thinking of possibilities and continual
transformations of targets.
4. Contingency
Perform Competitive Analysis. Protect.
Strategy is driven by potential
competitive threats.
Form Partnerships. Grow. Strategy is created
jointly through partnerships to create new
opportunities.
3. Attitude Toward Outsiders
Calculate Expected Return. Pursue the
(risk adjusted) largest opportunity
and accumulate required resources.
Maximize upside potential.
Set Affordable Loss. Pursue interesting
opportunities without investing more
resources than you can afford to lose. Set a
limit on downside potential.
2. Risk, Return and Resources
Set a Goal. Goals determine actions. For
example, the goal of achieving X, will
dictate I need person A with skills
matched to X.
Assess Your Means. Take action based on what
you have available:
* Who I am
* What I know
* Whom I know
Example: I have person A, I can achieve X, Y, or Z
1. Where to Start
Tactics for PredictionTactics for Control
Non-Predictive Control: Effectuation