fiban's business angel training "effective business angel investing strategies" by...
TRANSCRIPT
Robert E Wiltbank, Ph.D.
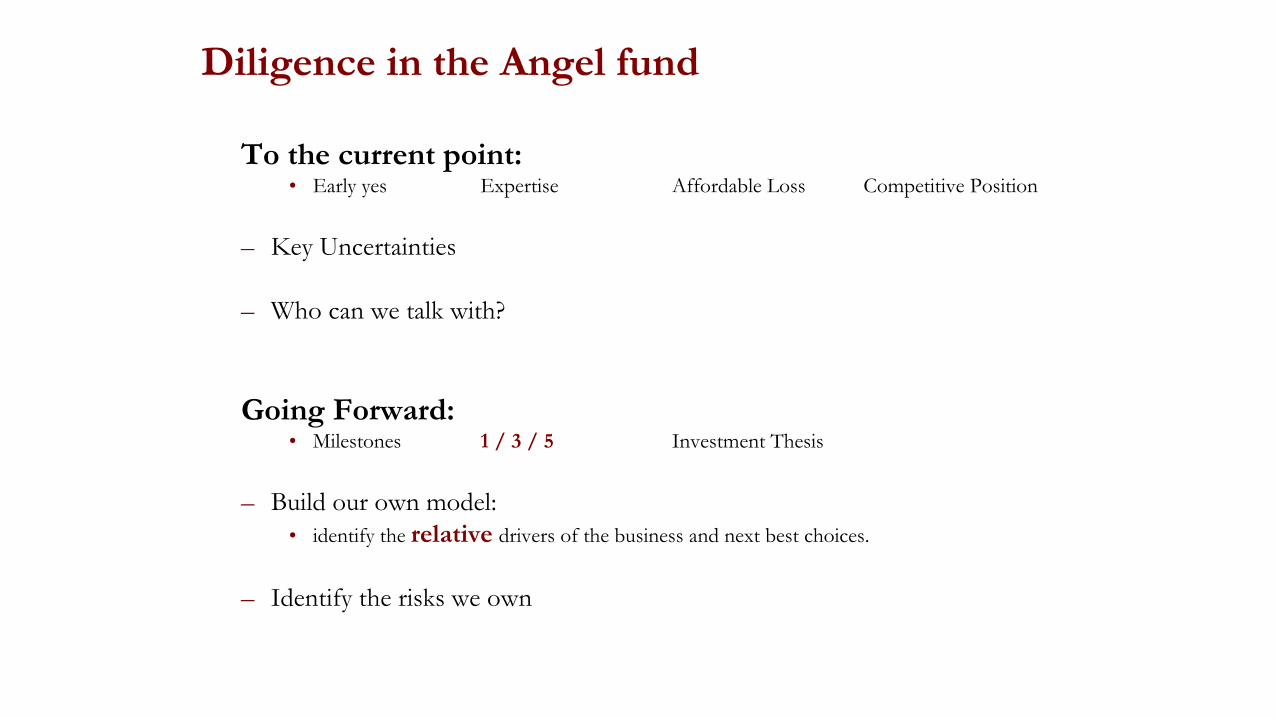
To the current point: • Early yes Expertise Affordable Loss Competitive Position
– Key Uncertainties
– Who can we talk with?
Going Forward:• Milestones 1 / 3 / 5 Investment Thesis
– Build our own model: • identify the relative drivers of the business and next best choices.
– Identify the risks we own
Diligence in the Angel fund
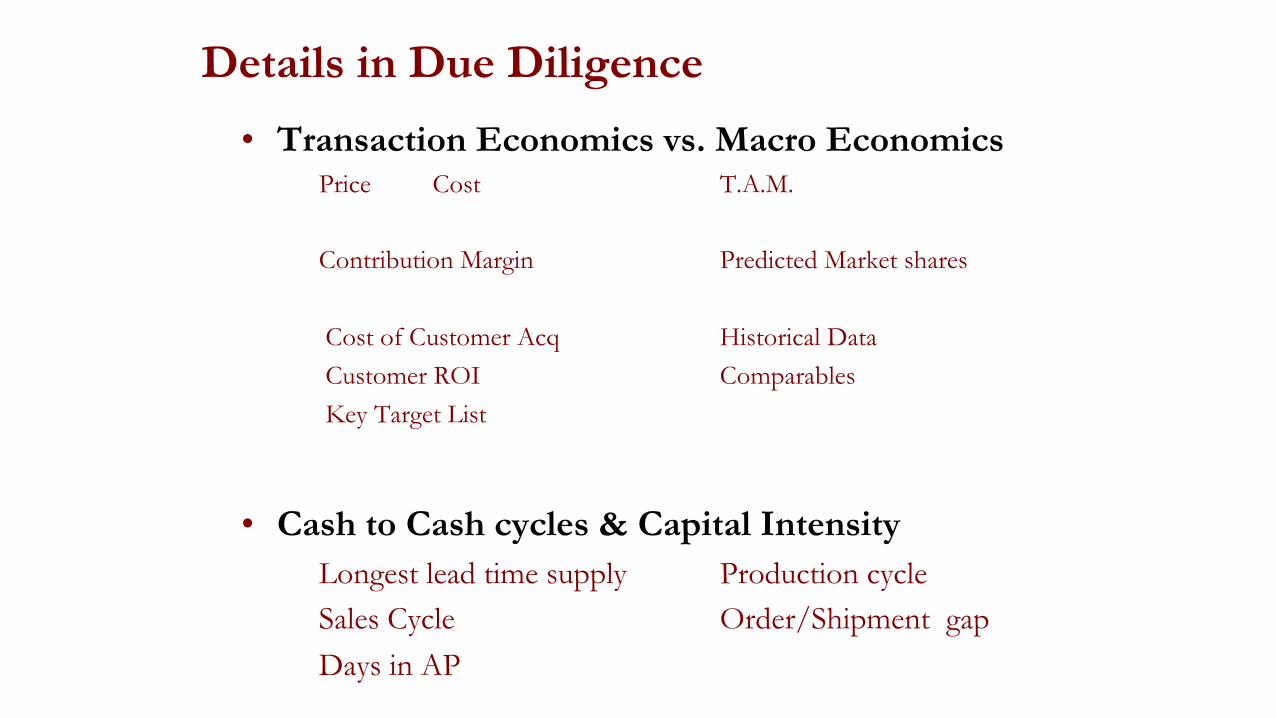
• Transaction Economics vs. Macro EconomicsPrice Cost T.A.M.
Contribution Margin Predicted Market shares
Cost of Customer Acq Historical DataCustomer ROI ComparablesKey Target List
• Cash to Cash cycles & Capital IntensityLongest lead time supply Production cycleSales Cycle Order/Shipment gapDays in AP
Details in Due Diligence
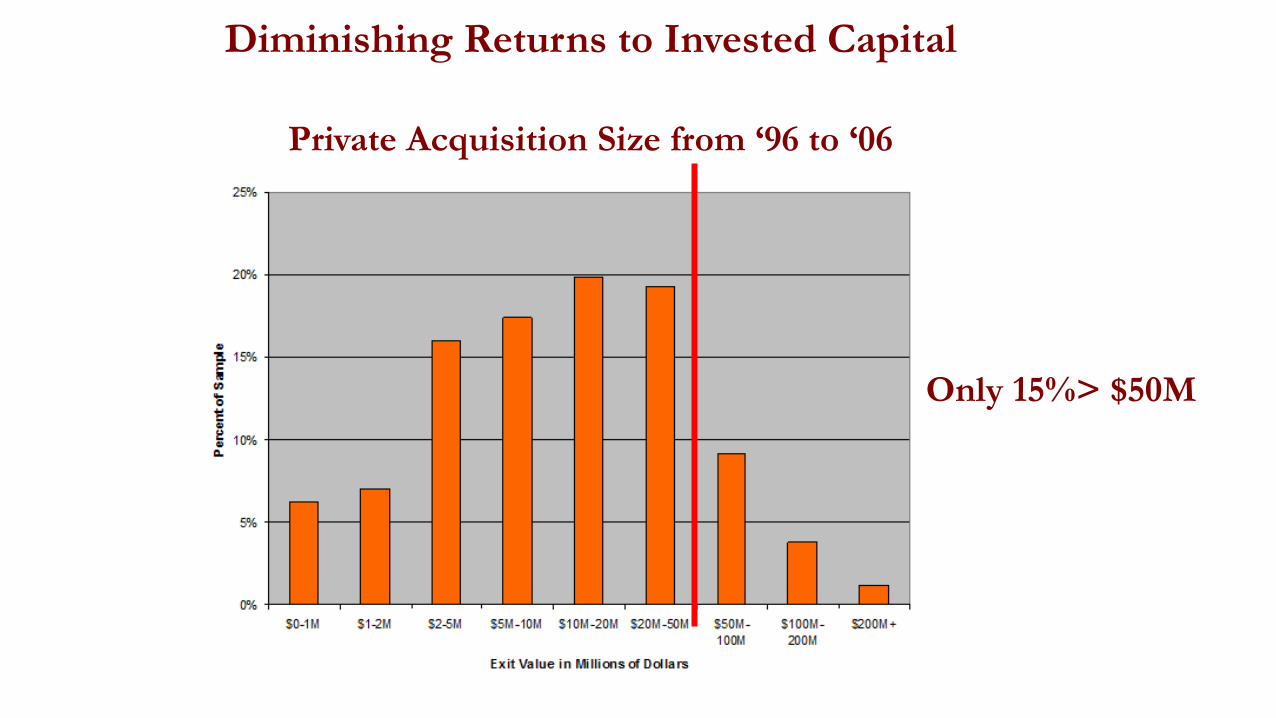
Diminishing Returns to Invested Capital
Private Acquisition Size from ‘96 to ‘06
Only 15%> $50M
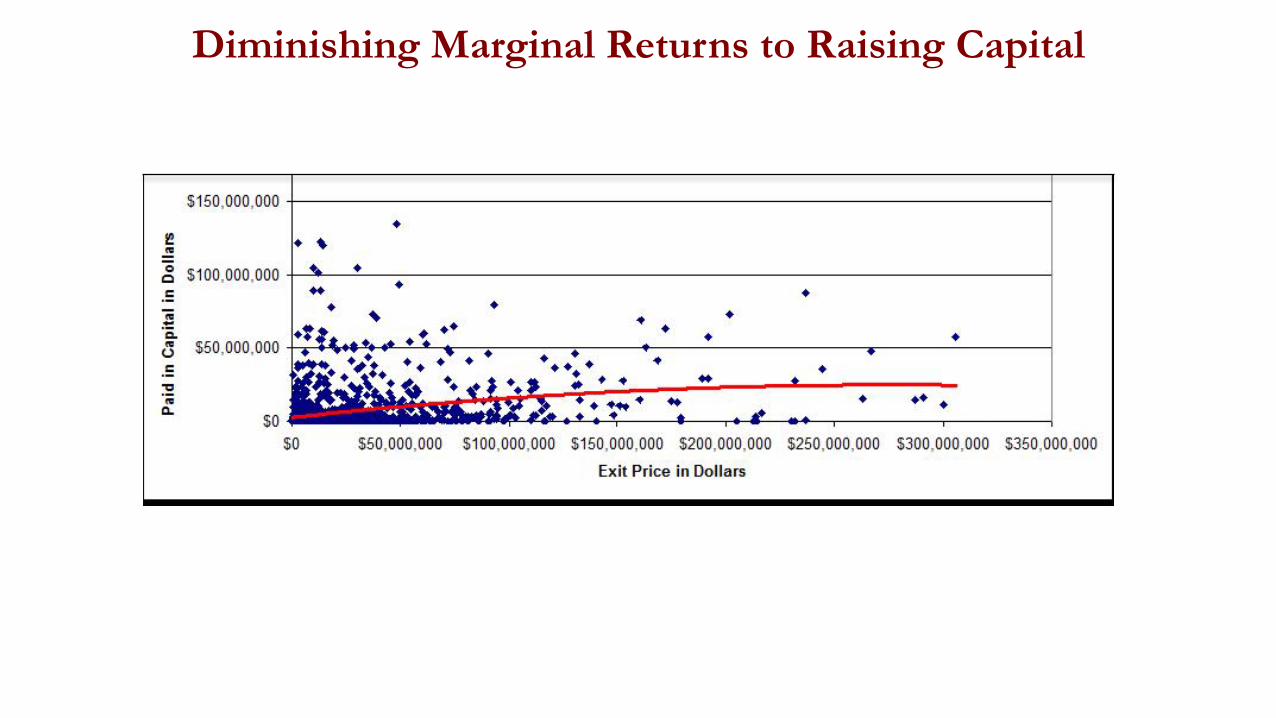
Diminishing Marginal Returns to Raising Capital
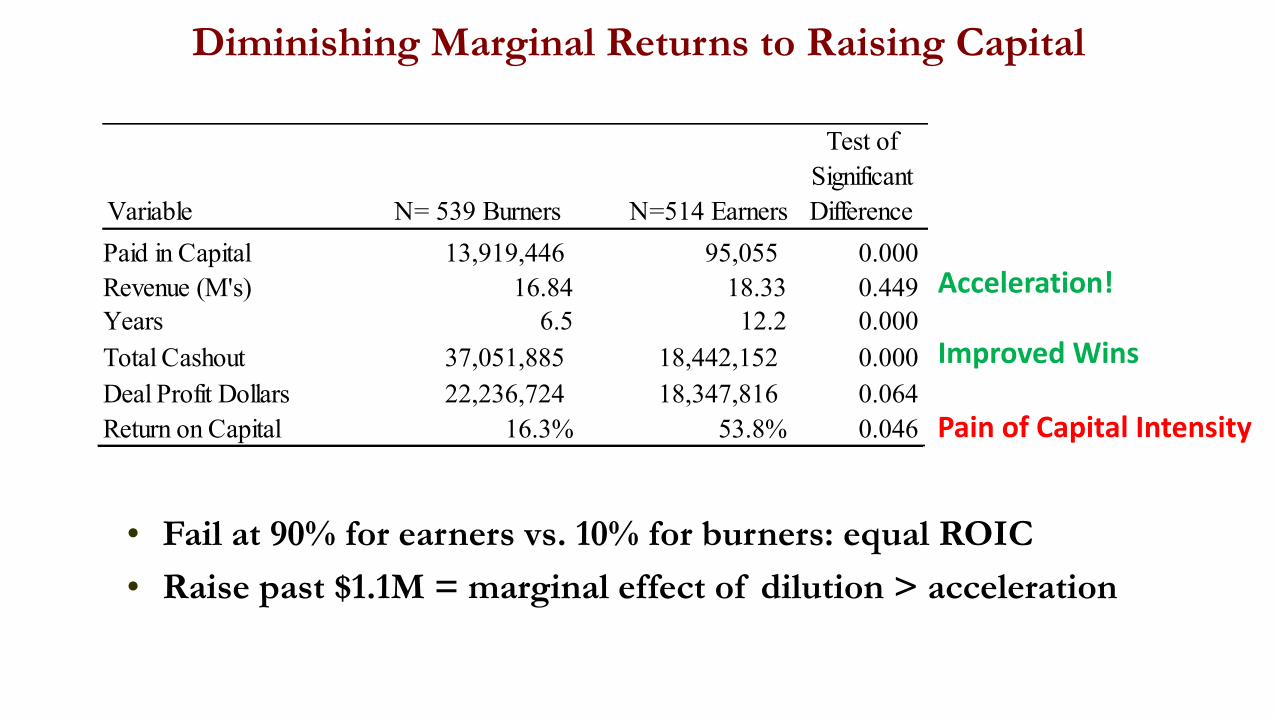
Variable N= 539 Burners N=514 Earners
Test of Significant Difference
Inc Year 1994 1987 0.000Seller Population 16,643,472 11,136,083 0.000Exit year 2001 1999 0.000Tech Bubble 0.28 0.11 0.000Exit VC activity (M's) 288.5 144.3 0.000Founding VC Activity (M's) 238.4 115.7 0.000Same State 0.32 0.25 0.006Shareholder's Equity (M's) -2.17 3.56 0.000Assets (M's) 12.79 9.63 0.007Revenue (M's) 16.84 18.33 0.449Retained Earnings (10,310,733.73) 3,310,482.26 0.000Paid in Capital 13,919,446 95,055 0.000Total Cashout 37,051,885 18,442,152 0.000Years 6.5 12.2 0.000Avg Growth Rate 266.3% 188.8% 0.006Deal Profit Dollars 22,236,724 18,347,816 0.064Return on Capital 16.3% 53.8% 0.046
Acceleration!
ImprovedWins
PainofCapitalIntensity
Diminishing Marginal Returns to Raising Capital
• Fail at 90% for earners vs. 10% for burners: equal ROIC• Raise past $1.1M = marginal effect of dilution > acceleration