february 14, 2006 hans stråberg president and ceo€¦ · february 14, 2006 hans stråberg...
TRANSCRIPT
Consolidated results 2005February 14, 2006
Hans StråbergPresident and CEO
2
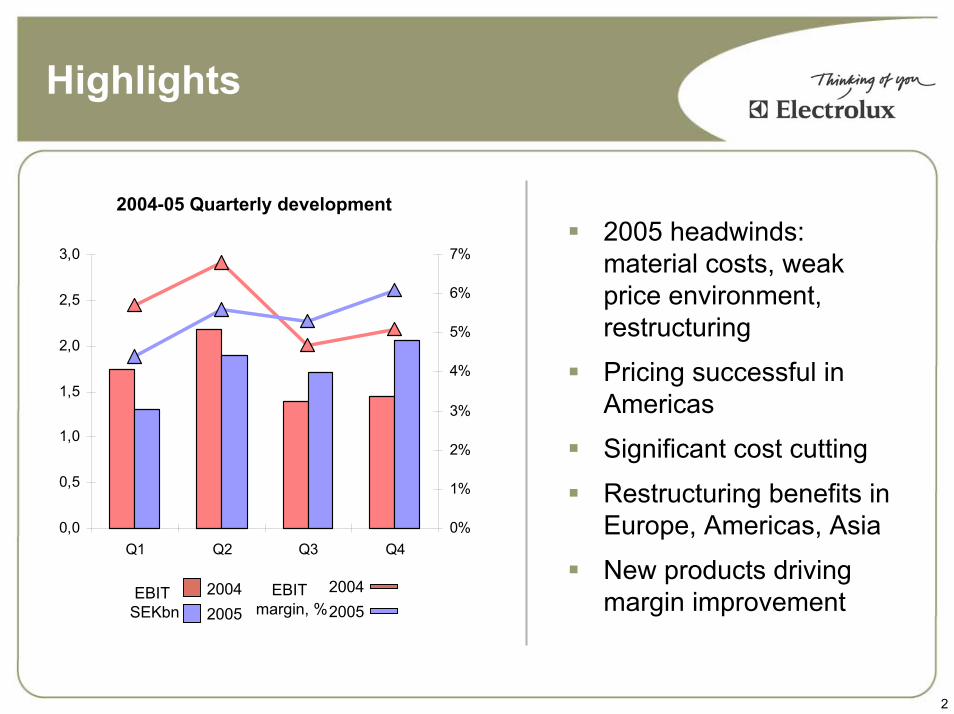
Highlights
2004-05 Quarterly development 2005 headwinds: material costs, weak price environment, restructuring
Pricing successful in Americas
Significant cost cutting
Restructuring benefits in Europe, Americas, Asia
New products driving margin improvementEBIT
margin, %20042005
0,0
0,5
1,0
1,5
2,0
2,5
3,0
Q1 Q2 Q3 Q40%
1%
2%
3%
4%
5%
6%
7%
20042005
EBIT SEKbn

3
Financial summaryexcluding items affecting comparability
SEKm
Net sales 33,651 17.6 129,469 7.3
Operating income 2,061 42.2 6,962 2.9
Pre-tax income 1,861 36.4 6,235 -2.8
SEK per share
Earnings per share 5.22 58.2 15.82 3.8
Dividend 7.50 7.1
Full year %2005 Change
Q4 %2005 Change
4
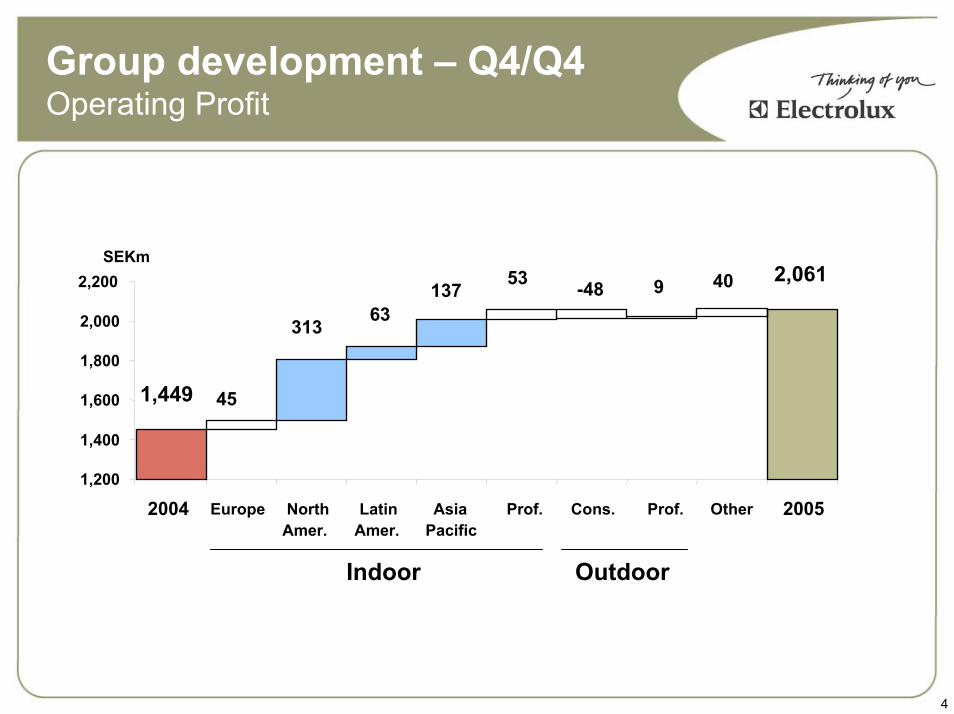
Group development – Q4/Q4Operating Profit
1,449 45
1,200
1,400
1,600
1,800
2,000
2,200
2004 Europe NorthAmer.
LatinAmer.
AsiaPacific
Prof. Cons. Prof. Other 2005
313 63137 53 -48 409 2,061
SEKm
Indoor Outdoor
5
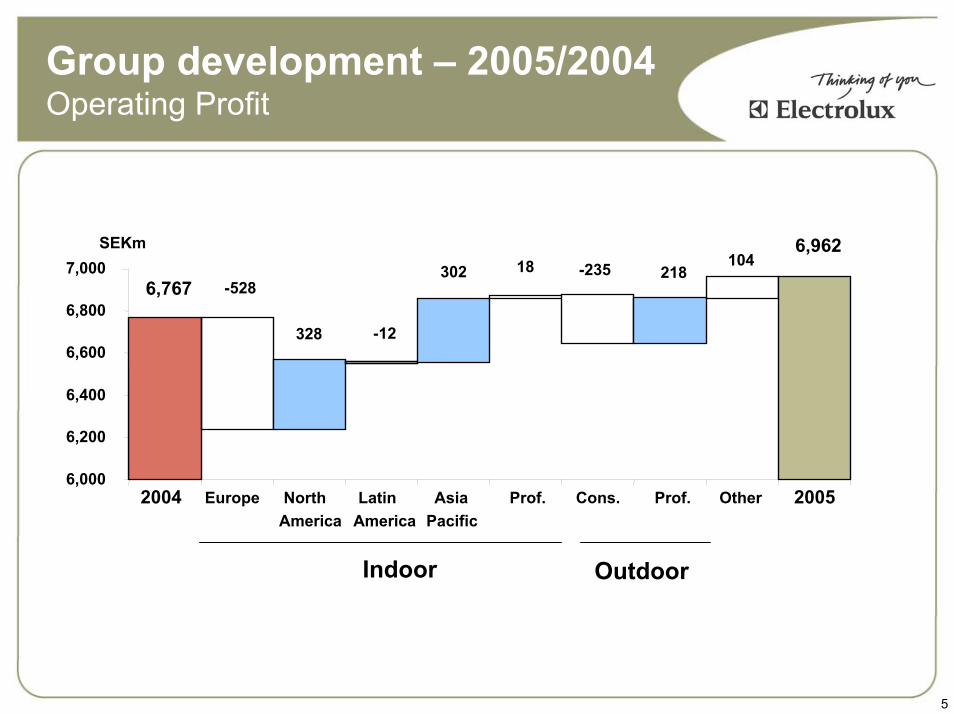
Group development – 2005/2004Operating Profit
-528
-12
302 18 -235
328
218104
6,767
6,962
6,000
6,200
6,400
6,600
6,800
7,000
Indoor Outdoor
2004 Europe NorthAmerica
LatinAmerica
AsiaPacific
Prof. Cons. Prof. Other 2005
SEKm

Financial review
Fredrik RystedtChief Financial Officer

7
2005 Cash flow
SEKbn 2005 2004
From operations, excluding change in operating assets and liabilities 8.4 7.1Change in operating assets and liabilities -1.9 1.4Capital Expenditure -4.8 -4.5Divestment of Indian operation -0.4 -Other -0.7 -0.8Cash flow from operations and investments 0.7 3.2
Inventories and accounts receivable stable as % of salesHigher capital spending– Appliance factories in Mexico, Poland, Hungary, Russia, Thailand– 35% of total capex for new products

8
Raw material impactQuarterly development 2005
0
200
400
600
800
1000
1200
Q1 Q2 Q3 Q4
SEKm
Materials cost pressures easing
Cost cutting programs continue
Negative full-year impact of SEK 1,900m
Gross cost increasesPurchasing and efficiency improvementsNet negative impact

9
Structural changes
Proceeded with closing 5 US and Western European facilities in 2005
– announced and charged in 2004
Announced closing/down-sizings of 5 facilities and Indian divestment
– SEK 3020 m charges in 2005
February 2006, announced down-sizing of US washer/dryer facility
– Investing SEK 1090 m in Mexico
Investigating compact appliance factory in SwedenWestern European production shifting to facilities in Eastern EuropeUS production shifting to new facilities in Mexico

10
Spin-off Outdoor
Process– early April Prospectus and information brochure
sent to shareholders– April 24 Proposal to AGM– May/June Road show– mid-June Listing on Stockholm exchange
Structured as a dividend to Electrolux shareholders– All shares in wholly-owned subsidiary named
Husqvarna AB– 1 Husqvarna A-share : 1 Electrolux A-share – 1 Husqvarna B-share : 1 Electrolux B-share

11
Spin-off Outdoor
Preliminary pro forma 2005 results – Including estimated group
common cost*
Sales 28.8
EBITDA 3.7*
EBIT 2.9*
Financial structure– Pro forma, Jan. 1, 2006
Net borrowings 5.3
Share capital 4.7
SEKbn
*) SEK 0.2bn estimated group common costs
Operational review
Hans StråbergPresident and CEO

13
Indoor Productsexcluding group common costs
2005 SalesSEK 100.7bn
2004-05 Quarterly development
0,0
0,4
0,8
1,2
1,6
2,0
2,4
2,8
Q1 Q2 Q3 Q40%
1%
2%
3%
4%
5%
6%
7%
7%
NorthAmerica
35%
Professional
Asia
Lat Am
9%
6%
Europe43%
EBIT Margin, %
EBIT SEKbn
2005 EBIT-margin 4.6% (4.9)

14
Indoor Europe
1-2% price erosion, materials cost increases
Steady profit improvement during year
Major relocation benefits
Cost cutting
New products driving margin improvement
Q4 2005* SEKm Change
Sales 12,502 +7.8%EBIT 986 +4.8%Margin 7.9%
In comparable currencySales +2.5%EBIT -2.5%
* Excluding items affecting comparability

15
Twin Clean“Cleans its own filter, so you don't have to”
Customers preferring a bagless vacuum cleaner find it frustrating to clean or change the filter
Electrolux developed a vacuum cleaner that could clean its own filter
Launched in 2005– First a European launch
– Second a global launch

16
2005 new product launches
Electrolux Icon ProfessionalDual-fuel freestanding ranges Electrolux Icon Professional
Wall ovens
Electrolux Icon ProfessionalUnder-counter wine cooler
Electrolux Insight Cookers Electrolux Source & Glacier
FridgeElectrolux Screenfridge

17
Indoor North America
Price increases holding
Cost cutting offset materials increases
New cooking products led margin improvement in Q4
New laundry launches in 2006
Relocation benefits in H2 2006
Q4 2005* SEKm Change
Sales 9,930 +29.3%EBIT 636 +96.9%Margin 6.4%
In comparable currencySales +11.5%EBIT +72.6%
* Excluding items affecting comparability

18
Indoor Latin America
Q4 2005* SEKm Change
Sales 1,817 +35.6%EBIT 112 n/aMargin 6.2%
In comparable currencySales +9.4%EBIT +203.3%
New round of price increases in Q4
New cooking products sold well
Remains a volatile market
* Excluding items affecting comparability

19
RevoluxA new cooker for the Brasilian market
No cooker that suited the Brazilian consumers’ need– Safety
– Design
– Time saving
– Easy to clean
Satisfied the customers need
20% market share in the premium segment

20
Indoor Asia/Pacific
Q4 2005* SEKm Change
Sales 2,442 +3.5%EBIT 42 n/aMargin 1.7%
In comparable currencySales -7.7%EBIT n/a
India: new business model cuts major losses
China: continuing shift from commodities to higher-end
Australia: restructuring benefits, mix improvement
* Excluding items affecting comparability

21
Indoor Professional
Q4 2005* SEKm Change
Sales 1,953 +16.8%EBIT 158 +50.5%Margin 8.1%
In comparable currencySales +11.3%EBIT +47.2%
European food service market up
Laundry equipment sales up, but income down on restructuring charges
* Excluding items affecting comparability
22
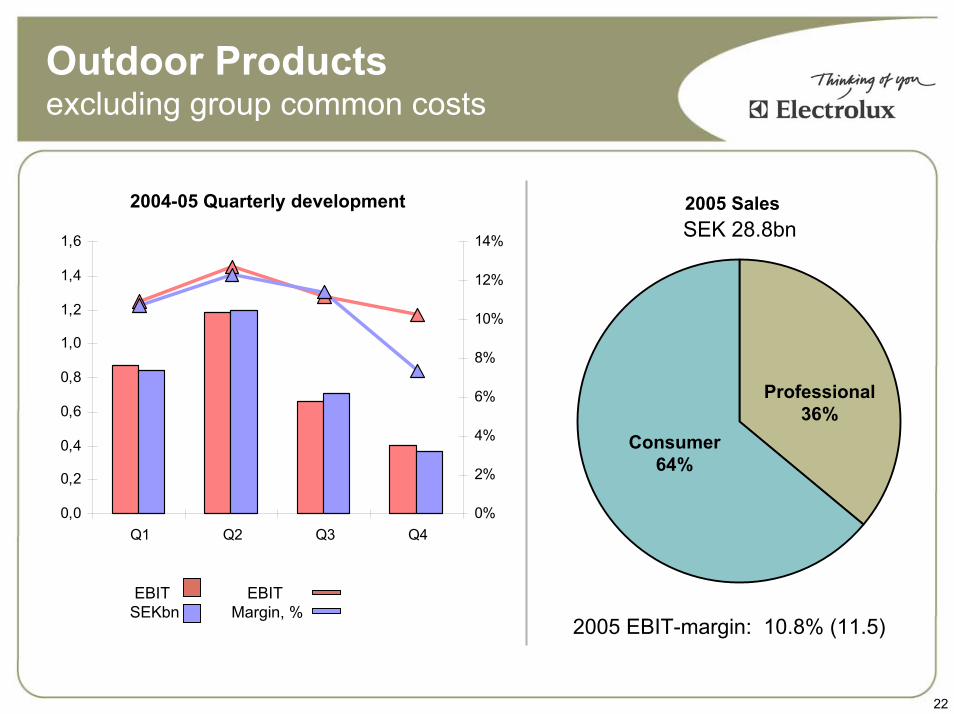
Outdoor Productsexcluding group common costs
2004-05 Quarterly development
0,0
0,2
0,4
0,6
0,8
1,0
1,2
1,4
1,6
Q1 Q2 Q3 Q40%
2%
4%
6%
8%
10%
12%
14%
2005 SalesSEK 28.8bn
Consumer64%
Professional36%
EBIT SEKbn
EBIT Margin, %
2005 EBIT-margin: 10.8% (11.5)

23
Outdoor Consumer
European sales and profit up on higher volume and improved mix
North America sales flat and profit down on less favorable mix, higher materials costs, inventory reduction
2005 EBIT margin 7.5%
Q4 2005* SEKm Change
Sales 2,519 +44.3%EBIT 34 -58.5%Margin 1.3%
In comparable currencySales +9.4%EBIT -90.7%
* Excluding items affecting comparability

24
Outdoor Professional
Q4 2005* SEKm Change
Sales 2,481 +12.0%EBIT 333 +2.8%Margin 13.4%
In comparable currencySales +2.1%EBIT -1.8%
Strong chainsaw sales
Professional garden up
Diamond tools and power cutters up, with higher North American demand
2005 EBIT margin 16.7%* Excluding items affecting comparability

25
2006 Outlook
Market demand for appliances in 2006 is expected to show some growth in both Europe and North America as compared to 2005.
Efforts to strengthen the Group’s competitive position through investments in product development and in building the Electrolux brand will continue.
Operating income for the Electrolux Indoor operations in 2006 is expected to be somewhat higher than in 2005 excluding
items affecting comparability.

26
Summary
Improved results for indoor across all regions
Restructuring on track, benefits flowing
New products driving margin improvement
Strong financial position
Outdoor spin-off unlocking value
In 2006 we will continue our work to strengthen our brand, launch new products and reduce cost in production and purchasing

Q & A session
28
Factors affecting forward-looking statements
Factors affecting forward-looking statementsThis presentation contains “forward-looking” statements within the meaning of the US Private Securities Litigation Reform Act of 1995. Such statements include, among others, the financial goals and targets of Electrolux for future periods and future business and financial plans. These statements are based on current expectations and are subject to risks and uncertainties that could cause actual results to differ materially due to a variety of factors. These factors include, but may not be limited to the following; consumer demand and market conditions in the geographical areas and industries in which Electrolux operates, effects of currency fluctuations, competitive pressures to reduce prices, significant loss of business from major retailers, the success in developing new products and marketing initiatives, developments in product liability litigation, progress in achieving operational and capital efficiency goals, the success in identifying growth opportunities and acquisition candidates and the integration of these opportunities with existing businesses, progress in achieving structural and supply-chain reorganization goals.

Appendix

30
Industry shipments2005 versus 2004
1) Consumer Products 2) Professional Products, excl. Power Cutters and Diamond Tools
+ 1%
+ 3%
North America
Asia
Australia
Europe
Brazil
Coreappliances
Vacuumcleaners
Food service
Outdoorproducts
+ 5% 1)+ 5% 2)
+ 2%
- 2% 1)
+ 0% 2)
+ 3%
+ 3%
Coreappliances
Vacuumcleaners
Outdoorproducts
Coreappliances
- 4%China
- 4%Core appliances
+ 1%
31
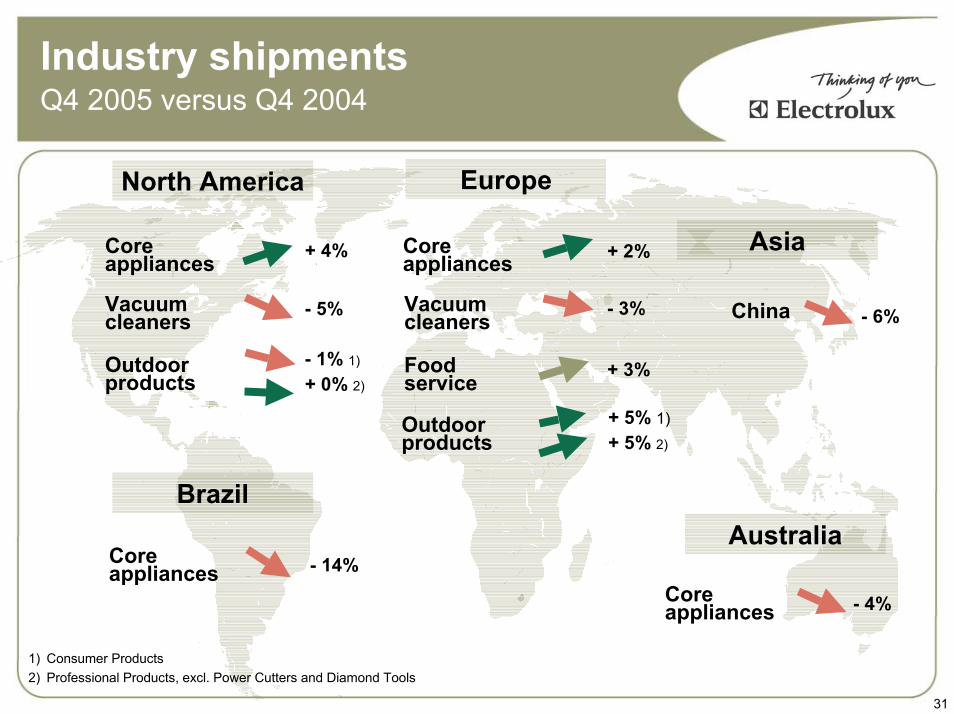
Industry shipmentsQ4 2005 versus Q4 2004
1) Consumer Products 2) Professional Products, excl. Power Cutters and Diamond Tools
+ 2%
+ 3%
- 3%
North America
Asia
Australia
Europe
Brazil
Coreappliances
Vacuumcleaners
Food service
Outdoorproducts
+ 5% 1)+ 5% 2)
+ 4%
- 1% 1)
+ 0% 2)
- 14%
- 5%
Coreappliances
Vacuumcleaners
Outdoorproducts
Coreappliances
- 6%China
- 4%Core appliances
32
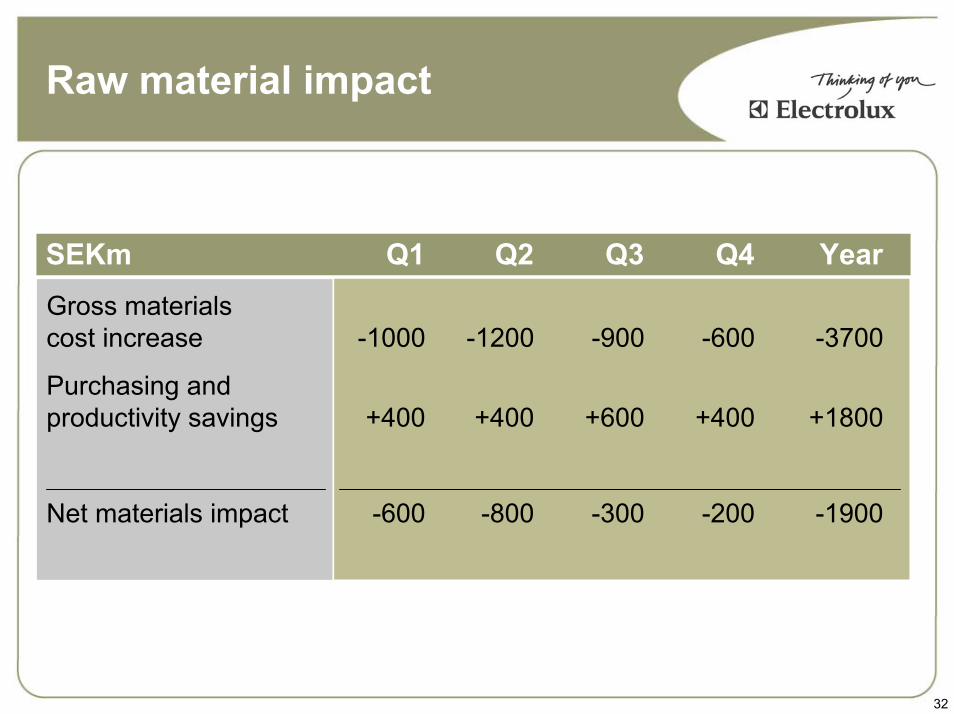
Raw material impact
SEKm Q1 Q2 Q3 Q4 YearGross materialscost increase -1000 -1200 -900 -600 -3700
Purchasing and productivity savings +400 +400 +600 +400 +1800
Net materials impact -600 -800 -300 -200 -1900