february 1, 2016 economic and fiscal impacts of the medicaid …bber.unm.edu › media ›...
TRANSCRIPT

1
Economic and Fiscal Impacts of the Medicaid Expansion in New Mexico
Lee A. Reynis PhD
February 1, 2016
FUNDRAISING PROVIDED BY: New Mexico Center on Law and Poverty
Reynis Analytics

2

3
Acknowledgements I received help and encouragement from many, without which it would have been absolutely impossible to do the analysis which follows. As I started this project, I was only too aware that I was an out-sider and not part of those working hard to manage this huge insurance program and make the Medicaid Expansion work for New Mexico. I could pull data from one public source after another for analysis but without access to good information on what was actually happening here on the ground my analysis would be meaningless. I had been watching the evolution of the Medicaid Expansion from afar. I knew that the burgeoning enrollment and costs of the program was a cause for consternation and wanted to update the analysis I had done back in 2012. To push things along, I promised to help organize a session on the Affordable Care Act and to do a presentation at the fall meeting of the Association of University Bureaus of Economic and Business Research, where I had presented on the same topic in 2012. I am grateful to the comments and insights of my colleagues in AUBER, those presenting and those in the audience. Initially, I had no funding for this research effort but when the New Mexico Center for Law and Poverty heard that I was tackling this topic again, they promised once again to provide some funding, which has been much appreciated. Abuko Estrada and Sireesha Manne, attorneys on their staff, provided many thoughtful comments and feedback. I am grateful to the Legislative Finance Committee and the Health and Human Services Committee for providing time during their fall legislative hearings for preliminary presentations. I am also particularly grateful Christine Boerner from the Legislative Finance Committee (LFC) staff for providing encouragement early on and for sharing information and contacts. John Clark from the LFC staff along with Shawna Maestas, Financial Audit Bureau Chief in the Office of the Superintendent of Insurance, helped me to piece together information on insurance taxes and the status of the NM Medical Insurance Care Pool. Jenny Felmbly (LFC) helped me pull together information on uncompensated care and pointed me in helpful directions regarding state funding for the new Safety Net Care Pool. I really could not have done this work, however, without cooperation from people in the Human Services Department who shared their worksheets and projections. Special thanks are in order to Lucinda Sydow, Bureau Chief, Budget Planning & Reporting, Jason Sanchez, Deputy Director, Medical Assistance Division, and to HSD Secretary Brent Earnest. I have also appreciated getting input from those who work daily with health care providers. Jeff Dye from the NM Hospital Association has helped me to understand how the Medicaid Expansion is playing out for hospitals around the state, and particularly those in rural areas. Randy Marshall from the NM Medical Society has once again given me assistance in trying to estimate the gross receipts tax impacts on physicians. Finally, special thanks must go to the Bureau of Business and Economic Research and to Director Jeff Mitchell. Throughout this project, I have worked from my old office, with the benefits of a good computer and computer support, a phone, and access to other economists. I appreciate once again support provided by economic impact guru Dr. Doleswar Bhandari, who assisted with IMPLAN runs on the medical and insurance sectors critical to my quantitative analysis.

4
I have received support and assistance from many quarters. I alone must take responsibility for any errors in interpretation or analysis. -- Lee A. Reynis

5
TABLE OF CONTENTS
Acknowledgements…………………………………………………………………………………………. 3 Introduction………………………………………………………………………………………………………..6
1. Medicaid Expansion .......................................................................................... 9
2. Impacts of the Medicaid Expansion .............................................................. . 14 Health Insurance Coverage, Access & Uncompensated Care……………………… 14
Evidence of Impacts of the Affordable Care Act and the Medicaid Expansion on the New Mexico Economy……………………………………………………………………… 17 3. Modeling the Economic Impacts of the Medicaid Expansion..…………………….. 24 Methodology Economic Impacts – Indirect & Induced Effects and the Multiplier……………… 29
4. The Impacts on the State's General Fund……………………………………………………. 33
5. Conclusion………………………………………………………………………………………………….. 38

6
Introduction
This report updates a previous analysis performed by UNM BBER on the likely impacts of Medicaid Expansion in New Mexico. Under the Patient Protection and Affordable Care Act (ACA) as enacted on March 23, 2010, states were required to extend Medicaid coverage to low-income adults under 65 years old with incomes up to 133% percent of the poverty level (138% after income disregards). However, the Supreme Court held that the federal government cannot withhold current Medicaid funding should a state decide to opt out of the Medicaid Expansion. When the previous report was written, New Mexico had not decided whether to implement the Medicaid Expansion. Subsequently, in January 2013, Governor Susana Martinez announced her decision to have New Mexico participate in the expansion. This report examines:
1. The additional flow of federal Medicaid dollars to the State of New Mexico since January 2014 as more and more eligible adults signed up to participate in the Medicaid Expansion and provides projections for the program through State Fiscal Year 2021. The projections through FY 2020 are based on enrollment and cost projections by the NM Health and Human Services Department (HSD) in December 2015. Details are in many cases informed by HSD projections that were made in conjunction with their September submission for the 2017 Budget cycle.
2. Related to the ACA and the Medicaid Expansion, changes in federal and state programs
designed to cover uncompensated care.
3. The emerging economic data that reflect the impacts of the Medicaid Expansion to date.
4. An analysis of the economic impacts on New Mexico of the Medicaid Expansion
(including new job creation) since implementation in 2014 and as may be expected between now and 2021.
5. Actual and anticipated impacts of the Medicaid Expansion on the State General Fund.
The report begins with a discussion of the Medicaid Expansion in New Mexico, where enrollments have considerably exceeded expectations, and includes current projections of future enrollments, costs, and of factor affecting the net flow of federal dollars into the state. The total amount of new federal dollars due to the Medicaid expansion is expected to exceed $11 billion between FY14 and FY21. Under the ACA, the Federal government picks up 100% of the costs of extending Medicaid coverage to newly eligible adults at or below 138% of poverty for the first three years, calendar
7
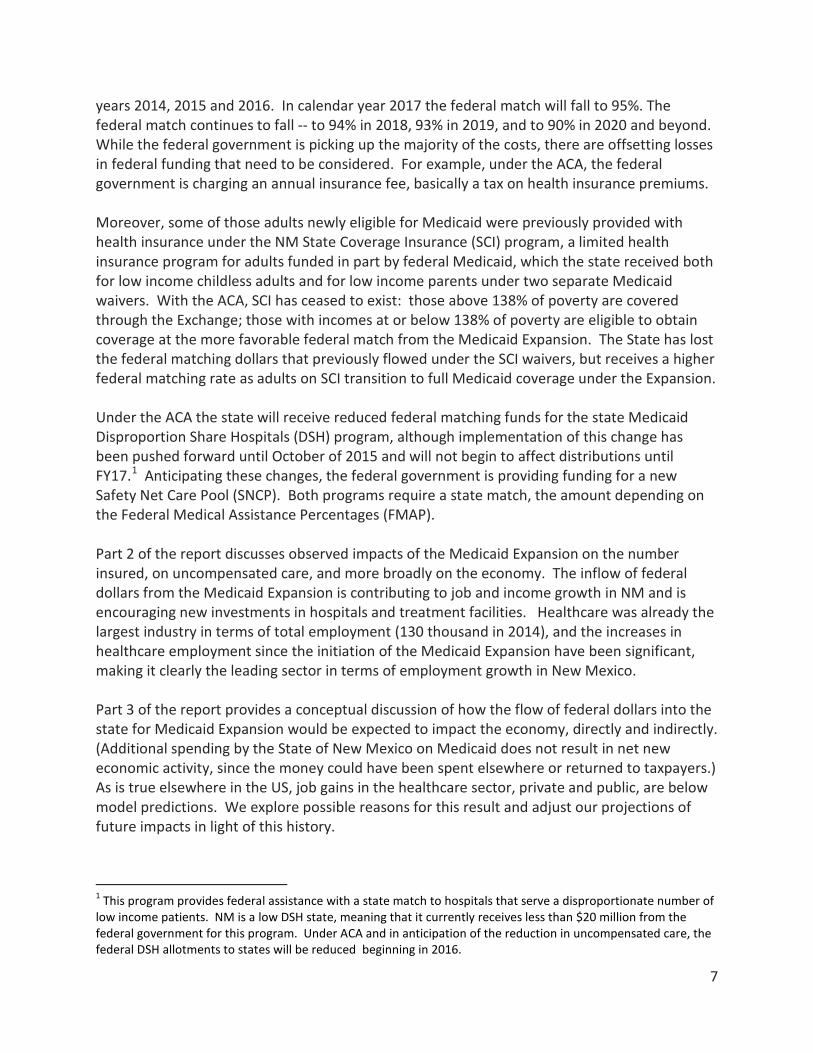
years 2014, 2015 and 2016. In calendar year 2017 the federal match will fall to 95%. The federal match continues to fall -- to 94% in 2018, 93% in 2019, and to 90% in 2020 and beyond. While the federal government is picking up the majority of the costs, there are offsetting losses in federal funding that need to be considered. For example, under the ACA, the federal government is charging an annual insurance fee, basically a tax on health insurance premiums. Moreover, some of those adults newly eligible for Medicaid were previously provided with health insurance under the NM State Coverage Insurance (SCI) program, a limited health insurance program for adults funded in part by federal Medicaid, which the state received both for low income childless adults and for low income parents under two separate Medicaid waivers. With the ACA, SCI has ceased to exist: those above 138% of poverty are covered through the Exchange; those with incomes at or below 138% of poverty are eligible to obtain coverage at the more favorable federal match from the Medicaid Expansion. The State has lost the federal matching dollars that previously flowed under the SCI waivers, but receives a higher federal matching rate as adults on SCI transition to full Medicaid coverage under the Expansion. Under the ACA the state will receive reduced federal matching funds for the state Medicaid Disproportion Share Hospitals (DSH) program, although implementation of this change has been pushed forward until October of 2015 and will not begin to affect distributions until FY17.1 Anticipating these changes, the federal government is providing funding for a new Safety Net Care Pool (SNCP). Both programs require a state match, the amount depending on the Federal Medical Assistance Percentages (FMAP). Part 2 of the report discusses observed impacts of the Medicaid Expansion on the number insured, on uncompensated care, and more broadly on the economy. The inflow of federal dollars from the Medicaid Expansion is contributing to job and income growth in NM and is encouraging new investments in hospitals and treatment facilities. Healthcare was already the largest industry in terms of total employment (130 thousand in 2014), and the increases in healthcare employment since the initiation of the Medicaid Expansion have been significant, making it clearly the leading sector in terms of employment growth in New Mexico. Part 3 of the report provides a conceptual discussion of how the flow of federal dollars into the state for Medicaid Expansion would be expected to impact the economy, directly and indirectly. (Additional spending by the State of New Mexico on Medicaid does not result in net new economic activity, since the money could have been spent elsewhere or returned to taxpayers.) As is true elsewhere in the US, job gains in the healthcare sector, private and public, are below model predictions. We explore possible reasons for this result and adjust our projections of future impacts in light of this history.
1 This program provides federal assistance with a state match to hospitals that serve a disproportionate number of low income patients. NM is a low DSH state, meaning that it currently receives less than $20 million from the federal government for this program. Under ACA and in anticipation of the reduction in uncompensated care, the federal DSH allotments to states will be reduced beginning in 2016.

8
Part 4 of the report provides BBER calculations of fiscal impacts, focusing on the State’s General Fund. While the federal government picks up 100% of the Medicaid Expansion costs for the first three years, the federal participation rate declines gradually to 90% for calendar 2020 and beyond, with the State picking up the balance required. In addition, there are expenditures for program administration, where the match is 50%, and for the new Safety Net Care Pool. These new costs are partially offset by the phasing out of existing programs, like State Coverage Insurance. Critical in terms of covering these new costs, the Expansion and the associated additional economic activity generate new revenues from existing taxes and fees (e.g., the Insurance Premium Tax, the Gross Receipts Tax, and the Personal Income Tax) that accrue to the State General Fund. Gains may also be expected through the partial phasing out of the state’s high risk pool which currently serves adults many of whom have already been or will be transferred to Medicaid. Overall, the Medicaid Expansion and associated programs generate a surplus of over $300 million for the General Fund between FY14-FY21. BBER does project a small deficit of just over $50 million in FY21, when the State participation reaches the full 10%. However, our estimates of revenues are conservative, focusing on direct effects. We do not include indirect effects; nor have we included estimates of the gross receipts taxes on the spending of the thousands of new health care workers hired in response to the increased demand for health care services.

9
1. Medicaid Expansion
The estimates used as a basis for the analysis presented in this report are estimates of the actual number of Medicaid Expansion enrollees and associated Medicaid costs developed by the NM Human Services Department (HSD) Medical Assistance Division in the summer and fall of 2015. BBER was provided estimates of actual enrollments and costs in FY 14 and in FY 15, and with projections of enrollment and spending through FY 20. As is evident in Figure 1.1 and Table 1.1, enrollment in the Medicaid Expansion in New Mexico has considerably exceeded expectations back in 2012 even under HSD’s High Scenario. According to a Kaiser Commission report, “Across all states implementing the ACA Medicaid expansion in FY 14 and FY 15, [total Medicaid] enrollment growth averaged 12.2 percent and 18.0 percent, respectively, well above national averages.”2 It is likely that at least some of the unanticipated enrollment may also have occurred as adults went into the Health Insurance Exchange to purchase insurance in compliance with the ACA and discovered their eligibility for Medicaid. The dismal performance of the New Mexico economy over the past few years has also undoubtedly contributed to a swelling in the ranks of those eligible for the program in this state.
Figure 1.1 Actual vs Projected Enrollments in the Medicaid Expansion
UNM BBER graph based on HSD 2012 and 2015 data
2 Kaiser Commission on Medicaid and the Uninsured, “Implementing the ACA: Medicaid Spending & Enrollment Growth for FY 2014 and FY 2015, Executive Summary”, p. 2.

10
Table 1.1 Actual Enrollment in NM Medicaid Expansion, Fiscal Years 2014 and 2015, Projected Enrollment FY 2016
Table 1.2 lays out the details of a scenario for the flow federal dollars related to the Medicaid Expansion through FY21, when 267 thousand are expected to be enrolled. We have used HSD data on actual Medicaid Expansion enrollments and expenditures through FY15 and their projections of enrollments and costs through FY20. This latest set of projections from HSD reflects a new Medicaid Waiver in which HSD successfully negotiated an increase in Medicaid Hospital Inpatient Rates that averages roughly $143 million on an annual basis. These projections are subject to change but they create a credible baseline scenario. We have added a column of data for FY 21, the first fiscal year in which the federal share will be 90% and the state share 10%. Our projection posits very moderate growth in the program in FY 21. Note that the total costs of the Medicaid Expansion over the 8-year period FYs 14–21 are projected to be $12.1 billion. The federal share of these costs as laid out explicitly in the ACA would be $11.5 billion, or just over 95.1%. However, the estimated bottom line net flow of new federal dollars into New Mexico as a result of the Medicaid Expansion is $11.1 billion over 8-years. As briefly discussed above and as detailed in the table, from the $11.5 billion federal share of the Medicaid Expansion, it is necessary to subtract: (1) the Federal Annual Insurance Fee mandated by the ACA that must now be paid on Medicaid health insurance premiums; (2) the expected flow of federal dollars that would have supported NM’s State Coverage Insurance (SCI) program, which has gone away; and (3) projected future losses in federal funding for the Medicaid Disproportion Share Hospitals (DSH) program. As a replacement for the lost DSH payments, the federal government has established the Safety Net Care Pool (SNCP), with an FMAP for NM of the same 70.5 as applies to DSH. The inflow of federal dollars for this program and the related SNCP Hospital Quality Improvement Initiative (HQII) is expected to total just under $385 million through FY 21. Bottom line, after making the appropriate adjustments, the total net flow of federal dollars to New Mexico over the period FY 14 – FY 21 is estimated to be $11.1 billion.
FY 2014 FY 2015 FY 20166 mos Prelim Projected
Actual and HSD Projected Enrollment 154,626 223,904 249,484
Low Uptake 101,910 107,427 112,873 as a % of Actual/2016 Projection 65.9% 48.0% 45.2%High Uptake 126,214 139,995 153,711 as a % of Actual/2016 Projection 81.6% 62.5% 61.6%
NM Human Services Department figures, BBER calculations
HSD Anticipated Enrollment 2012: Newly Eligible Plus SCI Adults

11
Table 1.2 . New Mexico Medicaid Expansion, Actual and Projected ($Millions)
Fiscal Years 2014 (6 m) 2015 2016 2017 2018 2019 2020 2021 2014-21
Enrollment1 154,626 223,904 249,484 261,585 263,107 264,287 265,625 267,000 267,000 44.8% 11.4% 4.9% 4.0% 2.0% 0.5% 0.5%
Cost per person1 $3,005 $5,972 $6,251 $6,170 $6,427 $6,617 $6,795 $6,97811.6% 4.7% -1.3% 4.2% 3.0% 2.7% 2.7%
Total Costs1 $442.1 $1,349.2 $1,483.5 $1,633.5 $1,714.6 $1,772.5 $1,828.6 $1,863.1 $12,087.0205.2% 10.0% 10.1% 5.0% 3.4% 3.2% 1.9%
Federal Share3 $442.1 $1,349.2 $1,483.5 $1,592.6 $1,620.3 $1,657.3 $1,673.2 $1,676.8 $11,494.9 Percent of Total 100.0% 100.0% 100.0% 97.5% 94.5% 93.5% 91.5% 90.0% 95.1% Minus: Federal Annual Insur Fee4 ($11.1) ($33.7) ($37.1) ($39.8) ($40.5) ($41.4) ($41.8) ($41.9) ($287.4) Minus: Fed Share SCI5 ($37.1) ($70.6) ($63.5) ($57.2) ($51.5) ($46.3) ($41.7) ($37.5) ($405.4) Minus: Fed DSH Lost 6 $0.0 $0.0 $0.0 ($0.2) ($4.5) ($9.5) ($14.5) ($20.0) ($48.7)
Plus: Safety Net Care Pool 7 $47.7 $24.0 $48.5 $48.6 $48.6 $48.6 $48.6 $48.6 $363.2 Plus: HQII 8 $0.0 $1.0 $2.0 $4.1 $6.2 $8.4 $0.0 $0.0 $21.7
NET FLOW OF FEDERAL DOLLARS $441.6 $1,269.9 $1,433.3 $1,548.1 $1,578.6 $1,617.1 $1,623.8 $1,625.9 $11,138.4
8. New federal dollars from SNCP Hospital Quality Improvement Incentive. This is a 5-year program.UNM BBER Estimates based on HSD Projections through Fiscal 2020. Detail only available through FY 17 for Satet Net Care Pool. Other sources indicated.
5. The Medicaid Expansion picks up the care of some of those previously covered under a state plan run by HSD, State Coverage Insurance (SCI), with federal funding from Medicaid. This latter flow disappears with the Medicaid Expansion.6. Federal Funding from Disproportionate Share Hospital program was reduced in ACA, since the Mediciad Expansion will pick up care previously uncompensated. 7. New federal dollars from Safety Net Care Pool (SNCP) to replace DSH program.
1. FYs 14-20 are NM Human Services Department (HSD) estimates (Dec 2015).2. Cost per person is an average as calculated. Amount depends on number of new enrollees, also gender and age composition, also on when people sign-up.3. As laid out in Affordable Care Act (ACA), although actual share slightly higher since Native Americans using Indian Health Service are covered 100%.4. As mandated under Affordable Care Act. Per NM estimates in Milliman Report, assumes premium increase to cover tax is 2.5% and that the share paid by the Federal Governtment is equal to their share of total Medicaid Expansion costs.

12
Table 1.3 presents a similar analysis for the State of New Mexico, breaking down the data on actual and projected State costs of the Medicaid Expansion and related programs. To the Expansion program costs we have added the State share of administrative costs. HSD estimated in 2012 that the State costs of administering the Medicaid Expansion would be $2.8 million per year. From materials provided by HSD in December, we now understand that their administrative costs are assumed to be roughly 2% of total expenditures. From further research we understand, regardless of the FMAT and with limited exceptions, these administrative costs are shared 50-50.3 The state has saved money with the elimination of the State Coverage Insurance (SCI) program. Nearly all adults in SCI were expected to receive coverage through the Medicaid Expansion.4 We estimate that after accounting for these savings, state net spending on the program itself through FY21 would have been almost $300 million. The State also saves on the Disproportionate Share Hospital Program, which is going away, but incurs new costs for their share of the Safety New Care Pool, including their share of the Hospital Quality Improvement Initiative (HQII). With these changes, the net costs to the State total $790 million over the period FY 14 to FY 21. It is important to note that these estimates for State expenditures do not take into account of new revenues generated. (See Fiscal Impact below.) It also should be noted that these numbers do not reflect the impact on State expenditures of the “Woodwork Effect” under which those who were eligible for Medicaid but not enrolled come out of the woodwork as implementation of the ACA proceeds. This effect might be expected with or without the Medicaid expansion. While this effect may be a consideration in discussing the impacts of the ACA on State expenditures, our focus is specifically on the effects of Medicaid Expansion.
3 BBER appreciates Sireesha Mann’s research on this question. Here are the relevant citations: https://www.medicaid.gov/medicaid-chip-program-information/by-topics/financing-and-reimbursement/medicaid-administrative-claiming.html, https://kaiserfamilyfoundation.files.wordpress.com/2013/01/8352.pdf. Paragraph 1) and the other federal matches for administrative costs (Paragraph 7) of https://www.ssa.gov/OP_Home/ssact/title19/1903.htm Here is guidance from HHS on how to calculate FMAP, that states in the opening summary that it only applies to expenditures for medical assistance, and that there is a separate federal matching rate for Medicaid administrative costs: https://aspe.hhs.gov/basic-report/fy2016-federal-medical-assistance-percentages 4 HSD estimates that 94% of current SCI enrollees would be eligible for coverage under the Medicaid Expansion. See HSD chart, Medicaid under Healthcare Reform by State Fiscal Year with Different Up Take Rates (May 2012), page 2 with “Low Uptake Scenario”, footnote 5.

13
Table 1.3 . New Mexico Medicaid Expansion, Actual and Projected State Expenditures ($Millions)
Fiscal Years 2014 (6 m) 2015 2016 2017 2018 2019 2020 2021 2014-21
Enrollment1 154,626 223,904 249,484 261,585 263,107 264,287 265,625 267,000 267,000 44.8% 11.4% 4.9% 4.0% 2.0% 0.5% 0.5%
Cost per person1 $3,005 $5,972 $6,251 $6,170 $6,427 $6,617 $6,795 $6,97811.6% 4.7% -1.3% 4.2% 3.0% 2.7% 2.7%
Total Costs1 $442.1 $1,349.2 $1,483.5 $1,633.5 $1,714.6 $1,772.5 $1,828.6 $1,863.1 $12,087.0205.2% 10.0% 10.1% 5.0% 3.4% 3.2% 1.9%
State Share3 $0.0 $0.0 $0.0 $40.8 $94.3 $115.2 $155.4 $186.3 $592.1 Percent of Total 0.0% 0.0% 0.0% 2.5% 5.5% 6.5% 8.5% 10.0% 4.9% Plus: Administrative Costs $4.4 $13.5 $14.8 $16.3 $17.1 $17.7 $18.3 $18.6 $120.9 Minus: State Share SCI5 ($30.1) ($57.2) ($51.5) ($46.3) ($41.7) ($37.5) ($33.8) ($30.4) ($328.5) Minus: Fed DSH Lost 6 $0.0 $0.0 $0.0 ($0.2) ($4.5) ($9.5) ($14.5) ($20.0) ($48.7)
Plus: State Share Safety Net Care $47.7 $24.0 $48.5 $48.6 $48.6 $48.6 $48.6 $48.6 ($256.3) Plus: State Share HQII 8 $0.0 $1.0 $2.0 $4.1 $6.2 $8.4 $0.0 $0.0 $21.7
State Costs $22.0 ($18.7) $13.8 $63.3 $120.1 $143.0 $174.1 $203.1 $720.7
4. State share of administrative costs is 50%.
8. New federal dollars from SNCP Hospital Quality Improvement Incentive UNM BBER Estimates based on HSD Projections through Fiscal 2020. Detail only available through FY 17 for Satet Net Care Pool. Other sources indicated.
5. The Medicaid Expansion picks up the care of some of those previously covered under a state plan run by HSD, State Coverage Insurance (SCI), with federal funding from Medicaid. This latter flow disappears with the Medicaid Expansion.6. Federal Funding from Disproportionate Share Hospital program was reduced in ACA, since the Mediciad Expansion will pick up care previously uncompensated. 7. New federal dollars from Safety Net Care Pool (SNCP) to replace DSH program.
1. FYs 14-20 are NM Human Services Department (HSD) estimates (Dec 2015).2. Cost per person is an average as calculated. Amount depends on number of new enrollees, also gender and age composition, also on when people sign-up.3. As laid out in Affordable Care Act (ACA), although actual share slightly higher since Native Americans using Indian Health Service are covered 100%.
4. As mandated under Affordable Care Act. Per NM estimates in Milliman Report, assumes premium increase to cover tax is 2.5% and that the share paid by the Federal Governtment is equal to their share of total Medicaid Expansion costs.

14
2. Impacts of the Medicaid Expansion
The Medicaid Expansion and the Affordable Care Act are resulting in sweeping changes across the state of New Mexico. This section explores these changes, starting with health care coverage and access and moving on to a discussion of the broader impacts on the economy. Health Insurance Coverage, Access and Uncompensated Care NM has long ranked on the top of the states in terms of the percentage of the population who were uninsured. The lack of insurance is a serious barrier to accessing health care services as well as to obtaining needed prescription drugs and medical equipment.5 According to a factsheet published by the Kaiser Commission on Medicaid and the Uninsured,
Over a quarter of uninsured adults in 2014 (27%) went without needed medical care due to costs. Studies repeatedly demonstrate that the uninsured are less likely than those with insurance to receive preventive care and services for major health conditions and chronic diseases. 6
And many who receive needed treatment find themselves unable to pay for their care. Indeed, according to an article by Olga Khazan7, ‘Healthcare is the number-one cause of personal bankruptcy and is responsible for more collections than credit cards.” The two following graphs, Figures 2.1 and 2. 2 from the Kaiser “factsheet” show what has happened across the nation to rates of uninsured for the non-elderly and indicate the importance of the Medicaid Expansion in the changes observed. Particularly has been the drop in the percent uninsured among nonelderly adults. The Kaiser numbers are from the Center for Disease Control. The latest data on New Mexico are available from the recently released 2014 data from the American Community Survey. Table 2.3 presents results on the changing rates of uninsured for the total population and for adults under 65 for New Mexico and the US between 2013 and 2014, the first full year of the Medicaid Expansion. Note that in NM, the rates of uninsured fell 4.7 percentage points for the total population and an impressive 8.0 percentage points for adults 18-64.
5 Lee A. Reynis and Adelamar Alcantara, Healthcare Coverage and Access in New Mexico: An Analysis of the 1999 Health Policy Commission Statewide Household Survey of Health Care Coverage, NM Health Policy Commission, 2000. 6The Kaiser Commission on Medicaid and the Uninsured, Key Facts about the Uninsured Population, Oct 2015 (http://files.kff.org/attachment/fact-sheet-key-facts-about-the-uninsured-population) 7 Olga Khazan, “Why Americans Are Drowning in Medical Debt,” The Atlantic, Oct. 8, 2014 (http://www.theatlantic.com/health/archive/2014/10/why-americans-are-drowning-in-medical-debt/381163/)

15
Figure 2.1 Quarterly Uninsured Rate for the Nonelderly Population by Age, Q4 2013 - Q1 15
Figure 2.2 Percentage Point Change in Uninsured Rate among the Nonelderly Population by Selected Characteristics, 2013-2014
Kaiser Commission on Medicaid and the Uninsured, “What has been happening to the uninsured under the ACA?”, Key Facts about the Uninsured Population
16
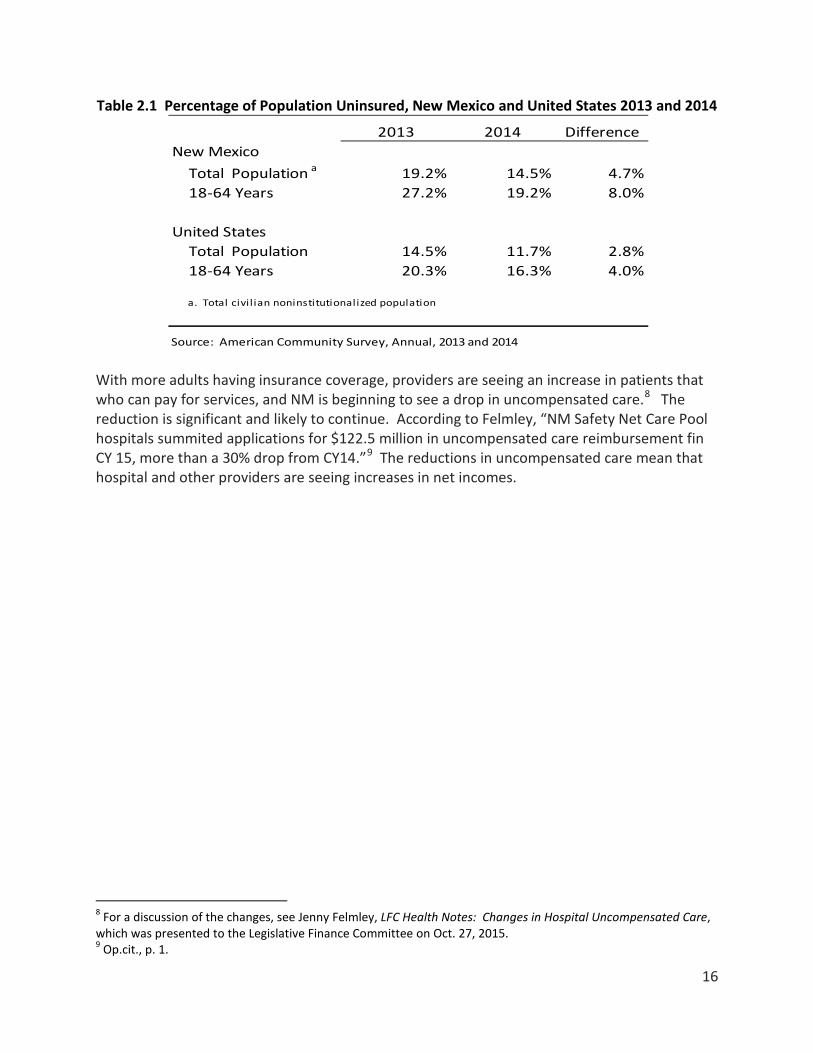
Table 2.1 Percentage of Population Uninsured, New Mexico and United States 2013 and 2014
With more adults having insurance coverage, providers are seeing an increase in patients that who can pay for services, and NM is beginning to see a drop in uncompensated care.8 The reduction is significant and likely to continue. According to Felmley, “NM Safety Net Care Pool hospitals summited applications for $122.5 million in uncompensated care reimbursement fin CY 15, more than a 30% drop from CY14.”9 The reductions in uncompensated care mean that hospital and other providers are seeing increases in net incomes.
8 For a discussion of the changes, see Jenny Felmley, LFC Health Notes: Changes in Hospital Uncompensated Care, which was presented to the Legislative Finance Committee on Oct. 27, 2015. 9 Op.cit., p. 1.
2013 2014 DifferenceNew Mexico
Total Population a 19.2% 14.5% 4.7%18-64 Years 27.2% 19.2% 8.0%
United StatesTotal Population 14.5% 11.7% 2.8%18-64 Years 20.3% 16.3% 4.0%
a. Total civil ian noninstitutionalized population
Source: American Community Survey, Annual, 2013 and 2014

17
Evidence of Impacts of the Affordable Care Act and the Medicaid Expansion on the New Mexico Economy New Mexico has long been under-served in terms of health care providers and health care facilities. The ACA included funding and provisions aimed at developing the health care infrastructure of states and at increasing the supply of health professionals. BBER is aware of investments in new facilities made possible by ACA, for example a new center that First Choice built in Los Lunas and improvements to 15 centers around the state,10 but as will be discussed, almost two years after implementation large gaps remain and providers are desperately seeking to hire doctors, nurses, and other medical professionals and often forced to pay more to attract those with the credentials and capabilities they need.11 The problem is not unanticipated but may have been intensified by the unexpectedly fast growth in eligible adults who have signed up for the Medicaid Expansion. While there have been lags in the response to increased demand for services, there is no question but the ACA and the Medicaid Expansion have had a major impact on the NM economy, increasing person income, increasing employment and income for health care workers, stimulating expansion of hospitals and health care treatment facilities. Available data on the impacts of the ACA and the Medicaid Expansion on the New Mexico economy are discussed below. Transfer Payments and Personal Income. Dr. Jeff Mitchell, UNM BBER Director, discussed the impacts Medicaid Expansion on NM personal income in his presentation to FOR-UNM subscribers in November 2015. The impacts are most dramatically seen in Figure 2.3, which is a bar chart that breaks down the growth in personal income into (1) income not attributable to transfer payments, e.g., wage and salaries, interest, dividends and rents; (2) transfer payments less Medicaid, and (3) Medicaid. The series goes back to 2010, when the federal government made huge injections of transfer payments into the economy as part of the stimulus package. The sharp fall-off in personal income in 2013 reflects losses in federal transfer payments. Beginning in 2014 with the ACA and the Medicaid Expansion, there are sharp increases in total person income and much of the increase is attributable to Medicaid and specifically the Medicaid Expansion. Indeed, Medicaid transfer payments account for between 24% (14Q1, 15Q2) and 46% (14Q4) of the increases in total NM personal income. As will be seen below, the Medicaid Expansion also works through the increases in employment required to provide services to the expanding population now covered by insurance. Associated with this Medicaid induced employment are higher wage and salary earnings and as well as higher earnings by individual proprietors who provide medical services to Medicaid recipients.
10. According to an article in Albuquerque Business First. Dec 10, 2014, “The U.S. Department of Health and Human Services …announced 15 health centers in New Mexico will receive a total of $450,225 in Affordable Care Act funding. 11 Email from Jeff Dye, CEO, NM Hospital Association and other sources. 11 Email from Jeff Dye, CEO, NM Hospital Association and other sources.

18
Figure 2.3. New Mexico Personal Income Growth and Medicaid Transfers
Jeff Mitchell, UNM Bureau of Business and Economic Research, Nov. 2015 Employment. The impacts of the ACA and particularly the Medicaid Expansion on employment in the Healthcare and Social Assistance Industry can be inferred from Figure 2.4. As the graph well illustrates, this is a sector which has seen sizeable gains in employment over the past decade – more than 3,000 annually in the years up to 2010, after which growth decelerates. It is perhaps surprising given the almost one year advance notice regarding the State’s participation in the Medicaid Expansion but growth in employment in this sector is negligible until the second half of 2014 with year-over-year gains approaching 4,000 in the final quarter. By the first quarter of 2015, the increase over a year earlier is 4,800 jobs, with almost all the growth continuing to come from the private sector.

19
Figure 2.4 Quarterly Job Gains Year Over Year in NM’s Healthcare and Social Assistance Sector, Total and Private, 2005 – 2015
Source: Quarterly Census of Employment and Wages Figure 2.5 separately graphs the jobs created in health care services and those in social assistance, which accounted for roughly 30,000 of the 130,000 jobs in the larger industry in 2014. Both sub-industries were in all likelihood affected by the Medicaid Expansion, but the growth in social assistance was more rapid than that in health care services. Indeed, the year-over-year growth rate in the first quarter of 2015 was 8.5% versus only 2.0% for health care services with social assistance picking up 2,687 jobs to the 2,029 gained in health service. The difference may reflect the greater difficulties in attracting health care workers. Given that many of the services provided under social assistance are for children, for families, and for seniors, it is difficult to argue that all the social assistance jobs created in this period are directly involved in providing services to the new enrollees in the Medicaid Expansion, but the flow of dollars into the state may have supported these various programs that provide ancillary services indirectly.
0
1,000
2,000
3,000
4,000
5,000
6,000
Total
Private

20
Figure 2.5. Quarterly Job Gains Year Over Year in NM’s Healthcare Services and Social Assistance Sub-Sectors, 2005 – 2015
Source: Quarterly Census of Employment and Wages Drilling down further, it is possible to see where the job gains in health services have been. Figure 2.6 provides year-over-year growth rates by quarter respectively for Ambulatory Services, Hospitals and Nursing and Residential Care (Home Health). Note that a cycle of rapid growth in Hospital employment has typically been accompanied by a slowdown in Ambulatory Care job growth and conversely. Since the beginning of the Medicaid Expansion, however, both of these subsectors are growing, with growth over 2% by the first quarter of 2015. Growth in
Figure 2.6. Quarterly Growth Year Over Year in Health Care Employment: Ambulatory, Hospital, and Nursing and Residential Care
Source: Quarterly Census of Employment and Wages
-1000
-500
0
500
1000
1500
2000
2500
3000
3500Health Care Services
Social Assistance
-8.0%
-6.0%
-4.0%
-2.0%
0.0%
2.0%
4.0%
6.0%
8.0%
Ambulatory
Hospitals
Nursing and Residential Care

21
Nursing and Residential Care employment is more subdued but this subindustry is not where the demand for health care services is concentrated for an adult population under 65. Since some health care providers are self-employed, not all of the growth in health care employment is captured by the Quarterly Census of Employment and Wages data. The BEA publishes quarterly data on earnings, which includes wages and salaries, supplements to wages and salaries (benefits) and proprietors’ income. No breakout is available below Health Care and Social Assistance but as is illustrated in Figure 2. 7, the graph of earnings for this industry in New Mexico shows a sharp up-tick over the course of 2014 and the first half of 2015, the same period in which enrollments in the Medicaid Expansion take off.
Figure 2. 7. Quarterly Earnings for NM Healthcare and Social Assistance Industry 2012-15, in $ Thousands
Source: US Bureau of Economic Research, Personal Income by Major
Component and Earnings by NAICS Industry, New Mexico 2012Q1 –15Q2 As noted above, Centennial Care requires that the care of Medicaid Expansion enrollees be coordinated by a Managed Care Organization (MCO). Therefore, another industry directly affected by the Medicaid Expansion is Direct Health and Medical Insurance Carriers. Detailed data from the BLS indicate that employment in this industry increased from about 2,000 to over 3,200 between the end of 2012 and the first quarter of 2015, a 60% increase. The data on employment gains here seem less impressive than some of the announcing hirings, e.g. Molina planning to hire 400 and United, 384, but there are job posting still up for all the MCOs under contract to Centennial Care. As noted above, the ACA included funding and provisions aimed at developing the health care infrastructure of states as well at increasing the supply of health professionals. BBER is aware of investments in new facilities made possible by ACA, for example a new center that First
$5,400,000
$5,500,000
$5,600,000
$5,700,000
$5,800,000
$5,900,000
$6,000,000
$6,100,000

22
Choice built in Los Lunas and improvements to 15 centers around the state,12 but almost two years after implementation large gaps remain and providers are desperately seeking to hire doctors, nurses, and other medical professionals and often forced to pay more to attract those with the credentials and capabilities they need.13 The problem is not unanticipated but may have been exacerbated by the unexpectedly fast growth in eligible adults who have signed up for the Medicaid Expansion. The ACA and the Medicaid Expansion have stimulated investment in new hospitals and health treatment facilities. Figure 2.8 presents history and Global Insight’s forecasts for investment in commercial and health care structure versus all nonresidential structures. Striking is the pickup in investment in commercial and health care structures in 2014 and beyond.
Figure 2.8. Percent Growth in US Commercial and Health Structures Investment Compared with All Nonresidential Structures
For NM, the best consistent series of detailed data on construction activity is probably the FWDodge data on construction awards. Figure 2.9 presents a graph of the award data for hospital and health treatment facilities. The biggest spike in the award data is for 2009 -10 and coincides with two major investments on the Albuquerque Westside, both in Sandoval County: Presbyterian’s investment in the Rust Medical Center, which opened in 2011, and UNM’s in the Sandoval County Regional Medical Center, which opened in 2012. There is, however, evidence of a pick-up in activity by this measure in 2014. The data for calendar 15 are only available through October and will be revised.
12 According to an article in Albuquerque Business First. Dec 10, 2014, “The U.S. Department of Health and Human Services …announced 15 health centers in New Mexico will receive a total of $450,225 in Affordable Care Act funding.
-35.0-30.0-25.0-20.0-15.0-10.0
-5.00.05.0
10.015.020.0
Commercial & Health Care
Nonresidential Structures
Source: HIS Global Insight, Baseline Forecast, September 2015

23
Figure 2.10. New Mexico Hospital and Health Treatment Facilities $1,000s
Source: FWDodge Construction Awards So far for 2015 in NM and using the Build Central online database, we have identified $10.5 million in unique completed projects for hospitals and health treatment facilities, excluding nursing homes: $230 million under construction, over $200 million with a ground breaking, and $740 million that are otherwise in the planning stages. Projects include acute care hospitals, medical offices, urgent care facilities, long-term treatment and rehab facilities, community and specialty clinics, and dialysis centers.
$0
$50,000
$100,000
$150,000
$200,000
$250,000
$300,000
2006 2007 2008 2009 2010 2011 2012 2013 2014 2015
24
3. Modeling the Economic Impacts of the Medicaid Expansion
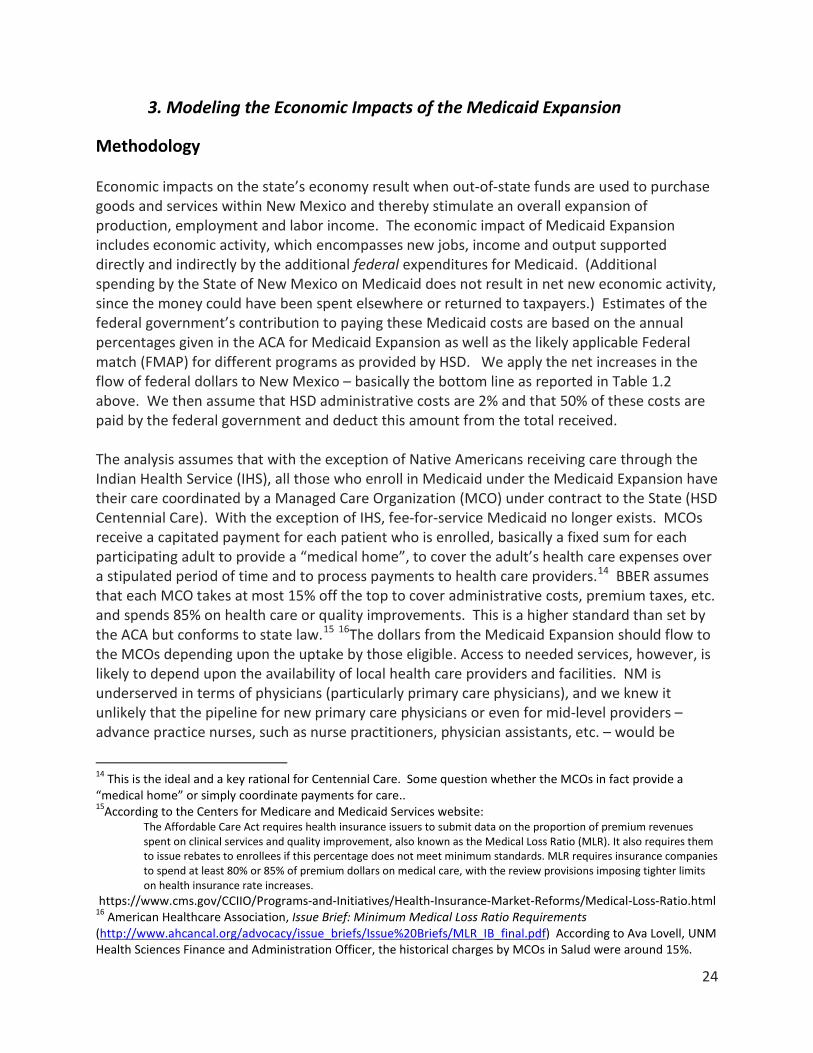
Methodology Economic impacts on the state’s economy result when out-of-state funds are used to purchase goods and services within New Mexico and thereby stimulate an overall expansion of production, employment and labor income. The economic impact of Medicaid Expansion includes economic activity, which encompasses new jobs, income and output supported directly and indirectly by the additional federal expenditures for Medicaid. (Additional spending by the State of New Mexico on Medicaid does not result in net new economic activity, since the money could have been spent elsewhere or returned to taxpayers.) Estimates of the federal government’s contribution to paying these Medicaid costs are based on the annual percentages given in the ACA for Medicaid Expansion as well as the likely applicable Federal match (FMAP) for different programs as provided by HSD. We apply the net increases in the flow of federal dollars to New Mexico – basically the bottom line as reported in Table 1.2 above. We then assume that HSD administrative costs are 2% and that 50% of these costs are paid by the federal government and deduct this amount from the total received. The analysis assumes that with the exception of Native Americans receiving care through the Indian Health Service (IHS), all those who enroll in Medicaid under the Medicaid Expansion have their care coordinated by a Managed Care Organization (MCO) under contract to the State (HSD Centennial Care). With the exception of IHS, fee-for-service Medicaid no longer exists. MCOs receive a capitated payment for each patient who is enrolled, basically a fixed sum for each participating adult to provide a “medical home”, to cover the adult’s health care expenses over a stipulated period of time and to process payments to health care providers.14 BBER assumes that each MCO takes at most 15% off the top to cover administrative costs, premium taxes, etc. and spends 85% on health care or quality improvements. This is a higher standard than set by the ACA but conforms to state law.15 16The dollars from the Medicaid Expansion should flow to the MCOs depending upon the uptake by those eligible. Access to needed services, however, is likely to depend upon the availability of local health care providers and facilities. NM is underserved in terms of physicians (particularly primary care physicians), and we knew it unlikely that the pipeline for new primary care physicians or even for mid-level providers – advance practice nurses, such as nurse practitioners, physician assistants, etc. – would be
14 This is the ideal and a key rational for Centennial Care. Some question whether the MCOs in fact provide a “medical home” or simply coordinate payments for care.. 15According to the Centers for Medicare and Medicaid Services website:
The Affordable Care Act requires health insurance issuers to submit data on the proportion of premium revenues spent on clinical services and quality improvement, also known as the Medical Loss Ratio (MLR). It also requires them to issue rebates to enrollees if this percentage does not meet minimum standards. MLR requires insurance companies to spend at least 80% or 85% of premium dollars on medical care, with the review provisions imposing tighter limits on health insurance rate increases.
https://www.cms.gov/CCIIO/Programs-and-Initiatives/Health-Insurance-Market-Reforms/Medical-Loss-Ratio.html 16 American Healthcare Association, Issue Brief: Minimum Medical Loss Ratio Requirements (http://www.ahcancal.org/advocacy/issue_briefs/Issue%20Briefs/MLR_IB_final.pdf) According to Ava Lovell, UNM Health Sciences Finance and Administration Officer, the historical charges by MCOs in Salud were around 15%.

25
cranked up in time to meet the demands in New Mexico and, simultaneously, in the rest of the country.17 The economic impacts on New Mexico of the flow of federal dollars under the Medicaid Expansion depend critically on how much of the anticipated additional demand for health care services can actually be met by providers working out of facilities in New Mexico. Many New Mexicans in Southeast New Mexico currently meet their health care needs by journeying to Lubbock, Texas, or some other major medical center. Under what conditions would Medicaid pay for care provided by out-of-state providers, and is out-of-state care likely to be a realistic option for those newly covered under Medicaid? There could be transportation issues and program participants might also encounter difficulties in taking time off from work, arranging childcare, etc. Historically, states have strictly limited the amount they will pay to out-of-state providers to care for their Medicaid patients.18 Nonetheless, and in light of the gaps between the model forecasts and observed increases in employment and labor income discussed below, questions remain at to where the billions of dollars that have come into NM for the Medicaid Expansion have gone. In modeling the economic impacts of the Medicaid expansion, BBER has made use of the IMPLAN Pro 3 Model and proprietary databases on New Mexico for which BBER holds a license. IMPLAN is a proprietary regional economic model that is widely used in economic impact analysis. As previously stated, we assume that the MCOs take 15% off of the top to cover administrative expenses, including taxes, coordination of care, payment processing, etc., and have modeled the 15% by using an IMPLAN sector that captures production information for accident and health insurance companies. For working age adults, we have identified three major IMPLAN health care sectors that are likely to provide services: (1) hospitals, (2) offices of physicians and other health care providers, and (3) a category that includes outpatient care centers, medical and diagnostic laboratories and other ambulatory health care services, but have also included home health and nursing home care to capture any use that might be made of these services. We developed estimates of each subindustry’s share of total output, examining data on NM and the allocations used in other studies. Seventy percent of adult needs are assumed to be met by the medical services enumerated above.19 Adults obviously will also need access to prescription drugs, and they may occasionally need access to medical equipment. Such needs may be met by mail order; they may be met locally but based on the IMPLAN runs, the impacts on the local economy are likely to be relatively small. We take off 30% of the Medicaid dollars to cover the amounts likely to be paid for
17 In an email, Jeff Dye provided a nice example of some of the problems. “The thinking was that more coverage would mean patients would be more likely to use PCPs [primary care providers] rather than emergency rooms. Not true. Why? His answer: “ i. There are not enough PCPs; ii. The newly insured still see ED’s [emergency rooms] as their primary source of care; and iii. There is little incentive for Medicaid recipients to not use the ED. (my insurance card says I’ll have to pay a co-pay of $250 to go to an ED. No such limitation on Medicaid patients.).” 18 Conversation with Ava Lovell, UNM HSC. 19 Major hospitals like Presbyterian are integrated healthcare service providers, offering the range of health care services that may be needed by the newly eligible adults.
26
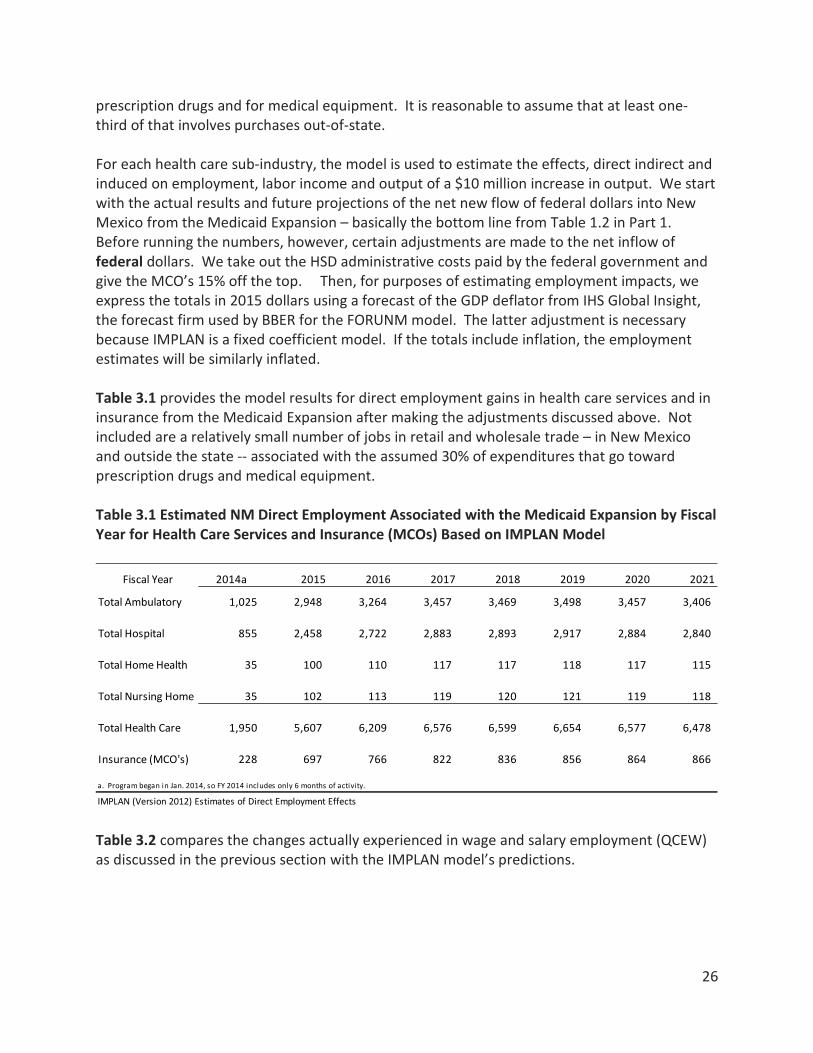
prescription drugs and for medical equipment. It is reasonable to assume that at least one-third of that involves purchases out-of-state. For each health care sub-industry, the model is used to estimate the effects, direct indirect and induced on employment, labor income and output of a $10 million increase in output. We start with the actual results and future projections of the net new flow of federal dollars into New Mexico from the Medicaid Expansion – basically the bottom line from Table 1.2 in Part 1. Before running the numbers, however, certain adjustments are made to the net inflow of federal dollars. We take out the HSD administrative costs paid by the federal government and give the MCO’s 15% off the top. Then, for purposes of estimating employment impacts, we express the totals in 2015 dollars using a forecast of the GDP deflator from IHS Global Insight, the forecast firm used by BBER for the FORUNM model. The latter adjustment is necessary because IMPLAN is a fixed coefficient model. If the totals include inflation, the employment estimates will be similarly inflated. Table 3.1 provides the model results for direct employment gains in health care services and in insurance from the Medicaid Expansion after making the adjustments discussed above. Not included are a relatively small number of jobs in retail and wholesale trade – in New Mexico and outside the state -- associated with the assumed 30% of expenditures that go toward prescription drugs and medical equipment. Table 3.1 Estimated NM Direct Employment Associated with the Medicaid Expansion by Fiscal Year for Health Care Services and Insurance (MCOs) Based on IMPLAN Model
Table 3.2 compares the changes actually experienced in wage and salary employment (QCEW) as discussed in the previous section with the IMPLAN model’s predictions.
Fiscal Year 2014a 2015 2016 2017 2018 2019 2020 2021
Total Ambulatory 1,025 2,948 3,264 3,457 3,469 3,498 3,457 3,406
Total Hospital 855 2,458 2,722 2,883 2,893 2,917 2,884 2,840
Total Home Health 35 100 110 117 117 118 117 115
Total Nursing Home 35 102 113 119 120 121 119 118
Total Health Care 1,950 5,607 6,209 6,576 6,599 6,654 6,577 6,478
Insurance (MCO's) 228 697 766 822 836 856 864 866
a. Program began in Jan. 2014, so FY 2014 includes only 6 months of activity.
IMPLAN (Version 2012) Estimates of Direct Employment Effects

27
Table 3.2. Actual Gains in Wage and Salary Health Care Employment Versus Implan Model Predictions for FY14 and the First Three Quarters of FY15
As noted above, some health care workers may be self-employed and would not be included in the QCEW wage and salary employment, but inclusion of these workers is not likely to narrow significantly the gap between actual and expected employment. The 2013 Nonemployer Statistics from the US Census Bureau that originate in data for the Internal Revenue Service tax return information, indicate that there were 7,088 nonemployers providing health care services. Data for 2014 are not yet available. The number of nonemployers in health services in NM shrank by 10 between 2012 and 2013. Table 3.3 compares the actual gains in earnings. We are using the BEA data because it provides a full year of data for FY 15 and also because it includes self-employed. The earnings data are quarterly but are seasonally adjusted annual rates. Unfortunately, no finer breakout was available from BEA than Health Care and Social Assistance. We know that social assistance employment grew rapidly over this period, so the gap between actual gains for Health Care and those predicted by the IMPLAN model could be considerably larger. Table 3.3. Actual Gains in Health Care and Social Assistance Earnings Compared with Implan
Model Predictions for Health Care Services ($Thousands)
As the data presented in the two previous tables indicate, actual employment and labor income gains for workers in health care services are both considerably below model expectations. This
2014 Q1 99,247 3332014 Q2 100,289 1,729FY14 Average 99,768 1,031 1,950 919 2014 Q3 100,880 1,8832014 Q4 100,880 2,3622015 Q1 100,625 1,378FY15 Average 100,795 1,874 5,607 3,733
Source of Data: NM DWS, QCEW, BBER Estimates based on Implan Model
Health Care W&S Employment
QCEW
Change Over Year Earlier
Additional Expected
Direct Difference
2014 Q1 $5,696,952 $64,4602014 Q2 $5,760,872 $112,612FY14 Average $5,728,912 $88,536 $140,258 $51,7222014 Q3 $5,815,540 $159,2962014 Q4 $5,896,508 $216,3762015 Q1 $5,985,459 $288,5072015 Q2 $5,988,422 $227,550FY15 Average $5,921,482 $222,932 $403,320 $180,388
Source of Data: US BEA, Quarterly Earnings by NAICS Sector; BBER Estimates based on Implan Model
Additional Expected Direct Earnings
(IMPLAN)Difference
Total Health Care Earnings
Change Over Year Earlier

28
finding is not unique to New Mexico but has been observed elsewhere across the US.20 In explaining this result, prior to the ACA many uninsured people in NM and other states who needed care did actually receive medical attention but the care was uncompensated. Quite a few New Mexican may also have gone out-of-state, perhaps to Mexico, to get care at a price that was more affordable. Other factors may be at work. Virtually all areas of the map in New Mexico have been designated Health Professional Shortage Areas – for primary care, dental care, and mental health services – by the Health Resources and Services Administration of the US Department of Health and Human Services.21 New Mexico’s serious capacity constraints, particularly outside of Albuquerque/Santa Fe/Los Alamos have also been discussed in annual reports as required under the Health Care Work Force Data Collection, Analysis and Policy Act (2012 HB19).22 The capacity constraints are not quickly overcome. All Medicaid Expansion States are competing for a limited supply of physicians and other medical personnel who take years to educate and train. As Gerry Harrison PhD, former Director of the NM Health Policy Commission and Executive Director of New Mexico Health Resources, pointed out in a phone call, the difficulties are compounded by the growing number of retirements of physicians and other health professionals who were part of the “baby boom”. In NM, shortages of doctors and highly trained health care workers have been mitigated to some extent by various primary care and specialty programs, including clinics in rural areas, the Locum Tenens and Specialty Extension Service Program of the UNM Medical Group, Project ECHO and other tele-medicine programs. In a recent initiative to provide much needed services in Lea County, Nor-Leah Hospital District in Lovington, NM, is contracting with out-of-state specialists to provide services at District facilities. As important as these efforts to extend and expand medical services in more remote areas are, they are typically not reflected in the employment statistics. This may help to explain some but hardly all of the discrepancy between actual employment/earnings and that projected by the model.
20 Discussion and papers presented by Scott Nystrom, Lee Reynis and Bryce Ward for a session entitled Healthcare – the Affordable Care Act: Preliminary Evidence Regarding Impacts, University Business and Economic Research Fall Conference, October 11, 2015. 21 See website http://bhpr.hrsa.gov/shortage/hpsas/ 22 See report by Dr. Richard Larson, Vice Chancellor for Research, UNM Health Sciences Center, to the Legislative Finance Committee, Dec. 9, 2015. Available on NM Legislative Council Service website.

29
Economic Impacts – Indirect Effects and the Multiplier To this point, we have looked at the dollars coming into the state for the Medicaid Expansion and used the year-on-year gains in employment and earnings in health services as estimates of the impacts of the ACA and the Medicaid Expansion, We have seen a restrained response in terms of the actual growth in the workforce available to serve the Medicaid Expansion. In our 2012 study, as a way of capturing the inevitable lags, we assumed that only 70% of the payments estimated by HSD for FY 14 would actually go to NM providers, followed by 85% in FY 15, 97% in FY 17, 99% in FY 18 and 100% thereafter. From the data reported above on actual performance, our method for capturing lags in 2012 appears to have been overly optimistic. Actual gains in health care employment were about 53% of model estimates in FY14 but only 33% in FY15, the first full year of the program. Of course enrollment in the expansion has been way above expectations, putting additional strain on resources. The inevitable questions arise: Where has the money gone? How much has gone into investment in facilities? How much has trickled out-of-state? In estimating the economic impacts of a change like the Medicaid Expansion, economists try to estimate the indirect and induced effects as well as the direct effects. In the case of the Medicaid Expansion, there is an increase in the demand for health care services (or prescription drugs, or medical equipment) by adults eligible for the Medicaid Expansion. The direct payments made to providers enable those providers to expand their operations to meet this additional demand and this may result in hiring additional staff -- doctors, or perhaps nurses, health assistants -- and purchasing more supplies and equipment. This is the direct effect. The hirings will result in induced effects as the newly hired health care workers purchase various goods and services locally, setting in motion additional hires and additional attempts to stock up for increased demand. The purchases of supplies and equipment will similarly stimulate “indirect effects” as suppliers purchase goods and equipment to meet the additional demand, and they may find a need to hire additional people to deal with the increased activity. What is described in simple terms is the operation of a “multiplier” whereby the effect of injecting additional federal dollars into the health care industry stimulates expansion in that industry directly and then through indirect and induced effects in other industries; it sets in motion waves of expansion. BBER uses a regional model, IMPLAN, to estimate these induced and indirect effects and the total impacts of a change like the Medicaid Expansion on the economy of New Mexico. In trying to estimate the multiplier impacts it seems most reasonable to start with the increases in employment (and income) actually observed. These increases are summarized above but Table 3.54 presents more detailed data from the Quarterly Census of Employment and Wages so that we can look at the effects for different subsectors, since the applicable multipliers are different. Data are presented for each quarter in calendar 2013 through the first quarter of 2015, the latest data available. For both employment and earnings we have calculated the changes from a year earlier for the first five quarters of the Medicaid Expansion.

30
The figures for Ambulatory Care and Hospitals are the most relevant for adults under 65 that are the target of the expansion. Note the general acceleration of growth both in employment and labor earnings. The middle columns of the left half of Table 3.6 presents calculations on the gains in “direct employment”, which we have defined as the gain in employment in a health subsector in one quarter over the same quarter a year earlier – basically the same methodology as applied earlier in Table3.2. Thus In calculating the fiscal year total gains in direct employment, we take the average year-over-year gains from Table 3.5. For FY 14 employment in ambulatory services, the average gain for the first two quarters of 2014 (the only two quarters in FY 14) is calculated to be 409. This is the figure entered for FY 14 employment in Table 3.6. On the other hand, in calculating earnings using the QCEW data, we define “direct earnings” as the sum of the year-over-year changes in earnings. For FY14, these estimates exist for only two quarters. For FY/15 there are only three quarters of earnings data so we multiply by 4/3 to get an estimate of the annual “direct earnings”. It is important to note that even in a world where there was some elasticity to the supply of health care workers (i.e., health care workers could be easily trained or would move quickly to meet demand), the broader “multiplier” impacts of the Medicaid Expansion on the economy would not be immediate as the increases in demand will take time to ripple through the economy.

31
Table 3.5 Employment and Earnings, 2013Q1 to 2015Q1
Source: Quarterly Census of Employment and Wages
NAICS 621 2013 01 47,438 505,360,208 819 42,588 2013 02 47,709 521,172,163 840 43,680 2013 03 47,599 525,996,995 850 44,200 2013 04 47,921 591,641,391 950 49,400 2014 01 47,809 371 0.8% 516,209,492 10,849,284 2.1% 831 43,212 2014 02 48,156 447 0.9% 534,535,748 13,363,585 2.6% 854 44,408 2014 03 48,867 1268 2.7% 537,579,871 11,582,876 2.2% 846 43,992 2014 04 49,008 1087 2.3% 605,697,364 14,055,973 2.4% 951 49,452 2015 01 48,912 1103 2.3% 534,155,663 17,946,171 3.5% 840 43,680
NAICS 621 2013 01 35,224 494,013,527 1079 56,108 2013 02 35,295 502,386,882 1095 56,940 2013 03 35,252 507,171,253 1107 57,564 2013 04 35,370 515,324,428 1121 58,292 2014 01 35,150 -74 -0.2% 503,567,458 9,553,931 1.9% 1102 57,304 2014 02 35,293 -2 0.0% 512,997,470 10,610,588 2.1% 1118 58,136 2014 03 35,650 398 1.1% 530,071,610 22,900,357 4.5% 1144 59,488 2014 04 35,939 569 1.6% 544,194,156 28,869,728 5.6% 1165 60,580 2015 01 36,064 914 2.6% 530,203,665 26,636,207 5.3% 1131 58,812
NAICS 6232013 01 15,547 106,365,408 526 27,352 2013 02 15,713 112,727,851 552 28,704 2013 03 15,709 111,763,542 547 28,444 2013 04 15,705 118,774,630 582 30,264 2014 01 15,637 90 0.6% 109,133,563 2,768,155 2.6% 537 27,924 2014 02 15,798 85 0.5% 117,775,897 5,048,046 4.5% 573 29,796 2014 03 15,772 63 0.4% 112,775,295 1,011,753 0.9% 550 28,600 2014 04 15,934 229 1.5% 122,541,123 3,766,493 3.2% 592 30,784 2015 01 15,649 12 0.1% 114,421,260 5,287,697 4.8% 562 29,224
NAICS 6242013 01 29,299 151,144,577 397 20,644 2013 02 29,363 157,801,377 413 21,476 2013 03 28,940 153,283,363 407 21,164 2013 04 29,292 164,087,574 431 22,412 2014 01 29,465 166 0.6% 154,741,594 3,597,017 2.4% 404 21,008 2014 02 29,698 335 1.1% 165,945,159 8,143,782 5.2% 430 22,360 2014 03 30,085 1145 4.0% 161,543,148 8,259,785 5.4% 413 21,476 2014 04 31,379 2087 7.1% 176,923,048 12,835,474 7.8% 434 22,568 2015 01 32,152 2687 9.1% 166,643,564 11,901,970 7.7% 399 20,748
Year Quarter Chg Over Year Ago
% Growth
Hospitals
Nursing and Residential Care Facilities
Social Assistance
Average Weakly
Earnings
Average Annual
Earnings
Labor Earnings
Chg Over Year Ago
% Growth
Employment
Ambulatory Health Care Services

32
Once we have calculated the direct effects on employment and earnings, we apply the relevant multipliers from Implan (See the columns labeled Multipliers in Table 3.6) to calculate the total increases expected to be supported by the Medicaid Expansion as implemented in FY 14 and FY 15. As noted above, we can calculate these effects based on actual changes in activity in these two fiscal years. So for FY 14 the total amount of employment expected to be supported is 675 jobs, including the direct employment gains actually seen of 409. However, the full effects of the Medicaid Expansion will take time to work through the economy. The ripples have been set in motion, and normally most of the impacts should be felt within a year or two. The Medicaid Expansion, however, is huge, and it may well take longer for NM economy to adjust.
Table 3.6 Calculations of Multiplier Impacts for Medicaid Expansion Based on Increases in Employment and Earnings
Multiplier Direct Total Multiplier Direct TotalPeriod
FY 2014 1.65 409 675 1.40 $24.2 $33.9
FY 2015 1.65 1,153 1,902 1.40 $58.1 $81.4
Period
FY 2014 1.76 -76 -134 1.39 $20.2 $28.0
FY 2015 1.76 627 1,104 1.39 $104.5 $145.3
Period
FY 2014 1.28 88 112 1.35 $7.8 $10.6
FY 2015 1.28 912 1,167 1.35 $13.4 $18.1
Naics 623 Nursing and Residential Care Facilities
Earnings ($ Millions)Employment
Naics 621 Ambulatory Health Care Services
Naics 622 Hospitals

33
4. The Impacts on the State’s General Fund
The Medicaid Expansion and the associated additional economic activity generate new revenues from existing taxes and fees that accrue to the State General Fund. New Mexico levies insurance premium taxes on managed care organizations and gross receipts taxes on some healthcare providers that serve Medicaid enrollees. The state also gains additional revenues from income taxes and gross receipts taxes as new jobs and income are generated by the inflow of federal funds. At the same time, the Medicaid Expansion eliminates the need for certain programs, like State Coverage Insurance, which was supported by the General Fund, but it also creates future funding obligations. This section examines the various ways in which the Medicaid Expansion is having an effect on General Fund revenues and expenditures. Table 4.1 presents the latest estimates of gain and losses to the State’s General Fund associated with the Medicaid Expansion as it has evolved and is expected to grow and change in the future. The narrative that follows provides the details on the derivation of the estimates. Revenues Insurance premium taxes. The first section of the table presents estimates of new revenues generated as a result of the Medicaid Expansion. The most significant source of new revenues is the insurance premium tax that is paid by the contract MCOs. The insurance premium tax is 3% (3.003% to be exact) but there is a 1% additional tax assessed on health insurance premiums.23 A four percent premium tax on payments to MCOs would generate considerably more revenue than the estimates shown in the table were it not for the deductions provided on insurer contributions to the NM Medical Insurance Pool (NMMIP). See the second line of the table. It was hoped that the NMMIP would no longer be necessary with the Medicaid Expansion and that those receiving care through the Pool would transition to the Medicaid Expansion. Indeed our estimates back in 2012 assumed a savings of the full $33.9 million annually, while the estimates in Table 3.1 assume savings of only $23.4 million in FY 19 and beyond. While some of those covered through the pool have transitioned, the most medically fragile have remained in the program, requiring annual contributions from insurers, most notably from the MCO contractors to Centennial Care that oversee the care of those gaining coverage through the Medicaid Expansion. Since these contributions are eligible for generous deductions (50% and 75%), the growth in the health insurance premium taxes has been held down. There is discussion and debate about whether the program should be continued and legitimate concerns about the effects on the population served. An alternative might be to exempt the Medicaid Expansion MCO’s from the responsibility to contribute to the NMMIP. Without the tax deductions to the NMMIP, premium tax payments from the Medicaid Expansion MCOs would increase substantially.
23 Insurance premium taxes are due on April 15, July 15, October 15 and the following January 15. We have adjusted receipts to reflect this schedule.

34
Table 4.1. Medicaid Expansion: Estimated Impacts on New Mexico General Fund (In $ Millions) FY 2014 FY 2015 FY 2016 FY 2017 FY 2018 FY 2019 FY 2020 FY 2021 FY 2014-21
New RevenuesPremium Tax -- 4% a $1.3 $19.8 $31.1 $34.8 $37.8 $39.7 $41.3 $42.6 $248.4NMMIP Reduction b $0.0 $0.0 $0.0 $7.4 $15.4 $23.4 $23.4 $23.4 $93.0Gross Receipts Tax Direct Only c $4.6 $13.5 $15.4 $16.7 $17.1 $17.6 $17.7 $17.8 $120.4 Supported ? ? ? ? ? ? ? ? ?Pers Income Tax d $2.8 $7.6 $8.6 $9.4 $9.6 $10.0 $10.1 $10.1 $68.2
Other Revenues County 1/12 cent GRT $24.0 $25.5 $26.2 $27.0 $27.8 $28.6 $29.4 $30.2 $218.8 UNM IGT $0.0 $12.2 $12.4 $13.1 $13.8 $14.6 $15.3 $16.1 $97.4Program Revenues $32.7 $78.6 $93.7 $108.3 $121.6 $133.8 $137.2 $140.2 $846.1
Cost SavingsState Savings SCI e $30.1 $57.2 $51.5 $46.3 $41.7 $37.5 $33.8 $30.4 $328.5State Savings DSH f $0.0 $0.0 $0.0 $0.1 $1.9 $4.1 $6.2 $8.6 $20.9
New CostsAdmin Costs g ($3.8) ($12.3) ($13.8) ($15.4) ($16.3) ($17.0) ($17.5) ($17.9) ($113.9)State contribution SNC Pool h ($21.2) ($10.5) ($20.4) ($20.3) ($20.3) ($20.3) ($20.3) ($20.3) ($153.7)State HQII h $0.0 $0.0 ($0.8) ($1.7) ($2.6) ($3.6) ($4.7) ($5.9) ($19.4) y
State shared costs $0.0 $0.0 $0.0 ($40.8) ($94.3) ($115.2) ($155.4) ($186.3) ($592.1)
Program Net Costs $5.1 $34.5 $16.5 ($31.8) ($89.9) ($114.5) ($158.0) ($191.5) ($529.8)
State Gain (Loss) $37.7 $113.1 $110.2 $76.5 $31.7 $19.4 ($20.9) ($51.3) $316.3
a. On newly eligible only since premium tax was paid on all current SCI. Premium tax estimates take account of deduction contributions to NMMIP.
c. Direct only. Subtracts out SCI. BBER takes 90% of the increase in total revenues as estimated using IMPLAN and applies a 5.125% rate less the state-shared 1.225% Municipal if applicable. Many providers are not subject to the GRT, e.g., Presbyterian, the VA, Federally Qualified Health Centers, UNM>
f. BBER assume State continues to contribute to DSH program. Contribution in FY15 estimated to be $9.6 million based on HSD worksheet.g. Per HSD worksheets, figured at 2% of total expenditures and then applied the 50% state participation rate mandated on administrative expendituresh. Per HSD worksheets thru 2017. Assumes FMAP of 70.5% beginning in FY 17. To help pay for this, the Legislature appropriate $9 million supposedly one time.UNM BBER Estimates
e. Actual reduction projected by HSD for FY 14.
b. Estimates based on a conversation with Jon Clark of the LFC
d. FY14 and FY15 estimates are based on BEA quarterly estimates of income and an effective tax rate of 3.2%. Tax revenues grow with IMPLAN direct labor

35
would go to different types of providers – offices of physicians and other health practitioners versus other ambulatory care versus hospitals, versus home health care and so on. To complicate matters, the receipts of many health care providers in NM are not subject to the tax. This includes major players like Presbyterian Hospital, which qualifies as a non-profit. It also includes federal facilities like those of the Indian Health Service and the Veterans Administration. Federally Qualified Medical Centers are not subject to tax; nor are state hospitals, like UNM Hospital, nor State and local government clinics, like the North Valley Clinic. The best source of data on the non-profit/for-profit status of health care providers is probably the Census Bureau’s Economic Census. Unfortunately, the data are only collected every five years and the 2012 data have been delayed and will not be published until later in 2016. We needed to assign percentages exempt by type of provider and were forced to use the 2007 Economic Census supplemented by other information, including that provided by Randy Marshall from the NM Medical Society on the tax status of NM physicians. In estimating the total gross receipts taxes paid by providers and received by the General Fund we assumed the State tax rate of 5.125% and adjusted for the Municipal Distributions. We were careful to include the care for those newly eligible and to subtract out the costs of providing care to those previously receiving coverage under SCI. An additional downward adjustment should perhaps be made for the hold harmless distributions to local governments, which are still in the process of being phased out, but the data on the basis of which to make this adjustment was not readily available. The second revenue source affected by the Medicaid Expansion is the gross receipts tax paid by health care providers. Estimating the amount of revenue likely to accrue to the State’s General Fund required first estimating how much of the revenue actually going for health care services would go to different types of providers – offices of physicians and other health practitioners versus other ambulatory care versus hospitals, versus home health care and so on. To complicate matters, the receipts of many health care providers in NM are not subject to the tax. This includes major players like Presbyterian Hospital, which qualifies as a non-profit. It also includes federal facilities like those of the Indian Health Service and the Veterans Administration. It is important to emphasize that the gross receipts taxes paid by providers covers only the direct taxes paid on their business receipts and none for the goods and services purchased by their employees, much less by all those purchases indirectly supported by the Medicaid Expansion. The estimate for the gross receipts tax should be considered an underestimate. The third source of revenues to the General Fund is the personal income tax. Because labor income growth has been less than model expectations, we used the latest figures from BEA on changes year-over-year between the quarters of FY 14 and 15 and grew the series from there based on IMPLAN projected growth in direct labor income using an effective tax rate of 3.2%. One of the new sources of revenue to the State General Fund is a 1/12 cent GRT that replaces the gross receipts tax formerly used by the counties to support indigent care. This distribution will now be more generally available to support the Medicaid Expansion and also to meet the
36
State match for the Safety Net Care Pool and the State Hospital Quality Improvement Incentive (HQII) program. The estimates here through FY 17 are based on estimates from the Human Services Department. A second new revenue source is a UNM Intergovernmental Transfer, which amounts to $12.2 million in FY15 and $12.4 million in FY 16. HSD assumes that UNMH will pay the “newly Eligible” state share in FY 17. We have assumed continued payments through FY 21. The above listed revenue sources generate a cumulative total of $846 million through FY 21. Cost Savings There are also significant cost savings. The replacement of the State Coverage Insurance program results in cumulative savings to the General Fund of an estimated $329 million through FY 21. A much smaller source of saving involves the State matches for the Disproportionate Share Hospital program. It is assumed that DSH distributions from the federal government will continue but at lower levels and this triggers lower state contributions in the future, at a net savings through FY 21 of $21 million. New Costs Fiscal concerns about the Medicaid Expansion have focused on the State Share on Newly Eligible once the three years of 100% federal subsidy are over. As noted in the introduction, the ACA assumes that states will pick up 10% of the costs by calendar 2000 and indefinitely into the future. The estimated General Fund burden of this requirement can be found in the last row under New Costs. The Cumulative cost through FY 21 is $592 million. These costs include the state share of applicable HSD administrative costs. Estimates for the State share of the Uncompensated Care Pool portion of the Safety Net Care Pool (SNCP) were roughly $69 million in FY14, falling briefly to $34.4 million in FY 15 and then returning to $69 million and assumed to remain at this level through FY 21. Part two of the SNCP is the Hospital Quality Improvement Incentive (HQII). Estimates are per HSD worksheets through FY 17. We have used a figure reported by HSD Secretary Brent Earnest for 2018.24 Numbers for the out-years assume FMAP of 70.5% beginning in FY 17. The $9 million appropriation included in SB268 passed by the 2014 Legislature may have been intended as a one-time fix but this appropriation to HSD is shown as continuing at least through FY 17 in their worksheets. The $9 million does not show up in our table. Instead, we include the $20 plus million in continuing costs for the SNCP that that this $9 million appropriation helped finance.
24 Brent Earnest, Safety Net Care Pool and Implementation of Senate Bill 268 et al. Presentation to the Legislative Finance Committee and the Revenue Stabilization and Tax Policy Committee, July 9, 2014.

37
Net Impacts on the General Fund The cumulative net costs of the program to the State’s General Fund are a little less than half a billion dollars ($530 million), for a net gain to the General Fund through FY 21 of $316 million. The Medicaid Expansion more than pays for itself in every year until FY 20, when it is estimated to run a deficit of $20.9 million. In FY 21, the first year in which the State will contribute the full 10% of Medicaid Expansion costs, the deficit is estimated to be just under $51.3 million. While the deficits in FY 20 and FY 21 may sound large, they are of similar magnitude to those TRD has calculated for many individual tax expenditures that have far less sweeping impacts.25 It is also important to point out that we have been extremely conservative in our calculations of State revenues, particularly in our inclusion of only the gross receipts taxes paid by providers. The program is currently more than covering its costs and is expected basically to continue to cover costs in 2020 when the State’s share rises to 10% and thereafter. The federal government has committed to assuming 90% of program costs for the Medicaid Expansion from calendar 2020 forward.
25 See New Mexico Taxation and Revenue Department, New Mexico Tax Expenditure Report, 2014 available on line on their website.

38
5. Conclusion
The Medicaid Expansion in New Mexico is increasing health insurance coverage and access to care among low income adults (138% of poverty). The program has contributed to a dramatic reduction in both the number of uninsured and the amount of care that is uncompensated. The net flow of federal dollars into the state to provide coverage is creating an effective demand for health care services. Providers are expanding and there is an increase in the health care workforce. The state has seen an increase in planned and actual investment in hospitals and health treatment facilities. These developments are important in a state that has long been under-served. While the State will pick up an increasing portion of the costs up to 10% in calendar 2020, a careful analysis of General Fund impacts indicates that the program is basically paying for itself.

39