feasibility study proposed dual-branded hotels at … · feasibility study proposed dual-branded...
TRANSCRIPT
FEASIBILITY STUDY
Proposed Dual-Branded Hotels at Florida Atlantic University
GLADES ROAD BOCA RATON, FLORIDA
SUBMITTED TO:PR OPOSED
Mr. Tom Donaudy Florida Atlantic University 777 Glades Road Boca Raton, Florida, 33431 +1 (561) 294-3000
PREPARED BY:
HVS Consulting and Valuation Services Division of TS Worldwide, LLC 2386 Clower Street, Suite E102 Snellville, Georgia 30078 +1 (678) 628-6577
April-2013
October 2, 2013 Mr. Tom Donaudy Florida Atlantic University 777 Glades Road Boca Raton, Florida, 33431
Re: Proposed Dual-Branded Hotels at Florida Atlantic University Boca Raton, Florida HVS Reference: 2013020786
Dear Mr. Donaudy: Pursuant to your request, we herewith submit our feasibility study pertaining to the above-captioned property. We have inspected the real estate and analyzed the hotel market conditions in the Boca Raton, Florida area. We have studied the proposed project, and the results of our fieldwork and analysis are presented in this report. We have also reviewed the proposed improvements for this site. Our report was prepared in accordance with the Uniform Standards of Professional Appraisal Practice (USPAP), as provided by the Appraisal Foundation. We hereby certify that we have no undisclosed interest in the property, and our employment and compensation are not contingent upon our findings. This study is subject to the comments made throughout this report and to all assumptions and limiting conditions set forth herein.
Sincerely, TS Worldwide, LLC
Michael E. Brophy, Senior Vice President, Partner [email protected], +1 (678) 628-6577 State-certified general real estate appraiser RZ3482
Adam R. Lair, MAI, Senior Vice President, Partner [email protected], +1 (504) 231-2651 State-certified general real estate appraiser RZ3493
HVS ATLANTA
2386 Clower Street, Suite E102
Snellville, Georgia 30078
+1 (678) 628-6577
+1 678 302-7048 FAX
www.hvs.com
Atlanta
Boston
Boulder
Chicago
Dallas
Denver
Houston
Las Vegas
Mexico City
Miami
Minneapolis
Nassau
New York
Newport
Philadelphia
San Francisco
St. Louis
Toronto
Vancouver
Washington
Athens
Beijing
Buenos Aires
Dubai
Hong Kong
Lima
London
Madrid
Milan
Moscow
Mumbai
New Delhi
Sao Paulo
Shanghai
Singapore
Specialists in Hotel Consulting and Appraisal Worldwide
Table of Contents
SECTION TITLE PAGE
1. Executive Summary 4 2. Description of the Site and Neighborhood 20 3. Market Area Analysis 29 4. Supply and Demand Analysis 51 5. Description of the Proposed Project 82 6. Projection of Occupancy and Average Rate 88 7. Projection of Income and Expense 100 8. Feasibility Analysis 128 9. Statement of Assumptions and Limiting Conditions 140 10. Certification 143
Addenda Penetration Explanation i Explanation of the Simultaneous Valuation Formula v
Qualifications
April-2013 Executive Summary Proposed Dual-Branded Hotels at Florida Atlantic University – Boca Raton, Florida 4
1. Executive Summary
The subject of the feasibility study is a 130,680-square-foot (3.00-acre) parcel to be improved with select-service and extended-stay lodging facilities. The hotels are expected to open on January 1, 2016. The select-service hotel is expected to feature 110 rooms, a restaurant and lounge, an exercise room and a business center. The extended-stay hotel is expected to feature 140 rooms, a breakfast dining area, an outdoor pool, an outdoor whirlpool, a market pantry, an exercise room, a business center, and a guest laundry facility. The hotels are also expected to share 10,000 square feet of meeting space, an outdoor pool, an outdoor whirlpool, and an outdoor patio. Each hotel will also feature all necessary back-of-the-house space. The proposed subject property will be part of the Boca Raton Campus Master Plan of Florida Atlantic University (FAU). Originally adopted on September 15, 1995, the Boca Raton Campus Master Plan was updated on November 18, 2009 to include a number of planned facilities expected to aid in the University's planned transition to a traditional campus model, which is expected to transform FAU into a first-class public university and research institution. Founded in 1964, Florida Atlantic University was the first public university in southeast Florida. FAU now comprises a 700-acre main campus in Boca Raton and five satellite campuses throughout southeast Florida. The University offers 147 undergraduate and graduate degree programs across ten schools, including the Charles E. Schmidt College of Medicine, which opened in 2010; in the fall of 2012, FAU's enrollment reached a milestone, exceeding 30,000 students for the first time in the school's history. Additional developments since the adoption of the 2009 Master Plan have included the construction of a $70-million, 24,419-seat football stadium and the $121-million Innovation Village student apartment complex, both of which were completed in 2011, as well as the opening of the $46-million Parliament Hall housing complex in August of 2013. Future plans include the development of additional student housing buildings, classroom facilities, and sports complexes throughout the main campus. The proposed subject property is expected to be the first component of a larger mixed-use development that will occupy a portion of a vacant 42-acre parcel situated along Glades Road at the southeast corner of the Boca Raton campus. The subject site’s location is Glades Road, Boca Raton, Florida, 33431. The effective date of the report is October 2, 2013. The subject site was inspected by Adam R. Lair, MAI on April 3, 2013. Michael E. Brophy participated in the analysis and reviewed the findings, but did not personally inspect the property.
Subject of the Feasibility Study
Pertinent Dates
April-2013 Executive Summary Proposed Dual-Branded Hotels at Florida Atlantic University – Boca Raton, Florida 5
The developer of the proposed subject property is Florida Atlantic University, a public entity. The subject site is not yet subdivided but is expected to be situated within a larger 42-acre parcel at the southeastern corner of the Florida Atlantic University main campus in Boca Raton. According to the Palm Beach County Property Appraiser, this 42-acre parcel comprises publicly owned land, portions of which are owned by the Board of Trustees of the Internal Improvement Trust Fund of the State of Florida (TIITF) and the United States Government. The subject parcel has not been sold in several years and is neither listed for sale nor under contract. We assume that the proposed dual-branded subject property will be managed by a single professional management company that is experienced in the operation of upscale, select-service and extended-stay hotels in this region. The management team had not been selected as of the date of this study; therefore, details pertaining to management terms had yet to be determined. Our forecast fees represent an estimate of what would be expected on a base-fee and incentive-fee basis. We have assumed a market-appropriate total management fee of 3.0% of total revenues in our study. We recommend that the proposed subject property operate as a dual-branded hotel offering separate upscale, select-service and extended-stay products that should share a central, connected conference center facility and select outdoor amenities. While we have not recommended a specific pair of brands for the proposed subject property, pairings available in this market include the Aloft and Element by Westin and the Hyatt Place and Hyatt House, and our forecasts reflect franchise terms typical of these brands. Additional select-service and extended-stay brand pairings include the Hilton Garden Inn and Homewood Suites by Hilton and the Courtyard by Marriot and Residence Inn by Marriott; however, we note that the Hilton Garden Inn, Courtyard by Marriott, and Residence Inn by Marriott brands currently exist in the subject market. Local employers and headquarter offices in the area, including those of Office Depot and The ADT Corporation, as well as Florida Atlantic University, Lynn University, and Boca Raton Regional Hospital, represent the primary sources of demand for this market. No new supply has entered this market since the opening of the Hilton Garden Inn in 2002. Demand and occupancy fluctuated during the first half of the last decade, with occupancy levels peaking in 2004 and remaining above 70% through 2006 as a result of the temporary influx of demand from cleanup crews following particularly strong hurricane seasons, including the landfalls of major named storms such as Jeanne and Wilma. As temporary demand dissipated, market occupancy levels declined significantly in 2007, and this negative trend continued in 2008 and 2009 as the economic recession limited corporate spending and leisure travel to the market. Demand began to recover in
Ownership, Franchise, and Management Assumptions
Summary of Hotel Market Trends
April-2013 Executive Summary Proposed Dual-Branded Hotels at Florida Atlantic University – Boca Raton, Florida 6
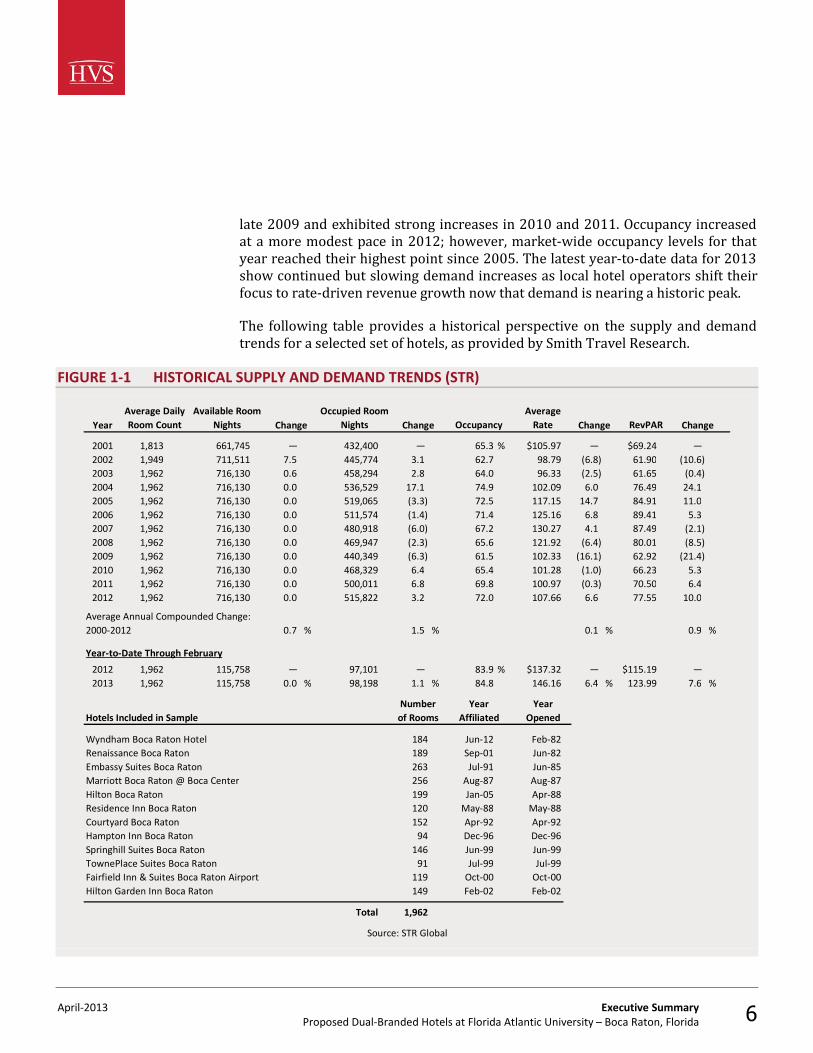
late 2009 and exhibited strong increases in 2010 and 2011. Occupancy increased at a more modest pace in 2012; however, market-wide occupancy levels for that year reached their highest point since 2005. The latest year-to-date data for 2013 show continued but slowing demand increases as local hotel operators shift their focus to rate-driven revenue growth now that demand is nearing a historic peak. The following table provides a historical perspective on the supply and demand trends for a selected set of hotels, as provided by Smith Travel Research.
FIGURE 1-1 HISTORICAL SUPPLY AND DEMAND TRENDS (STR)
YearAverage Daily Room Count
Available Room Nights Change
Occupied Room Nights Change Occupancy
Average Rate Change RevPAR Change
2001 1,813 661,745 — 432,400 — 65.3 % $105.97 — $69.24 — 2002 1,949 711,511 7.5 445,774 3.1 62.7 98.79 (6.8) 61.90 (10.6)2003 1,962 716,130 0.6 458,294 2.8 64.0 96.33 (2.5) 61.65 (0.4)2004 1,962 716,130 0.0 536,529 17.1 74.9 102.09 6.0 76.49 24.12005 1,962 716,130 0.0 519,065 (3.3) 72.5 117.15 14.7 84.91 11.02006 1,962 716,130 0.0 511,574 (1.4) 71.4 125.16 6.8 89.41 5.32007 1,962 716,130 0.0 480,918 (6.0) 67.2 130.27 4.1 87.49 (2.1)2008 1,962 716,130 0.0 469,947 (2.3) 65.6 121.92 (6.4) 80.01 (8.5)2009 1,962 716,130 0.0 440,349 (6.3) 61.5 102.33 (16.1) 62.92 (21.4)2010 1,962 716,130 0.0 468,329 6.4 65.4 101.28 (1.0) 66.23 5.32011 1,962 716,130 0.0 500,011 6.8 69.8 100.97 (0.3) 70.50 6.42012 1,962 716,130 0.0 515,822 3.2 72.0 107.66 6.6 77.55 10.0
0.7 % 1.5 % 0.1 % 0.9 %
Year-to-Date Through February
2012 1,962 115,758 — 97,101 — 83.9 % $137.32 — $115.19 — 2013 1,962 115,758 0.0 % 98,198 1.1 % 84.8 146.16 6.4 % 123.99 7.6 %
Hotels Included in Sample
Wyndham Boca Raton Hotel 184 Jun-12 Feb-82Renaissance Boca Raton 189 Sep-01 Jun-82Embassy Suites Boca Raton 263 Jul-91 Jun-85Marriott Boca Raton @ Boca Center 256 Aug-87 Aug-87Hilton Boca Raton 199 Jan-05 Apr-88Residence Inn Boca Raton 120 May-88 May-88Courtyard Boca Raton 152 Apr-92 Apr-92Hampton Inn Boca Raton 94 Dec-96 Dec-96Springhill Suites Boca Raton 146 Jun-99 Jun-99TownePlace Suites Boca Raton 91 Jul-99 Jul-99Fairfield Inn & Suites Boca Raton Airport 119 Oct-00 Oct-00Hilton Garden Inn Boca Raton 149 Feb-02 Feb-02
Total 1,962
Source: STR Global
YearOpened
Average Annual Compounded Change: 2000-2012
Number Yearof Rooms Affiliated

April-2013 Executive Summary Proposed Dual-Branded Hotels at Florida Atlantic University – Boca Raton, Florida 7
The following tables reflect our estimates of operating data for hotels on an individual basis. These trends are presented in detail in the Supply and Demand Analysis chapter of this report.
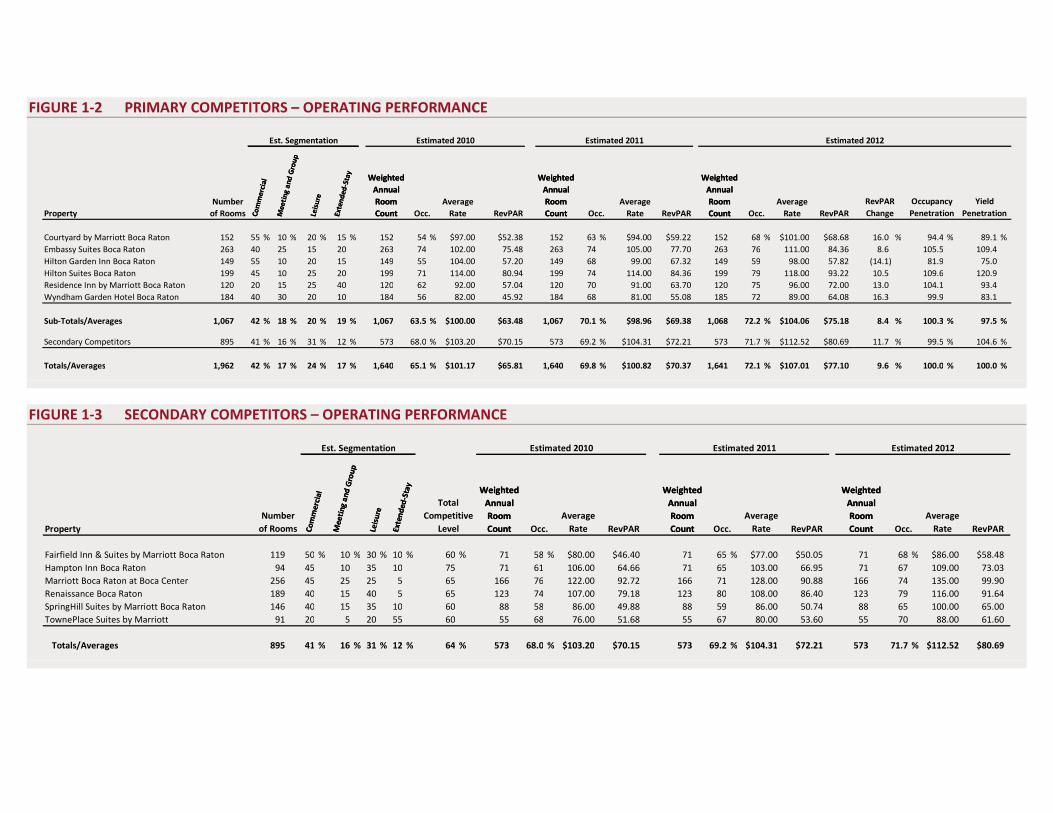
FIGURE 1-2 PRIMARY COMPETITORS – OPERATING PERFORMANCE
Est. Segmentation Estimated 2010 Estimated 2011 Estimated 2012
Weighted Annual Room Count
Weighted Annual Room CountCo
mm
erci
al
Mee
ting
and
Gro
up
Leis
ure
Exte
nded
-Sta
y
Weighted Annual Room CountProperty Occ. RevPAR Occ. RevPAR RevPAR
RevPAR Change
Occupancy Penetration
Yield Penetration
Courtyard by Marriott Boca Raton 152 55 % 10 % 20 % 15 % 152 54 % $97.00 $52.38 152 63 % $94.00 $59.22 152 68 % $101.00 $68.68 16.0 % 94.4 % 89.1 %Embassy Suites Boca Raton 263 40 25 15 20 263 74 102.00 75.48 263 74 105.00 77.70 263 76 111.00 84.36 8.6 105.5 109.4Hilton Garden Inn Boca Raton 149 55 10 20 15 149 55 104.00 57.20 149 68 99.00 67.32 149 59 98.00 57.82 (14.1) 81.9 75.0Hilton Suites Boca Raton 199 45 10 25 20 199 71 114.00 80.94 199 74 114.00 84.36 199 79 118.00 93.22 10.5 109.6 120.9Residence Inn by Marriott Boca Raton 120 20 15 25 40 120 62 92.00 57.04 120 70 91.00 63.70 120 75 96.00 72.00 13.0 104.1 93.4Wyndham Garden Hotel Boca Raton 184 40 30 20 10 184 56 82.00 45.92 184 68 81.00 55.08 185 72 89.00 64.08 16.3 99.9 83.1
Sub-Totals/Averages 1,067 42 % 18 % 20 % 19 % 1,067 63.5 % $100.00 $63.48 1,067 70.1 % $98.96 $69.38 1,068 72.2 % $104.06 $75.18 8.4 % 100.3 % 97.5 %
Secondary Competitors 895 41 % 16 % 31 % 12 % 573 68.0 % $103.20 $70.15 573 69.2 % $104.31 $72.21 573 71.7 % $112.52 $80.69 11.7 % 99.5 % 104.6 %
Totals/Averages 1,962 42 % 17 % 24 % 17 % 1,640 65.1 % $101.17 $65.81 1,640 69.8 % $100.82 $70.37 1,641 72.1 % $107.01 $77.10 9.6 % 100.0 % 100.0 %
Occ.Average
RateNumber
of Rooms
Weighted Annual Room Count
Weighted Annual Room CountCo
mm
erci
al
Mee
ting
and
Gro
up
Leis
ure
Exte
nded
-Sta
y
Average Rate
Weighted Annual Room Count
Average Rate
FIGURE 1-3 SECONDARY COMPETITORS – OPERATING PERFORMANCE
Est. Segmentation Estimated 2010 Estimated 2011 Estimated 2012
Weighted Annual Room CountEx
tend
ed-S
tay
Com
mer
cial
Mee
ting
and
Gro
up
Leis
ure
Weighted Annual Room Count
Weighted Annual Room Count
Total
PropertyNumber
of RoomsCompetitive
Level Occ.Average
Rate RevPAR Occ.Average
Rate RevPAR Occ.Average
Rate RevPAR
Fairfield Inn & Suites by Marriott Boca Raton 119 50 % 10 % 30 % 10 % 60 % 71 58 % $80.00 $46.40 71 65 % $77.00 $50.05 71 68 % $86.00 $58.48Hampton Inn Boca Raton 94 45 10 35 10 75 71 61 106.00 64.66 71 65 103.00 66.95 71 67 109.00 73.03Marriott Boca Raton at Boca Center 256 45 25 25 5 65 166 76 122.00 92.72 166 71 128.00 90.88 166 74 135.00 99.90Renaissance Boca Raton 189 40 15 40 5 65 123 74 107.00 79.18 123 80 108.00 86.40 123 79 116.00 91.64SpringHill Suites by Marriott Boca Raton 146 40 15 35 10 60 88 58 86.00 49.88 88 59 86.00 50.74 88 65 100.00 65.00TownePlace Suites by Marriott 91 20 5 20 55 60 55 68 76.00 51.68 55 67 80.00 53.60 55 70 88.00 61.60
Totals/Averages 895 41 % 16 % 31 % 12 % 64 % 573 68.0 % $103.20 $70.15 573 69.2 % $104.31 $72.21 573 71.7 % $112.52 $80.69
Weighted Annual Room CountEx
tend
ed-S
tay
Com
mer
cial
Mee
ting
and
Gro
up
Leis
ure
Weighted Annual Room Count
Weighted Annual Room Count
April-2013 Executive Summary Proposed Dual-Branded Hotels at Florida Atlantic University – Boca Raton, Florida 9
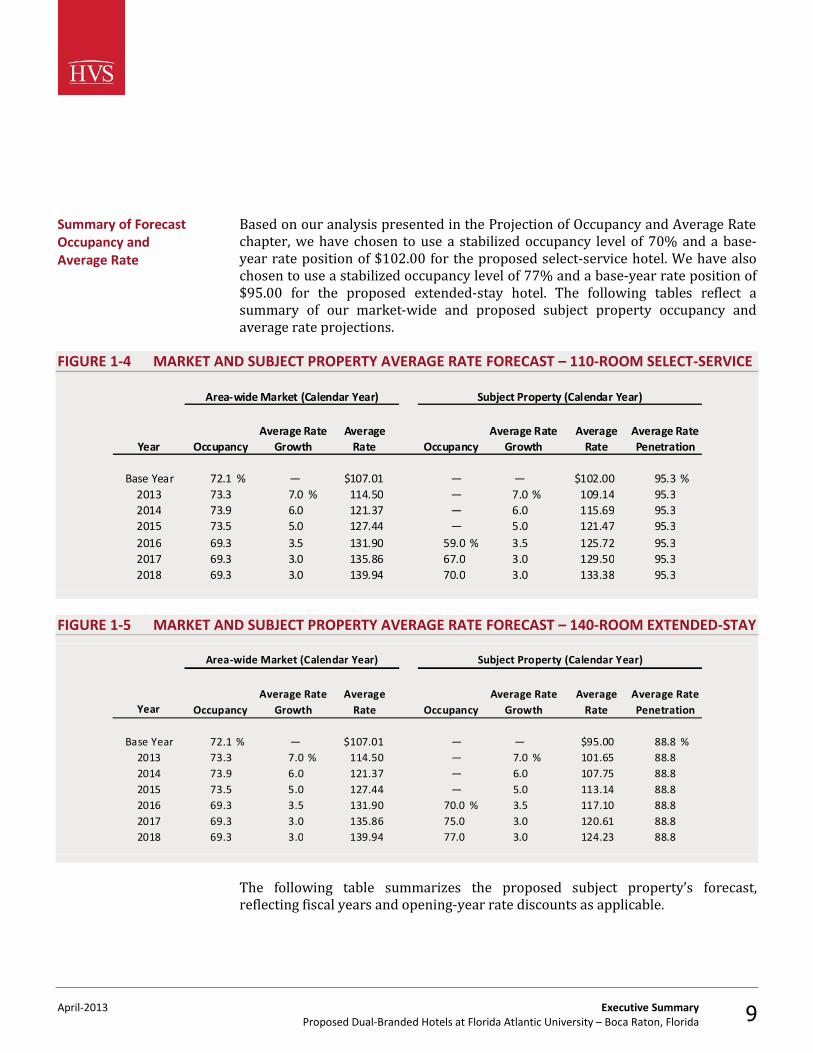
Based on our analysis presented in the Projection of Occupancy and Average Rate chapter, we have chosen to use a stabilized occupancy level of 70% and a base-year rate position of $102.00 for the proposed select-service hotel. We have also chosen to use a stabilized occupancy level of 77% and a base-year rate position of $95.00 for the proposed extended-stay hotel. The following tables reflect a summary of our market-wide and proposed subject property occupancy and average rate projections.
FIGURE 1-4 MARKET AND SUBJECT PROPERTY AVERAGE RATE FORECAST – 110-ROOM SELECT-SERVICE
Year
Base Year 72.1 % — $107.01 — — $102.00 95.3 %2013 73.3 7.0 % 114.50 — 7.0 % 109.14 95.32014 73.9 6.0 121.37 — 6.0 115.69 95.32015 73.5 5.0 127.44 — 5.0 121.47 95.32016 69.3 3.5 131.90 59.0 % 3.5 125.72 95.32017 69.3 3.0 135.86 67.0 3.0 129.50 95.32018 69.3 3.0 139.94 70.0 3.0 133.38 95.3
Area-wide Market (Calendar Year) Subject Property (Calendar Year)
Average Rate
Average Rate Penetration
Average Rate Growth
Average Rate OccupancyOccupancy
Average Rate Growth
FIGURE 1-5 MARKET AND SUBJECT PROPERTY AVERAGE RATE FORECAST – 140-ROOM EXTENDED-STAY
Year
Base Year 72.1 % — $107.01 — — $95.00 88.8 %2013 73.3 7.0 % 114.50 — 7.0 % 101.65 88.82014 73.9 6.0 121.37 — 6.0 107.75 88.82015 73.5 5.0 127.44 — 5.0 113.14 88.82016 69.3 3.5 131.90 70.0 % 3.5 117.10 88.82017 69.3 3.0 135.86 75.0 3.0 120.61 88.82018 69.3 3.0 139.94 77.0 3.0 124.23 88.8
Average Rate Growth
Area-wide Market (Calendar Year) Subject Property (Calendar Year)
Average Rate
Average Rate Penetration
Average Rate Growth
Average Rate OccupancyOccupancy
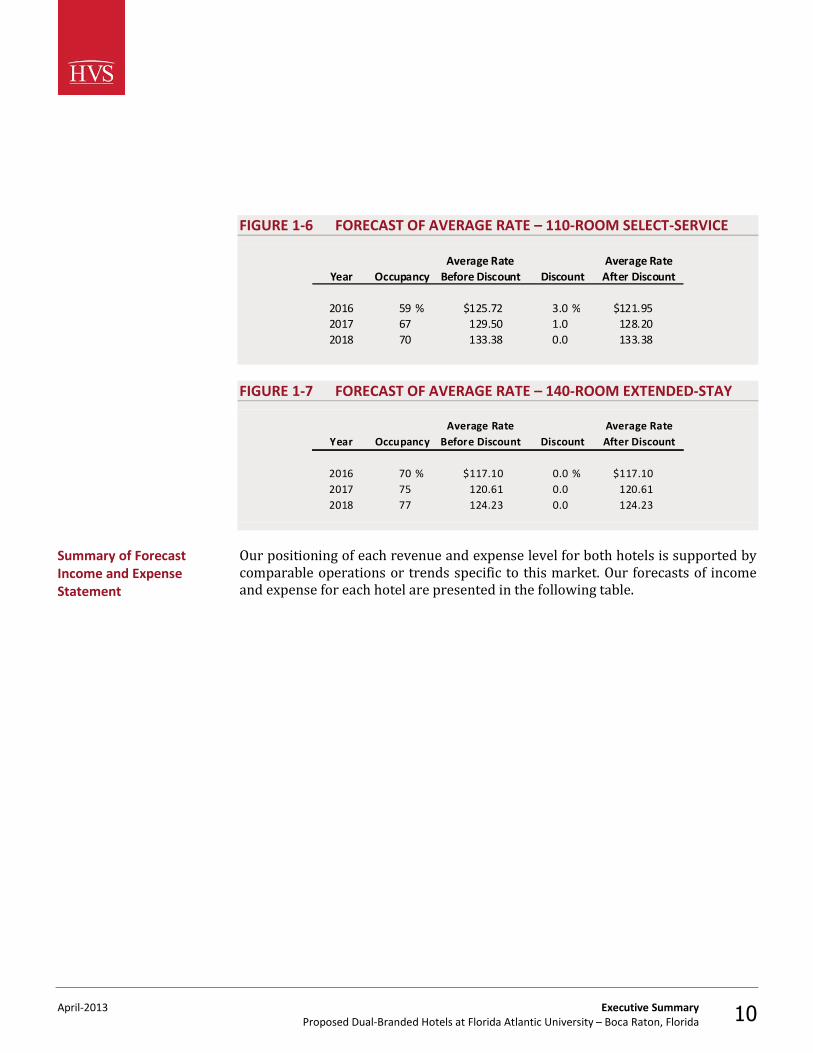
The following table summarizes the proposed subject property’s forecast, reflecting fiscal years and opening-year rate discounts as applicable.
Summary of Forecast Occupancy and Average Rate
April-2013 Executive Summary Proposed Dual-Branded Hotels at Florida Atlantic University – Boca Raton, Florida 10
FIGURE 1-6 FORECAST OF AVERAGE RATE – 110-ROOM SELECT-SERVICE
Year
2016 59 % $125.72 3.0 % $121.952017 67 129.50 1.0 128.202018 70 133.38 0.0 133.38
OccupancyAverage Rate
Before Discount DiscountAverage Rate
After Discount
FIGURE 1-7 FORECAST OF AVERAGE RATE – 140-ROOM EXTENDED-STAY
Year
2016 70 % $117.10 0.0 % $117.102017 75 120.61 0.0 120.612018 77 124.23 0.0 124.23
OccupancyAverage Rate
Before Discount DiscountAverage Rate After Discount
Our positioning of each revenue and expense level for both hotels is supported by comparable operations or trends specific to this market. Our forecasts of income and expense for each hotel are presented in the following table.
Summary of Forecast Income and Expense Statement
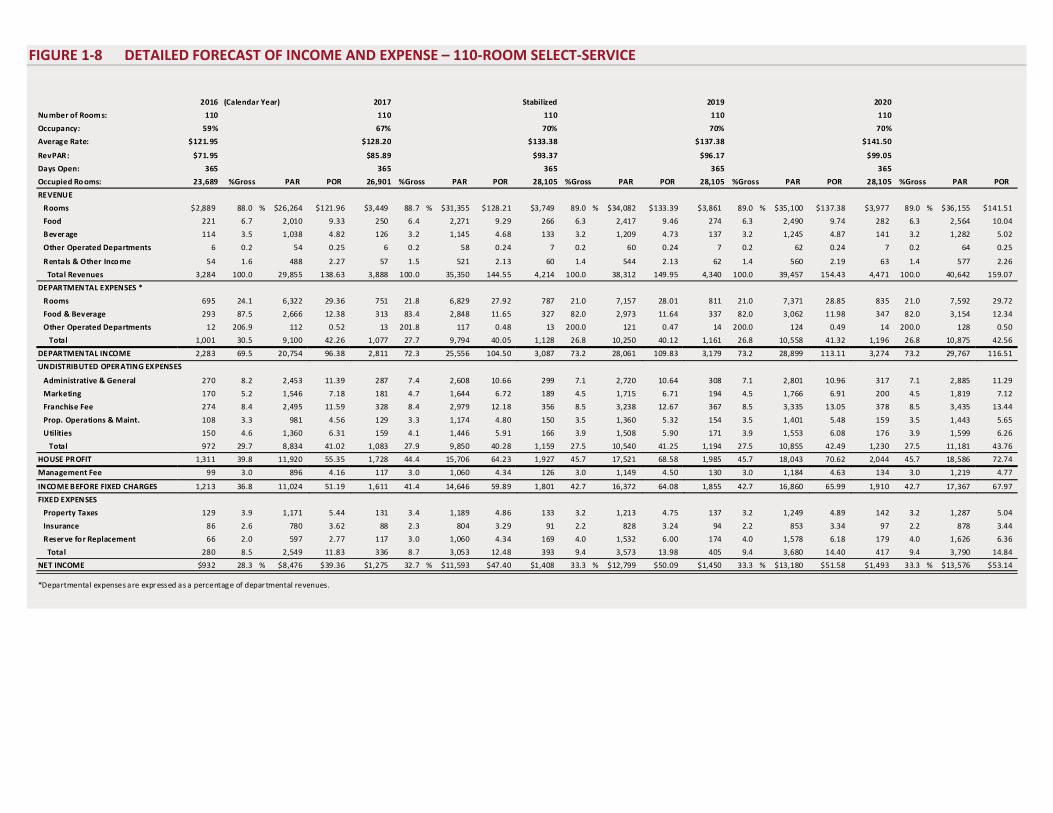
FIGURE 1-8 DETAILED FORECAST OF INCOME AND EXPENSE – 110-ROOM SELECT-SERVICE
2016 (Calendar Year) 2017 Stabilized 2019 2020
Nu mber of Room s: 110 110 110 110 110
Occupancy: 59% 67% 70% 70% 70%
Average Rate: $121.95 $128.20 $133.38 $137.38 $141.50
RevPAR: $71.95 $85.89 $93.37 $96.17 $99.05
Days Open: 365 365 365 365 365
Occupied Ro oms: 23,689 %Gross PAR POR 26,901 %Gross PAR POR 28,105 %Gross PAR POR 28,105 %Gross PAR POR 28,105 %Gross PAR POR
REVENUE
Rooms $2,889 88.0 % $26,264 $121.96 $3,449 88.7 % $31,355 $128.21 $3,749 89.0 % $34,082 $133.39 $3,861 89.0 % $35,100 $137.38 $3,977 89.0 % $36,155 $141.51
Food 221 6.7 2,010 9.33 250 6.4 2,271 9.29 266 6.3 2,417 9.46 274 6.3 2,490 9.74 282 6.3 2,564 10.04
Bever age 114 3.5 1,038 4.82 126 3.2 1,145 4.68 133 3.2 1,209 4.73 137 3.2 1,245 4.87 141 3.2 1,282 5.02
Other Operated Departments 6 0.2 54 0.25 6 0.2 58 0.24 7 0.2 60 0.24 7 0.2 62 0.24 7 0.2 64 0.25
Rentals & Other Inco me 54 1.6 488 2.27 57 1.5 521 2.13 60 1.4 544 2.13 62 1.4 560 2.19 63 1.4 577 2.26
Total Revenues 3,284 100.0 29,855 138.63 3,888 100.0 35,350 144.55 4,214 100.0 38,312 149.95 4,340 100.0 39,457 154.43 4,471 100.0 40,642 159.07
DEPARTMENTAL EXPENSES *
Rooms 695 24.1 6,322 29.36 751 21.8 6,829 27.92 787 21.0 7,157 28.01 811 21.0 7,371 28.85 835 21.0 7,592 29.72
Food & Beverage 293 87.5 2,666 12.38 313 83.4 2,848 11.65 327 82.0 2,973 11.64 337 82.0 3,062 11.98 347 82.0 3,154 12.34
Other Operated Departments 12 206.9 112 0.52 13 201.8 117 0.48 13 200.0 121 0.47 14 200.0 124 0.49 14 200.0 128 0.50
Total 1,001 30.5 9,100 42.26 1,077 27.7 9,794 40.05 1,128 26.8 10,250 40.12 1,161 26.8 10,558 41.32 1,196 26.8 10,875 42.56
DEPARTMENTAL INCOME 2,283 69.5 20,754 96.38 2,811 72.3 25,556 104.50 3,087 73.2 28,061 109.83 3,179 73.2 28,899 113.11 3,274 73.2 29,767 116.51
UNDISTRIBUTED OPERATING EXPENSES
Administrative & General 270 8.2 2,453 11.39 287 7.4 2,608 10.66 299 7.1 2,720 10.64 308 7.1 2,801 10.96 317 7.1 2,885 11.29
Marketing 170 5.2 1,546 7.18 181 4.7 1,644 6.72 189 4.5 1,715 6.71 194 4.5 1,766 6.91 200 4.5 1,819 7.12
Franchise Fee 274 8.4 2,495 11.59 328 8.4 2,979 12.18 356 8.5 3,238 12.67 367 8.5 3,335 13.05 378 8.5 3,435 13.44
Prop. Operations & Maint. 108 3.3 981 4.56 129 3.3 1,174 4.80 150 3.5 1,360 5.32 154 3.5 1,401 5.48 159 3.5 1,443 5.65
Utilities 150 4.6 1,360 6.31 159 4.1 1,446 5.91 166 3.9 1,508 5.90 171 3.9 1,553 6.08 176 3.9 1,599 6.26
Total 972 29.7 8,834 41.02 1,083 27.9 9,850 40.28 1,159 27.5 10,540 41.25 1,194 27.5 10,855 42.49 1,230 27.5 11,181 43.76
HOUSE PROFIT 1,311 39.8 11,920 55.35 1,728 44.4 15,706 64.23 1,927 45.7 17,521 68.58 1,985 45.7 18,043 70.62 2,044 45.7 18,586 72.74
Management Fee 99 3.0 896 4.16 117 3.0 1,060 4.34 126 3.0 1,149 4.50 130 3.0 1,184 4.63 134 3.0 1,219 4.77
INCOME BEFORE FIXED CHARGES 1,213 36.8 11,024 51.19 1,611 41.4 14,646 59.89 1,801 42.7 16,372 64.08 1,855 42.7 16,860 65.99 1,910 42.7 17,367 67.97
FIXED EXPENSES
Property Taxes 129 3.9 1,171 5.44 131 3.4 1,189 4.86 133 3.2 1,213 4.75 137 3.2 1,249 4.89 142 3.2 1,287 5.04
Insurance 86 2.6 780 3.62 88 2.3 804 3.29 91 2.2 828 3.24 94 2.2 853 3.34 97 2.2 878 3.44
Reser ve for Replacement 66 2.0 597 2.77 117 3.0 1,060 4.34 169 4.0 1,532 6.00 174 4.0 1,578 6.18 179 4.0 1,626 6.36
Total 280 8.5 2,549 11.83 336 8.7 3,053 12.48 393 9.4 3,573 13.98 405 9.4 3,680 14.40 417 9.4 3,790 14.84
NET INCOME $932 28.3 % $8,476 $39.36 $1,275 32.7 % $11,593 $47.40 $1,408 33.3 % $12,799 $50.09 $1,450 33.3 % $13,180 $51.58 $1,493 33.3 % $13,576 $53.14
*Departmental expenses are expr essed as a percentage of depar tmental revenues.
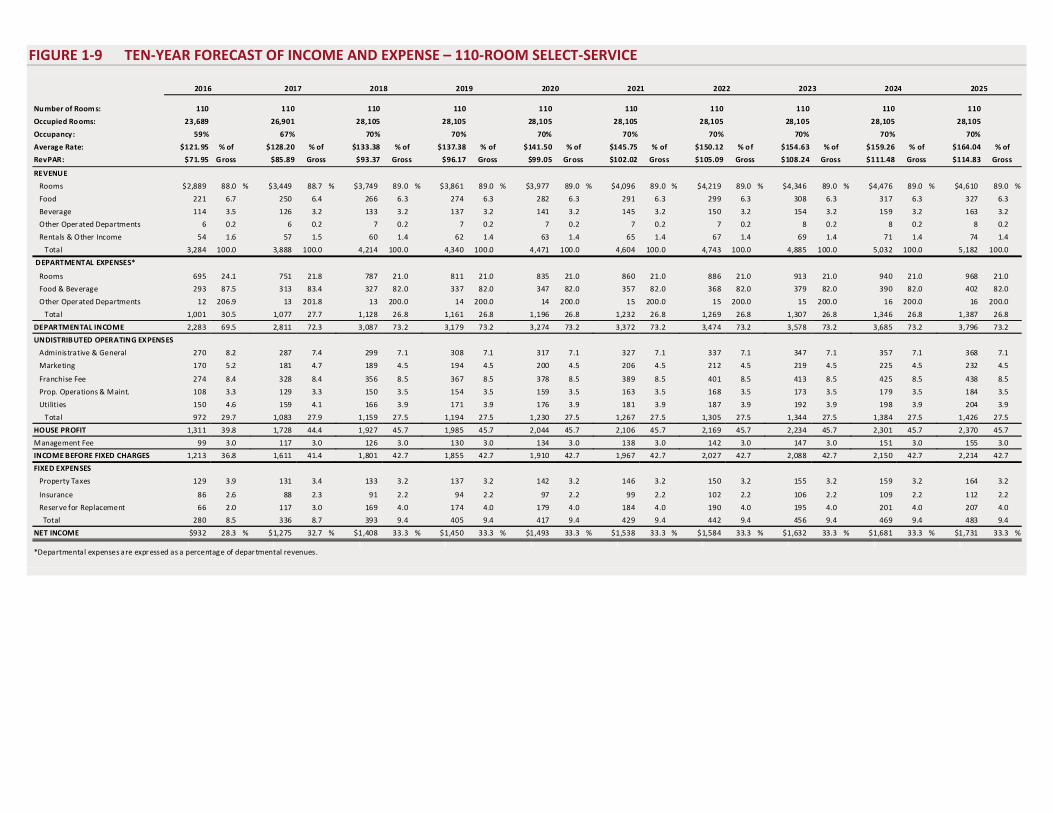
FIGURE 1-9 TEN-YEAR FORECAST OF INCOME AND EXPENSE – 110-ROOM SELECT-SERVICE
2016 2017 2018 2019 2020 2021 2022 2023 2024 2025
Number of Room s: 110 110 110 110 110 110 110 110 110 110
Occupied Rooms: 23,689 26,901 28,105 28,105 28,105 28,105 28,105 28,105 28,105 28,105
Occupancy: 59% 67% 70% 70% 70% 70% 70% 70% 70% 70%
Average Rate: $121. 95 % of $128.20 % of $133.38 % of $137.38 % of $141.50 % of $145.75 % of $150.12 % of $154.63 % of $159.26 % of $164.04
RevPAR: $71.95 Gross $85.89 Gross $93.37 Gross $96.17 Gross $99.05 Gross $102.02 Gross $105.09 Gross $108.24 Gross $111.48 Gross $114.83
REVENUE
Rooms $2,889 88.0 % $3,449 88.7 % $3,749 89.0 % $3,861 89.0 % $3,977 89.0 % $4,096 89.0 % $4,219 89.0 % $4,346 89.0 % $4,476 89.0 % $4,610 89.0 %
Food 221 6.7 250 6.4 266 6.3 274 6.3 282 6.3 291 6.3 299 6.3 308 6.3 317 6.3 327 6.3
Beverage 114 3.5 126 3.2 133 3.2 137 3.2 141 3.2 145 3.2 150 3.2 154 3.2 159 3.2 163 3.2
Other Oper ated Departments 6 0.2 6 0.2 7 0.2 7 0.2 7 0.2 7 0.2 7 0.2 8 0.2 8 0.2 8 0.2
Rentals & Other Income 54 1.6 57 1.5 60 1.4 62 1.4 63 1.4 65 1.4 67 1.4 69 1.4 71 1.4 74 1.4
Total 3,284 100.0 3,888 100.0 4,214 100.0 4,340 100.0 4,471 100.0 4,604 100.0 4,743 100.0 4,885 100.0 5,032 100.0 5,182 100.0
DEPARTMENTAL EXPENSES*
Rooms 695 24.1 751 21.8 787 21.0 811 21.0 835 21.0 860 21.0 886 21.0 913 21.0 940 21.0 968 21.0
Food & Bev erage 293 87.5 313 83.4 327 82.0 337 82.0 347 82.0 357 82.0 368 82.0 379 82.0 390 82.0 402 82.0
Other Oper ated Departments 12 206.9 13 201.8 13 200.0 14 200.0 14 200.0 15 200.0 15 200.0 15 200.0 16 200.0 16 200.0
Total 1,001 30.5 1,077 27.7 1,128 26.8 1,161 26.8 1,196 26.8 1,232 26.8 1,269 26.8 1,307 26.8 1,346 26.8 1,387 26.8
DEPARTMENTAL INCOME 2,283 69.5 2,811 72.3 3,087 73.2 3,179 73.2 3,274 73.2 3,372 73.2 3,474 73.2 3,578 73.2 3,685 73.2 3,796 73.2
UNDISTRIBUTED OPERATING EXPENSES
Administrative & General 270 8.2 287 7.4 299 7.1 308 7.1 317 7.1 327 7.1 337 7.1 347 7.1 357 7.1 368 7.1
Marketing 170 5.2 181 4.7 189 4.5 194 4.5 200 4.5 206 4.5 212 4.5 219 4.5 225 4.5 232 4.5
Franchise Fee 274 8.4 328 8.4 356 8.5 367 8.5 378 8.5 389 8.5 401 8.5 413 8.5 425 8.5 438 8.5
Prop. Operations & Maint. 108 3.3 129 3.3 150 3.5 154 3.5 159 3.5 163 3.5 168 3.5 173 3.5 179 3.5 184 3.5
Utilities 150 4.6 159 4.1 166 3.9 171 3.9 176 3.9 181 3.9 187 3.9 192 3.9 198 3.9 204 3.9
Total 972 29.7 1,083 27.9 1,159 27.5 1,194 27.5 1,230 27.5 1,267 27.5 1,305 27.5 1,344 27.5 1,384 27.5 1,426 27.5
HOUSE PROFIT 1,311 39.8 1,728 44.4 1,927 45.7 1,985 45.7 2,044 45.7 2,106 45.7 2,169 45.7 2,234 45.7 2,301 45.7 2,370 45.7
Management Fee 99 3.0 117 3.0 126 3.0 130 3.0 134 3.0 138 3.0 142 3.0 147 3.0 151 3.0 155 3.0
INCOME BEFORE FIXED CHARGES 1,213 36.8 1,611 41.4 1,801 42.7 1,855 42.7 1,910 42.7 1,967 42.7 2,027 42.7 2,088 42.7 2,150 42.7 2,214 42.7
FIXED EXPENSES
Property Taxes 129 3.9 131 3.4 133 3.2 137 3.2 142 3.2 146 3.2 150 3.2 155 3.2 159 3.2 164 3.2
Insurance 86 2.6 88 2.3 91 2.2 94 2.2 97 2.2 99 2.2 102 2.2 106 2.2 109 2.2 112 2.2
Reser ve for Replacement 66 2.0 117 3.0 169 4.0 174 4.0 179 4.0 184 4.0 190 4.0 195 4.0 201 4.0 207 4.0
Total 280 8.5 336 8.7 393 9.4 405 9.4 417 9.4 429 9.4 442 9.4 456 9.4 469 9.4 483 9.4
NET INCOME $932 28.3 % $1,275 32.7 % $1,408 33.3 % $1,450 33.3 % $1,493 33.3 % $1,538 33.3 % $1,584 33.3 % $1,632 33.3 % $1,681 33.3 % $1,731 33.3 %1 1 1 1 1 1 1 1 1 1
*Departmental expenses are expr essed as a percentage of depar tmental revenues.
% of
Gross
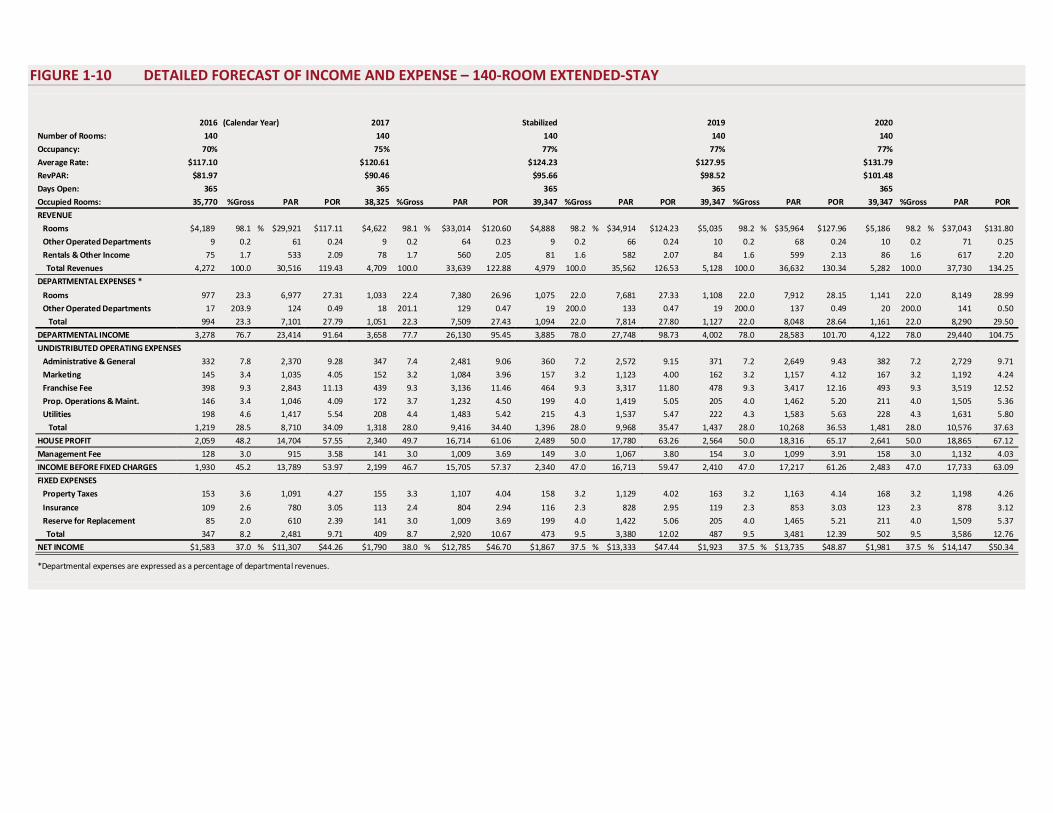
FIGURE 1-10 DETAILED FORECAST OF INCOME AND EXPENSE – 140-ROOM EXTENDED-STAY
2016 (Calendar Year) 2017 Stabilized 2019 2020
Number of Rooms: 140 140 140 140 140
Occupancy: 70% 75% 77% 77% 77%
Average Rate: $117.10 $120.61 $124.23 $127.95 $131.79
RevPAR: $81.97 $90.46 $95.66 $98.52 $101.48
Days Open: 365 365 365 365 365
Occupied Rooms: 35,770 %Gross PAR POR 38,325 %Gross PAR POR 39,347 %Gross PAR POR 39,347 %Gross PAR POR 39,347 %Gross PAR POR
REVENUE
Rooms $4,189 98.1 % $29,921 $117.11 $4,622 98.1 % $33,014 $120.60 $4,888 98.2 % $34,914 $124.23 $5,035 98.2 % $35,964 $127.96 $5,186 98.2 % $37,043 $131.80
Other Operated Departments 9 0.2 61 0.24 9 0.2 64 0.23 9 0.2 66 0.24 10 0.2 68 0.24 10 0.2 71 0.25
Rentals & Other Income 75 1.7 533 2.09 78 1.7 560 2.05 81 1.6 582 2.07 84 1.6 599 2.13 86 1.6 617 2.20
Total Revenues 4,272 100.0 30,516 119.43 4,709 100.0 33,639 122.88 4,979 100.0 35,562 126.53 5,128 100.0 36,632 130.34 5,282 100.0 37,730 134.25
DEPARTMENTAL EXPENSES *
Rooms 977 23.3 6,977 27.31 1,033 22.4 7,380 26.96 1,075 22.0 7,681 27.33 1,108 22.0 7,912 28.15 1,141 22.0 8,149 28.99
Other Operated Departments 17 203.9 124 0.49 18 201.1 129 0.47 19 200.0 133 0.47 19 200.0 137 0.49 20 200.0 141 0.50
Total 994 23.3 7,101 27.79 1,051 22.3 7,509 27.43 1,094 22.0 7,814 27.80 1,127 22.0 8,048 28.64 1,161 22.0 8,290 29.50
DEPARTMENTAL INCOME 3,278 76.7 23,414 91.64 3,658 77.7 26,130 95.45 3,885 78.0 27,748 98.73 4,002 78.0 28,583 101.70 4,122 78.0 29,440 104.75
UNDISTRIBUTED OPERATING EXPENSES
Administrative & General 332 7.8 2,370 9.28 347 7.4 2,481 9.06 360 7.2 2,572 9.15 371 7.2 2,649 9.43 382 7.2 2,729 9.71
Marketing 145 3.4 1,035 4.05 152 3.2 1,084 3.96 157 3.2 1,123 4.00 162 3.2 1,157 4.12 167 3.2 1,192 4.24
Franchise Fee 398 9.3 2,843 11.13 439 9.3 3,136 11.46 464 9.3 3,317 11.80 478 9.3 3,417 12.16 493 9.3 3,519 12.52
Prop. Operations & Maint. 146 3.4 1,046 4.09 172 3.7 1,232 4.50 199 4.0 1,419 5.05 205 4.0 1,462 5.20 211 4.0 1,505 5.36
Utilities 198 4.6 1,417 5.54 208 4.4 1,483 5.42 215 4.3 1,537 5.47 222 4.3 1,583 5.63 228 4.3 1,631 5.80
Total 1,219 28.5 8,710 34.09 1,318 28.0 9,416 34.40 1,396 28.0 9,968 35.47 1,437 28.0 10,268 36.53 1,481 28.0 10,576 37.63
HOUSE PROFIT 2,059 48.2 14,704 57.55 2,340 49.7 16,714 61.06 2,489 50.0 17,780 63.26 2,564 50.0 18,316 65.17 2,641 50.0 18,865 67.12
Management Fee 128 3.0 915 3.58 141 3.0 1,009 3.69 149 3.0 1,067 3.80 154 3.0 1,099 3.91 158 3.0 1,132 4.03
INCOME BEFORE FIXED CHARGES 1,930 45.2 13,789 53.97 2,199 46.7 15,705 57.37 2,340 47.0 16,713 59.47 2,410 47.0 17,217 61.26 2,483 47.0 17,733 63.09
FIXED EXPENSES
Property Taxes 153 3.6 1,091 4.27 155 3.3 1,107 4.04 158 3.2 1,129 4.02 163 3.2 1,163 4.14 168 3.2 1,198 4.26
Insurance 109 2.6 780 3.05 113 2.4 804 2.94 116 2.3 828 2.95 119 2.3 853 3.03 123 2.3 878 3.12
Reserve for Replacement 85 2.0 610 2.39 141 3.0 1,009 3.69 199 4.0 1,422 5.06 205 4.0 1,465 5.21 211 4.0 1,509 5.37
Total 347 8.2 2,481 9.71 409 8.7 2,920 10.67 473 9.5 3,380 12.02 487 9.5 3,481 12.39 502 9.5 3,586 12.76
NET INCOME $1,583 37.0 % $11,307 $44.26 $1,790 38.0 % $12,785 $46.70 $1,867 37.5 % $13,333 $47.44 $1,923 37.5 % $13,735 $48.87 $1,981 37.5 % $14,147 $50.34
*Departmental expenses are expressed as a percentage of departmental revenues.
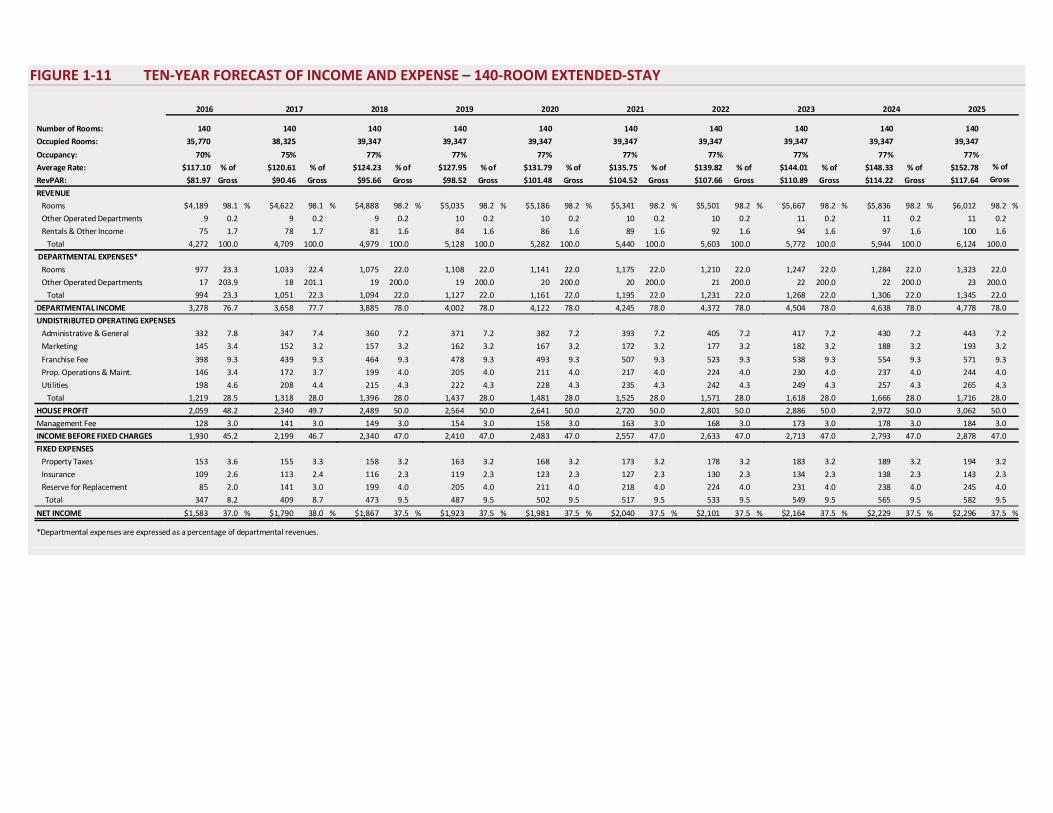
FIGURE 1-11 TEN-YEAR FORECAST OF INCOME AND EXPENSE – 140-ROOM EXTENDED-STAY
2016 2017 2018 2019 2020 2021 2022 2023 2024 2025
Number of Rooms: 140 140 140 140 140 140 140 140 140 140
Occupied Rooms: 35,770 38,325 39,347 39,347 39,347 39,347 39,347 39,347 39,347 39,347
Occupancy: 70% 75% 77% 77% 77% 77% 77% 77% 77% 77%
Average Rate: $117.10 % of $120.61 % of $124.23 % of $127.95 % of $131.79 % of $135.75 % of $139.82 % of $144.01 % of $148.33 % of $152.78
RevPAR: $81.97 Gross $90.46 Gross $95.66 Gross $98.52 Gross $101.48 Gross $104.52 Gross $107.66 Gross $110.89 Gross $114.22 Gross $117.64
REVENUE
Rooms $4,189 98.1 % $4,622 98.1 % $4,888 98.2 % $5,035 98.2 % $5,186 98.2 % $5,341 98.2 % $5,501 98.2 % $5,667 98.2 % $5,836 98.2 % $6,012 98.2 %
Other Operated Departments 9 0.2 9 0.2 9 0.2 10 0.2 10 0.2 10 0.2 10 0.2 11 0.2 11 0.2 11 0.2
Rentals & Other Income 75 1.7 78 1.7 81 1.6 84 1.6 86 1.6 89 1.6 92 1.6 94 1.6 97 1.6 100 1.6
Total 4,272 100.0 4,709 100.0 4,979 100.0 5,128 100.0 5,282 100.0 5,440 100.0 5,603 100.0 5,772 100.0 5,944 100.0 6,124 100.0
DEPARTMENTAL EXPENSES*
Rooms 977 23.3 1,033 22.4 1,075 22.0 1,108 22.0 1,141 22.0 1,175 22.0 1,210 22.0 1,247 22.0 1,284 22.0 1,323 22.0
Other Operated Departments 17 203.9 18 201.1 19 200.0 19 200.0 20 200.0 20 200.0 21 200.0 22 200.0 22 200.0 23 200.0
Total 994 23.3 1,051 22.3 1,094 22.0 1,127 22.0 1,161 22.0 1,195 22.0 1,231 22.0 1,268 22.0 1,306 22.0 1,345 22.0
DEPARTMENTAL INCOME 3,278 76.7 3,658 77.7 3,885 78.0 4,002 78.0 4,122 78.0 4,245 78.0 4,372 78.0 4,504 78.0 4,638 78.0 4,778 78.0
UNDISTRIBUTED OPERATING EXPENSES
Administrative & General 332 7.8 347 7.4 360 7.2 371 7.2 382 7.2 393 7.2 405 7.2 417 7.2 430 7.2 443 7.2
Marketing 145 3.4 152 3.2 157 3.2 162 3.2 167 3.2 172 3.2 177 3.2 182 3.2 188 3.2 193 3.2
Franchise Fee 398 9.3 439 9.3 464 9.3 478 9.3 493 9.3 507 9.3 523 9.3 538 9.3 554 9.3 571 9.3
Prop. Operations & Maint. 146 3.4 172 3.7 199 4.0 205 4.0 211 4.0 217 4.0 224 4.0 230 4.0 237 4.0 244 4.0
Utilities 198 4.6 208 4.4 215 4.3 222 4.3 228 4.3 235 4.3 242 4.3 249 4.3 257 4.3 265 4.3
Total 1,219 28.5 1,318 28.0 1,396 28.0 1,437 28.0 1,481 28.0 1,525 28.0 1,571 28.0 1,618 28.0 1,666 28.0 1,716 28.0
HOUSE PROFIT 2,059 48.2 2,340 49.7 2,489 50.0 2,564 50.0 2,641 50.0 2,720 50.0 2,801 50.0 2,886 50.0 2,972 50.0 3,062 50.0
Management Fee 128 3.0 141 3.0 149 3.0 154 3.0 158 3.0 163 3.0 168 3.0 173 3.0 178 3.0 184 3.0
INCOME BEFORE FIXED CHARGES 1,930 45.2 2,199 46.7 2,340 47.0 2,410 47.0 2,483 47.0 2,557 47.0 2,633 47.0 2,713 47.0 2,793 47.0 2,878 47.0
FIXED EXPENSES
Property Taxes 153 3.6 155 3.3 158 3.2 163 3.2 168 3.2 173 3.2 178 3.2 183 3.2 189 3.2 194 3.2
Insurance 109 2.6 113 2.4 116 2.3 119 2.3 123 2.3 127 2.3 130 2.3 134 2.3 138 2.3 143 2.3
Reserve for Replacement 85 2.0 141 3.0 199 4.0 205 4.0 211 4.0 218 4.0 224 4.0 231 4.0 238 4.0 245 4.0
Total 347 8.2 409 8.7 473 9.5 487 9.5 502 9.5 517 9.5 533 9.5 549 9.5 565 9.5 582 9.5
NET INCOME $1,583 37.0 % $1,790 38.0 % $1,867 37.5 % $1,923 37.5 % $1,981 37.5 % $2,040 37.5 % $2,101 37.5 % $2,164 37.5 % $2,229 37.5 % $2,296 37.5 %1 1 1 1 1 1 1 1 1 1
*Departmental expenses are expressed as a percentage of departmental revenues.
% of
Gross
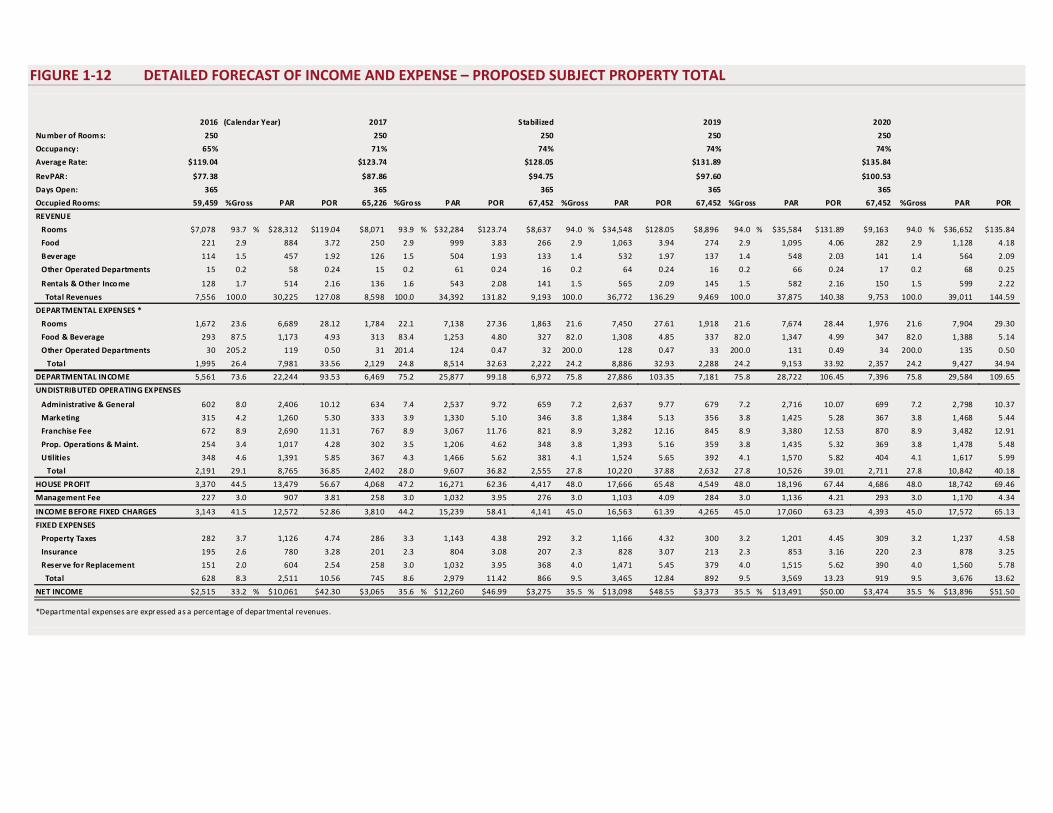
FIGURE 1-12 DETAILED FORECAST OF INCOME AND EXPENSE – PROPOSED SUBJECT PROPERTY TOTAL
2016 (Calendar Year) 2017 Stabilized 2019 2020
Nu mber of Room s: 250 250 250 250 250
Occupancy: 65% 71% 74% 74% 74%
Average Rate: $119.04 $123.74 $128.05 $131.89 $135.84
RevPAR: $77.38 $87.86 $94.75 $97.60 $100.53
Days Open: 365 365 365 365 365
Occupied Rooms: 59,459 %Gro ss PAR POR 65,226 %Gro ss P AR POR 67,452 %Gross PAR POR 67,452 %Gross PAR POR 67,452 %Gross PAR POR
REVENUE
Rooms $7,078 93.7 % $28,312 $119.04 $8,071 93.9 % $32,284 $123.74 $8,637 94.0 % $34,548 $128.05 $8,896 94.0 % $35,584 $131.89 $9,163 94.0 % $36,652 $135.84
Food 221 2.9 884 3.72 250 2.9 999 3.83 266 2.9 1,063 3.94 274 2.9 1,095 4.06 282 2.9 1,128 4.18
Beverage 114 1.5 457 1.92 126 1.5 504 1.93 133 1.4 532 1.97 137 1.4 548 2.03 141 1.4 564 2.09
Other Operated Departments 15 0.2 58 0.24 15 0.2 61 0.24 16 0.2 64 0.24 16 0.2 66 0.24 17 0.2 68 0.25
Rentals & Other Inco me 128 1.7 514 2.16 136 1.6 543 2.08 141 1.5 565 2.09 145 1.5 582 2.16 150 1.5 599 2.22
Total Revenues 7,556 100.0 30,225 127.08 8,598 100.0 34,392 131.82 9,193 100.0 36,772 136.29 9,469 100.0 37,875 140.38 9,753 100.0 39,011 144.59
DEPARTMENTAL EXPENSES *
Rooms 1,672 23.6 6,689 28.12 1,784 22.1 7,138 27.36 1,863 21.6 7,450 27.61 1,918 21.6 7,674 28.44 1,976 21.6 7,904 29.30
Food & Beverage 293 87.5 1,173 4.93 313 83.4 1,253 4.80 327 82.0 1,308 4.85 337 82.0 1,347 4.99 347 82.0 1,388 5.14
Other Operated Departments 30 205.2 119 0.50 31 201.4 124 0.47 32 200.0 128 0.47 33 200.0 131 0.49 34 200.0 135 0.50
Total 1,995 26.4 7,981 33.56 2,129 24.8 8,514 32.63 2,222 24.2 8,886 32.93 2,288 24.2 9,153 33.92 2,357 24.2 9,427 34.94
DEPARTMENTAL INCOME 5,561 73.6 22,244 93.53 6,469 75.2 25,877 99.18 6,972 75.8 27,886 103.35 7,181 75.8 28,722 106.45 7,396 75.8 29,584 109.65
UNDISTRIBUTED OPERATING EXPENSES
Administrative & General 602 8.0 2,406 10.12 634 7.4 2,537 9.72 659 7.2 2,637 9.77 679 7.2 2,716 10.07 699 7.2 2,798 10.37
Marketing 315 4.2 1,260 5.30 333 3.9 1,330 5.10 346 3.8 1,384 5.13 356 3.8 1,425 5.28 367 3.8 1,468 5.44
Franchise Fee 672 8.9 2,690 11.31 767 8.9 3,067 11.76 821 8.9 3,282 12.16 845 8.9 3,380 12.53 870 8.9 3,482 12.91
Prop. Operations & Maint. 254 3.4 1,017 4.28 302 3.5 1,206 4.62 348 3.8 1,393 5.16 359 3.8 1,435 5.32 369 3.8 1,478 5.48
Utilities 348 4.6 1,391 5.85 367 4.3 1,466 5.62 381 4.1 1,524 5.65 392 4.1 1,570 5.82 404 4.1 1,617 5.99
Total 2,191 29.1 8,765 36.85 2,402 28.0 9,607 36.82 2,555 27.8 10,220 37.88 2,632 27.8 10,526 39.01 2,711 27.8 10,842 40.18
HOUSE PROFIT 3,370 44.5 13,479 56.67 4,068 47.2 16,271 62.36 4,417 48.0 17,666 65.48 4,549 48.0 18,196 67.44 4,686 48.0 18,742 69.46
Management Fee 227 3.0 907 3.81 258 3.0 1,032 3.95 276 3.0 1,103 4.09 284 3.0 1,136 4.21 293 3.0 1,170 4.34
INCOME BEFORE FIXED CHARGES 3,143 41.5 12,572 52.86 3,810 44.2 15,239 58.41 4,141 45.0 16,563 61.39 4,265 45.0 17,060 63.23 4,393 45.0 17,572 65.13
FIXED EXPENSES
Property Taxes 282 3.7 1,126 4.74 286 3.3 1,143 4.38 292 3.2 1,166 4.32 300 3.2 1,201 4.45 309 3.2 1,237 4.58
Insurance 195 2.6 780 3.28 201 2.3 804 3.08 207 2.3 828 3.07 213 2.3 853 3.16 220 2.3 878 3.25
Reserve for Replacement 151 2.0 604 2.54 258 3.0 1,032 3.95 368 4.0 1,471 5.45 379 4.0 1,515 5.62 390 4.0 1,560 5.78
Total 628 8.3 2,511 10.56 745 8.6 2,979 11.42 866 9.5 3,465 12.84 892 9.5 3,569 13.23 919 9.5 3,676 13.62
NET INCOME $2,515 33.2 % $10,061 $42.30 $3,065 35.6 % $12,260 $46.99 $3,275 35.5 % $13,098 $48.55 $3,373 35.5 % $13,491 $50.00 $3,474 35.5 % $13,896 $51.50
*Departmental expenses are expr essed as a percentage of depar tmental revenues.
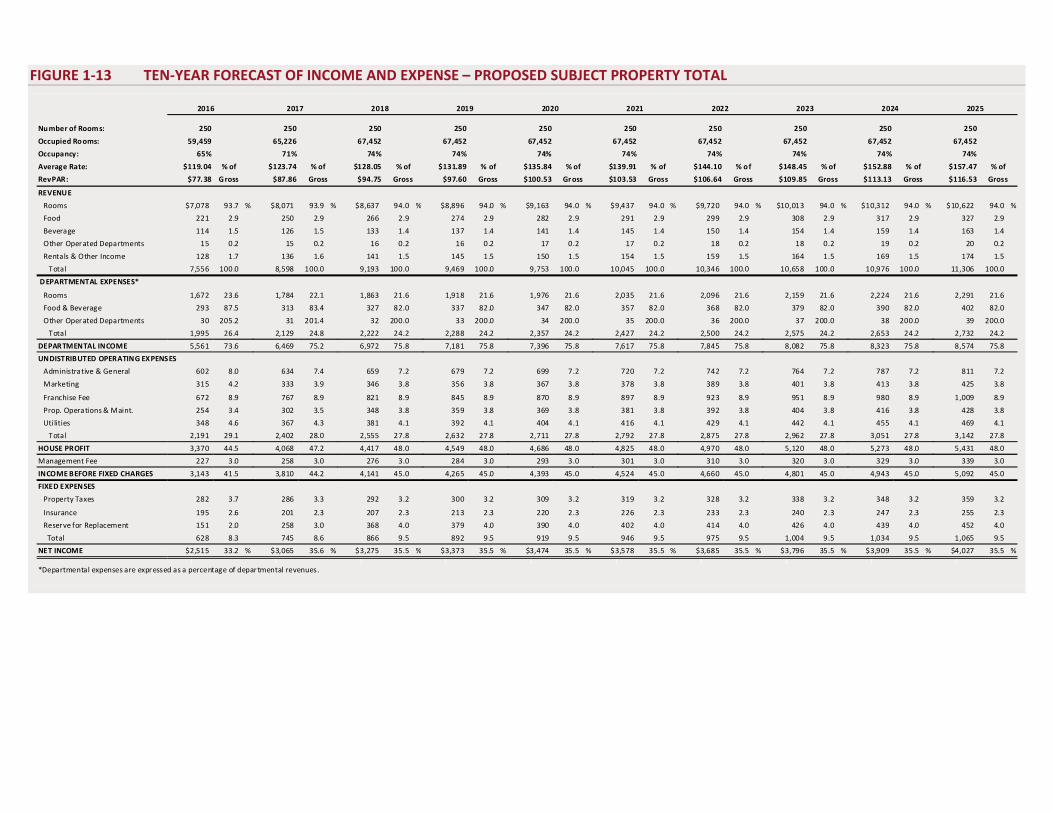
FIGURE 1-13 TEN-YEAR FORECAST OF INCOME AND EXPENSE – PROPOSED SUBJECT PROPERTY TOTAL
2016 2017 2018 2019 2020 2021 2022 2023 2024 2025
Number of Rooms: 250 250 250 250 250 250 250 250 250 250
Occupied Rooms: 59,459 65,226 67,452 67,452 67,452 67,452 67,452 67,452 67,452 67,452
Occupancy: 65% 71% 74% 74% 74% 74% 74% 74% 74% 74%
Average Rate: $119.04 % of $123.74 % of $128.05 % of $131.89 % of $135.84 % of $139.91 % of $144.10 % of $148.45 % of $152.88 % of $157.47
RevPAR: $77.38 Gross $87.86 Gross $94.75 Gross $97.60 Gross $100.53 Gr oss $103.53 Gross $106.64 Gross $109.85 Gross $113.13 Gross $116.53
REVENUE
Rooms $7,078 93.7 % $8,071 93.9 % $8,637 94.0 % $8,896 94.0 % $9,163 94.0 % $9,437 94.0 % $9,720 94.0 % $10,013 94.0 % $10,312 94.0 % $10,622 94.0 %
Food 221 2.9 250 2.9 266 2.9 274 2.9 282 2.9 291 2.9 299 2.9 308 2.9 317 2.9 327 2.9
Beverage 114 1.5 126 1.5 133 1.4 137 1.4 141 1.4 145 1.4 150 1.4 154 1.4 159 1.4 163 1.4
Other Operated Departments 15 0.2 15 0.2 16 0.2 16 0.2 17 0.2 17 0.2 18 0.2 18 0.2 19 0.2 20 0.2
Rentals & Other Income 128 1.7 136 1.6 141 1.5 145 1.5 150 1.5 154 1.5 159 1.5 164 1.5 169 1.5 174 1.5
Total 7,556 100.0 8,598 100.0 9,193 100.0 9,469 100.0 9,753 100.0 10,045 100.0 10,346 100.0 10,658 100.0 10,976 100.0 11,306 100.0
D EPARTMENTAL EXPENSES*
Rooms 1,672 23.6 1,784 22.1 1,863 21.6 1,918 21.6 1,976 21.6 2,035 21.6 2,096 21.6 2,159 21.6 2,224 21.6 2,291 21.6
Food & Beverage 293 87.5 313 83.4 327 82.0 337 82.0 347 82.0 357 82.0 368 82.0 379 82.0 390 82.0 402 82.0
Other Operated Departments 30 205.2 31 201.4 32 200.0 33 200.0 34 200.0 35 200.0 36 200.0 37 200.0 38 200.0 39 200.0
Total 1,995 26.4 2,129 24.8 2,222 24.2 2,288 24.2 2,357 24.2 2,427 24.2 2,500 24.2 2,575 24.2 2,653 24.2 2,732 24.2
DEPARTMENTAL INCOME 5,561 73.6 6,469 75.2 6,972 75.8 7,181 75.8 7,396 75.8 7,617 75.8 7,845 75.8 8,082 75.8 8,323 75.8 8,574 75.8
UNDISTRIBUTED OPERATING EXPENSES
Administrative & General 602 8.0 634 7.4 659 7.2 679 7.2 699 7.2 720 7.2 742 7.2 764 7.2 787 7.2 811 7.2
Marketing 315 4.2 333 3.9 346 3.8 356 3.8 367 3.8 378 3.8 389 3.8 401 3.8 413 3.8 425 3.8
Franchise Fee 672 8.9 767 8.9 821 8.9 845 8.9 870 8.9 897 8.9 923 8.9 951 8.9 980 8.9 1,009 8.9
Prop. Operations & Maint. 254 3.4 302 3.5 348 3.8 359 3.8 369 3.8 381 3.8 392 3.8 404 3.8 416 3.8 428 3.8
Utilities 348 4.6 367 4.3 381 4.1 392 4.1 404 4.1 416 4.1 429 4.1 442 4.1 455 4.1 469 4.1
Total 2,191 29.1 2,402 28.0 2,555 27.8 2,632 27.8 2,711 27.8 2,792 27.8 2,875 27.8 2,962 27.8 3,051 27.8 3,142 27.8
HOUSE PROFIT 3,370 44.5 4,068 47.2 4,417 48.0 4,549 48.0 4,686 48.0 4,825 48.0 4,970 48.0 5,120 48.0 5,273 48.0 5,431 48.0
Management Fee 227 3.0 258 3.0 276 3.0 284 3.0 293 3.0 301 3.0 310 3.0 320 3.0 329 3.0 339 3.0
INCOME BEFORE FIXED CHARGES 3,143 41.5 3,810 44.2 4,141 45.0 4,265 45.0 4,393 45.0 4,524 45.0 4,660 45.0 4,801 45.0 4,943 45.0 5,092 45.0
FIXED EXPENSES
Property Taxes 282 3.7 286 3.3 292 3.2 300 3.2 309 3.2 319 3.2 328 3.2 338 3.2 348 3.2 359 3.2
Insurance 195 2.6 201 2.3 207 2.3 213 2.3 220 2.3 226 2.3 233 2.3 240 2.3 247 2.3 255 2.3
Reserve for Replacement 151 2.0 258 3.0 368 4.0 379 4.0 390 4.0 402 4.0 414 4.0 426 4.0 439 4.0 452 4.0
Total 628 8.3 745 8.6 866 9.5 892 9.5 919 9.5 946 9.5 975 9.5 1,004 9.5 1,034 9.5 1,065 9.5
NET INCOME $2,515 33.2 % $3,065 35.6 % $3,275 35.5 % $3,373 35.5 % $3,474 35.5 % $3,578 35.5 % $3,685 35.5 % $3,796 35.5 % $3,909 35.5 % $4,027 35.5 %1 1 1 1 1 1 1 1 1 1
*Departmental expenses are expressed as a percentage of depar tmental revenues.
% of
Gross
April-2013 Executive Summary Proposed Dual-Branded Hotels at Florida Atlantic University – Boca Raton, Florida 17
As illustrated, each hotel is expected to stabilize at a profitable level. Please refer to the Forecast of Income and Expense chapter of our report for a detailed explanation of the methodology used in deriving this forecast. The Feasibility Analysis chapter of this report converts these cash flows into a net present value indication assuming set-forth debt and equity requirements. The conclusion indicates that an equity investor contributing $12,590,000 (roughly 35% of a $36,000,000 total value findings) would expect to receive a 17.5% internal rate of return over a ten-year holding period. Based on these parameters, the feasibility of the subject project is confirmed. “Extraordinary Assumption” is defined in USPAP as follows:
An assumption, directly related to a specific assignment, which, if found to be false, could alter the appraiser’s opinions or conclusions. Comment: Extraordinary assumptions presume as fact otherwise uncertain information about physical, legal, or economic characteristics of the subject property; or about conclusions external to the property, such as market conditions or trends; or about the integrity of the data used in an analysis.1
The analysis is based on the extraordinary assumption that the described improvements have been completed as of the stated date of opening. The reader should understand that the completed subject property does not yet, in fact, exist as of the date of this report. Our feasibility study does not address unforeseeable events that could alter the proposed project and/or the market conditions reflected in the analyses; we assume that no significant changes, other than those anticipated and explained in this report, will take place between the date of inspection and stated date of opening. We have made no other extraordinary assumptions specific to this feasibility study. However, several important general assumptions have been made that apply to this feasibility study and our studies of proposed hotels in general. These aspects are set forth in the Assumptions and Limiting Conditions chapter of this report. “Hypothetical Condition” is defined in USPAP as follows:
That which is contrary to what exists but is supposed for the purpose of analysis. Comment: Hypothetical conditions assume conditions contrary to known facts about physical, legal, or economic characteristics of the subject property; or about conditions external to the property, such as
1 Appraisal Institute, Uniform Standards of Professional Appraisal Practice, 2012 – 2013 ed.
Feasibility Conclusion
Assignment Conditions
April-2013 Executive Summary Proposed Dual-Branded Hotels at Florida Atlantic University – Boca Raton, Florida 18
market conditions or trends; or about the integrity of data used in an analysis. 2
We have assumed no significant hypothetical conditions. We have not made any jurisdictional exceptions to the Uniform Standards of Professional Appraisal Practice in our analysis or report. This feasibility report is being prepared for use in the development of the proposed subject property. The client for this engagement is Florida Atlantic University. This report is intended for the addressee firm, and may not be distributed to or relied upon by other persons or entities. The methodology used to develop this study is based on the market research and valuation techniques set forth in the textbooks authored by Hospitality Valuation Services for the American Institute of Real Estate Appraisers and the Appraisal Institute, entitled The Valuation of Hotels and Motels,3 Hotels, Motels and Restaurants: Valuations and Market Studies,4 The Computerized Income Approach to Hotel/Motel Market Studies and Valuations,5 Hotels and Motels: A Guide to Market Analysis, Investment Analysis, and Valuations,6 and Hotels and Motels – Valuations and Market Studies.7
1. All information was collected and analyzed by the staff of TS Worldwide, LLC. Information was supplied by the client and/or the property’s development team.
2. The subject site has been evaluated from the viewpoint of its physical utility for the future operation of a hotel, as well as access, visibility, and other relevant factors.
2 Appraisal Institute, Uniform Standards of Professional Appraisal Practice, 2012 – 2013 ed. 3 Stephen Rushmore, The Valuation of Hotels and Motels. (Chicago: American Institute of Real Estate Appraisers, 1978). 4 Stephen Rushmore, Hotels, Motels and Restaurants: Valuations and Market Studies. (Chicago: American Institute of Real Estate Appraisers, 1983). 5 Stephen Rushmore, The Computerized Income Approach to Hotel/Motel Market Studies and Valuations. (Chicago: American Institute of Real Estate Appraisers, 1990). 6 Stephen Rushmore, Hotels and Motels: A Guide to Market Analysis, Investment Analysis, and Valuations (Chicago: Appraisal Institute, 1992). 7 Stephen Rushmore and Erich Baum, Hotels and Motels – Valuations and Market Studies. (Chicago: Appraisal Institute, 2001).
Intended Use of the Feasibility Study
Identification of the Client and Intended User(s)
Scope of Work
April-2013 Executive Summary Proposed Dual-Branded Hotels at Florida Atlantic University – Boca Raton, Florida 19
3. The subject property's proposed improvements have been reviewed for their expected quality of construction, design, and layout efficiency.
4. The surrounding economic environment, on both an area and neighborhood level, has been reviewed to identify specific hostelry-related economic and demographic trends that may have an impact on future demand for hotels.
5. Dividing the market for hotel accommodations into individual segments defines specific market characteristics for the types of travelers expected to utilize the area's hotels. The factors investigated include purpose of visit, average length of stay, facilities and amenities required, seasonality, daily demand fluctuations, and price sensitivity.
6. An analysis of existing and proposed competition provides an indication of the current accommodated demand, along with market penetration and the degree of competitiveness. Unless noted otherwise, we have inspected the competitive lodging facilities summarized in this report.
7. Documentation for an occupancy and average rate projection is derived utilizing the build-up approach based on an analysis of lodging activity.
8. A detailed projection of income and expense made in accordance with the Uniform System of Accounts for the Lodging Industry sets forth the anticipated economic benefits of the subject property.
9. A feasibility analysis is performed that compares the net present value of the forecast cash flows to the development cost of the hotel.
April-2013 Description of the Site and Neighborhood Proposed Dual-Branded Hotels at Florida Atlantic University – Boca Raton, Florida 20
2. Description of the Site and Neighborhood
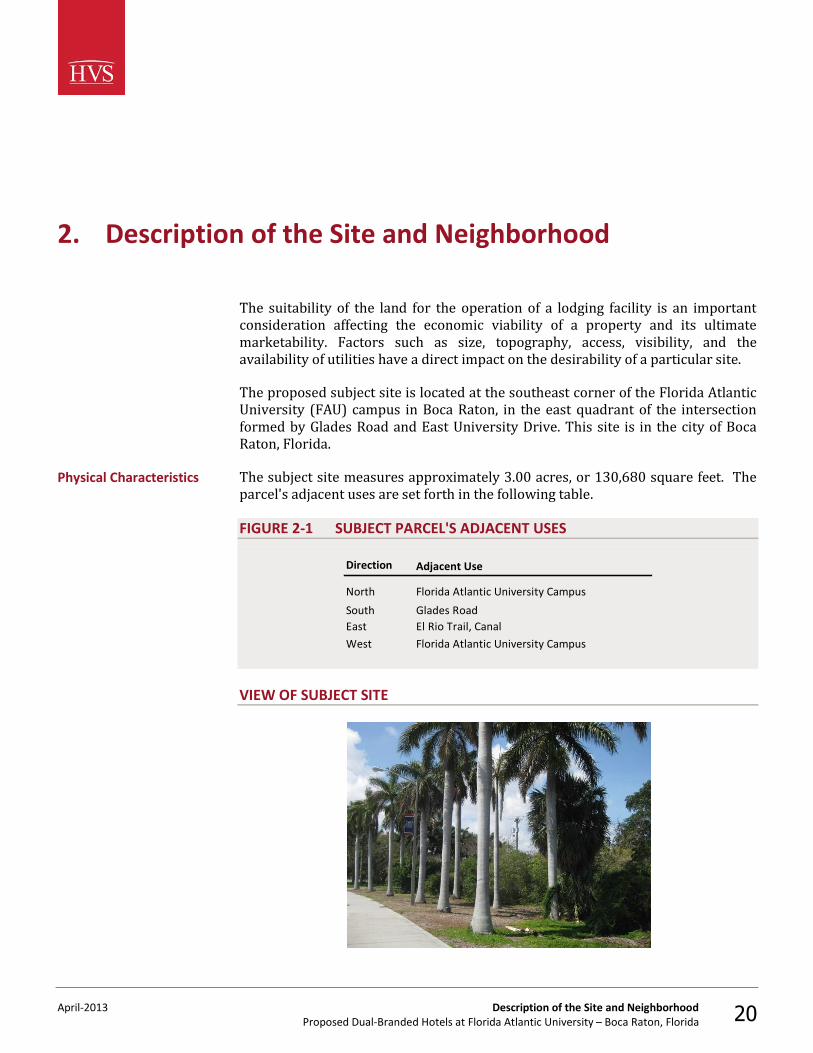
The suitability of the land for the operation of a lodging facility is an important consideration affecting the economic viability of a property and its ultimate marketability. Factors such as size, topography, access, visibility, and the availability of utilities have a direct impact on the desirability of a particular site. The proposed subject site is located at the southeast corner of the Florida Atlantic University (FAU) campus in Boca Raton, in the east quadrant of the intersection formed by Glades Road and East University Drive. This site is in the city of Boca Raton, Florida. The subject site measures approximately 3.00 acres, or 130,680 square feet. The parcel's adjacent uses are set forth in the following table. FIGURE 2-1 SUBJECT PARCEL'S ADJACENT USES
Direction
North Florida Atlantic University Campus
South Glades RoadEast El Rio Trail, Canal
West Florida Atlantic University Campus
Adjacent Use
VIEW OF SUBJECT SITE
Physical Characteristics
April-2013 Description of the Site and Neighborhood Proposed Dual-Branded Hotels at Florida Atlantic University – Boca Raton, Florida 21
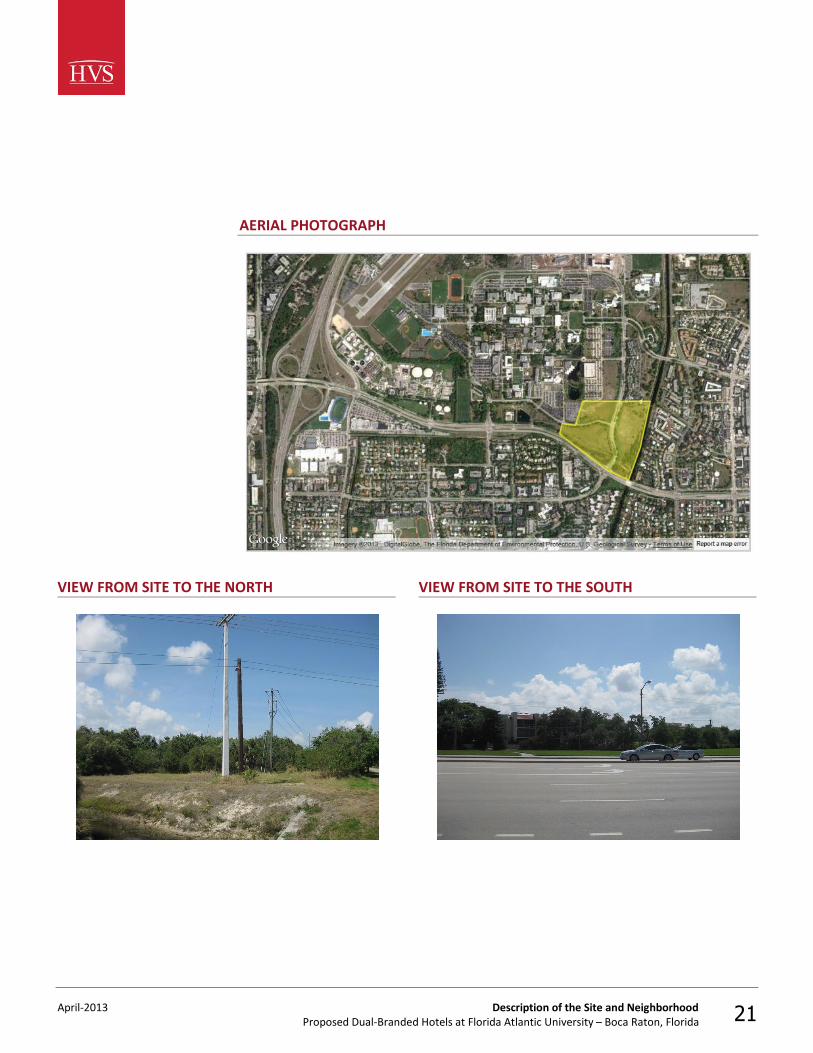
AERIAL PHOTOGRAPH
VIEW FROM SITE TO THE NORTH
VIEW FROM SITE TO THE SOUTH
April-2013 Description of the Site and Neighborhood Proposed Dual-Branded Hotels at Florida Atlantic University – Boca Raton, Florida 22
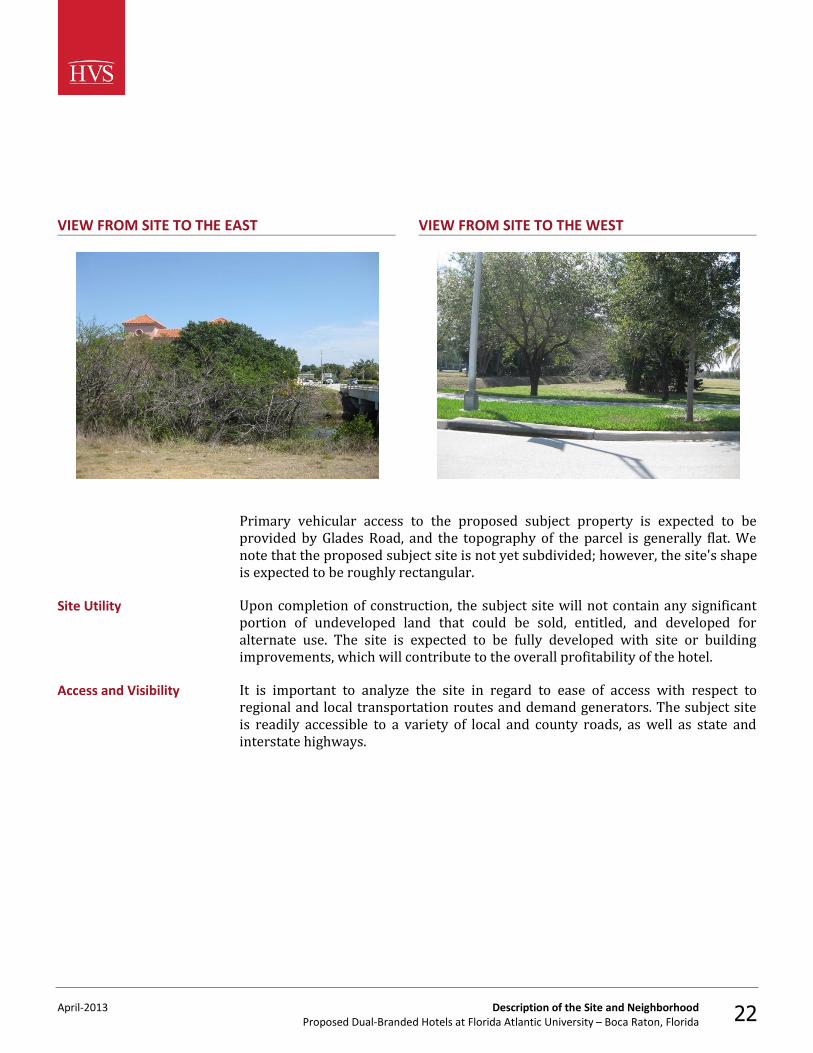
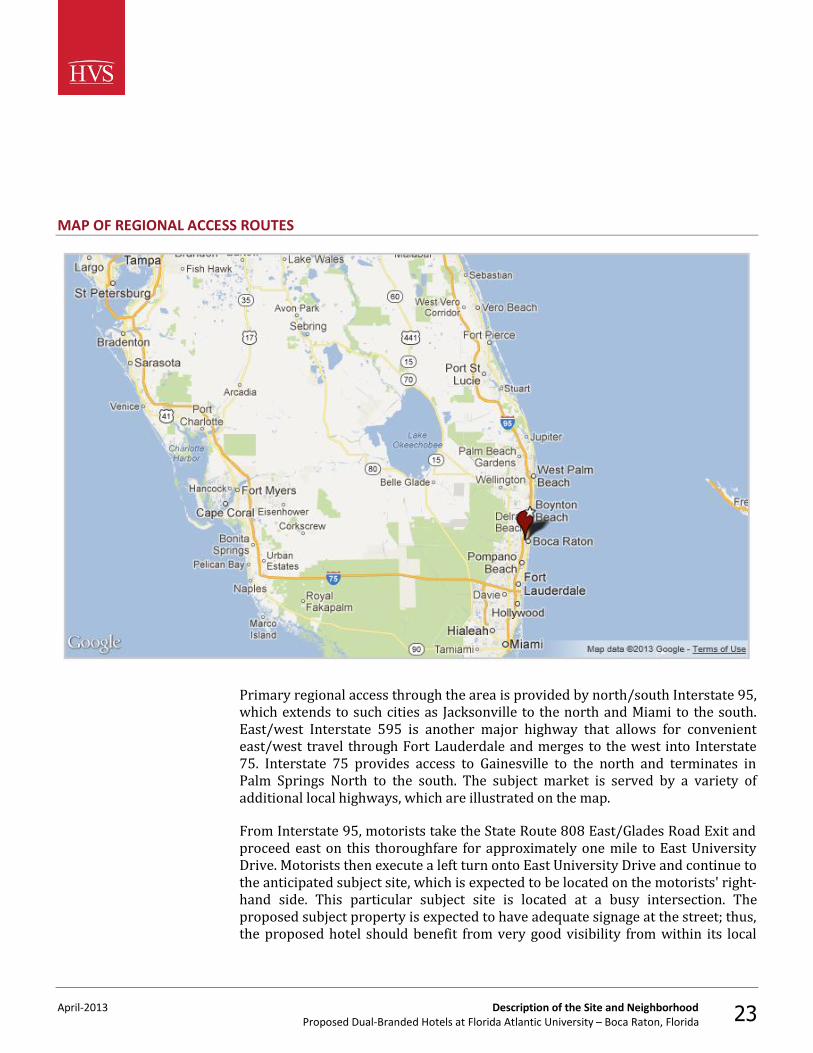
VIEW FROM SITE TO THE EAST
VIEW FROM SITE TO THE WEST
Primary vehicular access to the proposed subject property is expected to be provided by Glades Road, and the topography of the parcel is generally flat. We note that the proposed subject site is not yet subdivided; however, the site's shape is expected to be roughly rectangular. Upon completion of construction, the subject site will not contain any significant portion of undeveloped land that could be sold, entitled, and developed for alternate use. The site is expected to be fully developed with site or building improvements, which will contribute to the overall profitability of the hotel. It is important to analyze the site in regard to ease of access with respect to regional and local transportation routes and demand generators. The subject site is readily accessible to a variety of local and county roads, as well as state and interstate highways.
Site Utility
Access and Visibility
April-2013 Description of the Site and Neighborhood Proposed Dual-Branded Hotels at Florida Atlantic University – Boca Raton, Florida 23
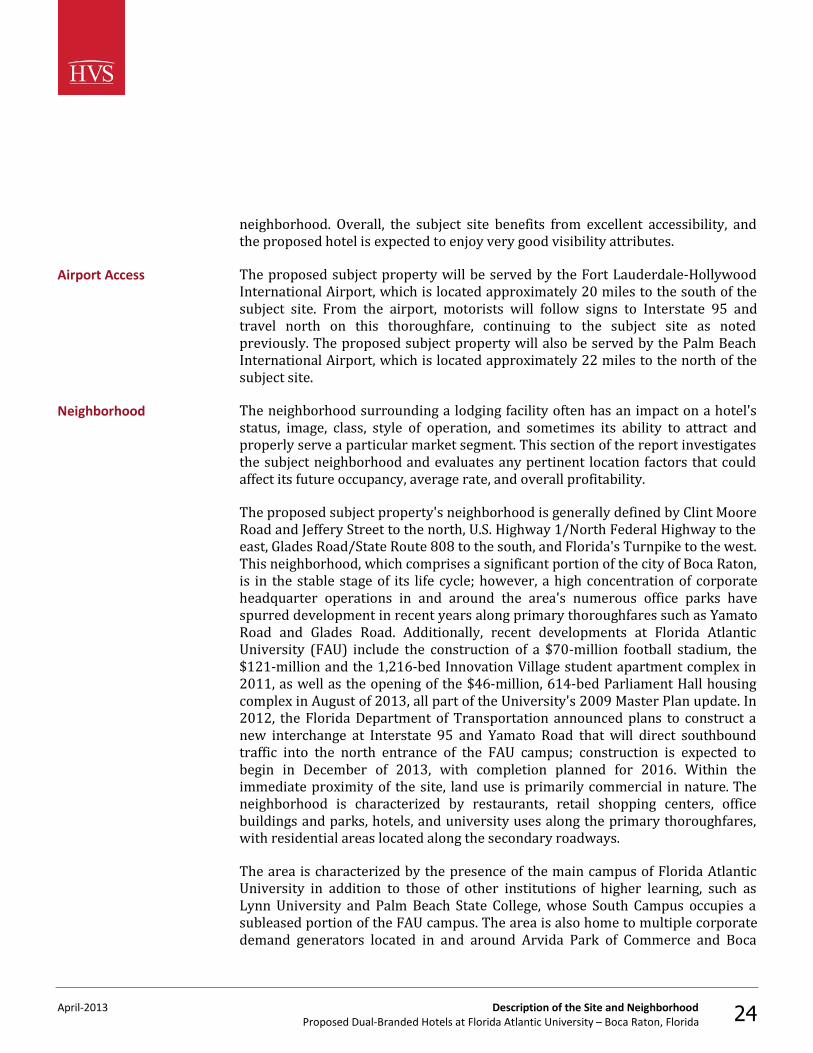
MAP OF REGIONAL ACCESS ROUTES
Primary regional access through the area is provided by north/south Interstate 95, which extends to such cities as Jacksonville to the north and Miami to the south. East/west Interstate 595 is another major highway that allows for convenient east/west travel through Fort Lauderdale and merges to the west into Interstate 75. Interstate 75 provides access to Gainesville to the north and terminates in Palm Springs North to the south. The subject market is served by a variety of additional local highways, which are illustrated on the map. From Interstate 95, motorists take the State Route 808 East/Glades Road Exit and proceed east on this thoroughfare for approximately one mile to East University Drive. Motorists then execute a left turn onto East University Drive and continue to the anticipated subject site, which is expected to be located on the motorists' right-hand side. This particular subject site is located at a busy intersection. The proposed subject property is expected to have adequate signage at the street; thus, the proposed hotel should benefit from very good visibility from within its local
April-2013 Description of the Site and Neighborhood Proposed Dual-Branded Hotels at Florida Atlantic University – Boca Raton, Florida 24
neighborhood. Overall, the subject site benefits from excellent accessibility, and the proposed hotel is expected to enjoy very good visibility attributes. The proposed subject property will be served by the Fort Lauderdale-Hollywood International Airport, which is located approximately 20 miles to the south of the subject site. From the airport, motorists will follow signs to Interstate 95 and travel north on this thoroughfare, continuing to the subject site as noted previously. The proposed subject property will also be served by the Palm Beach International Airport, which is located approximately 22 miles to the north of the subject site. The neighborhood surrounding a lodging facility often has an impact on a hotel's status, image, class, style of operation, and sometimes its ability to attract and properly serve a particular market segment. This section of the report investigates the subject neighborhood and evaluates any pertinent location factors that could affect its future occupancy, average rate, and overall profitability. The proposed subject property's neighborhood is generally defined by Clint Moore Road and Jeffery Street to the north, U.S. Highway 1/North Federal Highway to the east, Glades Road/State Route 808 to the south, and Florida's Turnpike to the west. This neighborhood, which comprises a significant portion of the city of Boca Raton, is in the stable stage of its life cycle; however, a high concentration of corporate headquarter operations in and around the area's numerous office parks have spurred development in recent years along primary thoroughfares such as Yamato Road and Glades Road. Additionally, recent developments at Florida Atlantic University (FAU) include the construction of a $70-million football stadium, the $121-million and the 1,216-bed Innovation Village student apartment complex in 2011, as well as the opening of the $46-million, 614-bed Parliament Hall housing complex in August of 2013, all part of the University's 2009 Master Plan update. In 2012, the Florida Department of Transportation announced plans to construct a new interchange at Interstate 95 and Yamato Road that will direct southbound traffic into the north entrance of the FAU campus; construction is expected to begin in December of 2013, with completion planned for 2016. Within the immediate proximity of the site, land use is primarily commercial in nature. The neighborhood is characterized by restaurants, retail shopping centers, office buildings and parks, hotels, and university uses along the primary thoroughfares, with residential areas located along the secondary roadways. The area is characterized by the presence of the main campus of Florida Atlantic University in addition to those of other institutions of higher learning, such as Lynn University and Palm Beach State College, whose South Campus occupies a subleased portion of the FAU campus. The area is also home to multiple corporate demand generators located in and around Arvida Park of Commerce and Boca
Airport Access
Neighborhood
April-2013 Description of the Site and Neighborhood Proposed Dual-Branded Hotels at Florida Atlantic University – Boca Raton, Florida 25
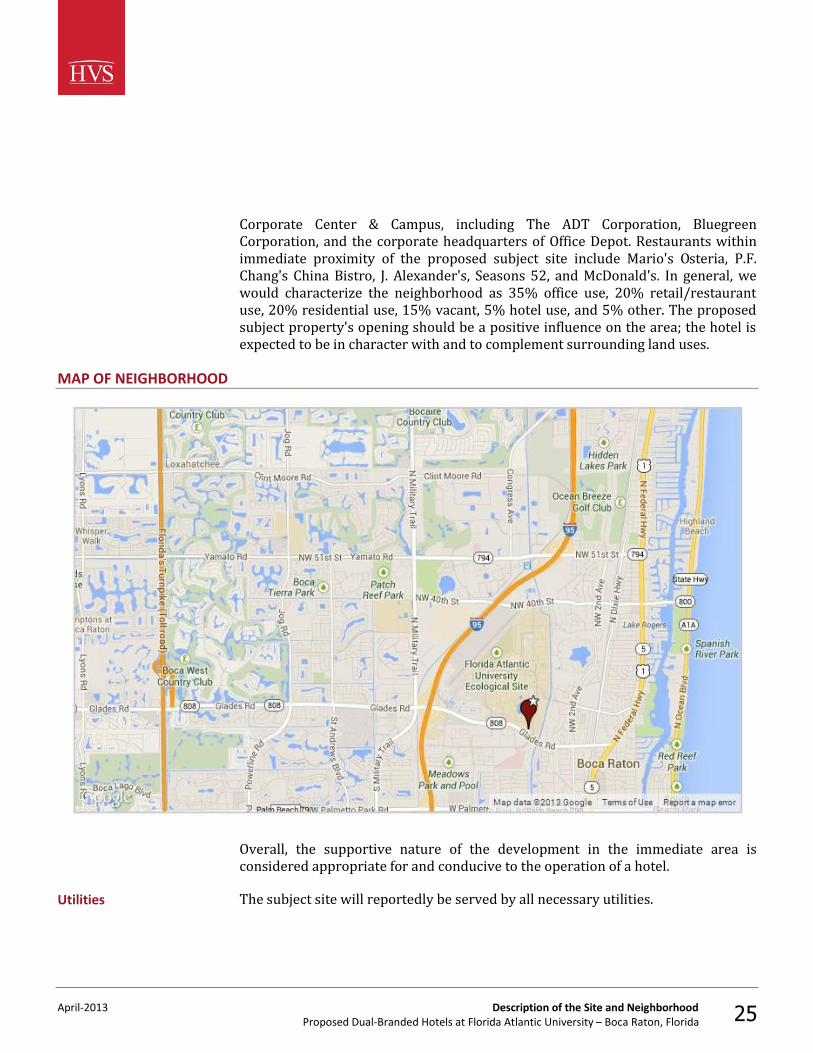
Corporate Center & Campus, including The ADT Corporation, Bluegreen Corporation, and the corporate headquarters of Office Depot. Restaurants within immediate proximity of the proposed subject site include Mario's Osteria, P.F. Chang's China Bistro, J. Alexander's, Seasons 52, and McDonald's. In general, we would characterize the neighborhood as 35% office use, 20% retail/restaurant use, 20% residential use, 15% vacant, 5% hotel use, and 5% other. The proposed subject property's opening should be a positive influence on the area; the hotel is expected to be in character with and to complement surrounding land uses.
MAP OF NEIGHBORHOOD
Overall, the supportive nature of the development in the immediate area is considered appropriate for and conducive to the operation of a hotel. The subject site will reportedly be served by all necessary utilities. Utilities
April-2013 Description of the Site and Neighborhood Proposed Dual-Branded Hotels at Florida Atlantic University – Boca Raton, Florida 26
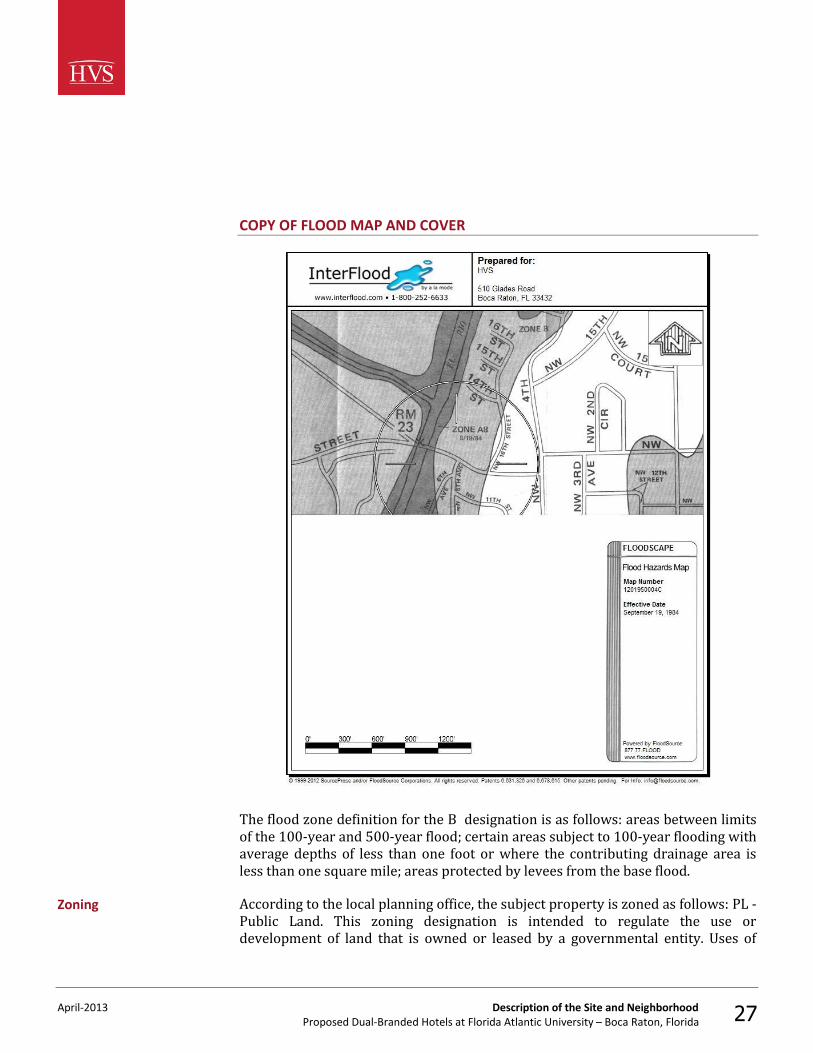
Geological and soil reports were not provided to us or made available for our review during the preparation of this report. We are not qualified to evaluate soil conditions other than by a visual inspection of the surface; no extraordinary conditions were apparent. We were not informed of any site-specific nuisances or hazards, and there were no visible signs of toxic ground contaminants at the time of our inspection. Because we are not experts in this field, we do not warrant the absence of hazardous waste and urge the reader to obtain an independent analysis of these factors. According to the Federal Emergency Management Agency map illustrated below, the subject site is located in flood zone B .
Soil and Subsoil Conditions
Nuisances and Hazards
Flood Zone
April-2013 Description of the Site and Neighborhood Proposed Dual-Branded Hotels at Florida Atlantic University – Boca Raton, Florida 27
COPY OF FLOOD MAP AND COVER
The flood zone definition for the B designation is as follows: areas between limits of the 100-year and 500-year flood; certain areas subject to 100-year flooding with average depths of less than one foot or where the contributing drainage area is less than one square mile; areas protected by levees from the base flood. According to the local planning office, the subject property is zoned as follows: PL - Public Land. This zoning designation is intended to regulate the use or development of land that is owned or leased by a governmental entity. Uses of
Zoning
April-2013 Description of the Site and Neighborhood Proposed Dual-Branded Hotels at Florida Atlantic University – Boca Raton, Florida 28
public lands must be consistent with the comprehensive plan of the City of Boca Raton and must be approved by the City. We assume that all necessary permits and approvals will be secured (including the appropriate liquor license if applicable) and that the subject property will be constructed in accordance with local zoning ordinances, building codes, and all other applicable regulations. Our zoning analysis should be verified before any physical changes are made to the site. We are not aware of any easements attached to the property that would significantly affect the utility of the site or marketability of this project. We have analyzed the issues of size, topography, access, visibility, and the availability of utilities. The chosen subject site is expected to be well located within Florida Atlantic University's master-planned expansion, which is scheduled to include additional student housing, sports and recreation facilities, and classroom buildings. The chosen subject site is also anticipated to be favorably situated along the well-traveled Glades Road corridor, proximate to Boca Raton Regional Hospital. In general, the site should be well suited for future hotel use, with acceptable access, visibility, and topography for an effective operation.
Easements and Encroachments
Conclusion
April-2013 Market Area Analysis Proposed Dual-Branded Hotels at Florida Atlantic University – Boca Raton, Florida 29
3. Market Area Analysis
The economic vitality of the market area and neighborhood surrounding the subject site is an important consideration in forecasting lodging demand and future income potential. Economic and demographic trends that reflect the amount of visitation provide a basis from which to project lodging demand. The purpose of the market area analysis is to review available economic and demographic data to determine whether the local market will undergo economic growth, stabilize, or decline. In addition to predicting the direction of the economy, the rate of change must be quantified. These trends are then correlated based on their propensity to reflect variations in lodging demand, with the objective of forecasting the amount of growth or decline in visitation by individual market segment (e.g., commercial, meeting and group, and leisure). The market area for a lodging facilities is the geographical region where the sources of demand and the competitive supply are located. The subject site is located in the city of Boca Raton, the county of Palm Beach, and the state of Florida. Situated in southern Palm Beach County, Boca Raton is the largest city between West Palm Beach to the north and Pompano Beach in Broward County and forms part of the Miami-Fort Lauderdale-Pompano Beach MSA. The city was incorporated in 1926 and was named for a Spanish colonial term meaning "rocky inlet." Boca Raton's growth into a major commercial hub over the past half-century is primarily attributable to the presence of IBM's research and manufacturing campus, which served as the birthplace of the IBM personal computer in the 1980s. Although IBM relocated most of its Boca Raton operations to Texas and North Carolina in 1996, the city is still home to the headquarter operations of major corporate entities, including The ADT Corporation and Office Depot. In addition to its significant corporate presence, Boca Raton's warm tropical climate and coastal setting make it a popular destination for "snowbirds" and retirees from the Northeast.
Market Area Definition
April-2013 Market Area Analysis Proposed Dual-Branded Hotels at Florida Atlantic University – Boca Raton, Florida 30
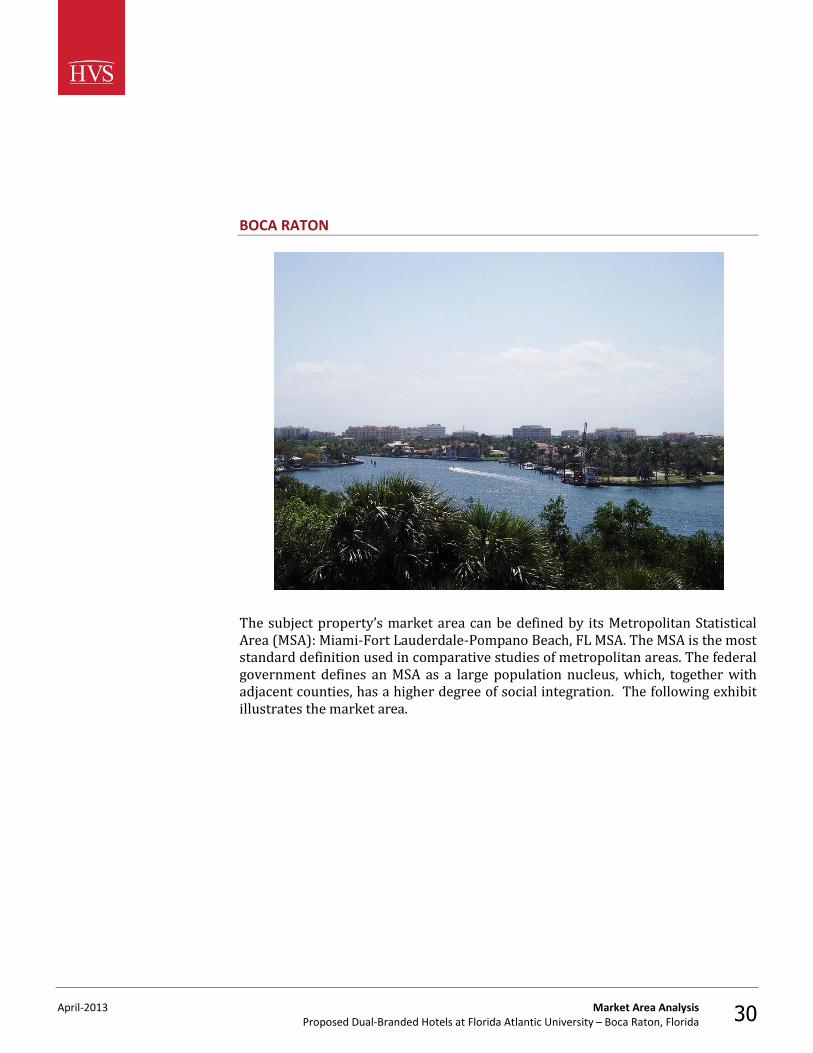
BOCA RATON
The subject property’s market area can be defined by its Metropolitan Statistical Area (MSA): Miami-Fort Lauderdale-Pompano Beach, FL MSA. The MSA is the most standard definition used in comparative studies of metropolitan areas. The federal government defines an MSA as a large population nucleus, which, together with adjacent counties, has a higher degree of social integration. The following exhibit illustrates the market area.
April-2013 Market Area Analysis Proposed Dual-Branded Hotels at Florida Atlantic University – Boca Raton, Florida 31
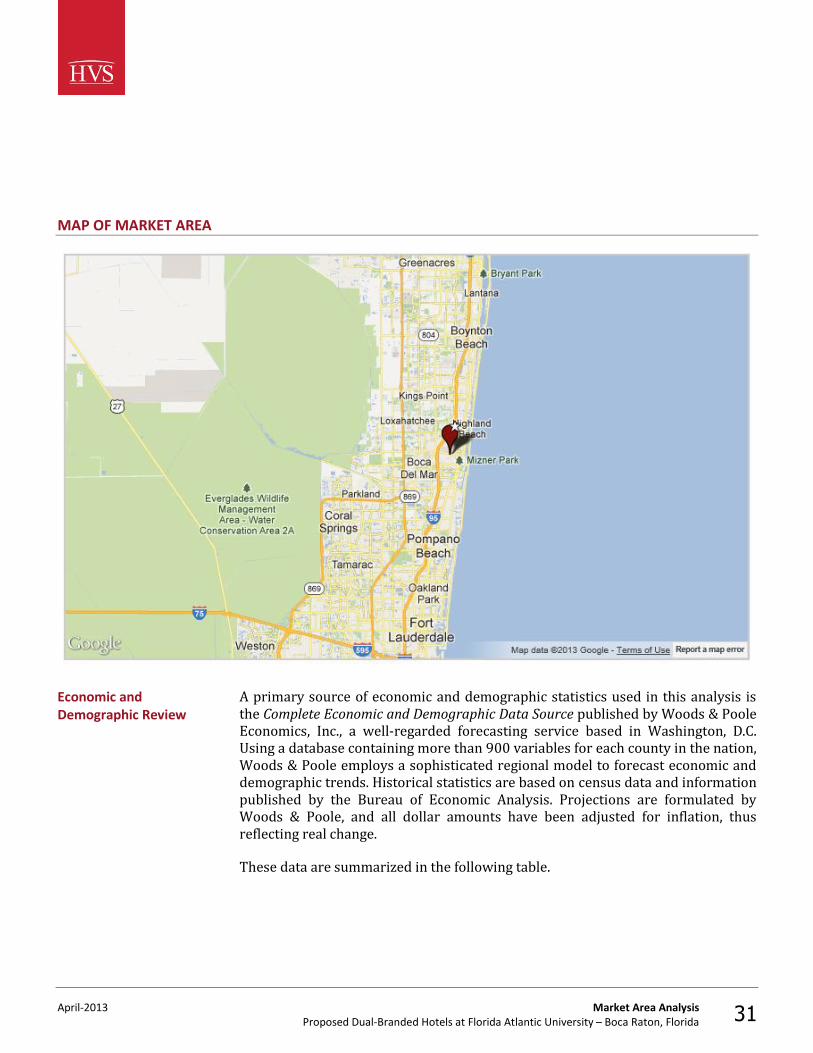
MAP OF MARKET AREA
A primary source of economic and demographic statistics used in this analysis is the Complete Economic and Demographic Data Source published by Woods & Poole Economics, Inc., a well-regarded forecasting service based in Washington, D.C. Using a database containing more than 900 variables for each county in the nation, Woods & Poole employs a sophisticated regional model to forecast economic and demographic trends. Historical statistics are based on census data and information published by the Bureau of Economic Analysis. Projections are formulated by Woods & Poole, and all dollar amounts have been adjusted for inflation, thus reflecting real change. These data are summarized in the following table.
Economic and Demographic Review
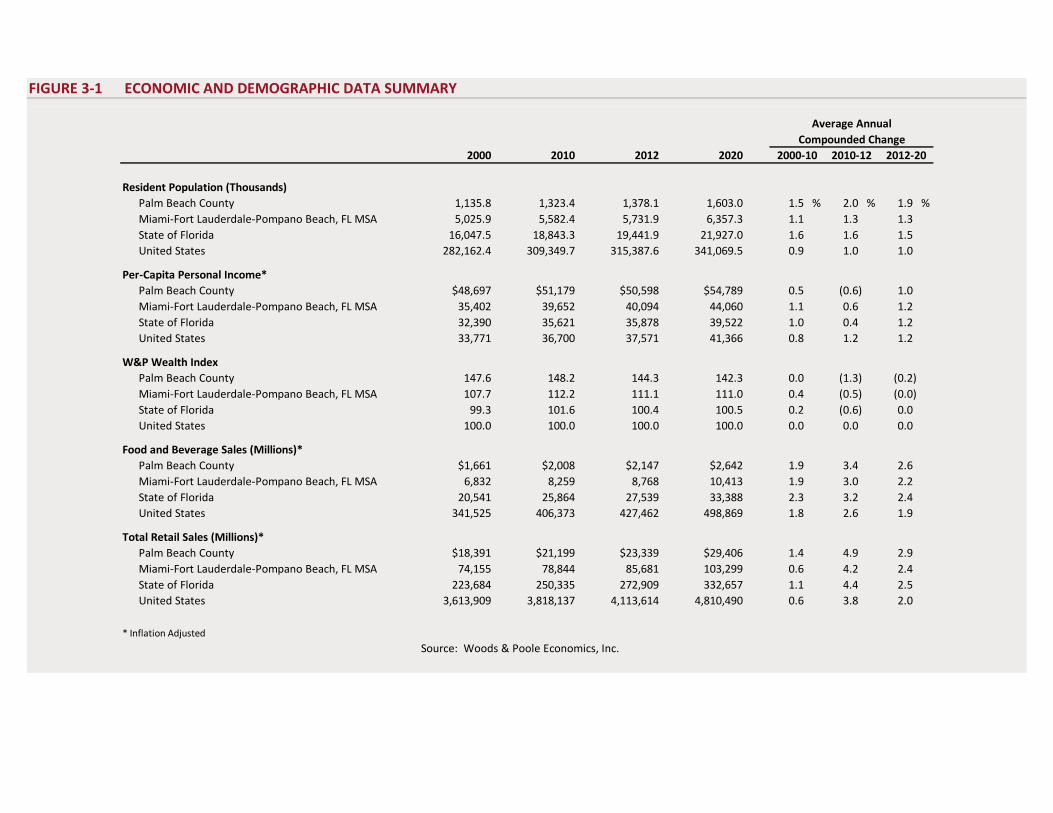
FIGURE 3-1 ECONOMIC AND DEMOGRAPHIC DATA SUMMARY
Average AnnualCompounded Change
2000 2010 2012 2020 2000-10 2010-12 2012-20
Resident Population (Thousands)Palm Beach County 1,135.8 1,323.4 1,378.1 1,603.0 1.5 % 2.0 % 1.9 %Miami-Fort Lauderdale-Pompano Beach, FL MSA 5,025.9 5,582.4 5,731.9 6,357.3 1.1 1.3 1.3State of Florida 16,047.5 18,843.3 19,441.9 21,927.0 1.6 1.6 1.5United States 282,162.4 309,349.7 315,387.6 341,069.5 0.9 1.0 1.0
Per-Capita Personal Income*Palm Beach County $48,697 $51,179 $50,598 $54,789 0.5 (0.6) 1.0Miami-Fort Lauderdale-Pompano Beach, FL MSA 35,402 39,652 40,094 44,060 1.1 0.6 1.2State of Florida 32,390 35,621 35,878 39,522 1.0 0.4 1.2United States 33,771 36,700 37,571 41,366 0.8 1.2 1.2
W&P Wealth IndexPalm Beach County 147.6 148.2 144.3 142.3 0.0 (1.3) (0.2)Miami-Fort Lauderdale-Pompano Beach, FL MSA 107.7 112.2 111.1 111.0 0.4 (0.5) (0.0)State of Florida 99.3 101.6 100.4 100.5 0.2 (0.6) 0.0United States 100.0 100.0 100.0 100.0 0.0 0.0 0.0
Food and Beverage Sales (Millions)*Palm Beach County $1,661 $2,008 $2,147 $2,642 1.9 3.4 2.6Miami-Fort Lauderdale-Pompano Beach, FL MSA 6,832 8,259 8,768 10,413 1.9 3.0 2.2State of Florida 20,541 25,864 27,539 33,388 2.3 3.2 2.4United States 341,525 406,373 427,462 498,869 1.8 2.6 1.9
Total Retail Sales (Millions)*Palm Beach County $18,391 $21,199 $23,339 $29,406 1.4 4.9 2.9Miami-Fort Lauderdale-Pompano Beach, FL MSA 74,155 78,844 85,681 103,299 0.6 4.2 2.4State of Florida 223,684 250,335 272,909 332,657 1.1 4.4 2.5United States 3,613,909 3,818,137 4,113,614 4,810,490 0.6 3.8 2.0
* Inflation Adjusted
Source: Woods & Poole Economics, Inc.
April-2013 Market Area Analysis Proposed Dual-Branded Hotels at Florida Atlantic University – Boca Raton, Florida 33
The U.S. population has grown at an average annual compounded rate of 1.0% from 2010 through 2012. The county’s population has grown at a quicker pace than the nation’s population; the average annual growth rate of 2.0% between 2010 and 2012 reflects a rapidly expanding area. Following this population trend, per-capita personal income decreased slowly, at -0.6% on average annually for the county between 2010 and 2012. Local wealth indexes have remained stable in recent years, registering a relatively high 144.3 level for the county in 2012. Food and beverage sales totaled $2,147 million in the county in 2012, versus $2,008 million in 2010. This reflects a 3.4% average annual change, which is stronger than the 1.9% pace recorded in the prior decade, the latter years of which were adversely affected by the recession. The strong growth recorded in the period 2010 to 2012 reflects the impact of the recovery on the local economy. Over the long term, the pace of growth is forecast to moderate to a more sustainable level of 2.6%, which is forecast through 2020. The retail sales sector demonstrated a similar pattern, with a minimal annual increase of 1.4% in the decade 2000 to 2010, followed by an increase of 4.9% in the period 2010 to 2012. A more normalized increase of 2.9% average annual change is expected in county retail sales through 2020. The characteristics of an area's workforce provide an indication of the type and amount of transient visitation likely to be generated by local businesses. Sectors such as finance, insurance, and real estate (FIRE); wholesale trade; and services produce a considerable number of visitors who are not particularly rate-sensitive. The government sector often generates transient room nights, but per-diem reimbursement allowances often limit the accommodations selection to budget and mid-priced lodging facilities. Contributions from manufacturing, construction, transportation, communications, and public utilities (TCPU) employers can also be important, depending on the company type. The following table sets forth the county workforce distribution by business sector in 2000, 2010, and 2012, as well as a forecast for 2020.
Workforce Characteristics
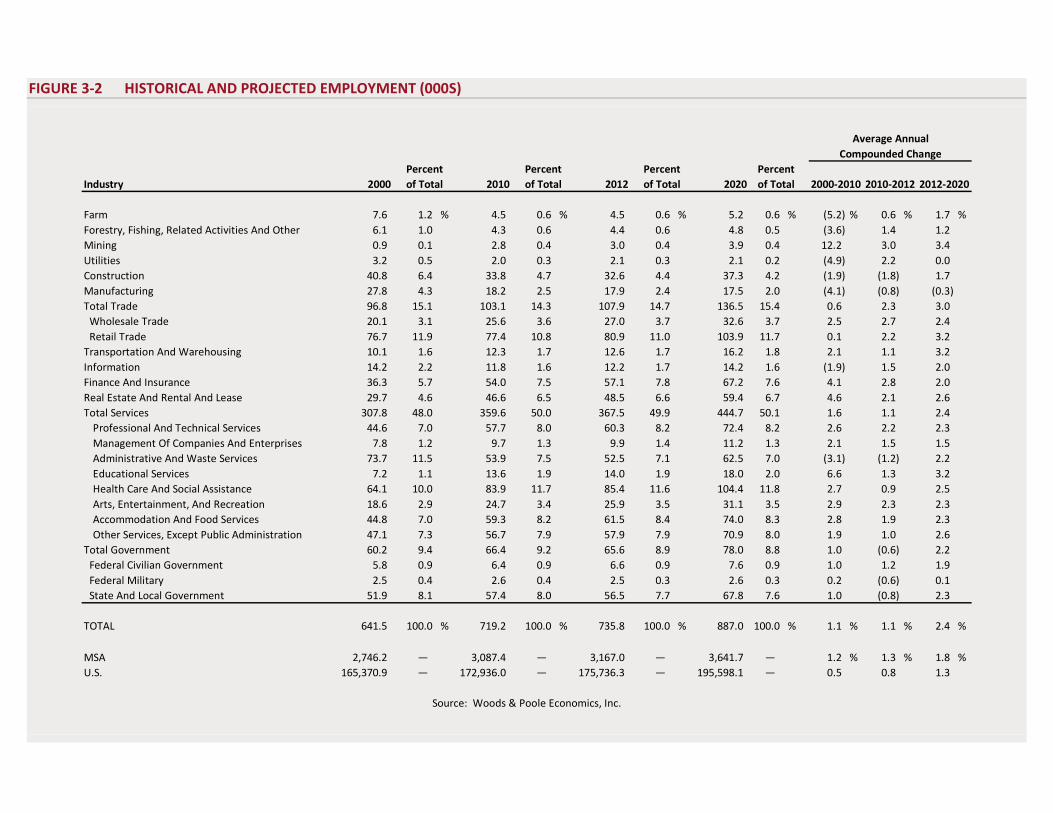
FIGURE 3-2 HISTORICAL AND PROJECTED EMPLOYMENT (000S)
Average AnnualCompounded Change
Percent Percent Percent PercentIndustry 2000 of Total 2010 of Total 2012 of Total 2020 of Total
Farm 7.6 1.2 % 4.5 0.6 % 4.5 0.6 % 5.2 0.6 % (5.2) % 0.6 % 1.7 %Forestry, Fishing, Related Activities And Other 6.1 1.0 4.3 0.6 4.4 0.6 4.8 0.5 (3.6) 1.4 1.2Mining 0.9 0.1 2.8 0.4 3.0 0.4 3.9 0.4 12.2 3.0 3.4Utilities 3.2 0.5 2.0 0.3 2.1 0.3 2.1 0.2 (4.9) 2.2 0.0Construction 40.8 6.4 33.8 4.7 32.6 4.4 37.3 4.2 (1.9) (1.8) 1.7Manufacturing 27.8 4.3 18.2 2.5 17.9 2.4 17.5 2.0 (4.1) (0.8) (0.3)Total Trade 96.8 15.1 103.1 14.3 107.9 14.7 136.5 15.4 0.6 2.3 3.0 Wholesale Trade 20.1 3.1 25.6 3.6 27.0 3.7 32.6 3.7 2.5 2.7 2.4 Retail Trade 76.7 11.9 77.4 10.8 80.9 11.0 103.9 11.7 0.1 2.2 3.2Transportation And Warehousing 10.1 1.6 12.3 1.7 12.6 1.7 16.2 1.8 2.1 1.1 3.2Information 14.2 2.2 11.8 1.6 12.2 1.7 14.2 1.6 (1.9) 1.5 2.0Finance And Insurance 36.3 5.7 54.0 7.5 57.1 7.8 67.2 7.6 4.1 2.8 2.0Real Estate And Rental And Lease 29.7 4.6 46.6 6.5 48.5 6.6 59.4 6.7 4.6 2.1 2.6Total Services 307.8 48.0 359.6 50.0 367.5 49.9 444.7 50.1 1.6 1.1 2.4
Professional And Technical Services 44.6 7.0 57.7 8.0 60.3 8.2 72.4 8.2 2.6 2.2 2.3Management Of Companies And Enterprises 7.8 1.2 9.7 1.3 9.9 1.4 11.2 1.3 2.1 1.5 1.5Administrative And Waste Services 73.7 11.5 53.9 7.5 52.5 7.1 62.5 7.0 (3.1) (1.2) 2.2Educational Services 7.2 1.1 13.6 1.9 14.0 1.9 18.0 2.0 6.6 1.3 3.2Health Care And Social Assistance 64.1 10.0 83.9 11.7 85.4 11.6 104.4 11.8 2.7 0.9 2.5Arts, Entertainment, And Recreation 18.6 2.9 24.7 3.4 25.9 3.5 31.1 3.5 2.9 2.3 2.3Accommodation And Food Services 44.8 7.0 59.3 8.2 61.5 8.4 74.0 8.3 2.8 1.9 2.3Other Services, Except Public Administration 47.1 7.3 56.7 7.9 57.9 7.9 70.9 8.0 1.9 1.0 2.6
Total Government 60.2 9.4 66.4 9.2 65.6 8.9 78.0 8.8 1.0 (0.6) 2.2 Federal Civilian Government 5.8 0.9 6.4 0.9 6.6 0.9 7.6 0.9 1.0 1.2 1.9 Federal Military 2.5 0.4 2.6 0.4 2.5 0.3 2.6 0.3 0.2 (0.6) 0.1 State And Local Government 51.9 8.1 57.4 8.0 56.5 7.7 67.8 7.6 1.0 (0.8) 2.3
TOTAL 641.5 100.0 % 719.2 100.0 % 735.8 100.0 % 887.0 100.0 % 1.1 % 1.1 % 2.4 %
MSA 2,746.2 — 3,087.4 — 3,167.0 — 3,641.7 — 1.2 % 1.3 % 1.8 %U.S. 165,370.9 — 172,936.0 — 175,736.3 — 195,598.1 — 0.5 0.8 1.3
Source: Woods & Poole Economics, Inc.
2000-2010 2010-2012 2012-2020
April-2013 Market Area Analysis Proposed Dual-Branded Hotels at Florida Atlantic University – Boca Raton, Florida 35
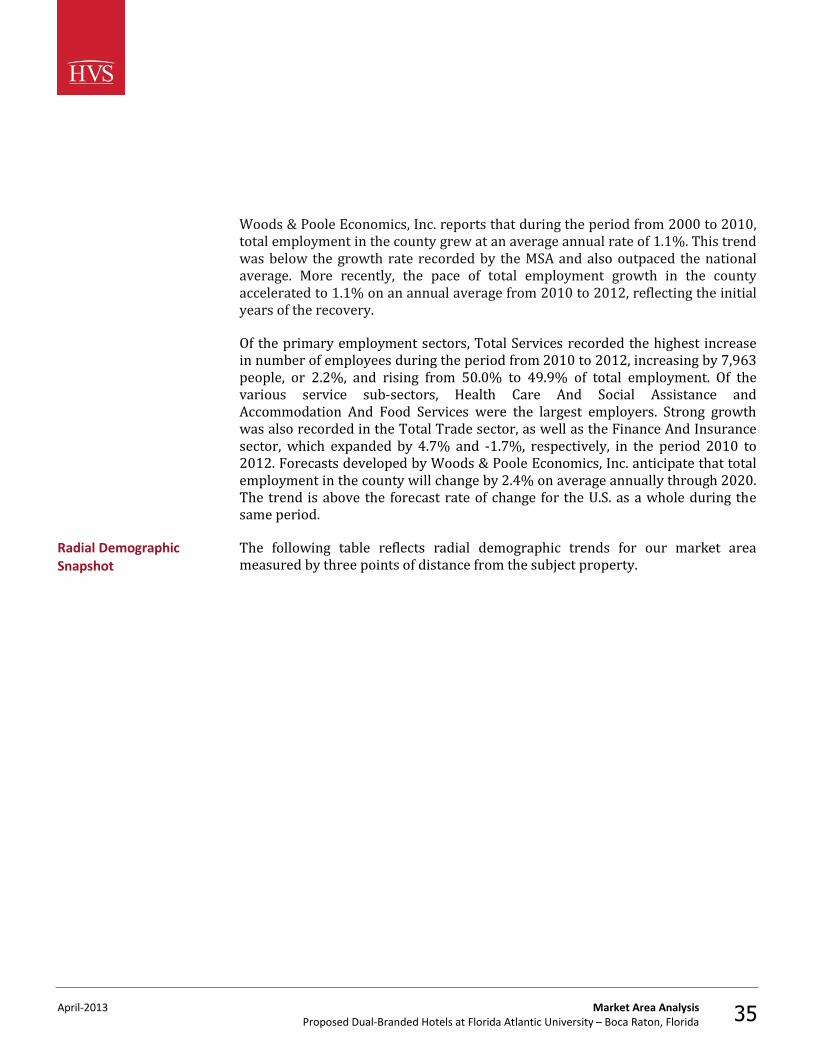
Woods & Poole Economics, Inc. reports that during the period from 2000 to 2010, total employment in the county grew at an average annual rate of 1.1%. This trend was below the growth rate recorded by the MSA and also outpaced the national average. More recently, the pace of total employment growth in the county accelerated to 1.1% on an annual average from 2010 to 2012, reflecting the initial years of the recovery. Of the primary employment sectors, Total Services recorded the highest increase in number of employees during the period from 2010 to 2012, increasing by 7,963 people, or 2.2%, and rising from 50.0% to 49.9% of total employment. Of the various service sub-sectors, Health Care And Social Assistance and Accommodation And Food Services were the largest employers. Strong growth was also recorded in the Total Trade sector, as well as the Finance And Insurance sector, which expanded by 4.7% and -1.7%, respectively, in the period 2010 to 2012. Forecasts developed by Woods & Poole Economics, Inc. anticipate that total employment in the county will change by 2.4% on average annually through 2020. The trend is above the forecast rate of change for the U.S. as a whole during the same period. The following table reflects radial demographic trends for our market area measured by three points of distance from the subject property.
Radial Demographic Snapshot
April-2013 Market Area Analysis Proposed Dual-Branded Hotels at Florida Atlantic University – Boca Raton, Florida 36
FIGURE 3-3 DEMOGRAPHICS BY RADIUS
Population 2017 Projection 10,717 76,121 192,832 2012 Estimate 10,757 76,355 193,318 2000 Census 10,289 75,153 193,751 1990 Census 9,644 66,737 160,790
Growth 2012-2017 -0.4% -0.3% -0.3% Growth 2000-2012 4.5% 1.6% -0.2% Growth 1990-2000 6.7% 12.6% 20.5%
Households 2017 Projection 3,664 33,574 90,659 2012 Estimate 3,676 33,739 90,927 2000 Census 3,785 33,322 91,064 1990 Census 3,714 29,048 74,939
Growth 2012-2017 -0.3% -0.5% -0.3% Growth 2000-2012 -2.9% 1.3% -0.2% Growth 1990-2000 1.9% 14.7% 21.5%
Income2012 Est. Average Household Income $62,611 $96,881 $90,7692012 Est. Median Household Income 43,250 60,197 56,7072012 Est. Per Capita Income 23,271 43,186 42,943
2012 Est. Civ Employed Pop 16+ by Occupation 5,088 36,385 84,846 Architect/Engineer 86 484 958 Arts/Entertain/Sports 96 990 2,216 Building Grounds Maint 166 1,158 2,908 Business/Financial Ops 226 2,023 4,956 Community/Soc Svcs 13 390 881 Computer/Mathematical 223 1,277 2,338 Construction/Extraction 275 1,319 3,652 Edu/Training/Library 334 1,937 3,847 Farm/Fish/Forestry 2 78 155 Food Prep/Serving 496 2,917 5,956 Health Practitioner/Tec 314 2,096 4,946 Healthcare Support 100 618 1,356 Maintenance Repair 128 903 1,963 Legal 52 922 2,148 Life/Phys/Soc Science 18 201 443 Management 559 5,443 12,127 Office/Admin Support 562 3,823 10,256 Production 118 909 2,148 Protective Svcs 165 662 1,599 Sales/Related 576 5,409 13,695 Personal Care/Svc 183 1,517 3,155 Transportation/Moving 399 1,310 3,144
0.00 - 1.00 miles 0.00 - 3.00 miles 0.00 - 5.00 miles
Source: The Nielsen Company
April-2013 Market Area Analysis Proposed Dual-Branded Hotels at Florida Atlantic University – Boca Raton, Florida 37
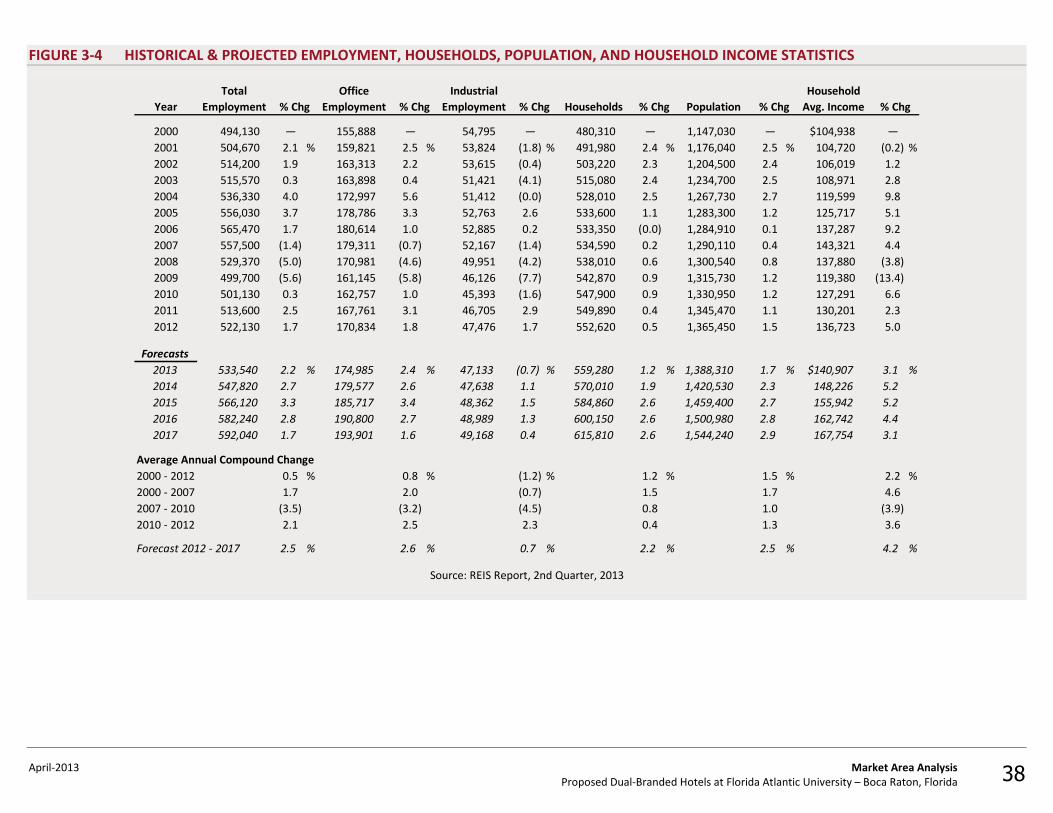
This source reports a population of 193,318 within a five-mile radius of the subject property, and 90,927 households within this same radius. Average household income within a five-mile radius of the subject property is currently reported at $90,769, while the median is $56,707. The following table illustrates historical and projected employment, households, population and average household income data as provided by REIS for the overall Palm Beach market.
April-2013 Market Area Analysis Proposed Dual-Branded Hotels at Florida Atlantic University – Boca Raton, Florida 38
FIGURE 3-4 HISTORICAL & PROJECTED EMPLOYMENT, HOUSEHOLDS, POPULATION, AND HOUSEHOLD INCOME STATISTICS
Year
2000 494,130 — 155,888 — 54,795 — 480,310 — 1,147,030 — $104,938 — 2001 504,670 2.1 % 159,821 2.5 % 53,824 (1.8) % 491,980 2.4 % 1,176,040 2.5 % 104,720 (0.2) %2002 514,200 1.9 163,313 2.2 53,615 (0.4) 503,220 2.3 1,204,500 2.4 106,019 1.22003 515,570 0.3 163,898 0.4 51,421 (4.1) 515,080 2.4 1,234,700 2.5 108,971 2.82004 536,330 4.0 172,997 5.6 51,412 (0.0) 528,010 2.5 1,267,730 2.7 119,599 9.82005 556,030 3.7 178,786 3.3 52,763 2.6 533,600 1.1 1,283,300 1.2 125,717 5.12006 565,470 1.7 180,614 1.0 52,885 0.2 533,350 (0.0) 1,284,910 0.1 137,287 9.22007 557,500 (1.4) 179,311 (0.7) 52,167 (1.4) 534,590 0.2 1,290,110 0.4 143,321 4.42008 529,370 (5.0) 170,981 (4.6) 49,951 (4.2) 538,010 0.6 1,300,540 0.8 137,880 (3.8)2009 499,700 (5.6) 161,145 (5.8) 46,126 (7.7) 542,870 0.9 1,315,730 1.2 119,380 (13.4)2010 501,130 0.3 162,757 1.0 45,393 (1.6) 547,900 0.9 1,330,950 1.2 127,291 6.62011 513,600 2.5 167,761 3.1 46,705 2.9 549,890 0.4 1,345,470 1.1 130,201 2.32012 522,130 1.7 170,834 1.8 47,476 1.7 552,620 0.5 1,365,450 1.5 136,723 5.0
Forecasts2013 533,540 2.2 % 174,985 2.4 % 47,133 (0.7) % 559,280 1.2 % 1,388,310 1.7 % $140,907 3.1 %2014 547,820 2.7 179,577 2.6 47,638 1.1 570,010 1.9 1,420,530 2.3 148,226 5.22015 566,120 3.3 185,717 3.4 48,362 1.5 584,860 2.6 1,459,400 2.7 155,942 5.22016 582,240 2.8 190,800 2.7 48,989 1.3 600,150 2.6 1,500,980 2.8 162,742 4.42017 592,040 1.7 193,901 1.6 49,168 0.4 615,810 2.6 1,544,240 2.9 167,754 3.1
Average Annual Compound Change2000 - 2012 0.5 % 0.8 % (1.2) % 1.2 % 1.5 % 2.2 %2000 - 2007 1.7 2.0 (0.7) 1.5 1.7 4.62007 - 2010 (3.5) (3.2) (4.5) 0.8 1.0 (3.9)2010 - 2012 2.1 2.5 2.3 0.4 1.3 3.6
Forecast 2012 - 2017 2.5 % 2.6 % 0.7 % 2.2 % 2.5 % 4.2 %
% ChgHousehold
Avg. Income % Chg
Source: REIS Report, 2nd Quarter, 2013
Households % Chg Population% ChgIndustrial
Employment % ChgTotal
Employment % ChgOffice
Employment
April-2013 Market Area Analysis Proposed Dual-Branded Hotels at Florida Atlantic University – Boca Raton, Florida 39
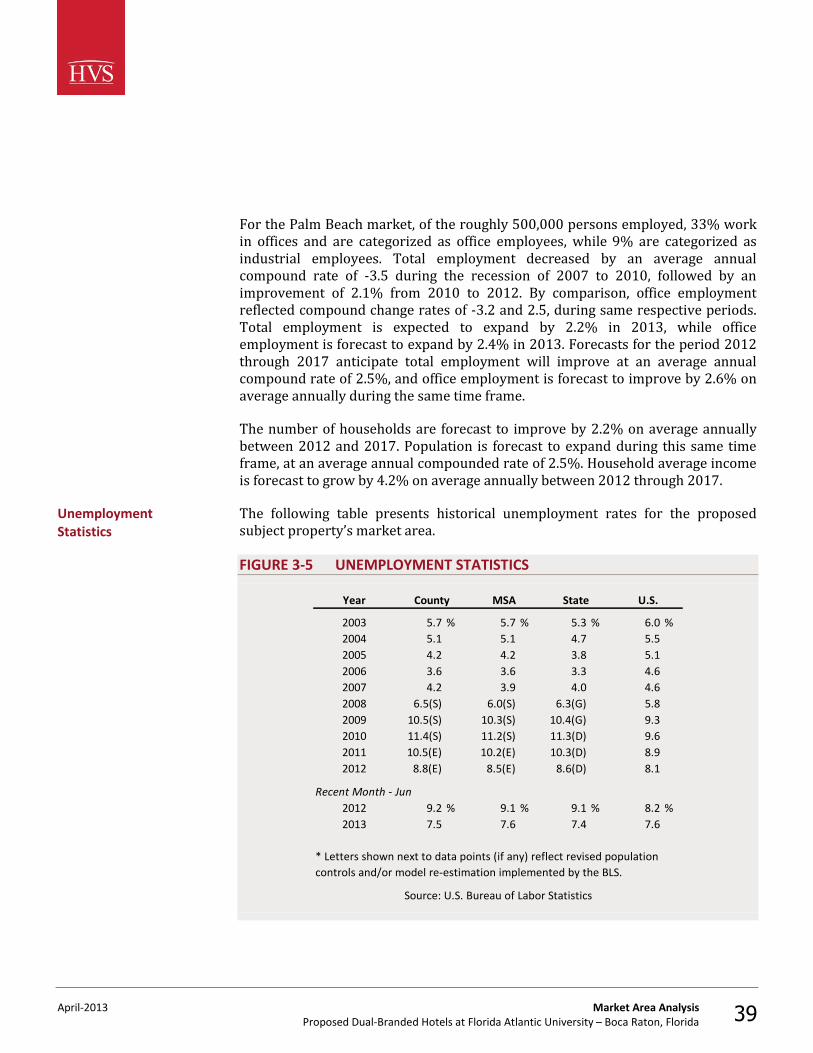
For the Palm Beach market, of the roughly 500,000 persons employed, 33% work in offices and are categorized as office employees, while 9% are categorized as industrial employees. Total employment decreased by an average annual compound rate of -3.5 during the recession of 2007 to 2010, followed by an improvement of 2.1% from 2010 to 2012. By comparison, office employment reflected compound change rates of -3.2 and 2.5, during same respective periods. Total employment is expected to expand by 2.2% in 2013, while office employment is forecast to expand by 2.4% in 2013. Forecasts for the period 2012 through 2017 anticipate total employment will improve at an average annual compound rate of 2.5%, and office employment is forecast to improve by 2.6% on average annually during the same time frame. The number of households are forecast to improve by 2.2% on average annually between 2012 and 2017. Population is forecast to expand during this same time frame, at an average annual compounded rate of 2.5%. Household average income is forecast to grow by 4.2% on average annually between 2012 through 2017. The following table presents historical unemployment rates for the proposed subject property’s market area. FIGURE 3-5 UNEMPLOYMENT STATISTICS
Year
2003 5.7 % 5.7 % 5.3 % 6.0 %2004 5.1 5.1 4.7 5.52005 4.2 4.2 3.8 5.12006 3.6 3.6 3.3 4.62007 4.2 3.9 4.0 4.62008 6.5(S) 6.0(S) 6.3(G) 5.82009 10.5(S) 10.3(S) 10.4(G) 9.32010 11.4(S) 11.2(S) 11.3(D) 9.62011 10.5(E) 10.2(E) 10.3(D) 8.92012 8.8(E) 8.5(E) 8.6(D) 8.1
Recent Month - Jun2012 9.2 % 9.1 % 9.1 % 8.2 %2013 7.5 7.6 7.4 7.6
* Letters shown next to data points (if any) reflect revised population controls and/or model re-estimation implemented by the BLS.
Source: U.S. Bureau of Labor Statistics
U.S.StateCounty MSA
Unemployment Statistics
April-2013 Market Area Analysis Proposed Dual-Branded Hotels at Florida Atlantic University – Boca Raton, Florida 40
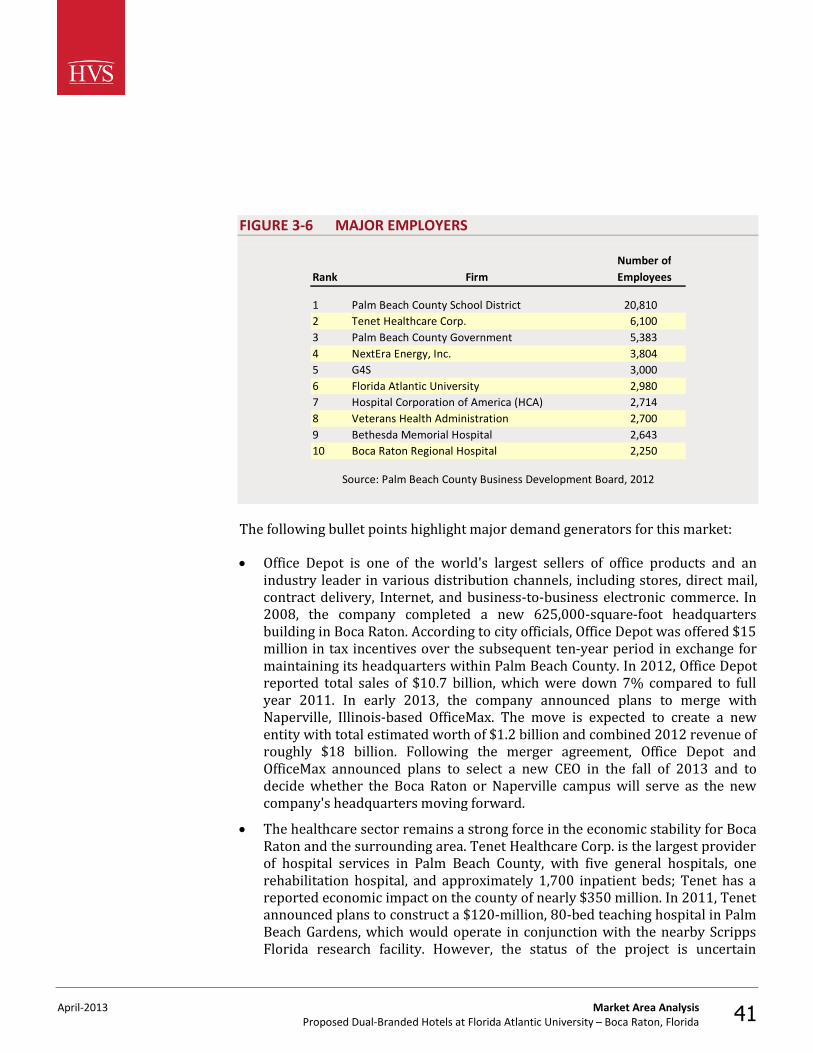
The unemployment rate for the U.S. fluctuated within the narrow range of 4.6% to 6.0% in the period spanning from 2003 to 2007. The recession and financial crisis in 2007 and 2008 resulted in heightened unemployment rates, which peaked at 10.0% in October of 2009. Job growth resumed in late 2009; the national unemployment rate has steadily declined since 2010. Total nonfarm payroll employment increased by 169,000 jobs in August of 2013, which brought down the unemployment rate to 7.3%, its lowest rate in over four years. This positive trend reflects steady progress by the U.S. economy, despite the contraction in government jobs caused by the sequestration. Retail trade and healthcare led the job gains in August. Locally, the unemployment rate was 8.8(E)% in 2012; for this same area in 2013, the most recent month’s unemployment rate was registered at 7.5%, versus 9.2% for the same month in 2012. Unemployment rates in this area declined mid-decade, concurrent with the general recovery trend after a difficult period earlier in the decade. Unemployment began to rise in 2007 as the region entered an economic slowdown, and this trend continued into 2010. However, a positive trend began in 2011 and continued in 2012. The most recent comparative period indicates substantial improvement, as employment has remained strong at local corporations such as Office Depot and ADT. Furthermore, an increase in construction projects has spurred additional job growth. Continued increases in tourism as consumer spending recovers have prompted hiring in the hospitality sector, as hotels, restaurants, and area attractions work to keep pace with growing demand. Providing additional context for understanding the nature of the regional economy, the following table presents a list of the major employers in the subject property’s market.
Major Business and Industry
April-2013 Market Area Analysis Proposed Dual-Branded Hotels at Florida Atlantic University – Boca Raton, Florida 41
FIGURE 3-6 MAJOR EMPLOYERS
Number ofRank Firm Employees
1 Palm Beach County School District 20,8102 Tenet Healthcare Corp. 6,1003 Palm Beach County Government 5,3834 NextEra Energy, Inc. 3,8045 G4S 3,0006 Florida Atlantic University 2,9807 Hospital Corporation of America (HCA) 2,7148 Veterans Health Administration 2,7009 Bethesda Memorial Hospital 2,64310 Boca Raton Regional Hospital 2,250
Source: Palm Beach County Business Development Board, 2012
The following bullet points highlight major demand generators for this market: • Office Depot is one of the world's largest sellers of office products and an
industry leader in various distribution channels, including stores, direct mail, contract delivery, Internet, and business-to-business electronic commerce. In 2008, the company completed a new 625,000-square-foot headquarters building in Boca Raton. According to city officials, Office Depot was offered $15 million in tax incentives over the subsequent ten-year period in exchange for maintaining its headquarters within Palm Beach County. In 2012, Office Depot reported total sales of $10.7 billion, which were down 7% compared to full year 2011. In early 2013, the company announced plans to merge with Naperville, Illinois-based OfficeMax. The move is expected to create a new entity with total estimated worth of $1.2 billion and combined 2012 revenue of roughly $18 billion. Following the merger agreement, Office Depot and OfficeMax announced plans to select a new CEO in the fall of 2013 and to decide whether the Boca Raton or Naperville campus will serve as the new company's headquarters moving forward.
• The healthcare sector remains a strong force in the economic stability for Boca Raton and the surrounding area. Tenet Healthcare Corp. is the largest provider of hospital services in Palm Beach County, with five general hospitals, one rehabilitation hospital, and approximately 1,700 inpatient beds; Tenet has a reported economic impact on the county of nearly $350 million. In 2011, Tenet announced plans to construct a $120-million, 80-bed teaching hospital in Palm Beach Gardens, which would operate in conjunction with the nearby Scripps Florida research facility. However, the status of the project is uncertain
April-2013 Market Area Analysis Proposed Dual-Branded Hotels at Florida Atlantic University – Boca Raton, Florida 42
following a May 2013 ruling by an administrative law judge that overturned the facility's initial approval by state regulators. Boca Raton Regional Hospital, the primary hospital facility in the city of Boca Raton and one of the largest employers in Palm Beach County, is a not-for-profit medical center offering 400 beds and a staff of more than 2,100 employees, including 800 general and specialty physicians. In 2013, Boca Raton Regional Hospital received Healthgrades' Distinguished Hospital Award for Clinical Excellence for the ninth year in a row; additionally, it was named a top-ranked hospital in two specialties in U.S. News & World Report's 2013-14 listing of America's Best Hospitals. In March of 2013, the hospital broke ground on the Marcus Neuroscience Institute, a planned 56,000-square-foot, 22-bed, state-of-the-art neurological care and research facility; the project is scheduled for completion in early 2014.
• Headquartered in Boca Raton, The ADT Corporation provides residential and small business security, fire alarm, and monitoring services to more than six million customers throughout North America, making it the largest security company in the United States and Canada. The company formerly operated as a subsidiary of Tyco International. In early 2010, Tyco International acquired Broadview Security, then the second-largest security company in North America, in a transaction valued at $2 billion. Following the acquisition, Broadview Security's operations were integrated into those of ADT, adding 1.3 million customers and an estimated $565 million of revenue to ADT's existing base. In June of 2011, Tyco International moved into a 171,000-square-foot campus on Yamato Road in Boca Raton following the execution of a long-term lease and extensive renovations to the facility. As a result of corporate restructuring, ADT split from Tyco International in October of 2012, and the campus became the corporate headquarters of The ADT Corporation. In November of that year, ADT announced plans to add 120 new jobs to its Boca Raton headquarters over a two-year period.
Although the Boca Raton market was negatively affected by the economic recession at the end of last decade, recent developments in the healthcare and education sectors, as well as expansions among major corporate entities, have resulted in a significant improvement of the local economy. Boca Raton benefits from its status as home to the corporate headquarters of both The ADT Corporation and Office Depot. Following its announced merger with OfficeMax, the status of Office Depot's Boca Raton headquarters remains uncertain, with the proposed entity yet to name a location for its future headquarters. However, investments by ADT in the local market, including the long-term lease of its Yamato Road headquarters facility and continuing expansion efforts, have helped to offset this uncertainty somewhat. The presence of other major corporate entities, such as Bluegreen Corporation, The Geo Group, and Tenet Healthcare Corporation, as well as additional projects, including the ongoing construction of
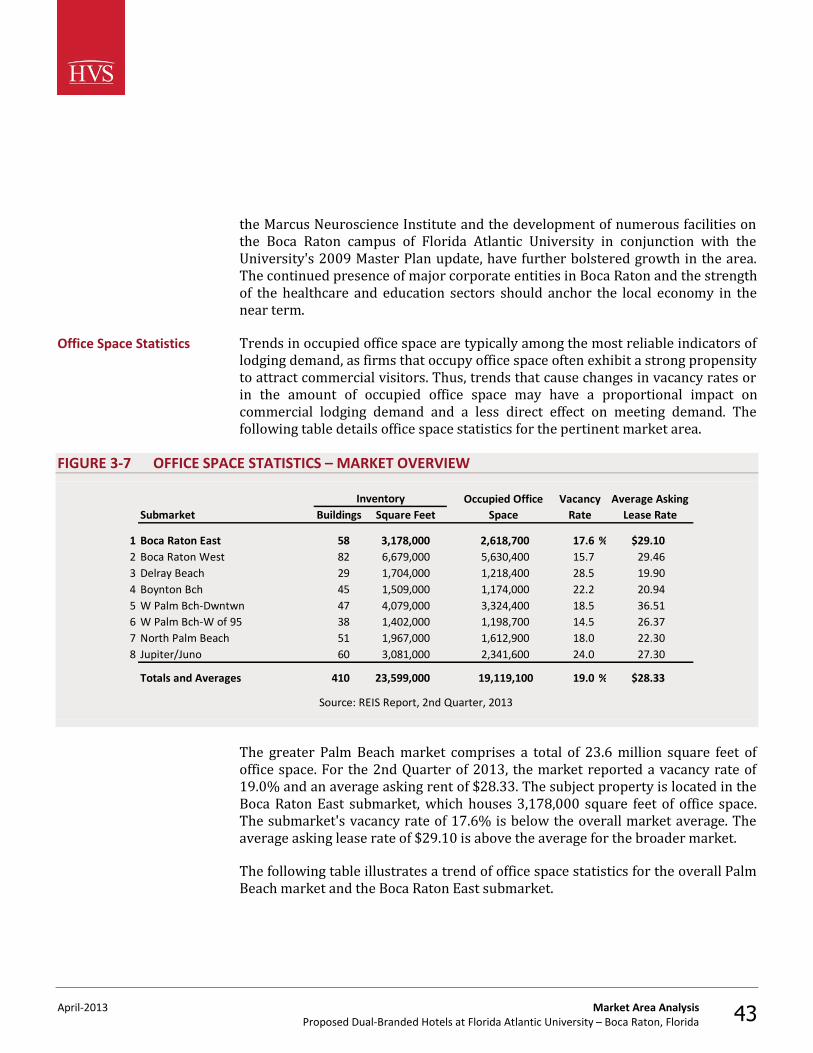
April-2013 Market Area Analysis Proposed Dual-Branded Hotels at Florida Atlantic University – Boca Raton, Florida 43
the Marcus Neuroscience Institute and the development of numerous facilities on the Boca Raton campus of Florida Atlantic University in conjunction with the University's 2009 Master Plan update, have further bolstered growth in the area. The continued presence of major corporate entities in Boca Raton and the strength of the healthcare and education sectors should anchor the local economy in the near term. Trends in occupied office space are typically among the most reliable indicators of lodging demand, as firms that occupy office space often exhibit a strong propensity to attract commercial visitors. Thus, trends that cause changes in vacancy rates or in the amount of occupied office space may have a proportional impact on commercial lodging demand and a less direct effect on meeting demand. The following table details office space statistics for the pertinent market area.
FIGURE 3-7 OFFICE SPACE STATISTICS – MARKET OVERVIEW
Submarket
1 Boca Raton East 58 3,178,000 2,618,700 17.6 % $29.102 Boca Raton West 82 6,679,000 5,630,400 15.7 29.463 Delray Beach 29 1,704,000 1,218,400 28.5 19.904 Boynton Bch 45 1,509,000 1,174,000 22.2 20.945 W Palm Bch-Dwntwn 47 4,079,000 3,324,400 18.5 36.516 W Palm Bch-W of 95 38 1,402,000 1,198,700 14.5 26.377 North Palm Beach 51 1,967,000 1,612,900 18.0 22.308 Jupiter/Juno 60 3,081,000 2,341,600 24.0 27.30
Totals and Averages 410 23,599,000 19,119,100 19.0 % $28.33
Inventory Occupied Office Space
Vacancy Rate
Average Asking Lease RateBuildings Square Feet
Source: REIS Report, 2nd Quarter, 2013
The greater Palm Beach market comprises a total of 23.6 million square feet of office space. For the 2nd Quarter of 2013, the market reported a vacancy rate of 19.0% and an average asking rent of $28.33. The subject property is located in the Boca Raton East submarket, which houses 3,178,000 square feet of office space. The submarket's vacancy rate of 17.6% is below the overall market average. The average asking lease rate of $29.10 is above the average for the broader market. The following table illustrates a trend of office space statistics for the overall Palm Beach market and the Boca Raton East submarket.
Office Space Statistics
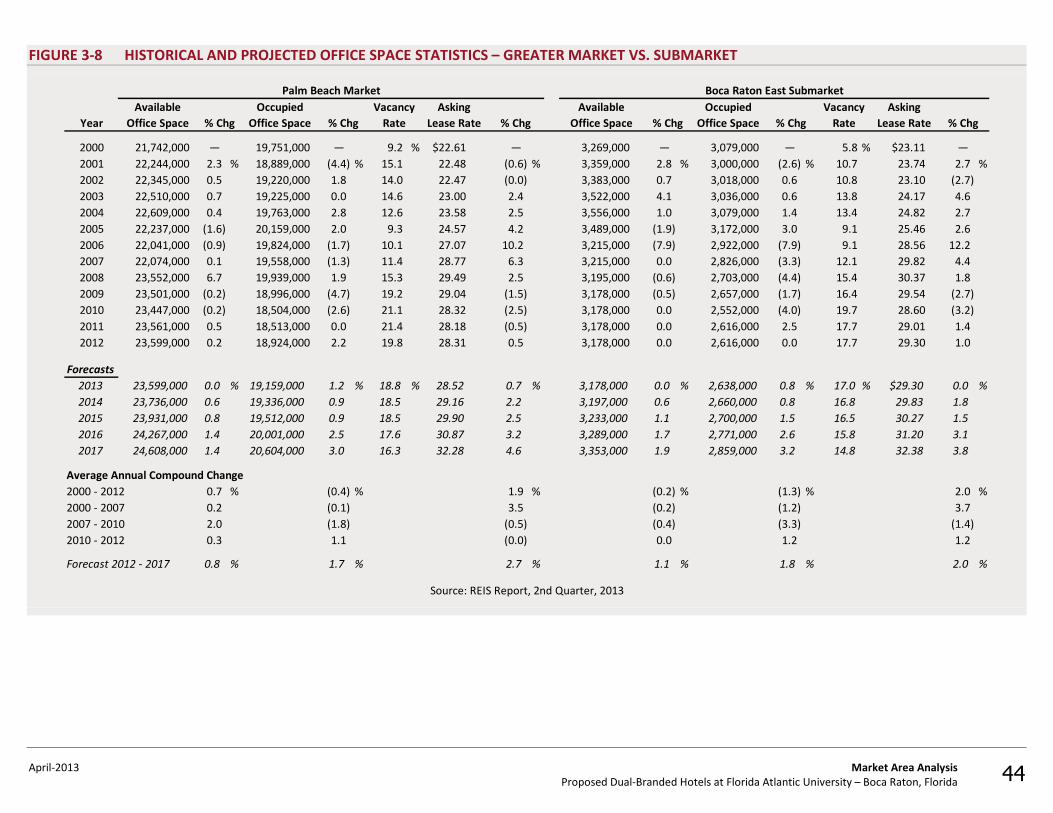
April-2013 Market Area Analysis Proposed Dual-Branded Hotels at Florida Atlantic University – Boca Raton, Florida 44
FIGURE 3-8 HISTORICAL AND PROJECTED OFFICE SPACE STATISTICS – GREATER MARKET VS. SUBMARKET
Year
2000 21,742,000 — 19,751,000 — 9.2 % $22.61 — 3,269,000 — 3,079,000 — 5.8 % $23.11 — 2001 22,244,000 2.3 % 18,889,000 (4.4) % 15.1 22.48 (0.6) % 3,359,000 2.8 % 3,000,000 (2.6) % 10.7 23.74 2.7 %2002 22,345,000 0.5 19,220,000 1.8 14.0 22.47 (0.0) 3,383,000 0.7 3,018,000 0.6 10.8 23.10 (2.7)2003 22,510,000 0.7 19,225,000 0.0 14.6 23.00 2.4 3,522,000 4.1 3,036,000 0.6 13.8 24.17 4.62004 22,609,000 0.4 19,763,000 2.8 12.6 23.58 2.5 3,556,000 1.0 3,079,000 1.4 13.4 24.82 2.72005 22,237,000 (1.6) 20,159,000 2.0 9.3 24.57 4.2 3,489,000 (1.9) 3,172,000 3.0 9.1 25.46 2.62006 22,041,000 (0.9) 19,824,000 (1.7) 10.1 27.07 10.2 3,215,000 (7.9) 2,922,000 (7.9) 9.1 28.56 12.22007 22,074,000 0.1 19,558,000 (1.3) 11.4 28.77 6.3 3,215,000 0.0 2,826,000 (3.3) 12.1 29.82 4.42008 23,552,000 6.7 19,939,000 1.9 15.3 29.49 2.5 3,195,000 (0.6) 2,703,000 (4.4) 15.4 30.37 1.82009 23,501,000 (0.2) 18,996,000 (4.7) 19.2 29.04 (1.5) 3,178,000 (0.5) 2,657,000 (1.7) 16.4 29.54 (2.7)2010 23,447,000 (0.2) 18,504,000 (2.6) 21.1 28.32 (2.5) 3,178,000 0.0 2,552,000 (4.0) 19.7 28.60 (3.2)2011 23,561,000 0.5 18,513,000 0.0 21.4 28.18 (0.5) 3,178,000 0.0 2,616,000 2.5 17.7 29.01 1.42012 23,599,000 0.2 18,924,000 2.2 19.8 28.31 0.5 3,178,000 0.0 2,616,000 0.0 17.7 29.30 1.0
Forecasts2013 23,599,000 0.0 % 19,159,000 1.2 % 18.8 % 28.52 0.7 % 3,178,000 0.0 % 2,638,000 0.8 % 17.0 % $29.30 0.0 %2014 23,736,000 0.6 19,336,000 0.9 18.5 29.16 2.2 3,197,000 0.6 2,660,000 0.8 16.8 29.83 1.82015 23,931,000 0.8 19,512,000 0.9 18.5 29.90 2.5 3,233,000 1.1 2,700,000 1.5 16.5 30.27 1.52016 24,267,000 1.4 20,001,000 2.5 17.6 30.87 3.2 3,289,000 1.7 2,771,000 2.6 15.8 31.20 3.12017 24,608,000 1.4 20,604,000 3.0 16.3 32.28 4.6 3,353,000 1.9 2,859,000 3.2 14.8 32.38 3.8
Average Annual Compound Change2000 - 2012 0.7 % (0.4) % 1.9 % (0.2) % (1.3) % 2.0 %2000 - 2007 0.2 (0.1) 3.5 (0.2) (1.2) 3.72007 - 2010 2.0 (1.8) (0.5) (0.4) (3.3) (1.4)2010 - 2012 0.3 1.1 (0.0) 0.0 1.2 1.2
Forecast 2012 - 2017 0.8 % 1.7 % 2.7 % 1.1 % 1.8 % 2.0 %
Palm Beach Market Boca Raton East SubmarketAvailable
Office Space % ChgOccupied
Office Space % ChgVacancy
RateAsking
Lease RateVacancy
RateAsking
Lease Rate % Chg% ChgAvailable
Office Space % ChgOccupied
Office Space
Source: REIS Report, 2nd Quarter, 2013
% Chg
April-2013 Market Area Analysis Proposed Dual-Branded Hotels at Florida Atlantic University – Boca Raton, Florida 45
The inventory of office space in the Palm Beach market increased at an average annual compound rate of 0.7% from 2000 through 2012, while occupied office space contracted at an average annual rate of -0.4% over the same period. During the period of 2000 through 2007, occupied office space contracted at an average annual compound rate of -0.1%. From 2007 through 2010, occupied office space contracted at an average annual compound rate of -1.8%, reflecting the impact of the recession. The onset of the recovery is evident in the 1.1% average annual change in occupied office space from 2010 to 2012. From 2012 through 2017, the inventory of occupied office space is forecast to increase at an average annual compound rate of 1.7%, with available office space expected to increase 0.8%, thus resulting in an anticipated vacancy rate of 16.3% as of 2017. Airport passenger counts are important indicators of lodging demand. Depending on the type of service provided by a particular airfield, a sizable percentage of arriving passengers may require hotel accommodations. Trends showing changes in passenger counts also reflect local business activity and the overall economic health of the area. The following table illustrates recent operating statistics for the Fort Lauderdale Hollywood International Airport, which is the primary airport facility serving the proposed subject property’s submarket.
Airport Traffic
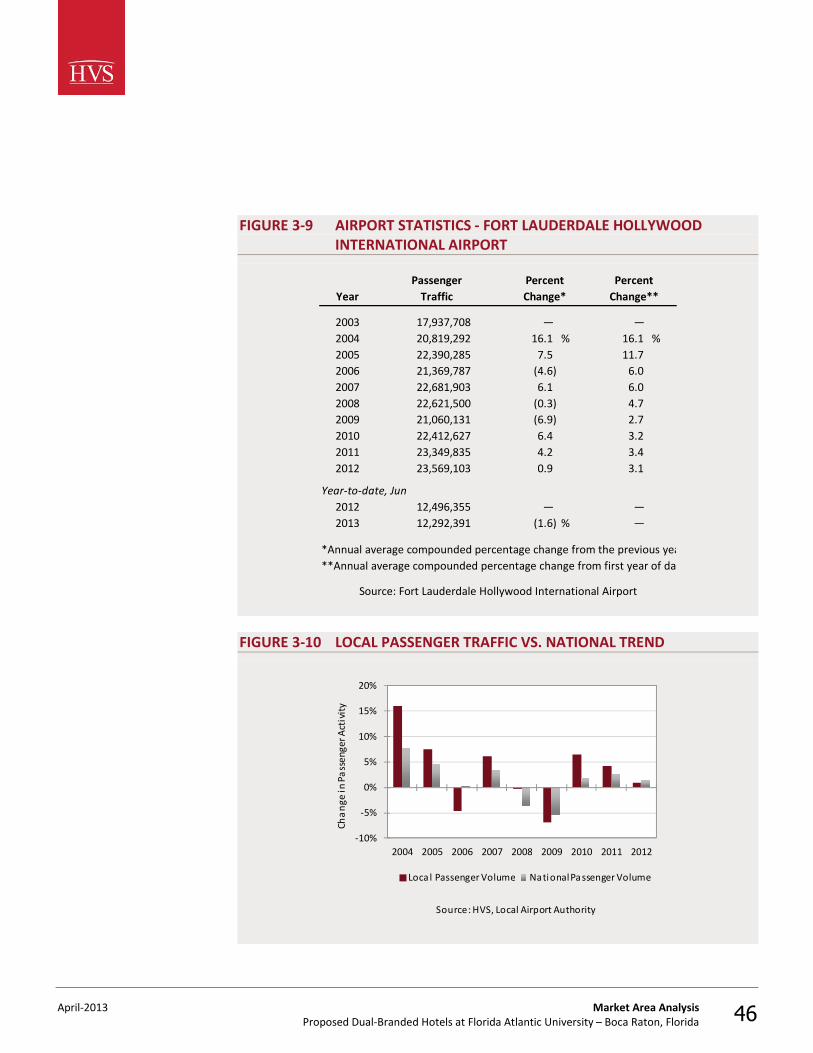
April-2013 Market Area Analysis Proposed Dual-Branded Hotels at Florida Atlantic University – Boca Raton, Florida 46
FIGURE 3-9 AIRPORT STATISTICS - FORT LAUDERDALE HOLLYWOOD INTERNATIONAL AIRPORT
Year
2003 17,937,708 — — 2004 20,819,292 16.1 % 16.1 %2005 22,390,285 7.5 11.72006 21,369,787 (4.6) 6.02007 22,681,903 6.1 6.02008 22,621,500 (0.3) 4.72009 21,060,131 (6.9) 2.72010 22,412,627 6.4 3.22011 23,349,835 4.2 3.42012 23,569,103 0.9 3.1
Year-to-date, Jun2012 12,496,355 — — 2013 12,292,391 (1.6) % —
*Annual average compounded percentage change from the previous year**Annual average compounded percentage change from first year of data
Change**Passenger
Change*TrafficPercent Percent
Source: Fort Lauderdale Hollywood International Airport
FIGURE 3-10 LOCAL PASSENGER TRAFFIC VS. NATIONAL TREND
-10%
-5%
0%
5%
10%
15%
20%
2004 2005 2006 2007 2008 2009 2010 2011 2012
Cha
nge
in P
ass
enge
r Act
ivit
y
Source: HVS, Local Airport Authority
Loca l Passenger Volume National Passenger Volume
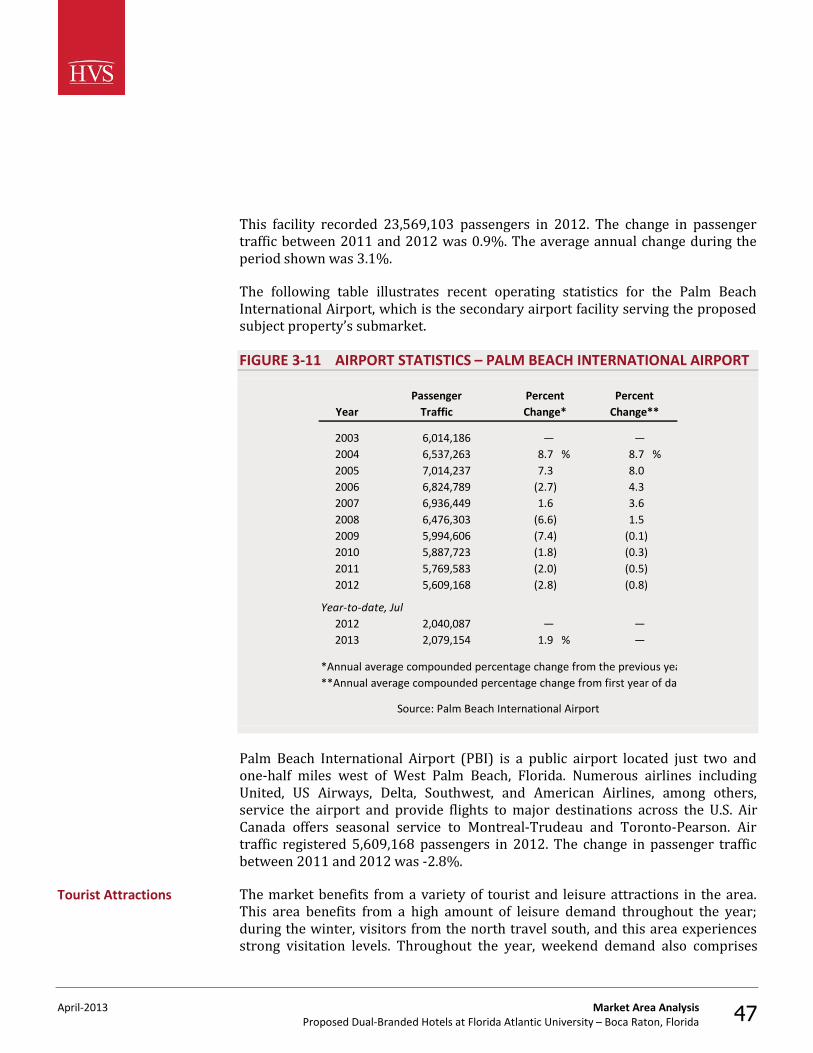
April-2013 Market Area Analysis Proposed Dual-Branded Hotels at Florida Atlantic University – Boca Raton, Florida 47
This facility recorded 23,569,103 passengers in 2012. The change in passenger traffic between 2011 and 2012 was 0.9%. The average annual change during the period shown was 3.1%. The following table illustrates recent operating statistics for the Palm Beach International Airport, which is the secondary airport facility serving the proposed subject property’s submarket. FIGURE 3-11 AIRPORT STATISTICS – PALM BEACH INTERNATIONAL AIRPORT
Year
2003 6,014,186 — — 2004 6,537,263 8.7 % 8.7 %2005 7,014,237 7.3 8.02006 6,824,789 (2.7) 4.32007 6,936,449 1.6 3.62008 6,476,303 (6.6) 1.52009 5,994,606 (7.4) (0.1)2010 5,887,723 (1.8) (0.3)2011 5,769,583 (2.0) (0.5)2012 5,609,168 (2.8) (0.8)
Year-to-date, Jul2012 2,040,087 — — 2013 2,079,154 1.9 % —
*Annual average compounded percentage change from the previous year**Annual average compounded percentage change from first year of data
Passenger Percent
Source: Palm Beach International Airport
Traffic Change*Percent
Change**
Palm Beach International Airport (PBI) is a public airport located just two and one-half miles west of West Palm Beach, Florida. Numerous airlines including United, US Airways, Delta, Southwest, and American Airlines, among others, service the airport and provide flights to major destinations across the U.S. Air Canada offers seasonal service to Montreal-Trudeau and Toronto-Pearson. Air traffic registered 5,609,168 passengers in 2012. The change in passenger traffic between 2011 and 2012 was -2.8%. The market benefits from a variety of tourist and leisure attractions in the area. This area benefits from a high amount of leisure demand throughout the year; during the winter, visitors from the north travel south, and this area experiences strong visitation levels. Throughout the year, weekend demand also comprises
Tourist Attractions
April-2013 Market Area Analysis Proposed Dual-Branded Hotels at Florida Atlantic University – Boca Raton, Florida 48
travelers passing through en route to other destinations, people visiting friends or relatives, and other similar weekend demand generators. Primary attractions in the area include the following: • Mizner Park is a mixed-use residential, commercial, and cultural center that
has become the catalyst for growth in the downtown Boca Raton area. The attraction consists of 235,000 square feet of retail space, including 54 shops, seven restaurants, a department store, and a cinema complex.
• The Boca Raton Museum of Art presents national and international exhibits, and a wide range of educational programs, lectures, gallery tours, and studio art classes. The Museum's permanent collection is an assembly of modern works by Degas, Matisse, Modigliani, and Picasso.
• Red Reef Park encompasses 67 acres of protected land, located adjacent to the Atlantic Ocean. The area features swimming, fishing, and other beach-related activities. The park also includes the Gumbo Limbo Environmental Complex, which is designed to provide environmental education for the community through seminars, workshops, field trips, and research.
• Fort Lauderdale boasts more than seven miles of beaches that offer residents and visitors premier opportunities for recreation, relaxation, and enjoyment. The city’s award-winning wave-wall and signature beachfront promenade highlight Fort Lauderdale’s world famous coastline, which is punctuated by an array of shops, restaurants, sidewalk cafés, and entertainment venues. Beachgoers can participate in a wide range of activities from boating, wind surfing, jet skiing, and volleyball to snorkeling, scuba diving, deep-sea fishing, and rollerblading.
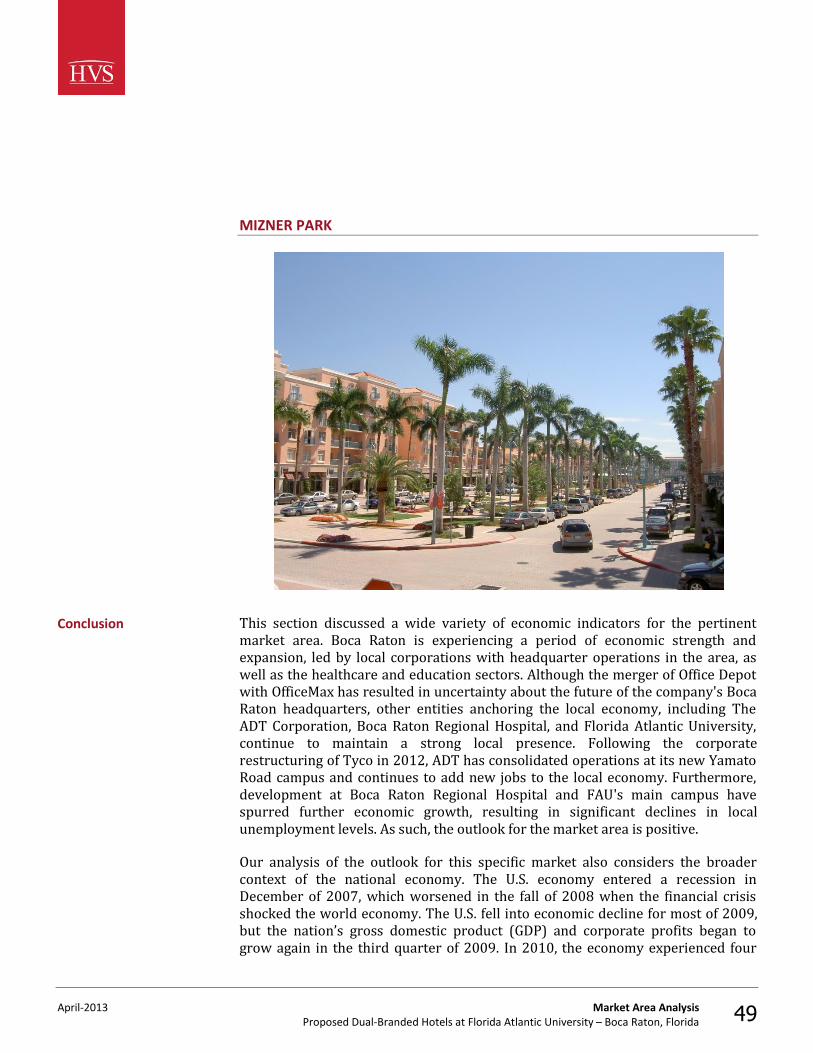
April-2013 Market Area Analysis Proposed Dual-Branded Hotels at Florida Atlantic University – Boca Raton, Florida 49
MIZNER PARK
This section discussed a wide variety of economic indicators for the pertinent market area. Boca Raton is experiencing a period of economic strength and expansion, led by local corporations with headquarter operations in the area, as well as the healthcare and education sectors. Although the merger of Office Depot with OfficeMax has resulted in uncertainty about the future of the company's Boca Raton headquarters, other entities anchoring the local economy, including The ADT Corporation, Boca Raton Regional Hospital, and Florida Atlantic University, continue to maintain a strong local presence. Following the corporate restructuring of Tyco in 2012, ADT has consolidated operations at its new Yamato Road campus and continues to add new jobs to the local economy. Furthermore, development at Boca Raton Regional Hospital and FAU's main campus have spurred further economic growth, resulting in significant declines in local unemployment levels. As such, the outlook for the market area is positive. Our analysis of the outlook for this specific market also considers the broader context of the national economy. The U.S. economy entered a recession in December of 2007, which worsened in the fall of 2008 when the financial crisis shocked the world economy. The U.S. fell into economic decline for most of 2009, but the nation’s gross domestic product (GDP) and corporate profits began to grow again in the third quarter of 2009. In 2010, the economy experienced four
Conclusion
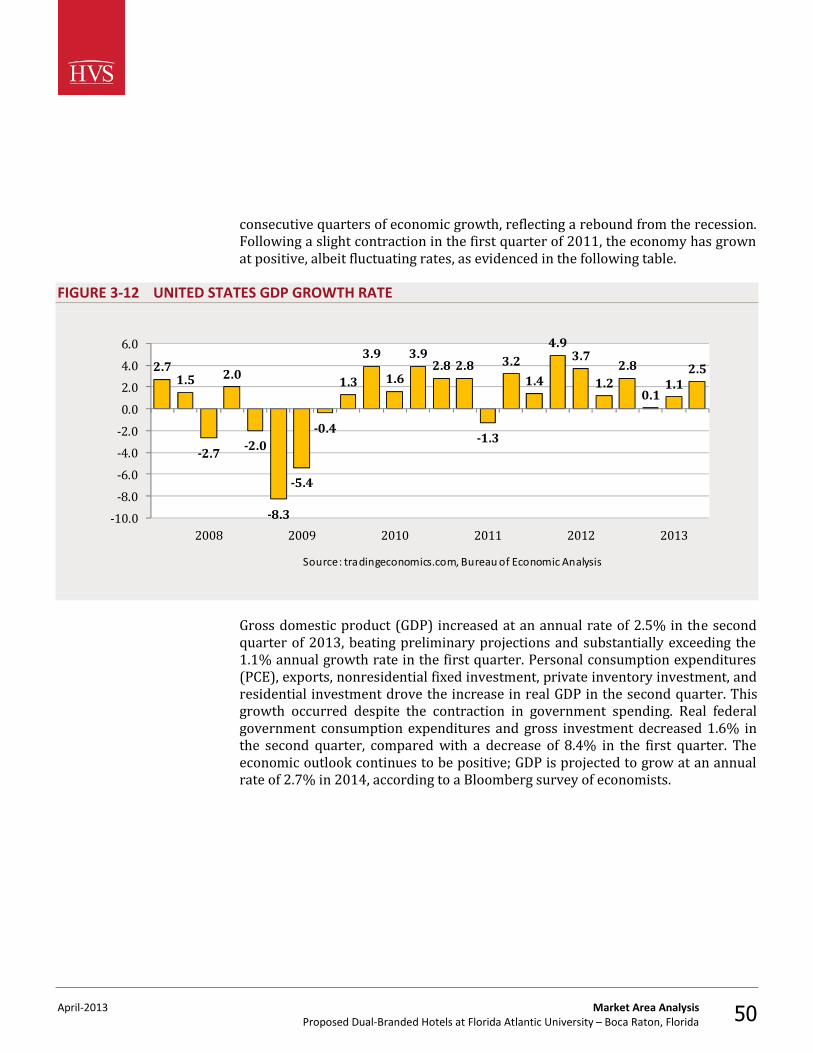
April-2013 Market Area Analysis Proposed Dual-Branded Hotels at Florida Atlantic University – Boca Raton, Florida 50
consecutive quarters of economic growth, reflecting a rebound from the recession. Following a slight contraction in the first quarter of 2011, the economy has grown at positive, albeit fluctuating rates, as evidenced in the following table.
FIGURE 3-12 UNITED STATES GDP GROWTH RATE
2.71.5
-2.7
2.0
-2.0
-8.3
-5.4
-0.4
1.3
3.9
1.6
3.92.8 2.8
-1.3
3.2
1.4
4.93.7
1.22.8
0.11.1
2.5
-10.0-8.0-6.0-4.0-2.00.02.04.06.0
2008 2009 2010 2011 2012 2013Source: tradingeconomics.com, Bureau of Economic Analysis
Gross domestic product (GDP) increased at an annual rate of 2.5% in the second quarter of 2013, beating preliminary projections and substantially exceeding the 1.1% annual growth rate in the first quarter. Personal consumption expenditures (PCE), exports, nonresidential fixed investment, private inventory investment, and residential investment drove the increase in real GDP in the second quarter. This growth occurred despite the contraction in government spending. Real federal government consumption expenditures and gross investment decreased 1.6% in the second quarter, compared with a decrease of 8.4% in the first quarter. The economic outlook continues to be positive; GDP is projected to grow at an annual rate of 2.7% in 2014, according to a Bloomberg survey of economists.
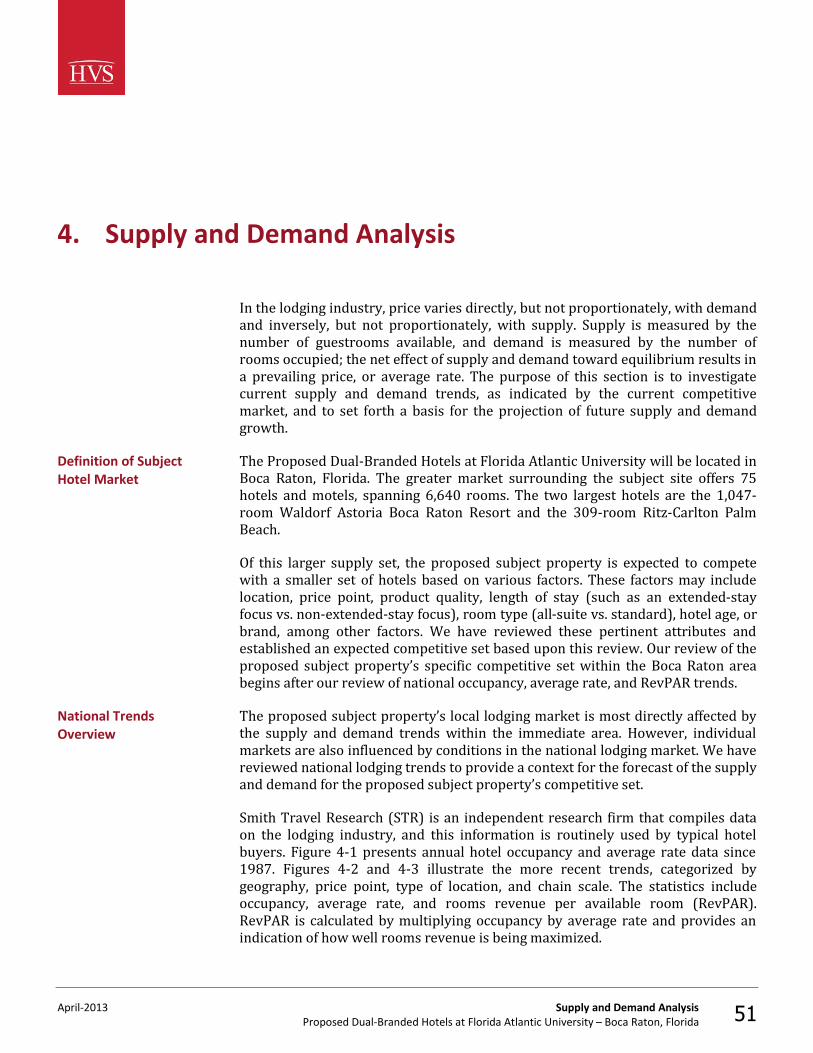
April-2013 Supply and Demand Analysis Proposed Dual-Branded Hotels at Florida Atlantic University – Boca Raton, Florida 51
4. Supply and Demand Analysis
In the lodging industry, price varies directly, but not proportionately, with demand and inversely, but not proportionately, with supply. Supply is measured by the number of guestrooms available, and demand is measured by the number of rooms occupied; the net effect of supply and demand toward equilibrium results in a prevailing price, or average rate. The purpose of this section is to investigate current supply and demand trends, as indicated by the current competitive market, and to set forth a basis for the projection of future supply and demand growth. The Proposed Dual-Branded Hotels at Florida Atlantic University will be located in Boca Raton, Florida. The greater market surrounding the subject site offers 75 hotels and motels, spanning 6,640 rooms. The two largest hotels are the 1,047-room Waldorf Astoria Boca Raton Resort and the 309-room Ritz-Carlton Palm Beach. Of this larger supply set, the proposed subject property is expected to compete with a smaller set of hotels based on various factors. These factors may include location, price point, product quality, length of stay (such as an extended-stay focus vs. non-extended-stay focus), room type (all-suite vs. standard), hotel age, or brand, among other factors. We have reviewed these pertinent attributes and established an expected competitive set based upon this review. Our review of the proposed subject property’s specific competitive set within the Boca Raton area begins after our review of national occupancy, average rate, and RevPAR trends. The proposed subject property’s local lodging market is most directly affected by the supply and demand trends within the immediate area. However, individual markets are also influenced by conditions in the national lodging market. We have reviewed national lodging trends to provide a context for the forecast of the supply and demand for the proposed subject property’s competitive set. Smith Travel Research (STR) is an independent research firm that compiles data on the lodging industry, and this information is routinely used by typical hotel buyers. Figure 4-1 presents annual hotel occupancy and average rate data since 1987. Figures 4-2 and 4-3 illustrate the more recent trends, categorized by geography, price point, type of location, and chain scale. The statistics include occupancy, average rate, and rooms revenue per available room (RevPAR). RevPAR is calculated by multiplying occupancy by average rate and provides an indication of how well rooms revenue is being maximized.
Definition of Subject Hotel Market
National Trends Overview
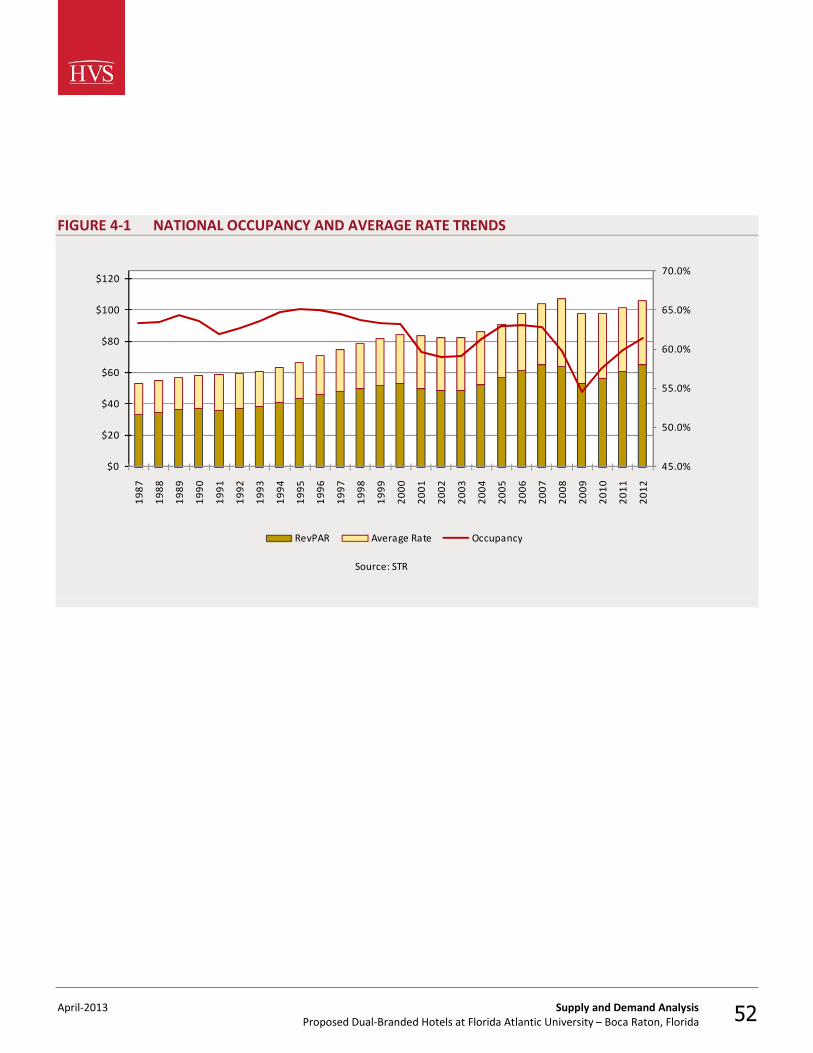
April-2013 Supply and Demand Analysis Proposed Dual-Branded Hotels at Florida Atlantic University – Boca Raton, Florida 52
FIGURE 4-1 NATIONAL OCCUPANCY AND AVERAGE RATE TRENDS
45.0%
50.0%
55.0%
60.0%
65.0%
70.0%
$0
$20
$40
$60
$80
$100
$120
1987
1988
1989
1990
1991
1992
1993
1994
1995
1996
1997
1998
1999
2000
2001
2002
2003
2004
2005
2006
2007
2008
2009
2010
2011
2012
Source: STR
RevPAR Average Rate Occupancy
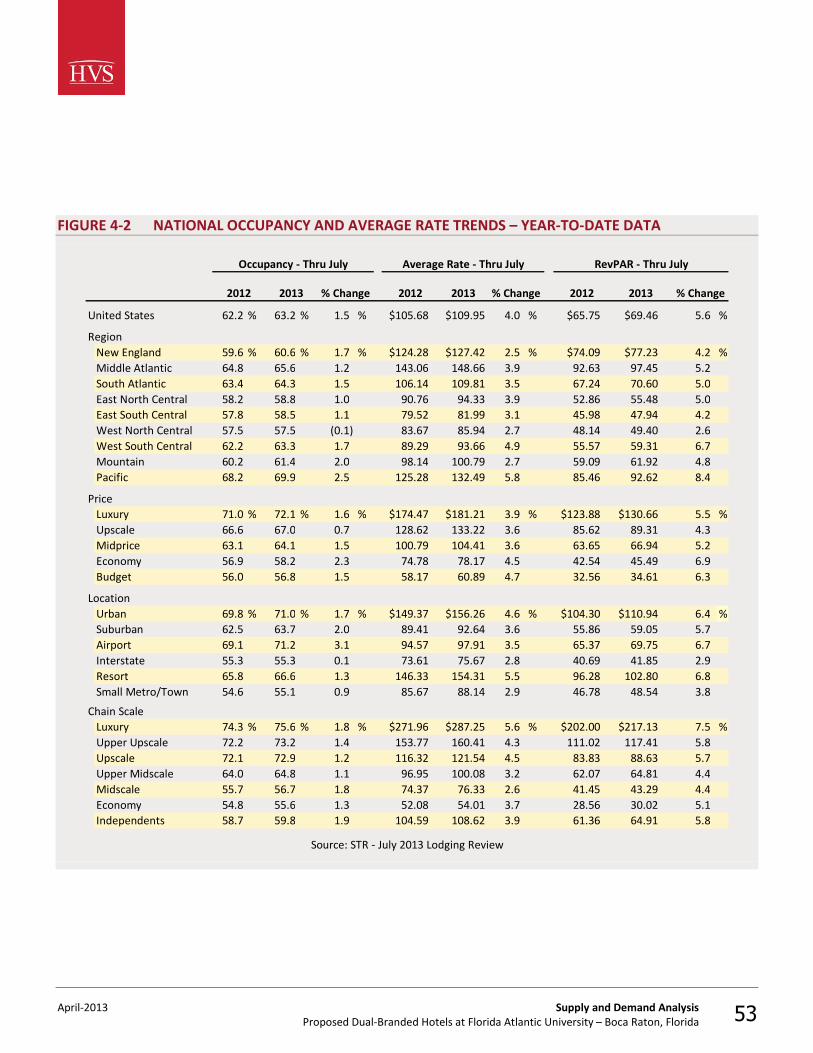
April-2013 Supply and Demand Analysis Proposed Dual-Branded Hotels at Florida Atlantic University – Boca Raton, Florida 53
FIGURE 4-2 NATIONAL OCCUPANCY AND AVERAGE RATE TRENDS – YEAR-TO-DATE DATA
United States 62.2 % 63.2 % 1.5 % $105.68 $109.95 4.0 % $65.75 $69.46 5.6 %
RegionNew England 59.6 % 60.6 % 1.7 % $124.28 $127.42 2.5 % $74.09 $77.23 4.2 %Middle Atlantic 64.8 65.6 1.2 143.06 148.66 3.9 92.63 97.45 5.2South Atlantic 63.4 64.3 1.5 106.14 109.81 3.5 67.24 70.60 5.0East North Central 58.2 58.8 1.0 90.76 94.33 3.9 52.86 55.48 5.0East South Central 57.8 58.5 1.1 79.52 81.99 3.1 45.98 47.94 4.2West North Central 57.5 57.5 (0.1) 83.67 85.94 2.7 48.14 49.40 2.6West South Central 62.2 63.3 1.7 89.29 93.66 4.9 55.57 59.31 6.7Mountain 60.2 61.4 2.0 98.14 100.79 2.7 59.09 61.92 4.8Pacific 68.2 69.9 2.5 125.28 132.49 5.8 85.46 92.62 8.4
PriceLuxury 71.0 % 72.1 % 1.6 % $174.47 $181.21 3.9 % $123.88 $130.66 5.5 %Upscale 66.6 67.0 0.7 128.62 133.22 3.6 85.62 89.31 4.3Midprice 63.1 64.1 1.5 100.79 104.41 3.6 63.65 66.94 5.2Economy 56.9 58.2 2.3 74.78 78.17 4.5 42.54 45.49 6.9Budget 56.0 56.8 1.5 58.17 60.89 4.7 32.56 34.61 6.3
LocationUrban 69.8 % 71.0 % 1.7 % $149.37 $156.26 4.6 % $104.30 $110.94 6.4 %Suburban 62.5 63.7 2.0 89.41 92.64 3.6 55.86 59.05 5.7Airport 69.1 71.2 3.1 94.57 97.91 3.5 65.37 69.75 6.7Interstate 55.3 55.3 0.1 73.61 75.67 2.8 40.69 41.85 2.9Resort 65.8 66.6 1.3 146.33 154.31 5.5 96.28 102.80 6.8Small Metro/Town 54.6 55.1 0.9 85.67 88.14 2.9 46.78 48.54 3.8
Chain ScaleLuxury 74.3 % 75.6 % 1.8 % $271.96 $287.25 5.6 % $202.00 $217.13 7.5 %Upper Upscale 72.2 73.2 1.4 153.77 160.41 4.3 111.02 117.41 5.8Upscale 72.1 72.9 1.2 116.32 121.54 4.5 83.83 88.63 5.7Upper Midscale 64.0 64.8 1.1 96.95 100.08 3.2 62.07 64.81 4.4Midscale 55.7 56.7 1.8 74.37 76.33 2.6 41.45 43.29 4.4Economy 54.8 55.6 1.3 52.08 54.01 3.7 28.56 30.02 5.1Independents 58.7 59.8 1.9 104.59 108.62 3.9 61.36 64.91 5.8
2012 % Change2012 20132013 % Change% Change
Occupancy - Thru July Average Rate - Thru July RevPAR - Thru July
Source: STR - July 2013 Lodging Review
2012 2013

April-2013 Supply and Demand Analysis Proposed Dual-Branded Hotels at Florida Atlantic University – Boca Raton, Florida 54
FIGURE 4-3 NATIONAL OCCUPANCY AND AVERAGE RATE TRENDS – CALENDAR YEAR DATA
United States 59.9 % 61.4 % 2.5 % $101.85 $106.10 4.2 % $61.02 $65.17 8.2 % Region
New England 61.2 % 61.6 % 0.7 % $120.66 $126.80 5.1 % $73.84 $78.13 8.6 %Middle Atlantic 65.4 66.5 1.8 145.05 150.55 3.8 94.80 100.15 8.1South Atlantic 59.4 60.9 2.5 100.20 103.28 3.1 59.50 62.86 7.0East North Central 56.5 58.5 3.6 88.20 92.28 4.6 49.82 53.98 8.4East South Central 55.5 56.4 1.5 77.22 79.47 2.9 42.89 44.78 5.7West North Central 56.2 57.4 2.2 80.92 83.82 3.6 45.48 48.13 6.5West South Central 58.1 60.6 4.4 84.80 88.78 4.7 49.23 53.81 8.5Mountain 59.1 59.2 0.2 93.39 96.57 3.4 55.20 57.20 8.4Pacific 65.6 67.9 3.5 119.05 125.98 5.8 78.06 85.49 10.3
Price Luxury 68.3 % 69.7 % 2.0 % $167.35 $173.50 3.7 % $114.26 $120.86 8.2 %Upscale 63.9 65.5 2.4 124.88 129.09 3.4 79.80 84.51 7.4Midprice 60.5 62.1 2.6 96.51 100.30 3.9 58.37 62.27 8.0Economy 53.9 55.6 3.1 72.78 76.12 4.6 39.24 42.30 7.2Budget 54.9 56.1 2.1 54.54 57.49 5.4 29.97 32.26 7.2
Location Urban 67.5 % 69.5 % 2.9 % $147.44 $153.94 4.4 % $99.53 $106.91 8.2 %Suburban 60.1 61.8 2.7 86.18 89.86 4.3 51.81 55.49 8.4Airport 66.3 68.1 2.7 91.01 94.70 4.1 60.37 64.49 7.1Interstate 53.3 54.6 2.4 71.66 74.18 3.5 38.22 40.53 6.7Resort 61.8 63.3 2.3 135.45 141.60 4.5 83.75 89.60 9.8Small Metro/Town 53.5 54.5 1.9 84.06 86.72 3.2 44.95 47.26 6.3
Chain ScaleLuxury 71.0 % 73.2 % 3.1 % $262.64 $274.51 4.5 % $186.43 $200.98 11.2 %Upper Upscale 69.3 70.9 2.3 147.99 154.36 4.3 102.60 109.43 6.6Upscale 69.5 70.9 2.0 111.70 116.88 4.6 77.64 82.87 8.0Mid-scale w/ F&B 61.3 63.0 2.8 93.93 97.41 3.7 57.58 61.36 8.6Mid-scale w/o F&B 53.2 54.8 3.0 72.34 74.45 2.9 38.50 40.79 3.0Economy 53.4 54.3 1.8 50.47 52.50 4.0 26.94 28.52 6.0Independents 56.8 58.3 2.6 101.24 105.12 3.8 57.49 61.27 6.5
Source: STR - December 2012 Lodging Review
2012 % Change2011 20112011 2012
Occupancy Average Rate RevPAR
% Change % Change2012
April-2013 Supply and Demand Analysis Proposed Dual-Branded Hotels at Florida Atlantic University – Boca Raton, Florida 55
Following the significant occupancy and RevPAR decline experienced during the last recession, demand growth resumed in 2010, led by select markets that had recorded positive growth trends in the fourth quarter of 2009. The pace of demand growth accelerated through the year; in 2010, lodging demand in the U.S. increased by 7.7% over that registered in 2009. A return of business travel and some group activity contributed to these positive trends. The resurgence in demand was partly fueled by the significant price discounts that were widely available in the first half of 2010. These discounting policies were largely phased out in the latter half of the year, balancing much of the early rate loss. Average rate decreased by only 0.1% in 2010 when compared to 2009. Strong demand growth continued in 2011 and 2012, at 5.0% and 3.0%, respectively. Demand increased 2.5% in the year-to-date through July 2013 period. Average rate rebounded by respective rates of 3.7% and 4.2%, in 2011 and 2012, followed by a 4.2% increase in the year-to-date through July 2013 period. In 2012, occupancy reached 61.4% (exceeding the ten-year average); moreover, occupancy is on track to gain another point in 2013. Average rate finished the year just over $106 in 2012, with year-to-date trends suggesting that another $4 to $5 gain in rate in 2013 is likely. Demand and average rates should continue to strengthen in the near term. These trends, combined with the low levels of supply growth anticipated through 2014, should boost occupancy to just over 63% by year-end 2014. On a national average, strengthening occupancy levels should also permit hotels to increase room rates beyond the 4.2% achieved in 2012. HVS forecasts U.S. average rate growth of 4.5% for 2013 and 5.0% for 2014. As previously noted, Smith Travel Research (STR) is an independent research firm that compiles and publishes data on the lodging industry, routinely used by typical hotel buyers. STR has compiled historical supply and demand data for a group of hotels considered applicable to this analysis for the proposed subject property. This information is presented in the following table, along with the market-wide occupancy, average rate, and rooms revenue per available room (RevPAR). RevPAR is calculated by multiplying occupancy by average rate and provides an indication of how well rooms revenue is being maximized.
Historical Supply and Demand Data
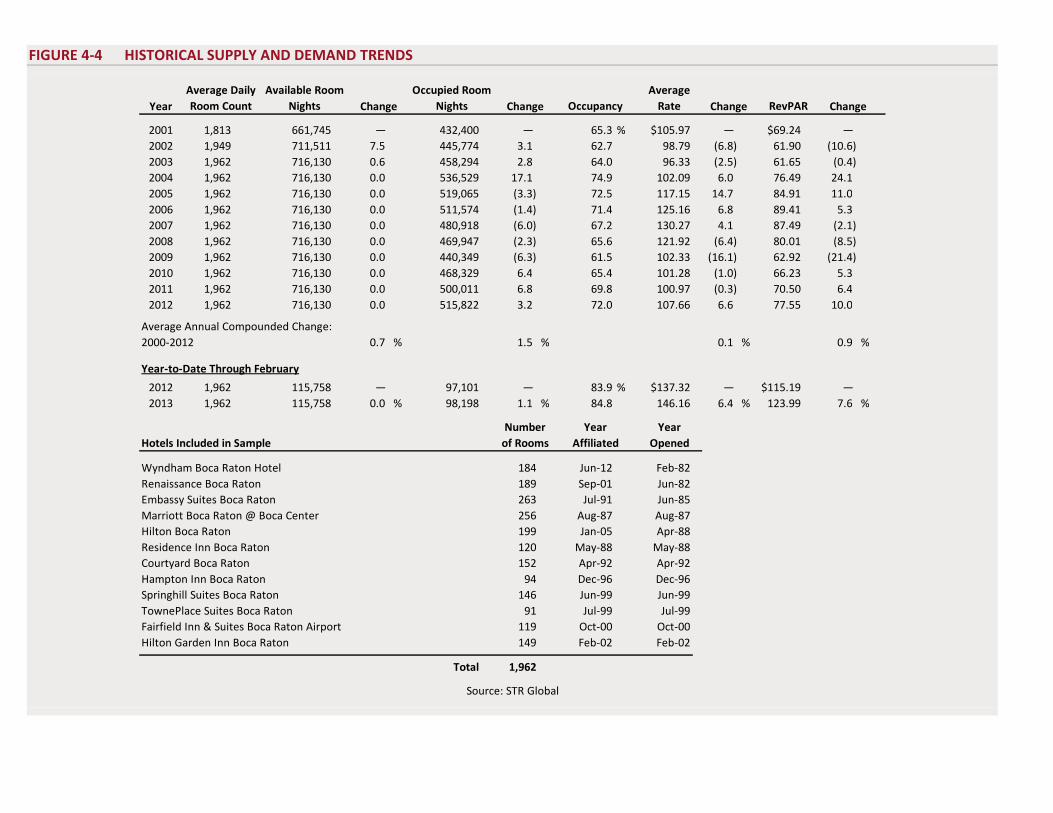
FIGURE 4-4 HISTORICAL SUPPLY AND DEMAND TRENDS
YearAverage Daily Room Count
Available Room Nights Change
Occupied Room Nights Change Occupancy
Average Rate Change RevPAR Change
2001 1,813 661,745 — 432,400 — 65.3 % $105.97 — $69.24 — 2002 1,949 711,511 7.5 445,774 3.1 62.7 98.79 (6.8) 61.90 (10.6)2003 1,962 716,130 0.6 458,294 2.8 64.0 96.33 (2.5) 61.65 (0.4)2004 1,962 716,130 0.0 536,529 17.1 74.9 102.09 6.0 76.49 24.12005 1,962 716,130 0.0 519,065 (3.3) 72.5 117.15 14.7 84.91 11.02006 1,962 716,130 0.0 511,574 (1.4) 71.4 125.16 6.8 89.41 5.32007 1,962 716,130 0.0 480,918 (6.0) 67.2 130.27 4.1 87.49 (2.1)2008 1,962 716,130 0.0 469,947 (2.3) 65.6 121.92 (6.4) 80.01 (8.5)2009 1,962 716,130 0.0 440,349 (6.3) 61.5 102.33 (16.1) 62.92 (21.4)2010 1,962 716,130 0.0 468,329 6.4 65.4 101.28 (1.0) 66.23 5.32011 1,962 716,130 0.0 500,011 6.8 69.8 100.97 (0.3) 70.50 6.42012 1,962 716,130 0.0 515,822 3.2 72.0 107.66 6.6 77.55 10.0
0.7 % 1.5 % 0.1 % 0.9 %
Year-to-Date Through February
2012 1,962 115,758 — 97,101 — 83.9 % $137.32 — $115.19 — 2013 1,962 115,758 0.0 % 98,198 1.1 % 84.8 146.16 6.4 % 123.99 7.6 %
Hotels Included in Sample
Wyndham Boca Raton Hotel 184 Jun-12 Feb-82Renaissance Boca Raton 189 Sep-01 Jun-82Embassy Suites Boca Raton 263 Jul-91 Jun-85Marriott Boca Raton @ Boca Center 256 Aug-87 Aug-87Hilton Boca Raton 199 Jan-05 Apr-88Residence Inn Boca Raton 120 May-88 May-88Courtyard Boca Raton 152 Apr-92 Apr-92Hampton Inn Boca Raton 94 Dec-96 Dec-96Springhill Suites Boca Raton 146 Jun-99 Jun-99TownePlace Suites Boca Raton 91 Jul-99 Jul-99Fairfield Inn & Suites Boca Raton Airport 119 Oct-00 Oct-00Hilton Garden Inn Boca Raton 149 Feb-02 Feb-02
Total 1,962
Source: STR Global
YearOpened
Average Annual Compounded Change: 2000-2012
Number Yearof Rooms Affiliated
April-2013 Supply and Demand Analysis Proposed Dual-Branded Hotels at Florida Atlantic University – Boca Raton, Florida 57
It is important to note some limitations of the STR data. Hotels are occasionally added to or removed from the sample, and not every property reports data in a consistent and timely manner; these factors can influence the overall quality of the information by skewing the results. These inconsistencies may also cause the STR data to differ from the results of our competitive survey. Nonetheless, STR data provide the best indication of aggregate growth or decline in existing supply and demand; thus, these trends have been considered in our analysis. Opening dates, as available, are presented for each reporting hotel in the previous table. The STR data for the competitive set reflect an overall market occupancy level of 72.0% in 2012, which compares to 69.8% for 2011. The overall average occupancy level for the calendar years presented equates to 66.9%. Local employers and headquarter offices in the area, including those of Office Depot and The ADT Corporation, as well as Florida Atlantic University, Lynn University, and Boca Raton Regional Hospital, represent the primary sources of demand for this market. No new supply has entered this market since the opening of the Hilton Garden Inn in 2002. Demand and occupancy fluctuated during the first half of the last decade, with occupancy levels peaking in 2004 and remaining above 70% through 2006 as a result of the temporary influx of demand from cleanup crews following particularly strong hurricane seasons, including the landfalls of major named storms such as Jeanne and Wilma. As temporary demand dissipated, market occupancy levels declined significantly in 2007, and this negative trend continued in 2008 and 2009 as the economic recession limited corporate spending and leisure travel to the market. Demand began to recover in late 2009 and exhibited strong increases in 2010 and 2011. Occupancy increased at a more modest pace in 2012; however, market-wide occupancy levels for that year reached their highest point since 2005. The latest year-to-date data for 2013 show continued but slowing demand increases as local hotel operators shift their focus to rate-driven revenue growth now that demand is nearing a historic peak. The STR data for the competitive set reflect an overall market average rate level of $107.66 in 2012, which compares to $100.97 for 2011. The average across all calendar years presented for average rate equates to $110.75. Average rate in the local market registered positive growth mid-decade from 2004 through much of 2007. The strength of the economy during that time, with little rate-resistance from corporate accounts such as Office Depot and Tyco International (ADT), allowed hotel operators to increase rates; temporary demand resulting from hurricane cleanup and recovery efforts in 2004 and 2005 further bolstered market-wide rates over that period. As temporary demand exited the market and corporate spending and leisure travel slowed significantly with the onset of the national recession, average rates declined in 2008. This downward trend continued through early 2011; however, average rates bottomed out in the low $80s that year. Average rates rebounded in 2012 as significant levels of demand
April-2013 Supply and Demand Analysis Proposed Dual-Branded Hotels at Florida Atlantic University – Boca Raton, Florida 58
returned to the market; this rate growth was further bolstered by a double-digit increase in October of that year due to the presidential debate held at Lynn University. The latest year-to-date 2013 data illustrate equally strong month-over-month increases, indicating that rate recovery is underway as market-wide demand levels near a historic peak. These occupancy and average rate trends resulted in a RevPAR level of $77.55 in 2012. Monthly occupancy and average rate trends are presented in the following tables. Seasonality
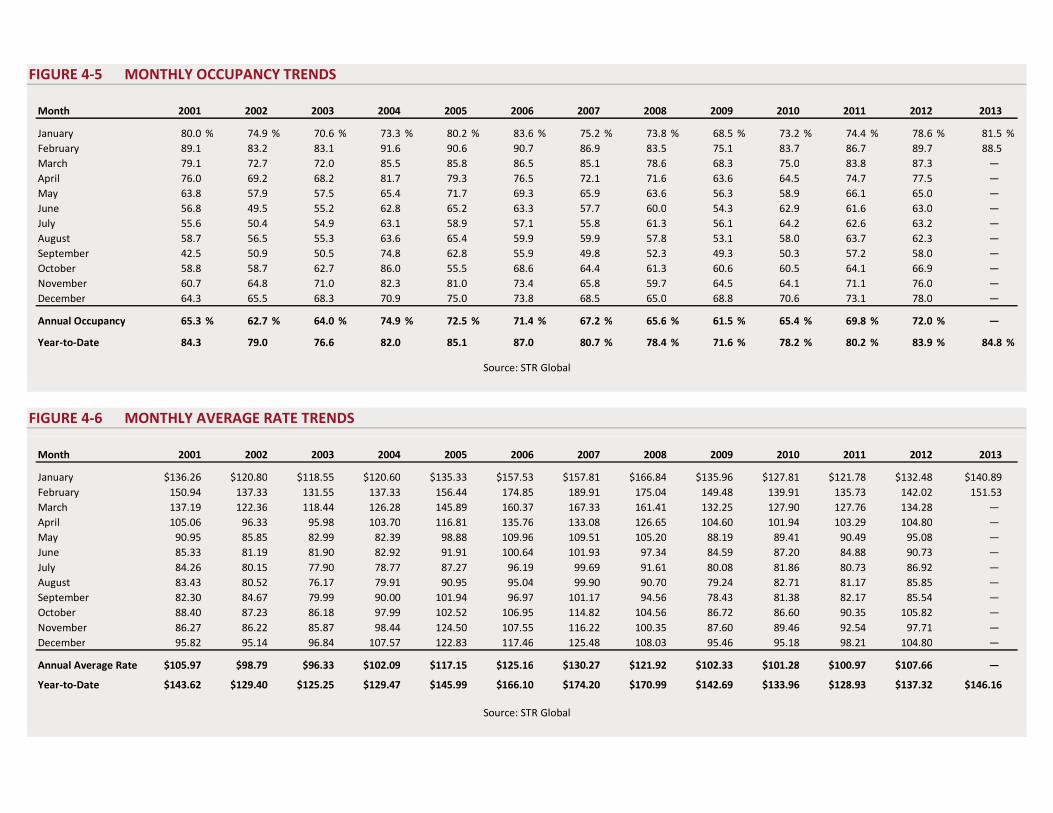
FIGURE 4-5 MONTHLY OCCUPANCY TRENDS
Month 2001 2002 2003 2004 2005 2006 2007 2008 2009 2010 2011 2012 2013
January 80.0 % 74.9 % 70.6 % 73.3 % 80.2 % 83.6 % 75.2 % 73.8 % 68.5 % 73.2 % 74.4 % 78.6 % 81.5 %February 89.1 83.2 83.1 91.6 90.6 90.7 86.9 83.5 75.1 83.7 86.7 89.7 88.5March 79.1 72.7 72.0 85.5 85.8 86.5 85.1 78.6 68.3 75.0 83.8 87.3 — April 76.0 69.2 68.2 81.7 79.3 76.5 72.1 71.6 63.6 64.5 74.7 77.5 — May 63.8 57.9 57.5 65.4 71.7 69.3 65.9 63.6 56.3 58.9 66.1 65.0 — June 56.8 49.5 55.2 62.8 65.2 63.3 57.7 60.0 54.3 62.9 61.6 63.0 — July 55.6 50.4 54.9 63.1 58.9 57.1 55.8 61.3 56.1 64.2 62.6 63.2 — August 58.7 56.5 55.3 63.6 65.4 59.9 59.9 57.8 53.1 58.0 63.7 62.3 — September 42.5 50.9 50.5 74.8 62.8 55.9 49.8 52.3 49.3 50.3 57.2 58.0 — October 58.8 58.7 62.7 86.0 55.5 68.6 64.4 61.3 60.6 60.5 64.1 66.9 — November 60.7 64.8 71.0 82.3 81.0 73.4 65.8 59.7 64.5 64.1 71.1 76.0 — December 64.3 65.5 68.3 70.9 75.0 73.8 68.5 65.0 68.8 70.6 73.1 78.0 —
Annual Occupancy 65.3 % 62.7 % 64.0 % 74.9 % 72.5 % 71.4 % 67.2 % 65.6 % 61.5 % 65.4 % 69.8 % 72.0 % —
Year-to-Date 84.3 79.0 76.6 82.0 85.1 87.0 80.7 % 78.4 % 71.6 % 78.2 % 80.2 % 83.9 % 84.8 %
Source: STR Global
FIGURE 4-6 MONTHLY AVERAGE RATE TRENDS
Month 2001 2002 2003 2004 2005 2006 2007 2008 2009 2010 2011 2012 2013
January $136.26 $120.80 $118.55 $120.60 $135.33 $157.53 $157.81 $166.84 $135.96 $127.81 $121.78 $132.48 $140.89February 150.94 137.33 131.55 137.33 156.44 174.85 189.91 175.04 149.48 139.91 135.73 142.02 151.53March 137.19 122.36 118.44 126.28 145.89 160.37 167.33 161.41 132.25 127.90 127.76 134.28 — April 105.06 96.33 95.98 103.70 116.81 135.76 133.08 126.65 104.60 101.94 103.29 104.80 — May 90.95 85.85 82.99 82.39 98.88 109.96 109.51 105.20 88.19 89.41 90.49 95.08 — June 85.33 81.19 81.90 82.92 91.91 100.64 101.93 97.34 84.59 87.20 84.88 90.73 — July 84.26 80.15 77.90 78.77 87.27 96.19 99.69 91.61 80.08 81.86 80.73 86.92 — August 83.43 80.52 76.17 79.91 90.95 95.04 99.90 90.70 79.24 82.71 81.17 85.85 — September 82.30 84.67 79.99 90.00 101.94 96.97 101.17 94.56 78.43 81.38 82.17 85.54 — October 88.40 87.23 86.18 97.99 102.52 106.95 114.82 104.56 86.72 86.60 90.35 105.82 — November 86.27 86.22 85.87 98.44 124.50 107.55 116.22 100.35 87.60 89.46 92.54 97.71 — December 95.82 95.14 96.84 107.57 122.83 117.46 125.48 108.03 95.46 95.18 98.21 104.80 —
Annual Average Rate $105.97 $98.79 $96.33 $102.09 $117.15 $125.16 $130.27 $121.92 $102.33 $101.28 $100.97 $107.66 —
Year-to-Date $143.62 $129.40 $125.25 $129.47 $145.99 $166.10 $174.20 $170.99 $142.69 $133.96 $128.93 $137.32 $146.16
Source: STR Global
April-2013 Supply and Demand Analysis Proposed Dual-Branded Hotels at Florida Atlantic University – Boca Raton, Florida 60
The illustrated monthly occupancy and average rates patterns reflect important seasonal characteristics. We have reviewed these trends in developing our forthcoming forecast of market-wide demand and average rate. Like other markets in the greater South Florida region, Boca Raton is highly seasonal, with leisure travel generating significant demand in the first quarter of the year. The warm, tropical climate and pristine Atlantic beaches of the South Florida region draw travelers seeking to escape the colder winter months in other parts of the country. Occupancy levels generally exceed 75% from December through March as "snowbirds," seasonal transplants from northern cities such as New York, vacation in the area. Occupancy levels then decline steadily over the summer months, typically reaching a low in the 50s in September before increasing once more. A review of the trends in occupancy, average rate, and RevPAR per day of the week over the past three fiscal years provides some insight into the impact that the current economic conditions have had on the competitive lodging market. The data, as provided by Smith Travel Research, are illustrated in the following table.
Patterns of Demand
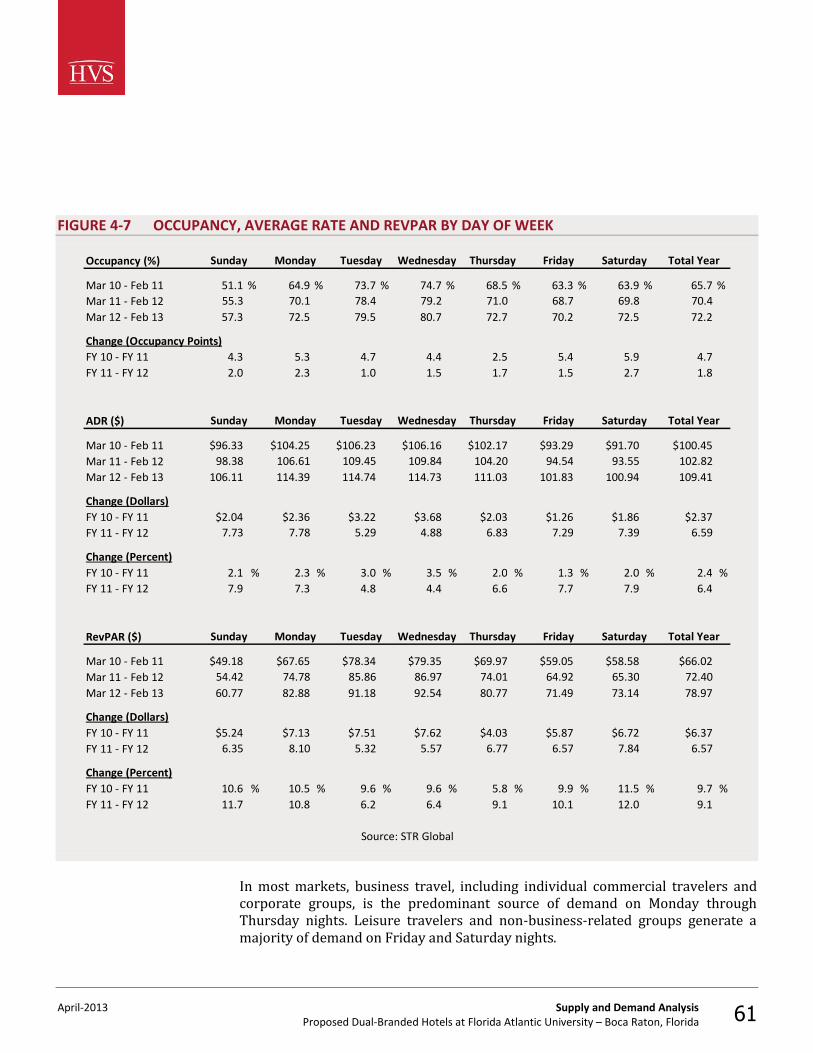
April-2013 Supply and Demand Analysis Proposed Dual-Branded Hotels at Florida Atlantic University – Boca Raton, Florida 61
FIGURE 4-7 OCCUPANCY, AVERAGE RATE AND REVPAR BY DAY OF WEEK
Occupancy (%)
Mar 10 - Feb 11 51.1 % 64.9 % 73.7 % 74.7 % 68.5 % 63.3 % 63.9 % 65.7 %Mar 11 - Feb 12 55.3 70.1 78.4 79.2 71.0 68.7 69.8 70.4Mar 12 - Feb 13 57.3 72.5 79.5 80.7 72.7 70.2 72.5 72.2
Change (Occupancy Points)FY 10 - FY 11 4.3 5.3 4.7 4.4 2.5 5.4 5.9 4.7FY 11 - FY 12 2.0 2.3 1.0 1.5 1.7 1.5 2.7 1.8
ADR ($)
Mar 10 - Feb 11 $96.33 $104.25 $106.23 $106.16 $102.17 $93.29 $91.70 $100.45Mar 11 - Feb 12 98.38 106.61 109.45 109.84 104.20 94.54 93.55 102.82Mar 12 - Feb 13 106.11 114.39 114.74 114.73 111.03 101.83 100.94 109.41
Change (Dollars)FY 10 - FY 11 $2.04 $2.36 $3.22 $3.68 $2.03 $1.26 $1.86 $2.37FY 11 - FY 12 7.73 7.78 5.29 4.88 6.83 7.29 7.39 6.59
Change (Percent)FY 10 - FY 11 2.1 % 2.3 % 3.0 % 3.5 % 2.0 % 1.3 % 2.0 % 2.4 %FY 11 - FY 12 7.9 7.3 4.8 4.4 6.6 7.7 7.9 6.4
RevPAR ($)
Mar 10 - Feb 11 $49.18 $67.65 $78.34 $79.35 $69.97 $59.05 $58.58 $66.02Mar 11 - Feb 12 54.42 74.78 85.86 86.97 74.01 64.92 65.30 72.40Mar 12 - Feb 13 60.77 82.88 91.18 92.54 80.77 71.49 73.14 78.97
Change (Dollars)FY 10 - FY 11 $5.24 $7.13 $7.51 $7.62 $4.03 $5.87 $6.72 $6.37FY 11 - FY 12 6.35 8.10 5.32 5.57 6.77 6.57 7.84 6.57
Change (Percent)FY 10 - FY 11 10.6 % 10.5 % 9.6 % 9.6 % 5.8 % 9.9 % 11.5 % 9.7 %FY 11 - FY 12 11.7 10.8 6.2 6.4 9.1 10.1 12.0 9.1
Source: STR Global
Sunday Monday Total YearSaturday
Total Year
Total Year
Thursday Friday Saturday
Thursday Friday SaturdaySunday Monday Tuesday Wednesday
FridayTuesday Wednesday Thursday
WednesdaySunday Monday Tuesday
In most markets, business travel, including individual commercial travelers and corporate groups, is the predominant source of demand on Monday through Thursday nights. Leisure travelers and non-business-related groups generate a majority of demand on Friday and Saturday nights.
April-2013 Supply and Demand Analysis Proposed Dual-Branded Hotels at Florida Atlantic University – Boca Raton, Florida 62
Based on an evaluation of the occupancy, rate structure, market orientation, chain affiliation, location, facilities, amenities, reputation, and quality of each area hotel, as well as the comments of management representatives, we have identified several properties that are expected to be primarily competitive with the proposed subject property. If applicable, additional lodging facilities may be judged only secondarily competitive; although the facilities, rate structures, or market orientations of these hotels prevent their inclusion among the primary competitive supply, they are expected to compete with the proposed subject property to some extent. The following table summarizes the important operating characteristics of the future primary competitors and the aggregate secondary competitors (if applicable). This information was compiled from personal interviews, inspections, lodging directories, and our in-house library of operating data. The table also sets forth each property’s penetration factors; penetration is the ratio between a specific hotel’s operating results and the corresponding data for the market. If the penetration factor is greater than 100%, the property is performing better than the market as a whole; conversely, if the penetration is less than 100%, the hotel is performing at a level below the market-wide average.
SUPPLY
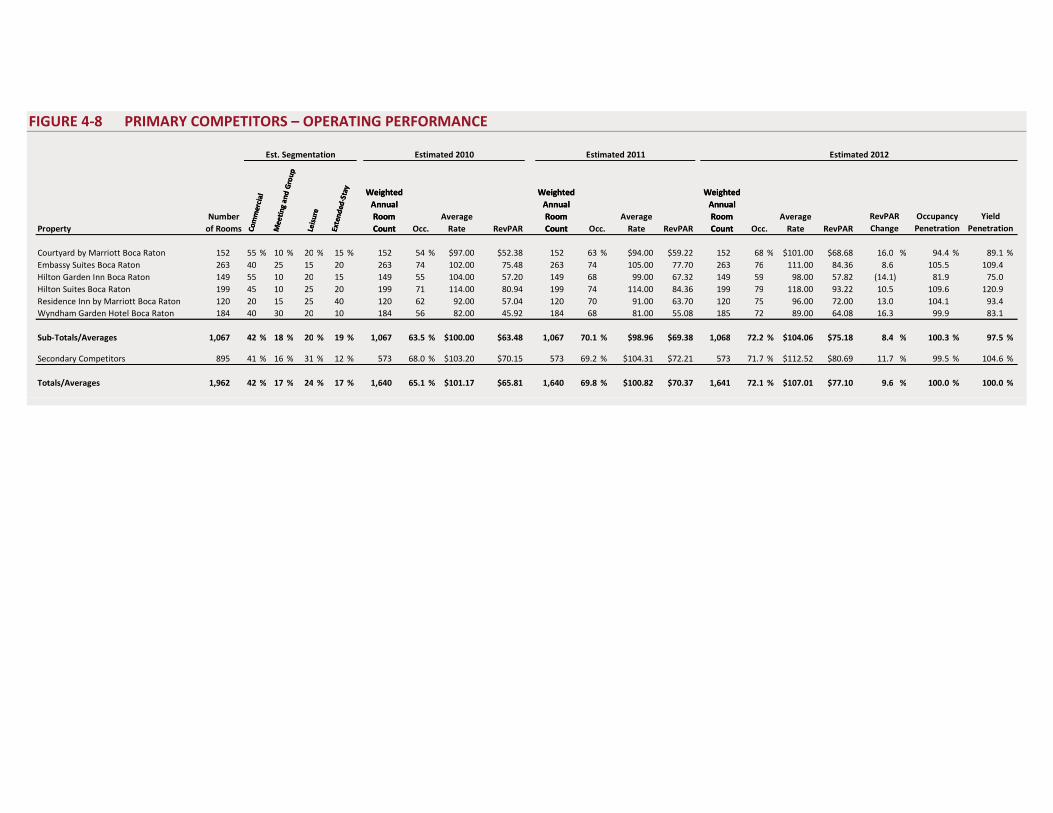
FIGURE 4-8 PRIMARY COMPETITORS – OPERATING PERFORMANCE
Est. Segmentation Estimated 2010 Estimated 2011 Estimated 2012
Weighted Annual Room Count
Weighted Annual Room CountCo
mm
erci
al
Mee
ting
and
Gro
up
Leis
ure
Exte
nded
-Sta
y
Weighted Annual Room CountProperty Occ. RevPAR Occ. RevPAR RevPAR
RevPAR Change
Occupancy Penetration
Yield Penetration
Courtyard by Marriott Boca Raton 152 55 % 10 % 20 % 15 % 152 54 % $97.00 $52.38 152 63 % $94.00 $59.22 152 68 % $101.00 $68.68 16.0 % 94.4 % 89.1 %Embassy Suites Boca Raton 263 40 25 15 20 263 74 102.00 75.48 263 74 105.00 77.70 263 76 111.00 84.36 8.6 105.5 109.4Hilton Garden Inn Boca Raton 149 55 10 20 15 149 55 104.00 57.20 149 68 99.00 67.32 149 59 98.00 57.82 (14.1) 81.9 75.0Hilton Suites Boca Raton 199 45 10 25 20 199 71 114.00 80.94 199 74 114.00 84.36 199 79 118.00 93.22 10.5 109.6 120.9Residence Inn by Marriott Boca Raton 120 20 15 25 40 120 62 92.00 57.04 120 70 91.00 63.70 120 75 96.00 72.00 13.0 104.1 93.4Wyndham Garden Hotel Boca Raton 184 40 30 20 10 184 56 82.00 45.92 184 68 81.00 55.08 185 72 89.00 64.08 16.3 99.9 83.1
Sub-Totals/Averages 1,067 42 % 18 % 20 % 19 % 1,067 63.5 % $100.00 $63.48 1,067 70.1 % $98.96 $69.38 1,068 72.2 % $104.06 $75.18 8.4 % 100.3 % 97.5 %
Secondary Competitors 895 41 % 16 % 31 % 12 % 573 68.0 % $103.20 $70.15 573 69.2 % $104.31 $72.21 573 71.7 % $112.52 $80.69 11.7 % 99.5 % 104.6 %
Totals/Averages 1,962 42 % 17 % 24 % 17 % 1,640 65.1 % $101.17 $65.81 1,640 69.8 % $100.82 $70.37 1,641 72.1 % $107.01 $77.10 9.6 % 100.0 % 100.0 %
Occ.Average
RateNumber
of Rooms
Weighted Annual Room Count
Weighted Annual Room CountCo
mm
erci
al
Mee
ting
and
Gro
up
Leis
ure
Exte
nded
-Sta
y
Average Rate
Weighted Annual Room Count
Average Rate
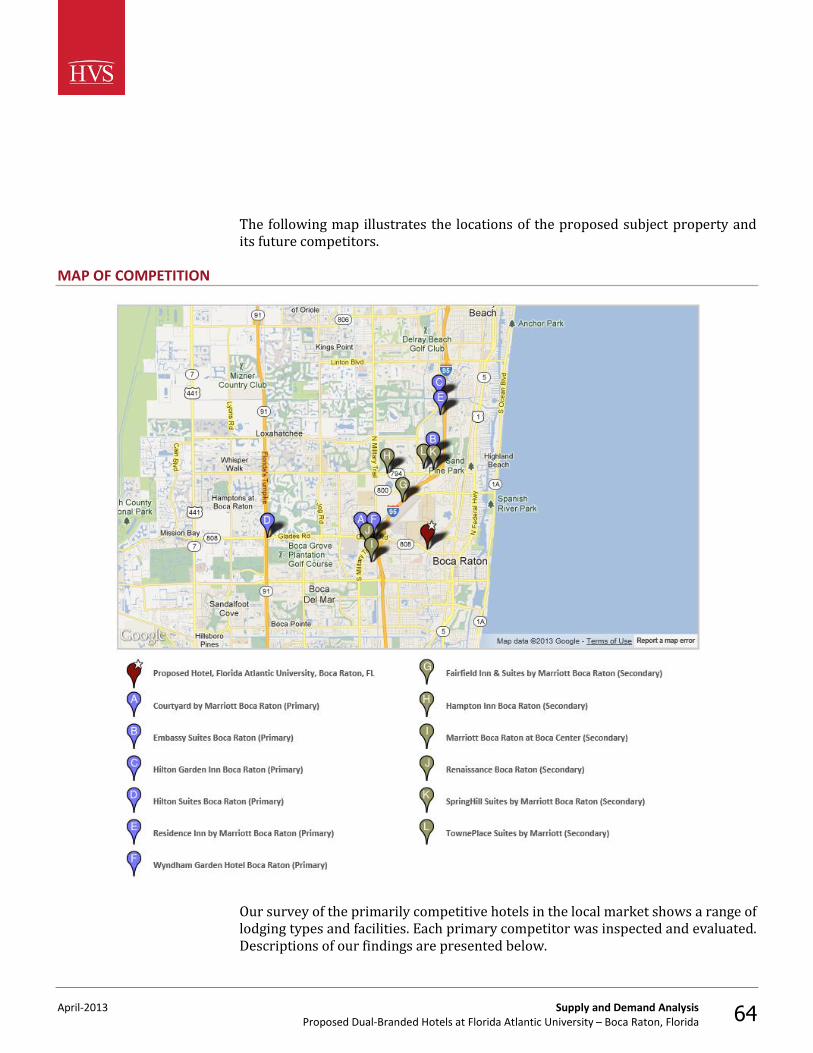
April-2013 Supply and Demand Analysis Proposed Dual-Branded Hotels at Florida Atlantic University – Boca Raton, Florida 64
The following map illustrates the locations of the proposed subject property and its future competitors.
MAP OF COMPETITION
Our survey of the primarily competitive hotels in the local market shows a range of lodging types and facilities. Each primary competitor was inspected and evaluated. Descriptions of our findings are presented below.
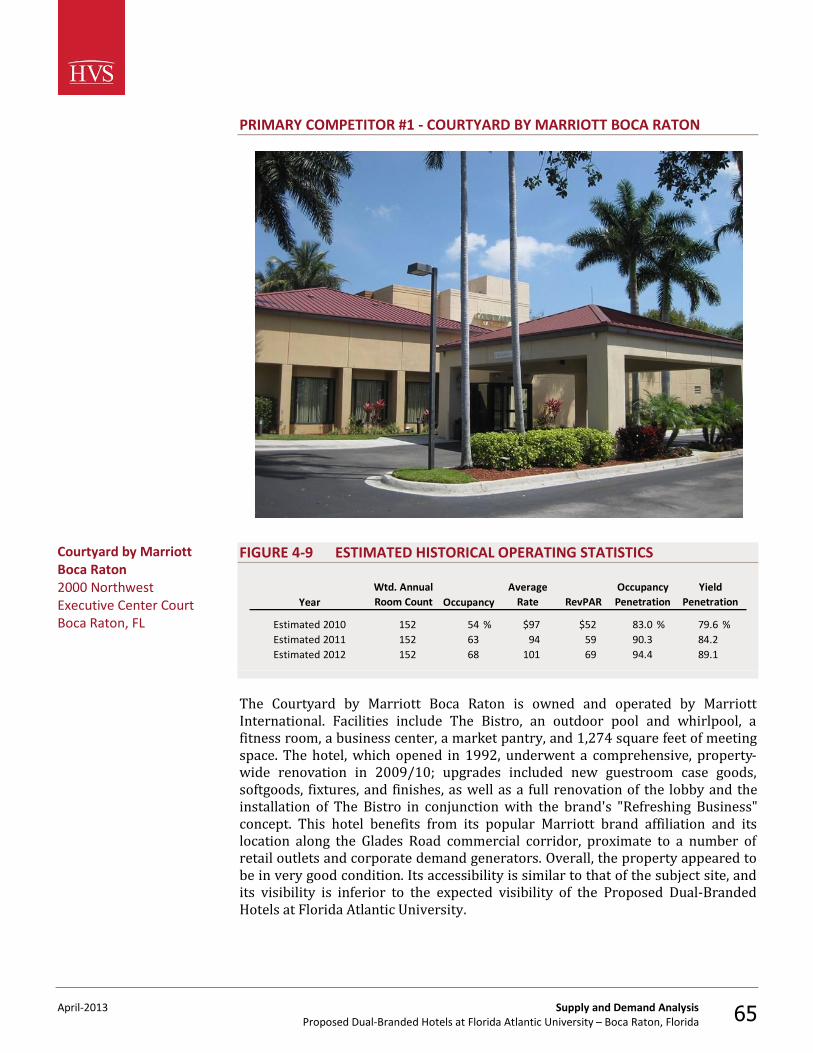
April-2013 Supply and Demand Analysis Proposed Dual-Branded Hotels at Florida Atlantic University – Boca Raton, Florida 65
PRIMARY COMPETITOR #1 - COURTYARD BY MARRIOTT BOCA RATON
FIGURE 4-9 ESTIMATED HISTORICAL OPERATING STATISTICS
YearWtd. Annual Room Count Occupancy
Average Rate RevPAR
Occupancy Penetration
Yield Penetration
Estimated 2010 152 54 % $97 $52 83.0 % 79.6 %Estimated 2011 152 63 94 59 90.3 84.2Estimated 2012 152 68 101 69 94.4 89.1
The Courtyard by Marriott Boca Raton is owned and operated by Marriott International. Facilities include The Bistro, an outdoor pool and whirlpool, a fitness room, a business center, a market pantry, and 1,274 square feet of meeting space. The hotel, which opened in 1992, underwent a comprehensive, property-wide renovation in 2009/10; upgrades included new guestroom case goods, softgoods, fixtures, and finishes, as well as a full renovation of the lobby and the installation of The Bistro in conjunction with the brand's "Refreshing Business" concept. This hotel benefits from its popular Marriott brand affiliation and its location along the Glades Road commercial corridor, proximate to a number of retail outlets and corporate demand generators. Overall, the property appeared to be in very good condition. Its accessibility is similar to that of the subject site, and its visibility is inferior to the expected visibility of the Proposed Dual-Branded Hotels at Florida Atlantic University.
Courtyard by Marriott Boca Raton 2000 Northwest Executive Center Court Boca Raton, FL
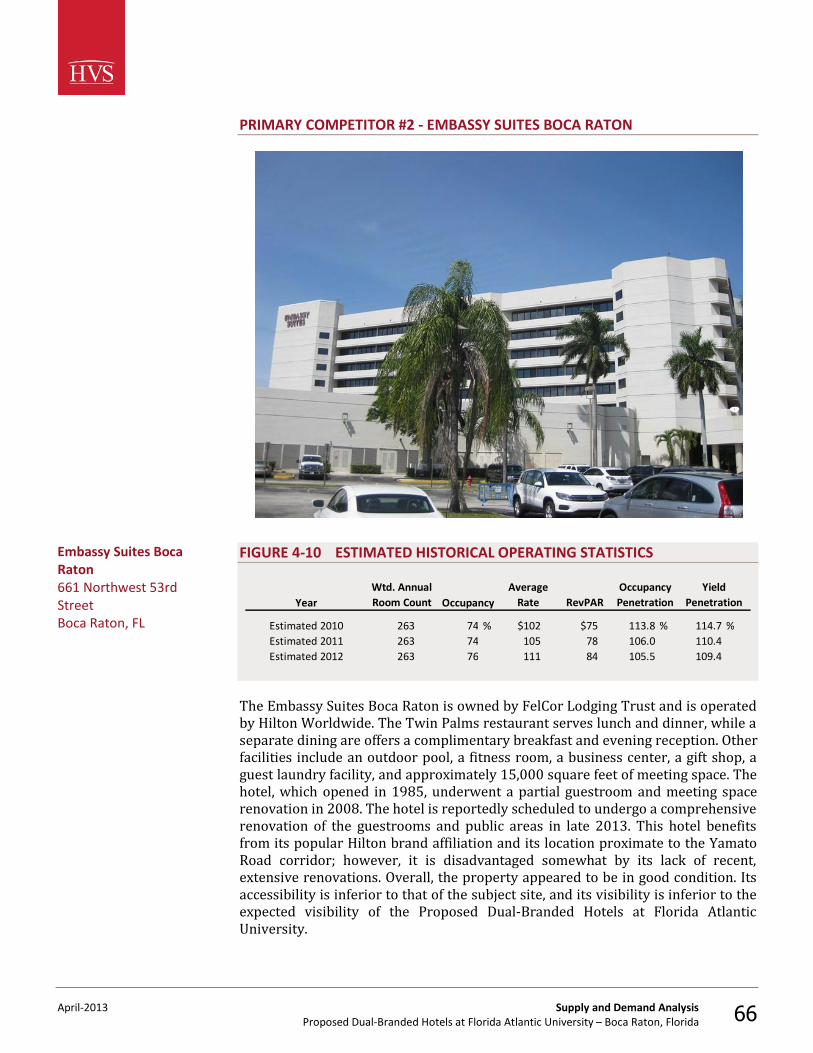
April-2013 Supply and Demand Analysis Proposed Dual-Branded Hotels at Florida Atlantic University – Boca Raton, Florida 66
PRIMARY COMPETITOR #2 - EMBASSY SUITES BOCA RATON
FIGURE 4-10 ESTIMATED HISTORICAL OPERATING STATISTICS
YearWtd. Annual Room Count Occupancy
Average Rate RevPAR
Occupancy Penetration
Yield Penetration
Estimated 2010 263 74 % $102 $75 113.8 % 114.7 %Estimated 2011 263 74 105 78 106.0 110.4Estimated 2012 263 76 111 84 105.5 109.4
The Embassy Suites Boca Raton is owned by FelCor Lodging Trust and is operated by Hilton Worldwide. The Twin Palms restaurant serves lunch and dinner, while a separate dining are offers a complimentary breakfast and evening reception. Other facilities include an outdoor pool, a fitness room, a business center, a gift shop, a guest laundry facility, and approximately 15,000 square feet of meeting space. The hotel, which opened in 1985, underwent a partial guestroom and meeting space renovation in 2008. The hotel is reportedly scheduled to undergo a comprehensive renovation of the guestrooms and public areas in late 2013. This hotel benefits from its popular Hilton brand affiliation and its location proximate to the Yamato Road corridor; however, it is disadvantaged somewhat by its lack of recent, extensive renovations. Overall, the property appeared to be in good condition. Its accessibility is inferior to that of the subject site, and its visibility is inferior to the expected visibility of the Proposed Dual-Branded Hotels at Florida Atlantic University.
Embassy Suites Boca Raton 661 Northwest 53rd Street Boca Raton, FL
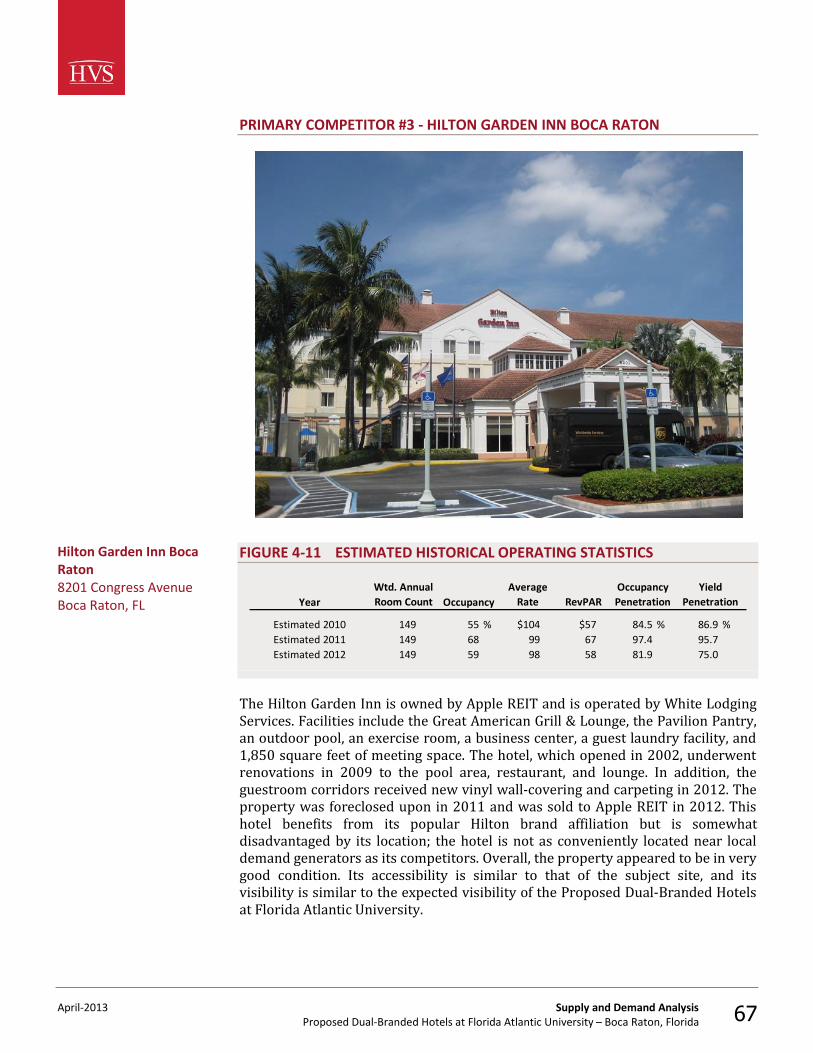
April-2013 Supply and Demand Analysis Proposed Dual-Branded Hotels at Florida Atlantic University – Boca Raton, Florida 67
PRIMARY COMPETITOR #3 - HILTON GARDEN INN BOCA RATON
FIGURE 4-11 ESTIMATED HISTORICAL OPERATING STATISTICS
YearWtd. Annual Room Count Occupancy
Average Rate RevPAR
Occupancy Penetration
Yield Penetration
Estimated 2010 149 55 % $104 $57 84.5 % 86.9 %Estimated 2011 149 68 99 67 97.4 95.7Estimated 2012 149 59 98 58 81.9 75.0
The Hilton Garden Inn is owned by Apple REIT and is operated by White Lodging Services. Facilities include the Great American Grill & Lounge, the Pavilion Pantry, an outdoor pool, an exercise room, a business center, a guest laundry facility, and 1,850 square feet of meeting space. The hotel, which opened in 2002, underwent renovations in 2009 to the pool area, restaurant, and lounge. In addition, the guestroom corridors received new vinyl wall-covering and carpeting in 2012. The property was foreclosed upon in 2011 and was sold to Apple REIT in 2012. This hotel benefits from its popular Hilton brand affiliation but is somewhat disadvantaged by its location; the hotel is not as conveniently located near local demand generators as its competitors. Overall, the property appeared to be in very good condition. Its accessibility is similar to that of the subject site, and its visibility is similar to the expected visibility of the Proposed Dual-Branded Hotels at Florida Atlantic University.
Hilton Garden Inn Boca Raton 8201 Congress Avenue Boca Raton, FL
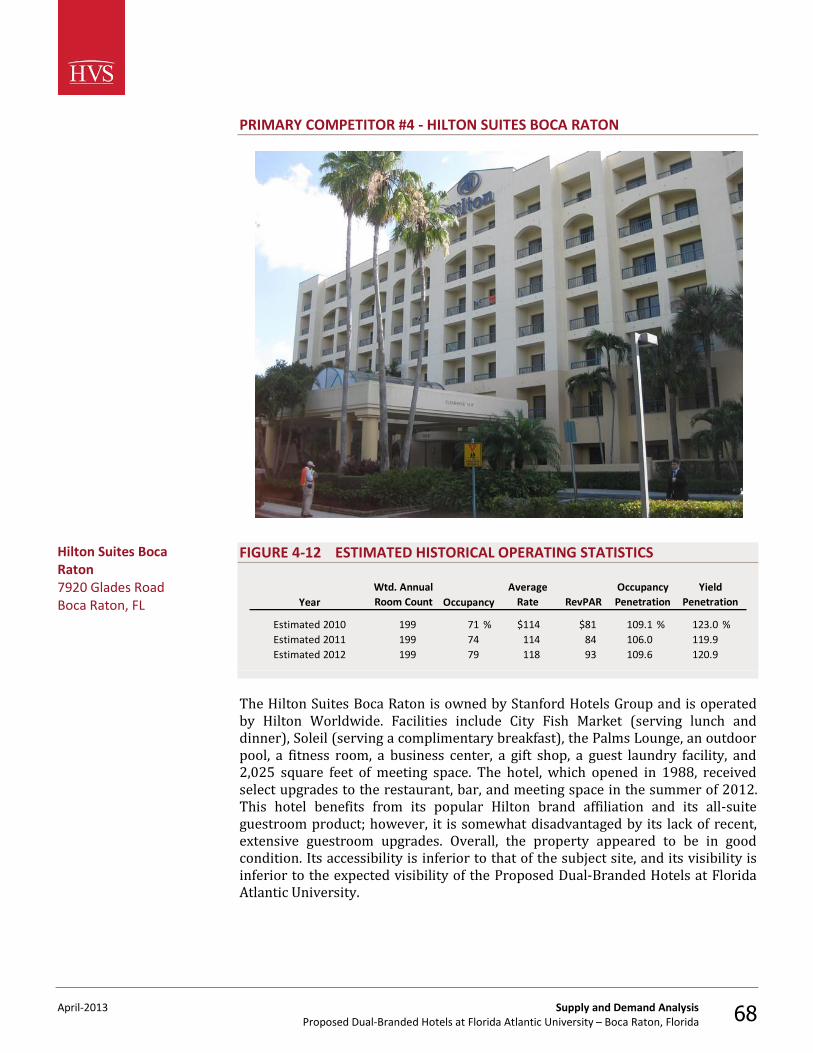
April-2013 Supply and Demand Analysis Proposed Dual-Branded Hotels at Florida Atlantic University – Boca Raton, Florida 68
PRIMARY COMPETITOR #4 - HILTON SUITES BOCA RATON
FIGURE 4-12 ESTIMATED HISTORICAL OPERATING STATISTICS
YearWtd. Annual Room Count Occupancy
Average Rate RevPAR
Occupancy Penetration
Yield Penetration
Estimated 2010 199 71 % $114 $81 109.1 % 123.0 %Estimated 2011 199 74 114 84 106.0 119.9Estimated 2012 199 79 118 93 109.6 120.9
The Hilton Suites Boca Raton is owned by Stanford Hotels Group and is operated by Hilton Worldwide. Facilities include City Fish Market (serving lunch and dinner), Soleil (serving a complimentary breakfast), the Palms Lounge, an outdoor pool, a fitness room, a business center, a gift shop, a guest laundry facility, and 2,025 square feet of meeting space. The hotel, which opened in 1988, received select upgrades to the restaurant, bar, and meeting space in the summer of 2012. This hotel benefits from its popular Hilton brand affiliation and its all-suite guestroom product; however, it is somewhat disadvantaged by its lack of recent, extensive guestroom upgrades. Overall, the property appeared to be in good condition. Its accessibility is inferior to that of the subject site, and its visibility is inferior to the expected visibility of the Proposed Dual-Branded Hotels at Florida Atlantic University.
Hilton Suites Boca Raton 7920 Glades Road Boca Raton, FL
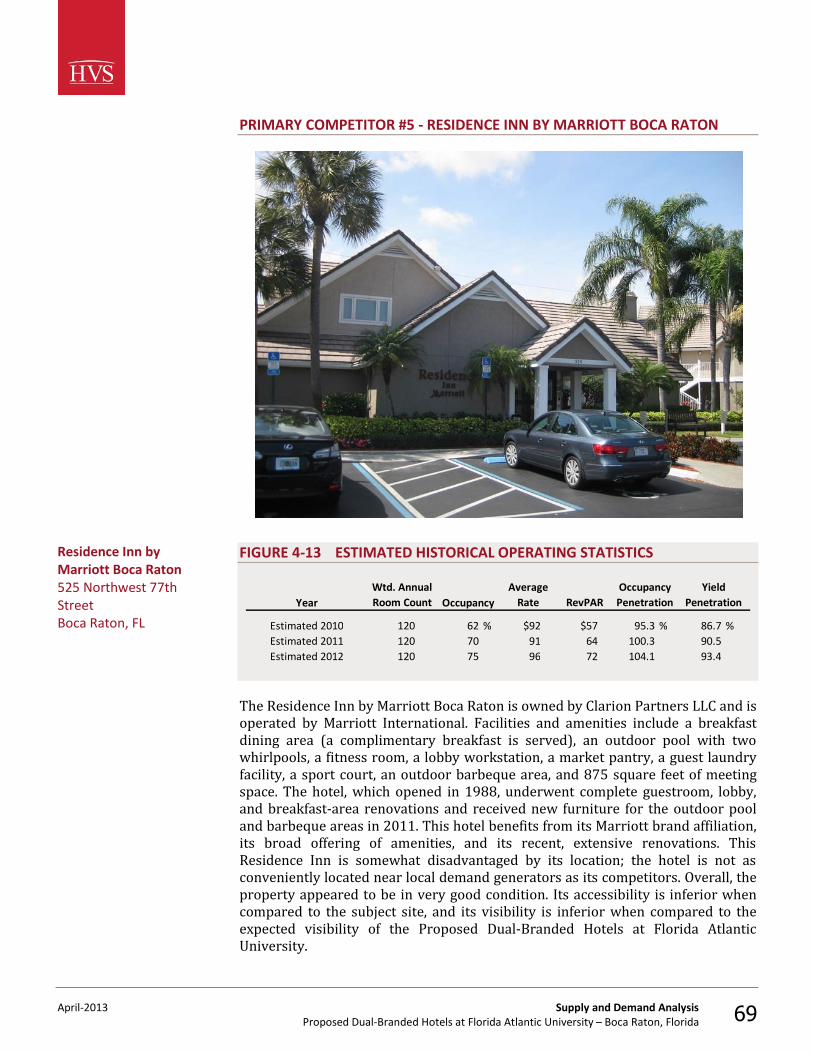
April-2013 Supply and Demand Analysis Proposed Dual-Branded Hotels at Florida Atlantic University – Boca Raton, Florida 69
PRIMARY COMPETITOR #5 - RESIDENCE INN BY MARRIOTT BOCA RATON
FIGURE 4-13 ESTIMATED HISTORICAL OPERATING STATISTICS
YearWtd. Annual Room Count Occupancy
Average Rate RevPAR
Occupancy Penetration
Yield Penetration
Estimated 2010 120 62 % $92 $57 95.3 % 86.7 %Estimated 2011 120 70 91 64 100.3 90.5Estimated 2012 120 75 96 72 104.1 93.4
The Residence Inn by Marriott Boca Raton is owned by Clarion Partners LLC and is operated by Marriott International. Facilities and amenities include a breakfast dining area (a complimentary breakfast is served), an outdoor pool with two whirlpools, a fitness room, a lobby workstation, a market pantry, a guest laundry facility, a sport court, an outdoor barbeque area, and 875 square feet of meeting space. The hotel, which opened in 1988, underwent complete guestroom, lobby, and breakfast-area renovations and received new furniture for the outdoor pool and barbeque areas in 2011. This hotel benefits from its Marriott brand affiliation, its broad offering of amenities, and its recent, extensive renovations. This Residence Inn is somewhat disadvantaged by its location; the hotel is not as conveniently located near local demand generators as its competitors. Overall, the property appeared to be in very good condition. Its accessibility is inferior when compared to the subject site, and its visibility is inferior when compared to the expected visibility of the Proposed Dual-Branded Hotels at Florida Atlantic University.
Residence Inn by Marriott Boca Raton 525 Northwest 77th Street Boca Raton, FL
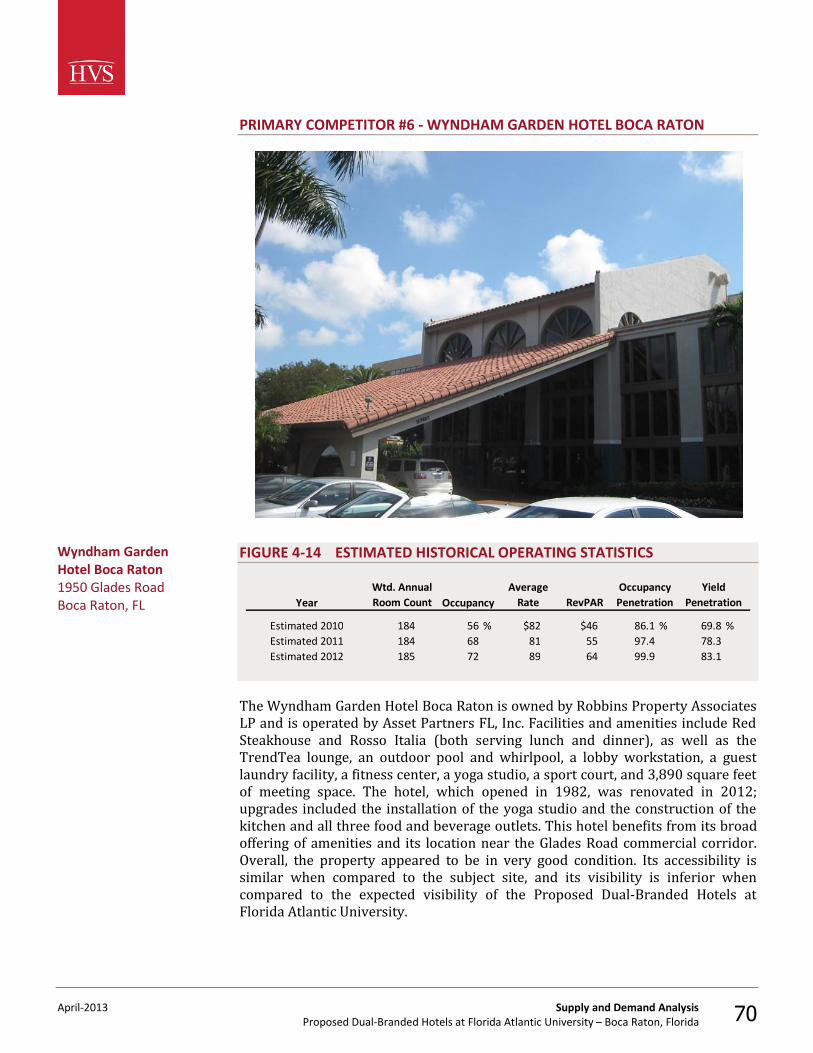
April-2013 Supply and Demand Analysis Proposed Dual-Branded Hotels at Florida Atlantic University – Boca Raton, Florida 70
PRIMARY COMPETITOR #6 - WYNDHAM GARDEN HOTEL BOCA RATON
FIGURE 4-14 ESTIMATED HISTORICAL OPERATING STATISTICS
YearWtd. Annual Room Count Occupancy
Average Rate RevPAR
Occupancy Penetration
Yield Penetration
Estimated 2010 184 56 % $82 $46 86.1 % 69.8 %Estimated 2011 184 68 81 55 97.4 78.3Estimated 2012 185 72 89 64 99.9 83.1
The Wyndham Garden Hotel Boca Raton is owned by Robbins Property Associates LP and is operated by Asset Partners FL, Inc. Facilities and amenities include Red Steakhouse and Rosso Italia (both serving lunch and dinner), as well as the TrendTea lounge, an outdoor pool and whirlpool, a lobby workstation, a guest laundry facility, a fitness center, a yoga studio, a sport court, and 3,890 square feet of meeting space. The hotel, which opened in 1982, was renovated in 2012; upgrades included the installation of the yoga studio and the construction of the kitchen and all three food and beverage outlets. This hotel benefits from its broad offering of amenities and its location near the Glades Road commercial corridor. Overall, the property appeared to be in very good condition. Its accessibility is similar when compared to the subject site, and its visibility is inferior when compared to the expected visibility of the Proposed Dual-Branded Hotels at Florida Atlantic University.
Wyndham Garden Hotel Boca Raton 1950 Glades Road Boca Raton, FL
April-2013 Supply and Demand Analysis Proposed Dual-Branded Hotels at Florida Atlantic University – Boca Raton, Florida 71
We have also reviewed other area lodging facilities to determine whether any may compete with the proposed subject property on a secondary basis. The room count of each secondary competitor has been weighted based on its assumed degree of competitiveness the future with the proposed subject property. By assigning degrees of competitiveness, we can assess how the proposed subject property and its future competitors may react to various changes in the market, including new supply, changes to demand generators, and renovations or franchise changes of existing supply. The following table sets forth the pertinent operating characteristics of the secondary competitors.
Secondary Competitors
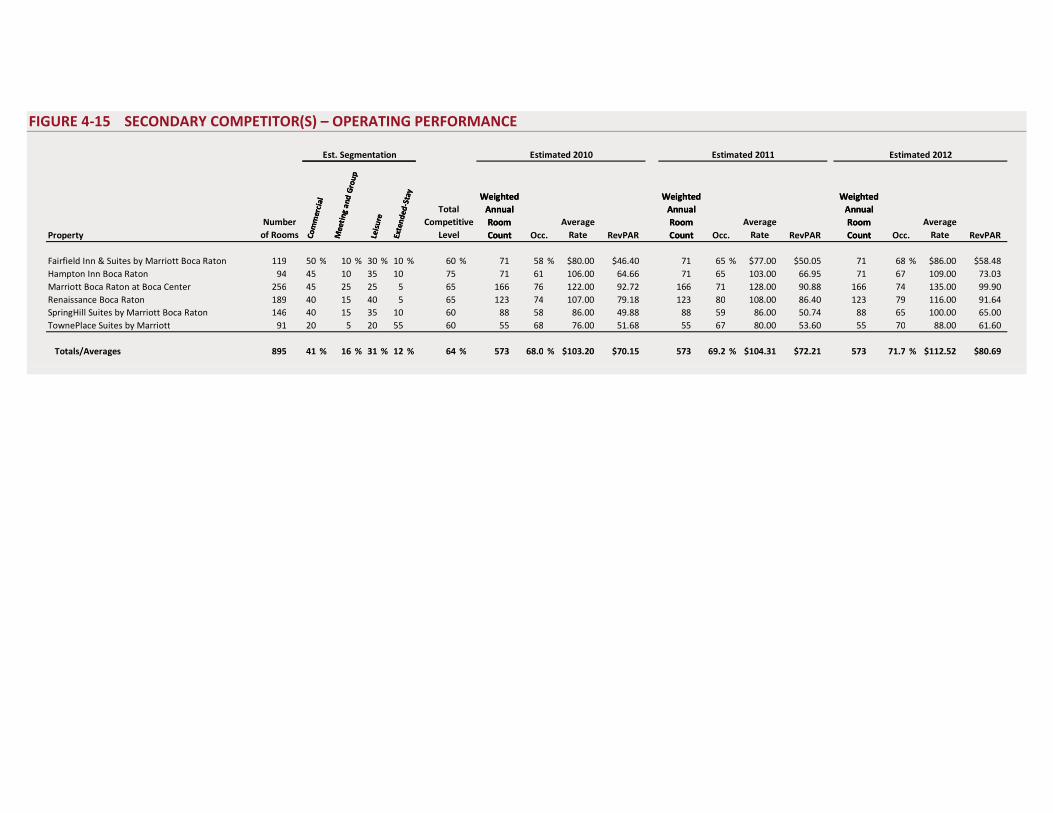
FIGURE 4-15 SECONDARY COMPETITOR(S) – OPERATING PERFORMANCE
Est. Segmentation Estimated 2010 Estimated 2011 Estimated 2012
Weighted Annual Room CountEx
tend
ed-S
tay
Com
mer
cial
Mee
ting
and
Gro
up
Leis
ure
Weighted Annual Room Count
Weighted Annual Room Count
Total
PropertyNumber
of RoomsCompetitive
Level Occ.Average
Rate RevPAR Occ.Average
Rate RevPAR Occ.Average
Rate RevPAR
Fairfield Inn & Suites by Marriott Boca Raton 119 50 % 10 % 30 % 10 % 60 % 71 58 % $80.00 $46.40 71 65 % $77.00 $50.05 71 68 % $86.00 $58.48Hampton Inn Boca Raton 94 45 10 35 10 75 71 61 106.00 64.66 71 65 103.00 66.95 71 67 109.00 73.03Marriott Boca Raton at Boca Center 256 45 25 25 5 65 166 76 122.00 92.72 166 71 128.00 90.88 166 74 135.00 99.90Renaissance Boca Raton 189 40 15 40 5 65 123 74 107.00 79.18 123 80 108.00 86.40 123 79 116.00 91.64SpringHill Suites by Marriott Boca Raton 146 40 15 35 10 60 88 58 86.00 49.88 88 59 86.00 50.74 88 65 100.00 65.00TownePlace Suites by Marriott 91 20 5 20 55 60 55 68 76.00 51.68 55 67 80.00 53.60 55 70 88.00 61.60
Totals/Averages 895 41 % 16 % 31 % 12 % 64 % 573 68.0 % $103.20 $70.15 573 69.2 % $104.31 $72.21 573 71.7 % $112.52 $80.69
Weighted Annual Room CountEx
tend
ed-S
tay
Com
mer
cial
Mee
ting
and
Gro
up
Leis
ure
Weighted Annual Room Count
Weighted Annual Room Count
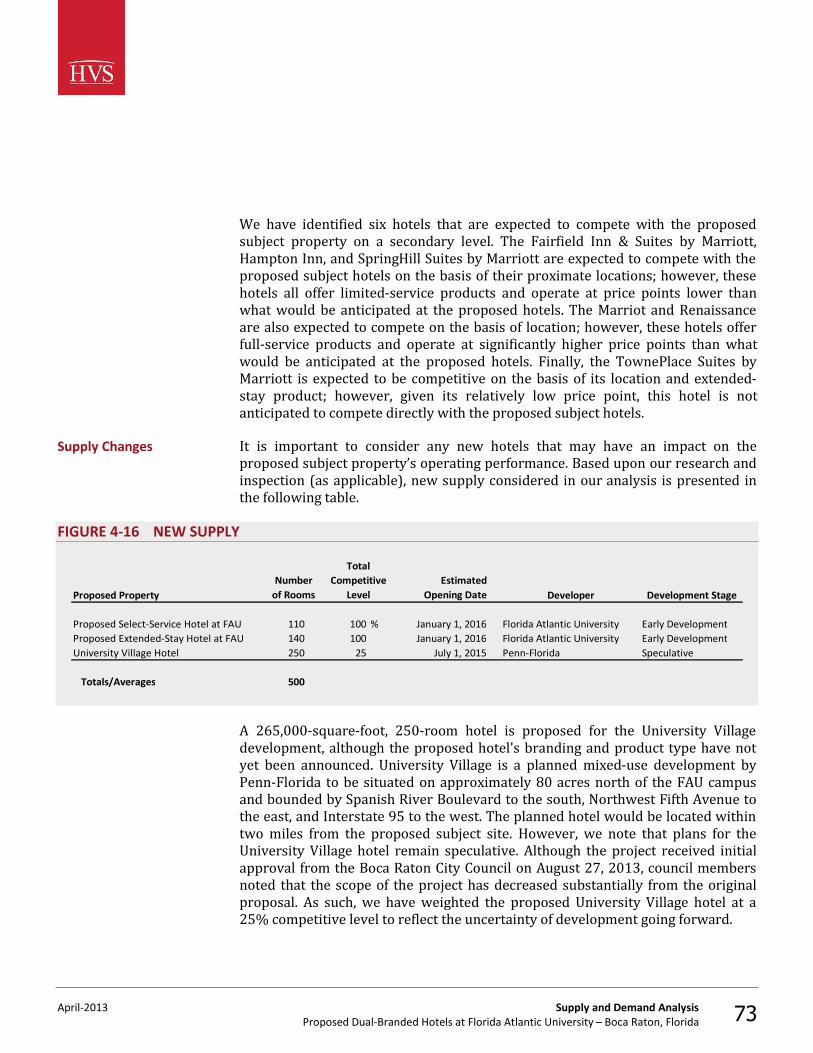
April-2013 Supply and Demand Analysis Proposed Dual-Branded Hotels at Florida Atlantic University – Boca Raton, Florida 73
We have identified six hotels that are expected to compete with the proposed subject property on a secondary level. The Fairfield Inn & Suites by Marriott, Hampton Inn, and SpringHill Suites by Marriott are expected to compete with the proposed subject hotels on the basis of their proximate locations; however, these hotels all offer limited-service products and operate at price points lower than what would be anticipated at the proposed hotels. The Marriot and Renaissance are also expected to compete on the basis of location; however, these hotels offer full-service products and operate at significantly higher price points than what would be anticipated at the proposed hotels. Finally, the TownePlace Suites by Marriott is expected to be competitive on the basis of its location and extended-stay product; however, given its relatively low price point, this hotel is not anticipated to compete directly with the proposed subject hotels. It is important to consider any new hotels that may have an impact on the proposed subject property’s operating performance. Based upon our research and inspection (as applicable), new supply considered in our analysis is presented in the following table.
FIGURE 4-16 NEW SUPPLY
Total
Proposed PropertyNumber
of Rooms Competitive
LevelEstimated
Opening Date Developer Development Stage
Proposed Select-Service Hotel at FAU 110 100 % January 1, 2016 Florida Atlantic University Early DevelopmentProposed Extended-Stay Hotel at FAU 140 100 January 1, 2016 Florida Atlantic University Early DevelopmentUniversity Village Hotel 250 25 July 1, 2015 Penn-Florida Speculative
Totals/Averages 500
A 265,000-square-foot, 250-room hotel is proposed for the University Village development, although the proposed hotel's branding and product type have not yet been announced. University Village is a planned mixed-use development by Penn-Florida to be situated on approximately 80 acres north of the FAU campus and bounded by Spanish River Boulevard to the south, Northwest Fifth Avenue to the east, and Interstate 95 to the west. The planned hotel would be located within two miles from the proposed subject site. However, we note that plans for the University Village hotel remain speculative. Although the project received initial approval from the Boca Raton City Council on August 27, 2013, council members noted that the scope of the project has decreased substantially from the original proposal. As such, we have weighted the proposed University Village hotel at a 25% competitive level to reflect the uncertainty of development going forward.
Supply Changes
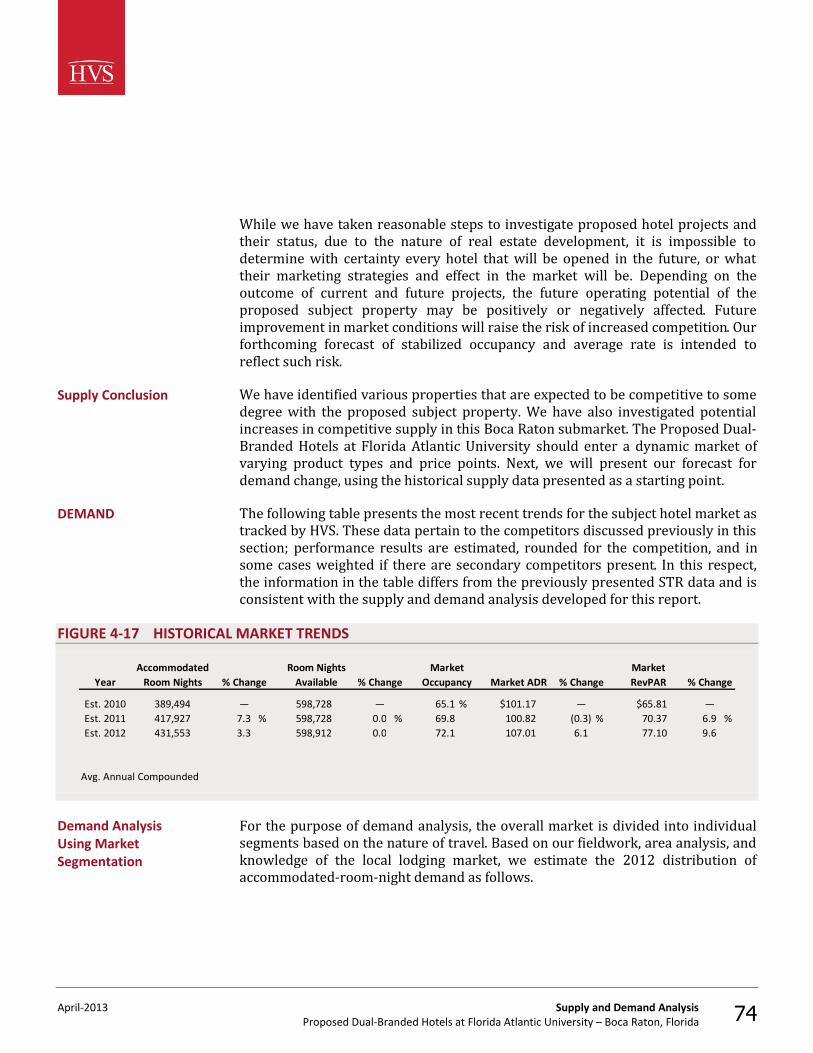
April-2013 Supply and Demand Analysis Proposed Dual-Branded Hotels at Florida Atlantic University – Boca Raton, Florida 74
While we have taken reasonable steps to investigate proposed hotel projects and their status, due to the nature of real estate development, it is impossible to determine with certainty every hotel that will be opened in the future, or what their marketing strategies and effect in the market will be. Depending on the outcome of current and future projects, the future operating potential of the proposed subject property may be positively or negatively affected. Future improvement in market conditions will raise the risk of increased competition. Our forthcoming forecast of stabilized occupancy and average rate is intended to reflect such risk. We have identified various properties that are expected to be competitive to some degree with the proposed subject property. We have also investigated potential increases in competitive supply in this Boca Raton submarket. The Proposed Dual-Branded Hotels at Florida Atlantic University should enter a dynamic market of varying product types and price points. Next, we will present our forecast for demand change, using the historical supply data presented as a starting point. The following table presents the most recent trends for the subject hotel market as tracked by HVS. These data pertain to the competitors discussed previously in this section; performance results are estimated, rounded for the competition, and in some cases weighted if there are secondary competitors present. In this respect, the information in the table differs from the previously presented STR data and is consistent with the supply and demand analysis developed for this report.
FIGURE 4-17 HISTORICAL MARKET TRENDS
Year
Est. 2010 389,494 — 598,728 — 65.1 % $101.17 — $65.81 — Est. 2011 417,927 7.3 % 598,728 0.0 % 69.8 100.82 (0.3) % 70.37 6.9 %Est. 2012 431,553 3.3 598,912 0.0 72.1 107.01 6.1 77.10 9.6
Avg. Annual Compounded
Accommodated Room Nights % Change
Room Nights Available
Market RevPAR % Change% Change% Change
Market Occupancy Market ADR
For the purpose of demand analysis, the overall market is divided into individual segments based on the nature of travel. Based on our fieldwork, area analysis, and knowledge of the local lodging market, we estimate the 2012 distribution of accommodated-room-night demand as follows.
Supply Conclusion
DEMAND
Demand Analysis Using Market Segmentation
April-2013 Supply and Demand Analysis Proposed Dual-Branded Hotels at Florida Atlantic University – Boca Raton, Florida 75
FIGURE 4-18 ACCOMMODATED ROOM NIGHT DEMAND
Marketwide
Market Segment
Commercial 181,484 42 %Meeting and Group 74,293 17Leisure 103,982 24Extended-Stay 71,794 17
Total 431,553 100 %
Accommodated Demand
Percentage of Total
The market’s demand mix comprises commercial demand, with this segment representing roughly 42% of the accommodated room nights in this Boca Raton submarket. The meeting and group comprises 17% of the total, with the final portions leisure and extended-stay in nature (24% and 17%, respectively). Using the distribution of accommodated hotel demand as a starting point, we will analyze the characteristics of each market segment in an effort to determine future trends in room-night demand. Commercial demand consists mainly of individual businesspeople passing through the subject market or visiting area businesses, in addition to high-volume corporate accounts generated by local firms. Brand loyalty (particularly frequent-traveler programs), as well as location and convenience with respect to businesses and amenities, influence lodging choices in this segment. Companies typically designate hotels as “preferred” accommodations in return for more favorable rates, which are discounted in proportion to the number of room nights produced by a commercial client. Commercial demand is strongest Monday through Thursday nights, declines significantly on Friday and Saturday, and increases somewhat on Sunday night. It is relatively constant throughout the year, with marginal declines in late December and during other holiday periods. A major factor considered in the development of our growth rates is the presence of major corporations in the Boca Raton area, including Office Depot, The ADT Corporation, Bluegreen Corporation, Tenet Healthcare Corporation, Tyco Integrated Security (ADT), and The GEO Group, Inc. Other important demand generators in the market include Florida Atlantic University, Lynn University, and Boca Ration Regional Hospital. These corporate, education, and healthcare entities provide area hotels with a significant level of year-round base demand, sustaining local occupancy levels outside of the market's traditional peak season. Expansions at FAU and Boca Raton Regional Hospital have created increased commercial
Commercial Segment
April-2013 Supply and Demand Analysis Proposed Dual-Branded Hotels at Florida Atlantic University – Boca Raton, Florida 76
demand for the market, while demand from major corporations continues to grow in conjunction with the overall economic recovery. The future of demand generated by Office Depot, a major anchor corporation for the local economy, is currently in question as the company decides on a headquarters location following the announcement of its planned merger with OfficeMax; however, Boca Raton remains an attractive location for major corporate operations, and other entities should continue to bolster commercial demand. As such, we expect modest growth to occur in this segment through the stabilized year. Considering both current and historical trends, we project demand change rates of 3.0% in 2013, 2.0% in 2014, and 1.0% in 2015. After these first three projection years, we have forecast demand change rates of 0.5% in 2016 and 0.0% in 2017. The meeting and group market includes meetings, seminars, conventions, trade association shows, and similar gatherings of ten or more people. Peak convention demand typically occurs in the spring and fall. Although there are numerous classifications within the meeting and group segment, the primary categories considered in this analysis are corporate groups, associations, and SMERFE (social, military, ethnic, religious, fraternal, and educational) groups. Corporate groups typically meet during the business week, most commonly in the spring and fall months. These groups tend to be the most profitable for hotels, as they typically pay higher rates and usually generate ancillary revenues including food and beverage and/or banquet revenue. SMERFE groups are typically price-sensitive and tend to meet on weekends and during the summer months or holiday season, when greater discounts are usually available; these groups generate limited ancillary revenues. Association demand is generally divided on a geographical basis, with national, regional, and state associations representing the most common sources. Professional associations and/or those supported by members' employers often meet on weekdays, while other associations prefer to hold events on weekends. The profile and revenue potential of associations varies depending on the group and the purpose of their meeting or event. Meeting and group demand in the Boca Raton market is highly driven by the local corporate entities in the area. As such, the relatively high concentration of major headquarter operations is expected to continue to bolster group room-block needs locally. Furthermore, recruiting and training activities associated with area businesses and entities, such as Office Depot and The ADT Corporation, should intensify as economic conditions continue to improve. A smaller portion of meeting and group demand in the market is associated with SMERFE-related sources; when combined with demand generated by FAU and Lynn University, these sources provide substantial off-peak base demand, particularly on weekends. A measurable percentage of the market make-up comprises first-class, suburban residential neighborhoods; as such, the area is also attractive for weddings and reunions. We expect modest growth to occur in this segment in the
Meeting and Group Segment
April-2013 Supply and Demand Analysis Proposed Dual-Branded Hotels at Florida Atlantic University – Boca Raton, Florida 77
near term as group activity continues to strengthen in line with the economic recovery. Considering both current and historical trends, we project demand change rates of 1.5% in 2013, 0.5% in 2014, and 0.0% in 2015. After these first three projection years, we have forecast demand change rates of 0.0% in 2016 and 0.0% in 2017. Leisure demand consists of individuals and families spending time in an area or passing through en route to other destinations. Travel purposes include sightseeing, recreation, or visiting friends and relatives. Leisure demand also includes room nights booked through Internet sites such as Expedia, hotels.com, and Priceline; however, leisure may not be the purpose of the stay. This demand may also include business travelers and group and convention attendees who use these channels to take advantage of any discounts that may be available on these sites. Leisure demand is strongest Friday and Saturday nights and all week during holiday periods and the summer months. These peak periods represent the inverse of commercial visitation trends, underscoring the stabilizing effect of capturing weekend and summer tourist travel. Future leisure demand is related to the overall economic health of the region and the nation. Trends showing changes in state and regional unemployment and disposable personal income correlate strongly with leisure travel levels. Leisure demand in the area is highly seasonal and is driven largely by the area's tropical setting, warm weather, and Atlantic coast beaches. Long-term stays by northern "snowbirds" during the first quarter of the year are supplemented by a high level of short-term tourism to the area, resulting in a near sellout of the local hotel market from December through April. Regional retail and entertainment venues, including those located at Mizner Park, are popular demand generators during off-peak holiday and back-to-school periods. Additionally, events such as football games held at the new FAU stadium and other events held on campus, such as the presidential debate held at Lynn University in October of 2012, provide transient leisure demand to the market. The area is also convenient to attractions in nearby Miami and the Florida Keys. In recent years, the recovery of leisure travel, particularly to traditional vacation destinations such as South Florida, and the relative lack of disruptions caused by major hurricanes have worked in concert to draw a substantial number of visitors to the Boca Raton area. As such, we expect continued, if somewhat more modest, demand growth in the leisure segment in the near term. Considering both current and historical trends, we project demand change rates of 1.5% in 2013, 0.5% in 2014, and 0.0% in 2015. After these first three projection years, we have forecast demand change rates of 0.0% in 2016 and 0.0% in 2017.
Leisure Segment
April-2013 Supply and Demand Analysis Proposed Dual-Branded Hotels at Florida Atlantic University – Boca Raton, Florida 78
Extended-stay demand consists of individuals who require accommodations for more than five nights; typically, the length of stay ranges from ten to fourteen nights, but can stretch to a month or more. The three principal categories of extended-stay demand are business-related (typically associated with long-term projects), family-oriented, and relocation demand. Extended-stay patrons usually prefer hotels located near shopping centers, restaurants, entertainment venues, and service-retail uses such as grocery stores, dry cleaners, and fueling stations. Extended-stay demand tends to trend in line with an area’s corporate expansion and/or population growth; commercial growth has a direct correlation on longer-term training activities that may be occurring in the area, while changes in population typically support related relocation demand. Large-scale construction projects, prevalent in growing metropolitan areas, also generate significant levels of extended-stay demand. Extended-stay demand in this market is generated primarily by the corporate operations present in the Boca Raton area. Easy access to restaurants, shops, and entertainment venues is sought after by travelers in the area on longer-term stays, and these establishments are prevalent throughout the market; the proximity to local access routes, major interstates, and South Florida's beaches and tourist attractions make the area a preferred choice for long-term stays. Additional demand generators in the education and healthcare sectors, such as the FAU and Boca Raton Regional Hospital, further bolster extended-stay demand in the market, with long-term stays by visiting families, university officials, patients, and healthcare professionals. Expansions on the FAU campus and at Boca Raton Regional Hospital, including the construction of the Marcus Neuroscience Institute, should increase the need for extended-stay lodging facilities as new types of long-term demand are added to the existing base. As such, we expect modest growth in this segment through the stabilized year. Considering these historical trends, we project demand change rates of 2.5% in 2013, 1.5% in 2014, and 1.0% in 2015. After these first three projection years, we have forecast demand change rates of 0.5% in 2016 and 0.0% in 2017. The purpose of segmenting the lodging market is to define each major type of demand, identify customer characteristics, and estimate future growth trends. Starting with an analysis of the local area, four segments were defined as representing the subject property’s lodging market. Various types of economic and demographic data were then evaluated to determine their propensity to reflect changes in hotel demand. Based on this procedure, we forecast the following average annual compounded market-segment growth rates.
Extended-Stay Segment
Conclusion
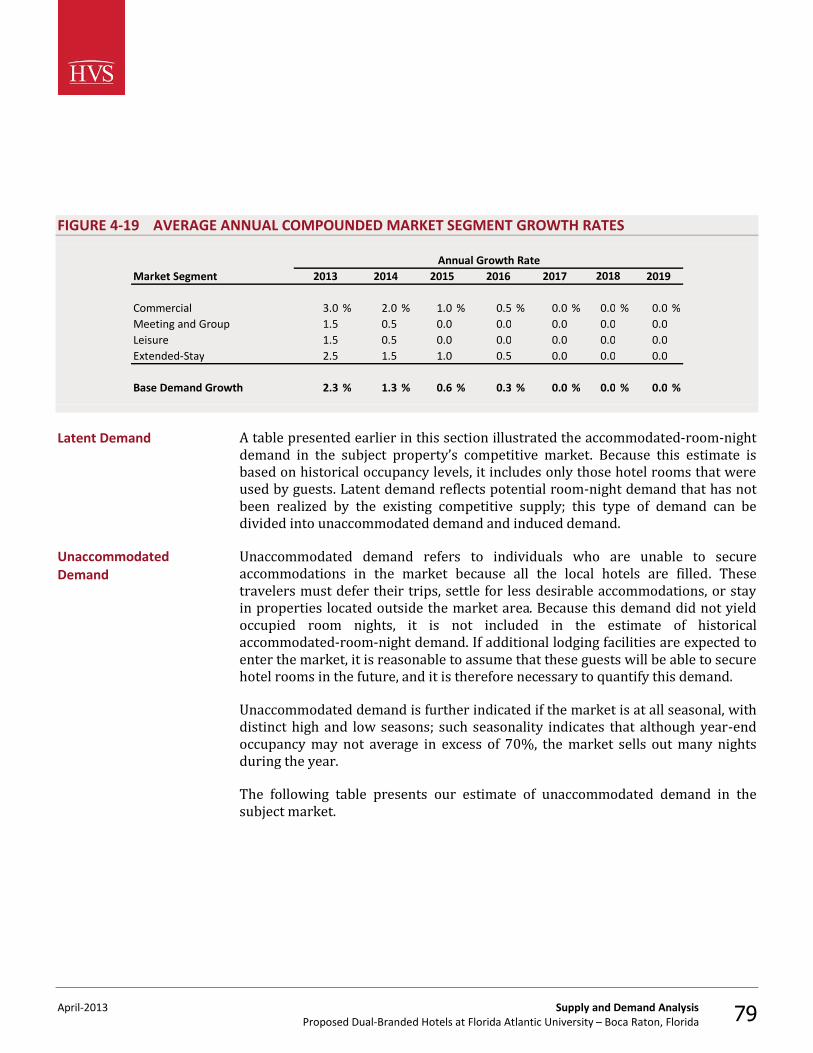
April-2013 Supply and Demand Analysis Proposed Dual-Branded Hotels at Florida Atlantic University – Boca Raton, Florida 79
FIGURE 4-19 AVERAGE ANNUAL COMPOUNDED MARKET SEGMENT GROWTH RATES
Annual Growth RateMarket Segment
Commercial 3.0 % 2.0 % 1.0 % 0.5 % 0.0 % 0.0 % 0.0 %Meeting and Group 1.5 0.5 0.0 0.0 0.0 0.0 0.0Leisure 1.5 0.5 0.0 0.0 0.0 0.0 0.0Extended-Stay 2.5 1.5 1.0 0.5 0.0 0.0 0.0
Base Demand Growth 2.3 % 1.3 % 0.6 % 0.3 % 0.0 % 0.0 % 0.0 %
2016 20182017 20192013 2014 2015
A table presented earlier in this section illustrated the accommodated-room-night demand in the subject property’s competitive market. Because this estimate is based on historical occupancy levels, it includes only those hotel rooms that were used by guests. Latent demand reflects potential room-night demand that has not been realized by the existing competitive supply; this type of demand can be divided into unaccommodated demand and induced demand. Unaccommodated demand refers to individuals who are unable to secure accommodations in the market because all the local hotels are filled. These travelers must defer their trips, settle for less desirable accommodations, or stay in properties located outside the market area. Because this demand did not yield occupied room nights, it is not included in the estimate of historical accommodated-room-night demand. If additional lodging facilities are expected to enter the market, it is reasonable to assume that these guests will be able to secure hotel rooms in the future, and it is therefore necessary to quantify this demand. Unaccommodated demand is further indicated if the market is at all seasonal, with distinct high and low seasons; such seasonality indicates that although year-end occupancy may not average in excess of 70%, the market sells out many nights during the year. The following table presents our estimate of unaccommodated demand in the subject market.
Latent Demand
Unaccommodated Demand
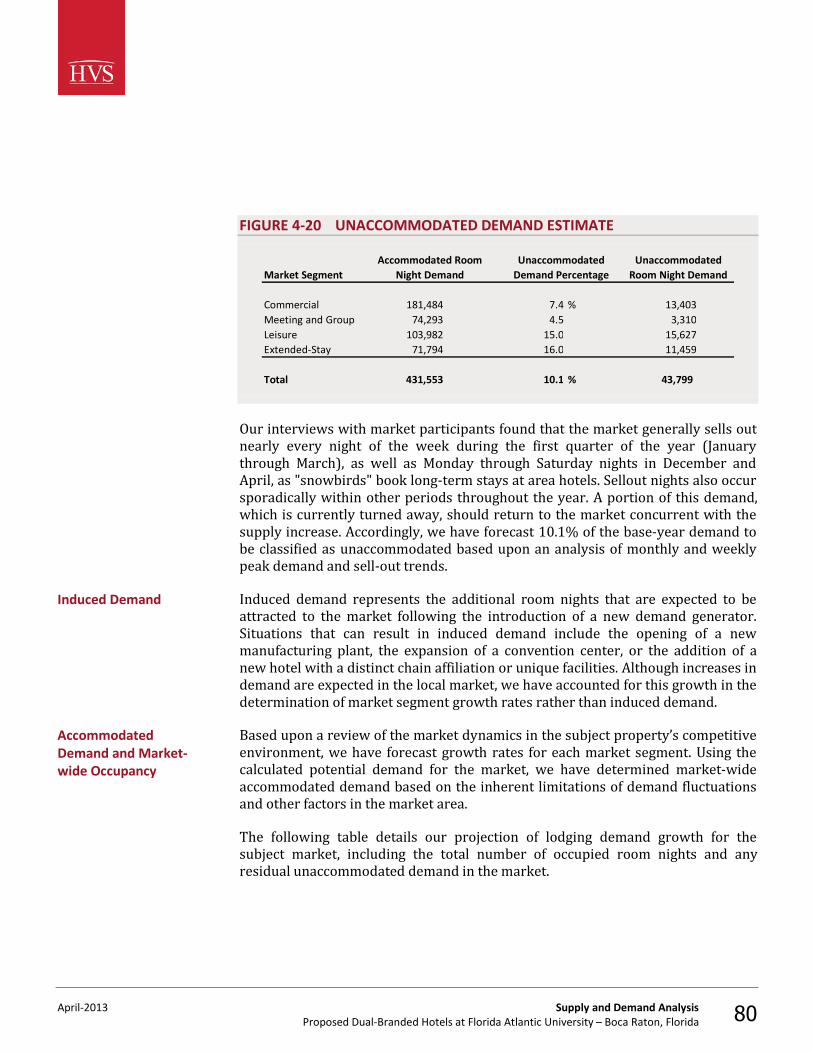
April-2013 Supply and Demand Analysis Proposed Dual-Branded Hotels at Florida Atlantic University – Boca Raton, Florida 80
FIGURE 4-20 UNACCOMMODATED DEMAND ESTIMATE
Market Segment
Commercial 181,484 7.4 % 13,403Meeting and Group 74,293 4.5 3,310Leisure 103,982 15.0 15,627Extended-Stay 71,794 16.0 11,459
Total 431,553 10.1 % 43,799
Accommodated Room Night Demand
Unaccommodated Demand Percentage
Unaccommodated Room Night Demand
Our interviews with market participants found that the market generally sells out nearly every night of the week during the first quarter of the year (January through March), as well as Monday through Saturday nights in December and April, as "snowbirds" book long-term stays at area hotels. Sellout nights also occur sporadically within other periods throughout the year. A portion of this demand, which is currently turned away, should return to the market concurrent with the supply increase. Accordingly, we have forecast 10.1% of the base-year demand to be classified as unaccommodated based upon an analysis of monthly and weekly peak demand and sell-out trends. Induced demand represents the additional room nights that are expected to be attracted to the market following the introduction of a new demand generator. Situations that can result in induced demand include the opening of a new manufacturing plant, the expansion of a convention center, or the addition of a new hotel with a distinct chain affiliation or unique facilities. Although increases in demand are expected in the local market, we have accounted for this growth in the determination of market segment growth rates rather than induced demand. Based upon a review of the market dynamics in the subject property’s competitive environment, we have forecast growth rates for each market segment. Using the calculated potential demand for the market, we have determined market-wide accommodated demand based on the inherent limitations of demand fluctuations and other factors in the market area. The following table details our projection of lodging demand growth for the subject market, including the total number of occupied room nights and any residual unaccommodated demand in the market.
Induced Demand
Accommodated Demand and Market-wide Occupancy
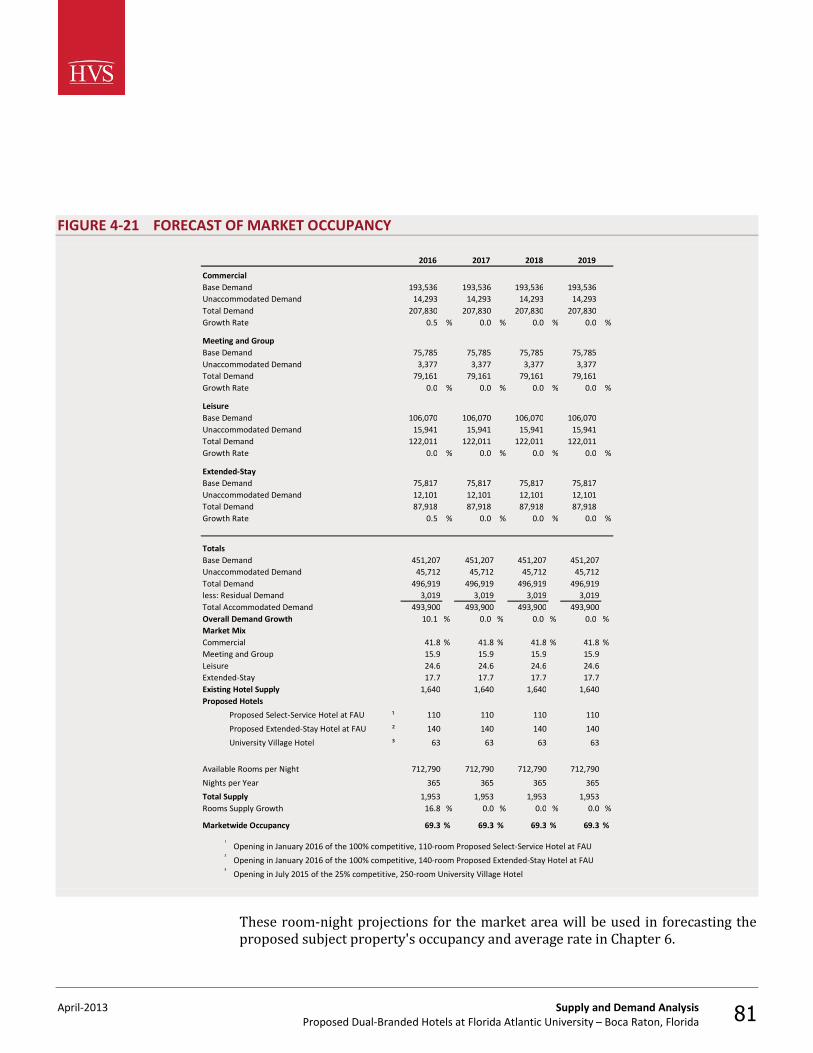
April-2013 Supply and Demand Analysis Proposed Dual-Branded Hotels at Florida Atlantic University – Boca Raton, Florida 81
FIGURE 4-21 FORECAST OF MARKET OCCUPANCY
193,536 193,536 193,536 193,536Unaccommodated Demand 14,293 14,293 14,293 14,293
207,830 207,830 207,830 207,830Growth Rate 0.5 % 0.0 % 0.0 % 0.0 %
75,785 75,785 75,785 75,7853,377 3,377 3,377 3,377
79,161 79,161 79,161 79,1610.0 % 0.0 % 0.0 % 0.0 %
106,070 106,070 106,070 106,07015,941 15,941 15,941 15,941
122,011 122,011 122,011 122,0110.0 % 0.0 % 0.0 % 0.0 %
75,817 75,817 75,817 75,817Unaccommodated Demand 12,101 12,101 12,101 12,101Total Demand 87,918 87,918 87,918 87,918Growth Rate 0.5 % 0.0 % 0.0 % 0.0 %
Base Demand 451,207 451,207 451,207 451,207Unaccommodated Demand 45,712 45,712 45,712 45,712Total Demand 496,919 496,919 496,919 496,919less: Residual Demand 3,019 3,019 3,019 3,019Total Accommodated Demand 493,900 493,900 493,900 493,900Overall Demand Growth 10.1 % 0.0 % 0.0 % 0.0 %Market Mix
41.8 % 41.8 % 41.8 % 41.8 %15.9 15.9 15.9 15.924.6 24.6 24.6 24.6
Extended-Stay 17.7 17.7 17.7 17.71,640 1,640 1,640 1,640
Proposed Select-Service Hotel at FAU ¹ 110 110 110 110
Proposed Extended-Stay Hotel at FAU ² 140 140 140 140
University Village Hotel ³ 63 63 63 63
Available Rooms per Night 712,790 712,790 712,790 712,790
Nights per Year 365 365 365 365
Total Supply 1,953 1,953 1,953 1,953Rooms Supply Growth 16.8 % 0.0 % 0.0 % 0.0 %
Marketwide Occupancy 69.3 % 69.3 % 69.3 % 69.3 %
¹ Opening in January 2016 of the 100% competitive, 110-room Proposed Select-Service Hotel at FAU² Opening in January 2016 of the 100% competitive, 140-room Proposed Extended-Stay Hotel at FAU³ Opening in July 2015 of the 25% competitive, 250-room University Village Hotel
Commercial
2016 2017 2018 2019
Base Demand
Growth Rate
Total Demand
Total Demand
Total Demand
Meeting and GroupBase DemandUnaccommodated Demand
Extended-Stay
Growth Rate
LeisureBase DemandUnaccommodated Demand
Totals
Base Demand
Proposed Hotels
CommercialMeeting and GroupLeisure
Existing Hotel Supply
These room-night projections for the market area will be used in forecasting the proposed subject property's occupancy and average rate in Chapter 6.
April-2013 Description of the Proposed Project Proposed Dual-Branded Hotels at Florida Atlantic University – Boca Raton, Florida 82
5. Description of the Proposed Project
The quality of a lodging facility's physical improvements has a direct influence on marketability, attainable occupancy, and average room rate. The design and functionality of the structure can also affect operating efficiency and overall profitability. This section investigates the subject property's proposed physical improvements and personal property in an effort to determine how they are expected to contribute to attainable cash flows. The Proposed Dual-Branded Hotels at Florida Atlantic University is expected to comprise two hotels, a select-service lodging facility containing 110 rentable units and a extended-stay lodging facility containing 140 rentable units. The proposed subject property is expected to open on January 1, 2016. The proposed subject property will be part of the Boca Raton Campus Master Plan of Florida Atlantic University (FAU). Originally adopted on September 15, 1995, the Boca Raton Campus Master Plan was updated on November 18, 2009 to include a number of planned facilities expected to aid in the University's planned transition to a traditional campus model, which is expected to transform FAU into a first-class public university and research institution. Founded in 1964, Florida Atlantic University was the first public university in southeast Florida. FAU now comprises a 700-acre main campus in Boca Raton and five satellite campuses throughout southeast Florida. The University offers 147 undergraduate and graduate degree programs across ten schools, including the Charles E. Schmidt College of Medicine, which opened in 2010; in the fall of 2012, FAU's enrollment reached a milestone, exceeding 30,000 students for the first time in the school's history. Additional developments since the adoption of the 2009 Master Plan have included the construction of a $70-million, 24,419-seat football stadium and the $121-million Innovation Village student apartment complex, both of which were completed in 2011, as well as the opening of the $46-million Parliament Hall housing complex in August of 2013. Future plans include the development of additional student housing buildings, classroom facilities, and sports complexes throughout the main campus. The proposed subject property is expected to be the first component of a larger mixed-use development that will occupy a portion of a vacant 42-acre parcel situated along Glades Road at the southeast corner of the Boca Raton campus. Based on information provided by the proposed subject property’s development representatives, the following table summarizes the facilities that are expected to be available at the proposed subject property.
Project Overview
Summary of the Facilities
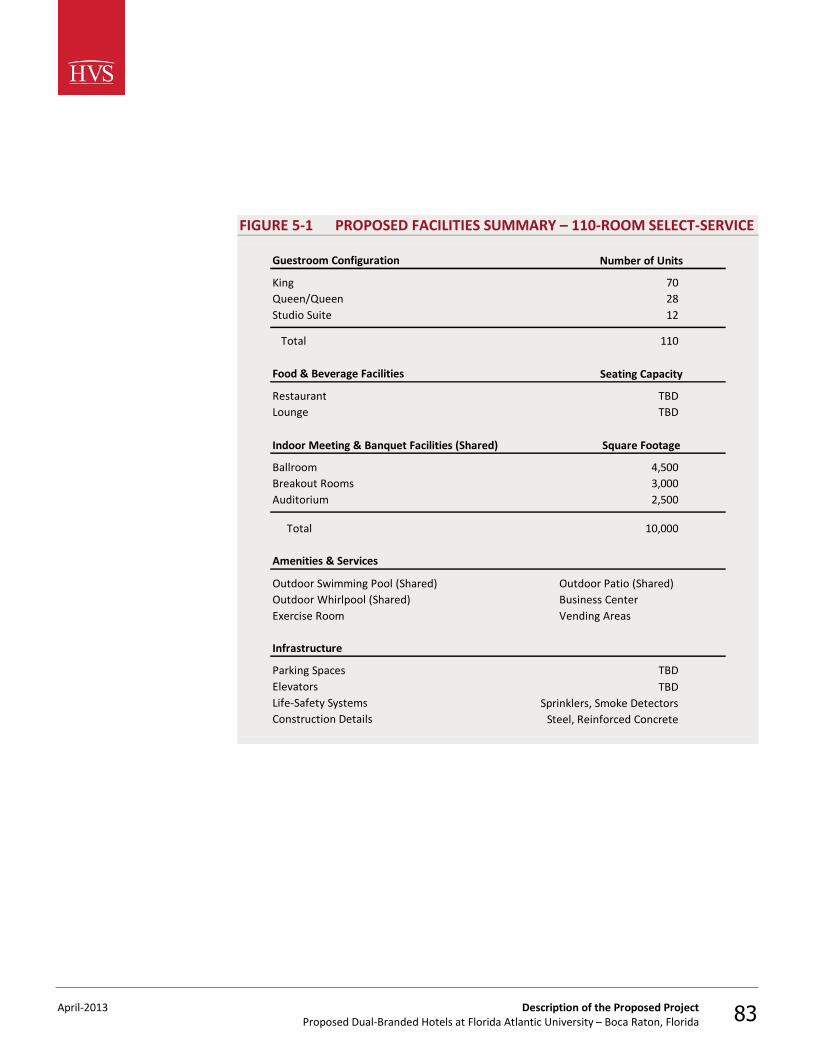
April-2013 Description of the Proposed Project Proposed Dual-Branded Hotels at Florida Atlantic University – Boca Raton, Florida 83
FIGURE 5-1 PROPOSED FACILITIES SUMMARY – 110-ROOM SELECT-SERVICE
Guestroom Configuration
King 70 Queen/Queen 28 Studio Suite 12
Total 110
Food & Beverage Facilities
Restaurant TBDLounge TBD
Ballroom 4,500 Breakout Rooms 3,000 Auditorium 2,500
Total 10,000
Amenities & Services
Infrastructure
Parking Spaces TBDElevatorsLife-Safety SystemsConstruction Details
Square Footage
Number of Units
Seating Capacity
Vending Areas
Outdoor Swimming Pool (Shared)
Exercise Room
Sprinklers, Smoke DetectorsSteel, Reinforced Concrete
TBD
Outdoor Patio (Shared)Business Center
Indoor Meeting & Banquet Facilities (Shared)
Outdoor Whirlpool (Shared)
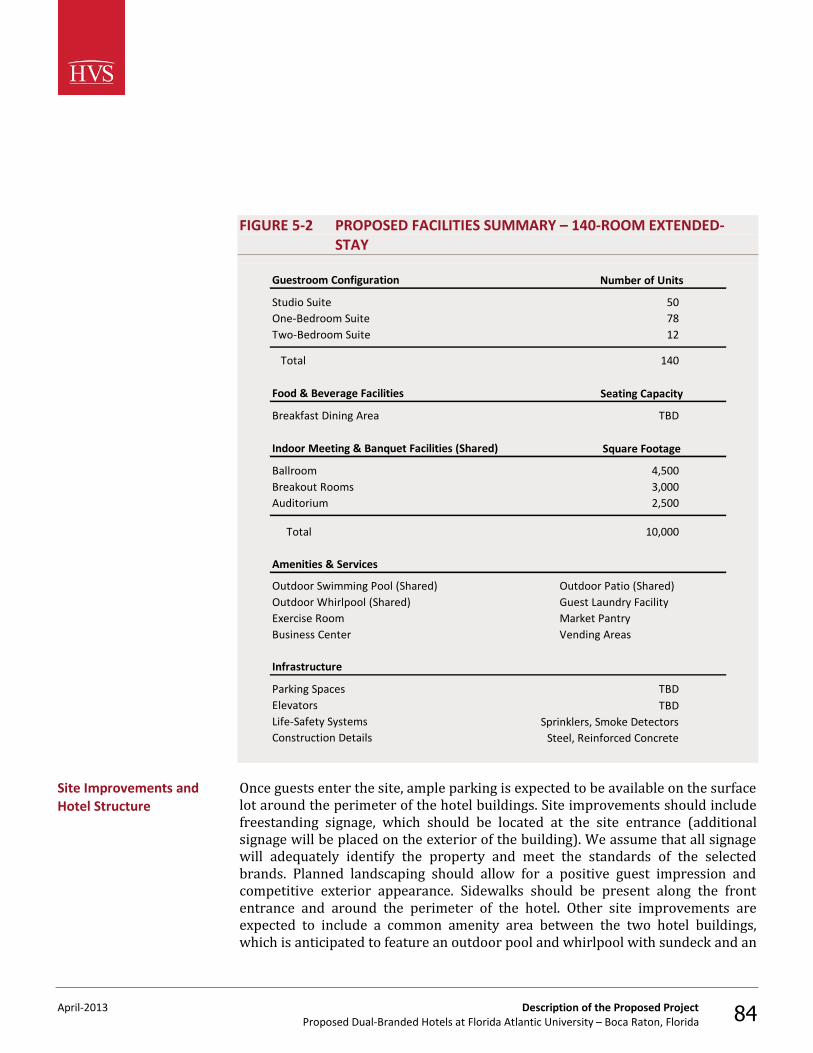
April-2013 Description of the Proposed Project Proposed Dual-Branded Hotels at Florida Atlantic University – Boca Raton, Florida 84
FIGURE 5-2 PROPOSED FACILITIES SUMMARY – 140-ROOM EXTENDED-STAY
Guestroom Configuration
Studio Suite 50 One-Bedroom Suite 78 Two-Bedroom Suite 12
Total 140
Food & Beverage Facilities
Breakfast Dining Area TBD
Indoor Meeting & Banquet Facilities (Shared)
Ballroom 4,500 Breakout Rooms 3,000 Auditorium 2,500
Total 10,000
Amenities & Services
Infrastructure
Parking Spaces TBDElevatorsLife-Safety SystemsConstruction Details
TBDSprinklers, Smoke Detectors
Steel, Reinforced Concrete
Outdoor Whirlpool (Shared) Guest Laundry FacilityExercise Room Market PantryBusiness Center Vending Areas
Number of Units
Seating Capacity
Square Footage
Outdoor Swimming Pool (Shared) Outdoor Patio (Shared)
Once guests enter the site, ample parking is expected to be available on the surface lot around the perimeter of the hotel buildings. Site improvements should include freestanding signage, which should be located at the site entrance (additional signage will be placed on the exterior of the building). We assume that all signage will adequately identify the property and meet the standards of the selected brands. Planned landscaping should allow for a positive guest impression and competitive exterior appearance. Sidewalks should be present along the front entrance and around the perimeter of the hotel. Other site improvements are expected to include a common amenity area between the two hotel buildings, which is anticipated to feature an outdoor pool and whirlpool with sundeck and an
Site Improvements and Hotel Structure
April-2013 Description of the Proposed Project Proposed Dual-Branded Hotels at Florida Atlantic University – Boca Raton, Florida 85
outdoor patio area. A trash area is also expected to be provided toward the rear of the subject site. Overall, the site improvements for the property should be adequate. The hotel structure is expected to comprise two hotel buildings offering separate select-service and extended-stay products, which will be linked by shared conference center building and a common outdoor amenity area. Both hotel structures and the conference center building are anticipated to be constructed of steel and reinforced concrete. The exterior of all buildings should be finished with stucco and should feature a design aesthetic in keeping with those of surrounding university buildings. Multiple stairways and elevators are expected to provide internal vertical transportation within both hotel structures. Each building's roof is anticipated to be constructed of concrete with a rubber membrane roofing system. Double-paned windows should reduce noise transmission into the rooms. Heating and cooling is expected to be provided by through-the-wall units and several large units for the public areas. Overall, the building components should be normal for a hotel of this type and should meet the standards for this market. We assume that all structural components will meet local building codes and that no significant defaults will occur during construction that may impact the future operating potential of the hotel or delay its assumed opening date. Three separate entrances should provide guests access to the subject property, one at the front of each hotel building and a third at the front of the conference center building. All entrances should feature a single set of automatic doors, which open to a vestibule, and a second set of automatic doors. Each hotel's lobby is expected to be average in size and appropriate for an upscale, select-service or extended-stay product. In keeping with the current design standards of most upscale brands, each lobby is anticipated to feature an open design concept, which should incorporate a social gathering area, and other varied seating areas integrated into the adjacent dining areas and business centers. The walls of each lobby should be attractively finished with an upscale material that is in line with brand standards. Each hotel's front desk is expected to feature a granite countertop and to be installed with appropriate property management and telephone systems. The furnishings and finishes in each space should offer an appropriate first impression, and the design of the space should lend itself to adequate efficiency. We assume that all property management and guestroom technology will be appropriately installed for the effective management of each hotel's operations. The proposed subject property's select-service hotel is expected to offer a restaurant where guests may purchase a variety of made-to-order menu items, as well as a lobby lounge, while the extended-stay hotel is expected to feature a breakfast dining area offering a variety of complimentary items. The furnishings of
Lobby
Food and Beverage Facilities
April-2013 Description of the Proposed Project Proposed Dual-Branded Hotels at Florida Atlantic University – Boca Raton, Florida 86
these spaces are anticipated to be of a similar style and finish as lobby and guestroom furnishings, and each dining area should be integrated into the adjacent public space in line with the open lobby design concept. Each hotel is anticipated to provide a competitive offering of food and beverage facilities for an upscale property. The proposed subject property is expected to feature a central conference center facility connecting the separate hotel buildings. The conference center should comprise approximately 10,000 square feet of total meeting space, including a fully divisible main ballroom, an auditorium, and multiple breakout rooms. The meeting space is anticipated to be outfitted with state-of-the-art technology, including laptop hook-ups, DVD players, projection screens, and flat-panel televisions. Public restrooms near the entrance to the conference center building should enhance the overall functionality of the area. The proposed subject property is anticipated to feature a common amenity area located adjacent to the conference center building and between the two hotel buildings. This area should offer an outdoor pool with sundeck, an outdoor whirlpool, and an outdoor patio area with a grill. Additionally, each hotel is expected to offer an exercise room that can be accessed 24 hours a day with a guest room key. Other amenities are expected to include an open business center in the lobby of each hotel, which should be integrated into the surrounding public spaces, as well as vending areas on select guestroom floors. Overall, the supporting facilities should be appropriate for a hotel of this type, and we assume that they will meet brand standards. The proposed subject property's select-service hotel is anticipated to feature both standard and suite-style guestroom configurations, and guestrooms should be present on all levels of the hotel building. The guestrooms are expected to be of a standard size and to offer typical amenities for an upscale, select-service product. The guestrooms should feature modern and contemporary furnishings and 42-inch flat-panel televisions, as well as an iron and ironing board, a coffeemaker, and wireless, high-speed Internet access. Studio suites should be available for a premium rate and are expected to feature a larger living area with a sleeper sofa. Conversely, the proposed subject property's extended-stay hotel is anticipated to offer an all-suite guestroom product, featuring studio, one-bedroom, and two-bedroom suites. The guestroom suites should be located on all levels of the hotel building and are expected to offer typical amenities for this upscale, extended-stay product type, including a fully equipped kitchen. In addition to the standard furnishings, in-room amenities are anticipated to include wireless, high-speed
Meeting and Banquet Space
Recreational Amenities
Additional Amenities
Guestrooms
April-2013 Description of the Proposed Project Proposed Dual-Branded Hotels at Florida Atlantic University – Boca Raton, Florida 87
Internet access and an iron and ironing board. Overall, the guestroom suites should offer a competitive product for the Boca Raton market. Guestroom bathrooms in each hotel are expected to be of a standard size, with a shower-in-tub, commode, and single sink with vanity area, featuring a stone countertop. The floors should be finished with stone tiles, and the walls will likely be finished with vinyl wall-covering. Bathrooms are anticipated to feature a hairdryer and complimentary toiletries. Overall, the bathroom design should be appropriate for an upscale, select-service or extended-stay product. The interior guestroom corridors in each hotel are expected to be wide and functional, permitting the easy passage of housekeeping carts. Corridor carpet, vinyl wall-covering, signage, and lighting should be in keeping with the overall look and design of the rest of the property. Each hotel is expected to be served by the necessary back-of-the-house space, including an in-house laundry facility, administrative offices, and a kitchen to service the needs of the dining area. These spaces should be adequate for an upscale, select-service or extended-stay hotel and should allow for the efficient operation of both hotels under competent management. We assume that the proposed subject property will be built according to all pertinent codes and brand standards. Moreover, we assume its construction will not create any environmental hazards (such as mold) and that the property will fully comply with the Americans with Disabilities Act. Our analysis assumes that, after their openings, the hotels will require ongoing upgrades and periodic renovations in order to maintain their competitive levels in this market and to remain compliant with the standards of the selected brands. These costs should be adequately funded by the forecasted reserve for replacement, as long as a successful, ongoing preventive-maintenance program is employed by hotel staff. Overall, the proposed subject property should offer a well-designed, functional layout of support areas and guestrooms. All typical and market-appropriate features and amenities are expected to be included in each hotel's design. We assume that the buildings will be fully open and operational on the stipulated opening date and will meet all local building codes and brand standards. Furthermore, we assume that the staff of each hotel will be adequately trained to allow for a successful opening and that pre-marketing efforts will have introduced the product to major local accounts at least six months in advance of the opening date.
Back-of-the-House
ADA and Environmental
Capital Expenditures
Conclusion
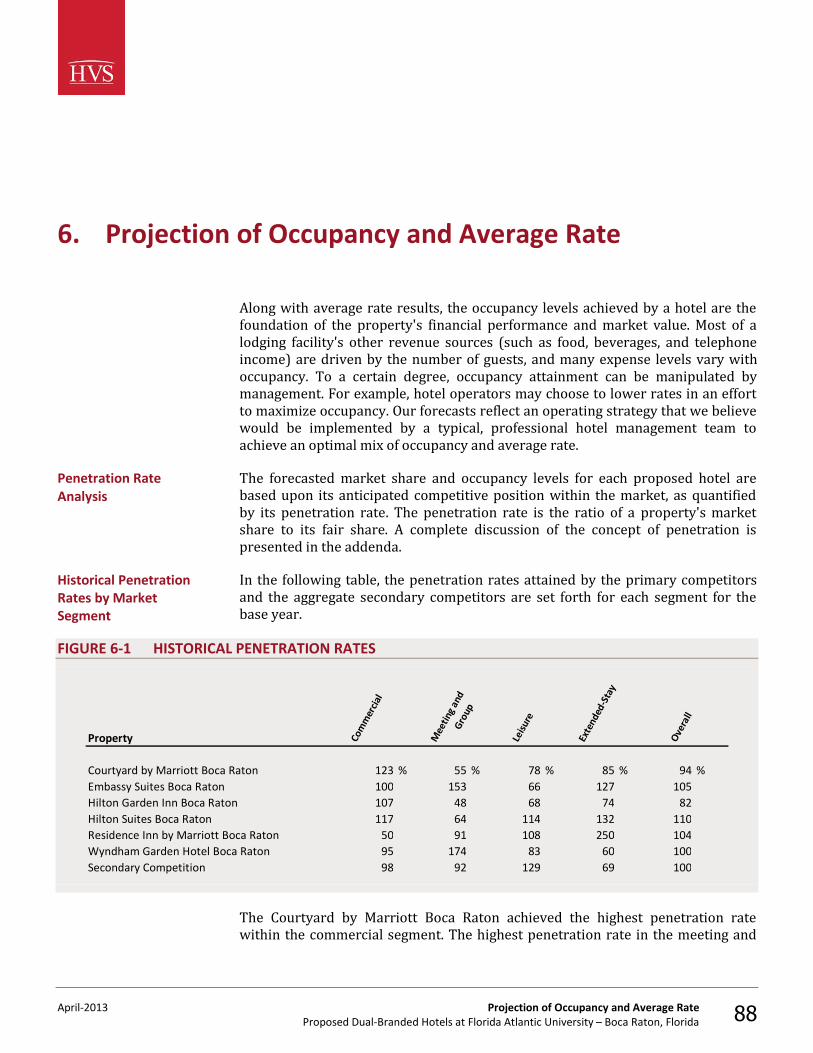
April-2013 Projection of Occupancy and Average Rate Proposed Dual-Branded Hotels at Florida Atlantic University – Boca Raton, Florida 88
6. Projection of Occupancy and Average Rate
Along with average rate results, the occupancy levels achieved by a hotel are the foundation of the property's financial performance and market value. Most of a lodging facility's other revenue sources (such as food, beverages, and telephone income) are driven by the number of guests, and many expense levels vary with occupancy. To a certain degree, occupancy attainment can be manipulated by management. For example, hotel operators may choose to lower rates in an effort to maximize occupancy. Our forecasts reflect an operating strategy that we believe would be implemented by a typical, professional hotel management team to achieve an optimal mix of occupancy and average rate. The forecasted market share and occupancy levels for each proposed hotel are based upon its anticipated competitive position within the market, as quantified by its penetration rate. The penetration rate is the ratio of a property's market share to its fair share. A complete discussion of the concept of penetration is presented in the addenda. In the following table, the penetration rates attained by the primary competitors and the aggregate secondary competitors are set forth for each segment for the base year.
FIGURE 6-1 HISTORICAL PENETRATION RATES
Property
Courtyard by Marriott Boca Raton 123 % 55 % 78 % 85 % 94 %Embassy Suites Boca Raton 100 153 66 127 105Hilton Garden Inn Boca Raton 107 48 68 74 82Hilton Suites Boca Raton 117 64 114 132 110Residence Inn by Marriott Boca Raton 50 91 108 250 104Wyndham Garden Hotel Boca Raton 95 174 83 60 100Secondary Competition 98 92 129 69 100
Exte
nded
-Sta
y
Ove
rall
Com
mer
cial
Mee
ting
and
Grou
p
Leisu
re
The Courtyard by Marriott Boca Raton achieved the highest penetration rate within the commercial segment. The highest penetration rate in the meeting and
Penetration Rate Analysis
Historical Penetration Rates by Market Segment
April-2013 Projection of Occupancy and Average Rate Proposed Dual-Branded Hotels at Florida Atlantic University – Boca Raton, Florida 89
group segment was achieved by the Wyndham Garden Hotel Boca Raton, while the secondary competition led the market with the highest leisure penetration rate. Because the supply and demand balance for the competitive market is dynamic, there is a circular relationship between the penetration factors of each hotel in the market. The performance of individual new hotels has a direct effect upon the aggregate performance of the market, and consequently upon the calculated penetration factor for each hotel in each market segment. The same is true when the performance of existing hotels changes, either positively (following a refurbishment, for example) or negatively (when a poorly maintained or marketed hotel loses market share). A hotel’s penetration factor is calculated as its achieved market share of demand divided by its fair share of demand. Thus, if one hotel’s penetration performance increases, thereby increasing its achieved market share, this leaves less demand available in the market for the other hotels to capture and the penetration performance of one or more of those other hotels consequently declines (other things remaining equal). This type of market share adjustment takes place every time there is a change in supply, or a change in the relative penetration performance of one or more hotels in the competitive market. Our projections of penetration, demand capture, and occupancy performance for the subject property account for these types of adjustments to market share within the defined competitive market. Consequently, the actual penetration factors applicable to the subject property and its competitors for each market segment in each projection year may vary somewhat from the penetration factors delineated in the previous tables. The following tables set forth, by market segment, the projected adjusted penetration rates for the proposed subject hotels and each hotel in the competitive set.
Forecast of Subject Property’s Occupancy
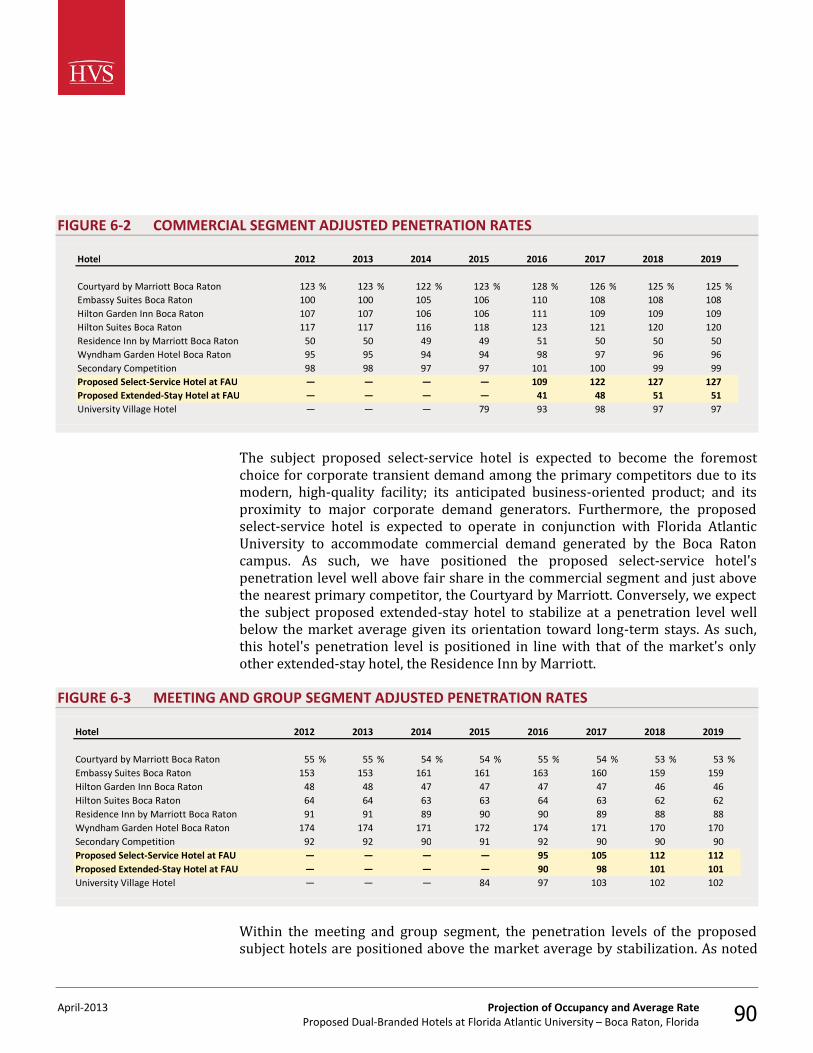
April-2013 Projection of Occupancy and Average Rate Proposed Dual-Branded Hotels at Florida Atlantic University – Boca Raton, Florida 90
FIGURE 6-2 COMMERCIAL SEGMENT ADJUSTED PENETRATION RATES
Hotel 2012 2013 2014 2015 2016 2017 2018 2019
Courtyard by Marriott Boca Raton 123 % 123 % 122 % 123 % 128 % 126 % 125 % 125 %Embassy Suites Boca Raton 100 100 105 106 110 108 108 108Hilton Garden Inn Boca Raton 107 107 106 106 111 109 109 109Hilton Suites Boca Raton 117 117 116 118 123 121 120 120Residence Inn by Marriott Boca Raton 50 50 49 49 51 50 50 50Wyndham Garden Hotel Boca Raton 95 95 94 94 98 97 96 96Secondary Competition 98 98 97 97 101 100 99 99Proposed Select-Service Hotel at FAU — — — — 109 122 127 127Proposed Extended-Stay Hotel at FAU — — — — 41 48 51 51University Village Hotel — — — 79 93 98 97 97
The subject proposed select-service hotel is expected to become the foremost choice for corporate transient demand among the primary competitors due to its modern, high-quality facility; its anticipated business-oriented product; and its proximity to major corporate demand generators. Furthermore, the proposed select-service hotel is expected to operate in conjunction with Florida Atlantic University to accommodate commercial demand generated by the Boca Raton campus. As such, we have positioned the proposed select-service hotel's penetration level well above fair share in the commercial segment and just above the nearest primary competitor, the Courtyard by Marriott. Conversely, we expect the subject proposed extended-stay hotel to stabilize at a penetration level well below the market average given its orientation toward long-term stays. As such, this hotel's penetration level is positioned in line with that of the market's only other extended-stay hotel, the Residence Inn by Marriott.
FIGURE 6-3 MEETING AND GROUP SEGMENT ADJUSTED PENETRATION RATES
Hotel 2012 2013 2014 2015 2016 2017 2018 2019
Courtyard by Marriott Boca Raton 55 % 55 % 54 % 54 % 55 % 54 % 53 % 53 %Embassy Suites Boca Raton 153 153 161 161 163 160 159 159Hilton Garden Inn Boca Raton 48 48 47 47 47 47 46 46Hilton Suites Boca Raton 64 64 63 63 64 63 62 62Residence Inn by Marriott Boca Raton 91 91 89 90 90 89 88 88Wyndham Garden Hotel Boca Raton 174 174 171 172 174 171 170 170Secondary Competition 92 92 90 91 92 90 90 90Proposed Select-Service Hotel at FAU — — — — 95 105 112 112Proposed Extended-Stay Hotel at FAU — — — — 90 98 101 101University Village Hotel — — — 84 97 103 102 102
Within the meeting and group segment, the penetration levels of the proposed subject hotels are positioned above the market average by stabilization. As noted
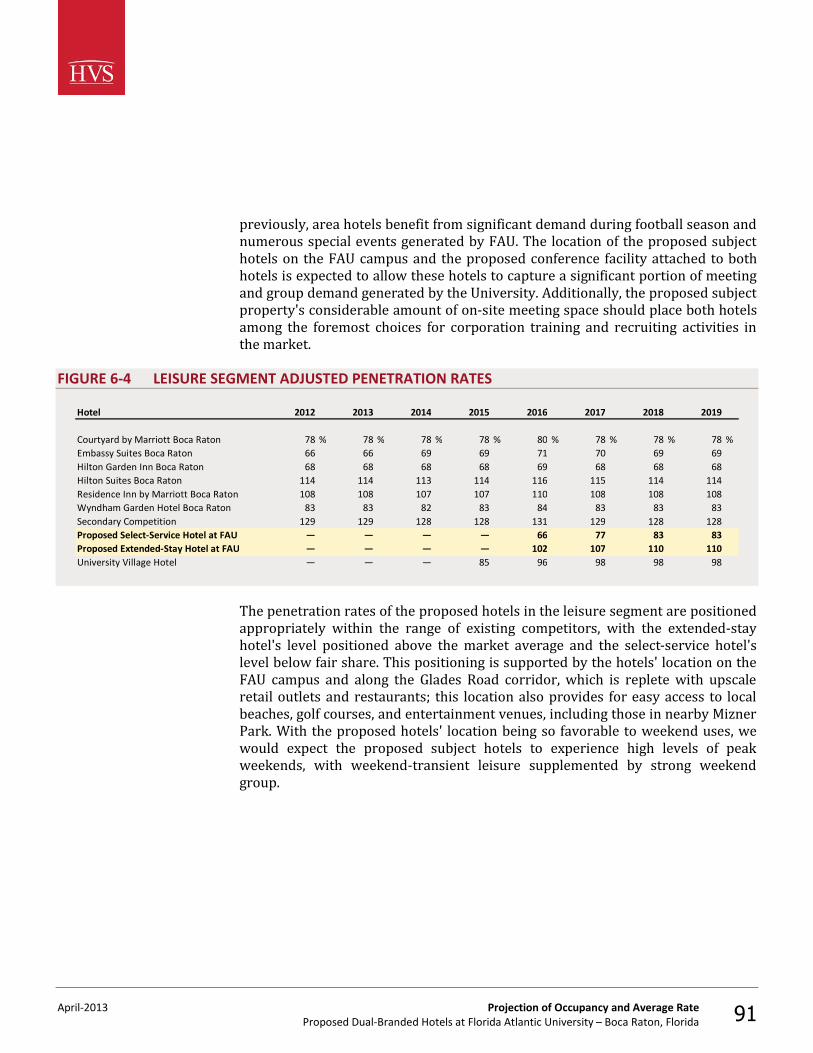
April-2013 Projection of Occupancy and Average Rate Proposed Dual-Branded Hotels at Florida Atlantic University – Boca Raton, Florida 91
previously, area hotels benefit from significant demand during football season and numerous special events generated by FAU. The location of the proposed subject hotels on the FAU campus and the proposed conference facility attached to both hotels is expected to allow these hotels to capture a significant portion of meeting and group demand generated by the University. Additionally, the proposed subject property's considerable amount of on-site meeting space should place both hotels among the foremost choices for corporation training and recruiting activities in the market.
FIGURE 6-4 LEISURE SEGMENT ADJUSTED PENETRATION RATES
Hotel 2012 2013 2014 2015 2016 2017 2018 2019
Courtyard by Marriott Boca Raton 78 % 78 % 78 % 78 % 80 % 78 % 78 % 78 %Embassy Suites Boca Raton 66 66 69 69 71 70 69 69Hilton Garden Inn Boca Raton 68 68 68 68 69 68 68 68Hilton Suites Boca Raton 114 114 113 114 116 115 114 114Residence Inn by Marriott Boca Raton 108 108 107 107 110 108 108 108Wyndham Garden Hotel Boca Raton 83 83 82 83 84 83 83 83Secondary Competition 129 129 128 128 131 129 128 128Proposed Select-Service Hotel at FAU — — — — 66 77 83 83Proposed Extended-Stay Hotel at FAU — — — — 102 107 110 110University Village Hotel — — — 85 96 98 98 98
The penetration rates of the proposed hotels in the leisure segment are positioned appropriately within the range of existing competitors, with the extended-stay hotel's level positioned above the market average and the select-service hotel's level below fair share. This positioning is supported by the hotels' location on the FAU campus and along the Glades Road corridor, which is replete with upscale retail outlets and restaurants; this location also provides for easy access to local beaches, golf courses, and entertainment venues, including those in nearby Mizner Park. With the proposed hotels' location being so favorable to weekend uses, we would expect the proposed subject hotels to experience high levels of peak weekends, with weekend-transient leisure supplemented by strong weekend group.

April-2013 Projection of Occupancy and Average Rate Proposed Dual-Branded Hotels at Florida Atlantic University – Boca Raton, Florida 92
FIGURE 6-5 LEISURE SEGMENT ADJUSTED PENETRATION RATES
Hotel 2012 2013 2014 2015 2016 2017 2018 2019
Courtyard by Marriott Boca Raton 85 % 85 % 84 % 85 % 77 % 76 % 76 % 76 %Embassy Suites Boca Raton 127 127 133 134 122 121 120 120Hilton Garden Inn Boca Raton 74 74 73 73 67 66 66 66Hilton Suites Boca Raton 132 132 130 132 121 119 118 118Residence Inn by Marriott Boca Raton 250 250 247 249 227 224 223 223Wyndham Garden Hotel Boca Raton 60 60 59 60 55 54 54 54Secondary Competition 69 69 68 68 63 62 61 61Proposed Select-Service Hotel at FAU — — — — 50 56 58 58Proposed Extended-Stay Hotel at FAU — — — — 250 260 263 263University Village Hotel — — — 55 59 63 62 62
The subject proposed extended-stay hotel is expected to become the foremost choice for extended-stay demand in the Boca Raton area, with its all-suite product and in-room kitchens being designed for this type of demand. The proposed hotel's location on the FAU campus, proximate to Boca Raton Regional Hospital and nearby corporate campuses and business parks, should allow it to maximize its capture of long-term demand produced by the market's major extended-stay demand generators. Furthermore, the proposed extended-stay hotel is expected to outperform the Residence Inn by Marriott by a relatively wide margin given its more central location and its anticipated status as the primary choice for long-term lodging related to FAU. Conversely, the extended-stay penetration level of the adjoining proposed select-service hotel is positioned below the penetration rates of the Courtyard by Marriott and Hilton Garden Inn, as the adjacent proposed extended-stay hotel is expected to capture the majority of the extended-stay demand that would normally be accommodated by the select-service facility. These positioned segment penetration rates result in the following market segmentation forecasts.
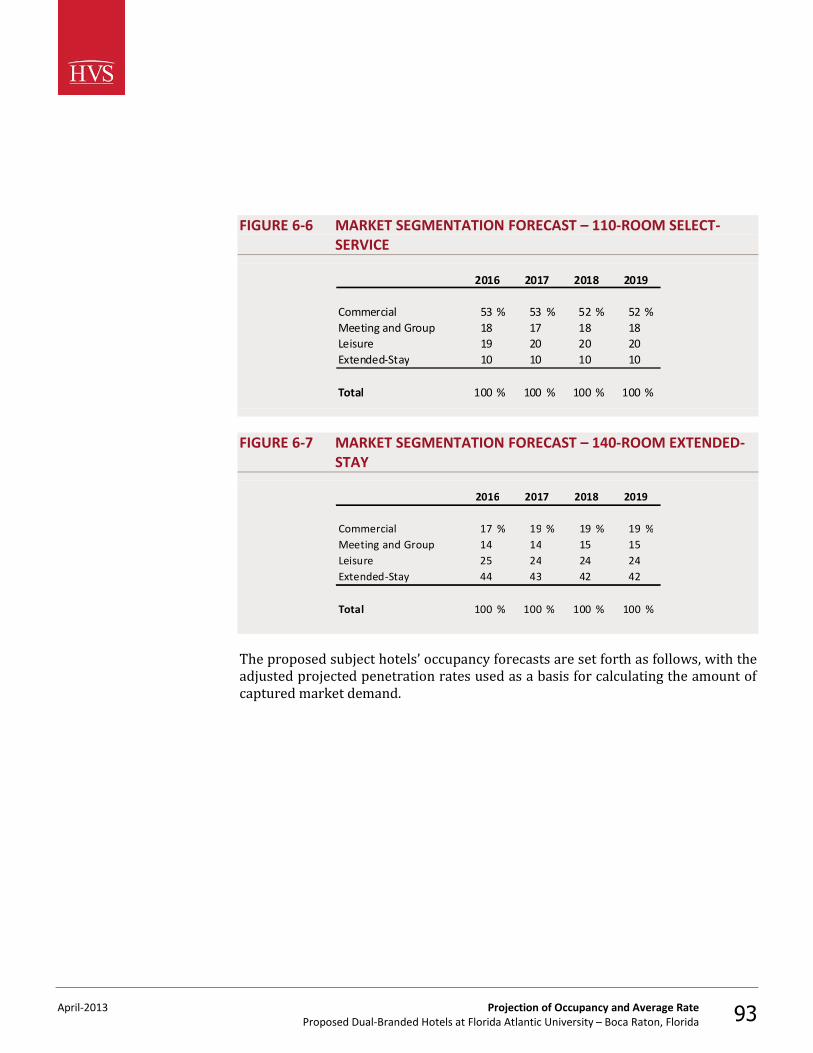
April-2013 Projection of Occupancy and Average Rate Proposed Dual-Branded Hotels at Florida Atlantic University – Boca Raton, Florida 93
FIGURE 6-6 MARKET SEGMENTATION FORECAST – 110-ROOM SELECT-SERVICE
Commercial 53 % 53 % 52 % 52 %Meeting and Group 18 17 18 18Leisure 19 20 20 20Extended-Stay 10 10 10 10
Total 100 % 100 % 100 % 100 %
2017 20192016 2018
FIGURE 6-7 MARKET SEGMENTATION FORECAST – 140-ROOM EXTENDED-STAY
Commercial 17 % 19 % 19 % 19 %Meeting and Group 14 14 15 15Leisure 25 24 24 24Extended-Stay 44 43 42 42
Total 100 % 100 % 100 % 100 %
2018 20192016 2017
The proposed subject hotels’ occupancy forecasts are set forth as follows, with the adjusted projected penetration rates used as a basis for calculating the amount of captured market demand.
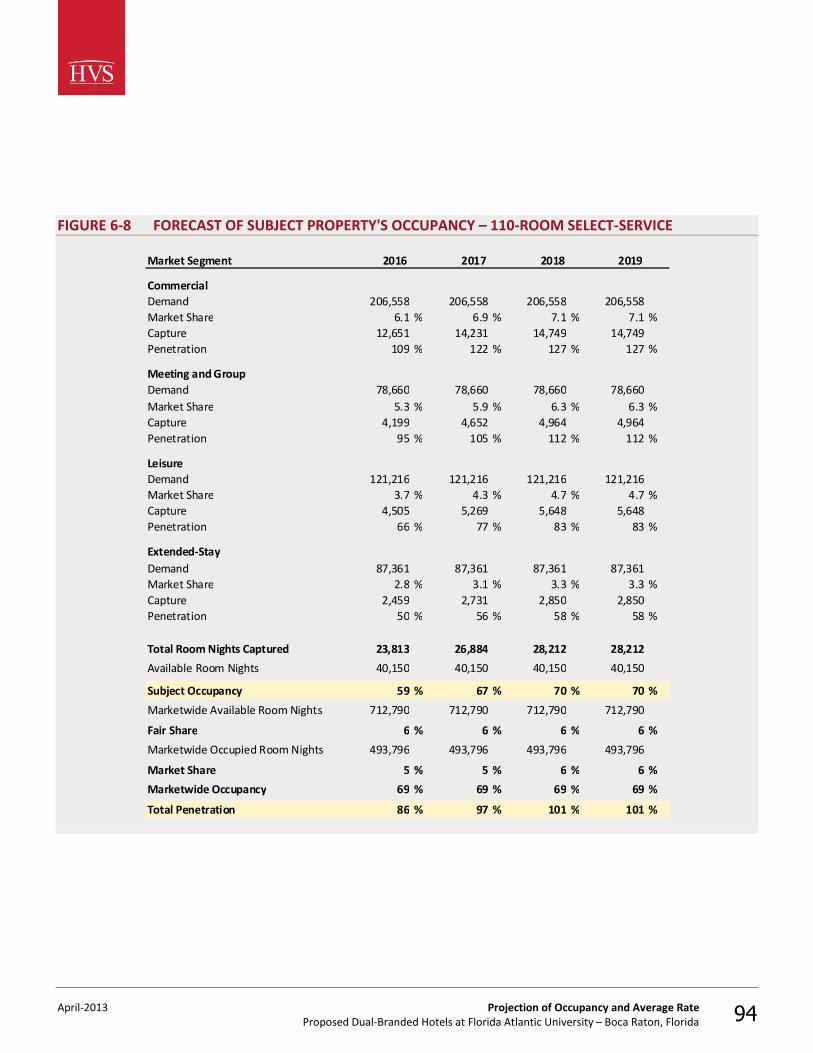
April-2013 Projection of Occupancy and Average Rate Proposed Dual-Branded Hotels at Florida Atlantic University – Boca Raton, Florida 94
FIGURE 6-8 FORECAST OF SUBJECT PROPERTY'S OCCUPANCY – 110-ROOM SELECT-SERVICE
Market Segment
CommercialDemand 206,558 206,558 206,558 206,558Market Share 6.1 % 6.9 % 7.1 % 7.1 %Capture 12,651 14,231 14,749 14,749Penetration 109 % 122 % 127 % 127 %
Meeting and GroupDemand 78,660 78,660 78,660 78,660Market Share 5.3 % 5.9 % 6.3 % 6.3 %Capture 4,199 4,652 4,964 4,964Penetration 95 % 105 % 112 % 112 %
LeisureDemand 121,216 121,216 121,216 121,216Market Share 3.7 % 4.3 % 4.7 % 4.7 %Capture 4,505 5,269 5,648 5,648Penetration 66 % 77 % 83 % 83 %
Extended-StayDemand 87,361 87,361 87,361 87,361Market Share 2.8 % 3.1 % 3.3 % 3.3 %Capture 2,459 2,731 2,850 2,850Penetration 50 % 56 % 58 % 58 %
Total Room Nights Captured 23,813 26,884 28,212 28,212
Available Room Nights 40,150 40,150 40,150 40,150
Subject Occupancy 59 % 67 % 70 % 70 %
Marketwide Available Room Nights 712,790 712,790 712,790 712,790
Fair Share 6 % 6 % 6 % 6 %
Marketwide Occupied Room Nights 493,796 493,796 493,796 493,796
Market Share 5 % 5 % 6 % 6 %
Marketwide Occupancy 69 % 69 % 69 % 69 %
Total Penetration 86 % 97 % 101 % 101 %
20182016 20192017
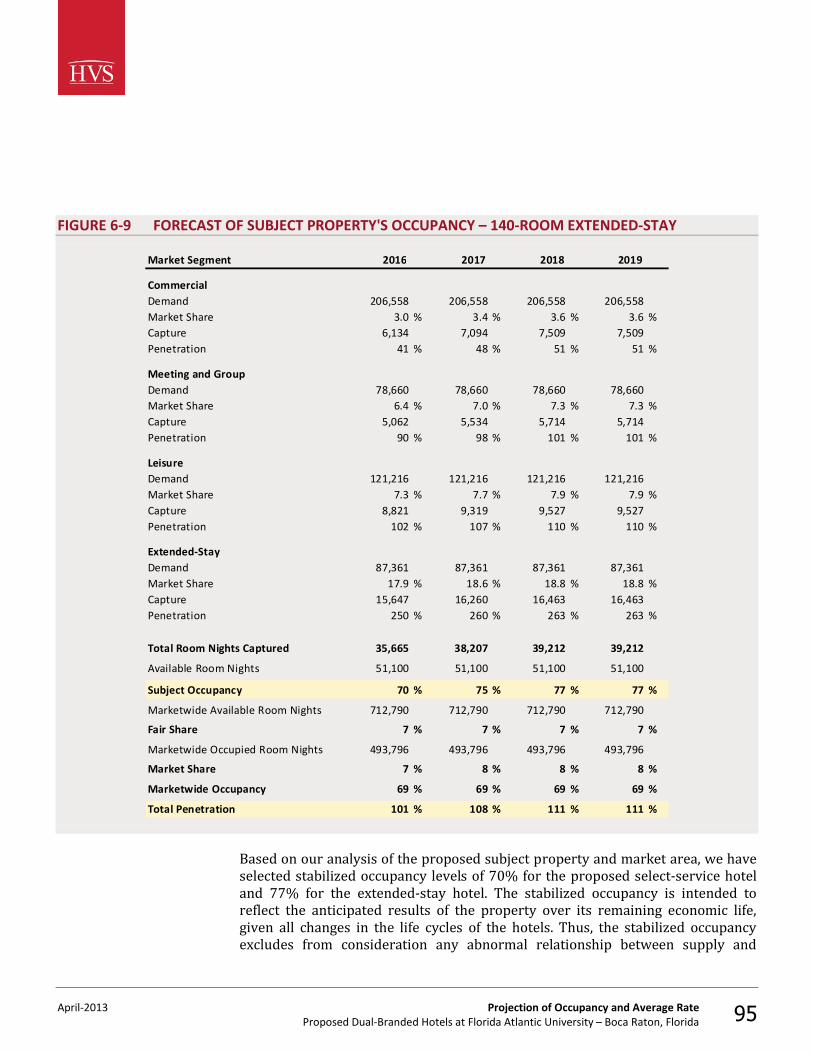
April-2013 Projection of Occupancy and Average Rate Proposed Dual-Branded Hotels at Florida Atlantic University – Boca Raton, Florida 95
FIGURE 6-9 FORECAST OF SUBJECT PROPERTY'S OCCUPANCY – 140-ROOM EXTENDED-STAY
Market Segment
CommercialDemand 206,558 206,558 206,558 206,558Market Share 3.0 % 3.4 % 3.6 % 3.6 %Capture 6,134 7,094 7,509 7,509Penetration 41 % 48 % 51 % 51 %
Meeting and GroupDemand 78,660 78,660 78,660 78,660Market Share 6.4 % 7.0 % 7.3 % 7.3 %Capture 5,062 5,534 5,714 5,714Penetration 90 % 98 % 101 % 101 %
LeisureDemand 121,216 121,216 121,216 121,216Market Share 7.3 % 7.7 % 7.9 % 7.9 %Capture 8,821 9,319 9,527 9,527Penetration 102 % 107 % 110 % 110 %
Extended-StayDemand 87,361 87,361 87,361 87,361Market Share 17.9 % 18.6 % 18.8 % 18.8 %Capture 15,647 16,260 16,463 16,463Penetration 250 % 260 % 263 % 263 %
Total Room Nights Captured 35,665 38,207 39,212 39,212
Available Room Nights 51,100 51,100 51,100 51,100
Subject Occupancy 70 % 75 % 77 % 77 %
Marketwide Available Room Nights 712,790 712,790 712,790 712,790
Fair Share 7 % 7 % 7 % 7 %
Marketwide Occupied Room Nights 493,796 493,796 493,796 493,796
Market Share 7 % 8 % 8 % 8 %
Marketwide Occupancy 69 % 69 % 69 % 69 %
Total Penetration 101 % 108 % 111 % 111 %
2016 20192017 2018
Based on our analysis of the proposed subject property and market area, we have selected stabilized occupancy levels of 70% for the proposed select-service hotel and 77% for the extended-stay hotel. The stabilized occupancy is intended to reflect the anticipated results of the property over its remaining economic life, given all changes in the life cycles of the hotels. Thus, the stabilized occupancy excludes from consideration any abnormal relationship between supply and
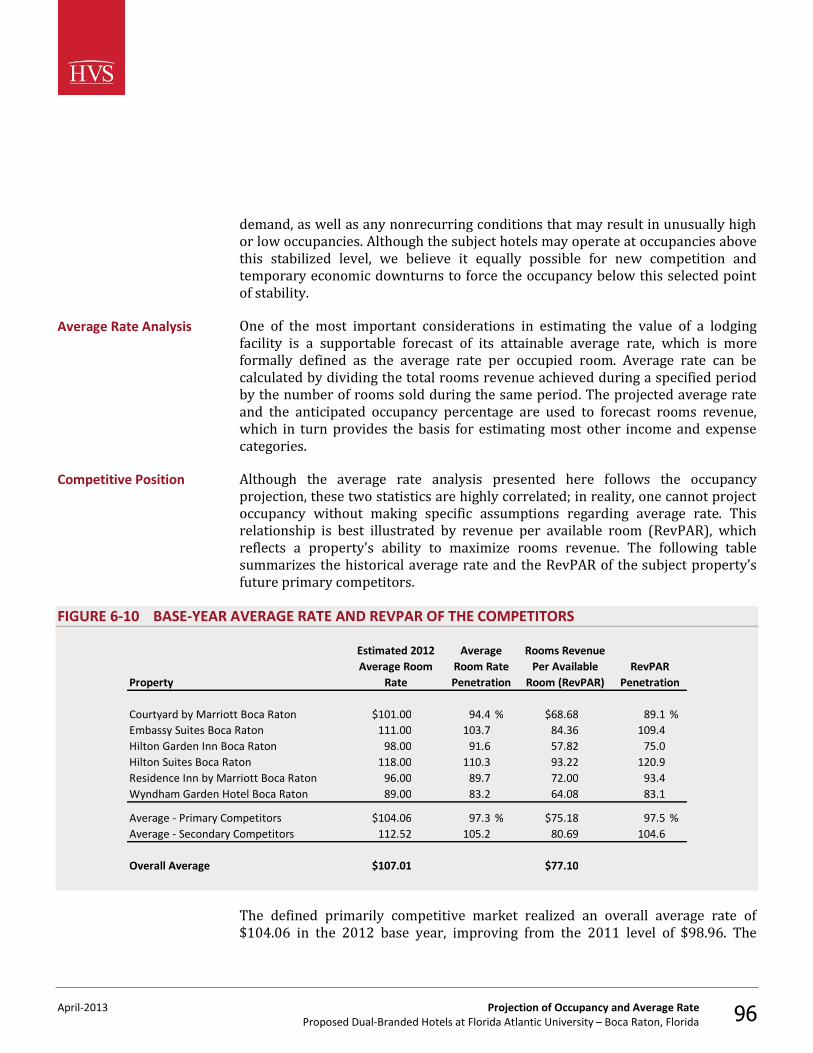
April-2013 Projection of Occupancy and Average Rate Proposed Dual-Branded Hotels at Florida Atlantic University – Boca Raton, Florida 96
demand, as well as any nonrecurring conditions that may result in unusually high or low occupancies. Although the subject hotels may operate at occupancies above this stabilized level, we believe it equally possible for new competition and temporary economic downturns to force the occupancy below this selected point of stability. One of the most important considerations in estimating the value of a lodging facility is a supportable forecast of its attainable average rate, which is more formally defined as the average rate per occupied room. Average rate can be calculated by dividing the total rooms revenue achieved during a specified period by the number of rooms sold during the same period. The projected average rate and the anticipated occupancy percentage are used to forecast rooms revenue, which in turn provides the basis for estimating most other income and expense categories. Although the average rate analysis presented here follows the occupancy projection, these two statistics are highly correlated; in reality, one cannot project occupancy without making specific assumptions regarding average rate. This relationship is best illustrated by revenue per available room (RevPAR), which reflects a property's ability to maximize rooms revenue. The following table summarizes the historical average rate and the RevPAR of the subject property’s future primary competitors.
FIGURE 6-10 BASE-YEAR AVERAGE RATE AND REVPAR OF THE COMPETITORS
Property
Courtyard by Marriott Boca Raton $101.00 94.4 % $68.68 89.1 %Embassy Suites Boca Raton 111.00 103.7 84.36 109.4Hilton Garden Inn Boca Raton 98.00 91.6 57.82 75.0Hilton Suites Boca Raton 118.00 110.3 93.22 120.9Residence Inn by Marriott Boca Raton 96.00 89.7 72.00 93.4Wyndham Garden Hotel Boca Raton 89.00 83.2 64.08 83.1
Average - Primary Competitors $104.06 97.3 % $75.18 97.5 %Average - Secondary Competitors 112.52 105.2 80.69 104.6
Overall Average $107.01 $77.10
Estimated 2012 Average Room
Rate
Rooms Revenue Per Available
Room (RevPAR)
Average Room Rate Penetration
RevPAR Penetration
The defined primarily competitive market realized an overall average rate of $104.06 in the 2012 base year, improving from the 2011 level of $98.96. The
Average Rate Analysis
Competitive Position
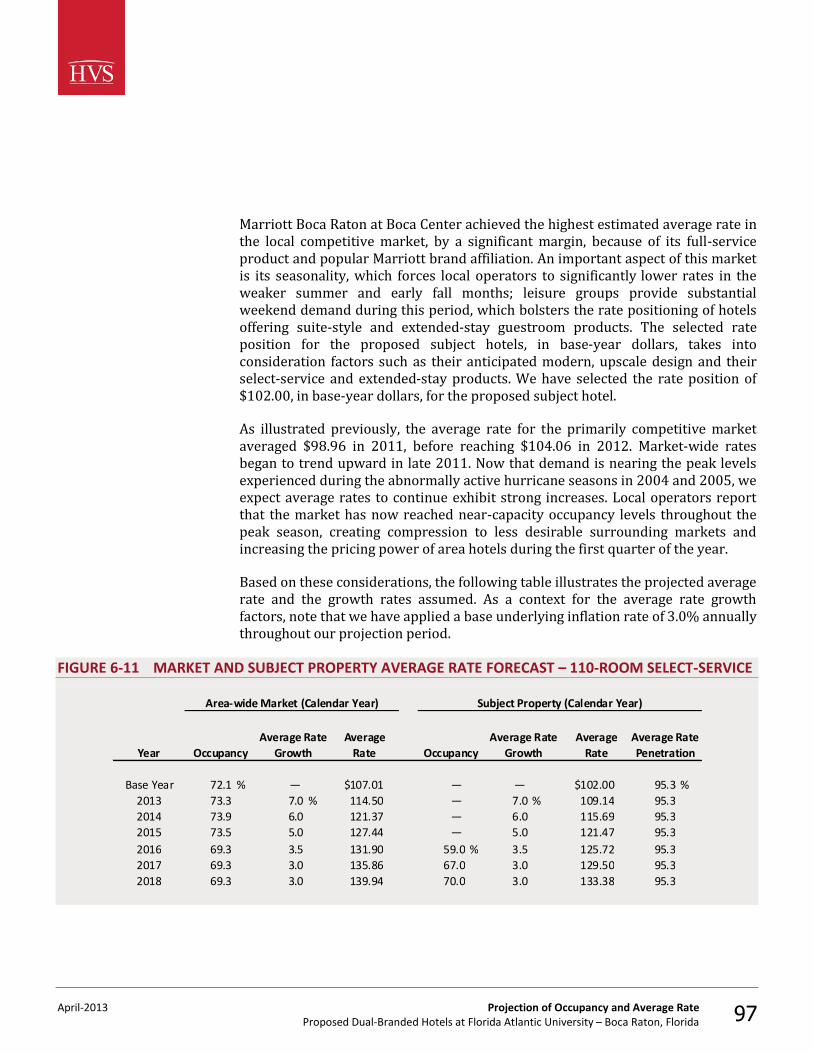
April-2013 Projection of Occupancy and Average Rate Proposed Dual-Branded Hotels at Florida Atlantic University – Boca Raton, Florida 97
Marriott Boca Raton at Boca Center achieved the highest estimated average rate in the local competitive market, by a significant margin, because of its full-service product and popular Marriott brand affiliation. An important aspect of this market is its seasonality, which forces local operators to significantly lower rates in the weaker summer and early fall months; leisure groups provide substantial weekend demand during this period, which bolsters the rate positioning of hotels offering suite-style and extended-stay guestroom products. The selected rate position for the proposed subject hotels, in base-year dollars, takes into consideration factors such as their anticipated modern, upscale design and their select-service and extended-stay products. We have selected the rate position of $102.00, in base-year dollars, for the proposed subject hotel. As illustrated previously, the average rate for the primarily competitive market averaged $98.96 in 2011, before reaching $104.06 in 2012. Market-wide rates began to trend upward in late 2011. Now that demand is nearing the peak levels experienced during the abnormally active hurricane seasons in 2004 and 2005, we expect average rates to continue exhibit strong increases. Local operators report that the market has now reached near-capacity occupancy levels throughout the peak season, creating compression to less desirable surrounding markets and increasing the pricing power of area hotels during the first quarter of the year. Based on these considerations, the following table illustrates the projected average rate and the growth rates assumed. As a context for the average rate growth factors, note that we have applied a base underlying inflation rate of 3.0% annually throughout our projection period.
FIGURE 6-11 MARKET AND SUBJECT PROPERTY AVERAGE RATE FORECAST – 110-ROOM SELECT-SERVICE
Year
Base Year 72.1 % — $107.01 — — $102.00 95.3 %2013 73.3 7.0 % 114.50 — 7.0 % 109.14 95.32014 73.9 6.0 121.37 — 6.0 115.69 95.32015 73.5 5.0 127.44 — 5.0 121.47 95.32016 69.3 3.5 131.90 59.0 % 3.5 125.72 95.32017 69.3 3.0 135.86 67.0 3.0 129.50 95.32018 69.3 3.0 139.94 70.0 3.0 133.38 95.3
Area-wide Market (Calendar Year) Subject Property (Calendar Year)
Average Rate
Average Rate Penetration
Average Rate Growth
Average Rate OccupancyOccupancy
Average Rate Growth
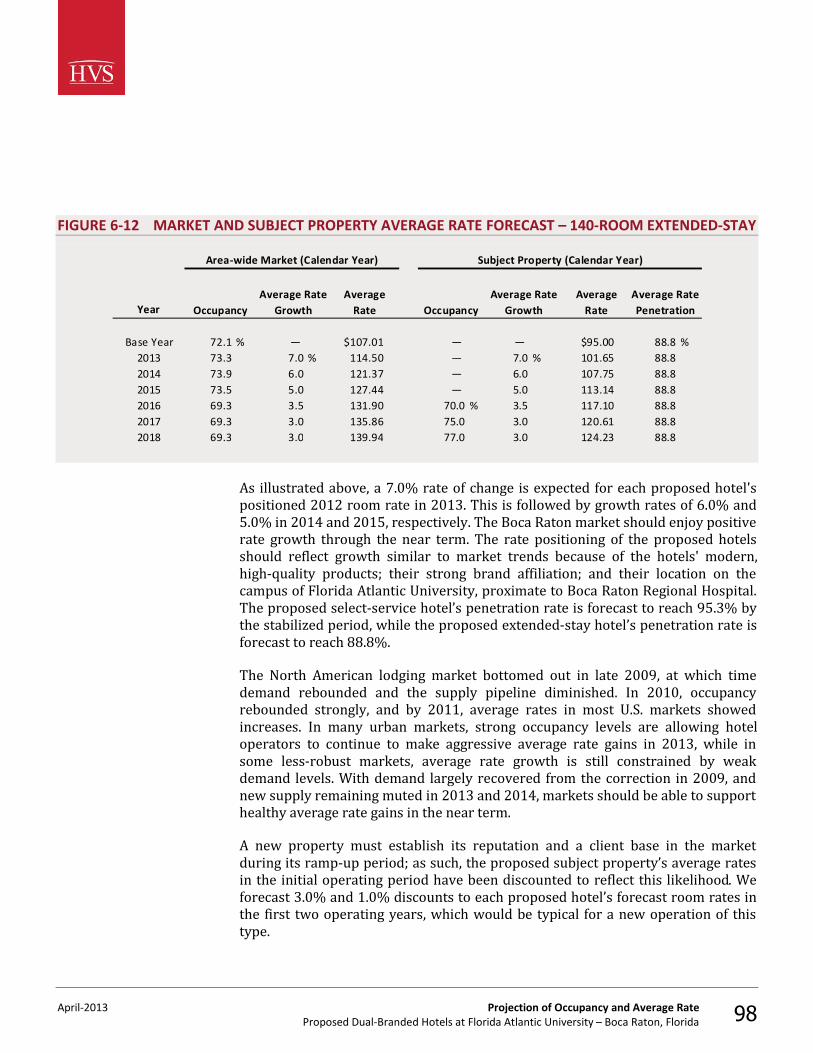
April-2013 Projection of Occupancy and Average Rate Proposed Dual-Branded Hotels at Florida Atlantic University – Boca Raton, Florida 98
FIGURE 6-12 MARKET AND SUBJECT PROPERTY AVERAGE RATE FORECAST – 140-ROOM EXTENDED-STAY
Year
Base Year 72.1 % — $107.01 — — $95.00 88.8 %2013 73.3 7.0 % 114.50 — 7.0 % 101.65 88.82014 73.9 6.0 121.37 — 6.0 107.75 88.82015 73.5 5.0 127.44 — 5.0 113.14 88.82016 69.3 3.5 131.90 70.0 % 3.5 117.10 88.82017 69.3 3.0 135.86 75.0 3.0 120.61 88.82018 69.3 3.0 139.94 77.0 3.0 124.23 88.8
Average Rate Growth
Area-wide Market (Calendar Year) Subject Property (Calendar Year)
Average Rate
Average Rate Penetration
Average Rate Growth
Average Rate OccupancyOccupancy
As illustrated above, a 7.0% rate of change is expected for each proposed hotel's positioned 2012 room rate in 2013. This is followed by growth rates of 6.0% and 5.0% in 2014 and 2015, respectively. The Boca Raton market should enjoy positive rate growth through the near term. The rate positioning of the proposed hotels should reflect growth similar to market trends because of the hotels' modern, high-quality products; their strong brand affiliation; and their location on the campus of Florida Atlantic University, proximate to Boca Raton Regional Hospital. The proposed select-service hotel’s penetration rate is forecast to reach 95.3% by the stabilized period, while the proposed extended-stay hotel’s penetration rate is forecast to reach 88.8%. The North American lodging market bottomed out in late 2009, at which time demand rebounded and the supply pipeline diminished. In 2010, occupancy rebounded strongly, and by 2011, average rates in most U.S. markets showed increases. In many urban markets, strong occupancy levels are allowing hotel operators to continue to make aggressive average rate gains in 2013, while in some less-robust markets, average rate growth is still constrained by weak demand levels. With demand largely recovered from the correction in 2009, and new supply remaining muted in 2013 and 2014, markets should be able to support healthy average rate gains in the near term. A new property must establish its reputation and a client base in the market during its ramp-up period; as such, the proposed subject property’s average rates in the initial operating period have been discounted to reflect this likelihood. We forecast 3.0% and 1.0% discounts to each proposed hotel’s forecast room rates in the first two operating years, which would be typical for a new operation of this type.
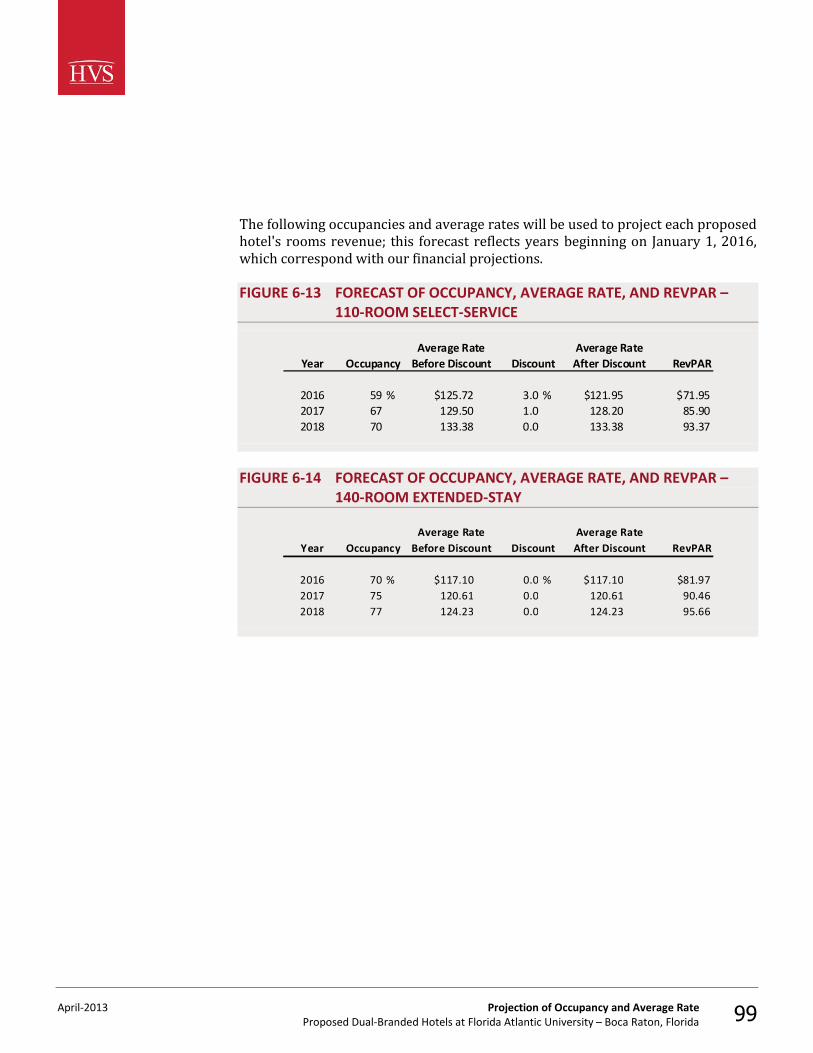
April-2013 Projection of Occupancy and Average Rate Proposed Dual-Branded Hotels at Florida Atlantic University – Boca Raton, Florida 99
The following occupancies and average rates will be used to project each proposed hotel's rooms revenue; this forecast reflects years beginning on January 1, 2016, which correspond with our financial projections. FIGURE 6-13 FORECAST OF OCCUPANCY, AVERAGE RATE, AND REVPAR –
110-ROOM SELECT-SERVICE
Year
2016 59 % $125.72 3.0 % $121.95 $71.952017 67 129.50 1.0 128.20 85.902018 70 133.38 0.0 133.38 93.37
OccupancyAverage Rate
Before Discount DiscountAverage Rate
After Discount RevPAR
FIGURE 6-14 FORECAST OF OCCUPANCY, AVERAGE RATE, AND REVPAR – 140-ROOM EXTENDED-STAY
Year
2016 70 % $117.10 0.0 % $117.10 $81.972017 75 120.61 0.0 120.61 90.462018 77 124.23 0.0 124.23 95.66
OccupancyAverage Rate
Before Discount DiscountAverage Rate After Discount RevPAR
April-2013 Projection of Income and Expense Proposed Dual-Branded Hotels at Florida Atlantic University – Boca Raton, Florida 100
7. Projection of Income and Expense
In this chapter of our report, we have compiled a forecast of income and expense for the proposed subject property. This forecast is based on the facilities program set forth previously, as well as the occupancy and average rate forecast discussed previously. The forecast of income and expense is expressed in current dollars for each year. The stabilized year is intended to reflect the anticipated operating results of each hotel over its remaining economic life, given any or all applicable stages of build-up, plateau, and decline in the life cycle of the hotel. Thus, income and expense estimates from the stabilized year forward exclude from consideration any abnormal relationship between supply and demand, as well as any nonrecurring conditions that may result in unusual revenues or expenses. The ten-year period reflects the typical holding period of large real estate assets such as hotels. In addition, the ten-year period provides for the stabilization of income streams and comparison of yields with alternate types of real estate. The forecasted income streams reflect the future benefits of owning specific rights in income-producing real estate. In order to project future income and expense for the proposed subject property, we have included a sample of individual comparable operating statements from our database of hotel statistics. All financial data are presented according to the three most common measures of industry performance: ratio to sales (RTS), amounts per available room (PAR), and amounts per occupied room night (POR). These historical income and expense statements will be used as benchmarks in our forthcoming forecast of income and expense.
Comparable Operating Statements
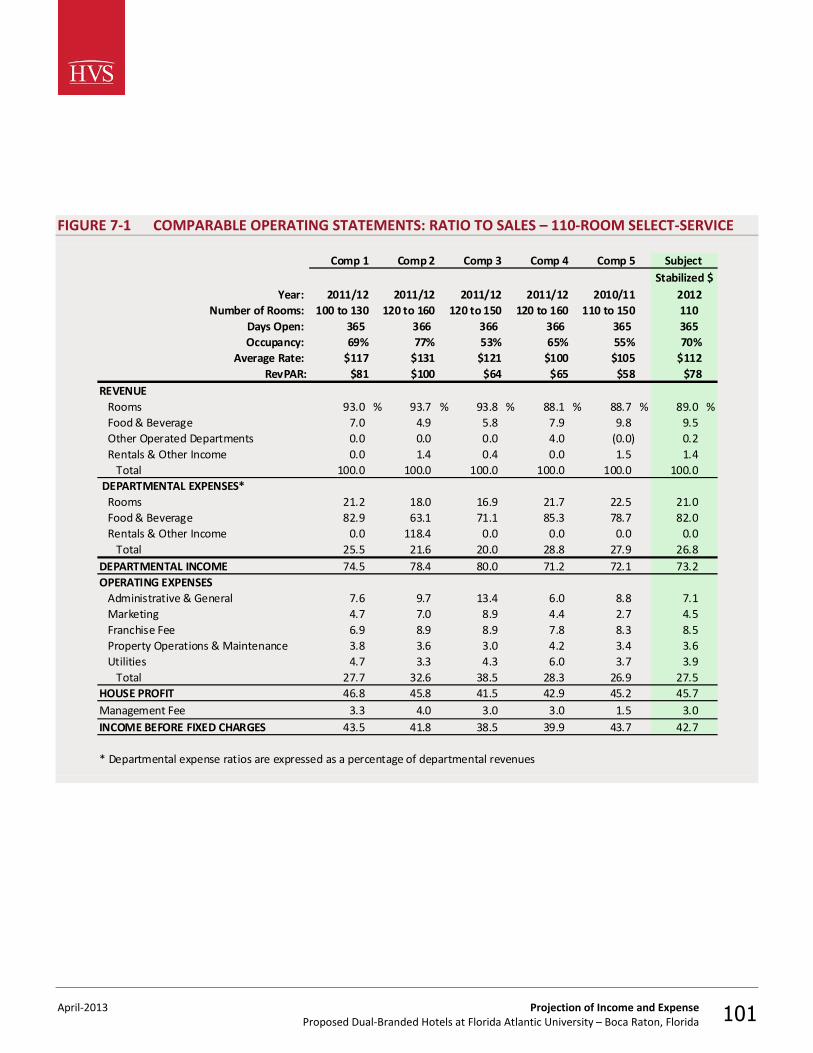
April-2013 Projection of Income and Expense Proposed Dual-Branded Hotels at Florida Atlantic University – Boca Raton, Florida 101
FIGURE 7-1 COMPARABLE OPERATING STATEMENTS: RATIO TO SALES – 110-ROOM SELECT-SERVICE
Comp 1 Comp 2 Comp 3 Comp 4 Comp 5 Subject
Year: 2011/12 2011/12 2011/12 2011/12 2010/11 2012Number of Rooms: 100 to 130 120 to 160 120 to 150 120 to 160 110 to 150 110
Days Open: 365 366 366 366 365 365Occupancy: 69% 77% 53% 65% 55% 70%
Average Rate: $117 $131 $121 $100 $105 $112RevPAR: $81 $100 $64 $65 $58 $78
REVENUE Rooms 93.0 % 93.7 % 93.8 % 88.1 % 88.7 % 89.0 % Food & Beverage 7.0 4.9 5.8 7.9 9.8 9.5 Other Operated Departments 0.0 0.0 0.0 4.0 (0.0) 0.2 Rentals & Other Income 0.0 1.4 0.4 0.0 1.5 1.4 Total 100.0 100.0 100.0 100.0 100.0 100.0 DEPARTMENTAL EXPENSES* Rooms 21.2 18.0 16.9 21.7 22.5 21.0 Food & Beverage 82.9 63.1 71.1 85.3 78.7 82.0 Rentals & Other Income 0.0 118.4 0.0 0.0 0.0 0.0 Total 25.5 21.6 20.0 28.8 27.9 26.8DEPARTMENTAL INCOME 74.5 78.4 80.0 71.2 72.1 73.2OPERATING EXPENSES Administrative & General 7.6 9.7 13.4 6.0 8.8 7.1 Marketing 4.7 7.0 8.9 4.4 2.7 4.5 Franchise Fee 6.9 8.9 8.9 7.8 8.3 8.5 Property Operations & Maintenance 3.8 3.6 3.0 4.2 3.4 3.6 Utilities 4.7 3.3 4.3 6.0 3.7 3.9 Total 27.7 32.6 38.5 28.3 26.9 27.5HOUSE PROFIT 46.8 45.8 41.5 42.9 45.2 45.7Management Fee 3.3 4.0 3.0 3.0 1.5 3.0INCOME BEFORE FIXED CHARGES 43.5 41.8 38.5 39.9 43.7 42.7
* Departmental expense ratios are expressed as a percentage of departmental revenues
Stabilized $
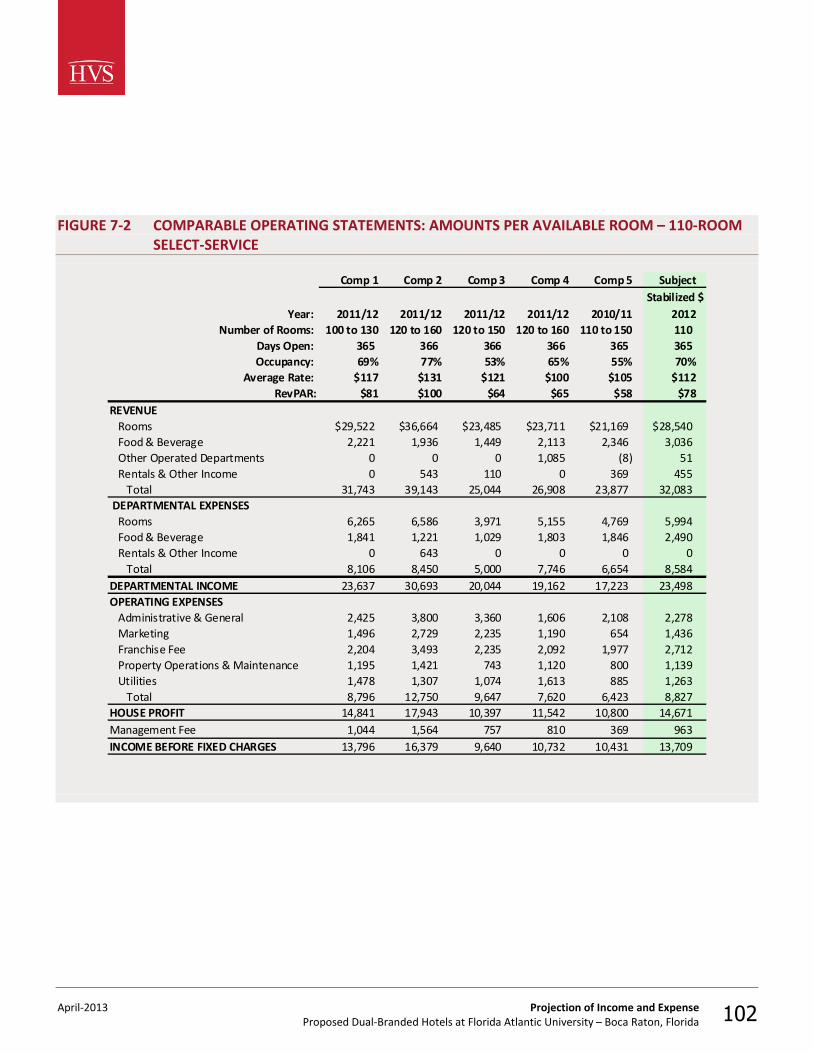
April-2013 Projection of Income and Expense Proposed Dual-Branded Hotels at Florida Atlantic University – Boca Raton, Florida 102
FIGURE 7-2 COMPARABLE OPERATING STATEMENTS: AMOUNTS PER AVAILABLE ROOM – 110-ROOM SELECT-SERVICE
Comp 1 Comp 2 Comp 3 Comp 4 Comp 5 Subject
Year: 2011/12 2011/12 2011/12 2011/12 2010/11 2012Number of Rooms: 100 to 130 120 to 160 120 to 150 120 to 160 110 to 150 110
Days Open: 365 366 366 366 365 365Occupancy: 69% 77% 53% 65% 55% 70%
Average Rate: $117 $131 $121 $100 $105 $112RevPAR: $81 $100 $64 $65 $58 $78
REVENUE Rooms $29,522 $36,664 $23,485 $23,711 $21,169 $28,540 Food & Beverage 2,221 1,936 1,449 2,113 2,346 3,036 Other Operated Departments 0 0 0 1,085 (8) 51 Rentals & Other Income 0 543 110 0 369 455 Total 31,743 39,143 25,044 26,908 23,877 32,083 DEPARTMENTAL EXPENSES Rooms 6,265 6,586 3,971 5,155 4,769 5,994 Food & Beverage 1,841 1,221 1,029 1,803 1,846 2,490 Rentals & Other Income 0 643 0 0 0 0 Total 8,106 8,450 5,000 7,746 6,654 8,584DEPARTMENTAL INCOME 23,637 30,693 20,044 19,162 17,223 23,498OPERATING EXPENSES Administrative & General 2,425 3,800 3,360 1,606 2,108 2,278 Marketing 1,496 2,729 2,235 1,190 654 1,436 Franchise Fee 2,204 3,493 2,235 2,092 1,977 2,712 Property Operations & Maintenance 1,195 1,421 743 1,120 800 1,139 Utilities 1,478 1,307 1,074 1,613 885 1,263 Total 8,796 12,750 9,647 7,620 6,423 8,827HOUSE PROFIT 14,841 17,943 10,397 11,542 10,800 14,671Management Fee 1,044 1,564 757 810 369 963INCOME BEFORE FIXED CHARGES 13,796 16,379 9,640 10,732 10,431 13,709
Stabilized $
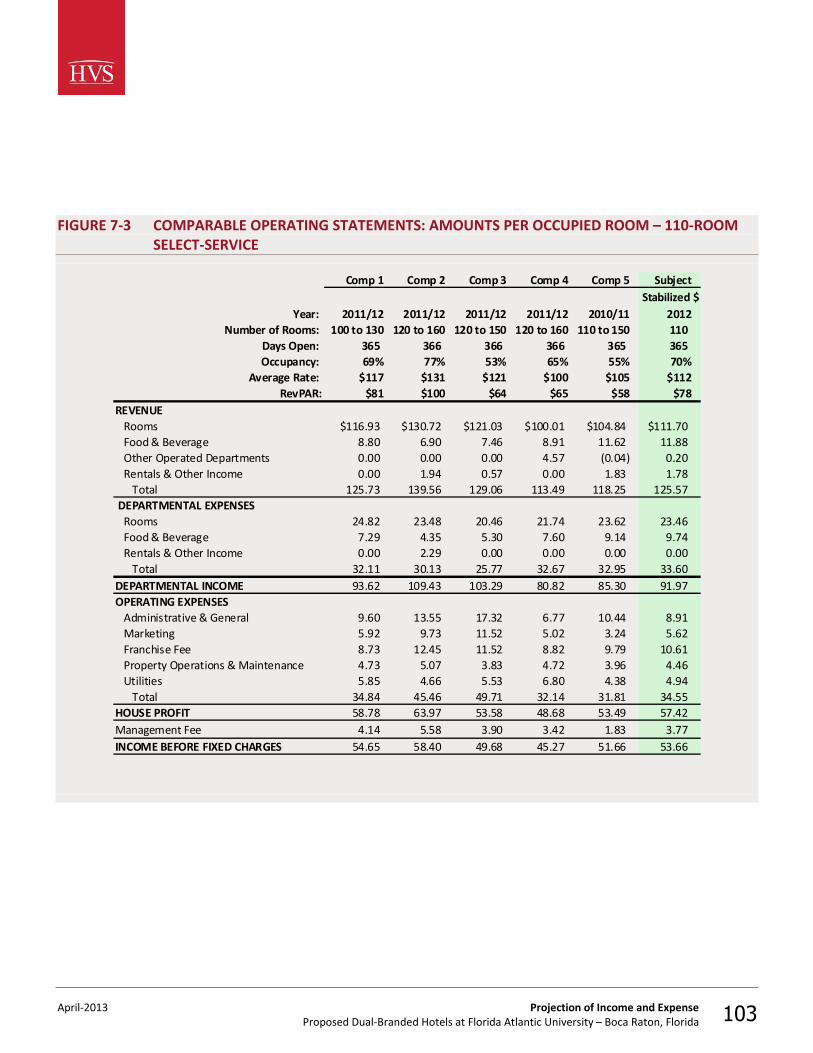
April-2013 Projection of Income and Expense Proposed Dual-Branded Hotels at Florida Atlantic University – Boca Raton, Florida 103
FIGURE 7-3 COMPARABLE OPERATING STATEMENTS: AMOUNTS PER OCCUPIED ROOM – 110-ROOM SELECT-SERVICE
Comp 1 Comp 2 Comp 3 Comp 4 Comp 5 Subject
Year: 2011/12 2011/12 2011/12 2011/12 2010/11 2012Number of Rooms: 100 to 130 120 to 160 120 to 150 120 to 160 110 to 150 110
Days Open: 365 366 366 366 365 365Occupancy: 69% 77% 53% 65% 55% 70%
Average Rate: $117 $131 $121 $100 $105 $112RevPAR: $81 $100 $64 $65 $58 $78
REVENUE Rooms $116.93 $130.72 $121.03 $100.01 $104.84 $111.70 Food & Beverage 8.80 6.90 7.46 8.91 11.62 11.88 Other Operated Departments 0.00 0.00 0.00 4.57 (0.04) 0.20 Rentals & Other Income 0.00 1.94 0.57 0.00 1.83 1.78 Total 125.73 139.56 129.06 113.49 118.25 125.57 DEPARTMENTAL EXPENSES Rooms 24.82 23.48 20.46 21.74 23.62 23.46 Food & Beverage 7.29 4.35 5.30 7.60 9.14 9.74 Rentals & Other Income 0.00 2.29 0.00 0.00 0.00 0.00 Total 32.11 30.13 25.77 32.67 32.95 33.60DEPARTMENTAL INCOME 93.62 109.43 103.29 80.82 85.30 91.97OPERATING EXPENSES Administrative & General 9.60 13.55 17.32 6.77 10.44 8.91 Marketing 5.92 9.73 11.52 5.02 3.24 5.62 Franchise Fee 8.73 12.45 11.52 8.82 9.79 10.61 Property Operations & Maintenance 4.73 5.07 3.83 4.72 3.96 4.46 Utilities 5.85 4.66 5.53 6.80 4.38 4.94 Total 34.84 45.46 49.71 32.14 31.81 34.55HOUSE PROFIT 58.78 63.97 53.58 48.68 53.49 57.42Management Fee 4.14 5.58 3.90 3.42 1.83 3.77INCOME BEFORE FIXED CHARGES 54.65 58.40 49.68 45.27 51.66 53.66
Stabilized $
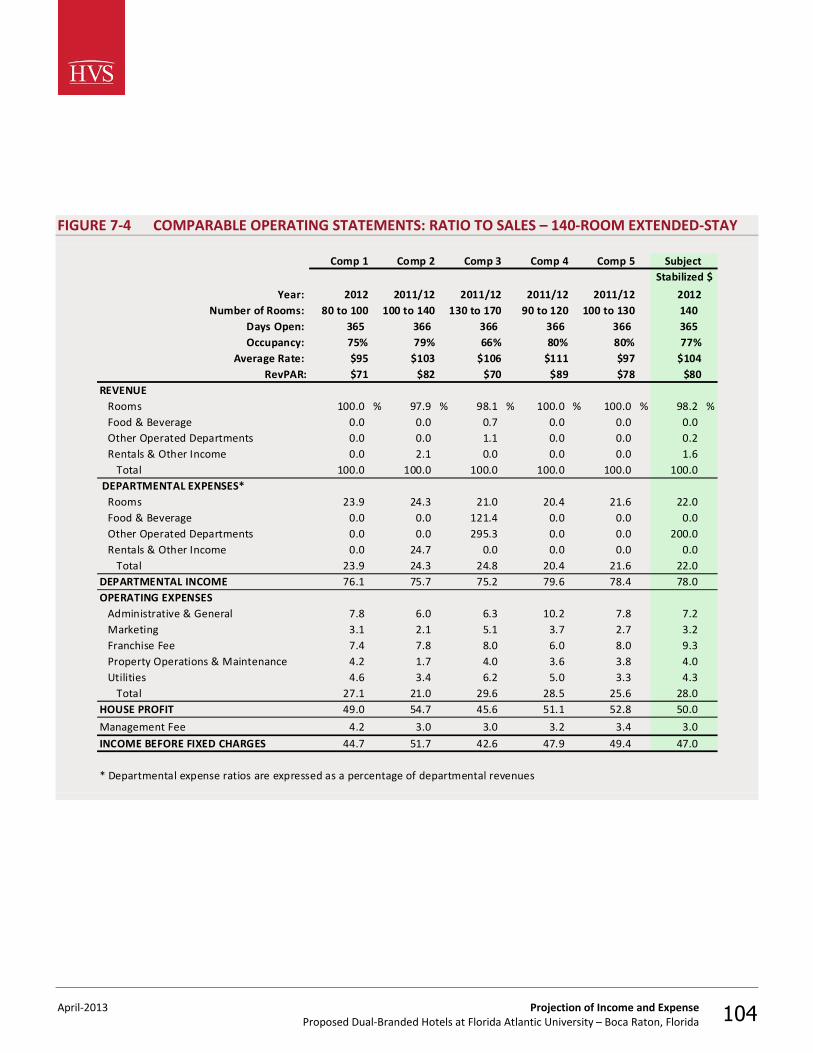
April-2013 Projection of Income and Expense Proposed Dual-Branded Hotels at Florida Atlantic University – Boca Raton, Florida 104
FIGURE 7-4 COMPARABLE OPERATING STATEMENTS: RATIO TO SALES – 140-ROOM EXTENDED-STAY
Comp 1 Comp 2 Comp 3 Comp 4 Comp 5 Subject
Year: 2012 2011/12 2011/12 2011/12 2011/12 2012Number of Rooms: 80 to 100 100 to 140 130 to 170 90 to 120 100 to 130 140
Days Open: 365 366 366 366 366 365Occupancy: 75% 79% 66% 80% 80% 77%
Average Rate: $95 $103 $106 $111 $97 $104RevPAR: $71 $82 $70 $89 $78 $80
REVENUE Rooms 100.0 % 97.9 % 98.1 % 100.0 % 100.0 % 98.2 % Food & Beverage 0.0 0.0 0.7 0.0 0.0 0.0 Other Operated Departments 0.0 0.0 1.1 0.0 0.0 0.2 Rentals & Other Income 0.0 2.1 0.0 0.0 0.0 1.6 Total 100.0 100.0 100.0 100.0 100.0 100.0 DEPARTMENTAL EXPENSES* Rooms 23.9 24.3 21.0 20.4 21.6 22.0 Food & Beverage 0.0 0.0 121.4 0.0 0.0 0.0 Other Operated Departments 0.0 0.0 295.3 0.0 0.0 200.0 Rentals & Other Income 0.0 24.7 0.0 0.0 0.0 0.0 Total 23.9 24.3 24.8 20.4 21.6 22.0DEPARTMENTAL INCOME 76.1 75.7 75.2 79.6 78.4 78.0OPERATING EXPENSES Administrative & General 7.8 6.0 6.3 10.2 7.8 7.2 Marketing 3.1 2.1 5.1 3.7 2.7 3.2 Franchise Fee 7.4 7.8 8.0 6.0 8.0 9.3 Property Operations & Maintenance 4.2 1.7 4.0 3.6 3.8 4.0 Utilities 4.6 3.4 6.2 5.0 3.3 4.3 Total 27.1 21.0 29.6 28.5 25.6 28.0HOUSE PROFIT 49.0 54.7 45.6 51.1 52.8 50.0
Management Fee 4.2 3.0 3.0 3.2 3.4 3.0INCOME BEFORE FIXED CHARGES 44.7 51.7 42.6 47.9 49.4 47.0
* Departmental expense ratios are expressed as a percentage of departmental revenues
Stabilized $
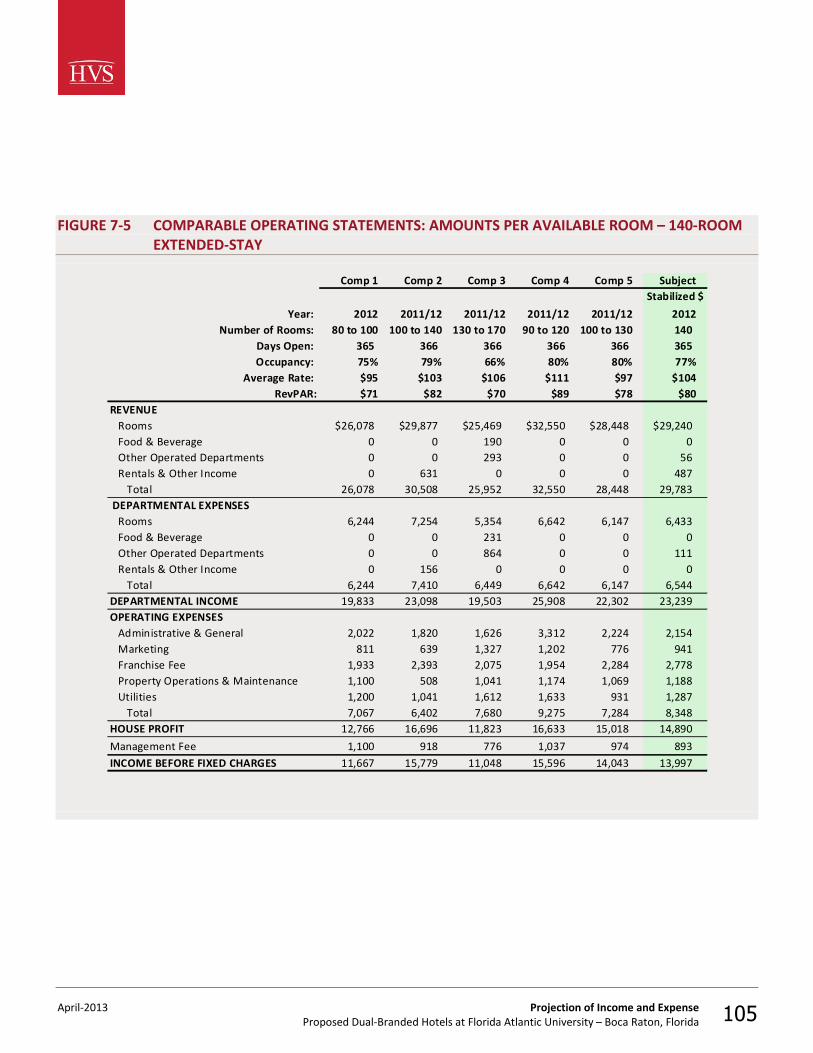
April-2013 Projection of Income and Expense Proposed Dual-Branded Hotels at Florida Atlantic University – Boca Raton, Florida 105
FIGURE 7-5 COMPARABLE OPERATING STATEMENTS: AMOUNTS PER AVAILABLE ROOM – 140-ROOM EXTENDED-STAY
Comp 1 Comp 2 Comp 3 Comp 4 Comp 5 Subject
Year: 2012 2011/12 2011/12 2011/12 2011/12 2012Number of Rooms: 80 to 100 100 to 140 130 to 170 90 to 120 100 to 130 140
Days Open: 365 366 366 366 366 365Occupancy: 75% 79% 66% 80% 80% 77%
Average Rate: $95 $103 $106 $111 $97 $104RevPAR: $71 $82 $70 $89 $78 $80
REVENUE Rooms $26,078 $29,877 $25,469 $32,550 $28,448 $29,240 Food & Beverage 0 0 190 0 0 0 Other Operated Departments 0 0 293 0 0 56 Rentals & Other Income 0 631 0 0 0 487 Total 26,078 30,508 25,952 32,550 28,448 29,783 DEPARTMENTAL EXPENSES Rooms 6,244 7,254 5,354 6,642 6,147 6,433 Food & Beverage 0 0 231 0 0 0 Other Operated Departments 0 0 864 0 0 111 Rentals & Other Income 0 156 0 0 0 0 Total 6,244 7,410 6,449 6,642 6,147 6,544DEPARTMENTAL INCOME 19,833 23,098 19,503 25,908 22,302 23,239OPERATING EXPENSES Administrative & General 2,022 1,820 1,626 3,312 2,224 2,154 Marketing 811 639 1,327 1,202 776 941 Franchise Fee 1,933 2,393 2,075 1,954 2,284 2,778 Property Operations & Maintenance 1,100 508 1,041 1,174 1,069 1,188 Utilities 1,200 1,041 1,612 1,633 931 1,287 Total 7,067 6,402 7,680 9,275 7,284 8,348HOUSE PROFIT 12,766 16,696 11,823 16,633 15,018 14,890
Management Fee 1,100 918 776 1,037 974 893INCOME BEFORE FIXED CHARGES 11,667 15,779 11,048 15,596 14,043 13,997
Stabilized $

April-2013 Projection of Income and Expense Proposed Dual-Branded Hotels at Florida Atlantic University – Boca Raton, Florida 106
FIGURE 7-6 COMPARABLE OPERATING STATEMENTS: AMOUNTS PER OCCUPIED ROOM – 140-ROOM EXTENDED-STAY
Comp 1 Comp 2 Comp 3 Comp 4 Comp 5 Subject
Year: 2012 2011/12 2011/12 2011/12 2011/12 2012Number of Rooms: 80 to 100 100 to 140 130 to 170 90 to 120 100 to 130 140
Days Open: 365 366 366 366 366 365Occupancy: 75% 79% 66% 80% 80% 77%
Average Rate: $95 $103 $106 $111 $97 $104RevPAR: $71 $82 $70 $89 $78 $80
REVENUE Rooms $95.32 $103.21 $105.70 $110.75 $96.75 $104.04 Food & Beverage 0.00 0.00 0.79 0.00 0.00 0.00 Other Operated Departments 0.00 0.00 1.21 0.00 0.00 0.20 Rentals & Other Income 0.00 2.18 0.00 0.00 0.00 1.73 Total 95.32 105.39 107.71 110.75 96.75 105.97 DEPARTMENTAL EXPENSES Rooms 22.83 25.06 22.22 22.60 20.90 22.89 Food & Beverage 0.00 0.00 0.96 0.00 0.00 0.00 Other Operated Departments 0.00 0.00 3.59 0.00 0.00 0.40 Rentals & Other Income 0.00 0.54 0.00 0.00 0.00 0.00 Total 22.83 25.60 26.76 22.60 20.90 23.28DEPARTMENTAL INCOME 72.50 79.79 80.94 88.15 75.85 82.69OPERATING EXPENSES Administrative & General 7.39 6.29 6.75 11.27 7.56 7.66 Marketing 2.96 2.21 5.51 4.09 2.64 3.35 Franchise Fee 7.07 8.27 8.61 6.65 7.77 9.88 Property Operations & Maintenance 4.02 1.76 4.32 4.00 3.64 4.23 Utilities 4.39 3.60 6.69 5.56 3.17 4.58 Total 25.83 22.11 31.88 31.56 24.77 29.70HOUSE PROFIT 46.67 57.68 49.07 56.59 51.07 52.98
Management Fee 4.02 3.17 3.22 3.53 3.31 3.18INCOME BEFORE FIXED CHARGES 42.64 54.50 45.85 53.07 47.76 49.80
Stabilized $
April-2013 Projection of Income and Expense Proposed Dual-Branded Hotels at Florida Atlantic University – Boca Raton, Florida 107
For the proposed select-service hotel, the comparables’ departmental income ranged from 71.2% to 80.0% of total revenue. The comparable properties achieved a house profit ranging from 41.5% to 46.8% of total revenue. For the proposed extended-stay hotel, the comparables’ departmental income ranged from 75.2% to 79.6% of total revenue. The comparable properties achieved a house profit ranging from 45.6% to 54.7% of total revenue. We will refer to the comparable operating data in our discussion of each line item, which follows later in this section of the report. HVS uses a fixed and variable component model to project a lodging facility's revenue and expense levels. This model is based on the premise that hotel revenues and expenses have one component that is fixed and another that varies directly with occupancy and facility usage. A projection can be made by taking a known level of revenue or expense and calculating its fixed and variable components. The fixed component is then increased in tandem with the underlying rate of inflation, while the variable component is adjusted for a specific measure of volume such as total revenue. The actual forecast is derived by adjusting each year’s revenue and expense by the amount fixed (the fixed expense multiplied by the inflated base-year amount) plus the variable amount (the variable expense multiplied by the inflated base-year amount) multiplied by the ratio of the projection year’s occupancy to the base-year occupancy (in the case of departmental revenue and expense) or the ratio of the projection year’s revenue to the base year’s revenue (in the case of undistributed operating expenses). Fixed expenses remain fixed, increasing only with inflation. Our discussion of the revenue and expense forecast in this report is based upon the output derived from the fixed and variable model. This forecast of revenue and expense is accomplished through a systematic approach, following the format of the Uniform System of Accounts for the Lodging Industry. Each category of revenue and expense is estimated separately and combined at the end in the final statement of income and expense. A general rate of inflation must be established that will be applied to most revenue and expense categories. The following table shows inflation estimates made by economists at some noted institutions and corporations.
Fixed and Variable Component Analysis
Inflation Assumption
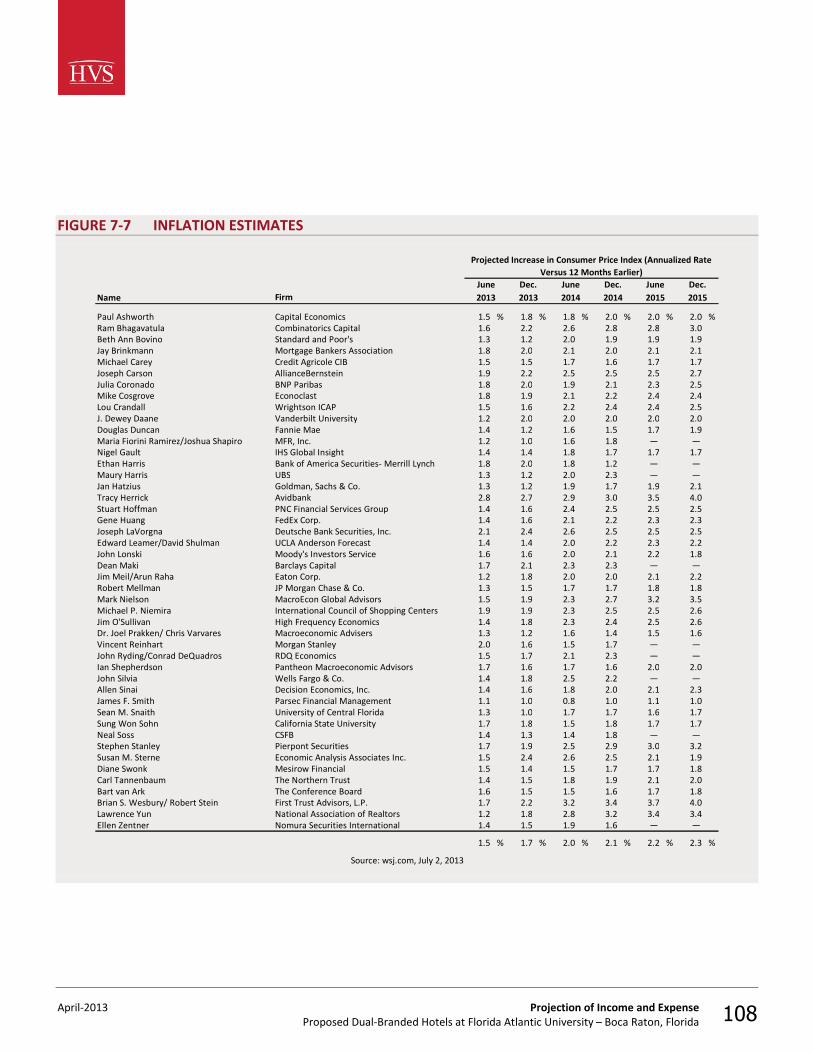
April-2013 Projection of Income and Expense Proposed Dual-Branded Hotels at Florida Atlantic University – Boca Raton, Florida 108
FIGURE 7-7 INFLATION ESTIMATES
June Dec. June Dec. June Dec.Name Firm 2013 2013 2014 2014 2015 2015
Paul Ashworth Capital Economics 1.5 % 1.8 % 1.8 % 2.0 % 2.0 % 2.0 %Ram Bhagavatula Combinatorics Capital 1.6 2.2 2.6 2.8 2.8 3.0Beth Ann Bovino Standard and Poor's 1.3 1.2 2.0 1.9 1.9 1.9Jay Brinkmann Mortgage Bankers Association 1.8 2.0 2.1 2.0 2.1 2.1Michael Carey Credit Agricole CIB 1.5 1.5 1.7 1.6 1.7 1.7Joseph Carson AllianceBernstein 1.9 2.2 2.5 2.5 2.5 2.7Julia Coronado BNP Paribas 1.8 2.0 1.9 2.1 2.3 2.5Mike Cosgrove Econoclast 1.8 1.9 2.1 2.2 2.4 2.4Lou Crandall Wrightson ICAP 1.5 1.6 2.2 2.4 2.4 2.5J. Dewey Daane Vanderbilt University 1.2 2.0 2.0 2.0 2.0 2.0Douglas Duncan Fannie Mae 1.4 1.2 1.6 1.5 1.7 1.9Maria Fiorini Ramirez/Joshua Shapiro MFR, Inc. 1.2 1.0 1.6 1.8 — — Nigel Gault IHS Global Insight 1.4 1.4 1.8 1.7 1.7 1.7Ethan Harris Bank of America Securities- Merrill Lynch 1.8 2.0 1.8 1.2 — — Maury Harris UBS 1.3 1.2 2.0 2.3 — — Jan Hatzius Goldman, Sachs & Co. 1.3 1.2 1.9 1.7 1.9 2.1Tracy Herrick Avidbank 2.8 2.7 2.9 3.0 3.5 4.0Stuart Hoffman PNC Financial Services Group 1.4 1.6 2.4 2.5 2.5 2.5Gene Huang FedEx Corp. 1.4 1.6 2.1 2.2 2.3 2.3Joseph LaVorgna Deutsche Bank Securities, Inc. 2.1 2.4 2.6 2.5 2.5 2.5Edward Leamer/David Shulman UCLA Anderson Forecast 1.4 1.4 2.0 2.2 2.3 2.2John Lonski Moody's Investors Service 1.6 1.6 2.0 2.1 2.2 1.8Dean Maki Barclays Capital 1.7 2.1 2.3 2.3 — — Jim Meil/Arun Raha Eaton Corp. 1.2 1.8 2.0 2.0 2.1 2.2Robert Mellman JP Morgan Chase & Co. 1.3 1.5 1.7 1.7 1.8 1.8Mark Nielson MacroEcon Global Advisors 1.5 1.9 2.3 2.7 3.2 3.5Michael P. Niemira International Council of Shopping Centers 1.9 1.9 2.3 2.5 2.5 2.6Jim O'Sullivan High Frequency Economics 1.4 1.8 2.3 2.4 2.5 2.6Dr. Joel Prakken/ Chris Varvares Macroeconomic Advisers 1.3 1.2 1.6 1.4 1.5 1.6Vincent Reinhart Morgan Stanley 2.0 1.6 1.5 1.7 — — John Ryding/Conrad DeQuadros RDQ Economics 1.5 1.7 2.1 2.3 — — Ian Shepherdson Pantheon Macroeconomic Advisors 1.7 1.6 1.7 1.6 2.0 2.0John Silvia Wells Fargo & Co. 1.4 1.8 2.5 2.2 — — Allen Sinai Decision Economics, Inc. 1.4 1.6 1.8 2.0 2.1 2.3James F. Smith Parsec Financial Management 1.1 1.0 0.8 1.0 1.1 1.0Sean M. Snaith University of Central Florida 1.3 1.0 1.7 1.7 1.6 1.7Sung Won Sohn California State University 1.7 1.8 1.5 1.8 1.7 1.7Neal Soss CSFB 1.4 1.3 1.4 1.8 — — Stephen Stanley Pierpont Securities 1.7 1.9 2.5 2.9 3.0 3.2Susan M. Sterne Economic Analysis Associates Inc. 1.5 2.4 2.6 2.5 2.1 1.9Diane Swonk Mesirow Financial 1.5 1.4 1.5 1.7 1.7 1.8Carl Tannenbaum The Northern Trust 1.4 1.5 1.8 1.9 2.1 2.0Bart van Ark The Conference Board 1.6 1.5 1.5 1.6 1.7 1.8Brian S. Wesbury/ Robert Stein First Trust Advisors, L.P. 1.7 2.2 3.2 3.4 3.7 4.0Lawrence Yun National Association of Realtors 1.2 1.8 2.8 3.2 3.4 3.4Ellen Zentner Nomura Securities International 1.4 1.5 1.9 1.6 — —
1.5 % 1.7 % 2.0 % 2.1 % 2.2 % 2.3 %
Source: wsj.com, July 2, 2013
Projected Increase in Consumer Price Index (Annualized Rate Versus 12 Months Earlier)
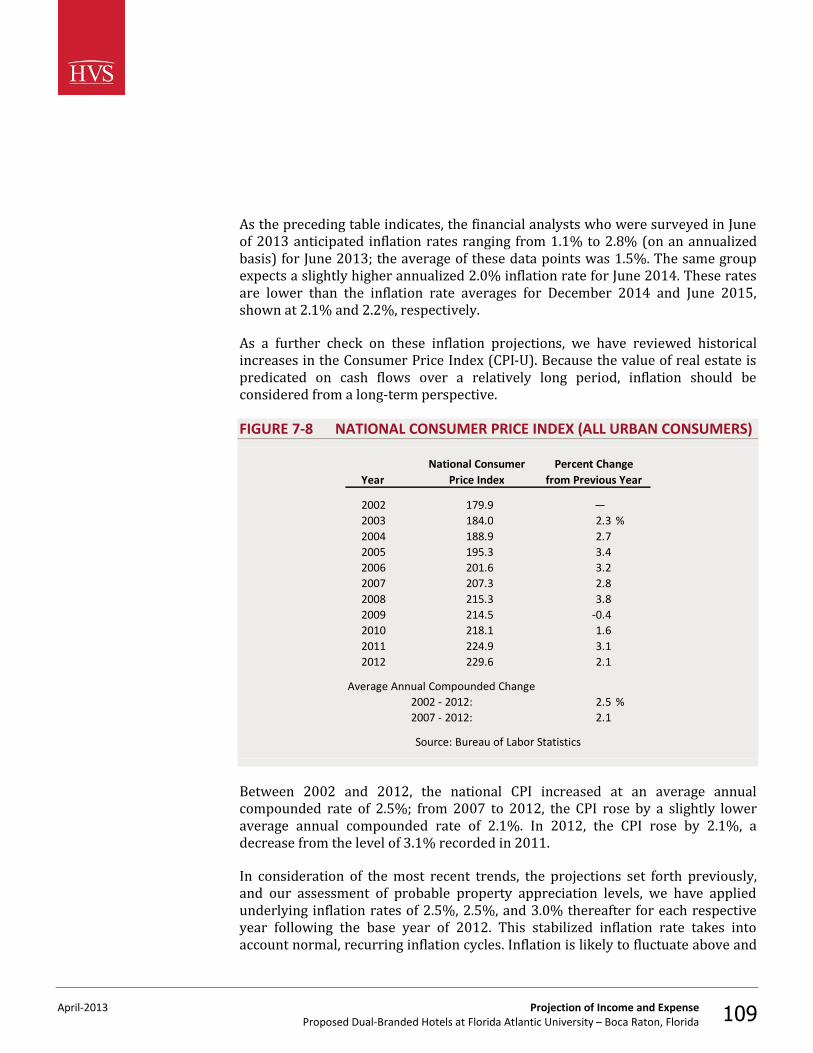
April-2013 Projection of Income and Expense Proposed Dual-Branded Hotels at Florida Atlantic University – Boca Raton, Florida 109
As the preceding table indicates, the financial analysts who were surveyed in June of 2013 anticipated inflation rates ranging from 1.1% to 2.8% (on an annualized basis) for June 2013; the average of these data points was 1.5%. The same group expects a slightly higher annualized 2.0% inflation rate for June 2014. These rates are lower than the inflation rate averages for December 2014 and June 2015, shown at 2.1% and 2.2%, respectively. As a further check on these inflation projections, we have reviewed historical increases in the Consumer Price Index (CPI-U). Because the value of real estate is predicated on cash flows over a relatively long period, inflation should be considered from a long-term perspective. FIGURE 7-8 NATIONAL CONSUMER PRICE INDEX (ALL URBAN CONSUMERS)
National Consumer Percent ChangeYear Price Index from Previous Year
2002 179.9 — 2003 184.0 2.3 %2004 188.9 2.72005 195.3 3.42006 201.6 3.22007 207.3 2.82008 215.3 3.82009 214.5 -0.42010 218.1 1.62011 224.9 3.12012 229.6 2.1
Average Annual Compounded Change2002 - 2012: 2.5 %2007 - 2012: 2.1
Source: Bureau of Labor Statistics
Between 2002 and 2012, the national CPI increased at an average annual compounded rate of 2.5%; from 2007 to 2012, the CPI rose by a slightly lower average annual compounded rate of 2.1%. In 2012, the CPI rose by 2.1%, a decrease from the level of 3.1% recorded in 2011. In consideration of the most recent trends, the projections set forth previously, and our assessment of probable property appreciation levels, we have applied underlying inflation rates of 2.5%, 2.5%, and 3.0% thereafter for each respective year following the base year of 2012. This stabilized inflation rate takes into account normal, recurring inflation cycles. Inflation is likely to fluctuate above and
April-2013 Projection of Income and Expense Proposed Dual-Branded Hotels at Florida Atlantic University – Boca Raton, Florida 110
below this level during the projection period. Any exceptions to the application of the assumed underlying inflation rate are discussed in our write-up of individual income and expense items. Based on an analysis that will be detailed throughout this section, we have formulated a forecast of income and expense for each hotel, followed by a forecast for the overall proposed subject property. The first tables present detailed forecasts through the fifth projection year, including amounts per available room and per occupied room. The second tables illustrate our ten-year forecast of income and expense, presented with a lesser degree of detail. The forecasts pertain to years that begin on January 1, 2016, expressed in inflated dollars for each year.
Summary of Projections
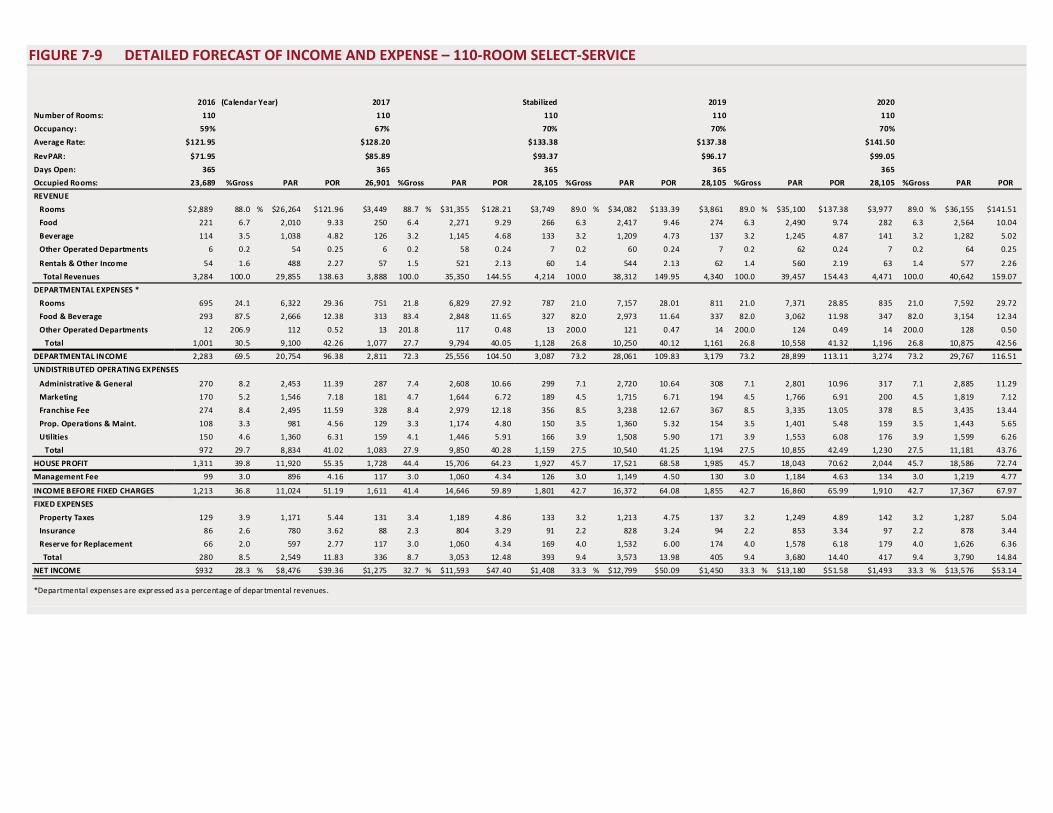
FIGURE 7-9 DETAILED FORECAST OF INCOME AND EXPENSE – 110-ROOM SELECT-SERVICE
2016 (Calendar Year) 2017 Stabilized 2019 2020
Number of Rooms: 110 110 110 110 110
Occupancy: 59% 67% 70% 70% 70%
Average Rate: $121.95 $128.20 $133.38 $137.38 $141.50
RevPAR: $71.95 $85.89 $93.37 $96.17 $99.05
Days Open: 365 365 365 365 365
Occupied Rooms: 23,689 %Gross PAR POR 26,901 %Gross PAR POR 28,105 %Gross PAR POR 28,105 %Gross PAR POR 28,105 %Gross PAR POR
REVENUE
Rooms $2,889 88.0 % $26,264 $121.96 $3,449 88.7 % $31,355 $128.21 $3,749 89.0 % $34,082 $133.39 $3,861 89.0 % $35,100 $137.38 $3,977 89.0 % $36,155 $141.51
Food 221 6.7 2,010 9.33 250 6.4 2,271 9.29 266 6.3 2,417 9.46 274 6.3 2,490 9.74 282 6.3 2,564 10.04
Beverage 114 3.5 1,038 4.82 126 3.2 1,145 4.68 133 3.2 1,209 4.73 137 3.2 1,245 4.87 141 3.2 1,282 5.02
Other Operated Departments 6 0.2 54 0.25 6 0.2 58 0.24 7 0.2 60 0.24 7 0.2 62 0.24 7 0.2 64 0.25
Rentals & Other Income 54 1.6 488 2.27 57 1.5 521 2.13 60 1.4 544 2.13 62 1.4 560 2.19 63 1.4 577 2.26
Total Revenues 3,284 100.0 29,855 138.63 3,888 100.0 35,350 144.55 4,214 100.0 38,312 149.95 4,340 100.0 39,457 154.43 4,471 100.0 40,642 159.07
DEPARTMENTAL EXPENSES *
Rooms 695 24.1 6,322 29.36 751 21.8 6,829 27.92 787 21.0 7,157 28.01 811 21.0 7,371 28.85 835 21.0 7,592 29.72
Food & Beverage 293 87.5 2,666 12.38 313 83.4 2,848 11.65 327 82.0 2,973 11.64 337 82.0 3,062 11.98 347 82.0 3,154 12.34
Other Operated Departments 12 206.9 112 0.52 13 201.8 117 0.48 13 200.0 121 0.47 14 200.0 124 0.49 14 200.0 128 0.50
Total 1,001 30.5 9,100 42.26 1,077 27.7 9,794 40.05 1,128 26.8 10,250 40.12 1,161 26.8 10,558 41.32 1,196 26.8 10,875 42.56
DEPARTMENTAL INCOME 2,283 69.5 20,754 96.38 2,811 72.3 25,556 104.50 3,087 73.2 28,061 109.83 3,179 73.2 28,899 113.11 3,274 73.2 29,767 116.51
UNDISTRIBUTED OPERATING EXPENSES
Administrative & General 270 8.2 2,453 11.39 287 7.4 2,608 10.66 299 7.1 2,720 10.64 308 7.1 2,801 10.96 317 7.1 2,885 11.29
Marketing 170 5.2 1,546 7.18 181 4.7 1,644 6.72 189 4.5 1,715 6.71 194 4.5 1,766 6.91 200 4.5 1,819 7.12
Franchise Fee 274 8.4 2,495 11.59 328 8.4 2,979 12.18 356 8.5 3,238 12.67 367 8.5 3,335 13.05 378 8.5 3,435 13.44
Prop. Operations & Maint. 108 3.3 981 4.56 129 3.3 1,174 4.80 150 3.5 1,360 5.32 154 3.5 1,401 5.48 159 3.5 1,443 5.65
Utilities 150 4.6 1,360 6.31 159 4.1 1,446 5.91 166 3.9 1,508 5.90 171 3.9 1,553 6.08 176 3.9 1,599 6.26
Total 972 29.7 8,834 41.02 1,083 27.9 9,850 40.28 1,159 27.5 10,540 41.25 1,194 27.5 10,855 42.49 1,230 27.5 11,181 43.76
HOUSE PROFIT 1,311 39.8 11,920 55.35 1,728 44.4 15,706 64.23 1,927 45.7 17,521 68.58 1,985 45.7 18,043 70.62 2,044 45.7 18,586 72.74
Management Fee 99 3.0 896 4.16 117 3.0 1,060 4.34 126 3.0 1,149 4.50 130 3.0 1,184 4.63 134 3.0 1,219 4.77
INCOME BEFORE FIXED CHARGES 1,213 36.8 11,024 51.19 1,611 41.4 14,646 59.89 1,801 42.7 16,372 64.08 1,855 42.7 16,860 65.99 1,910 42.7 17,367 67.97
FIXED EXPENSES
Property Taxes 129 3.9 1,171 5.44 131 3.4 1,189 4.86 133 3.2 1,213 4.75 137 3.2 1,249 4.89 142 3.2 1,287 5.04
Insurance 86 2.6 780 3.62 88 2.3 804 3.29 91 2.2 828 3.24 94 2.2 853 3.34 97 2.2 878 3.44
Reserve for Replacement 66 2.0 597 2.77 117 3.0 1,060 4.34 169 4.0 1,532 6.00 174 4.0 1,578 6.18 179 4.0 1,626 6.36
Total 280 8.5 2,549 11.83 336 8.7 3,053 12.48 393 9.4 3,573 13.98 405 9.4 3,680 14.40 417 9.4 3,790 14.84
NET INCOME $932 28.3 % $8,476 $39.36 $1,275 32.7 % $11,593 $47.40 $1,408 33.3 % $12,799 $50.09 $1,450 33.3 % $13,180 $51.58 $1,493 33.3 % $13,576 $53.14
*Departmental expenses are expr essed as a percentage of depar tmental revenues.
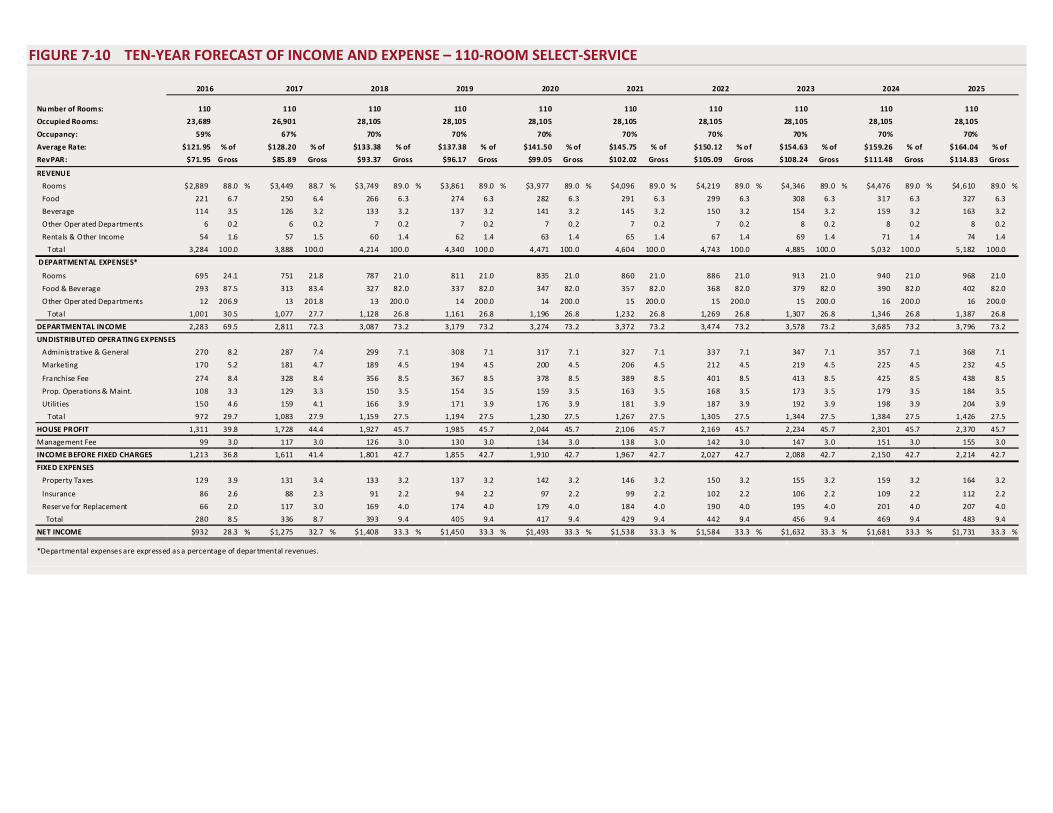
FIGURE 7-10 TEN-YEAR FORECAST OF INCOME AND EXPENSE – 110-ROOM SELECT-SERVICE
2016 2017 2018 2019 2020 2021 2022 2023 2024 2025
Nu mber of Rooms: 110 110 110 110 110 110 110 110 110 110
Occupied Rooms: 23,689 26,901 28,105 28,105 28,105 28,105 28,105 28,105 28,105 28,105
Occupancy: 59% 67% 70% 70% 70% 70% 70% 70% 70% 70%
Average Rate: $121.95 % of $128.20 % of $133.38 % of $137.38 % of $141.50 % of $145.75 % of $150.12 % of $154.63 % of $159.26 % of $164.04
RevPAR: $71.95 Gross $85.89 Gross $93.37 Gross $96.17 Gross $99.05 Gr oss $102.02 Gross $105.09 Gross $108.24 Gross $111.48 Gross $114.83
REVENUE
Rooms $2,889 88.0 % $3,449 88.7 % $3,749 89.0 % $3,861 89.0 % $3,977 89.0 % $4,096 89.0 % $4,219 89.0 % $4,346 89.0 % $4,476 89.0 % $4,610 89.0 %
Food 221 6.7 250 6.4 266 6.3 274 6.3 282 6.3 291 6.3 299 6.3 308 6.3 317 6.3 327 6.3
Beverage 114 3.5 126 3.2 133 3.2 137 3.2 141 3.2 145 3.2 150 3.2 154 3.2 159 3.2 163 3.2
Other Oper ated Departments 6 0.2 6 0.2 7 0.2 7 0.2 7 0.2 7 0.2 7 0.2 8 0.2 8 0.2 8 0.2
Rentals & Other Income 54 1.6 57 1.5 60 1.4 62 1.4 63 1.4 65 1.4 67 1.4 69 1.4 71 1.4 74 1.4
Total 3,284 100.0 3,888 100.0 4,214 100.0 4,340 100.0 4,471 100.0 4,604 100.0 4,743 100.0 4,885 100.0 5,032 100.0 5,182 100.0
DEPARTMENTAL EXPENSES*
Rooms 695 24.1 751 21.8 787 21.0 811 21.0 835 21.0 860 21.0 886 21.0 913 21.0 940 21.0 968 21.0
Food & Beverage 293 87.5 313 83.4 327 82.0 337 82.0 347 82.0 357 82.0 368 82.0 379 82.0 390 82.0 402 82.0
Other Oper ated Departments 12 206.9 13 201.8 13 200.0 14 200.0 14 200.0 15 200.0 15 200.0 15 200.0 16 200.0 16 200.0
Total 1,001 30.5 1,077 27.7 1,128 26.8 1,161 26.8 1,196 26.8 1,232 26.8 1,269 26.8 1,307 26.8 1,346 26.8 1,387 26.8
DEPARTMENTAL INCOME 2,283 69.5 2,811 72.3 3,087 73.2 3,179 73.2 3,274 73.2 3,372 73.2 3,474 73.2 3,578 73.2 3,685 73.2 3,796 73.2
UNDISTRIBUTED OPERATING EXPENSES
Administrative & General 270 8.2 287 7.4 299 7.1 308 7.1 317 7.1 327 7.1 337 7.1 347 7.1 357 7.1 368 7.1
Marketing 170 5.2 181 4.7 189 4.5 194 4.5 200 4.5 206 4.5 212 4.5 219 4.5 225 4.5 232 4.5
Franchise Fee 274 8.4 328 8.4 356 8.5 367 8.5 378 8.5 389 8.5 401 8.5 413 8.5 425 8.5 438 8.5
Prop. Operations & Maint. 108 3.3 129 3.3 150 3.5 154 3.5 159 3.5 163 3.5 168 3.5 173 3.5 179 3.5 184 3.5
Utilities 150 4.6 159 4.1 166 3.9 171 3.9 176 3.9 181 3.9 187 3.9 192 3.9 198 3.9 204 3.9
Total 972 29.7 1,083 27.9 1,159 27.5 1,194 27.5 1,230 27.5 1,267 27.5 1,305 27.5 1,344 27.5 1,384 27.5 1,426 27.5
HOUSE PROFIT 1,311 39.8 1,728 44.4 1,927 45.7 1,985 45.7 2,044 45.7 2,106 45.7 2,169 45.7 2,234 45.7 2,301 45.7 2,370 45.7
Management Fee 99 3.0 117 3.0 126 3.0 130 3.0 134 3.0 138 3.0 142 3.0 147 3.0 151 3.0 155 3.0
INCOME BEFORE FIXED CHARGES 1,213 36.8 1,611 41.4 1,801 42.7 1,855 42.7 1,910 42.7 1,967 42.7 2,027 42.7 2,088 42.7 2,150 42.7 2,214 42.7
FIXED EXPENSES
Property Taxes 129 3.9 131 3.4 133 3.2 137 3.2 142 3.2 146 3.2 150 3.2 155 3.2 159 3.2 164 3.2
Insurance 86 2.6 88 2.3 91 2.2 94 2.2 97 2.2 99 2.2 102 2.2 106 2.2 109 2.2 112 2.2
Reser ve for Replacement 66 2.0 117 3.0 169 4.0 174 4.0 179 4.0 184 4.0 190 4.0 195 4.0 201 4.0 207 4.0
Total 280 8.5 336 8.7 393 9.4 405 9.4 417 9.4 429 9.4 442 9.4 456 9.4 469 9.4 483 9.4
NET INCOME $932 28.3 % $1,275 32.7 % $1,408 33.3 % $1,450 33.3 % $1,493 33.3 % $1,538 33.3 % $1,584 33.3 % $1,632 33.3 % $1,681 33.3 % $1,731 33.3 %1 1 1 1 1 1 1 1 1 1
*Departmental expenses are expressed as a percentage of depar tmental revenues.
% of
Gross
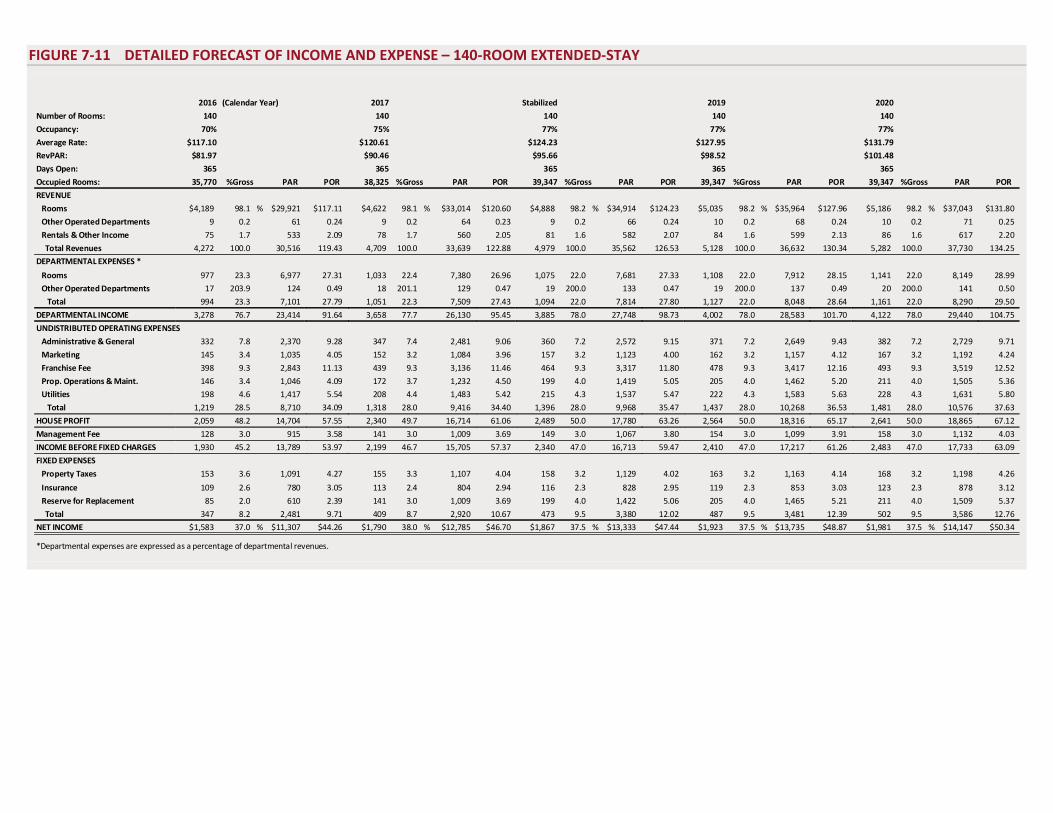
FIGURE 7-11 DETAILED FORECAST OF INCOME AND EXPENSE – 140-ROOM EXTENDED-STAY
2016 (Calendar Year) 2017 Stabilized 2019 2020
Number of Rooms: 140 140 140 140 140
Occupancy: 70% 75% 77% 77% 77%
Average Rate: $117.10 $120.61 $124.23 $127.95 $131.79
RevPAR: $81.97 $90.46 $95.66 $98.52 $101.48
Days Open: 365 365 365 365 365
Occupied Rooms: 35,770 %Gross PAR POR 38,325 %Gross PAR POR 39,347 %Gross PAR POR 39,347 %Gross PAR POR 39,347 %Gross PAR POR
REVENUE
Rooms $4,189 98.1 % $29,921 $117.11 $4,622 98.1 % $33,014 $120.60 $4,888 98.2 % $34,914 $124.23 $5,035 98.2 % $35,964 $127.96 $5,186 98.2 % $37,043 $131.80
Other Operated Departments 9 0.2 61 0.24 9 0.2 64 0.23 9 0.2 66 0.24 10 0.2 68 0.24 10 0.2 71 0.25
Rentals & Other Income 75 1.7 533 2.09 78 1.7 560 2.05 81 1.6 582 2.07 84 1.6 599 2.13 86 1.6 617 2.20
Total Revenues 4,272 100.0 30,516 119.43 4,709 100.0 33,639 122.88 4,979 100.0 35,562 126.53 5,128 100.0 36,632 130.34 5,282 100.0 37,730 134.25
DEPARTMENTAL EXPENSES *
Rooms 977 23.3 6,977 27.31 1,033 22.4 7,380 26.96 1,075 22.0 7,681 27.33 1,108 22.0 7,912 28.15 1,141 22.0 8,149 28.99
Other Operated Departments 17 203.9 124 0.49 18 201.1 129 0.47 19 200.0 133 0.47 19 200.0 137 0.49 20 200.0 141 0.50
Total 994 23.3 7,101 27.79 1,051 22.3 7,509 27.43 1,094 22.0 7,814 27.80 1,127 22.0 8,048 28.64 1,161 22.0 8,290 29.50
DEPARTMENTAL INCOME 3,278 76.7 23,414 91.64 3,658 77.7 26,130 95.45 3,885 78.0 27,748 98.73 4,002 78.0 28,583 101.70 4,122 78.0 29,440 104.75
UNDISTRIBUTED OPERATING EXPENSES
Administrative & General 332 7.8 2,370 9.28 347 7.4 2,481 9.06 360 7.2 2,572 9.15 371 7.2 2,649 9.43 382 7.2 2,729 9.71
Marketing 145 3.4 1,035 4.05 152 3.2 1,084 3.96 157 3.2 1,123 4.00 162 3.2 1,157 4.12 167 3.2 1,192 4.24
Franchise Fee 398 9.3 2,843 11.13 439 9.3 3,136 11.46 464 9.3 3,317 11.80 478 9.3 3,417 12.16 493 9.3 3,519 12.52
Prop. Operations & Maint. 146 3.4 1,046 4.09 172 3.7 1,232 4.50 199 4.0 1,419 5.05 205 4.0 1,462 5.20 211 4.0 1,505 5.36
Utilities 198 4.6 1,417 5.54 208 4.4 1,483 5.42 215 4.3 1,537 5.47 222 4.3 1,583 5.63 228 4.3 1,631 5.80
Total 1,219 28.5 8,710 34.09 1,318 28.0 9,416 34.40 1,396 28.0 9,968 35.47 1,437 28.0 10,268 36.53 1,481 28.0 10,576 37.63
HOUSE PROFIT 2,059 48.2 14,704 57.55 2,340 49.7 16,714 61.06 2,489 50.0 17,780 63.26 2,564 50.0 18,316 65.17 2,641 50.0 18,865 67.12
Management Fee 128 3.0 915 3.58 141 3.0 1,009 3.69 149 3.0 1,067 3.80 154 3.0 1,099 3.91 158 3.0 1,132 4.03
INCOME BEFORE FIXED CHARGES 1,930 45.2 13,789 53.97 2,199 46.7 15,705 57.37 2,340 47.0 16,713 59.47 2,410 47.0 17,217 61.26 2,483 47.0 17,733 63.09
FIXED EXPENSES
Property Taxes 153 3.6 1,091 4.27 155 3.3 1,107 4.04 158 3.2 1,129 4.02 163 3.2 1,163 4.14 168 3.2 1,198 4.26
Insurance 109 2.6 780 3.05 113 2.4 804 2.94 116 2.3 828 2.95 119 2.3 853 3.03 123 2.3 878 3.12
Reserve for Replacement 85 2.0 610 2.39 141 3.0 1,009 3.69 199 4.0 1,422 5.06 205 4.0 1,465 5.21 211 4.0 1,509 5.37
Total 347 8.2 2,481 9.71 409 8.7 2,920 10.67 473 9.5 3,380 12.02 487 9.5 3,481 12.39 502 9.5 3,586 12.76
NET INCOME $1,583 37.0 % $11,307 $44.26 $1,790 38.0 % $12,785 $46.70 $1,867 37.5 % $13,333 $47.44 $1,923 37.5 % $13,735 $48.87 $1,981 37.5 % $14,147 $50.34
*Departmental expenses are expressed as a percentage of departmental revenues.
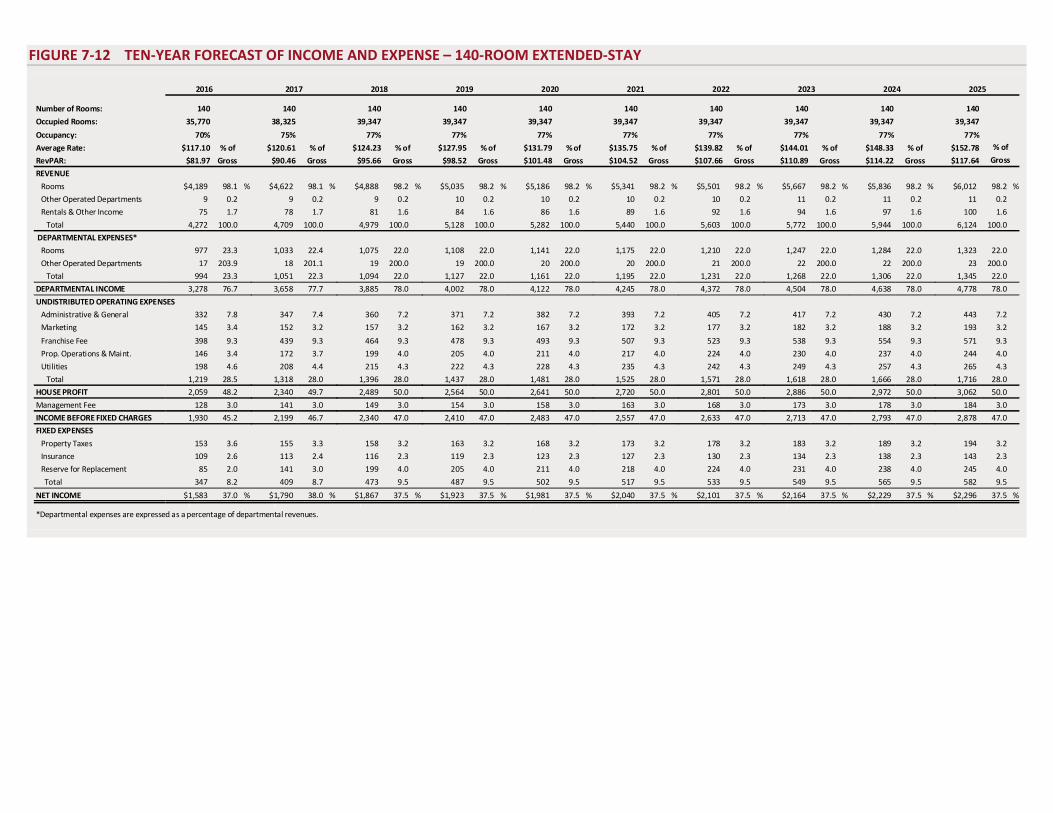
FIGURE 7-12 TEN-YEAR FORECAST OF INCOME AND EXPENSE – 140-ROOM EXTENDED-STAY
2016 2017 2018 2019 2020 2021 2022 2023 2024 2025
Number of Rooms: 140 140 140 140 140 140 140 140 140 140
Occupied Rooms: 35,770 38,325 39,347 39,347 39,347 39,347 39,347 39,347 39,347 39,347
Occupancy: 70% 75% 77% 77% 77% 77% 77% 77% 77% 77%
Average Rate: $117.10 % of $120.61 % of $124.23 % of $127.95 % of $131.79 % of $135.75 % of $139.82 % of $144.01 % of $148.33 % of $152.78
RevPAR: $81.97 Gross $90.46 Gross $95.66 Gross $98.52 Gross $101.48 Gross $104.52 Gross $107.66 Gross $110.89 Gross $114.22 Gross $117.64
REVENUE
Rooms $4,189 98.1 % $4,622 98.1 % $4,888 98.2 % $5,035 98.2 % $5,186 98.2 % $5,341 98.2 % $5,501 98.2 % $5,667 98.2 % $5,836 98.2 % $6,012 98.2 %
Other Operated Departments 9 0.2 9 0.2 9 0.2 10 0.2 10 0.2 10 0.2 10 0.2 11 0.2 11 0.2 11 0.2
Rentals & Other Income 75 1.7 78 1.7 81 1.6 84 1.6 86 1.6 89 1.6 92 1.6 94 1.6 97 1.6 100 1.6
Total 4,272 100.0 4,709 100.0 4,979 100.0 5,128 100.0 5,282 100.0 5,440 100.0 5,603 100.0 5,772 100.0 5,944 100.0 6,124 100.0
DEPARTMENTAL EXPENSES*
Rooms 977 23.3 1,033 22.4 1,075 22.0 1,108 22.0 1,141 22.0 1,175 22.0 1,210 22.0 1,247 22.0 1,284 22.0 1,323 22.0
Other Operated Departments 17 203.9 18 201.1 19 200.0 19 200.0 20 200.0 20 200.0 21 200.0 22 200.0 22 200.0 23 200.0
Total 994 23.3 1,051 22.3 1,094 22.0 1,127 22.0 1,161 22.0 1,195 22.0 1,231 22.0 1,268 22.0 1,306 22.0 1,345 22.0
DEPARTMENTAL INCOME 3,278 76.7 3,658 77.7 3,885 78.0 4,002 78.0 4,122 78.0 4,245 78.0 4,372 78.0 4,504 78.0 4,638 78.0 4,778 78.0
UNDISTRIBUTED OPERATING EXPENSES
Administrative & General 332 7.8 347 7.4 360 7.2 371 7.2 382 7.2 393 7.2 405 7.2 417 7.2 430 7.2 443 7.2
Marketing 145 3.4 152 3.2 157 3.2 162 3.2 167 3.2 172 3.2 177 3.2 182 3.2 188 3.2 193 3.2
Franchise Fee 398 9.3 439 9.3 464 9.3 478 9.3 493 9.3 507 9.3 523 9.3 538 9.3 554 9.3 571 9.3
Prop. Operations & Maint. 146 3.4 172 3.7 199 4.0 205 4.0 211 4.0 217 4.0 224 4.0 230 4.0 237 4.0 244 4.0
Utilities 198 4.6 208 4.4 215 4.3 222 4.3 228 4.3 235 4.3 242 4.3 249 4.3 257 4.3 265 4.3
Total 1,219 28.5 1,318 28.0 1,396 28.0 1,437 28.0 1,481 28.0 1,525 28.0 1,571 28.0 1,618 28.0 1,666 28.0 1,716 28.0
HOUSE PROFIT 2,059 48.2 2,340 49.7 2,489 50.0 2,564 50.0 2,641 50.0 2,720 50.0 2,801 50.0 2,886 50.0 2,972 50.0 3,062 50.0
Management Fee 128 3.0 141 3.0 149 3.0 154 3.0 158 3.0 163 3.0 168 3.0 173 3.0 178 3.0 184 3.0
INCOME BEFORE FIXED CHARGES 1,930 45.2 2,199 46.7 2,340 47.0 2,410 47.0 2,483 47.0 2,557 47.0 2,633 47.0 2,713 47.0 2,793 47.0 2,878 47.0
FIXED EXPENSES
Property Taxes 153 3.6 155 3.3 158 3.2 163 3.2 168 3.2 173 3.2 178 3.2 183 3.2 189 3.2 194 3.2
Insurance 109 2.6 113 2.4 116 2.3 119 2.3 123 2.3 127 2.3 130 2.3 134 2.3 138 2.3 143 2.3
Reserve for Replacement 85 2.0 141 3.0 199 4.0 205 4.0 211 4.0 218 4.0 224 4.0 231 4.0 238 4.0 245 4.0
Total 347 8.2 409 8.7 473 9.5 487 9.5 502 9.5 517 9.5 533 9.5 549 9.5 565 9.5 582 9.5
NET INCOME $1,583 37.0 % $1,790 38.0 % $1,867 37.5 % $1,923 37.5 % $1,981 37.5 % $2,040 37.5 % $2,101 37.5 % $2,164 37.5 % $2,229 37.5 % $2,296 37.5 %1 1 1 1 1 1 1 1 1 1
*Departmental expenses are expressed as a percentage of departmental revenues.
% of
Gross
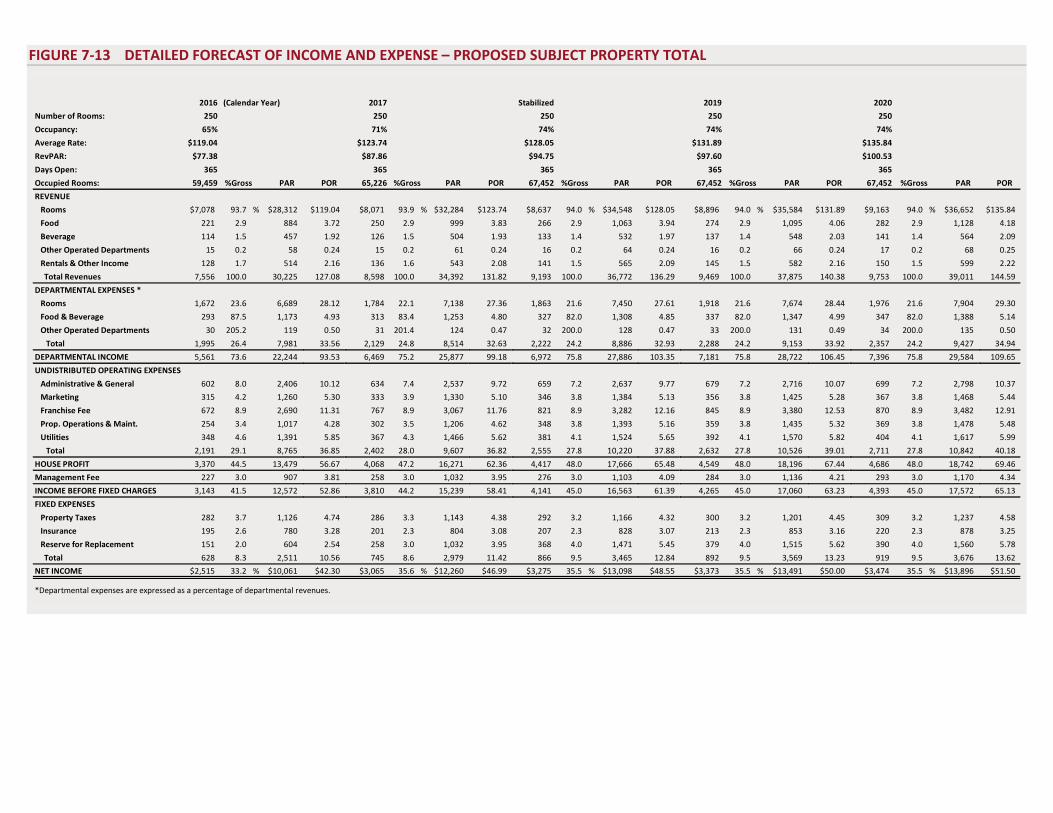
FIGURE 7-13 DETAILED FORECAST OF INCOME AND EXPENSE – PROPOSED SUBJECT PROPERTY TOTAL
2016 (Calendar Year) 2017 Stabilized 2019 2020
Number of Rooms: 250 250 250 250 250
Occupancy: 65% 71% 74% 74% 74%
Average Rate: $119.04 $123.74 $128.05 $131.89 $135.84
RevPAR: $77.38 $87.86 $94.75 $97.60 $100.53
Days Open: 365 365 365 365 365
Occupied Rooms: 59,459 %Gross PAR POR 65,226 %Gross PAR POR 67,452 %Gross PAR POR 67,452 %Gross PAR POR 67,452 %Gross PAR POR
REVENUE
Rooms $7,078 93.7 % $28,312 $119.04 $8,071 93.9 % $32,284 $123.74 $8,637 94.0 % $34,548 $128.05 $8,896 94.0 % $35,584 $131.89 $9,163 94.0 % $36,652 $135.84
Food 221 2.9 884 3.72 250 2.9 999 3.83 266 2.9 1,063 3.94 274 2.9 1,095 4.06 282 2.9 1,128 4.18
Beverage 114 1.5 457 1.92 126 1.5 504 1.93 133 1.4 532 1.97 137 1.4 548 2.03 141 1.4 564 2.09
Other Operated Departments 15 0.2 58 0.24 15 0.2 61 0.24 16 0.2 64 0.24 16 0.2 66 0.24 17 0.2 68 0.25
Rentals & Other Income 128 1.7 514 2.16 136 1.6 543 2.08 141 1.5 565 2.09 145 1.5 582 2.16 150 1.5 599 2.22
Total Revenues 7,556 100.0 30,225 127.08 8,598 100.0 34,392 131.82 9,193 100.0 36,772 136.29 9,469 100.0 37,875 140.38 9,753 100.0 39,011 144.59
DEPARTMENTAL EXPENSES *
Rooms 1,672 23.6 6,689 28.12 1,784 22.1 7,138 27.36 1,863 21.6 7,450 27.61 1,918 21.6 7,674 28.44 1,976 21.6 7,904 29.30
Food & Beverage 293 87.5 1,173 4.93 313 83.4 1,253 4.80 327 82.0 1,308 4.85 337 82.0 1,347 4.99 347 82.0 1,388 5.14
Other Operated Departments 30 205.2 119 0.50 31 201.4 124 0.47 32 200.0 128 0.47 33 200.0 131 0.49 34 200.0 135 0.50
Total 1,995 26.4 7,981 33.56 2,129 24.8 8,514 32.63 2,222 24.2 8,886 32.93 2,288 24.2 9,153 33.92 2,357 24.2 9,427 34.94
DEPARTMENTAL INCOME 5,561 73.6 22,244 93.53 6,469 75.2 25,877 99.18 6,972 75.8 27,886 103.35 7,181 75.8 28,722 106.45 7,396 75.8 29,584 109.65
UNDISTRIBUTED OPERATING EXPENSES
Administrative & General 602 8.0 2,406 10.12 634 7.4 2,537 9.72 659 7.2 2,637 9.77 679 7.2 2,716 10.07 699 7.2 2,798 10.37
Marketing 315 4.2 1,260 5.30 333 3.9 1,330 5.10 346 3.8 1,384 5.13 356 3.8 1,425 5.28 367 3.8 1,468 5.44
Franchise Fee 672 8.9 2,690 11.31 767 8.9 3,067 11.76 821 8.9 3,282 12.16 845 8.9 3,380 12.53 870 8.9 3,482 12.91
Prop. Operations & Maint. 254 3.4 1,017 4.28 302 3.5 1,206 4.62 348 3.8 1,393 5.16 359 3.8 1,435 5.32 369 3.8 1,478 5.48
Utilities 348 4.6 1,391 5.85 367 4.3 1,466 5.62 381 4.1 1,524 5.65 392 4.1 1,570 5.82 404 4.1 1,617 5.99
Total 2,191 29.1 8,765 36.85 2,402 28.0 9,607 36.82 2,555 27.8 10,220 37.88 2,632 27.8 10,526 39.01 2,711 27.8 10,842 40.18
HOUSE PROFIT 3,370 44.5 13,479 56.67 4,068 47.2 16,271 62.36 4,417 48.0 17,666 65.48 4,549 48.0 18,196 67.44 4,686 48.0 18,742 69.46
Management Fee 227 3.0 907 3.81 258 3.0 1,032 3.95 276 3.0 1,103 4.09 284 3.0 1,136 4.21 293 3.0 1,170 4.34
INCOME BEFORE FIXED CHARGES 3,143 41.5 12,572 52.86 3,810 44.2 15,239 58.41 4,141 45.0 16,563 61.39 4,265 45.0 17,060 63.23 4,393 45.0 17,572 65.13
FIXED EXPENSES
Property Taxes 282 3.7 1,126 4.74 286 3.3 1,143 4.38 292 3.2 1,166 4.32 300 3.2 1,201 4.45 309 3.2 1,237 4.58
Insurance 195 2.6 780 3.28 201 2.3 804 3.08 207 2.3 828 3.07 213 2.3 853 3.16 220 2.3 878 3.25
Reserve for Replacement 151 2.0 604 2.54 258 3.0 1,032 3.95 368 4.0 1,471 5.45 379 4.0 1,515 5.62 390 4.0 1,560 5.78
Total 628 8.3 2,511 10.56 745 8.6 2,979 11.42 866 9.5 3,465 12.84 892 9.5 3,569 13.23 919 9.5 3,676 13.62
NET INCOME $2,515 33.2 % $10,061 $42.30 $3,065 35.6 % $12,260 $46.99 $3,275 35.5 % $13,098 $48.55 $3,373 35.5 % $13,491 $50.00 $3,474 35.5 % $13,896 $51.50
*Departmental expenses are expressed as a percentage of departmental revenues.
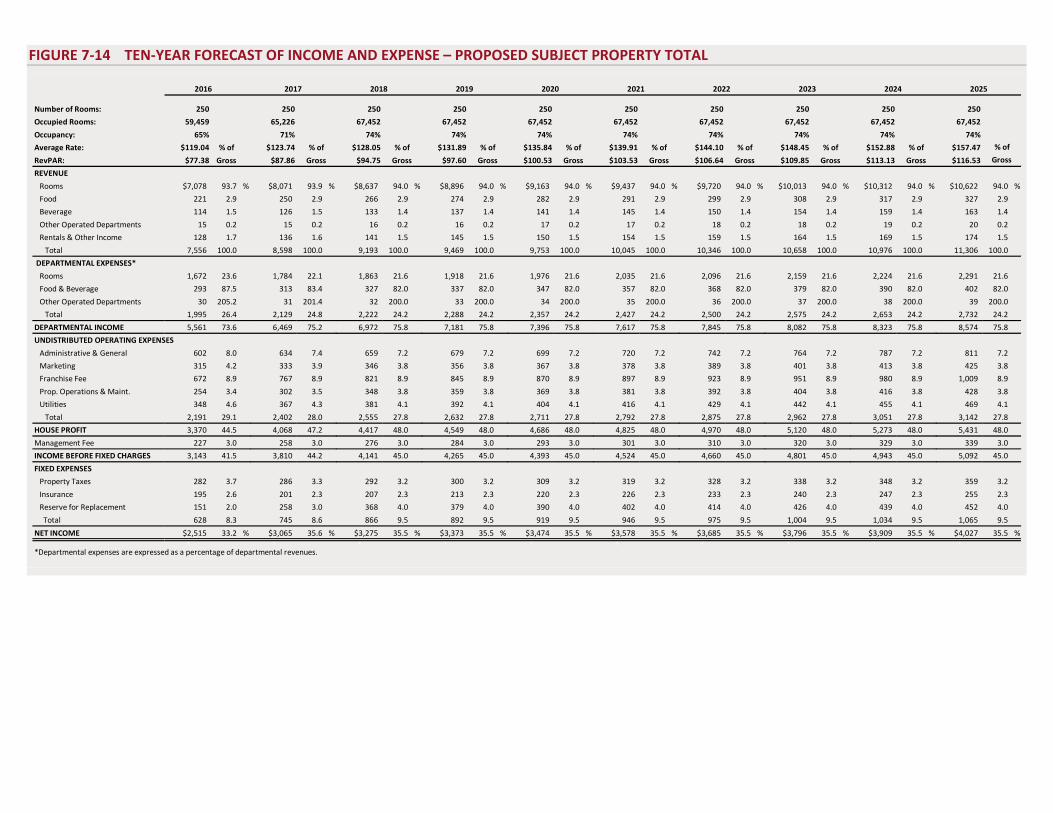
FIGURE 7-14 TEN-YEAR FORECAST OF INCOME AND EXPENSE – PROPOSED SUBJECT PROPERTY TOTAL
2016 2017 2018 2019 2020 2021 2022 2023 2024 2025
Number of Rooms: 250 250 250 250 250 250 250 250 250 250
Occupied Rooms: 59,459 65,226 67,452 67,452 67,452 67,452 67,452 67,452 67,452 67,452
Occupancy: 65% 71% 74% 74% 74% 74% 74% 74% 74% 74%
Average Rate: $119.04 % of $123.74 % of $128.05 % of $131.89 % of $135.84 % of $139.91 % of $144.10 % of $148.45 % of $152.88 % of $157.47
RevPAR: $77.38 Gross $87.86 Gross $94.75 Gross $97.60 Gross $100.53 Gross $103.53 Gross $106.64 Gross $109.85 Gross $113.13 Gross $116.53
REVENUE
Rooms $7,078 93.7 % $8,071 93.9 % $8,637 94.0 % $8,896 94.0 % $9,163 94.0 % $9,437 94.0 % $9,720 94.0 % $10,013 94.0 % $10,312 94.0 % $10,622 94.0 %
Food 221 2.9 250 2.9 266 2.9 274 2.9 282 2.9 291 2.9 299 2.9 308 2.9 317 2.9 327 2.9
Beverage 114 1.5 126 1.5 133 1.4 137 1.4 141 1.4 145 1.4 150 1.4 154 1.4 159 1.4 163 1.4
Other Operated Departments 15 0.2 15 0.2 16 0.2 16 0.2 17 0.2 17 0.2 18 0.2 18 0.2 19 0.2 20 0.2
Rentals & Other Income 128 1.7 136 1.6 141 1.5 145 1.5 150 1.5 154 1.5 159 1.5 164 1.5 169 1.5 174 1.5
Total 7,556 100.0 8,598 100.0 9,193 100.0 9,469 100.0 9,753 100.0 10,045 100.0 10,346 100.0 10,658 100.0 10,976 100.0 11,306 100.0
DEPARTMENTAL EXPENSES*
Rooms 1,672 23.6 1,784 22.1 1,863 21.6 1,918 21.6 1,976 21.6 2,035 21.6 2,096 21.6 2,159 21.6 2,224 21.6 2,291 21.6
Food & Beverage 293 87.5 313 83.4 327 82.0 337 82.0 347 82.0 357 82.0 368 82.0 379 82.0 390 82.0 402 82.0
Other Operated Departments 30 205.2 31 201.4 32 200.0 33 200.0 34 200.0 35 200.0 36 200.0 37 200.0 38 200.0 39 200.0
Total 1,995 26.4 2,129 24.8 2,222 24.2 2,288 24.2 2,357 24.2 2,427 24.2 2,500 24.2 2,575 24.2 2,653 24.2 2,732 24.2
DEPARTMENTAL INCOME 5,561 73.6 6,469 75.2 6,972 75.8 7,181 75.8 7,396 75.8 7,617 75.8 7,845 75.8 8,082 75.8 8,323 75.8 8,574 75.8
UNDISTRIBUTED OPERATING EXPENSES
Administrative & General 602 8.0 634 7.4 659 7.2 679 7.2 699 7.2 720 7.2 742 7.2 764 7.2 787 7.2 811 7.2
Marketing 315 4.2 333 3.9 346 3.8 356 3.8 367 3.8 378 3.8 389 3.8 401 3.8 413 3.8 425 3.8
Franchise Fee 672 8.9 767 8.9 821 8.9 845 8.9 870 8.9 897 8.9 923 8.9 951 8.9 980 8.9 1,009 8.9
Prop. Operations & Maint. 254 3.4 302 3.5 348 3.8 359 3.8 369 3.8 381 3.8 392 3.8 404 3.8 416 3.8 428 3.8
Utilities 348 4.6 367 4.3 381 4.1 392 4.1 404 4.1 416 4.1 429 4.1 442 4.1 455 4.1 469 4.1
Total 2,191 29.1 2,402 28.0 2,555 27.8 2,632 27.8 2,711 27.8 2,792 27.8 2,875 27.8 2,962 27.8 3,051 27.8 3,142 27.8
HOUSE PROFIT 3,370 44.5 4,068 47.2 4,417 48.0 4,549 48.0 4,686 48.0 4,825 48.0 4,970 48.0 5,120 48.0 5,273 48.0 5,431 48.0
Management Fee 227 3.0 258 3.0 276 3.0 284 3.0 293 3.0 301 3.0 310 3.0 320 3.0 329 3.0 339 3.0
INCOME BEFORE FIXED CHARGES 3,143 41.5 3,810 44.2 4,141 45.0 4,265 45.0 4,393 45.0 4,524 45.0 4,660 45.0 4,801 45.0 4,943 45.0 5,092 45.0
FIXED EXPENSES
Property Taxes 282 3.7 286 3.3 292 3.2 300 3.2 309 3.2 319 3.2 328 3.2 338 3.2 348 3.2 359 3.2
Insurance 195 2.6 201 2.3 207 2.3 213 2.3 220 2.3 226 2.3 233 2.3 240 2.3 247 2.3 255 2.3
Reserve for Replacement 151 2.0 258 3.0 368 4.0 379 4.0 390 4.0 402 4.0 414 4.0 426 4.0 439 4.0 452 4.0
Total 628 8.3 745 8.6 866 9.5 892 9.5 919 9.5 946 9.5 975 9.5 1,004 9.5 1,034 9.5 1,065 9.5
NET INCOME $2,515 33.2 % $3,065 35.6 % $3,275 35.5 % $3,373 35.5 % $3,474 35.5 % $3,578 35.5 % $3,685 35.5 % $3,796 35.5 % $3,909 35.5 % $4,027 35.5 %1 1 1 1 1 1 1 1 1 1
*Departmental expenses are expressed as a percentage of departmental revenues.
% of
Gross
April-2013 Projection of Income and Expense Proposed Dual-Branded Hotels at Florida Atlantic University – Boca Raton, Florida 117
The following description sets forth the basis for the forecast of income and expense. We anticipate that it will take three years for both subject hotels to reach stabilized levels of operation. Each revenue and expense item has been forecast based upon our review of the proposed subject property's operating budget and comparable income and expense statements. The forecast is based upon calendar years beginning January 1, 2016, expressed in inflated dollars for each year. Rooms revenue is determined by two variables: occupancy and average rate. We projected occupancy and average rate in a previous section of this report. The proposed select-service hotel is expected to stabilize at an occupancy level of 70% with an average rate of $133.38 in 2018. Meanwhile, the proposed extended-stay hotel is expected to stabilize at an occupancy level of 77% with an average rate of $124.23 in 2018. Following the stabilized year, the subject hotels’ average rates are projected to increase along with the underlying rate of inflation. Food and beverage revenue is generated by a hotel's restaurants, lounges, coffee shops, snack bars, banquet rooms, and room service. In addition to providing a source of revenue, these outlets serve as an amenity that assists in the sale of guestrooms. With the exception of properties with active lounges or banquet facilities that draw local residents, in-house guests generally represent a substantial percentage of a hotel's food and beverage patrons. In the case of the proposed select-service hotel, the food and beverage department will include a restaurant and lounge, while the food and beverage department of the proposed extended-stay hotel will include a breakfast dining area; moreover, shared banquet space is expected to span 10,000 square feet. Although food and beverage revenue varies directly with changes in occupancy, the small portion generated by banquet sales and outside capture is relatively fixed. The comparable statements illustrated food and beverage revenue between 5.3% and 11.1% of rooms revenue, or $6.90 and $11.62 per occupied room. The food and beverage operation of the proposed subject property's select-service hotel is expected to be an important component. Therefore, based upon our review of comparable operating statements, we have positioned an appropriate revenue level given the hotel's planned facility and price point. We would expect future moderate growth to occur within this category after the hotel's opening. We note that the proposed subject property's extended-stay hotel is not expected to include a revenue-generating food and beverage operation. We project food and beverage revenue for the select-service hotel to be $9.33 and $4.82 per occupied room, respectively, in the first projection year, or respectively 7.7% and 4.0% of rooms revenue. These per-occupied-room amounts increase to $9.46 and $4.73 for respective food and beverage revenue categories by the stabilized year, or respectively 7.1% and 3.5% of rooms revenue. On a percentage of food revenue,
Forecast of Income and Expense
Rooms Revenue
Food and Beverage Revenue
April-2013 Projection of Income and Expense Proposed Dual-Branded Hotels at Florida Atlantic University – Boca Raton, Florida 118
beverage revenue is forecast at 51.7% in the first projection year, stabilizing at 50.0%. According to the Uniform System of Accounts, other operated departments include any major or minor operated department other than rooms and food and beverage. These departmental revenues and expenses are presented in the other operated departments revenue and expense line items on a summary operating statement; sub-schedules set forth the individual departmental revenues and expenses in more detail. Any other operated departments revenue and expense may be presented in the summary statement if it is considered a significant factor in the hotel’s operation. Telephone revenue and expense is now considered a component of other operated departments and is being reported as a separate line item more infrequently now that telephone revenue has become so inconsequential. The proposed subject hotels' other operated departments revenue sources are expected to include each hotel's telephone charges. Based on our review of operations with a similar extent of offerings, we have positioned an appropriate revenue level for each proposed hotel. For the proposed select-service hotel, the comparable operating statements illustrate other operated departments revenue ranging from 4.6% to 4.6% of rooms revenue and $4.57 to $4.57 per occupied room. We forecast this hotel’s other operated departments revenue to stabilize at 0.2% of rooms revenue or $0.24 per occupied room by the stabilized year, 2018. For the proposed extended-stay hotel, the comparable operating statements illustrate other operated departments revenue ranging from 1.1% to 1.1% of rooms revenue and $1.21 to $1.21 per occupied room. We forecast this hotel’s other operated departments revenue to stabilize at 0.2% of rooms revenue or $0.24 per occupied room by the stabilized year, 2018. The rentals and other income sources comprise those other than guestrooms, food and beverage, and the other operated departments. The proposed subject hotels' rentals and other income revenues are expected to be generated primarily by each hotels' market pantry, meeting space rentals, business center services, in-room movie and game charges, and vending areas, as well as the guest laundry fees of the extended-stay hotel. Based on our review of operations with a similar extent of offerings, we have positioned an appropriate revenue level for the proposed subject property. In the case of the proposed select-service hotel, rentals and other income revenue for the comparables ranged 0.5% to 1.7% of rooms revenue or $0.57 to $1.94 on a per-occupied-room basis. Changes in this revenue item through the projection period result from the application of the underlying inflation rate and projected changes in occupancy. We forecast this hotel’s rentals
Other Operated Departments Revenue
Rentals & Other Income
April-2013 Projection of Income and Expense Proposed Dual-Branded Hotels at Florida Atlantic University – Boca Raton, Florida 119
and other income to stabilize at $2.13 per occupied room by the stabilized year, 2018. In the case of the proposed extended-stay hotel, rentals and other income revenue for the comparables ranged 2.1% to 2.1% of rooms revenue or $2.18 to $2.18 on a per-occupied-room basis. Changes in this revenue item through the projection period result from the application of the underlying inflation rate and projected changes in occupancy. We forecast this hotel’s rentals and other income to stabilize at $2.07 per occupied room by the stabilized year, 2018. Rooms expense consists of items related to the sale and upkeep of guestrooms and public space. Salaries, wages, and employee benefits account for a substantial portion of this category. Although payroll varies somewhat with occupancy and managers can generally scale the level of service staff on hand to meet an expected occupancy level, much of a hotel's payroll is fixed. A base level of front desk personnel, housekeepers, and supervisors must be maintained at all times. As a result, salaries, wages, and employee benefits are only moderately sensitive to changes in occupancy. Commissions and reservations are usually based on room sales, and thus are highly sensitive to changes in occupancy and average rate. While guest supplies vary 100% with occupancy, linens and other operating expenses are only slightly affected by volume. For the proposed select-service hotel, the comparables illustrated rooms expense ranging between 16.9% and 22.5% of rooms revenue; on a per-occupied-room basis, the range was between $20.46 and $24.82. We have projected rooms expense for this hotel at 24.1% in the first year (or $29.36 per occupied room), stabilizing at 21.0% in 2018 (or $28.01 per occupied room). For the proposed extended-stay hotel, the comparables illustrated rooms expense ranging between 20.4% and 24.3% of rooms revenue; on a per-occupied-room basis, the range was between $20.90 and $25.06. We have projected rooms expense for this hotel at 23.3% in the first year (or $27.31 per occupied room), stabilizing at 22.0% in 2018 (or $27.33 per occupied room). The rooms department expense for each proposed hotel has been positioned based upon our review of the comparable operating data and our understanding of each hotel's future service level and price point. Food expenses consist of items necessary for the primary operation of a hotel's food and banquet facilities. The costs associated with food sales and payroll are moderately to highly correlated to food revenues. Items such as china, linen and uniforms are less dependent on volume. Although the other expense items are
Rooms Expense
Food and Beverage Expense
April-2013 Projection of Income and Expense Proposed Dual-Branded Hotels at Florida Atlantic University – Boca Raton, Florida 120
basically fixed, they represent a relatively insignificant factor. Beverage expenses consist of items necessary for the operation of a hotel’s lounge and bar areas. The costs associated with beverage sales and payroll are moderately to highly correlated to beverage revenues. In the case of the proposed select-service hotel, the comparables illustrate food and beverage expense ranging between 63.1% and 85.3% of food and beverage revenue. We have projected a stabilized expense ratio of 82.0% in 2018. The proposed select-service hotel's food and beverage operation is expected to be efficiently managed and operate at an expense level that is in line with other comparable operations. Other operated departments expense includes all expenses reflected in the summary statements for the divisions associated in these categories. This was previously discussed in this chapter. For the proposed select-service hotel, the comparables illustrated other operated departments expense ranging between $0.00 and $3.33 per occupied room. We have projected a stabilized expense ratio of 200.0% in 2018. For the proposed extended-stay hotel, the comparables illustrated other operated departments expense ranging between $0.00 and $3.59 per occupied room. We have projected a stabilized expense ratio of 200.0% in 2018. The proposed subject hotels' other operated departments revenue sources are expected to include each hotel's telephone charges. Based on our review of operations with a similar extent of offerings, we have positioned an appropriate revenue level for each proposed hotel. Administrative and general expense includes the salaries and wages of all administrative personnel who are not directly associated with a particular department. Expense items related to the management and operation of the property are also allocated to this category. Most administrative and general expenses are relatively fixed. The exceptions are cash overages and shortages; commissions on credit card charges; provision for doubtful accounts, which are moderately affected by the number of transactions or total revenue; and salaries, wages, and benefits, which are very slightly influenced by volume. As a percentage of total revenue, the comparable operations for the proposed select-service hotel indicate an administrative and general expense range from 6.0% to 13.4%, or $1,606 to $3,800 per available room. The comparable operations for the proposed extended-stay hotel indicate an administrative and general expense range from 6.0% to 10.2%, or $1,626 to $3,312 per available
Other Operated Departments Expense
Administrative and General Expense
April-2013 Projection of Income and Expense Proposed Dual-Branded Hotels at Florida Atlantic University – Boca Raton, Florida 121
room. Based upon our review of the comparable operating data and the expected scope of the proposed hotels, we have positioned the administrative and general expense level for each hotel at a market- and property-supported level. In the first projection year, we have projected administrative and general expense for the proposed select-service hotel to be $2,453 per available room, or 8.2% of total revenue. By the 2018 stabilized year, these amounts change to $2,720 per available room and 7.1% of total revenue. In the first projection year, we have projected administrative and general expense for the proposed extended-stay hotel to be $2,370 per available room, or 7.8% of total revenue. By the 2018 stabilized year, these amounts change to $2,572 per available room and 7.2% of total revenue. Marketing expense consists of all costs associated with advertising, sales, and promotion; these activities are intended to attract and retain customers. Marketing can be used to create an image, develop customer awareness, and stimulate patronage of a property's various facilities. The marketing category is unique in that all expense items, with the exception of fees and commissions, are totally controlled by management. Most hotel operators establish an annual marketing budget that sets forth all planned expenditures. If the budget is followed, total marketing expenses can be projected accurately. Marketing expenditures are unusual because although there is a lag period before results are realized, the benefits are often extended over a long period. Depending on the type and scope of the advertising and promotion program implemented, the lag time can be as short as a few weeks or as long as several years. However, the favorable results of an effective marketing campaign tend to linger, and a property often enjoys the benefits of concentrated sales efforts for many months. As a percentage of total revenue, the comparable operations for the proposed select-service hotel indicate a marketing expense range from 2.7% to 8.9%, or $654 to $2,729 per available room. The comparable operations for the proposed extended-stay hotel indicate a marketing expense range from 2.1% to 5.1%, or $639 to $1,327 per available room. Based upon our review of the comparable operating data and the expected scope of the proposed hotels, we have positioned the marketing expense level for each hotel at a market- and property-supported level. In the first projection year, we have projected marketing expense for the proposed select-service hotel to be $1,546 per available room, or 5.2% of total revenue. By
Marketing Expense
April-2013 Projection of Income and Expense Proposed Dual-Branded Hotels at Florida Atlantic University – Boca Raton, Florida 122
the 2018 stabilized year, these amounts change to $1,715 per available room and 4.5% of total revenue. In the first projection year, we have projected marketing expense for the proposed extended-stay to be $1,035 per available room, or 3.4% of total revenue. By the 2018 stabilized year, these amounts change to $1,123 per available room and 3.2% of total revenue. As previously discussed, the franchise affiliation of the proposed subject property has not yet been finalized. The franchise costs reflected in our forecasts are representative of select-service and extended-stay pairings available in the market. Property operations and maintenance expense is another expense category that is largely controlled by management. Except for repairs that are necessary to keep the facility open and prevent damage (e.g., plumbing, heating, and electrical items), most maintenance can be deferred for varying lengths of time. Maintenance is an accumulating expense. If management elects to postpone performing a required repair, they have not eliminated or saved the expenditure; they have only deferred payment until a later date. A lodging facility that operates with a lower-than-normal maintenance budget is likely to accumulate a considerable amount of deferred maintenance. The age of a lodging facility has a strong influence on the required level of maintenance. A new or thoroughly renovated property is protected for several years by modern equipment and manufacturers' warranties. However, as a hostelry grows older, maintenance expenses escalate. A well-organized preventive maintenance system often helps delay deterioration, but most facilities face higher property operations and maintenance costs each year, regardless of the occupancy trend. The quality of initial construction can also have a direct impact on future maintenance requirements. The use of high-quality building materials and construction methods generally reduces the need for maintenance expenditures over the long term. As a percentage of total revenue, the comparable operations for the proposed select-service hotel indicate a property operations and maintenance expense range from 3.0% to 4.2%, or $743 to $1,421 per available room. The comparable operations for the proposed extended-stay hotel indicate a property operations and maintenance expense range from 1.7% to 4.2%, or $508 to $1,174 per available room. We expect each hotel's maintenance operation to be well managed, and expense levels should stabilize at typical levels for properties of this type.
Franchise Fee
Property Operations and Maintenance
April-2013 Projection of Income and Expense Proposed Dual-Branded Hotels at Florida Atlantic University – Boca Raton, Florida 123
Changes in this expense item through the projection period result from the application of the underlying inflation rate and projected changes in occupancy. In the first projection year, we have projected property operations and maintenance expense for the proposed select-service hotel to be $981 per available room, or 3.3% of total revenue. By the 2018 stabilized year, these amounts change to $1,360 per available room and 3.5% of total revenue. In the first projection year, we have projected property operations and maintenance expense for the proposed extended-stay hotel to be $1,046 per available room, or 3.4% of total revenue. By the 2018 stabilized year, these amounts change to $1,419 per available room and 4.0% of total revenue. The utilities consumption of a lodging facility takes several forms, including water and space heating, air conditioning, lighting, cooking fuel, and other miscellaneous power requirements. The most common sources of hotel utilities are electricity, natural gas, fuel oil, and steam. This category also includes the cost of water service. Total energy cost depends on the source and quantity of fuel used. Electricity tends to be the most expensive source, followed by oil and gas. Although all hotels consume a sizable amount of electricity, many properties supplement their utility requirements with less expensive sources, such as gas and oil, for heating and cooking. As a percentage of total revenue, the comparable operations for the proposed select-service hotel indicate a utilities expense range from 3.3% to 6.0%, or $885 to $1,613 per available room. The changes in this utilities line item through the projection period are a result of the application of the underlying inflation rate and projected changes in occupancy. In the first projection year, we have projected utilities expense for this hotel to be $1,360 per available room, or 4.6% of total revenue. By the 2018 stabilized year, these amounts change to $1,508 per available room and 3.9% of total revenue. The comparable operations for the proposed extended-stay hotel indicate a utilities expense range from 3.3% to 6.2%, or $931 to $1,633 per available room. In the first projection year, we have projected utilities expense for this hotel to be $1,417 per available room, or 4.6% of total revenue. By the 2018 stabilized year, these amounts change to $1,537 per available room and 4.3% of total revenue. Management expense consists of the fees paid to the managing agent contracted to operate the property. Some companies provide management services and a brand-name affiliation (first-tier management company), while others provide
Utilities Expense
Management Fee
April-2013 Projection of Income and Expense Proposed Dual-Branded Hotels at Florida Atlantic University – Boca Raton, Florida 124
management services alone (second-tier management company). Some management contracts specify only a base fee (usually a percentage of total revenue), while others call for both a base fee and an incentive fee (usually a percentage of defined profit). Basic hotel management fees are often based on a percentage of total revenue, which means they have no fixed component. While base fees typically range from 2% to 4% of total revenue, incentive fees are deal-specific and often are calculated as a percentage of income available after debt service and, in some cases, after a preferred return on equity. Total management fees for the subject property have been forecast at 3.0% of total revenue. Property (or ad valorem) tax is one of the primary revenue sources of municipalities. Based on the concept that the tax burden should be distributed in proportion to the value of all properties within a taxing jurisdiction, a system of assessments is established. Theoretically, the assessed value placed on each parcel bears a definite relationship to market value, so properties with equal market values will have similar assessments and properties with higher and lower values will have proportionately larger and smaller assessments. Depending on the taxing policy of the municipality, property taxes can be based on the value of the real property or the value of the personal property and the real property. We have based our estimate of the proposed subject property's market value (for tax purposes) on an analysis of assessments of comparable hotel properties in the local municipality.
FIGURE 7-15 COUNTY-ASSESSED VALUE OF COMPARABLE HOTELS - 110-ROOM SELECT-SERVICE
NumberHotel of Rooms Total
Courtyard by Marriott Boca Raton 152 $7,402,084 $139,033 $7,541,117Residence Inn by Marriott Boca Raton 120 4,620,000 922,164 5,542,164Hampton Inn Boca Raton 94 4,312,779 618,780 4,931,559
Assessments per RoomCourtyard by Marriott Boca Raton $48,698 $915 $49,613Residence Inn by Marriott Boca Raton 38,500 7,685 46,185Hampton Inn Boca Raton 45,881 6,583 52,463
Positioned Subject - Per Room 110 $50,000 $7,000 $57,000
Positioned Subject - Total $5,500,000 $770,000 $6,270,000
Real*
Source: Palm Beach County Property Appraiser
Total AssessmentPersonal
Property Taxes
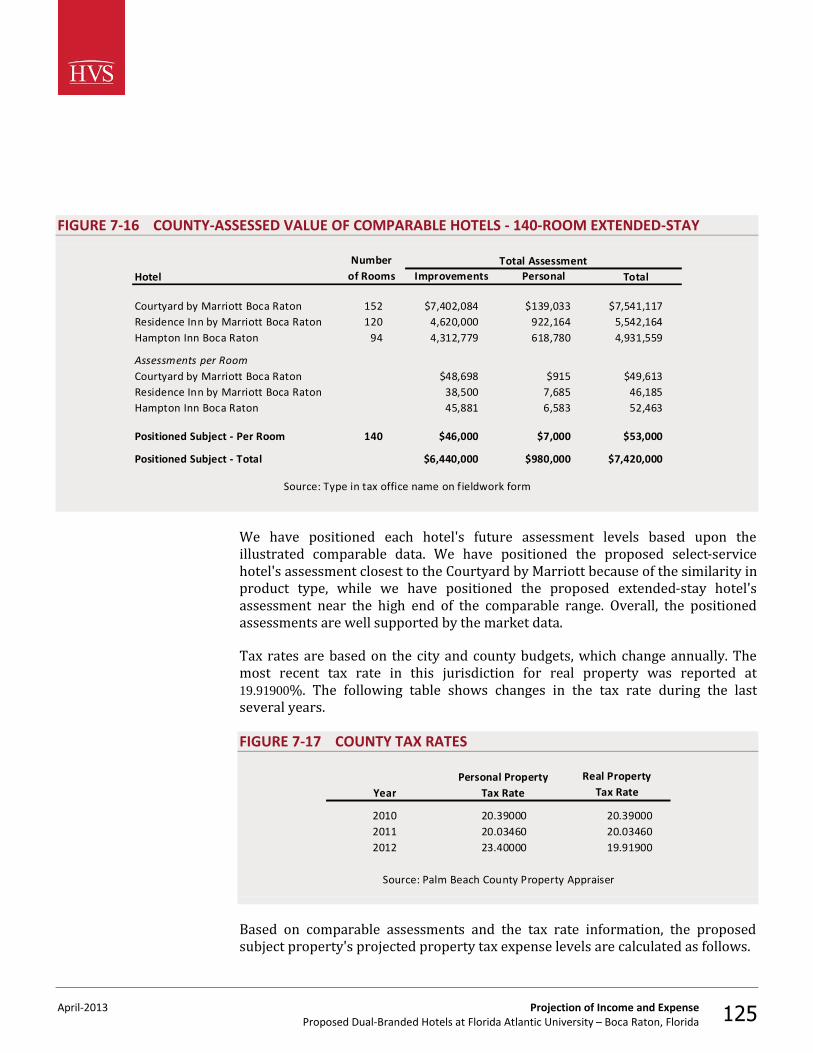
April-2013 Projection of Income and Expense Proposed Dual-Branded Hotels at Florida Atlantic University – Boca Raton, Florida 125
FIGURE 7-16 COUNTY-ASSESSED VALUE OF COMPARABLE HOTELS - 140-ROOM EXTENDED-STAY
Number
Hotel of Rooms Total
Courtyard by Marriott Boca Raton 152 $7,402,084 $139,033 $7,541,117Residence Inn by Marriott Boca Raton 120 4,620,000 922,164 5,542,164Hampton Inn Boca Raton 94 4,312,779 618,780 4,931,559
Assessments per RoomCourtyard by Marriott Boca Raton $48,698 $915 $49,613Residence Inn by Marriott Boca Raton 38,500 7,685 46,185Hampton Inn Boca Raton 45,881 6,583 52,463
Positioned Subject - Per Room 140 $46,000 $7,000 $53,000
Positioned Subject - Total $6,440,000 $980,000 $7,420,000
PersonalImprovements
Source: Type in tax office name on fieldwork form
Total Assessment
We have positioned each hotel's future assessment levels based upon the illustrated comparable data. We have positioned the proposed select-service hotel's assessment closest to the Courtyard by Marriott because of the similarity in product type, while we have positioned the proposed extended-stay hotel's assessment near the high end of the comparable range. Overall, the positioned assessments are well supported by the market data. Tax rates are based on the city and county budgets, which change annually. The most recent tax rate in this jurisdiction for real property was reported at 19.91900%. The following table shows changes in the tax rate during the last several years. FIGURE 7-17 COUNTY TAX RATES
Personal PropertyYear Tax Rate
2010 20.39000 20.390002011 20.03460 20.034602012 23.40000 19.91900
Tax RateReal Property
Source: Palm Beach County Property Appraiser
Based on comparable assessments and the tax rate information, the proposed subject property's projected property tax expense levels are calculated as follows.
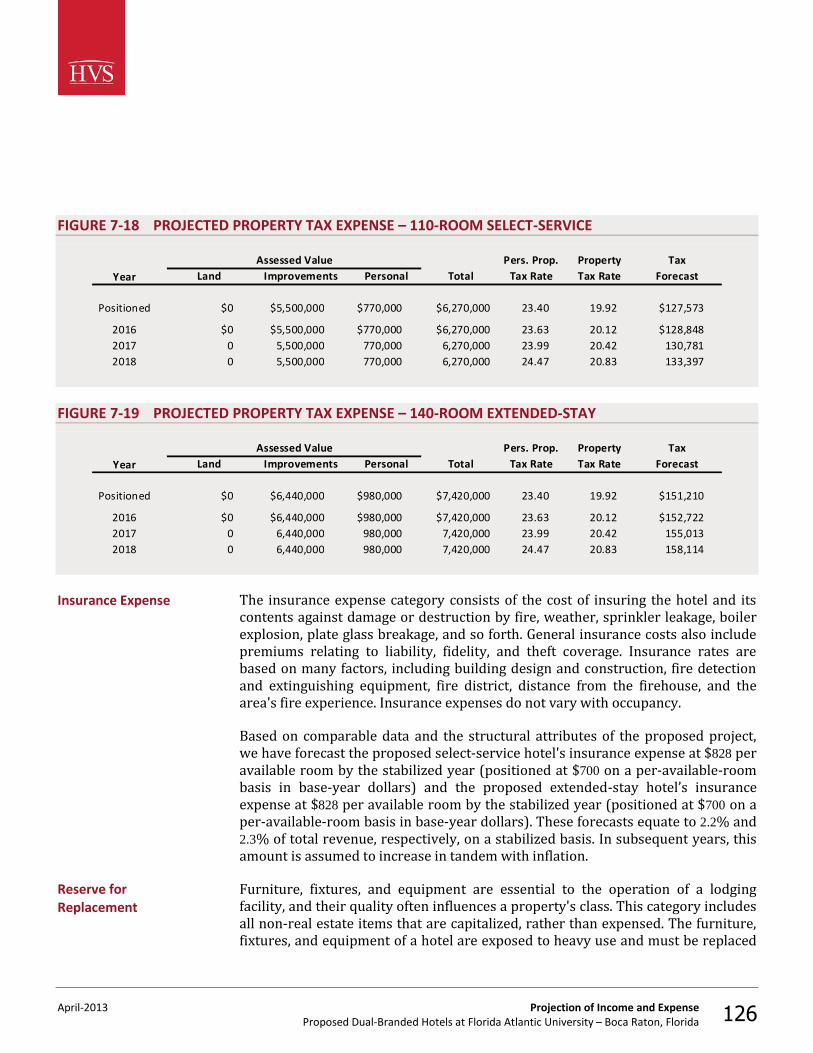
April-2013 Projection of Income and Expense Proposed Dual-Branded Hotels at Florida Atlantic University – Boca Raton, Florida 126
FIGURE 7-18 PROJECTED PROPERTY TAX EXPENSE – 110-ROOM SELECT-SERVICE
Year
Positioned $0 $5,500,000 $770,000 $6,270,000 23.40 19.92 $127,573
2016 $0 $5,500,000 $770,000 $6,270,000 23.63 20.12 $128,8482017 0 5,500,000 770,000 6,270,000 23.99 20.42 130,7812018 0 5,500,000 770,000 6,270,000 24.47 20.83 133,397
Pers. Prop. TaxTax Rate
PropertyTax RateTotal Forecast
Assessed ValuePersonalLand Improvements
FIGURE 7-19 PROJECTED PROPERTY TAX EXPENSE – 140-ROOM EXTENDED-STAY
Year
Positioned $0 $6,440,000 $980,000 $7,420,000 23.40 19.92 $151,210
2016 $0 $6,440,000 $980,000 $7,420,000 23.63 20.12 $152,7222017 0 6,440,000 980,000 7,420,000 23.99 20.42 155,0132018 0 6,440,000 980,000 7,420,000 24.47 20.83 158,114
Total ForecastAssessed Value
PersonalLand ImprovementsPers. Prop. Tax
Tax RatePropertyTax Rate
The insurance expense category consists of the cost of insuring the hotel and its contents against damage or destruction by fire, weather, sprinkler leakage, boiler explosion, plate glass breakage, and so forth. General insurance costs also include premiums relating to liability, fidelity, and theft coverage. Insurance rates are based on many factors, including building design and construction, fire detection and extinguishing equipment, fire district, distance from the firehouse, and the area's fire experience. Insurance expenses do not vary with occupancy. Based on comparable data and the structural attributes of the proposed project, we have forecast the proposed select-service hotel's insurance expense at $828 per available room by the stabilized year (positioned at $700 on a per-available-room basis in base-year dollars) and the proposed extended-stay hotel’s insurance expense at $828 per available room by the stabilized year (positioned at $700 on a per-available-room basis in base-year dollars). These forecasts equate to 2.2% and 2.3% of total revenue, respectively, on a stabilized basis. In subsequent years, this amount is assumed to increase in tandem with inflation. Furniture, fixtures, and equipment are essential to the operation of a lodging facility, and their quality often influences a property's class. This category includes all non-real estate items that are capitalized, rather than expensed. The furniture, fixtures, and equipment of a hotel are exposed to heavy use and must be replaced
Insurance Expense
Reserve for Replacement
April-2013 Projection of Income and Expense Proposed Dual-Branded Hotels at Florida Atlantic University – Boca Raton, Florida 127
at regular intervals. The useful life of these items is determined by their quality, durability, and the amount of guest traffic and use. Periodic replacement of furniture, fixtures, and equipment is essential to maintain the quality, image, and income-producing potential of a lodging facility. Because capitalized expenditures are not included in the operating statement but affect an owner's cash flow, a forecast of income and expense should reflect these expenses in the form of an appropriate reserve for replacement. The International Society of Hospitality Consultants (ISHC) undertook a major industry-sponsored study of the capital expenditure requirements for full-service/luxury, select-service, and extended-stay hotels. The most recent findings of the study were published in a report in 2007.8 Historical capital expenditures of well-maintained hotels were investigated through the compilation of data provided by most of the major hotel companies in the United States. A prospective analysis of future capital expenditure requirements was also performed based upon the cost to replace short- and long-lived building components over a hotel's economic life. The study showed that the capital expenditure requirements for hotels vary significantly from year to year and depend upon both the actual and effective ages of a property. The results of this study showed that hotel lenders and investors are requiring reserves for replacement ranging from 4% to 5% of total revenue. Based on the results of this study, our review of the subject asset and comparable lodging facilities, and our industry expertise, we estimate that a reserve for replacement of 4% of total revenues is sufficient to provide for the timely and periodic replacement of the subject property's furniture, fixtures, and equipment. This amount is ramped up during the initial projection period. In conclusion, our analysis reflects a profitable operation for the subject property as a whole, with net income expected to total 35.5% of total revenue by the stabilized year. The stabilized total revenue comprises primarily rooms and food and beverage revenue, with a secondary portion derived from other income sources. On the cost side, departmental expenses total 24.2% of revenue by the stabilized year, while undistributed operating expenses total 27.8% of total revenues; this assumes that the hotels will be operated competently by a well-known hotel operator. After a 3.0% of total revenues management fee, and 9.5% of total revenues in fixed expenses, a net income ratio of 35.5% is forecast by the stabilized year. 8 The International Society of Hotel Consultants, CapEx 2007, A Study of Capital Expenditure in the U.S. Hotel Industry.
Conclusion
April-2013 Feasibility Analysis Proposed Dual-Branded Hotels at Florida Atlantic University – Boca Raton, Florida 128
8. Feasibility Analysis
Return on investment can be defined as the future benefits of an income-producing property relative to its acquisition or construction cost. The first step in performing a return on investment analysis is to determine the amount to be initially invested. For a proposed property, this amount is most likely to be the development cost of the hotel. Based on the total development cost, the individual investor will utilize a return on investment analysis to determine if the future cash flow from a current cash outlay meets his or her own investment criteria and at what level above or below this amount such an outlay exceeds or fails to meet these criteria. As an individual or company considering investment in hotel real estate, the decision to use one’s own cash, an equity partner's capital, or lender financing will be an internal one. Because hotels typically require a substantial investment, only the largest investors and hotel companies generally have the means to purchase properties with all cash. We would anticipate the involvement of some financing by a third party for the typical investor or for those who may be entering the market for hotel acquisitions at this time. In leveraged acquisitions and developments where investors typically purchase or build upon real estate with a small amount of equity cash (20% to 50%) and a large amount of mortgage financing (50% to 80%), it is important for the equity investor to acknowledge the return requirements of the debt participant (mortgagee), as well as his or her own return requirements. Therefore, we will begin our rate of return analysis by reviewing the debt requirements of typical hotel mortgagees. Data for the mortgage component may be developed from statistics of actual hotel mortgages made by long-term lenders. The American Council of Life Insurance, which represents 20 large life-insurance companies, publishes quarterly information pertaining to the hotel mortgages issued by its member companies. Because of the six- to nine-month lag time in reporting and publishing hotel mortgage statistics, it was necessary to update this information to reflect current lending practices. Our research indicates that the greatest degree of correlation exists between the average interest rate of a hotel mortgage and the concurrent yield on an average-A corporate bond. The following chart summarizes the average mortgage interest rates of the hotel loans made by these lenders. For the purpose of comparison, the average-A corporate bond yield (as reported by Moody's Bond Record) is also shown.
Mortgage Component
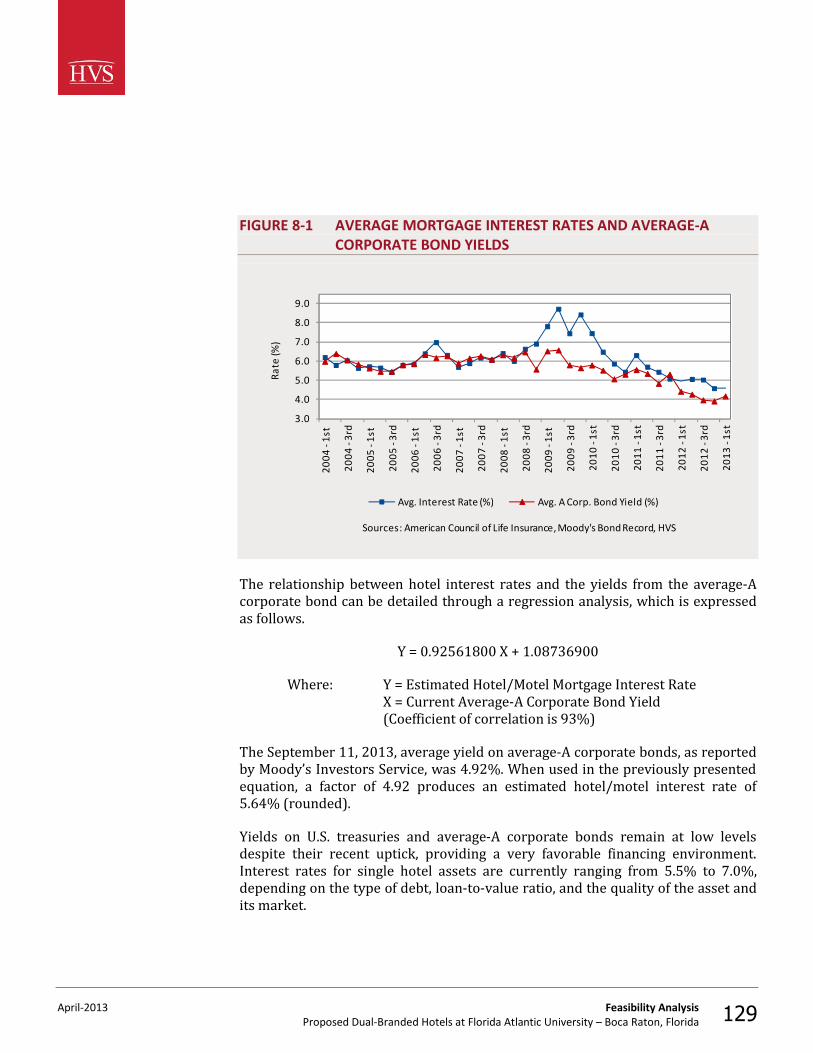
April-2013 Feasibility Analysis Proposed Dual-Branded Hotels at Florida Atlantic University – Boca Raton, Florida 129
FIGURE 8-1 AVERAGE MORTGAGE INTEREST RATES AND AVERAGE-A CORPORATE BOND YIELDS
3.0
4.0
5.0
6.0
7.0
8.0
9.0
2004
-1s
t
2004
-3r
d
2005
-1s
t
2005
-3r
d
2006
-1s
t
2006
-3r
d
2007
-1s
t
2007
-3r
d
2008
-1s
t
2008
-3r
d
2009
-1s
t
2009
-3r
d
2010
-1s
t
2010
-3r
d
2011
-1s
t
2011
-3r
d
2012
-1s
t
2012
-3r
d
2013
-1s
t
Rate
(%)
Sources: American Council of Life Insurance, Moody's Bond Record, HVS
Avg. Interest Rate (%) Avg. A Corp. Bond Yield (%)
The relationship between hotel interest rates and the yields from the average-A corporate bond can be detailed through a regression analysis, which is expressed as follows.
Y = 0.92561800 X + 1.08736900 Where: Y = Estimated Hotel/Motel Mortgage Interest Rate
X = Current Average-A Corporate Bond Yield (Coefficient of correlation is 93%)
The September 11, 2013, average yield on average-A corporate bonds, as reported by Moody’s Investors Service, was 4.92%. When used in the previously presented equation, a factor of 4.92 produces an estimated hotel/motel interest rate of 5.64% (rounded). Yields on U.S. treasuries and average-A corporate bonds remain at low levels despite their recent uptick, providing a very favorable financing environment. Interest rates for single hotel assets are currently ranging from 5.5% to 7.0%, depending on the type of debt, loan-to-value ratio, and the quality of the asset and its market.
April-2013 Feasibility Analysis Proposed Dual-Branded Hotels at Florida Atlantic University – Boca Raton, Florida 130
In addition to the mortgage interest rate estimate derived from this regression analysis, HVS constantly monitors the terms of hotel mortgage loans made by our institutional lending clients. Hotel financing is currently very active at all tiers of the lodging industry. Lenders are attracted to the lodging industry because of the higher yields generated by hotel financing relative to other commercial real estate, and the industry is performing strongly, with supply growth constrained. Commercial banks, mortgage REITs, insurance companies, and CMBS and mezzanine lenders are aggressively pursuing deals. Financing is also increasingly available for hotels that require a turnaround.200 to 500 basis points over the corresponding yield on treasury notes. As of September 11, 2013, the yield on the ten-year T-bill was 2.9%, indicating an interest rate range from 4.9% to 7.9%. While hotel mortgage interest rates have risen from their recent historic low, they are still at very favorable levels due to the low interest rate environment being maintained by the Federal Reserve. At present, we find that lenders who are active in the market are using loan-to-value ratios of 50% to 75% and amortization periods of 20 to 30 years. Based on our analysis of the current lodging industry mortgage market and adjustments for specific factors, such as the property’s site, proposed facility, and conditions in the Boca Raton hotel market, it is our opinion that a 5.50% interest, 25-year amortization mortgage with a 0.073690 constant is appropriate for the proposed subject property. In the mortgage-equity analysis, we have applied a loan-to-value ratio of 65%, which is reasonable to expect based on this interest rate and the current parameters. The remaining capital required for a hotel investment generally comes from the equity investor. The rate of return that an equity investor expects over a ten-year holding period is known as the equity yield. Unlike the equity dividend, which is a short-term rate of return, the equity yield specifically considers a long-term holding period (generally ten years), annual inflation- adjusted cash flows, property appreciation, mortgage amortization, and proceeds from a sale at the end of the holding period. In order to establish an appropriate equity yield rate, we have used two sources of data: past appraisals and investor interviews. Hotel Sales – Each appraisal performed by HVS uses a mortgage-equity approach in which income is projected and then discounted to a current value at rates reflecting the cost of debt and equity capital. In the case of hotels that were sold near the date of our valuation, we were able to determine an appropriate equity yield rate and total investment discount rate by inserting the projection into a valuation model and adjusting the appraised value to reflect the total investment (purchase price and estimated capital expenditure and/or PIP) by modifying the return assumptions. The overall capitalization rates for the historical income and
Equity Component & Equity Yield Rate
April-2013 Feasibility Analysis Proposed Dual-Branded Hotels at Florida Atlantic University – Boca Raton, Florida 131
projected first-year income are based on the sales price “as is.” The following table shows a representative sample of hotels that were sold shortly after we appraised them, along with the imputed equity return and discount rates based on our valuation approach.
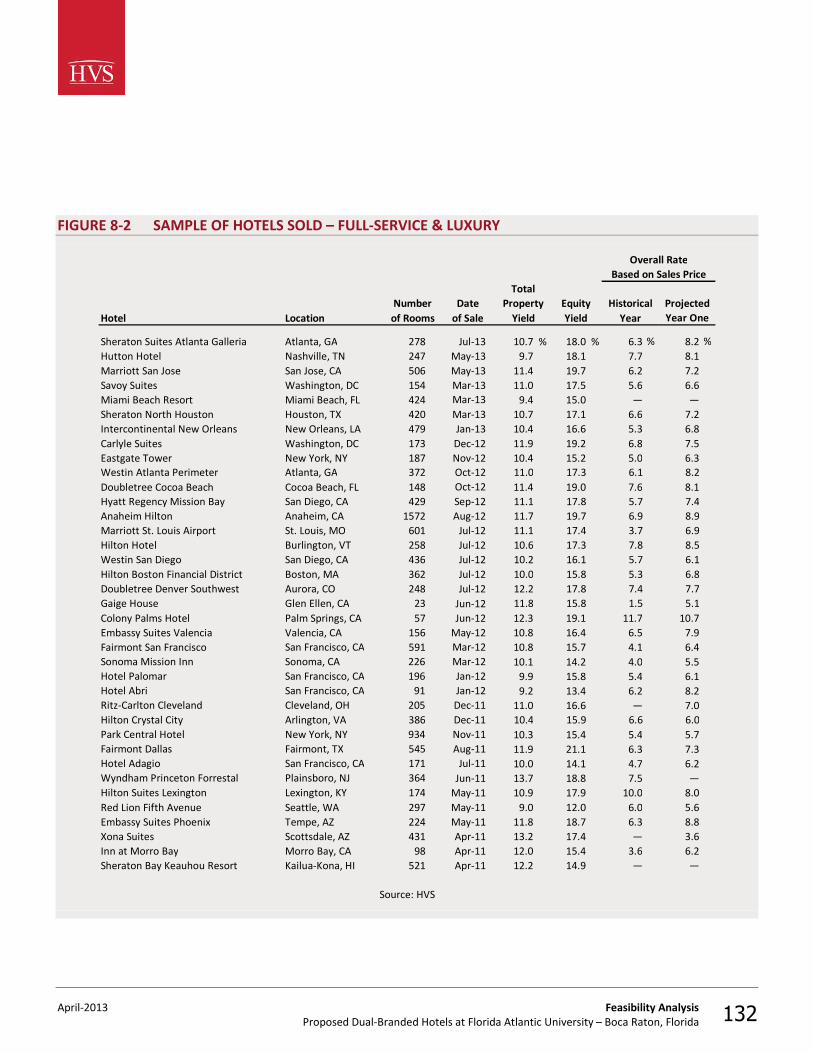
April-2013 Feasibility Analysis Proposed Dual-Branded Hotels at Florida Atlantic University – Boca Raton, Florida 132
FIGURE 8-2 SAMPLE OF HOTELS SOLD – FULL-SERVICE & LUXURY
Hotel Location
Sheraton Suites Atlanta Galleria Atlanta, GA 278 Jul-13 10.7 % 18.0 % 6.3 % 8.2 %Hutton Hotel Nashville, TN 247 May-13 9.7 18.1 7.7 8.1Marriott San Jose San Jose, CA 506 May-13 11.4 19.7 6.2 7.2Savoy Suites Washington, DC 154 Mar-13 11.0 17.5 5.6 6.6Miami Beach Resort Miami Beach, FL 424 Mar-13 9.4 15.0 — —Sheraton North Houston Houston, TX 420 Mar-13 10.7 17.1 6.6 7.2Intercontinental New Orleans New Orleans, LA 479 Jan-13 10.4 16.6 5.3 6.8Carlyle Suites Washington, DC 173 Dec-12 11.9 19.2 6.8 7.5Eastgate Tower New York, NY 187 Nov-12 10.4 15.2 5.0 6.3Westin Atlanta Perimeter Atlanta, GA 372 Oct-12 11.0 17.3 6.1 8.2Doubletree Cocoa Beach Cocoa Beach, FL 148 Oct-12 11.4 19.0 7.6 8.1Hyatt Regency Mission Bay San Diego, CA 429 Sep-12 11.1 17.8 5.7 7.4Anaheim Hilton Anaheim, CA 1572 Aug-12 11.7 19.7 6.9 8.9Marriott St. Louis Airport St. Louis, MO 601 Jul-12 11.1 17.4 3.7 6.9Hilton Hotel Burlington, VT 258 Jul-12 10.6 17.3 7.8 8.5Westin San Diego San Diego, CA 436 Jul-12 10.2 16.1 5.7 6.1Hilton Boston Financial District Boston, MA 362 Jul-12 10.0 15.8 5.3 6.8Doubletree Denver Southwest Aurora, CO 248 Jul-12 12.2 17.8 7.4 7.7Gaige House Glen Ellen, CA 23 Jun-12 11.8 15.8 1.5 5.1Colony Palms Hotel Palm Springs, CA 57 Jun-12 12.3 19.1 11.7 10.7Embassy Suites Valencia Valencia, CA 156 May-12 10.8 16.4 6.5 7.9Fairmont San Francisco San Francisco, CA 591 Mar-12 10.8 15.7 4.1 6.4Sonoma Mission Inn Sonoma, CA 226 Mar-12 10.1 14.2 4.0 5.5Hotel Palomar San Francisco, CA 196 Jan-12 9.9 15.8 5.4 6.1Hotel Abri San Francisco, CA 91 Jan-12 9.2 13.4 6.2 8.2Ritz-Carlton Cleveland Cleveland, OH 205 Dec-11 11.0 16.6 — 7.0Hilton Crystal City Arlington, VA 386 Dec-11 10.4 15.9 6.6 6.0Park Central Hotel New York, NY 934 Nov-11 10.3 15.4 5.4 5.7Fairmont Dallas Fairmont, TX 545 Aug-11 11.9 21.1 6.3 7.3Hotel Adagio San Francisco, CA 171 Jul-11 10.0 14.1 4.7 6.2Wyndham Princeton Forrestal Plainsboro, NJ 364 Jun-11 13.7 18.8 7.5 —Hilton Suites Lexington Lexington, KY 174 May-11 10.9 17.9 10.0 8.0Red Lion Fifth Avenue Seattle, WA 297 May-11 9.0 12.0 6.0 5.6Embassy Suites Phoenix Tempe, AZ 224 May-11 11.8 18.7 6.3 8.8Xona Suites Scottsdale, AZ 431 Apr-11 13.2 17.4 — 3.6Inn at Morro Bay Morro Bay, CA 98 Apr-11 12.0 15.4 3.6 6.2Sheraton Bay Keauhou Resort Kailua-Kona, HI 521 Apr-11 12.2 14.9 — —
PropertyTotal
Number Date
Source: HVS
Year Year Oneof Rooms of Sale Yield YieldEquity Historical
Overall RateBased on Sales Price
Projected
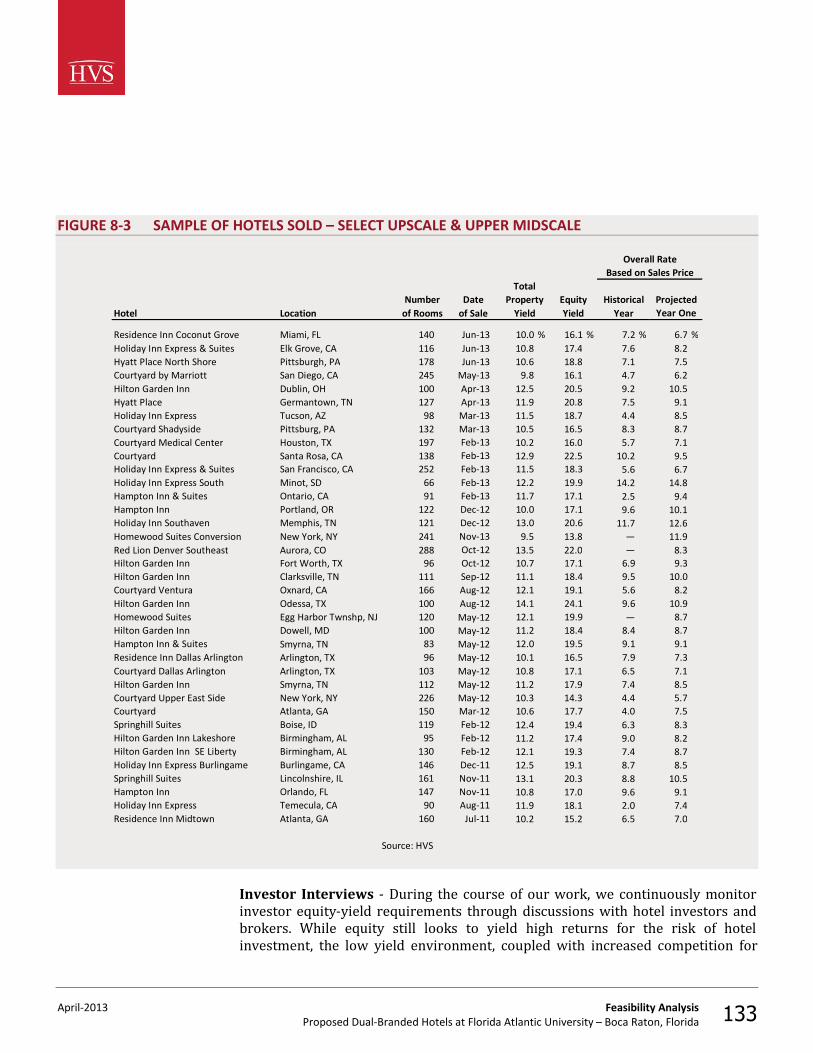
April-2013 Feasibility Analysis Proposed Dual-Branded Hotels at Florida Atlantic University – Boca Raton, Florida 133
FIGURE 8-3 SAMPLE OF HOTELS SOLD – SELECT UPSCALE & UPPER MIDSCALE
Hotel Location
Residence Inn Coconut Grove Miami, FL 140 Jun-13 10.0 % 16.1 % 7.2 % 6.7 %Holiday Inn Express & Suites Elk Grove, CA 116 Jun-13 10.8 17.4 7.6 8.2Hyatt Place North Shore Pittsburgh, PA 178 Jun-13 10.6 18.8 7.1 7.5Courtyard by Marriott San Diego, CA 245 May-13 9.8 16.1 4.7 6.2Hilton Garden Inn Dublin, OH 100 Apr-13 12.5 20.5 9.2 10.5Hyatt Place Germantown, TN 127 Apr-13 11.9 20.8 7.5 9.1Holiday Inn Express Tucson, AZ 98 Mar-13 11.5 18.7 4.4 8.5Courtyard Shadyside Pittsburg, PA 132 Mar-13 10.5 16.5 8.3 8.7Courtyard Medical Center Houston, TX 197 Feb-13 10.2 16.0 5.7 7.1Courtyard Santa Rosa, CA 138 Feb-13 12.9 22.5 10.2 9.5Holiday Inn Express & Suites San Francisco, CA 252 Feb-13 11.5 18.3 5.6 6.7Holiday Inn Express South Minot, SD 66 Feb-13 12.2 19.9 14.2 14.8Hampton Inn & Suites Ontario, CA 91 Feb-13 11.7 17.1 2.5 9.4Hampton Inn Portland, OR 122 Dec-12 10.0 17.1 9.6 10.1Holiday Inn Southaven Memphis, TN 121 Dec-12 13.0 20.6 11.7 12.6Homewood Suites Conversion New York, NY 241 Nov-13 9.5 13.8 — 11.9Red Lion Denver Southeast Aurora, CO 288 Oct-12 13.5 22.0 — 8.3Hilton Garden Inn Fort Worth, TX 96 Oct-12 10.7 17.1 6.9 9.3Hilton Garden Inn Clarksville, TN 111 Sep-12 11.1 18.4 9.5 10.0Courtyard Ventura Oxnard, CA 166 Aug-12 12.1 19.1 5.6 8.2Hilton Garden Inn Odessa, TX 100 Aug-12 14.1 24.1 9.6 10.9Homewood Suites Egg Harbor Twnshp, NJ 120 May-12 12.1 19.9 — 8.7Hilton Garden Inn Dowell, MD 100 May-12 11.2 18.4 8.4 8.7Hampton Inn & Suites Smyrna, TN 83 May-12 12.0 19.5 9.1 9.1Residence Inn Dallas Arlington Arlington, TX 96 May-12 10.1 16.5 7.9 7.3Courtyard Dallas Arlington Arlington, TX 103 May-12 10.8 17.1 6.5 7.1Hilton Garden Inn Smyrna, TN 112 May-12 11.2 17.9 7.4 8.5Courtyard Upper East Side New York, NY 226 May-12 10.3 14.3 4.4 5.7Courtyard Atlanta, GA 150 Mar-12 10.6 17.7 4.0 7.5Springhill Suites Boise, ID 119 Feb-12 12.4 19.4 6.3 8.3Hilton Garden Inn Lakeshore Birmingham, AL 95 Feb-12 11.2 17.4 9.0 8.2Hilton Garden Inn SE Liberty Birmingham, AL 130 Feb-12 12.1 19.3 7.4 8.7Holiday Inn Express Burlingame Burlingame, CA 146 Dec-11 12.5 19.1 8.7 8.5Springhill Suites Lincolnshire, IL 161 Nov-11 13.1 20.3 8.8 10.5Hampton Inn Orlando, FL 147 Nov-11 10.8 17.0 9.6 9.1Holiday Inn Express Temecula, CA 90 Aug-11 11.9 18.1 2.0 7.4Residence Inn Midtown Atlanta, GA 160 Jul-11 10.2 15.2 6.5 7.0
Numberof Rooms of Sale
HistoricalTotal
Property Equity ProjectedYear Year One
DateYield Yield
Overall RateBased on Sales Price
Source: HVS
Investor Interviews - During the course of our work, we continuously monitor investor equity-yield requirements through discussions with hotel investors and brokers. While equity still looks to yield high returns for the risk of hotel investment, the low yield environment, coupled with increased competition for
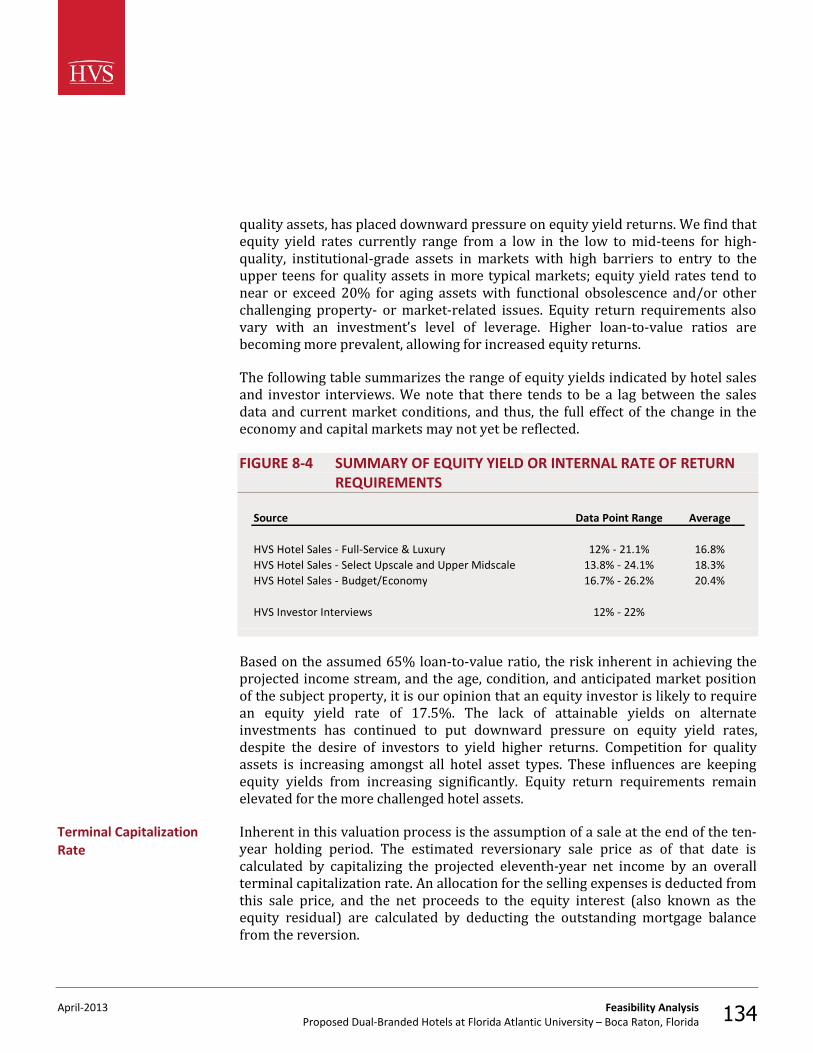
April-2013 Feasibility Analysis Proposed Dual-Branded Hotels at Florida Atlantic University – Boca Raton, Florida 134
quality assets, has placed downward pressure on equity yield returns. We find that equity yield rates currently range from a low in the low to mid-teens for high-quality, institutional-grade assets in markets with high barriers to entry to the upper teens for quality assets in more typical markets; equity yield rates tend to near or exceed 20% for aging assets with functional obsolescence and/or other challenging property- or market-related issues. Equity return requirements also vary with an investment’s level of leverage. Higher loan-to-value ratios are becoming more prevalent, allowing for increased equity returns. The following table summarizes the range of equity yields indicated by hotel sales and investor interviews. We note that there tends to be a lag between the sales data and current market conditions, and thus, the full effect of the change in the economy and capital markets may not yet be reflected. FIGURE 8-4 SUMMARY OF EQUITY YIELD OR INTERNAL RATE OF RETURN
REQUIREMENTS
Source Data Point Range Average
HVS Hotel Sales - Full-Service & Luxury 12% - 21.1% 16.8%HVS Hotel Sales - Select Upscale and Upper Midscale 13.8% - 24.1% 18.3%HVS Hotel Sales - Budget/Economy 16.7% - 26.2% 20.4%
HVS Investor Interviews 12% - 22%
Based on the assumed 65% loan-to-value ratio, the risk inherent in achieving the projected income stream, and the age, condition, and anticipated market position of the subject property, it is our opinion that an equity investor is likely to require an equity yield rate of 17.5%. The lack of attainable yields on alternate investments has continued to put downward pressure on equity yield rates, despite the desire of investors to yield higher returns. Competition for quality assets is increasing amongst all hotel asset types. These influences are keeping equity yields from increasing significantly. Equity return requirements remain elevated for the more challenged hotel assets. Inherent in this valuation process is the assumption of a sale at the end of the ten-year holding period. The estimated reversionary sale price as of that date is calculated by capitalizing the projected eleventh-year net income by an overall terminal capitalization rate. An allocation for the selling expenses is deducted from this sale price, and the net proceeds to the equity interest (also known as the equity residual) are calculated by deducting the outstanding mortgage balance from the reversion.
Terminal Capitalization Rate
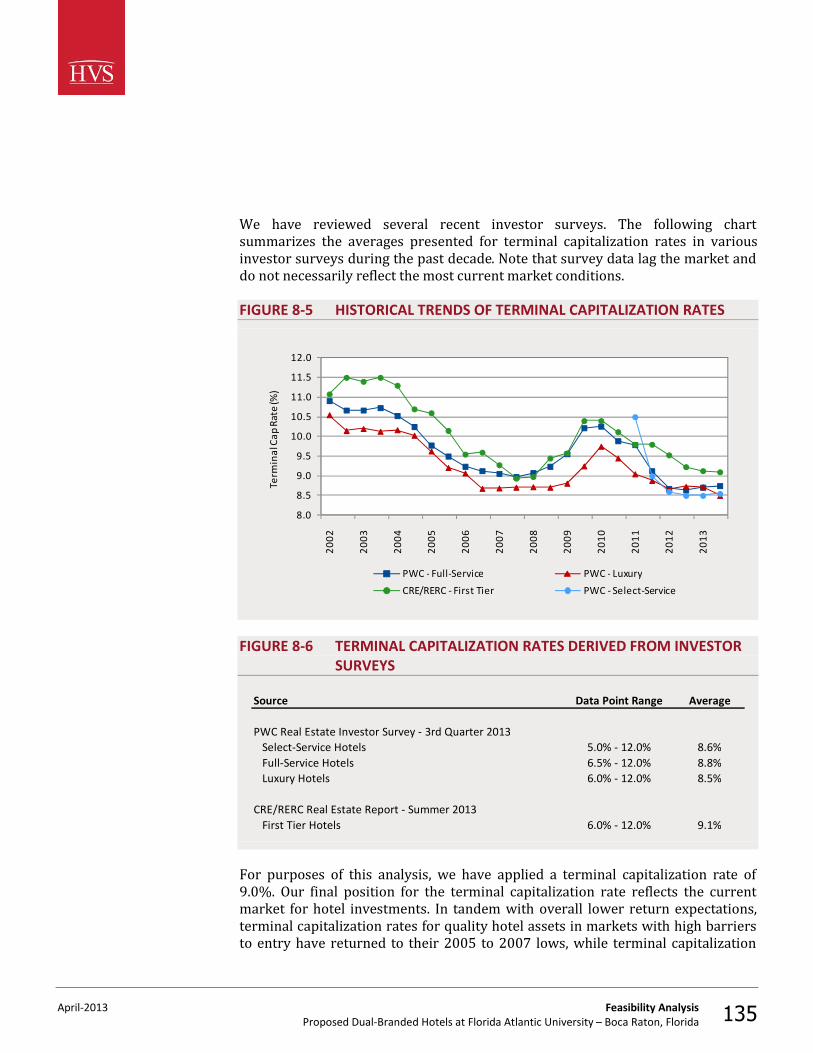
April-2013 Feasibility Analysis Proposed Dual-Branded Hotels at Florida Atlantic University – Boca Raton, Florida 135
We have reviewed several recent investor surveys. The following chart summarizes the averages presented for terminal capitalization rates in various investor surveys during the past decade. Note that survey data lag the market and do not necessarily reflect the most current market conditions. FIGURE 8-5 HISTORICAL TRENDS OF TERMINAL CAPITALIZATION RATES
8.0
8.5
9.0
9.5
10.0
10.5
11.0
11.5
12.0
2002
2003
2004
2005
2006
2007
2008
2009
2010
2011
2012
2013
Term
inal
Cap
Rat
e (%
)
PWC - Full-Service PWC - Luxury
CRE/RERC - First Tier PWC - Select-Service
FIGURE 8-6 TERMINAL CAPITALIZATION RATES DERIVED FROM INVESTOR SURVEYS
Source Data Point Range Average
PWC Real Estate Investor Survey - 3rd Quarter 2013 Select-Service Hotels 5.0% - 12.0% 8.6% Full-Service Hotels 6.5% - 12.0% 8.8% Luxury Hotels 6.0% - 12.0% 8.5%
CRE/RERC Real Estate Report - Summer 2013 First Tier Hotels 6.0% - 12.0% 9.1%
For purposes of this analysis, we have applied a terminal capitalization rate of 9.0%. Our final position for the terminal capitalization rate reflects the current market for hotel investments. In tandem with overall lower return expectations, terminal capitalization rates for quality hotel assets in markets with high barriers to entry have returned to their 2005 to 2007 lows, while terminal capitalization
April-2013 Feasibility Analysis Proposed Dual-Branded Hotels at Florida Atlantic University – Boca Raton, Florida 136
rates for older assets or for those suffering from functional obsolescence and/or weak market conditions remain elevated, reflecting the market's recognition that certain assets have less opportunity for significant appreciation. As the two participants in a real estate investment, investors and lenders must evaluate their equity and debt contributions based on their particular return requirements. After carefully weighing the risk associated with the projected economic benefits of a lodging investment, the participants will typically make their decision whether or not to invest in a hotel or resort by determining if their investment will provide an adequate yield over an established period. For the lender, this yield will typically reflect the interest rate required for a hotel mortgage over a period of what can range from seven to ten years. The yield to the equity participant may consider not only the requirements of a particular investor, but also the potential payments to cooperative or ancillary entities such as limited partner payouts, stockholder dividends, and management company incentive fees. The return on investment analysis in a hotel acquisition would not be complete without recognizing and reflecting the yield requirements of both the equity and debt participants. The analysis will now calculate the yields to the mortgage and equity participants during a ten-year projection period. The annual debt service is calculated by multiplying the mortgage component by the mortgage constant.
Mortgage Component $23,378,000Mortgage Constant 0.073690 Annual Debt Service $1,722,736
The yield to the lender based on a 65% debt contribution equates to an interest rate of 5.50%, which is calculated as follows.
Mortgage-Equity Method – Opinion of Net Present Value
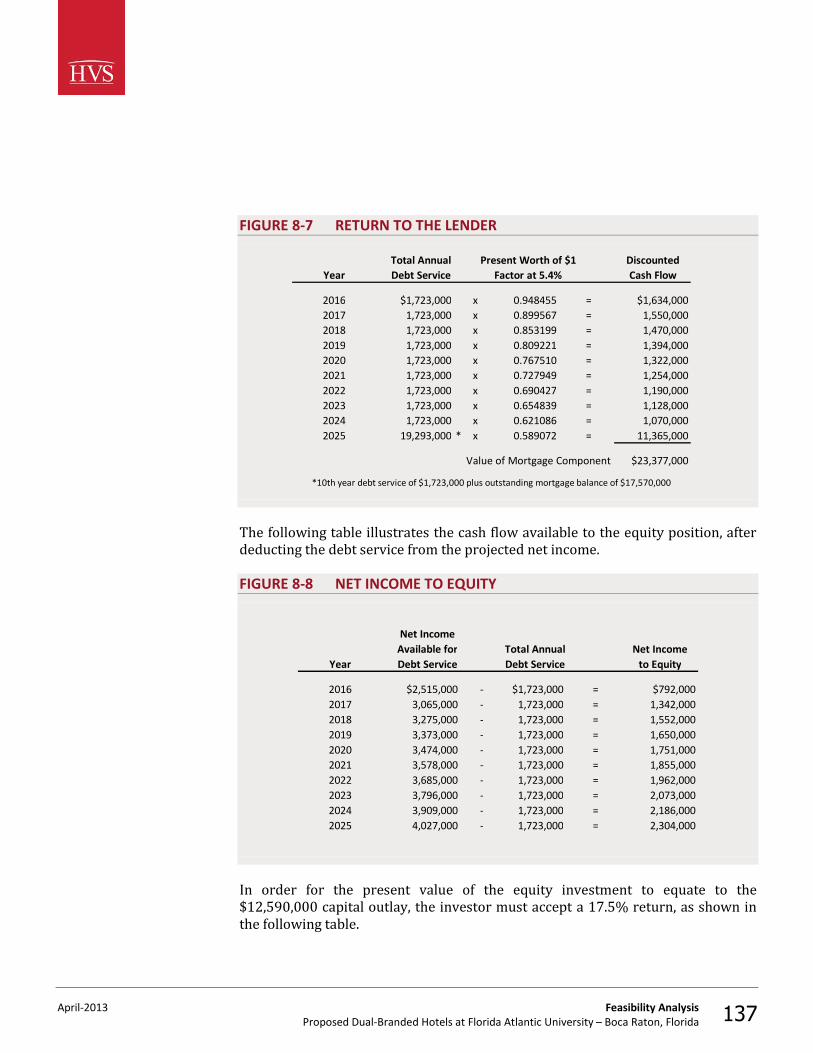
April-2013 Feasibility Analysis Proposed Dual-Branded Hotels at Florida Atlantic University – Boca Raton, Florida 137
FIGURE 8-7 RETURN TO THE LENDER
Total Annual Present Worth of $1 DiscountedYear Debt Service Factor at 5.4% Cash Flow
2016 $1,723,000 x 0.948455 = $1,634,0002017 1,723,000 x 0.899567 = 1,550,0002018 1,723,000 x 0.853199 = 1,470,0002019 1,723,000 x 0.809221 = 1,394,0002020 1,723,000 x 0.767510 = 1,322,0002021 1,723,000 x 0.727949 = 1,254,0002022 1,723,000 x 0.690427 = 1,190,0002023 1,723,000 x 0.654839 = 1,128,0002024 1,723,000 x 0.621086 = 1,070,0002025 19,293,000 * x 0.589072 = 11,365,000
Value of Mortgage Component $23,377,000
*10th year debt service of $1,723,000 plus outstanding mortgage balance of $17,570,000
The following table illustrates the cash flow available to the equity position, after deducting the debt service from the projected net income. FIGURE 8-8 NET INCOME TO EQUITY
Net IncomeAvailable for Total Annual Net Income
Year Debt Service Debt Service to Equity
2016 $2,515,000 - $1,723,000 = $792,0002017 3,065,000 - 1,723,000 = 1,342,0002018 3,275,000 - 1,723,000 = 1,552,0002019 3,373,000 - 1,723,000 = 1,650,0002020 3,474,000 - 1,723,000 = 1,751,0002021 3,578,000 - 1,723,000 = 1,855,0002022 3,685,000 - 1,723,000 = 1,962,0002023 3,796,000 - 1,723,000 = 2,073,0002024 3,909,000 - 1,723,000 = 2,186,0002025 4,027,000 - 1,723,000 = 2,304,000
In order for the present value of the equity investment to equate to the $12,590,000 capital outlay, the investor must accept a 17.5% return, as shown in the following table.
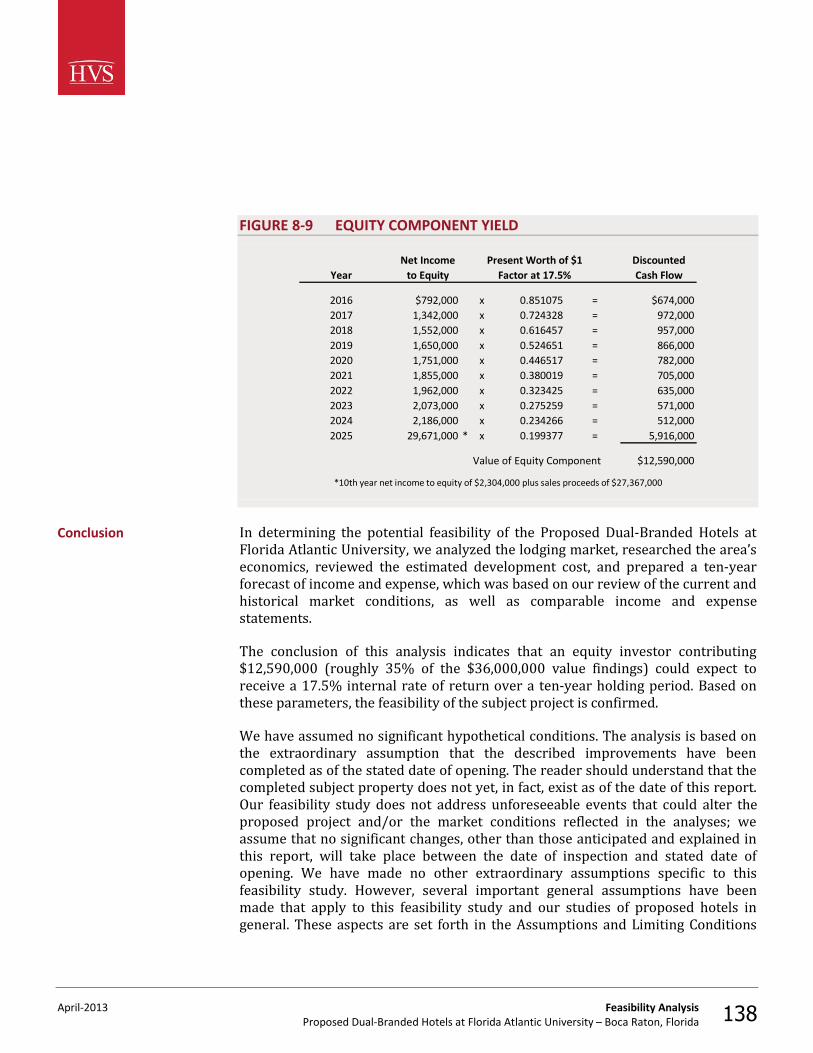
April-2013 Feasibility Analysis Proposed Dual-Branded Hotels at Florida Atlantic University – Boca Raton, Florida 138
FIGURE 8-9 EQUITY COMPONENT YIELD
Net Income Present Worth of $1 DiscountedYear to Equity Factor at 17.5% Cash Flow
2016 $792,000 x 0.851075 = $674,0002017 1,342,000 x 0.724328 = 972,0002018 1,552,000 x 0.616457 = 957,0002019 1,650,000 x 0.524651 = 866,0002020 1,751,000 x 0.446517 = 782,0002021 1,855,000 x 0.380019 = 705,0002022 1,962,000 x 0.323425 = 635,0002023 2,073,000 x 0.275259 = 571,0002024 2,186,000 x 0.234266 = 512,0002025 29,671,000 * x 0.199377 = 5,916,000
Value of Equity Component $12,590,000
*10th year net income to equity of $2,304,000 plus sales proceeds of $27,367,000
In determining the potential feasibility of the Proposed Dual-Branded Hotels at Florida Atlantic University, we analyzed the lodging market, researched the area’s economics, reviewed the estimated development cost, and prepared a ten-year forecast of income and expense, which was based on our review of the current and historical market conditions, as well as comparable income and expense statements. The conclusion of this analysis indicates that an equity investor contributing $12,590,000 (roughly 35% of the $36,000,000 value findings) could expect to receive a 17.5% internal rate of return over a ten-year holding period. Based on these parameters, the feasibility of the subject project is confirmed. We have assumed no significant hypothetical conditions. The analysis is based on the extraordinary assumption that the described improvements have been completed as of the stated date of opening. The reader should understand that the completed subject property does not yet, in fact, exist as of the date of this report. Our feasibility study does not address unforeseeable events that could alter the proposed project and/or the market conditions reflected in the analyses; we assume that no significant changes, other than those anticipated and explained in this report, will take place between the date of inspection and stated date of opening. We have made no other extraordinary assumptions specific to this feasibility study. However, several important general assumptions have been made that apply to this feasibility study and our studies of proposed hotels in general. These aspects are set forth in the Assumptions and Limiting Conditions
Conclusion
April-2013 Feasibility Analysis Proposed Dual-Branded Hotels at Florida Atlantic University – Boca Raton, Florida 139
chapter of this report. We have not made any jurisdictional exceptions to the Uniform Standards of Professional Appraisal Practice in our analysis or report.
April-2013 Statement of Assumptions and Limiting Conditions Proposed Dual-Branded Hotels at Florida Atlantic University – Boca Raton, Florida 140
9. Statement of Assumptions and Limiting Conditions
1. This report is set forth as a feasibility study of the proposed subject property; this is not an appraisal report.
2. This report is to be used in whole and not in part. 3. No responsibility is assumed for matters of a legal nature, nor do we
render any opinion as to title, which is assumed to be marketable and free of any deed restrictions and easements. The property is evaluated as though free and clear unless otherwise stated.
4. We assume that there are no hidden or unapparent conditions of the sub-soil or structures, such as underground storage tanks, that would impact the property’s development potential. No responsibility is assumed for these conditions or for any engineering that may be required to discover them.
5. We have not considered the presence of potentially hazardous materials or any form of toxic waste on the project site. The consultants are not qualified to detect hazardous substances, and we urge the client to retain an expert in this field if desired.
6. The Americans with Disabilities Act (ADA) became effective on January 26, 1992. We have assumed the proposed hotel would be designed and constructed to be in full compliance with the ADA.
7. We have made no survey of the site, and we assume no responsibility in connection with such matters. Sketches, photographs, maps, and other exhibits are included to assist the reader in visualizing the property. It is assumed that the use of the described real estate will be within the boundaries of the property described, and that no encroachment will exist.
8. All information, financial operating statements, estimates, and opinions obtained from parties not employed by TS Worldwide, LLC are assumed to be true and correct. We can assume no liability resulting from misinformation.
9. Unless noted, we assume that there are no encroachments, zoning violations, or building violations encumbering the subject property.
10. The property is assumed to be in full compliance with all applicable federal, state, local, and private codes, laws, consents, licenses, and regulations (including a liquor license where appropriate), and that all
April-2013 Statement of Assumptions and Limiting Conditions Proposed Dual-Branded Hotels at Florida Atlantic University – Boca Raton, Florida 141
licenses, permits, certificates, franchises, and so forth can be freely renewed or transferred to a purchaser.
11. All mortgages, liens, encumbrances, leases, and servitudes have been disregarded unless specified otherwise.
12. None of this material may be reproduced in any form without our written permission, and the report cannot be disseminated to the public through advertising, public relations, news, sales, or other media.
13. We are not required to give testimony or attendance in court by reason of this analysis without previous arrangements, and only when our standard per-diem fees and travel costs are paid prior to the appearance.
14. If the reader is making a fiduciary or individual investment decision and has any questions concerning the material presented in this report, it is recommended that the reader contact us.
15. We take no responsibility for any events or circumstances that take place subsequent to the date of our field inspection.
16. The quality of a lodging facility's on-site management has a direct effect on a property's economic viability. The financial forecasts presented in this analysis assume responsible ownership and competent management. Any departure from this assumption may have a significant impact on the projected operating results.
17. The financial analysis presented in this report is based upon assumptions, estimates, and evaluations of the market conditions in the local and national economy, which may be subject to sharp rises and declines. Over the projection period considered in our analysis, wages and other operating expenses may increase or decrease because of market volatility and economic forces outside the control of the hotel’s management. We assume that the price of hotel rooms, food, beverages, and other sources of revenue to the hotel will be adjusted to offset any increases or decreases in related costs. We do not warrant that our estimates will be attained, but they have been developed based upon information obtained during the course of our market research and are intended to reflect the expectations of a typical hotel investor as of the stated date of the report.
18. This analysis assumes continuation of all Internal Revenue Service tax code provisions as stated or interpreted on either the date of value or the date of our field inspection, whichever occurs first.
19. Many of the figures presented in this report were generated using sophisticated computer models that make calculations based on numbers carried out to three or more decimal places. In the interest of simplicity,
April-2013 Statement of Assumptions and Limiting Conditions Proposed Dual-Branded Hotels at Florida Atlantic University – Boca Raton, Florida 142
most numbers have been rounded to the nearest tenth of a percent. Thus, these figures may be subject to small rounding errors.
20. It is agreed that our liability to the client is limited to the amount of the fee paid as liquidated damages. Our responsibility is limited to the client, and use of this report by third parties shall be solely at the risk of the client and/or third parties. The use of this report is also subject to the terms and conditions set forth in our engagement letter with the client.
21. Evaluating and comprising financial forecasts for hotels is both a science and an art. Although this analysis employs various mathematical calculations to provide value indications, the final forecasts are subjective and may be influenced by our experience and other factors not specifically set forth in this report.
22. This study was prepared by TS Worldwide, LLC. All opinions, recommendations, and conclusions expressed during the course of this assignment are rendered by the staff of TS Worldwide, LLC as employees, rather than as individuals.
April-2013 Certification Proposed Dual-Branded Hotels at Florida Atlantic University – Boca Raton, Florida 143
10. Certification
The undersigned hereby certify that, to the best of our knowledge and belief: 1. the statements of fact presented in this report are true and correct; 2. the reported analyses, opinions, and conclusions are limited only by the
reported assumptions and limiting conditions, and are our personal, impartial, and unbiased professional analyses, opinions, and conclusions;
3. we have no (or the specified) present or prospective interest in the property that is the subject of this report and no (or the specified) personal interest with respect to the parties involved;
4. we have no bias with respect to the property that is the subject of this report or to the parties involved with this assignment;
5. our engagement in this assignment was not contingent upon developing or reporting predetermined results;
6. our compensation for completing this assignment is not contingent upon the development or reporting of a predetermined result or direction in performance that favors the cause of the client, the attainment of a stipulated result, or the occurrence of a subsequent event directly related to the intended use of this study;
7. our analyses, opinions, and conclusions were developed, and this report has been prepared, in conformity with the Uniform Standards of Professional Appraisal Practice;
8. Adam R. Lair, MAI personally inspected the property described in this report; Michael E. Brophy participated in the analysis and reviewed the findings, but did not personally inspect the property;
9. no one provided significant assistance to Michael E. Brophy and Adam R. Lair, MAI, and that no one other than those listed above and the undersigned prepared the analyses, conclusions, and opinions concerning the real estate that are set forth in this report; neither Adam R. Lair, MAI nor Michael E. Brophy has performed appraisal or consulting work on this property within the past three years;
10. the reported analyses, opinions, and conclusions were developed, and this report has been prepared, in conformity with the requirements of the Code of Professional Ethics and the Standards of Professional Appraisal Practice of the Appraisal Institute;
April-2013 Certification Proposed Dual-Branded Hotels at Florida Atlantic University – Boca Raton, Florida 144
11. the use of this report is subject to the requirements of the Appraisal Institute relating to review by its duly authorized representatives; and
12. as of the date of this report, Michael E. Brophy has completed the Standards and Ethics Education Requirement of the Appraisal Institute for Associate Members; and as of the date of this report, Adam R. Lair, MAI has completed the requirements of the continuing education program of the Appraisal Institute.
Michael E. Brophy Senior Vice President, Partner TS Worldwide, LLC State-certified general real estate appraiser RZ3482 Adam R. Lair, MAI Senior Vice President, Partner TS Worldwide, LLC State-certified general real estate appraiser RZ3493
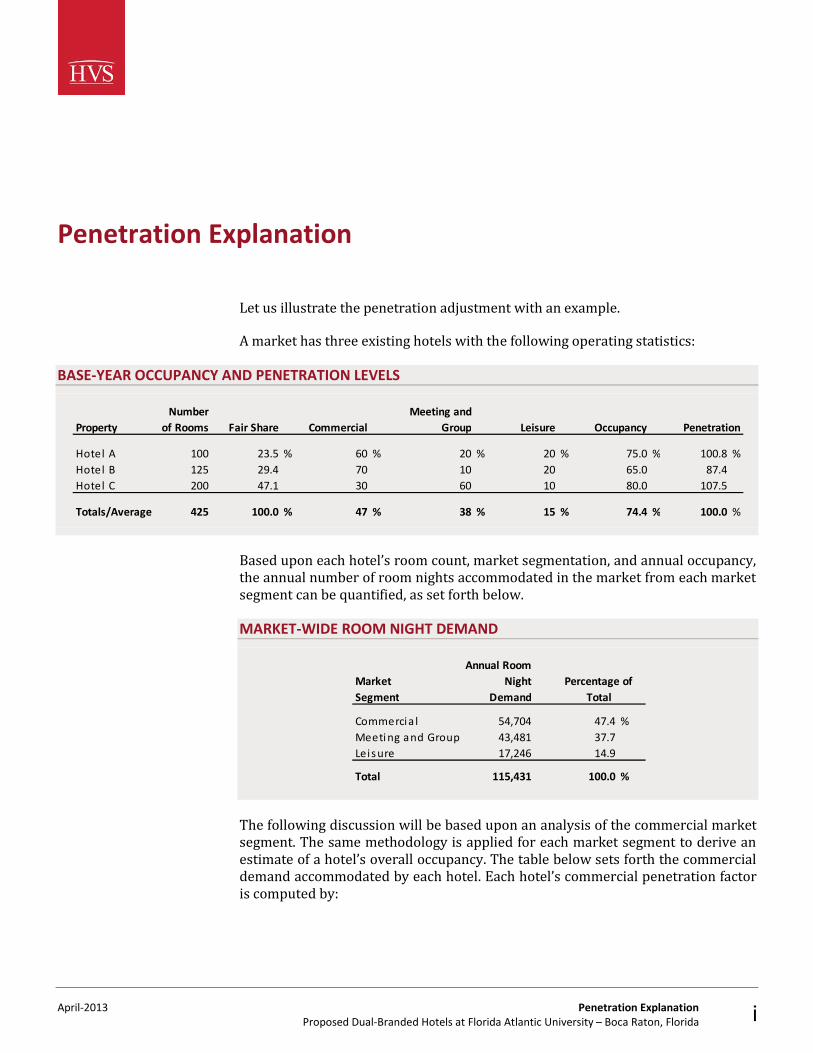
April-2013 Penetration Explanation Proposed Dual-Branded Hotels at Florida Atlantic University – Boca Raton, Florida i
Penetration Explanation
Let us illustrate the penetration adjustment with an example. A market has three existing hotels with the following operating statistics:
BASE-YEAR OCCUPANCY AND PENETRATION LEVELS
Based upon each hotel’s room count, market segmentation, and annual occupancy, the annual number of room nights accommodated in the market from each market segment can be quantified, as set forth below. MARKET-WIDE ROOM NIGHT DEMAND
The following discussion will be based upon an analysis of the commercial market segment. The same methodology is applied for each market segment to derive an estimate of a hotel’s overall occupancy. The table below sets forth the commercial demand accommodated by each hotel. Each hotel’s commercial penetration factor is computed by:
PropertyNumber
of Rooms Fair Share CommercialMeeting and
Group Leisure Occupancy
Hotel A 100 23.5 % 60 % 20 % 20 % 75.0 % 100.8 %Hotel B 125 29.4 70 10 20 65.0 87.4Hotel C 200 47.1 30 60 10 80.0 107.5
Totals/Average 425 100.0 % 47 % 38 % 15 % 74.4 % 100.0 %
Penetration
Market Segment
Annual Room Night
Demand
Commercia l 54,704 47.4 %Meeti ng and Group 43,481 37.7Leis ure 17,246 14.9
Total 115,431 100.0 %
Percentage of Total
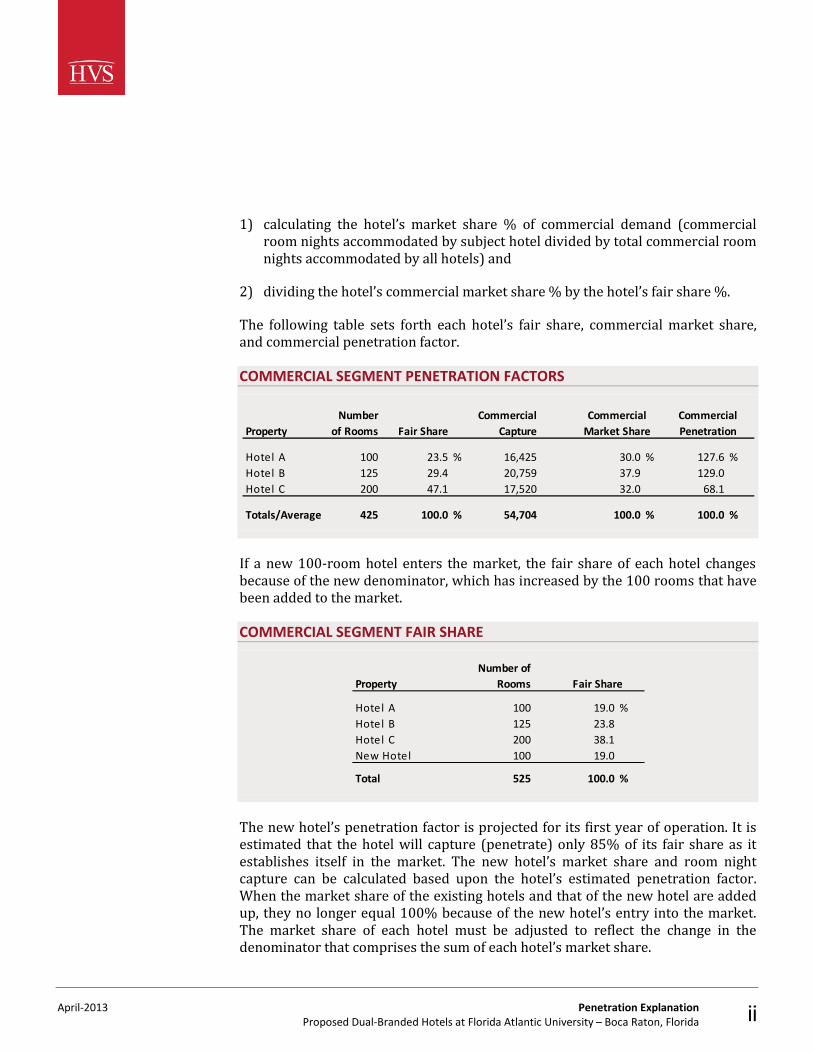
April-2013 Penetration Explanation Proposed Dual-Branded Hotels at Florida Atlantic University – Boca Raton, Florida ii
1) calculating the hotel’s market share % of commercial demand (commercial room nights accommodated by subject hotel divided by total commercial room nights accommodated by all hotels) and
2) dividing the hotel’s commercial market share % by the hotel’s fair share %. The following table sets forth each hotel’s fair share, commercial market share, and commercial penetration factor. COMMERCIAL SEGMENT PENETRATION FACTORS
If a new 100-room hotel enters the market, the fair share of each hotel changes because of the new denominator, which has increased by the 100 rooms that have been added to the market. COMMERCIAL SEGMENT FAIR SHARE
The new hotel’s penetration factor is projected for its first year of operation. It is estimated that the hotel will capture (penetrate) only 85% of its fair share as it establishes itself in the market. The new hotel’s market share and room night capture can be calculated based upon the hotel’s estimated penetration factor. When the market share of the existing hotels and that of the new hotel are added up, they no longer equal 100% because of the new hotel’s entry into the market. The market share of each hotel must be adjusted to reflect the change in the denominator that comprises the sum of each hotel’s market share.
PropertyNumber
of Rooms Fair ShareCommercial
Capture
Hotel A 100 23.5 % 16,425 30.0 % 127.6 %Hotel B 125 29.4 20,759 37.9 129.0Hotel C 200 47.1 17,520 32.0 68.1
Totals/Average 425 100.0 % 54,704 100.0 % 100.0 %
Commercial Penetration
Commercial Market Share
PropertyNumber of
Rooms
Hotel A 100 19.0 %Hotel B 125 23.8Hotel C 200 38.1New Hotel 100 19.0
Total 525 100.0 %
Fair Share
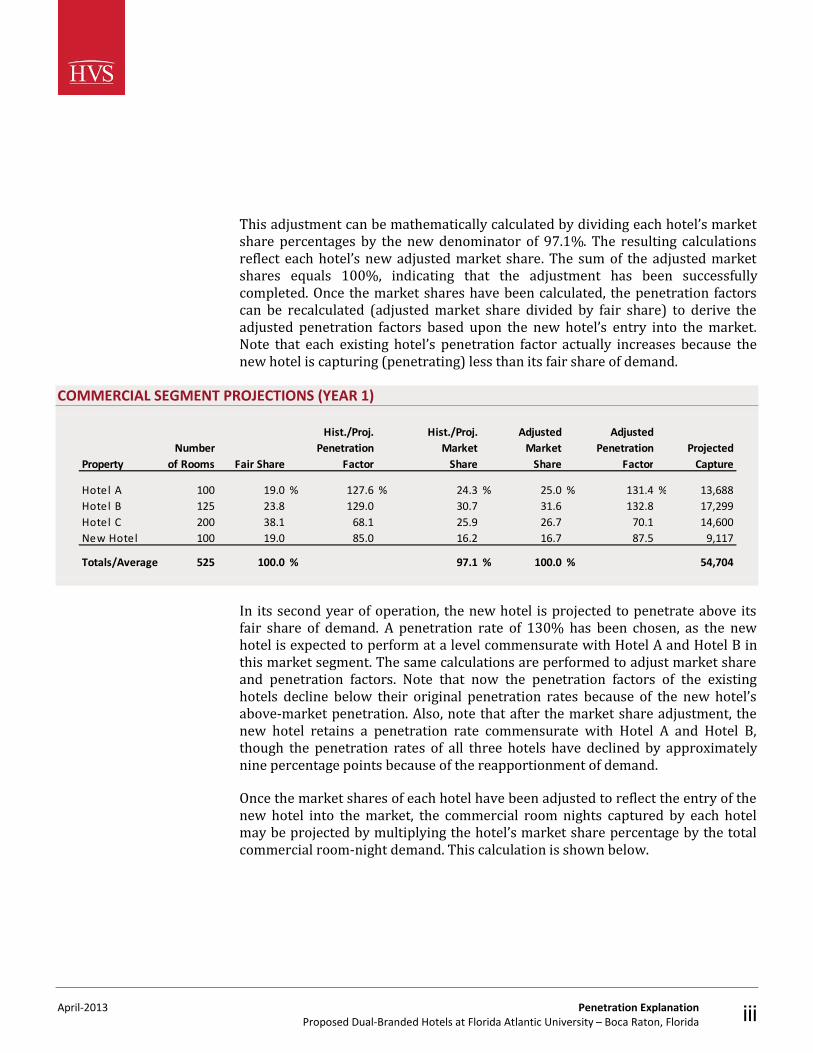
April-2013 Penetration Explanation Proposed Dual-Branded Hotels at Florida Atlantic University – Boca Raton, Florida iii
This adjustment can be mathematically calculated by dividing each hotel’s market share percentages by the new denominator of 97.1%. The resulting calculations reflect each hotel’s new adjusted market share. The sum of the adjusted market shares equals 100%, indicating that the adjustment has been successfully completed. Once the market shares have been calculated, the penetration factors can be recalculated (adjusted market share divided by fair share) to derive the adjusted penetration factors based upon the new hotel’s entry into the market. Note that each existing hotel’s penetration factor actually increases because the new hotel is capturing (penetrating) less than its fair share of demand.
COMMERCIAL SEGMENT PROJECTIONS (YEAR 1)
In its second year of operation, the new hotel is projected to penetrate above its fair share of demand. A penetration rate of 130% has been chosen, as the new hotel is expected to perform at a level commensurate with Hotel A and Hotel B in this market segment. The same calculations are performed to adjust market share and penetration factors. Note that now the penetration factors of the existing hotels decline below their original penetration rates because of the new hotel’s above-market penetration. Also, note that after the market share adjustment, the new hotel retains a penetration rate commensurate with Hotel A and Hotel B, though the penetration rates of all three hotels have declined by approximately nine percentage points because of the reapportionment of demand. Once the market shares of each hotel have been adjusted to reflect the entry of the new hotel into the market, the commercial room nights captured by each hotel may be projected by multiplying the hotel’s market share percentage by the total commercial room-night demand. This calculation is shown below.
PropertyNumber
of Rooms Fair Share
Hist./Proj. Penetration
Factor
Hist./Proj. Market
Share
Adjusted Market
Share
Adjusted Penetration
FactorProjected
Capture
Hotel A 100 19.0 % 127.6 % 24.3 % 25.0 % 131.4 % 13,688Hotel B 125 23.8 129.0 30.7 31.6 132.8 17,299Hotel C 200 38.1 68.1 25.9 26.7 70.1 14,600New Hotel 100 19.0 85.0 16.2 16.7 87.5 9,117
Totals/Average 525 100.0 % 97.1 % 100.0 % 54,704
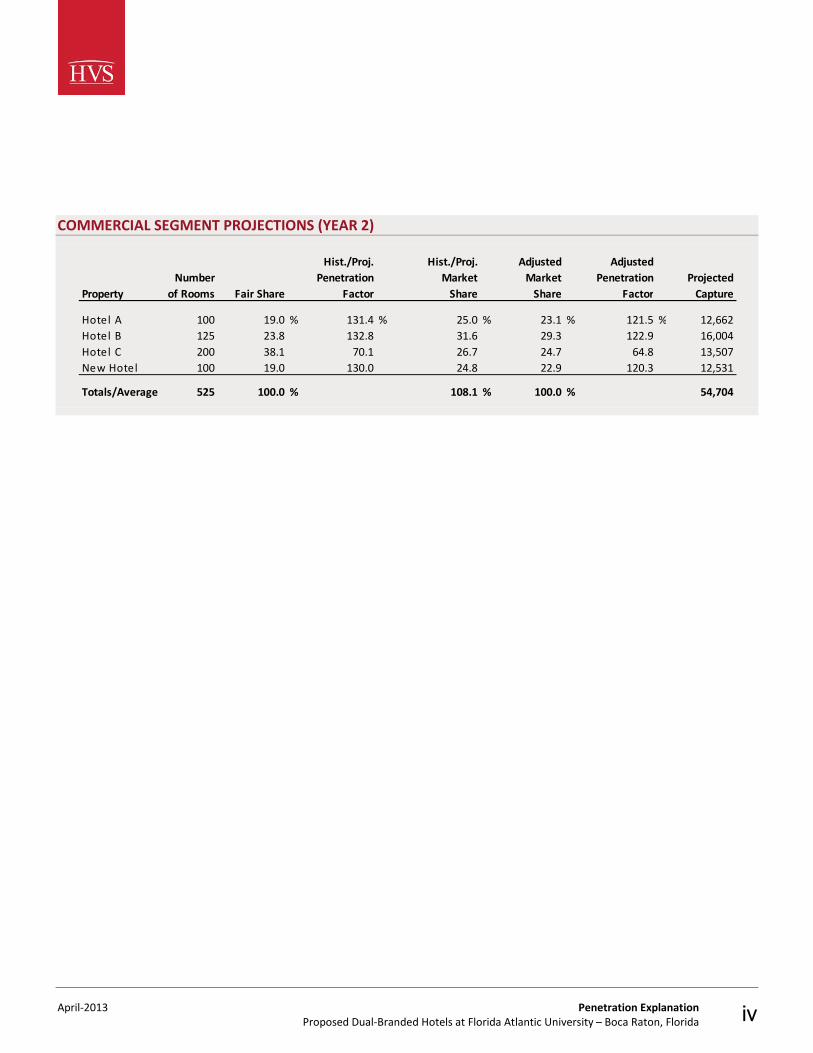
April-2013 Penetration Explanation Proposed Dual-Branded Hotels at Florida Atlantic University – Boca Raton, Florida iv
COMMERCIAL SEGMENT PROJECTIONS (YEAR 2)
PropertyNumber
of Rooms Fair Share
Hist./Proj. Penetration
Factor
Hist./Proj. Market
Share
Adjusted Market
Share
Adjusted Penetration
FactorProjected
Capture
Hotel A 100 19.0 % 131.4 % 25.0 % 23.1 % 121.5 % 12,662Hotel B 125 23.8 132.8 31.6 29.3 122.9 16,004Hotel C 200 38.1 70.1 26.7 24.7 64.8 13,507New Hotel 100 19.0 130.0 24.8 22.9 120.3 12,531
Totals/Average 525 100.0 % 108.1 % 100.0 % 54,704
April-2013 Explanation of the Simultaneous Valuation Formula Proposed Dual-Branded Hotels at Florida Atlantic University – Boca Raton, Florida v
Explanation of the Simultaneous Valuation Formula
The algebraic equation known as the simultaneous valuation formula, which solves for the total property value using a ten-year mortgage and equity technique, was developed by Suzanne R. Mellen, CRE, MAI, FRICS, ISHC, Managing Director of the San Francisco office of HVS. A complete discussion of the technique is presented in her article entitled “Simultaneous Valuation: A New Technique.”9 The process of solving for the value of the mortgage and equity components begins by deducting the annual debt service from the projected income before debt service, leaving the net income to equity for each year. The net income as of the eleventh year is capitalized into a reversionary value using the terminal capitalization rate. The equity residual, which is the total reversionary value less the mortgage balance at that point in time and less any brokerage and legal costs associated with the sale, is discounted to the date of value at the equity yield rate. The net income to equity for each projection year is also discounted back to the date of value. The sum of these discounted values equals the value of the equity component. Because the equity component comprises a specific percentage of the total value, the value of the mortgage and the total property can be computed easily. This process can be expressed in two algebraic equations that set forth the mathematical relationships between the known and unknown variables using the following symbols.
9Suzanne R. Mellen. "Simultaneous Valuation: A New Technique," Appraisal Journal, April, 1983.
April-2013 Explanation of the Simultaneous Valuation Formula Proposed Dual-Branded Hotels at Florida Atlantic University – Boca Raton, Florida vi
NI = Net income available for debt service V = Value M = Loan-to-value ratio f = Annual debt service constant n = Number of years in the projection period de = Annual cash available to equity dr = Residual equity value b = Brokerage and legal cost percentage P = Fraction of the loan paid off during the projection
period fp = Annual constant required to amortize the entire loan
during the projection period Rr = Overall terminal capitalization rate that is applied to
net income to calculate the total property reversion (sales price at the end of the projection period)
1/Sn = Present worth of $1 factor (discount factor) at the equity yield rate
Using these symbols, the following formulas can be used to express some of the components of this mortgage and equity valuation process. Debt Service – A property's debt service is calculated by first determining the mortgage amount that equals the total value (V) multiplied by the loan-to-value ratio (M). Debt service is derived by multiplying the mortgage amount by the annual debt service constant (f). The following formula represents debt service.
f x M x V = Debt Service Net Income to Equity (Equity Dividend) – The net income to equity (de) is the property's net income before debt service (NI) less debt service. The following formula represents the net income to equity.
NI - (f x M x V) = de Reversionary Value – The value of the hotel at the end of the tenth year is calculated by dividing the eleventh-year net income before debt service (NI11) by the terminal capitalization rate (Rr). The following formula represents the property's tenth-year reversionary value.
April-2013 Explanation of the Simultaneous Valuation Formula Proposed Dual-Branded Hotels at Florida Atlantic University – Boca Raton, Florida vii
(NI11/Rr) = Reversionary Value Brokerage and Legal Costs – When a hotel is sold, certain costs are associated with the transaction. Normally, the broker is paid a commission and the attorney collects legal fees. In the case of hotel transactions, brokerage and legal costs typically range from 1% to 4% of the sales price. Because these expenses reduce the proceeds to the seller, they are usually deducted from the reversionary value in the mortgage and equity valuation process. Brokerage and legal costs (b), expressed as a percentage of reversionary value (NI11/Rr), are calculated by application of the following formula.
b (NI11/Rr) = Brokerage and Legal Costs Ending Mortgage Balance – The mortgage balance at the end of the tenth year must be deducted from the total reversionary value (debt and equity) in order to determine the equity residual. The formula used to determine the fraction of the loan remaining (expressed as a percentage of the original loan balance) at any point in time (P) takes the annual debt service constant of the loan over the entire amortization period (f) less the mortgage interest rate (i), and divides it by the annual constant required to amortize the entire loan during the ten-year projection period (fp) less the mortgage interest rate. The following formula represents the fraction of the loan paid off (P).
(f - i)/(fp - i) = P If the fraction of the loan paid off (expressed as a percentage of the initial loan balance) is P, then the remaining loan percentage is expressed as 1 - P. The ending mortgage balance is the fraction of the remaining loan (1 - P) multiplied by the initial loan amount (M x V). The following formula represents the ending mortgage balance.
(1 - P) x M x V Equity Residual Value – The value of the equity upon the sale at the end of the projection period (dr) is the reversionary value less the brokerage and legal costs and the ending mortgage balance. The following formula represents the equity residual value.
(NI11/Rr) - (b (NI11/Rr) - ((1 - P) x M x V) = dr Annual Cash Flow to Equity – The annual cash flow to equity consists of the equity dividend for each projection year plus the equity residual at the end of the tenth year. The following formula represents the annual cash flow to equity.
April-2013 Explanation of the Simultaneous Valuation Formula Proposed Dual-Branded Hotels at Florida Atlantic University – Boca Raton, Florida viii
NI1 - (f x M x V) = de1 NI2 - (f x M x V) = de2
NI10 - (f x M x V) = de10 (NI11/Rr) - (b (NI11/Rr) - ((1 - P) x M x V) = dr
Value of the Equity – If the initial mortgage amount is calculated by multiplying the loan-to-value ratio (M) by the property value (V), then the equity value is one minus the loan-to-value ratio multiplied by the property value. The following formula represents the value of the equity.
(1 - M) V Discounting the Cash Flow to Equity to the Present Value – The cash flow to equity in each projection year is discounted to the present value at the equity yield rate (1/Sn). The sum of these cash flows is the value of the equity (1 - M) V. The following formula represents the calculation of equity as the sum of the discounted cash flows.
(de1 x 1/S1) + (de2 x 1/S2) + . . . + (de10 x 1/S10) + (dr x 1/S10) = (1 - M) V Combining the Equations: Annual Cash Flow to Equity and Discounting the Cash Flow to Equity to the Present Value – The last step is to arrive at one overall equation that shows that the annual cash flow to equity plus the yearly discounting to the present value equals the value of the equity.
((NI1 - (f x M x V)) 1/S1) + ((NI2 - (f x M x V)) 1/S2) + . . . ((NI10 - (f x M x V)) 1/S10) +
(((NI11/Rr) - (b (NI11/Rr)) - ((1 - P) x M x V)) 1/S10) = (1 -M) V Because the only unknown in this equation is the property's value (V), it can be solved readily. Ten-Year Projection of Income and Expense – Because the fixed and variable forecast of income and expense is carried out only to the stabilized year, it is necessary to continue the projection to the eleventh year. In most cases, net income before debt service beyond the stabilized year is projected at an assumed inflation rate. By increasing a property's revenue and expenses at the same rate of inflation, net income remains constant as a percentage of total revenue, and the dollar amount escalates at the annual inflation rate. The ten-year forecast of
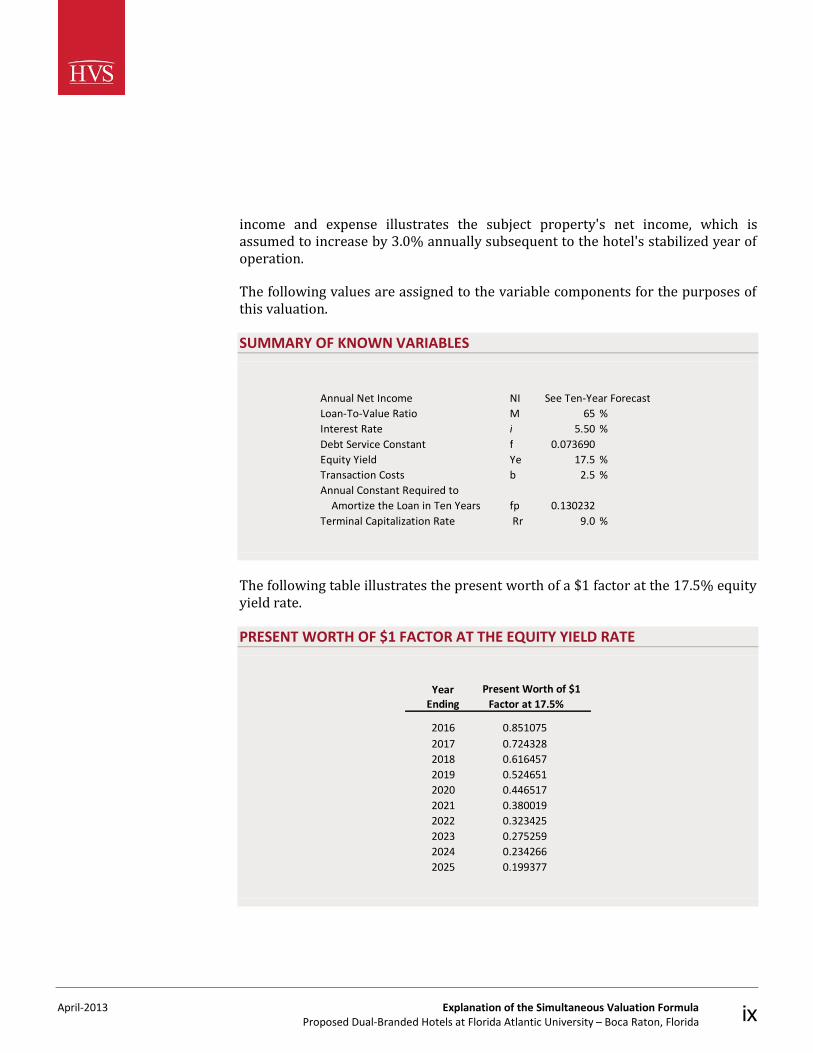
April-2013 Explanation of the Simultaneous Valuation Formula Proposed Dual-Branded Hotels at Florida Atlantic University – Boca Raton, Florida ix
income and expense illustrates the subject property's net income, which is assumed to increase by 3.0% annually subsequent to the hotel's stabilized year of operation. The following values are assigned to the variable components for the purposes of this valuation. SUMMARY OF KNOWN VARIABLES
Annual Net Income NI See Ten-Year ForecastLoan-To-Value Ratio M 65 %Interest Rate i 5.50 %Debt Service Constant f 0.073690Equity Yield Ye 17.5 %Transaction Costs b 2.5 %Annual Constant Required to Amortize the Loan in Ten Years fp 0.130232Terminal Capitalization Rate Rr 9.0 %
The following table illustrates the present worth of a $1 factor at the 17.5% equity yield rate. PRESENT WORTH OF $1 FACTOR AT THE EQUITY YIELD RATE
Year Present Worth of $1Ending Factor at 17.5%
2016 0.8510752017 0.7243282018 0.6164572019 0.5246512020 0.4465172021 0.3800192022 0.3234252023 0.2752592024 0.2342662025 0.199377
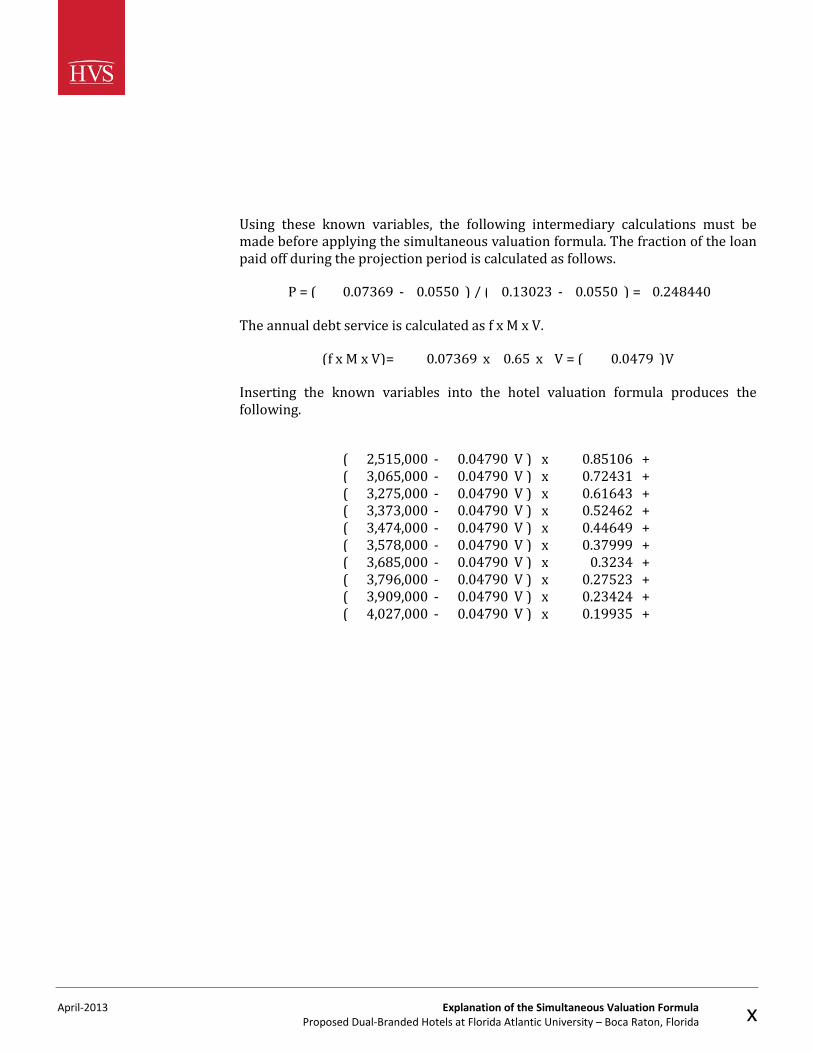
April-2013 Explanation of the Simultaneous Valuation Formula Proposed Dual-Branded Hotels at Florida Atlantic University – Boca Raton, Florida x
Using these known variables, the following intermediary calculations must be made before applying the simultaneous valuation formula. The fraction of the loan paid off during the projection period is calculated as follows.
P = ( 0.07369 - 0.0550 ) / ( 0.13023 - 0.0550 ) = 0.248440 The annual debt service is calculated as f x M x V.
(f x M x V)= 0.07369 x 0.65 x V = ( 0.0479 )V Inserting the known variables into the hotel valuation formula produces the following.
( 2,515,000 - 0.04790 V ) x 0.85106 +( 3,065,000 - 0.04790 V ) x 0.72431 +( 3,275,000 - 0.04790 V ) x 0.61643 +( 3,373,000 - 0.04790 V ) x 0.52462 +( 3,474,000 - 0.04790 V ) x 0.44649 +( 3,578,000 - 0.04790 V ) x 0.37999 +( 3,685,000 - 0.04790 V ) x 0.3234 +( 3,796,000 - 0.04790 V ) x 0.27523 +( 3,909,000 - 0.04790 V ) x 0.23424 +( 4,027,000 - 0.04790 V ) x 0.19935 +
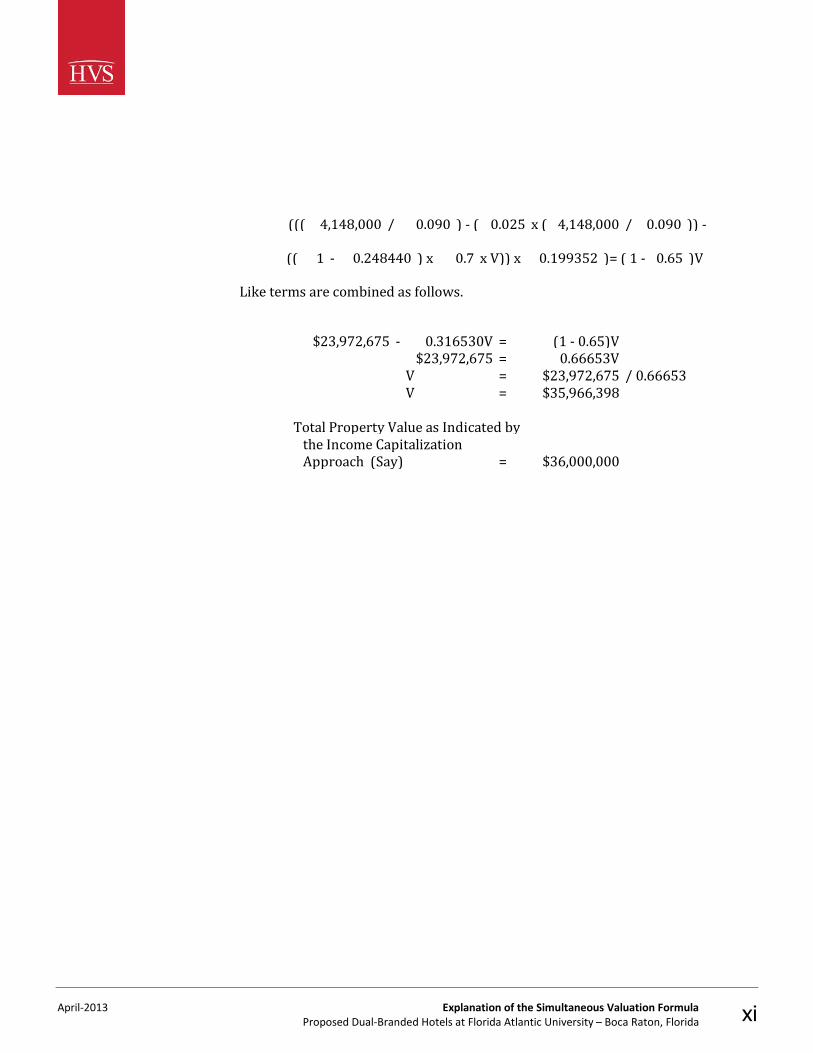
April-2013 Explanation of the Simultaneous Valuation Formula Proposed Dual-Branded Hotels at Florida Atlantic University – Boca Raton, Florida xi
((( 4,148,000 / 0.090 ) - ( 0.025 x ( 4,148,000 / 0.090 )) - (( 1 - 0.248440 ) x 0.7 x V)) x 0.199352 )= ( 1 - 0.65 )V
Like terms are combined as follows.
$23,972,675 - 0.316530V = (1 - 0.65)V$23,972,675 = 0.66653V
V = $23,972,675 / 0.66653V = $35,966,398
Total Property Value as Indicated by the Income Capitalization Approach (Say) = $36,000,000
HVS, Atlanta, Georgia Qualifications of Michael Brophy 1
Michael Brophy
HVS CONSULTING AND VALUATION SERVICES Atlanta, Georgia TWO RIVERS CONVENTION CENTER/AVALON THEATRE Grand Junction, Colorado SOUTHFORK RANCH EVENT AND CONFERENCE CENTER Dallas, Texas WYNDHAM INTERNATIONAL San Rafael, California; Commerce, California; Dallas, Texas BS – East Stroudsburg State University
Certified General Appraiser Classes Completed: Basic Real Estate Appraisal – 60 hours Uniform Residential Appraisal Report – 15 hours Uniform Standards of Professional Appraisal Practice – 15 hours Basic Income Capitalization – 39 hours Apartment Appraisal – 15 hours Residential Report Writing and Case Studies – 15 hours General Appraiser Market Analysis and HBU – 30 hours General Appraiser Site Valuation and Cost Approach – 30 hours General Appraiser Sales Comparison Approach – 30 hours Real Estate Finance, Statistics, and Valuation Modeling – 15 hours General Appraiser Report Writing and Case Studies – 30 hours General Appraiser Income Approach, Part II – 30 hours Advanced Income Capitalization – 40 hours
EMPLOYMENT
2004 to present
2001 – 2003
1998 – 2001
1995 – 1998
EDUCATION AND OTHER TRAINING
HVS, Atlanta, Georgia Qualifications of Michael Brophy 2
General Demonstration Appraisal Report Writing Report Seminar – 7 hours Advanced Sales & Cost – 40 hours Report Writing and Valuation Analysis – 40 hours Business Practices and Ethics – 7 hours Fundamentals of Separating Real, Personal Property, and Intangible Business Assets – 15
hours Advanced Applications – 40 hours Forecasting Revenue – 7 hours PA Law Class – 2 hours USPAP Update – 2008, 2011, 2012 Alabama, Georgia, Florida, Illinois, Mississippi, North Carolina, Ohio, Pennsylvania, South Carolina, Tennessee “Market Intelligence Report 2013: Atlanta,” June 2013 “Hotel Performance, Transactions, and Values: News from the 25th Annual Hunter Hotel Conference,” April 2013 “HVS Hotel Market Snapshot: Atlanta,” April 2011 “HVS Reflections on the 2010 Hunter Hotel Conference,” co-authored with Janet Snyder, May 2010 “What You Need to Consider Before Buying a Distressed Property,” co-authored with Li Chen, August 2009 “Brand Power: InterContinental Hotels Group,” March 2009 Flower Mound Chamber of Commerce American Hotel & Lodging Association
EDUCATION AND OTHER TRAINING (CON’T)
STATE CERTIFICATIONS
PUBLISHED ARTICLES
HVS Journal
HVS Journal
HVS Journal
HVS Journal
HVS Journal
HVS Journal
PROFESSIONAL AFFILIATIONS
HVS, Atlanta, Georgia Qualifications of Michael Brophy 3
EXAMPLES OF COROPRATE AND INSTITUTIONAL CLIENTS SERVED AEW Aldridge, Inc. American Hotel Development Partners American Property Management Archon Hospitality Ardmore Tourism Authority Arnall Golden Gregory LLP Ascent Hospitality LLC Assent Capital LLC Avista Aztec Group, Inc. B&H Hospitality Baha Mar Development Company Bankers Bank Bank MidWest Bank of America Bank of Hampton Roads Bank of Jackson Hole Barclays Bear Stearns Behringer Harvard Benchmark Development Berkshire Hotels Group Blanchard & Calhoun BNA Associates Branch Banking & Trust Co. Brotherhood Bank & Trust Buena Vista Hospitality Group Cabi Developers Camden National Bank Capital Funding Group Cathay Bank Cava Construction CB Richard Ellis Centerline Capital Group Cheeca Holdings, LLC CIBC World Markets CIT Citigroup City of Acworth City of Chattanooga Clarion Partners Columbus Bank & Trust Column Financial
Commerce National Bank Cornerstone Bank Countrywide Credit Suisse CS First Boston CU Business Capital CWCapital Delco Development Deutsche Bank Dillon Read Dimension Development Eastside Commercial Bank Elm Street Center, LLC Falor Companies Fidelity Bank First Hartford Realty Foxhall Resort and Sporting Club Galleria Ventures Ganesh Ventures LLC GE Capital Gencom Goldman Sachs GS Development LLC Guy Mitchell Hall Financial Harrell Hospitality Holland Development Group Holloway Lodging REIT HomePlace Developers The HUB Mixed Use LLC iCAP Realty Advisors Impact Properties ING Investment Management Investcorp Jackson State Bank & Trust JER Partners Johnson Resort Properties Jones Lang LaSalle JPMorgan Chase Kent State University KMW Real Estate Lake Real Estate Latitude Hospitality, Inc. Laureate Capital Lehman Brothers Lennar Lexden Capital
Love Funding LRP Manchester Texas Financial Group MainSource Bank Mellon Bank Merrill Lynch MetLife MetroFund Group Midland Loan Services MMA Realty, Inc. Mockingbird Properties Moody National Companies Morgan Stanley Mutual Bank Natixis Real Estate Capital Neptune Hospitality Nock Investments, Inc. Nomura North Ocean Management Group Northview Hotel Group NRF Capital NXT Capital, LLC Oakworth Capital Bank O’Connor Capital Palmetto Bank Paragon Hotel Company Park Hospitality Group Park National Bank PB Capital Corporation Peachtree Hotel Group Peoples Bank Biloxi Pleasant Hill Partners Potomac Business Services Prescient Capital Principal Real Estate Investors ProHomes, LLC Prudential Purdue University Quarterage Hotel Quincy Investments Ranger Properties RBS Remington Resort Management Group LLC Rialto Capital Rilea Group River Hall Partnership
HVS, Atlanta, Georgia Qualifications of Michael Brophy 4
Robinson McFadden Attorney Rolarco Services Sabra Enterprises Self-Help Bank Shore Land Ventures, LLC Silverton Bank Site Realty Smith, Gambrell & Russell, LLP Somerock University Mall Holdings,
LLC SouthCity Bank Specialty Finance Group State Bank of Texas Steiner Summit Financial Summit Hotel Group Textron Financial The Blackstone Group Third Ward Park Holding LLC TIB Bank TJ, LLC Torgerson Properties Tramz Hotels TriState Bank True North Development Group TVO North America UBS Investment Bank University of West Florida Upscale Companies US Bank Valuation Management Group Vieste Development Vintage Companies Vision Hospitality Group WG Yates and Sons Construction Windmill Development Winslow Homes, LLC WPM Construction LLC EXAMPLES OF PROPERTIES APPRAISED OR EVALUATED PORTFOLIO ANALYSIS
Quarterly Portfolio of 57 Clarion-Owned Properties, Various Locations
ALABAMA Hampton Inn & Suites, Athens Hampton Inn, Bessemer Hampton Inn, Birmingham Hilton, Birmingham Proposed aloft, Birmingham Residence Inn by Marriott,
Birmingham Proposed Fairfield Inn by Marriott,
Greenville Embassy Suites, Hoover Hilton Garden Inn, Huntsville Hampton Inn, Montgomery Proposed Hilton Garden Inn,
Montgomery Baymont Inn & Suites, Oxford ARIZONA Phoenix Highland Hotel, Phoenix Phoenix Inn, Phoenix Phoenix Place Hotel and Suites
(DoubleTree Conversion), Phoenix Radisson, Phoenix Proposed Summerfield Suites, Tempe DoubleTree, Tucson ARKANSAS Radisson, Fayetteville Embassy Suites, Little Rock La Quinta, Little Rock Proposed Embassy Suites, Little Rock Proposed Sheraton, Rogers Hampton Inn & Suites, Springdale Holiday Inn, Springdale CALIFORNIA
Ventana Inn & Spa, Big Sur DoubleTree, Commerce Homewood Suites by Hilton, La Quinta Sheraton Four Points, Los Angeles Westin Century Plaza, Los Angeles Embassy Suites, Monterey Bay Best Western, Poway Proposed Hyatt Summerfield Suites,
Roseville La Quinta, San Diego Casa Madrona, Sausalito Embassy Suites Monterey Bay, Seaside Fairmont Mission Inn, Sonoma COLORADO Homewood Suites, Boulder Sheraton, Colorado Springs CONNECTICUT Sheraton, Stamford Mayflower Inn & Spa, Washington Courtyard by Marriott, Waterbury DELAWARE Courtyard by Marriott, Wilmington McIntosh Hotel, Wilmington DISTRICT OF COLUMBIA Capitol Hill Suites Courtyard by Marriott Navy Yard DoubleTree FLORIDA South Seas Resort, Captiva Island Hilton, Clearwater Beach Hilton, Cocoa Beach
HVS, Atlanta, Georgia Qualifications of Michael Brophy 5
Mayfair Hotel & Spa, Coconut Grove Omni, Coral Gables Holiday Inn, Daytona Beach Hawk’s Cay, Duck Key Red Roof Inn, Fort Lauderdale Fairfield Inn & Suites, Gainesville Ramada Inn, Hialeah Proposed Hotel, Indian Rocks Beach Cheeca Lodge & Spa, Islamorada Sheraton, Key Largo Crowne Plaza, Key West Inn at Key West, Key West Proposed Hotel, Key West Proposed Hampton Inn & Suites,
Lake Buena Vista Hilton, Melbourne Quality Suites, Melbourne Mayfair, Miami Hacienda Hotel, New Port Richey Proposed Hampton Inn, New Smyrna
Beach Best Western, Ocala Hilton Garden Inn, Orange Park DoubleTree, Orlando International Plaza Resort, Orlando Proposed Condo Hotel, Orlando Coral Sands Hotel, Ormond Beach Hilton, Palm Beach Ocean Club Beach Resort, Palm Beach Proposed Hotel – UWF, Pensacola Proposed Hyatt Place & Conference
Center, Pensacola Days Inn, Port Charlotte Hampton Inn, Port Charlotte SpringHill Suites, Port St. Lucie Sanibel Inn, Sanibel Island Seaside Inn, Sanibel Island Song of the Sea, Sanibel Island Sundial Beach Resort, Sanibel Island Sunset Beach Resort, Sanibel Island Tradewinds Resort, St. Petersburg Holiday Inn, Tallahassee Proposed element, Tampa Proposed Holiday Inn, Tampa GEORGIA
Proposed Hotel, Acworth Proposed Hampton Inn & Suites,
Adairsville Courtyard Atlanta Executive Park,
Atlanta Courtyard Atlanta
Glenridge/Perimeter, Atlanta Courtyard Buckhead, Atlanta Crowne Plaza Ravinia, Atlanta The Glenn Hotel, Atlanta Homewood Suites, Atlanta Mansion on Peachtree, Atlanta – expert
testimony Red Roof Inn, Atlanta Renaissance Concourse, Atlanta Residence Inn, Atlanta Ritz-Carlton Downtown, Atlanta Westin Airport, Atlanta W Hotel, Atlanta W Midtown, Atlanta Candlewood Suites, Athens Proposed Candlewood Suites, Athens Proposed Hotel Condo Conversion,
Athens Proposed Select-Service Hotel,
Augusta Proposed TownePlace Suites, Augusta Quality Inn & Suites, Bremen SpringHill Suites, Buckhead Proposed Courtyard by Marriott,
Buford Proposed Cambria Suites, College Park Proposed Foxhall Resort, Douglas
County Hilton Garden Inn, Duluth Holiday Inn Gwinnett Center, Duluth Residence Inn, Hapeville Embassy Suites, Kennesaw Proposed Four Points, Kennesaw Proposed Hotel, Lake Oconee Proposed Full-Service Hotel,
Lawrenceville Proposed Hotel, Macon Hilton Atlanta Northeast, Norcross Proposed aloft, Perimeter
Proposed Luxury Collection, Rising Fawn
Proposed Cambria Suites, Savannah Proposed Extended-Stay Hotel,
Savannah Proposed Indigo Hotel, Savannah Fairfield Inn & Suites, Valdosta Wingate Inn, Valdosta ILLINOIS Proposed Hotel & Conference Center,
Alton Hotel Allegro, Chicago Lenox Suites, Chicago Proposed Renaissance, Chicago Proposed Wyndham, Chicago Radisson, Chicago Wyndham Downtown, Chicago Wyndham O’Hare, Chicago Residence Inn, Deerfield Wyndham Northwest, Itasca Crowne Plaza Chicago O’Hare,
Rosemont INDIANA Marriott, Evansville Proposed Hotel/Impact Study, West
Lafayette Proposed Union Club Hotel, West
Lafayette IOWA Proposed Hilton Garden Inn &
Conference Center, Amana Marriott (Collins Plaza), Cedar Rapids Proposed Sheraton, Davenport Radisson, Davenport LOUISIANA
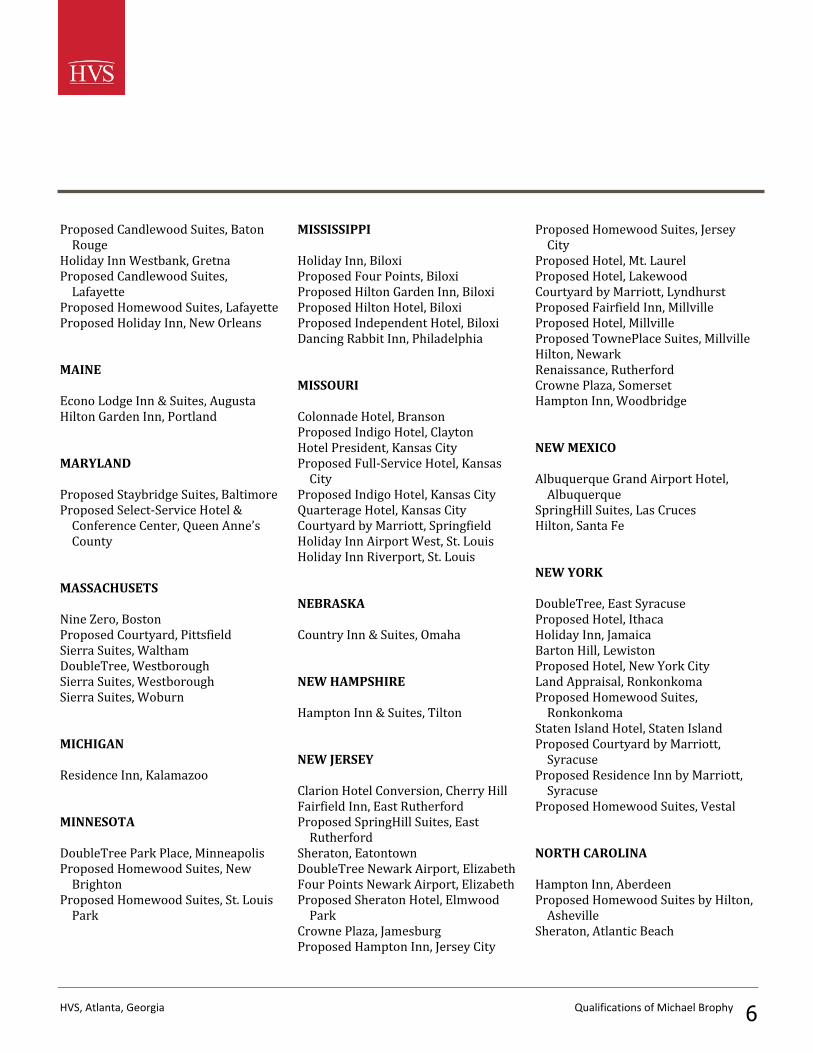
HVS, Atlanta, Georgia Qualifications of Michael Brophy 6
Proposed Candlewood Suites, Baton Rouge
Holiday Inn Westbank, Gretna Proposed Candlewood Suites,
Lafayette Proposed Homewood Suites, Lafayette Proposed Holiday Inn, New Orleans MAINE Econo Lodge Inn & Suites, Augusta Hilton Garden Inn, Portland MARYLAND Proposed Staybridge Suites, Baltimore Proposed Select-Service Hotel &
Conference Center, Queen Anne’s County
MASSACHUSETS Nine Zero, Boston Proposed Courtyard, Pittsfield Sierra Suites, Waltham DoubleTree, Westborough Sierra Suites, Westborough Sierra Suites, Woburn MICHIGAN Residence Inn, Kalamazoo MINNESOTA DoubleTree Park Place, Minneapolis Proposed Homewood Suites, New
Brighton Proposed Homewood Suites, St. Louis
Park
MISSISSIPPI Holiday Inn, Biloxi Proposed Four Points, Biloxi Proposed Hilton Garden Inn, Biloxi Proposed Hilton Hotel, Biloxi Proposed Independent Hotel, Biloxi Dancing Rabbit Inn, Philadelphia MISSOURI Colonnade Hotel, Branson Proposed Indigo Hotel, Clayton Hotel President, Kansas City Proposed Full-Service Hotel, Kansas
City Proposed Indigo Hotel, Kansas City Quarterage Hotel, Kansas City Courtyard by Marriott, Springfield Holiday Inn Airport West, St. Louis Holiday Inn Riverport, St. Louis NEBRASKA Country Inn & Suites, Omaha NEW HAMPSHIRE Hampton Inn & Suites, Tilton NEW JERSEY Clarion Hotel Conversion, Cherry Hill Fairfield Inn, East Rutherford Proposed SpringHill Suites, East
Rutherford Sheraton, Eatontown DoubleTree Newark Airport, Elizabeth Four Points Newark Airport, Elizabeth Proposed Sheraton Hotel, Elmwood
Park Crowne Plaza, Jamesburg Proposed Hampton Inn, Jersey City
Proposed Homewood Suites, Jersey City
Proposed Hotel, Mt. Laurel Proposed Hotel, Lakewood Courtyard by Marriott, Lyndhurst Proposed Fairfield Inn, Millville Proposed Hotel, Millville Proposed TownePlace Suites, Millville Hilton, Newark Renaissance, Rutherford Crowne Plaza, Somerset Hampton Inn, Woodbridge NEW MEXICO Albuquerque Grand Airport Hotel,
Albuquerque SpringHill Suites, Las Cruces Hilton, Santa Fe NEW YORK DoubleTree, East Syracuse Proposed Hotel, Ithaca Holiday Inn, Jamaica Barton Hill, Lewiston Proposed Hotel, New York City Land Appraisal, Ronkonkoma Proposed Homewood Suites,
Ronkonkoma Staten Island Hotel, Staten Island Proposed Courtyard by Marriott,
Syracuse Proposed Residence Inn by Marriott,
Syracuse Proposed Homewood Suites, Vestal NORTH CAROLINA Hampton Inn, Aberdeen Proposed Homewood Suites by Hilton,
Asheville Sheraton, Atlantic Beach
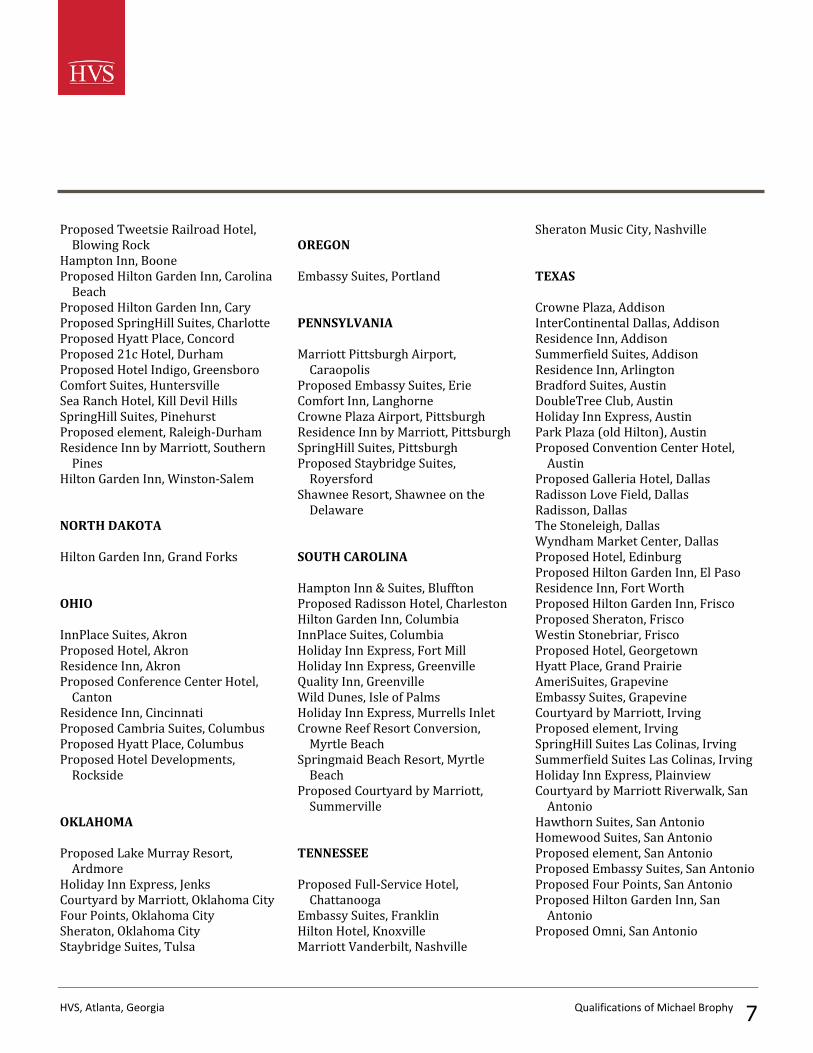
HVS, Atlanta, Georgia Qualifications of Michael Brophy 7
Proposed Tweetsie Railroad Hotel, Blowing Rock
Hampton Inn, Boone Proposed Hilton Garden Inn, Carolina
Beach Proposed Hilton Garden Inn, Cary Proposed SpringHill Suites, Charlotte Proposed Hyatt Place, Concord Proposed 21c Hotel, Durham Proposed Hotel Indigo, Greensboro Comfort Suites, Huntersville Sea Ranch Hotel, Kill Devil Hills SpringHill Suites, Pinehurst Proposed element, Raleigh-Durham Residence Inn by Marriott, Southern
Pines Hilton Garden Inn, Winston-Salem NORTH DAKOTA Hilton Garden Inn, Grand Forks OHIO InnPlace Suites, Akron Proposed Hotel, Akron Residence Inn, Akron Proposed Conference Center Hotel,
Canton Residence Inn, Cincinnati Proposed Cambria Suites, Columbus Proposed Hyatt Place, Columbus Proposed Hotel Developments,
Rockside OKLAHOMA Proposed Lake Murray Resort,
Ardmore Holiday Inn Express, Jenks Courtyard by Marriott, Oklahoma City Four Points, Oklahoma City Sheraton, Oklahoma City Staybridge Suites, Tulsa
OREGON Embassy Suites, Portland PENNSYLVANIA Marriott Pittsburgh Airport,
Caraopolis Proposed Embassy Suites, Erie Comfort Inn, Langhorne Crowne Plaza Airport, Pittsburgh Residence Inn by Marriott, Pittsburgh SpringHill Suites, Pittsburgh Proposed Staybridge Suites,
Royersford Shawnee Resort, Shawnee on the
Delaware SOUTH CAROLINA Hampton Inn & Suites, Bluffton Proposed Radisson Hotel, Charleston Hilton Garden Inn, Columbia InnPlace Suites, Columbia Holiday Inn Express, Fort Mill Holiday Inn Express, Greenville Quality Inn, Greenville Wild Dunes, Isle of Palms Holiday Inn Express, Murrells Inlet Crowne Reef Resort Conversion,
Myrtle Beach Springmaid Beach Resort, Myrtle
Beach Proposed Courtyard by Marriott,
Summerville TENNESSEE Proposed Full-Service Hotel,
Chattanooga Embassy Suites, Franklin Hilton Hotel, Knoxville Marriott Vanderbilt, Nashville
Sheraton Music City, Nashville TEXAS Crowne Plaza, Addison InterContinental Dallas, Addison Residence Inn, Addison Summerfield Suites, Addison Residence Inn, Arlington Bradford Suites, Austin DoubleTree Club, Austin Holiday Inn Express, Austin Park Plaza (old Hilton), Austin Proposed Convention Center Hotel,
Austin Proposed Galleria Hotel, Dallas Radisson Love Field, Dallas Radisson, Dallas The Stoneleigh, Dallas Wyndham Market Center, Dallas Proposed Hotel, Edinburg Proposed Hilton Garden Inn, El Paso Residence Inn, Fort Worth Proposed Hilton Garden Inn, Frisco Proposed Sheraton, Frisco Westin Stonebriar, Frisco Proposed Hotel, Georgetown Hyatt Place, Grand Prairie AmeriSuites, Grapevine Embassy Suites, Grapevine Courtyard by Marriott, Irving Proposed element, Irving SpringHill Suites Las Colinas, Irving Summerfield Suites Las Colinas, Irving Holiday Inn Express, Plainview Courtyard by Marriott Riverwalk, San
Antonio Hawthorn Suites, San Antonio Homewood Suites, San Antonio Proposed element, San Antonio Proposed Embassy Suites, San Antonio Proposed Four Points, San Antonio Proposed Hilton Garden Inn, San
Antonio Proposed Omni, San Antonio
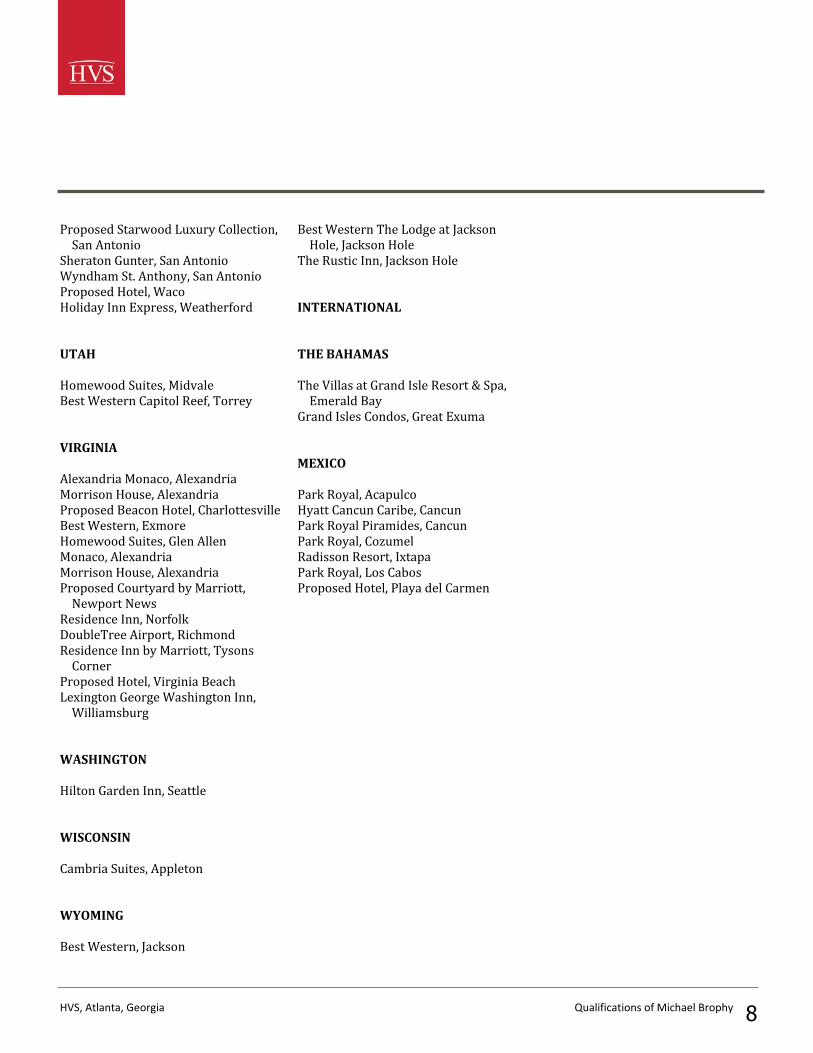
HVS, Atlanta, Georgia Qualifications of Michael Brophy 8
Proposed Starwood Luxury Collection, San Antonio
Sheraton Gunter, San Antonio Wyndham St. Anthony, San Antonio Proposed Hotel, Waco Holiday Inn Express, Weatherford UTAH Homewood Suites, Midvale Best Western Capitol Reef, Torrey VIRGINIA Alexandria Monaco, Alexandria Morrison House, Alexandria Proposed Beacon Hotel, Charlottesville Best Western, Exmore Homewood Suites, Glen Allen Monaco, Alexandria Morrison House, Alexandria Proposed Courtyard by Marriott,
Newport News Residence Inn, Norfolk DoubleTree Airport, Richmond Residence Inn by Marriott, Tysons
Corner Proposed Hotel, Virginia Beach Lexington George Washington Inn,
Williamsburg WASHINGTON Hilton Garden Inn, Seattle WISCONSIN Cambria Suites, Appleton WYOMING Best Western, Jackson
Best Western The Lodge at Jackson Hole, Jackson Hole
The Rustic Inn, Jackson Hole INTERNATIONAL THE BAHAMAS The Villas at Grand Isle Resort & Spa,
Emerald Bay Grand Isles Condos, Great Exuma MEXICO Park Royal, Acapulco Hyatt Cancun Caribe, Cancun Park Royal Piramides, Cancun Park Royal, Cozumel Radisson Resort, Ixtapa Park Royal, Los Cabos Proposed Hotel, Playa del Carmen
HVS, Atlanta, Georgia Qualifications of Adam Lair, MAI 1
Adam Lair, MAI
HVS CONSULTING AND VALUATION SERVICES Atlanta, Georgia AXIA VALUATION New Orleans, Louisiana BA – Louisiana State University
Other Specialized Training Classes Completed: National USPAP Course – 15 hours National USPAP Course Update – 7 hours Basic Appraisal Principles – 30 hours Basic Appraisal Procedures – 30 hours Real Estate Finance, Statistics, Valuation Modeling – 15 hours General Appraiser Market Analysis and Highest & Best Use – 30 hours General Appraiser Sales Comparison Approach – 30 hours General Appraiser Site Valuation and Cost Approach – 30 hours General Appraiser Income Approach – 60 hours General Appraiser Report Writing and Case Studies – 30 hours Advanced Sales Comparison and Cost Approaches – 40 hours Business Practices and Ethics – 7 hours Advanced Concepts and Case Studies – 40 hours Advanced Income Capitalization – 40 hours Florida Law Class – 3 hours
EMPLOYMENT
2011 to present
2007 – 2011
EDUCATION AND OTHER TRAINING
HVS, Atlanta, Georgia Qualifications of Adam Lair, MAI 2
Alabama, Florida, Georgia, Louisiana, Mississippi, North Carolina, South Carolina, Texas Appraisal Institute – Designated Member (MAI) “HVS Hotel Market Intelligence Report: New Orleans, Louisiana,” January 2012
STATE CERTIFICATIONS
PROFESSIONAL AFFILIATIONS
PUBLISHED ARTICLES
HVS Journal
HVS, Atlanta, Georgia Qualifications of Adam Lair, MAI 3
EXAMPLES OF COROPRATE AND INSTITUTIONAL CLIENTS SERVED Adams and Reese LLP Archetype Mortgage Capital Bancorp South BB&T Biltmore Company BNA Associates Borrego Springs Bank Business First Bank Cantor Commercial Real Estate
Lending LLC Capital Bank Capital One Capsule Group Citi Citizens National Bank of Meridien Citizens National Bank Clarion Partners Cornerstone Commercial Mortgages,
LLC Cushman & Wakefield CWB Bank CW Capital Deutsche Bank DRDC-Citymarket LLC Eastern Capital EKS&H Fidelity Bank Fine Hospitality Group First Jackson Bank First NBC Bank First National Bank of Talladega First NBC Bank Foxhall Event & Sporting Club Gainsville Stimulus Fund Glacier Club Greenspoon Marder Hana Small Business Lending HDG Mansur The HUB Mixed Use LLC International Bank of Commerce JPMorgan Chase Kennebunk Savings Legence Bank Merrill Trust Communities & Resorts
Metro City Bank Midfirst Bank Mountain 1st Bank & Trust NBT Bank Noah Bank Northern Riverfront Marina & Hotel
LLLP NXT Capital, LLC Oxbox Ventures Patriot Group PCCP, LLC Prudential Quadrant Financial Ram Hotel Development Redwood Commercial Mortgage Regions Bank Robinson McFadden Attorney Simon Properties Summit Hotel Properties Susquehanna Total Bank UrbanAmerica USB US Bank Valuation Management Group, LLC Vieste Development Wells Fargo Wilshire Bank WPM Construction
HVS, Atlanta, Georgia Qualifications of Adam Lair, MAI 4
EXAMPLES OF PROPERTIES APPRAISED OR EVALUATED ALABAMA Holiday Inn Express, Auburn Comfort Inn & Suites, Birmingham Hilton, Birmingham Best Western Daphne City Lodge, Florence Best Western, Gadsden Country Inn & Suites, Homewood Homewood Suites, Huntsville Comfort Inn, Mobile Homewood Suites, Mobile Best Western, Montgomery Proposed Courtyard, Phenix City Quality Inn, Phenix City Days Inn, Saraland ARIZONA Palm Inn, Yuma CALIFORNIA Proposed Hilton Garden Inn, Burbank Residence Inn by Marriott Days Inn & Suites, Palmdale COLORADO Proposed Hotel Glacier Club, Durango The Peaks Resort and Spa, Telluride DISTRICT OF COLUMBIA Proposed Cambria Suites FLORIDA
Proposed Select-Service Hotel, Boca Raton
Hampton Inn, Clermont Daytona Beach Resort, Daytona Beach Comfort Inn, Jupiter Hilton Garden Inn, Lake Mary Proposed Courtyard by Marriott,
Marathon Candlewood Suites, Melbourne Proposed Hotel Dadeland Mall, Miami DoubleTree Orlando at SeaWorld,
Orlando Fairfield Inn, Orlando GEORGIA Clermont Hotel, Atlanta Comfort Inn, Atlanta Country Inn, Atlanta Crowne Plaza Ravinia, Atlanta Quality Inn, Atlanta Ritz-Carlton Downtown, Atlanta Westin Perimeter North, Atlanta Hilton Garden Inn, College Park Quality Inn & Suites, College Park Proposed Boutique Hotel, Douglas
County Proposed Westin, Douglas County Quality Inn, Savannah Proposed Fairfield Inn & Suites,
Stockbridge Fairfield Inn & Suites, Valdosta ILLINOIS Allegro, Chicago INDIANA Hampton Inn, Warsaw LOUISIANA
Holiday Inn, Baton Rouge Country Inn & Suites, Covington Travelodge, Harvey Courtyard by Marriott, Houma Crowne Plaza, Kenner Super 8, Lake Charles Courtyard, Metairie Residence Inn, Metairie Courtyard Convention Center, New
Orleans Courtyard French Quarter, New
Orleans InterContinental, New Orleans Proposed Hyatt House, New Orleans SpringHill Suites Convention Center,
New Orleans MAINE Econo Lodge, Freeport MARYLAND Ramada Inn, Perryville Quality Inn Econo Lodge, Takoma Park MISSISSIPPI Proposed Hampton Inn & Suites,
Gulfport Proposed Hotel University of
Mississippi Medical Center, Jackson Comfort Inn, Laurel Super 8, Moss Point America’s Best Inns & Suites, Tupelo NEVADA Holiday Inn Express Nellis, Las Vegas NEW HAMPSHIRE
HVS, Atlanta, Georgia Qualifications of Adam Lair, MAI 5
Country Inn & Suites, New Bedford NEW JERSEY Comfort Inn, Princeton NORTH CAROLINA Proposed Hotel – Biltmore Estate,
Asheville Proposed Wyndham, Greensboro Courtyard by Marriott, Raleigh Proposed Indigo, Wilmington OHIO Econo Lodge, Columbus PENNSYLVANIA Crowne Plaza, Trevose SOUTH CAROLINA Comfort Inn, Charleston Proposed Radisson Hotel, Charleston Comfort Suites, Lexington Crown Reef Resort, Myrtle Beach TENNESSEE Sheraton Road House, Chattanooga TEXAS Proposed Holiday Inn Express,
Baytown Ramada, Dallas Days Inn, Decatur
Candlewood Suites DFW Airport South, Fort Worth
Holiday Inn DFW Airport South, Fort Worth
Staybridge Suites Plano, Plano VIRGINIA Alexandria Monaco, Alexandria Morrison House, Alexandria Comfort Suites, Manassas Quality Inn West End, Richmond WISCONSIN Ramada, Fond du Lac