family business gone wrong? ownership patterns and corporate
TRANSCRIPT
ADB INSTITUTE WORKING PAPER 19
Family Business Gone Wrong?Ownership Patterns and Corporate Performance in Thailand
Akira Suehiro
May 2001
ADB INSTITUTETOKYO
ASIA
N D
EV
ELO
PM
EN
T BA
NK IN
ST
ITU
TE
ASIA
N D
EV
ELO
PM
EN
T BA
NK IN
ST
ITU
TE
For many scholars and international institutions, the postcrisis agenda facing Asia has been mainly to reform corporate governance. However, they have paid little attention to how to implement such reforms. Can this Western concept of "good corporate governance" be successfully adapted to Asian corporations?
This is one of the fundamental questions addressed in this paper, which takes the case of Thailand to test if the ownership structure of family-run businesses was really the main culprit behind the Asian financial crisis, and whether changes in this regard have helped improve corporate performance for the recovery.
ADB InstituteWorking Paper Series
No. 19
May 2001
Family Business Gone Wrong?
Ownership Patterns and Corporate
Performance in Thailand
Akira Suehiro
In association with
Nate-napha Weilerdsak
II
ADB INSTITUTE WORKING PAPER 19
Additional copies of the paper are available free from the Asian Development Bank Institute, 8th Floor, KasumigasekiBuilding, 3-2-5 Kasumigaseki, Chiyoda-ku, Tokyo 100-6008, Japan. Attention: Publications. Also online at www.adbi.org
The Working Paper Series primarily disseminates selected work in progress to facilitate an exchange of ideaswithin the Institute's constituencies and the wider academic and policy communities. An objective of theseries is to circulate primary findings promptly, regardless of the degree of finish. The findings,interpretations, and conclusions are the author's own and are not necessarily endorsed by the AsianDevelopment Bank Institute. They should not be attributed to the Asian Development Bank, its Boards, or anyof its member countries. They are published under the responsibility of the Dean of the ADB Institute. TheInstitute does not guarantee the accuracy or reasonableness of the contents herein and accepts noresponsibility whatsoever for any consequences of its use. The term "country", as used in the context of theADB, refers to a member of the ADB and does not imply any view on the part of the Institute as to sovereigntyor independent status. Names of countries or economies mentioned in this series are chosen by the authors, inthe exercise of their academic freedom, and the Institute is in no way responsible for such usage.
Copyright © 2001 Asian Development Bank Institute & A. Suehiro. All rights reserved. Produced by ADBI Publishing.
ABOUT THE AUTHOR
Akira Suehiro is a professor of the Institute of Social Science at the University of Tokyo and aneconomist specializing in Asian economies. He is also a research consultant at the ADB Institute andChairman of the Thailand Monitoring Committee of the Japan International Cooperation Agency.Prof. Suehiro organizes a study team on Thailand’s economic reforms at the JETRO Institute ofDeveloping Economies and is a member of the ADBI’s experts group on corporate governance.
Nate-napha Weilerdsak is a Ph.D. candidate of the Graduate School of Economics of the Universityof Tokyo. She is conducting a comparative study of white-collar career formation systems betweenJapan and Thailand.
III
PREFACE
The ADB Institute aims to explore the most appropriate development paradigms for Asia
composed of well-balanced combinations of the roles of markets, governments and institutions in the
post-crisis period.
Under this broad research project on development paradigms, the ADB Institute Working
Paper Series will contribute to disseminating works-in-progress as a building block of the project and
will invite comments and questions.
I trust that this series will provoke constructive discussions among policymakers as well as
researchers about where Asian economies should go from the last crisis and current recovery.
This Working Paper is part of the ADB Institute’s research project on corporate governance.
Masaru Yoshitomi
Dean
ADB Institute
IV
ABSTRACT
Since the Asian currency and economic crises erupted in 1997, many scholars and
international financial organizations have discussed their major causes and proposed policies that
could overcome the structural weaknesses that apparently led to the crises. In this context, scholars at
the International Monetary Fund, World Bank and numerous other institutions have emphasized the
need for Asian governments to bring about institutional reforms in corporate governance. However,
they seem to have paid little attention to the important issue of how to effectively implement these
institutional reforms, keeping in mind the reality of Asian corporations rather than the Anglo-
American ideal of good corporate governance.
The World Bank, in general, and a group of researchers working at that institution, in
particular, have focused on identification of ultimate owners, agency problems, the large gap between
control rights and cash flow rights, and expropriation of minority shareholders. However, it appears
that in their analysis they have not taken into account the actual functioning of local Asian firms and
their responses to government institutional reforms after the crisis.
Their analysis raises two major questions: (1) How have local firms adjusted themselves to
reforms, and has such adjustment positively contributed to improvement of corporate performance,
stock market movement and the national economy? (2) Has the introduction of the Anglo-American
model of good corporate governance into local firms really resulted in improved performance at the
individual firm level? In short, the main question addressed is whether the Western concept of “good
corporate governance,” which presupposes the presence of independent directors and minority
protection of shareholders as key elements for sound corporate activity, can be adapted to Asian
corporations.
In this study, we have attempted to address these questions by exploring the
interrelationships between ownership patterns, corporate structure and economic performance, based
on our own research of the 448 listed companies in Thailand between 1996 and 2000.
We examined the economic performance of Thai listed companies based on data taken
from their financial statements. We focused on their ownership patterns and investigated the
correlation between the firms’ economic performance and their ultimate owners (family business),
foreign ownership, the presence of minority shareholders and ownership/management separation
among family-owned firms.
Arising out of our findings are two useful hypotheses concerning family-run business and
corporate reforms in Thailand. The first is that family businesses in themselves were not a major cause
of the financial crisis and have not hindered recovery. Taking into account the significant role that
family businesses have played in Thailand’s nonfinancial sector, it would be better and more rational
to introduce ways of revitalizing existing family businesses to support sustainable growth rather than
trying to directly adapt the Western model of good corporate governance to local firms.
The second hypothesis is that family businesses are not automatically viable entities unless
they work to adjust themselves to the changing environment. They now face the need for fundamental
corporate restructuring under pressure of economic liberalization and industrial upgrading in
Thailand.
V
TABLE OF CONTENTS
About the Author II
Preface III
Abstract IV
Table of Contents V
1. Introduction: What is Good Corporate Governance for Thailand? 1
2. The World Bank’s Views on the Asian Crisis and Corporate Governance 3
3. Development of the Stock Market and Listed Companies in Thailand 6
3.1. The Importance of Listed Companies 6
3.2. Development of the Thai Stock Market 7
4. Who Controls Thai Firms: 1996 and 2000? 8
4.1. Classification of Thai Listed Companies by the World Bank and Suehiro 8
4.2. Changes in Ownership Pattern between 1996 and 2000 9
5. Ownership Pattern and Corporate Economic Performance 10
5.1. Data Sources and Financial Indicators Measuring Corporate Performance 10
5.2. Ultimate Owners, Family Businesses and Economic Performance 10
5.3. REHABCOs and Type of Business 11
5.4. Foreign Shareholdings and Economic Performance 11
5.5. Changes in Ownership Pattern and the Effect on Economic Performance 12
6. Minority Shareholders and Corporate Economic Performance 12
7. Separation of Ownership and Control among Family Businesses 14
7.1. Separation of Management from Ownership 14
7.2. Separation of the Executive Committee from the Board of Directors 15
7.3. Type of Business and Ownership Pattern 15
8. Restructuring Family Businesses 16
8.1. Why Family Businesses Survive 16
8.2. Human Resources among Family Businesses 16

VI
8.3. Continuous Reforms and Alliances with Foreign Partners 17
8.4. Traditional Family Businesses: Authoritarian Type 18
8.5. Modern Family Businesses: Innovative Type 20
9. Suggestions for Further Study 21
References 24
Tables and Diagrams 29
1
Family Business Gone Wrong?Ownership Patterns and Corporate Performance in Thailand
Akira Suehiro†
1. Introduction: What is Good Corporate Governance for Thailand?
This paper explores the interrelationships between ownership patterns, corporatestructure and economic performance, based on our own research of the 448 listedcompanies in Thailand between 1996 and 2000. We would like to address threequestions:
(1) Do family businesses always perform poorly due to their traditional pattern of controlover both ownership and management?
(2) Do minority shareholders contribute not only to a firm’s increased market valuation,but also to its improved corporate performance?
(3) To what extent does the separation of management from ownership among family-runbusinesses and the degree of independence of their Board members improve corporateperformance?
In short, the main question addressed in this paper is: can the Western concept of“good corporate governance,” which presupposes the presence of independent directorsand minority shareholders as key elements of sound corporate activity, be adapted toAsian corporations?
Since the Asian currency and economic crises erupted in 1997, many scholars andinternational financial organizations have discussed their major causes and haveproposed policies that could overcome the structural weaknesses that apparently led tothe crises. The International Monetary Fund (IMF) and World Bank have proposed to thegovernments of the crisis-hit Asian countries basically two interconnected types ofreform: (1) the restructuring of financial institutions, and (2) corporate restructuring(World Bank, 1998; 1999). Financial institutional restructuring seeks to resolvecommercial banks’ high levels of nonperforming loans (NPLs) and introduce to the localfinancial sectors new institutional frameworks based on global standards. Corporaterestructuring, on the other hand, mainly aims to restructure the huge amount of corporatedebt by drastically reorganizing corporate structure, which is largely dominated byfamily-run businesses.
In this context, IMF and the World Bank inevitably stress the importance of Asiancountries undertaking institutional reforms aimed at developing a direct corporate financesystem (i.e., equity and corporate bond markets), and reforming local corporations in linewith the so-called Anglo-American model of good corporate governance. The latterreform implies that a local corporation should be reorganized into a “modern”corporation, which utilizes the management skills of professional managers, and in which
† In association with Nate-napha Weilerdsak.
2
the Board of Directors and minority shareholders can more effectively supervisemanagement. Implicit in this argument is the assumption that family-run businesses havebeen prone to poor economic performance and lower stock market valuation, and havesignificantly contributed, in the long run, to structural weaknesses in Asia.
Based on these assumptions, IMF and the World Bank have proposed that Asiangovernments should adopt the following policies:• develop their stock markets in order to promote direct corporate finance;• appoint independent directors to company Boards and establish independent audit
committees;• introduce new audit and accounting systems in line with the International Accounting
Standards Committee (IASC) or the American Financial Accounting Standards Board(FASB);
• introduce new legal frameworks governing bankruptcy in order to quickly resolvecorporate debt conflicts between foreign creditors and local debtors; and
• promote an information disclosure system to improve local corporations ’transparency for the sake of investors and minority shareholders.
In line with these proposals, the Thai Government introduced new institutional andlegal frameworks by the end of 1999 (see Suehiro, 2001). Thus, it is necessary tocarefully examine whether these policies have actually produced any positive results, interms of improved performance at the level of firms, stock market and the overall nationaleconomy.
Scholars at IMF, the World Bank and numerous other institutions have emphasizedthe need for Asian governments to overcome structural weaknesses by bringing aboutinstitutional reforms in the governance of their corporate sector. However, they seem tohave paid little attention to the important issue of how to effectively implement theseinstitutional reforms, keeping in mind the reality of Asian corporations compared to theAnglo-American concept of good corporate governance.
In their research and policy recommendations on Asian corporate governance, theWorld Bank, in general, and a group of researchers working at that institution (StijnClaessens, Simeon Djankov, and Larry Lang [CDL group], 1998; 1999), in particular,have focused on identification of ultimate owners, agency problems, the large gapbetween control rights and cash flow rights, and expropriation of minority shareholders.However, it appears that in their analysis they have not taken into account the actualfunctioning of local Asian firms and corporate responses to government institutionalreforms after the crisis. Thus, two major questions should be raised.
The first question relates to how local firms have adjusted themselves to thesereforms, and asks whether such adjustment has positively contributed to improvement ofcorporate performance, stock market movement and the national economy in Thailand.At least with regard to the stock market, these institutional reforms do not seem to havehad a positive effect. As can be seen in Diagram 1, Thailand’s stock market index hasremained consistently at a low ebb since 1998. I have discussed this issue further inanother recent paper by analyzing the impact of new policies or the so-calleddisclosure-based screening system adopted by the Stock Exchange of Thailand (SET)since 1998 (Suehiro, 2001).
The second question relates to whether the introduction of the Anglo-Americanmodel of good corporate governance into local firms has really improved performance at
3
the individual firm level. Although many scholars have reproached family businesses asconstituting a key element in the institutional vulnerability of Asian economies, nobody,to our knowledge, has conducted intensive research work to explore correlations betweenownership patterns of Thai firms and their economic performance. Thus, there has beenno detailed study to answer the question of whether or how family businesses in Thailandhave gone wrong.
In this study, which is part of a research project on Asian corporate governanceinitiated by the Asian Development Bank Institute (ADB Institute) in Tokyo, we haveattempted to address these questions. We conducted a comprehensive survey of all thelisted companies in Thailand in March to August 2000, in collaboration with the Facultyof Economics of Chulalongkorn University. We collected a large number of companydocuments in Thai and English compiled by both SET and the Commercial RegistrationDepartment of the Thai Ministry of Commerce. We then constructed a database on 448listed companies, including detailed information on the ir types of business, ownershippatterns, management structures and four-year business performance (1996-1999). Wealso put together profiles of their Board of Directors, and Executive Committee and AuditCommittee members (6,028 persons in total). Analysis of the top management will bepresented in a future companion ADB Institute working paper, entitled “Who ManagesThai Firms: Management Structure and Top Executives in Thailand.”
2. The World Bank’s Views on the Asian Crisis and Corporate Governance
Immediately after the currency crisis hit Asia, the World Bank set about studying thenature of the crisis and formulated a set of economic and social restructuring plans incollaboration with IMF. The World Bank identified structural weaknesses or institutionalvulnerability in the governance of both the financial sector and the corporate sector asamong the main causes of the Asian crisis. It emphasized this aspect in a 1998 report:
“Rapid structural changes in the real economy were requiring improvements inthe corporate governance of firms for which securities markets are important.This lack of well-developed capital markets meant that the monitoring ofcorporations was primarily the responsibility of banks and was not complementedby other financial institutions…Weak governance of banks, often influenceddirectly by government policies, added to the poor performance. Perhaps the mostimportant weakness was the limited institutional development of banks” (WorldBank, 1998a; pp. 34-35).
“The main lesson from the East Asian crisis is that it is important to take anintegrated approach to the issues of corporate governance and financing. The poorsystem of corporate governance has contributed to the present financial crisis byshielding the banks, financial companies, and corporations from market discipline.Rather than ensuring internal oversight and allowing external monitoring,corporate governance has been characterized by ineffective boards of directors,weak internal control, unreliable financial reporting, lack of adequate disclosure,lax enforcement to ensure compliance, and poor audits. These problems areevidenced by unreported losses and understated liabilities” (Ibid., p. 57).
4
On the basis of such diagnoses, the World Bank proposed that Asia’s governmentsshould promote financial institutional reforms, including development of their equity andbond markets and improvement of corporate governance at the individual firm level, inline with global standards.
At the same time, towards the end of 1997, the World Bank conducted field surveyson 3,710 manufacturing firms in the five crisis-affected Asian countries: Indonesia (816firms), Republic of Korea (857 firms), Malaysia (814 firms), Philippines (564 firms) andThailand (659 firms). From these surveys, the researchers found that “a large number ofshareholders did not mean a large number of effective owners. The mean combinedownership of the top 10 shareholders in companies with 10 or more shareholdersaveraged 84%, quite enough to override minority voices” (“The Ultimate BusinessSurvey,” Asiaweek, 16 April 1998). In addition to this company survey, a group of WorldBank economists also initiated a more intensive study of ownership patterns andcorporate governance in listed companies of nine Asian countries. The findings of thisstudy have since been published in joint papers by Stijn Claessens, Simeon Djankov,Larry Lang (CDL), Joseph Fan and others (see References).
In their research, the CDL group focused on the correlation between ownershippatterns and corporate governance. They sought to explore the corporate structure oflisted Asian firms, as characterized by family ownership, by first identifying theirultimate owners (controlling shareholders). According to CDL group findings, Asiancountries, in general, and the crisis-affected countries such as Indonesia, Republic ofKorea and Thailand, in particular, were highly leveraged (debt to equity [D/E] ratio) dueto heavy dependence on external borrowings (see Table 1). They also contend that theweak monitoring role of the financial sector in each country produced financial instabilityboth at the national economy level and at the individual firm level. Further, such financialinstability has been accelerated by the dominance of family-owned firms over businessactivities in Asian countries (see Table 2), which further hindered the development ofsound market discipline.
The dominance of family-owned firms is interpreted by the CDL group as theconcentration of ownership in the hands of ultimate owners, mostly owner-families. Thisphenomenon is common not only in Asian countries but also in other developingcountries and produces obstacles to sound corporate governance, as follows:
“First, ownership concentration may impede the development of professionalmanagers that are required as economies and firms mature and become morecomplex. Second, it may have led to increased risk taking behavior by firms, inparticular given the inter-relationships between financial institutions and banks,and the supervisory weakness and perverse incentives prevalent in the Thaifinancial system during the 1990s. In addition, in order not to lose control, largeshareholders may have diluted market pressures for improved disclosure andprotection for minority shareholders and are reportedly an impediment today tocorporate workouts” (Pedro, Claessens and Djankov, 1998; p. 13).
Concentrated ownership, according to the CDL group, has two major impacts oncorporate governance. First, it solves the classic agency problem between managers andowners, since large shareholders are able to effectively monitor firm management and
5
thus limit management ineffectiveness and abuse. Second, concentrated ownership tendsto be detrimental to the interests of minority shareholders, by making them vulnerable toexpropriation by controlling shareholders, especially in the presence of a wide gapbetween voting rights (control rights) and cash flow rights. This will make it difficult forlocal Asian firms to attract necessary money from the outside (Pedro, Claessens andDjankov, 1998; Claessens, Djankov and Lang, 1999). The World Bank supported thisargument, as follows:
“Ownership concentration has benefits and costs. On the benefits side, it has beenassociated with firms enhancing their efficiency of operations and investment. Onthe costs side, it may lead controlling owners to expropriate other investors andstakeholders and pursue personal nonprofit maximizing objectives, and it mayimpede the development of professional managers, who are required aseconomies and firms mature and become more complex. Empirical evidenceshows an inverted “U”-shaped relationship between the degree of ownershipconcentration and profitability” (World Bank, 1998a; p. 60).
Expropriation of minority shareholders is reflected in lower market valuation oflocal firms. Indeed, on the basis of their empirical tests for listed companies in nine Asiancountries, the CDL group concluded that “family control is an important factor behind thenegative relation between control rights and market valuation” (Claessens, Djankov, Fanand Lang, 1999a; p. 22).
In our view, the problem with the World Bank group’s analyses is that they definegood corporate governance mainly in terms of the Anglo-American model, whichstresses the importance of capital markets, and the monitoring roles of independentdirectors and minority shareholders. These ideas directly influenced the institutionalreforms initiated by Asian governments after the crisis. In line with these views, whenexamining good or poor performance of local Asian firms, CDL group often tested thecorrelation between ownership pattern and market valuation (investor’s reputation) in thestock markets. In addition, while analyzing the performance of local firms in terms offinancial indicators, such as return on assets (ROA), they compared only average figuresof listed companies among the nine Asian countries rather than comparing firmperformance indicators by the difference in ownership pattern in a specific country(Claessens, Djankov and Lang, 1999).
Therefore, in this study we aim to examine economic performance of Thai listedcompanies based on data taken from their financial statements. We will focus on theirownership patterns and investigate the correlation between the firms’ economicperformance and their ultimate owners (family business), foreign ownership, thepresence of minority shareholders and ownership/management separation amongfamily-owned firms.
6
3. Development of the Stock Market and Listed Companies in Thailand
3.1. The Impor tance of Lis ted Companies
Corporations that are registered in Thailand are divided into two types: companies listedon the stock exchange regulated by the Public Limited Company Act (revised in 1992)and nonlisted companies regulated by the Company Act of the Civil Code (1927). What issignificant is the fact that only listed companies were targeted by the Thai Governmentwhen it undertook corporate restructuring in line with IMF and World Bank proposals.Accordingly, it is necessary for us to examine the development of the stock market andthe importance of listed companies by measuring (1) their weight among leading Thaifirms, including foreign-owned firms ; and (2) their weight among subsidiaries belongingto leading Thai business groups, including those controlled by owner- families.
Tables 3A and 3B, and Diagrams 2A to 2D summarize the distribution of the top5,000 firms in Thailand in terms of their annual turnover in 1997 by type of firm,comprising public limited companies (PLCs), private limited companies, limitedpartnerships, registered ordinary partnerships and branches. Figures in these tables showthat 475 out of the 5,000 firms (about 9.5%) belonged to the category of PLCs or “listedcompanies” and that the combined annual turnover of these 475 PLCs accounted for asmuch as 32% of the total annual turnover of the 5,000 firms in 1997. Clearly, thisdemonstrates the relative importance of listed companies compared to other types offirms.
What should not be overlooked here is the fact that the weight of PLCs amongforeign firms in Thailand is less important compared to that of the top 5,000 firms as awhole. In 1997, there were a total of 1,056 foreign firms in Thailand. Of that total, 68(6.4%) belonged to the category of PLCs. But their combined annual turnover was only15% of the total of the 1,056 foreign firms. This is largely due to the fact that manyleading foreign firms have been reluctant to list their subsidiaries on the local stockmarket. These firms include leading Japanese manufacturing firms (Toyota Motors,Mitsubishi Motors, Matsushita Industrial Electrical, Hitachi, Toshiba, Sony, Fujitsu,etc.); Japanese general trading companies (Mitsui, Mitsubishi, Marubeni, C. Itoh, etc.);and Western manufacturing firms (Philips, Unilever, Bayer, etc.). This fact should bekept in mind when we evaluate economic performance of listed companies with respect todifferences in ownership pattern (see Section 5).
Table 4 shows the importance of listed companies among affiliated companies thatbelong to specific owner-family-controlled business groups (zaibatsu-type groups) orother types of Thai business groups owned by State enterprises and the Crown PropertyBureau (the King, Siam Cement Group and Siam Commercial Bank Group). Looking atthe table, we find that 113 out of 398 firms belonging to the top 40 business groups canbe identified as listed companies, with their combined turnover accounting for 60% oftotal turnover in 1997. These tables suggest that it is impossible to adequately discusscorporate activity and corporate governance in Thailand without giving seriousconsideration to listed companies.
7
3.2. Development of the Thai Stock Market
Listed companies have increased in importance as the stock market has developed sincethe end of the 1980s when Thailand enjoyed an unprecedented economic boom. From1975, when the Securities Exchange of Thailand (renamed the Stock Exchange ofThailand or SET in 1992) was established, up till 1985, the stock market did not show anynotable growth either in terms of the number of listed companies or the size of annualtransaction of stocks. However, starting from the late 1980s, the Thai private stockmarket began to experience rapid growth as leading Thai business groups increasinglylooked to it for fundraising and SET introduced a new act to promote the listing ofcompanies (see Table 5 and Diagram 3).
Indeed, the number of listed companies almost doubled from 109 in 1987 to 214 in1990, and increased further to 347 in 1993, with annual transactions jumping from B122billion to B627 billion, and further to B2,201 billion during the same period. In line withthis, the SET Index also increased from 285 in 1987 to 613 in 1990, reaching 1,683 in1993 (Table 5). Market capitalization of the stock market amounted to B3,325 billion in1993, which exceeded nominal gross domestic product (GDP) (B3,170 billion) in thesame year. After 1993, when Thailand entered its “bubble economy” stage in the stockand property markets, annual transactions and the SET Index began to show a slightdownward trend.
After July 1997, when the currency crisis rocked the Thai economy, the stockmarket collapsed. Annual transactions quickly dropped from B1,300 billion to B930billion in 1997, while the SET Index suffered a rapid decline from 832 in 1996 to 373 in1997, and further to 356 in 1998, a level that was only one fifth its highest recorded levelof 1,754 in January 1994. The total value of market capitalization also quickly droppedfrom B3,565 billion in 1995 to B1,133 billion in 1997.
Facing this difficulty, the Government as well as SET launched stock marketreforms, which were mainly designed to introduce stricter regulations for listedcompanies, in the name of good corporate governance (see Table 9 in Suehiro, 2001; pp.69-70). The new SET regulations announced in January 1998 included the appointmentof at least two independent directors and introduction of guidelines on best practices fordirectors; establishment of three new committees—an Audit Committee, RemunerationCommittee and Nominating Committee for directors; introduction of new audit andaccounting systems in line with global standards; and promotion of informationdisclosure on management and investment plans of local listed companies (submission ofForm 56/1 Report to SET).
These policies exactly corresponded to the World Bank’s proposals aimed atimproving corporate governance. SET described this new system as a “Disclosure-basedScreening System,” which was mainly designed to filter “good” companies through newstock market guidelines (see Diagram 1 in Suehiro, 2001; p. 72). Accordingly, since 1998,all listed companies have been required to follow the new guidelines; failure to do sowould result in delisting from the stock market.
An important question is whether these new SET guidelines actually brought aboutnotable changes in the ownership pattern, corporate organization and economicperformance of listed companies after 1998. I have already reviewed the impact of SETpolicy on the activities of leading family businesses and the movement of the stock
8
market in another paper (see Suehiro, 2001). I will, therefore, focus here on anotheraspect of listed companies’ responses: that is, how they changed their ownership patternbetween 1996 and 2000.
4. Who Controls Thai Firms: 1996 and 2000?
4.1 . Class i f icat ion of Thai Lis ted Companies by the World Bank and Suehiro
Section 2 has outlined how a group of World Bank economists (the CDL group) stressedthe dominance of family-run businesses among Asian corporations before the crisis(World Bank, 1998a; pp.60-61; Claessens, Djankov and Lang, 1999). Accordingly, I alsoattempted to clarify the weight of family-run businesses among listed companies inThailand by using the same methodology adopted by the World Bank researchers in theircompany survey. Tables 6A, 6B, 6C and 6D illustrate the classification of listedcompanies by type of controlling shareholder or ultimate owner, and provide acomparison of the percentage distribution of listed companies by ownership pattern,using 20% and 40% cutoff levels. The World Bank group classifies a listed company(including financial and nonfinancial firms) into five categories. The ir methodology is asfollows:
“We [Claessens et al.] divide corporations into widely-held and corporations withultimate owners, with ultimate ownership defined at four cut-off levels: 10%,20%, 30%, 40%. A widely-held corporation is a corporation which does not haveany owners who have significant control rights. Ultimate owners are furtherdivided into four categories: 1) families (which includes individuals who havelarge stakes), 2) the state, 3) widely-held financial institutions such as banks andinsurance companies, and 4) widely-held corporations” (Claessens, Djankov andLang, 1999; p. 8).
The World Bank group principally adopted the methodology of the La Porta group(La Porta et al., 1999) who conducted a comprehensive survey on the ownership patternof leading firms worldwide. But they did not disclose the details of their methodology inidentifying a corporation according to the above-mentioned classification. Nevertheless, Iinvestigated the top three shareholders of each listed company on the basis of 1996 baseyear data (SET [ed.], Thailand Listed Company 1997 (original one), Bangkok, 1997) and2000 base year data (SET CD-ROM of Listed Company Info 2000 [Q1-Q2] [Thai version;no English version for shareholders list is available]). Identification of ultimate owners ofeach company is based on my own firm-level research conducted in Thailand coveringaround 2,000 firms (see Suehiro, 2000c).
It is not surprising that there are some differences in identification of ultimateowners between the World Bank’s survey in 1998 and my survey in 2000. For instance, Iidentified a Company A (shareholder) as a specific fully family-owned corporation on thebasis of my own information, while the World Bank study seems to define this companyas an independent one (cf., IDE Co., Ltd. is one of the investment companies for the SPIGroup controlled by the Chokwattana family, etc.). Likewise, I identify a Company B as a
9
specific owner-family–controlled corporation, while the World Bank group defines it asan independent company with no controlling shareholder.
In addition to these possible differences in identification, I classify a corporation asa widely-held financial institution when this company has at least two financialinstitutions (commercial banks, finance companies, insurance companies or mutualfunds) among the top three shareholders, with each shareholder owning less than 20% ofthe total shareholdings. Further, I define a firm as foreign-owned, distinct from any othertype of corporation, when foreign investors or foreign firms own 30% or more of its totalshareholdings.
Table 6C reveals the common characteristics of dominance by family-runbusinesses in two surveys using 1996 as base year. The results presented in the tablesuggest that the share of family businesses, including semifamily businesses or quasi-family businesses, accounts for 48.2% of the total number of firms, significantly less than61.6% found in the World Bank survey. Further, widely-held corporations (no controllingshareholder) show the widest divergence between the percentage distribution of theWorld Bank survey (6.6%) and the author’s survey (20.8%). It may be noted thatYupana’s survey (2000a), on the basis of 1996 company data, supports the author’sfindings rather than the World Bank’s (Table 6D).
4.2 . Changes in Ownership Pat tern be tween 1996 and 2000
Table 7 presents more detailed information on the percentage distribution of listedcompanies in Thailand in 1996 base year on the basis of our own research, while Table 8provides the same information for base year 2000. In these two tables, we dividefamily-owned: FW corporations into two major groups (family-owned: FA andsemifamily-owned) and further into six categories (f1, f2, f4 and f5, fw1 and fw2; f3, anowner- family financial firm, was integrated into f4 during data construction) (see Table6A). Unlike the World Bank’s survey, we also distinguish foreign-owned corporationsfrom widely-held corporations (WC) in order to explore the significant role that foreigninvestment is playing among Thai listed companies. The same methodology was alsoadopted by Yupana’s survey when she investigated economic performance of Thai listedcompanies (Yupana, 2000a; 2000b). In terms of the total picture (for financial andnonfinancial firms), family-owned businesses account for 33.5% at the 20% cutoff level,and the percentage increases to 48.2% if semifamily-owned type firms are included. If thesurvey is confined only to nonfinanc ial companies (357 out of 448 firms), these figuresincrease to 40.1% and 57.1% at the 20% cutoff level, respectively.
One question that needs to be raised here is how the economic crisis affected theownership pattern of listed companies. To answer this question, we constructed asummary table, which shows the changes in the ownership pattern of firms by the type of“ultimate owners” between 1996 and 2000. According to the summary Table 9, surveyedfirms, whose shareholders’ lists are available, numbered 424 between 1996 and 2000. Outof these 424, 110 firms or 26% were forced to change their ownership pattern during thecrisis period. This is an interesting finding since it can throw some light on the limitationsof the corporate structures that existed before the crisis.
Analyzing the ownership pattern changes of these 110 firms, we discover that asmany as 40 family-owned corporations changed their ownership structure into other types,
10
such as various widely-held groups, Thai corporations, foreign-owned, etc. On the otherhand, 41 firms shifted their ownership from nonforeign-owned to foreign-owned. Thismovement has been spurred by the pressure of corporate debt restructuring schemesduring the crisis, when local controlling shareholders were compelled to allocate newly-issued equity shares to existing foreign partners or to invite new foreign investors (cf.,from the Bank of Ayudhya Group = the Rattanarak family to Swiss Holder bankCompany in the Siam City Cement PLC, etc.), or they were forced to transfer their equityshares to existing foreign partners (cf., from the Central Department Store Group = theChirathiwat family to French Casino Group in the Big C Supercenter PLC; from the CPGroup = the Chiarawanon family to Dutch Makro Group in the Siam Makro PLC; thecases of leading finance companies formerly owned by local commercial banks, etc.).
5. Ownership Pattern and Corporate Economic Performance
5.1. Data Sources and Financial Indicators Measuring Corporate Performance
In this section, we will highlight the interrelationships between the ownership pattern ofThai listed companies and their corporate performance. To measure corporateperformance, we chose four financial indicators: (1) liquidity or current ratio (currentassets/current liabilities—desirable figure is about 2.0); (2) leverage or D/E ratio(desirable figure is about 1.0); (3) profitability or ROA; and (4) profitability or return onequity (ROE). We collected necessary data for each company from financial statementsand balance sheets that are included in the SET (ed.), CD-ROM Listed Company Info1999 (Q1/Q2) and CD-ROM Listed Company Info 2000 (Q1/Q2), and constructed four-year time series data (1996 to 1999).
Only a few listed companies failed to submit their balance sheets to SET after thecrisis. But even if listed companies submitted their balance sheets, there still was anotherproblem of lack of financial data for a specific year or for a specific item (especially theD/E ratio and ROE). In order to overcome these data problems, we used the figures ofcompanies whose data were available for at least three years between 1996 and 1999,together with those of companies whose data were available for all four years.
5.2. Ultimate O w n e r s, Family Business es and Economic Per formance
Table 10 and Diagrams 4A, 4B and 4C illustrate economic performance of listedcompanies by the type of ultimate owners on the basis of 1996 base year (for theclassification of ultimate owners, see Table 6A). Interestingly, the table tells us thatfamily-type business (FA and FW) do not always demonstrate poor performance incomparison with other types of ultimate owners. It is evident that a group of foreign-owned firms (XB and XC) has achieved the best performance (actual figures and speed ofrecovery from the crisis) in every indicator between 1996 and 1999, while corporationswith no ultimate owners (WV) and State-owned firms (S) have constantly performed theworst. Two groups of corporations held by financial institutions (WB) and corporationsheld by Thai corporations (WC) showed the second best performance behind the group offoreign-owned firms.
11
These findings do not suggest that family-run businesses belong to the group ofcorporations with poor economic performance. This is because family-run businessessometimes show better performance in terms of current ratio, ROA and ROE, as was thecase in 1997 and 1998. From the results in the table, we can tentatively conclude thatforeign-owned firms among listed companies have achieved better performance andquicker recovery from the crisis compared to all other types of corporations. Yupana’ssurvey also supports this finding.
5.3. R E H A B C Os and Type of Business
This hypothesis may be confirmed if we examine economic performance of the group ofREHABCO firms. A REHABCO is a rehabilitation corporation that is undergoing debtrestructuring and has been ordered by SET to stop its transactions on the stock market.Therefore, we can consider REHABCO firms as corporations that might have made poormanagement decisions before the crisis. If so, we need to examine whether REHABCOfirms are mainly owned and operated by owner-family members.
Table 11 rejects this hypothesis, because there is little correlation between the typeof ultimate owners of REHABCO firms and their economic performance. Estimating theshare of family-owned firms among REHABCO firms, we find that about 53.2% of thetotal belong to the former, which is only a little higher than for nonfinancial listedcompanies as a whole (48.7%). It is apparent that differences in the type of businessesrather than in ultimate owners have had a much greater effect on the performance of listedcompanies after the crisis. Indeed, the industrial base of REHABCO firms wasconcentrated in two fields—the building materials industry (nine out of 47 firms, or 19%)and property (13 firms, 28%)—that were most seriously hit by the crisis through theiraccumulated dollar-based external borrowings and the recession in the domesticeconomy.
5.4. Foreign Shareholdings and Economic Performance
Table 10 shows that foreign-owned firms have achieved good performance before andafter the crisis. Table 12 illustrates the comparison between firms by the difference in thepercentage of foreign shareholdings in 1996 base year (0-9%, 10-29%, 30-49%, and 50%and above). At a glance, we can see that firms with foreign shareholdings of 30-49% putin the best performance, followed by firms with foreign shareholdings of 50% and above.In contrast to these two groups, firms with foreign shareholdings of 0-9% performedworst in every financial indicator.
This finding may be explained by two major factors. First, it may be supposed thatforeign involvement as a controlling shareholder contributed to better corporatemanagement during the crisis. In addition, it is also highly likely that the parentcompanies of foreign firms have helped in the recovery from the crisis by providing freshmoney and accelerating debt-restructuring. Second, foreign-controlled firms are inclinedto enter into more profitable sectors and industries.
12
5.5. C h a n g es in Ownership Pat tern and the Effect on Economic Performance
An interesting question that needs to be addressed here is whether a shift in ultimateownership from a family-owned firm to another ownership structure has contributed tonotable improvement in economic performance. As shown by Table 9, one fourth oflisted companies in Thailand changed their ownership pattern during 1996 to 2000. If afirm that changed its ultimate owner from owner-family member to another type ofshareholder improved its performance during this period, we can suppose that familybusinesses themselves affected corporate performance, if we neglect the possible impactof other explanatory variables such as the type of business, the size of firm and age offirm.
Table 13 and Diagram 6 are intended to address this issue. The table dividesfamily-owned firms into three major groups: Type A—a firm that did not change itsownership pattern; Type B—a firm that changed its ultimate owner from owner-family toanother type of shareholder (Thai corporation, corporation with no controllingshareholder, etc.); and Type C—a firm that changed its ultimate owner to a foreigner. AsTables 10 and 12 suggest, Type C (or a firm in which a foreigner becomes an ultimateowner by 2000) showed a distinct recovery in its performance. On the other hand, andcontrary to traditional arguments, Type B did not achieve better performance compared toType A.
Looking at our own research on listed companies, it is safe to say that the differencein ownership pattern as well as the presence of a family-run business have hardly affectedcorporate performance in terms of financial indicators, such as the D/E ratio, ROA andROE. It is difficult to see any distinct interrelationship between family ownership ofbusiness and poor performance in terms of leverage and profitability. Further, contrary tothe traditional argument in favor of the model of good corporate governance, the group ofcorporations with no ultimate owners (WV) has always shown the worst business recordamong surveyed listed companies in Thailand.
These findings, in turn, cast doubt on the second hypothesis that the presence ofminority shareholders contributes to improvement of corporate governance of local firms.The World Bank studies and other traditional arguments have stressed this point bymainly focusing on the relationship between minority shareholdings of local firms andtheir market valuation. But they seem to have paid little attention to the relationshipbetween minority shareholdings and economic performance as indicated by ROA andROE. This question is examined in the next section.
6. Minority Shareholders and Corporate Economic Performance
In Thailand, SET defines a minority (“minor” in SET) shareholder in the Public LimitedCompany Act 1992 as one that has less than 0.5% of the total shareholdings. After theeconomic crisis, SET ordered all listed companies to disclose and report the exact numberof minority shareholders and their combined percentages against total shareholdings.Thanks to this new SET guideline, we can avail of the information on the weight ofminority shareholdings of each listed company since 2000.
Table 14 divides all of the surveyed firms into seven categories in accordance withboth the percentage of combined minority shareholdings and the involvement of foreign
13
shareholders: (Type D1) a firm with minority shareholdings of 50% and over; (D2) a firmwith minority shareholdings of 30-49%; (D2f) a firm with minority shareholdings of 30-49% and foreign shareholdings of 20% and over; (D3) a firm with minority shareholdingsof 20-29%; (D3f) a firm with minority shareholdings of 20-29% and foreignshareholdings of 20% and over; (D4) a firm with minority shareholdings of 10-19%; and(D5) a firm with minority shareholdings of 1-9%.
Paradoxically, the table and Diagram 7 demonstrate that the group of firms withminority shareholdings of less than 30% achieved better performance in three financialindicators than a group of firms with minority shareholdings of 30% and over. Also, thegroup of firms with minority shareholdings of 50% and over have a poor business record.In order to explain these results, we can put forward two arguments.
The first is that minority shareholders can be considered a key element of goodcorporate governance since they serve as monitors and supervisors for a listed company.In this case, the major cause of poor performance could be the lack of a legal frameworkor inadequate government policies to enhance their rights and promote their role in thegeneral meeting of shareholders. The second argument seeks to identify the real roleplayed by minority shareholders in local firms and family-owned firms, in particular,rather than deficient government policy. In Thailand and also many other Asian countries,minority shareholders are frequently invited from among the friends of owner-familymembers and provide controlling shareholders with a portion of the capital needed.Therefore, they have no intention of strictly supervising corporate activity. And there isno motivation for them to exert their rights against the interests of controllingshareholders.
Assuming the latter argument, it would be difficult to imagine that local smallshareholders would serve as monitors and supervisors of listed companies even after theGovernment introduces new policies enhancing their rights. As with independentdirectors (SET published a “Guide Book for the Best Practices of Directors” in Thai andEnglish in 1998), the Government is required to promote best practices for minorityshareholders in the name of good corporate governance. At the same time, the combinedpercentages of minority shareholdings still account for merely 21.8% of the 314 surveyedfirms in 2000 (26.6% in 43 finance companies and 18.7% in 271 nonfinance companies).In this sense, the role of minority shareholders should be considered to be limited underthe given conditions of high ownership concentration.
Another possible approach is to invite a foreign investor as a minority shareholder.Indeed, SET decided to give tax incentives to foreign minority shareholders with novoting rights in August 2000 (interview with Dr. Prasarn Trairatworakun, Secretary-General of the Securities and Exchange Commission on 8 August 2000). By increasingthe number of foreign minority investors, SET aimed to invigorate the stock market andimprove corporate governance of local firms. Looking at Table 14 and Diagram 7, thegroup of firms with foreign direct involvement shows better performance than others. Butthe presence of minority shareholders alone is not enough to improve corporateperformance.

14
7. Separation of Ownership and Control among Family Businesses
7.1. Separat ion of Management f rom Ownership
The third hypothesis that the World Bank and other scholars suggest is that familybusinesses tend to have poor management when ultimate owners control both ownershipand management. Lack of separation between ownership and control means that there areneither independent directors nor minority shareholders to effectively monitor orsupervise management. This lack of separation also means there will be an overlapping ofthe Board of Directors with Executive Committee members, while top management maybe recruited from among owner-family members (including unqualified persons) ratherthan from professional groups. These elements combined together hinder thetransparency of management for outside investors and inevitably lead to expropriation ofminority interests. Therefore, appointing independent directors, establishing auditcommittees and enhanc ing shareholders’ rights were key elements of corporategovernance reforms initiated by the World Bank (see Table 15 for a summary).
This hypothesis implicitly presupposes that a family-owned firm with separationwill demonstrate better performance than a family-owned firm with no separation. Toexplore this further, we constructed Tables 16A and 16B to compare theownership/management separation of family-owned firms (FA and FW) and theireconomic performance.
In these two tables, we define a firm in which (1) a chairperson or vice-chairpersonis independent from controlling shareholders (owner-family), and (2) a chief executiveofficer (CEO) or president is independent from the family-owners as Type A. If achairperson/vice-chairperson or CEO/president overlaps with controlling shareholders,we define it as a family-owned firm with no separation or Type B. Semifamily-owned orType C firms in the tables are those that have no controlling shareholder at the 20% cutofflevel, but combined percentages of the two or three largest shareholders exceed 20%. Ifwe cannot obtain necessary information on the Board members and executives, we defineit as a family-owned firm with no available data or Type D. These two tables, andDiagrams 8A, 8B and 8C suggest some interesting conclusions.
First, roughly speaking, Type A or family-owned firms with separation haveperformed better than family-owned firms with no separation. But it is difficult to see adistinct difference in major financial indicators of the D/E ratio, ROA and ROE betweenType A and Type B. On the basis of economic performance, not market valuation, it issafe to say that ownership/management separation does not always contribute toimproved corporate activity.
Second, Type C or quasi- family-owned firms with no separation demonstrate thebest performance among the four groups. This suggests that diversification ofshareholdings by the owner-family into their related companies positively affectscorporate performance.
Last and most important, Type D or family-owned firms with no available datahave the worst business record in all financial indicators. Further, there is a wide gap inperformance when we compare Type D to the three other types. Type D firms are likely tobe those that have been reluctant to disclose detailed information on their management
15
and directorships, although they faithfully submit SET Form 56/1 reports in accordancewith the new guidelines.
7.2. Separation of the Execut ive Commit tee from the Board of Directors
Tables 17A, 17B and 17C illustrate another aspect of management structure of family-owned firms by focusing on the personal overlap of the Board members with theExecutive Committee members, or the independence of the Board of Directors from themanagement team. These tables divide family-owned firms into three categories: a firmin which a chairperson of the Board is independent from the Executive Committeemembers (Type A); a firm in which a chairperson is also an Executive Committeemember (Type B); and a firm with no available data (Type C).
Our research on family-owned firms by type of management separation also revealsthat these three different groups of firms show a similar pattern of economic performanceto the four groups of ownership/management separation. It is difficult to find a distinctdifference between Type A and Type B. As was shown in Table 16, Type C or family-owned firms with no available data again put in the worst performance. However, inagribusiness, Type B (no separation type) achieved better performance than Type A(separation type) in all three major financial indicators—the D/E ratio, ROA andROE—between 1996 and 1999.
Based on these results, the independence of chairpersons from controllingshareholders and executive members still is not significant enough to affect economicperformance of family-owned firms. Indeed, among Thai listed firms, the post ofchairperson is frequently considered an honorary role, meant to contribute to thecompany’s reputation rather than an important position to effectively supervisecontrolling shareholders and management teams. Because of this, it is common that aspecific person of high social status serves as chairperson for more than 10 corporations,as can be seen in the case of Sunthon Hongdaladarom (former Finance Minister) andPhao Sarasin (member of a distinguished Thai family and owner of the largest soft drinkmanufacturing firm, PepsiCo).
7.3. Type of Business and Ownership Pat tern
Last, we should examine the relation between the type of business and ownership patternof listed companies. As we suggested in previous sections, the difference in economicperformance is possibly connected with the type of business: whether it is from a crisis-hit industry, a profitable sector following the baht’s devaluation or a growing industry inthe eyes of foreign investors.
Table 18 compares profitability (ROA) of Thai listed firms by sector and industrywith special reference to the type of ultimate owners (family-owned or foreign-owned).Contrary to expectations, it is impossible to discover any evidence that foreign-ownedfirms concentrate their business activities in more profitable sectors or industriescompared to family-owned firms. This topic should be rigorously tested by usingregression analysis on the basis of company-based data.
16
8. Restructuring Family Businesses
8.1. Why Family Businesses Survive
If our research results in sections 5 to 7 are acceptable, it immediately raises a newquestion: why did family businesses in Thailand develop before the crisis, and how didthey survive the crisis? As I have already discussed in other papers (Suehiro, 1993; 1998),business groups built on the basis of family ownership have been a crucial agent both foreconomic growth and the upgrading of Thailand’s industrial structure. After theGovernment accelerated liberalization of the financial sector and industrial investmenttowards the end of the 1980s, these business groups speedily responded to new policiesand actively expanded their business bases from agro-industry and traditional export-oriented industries, such as textiles and garments, to new growing industries such astelecommunications, petrochemicals, steel and machinery, and modern retail business(Suehiro and Higashi [eds.], 2000). It is true that they also invested a huge amount intoproperty and this, in turn, led to the “bubble economy” in Thailand. But they also servedas important agents for a rapid upgrading of Thailand’s industrial structure during the1990s.
In the wake of the currency crisis in Thailand, around half of the 40 leading groupsare now facing a critical situation. It is reported that one third of them have alreadyapplied to the bankruptcy court or asked the Government for help under the new BusinessRehabilitation Act, in order to resolve their default problems (Suehiro and Higashi [eds.],2001; pp. 81-85). Nevertheless, there are still leading business groups that haveundertaken extensive corporate restructuring. They promoted the downsizing of theirexpanded business bases, concentrated their managerial resources in two or three corebusinesses, and have started tough negotiations with foreign creditors.
Owing to these individual reforms, they seem to be recovering from the crisis. Inother words, we see a trend towards bipolarization between bankrupt firms and survivors.We can see a similar trend among leading business groups in Mexico under the externalpressure of economic globalization and liberalization (Hoshino, 2001). Looking ateconomic performance in Table 10, it would be difficult to say that family-owned listedcompanies failed to rapidly recover their business performance after the crisis. If so, howcan we explain this?
8.2. Human Resources among Fami ly Bus inesses
There are four major elements to explain the quick growth of local business groupson the basis of family ownership during the past few decades:
(1) high potentiality of human resources among family businesses;
(2) continuous management reforms in terms of ownership structure, and organizationaland management style ;
(3) speedy and flexible responses to changing government policies that give incentives topromoted industries or undertake liberalization in the financial sector and industrialinvestment ; and
17
(4) strategic alliances with foreign capital by means of joint-ventures, which enable localfirms to advance into growing industries such as telecommunications, petrochemicaland modern retail business.
Table 19 compares the age distribution of top executives (chairpersons, vice-chairpersons and Board directors, and members of the audit committee, CEOs andpresidents of listed companies) and their educational attainment in both Japan andThailand. Table 20 lists countries where Thailand’s top executives obtained their highesteducational degrees. Such qualifications do not exactly reflect the quality of topexecutives among family-run business, but we can see overall human resourcescharacteristics.
First, top executives in Thailand are by far younger than those in Japan. In Thailand,those aged 50 years old and below account for about 57% of the total number (2% inJapan), while the group aged 61 years old and above form merely 16% (65% in Japan).There is no doubt that long tenures and accumulated experience help in developingmanagerial skills in Japan (see Inagami [ed.], 2000). Nevertheless, a younger generationwill be able to obtain new information on markets, adopt new technology in productionand adjust themselves more speedily to a changing international environment.
Second, these two tables show that top executives in Thailand have attained ahigher educational level than those in Japan. The group with bachelors degrees accountsfor 40%. More interestingly, there is a group with masters degrees/MBAs and doctoraldegrees accounting for 48%, by far larger than the 3% in Japan. In addition to this highereducational attainment, 54% of the total surveyed executives (3,890 persons) in Thailandwere also educated abroad, and 35% were educated in the United States. In Japan, it isreported that few (less than 2%) obtained their degree abroad. This fact suggests that topexecutives in Thailand have the potential to adapt to US management styles andaccounting systems, as well as communicate well with foreign investors and clients inEnglish.
It is, thus, not surprising that listed companies in Thailand and even family-runbusinesses show great potential in terms of human resources. In fact, owner-families ofleading business groups in Thailand, since World War II, have tended to send theirchildren to the United States, Australia and Japan for higher education and qualifications(MBAs, etc.). After returning to Thailand, they have often temporarily worked at foreignor local big firms as apprentices, and then moved to family-run firms as top executives ormiddle management. As a result, new generations have frequently become key persons inthe modernization and improvement of the corporate activities of family-owned firms(see Suehiro, 1993). In the initial stage of industrialization of developing countries suchas Thailand, a family-owned firm can easily find able persons among its own familymembers and it does not need to recruit from outside.
8.3. Continuous Reforms and All iance s wi th Foreign Partners
High human resources potential among family members alone does not fully explain therapid growth of local business groups. Therefore, we must seek other factors that haveenabled business groups to constantly expand and extend their business activities. Theseinclude continuous management reforms, speedy responses to government policies andalliances with foreign corporations. Among these, management reform is the mostimportant factor.
18
Contrary to traditional arguments concerning family-run business, leading Thaibusiness groups have always undertaken innovative reforms in the fields of raisinginvestment funds, reforming management structure and developing human resources.Table 21 takes the Charoen Pokphand (CP) Group owned by the Chiarawanon family asan example. The table shows that the CP Group has continuously undertaken variousattempts to improve its business activities. Such moves have included shifting itsbusiness base from trading to manufacturing; diversifying into growing industries (thelate 1980s); introducing new management styles such as the American divisionaldepartment system (1985); establishing a holding company-cum-headquarters tocentralize its decision-making process (1990); listing affiliated companies on the stockmarket to attract fresh money (since 1987); employing professionals in finance,technology and investment planning (1957-1963 and 1979-1981); and developingintensive human resources development programs (CP, Personal Information System,since 1995).
Thanks to these reforms, the CP Group has enjoyed rapid growth over the past threedecades, becoming the third largest business group in Thailand, following the SiamCement Group and the Bangkok Bank Group (see Suehiro, 1998; do., 2000d, Chapter 9).These two leading groups have developed in a similar way to the CP Group, introducinginnovative reforms into their management (see Suehiro and Nambara, 1991).
What distinguishes Thai business groups from the zaibatsu-type groups of prewarJapan is their strategic alliances with foreign corporations. When advancing into newbusinesses or industries, local business groups with no information, productiontechnology or marketing know-how have frequently utilized foreign partners’ managerialresources through the joint-venture system. In this way, they could maximize theeconomic backwardness advantage of latecomers and could accelerate their businessexpansion. Unless we take these aspects into consideration, we cannot adequatelyevaluate the real picture of local business groups.
8.4. Tradi t ional Family Businesses: Authoritarian Type
Not all local business groups have undertaken continuous reforms in response to the neweconomic environment. Many family-run businesses apparently have encounteredfinancial difficulties after the economic crisis. In order to explain why some groups couldsurvive while other groups went bankrupt, it is necessary to divide family-run businessesinto two different types: innovative or modern type group, and authoritarian type.
Thai Petrochemical Industry (TPI) Group owned by the Leaophairat family offersan instructive case of an authoritarian type family-run business. The grandfather of thefounders of the TPI Group, a teochew overseas Chinese, started a rice milling business incentral Thailand before World War II. After the War, his son, Phorn Leaophairat,migrated to Bangkok and established a traditional trading house—Hang Hong Yiah Seng(Thanapornchai Co., Ltd., in Thai)—to export rice and import textile goods. Hesuccessfully expanded his business and the Hong Yiah Seng became one of the fivelargest rice exporters (ha-sua or five big tigers) in Thailand by the 1960s.
Phorn’s sons, or the third generation of the Leaophairat family, were educated inthe United States and obtained bachelors degrees in business administration and chemicalengineering. After returning to Thailand, three sons—Prachai, Prathip and Pramuwan—
19
jointly set up a new ambitious petrochemical firm, Thai Petrochemical Industry Co., Ltd.(TPI), in 1978 (listed in 1995). This was fully supported by government policy promotingheavy industries by utilizing natural gas produced in the Gulf of Siam. When theGovernment announced liberalization of industrial investment in the cement industry,they also expanded their industrial base to this field by establishing TPI Polene Co., Ltd.,in 1987 (listed in 1990). TPI soon became the second largest firm in the petrochemicalindustry, while TPI Polene grew into the second largest local firm before the crisis. TPIGroup (not including the Hong Yiah Seng Group’s companies and other family-ownedfirms such as Union Bangkok Insurance Co., Ltd.) consisted of as many as 44 firmsbetween 1978 and 1996 (TPI [ed.], 1996; Thanawat, 2000; pp. 326-332).
Such quick expansion was financially backed by large loans from domesticcommercial banks (especially Bangkok Bank PLC and Krungthai Bank PLC) and foreignfinancial institutions (IFC, etc.). As a result, dollar-based external debt totaled $3.2billion (B100.85 billion), so in the wake of the crisis, foreign exchange losses inDecember 1997 amounted to B14.46 billion (Krungthep Thurakit newspaper, 12December 1997). Immediately after the crisis, TPI suspended construction of newpetrochemical and cement plants and started negotiations for debt restructuring with 400creditors in December 1998. Getting bogged down in conflicts with creditors, Prachai andhis brothers would not yield control rights over TPI and finally decided to apply to thebankruptcy court in January 2000. TPI Polene Co., Ltd., followed suit in June (see PhuChatkan Rai-duan, 2000b; Suehiro and Higashi [eds.], 2001, Chapter 2).
Why did TPI Group collapse after the crisis? Why could it not effectively superviseincreasing external debt? Table 22 illustrates the case of TPI and its affiliated companiesby focusing on their ownership structure (pyramid structure) and management structure.At a glance, we find that the three brothers—Prachai, Prathip and Pramuwan—exclusively controlled all affiliated companies as chairmen, vice-chairmen, directors-cum-executives, CEOs and presidents. The Board members of almost all of thecompanies under TPI’s control overlapped with Executive Committee members of eachcompany.
In the case of TPI PLC itself, the 20 Board members included two independentdirectors, following exactly SET’s guideline, while Sunthon Hondaladarom (FinanceMinister in 1959-1963 and 1963-1965) was invited to be its chairman. But when Prachaibecame CEO and vice-chairman and his two younger brothers also were appointedpresident and directors in 1988, TPI was put under the complete control of owner-familymembers. Independent directors or foreign advisors could not wield any power againstthe three brothers. Also, TPI did not disclose detailed information on its debt compositionand investment plans. Thus, this type of family business may be designated as anauthoritarian-type group under the control of a single person or a few owner-familymembers.
Carefully investigating collapsed business groups by focusing on their managementstructure, we can easily find similar patterns to TPI. These include Alphatec Group(semiconductor industry) led by Charn Assawachok (applied to the bankruptcy court inMay 1998); the One Holding Group (finance) led by Pin Chakkapak (May 2000); theBangkok Metropolitan Bank Group (a financial conglomerate) led by UdaneTaechaphaibun (the Government took over in January 1998); the NTS Group (steelindustry) led by Sawat Horunruang (September 2000); the Sino-Thai Group (construction
20
and engineering) led by Anuthin Chanwirakun (December 1999); the UCOM Group(telecommunications industry) led by Bunchai Bencharongkun; the Thanayong Group(property business) led by Khiri Kanchanapak; the TBI Group (textiles) led by SukreePhothirattanangkun (May 2000), etc.
8.5. Modern Family Businesse s: Innovat ive Type
In contrast to authoritarian type groups, several local groups, such as Siam Cement Group(owned by the Crown Property Bureau, not a family business), CP Group, the ThaiFarmers Bank Group, the Bank of Ayudhya Group, the SPI Group, and the CentralDepartment Store Group, launched reforms to downsize their widely diversified businessactivities, accelerated reduction of external debt, shifted their fundraising sources frombank borrowings to new issues of corporate bonds, and promoted alliances with newforeign partners (see Phu Chatkan Rai-duan, 2000a). The development of CP Groupserves as a typical example.
Immediately after the currency crisis, CP Group undertook drastic corporaterestructur ing and downsized its business by concentrating resources in two core fields:agro-industry and telecommunications. In the process, it transferred profitable sectors ofits retail business to foreign partners and then deinvested from the petrochemical industry(see Phu Chatkan Rai-duan, 2000c).
The CP Group also streamlined all agro-industry-related firms (shrimp culture andprocessing, feed milling, and processing of broiler-chickens and swine) and reorganizedthem into Charoen Pokphand Foods PLC (CPF) in December 1998 (see Diagram 9; CPFAnnual Report, 1999 [in Thai]; do., A Form 56/1 Report, 1999 [in Thai]). Through thisreorganization, CPF became a holding company to supervise its operations in the agro-industry sector and the core firm to attract foreign investors. Owing to this corporaterestructuring, CPF successfully attracted foreign investors, who took about 39% of totalshareholdings, and quickly improved its financial indicators (D/E ratio, net profit margin,ROA, etc.) as Table 23 shows. CPF also is active in promoting information disclosure anddecided to increase its Board members from 10 persons in 1996 to 16 in February 1999 byincluding two new independent directors, Asa Sarasin and Prof. Atthasit Wechachiwa(see Table 24).
Nevertheless, the Chiarawanon family, ultimate owner of the CP Group as a whole,continued to keep control over ownership and management of CPF. Also, 13 out of 16directors of the Board came from owner-family members (four persons) or long-timeemployed staff in the CP Group (nine persons) (see Table 24). The Charoen PokphandGroup Company, which is a nonlisted holding company, also holds 31.4% of the totalshareholdings of CPF. Therefore, even innovative-type family business such as CP Grouphave not easily given up control of listed companies after the crisis (see Diagram 10).
A more modern type of family business ownership pattern may be found in thetelecommunications field, in SHIN (formerly Shinawatra) Group. The SHIN CorporationPLC, a computer service and holding company of SHIN Group, was owned by theShinawatra family (54%) and foreign institutional investors (30%) in 2000 (see Tables25A and 25B). The SHIN Corporation serves as the largest shareholder of the three majorgroup companies of the Advanced Info Service PLC (cellular), the SHIN Satellite PLC
21
(satellite television service) and Shinawatra Infomedia Technology PLC. All of these arelisted on the local stock market (see Diagram 11).
The Shinawatra family does not directly involve itself in these firms, and hasentrusted management to professionals recruited from the Communication Authority ofThailand (CAT), Telephone Organization of Thailand (TOT), IBM Thailand Co., Ltd.,and other companies of high reputation. The SHIN Group seems to have achievedcomplete separation between ownership and management, and serves as an example of amodernized business group among the local telecommunications industry (Phairo, 1999;Suehiro and Higashi [eds.], 2001; pp.18-20). By contrast, authoritarian-type groups suchas UCOM and Samart are going to be expelled from the market as thetelecommunications market is liberalized and in the face of fierce competition withforeign companies.
9. Suggestions for Further Study
Based on our research of Thai listed companies, which has focused on their economicperformance, we can summarize our findings as follows.
(1) Family-owned businesses in terms of ultimate owners do not always result in poorperformance.
(2) Corporations that are widely-held by various groups and have no controllingshareholdings have performed the worst, together with State-owned firms.
(3) Foreign involvement seems to contribute to better economic performance among Thailisted companies. When listed companies increase their foreign shareholdings, theireconomic performance tends to improve.
(4) The presence of minority shareholders does not directly affect economic performance.Especially when their total shareholdings in a listed company exceed 30%, it tends toproduce poor performance.
(5) Separation of the Board Chairperson from controlling shareholders and from theExecutive Committee members does not always result in good economic performance,although ownership/control separation might improve corporate governance in termsof market valuation.
(6) Family-owned firms that have been reluctant to disclose detailed information on theirmanagement, without exception, have the worst business record, even whencompared to family-owned firms with no separation between ownership and control.
Arising out of our findings are two useful hypotheses concerning family-runbusiness and corporate reforms in Thailand. The first is that family businesses inthemselves were not a major cause of the financial crisis and have not hindered recovery.Taking into account the significant role that family businesses have played in Thailand’snonfinancial sector, it would be better and more rational to introduce ways of revitalizingexisting family businesses to support sustainable growth rather than directly adapt the
22
Western model of good corporate governance to local firms. However, there arelimitations to family businesses, as the case of TPI Group apparently evidenced duringthe crisis.
This leads to the second hypothesis, which is that family businesses are notautomatically stable entities unless they work to adjust themselves to the changingenvironment. They now face the need for fundamental corporate restructuring underpressure of economic liberalization and industrial upgrading in Thailand. In this context,Larry Lang’s argument is highly suggestive to our hypotheses.
“The East Asian miracle: the post-war surge of growth which occurred despite theabsence of the Western institutions of the rule of law and democracy. This waspossible because East Asia had substitutes: business networks based on familyand long-term associates that permitted complex transactions without a law ofcontract; and autocratic governments and effective civil services committed toimproving national welfare. Problems arose only when growth proceeded to thepoint where companies had to seek outside sources of finance to continue theirgrowth” (Lang, 2001; p.11).
“The point” in his argument can be interpreted as the minimum size of necessaryinvestment and the corporate structure that will support increasing investment. Up to theeconomic boom, most Thai business groups had managed to control their businessactivity by depending on internal economic resources among the owner-family. However,after extending their business into more capital-intensive and/or technology-intensiveindustries, they had to seek outside sources of corporate finance such as stock market andoverseas project-based syndicate loans, together with borrowings from commercial banks.This shift inevitably requires local firms to reorganize their corporate structure andmanagement style. In short, innovation is the key element for Thai business groups tocontinue their growth. In addition to upgrading the business base, economic liberalizationpolicy also makes it difficult for local firms to maintain the traditional form of familybusiness when collaborating with foreign partners. This is because foreign investorsturned into competitors rather than good partners for local firms after the liberalizationand this trend will be enhanced in the future. Competitiveness, thus, has become anotherkey element for Thai business groups.
So how can we integrate the two contradictory elements of the dominance of familybusiness and the need for corporate reforms in order to revitalize local firms? Thepossible answer may be the introduction of a two-step approach to corporate restructuring.That is, place first priority on the promotion of internal control by Thai business groupsthemselves, and then gradually introduce legal and institutional frameworks in line withglobal standards to regulate local firms’ activities. With the local stock market not soattractive to foreign investors and bank borrowings still of great importance to local firms,it would seem to be less beneficial for Thai companies to adapt directly the Westernconcept of good corporate governance without giving careful consideration to thesequence of necessary policies as well as their adaptability.
If such a two-step approach is acceptable, further study is needed in the followingfour fields.
23
(1) Explore the relationships between local commercial banks and family business. As bank loans still play such an important role in fundraising for local firms, we mustinvestigate more deeply local commercial banks’ supervision of debtors and seekways to improve banks’ monitoring role in corporate finance. Before attacking theweaknesses of the local financial sector, we need to study more the activities of localcommercial banks in accordance with the differences in ownership pattern (State-owned or family-owned) and corporate type (financial conglomerate or independentcommercial bank).
(2) Conduct more detailed studies of the role of nonlisted companies in relation to thepyramid structure of family-run business. As the CP Group typically showed,owner-families frequently exert control over publicly traded companies through theirprivate holding companies and family-owned investment companies. Thesecompanies, without exception, belong to nonlisted companies that are beyond thereach of postcrisis SET-led corporate reforms. If we hope to discuss the widening gapbetween control rights and cash-flow rights among local listed firms, it is necessary toattempt to grasp the whole structure of Thai business groups, including nonlistedcompanies.
(3) Conduct field research not only on ownership patterns of family businesses but alsoon their management structure. It is surprising that there is no reliable information onthe frequency of general meetings of shareholders and the Board of Directors amonglisted companies. Further, there is no field research on interrelationships betweencontrolling shareholders (owner-family), the Board of Directors and the ExecutiveCommittee. On the other hand, internal control by family businesses throughmanagerial reforms seems to be becoming more and more important. If so, our studyof corporate governance should be extended from the traditional question of whocontrols Thai (or Asian) firms to the new question of who manages Thai (or Asian)firms. Combining the study of ownership patterns with that of management structure,we can formulate policies to revitalize local firms.
(4) Construct a method to evaluate the competitiveness of local firms according to theircontribution to the national economy in addition to market valuation and economicperformance in financial statements (see Woo, Sachs and Schwab [eds.], 2000).International organizations are inclined to divide listed companies into only twotypes: financial sector and nonfinancial sector. Therefore, they seem to neglect thesignificant role of the industrial sector in supporting national economic growth. Butas long as increases in manufactured exports are still so essential to economicrecovery in Asian countries, it is important to evaluate and improve the industrialcompetitiveness of each company in terms of export performance, technologyformation, and research and development. Reforms on the narrow basis of corporategovernance alone are not enough to overcome national economic crises or toreactivate export-oriented industries (see Suehiro, 2000a). In this sense,competitiveness should be included when we argue for corporate governance of localfirms.
24
References
Advanced Research Group Co., Ltd. (ed.). Thailand Company Information, Bangkok,annually, 1992/93 to 1998/99.
Asian Development Bank. 2000. “Corporate and Financial Sector Reform: Progress andProspects,” in Asian Development Outlook 2000, New York: Oxford University Press:21-40.
Bank of Thailand Research Division. 1999. “Phon-ngan Samruwat Sathanakan kankhong Thurakit,” in Thanakhan haeng Chat, Rai-ngan Pracham Duan, August: 31-38.
Claessens, Stijn, Simeon Djankov, Joseph Fan and Larry Lang. 1999a. “Expropriation ofMinority Shareholders: Evidence from East Asia,” World Bank Policy Research WorkingPaper No. 2088, Washington, DC: World Bank. March
Claessens, Stijn, Simeon Djankov, Joseph Fan and Larry Lang. 1999b. “CorporateDiversification in East Asia: The Role of Ultimate Ownership and Group,” World BankPolicy Research Working Paper No. 2089, Washington, DC: World Bank. March.
Claessens, Stijn, Simeon Djankov and Daniela Klingbeil. 1999. “Financial Restructuringin East Asia: Halfway There?” World Bank Financial Sector Discussion Paper No. 3,Washington, DC: World Bank. September.
Claessens, Stijn, Simeon Djankov and Larry Lang. 1998. “East Asian Corporations’Growth, Financing and Risks over the Last Decade,” World Bank Policy ResearchWorking Paper No. 2017, Washington, DC: World Bank. November.
Claessens, Stijn, Simeon Djankov and Larry Lang. 1999. “Who Controls East AsianCorporations?” World Bank Policy Research Working Paper No. 2054, Washington, DC:World Bank. February.
Claessens, Stijn, Simeon Djankov and Larry Lang. 2000. “East Asian Corporations:Heroes or Villains?” World Bank Working Paper No. 409, Washington, DC: WorldBank.
Dun & Bradstreet (Singapore) Pte., Ltd., and Business On-Line [eds.]. 1999. Top 5,000Companies in Thailand 1999/2000 Edition, Bangkok: Business On-Line Ltd.
Fischer, Stanley. 1999. “The Asian Crisis: A View from the IMF.” IMF, 22 January.
Hoshino, Taeko. 2001. “Keizai Gurobaruka to Mekisiko Minkan-bumon no Saihen”(Restructuring of Mexican Private Sector in Response to the Globalized Economy), inAzia Keizai, Tokyo: IDE. forthcoming.
25
Inagami, Takeshi, and Rengo Sogo Seikatsu Kaihatsu Kenkyusho (eds.). 2000. GendaiNihon no Koporeito Gabanansu (Corporate Governance in Contemporary Japan), Tokyo:Toyo Kezai Shimposha.
Keizai Kikakucho Keizai Kenkyusho (ed.). 1998. Nihon no Kooporeito Gabanansu:Kouzou Bunseki no Kantenkara (Corporate Governance in Japan: Standpoint ofStructural Analysis), Tokyo: Keizai Kikakucho.
Khan, Haider A. 1999. Corporate Governance of Family Businesses in Asia: What’sRight and What’s Wrong? Tokyo: Asian Development Bank Institute Working PaperNo.3.
La Porta, R., F. Lopez-De-Silanes, and A. Shleifer. 1999. “Corporate Ownership Aroundthe World,” Journal of Finance, 54: 471-518.
Lang, Larry. 2001. “Expropriation” A paper submitted to the International Seminar onCorporate Governance of Family Business in Asia, ADB Institute, Tokyo, 1 March.
Media Associated Co., Ltd. (ed.). Thailand (Finance &) Banking Yearbook, 1995, 1996,1997, 1998 and 1999 editions, Bangkok.
MITI (Japan’s Ministry of International Trade and Industry) (ed.). 1999. White Paper onInternational Trade 1999, Tokyo: Okurasho Printing House.
Pasuk Phongpaichit and Chris Baker. 2000. Thailand’s Crisis, Chiang Mai: SilkwormBooks.
Pedro, Alba, Stijn Claessens and Simeon Djankov. 1998. “Thailand’s CorporateFinancing and Governance Structures,” World Bank Policy Research Working Paper No.2003, Washington, DC: World Bank, November.
Phairo Loetwiram. 1999. “Bunkhlee Plangsiri: Phu-nam SHIN Corp. Yuk Mai”(Bunkhlee Plangsiri: Leader of SHIN Corp. in a New Era), in Phu Chatkan Rai-duan, Vol.17, No. 193, Bangkok, October: 43-62.
Phu Chatkan Rai-duan (ed.). 2000a. “Buang-luk Khwam Khit Banthun Lamsam:Thanakhan Pen Ruang Sakon” (Deep Thought of Mr. Banthun Lamsam: CommercialBank Is a Universal Matter), in Phu Chatkan Rai-duan, Vol. 17, No. 197, Bangkok,February: 84-111.
Phu Chatkan Rai-duan (ed.). 2000b. “Prachai Leaophairat: Local Hero,” in Phu ChatkanRai-duan, Vol. 17, No. 200, Bangkok, May: 62-93.
Phu Chatkan Rai-duan (ed.). 2000c. “CP Satawat thi 21: Phara Sut-thai ThaninChiarawanon” (CP Group in the 21 s t Century: Final Task of Thanin Chiarawanon), in PhuChatkan Rai-duan, Vol. 17, No. 206, Bangkok, November: 56-83.
26
Samakhom Thanakhan Phanit haeng Prathet Thai (ed.). Kan Ngoen Thanakhan (Moneyand Bank), Bangkok, monthly, various issues.
Securities (Stock) Exchange of Thailand (Talat Laksap haeng Prathet Thai) (ed.). SarupKho Sonthet: Borisat Chot-Thabian, Borisat Rap-Anuyat, 1989, 1990, 1992 and 1994editions, Bangkok (in Thai).
Shleifer, Andrei, and Robert W. Vishny. 1997. “A Survey of Corporate Governance,” inJournal of Finance, No. 52: 737-783.
Stock Exchange of Thailand. 1997. “Corporate Governance Survey in Thailand,” in SETJournal, Vol. 1, No. 7, April: 6-16.
Stock Exchange of Thailand. 1999. CD-ROM Listed Company Info 1998 Q1/Q2 andQ3/Q4, Bangkok: SET.
Stock Exchange of Thailand. 2000. CD-ROM Listed Company Info 1999 Q1/Q2 andQ3/Q4, Bangkok: SET.
Stock Exchange of Thailand. 2001. CD-ROM Listed Company Info 2000 Q1/Q2,Bangkok: SET.
Stock Exchange of Thailand. Fact Book of SET, annually, 1987-1999.
Stock Exchange of Thailand. Annual Report of SET, annually, 1990-1999.
Stock Exchange of Thailand. Thailand Listed Company 1997 (original one), Bangkok:SET.
Stock Exchange of Thailand. Warasan (Journal), monthly, various issues.
Suehiro, Akira. 1989. Capital Accumulation in Thailand 1885-1985, Tokyo: UNESCO,Centre for East Asian Cultural Studies.
Suehiro, Akira. 1993. “Family Business Reassessed: Corporate Structure and Late-starting Industrialization in Thailand,” in The Developing Economies, Vol. 31, No. 4,378-407.
Suehiro, Akira. 1998. “Modern Family Business and Corporate Capability in Thailand: ACase Study of the CP Group,” Japanese Yearbook on Business History, Vol. 14: 31-58.
Suehiro, Akira. 2000a. “Thai no Keizai Kaikaku: Sangyo Kouzo Chosei Jigyo to ChushoKigyo Shien” (Economic Reforms in Thailand: Industrial Restructuring Program andPromotion of Small- and Medium-sized Enterprises), Shakai Kagaku Kenkyu (Institute ofSocial Science of the University of Tokyo), Vol. 51, No. 4, March: 25-65.
27
Suehiro, Akira. 2000b. “Asian Crisis and Economic and Social Restructuring:Americanization and Social Governance,” in Ippei Yamazawa (ed.), DevelopingEconomies in the Twenty-First Century, Tokyo: IDE.
Suehiro, Akira. 2000c. Thai Daikigyo no Deta to Bunseki: Kokuei Kigyo, TakokusekiKigyo, Zaibatsu Gurupu (Data Book on Big Corporations in Thailand: State Enterprises,Multinational Corporations and the Zaibatsu-type Business Group), Institute of SocialScience of the University of Tokyo.
Suehiro, Akira. 2000d. Kyacchi Appu-gata Kogyoka-ron: Ajia Keizai no Kiseki to Tenbo(Catch-up Type Industrialization: Experience of and Perspective on the Asian Economy),Nagoya: Nagoya University Press.
Suehiro, Akira. 2001. “Asian Corporate Governance: Disclosure-Based ScreeningSystem and Family Business Restructuring in Thailand,” Shakai Kagaku Kenkyu(Institute of Social Science of the University of Tokyo), Vol. 52, No. 5, March: 55-97
Suehiro, Akira, and Higashi Shigeki (eds.). 2000. Thai no Keizai Seisaku: Seido, Soshiki,Akutaa (Economic Policy in Thailand: The Role of Institutions and Actors), Tokyo: IDE.
Suehiro, Akira, and Higashi Shigeki (eds.). 2001. Thai Keizai-kiki to Kigyo Kaikaku(Economic Crisis and Corporate Restructuring in Thailand), Tokyo: IDE.
Suehiro, Akira, and Yamakage Susumu (eds.). 2001. Ajia Seiji Keizai-ron: Ajia nonakano Nihon wo Mezashite (Studies of Asian Political Economy: Seeking Japan’sContribution to Asia), Tokyo: NTT Publisher.
Talat Laksap haeng Prathet Thai (ed.). Nangsue Wien Talat Laksap haeng Prathet Thai1990-1999: Khamsang lae Prakat, (Circulated Documents of SET: Orders andAnnouncements), Bangkok: SET Library.
Thai Bond Dealing Centre (ed.). 2000. Thai BDC Profile 2000, Bangkok. BDC.
Thanawat Sap-phaibun. 2000. 55 Trakun Dan, Phak 1 (55 Distinguished Families),Bangkok: Krungthep Thurakit.
Wirat Saengthongkham. 1998. Thanakhan Thai Lom Salai (Thai Commercial BanksCollapsed), Bangkok: P. Press.
Woo, Wing Thye, Jeffrey Sachs and Klaus Schwab (eds.). 2000. The Asian FinancialCrisis: Lessons for A Resilient Asia, Cambridge, MA.: The MIT Press.
World Bank. 1998a. East Asia: The Road to Recovery, Washington, DC: World Bank.
World Bank. 1998b. “The Ultimate Business Survey,” Asiaweek, 16 April: 1-14.
28
World Bank. 1999. Global Economic Prospects and the Developing Countries 1998/99:Beyond Financial Crisis, Washington, DC: World Bank.
World Bank. 2000. East Asia: Recovery and Beyond, Washington, DC: World Bank.
Yupana Wiwattanakantang. 1999. “An Empirical Study on the Determinants of theCapital Structure of Thai Firms,” Pacific-Basin Finance Journal, No. 7, Tokyo: 371-403.
Yupana Wiwattanakantang. 2000a. “The Equity Ownership Structure of Thai Firms,”Institute of Economic Research of Hitotsubashi University. June. mimeo.
Yupana Wiwattanakantang. 2000b. “The Effect of Ownership Structure and CorporateGovernance on the Performance of Thai Firms,” Institute of Economic Research ofHitotsubashi University. June. mimeo.
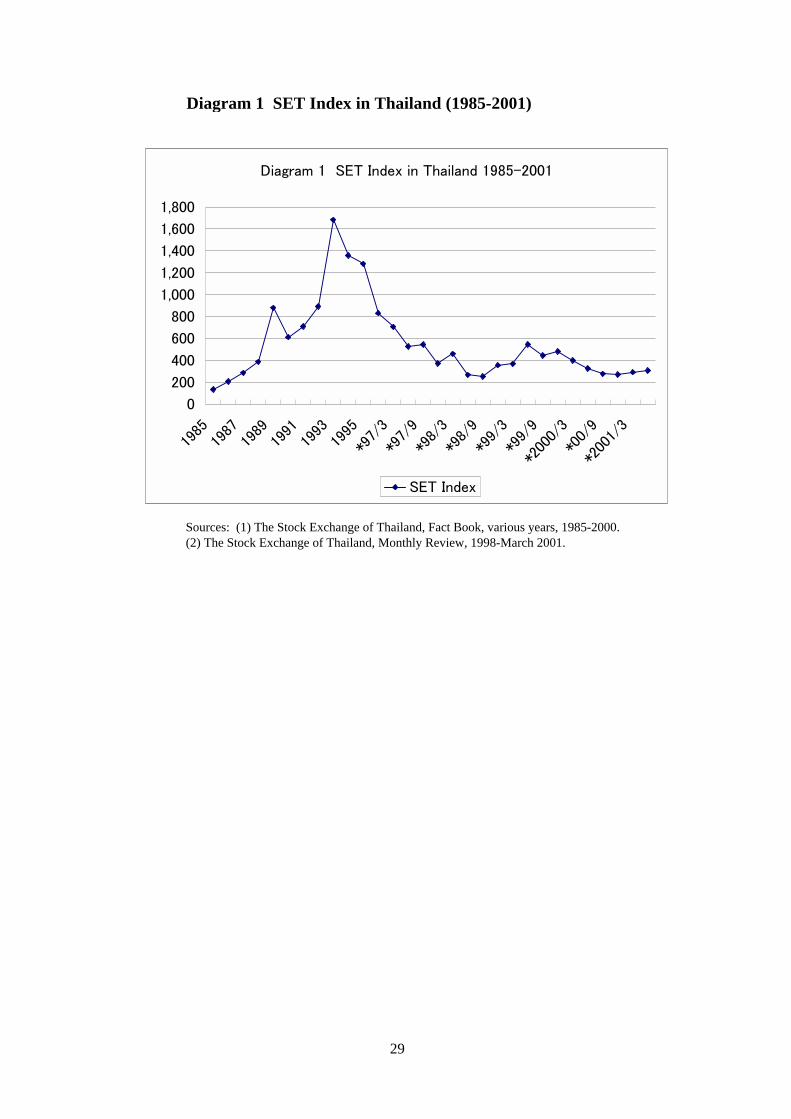
Diagram 1 SET Index in Thailand (1985-2001)
Sources: (1) The Stock Exchange of Thailand, Fact Book, various years, 1985-2000.(2) The Stock Exchange of Thailand, Monthly Review, 1998-March 2001.
Diagram 1 SET Index in Thailand 1985-2001
0
200
400
600
800
1,000
1,200
1,400
1,600
1,800
1985
1987
1989
1991
1993
1995
*97/
3
*97/
9
*98/
3
*98/
9
*99/
3
*99/
9
*200
0/3
*00/
9
*200
1/3
SET Index
29
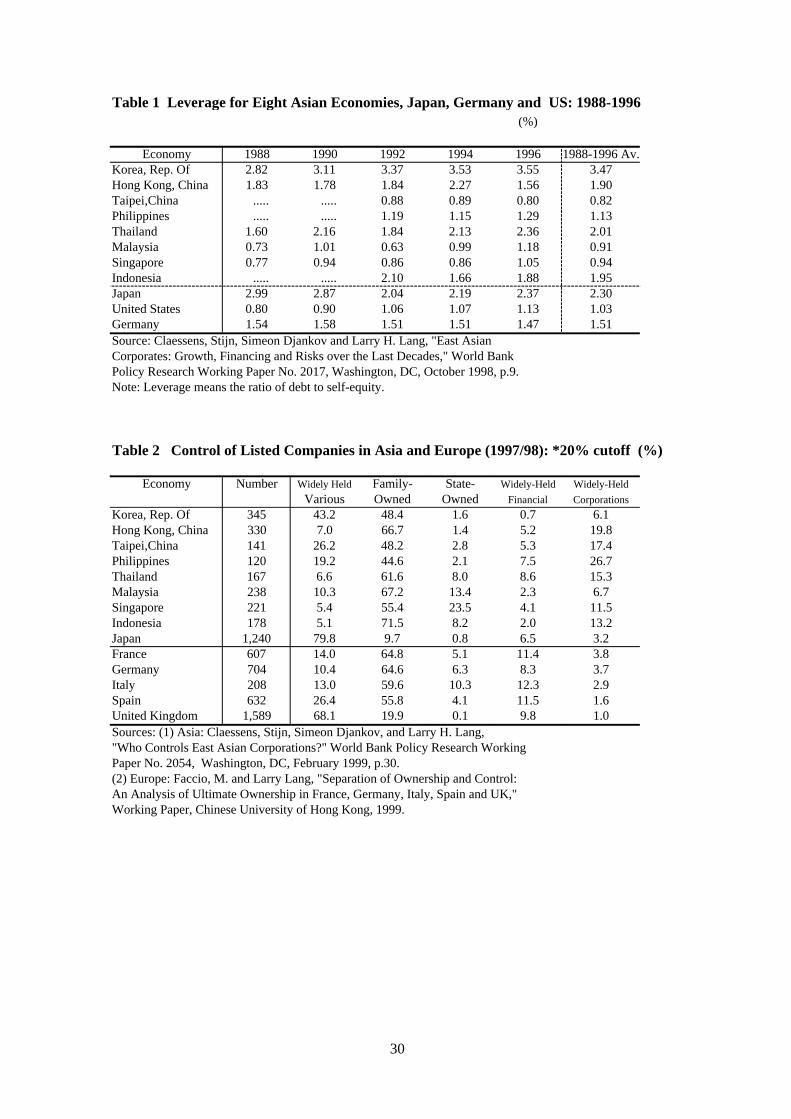
Table 1 Leverage for Eight Asian Economies, Japan, Germany and US: 1988-1996 (%)
Economy 1988 1990 1992 1994 1996 1988-1996 Av.Korea, Rep. Of 2.82 3.11 3.37 3.53 3.55 3.47Hong Kong, China 1.83 1.78 1.84 2.27 1.56 1.90Taipei,China ..... ..... 0.88 0.89 0.80 0.82Philippines ..... ..... 1.19 1.15 1.29 1.13Thailand 1.60 2.16 1.84 2.13 2.36 2.01Malaysia 0.73 1.01 0.63 0.99 1.18 0.91Singapore 0.77 0.94 0.86 0.86 1.05 0.94Indonesia ..... ..... 2.10 1.66 1.88 1.95Japan 2.99 2.87 2.04 2.19 2.37 2.30United States 0.80 0.90 1.06 1.07 1.13 1.03Germany 1.54 1.58 1.51 1.51 1.47 1.51Source: Claessens, Stijn, Simeon Djankov and Larry H. Lang, "East Asian Corporates: Growth, Financing and Risks over the Last Decades," World Bank Policy Research Working Paper No. 2017, Washington, DC, October 1998, p.9.Note: Leverage means the ratio of debt to self-equity.
Table 2 Control of Listed Companies in Asia and Europe (1997/98): *20% cutoff (%)
Economy Number Widely Held Family- State- Widely-Held Widely-Held
Various Owned Owned Financial Corporations
Korea, Rep. Of 345 43.2 48.4 1.6 0.7 6.1Hong Kong, China 330 7.0 66.7 1.4 5.2 19.8Taipei,China 141 26.2 48.2 2.8 5.3 17.4Philippines 120 19.2 44.6 2.1 7.5 26.7Thailand 167 6.6 61.6 8.0 8.6 15.3Malaysia 238 10.3 67.2 13.4 2.3 6.7Singapore 221 5.4 55.4 23.5 4.1 11.5Indonesia 178 5.1 71.5 8.2 2.0 13.2Japan 1,240 79.8 9.7 0.8 6.5 3.2France 607 14.0 64.8 5.1 11.4 3.8Germany 704 10.4 64.6 6.3 8.3 3.7Italy 208 13.0 59.6 10.3 12.3 2.9Spain 632 26.4 55.8 4.1 11.5 1.6United Kingdom 1,589 68.1 19.9 0.1 9.8 1.0Sources: (1) Asia: Claessens, Stijn, Simeon Djankov, and Larry H. Lang, "Who Controls East Asian Corporations?" World Bank Policy Research Working Paper No. 2054, Washington, DC, February 1999, p.30.(2) Europe: Faccio, M. and Larry Lang, "Separation of Ownership and Control: An Analysis of Ultimate Ownership in France, Germany, Italy, Spain and UK," Working Paper, Chinese University of Hong Kong, 1999.
30
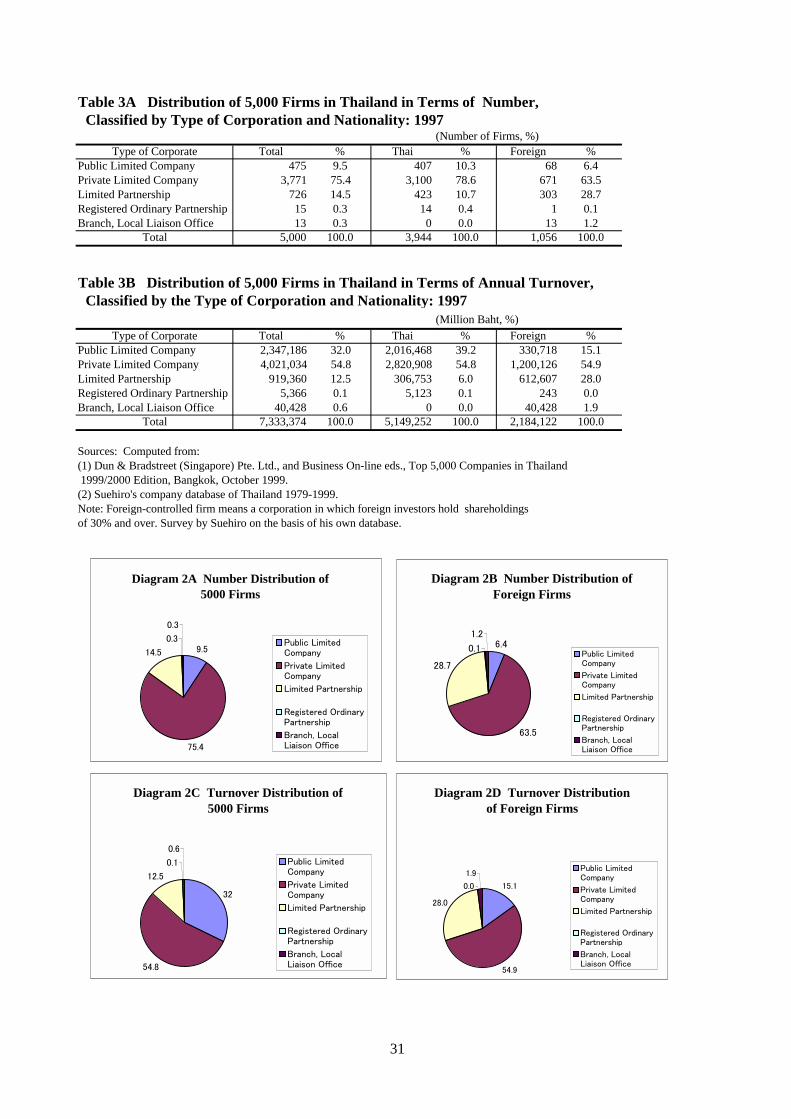
Table 3A Distribution of 5,000 Firms in Thailand in Terms of Number, Classified by Type of Corporation and Nationality: 1997
(Number of Firms, %)Type of Corporate Total % Thai % Foreign %
Public Limited Company 475 9.5 407 10.3 68 6.4Private Limited Company 3,771 75.4 3,100 78.6 671 63.5Limited Partnership 726 14.5 423 10.7 303 28.7Registered Ordinary Partnership 15 0.3 14 0.4 1 0.1Branch, Local Liaison Office 13 0.3 0 0.0 13 1.2
Total 5,000 100.0 3,944 100.0 1,056 100.0
Table 3B Distribution of 5,000 Firms in Thailand in Terms of Annual Turnover, Classified by the Type of Corporation and Nationality: 1997
(Million Baht, %)Type of Corporate Total % Thai % Foreign %
Public Limited Company 2,347,186 32.0 2,016,468 39.2 330,718 15.1Private Limited Company 4,021,034 54.8 2,820,908 54.8 1,200,126 54.9Limited Partnership 919,360 12.5 306,753 6.0 612,607 28.0Registered Ordinary Partnership 5,366 0.1 5,123 0.1 243 0.0Branch, Local Liaison Office 40,428 0.6 0 0.0 40,428 1.9
Total 7,333,374 100.0 5,149,252 100.0 2,184,122 100.0
Sources: Computed from:(1) Dun & Bradstreet (Singapore) Pte. Ltd., and Business On-line eds., Top 5,000 Companies in Thailand 1999/2000 Edition, Bangkok, October 1999.(2) Suehiro's company database of Thailand 1979-1999.Note: Foreign-controlled firm means a corporation in which foreign investors hold shareholdings of 30% and over. Survey by Suehiro on the basis of his own database.
Diagram 2A Number Distribution of5000 Firms
9.5
75.4
14.5
0.3
0.3
Public LimitedCompany
Private LimitedCompany
Limited Partnership
Registered OrdinaryPartnership
Branch, LocalLiaison Office
Diagram 2B Number Distribution ofForeign Firms
6.4
63.5
28.7
0.1
1.2
Public LimitedCompany
Private LimitedCompany
Limited Partnership
Registered OrdinaryPartnership
Branch, LocalLiaison Office
Diagram 2C Turnover Distribution of5000 Firms
32
54.8
12.5
0.1
0.6
Public LimitedCompany
Private LimitedCompany
Limited Partnership
Registered OrdinaryPartnership
Branch, LocalLiaison Office
Diagram 2D Turnover Distributionof Foreign Firms
15.1
54.9
28.0
0.0
1.9Public LimitedCompany
Private LimitedCompany
Limited Partnership
Registered OrdinaryPartnership
Branch, LocalLiaison Office
31
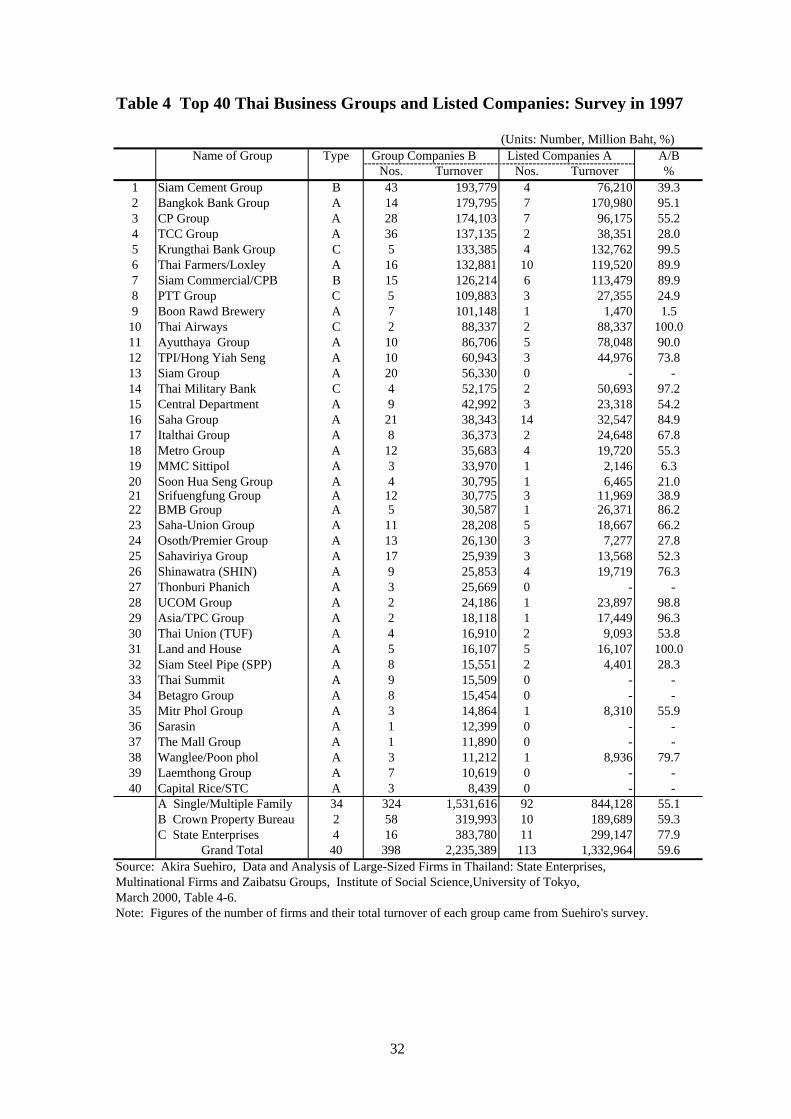
Table 4 Top 40 Thai Business Groups and Listed Companies: Survey in 1997
(Units: Number, Million Baht, %)Name of Group Type Group Companies B Listed Companies A A/B
Nos. Turnover Nos. Turnover %1 Siam Cement Group B 43 193,779 4 76,210 39.32 Bangkok Bank Group A 14 179,795 7 170,980 95.13 CP Group A 28 174,103 7 96,175 55.24 TCC Group A 36 137,135 2 38,351 28.05 Krungthai Bank Group C 5 133,385 4 132,762 99.56 Thai Farmers/Loxley A 16 132,881 10 119,520 89.97 Siam Commercial/CPB B 15 126,214 6 113,479 89.98 PTT Group C 5 109,883 3 27,355 24.99 Boon Rawd Brewery A 7 101,148 1 1,470 1.5
10 Thai Airways C 2 88,337 2 88,337 100.011 Ayutthaya Group A 10 86,706 5 78,048 90.012 TPI/Hong Yiah Seng A 10 60,943 3 44,976 73.813 Siam Group A 20 56,330 0 - -14 Thai Military Bank C 4 52,175 2 50,693 97.215 Central Department A 9 42,992 3 23,318 54.216 Saha Group A 21 38,343 14 32,547 84.917 Italthai Group A 8 36,373 2 24,648 67.818 Metro Group A 12 35,683 4 19,720 55.319 MMC Sittipol A 3 33,970 1 2,146 6.320 Soon Hua Seng Group A 4 30,795 1 6,465 21.021 Srifuengfung Group A 12 30,775 3 11,969 38.922 BMB Group A 5 30,587 1 26,371 86.223 Saha-Union Group A 11 28,208 5 18,667 66.224 Osoth/Premier Group A 13 26,130 3 7,277 27.825 Sahaviriya Group A 17 25,939 3 13,568 52.326 Shinawatra (SHIN) A 9 25,853 4 19,719 76.327 Thonburi Phanich A 3 25,669 0 - -28 UCOM Group A 2 24,186 1 23,897 98.829 Asia/TPC Group A 2 18,118 1 17,449 96.330 Thai Union (TUF) A 4 16,910 2 9,093 53.831 Land and House A 5 16,107 5 16,107 100.032 Siam Steel Pipe (SPP) A 8 15,551 2 4,401 28.333 Thai Summit A 9 15,509 0 - -34 Betagro Group A 8 15,454 0 - -35 Mitr Phol Group A 3 14,864 1 8,310 55.936 Sarasin A 1 12,399 0 - -37 The Mall Group A 1 11,890 0 - -38 Wanglee/Poon phol A 3 11,212 1 8,936 79.739 Laemthong Group A 7 10,619 0 - -40 Capital Rice/STC A 3 8,439 0 - -
A Single/Multiple Family 34 324 1,531,616 92 844,128 55.1B Crown Property Bureau 2 58 319,993 10 189,689 59.3C State Enterprises 4 16 383,780 11 299,147 77.9
Grand Total 40 398 2,235,389 113 1,332,964 59.6Source: Akira Suehiro, Data and Analysis of Large-Sized Firms in Thailand: State Enterprises, Multinational Firms and Zaibatsu Groups, Institute of Social Science,University of Tokyo, March 2000, Table 4-6.Note: Figures of the number of firms and their total turnover of each group came from Suehiro's survey.
32
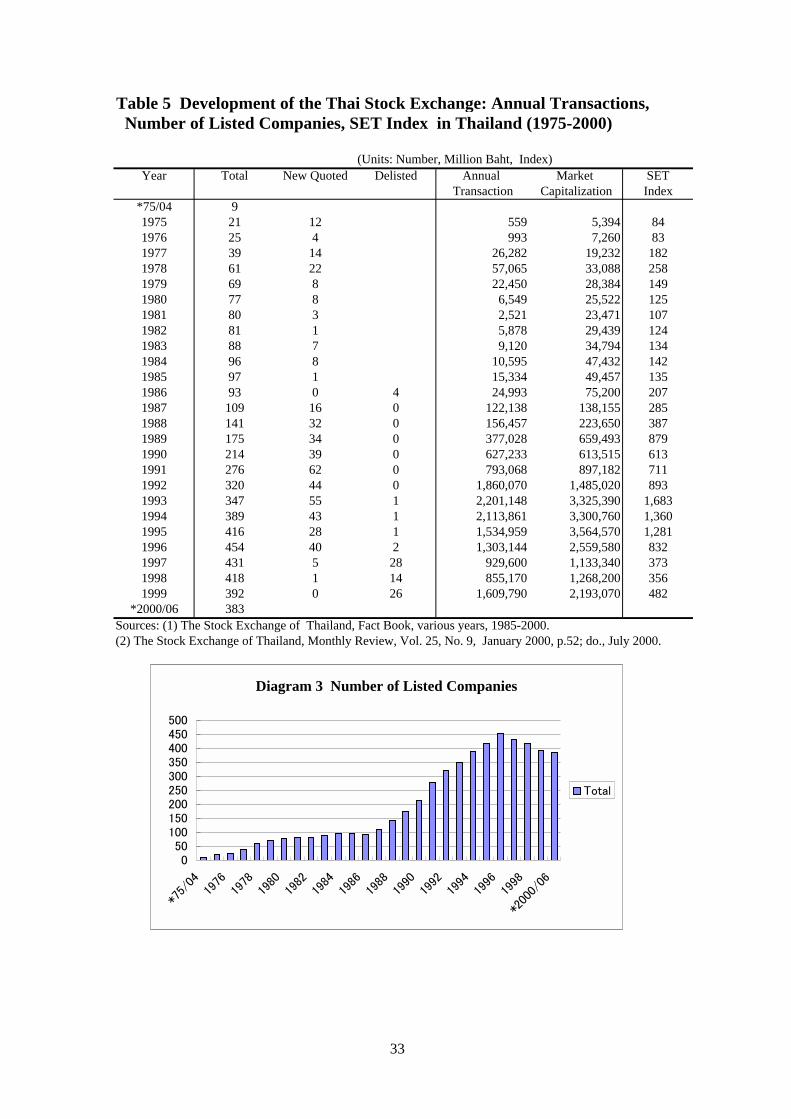
Table 5 Development of the Thai Stock Exchange: Annual Transactions, Number of Listed Companies, SET Index in Thailand (1975-2000)
(Units: Number, Million Baht, Index)Year Total New Quoted Delisted Annual Market SET
Transaction Capitalization Index*75/04 91975 21 12 559 5,394 841976 25 4 993 7,260 831977 39 14 26,282 19,232 1821978 61 22 57,065 33,088 2581979 69 8 22,450 28,384 1491980 77 8 6,549 25,522 1251981 80 3 2,521 23,471 1071982 81 1 5,878 29,439 1241983 88 7 9,120 34,794 1341984 96 8 10,595 47,432 1421985 97 1 15,334 49,457 1351986 93 0 4 24,993 75,200 2071987 109 16 0 122,138 138,155 2851988 141 32 0 156,457 223,650 3871989 175 34 0 377,028 659,493 8791990 214 39 0 627,233 613,515 6131991 276 62 0 793,068 897,182 7111992 320 44 0 1,860,070 1,485,020 8931993 347 55 1 2,201,148 3,325,390 1,6831994 389 43 1 2,113,861 3,300,760 1,3601995 416 28 1 1,534,959 3,564,570 1,2811996 454 40 2 1,303,144 2,559,580 8321997 431 5 28 929,600 1,133,340 3731998 418 1 14 855,170 1,268,200 3561999 392 0 26 1,609,790 2,193,070 482
*2000/06 383Sources: (1) The Stock Exchange of Thailand, Fact Book, various years, 1985-2000.(2) The Stock Exchange of Thailand, Monthly Review, Vol. 25, No. 9, January 2000, p.52; do., July 2000.
Diagram 3 Number of Listed Companies
050
100150200250300350400450500
*75/
0419
7619
7819
8019
8219
8419
8619
8819
9019
9219
9419
9619
98
*200
0/06
Total
33
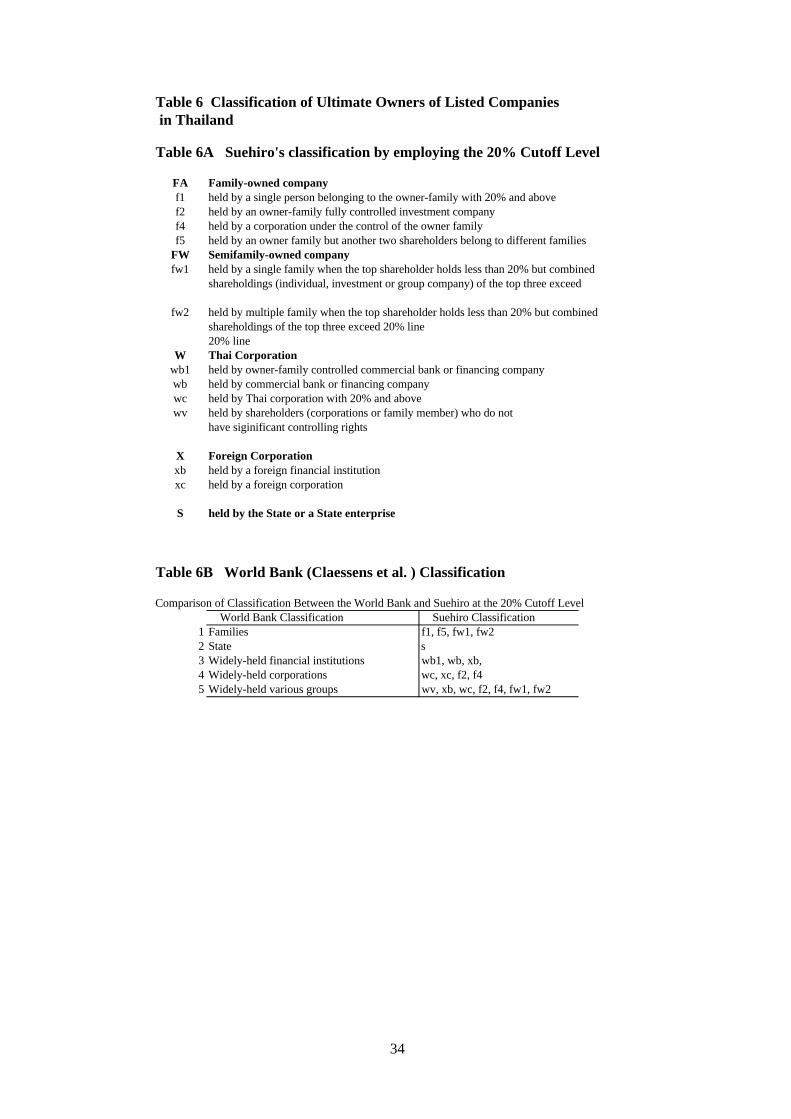
Table 6 Classification of Ultimate Owners of Listed Companies in Thailand
Table 6A Suehiro's classification by employing the 20% Cutoff Level
FA Family-owned companyf1 held by a single person belonging to the owner-family with 20% and abovef2 held by an owner-family fully controlled investment companyf4 held by a corporation under the control of the owner familyf5 held by an owner family but another two shareholders belong to different families
FW Semifamily-owned companyfw1 held by a single family when the top shareholder holds less than 20% but combined
shareholdings (individual, investment or group company) of the top three exceed
fw2 held by multiple family when the top shareholder holds less than 20% but combinedshareholdings of the top three exceed 20% line20% line
W Thai Corporationwb1 held by owner-family controlled commercial bank or financing companywb held by commercial bank or financing companywc held by Thai corporation with 20% and abovewv held by shareholders (corporations or family member) who do not
have siginificant controlling rights
X Foreign Corporationxb held by a foreign financial institutionxc held by a foreign corporation
S held by the State or a State enterprise
Table 6B World Bank (Claessens et al. ) Classification
Comparison of Classification Between the World Bank and Suehiro at the 20% Cutoff Level World Bank Classification Suehiro Classification
1 Families f1, f5, fw1, fw22 State s3 Widely-held financial institutions wb1, wb, xb, 4 Widely-held corporations wc, xc, f2, f45 Widely-held various groups wv, xb, wc, f2, f4, fw1, fw2
34
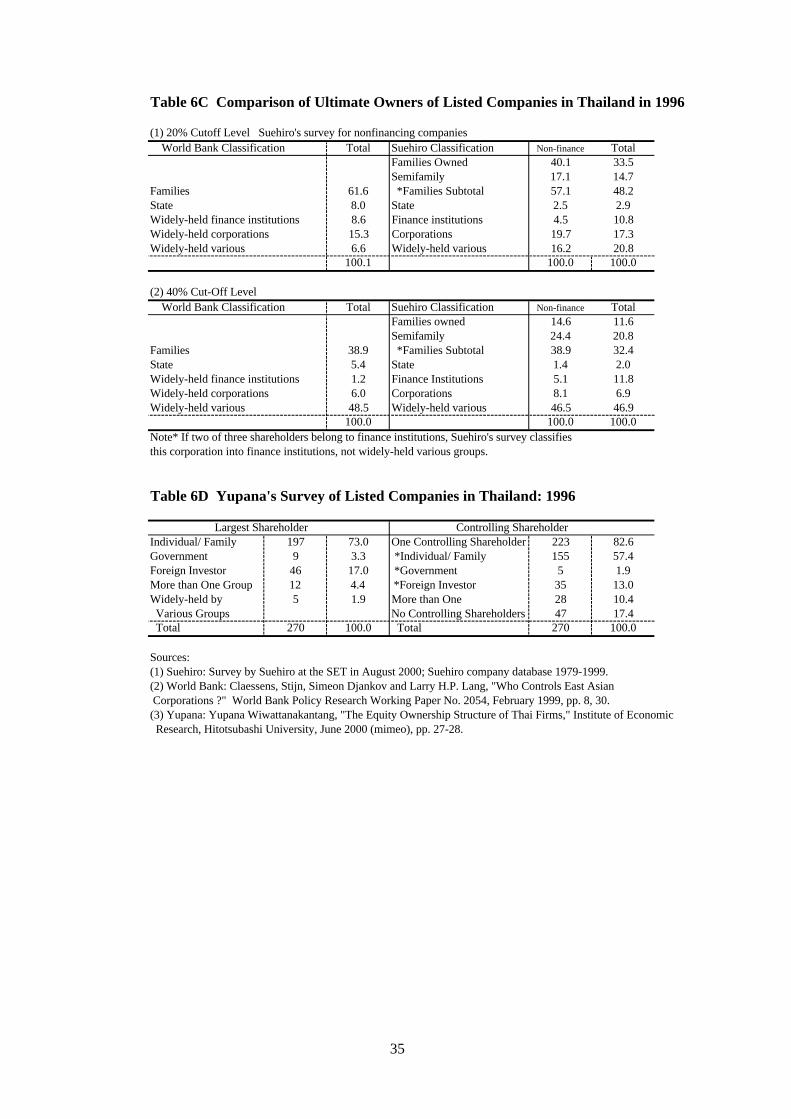
Table 6C Comparison of Ultimate Owners of Listed Companies in Thailand in 1996
(1) 20% Cutoff Level Suehiro's survey for nonfinancing companies World Bank Classification Total Suehiro Classification Non-finance Total
Families Owned 40.1 33.5Semifamily 17.1 14.7
Families 61.6 *Families Subtotal 57.1 48.2State 8.0 State 2.5 2.9Widely-held finance institutions 8.6 Finance institutions 4.5 10.8Widely-held corporations 15.3 Corporations 19.7 17.3Widely-held various 6.6 Widely-held various 16.2 20.8
100.1 100.0 100.0
(2) 40% Cut-Off Level World Bank Classification Total Suehiro Classification Non-finance Total
Families owned 14.6 11.6Semifamily 24.4 20.8
Families 38.9 *Families Subtotal 38.9 32.4State 5.4 State 1.4 2.0Widely-held finance institutions 1.2 Finance Institutions 5.1 11.8Widely-held corporations 6.0 Corporations 8.1 6.9Widely-held various 48.5 Widely-held various 46.5 46.9
100.0 100.0 100.0Note* If two of three shareholders belong to finance institutions, Suehiro's survey classifies this corporation into finance institutions, not widely-held various groups.
Table 6D Yupana's Survey of Listed Companies in Thailand: 1996
Largest Shareholder Controlling ShareholderIndividual/ Family 197 73.0 One Controlling Shareholder 223 82.6Government 9 3.3 *Individual/ Family 155 57.4Foreign Investor 46 17.0 *Government 5 1.9More than One Group 12 4.4 *Foreign Investor 35 13.0Widely-held by 5 1.9 More than One 28 10.4 Various Groups No Controlling Shareholders 47 17.4 Total 270 100.0 Total 270 100.0
Sources:(1) Suehiro: Survey by Suehiro at the SET in August 2000; Suehiro company database 1979-1999.(2) World Bank: Claessens, Stijn, Simeon Djankov and Larry H.P. Lang, "Who Controls East Asian Corporations ?" World Bank Policy Research Working Paper No. 2054, February 1999, pp. 8, 30.(3) Yupana: Yupana Wiwattanakantang, "The Equity Ownership Structure of Thai Firms," Institute of Economic Research, Hitotsubashi University, June 2000 (mimeo), pp. 27-28.
35
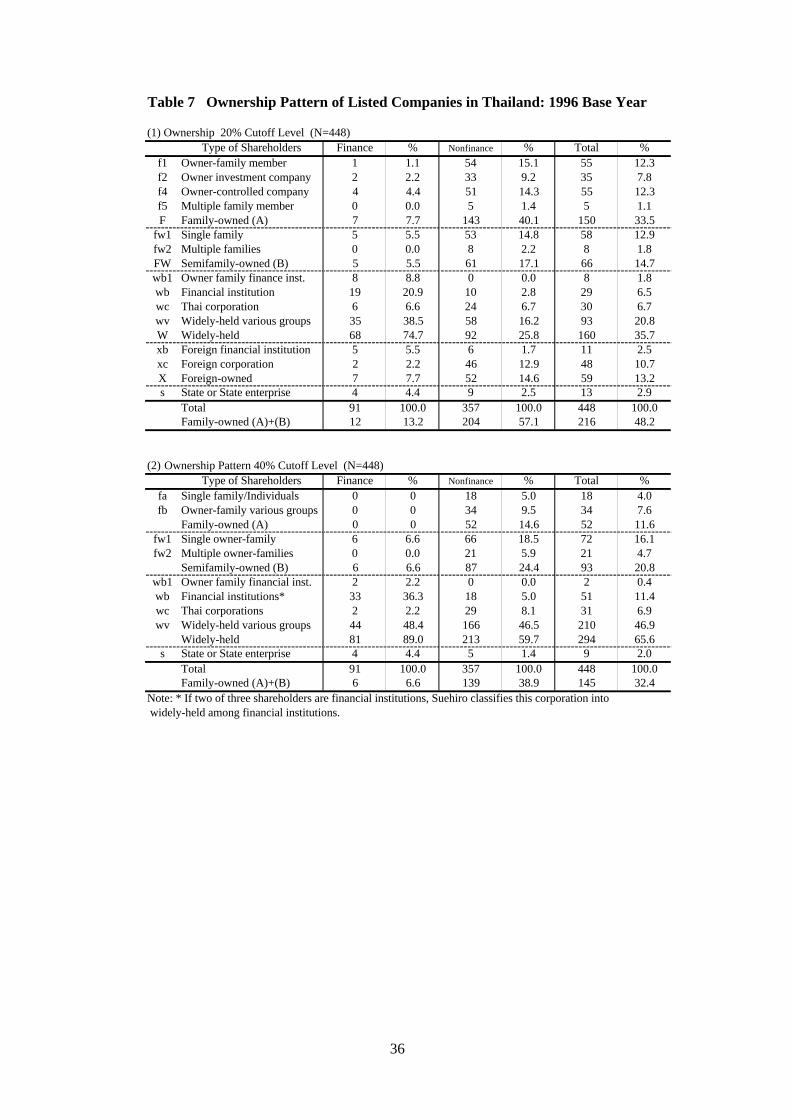
Table 7 Ownership Pattern of Listed Companies in Thailand: 1996 Base Year
(1) Ownership 20% Cutoff Level (N=448)Type of Shareholders Finance % Nonfinance % Total %
f1 Owner-family member 1 1.1 54 15.1 55 12.3f2 Owner investment company 2 2.2 33 9.2 35 7.8f4 Owner-controlled company 4 4.4 51 14.3 55 12.3f5 Multiple family member 0 0.0 5 1.4 5 1.1F Family-owned (A) 7 7.7 143 40.1 150 33.5
fw1 Single family 5 5.5 53 14.8 58 12.9fw2 Multiple families 0 0.0 8 2.2 8 1.8FW Semifamily-owned (B) 5 5.5 61 17.1 66 14.7wb1 Owner family finance inst. 8 8.8 0 0.0 8 1.8wb Financial institution 19 20.9 10 2.8 29 6.5wc Thai corporation 6 6.6 24 6.7 30 6.7wv Widely-held various groups 35 38.5 58 16.2 93 20.8W Widely-held 68 74.7 92 25.8 160 35.7xb Foreign financial institution 5 5.5 6 1.7 11 2.5xc Foreign corporation 2 2.2 46 12.9 48 10.7X Foreign-owned 7 7.7 52 14.6 59 13.2s State or State enterprise 4 4.4 9 2.5 13 2.9
Total 91 100.0 357 100.0 448 100.0Family-owned (A)+(B) 12 13.2 204 57.1 216 48.2
(2) Ownership Pattern 40% Cutoff Level (N=448)Type of Shareholders Finance % Nonfinance % Total %
fa Single family/Individuals 0 0 18 5.0 18 4.0fb Owner-family various groups 0 0 34 9.5 34 7.6
Family-owned (A) 0 0 52 14.6 52 11.6fw1 Single owner-family 6 6.6 66 18.5 72 16.1fw2 Multiple owner-families 0 0.0 21 5.9 21 4.7
Semifamily-owned (B) 6 6.6 87 24.4 93 20.8wb1 Owner family financial inst. 2 2.2 0 0.0 2 0.4wb Financial institutions* 33 36.3 18 5.0 51 11.4wc Thai corporations 2 2.2 29 8.1 31 6.9wv Widely-held various groups 44 48.4 166 46.5 210 46.9
Widely-held 81 89.0 213 59.7 294 65.6s State or State enterprise 4 4.4 5 1.4 9 2.0
Total 91 100.0 357 100.0 448 100.0Family-owned (A)+(B) 6 6.6 139 38.9 145 32.4
Note: * If two of three shareholders are financial institutions, Suehiro classifies this corporation into widely-held among financial institutions.
36
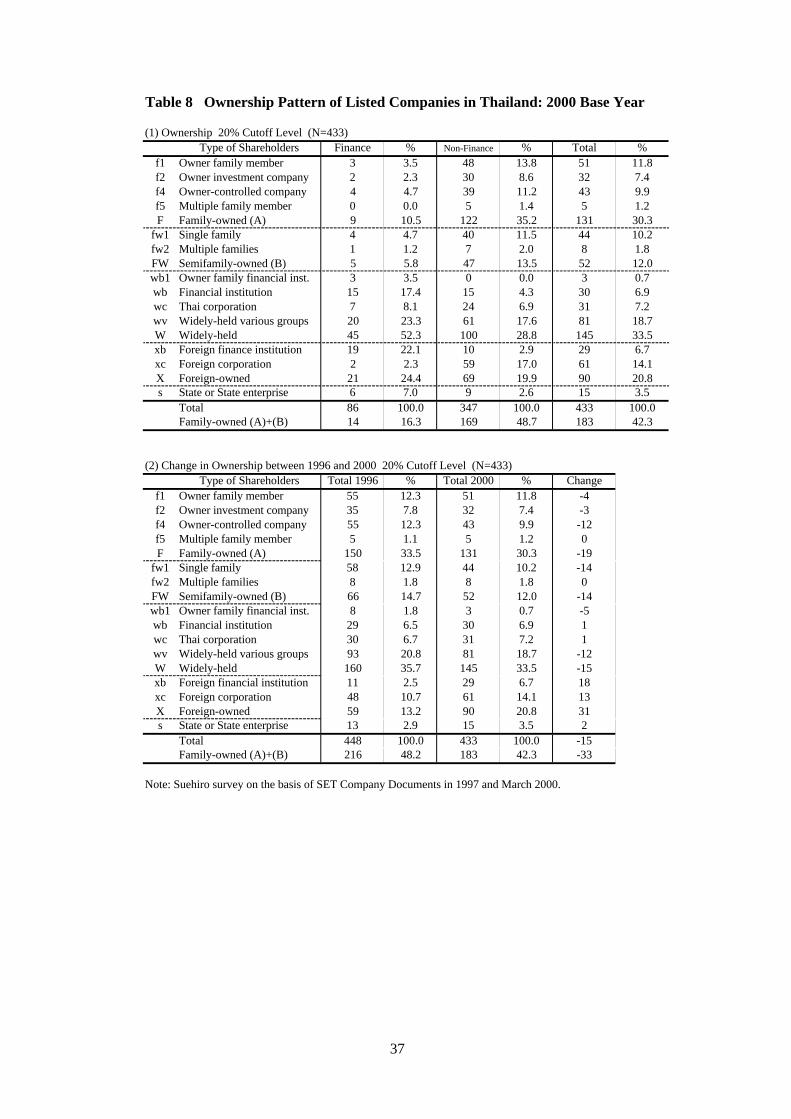
Table 8 Ownership Pattern of Listed Companies in Thailand: 2000 Base Year
(1) Ownership 20% Cutoff Level (N=433)Type of Shareholders Finance % Non-Finance % Total %
f1 Owner family member 3 3.5 48 13.8 51 11.8f2 Owner investment company 2 2.3 30 8.6 32 7.4f4 Owner-controlled company 4 4.7 39 11.2 43 9.9f5 Multiple family member 0 0.0 5 1.4 5 1.2F Family-owned (A) 9 10.5 122 35.2 131 30.3
fw1 Single family 4 4.7 40 11.5 44 10.2fw2 Multiple families 1 1.2 7 2.0 8 1.8FW Semifamily-owned (B) 5 5.8 47 13.5 52 12.0wb1 Owner family financial inst. 3 3.5 0 0.0 3 0.7wb Financial institution 15 17.4 15 4.3 30 6.9wc Thai corporation 7 8.1 24 6.9 31 7.2wv Widely-held various groups 20 23.3 61 17.6 81 18.7W Widely-held 45 52.3 100 28.8 145 33.5xb Foreign finance institution 19 22.1 10 2.9 29 6.7xc Foreign corporation 2 2.3 59 17.0 61 14.1X Foreign-owned 21 24.4 69 19.9 90 20.8s State or State enterprise 6 7.0 9 2.6 15 3.5
Total 86 100.0 347 100.0 433 100.0Family-owned (A)+(B) 14 16.3 169 48.7 183 42.3
(2) Change in Ownership between 1996 and 2000 20% Cutoff Level (N=433)Type of Shareholders Total 1996 % Total 2000 % Change
f1 Owner family member 55 12.3 51 11.8 -4f2 Owner investment company 35 7.8 32 7.4 -3f4 Owner-controlled company 55 12.3 43 9.9 -12f5 Multiple family member 5 1.1 5 1.2 0F Family-owned (A) 150 33.5 131 30.3 -19
fw1 Single family 58 12.9 44 10.2 -14fw2 Multiple families 8 1.8 8 1.8 0FW Semifamily-owned (B) 66 14.7 52 12.0 -14wb1 Owner family financial inst. 8 1.8 3 0.7 -5wb Financial institution 29 6.5 30 6.9 1wc Thai corporation 30 6.7 31 7.2 1wv Widely-held various groups 93 20.8 81 18.7 -12W Widely-held 160 35.7 145 33.5 -15xb Foreign financial institution 11 2.5 29 6.7 18xc Foreign corporation 48 10.7 61 14.1 13X Foreign-owned 59 13.2 90 20.8 31s State or State enterprise 13 2.9 15 3.5 2
Total 448 100.0 433 100.0 -15Family-owned (A)+(B) 216 48.2 183 42.3 -33
Note: Suehiro survey on the basis of SET Company Documents in 1997 and March 2000.
37
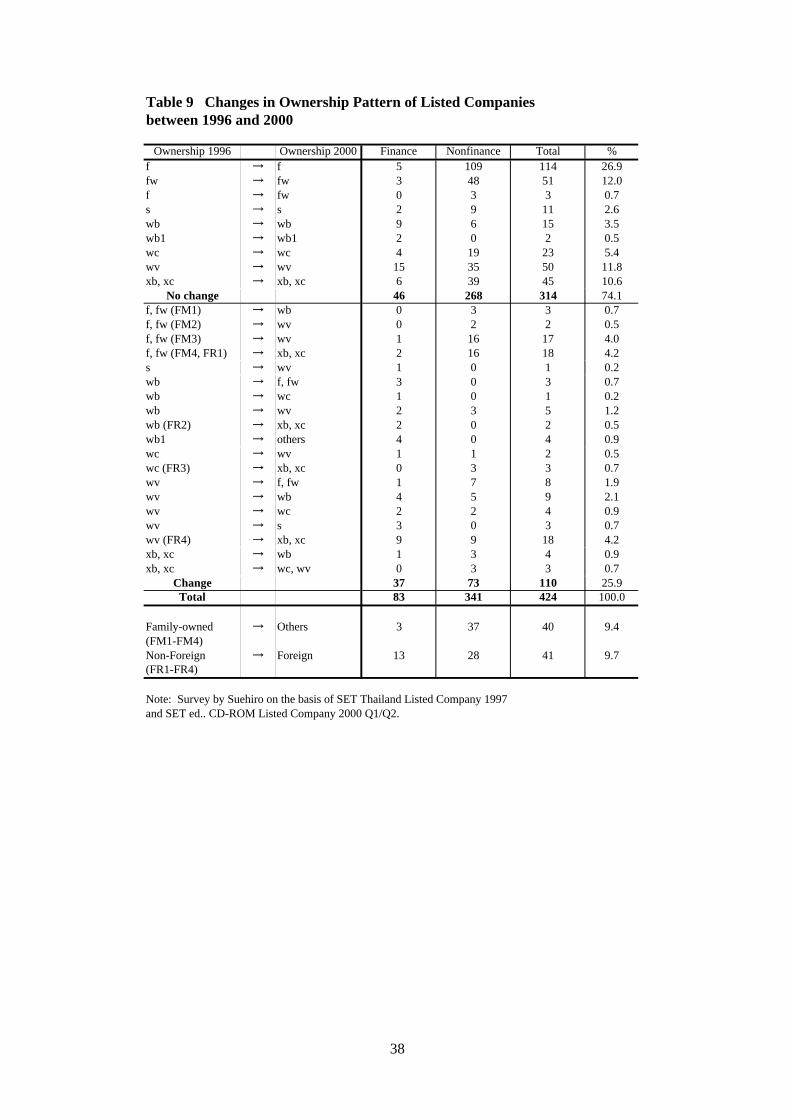
Table 9 Changes in Ownership Pattern of Listed Companies between 1996 and 2000
Ownership 1996 Ownership 2000 Finance Nonfinance Total %f → f 5 109 114 26.9fw → fw 3 48 51 12.0f → fw 0 3 3 0.7s → s 2 9 11 2.6wb → wb 9 6 15 3.5wb1 → wb1 2 0 2 0.5wc → wc 4 19 23 5.4wv → wv 15 35 50 11.8xb, xc → xb, xc 6 39 45 10.6
No change 46 268 314 74.1f, fw (FM1) → wb 0 3 3 0.7f, fw (FM2) → wv 0 2 2 0.5f, fw (FM3) → wv 1 16 17 4.0f, fw (FM4, FR1) → xb, xc 2 16 18 4.2s → wv 1 0 1 0.2wb → f, fw 3 0 3 0.7wb → wc 1 0 1 0.2wb → wv 2 3 5 1.2wb (FR2) → xb, xc 2 0 2 0.5wb1 → others 4 0 4 0.9wc → wv 1 1 2 0.5wc (FR3) → xb, xc 0 3 3 0.7wv → f, fw 1 7 8 1.9wv → wb 4 5 9 2.1wv → wc 2 2 4 0.9wv → s 3 0 3 0.7wv (FR4) → xb, xc 9 9 18 4.2xb, xc → wb 1 3 4 0.9xb, xc → wc, wv 0 3 3 0.7
Change 37 73 110 25.9Total 83 341 424 100.0
Family-owned → Others 3 37 40 9.4(FM1-FM4)Non-Foreign → Foreign 13 28 41 9.7(FR1-FR4)
Note: Survey by Suehiro on the basis of SET Thailand Listed Company 1997 and SET ed.. CD-ROM Listed Company 2000 Q1/Q2.
38
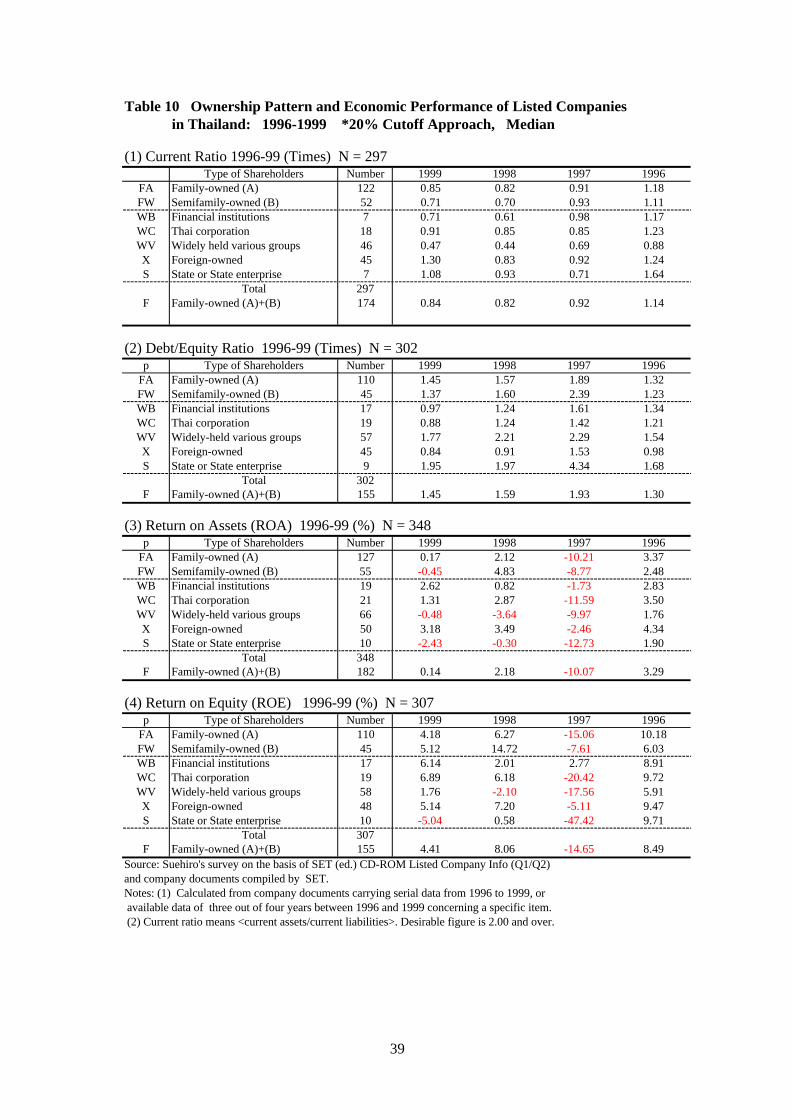
Table 10 Ownership Pattern and Economic Performance of Listed Companies in Thailand: 1996-1999 *20% Cutoff Approach, Median
(1) Current Ratio 1996-99 (Times) N = 297Type of Shareholders Number 1999 1998 1997 1996
FA Family-owned (A) 122 0.85 0.82 0.91 1.18FW Semifamily-owned (B) 52 0.71 0.70 0.93 1.11WB Financial institutions 7 0.71 0.61 0.98 1.17WC Thai corporation 18 0.91 0.85 0.85 1.23WV Widely held various groups 46 0.47 0.44 0.69 0.88X Foreign-owned 45 1.30 0.83 0.92 1.24S State or State enterprise 7 1.08 0.93 0.71 1.64
Total 297F Family-owned (A)+(B) 174 0.84 0.82 0.92 1.14
(2) Debt/Equity Ratio 1996-99 (Times) N = 302p Type of Shareholders Number 1999 1998 1997 1996
FA Family-owned (A) 110 1.45 1.57 1.89 1.32FW Semifamily-owned (B) 45 1.37 1.60 2.39 1.23WB Financial institutions 17 0.97 1.24 1.61 1.34WC Thai corporation 19 0.88 1.24 1.42 1.21WV Widely-held various groups 57 1.77 2.21 2.29 1.54X Foreign-owned 45 0.84 0.91 1.53 0.98S State or State enterprise 9 1.95 1.97 4.34 1.68
Total 302F Family-owned (A)+(B) 155 1.45 1.59 1.93 1.30
(3) Return on Assets (ROA) 1996-99 (%) N = 348p Type of Shareholders Number 1999 1998 1997 1996
FA Family-owned (A) 127 0.17 2.12 -10.21 3.37FW Semifamily-owned (B) 55 -0.45 4.83 -8.77 2.48WB Financial institutions 19 2.62 0.82 -1.73 2.83WC Thai corporation 21 1.31 2.87 -11.59 3.50WV Widely-held various groups 66 -0.48 -3.64 -9.97 1.76X Foreign-owned 50 3.18 3.49 -2.46 4.34S State or State enterprise 10 -2.43 -0.30 -12.73 1.90
Total 348F Family-owned (A)+(B) 182 0.14 2.18 -10.07 3.29
(4) Return on Equity (ROE) 1996-99 (%) N = 307p Type of Shareholders Number 1999 1998 1997 1996
FA Family-owned (A) 110 4.18 6.27 -15.06 10.18FW Semifamily-owned (B) 45 5.12 14.72 -7.61 6.03WB Financial institutions 17 6.14 2.01 2.77 8.91WC Thai corporation 19 6.89 6.18 -20.42 9.72WV Widely-held various groups 58 1.76 -2.10 -17.56 5.91X Foreign-owned 48 5.14 7.20 -5.11 9.47S State or State enterprise 10 -5.04 0.58 -47.42 9.71
Total 307F Family-owned (A)+(B) 155 4.41 8.06 -14.65 8.49
Source: Suehiro's survey on the basis of SET (ed.) CD-ROM Listed Company Info (Q1/Q2) and company documents compiled by SET.Notes: (1) Calculated from company documents carrying serial data from 1996 to 1999, or available data of three out of four years between 1996 and 1999 concerning a specific item. (2) Current ratio means <current assets/current liabilities>. Desirable figure is 2.00 and over.
39
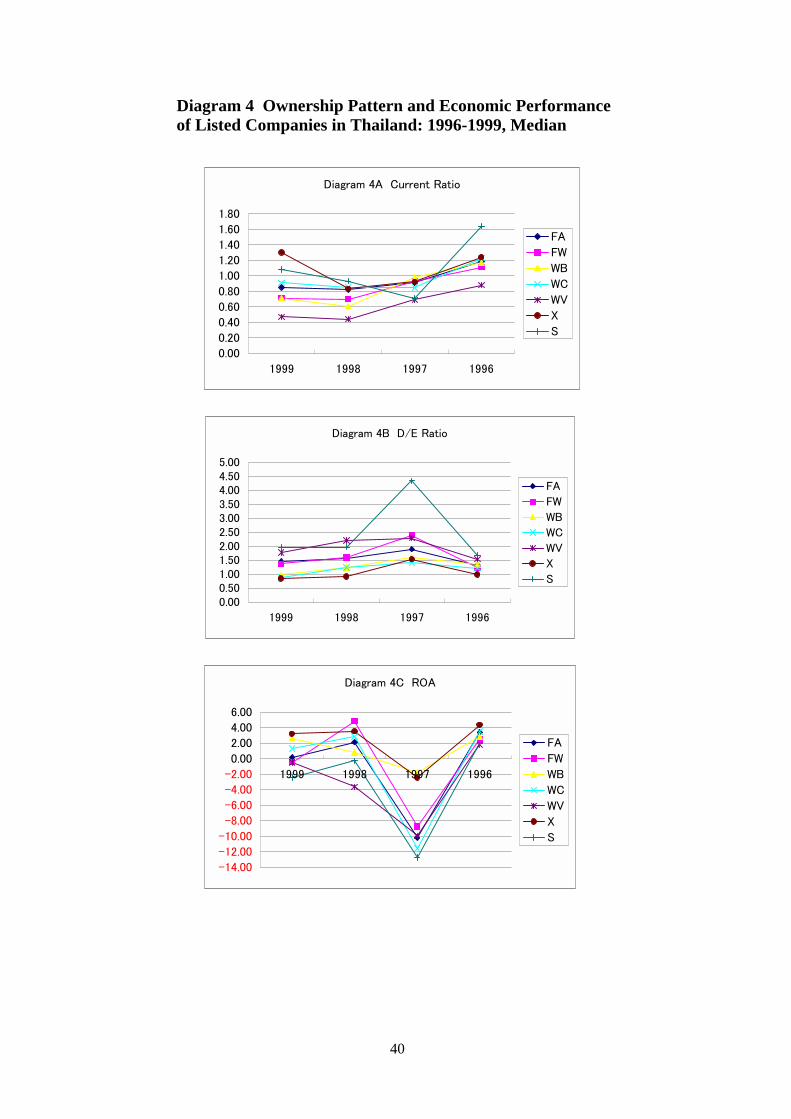
Diagram 4 Ownership Pattern and Economic Performance of Listed Companies in Thailand: 1996-1999, Median
Diagram 4C ROA
-14.00
-12.00
-10.00
-8.00
-6.00
-4.00
-2.00
0.00
2.00
4.00
6.00
1999 1998 1997 1996
FA
FW
WB
WC
WV
X
S
Diagram 4A Current Ratio
0.00
0.20
0.40
0.60
0.80
1.00
1.20
1.40
1.60
1.80
1999 1998 1997 1996
FA
FW
WB
WC
WV
X
S
Diagram 4B D/E Ratio
0.000.501.001.502.002.503.003.504.004.505.00
1999 1998 1997 1996
FA
FW
WB
WC
WV
X
S
40
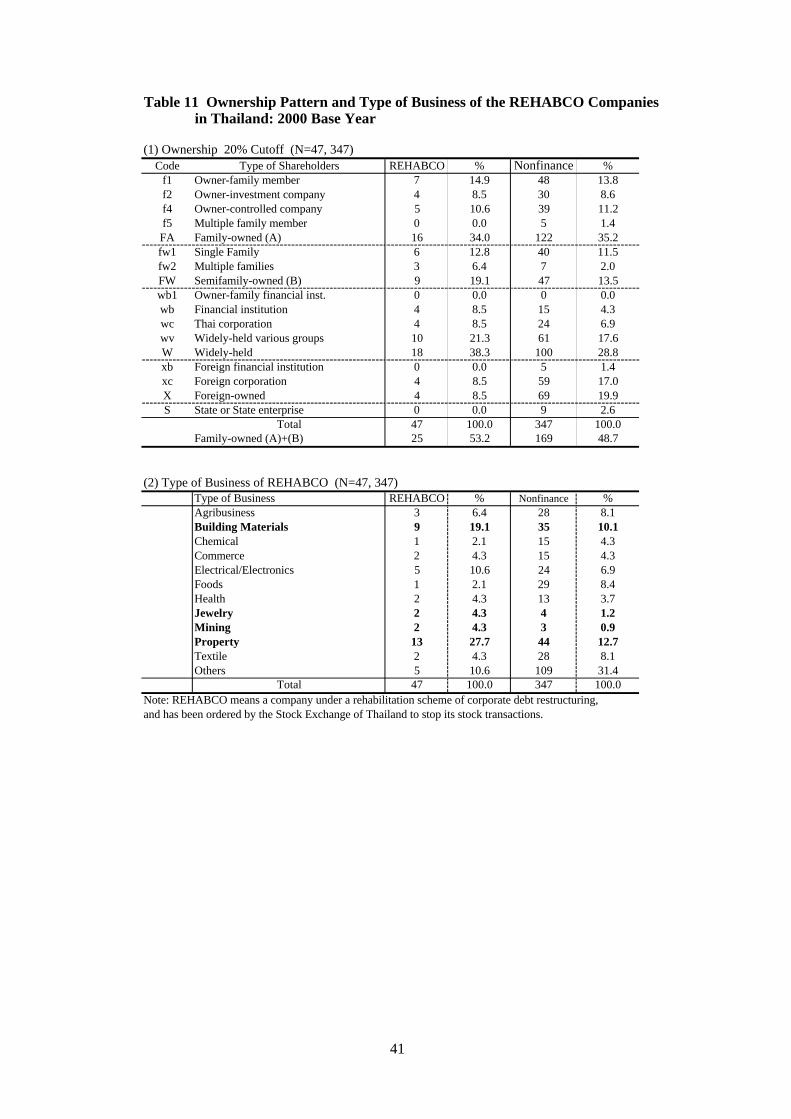
Table 11 Ownership Pattern and Type of Business of the REHABCO Companies in Thailand: 2000 Base Year
(1) Ownership 20% Cutoff (N=47, 347)Code Type of Shareholders REHABCO % Nonfinance %
f1 Owner-family member 7 14.9 48 13.8f2 Owner-investment company 4 8.5 30 8.6f4 Owner-controlled company 5 10.6 39 11.2f5 Multiple family member 0 0.0 5 1.4FA Family-owned (A) 16 34.0 122 35.2fw1 Single Family 6 12.8 40 11.5fw2 Multiple families 3 6.4 7 2.0FW Semifamily-owned (B) 9 19.1 47 13.5wb1 Owner-family financial inst. 0 0.0 0 0.0wb Financial institution 4 8.5 15 4.3wc Thai corporation 4 8.5 24 6.9wv Widely-held various groups 10 21.3 61 17.6W Widely-held 18 38.3 100 28.8xb Foreign financial institution 0 0.0 5 1.4xc Foreign corporation 4 8.5 59 17.0X Foreign-owned 4 8.5 69 19.9S State or State enterprise 0 0.0 9 2.6
Total 47 100.0 347 100.0Family-owned (A)+(B) 25 53.2 169 48.7
(2) Type of Business of REHABCO (N=47, 347)Type of Business REHABCO % Nonfinance %Agribusiness 3 6.4 28 8.1Building Materials 9 19.1 35 10.1Chemical 1 2.1 15 4.3Commerce 2 4.3 15 4.3Electrical/Electronics 5 10.6 24 6.9Foods 1 2.1 29 8.4Health 2 4.3 13 3.7Jewelry 2 4.3 4 1.2Mining 2 4.3 3 0.9Property 13 27.7 44 12.7Textile 2 4.3 28 8.1Others 5 10.6 109 31.4
Total 47 100.0 347 100.0Note: REHABCO means a company under a rehabilitation scheme of corporate debt restructuring, and has been ordered by the Stock Exchange of Thailand to stop its stock transactions.
41
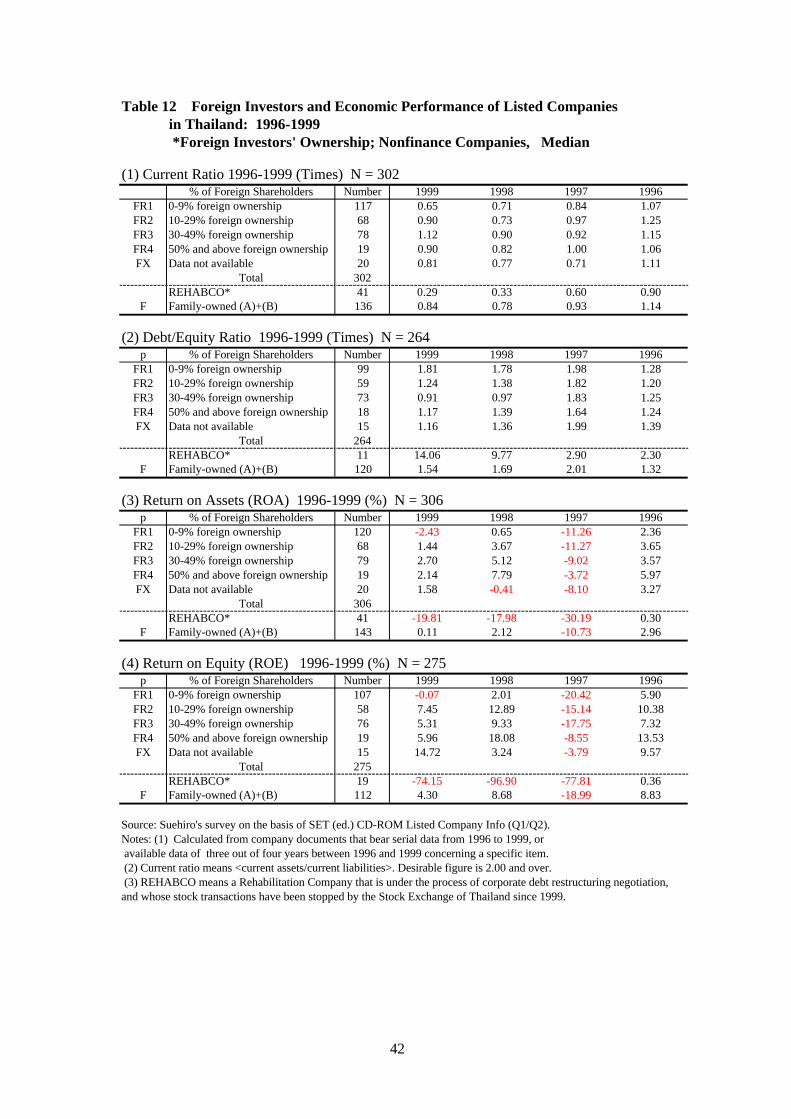
Table 12 Foreign Investors and Economic Performance of Listed Companies in Thailand: 1996-1999 *Foreign Investors' Ownership; Nonfinance Companies, Median
(1) Current Ratio 1996-1999 (Times) N = 302% of Foreign Shareholders Number 1999 1998 1997 1996
FR1 0-9% foreign ownership 117 0.65 0.71 0.84 1.07FR2 10-29% foreign ownership 68 0.90 0.73 0.97 1.25FR3 30-49% foreign ownership 78 1.12 0.90 0.92 1.15FR4 50% and above foreign ownership 19 0.90 0.82 1.00 1.06FX Data not available 20 0.81 0.77 0.71 1.11
Total 302REHABCO* 41 0.29 0.33 0.60 0.90
F Family-owned (A)+(B) 136 0.84 0.78 0.93 1.14
(2) Debt/Equity Ratio 1996-1999 (Times) N = 264p % of Foreign Shareholders Number 1999 1998 1997 1996
FR1 0-9% foreign ownership 99 1.81 1.78 1.98 1.28FR2 10-29% foreign ownership 59 1.24 1.38 1.82 1.20FR3 30-49% foreign ownership 73 0.91 0.97 1.83 1.25FR4 50% and above foreign ownership 18 1.17 1.39 1.64 1.24FX Data not available 15 1.16 1.36 1.99 1.39
Total 264REHABCO* 11 14.06 9.77 2.90 2.30
F Family-owned (A)+(B) 120 1.54 1.69 2.01 1.32
(3) Return on Assets (ROA) 1996-1999 (%) N = 306p % of Foreign Shareholders Number 1999 1998 1997 1996
FR1 0-9% foreign ownership 120 -2.43 0.65 -11.26 2.36FR2 10-29% foreign ownership 68 1.44 3.67 -11.27 3.65FR3 30-49% foreign ownership 79 2.70 5.12 -9.02 3.57FR4 50% and above foreign ownership 19 2.14 7.79 -3.72 5.97FX Data not available 20 1.58 -0.41 -8.10 3.27
Total 306REHABCO* 41 -19.81 -17.98 -30.19 0.30
F Family-owned (A)+(B) 143 0.11 2.12 -10.73 2.96
(4) Return on Equity (ROE) 1996-1999 (%) N = 275p % of Foreign Shareholders Number 1999 1998 1997 1996
FR1 0-9% foreign ownership 107 -0.07 2.01 -20.42 5.90FR2 10-29% foreign ownership 58 7.45 12.89 -15.14 10.38FR3 30-49% foreign ownership 76 5.31 9.33 -17.75 7.32FR4 50% and above foreign ownership 19 5.96 18.08 -8.55 13.53FX Data not available 15 14.72 3.24 -3.79 9.57
Total 275REHABCO* 19 -74.15 -96.90 -77.81 0.36
F Family-owned (A)+(B) 112 4.30 8.68 -18.99 8.83
Source: Suehiro's survey on the basis of SET (ed.) CD-ROM Listed Company Info (Q1/Q2).Notes: (1) Calculated from company documents that bear serial data from 1996 to 1999, or available data of three out of four years between 1996 and 1999 concerning a specific item. (2) Current ratio means <current assets/current liabilities>. Desirable figure is 2.00 and over. (3) REHABCO means a Rehabilitation Company that is under the process of corporate debt restructuring negotiation, and whose stock transactions have been stopped by the Stock Exchange of Thailand since 1999.
42
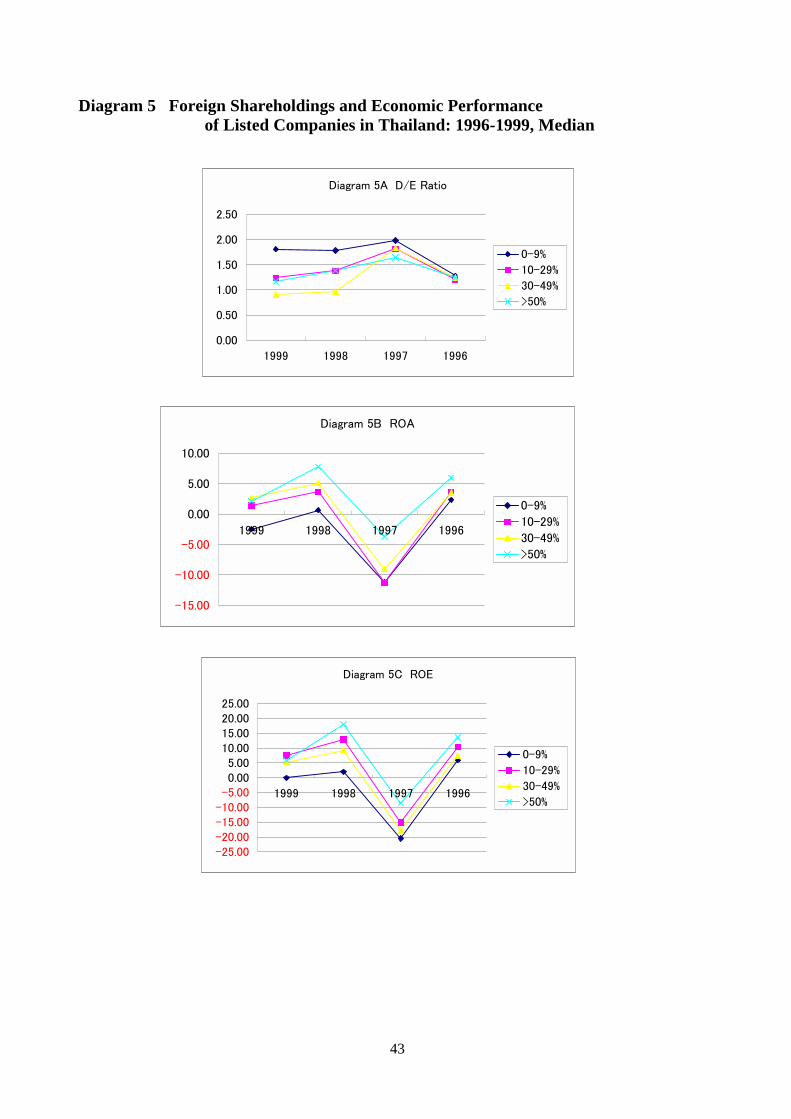
Diagram 5 Foreign Shareholdings and Economic Performance of Listed Companies in Thailand: 1996-1999, Median
Diagram 5A D/E Ratio
0.00
0.50
1.00
1.50
2.00
2.50
1999 1998 1997 1996
0-9%
10-29%
30-49%
>50%
Diagram 5B ROA
-15.00
-10.00
-5.00
0.00
5.00
10.00
1999 1998 1997 1996
0-9%
10-29%
30-49%
>50%
Diagram 5C ROE
-25.00-20.00-15.00-10.00-5.000.005.00
10.0015.0020.0025.00
1999 1998 1997 1996
0-9%
10-29%
30-49%
>50%
43
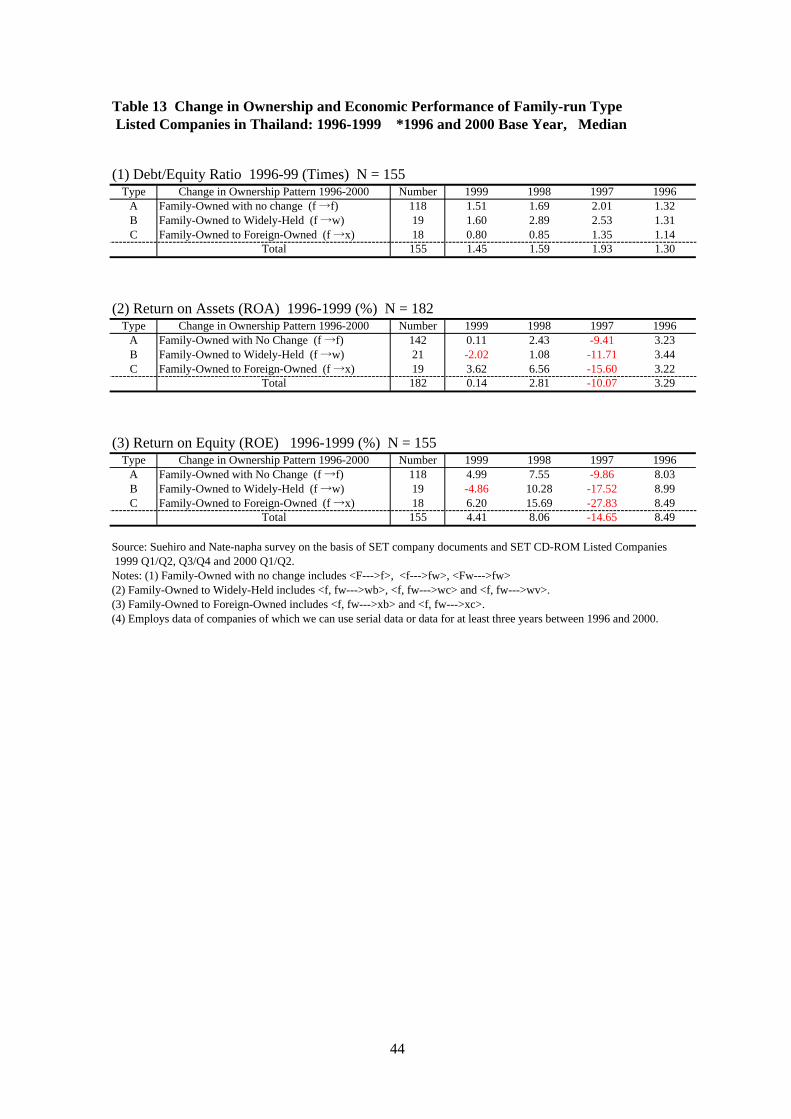
Table 13 Change in Ownership and Economic Performance of Family-run Type Listed Companies in Thailand: 1996-1999 *1996 and 2000 Base Year, Median
(1) Debt/Equity Ratio 1996-99 (Times) N = 155Type Change in Ownership Pattern 1996-2000 Number 1999 1998 1997 1996
A Family-Owned with no change (f →f) 118 1.51 1.69 2.01 1.32B Family-Owned to Widely-Held (f →w) 19 1.60 2.89 2.53 1.31C Family-Owned to Foreign-Owned (f →x) 18 0.80 0.85 1.35 1.14
Total 155 1.45 1.59 1.93 1.30
(2) Return on Assets (ROA) 1996-1999 (%) N = 182Type Change in Ownership Pattern 1996-2000 Number 1999 1998 1997 1996
A Family-Owned with No Change (f →f) 142 0.11 2.43 -9.41 3.23B Family-Owned to Widely-Held (f →w) 21 -2.02 1.08 -11.71 3.44C Family-Owned to Foreign-Owned (f →x) 19 3.62 6.56 -15.60 3.22
Total 182 0.14 2.81 -10.07 3.29
(3) Return on Equity (ROE) 1996-1999 (%) N = 155Type Change in Ownership Pattern 1996-2000 Number 1999 1998 1997 1996
A Family-Owned with No Change (f →f) 118 4.99 7.55 -9.86 8.03B Family-Owned to Widely-Held (f →w) 19 -4.86 10.28 -17.52 8.99C Family-Owned to Foreign-Owned (f →x) 18 6.20 15.69 -27.83 8.49
Total 155 4.41 8.06 -14.65 8.49
Source: Suehiro and Nate-napha survey on the basis of SET company documents and SET CD-ROM Listed Companies 1999 Q1/Q2, Q3/Q4 and 2000 Q1/Q2. Notes: (1) Family-Owned with no change includes <F--->f>, <f--->fw>, <Fw--->fw>(2) Family-Owned to Widely-Held includes <f, fw--->wb>, <f, fw--->wc> and <f, fw--->wv>.(3) Family-Owned to Foreign-Owned includes <f, fw--->xb> and <f, fw--->xc>.(4) Employs data of companies of which we can use serial data or data for at least three years between 1996 and 2000.
44
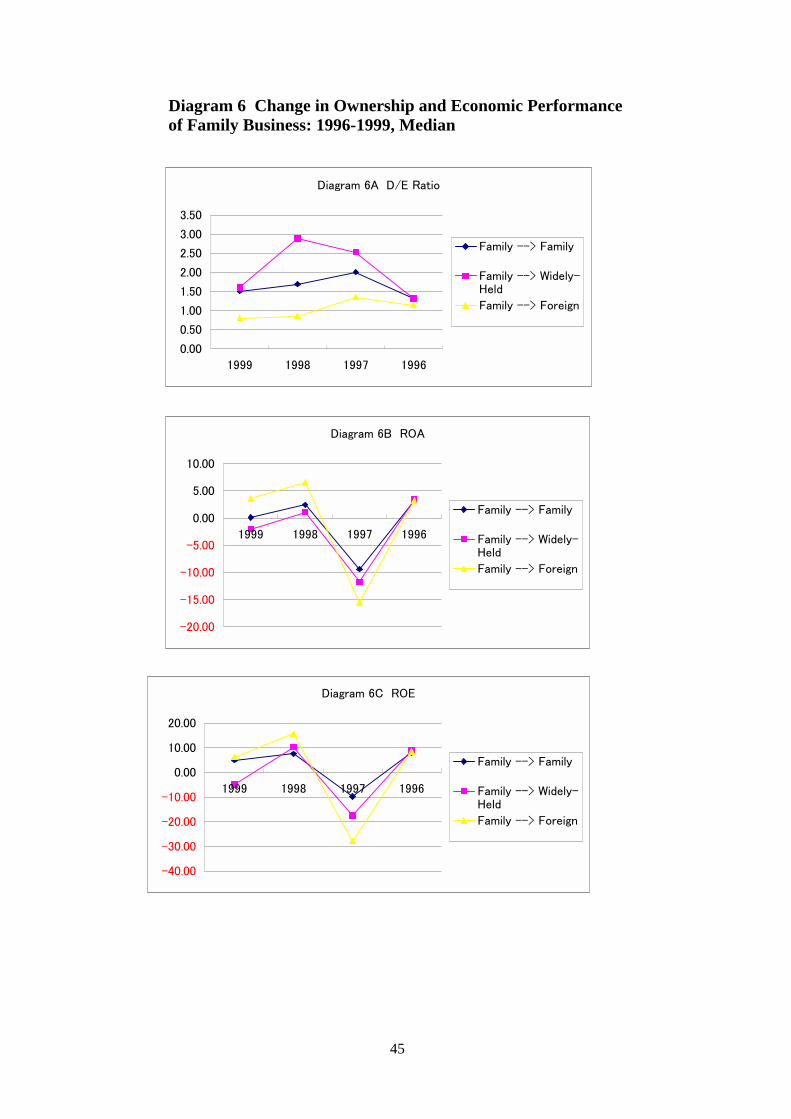
Diagram 6 Change in Ownership and Economic Performance of Family Business: 1996-1999, Median
Diagram 6A D/E Ratio
0.00
0.50
1.00
1.50
2.00
2.50
3.00
3.50
1999 1998 1997 1996
Family --> Family
Family --> Widely-Held
Family --> Foreign
Diagram 6B ROA
-20.00
-15.00
-10.00
-5.00
0.00
5.00
10.00
1999 1998 1997 1996
Family --> Family
Family --> Widely-Held
Family --> Foreign
Diagram 6C ROE
-40.00
-30.00
-20.00
-10.00
0.00
10.00
20.00
1999 1998 1997 1996
Family --> Family
Family --> Widely-Held
Family --> Foreign
45
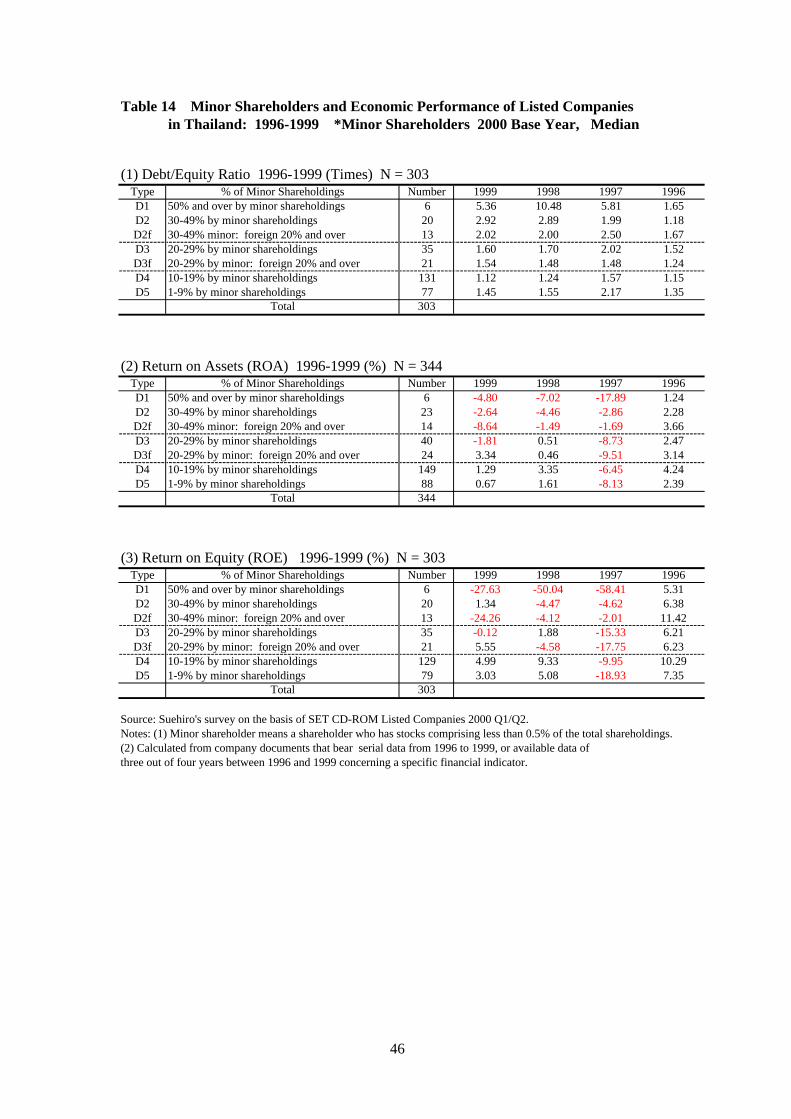
Table 14 Minor Shareholders and Economic Performance of Listed Companies in Thailand: 1996-1999 *Minor Shareholders 2000 Base Year, Median
(1) Debt/Equity Ratio 1996-1999 (Times) N = 303Type % of Minor Shareholdings Number 1999 1998 1997 1996D1 50% and over by minor shareholdings 6 5.36 10.48 5.81 1.65D2 30-49% by minor shareholdings 20 2.92 2.89 1.99 1.18D2f 30-49% minor: foreign 20% and over 13 2.02 2.00 2.50 1.67D3 20-29% by minor shareholdings 35 1.60 1.70 2.02 1.52D3f 20-29% by minor: foreign 20% and over 21 1.54 1.48 1.48 1.24D4 10-19% by minor shareholdings 131 1.12 1.24 1.57 1.15D5 1-9% by minor shareholdings 77 1.45 1.55 2.17 1.35
Total 303
(2) Return on Assets (ROA) 1996-1999 (%) N = 344Type % of Minor Shareholdings Number 1999 1998 1997 1996D1 50% and over by minor shareholdings 6 -4.80 -7.02 -17.89 1.24D2 30-49% by minor shareholdings 23 -2.64 -4.46 -2.86 2.28D2f 30-49% minor: foreign 20% and over 14 -8.64 -1.49 -1.69 3.66D3 20-29% by minor shareholdings 40 -1.81 0.51 -8.73 2.47D3f 20-29% by minor: foreign 20% and over 24 3.34 0.46 -9.51 3.14D4 10-19% by minor shareholdings 149 1.29 3.35 -6.45 4.24D5 1-9% by minor shareholdings 88 0.67 1.61 -8.13 2.39
Total 344
(3) Return on Equity (ROE) 1996-1999 (%) N = 303Type % of Minor Shareholdings Number 1999 1998 1997 1996D1 50% and over by minor shareholdings 6 -27.63 -50.04 -58.41 5.31D2 30-49% by minor shareholdings 20 1.34 -4.47 -4.62 6.38D2f 30-49% minor: foreign 20% and over 13 -24.26 -4.12 -2.01 11.42D3 20-29% by minor shareholdings 35 -0.12 1.88 -15.33 6.21D3f 20-29% by minor: foreign 20% and over 21 5.55 -4.58 -17.75 6.23D4 10-19% by minor shareholdings 129 4.99 9.33 -9.95 10.29D5 1-9% by minor shareholdings 79 3.03 5.08 -18.93 7.35
Total 303
Source: Suehiro's survey on the basis of SET CD-ROM Listed Companies 2000 Q1/Q2. Notes: (1) Minor shareholder means a shareholder who has stocks comprising less than 0.5% of the total shareholdings.(2) Calculated from company documents that bear serial data from 1996 to 1999, or available data ofthree out of four years between 1996 and 1999 concerning a specific financial indicator.
46
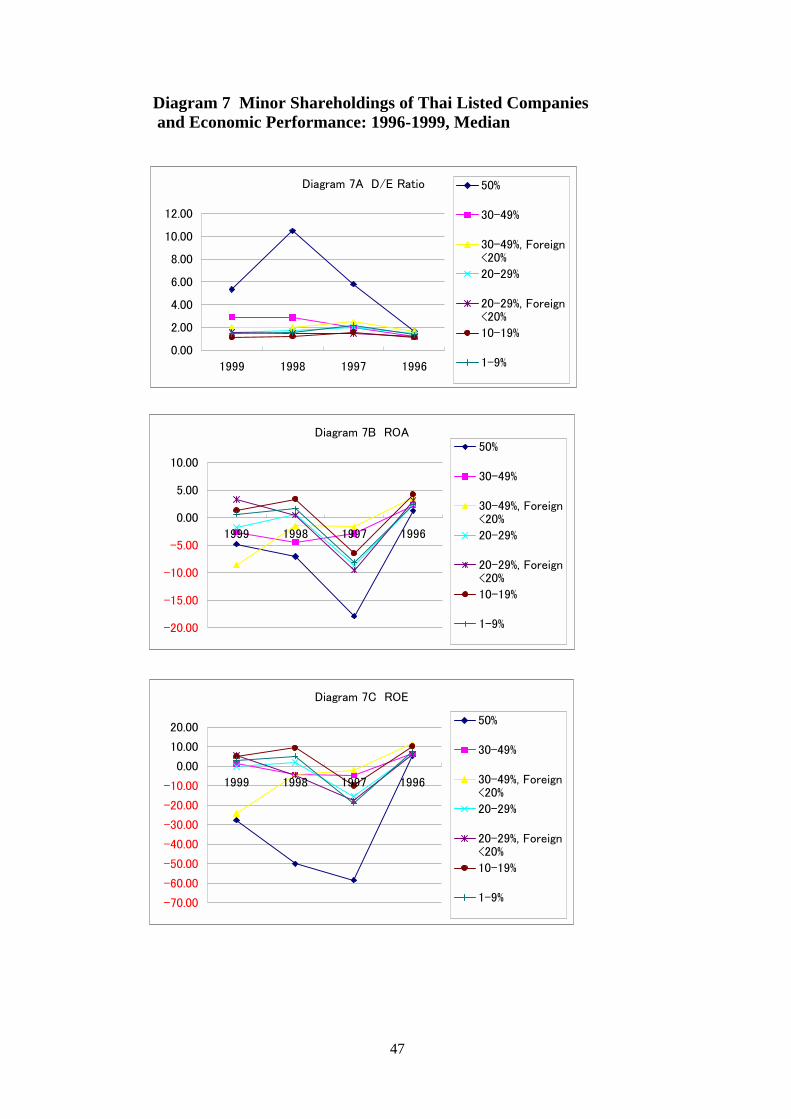
Diagram 7 Minor Shareholdings of Thai Listed Companies and Economic Performance: 1996-1999, Median
Diagram 7A D/E Ratio
0.00
2.00
4.00
6.00
8.00
10.00
12.00
1999 1998 1997 1996
50%
30-49%
30-49%, Foreign<20%
20-29%
20-29%, Foreign<20%
10-19%
1-9%
Diagram 7B ROA
-20.00
-15.00
-10.00
-5.00
0.00
5.00
10.00
1999 1998 1997 1996
50%
30-49%
30-49%, Foreign<20%
20-29%
20-29%, Foreign<20%
10-19%
1-9%
Diagram 7C ROE
-70.00
-60.00
-50.00
-40.00
-30.00
-20.00
-10.00
0.00
10.00
20.00
1999 1998 1997 1996
50%
30-49%
30-49%, Foreign<20%
20-29%
20-29%, Foreign<20%
10-19%
1-9%
47
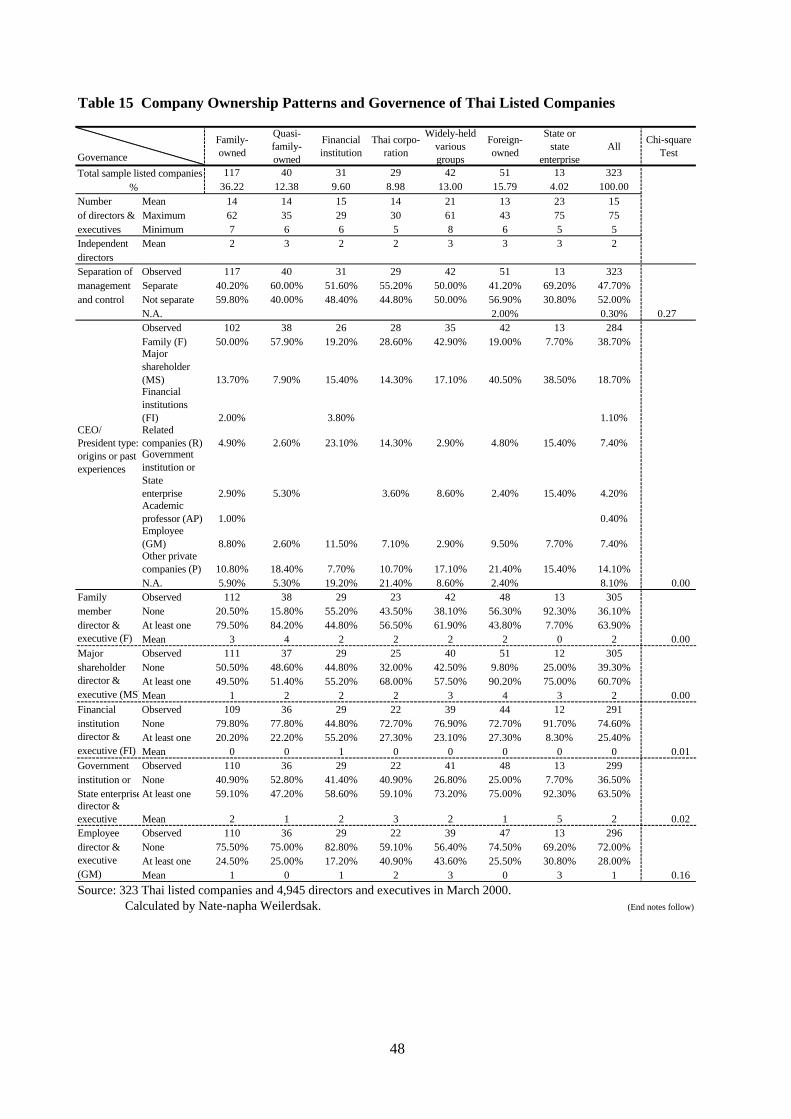
Table 15 Company Ownership Patterns and Governence of Thai Listed Companies
Family-owned
Quasi-family-owned
Financialinstitution
Thai corpo-ration
Widely-heldvariousgroups
Foreign-owned
State orstate
enterpriseAll
Chi-squareTest
Total sample listed companies 117 40 31 29 42 51 13 323% 36.22 12.38 9.60 8.98 13.00 15.79 4.02 100.00
Number Mean 14 14 15 14 21 13 23 15of directors & Maximum 62 35 29 30 61 43 75 75executives Minimum 7 6 6 5 8 6 5 5Independent Mean 2 3 2 2 3 3 3 2directorsSeparation of Observed 117 40 31 29 42 51 13 323management Separate 40.20% 60.00% 51.60% 55.20% 50.00% 41.20% 69.20% 47.70%and control Not separate 59.80% 40.00% 48.40% 44.80% 50.00% 56.90% 30.80% 52.00%
N.A. 2.00% 0.30% 0.27Observed 102 38 26 28 35 42 13 284Family (F) 50.00% 57.90% 19.20% 28.60% 42.90% 19.00% 7.70% 38.70%Majorshareholder(MS) 13.70% 7.90% 15.40% 14.30% 17.10% 40.50% 38.50% 18.70%Financialinstitutions(FI) 2.00% 3.80% 1.10%
CEO/President type:
Relatedcompanies (R) 4.90% 2.60% 23.10% 14.30% 2.90% 4.80% 15.40% 7.40%
origins or pastexperiences
Governmentinstitution orStateenterprise 2.90% 5.30% 3.60% 8.60% 2.40% 15.40% 4.20%Academicprofessor (AP) 1.00% 0.40%Employee(GM) 8.80% 2.60% 11.50% 7.10% 2.90% 9.50% 7.70% 7.40%Other privatecompanies (P) 10.80% 18.40% 7.70% 10.70% 17.10% 21.40% 15.40% 14.10%N.A. 5.90% 5.30% 19.20% 21.40% 8.60% 2.40% 8.10% 0.00
Family Observed 112 38 29 23 42 48 13 305member None 20.50% 15.80% 55.20% 43.50% 38.10% 56.30% 92.30% 36.10%director & At least one 79.50% 84.20% 44.80% 56.50% 61.90% 43.80% 7.70% 63.90%executive (F) Mean 3 4 2 2 2 2 0 2 0.00Major Observed 111 37 29 25 40 51 12 305shareholder None 50.50% 48.60% 44.80% 32.00% 42.50% 9.80% 25.00% 39.30%director & At least one 49.50% 51.40% 55.20% 68.00% 57.50% 90.20% 75.00% 60.70%executive (MS)Mean 1 2 2 2 3 4 3 2 0.00Financial Observed 109 36 29 22 39 44 12 291institution None 79.80% 77.80% 44.80% 72.70% 76.90% 72.70% 91.70% 74.60%director & At least one 20.20% 22.20% 55.20% 27.30% 23.10% 27.30% 8.30% 25.40%executive (FI) Mean 0 0 1 0 0 0 0 0 0.01Government Observed 110 36 29 22 41 48 13 299institution or None 40.90% 52.80% 41.40% 40.90% 26.80% 25.00% 7.70% 36.50%State enterpriseAt least one 59.10% 47.20% 58.60% 59.10% 73.20% 75.00% 92.30% 63.50%director &executive Mean 2 1 2 3 2 1 5 2 0.02Employee Observed 110 36 29 22 39 47 13 296director & None 75.50% 75.00% 82.80% 59.10% 56.40% 74.50% 69.20% 72.00%executive At least one 24.50% 25.00% 17.20% 40.90% 43.60% 25.50% 30.80% 28.00%(GM) Mean 1 0 1 2 3 0 3 1 0.16
Source: 323 Thai listed companies and 4,945 directors and executives in March 2000. Calculated by Nate-napha Weilerdsak. (End notes follow)
Governance
48
Table 15 End Notes: Definitions and Explanations
The ownership patterns have been broken into seven categories: family-owned, quasifamily-owned, financial institutions, Thai corporations, widely-held various group, foreign-owned, and State or State enterprise-owned companies (see Suehiro).Observed: indicates the number of companies observed in each cross tabulation. The percentages show the proportion of cases. The last column presents the significant level of the chi-square statistic associated with each cross-tabulation. In some instances (separation of management and control, employee executive & director), there are no relationships between the applications to ownership patterns.
Definition of Variables:1) Number of directors and executives = Average, maximum and minimum of directors and executives per company.2) Independent directors, or outside directors are directors who do not have any relations with major shareholders, managements and concerned persons, and hold less than 0.5% shares of the company. At least two independent directors are required under the SET rule. In the table, independent directors who are currently occupying other positions (i.e., chairperson, vice-chairperson, audit committee) are included.3) Separation between management and control; 0 = company not separate; 1 = company separate4) CEO/President type = the origin or past exeperience of CEO; F = family member; MS = major shareholder; FI = financial institution; R = related company; GV = government institution or State enterprise; AP = academic professor; GM = employee; P = employed professional or from other private company CEO/President currently occupying other positions (i.e., chairperson, vice-chairperson, chairperson of executive board) are included.A number of companies having at least one director and executive from ---5) family-member (including those who have either blood relation or kinship with the family founders or shareholders); 0 = none; 1 = existing6) major shareholders (nonfamily); 0 = none; 1 = existing 7) financial institutions; 0 = none; 1 = existing8) government institutions or State enterprises; 0 = none; 1 = existing9) employees (including internally-promoted genuine employee and mid-career employee) ; 0 = none; 1 = existingAnd mean figures show the average number of such directors and executives per company.
49
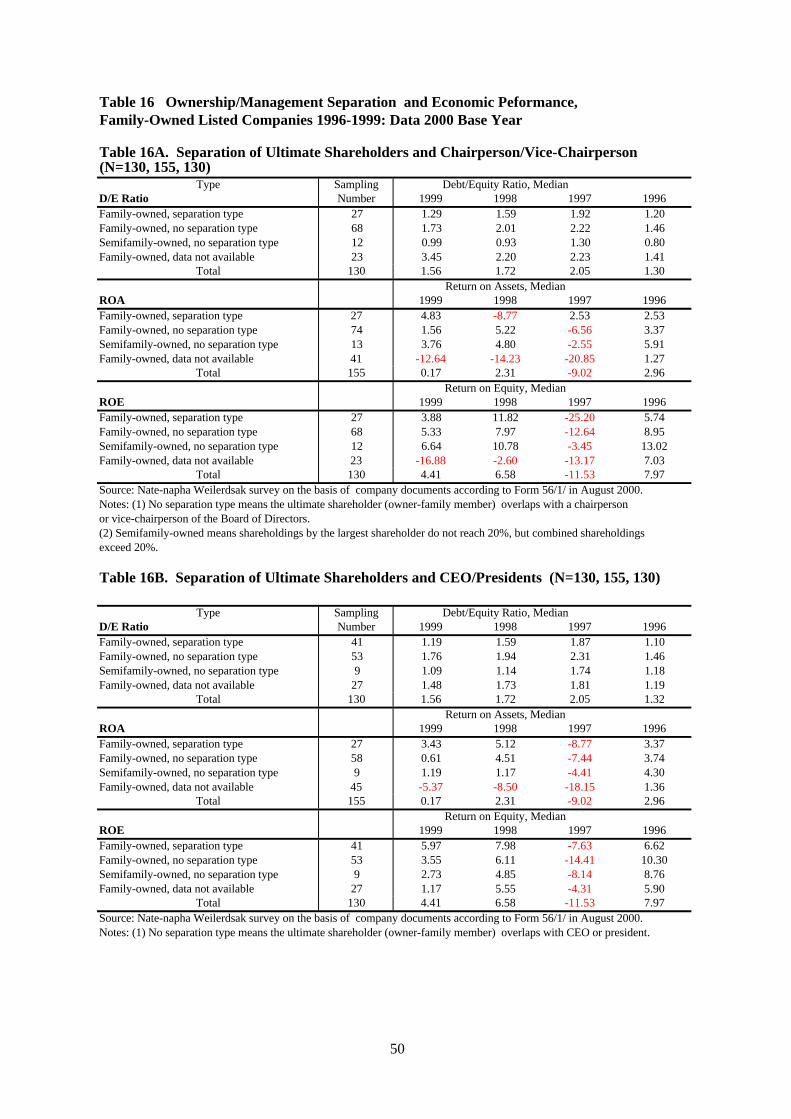
Table 16 Ownership/Management Separation and Economic Peformance, Family-Owned Listed Companies 1996-1999: Data 2000 Base Year
Table 16A. Separation of Ultimate Shareholders and Chairperson/Vice-Chairperson (N=130, 155, 130)
Type Sampling Debt/Equity Ratio, MedianD/E Ratio Number 1999 1998 1997 1996Family-owned, separation type 27 1.29 1.59 1.92 1.20Family-owned, no separation type 68 1.73 2.01 2.22 1.46Semifamily-owned, no separation type 12 0.99 0.93 1.30 0.80Family-owned, data not available 23 3.45 2.20 2.23 1.41
Total 130 1.56 1.72 2.05 1.30Return on Assets, Median
ROA 1999 1998 1997 1996Family-owned, separation type 27 4.83 -8.77 2.53 2.53Family-owned, no separation type 74 1.56 5.22 -6.56 3.37Semifamily-owned, no separation type 13 3.76 4.80 -2.55 5.91Family-owned, data not available 41 -12.64 -14.23 -20.85 1.27
Total 155 0.17 2.31 -9.02 2.96Return on Equity, Median
ROE 1999 1998 1997 1996Family-owned, separation type 27 3.88 11.82 -25.20 5.74Family-owned, no separation type 68 5.33 7.97 -12.64 8.95Semifamily-owned, no separation type 12 6.64 10.78 -3.45 13.02Family-owned, data not available 23 -16.88 -2.60 -13.17 7.03
Total 130 4.41 6.58 -11.53 7.97Source: Nate-napha Weilerdsak survey on the basis of company documents according to Form 56/1/ in August 2000.Notes: (1) No separation type means the ultimate shareholder (owner-family member) overlaps with a chairperson or vice-chairperson of the Board of Directors.(2) Semifamily-owned means shareholdings by the largest shareholder do not reach 20%, but combined shareholdingsexceed 20%.
Table 16B. Separation of Ultimate Shareholders and CEO/Presidents (N=130, 155, 130)
Type Sampling Debt/Equity Ratio, MedianD/E Ratio Number 1999 1998 1997 1996Family-owned, separation type 41 1.19 1.59 1.87 1.10Family-owned, no separation type 53 1.76 1.94 2.31 1.46Semifamily-owned, no separation type 9 1.09 1.14 1.74 1.18Family-owned, data not available 27 1.48 1.73 1.81 1.19
Total 130 1.56 1.72 2.05 1.32Return on Assets, Median
ROA 1999 1998 1997 1996Family-owned, separation type 27 3.43 5.12 -8.77 3.37Family-owned, no separation type 58 0.61 4.51 -7.44 3.74Semifamily-owned, no separation type 9 1.19 1.17 -4.41 4.30Family-owned, data not available 45 -5.37 -8.50 -18.15 1.36
Total 155 0.17 2.31 -9.02 2.96Return on Equity, Median
ROE 1999 1998 1997 1996Family-owned, separation type 41 5.97 7.98 -7.63 6.62Family-owned, no separation type 53 3.55 6.11 -14.41 10.30Semifamily-owned, no separation type 9 2.73 4.85 -8.14 8.76Family-owned, data not available 27 1.17 5.55 -4.31 5.90
Total 130 4.41 6.58 -11.53 7.97Source: Nate-napha Weilerdsak survey on the basis of company documents according to Form 56/1/ in August 2000.Notes: (1) No separation type means the ultimate shareholder (owner-family member) overlaps with CEO or president.
50
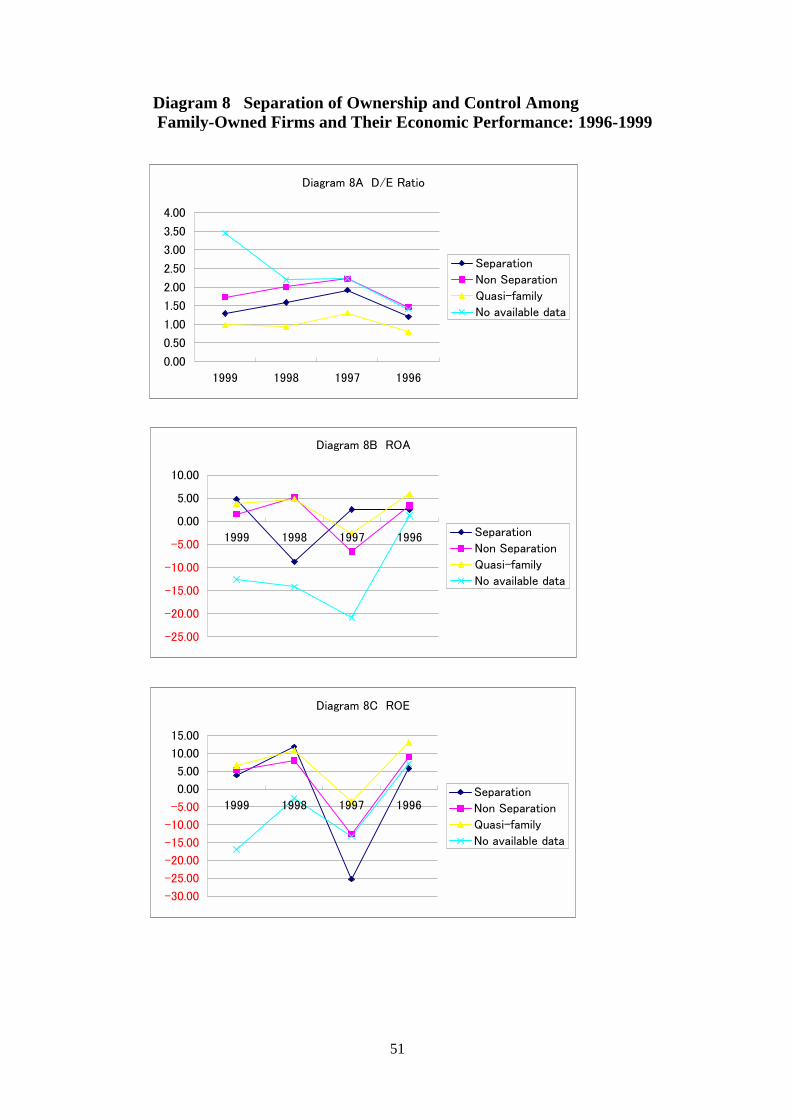
Diagram 8 Separation of Ownership and Control Among Family-Owned Firms and Their Economic Performance: 1996-1999
Diagram 8A D/E Ratio
0.00
0.50
1.00
1.50
2.00
2.50
3.00
3.50
4.00
1999 1998 1997 1996
Separation
Non Separation
Quasi-family
No available data
Diagram 8B ROA
-25.00
-20.00
-15.00
-10.00
-5.00
0.00
5.00
10.00
1999 1998 1997 1996 Separation
Non Separation
Quasi-family
No available data
Diagram 8C ROE
-30.00
-25.00
-20.00
-15.00
-10.00
-5.00
0.00
5.00
10.00
15.00
1999 1998 1997 1996Separation
Non Separation
Quasi-family
No available data
51
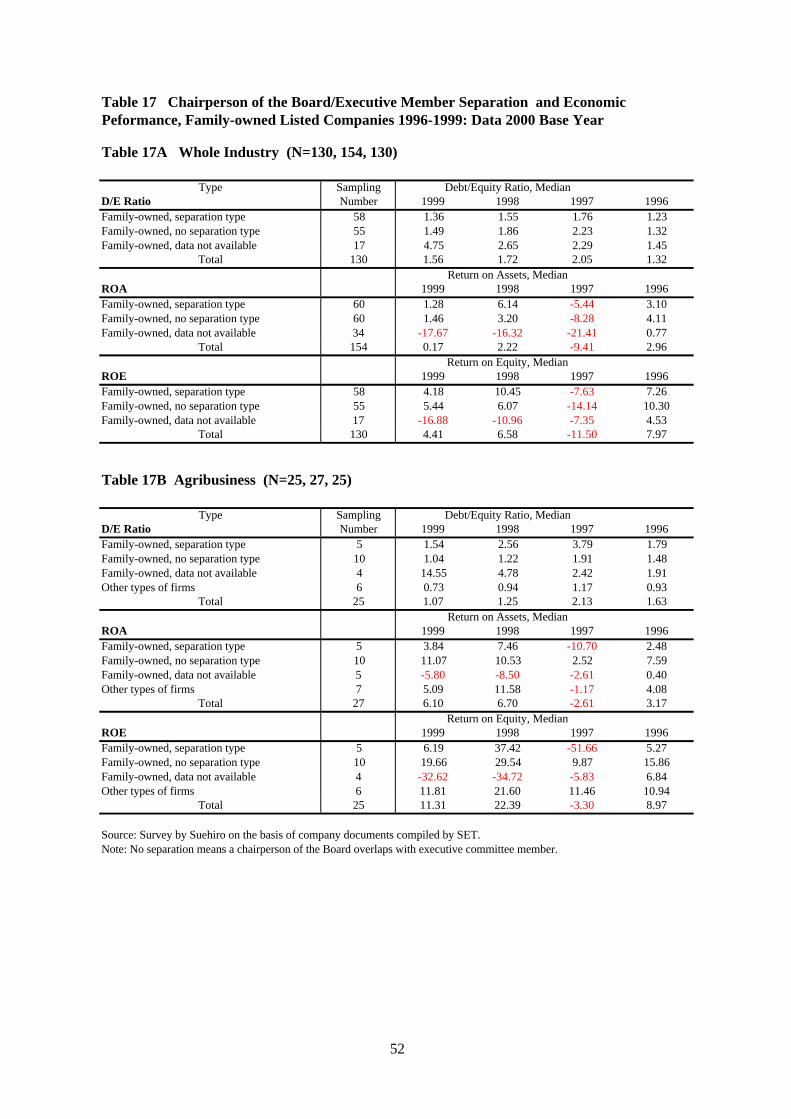
Table 17 Chairperson of the Board/Executive Member Separation and Economic Peformance, Family-owned Listed Companies 1996-1999: Data 2000 Base Year
Table 17A Whole Industry (N=130, 154, 130)
Type Sampling Debt/Equity Ratio, MedianD/E Ratio Number 1999 1998 1997 1996Family-owned, separation type 58 1.36 1.55 1.76 1.23Family-owned, no separation type 55 1.49 1.86 2.23 1.32Family-owned, data not available 17 4.75 2.65 2.29 1.45
Total 130 1.56 1.72 2.05 1.32Return on Assets, Median
ROA 1999 1998 1997 1996Family-owned, separation type 60 1.28 6.14 -5.44 3.10Family-owned, no separation type 60 1.46 3.20 -8.28 4.11Family-owned, data not available 34 -17.67 -16.32 -21.41 0.77
Total 154 0.17 2.22 -9.41 2.96Return on Equity, Median
ROE 1999 1998 1997 1996Family-owned, separation type 58 4.18 10.45 -7.63 7.26Family-owned, no separation type 55 5.44 6.07 -14.14 10.30Family-owned, data not available 17 -16.88 -10.96 -7.35 4.53
Total 130 4.41 6.58 -11.50 7.97
Table 17B Agribusiness (N=25, 27, 25)
Type Sampling Debt/Equity Ratio, MedianD/E Ratio Number 1999 1998 1997 1996Family-owned, separation type 5 1.54 2.56 3.79 1.79Family-owned, no separation type 10 1.04 1.22 1.91 1.48Family-owned, data not available 4 14.55 4.78 2.42 1.91Other types of firms 6 0.73 0.94 1.17 0.93
Total 25 1.07 1.25 2.13 1.63Return on Assets, Median
ROA 1999 1998 1997 1996Family-owned, separation type 5 3.84 7.46 -10.70 2.48Family-owned, no separation type 10 11.07 10.53 2.52 7.59Family-owned, data not available 5 -5.80 -8.50 -2.61 0.40Other types of firms 7 5.09 11.58 -1.17 4.08
Total 27 6.10 6.70 -2.61 3.17Return on Equity, Median
ROE 1999 1998 1997 1996Family-owned, separation type 5 6.19 37.42 -51.66 5.27Family-owned, no separation type 10 19.66 29.54 9.87 15.86Family-owned, data not available 4 -32.62 -34.72 -5.83 6.84Other types of firms 6 11.81 21.60 11.46 10.94
Total 25 11.31 22.39 -3.30 8.97
Source: Survey by Suehiro on the basis of company documents compiled by SET.Note: No separation means a chairperson of the Board overlaps with executive committee member.
52
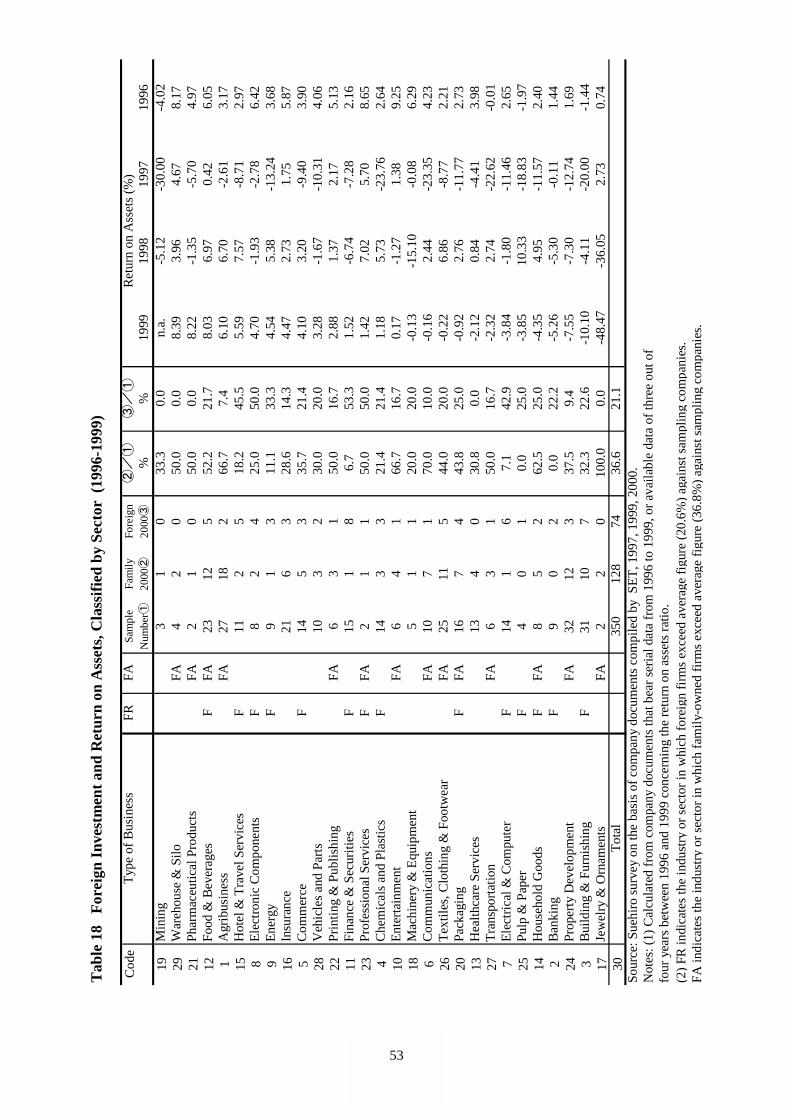
Tab
le 1
8 F
orei
gn I
nves
tmen
t and
Ret
urn
on A
sset
s, C
lass
ifie
d by
Sec
tor
(199
6-19
99)
Cod
eT
ype
of B
usin
ess
FRFA
Sam
ple
Fam
ilyFo
reig
n②/①
③/①
Ret
urn
on A
sset
s (%
) N
umbe
r①20
00②
2000③
%%
1999
1998
1997
1996
19M
inin
g3
10
33.3
0.0
n.a.
-5.1
2-3
0.00
-4.0
229
War
ehou
se &
Silo
FA4
20
50.0
0.0
8.39
3.96
4.67
8.17
21Ph
arm
aceu
tical
Pro
duct
sFA
21
050
.00.
08.
22-1
.35
-5.7
04.
9712
Food
& B
ever
ages
FFA
2312
552
.221
.78.
036.
970.
426.
051
Agr
ibus
ines
sFA
2718
266
.77.
46.
106.
70-2
.61
3.17
15H
otel
& T
rave
l Ser
vice
sF
112
518
.245
.55.
597.
57-8
.71
2.97
8E
lect
roni
c C
ompo
nent
sF
82
425
.050
.04.
70-1
.93
-2.7
86.
429
Ene
rgy
F9
13
11.1
33.3
4.54
5.38
-13.
243.
6816
Insu
ranc
e21
63
28.6
14.3
4.47
2.73
1.75
5.87
5C
omm
erce
F14
53
35.7
21.4
4.10
3.20
-9.4
03.
9028
Veh
icle
s an
d Pa
rts
103
230
.020
.03.
28-1
.67
-10.
314.
0622
Prin
ting
& P
ublis
hing
FA6
31
50.0
16.7
2.88
1.37
2.17
5.13
11Fi
nanc
e &
Sec
uriti
esF
151
86.
753
.31.
52-6
.74
-7.2
82.
1623
Prof
essi
onal
Ser
vice
sF
FA2
11
50.0
50.0
1.42
7.02
5.70
8.65
4C
hem
ical
s an
d Pl
astic
sF
143
321
.421
.41.
185.
73-2
3.76
2.64
10E
nter
tain
men
tFA
64
166
.716
.70.
17-1
.27
1.38
9.25
18M
achi
nery
& E
quip
men
t5
11
20.0
20.0
-0.1
3-1
5.10
-0.0
86.
296
Com
mun
icat
ions
FA10
71
70.0
10.0
-0.1
62.
44-2
3.35
4.23
26T
extil
es, C
loth
ing
& F
ootw
ear
FA25
115
44.0
20.0
-0.2
26.
86-8
.77
2.21
20Pa
ckag
ing
FFA
167
443
.825
.0-0
.92
2.76
-11.
772.
7313
Hea
lthca
re S
ervi
ces
134
030
.80.
0-2
.12
0.84
-4.4
13.
9827
Tra
nspo
rtat
ion
FA6
31
50.0
16.7
-2.3
22.
74-2
2.62
-0.0
17
Ele
ctri
cal &
Com
pute
rF
141
67.
142
.9-3
.84
-1.8
0-1
1.46
2.65
25Pu
lp &
Pap
erF
40
10.
025
.0-3
.85
10.3
3-1
8.83
-1.9
714
Hou
seho
ld G
oods
FFA
85
262
.525
.0-4
.35
4.95
-11.
572.
402
Ban
king
F9
02
0.0
22.2
-5.2
6-5
.30
-0.1
11.
4424
Prop
erty
Dev
elop
men
tFA
3212
337
.59.
4-7
.55
-7.3
0-1
2.74
1.69
3B
uild
ing
& F
urni
shin
gF
3110
732
.322
.6-1
0.10
-4.1
1-2
0.00
-1.4
417
Jew
elry
& O
rnam
ents
FA2
20
100.
00.
0-4
8.47
-36.
052.
730.
7430
Tot
al35
012
874
36.6
21.1
Sour
ce: S
uehi
ro s
urve
y on
the
basi
s of
com
pany
doc
umen
ts c
ompi
led
by S
ET
, 199
7, 1
999,
200
0.N
otes
: (1)
Cal
cula
ted
from
com
pany
doc
umen
ts th
at b
ear
seri
al d
ata
from
199
6 to
199
9, o
r av
aila
ble
data
of
thre
e ou
t of
four
yea
rs b
etw
een
1996
and
199
9 co
ncer
ning
the
retu
rn o
n as
sets
rat
io.
(2)
FR in
dica
tes
the
indu
stry
or
sect
or in
whi
ch f
orei
gn f
irm
s ex
ceed
ave
rage
fig
ure
(20.
6%)
agai
nst s
ampl
ing
com
pani
es.
FA in
dica
tes
the
indu
stry
or
sect
or in
whi
ch f
amily
-ow
ned
firm
s ex
ceed
ave
rage
fig
ure
(36.
8%)
agai
nst s
ampl
ing
com
pani
es.
53
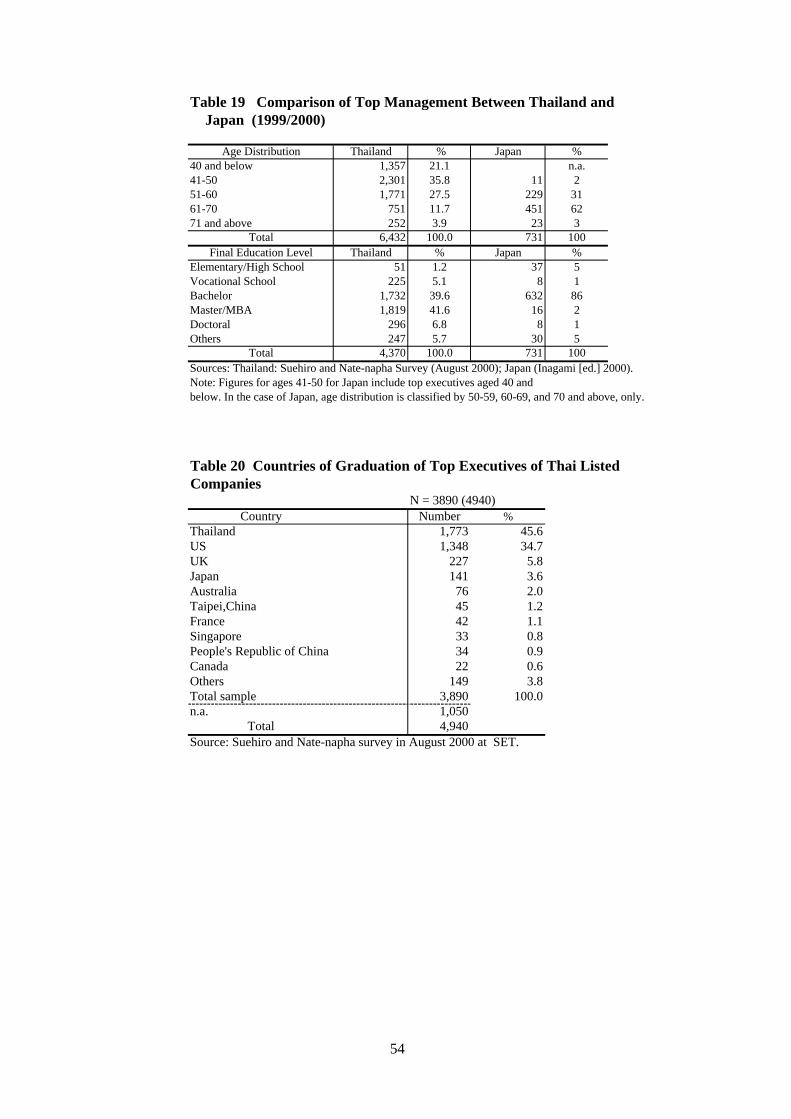
Table 19 Comparison of Top Management Between Thailand and Japan (1999/2000)
Age Distribution Thailand % Japan %40 and below 1,357 21.1 n.a.41-50 2,301 35.8 11 251-60 1,771 27.5 229 3161-70 751 11.7 451 6271 and above 252 3.9 23 3
Total 6,432 100.0 731 100Final Education Level Thailand % Japan %
Elementary/High School 51 1.2 37 5Vocational School 225 5.1 8 1Bachelor 1,732 39.6 632 86Master/MBA 1,819 41.6 16 2Doctoral 296 6.8 8 1Others 247 5.7 30 5
Total 4,370 100.0 731 100Sources: Thailand: Suehiro and Nate-napha Survey (August 2000); Japan (Inagami [ed.] 2000).Note: Figures for ages 41-50 for Japan include top executives aged 40 andbelow. In the case of Japan, age distribution is classified by 50-59, 60-69, and 70 and above, only.
Table 20 Countries of Graduation of Top Executives of Thai Listed Companies
N = 3890 (4940)Country Number %
Thailand 1,773 45.6US 1,348 34.7UK 227 5.8Japan 141 3.6Australia 76 2.0Taipei,China 45 1.2France 42 1.1Singapore 33 0.8People's Republic of China 34 0.9Canada 22 0.6Others 149 3.8Total sample 3,890 100.0n.a. 1,050
Total 4,940Source: Suehiro and Nate-napha survey in August 2000 at SET.
54
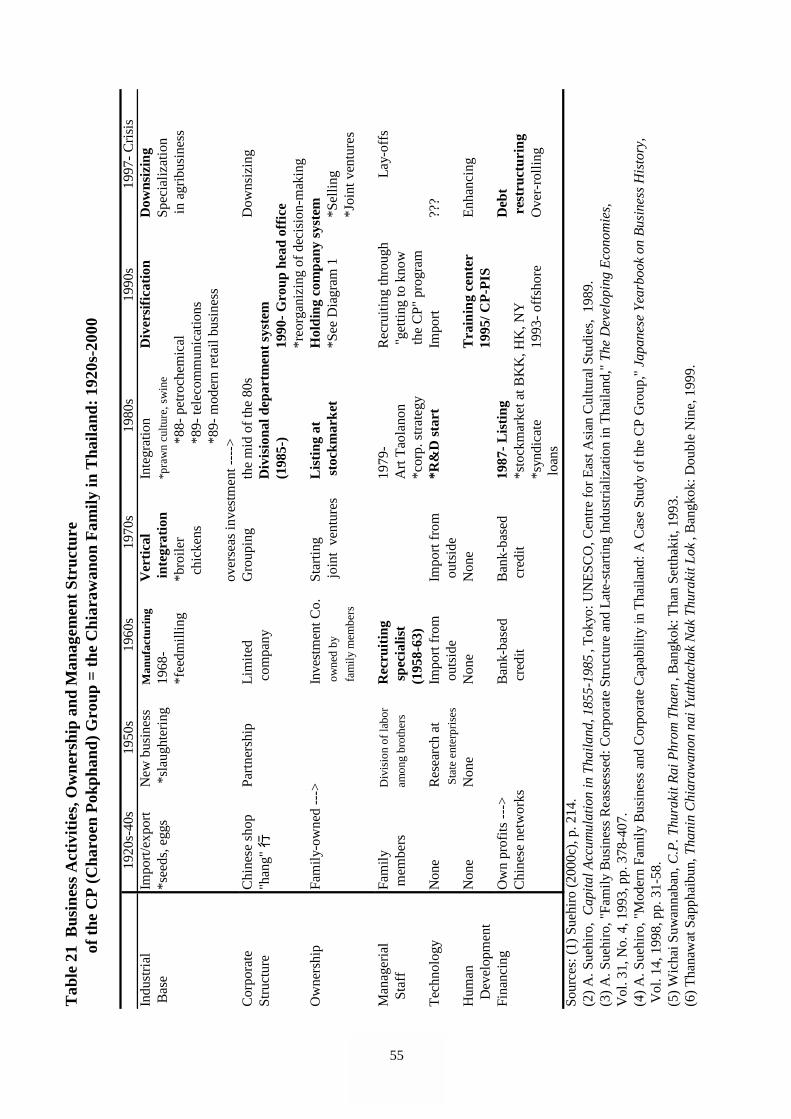
55
Tab
le 2
1 B
usin
ess
Act
ivit
ies,
Ow
ners
hip
and
Man
agem
ent
Stru
ctur
e
o
f th
e C
P (C
haro
en P
okph
and)
Gro
up =
the
Chi
araw
anon
Fam
ily in
Tha
iland
: 19
20s-
2000
1920
s-40
s19
50s
1960
s19
70s
1980
s19
90s
1997
- C
risi
sIn
dust
rial
Im
port
/exp
ort
New
bus
ines
sM
anuf
actu
ring
Ver
tica
lIn
tegr
atio
nD
iver
sifi
cati
onD
owns
izin
g B
ase
*see
ds, e
ggs
*sl
augh
teri
ng19
68-
inte
grat
ion
*pra
wn
cultu
re, s
win
e Sp
ecia
lizat
ion
*fee
dmill
ing
*bro
iler
*
88-
petr
oche
mic
al
in a
grib
usin
ess
chi
cken
s
*89
- te
leco
mm
unic
atio
ns
*89
- m
oder
n re
tail
busi
ness
over
seas
inve
stm
ent -
--->
Cor
pora
teC
hine
se s
hop
Part
ners
hip
Lim
ited
G
roup
ing
the
mid
of
the
80s
Dow
nsiz
ing
Stru
ctur
e"h
ang"
行 c
ompa
nyD
ivis
iona
l dep
artm
ent
syst
em(1
985-
)19
90-
Gro
up h
ead
offi
ce*r
eorg
aniz
ing
of d
ecis
ion-
mak
ing
Ow
ners
hip
Fam
ily-o
wne
d --
->In
vest
men
t Co.
Star
ting
Lis
ting
at
Hol
ding
com
pany
sys
tem
ow
ned
by
join
t ve
ntur
es s
tock
mar
ket
*See
Dia
gram
1*S
ellin
g f
amily
mem
bers
*Joi
nt v
entu
res
Man
ager
ial
Fam
ily
Div
isio
n of
labo
rR
ecru
itin
g19
79-
Rec
ruit
ing
thro
ugh
Lay
-off
s S
taff
mem
bers
amon
g br
othe
rs s
peci
alis
tA
rt T
aola
non
"ge
tting
to k
now
(195
8-63
)*c
orp.
str
ateg
y th
e C
P"
prog
ram
Tec
hnol
ogy
Non
eR
esea
rch
atIm
port
fro
mIm
port
fro
m*R
&D
sta
rtIm
port
???
Sta
te e
nter
pris
es o
utsi
de o
utsi
deH
uman
N
one
Non
eN
one
Non
eT
rain
ing
cent
erE
nhan
cing
Dev
elop
men
t19
95/ C
P-P
IS
Fina
ncin
gO
wn
prof
its -
-->
Ban
k-ba
sed
Ban
k-ba
sed
1987
- L
isti
ngD
ebt
Chi
nese
net
wor
ks c
redi
t c
redi
t*s
tock
mar
ket a
t BK
K, H
K, N
Y r
estr
uctu
ring
*syn
dica
te
1993
- of
fsho
reO
ver-
roll
ing
loan
sSo
urce
s: (
1) S
uehi
ro (
2000
c), p
. 214
.(2
) A
. Sue
hiro
, C
apita
l Acc
umul
atio
n in
Tha
iland
, 185
5-19
85, T
okyo
: UN
ESC
O, C
entr
e fo
r E
ast A
sian
Cul
tura
l Stu
dies
, 19
89.
(3)
A. S
uehi
ro, "
Fam
ily B
usin
ess
Rea
sses
sed:
Cor
pora
te S
truc
ture
and
Lat
e-st
artin
g In
dust
rial
izat
ion
in T
haila
nd,"
The
Dev
elop
ing
Eco
nom
ies,
Vol
. 31,
No.
4, 1
993,
pp.
378
-407
.(4
) A
. Sue
hiro
, "M
oder
n Fa
mil
y B
usin
ess
and
Cor
pora
te C
apab
ility
in T
haila
nd: A
Cas
e St
udy
of th
e C
P G
roup
," J
apan
ese
Year
book
on
Bus
ines
s H
isto
ry,
Vol
. 14,
199
8, p
p. 3
1-58
.(5
) W
icha
i Suw
anna
ban,
C.P
. Thu
raki
t Rai
Phr
om T
haen
, Ban
gkok
: Tha
n Se
tthak
it, 1
993.
(6)
Tha
naw
at S
apph
aibu
n, T
hani
n C
hiar
awan
on n
ai Y
utth
acha
k N
ak T
hura
kit L
ok, B
angk
ok: D
oubl
e N
ine,
199
9.
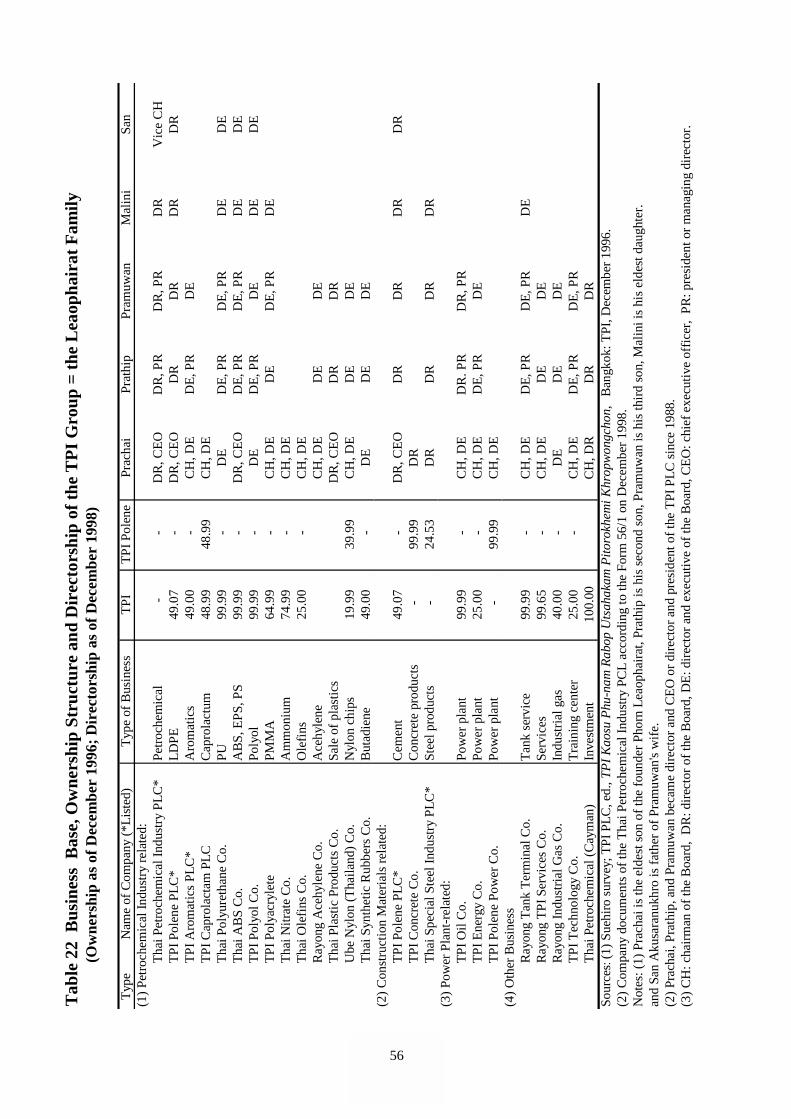
56
Tab
le 2
2 B
usin
ess
Bas
e, O
wne
rshi
p St
ruct
ure
and
Dir
ecto
rshi
p of
the
TP
I G
roup
= t
he L
eaop
hair
at F
amily
(Ow
ners
hip
as o
f Dec
embe
r 19
96; D
irec
tors
hip
as o
f D
ecem
ber
1998
)
Typ
eN
ame
of C
ompa
ny (
*Lis
ted)
Typ
e of
Bus
ines
sT
PIT
PI P
olen
ePr
acha
iPr
athi
pPr
amuw
anM
alin
iSa
n(1
) Pe
troc
hem
ical
Indu
stry
rel
ated
:T
hai P
etro
chem
ical
Indu
stry
PL
C*
Petr
oche
mic
al
- -
DR
, CE
OD
R, P
RD
R, P
RD
RV
ice
CH
TPI
Pol
ene
PLC
*L
DPE
49.0
7 -
DR
, CE
OD
RD
RD
RD
RT
PI A
rom
atic
s PL
C*
Aro
mat
ics
49.0
0 -
CH
, DE
DE
, PR
DE
TPI
Cap
rola
ctam
PL
CC
apro
lact
um48
.99
48.9
9C
H, D
ET
hai P
olyu
reth
ane
Co.
PU99
.99
-D
ED
E, P
RD
E, P
RD
ED
ET
hai A
BS
Co.
AB
S, E
PS, P
S99
.99
-D
R, C
EO
DE
, PR
DE
, PR
DE
DE
TPI
Pol
yol C
o.Po
lyol
99.9
9 -
DE
DE
, PR
DE
DE
DE
TPI
Pol
yacr
ylet
ePM
MA
64.9
9 -
CH
, DE
DE
DE
, PR
DE
Tha
i Nitr
ate
Co.
Am
mon
ium
74.9
9 -
CH
, DE
Tha
i Ole
fins
Co.
Ole
fins
25.0
0 -
CH
, DE
Ray
ong
Ace
hyle
ne C
o.A
cehy
lene
CH
, DE
DE
DE
Tha
i Pla
stic
Pro
duct
s C
o.Sa
le o
f pl
astic
sD
R, C
EO
DR
DR
Ube
Nyl
on (
Tha
iland
) C
o.N
ylon
chi
ps19
.99
39.9
9C
H, D
ED
ED
ET
hai S
ynth
etic
Rub
bers
Co.
But
adie
ne49
.00
-D
ED
ED
E(2
) C
onst
ruct
ion
Mat
eria
ls r
elat
ed:
TPI
Pol
ene
PLC
*C
emen
t49
.07
-D
R, C
EO
DR
DR
DR
DR
TPI
Con
cret
e C
o.C
oncr
ete
prod
ucts
-99
.99
DR
Tha
i Spe
cial
Ste
el In
dust
ry P
LC
*St
eel p
rodu
cts
-24
.53
DR
DR
DR
DR
(3)
Pow
er P
lant
-rel
ated
:T
PI O
il C
o.Po
wer
pla
nt99
.99
-C
H, D
ED
R. P
RD
R, P
RT
PI E
nerg
y C
o.Po
wer
pla
nt25
.00
-C
H, D
ED
E, P
RD
ET
PI P
olen
e Po
wer
Co.
Pow
er p
lant
-99
.99
CH
, DE
(4)
Oth
er B
usin
ess
Ray
ong
Tan
k T
erm
inal
Co.
Tan
k se
rvic
e99
.99
-C
H, D
ED
E, P
RD
E, P
RD
ER
ayon
g T
PI S
ervi
ces
Co.
Serv
ices
99.6
5 -
CH
, DE
DE
DE
Ray
ong
Indu
stri
al G
as C
o.In
dust
rial
gas
40.0
0 -
DE
DE
DE
TPI
Tec
hnol
ogy
Co.
Tra
inin
g ce
nter
25.0
0 -
CH
, DE
DE
, PR
DE
, PR
Tha
i Pet
roch
emic
al (
Cay
man
)In
vest
men
t 10
0.00
CH
, DR
DR
DR
Sour
ces :
(1)
Sue
hiro
sur
vey;
TPI
PL
C, e
d., T
PI K
aosu
Phu
-nam
Rab
op U
tsah
akam
Pito
rokh
emi K
hrop
won
gcho
n, B
angk
ok: T
PI, D
ecem
ber
1996
.(2
) C
ompa
ny d
ocum
ents
of
the
Tha
i Pet
roch
emic
al In
dust
ry P
CL
acc
ordi
ng to
the
Form
56/
1 on
Dec
embe
r 19
98.
Not
es: (
1) P
rach
ai is
the
elde
st s
on o
f th
e fo
unde
r Ph
orn
Lea
opha
irat
, Pra
thip
is h
is s
econ
d so
n, P
ram
uwan
is h
is th
ird
son,
Mal
ini i
s hi
s el
dest
dau
ghte
r.an
d Sa
n A
kusa
ranu
khro
is f
athe
r of
Pra
muw
an's
wif
e.(2
) Pr
acha
i, Pr
athi
p, a
nd P
ram
uwan
bec
ame
dire
ctor
and
CE
O o
r di
rect
or a
nd p
resi
dent
of
the
TPI
PL
C s
ince
198
8.(3
) C
H: c
hair
man
of
the
Boa
rd,
DR
: dir
ecto
r of
the
Boa
rd, D
E: d
irec
tor
and
exec
utiv
e of
the
Boa
rd, C
EO
: chi
ef e
xecu
tive
offi
cer,
PR
: pre
side
nt o
r m
anag
ing
dire
ctor
.
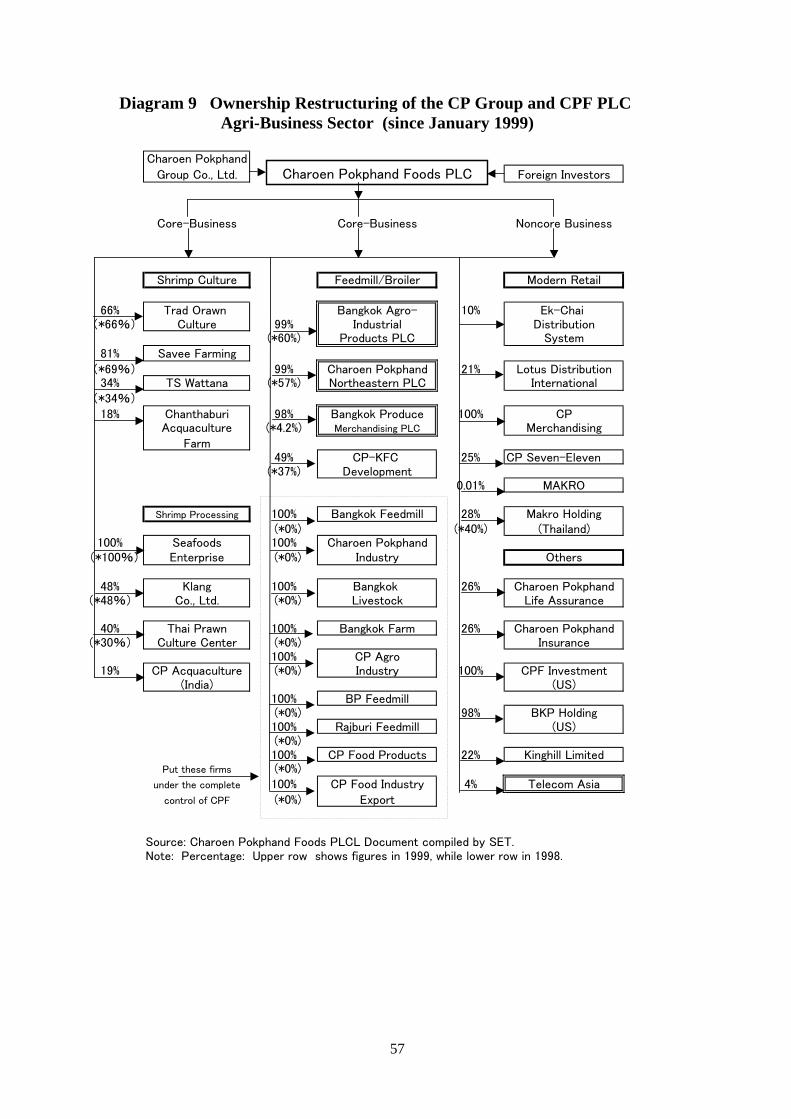
Diagram 9 Ownership Restructuring of the CP Group and CPF PLC Agri-Business Sector (since January 1999)
Charoen Pokphand
Group Co., Ltd. Charoen Pokphand Foods PLC Foreign Investors
Core-Business Core-Business Noncore Business
Shrimp Culture Feedmill/Broiler Modern Retail
66% Trad Orawn Bangkok Agro- 10% Ek-Chai (*66%) Culture 99% Industrial Distribution
(*60%) Products PLC System81% Savee Farming
(*69%) 99% Charoen Pokphand 21% Lotus Distribution34% TS Wattana (*57%) Northeastern PLC International
(*34%)18% Chanthaburi 98% Bangkok Produce 100% CP
Acquaculture (*4.2%) Merchandising PLC MerchandisingFarm
49% CP-KFC 25% CP Seven-Eleven(*37%) Development
0.01% MAKRO
Shrimp Processing 100% Bangkok Feedmill 28% Makro Holding (*0%) (*40%) (Thailand)
100% Seafoods 100% Charoen Pokphand (*100%) Enterprise (*0%) Industry Others
48% Klang 100% Bangkok 26% Charoen Pokphand(*48%) Co., Ltd. (*0%) Livestock Life Assurance
40% Thai Prawn 100% Bangkok Farm 26% Charoen Pokphand(*30%) Culture Center (*0%) Insurance
100% CP Agro19% CP Acquaculture (*0%) Industry 100% CPF Investment
(India) (US)100% BP Feedmill
(*0%) 98% BKP Holding100% Rajburi Feedmill (US)
(*0%)100% CP Food Products 22% Kinghill Limited
Put these firms (*0%)under the complete 100% CP Food Industry 4% Telecom Asia
control of CPF (*0%) Export
Source: Charoen Pokphand Foods PLCL Document compiled by SET.Note: Percentage: Upper row shows figures in 1999, while lower row in 1998.
57
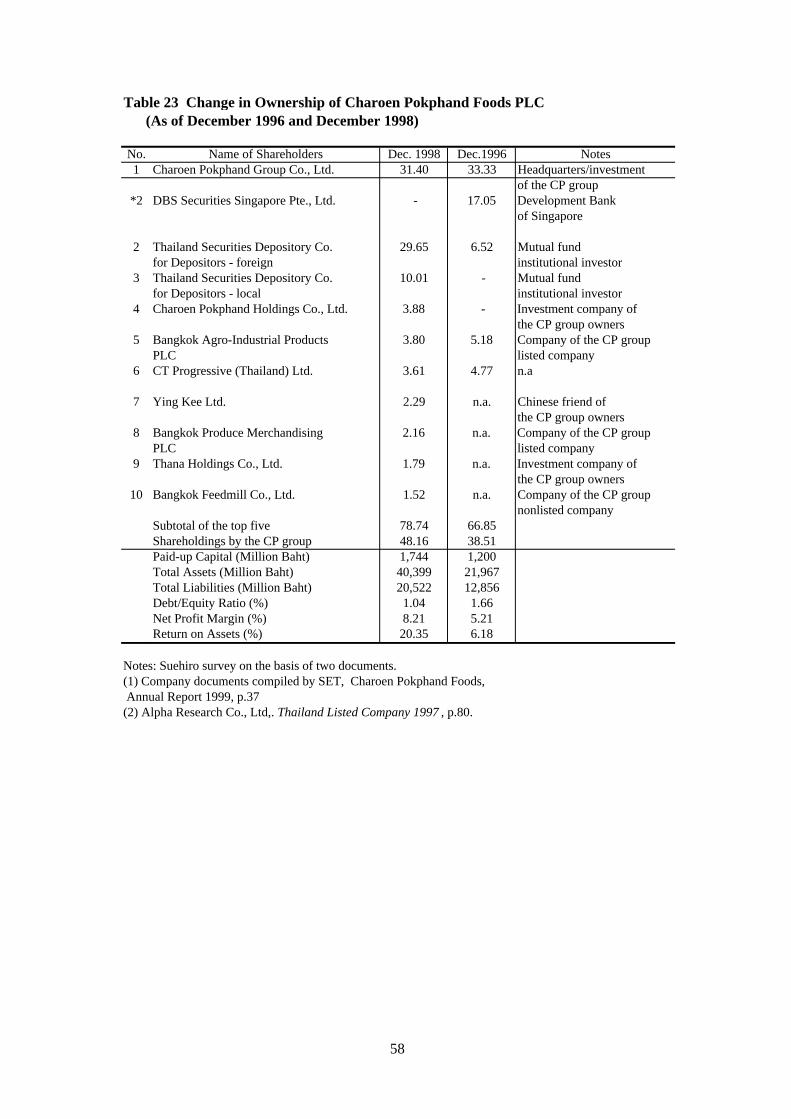
Table 23 Change in Ownership of Charoen Pokphand Foods PLC (As of December 1996 and December 1998)
No. Name of Shareholders Dec. 1998 Dec.1996 Notes1 Charoen Pokphand Group Co., Ltd. 31.40 33.33 Headquarters/investment
of the CP group*2 DBS Securities Singapore Pte., Ltd. - 17.05 Development Bank
of Singapore
2 Thailand Securities Depository Co. 29.65 6.52 Mutual fundfor Depositors - foreign institutional investor
3 Thailand Securities Depository Co. 10.01 - Mutual fundfor Depositors - local institutional investor
4 Charoen Pokphand Holdings Co., Ltd. 3.88 - Investment company ofthe CP group owners
5 Bangkok Agro-Industrial Products 3.80 5.18 Company of the CP groupPLC listed company
6 CT Progressive (Thailand) Ltd. 3.61 4.77 n.a
7 Ying Kee Ltd. 2.29 n.a. Chinese friend of the CP group owners
8 Bangkok Produce Merchandising 2.16 n.a. Company of the CP groupPLC listed company
9 Thana Holdings Co., Ltd. 1.79 n.a. Investment company ofthe CP group owners
10 Bangkok Feedmill Co., Ltd. 1.52 n.a. Company of the CP groupnonlisted company
Subtotal of the top five 78.74 66.85Shareholdings by the CP group 48.16 38.51Paid-up Capital (Million Baht) 1,744 1,200Total Assets (Million Baht) 40,399 21,967Total Liabilities (Million Baht) 20,522 12,856Debt/Equity Ratio (%) 1.04 1.66Net Profit Margin (%) 8.21 5.21Return on Assets (%) 20.35 6.18
Notes: Suehiro survey on the basis of two documents.(1) Company documents compiled by SET, Charoen Pokphand Foods, Annual Report 1999, p.37(2) Alpha Research Co., Ltd,. Thailand Listed Company 1997 , p.80.
58
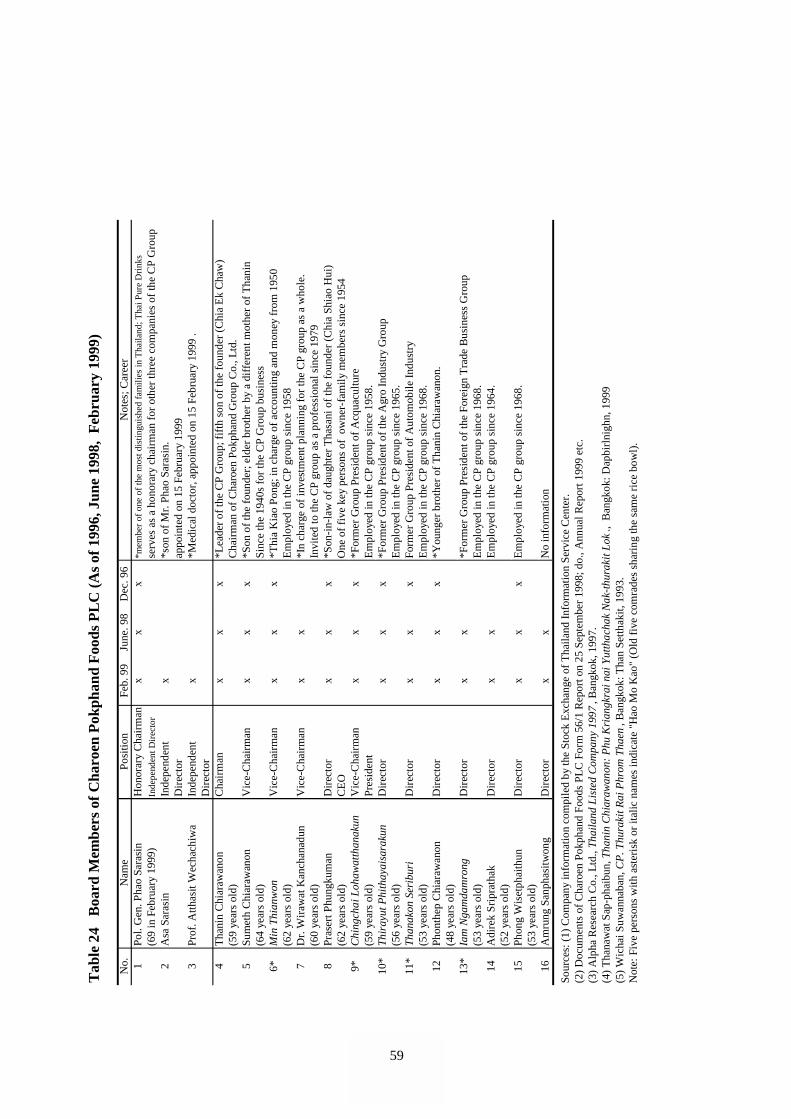
59
Tab
le 2
4 B
oard
Mem
bers
of C
haro
en P
okph
and
Foo
ds P
LC
(As
of 1
996,
Jun
e 19
98,
Feb
ruar
y 19
99)
No.
Nam
ePo
sitio
nFe
b. 9
9Ju
ne. 9
8D
ec. 9
6N
otes
; Car
eer
1Po
l. G
en. P
hao
Sara
sin
Hon
orar
y C
hair
man
xx
x*m
embe
r of
one
of
the
mos
t dis
tingu
ishe
d fa
mili
es in
Tha
iland
; Tha
i Pur
e D
rink
s
(69
in F
ebru
ary
1999
)In
depe
nden
t Dir
ecto
rse
rves
as
a ho
nora
ry c
hair
man
for
oth
er th
ree
com
pani
es o
f th
e C
P G
roup
2A
sa S
aras
inIn
depe
nden
tx
*son
of
Mr.
Pha
o Sa
rasi
n.D
irec
tor
appo
inte
d on
15
Febr
uary
199
9 3
Prof
. Atth
asit
Wec
hach
iwa
Inde
pend
ent
x*M
edic
al d
octo
r, a
ppoi
nted
on
15 F
ebru
ary
1999
.D
irec
tor
4T
hani
n C
hiar
awan
onC
hair
man
xx
x*L
eade
r of
the
CP
Gro
up; f
ifth
son
of
the
foun
der
(Chi
a E
k C
haw
)(5
9 ye
ars
old)
Cha
irm
an o
f C
haro
en P
okph
and
Gro
up C
o., L
td.
5Su
met
h C
hiar
awan
onV
ice-
Cha
irm
anx
xx
*Son
of
the
foun
der;
eld
er b
roth
er b
y a
diff
eren
t mot
her
of T
hani
n(6
4 ye
ars
old)
Sinc
e th
e 19
40s
for
the
CP
Gro
up b
usin
ess
6*M
in T
hian
won
Vic
e-C
hair
man
xx
x*T
hia
Kia
o P
ong;
in c
harg
e of
acc
ount
ing
and
mon
ey f
rom
195
0(6
2 ye
ars
old)
Em
ploy
ed in
the
CP
gro
up s
ince
195
87
Dr.
Wir
awat
Kan
chan
adun
Vic
e-C
hair
man
xx
*In
char
ge o
f in
vest
men
t pla
nnin
g fo
r th
e C
P gr
oup
as a
who
le.
(60
year
s ol
d)In
vite
d to
the
CP
gro
up a
s a
prof
essi
onal
sin
ce 1
979
8Pr
aser
t Phu
ngku
man
Dir
ecto
rx
xx
*Son
-in-
law
of
daug
hter
Tha
sani
of
the
foun
der
(Chi
a Sh
iao
Hui
)(6
2 ye
ars
old)
CE
OO
ne o
f fi
ve k
ey p
erso
ns o
f o
wne
r-fa
mily
mem
bers
sin
ce 1
954
9*C
hing
chai
Loh
awat
than
akun
Vic
e-C
hair
man
xx
x*F
orm
er G
roup
Pre
side
nt o
f A
cqua
cultu
re(5
9 ye
ars
old)
Pres
iden
tE
mpl
oyed
in th
e C
P g
roup
sin
ce 1
958.
10*
Thir
ayut
Phi
thay
aisa
raku
nD
irec
tor
xx
x*F
orm
er G
roup
Pre
side
nt o
f th
e A
gro
Indu
stry
Gro
up(5
6 ye
ars
old)
Em
ploy
ed in
the
CP
gro
up s
ince
196
5.11
*Th
anak
on S
erib
uri
Dir
ecto
rx
xx
Form
er G
roup
Pre
side
nt o
f A
utom
obile
Indu
stry
(53
year
s ol
d)E
mpl
oyed
in th
e C
P g
roup
sin
ce 1
968.
12Ph
onth
ep C
hiar
awan
onD
irec
tor
xx
x*Y
oung
er b
roth
er o
f T
hani
n C
hiar
awan
on.
(48
year
s ol
d)13
*Ia
m N
gam
dam
rong
Dir
ecto
rx
x*F
orm
er G
roup
Pre
side
nt o
f th
e Fo
reig
n T
rade
Bus
ines
s G
roup
(53
year
s ol
d)E
mpl
oyed
in th
e C
P g
roup
sin
ce 1
968.
14A
dire
k S
ripr
atha
kD
irec
tor
xx
Em
ploy
ed in
the
CP
gro
up s
ince
196
4.(5
2 ye
ars
old)
15Ph
ong
Wis
etph
aith
unD
irec
tor
xx
xE
mpl
oyed
in th
e C
P g
roup
sin
ce 1
968.
(53
year
s ol
d)16
Am
rung
San
phas
itw
ong
Dir
ecto
rx
xN
o in
form
atio
n
Sour
ces:
(1)
Com
pany
info
rmat
ion
com
pile
d by
the
Stoc
k E
xcha
nge
of T
haila
nd I
nfor
mat
ion
Ser
vice
Cen
ter.
(2)
Doc
umen
ts o
f C
haro
en P
okph
and
Food
s PL
C F
orm
56/
1 R
epor
t on
25 S
epte
mbe
r 19
98; d
o., A
nnua
l Rep
ort 1
999
etc.
(3
) A
lpha
Res
earc
h C
o., L
td.,
Thai
land
Lis
ted
Com
pany
199
7, B
angk
ok, 1
997.
(4)
Tha
naw
at S
ap-p
haib
un, T
hani
n C
hiar
awan
on: P
hu K
rian
gkra
i nai
Yut
thac
hak
Nak
-thu
raki
t Lok
., B
angk
ok: D
apbi
rlni
ghn,
199
9(5
) W
icha
i Suw
anna
ban,
CP
. Thu
raki
t Rai
Phr
om T
haen
, Ban
gkok
: Tha
n Se
tthak
it, 1
993.
Not
e: F
ive
pers
ons
with
ast
eris
k or
ital
ic n
ames
indi
cate
"H
ao M
o K
ao"
(Old
fiv
e co
mra
des
shar
ing
the
sam
e ri
ce b
owl)
.
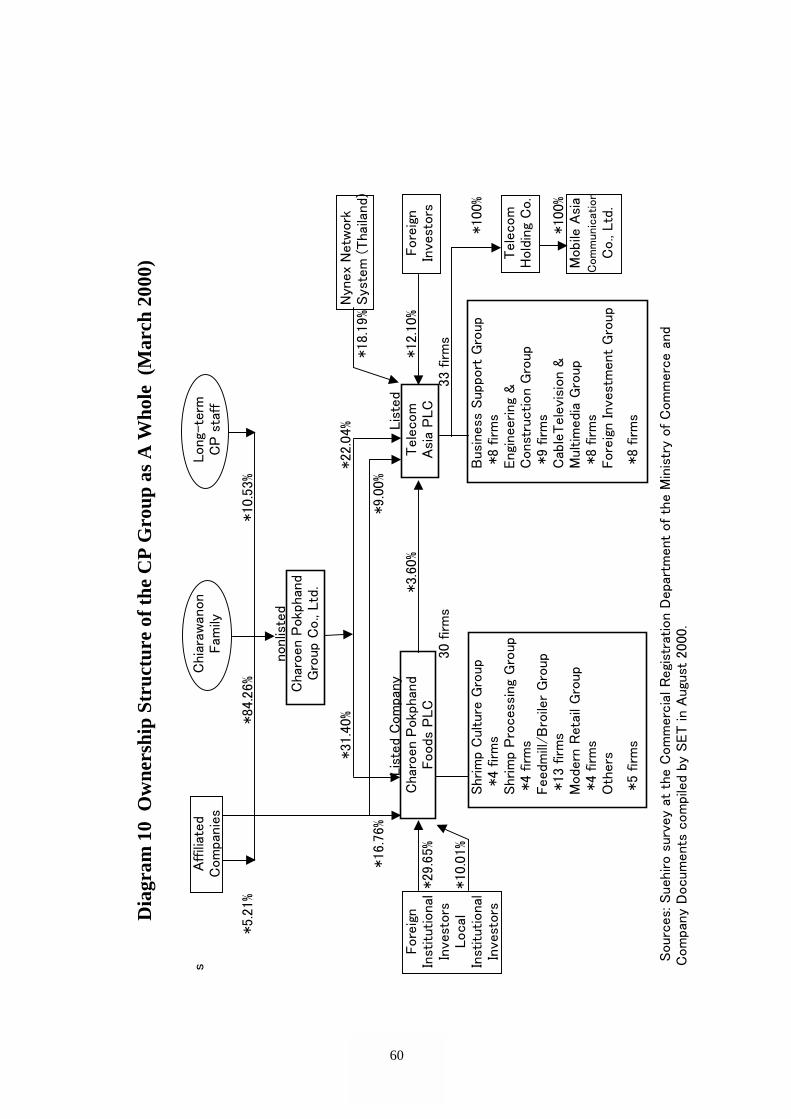
D
iagr
am 1
0 O
wne
rshi
p St
ruct
ure
of th
e C
P G
roup
as
A W
hole
(M
arch
200
0)
sA
ffili
ated
Chi
araw
anon
Long
-te
rmC
om
pan
ies
Fam
ilyC
P s
taff
*5.
21%
*84
.26%
*10
.53%
nonlis
ted
Cha
roen
Pokp
han
dG
roup
Co.,
Ltd
.
*31
.40%
*22
.04%
Nyn
ex
Netw
ork
*18
.19%
Sys
tem
(Tha
iland)
*16
.76%
*9.
00%
Lis
ted C
om
pany
Lis
ted
Fore
ign
Cha
roen
Pokp
han
d*3.
60%
Tele
com
*12
.10%
Fore
ign
Inst
itut
ional
*29
.65%
Foods
PLC
Asi
a P
LC
Inve
stors
Inve
stors
30
firm
s33
firm
sLoca
l*10
.01%
Inst
itut
ional
Shrim
p C
ultu
re G
roup
Bus
iness
Sup
port
Gro
up*10
0%In
vest
ors
*4
firm
s *
8 firm
sShrim
p P
roces
sing
Gro
upEngi
nee
ring
&
Tele
com
*4
firm
sC
onst
ruction
Gro
upH
old
ing
Co.
Feed
mill
/Bro
iler
Gro
up
*9
firm
s *13
firm
sC
able
Tele
visi
on &
*10
0%M
odern
Ret
ail G
roup
Multim
edia
Gro
up
Mobile
Asi
a *
4 firm
s *
8 firm
sC
om
munic
atio
n
Oth
ers
Fore
ign Inve
stm
ent
Gro
up
Co.,
Ltd
.
*5
firm
s *
8 firm
s
Sourc
es:
Sueh
iro s
urve
y at
the
Com
merc
ial R
egi
stra
tion D
epa
rtm
ent
of th
e M
inis
try
of C
om
merc
e a
nd
Com
pan
y D
ocu
ment
s co
mpi
led b
y SET in
Aug
ust
2000
.
60
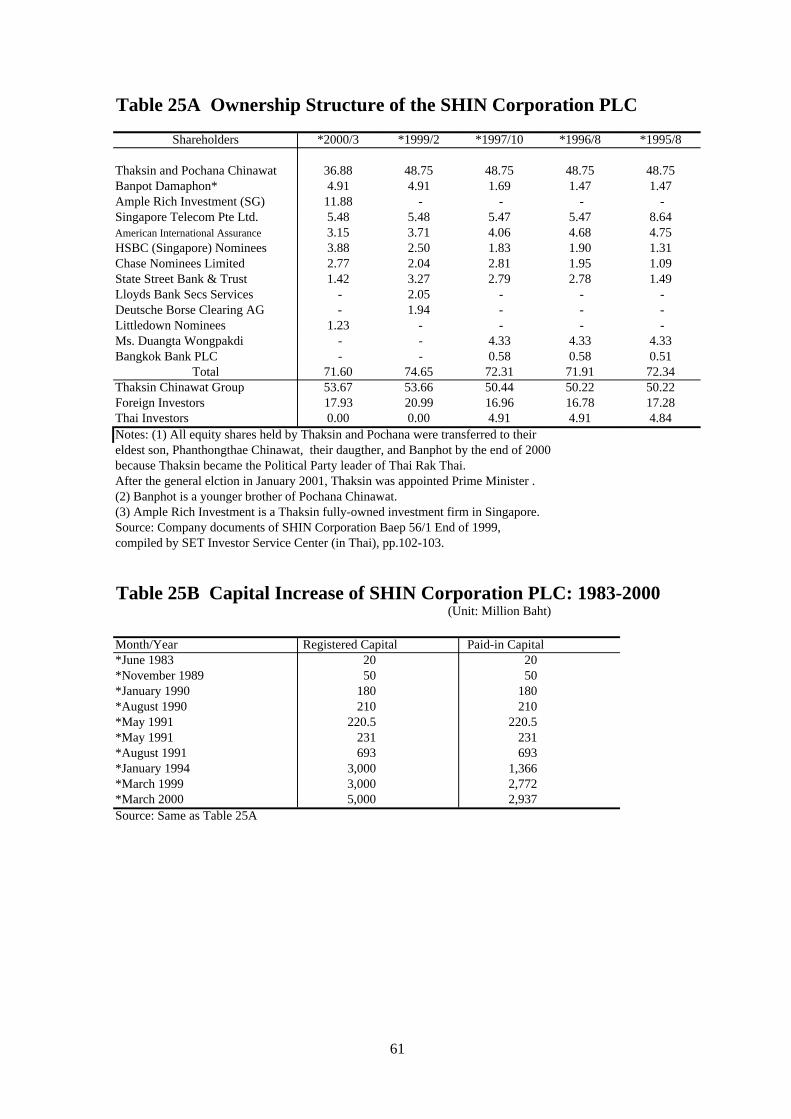
Table 25A Ownership Structure of the SHIN Corporation PLC
Shareholders *2000/3 *1999/2 *1997/10 *1996/8 *1995/8
Thaksin and Pochana Chinawat 36.88 48.75 48.75 48.75 48.75Banpot Damaphon* 4.91 4.91 1.69 1.47 1.47Ample Rich Investment (SG) 11.88 - - - -Singapore Telecom Pte Ltd. 5.48 5.48 5.47 5.47 8.64American International Assurance 3.15 3.71 4.06 4.68 4.75HSBC (Singapore) Nominees 3.88 2.50 1.83 1.90 1.31Chase Nominees Limited 2.77 2.04 2.81 1.95 1.09State Street Bank & Trust 1.42 3.27 2.79 2.78 1.49Lloyds Bank Secs Services - 2.05 - - -Deutsche Borse Clearing AG - 1.94 - - -Littledown Nominees 1.23 - - - -Ms. Duangta Wongpakdi - - 4.33 4.33 4.33Bangkok Bank PLC - - 0.58 0.58 0.51
Total 71.60 74.65 72.31 71.91 72.34Thaksin Chinawat Group 53.67 53.66 50.44 50.22 50.22Foreign Investors 17.93 20.99 16.96 16.78 17.28Thai Investors 0.00 0.00 4.91 4.91 4.84Notes: (1) All equity shares held by Thaksin and Pochana were transferred to their eldest son, Phanthongthae Chinawat, their daugther, and Banphot by the end of 2000because Thaksin became the Political Party leader of Thai Rak Thai.After the general elction in January 2001, Thaksin was appointed Prime Minister .(2) Banphot is a younger brother of Pochana Chinawat.(3) Ample Rich Investment is a Thaksin fully-owned investment firm in Singapore.Source: Company documents of SHIN Corporation Baep 56/1 End of 1999, compiled by SET Investor Service Center (in Thai), pp.102-103.
Table 25B Capital Increase of SHIN Corporation PLC: 1983-2000(Unit: Million Baht)
Month/Year Registered Capital Paid-in Capital*June 1983 20 20*November 1989 50 50*January 1990 180 180*August 1990 210 210*May 1991 220.5 220.5*May 1991 231 231*August 1991 693 693*January 1994 3,000 1,366*March 1999 3,000 2,772*March 2000 5,000 2,937Source: Same as Table 25A
61
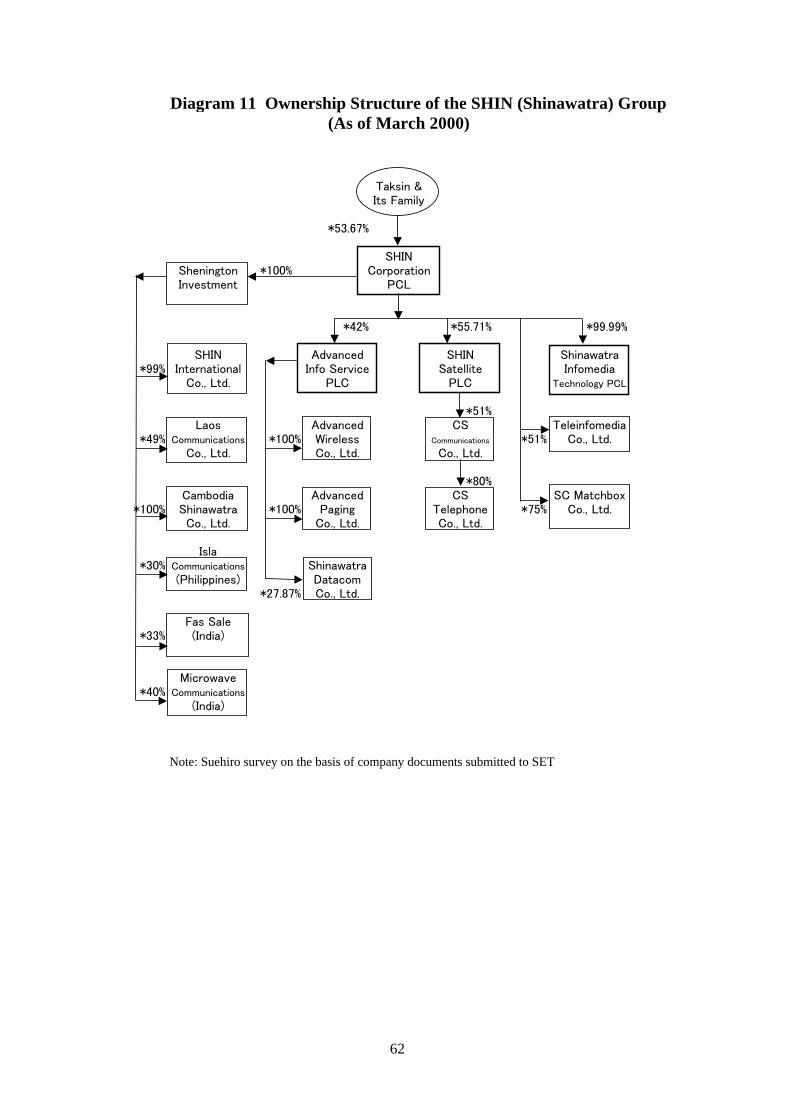
Diagram 11 Ownership Structure of the SHIN (Shinawatra) Group (As of March 2000)
Taksin &Its Family
*53.67%
SHINShenington *100% CorporationInvestment PCL
*42% *55.71% *99.99%
SHIN Advanced SHIN Shinawatra*99% International Info Service Satellite Infomedia
Co., Ltd. PLC PLC Technology PCL
*51%Laos Advanced CS Teleinfomedia
*49% Communications *100% Wireless Communications *51% Co., Ltd.Co., Ltd. Co., Ltd. Co., Ltd.
*80%Cambodia Advanced CS SC Matchbox
*100% Shinawatra *100% Paging Telephone *75% Co., Ltd.Co., Ltd. Co., Ltd. Co., Ltd.
Isla*30% Communications Shinawatra
(Philippines) Datacom*27.87% Co., Ltd.
Fas Sale*33% (India)
Microwave*40% Communications
(India)
Note: Suehiro survey on the basis of company documents submitted to SET
62
WORKING PAPER SERIES
EXECUTIVE SUMMARY SERIES
HOW TO CONTACT US?
Asian Development Bank InstituteKasumigaseki Building 8F3-2-5 Kasumigaseki, Chiyoda-ku,Tokyo 100-6008 Japan
Tel: +81 (03) 3593-5500Fax: +81 (03) 3593-5571E-mail: [email protected]
Papers are also available online at the ADBI Internet site:http://www.adbi.org/publications/
Public-Private Partnerships in Health(No. S34/01)
Skill Development for Industry(No. S35/01)
High-Level Dialogue on Banking Regulation and Financial Market Development:�New Issues in the Post-Crisis Recovery Phase�(No. S36/01)
Banking Sector Reform�(No. S37/01)
Pacific Public Management Executive Program (PPMEP) �Module 3: Managing Programs, Projects and People�(No. S38/01)
Information and Communication Technology (ICT) Strategies for Developing Countries�(No. S39/01)
Do Foreign Companies Conduct R&D in Developing Countries?A New Approach to Analyzing the Level of R&D, with an Analysis of SingaporeMarch 2001 Code: 14-2001 by Alice H. Amsden, Ted Tschang and Akira Goto
Designing a Financial Market Structure in Post-Crisis Asia �-How to Develop Corporate Bond Markets-March 27, 2001 Code: 15-2001 by Dr. Masaru Yoshitomi and Dr. Sayuri Shirai
Population Pressure, Land Tenure, and Natural Resource ManagementMarch 2001 Code: 16-2001 by Keijiro Otsuka
Growth and Poverty Alleviation: Lessons from Development ExperienceApril 2001 Code: 17-2001 by T. N. Srinivasan
Diverse Paths toward “the Right Institutions:” Law, the State, and Economic Reform in East AsiaApril 2001 Code: 18-2001 by Meredith Woo-Cumings
Family Business Gone Wrong? Ownership Patterns and Corporate Performance in ThailandMay 2001 Code: 19-2001 by Akira Suehiro
ADB INSTITUTE WORKING PAPER 19