fact book spreadsheets2009- 2010 book january 2011 final.pdf · arlington central school district...
TRANSCRIPT

Fact Book2005-2006 Through 2009-2010
Dutchess County
Produced by Dutchess BOCES
Dutchess County Chief School OfficersDutchess County School Boards Association
January 2011

DUTCHESS COUNTY BOARD OF COOPERATIVE EDUCATIONAL SERVICES
THE BOCES BOARD Edward L. McCormick, President
Michael Riehl, Vice President
Ralph Chiumento, Jr.
Mary Falcone
Thomas Johnson
Robert M. Meade
Jim Milano
Nancy Pisanelli, Clerk of the Board
ADMINISTRATIVE STAFF John C. Pennoyer
District Superintendent
Linda Anne Heitmann Assistant Superintendent – Educational Services
Linda Poleski
Assistant Superintendent – Business Services

DUTCHESS COUNTY CHIEF SCHOOL OFFICERS
Geoffrey M. Hicks, Superintendent Arlington Central School District
Fern Aefsky, Superintendent Beacon City School District
Michael Tierney, Superintendent
Dover Union Free School District
Greer F. Fischer, Superintendent Hyde Park Central School District
R. Lloyd Jaeger, Superintendent
Millbrook Central School District
Joseph Sciortino, Superintendent Pawling Central School District
Linda L. Kaumeyer, Superintendent Pine Plains Central School District
Laval S. Wilson, Superintendent
Poughkeepsie City School District
Paul Finch, Superintendent Red Hook Central School District
Joseph Phelan, Superintendent
Rhinebeck Central School District
Lois Powell, Superintendent Spackenkill Union Free School District
James A. Parla, Superintendent
Wappingers Central School District
Steven D. Schoonmaker, Superintendent Webutuck Central School District

DUTCHESS COUNTY SCHOOL BOARDS ASSOCIATION OFFICERS AND DIRECTORS
Kelly Lappan, President Arlington Board of Education
John Rudy, Vice President
Millbrook Board of Education
Raymond Duncan, Legislation Director Poughkeepsie Board of Education
Elissa Cascio, Program Director Rhinebeck Board of Education
Lynne Cruger, Executive Director and Treasurer
Dorothy Slattery, Area 9 Director

DUTCHESS COUNTY SCHOOL BOARDS ASSOCIATION EXECUTIVE COMMITTEE
Christine Baxter Arlington Central School District
William Zopf
Beacon City School District
Lisa Seifts Dover Union Free School District
Mary Falcone
Dutchess BOCES
Douglas Hieter and John Seagren Hyde Park Central School District
John Rudy
Millbrook Central School District
Eric Harris Pawling Central School District
Heather Boucher
Pine Plains Central School District
Raymond Duncan Poughkeepsie City School District
Frank Knobloch
Red Hook Central School District
Elissa Cascio Rhinebeck Central School District
Michael McCall
Spackenkill Union Free School District

TABLE OF CONTENTS Description Page Numbers
Totals to
Totals
Totals to Totals CPI Adjusted
Cost per
Pupil
Cost per Pupil
CPI Adjusted
Other Narrative Information 1 - 3 Student Enrollment 4
Revenues 5 6 7 8 Property Taxes 9 10 11 12
Tax Assessed at True Value 13 State Aid 14 15 16 17
Total Expenditures 18 19 20 21 Basic Expenditures 22 23 24 25 Special Education 27 28 29 30 26
Classroom Instruction 31 32 33 34 Total Administration 35 36 37 38
Central Administration 39 40 41 42 Building Administration 43 44 45 46
Employee Benefits 47 48 49 50 Transportation Costs 51 52 53 54
Plant Operations 55 56 57 58 Interscholastic & Co-Curricular Costs 59 60 61 62

Page 1
DUTCHESS COUNTY SCHOOL DISTRICTS FACT SHEET FOR PERIOD 2005-2006 through 2009-2010
I. BACKGROUND
A. Data is taken from the “Dutchess County Contract Analysis” booklet that is prepared annually.
B. In reviewing each of the charts please note that the information is compiled by: 1. Total cost for each category 2. Total cost adjusted by CPI 3. Cost per pupil 4. Cost per pupil adjusted by CPI
C. The CPI factor used in this document is the State Education Department’s annual allowable transportation contract adjustment.
D. The data in the book has been taken from each district’s SAMS that is annually filed with the State Education Department.
II. DEFINITIONS
A. Total Expenditures – Includes the total General Fund expenditures.
B. Basic Expenditures – Includes Total Expenditures less Special Items (certiorari, etc…), Transportation, Community Service, Debt Service, and Interfund Transfers.
C. Special Education – Includes all direct expenditures for special education services, but does not recognize special education expense for pupil personnel costs, transportation costs, legal costs, or staff employees’ benefits.
D. Classroom Instruction - Includes the costs for instructional/non-instructional salaries, equipment, supplies, contractual, tuitions, textbooks, and BOCES services for Teaching-Regular School, Special Education, Occupational Education, and Teaching-Special Schools. Excluded are employees’ benefits for those persons employed in the above-indicated areas.
E. Central Administration – Includes the costs for instructional/non-instructional salaries, equipment, supplies, contractual, tuitions, textbooks, and BOCES services for Chief School Administrator, Total Finance Office, Legal, Personnel. Records Management and Public Information. Excluded are employees’ benefits for those persons employed in the above-indicated areas.
F. Building Administration - Excluded are employees’ benefits for those persons employed in the above indicated areas for Curriculum Development and Supervision; Supervision – Regular School; Supervision-Special Schools; Research, Planning and Evaluation; and In-service Training-Instruction. Excluded are employees’ benefits for those persons employed in the above-indicated areas.

Page 2
G. Employee Benefits – Includes the costs for the Employees’ Retirement, Teachers’ Retirement, Workers’ Compensation, Social Security, Life Insurance, Unemployment Insurance, Medical Insurance, and Dental Insurance.
H. Transportation Costs – Includes the cost for regular and special education transportation expenses comprising salaries, equipment, bus purchases, materials/supplies, and BOCES services, garage-building expenses, and contracted transportation costs. Excluded are the debt service on purchased busses and employee benefits for those persons employed above.
I. Plant Operations – Includes the cost of operation and maintenance, comprising salaries, equipment, contractual such as utilities, material/supplies, and BOCES services such as safety compliance. Excluded are the employee benefits for those persons employed above.
J. Interscholastic Sports and Co-Curricular Activities – Includes the cost of salaries, equipment, contractual, material/supplies, and BOCES services. Excluded are the employee benefits for those persons employed above.
III. FACTS
A. Student enrollment in the Dutchess BOCES catchment area decreased over the five-year period, at -3.20%, compared to -2.59% losses in last year’s report. Nine of the thirteen districts experienced declines in population. Of the four districts that reported growth, the increase was 0, 1 and5 students and 60 for the city of Poughkeepsie.
B. The Total Revenue for the five-year period increased by 22.36%. When the 05/06 figures are adjusted by CPI there was a decrease in revenue growth of -.72%. If you analyze the same data on a per pupil basis, the respective figures are 26.23% and 2.42%.
C. Over the period of the study the amount of money collected by the property tax increased by 23.5% as compared to 31.79% in last year’s report. The CPI adjustment reduces the percentage increase to less than 1 percent compared to 6.72% previously. Six districts reported a decrease in property taxes when adjusted for CPI.
D. Taxable property value decreased by -3.57% as compared to a decrease of 3.99% in the previous report.
E. The overall increases in State Aid were 17.55% and when adjusted for inflation the increase is -4.62%. This is a decrease in the growth in state aid over the previous 5 year period. Eight districts reported a decrease in aid when adjusted for CPI.
F. Total expense in the BOCES region increased by 20.93% or -1.88% when adjusted for inflation. The per-pupil analyses show respective increase of 24.76% and 1.22%. This is a smaller growth in expenditures than reported in last year’s report. The analyses of specific types of expense reveal a reduction in growth in every category of expense and a negative growth when adjusted for CPI with the exception of employee benefits. Benefits showed an increase of .91% down from 16.58% during the previous period.
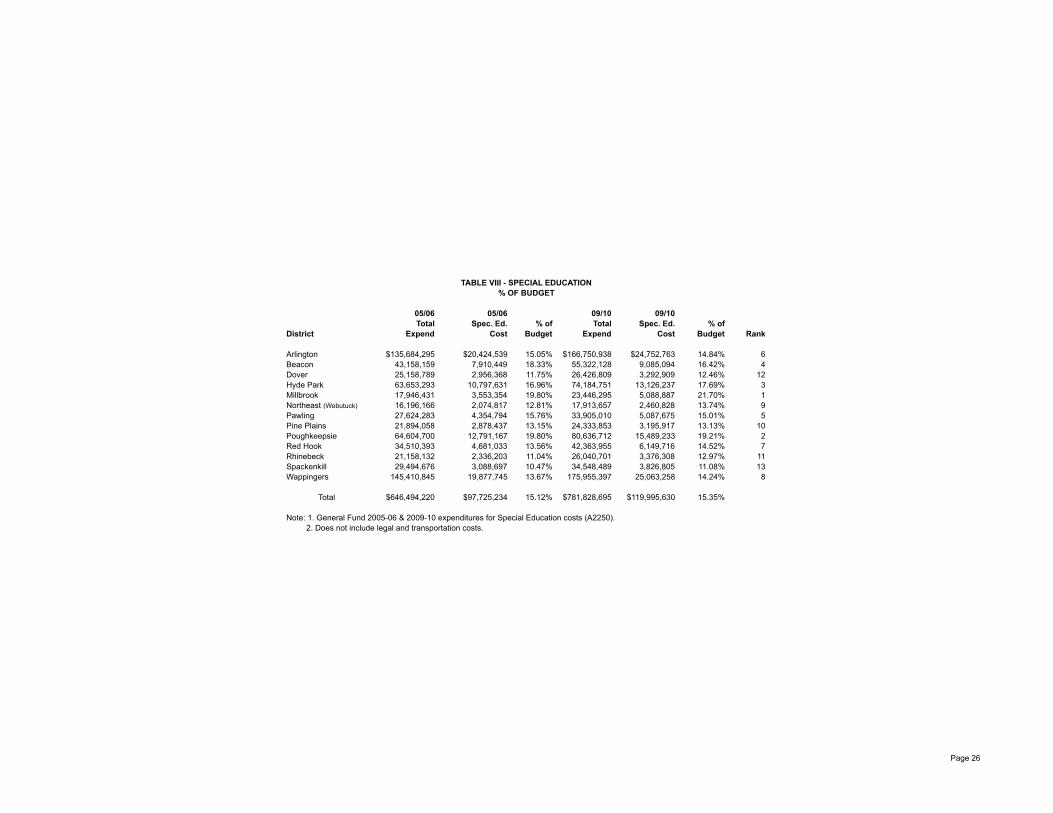
G. Special Education as a part of the overall budget is almost the same at 15.35% from 14.85%.

Page 3
IV. ANALYSIS When 2005-06 amounts are adjusted for CPI there is a decrease for the five year period in all but two of the income and expense areas: Revenue and State Aid Total Expenditures and Basic Expenditures Classroom Instructional Costs Total Administrative Costs, Central Administrative Costs and Building Level Administrative Costs Transportation Plant Operations
Co-Curricular and Interscholastic Sports Only two areas reported an increase and it was less than 1%: Property Taxes Employee Benefits
One conclusion that can be drawn from the data is that in Dutchess County, State Aid, as a portion of the revenue stream is declining and placing even more pressure on the homeowner through property taxes. During this period we see a continued decline in property values impacting the tax rate. In this economic climate that is not practical. The smaller increase in property taxes is evidence of this. Certiorari expense has increased in some districts. The political pressures and proposed spending and tax caps are placing ever increasing strain on the educational system. School districts are responding by containing the growth in expenses by reducing program and staffing where possible. Mandated costs and meeting the increasing need of students make this difficult. The mandate has increase for Academic Intervention Services and collection and retention of data on students. The increase in health insurance is being mitigated by more cost sharing on the part of employees. Many employee contracts remain unsettled and the settled ones are showing smaller increases. Pension costs continue to rise. The new tier in the system will help in the future but is offering no relief in the present. This is resulting in increases in class size and fewer choices and supports for students. In some cases, there is a decrease in co curricular and athletic activities and educational support for general education students. The current economic climate will continue to put a strain on our communities and on the educational system. The State’s fiscal deficit and the projected decreases in state aid and federal aid will present a challenge for school officials, tax payers and parents.

Page 4
05/06 09/10Student Student %
District Enrollment Enrollment Growth Growth Rank
Arlington 10,322 10,041 -281 -2.72% 5Beacon 3,380 3,380 0 0.00% 4Dover 1,714 1,612 -102 -5.95% 9Hyde Park 4,616 4,116 -500 -10.83% 12Millbrook 1,213 1,214 1 0.08% 2Northeast (Webutuck) 908 830 -78 -8.59% 10Pawling 1,452 1,396 -56 -3.86% 7Pine Plains 1,334 1,126 -208 -15.59% 13Poughkeepsie 4,606 4,666 60 1.30% 1Red Hook 2,364 2,231 -133 -5.63% 8Rhinebeck 1,235 1,191 -44 -3.56% 6Spackenkill 1,826 1,647 -179 -9.80% 11Wappingers 12,401 12,406 5 0.04% 3
Total 47,371 45,856 -1,515 -3.20%
TABLE I - STUDENT ENROLLMENT

Page 5
05/06 09/10 %Total Total Revenue Revenue
District Revenue Revenue Increase Increase Rank
Arlington $134,751,646 $171,206,205 $36,454,559 27.05% 2Beacon 51,069,449 55,382,162 4,312,713 8.44% 13Dover 24,017,576 27,543,639 3,526,063 14.68% 11Hyde Park 65,128,088 77,930,093 12,802,005 19.66% 10Millbrook 17,935,157 23,726,306 5,791,149 32.29% 1Northeast (Webutuck) 15,807,880 17,874,696 2,066,816 13.07% 12Pawling 26,975,165 33,981,552 7,006,387 25.97% 3Pine Plains 20,858,365 26,108,831 5,250,466 25.17% 5Poughkeepsie 64,640,800 80,927,355 16,286,555 25.20% 4Red Hook 34,873,923 42,146,211 7,272,288 20.85% 9Rhinebeck 21,434,927 26,128,315 4,693,388 21.90% 8Spackenkill 29,345,431 36,000,524 6,655,093 22.68% 7Wappingers 144,587,658 178,155,669 33,568,011 23.22% 6
Total $651,426,065 $797,111,558 $145,685,493 22.36%
Note: 1. Total Revenues for 2005-06 are from ST-3, DP Code 111. 2. Total Revenues for 2009-10 are from SAMS, DP code 114
TABLE II - TOTAL REVENUESCOMPARISON OF TOTAL REVENUES FOR 2005-06 to 2009-10

Page 6
05/06 09/10 %Total Total Revenue Revenue
District Revenue Revenue Increase Increase Rank
Arlington $166,081,404 $171,206,205 $5,124,801 3.09% 2Beacon $62,943,096 55,382,162 -7,560,934 -12.01% 13Dover $29,601,662 27,543,639 -2,058,023 -6.95% 11Hyde Park $80,270,368 77,930,093 -2,340,275 -2.92% 10Millbrook $22,105,081 23,726,306 1,621,225 7.33% 1Northeast (Webutuck) $19,483,212 17,874,696 -1,608,516 -8.26% 12Pawling $33,246,891 33,981,552 734,661 2.21% 3Pine Plains $25,707,935 26,108,831 400,896 1.56% 5Poughkeepsie $79,669,786 80,927,355 1,257,569 1.58% 4Red Hook $42,982,110 42,146,211 -835,899 -1.94% 9Rhinebeck $26,418,548 26,128,315 -290,233 -1.10% 8Spackenkill $36,168,244 36,000,524 -167,720 -0.46% 7Wappingers $178,204,288 178,155,669 -48,619 -0.03% 6
Total $802,882,625 $797,111,558 -$5,771,067 -0.72%
Note: 1. Total Revenues for 2005-06 are from ST-3, DP Code 111 2. Total Revenues for 2009-10 are from SAMS, DP code 114 3. CPI is from SED and % used for transportation contracts:
05/06 3.406/07 4.807/08 2.508/09 4.009/10 -0.1
5 year compounded rate of 23.25%
TABLE II - A - TOTAL REVENUES ADJUSTED FOR CPICOMPARISON OF TOTAL REVENUES FOR 2005-06 to 2009-10
ADJUSTED BY CPI

Page 7
COMPARISON OF REVENUE GROWTH ON A PER STUDENT BASIS FOR 2005-06 to 2009-10
05/06 05/06 05/06 09/10 09/10 09/10 Revenue % RevenueStudent Total Revenue Student Total Revenue Increase Increase
District Enrollment Revenue Per Student Enrollment Revenue Per Student Per Student Per Student Rank
Arlington 10,322 $134,751,646 $13,055 10,041 $171,206,205 $17,051 $3,996 30.61% 6Beacon 3,380 51,069,449 15,109 3,443 55,382,162 16,085 976 6.46% 13Dover 1,714 24,017,576 14,013 1,612 27,543,639 17,087 3,074 21.94% 12Hyde Park 4,616 65,128,088 14,109 4,116 77,930,093 18,933 4,824 34.19% 3Millbrook 1,213 17,935,157 14,786 1,214 23,726,306 19,544 4,758 32.18% 4Northeast (Webutuck) 908 15,807,880 17,410 830 17,874,696 21,536 4,126 23.70% 9Pawling 1,452 26,975,165 18,578 1,396 33,981,552 24,342 5,764 31.03% 5Pine Plains 1,334 20,858,365 15,636 1,126 26,108,831 23,187 7,551 48.29% 1Poughkeepsie 4,606 64,640,800 14,034 4,666 80,927,355 17,344 3,310 23.59% 10Red Hook 2,364 34,873,923 14,752 2,231 42,146,211 18,891 4,139 28.06% 7Rhinebeck 1,235 21,434,927 17,356 1,191 26,128,315 21,938 4,582 26.40% 8Spackenkill 1,826 29,345,431 16,071 1,647 36,000,524 21,858 5,787 36.01% 2Wappingers 12,401 144,587,658 11,659 12,406 178,155,669 14,360 2,701 23.17% 11
Total 47,371 $651,426,065 $13,752 45,919 $797,111,558 $17,359 $3,607 26.23%
Note: 1. Total Revenues for 2005-06 are from ST-3, DP Code 111. 2. Total Revenues for 2009-10 are from SAMS, DP code 114.
TABLE II - B - TOTAL REVENUES PER STUDENT

Page 8
05/06 05/06 05/06 09/10 09/10 09/10 Increase % IncreaseStudent Total Revenue Student Total Revenue Revenue Revenue
District Enrollment Revenue Per Student Enrollment Revenue Per Student Per Student Per Student Rank
Arlington 10,322 $166,081,404 $16,090 10,041 $171,206,205 $17,051 $961 5.97% 6Beacon 3,380 $62,943,096 18,622 3,443 55,382,162 16,085 -2,537 -13.62% 13Dover 1,714 $29,601,662 17,271 1,612 27,543,639 17,087 -184 -1.06% 12Hyde Park 4,616 $80,270,368 17,390 4,116 77,930,093 18,933 1,544 8.88% 3Millbrook 1,213 $22,105,081 18,223 1,214 23,726,306 19,544 1,320 7.25% 4Northeast (Webutuck) 908 $19,483,212 21,457 830 17,874,696 21,536 78 0.37% 9Pawling 1,452 $33,246,891 22,897 1,396 33,981,552 24,342 1,445 6.31% 5Pine Plains 1,334 $25,707,935 19,271 1,126 26,108,831 23,187 3,916 20.32% 1Poughkeepsie 4,606 $79,669,786 17,297 4,666 80,927,355 17,344 47 0.27% 10Red Hook 2,364 $42,982,110 18,182 2,231 42,146,211 18,891 709 3.90% 7Rhinebeck 1,235 $26,418,548 21,392 1,191 26,128,315 21,938 547 2.56% 8Spackenkill 1,826 $36,168,244 19,807 1,647 36,000,524 21,858 2,051 10.35% 2Wappingers 12,401 $178,204,288 14,370 12,406 178,155,669 14,360 -10 -0.07% 11
Total 47,371 $802,882,625 $16,949 45,919 $797,111,558 $17,359 $410 2.42%
Note: 1. Total Revenues for 2005-06 are from ST-3, DP Code 111 2. Total Revenues for 2009-10 are from SAMS, DP code 114. 3. CPI is from SED and % used for transportation contracts:
05/06 3.406/07 4.807/08 2.508/09 4.009/10 -0.1
5 year compounded rate of 23.25%
TABLE II - C - TOTAL REVENUES PER STUDENT ADJUSTED FOR CPICOMPARISON OF REVENUE GROWTH ON A PER STUDENT BASIS FOR 2005-06 to 2009-10
2005-06 REVENUES ADJUSTED FOR CPI

Page 9
05/06 09/10 IncreaseProp. Prop. Prop. % Prop.
District Taxes Taxes Taxes Tax Inc. Rank
Arlington $80,033,394 $100,324,572 $20,291,178 25.35% 5Beacon 21,523,652 25,315,231 3,791,579 17.62% 12Dover 11,860,666 14,159,955 2,299,289 19.39% 11Hyde Park 35,833,748 42,834,978 7,001,230 19.54% 10Millbrook 13,920,456 18,200,986 4,280,530 30.75% 2Northeast (Webutuck) 8,666,524 10,627,767 1,961,243 22.63% 8Pawling 19,934,107 25,295,922 5,361,815 26.90% 4Pine Plains 11,847,410 16,819,753 4,972,343 41.97% 1Poughkeepsie 17,895,192 19,618,174 1,722,982 9.63% 13Red Hook 17,958,467 23,115,519 5,157,052 28.72% 3Rhinebeck 16,583,662 20,676,267 4,092,605 24.68% 6Spackenkill 21,154,248 25,333,403 4,179,155 19.76% 9Wappingers 84,201,240 104,031,742 19,830,502 23.55% 7
Total $361,412,766 $446,354,269 $84,941,503 23.50%
Note: Property Taxes 2005-06 are from ST-3, Code A1001. Property Taxes 2009-10 are from SAMS, DP code 1.
TABLE III - PROPERTY TAXESCOMPARISON OF PROPERTY TAXES FOR 2005-06 to 2009-10

Page 10
05/06 09/10Prop. Prop. Increase % Increase
District Taxes Taxes Prop. Tax Prop. Tax Rank
Arlington $98,641,158 $100,324,572 $1,683,414 1.71% 5Beacon $26,527,901 25,315,231 -1,212,670 -4.57% 12Dover $14,618,271 14,159,955 -458,316 -3.14% 11Hyde Park $44,165,094 42,834,978 -1,330,116 -3.01% 10Millbrook $17,156,962 18,200,986 1,044,024 6.09% 2Northeast (Webutuck) $10,681,491 10,627,767 -53,724 -0.50% 8Pawling $24,568,787 25,295,922 727,135 2.96% 4Pine Plains $14,601,933 16,819,753 2,217,820 15.19% 1Poughkeepsie $22,055,824 19,618,174 -2,437,650 -11.05% 13Red Hook $22,133,811 23,115,519 981,708 4.44% 3Rhinebeck $20,439,363 20,676,267 236,904 1.16% 6Spackenkill $26,072,611 25,333,403 -739,208 -2.84% 9Wappingers $103,778,028 104,031,742 253,714 0.24% 7
Total $445,441,234 $446,354,269 $913,035 0.20%
Note: 1. Property Taxes 2005-06 are from ST-3, DP Code A1001. 2. Property Taxes 2009-10 are from SAMS, DP code 1. 3. CPI is from SED and % used for transportation contracts:
05/06 3.406/07 4.807/08 2.508/09 4.009/10 -0.1
5 year compounded rate of 23.25%
TABLE III - A - PROPERTY TAXES ADJUSTED FOR CPICOMPARISON OF PROPERTY TAXES FOR 2005-06 to 2009-10
2005-06 PROPERTY TAXES ADJUSTED WITH CPI

Page 11
05/06 05/06 05/06 09/10 09/10 09/10 IncreaseStudent Prop. Prop. Tax Student Prop. Prop. Tax Prop. Tax % Increase
District Enrollment Taxes Per Student Enrollment Taxes Per Student Per Student Per Student Rank
Arlington 10,322 $80,033,394 $7,754 10,041 $100,324,572 $9,991 $2,238 28.86% 9Beacon 3,380 21,523,652 6,368 3,443 25,315,231 7,353 985 15.46% 12Dover 1,714 11,860,666 6,920 1,612 14,159,955 8,784 1,864 26.94% 10Hyde Park 4,616 35,833,748 7,763 4,116 42,834,978 10,407 2,644 34.06% 4Millbrook 1,213 13,920,456 11,476 1,214 18,200,986 14,993 3,517 30.64% 7Northeast (Webutuck) 908 8,666,524 9,545 830 10,627,767 12,805 3,260 34.15% 3Pawling 1,452 19,934,107 13,729 1,396 25,295,922 18,120 4,392 31.99% 6Pine Plains 1,334 11,847,410 8,881 1,126 16,819,753 14,938 6,056 68.20% 1Poughkeepsie 4,606 17,895,192 3,885 4,666 19,618,174 4,204 319 8.22% 13Red Hook 2,364 17,958,467 7,597 2,231 23,115,519 10,361 2,764 36.39% 2Rhinebeck 1,235 16,583,662 13,428 1,191 20,676,267 17,360 3,932 29.28% 8Spackenkill 1,826 21,154,248 11,585 1,647 25,333,403 15,382 3,797 32.77% 5Wappingers 12,401 84,201,240 6,790 12,406 104,031,742 8,386 1,596 23.50% 11
Total 47,371 $361,412,766 $7,629 45,919 $446,354,269 $9,720 $2,091 27.41%
Note: 1. Property Taxes 2005-06 are from ST-3, DP Code A1001. 2. Property Taxes 2009-10 are from SAMS, DP code 1.
TABLE III - B - PROPERTY TAXES PER STUDENTCOMPARISON OF PROPERTY TAX GROWTH ON A PER STUDENT BASIS FOR 2005-06 to 2009-10

Page 12
COMPARISON OF PROPERTY TAX GROWTH ON A PER STUDENT BASIS FOR 2005-06 to 2009-102005-06 PROPERTY TAXES ADJUSTED FOR CPI
05/06 05/06 05/06 09/10 09/10 09/10 IncreaseStudent Prop. Prop. Tax Student Prop. Prop. Tax Prop. Tax % Inc.
District Enrollment Taxes Per Student Enrollment Taxes Per Student Per Student Per Student Rank
Arlington 10,322 $98,641,158 $9,556 10,041 $100,324,572 $9,991 $435 4.55% 9Beacon 3,380 $26,527,901 7,848 3,443 25,315,231 7,353 -496 -6.32% 12Dover 1,714 $14,618,271 8,529 1,612 14,159,955 8,784 255 2.99% 10Hyde Park 4,616 $44,165,094 9,568 4,116 42,834,978 10,407 839 8.77% 4Millbrook 1,213 $17,156,962 14,144 1,214 18,200,986 14,993 848 6.00% 7Northeast (Webutuck) 908 $10,681,491 11,764 830 10,627,767 12,805 1,041 8.85% 3Pawling 1,452 $24,568,787 16,921 1,396 25,295,922 18,120 1,200 7.09% 6Pine Plains 1,334 $14,601,933 10,946 1,126 16,819,753 14,938 3,992 36.47% 1Poughkeepsie 4,606 $22,055,824 4,788 4,666 19,618,174 4,204 -584 -12.20% 13Red Hook 2,364 $22,133,811 9,363 2,231 23,115,519 10,361 998 10.66% 2Rhinebeck 1,235 $20,439,363 16,550 1,191 20,676,267 17,360 810 4.90% 8Spackenkill 1,826 $26,072,611 14,279 1,647 25,333,403 15,382 1,103 7.72% 5Wappingers 12,401 $103,778,028 8,369 12,406 104,031,742 8,386 17 0.20% 11
Total 47,371 $445,441,234 $9,403 45,919 $446,354,269 $9,720 $317 3.37%
Note: 1. Property Taxes 2005-06 are from ST-3, DP Code A1001. 2. Property Taxes 2009-10 are from SAMS, DP code 1. 3. CPI is from SED and % used for transportation contracts:
05/06 3.406/07 4.807/08 2.508/09 4.009/10 -0.1
5 year compounded rate of 23.25%
TABLE III - C - PROPERTY TAXES PER STUDENT ADJUSTED FOR CPI

Page 13
09/10 10/11Taxable Taxable
Assessment Assessment Amount %District at True Value at True Value Change Change Rank
Arlington $6,644,287,838 $6,128,178,886 -$516,108,952 -7.77% 6Beacon 2,332,273,674 2,171,164,130 -161,109,544 -6.91% 5Dover 1,057,587,370 949,709,265 -107,878,105 -10.20% 11Hyde Park 3,187,283,749 2,770,033,299 -417,250,450 -13.09% 12Millbrook 2,004,607,274 1,805,274,362 -199,332,912 -9.94% 10Northeast (Webutuck) 1,025,115,753 996,998,333 -28,117,420 -2.74% 1Pawling 1,708,746,526 1,457,903,591 -250,842,935 -14.68% 13Pine Plains 1,859,654,744 1,677,331,053 -182,323,691 -9.80% 9Poughkeepsie 2,235,842,353 2,158,428,468 -77,413,885 -3.46% 2Red Hook 1,622,875,001 1,542,284,823 -80,590,178 -4.97% 4Rhinebeck 1,825,585,451 1,658,926,562 -166,658,889 -9.13% 8Spackenkill 1,257,523,137 1,155,124,802 -102,398,335 -8.14% 7Wappingers 9,931,927,031 9,444,188,920 -487,738,111 -4.91% 3
Total $36,693,309,901 $33,915,546,494 -$2,777,763,407 -7.57%
TABLE IV - TOTAL PROPERTY VALUE

Page 14
05/06 09/10 State % StateState State Aid Aid
District Aid Aid Increase Increase Rank
Arlington $38,611,904 $48,099,838 $9,487,934 24.57% 5Beacon 19,256,591 23,591,849 4,335,258 22.51% 6Dover 9,661,019 9,752,952 91,933 0.95% 11Hyde Park 19,629,284 23,095,834 3,466,550 17.66% 8Millbrook 2,191,736 2,985,455 793,719 36.21% 1Northeast (Webutuck) 5,673,056 5,348,936 -324,120 -5.71% 12Pawling 4,355,514 5,506,944 1,151,430 26.44% 3Pine Plains 6,738,740 6,122,004 -616,736 -9.15% 13Poughkeepsie 41,911,151 52,635,773 10,724,622 25.59% 4Red Hook 13,080,651 14,258,852 1,178,201 9.01% 10Rhinebeck 2,378,831 2,838,030 459,199 19.30% 7Spackenkill 4,901,105 6,619,319 1,718,214 35.06% 2Wappingers 38,857,995 42,771,935 3,913,940 10.07% 9
Total $207,247,577 $243,627,721 $36,380,144 17.55%
Note: State Aid 2005-06 is from ST-3, Code AT3999. State Aid 2009-10 is from SAMS, DP code 94.
TABLE V - STATE AIDCOMPARISON OF STATE AID FROM 2005-06 to 2009-10

Page 15
05/06 09/10 State % StateState State Aid Aid
District Aid Aid Increase Increase Rank
Arlington $47,589,172 $48,099,838 $510,666 1.07% 5Beacon $23,733,748 23,591,849 -141,899 -0.60% 6Dover $11,907,206 9,752,952 -2,154,254 -18.09% 11Hyde Park $24,193,093 23,095,834 -1,097,259 -4.54% 8Millbrook $2,701,315 2,985,455 284,140 10.52% 1Northeast (Webutuck) $6,992,042 5,348,936 -1,643,106 -23.50% 12Pawling $5,368,171 5,506,944 138,773 2.59% 3Pine Plains $8,305,497 6,122,004 -2,183,493 -26.29% 13Poughkeepsie $51,655,494 52,635,773 980,279 1.90% 4Red Hook $16,121,902 14,258,852 -1,863,050 -11.56% 10Rhinebeck $2,931,909 2,838,030 -93,879 -3.20% 7Spackenkill $6,040,612 6,619,319 578,707 9.58% 2Wappingers $47,892,479 42,771,935 -5,120,544 -10.69% 9
Total $255,432,639 $243,627,721 -$11,804,918 -4.62%
Note: 1. State Aid 2005-06 is from ST-3, DP Code AT3999. 2. State Aid 2009-10 is from SAMS, DP code 94. 3. CPI is from SED and % used for transportation contracts:
05/06 3.406/07 4.807/08 2.508/09 4.009/10 -0.1
5 year compounded rate of 23.25%
TABLE V - A - STATE AID ADJUSTED FOR CPICOMPARISON OF STATE AID FROM 2005-06 to 2009-10
2005-06 STATE AID ADJUSTED FOR CPI

Page 16
COMPARISON OF STATE AID ON A PER STUDENT BASIS FOR 2005-06 to 2009-10
05/06 05/06 05/06 09/10 09/10 09/10 State AidStudent State State Aid Student State State Aid Per Student % Increase
District Enrollment Aid Per Student Enrollment Aid Per Student Increase Per Student Rank
Arlington 10,322 $38,611,904 $3,741 10,041 $48,099,838 $4,790 $1,050 28.06% 5Beacon 3,380 19,256,591 5,697 3,443 23,591,849 6,852 1,155 20.27% 8Dover 1,714 9,661,019 5,637 1,612 9,752,952 6,050 414 7.34% 12Hyde Park 4,616 19,629,284 4,252 4,116 23,095,834 5,611 1,359 31.95% 3Millbrook 1,213 2,191,736 1,807 1,214 2,985,455 2,459 652 36.10% 2Northeast (Webutuck) 908 5,673,056 6,248 830 5,348,936 6,445 197 3.15% 13Pawling 1,452 4,355,514 3,000 1,396 5,506,944 3,945 945 31.51% 4Pine Plains 1,334 6,738,740 5,052 1,126 6,122,004 5,437 385 7.63% 11Poughkeepsie 4,606 41,911,151 9,099 4,666 52,635,773 11,281 2,181 23.97% 6Red Hook 2,364 13,080,651 5,533 2,231 14,258,852 6,391 858 15.51% 9Rhinebeck 1,235 2,378,831 1,926 1,191 2,838,030 2,383 457 23.71% 7Spackenkill 1,826 4,901,105 2,684 1,647 6,619,319 4,019 1,335 49.74% 1Wappingers 12,401 38,857,995 3,133 12,406 42,771,935 3,448 314 10.03% 10
Total 47,371 $207,247,577 $4,375 45,919 $243,627,721 $5,306 $931 21.27%
Note: State Aid 2005-06 is from ST-3, Code AT3999. State Aid 2009-10 is from SAMS, DP code 94.
TABLE V - B - STATE AID PER STUDENT

Page 17
05/06 05/06 05/06 09/10 09/10 09/10 State AidStudent State State Aid Student State State Aid Per Student % Increase
District Enrollment Aid Per Student Enrollment Aid Per Student Increase Per Student Rank
Arlington 10,322 $47,589,172 $4,610 10,041 $48,099,838 $4,790 $180 3.90% 5Beacon 3,380 $23,733,748 7,022 3,443 23,591,849 6,852 -170 -2.42% 8Dover 1,714 $11,907,206 6,947 1,612 9,752,952 6,050 -897 -12.91% 12Hyde Park 4,616 $24,193,093 5,241 4,116 23,095,834 5,611 370 7.06% 3Millbrook 1,213 $2,701,315 2,227 1,214 2,985,455 2,459 232 10.43% 2Northeast (Webutuck) 908 $6,992,042 7,700 830 5,348,936 6,445 -1,256 -16.31% 13Pawling 1,452 $5,368,171 3,697 1,396 5,506,944 3,945 248 6.70% 4Pine Plains 1,334 $8,305,497 6,226 1,126 6,122,004 5,437 -789 -12.67% 11Poughkeepsie 4,606 $51,655,494 11,215 4,666 52,635,773 11,281 66 0.59% 6Red Hook 2,364 $16,121,902 6,820 2,231 14,258,852 6,391 -429 -6.28% 9Rhinebeck 1,235 $2,931,909 2,374 1,191 2,838,030 2,383 9 0.37% 7Spackenkill 1,826 $6,040,612 3,308 1,647 6,619,319 4,019 711 21.49% 1Wappingers 12,401 $47,892,479 3,862 12,406 42,771,935 3,448 -414 -10.73% 10
Total 47,371 $255,432,639 $5,392 45,919 $243,627,721 $5,306 -$87 -1.61%
Note: 1. State Aid 2005-06 is from ST-3, Code AT3999. 2. State Aid 2009-10 is from SAMS, DP code 94. 3. CPI is from SED and % used for transportation contracts:
05/06 3.406/07 4.807/08 2.508/09 4.009/10 -0.1
5 year compounded rate of 23.25%
TABLE V - C - STATE AID PER STUDENT ADJUSTED FOR CPICOMPARISON OF STATE AID ON A PER STUDENT BASIS FOR 2005-06 to 2009-10
2005-06 STATE AID ADJUSTED FOR CPI

Page 18
05/06 09/10 Total %TotalTotal Total Expenditure Expenditure
District Expenditure Expenditure Increase Increase Rank
Arlington $135,684,295 $166,750,938 $31,066,643 22.90% 5Beacon 43,158,159 55,322,128 12,163,969 28.18% 2Dover 25,158,789 26,426,809 1,268,020 5.04% 13Hyde Park 63,653,293 74,184,751 10,531,458 16.55% 10Millbrook 17,946,431 23,446,295 5,499,864 30.65% 1Northeast (Webutuck) 16,196,166 17,913,657 1,717,491 10.60% 12Pawling 27,624,283 33,905,010 6,280,727 22.74% 7Pine Plains 21,894,058 24,333,853 2,439,795 11.14% 11Poughkeepsie 64,604,700 80,636,712 16,032,012 24.82% 3Red Hook 34,510,393 42,363,955 7,853,562 22.76% 6Rhinebeck 21,158,132 26,040,701 4,882,569 23.08% 4Spackenkill 29,494,676 34,548,489 5,053,813 17.13% 9Wappingers 145,410,845 175,955,397 30,544,552 21.01% 8
Total $646,494,220 $781,828,695 $135,334,475 20.93%
Note: Total Expenditures 2005-06 are from ST-3, Code AT9999. Total Expenditures 2009-10 are from SAMS, DP code 436.
TABLE VI - TOTAL EXPENDITURESCOMPARISON OF TOTAL EXPENDITURES FOR 2005-06 to 2009-10

Page 19
05/06 09/10 Total % TotalTotal Total Expenditure Expenditure
District Expenditure Expenditure Increase Increase Rank
Arlington $167,230,894 $166,750,938 -$479,956 -0.29% 5Beacon $53,192,431 55,322,128 2,129,697 4.00% 2Dover $31,008,207 26,426,809 -4,581,398 -14.77% 13Hyde Park $78,452,684 74,184,751 -4,267,933 -5.44% 10Millbrook $22,118,976 23,446,295 1,327,319 6.00% 1Northeast (Webutuck) $19,961,775 17,913,657 -2,048,118 -10.26% 12Pawling $34,046,929 33,905,010 -141,919 -0.42% 7Pine Plains $26,984,426 24,333,853 -2,650,573 -9.82% 11Poughkeepsie $79,625,293 80,636,712 1,011,419 1.27% 3Red Hook $42,534,059 42,363,955 -170,104 -0.40% 6Rhinebeck $26,077,398 26,040,701 -36,697 -0.14% 4Spackenkill $36,352,188 34,548,489 -1,803,699 -4.96% 9Wappingers $179,218,866 175,955,397 -3,263,469 -1.82% 8
Total $796,804,126 $781,828,695 -$14,975,431 -1.88%
Note: 1. Total Expenditures 2005-06 are from ST-3, Code AT9999. 2. Total Expenditures 2009-10 are from SAMS, DP code 436. 3. CPI is from SED and % used for transportation contracts:
05/06 3.406/07 4.807/08 2.508/09 4.009/10 -0.1
5 year compounded rate of 23.25%
TABLE VI - A - TOTAL EXPENDITURES ADJUSTED FOR CPICOMPARISON OF TOTAL EXPENDITURES FOR 2005-06 to 2009-10
2005-06 TOTAL EXPENDITURES ADJUSTED FOR CPI

Page 20
05/06 09/10 Total05/06 05/06 Per Student 09/10 09/10 Per Student Expenditure
Student Total Total Student Total Total Per Student % IncreaseDistrict Enroll Expenditure Expenditure Enroll Expenditure Expenditure Increase Per Student Rank
Arlington 10,322 $135,684,295 $13,145 10,041 $166,750,938 $16,607 $3,462 26.34% 8Beacon 3,380 43,158,159 12,769 3,443 55,322,128 16,068 3,299 25.84% 9Dover 1,714 25,158,789 14,678 1,612 26,426,809 16,394 1,715 11.69% 13Hyde Park 4,616 63,653,293 13,790 4,116 74,184,751 18,024 4,234 30.70% 2Millbrook 1,213 17,946,431 14,795 1,214 23,446,295 19,313 4,518 30.54% 3Northeast (Webutuck) 908 16,196,166 17,837 830 17,913,657 21,583 3,746 21.00% 11Pawling 1,452 27,624,283 19,025 1,396 33,905,010 24,287 5,262 27.66% 6Pine Plains 1,334 21,894,058 16,412 1,126 24,333,853 21,611 5,199 31.67% 1Poughkeepsie 4,606 64,604,700 14,026 4,666 80,636,712 17,282 3,256 23.21% 10Red Hook 2,364 34,510,393 14,598 2,231 42,363,955 18,989 4,390 30.08% 4Rhinebeck 1,235 21,158,132 17,132 1,191 26,040,701 21,865 4,732 27.62% 7Spackenkill 1,826 29,494,676 16,153 1,647 34,548,489 20,977 4,824 29.87% 5Wappingers 12,401 145,410,845 11,726 12,406 175,955,397 14,183 2,457 20.96% 12
Total 47,371 $646,494,220 $13,647 45,919 $781,828,695 $17,026 $3,379 24.76%
Note: Total Expenditures 2005-06 are from ST-3, Code AT9999. Total Expenditures 2009-10 are from SAMS, DP code 436.
TABLE VI - B - TOTAL EXPENDITURES PER STUDENTCOMPARISON OF TOTAL EXPENDITURES FOR 2005-06 to 2009-10

Page 21
05/06 09/10 Total05/06 05/06 Per Student 09/10 09/10 Per Student Expenditure
Student Total Total Student Total Total Per Student % IncreaseDistrict Enroll Expenditure Expenditure Enroll Expenditure Expenditure Increase Per Student Rank
Arlington 10,322 $167,230,894 $16,201 10,041 $166,750,938 $16,607 $406 2.50% 8Beacon 3,380 $53,192,431 15,737 3,443 55,322,128 16,068 331 2.10% 9Dover 1,714 $31,008,207 18,091 1,612 26,426,809 16,394 -1,697 -9.38% 13Hyde Park 4,616 $78,452,684 16,996 4,116 74,184,751 18,024 1,028 6.05% 2Millbrook 1,213 $22,118,976 18,235 1,214 23,446,295 19,313 1,078 5.91% 3Northeast (Webutuck) 908 $19,961,775 21,984 830 17,913,657 21,583 -402 -1.83% 11Pawling 1,452 $34,046,929 23,448 1,396 33,905,010 24,287 839 3.58% 6Pine Plains 1,334 $26,984,426 20,228 1,126 24,333,853 21,611 1,383 6.84% 1Poughkeepsie 4,606 $79,625,293 17,287 4,666 80,636,712 17,282 -6 -0.03% 10Red Hook 2,364 $42,534,059 17,992 2,231 42,363,955 18,989 996 5.54% 4Rhinebeck 1,235 $26,077,398 21,115 1,191 26,040,701 21,865 749 3.55% 7Spackenkill 1,826 $36,352,188 19,908 1,647 34,548,489 20,977 1,069 5.37% 5Wappingers 12,401 $179,218,866 14,452 12,406 175,955,397 14,183 -269 -1.86% 12
Total 47,371 $796,804,126 $16,821 45,919 $781,828,695 $17,026 $206 1.22%
Note: 1.Total Expenditures 2005-06 are from ST-3, Code AT9999. 2. Total Expenditures 2009-10 are from SAMS, DP code 436. 3. CPI is from SED and % used for transportation contracts:
05/06 3.406/07 4.807/08 2.508/09 4.009/10 -0.1
5 year compounded rate of 23.25%
TABLE VI - C - TOTAL EXPENDITURES PER STUDENT ADJUSTED FOR CPICOMPARISON OF TOTAL EXPENDITURES FOR 2005-06 to 2009-10
2005-06 TOTAL EXPENDITURES ADJUSTED FOR CPI

Page 22
05/06 09/10 Basic % BasicBasic Expend. Basic Expend. Expend. Expend.
District Dollars Dollars Increase Increase Rank
Arlington $116,741,481 $139,559,580 $22,818,099 19.55% 8Beacon 36,467,126 45,400,494 8,933,368 24.50% 2Dover 19,511,852 22,178,865 2,667,013 13.67% 11Hyde Park 56,016,823 65,529,046 9,512,223 16.98% 9Millbrook 14,532,845 19,213,293 4,680,448 32.21% 1Northeast (Webutuck) 13,740,075 15,095,314 1,355,239 9.86% 13Pawling 23,786,960 29,002,001 5,215,041 21.92% 6Pine Plains 19,135,828 21,147,353 2,011,525 10.51% 12Poughkeepsie 60,394,759 74,822,927 14,428,168 23.89% 3Red Hook 29,675,970 36,264,970 6,589,000 22.20% 4Rhinebeck 18,044,934 21,974,458 3,929,524 21.78% 7Spackenkill 27,082,033 31,180,734 4,098,701 15.13% 10Wappingers 128,865,366 157,353,343 28,487,977 22.11% 5
Total $563,996,052 $678,722,378 $114,726,326 20.34%
Note: Costs for Total Special Items (AT1998), Transportation (AT5599), Community Service (AT8999), Debt Service (AT9898) and Interfund Transfers (AT9959) are not included.
TABLE VII - BASIC EXPENDITURESCOMPARISON OF BASIC EXPENDITURES FOR 2005-06 to 2009-10

Page 23
05/06 09/10 Basic % BasicBasic Expend. Basic Expend. Expend. Expend.
District Dollars Dollars Increase Increase Rank
Arlington $143,883,875 $139,559,580 -$4,324,295 -3.01% 8Beacon $44,945,733 45,400,494 454,761 1.01% 2Dover $24,048,358 22,178,865 -1,869,493 -7.77% 11Hyde Park $69,040,734 65,529,046 -3,511,688 -5.09% 9Millbrook $17,911,731 19,213,293 1,301,562 7.27% 1Northeast (Webutuck) $16,934,642 15,095,314 -1,839,328 -10.86% 13Pawling $29,317,428 29,002,001 -315,427 -1.08% 6Pine Plains $23,584,908 21,147,353 -2,437,555 -10.34% 12Poughkeepsie $74,436,540 74,822,927 386,387 0.52% 3Red Hook $36,575,633 36,264,970 -310,663 -0.85% 4Rhinebeck $22,240,381 21,974,458 -265,923 -1.20% 7Spackenkill $33,378,606 31,180,734 -2,197,872 -6.58% 10Wappingers $158,826,564 157,353,343 -1,473,221 -0.93% 5
Total $695,125,134 $678,722,378 -$16,402,756 -2.36%
Note: 1. Costs for Total Special Items (AT1998), Transportation (AT5599), Community Service (AT8999), Debt Service (AT9898) and Interfund Transfers (AT9959) are not included. 2. CPI is from SED and % used for transportation contracts:
05/06 3.406/07 4.807/08 2.508/09 4.009/10 -0.1
5 year compounded rate of 23.25%
COMPARISON OF BASIC EXPENDITURES FOR 2005-06 to 2009-10TABLE VII - A - BASIC EXPENDITURES ADJUSTED FOR CPI
2005-06 BASIC EXPENDITURES ADJUSTED FOR CPI

Page 24
05/06 09/10 %05/06 05/06 Per Student 09/10 09/10 Per Student Basis Expend Basis Expend
Student Basic Expend. Basis Expend Student Basic Expend. Basis Expend Per Student Per StudentDistrict Enroll Dollars Dollars Enroll Dollars Dollars Increase Increase Rank
Arlington 10,322 $116,741,481 $11,310 10,041 $139,559,580 $13,899 $2,589 22.89% 8Beacon 3,380 36,467,126 10,789 3,443 45,400,494 13,186 2,397 22.22% 10Dover 1,714 19,511,852 11,384 1,612 22,178,865 13,759 2,375 20.86% 12Hyde Park 4,616 56,016,823 12,135 4,116 65,529,046 15,921 3,785 31.19% 2Millbrook 1,213 14,532,845 11,981 1,214 19,213,293 15,826 3,846 32.10% 1Northeast (Webutuck) 908 13,740,075 15,132 830 15,095,314 18,187 3,055 20.19% 13Pawling 1,452 23,786,960 16,382 1,396 29,002,001 20,775 4,393 26.81% 6Pine Plains 1,334 19,135,828 14,345 1,126 21,147,353 18,781 4,436 30.93% 3Poughkeepsie 4,606 60,394,759 13,112 4,666 74,822,927 16,036 2,924 22.30% 9Red Hook 2,364 29,675,970 12,553 2,231 36,264,970 16,255 3,702 29.49% 4Rhinebeck 1,235 18,044,934 14,611 1,191 21,974,458 18,450 3,839 26.28% 7Spackenkill 1,826 27,082,033 14,831 1,647 31,180,734 18,932 4,100 27.65% 5Wappingers 12,401 128,865,366 10,392 12,406 157,353,343 12,684 2,292 22.06% 11
Total 47,371 $563,996,052 $11,906 45,919 $678,722,378 $14,781 $2,875 24.15%
Note: Costs for Total Special Items (AT1998), Transportation (AT5599), Community Service (AT8999), Debt Service (AT9898) and Interfund Transfers (AT9959) are not included.
TABLE VII - B - BASIC EXPENDITURES PER STUDENTCOMPARISON OF BASIC EXPENDITURES ON A PER STUDENT BASIS FOR 2005-06 to 2009-10

Page 25
05/06 09/10 %05/06 05/06 Per Student 09/10 09/10 Per Student Basis Expend Basis Expend
Student Basic Expend. Basis Expend Student Basic Expend. Basis Expend Per Student Per StudentDistrict Enroll Dollars Dollars Enroll Dollars Dollars Increase Increase Rank
Arlington 10,322 $143,883,875 $13,940 10,041 $139,559,580 $13,899 -$41 -0.29% 8Beacon 3,380 $44,945,733 13,298 3,443 45,400,494 13,186 -111 -0.84% 10Dover 1,714 $24,048,358 14,031 1,612 22,178,865 13,759 -272 -1.94% 12Hyde Park 4,616 $69,040,734 14,957 4,116 65,529,046 15,921 964 6.44% 2Millbrook 1,213 $17,911,731 14,766 1,214 19,213,293 15,826 1,060 7.18% 1Northeast (Webutuck) 908 $16,934,642 18,650 830 15,095,314 18,187 -463 -2.48% 13Pawling 1,452 $29,317,428 20,191 1,396 29,002,001 20,775 584 2.89% 6Pine Plains 1,334 $23,584,908 17,680 1,126 21,147,353 18,781 1,101 6.23% 3Poughkeepsie 4,606 $74,436,540 16,161 4,666 74,822,927 16,036 -125 -0.77% 9Red Hook 2,364 $36,575,633 15,472 2,231 36,264,970 16,255 783 5.06% 4Rhinebeck 1,235 $22,240,381 18,008 1,191 21,974,458 18,450 442 2.45% 7Spackenkill 1,826 $33,378,606 18,280 1,647 31,180,734 18,932 652 3.57% 5Wappingers 12,401 $158,826,564 12,808 12,406 157,353,343 12,684 -124 -0.97% 11
Total 47,371 $695,125,134 $14,674 45,919 $678,722,378 $14,781 $107 0.73%
Note: 1. Costs for Total Special Items (AT1998), Transportation (AT5599), Community Service (AT8999), Debt Service (AT9898) and Interfund Transfers (AT9959) are not included. 2. CPI is from SED and % used for transportation contracts:
05/06 3.406/07 4.807/08 2.508/09 4.009/10 -0.1
5 year compounded rate of 23.25%
TABLE VII - C - BASIC EXPENDITURES PER STUDENT ADJUSTED FOR CPICOMPARISON OF BASIC EXPENDITURES ON A PER STUDENT BASIS FOR 2005-06 to 2009-10
2005-06 BASIC EXPENDITURES ADJUSTED FOR CPI
Page 26
05/06 05/06 09/10 09/10Total Spec. Ed. % of Total Spec. Ed. % of
District Expend Cost Budget Expend Cost Budget Rank
Arlington $135,684,295 $20,424,539 15.05% $166,750,938 $24,752,763 14.84% 6Beacon 43,158,159 7,910,449 18.33% 55,322,128 9,085,094 16.42% 4Dover 25,158,789 2,956,368 11.75% 26,426,809 3,292,909 12.46% 12Hyde Park 63,653,293 10,797,631 16.96% 74,184,751 13,126,237 17.69% 3Millbrook 17,946,431 3,553,354 19.80% 23,446,295 5,088,887 21.70% 1Northeast (Webutuck) 16,196,166 2,074,817 12.81% 17,913,657 2,460,828 13.74% 9Pawling 27,624,283 4,354,794 15.76% 33,905,010 5,087,675 15.01% 5Pine Plains 21,894,058 2,878,437 13.15% 24,333,853 3,195,917 13.13% 10Poughkeepsie 64,604,700 12,791,167 19.80% 80,636,712 15,489,233 19.21% 2Red Hook 34,510,393 4,681,033 13.56% 42,363,955 6,149,716 14.52% 7Rhinebeck 21,158,132 2,336,203 11.04% 26,040,701 3,376,308 12.97% 11Spackenkill 29,494,676 3,088,697 10.47% 34,548,489 3,826,805 11.08% 13Wappingers 145,410,845 19,877,745 13.67% 175,955,397 25,063,258 14.24% 8
Total $646,494,220 $97,725,234 15.12% $781,828,695 $119,995,630 15.35%
Note: 1. General Fund 2005-06 & 2009-10 expenditures for Special Education costs (A2250). 2. Does not include legal and transportation costs.
TABLE VIII - SPECIAL EDUCATION% OF BUDGET

Page 27
05/06 09/10Spec. Ed. Spec. Ed. Dollar Percent
District Cost Cost Increase Increase Rank
Arlington $20,424,539 $24,752,763 $4,328,224 21.19% 7Beacon 7,910,449 9,085,094 1,174,645 14.85% 11Dover 2,956,368 3,292,909 336,541 11.38% 12Hyde Park 10,797,631 13,126,237 2,328,606 21.57% 6Millbrook 3,553,354 5,088,887 1,535,533 43.21% 2Northeast (Webutuck) 2,074,817 2,460,828 386,011 18.60% 9Pawling 4,354,794 5,087,675 732,881 16.83% 10Pine Plains 2,878,437 3,195,917 317,480 11.03% 13Poughkeepsie 12,791,167 15,489,233 2,698,066 21.09% 8Red Hook 4,681,033 6,149,716 1,468,683 31.38% 3Rhinebeck 2,336,203 3,376,308 1,040,105 44.52% 1Spackenkill 3,088,697 3,826,805 738,108 23.90% 5Wappingers 19,877,745 25,063,258 5,185,513 26.09% 4
Total $97,725,234 $119,995,630 $22,270,396 22.79%
Note: 1. General Fund 2005-06 & 2009-10 expenditures for Special Education costs (A2250). 2. Does not include legal and transportation costs.
TABLE VIII - A - SPECIAL EDUCATION BUDGET INCREASE

Page 28
05/06 09/10Spec. Ed. Spec. Ed. Dollar Percent
District Costs Costs Increase Increase Rank
Arlington $25,173,244 $24,752,763 -$420,481 -1.67% 7Beacon $9,749,628 9,085,094 -664,534 -6.82% 11Dover $3,643,724 3,292,909 -350,815 -9.63% 12Hyde Park $13,308,080 13,126,237 -181,843 -1.37% 6Millbrook $4,379,509 5,088,887 709,378 16.20% 2Northeast (Webutuck) $2,557,212 2,460,828 -96,384 -3.77% 9Pawling $5,367,284 5,087,675 -279,609 -5.21% 10Pine Plains $3,547,674 3,195,917 -351,757 -9.92% 13Poughkeepsie $15,765,113 15,489,233 -275,880 -1.75% 8Red Hook $5,769,373 6,149,716 380,343 6.59% 3Rhinebeck $2,879,370 3,376,308 496,938 17.26% 1Spackenkill $3,806,819 3,826,805 19,986 0.53% 5Wappingers $24,499,321 25,063,258 563,937 2.30% 4
Total $120,446,351 $119,995,630 -$450,721 -0.37%
Note: 1. General Fund 2005-06 & 2009-10 expenditures for Special Education costs (A2250). 2. Does not include legal and transportation costs. 3. CPI is from SED and % used for transportation contracts:
05/06 3.406/07 4.807/08 2.508/09 4.009/10 -0.1
5 year compounded rate of 23.25%
TABLE VIII - B - SPECIAL EDUCATION EXPENDITURES ADJUSTED BY CPICOMPARISON OF SPECIAL EDUCATION EXPENDITURE COST 2005-06 to 2009-10
2005-06 SPECIAL EDUCATION EXPENDITURE COSTS ADJUSTED FOR CPI
Page 29
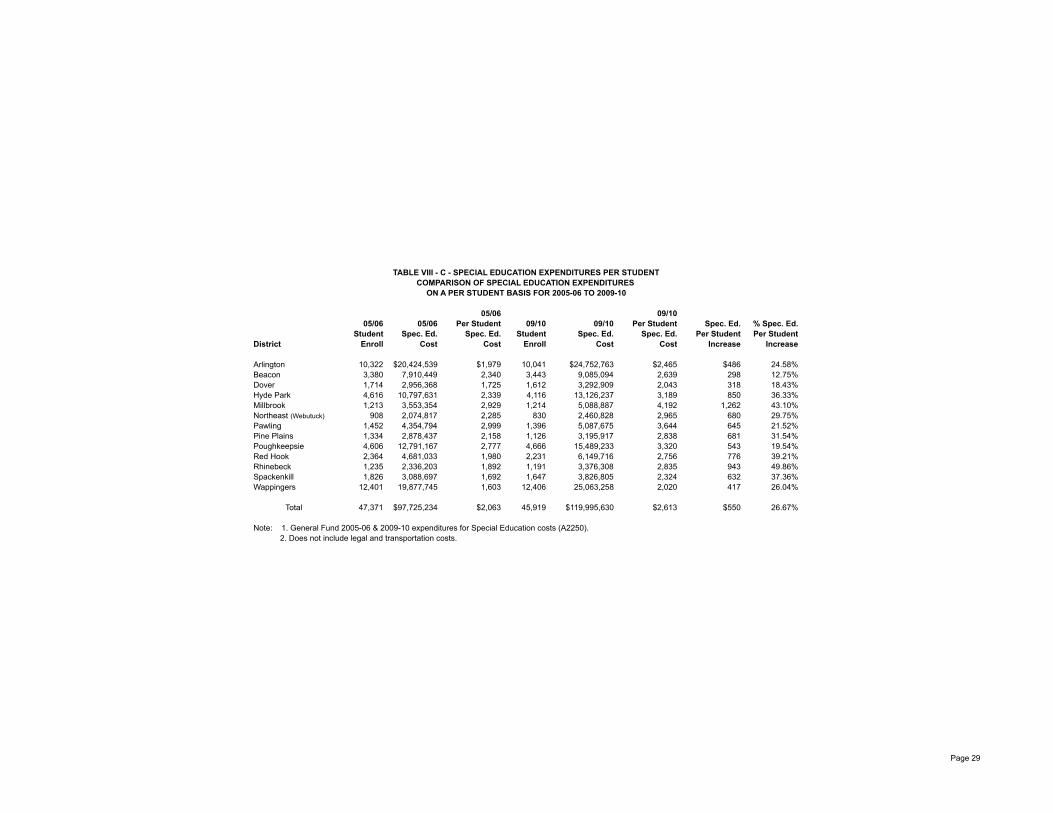
COMPARISON OF SPECIAL EDUCATION EXPENDITURES ON A PER STUDENT BASIS FOR 2005-06 TO 2009-10
05/06 09/1005/06 05/06 Per Student 09/10 09/10 Per Student Spec. Ed. % Spec. Ed.
Student Spec. Ed. Spec. Ed. Student Spec. Ed. Spec. Ed. Per Student Per StudentDistrict Enroll Cost Cost Enroll Cost Cost Increase Increase
Arlington 10,322 $20,424,539 $1,979 10,041 $24,752,763 $2,465 $486 24.58%Beacon 3,380 7,910,449 2,340 3,443 9,085,094 2,639 298 12.75%Dover 1,714 2,956,368 1,725 1,612 3,292,909 2,043 318 18.43%Hyde Park 4,616 10,797,631 2,339 4,116 13,126,237 3,189 850 36.33%Millbrook 1,213 3,553,354 2,929 1,214 5,088,887 4,192 1,262 43.10%Northeast (Webutuck) 908 2,074,817 2,285 830 2,460,828 2,965 680 29.75%Pawling 1,452 4,354,794 2,999 1,396 5,087,675 3,644 645 21.52%Pine Plains 1,334 2,878,437 2,158 1,126 3,195,917 2,838 681 31.54%Poughkeepsie 4,606 12,791,167 2,777 4,666 15,489,233 3,320 543 19.54%Red Hook 2,364 4,681,033 1,980 2,231 6,149,716 2,756 776 39.21%Rhinebeck 1,235 2,336,203 1,892 1,191 3,376,308 2,835 943 49.86%Spackenkill 1,826 3,088,697 1,692 1,647 3,826,805 2,324 632 37.36%Wappingers 12,401 19,877,745 1,603 12,406 25,063,258 2,020 417 26.04%
Total 47,371 $97,725,234 $2,063 45,919 $119,995,630 $2,613 $550 26.67%
Note: 1. General Fund 2005-06 & 2009-10 expenditures for Special Education costs (A2250). 2. Does not include legal and transportation costs.
TABLE VIII - C - SPECIAL EDUCATION EXPENDITURES PER STUDENT

Page 30
COMPARISON OF SPECIAL EDUCATION EXPENDITURES ON A PER STUDENT BASIS FOR 2005-06 to 2009-102005-06 SPECIAL EDUCATION EXPENDITURE COSTS ADJUSTED FOR CPI
05/06 09/1005/06 05/06 Per Student 09/10 09/10 Per Student Spec. Ed. % Spec. Ed.
Student Spec. Ed. Spec. Ed. Student Spec. Ed. Spec. Ed. Per Student Per StudentDistrict Enroll Cost Cost Enroll Cost Cost Increase Increase
Arlington 10,322 $25,173,244 $2,439 10,041 $24,752,763 $2,465 $26 1.08%Beacon 3,380 $9,749,628 2,885 3,443 9,085,094 2,639 -246 -8.52%Dover 1,714 $3,643,724 2,126 1,612 3,292,909 2,043 -83 -3.91%Hyde Park 4,616 $13,308,080 2,883 4,116 13,126,237 3,189 306 10.62%Millbrook 1,213 $4,379,509 3,610 1,214 5,088,887 4,192 581 16.10%Northeast (Webutuck) 908 $2,557,212 2,816 830 2,460,828 2,965 149 5.27%Pawling 1,452 $5,367,284 3,696 1,396 5,087,675 3,644 -52 -1.41%Pine Plains 1,334 $3,547,674 2,659 1,126 3,195,917 2,838 179 6.73%Poughkeepsie 4,606 $15,765,113 3,423 4,666 15,489,233 3,320 -103 -3.01%Red Hook 2,364 $5,769,373 2,441 2,231 6,149,716 2,756 316 12.95%Rhinebeck 1,235 $2,879,370 2,331 1,191 3,376,308 2,835 503 21.59%Spackenkill 1,826 $3,806,819 2,085 1,647 3,826,805 2,324 239 11.45%Wappingers 12,401 $24,499,321 1,976 12,406 25,063,258 2,020 45 2.26%
Total 47,371 $120,446,351 $2,543 45,919 $119,995,630 $2,613 $71 2.78%
Note: 1. General Fund 2005-06 & 2009-10 expenditures for Special Education costs (A2250). 2. Does not include legal and transportation costs. 3. CPI is from SED and % used for transportation contracts:
05/06 3.406/07 4.807/08 2.508/09 4.009/10 -0.1
5 year compounded rate of 23.25%
TABLE VIII - D - SPECIAL EDUCATION EXPENDITURES PER STUDENT

Page 31
05/06 09/10 Total Inst. % Total Inst.Total Inst. Total Inst. Classroom Cost Classroom Cost
District Classroom Cost Classroom Cost Increase Increase Rank
Arlington $61,663,830 $71,851,164 $10,187,334 16.52% 9Beacon 19,820,832 24,794,624 4,973,792 25.09% 2Dover 10,134,165 11,266,502 1,132,337 11.17% 11Hyde Park 30,268,347 34,047,207 3,778,860 12.48% 10Millbrook 7,092,851 8,743,345 1,650,494 23.27% 4Northeast (Webutuck) 6,840,968 7,321,452 480,484 7.02% 12Pawling 12,098,311 14,479,122 2,380,811 19.68% 6Pine Plains 9,783,206 10,259,935 476,729 4.87% 13Poughkeepsie 32,767,958 41,340,854 8,572,896 26.16% 1Red Hook 15,815,354 19,203,194 3,387,840 21.42% 5Rhinebeck 9,172,916 11,338,837 2,165,921 23.61% 3Spackenkill 13,217,182 15,533,302 2,316,120 17.52% 8Wappingers 64,473,187 77,013,662 12,540,475 19.45% 7
Total $293,149,107 $347,193,200 $54,044,093 18.44%
Note: 1. 2005-06 costs are from the ST-3, Code AT2399. 2. 2009-10 costs are from SAMS, DP code 214.
TABLE IX - CLASSROOM INSTRUCTIONCOMPARISON OF TOTAL CLASSROOM INSTRUCTIONAL COST 2005-06 to 2009-10

Page 32
05/06 09/10 Total Inst. % Total Inst.Total Inst. Total Inst. Classroom Cost Classroom Cost
District Classroom Cost Classroom Cost Increase Increase Rank
Arlington $76,000,670 $71,851,164 -$4,149,506 -5.46% 9Beacon $24,429,175 24,794,624 365,449 1.50% 2Dover $12,490,358 11,266,502 -1,223,856 -9.80% 11Hyde Park $37,305,738 34,047,207 -3,258,531 -8.73% 10Millbrook $8,741,939 8,743,345 1,406 0.02% 4Northeast (Webutuck) $8,431,493 7,321,452 -1,110,041 -13.17% 12Pawling $14,911,168 14,479,122 -432,046 -2.90% 6Pine Plains $12,057,801 10,259,935 -1,797,866 -14.91% 13Poughkeepsie $40,386,508 41,340,854 954,346 2.36% 1Red Hook $19,492,424 19,203,194 -289,230 -1.48% 5Rhinebeck $11,305,619 11,338,837 33,218 0.29% 3Spackenkill $16,290,177 15,533,302 -756,875 -4.65% 8Wappingers $79,463,203 77,013,662 -2,449,541 -3.08% 7
Total $361,306,274 $347,193,200 -$14,113,074 -3.91%
Note: 1. 2005-06 costs are from the ST-3, Code AT2399. 2. 2009-10 costs are from SAMS, DP code 214. 3. CPI is from SED and % used for transportation contracts:
05/06 3.406/07 4.807/08 2.508/09 4.009/10 -0.1
5 year compounded rate of 23.25%
TABLE IX - A - CLASSROOM INSTRUCTION ADJUSTED FOR CPICOMPARISON OF TOTAL CLASSROOM INSTRUCTIONAL COST 2005-06 to 2009-10
2005-06 TOTAL CLASSROOM INSTRUCTIONAL COSTS ADJUSTED FOR CPI
Page 33
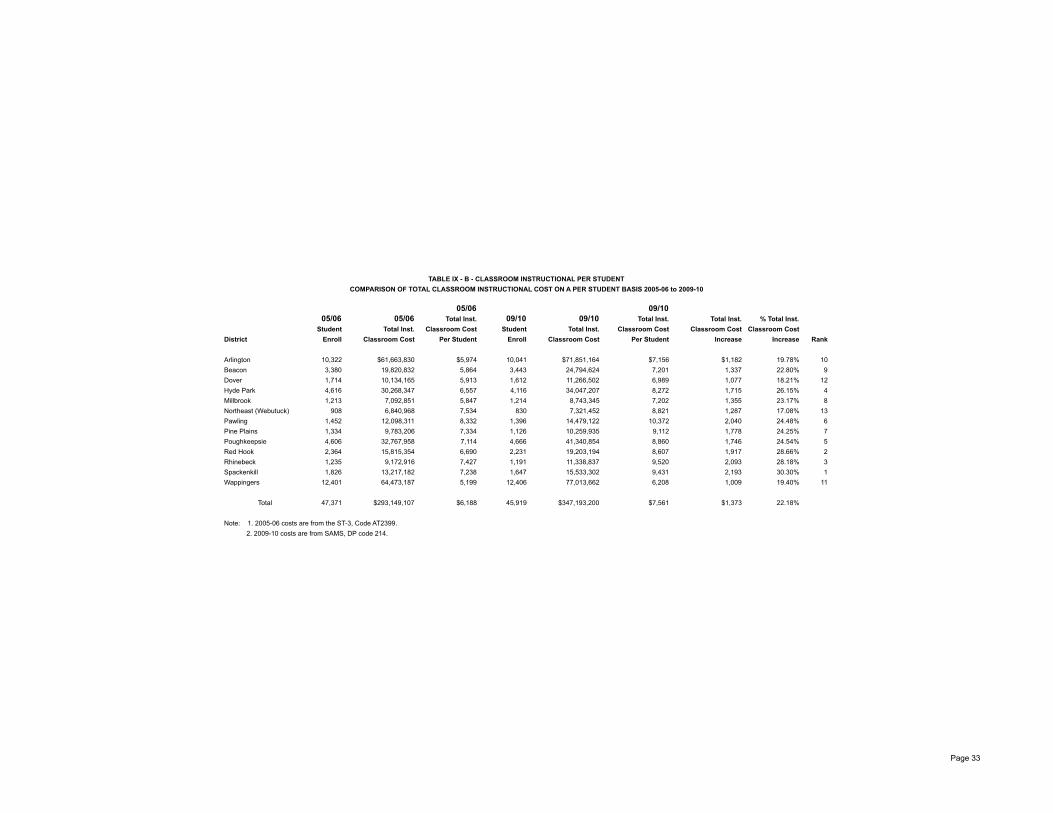
05/06 09/1005/06 05/06 Total Inst. 09/10 09/10 Total Inst. Total Inst. % Total Inst.
Student Total Inst. Classroom Cost Student Total Inst. Classroom Cost Classroom Cost Classroom CostDistrict Enroll Classroom Cost Per Student Enroll Classroom Cost Per Student Increase Increase Rank
Arlington 10,322 $61,663,830 $5,974 10,041 $71,851,164 $7,156 $1,182 19.78% 10Beacon 3,380 19,820,832 5,864 3,443 24,794,624 7,201 1,337 22.80% 9Dover 1,714 10,134,165 5,913 1,612 11,266,502 6,989 1,077 18.21% 12Hyde Park 4,616 30,268,347 6,557 4,116 34,047,207 8,272 1,715 26.15% 4Millbrook 1,213 7,092,851 5,847 1,214 8,743,345 7,202 1,355 23.17% 8Northeast (Webutuck) 908 6,840,968 7,534 830 7,321,452 8,821 1,287 17.08% 13Pawling 1,452 12,098,311 8,332 1,396 14,479,122 10,372 2,040 24.48% 6Pine Plains 1,334 9,783,206 7,334 1,126 10,259,935 9,112 1,778 24.25% 7Poughkeepsie 4,606 32,767,958 7,114 4,666 41,340,854 8,860 1,746 24.54% 5Red Hook 2,364 15,815,354 6,690 2,231 19,203,194 8,607 1,917 28.66% 2Rhinebeck 1,235 9,172,916 7,427 1,191 11,338,837 9,520 2,093 28.18% 3Spackenkill 1,826 13,217,182 7,238 1,647 15,533,302 9,431 2,193 30.30% 1Wappingers 12,401 64,473,187 5,199 12,406 77,013,662 6,208 1,009 19.40% 11
Total 47,371 $293,149,107 $6,188 45,919 $347,193,200 $7,561 $1,373 22.18%
Note: 1. 2005-06 costs are from the ST-3, Code AT2399. 2. 2009-10 costs are from SAMS, DP code 214.
TABLE IX - B - CLASSROOM INSTRUCTIONAL PER STUDENTCOMPARISON OF TOTAL CLASSROOM INSTRUCTIONAL COST ON A PER STUDENT BASIS 2005-06 to 2009-10

Page 34
05/06 09/1005/06 05/06 Total Inst. 09/10 09/10 Total Inst. Total Inst. % Total Inst.
Student Total Inst. Classroom Cost Student Total Inst. Classroom Cost Classroom Cost Classroom CostDistrict Enroll Classroom Cost Per Student Enroll Classroom Cost Per Student Increase Increase Rank
Arlington 10,322 $76,000,670 $7,363 10,041 $71,851,164 $7,156 -$207 -2.81% 10Beacon 3,380 $24,429,175 7,228 3,443 24,794,624 7,201 -26 -0.36% 9Dover 1,714 $12,490,358 7,287 1,612 11,266,502 6,989 -298 -4.09% 12Hyde Park 4,616 $37,305,738 8,082 4,116 34,047,207 8,272 190 2.35% 4Millbrook 1,213 $8,741,939 7,207 1,214 8,743,345 7,202 -5 -0.07% 8Northeast (Webutuck) 908 $8,431,493 9,286 830 7,321,452 8,821 -465 -5.01% 13Pawling 1,452 $14,911,168 10,269 1,396 14,479,122 10,372 102 1.00% 6Pine Plains 1,334 $12,057,801 9,039 1,126 10,259,935 9,112 73 0.81% 7Poughkeepsie 4,606 $40,386,508 8,768 4,666 41,340,854 8,860 92 1.05% 5Red Hook 2,364 $19,492,424 8,246 2,231 19,203,194 8,607 362 4.39% 2Rhinebeck 1,235 $11,305,619 9,154 1,191 11,338,837 9,520 366 4.00% 3Spackenkill 1,826 $16,290,177 8,921 1,647 15,533,302 9,431 510 5.72% 1Wappingers 12,401 $79,463,203 6,408 12,406 77,013,662 6,208 -200 -3.12% 11
Total 47,371 $361,306,274 $7,627 45,919 $347,193,200 $7,561 -$66 -0.87%
Note: 1. 2005-06 costs are from the ST-3, Code AT2399. 2. 2009-10 costs are from SAMS, DP code 214. 3. CPI is from SED and % used for transportation contracts:
05/06 3.406/07 4.807/08 2.508/09 4.009/10 -0.1
5 year compounded rate of 23.25%
TABLE IX - C - CLASSROOM INSTRUCTIONAL PER STUDENT ADJUSTED FOR CPICOMPARISON OF TOTAL CLASSROOM INSTRUCTIONAL COST ON A PER STUDENT BASIS 2005-06 to 2009-10
2005-06 TOTAL CLASSROOM INSTRUCTIONAL COST ADJUSTED FOR CPI

Page 35
05/06 05/06 05/06 09/10 09/10 09/10 Total % TotalCentral Admin. Building Admin. Total Central Admin. Building Admin. Total Admin. Cost Admin. Cost
District Cost Cost Admin. Cost Cost Cost Admin. Cost Increase Increase Rank
Arlington $2,326,994 $5,192,671 $7,519,665 $2,820,046 $6,859,619 $9,679,665 $2,160,000 28.72% 3Beacon 828,575 1,836,884 2,665,459 1,008,160 2,391,957 3,400,117 734,658 27.56% 4Dover 563,558 906,768 1,470,326 762,050 1,066,843 1,828,893 358,567 24.39% 7Hyde Park 1,046,237 2,651,407 3,697,644 1,436,196 3,118,560 4,554,756 857,112 23.18% 8Millbrook 572,085 485,604 1,057,689 757,493 677,189 1,434,682 376,993 35.64% 1Northeast (Webutuck) 497,220 403,569 900,789 585,150 508,674 1,093,824 193,035 21.43% 9Pawling 867,630 990,338 1,857,968 1,011,261 1,323,708 2,334,969 477,001 25.67% 6Pine Plains 516,999 672,557 1,189,556 640,239 863,233 1,503,472 313,916 26.39% 5Poughkeepsie 1,570,760 3,521,030 5,091,790 1,837,037 3,749,132 5,586,169 494,379 9.71% 12Red Hook 654,381 1,415,254 2,069,635 860,061 1,911,736 2,771,797 702,162 33.93% 2Rhinebeck 602,954 931,552 1,534,506 651,663 1,064,143 1,715,806 181,300 11.81% 11Spackenkill 784,059 1,399,588 2,183,647 937,018 1,542,083 2,479,101 295,454 13.53% 10Wappingers 2,395,684 6,240,616 8,636,300 2,282,668 7,034,607 9,317,275 680,975 7.89% 13
Total $13,227,136 $26,647,838 $39,874,974 $15,589,042 $32,111,484 $47,700,526 $7,825,552 19.63%
Note: 1. Building Administrator 2005-06 costs are from ST-3, Code AT2099 2. Building Administration 2009-10 costs from SAMS, DP code 163. 3. Central Administration 2005-06 costs are from ST-3, Codes A1240, AT1399, and AT1499. 4. Central Administration 2009-10 costs are from SAMS, DP codes 23, 55, and 83.
TABLE X - TOTAL ADMINISTRATIONCOMPARISON OF TOTAL ADMINISTRATIVE COSTS FOR 2005-06 to 2009-10

Page 36
05/06 05/06 05/06 09/10 09/10 09/10 Total % TotalCentral Admin. Building Admin. Total Central Admin. Building Admin. Total Admin. Cost Admin. Cost
District Cost Cost Admin. Cost Cost Cost Admin. Cost Increase Increase Rank
Arlington $2,868,020 $6,399,967 $9,267,987 $2,820,046 $6,859,619 $9,679,665 $411,678 4.44% 3Beacon $1,021,219 $2,263,960 3,285,178 1,008,160 2,391,957 3,400,117 114,939 3.50% 4Dover $694,585 $1,117,592 1,812,177 762,050 1,066,843 1,828,893 16,716 0.92% 7Hyde Park $1,289,487 $3,267,859 4,557,346 1,436,196 3,118,560 4,554,756 -2,590 -0.06% 8Millbrook $705,095 $598,507 1,303,602 757,493 677,189 1,434,682 131,080 10.06% 1Northeast (Webutuck) $612,824 $497,399 1,110,222 585,150 508,674 1,093,824 -16,398 -1.48% 9Pawling $1,069,354 $1,220,592 2,289,946 1,011,261 1,323,708 2,334,969 45,023 1.97% 6Pine Plains $637,201 $828,927 1,466,128 640,239 863,233 1,503,472 37,344 2.55% 5Poughkeepsie $1,935,962 $4,339,669 6,275,631 1,837,037 3,749,132 5,586,169 -689,462 -10.99% 12Red Hook $806,525 $1,744,301 2,550,825 860,061 1,911,736 2,771,797 220,972 8.66% 2Rhinebeck $743,141 $1,148,138 1,891,279 651,663 1,064,143 1,715,806 -175,473 -9.28% 11Spackenkill $966,353 $1,724,992 2,691,345 937,018 1,542,083 2,479,101 -212,244 -7.89% 10Wappingers $2,952,681 $7,691,559 10,644,240 2,282,668 7,034,607 9,317,275 -1,326,965 -12.47% 13
Total $16,302,445 $32,843,460 $49,145,905 $15,589,042 $32,111,484 $47,700,526 -$1,445,379 -2.94%
Note: 1. Building Administrator 2005-06 costs are from ST-3, Code AT2099 2. Building Administration 2009-10 costs from SAMS, DP code 163. 3. Central Administration 2005-06 costs are from ST-3, Codes A1240, AT1399, and AT1499. 4. Central Administration 2009-10 costs are from SAMS, DP codes 23, 55, and 83. 5. CPI is from SED and % used for transportation contracts:
05/06 3.406/07 4.807/08 2.508/09 4.009/10 -0.1
5 year compounded rate of 23.25%
TABLE X - A - TOTAL ADMINISTRATION ADJUSTED FOR CPICOMPARISON OF TOTAL ADMINISTRATIVE COSTS FOR 2005-06 to 2009-10
2005-06 TOTAL ADMIN. COST ADJUSTED FOR CPI

Page 37
05/06 09/1005/06 05/06 05/06 05/06 Total 09/10 09/10 09/10 09/10 Total Total % Total
Student Central Admin. Building Admin. Total Admin. Cost Student Central Admin.Building Admin. Total Admin. Cost Admin. Cost Admin. CostDistrict Enroll Cost Cost Admin. Cost Per Student Enroll Cost Cost Admin. Cost Per Student Increase Increase Rank
Arlington 10,322 $2,326,994 $5,192,671 $7,519,665 $729 10,041 $2,820,046 $6,859,619 $9,679,665 $964 $236 32.33% 6Beacon 3,380 828,575 1,836,884 2,665,459 789 3,443 1,008,160 2,391,957 3,400,117 988 199 25.23% 10Dover 1,714 563,558 906,768 1,470,326 858 1,612 762,050 1,066,843 1,828,893 1,135 277 32.26% 7Hyde Park 4,616 1,046,237 2,651,407 3,697,644 801 4,116 1,436,196 3,118,560 4,554,756 1,107 306 38.14% 3Millbrook 1,213 572,085 485,604 1,057,689 872 1,214 757,493 677,189 1,434,682 1,182 310 35.53% 4Northeast (Webutuck) 908 497,220 403,569 900,789 992 830 585,150 508,674 1,093,824 1,318 326 32.84% 5Pawling 1,452 867,630 990,338 1,857,968 1,280 1,396 1,011,261 1,323,708 2,334,969 1,673 393 30.71% 8Pine Plains 1,334 516,999 672,557 1,189,556 892 1,126 640,239 863,233 1,503,472 1,335 444 49.74% 1Poughkeepsie 4,606 1,570,760 3,521,030 5,091,790 1,105 4,666 1,837,037 3,749,132 5,586,169 1,197 92 8.30% 12Red Hook 2,364 654,381 1,415,254 2,069,635 875 2,231 860,061 1,911,736 2,771,797 1,242 367 41.91% 2Rhinebeck 1,235 602,954 931,552 1,534,506 1,243 1,191 651,663 1,064,143 1,715,806 1,441 198 15.95% 11Spackenkill 1,826 784,059 1,399,588 2,183,647 1,196 1,647 937,018 1,542,083 2,479,101 1,505 309 25.87% 9Wappingers 12,401 2,395,684 6,240,616 8,636,300 696 12,406 2,282,668 7,034,607 9,317,275 751 55 7.84% 13
Total 47,371 $13,227,136 $26,647,838 $39,874,974 $842 45,919 $15,589,042 $32,111,484 $47,700,526 $1,039 $197 23.41%
Note: 1. Building Administrator 2005-06 costs are from ST-3, Code AT2099. 2. Building Administration 2009-10 costs from SAMS, DP code 163. 3. Central Administration 2005-06 costs are from ST-3, Codes A1240, AT1399, and AT1499. 4. Central Administration 2009-10 costs are from SAMS, DP codes 23, 55, and 83.
TABLE X - B - TOTAL ADMINISTRATION PER STUDENTCOMPARISON OF TOTAL ADMINISTRATIVE COSTS ON A PER STUDENT BASIS FOR 2005-06 to 2009-10

Page 38
05/06 09/1005/06 05/06 05/06 05/06 Total 09/10 09/10 09/10 09/10 Total Total % Total
Student Central Admin. Building Admin. Total Admin. Cost Student Central Admin.Building Admin. Total Admin. Cost Admin. Cost Admin. CostDistrict Enroll Cost Cost Admin. Cost Per Student Enroll Cost Cost Admin. Cost Per Student Increase Increase Rank
Arlington 10,322 $2,868,020 $6,399,967 $9,267,987 $898 10,041 $2,820,046 $6,859,619 $9,679,665 $964 $66 7.36% 6Beacon 3,380 $1,021,219 $2,263,960 3,285,178 972 3,443 1,008,160 2,391,957 3,400,117 988 16 1.60% 10Dover 1,714 $694,585 $1,117,592 1,812,177 1,057 1,612 762,050 1,066,843 1,828,893 1,135 77 7.31% 7Hyde Park 4,616 $1,289,487 $3,267,859 4,557,346 987 4,116 1,436,196 3,118,560 4,554,756 1,107 119 12.08% 3Millbrook 1,213 $705,095 $598,507 1,303,602 1,075 1,214 757,493 677,189 1,434,682 1,182 107 9.96% 4Northeast (Webutuck) 908 $612,824 $497,399 1,110,222 1,223 830 585,150 508,674 1,093,824 1,318 95 7.78% 5Pawling 1,452 $1,069,354 $1,220,592 2,289,946 1,577 1,396 1,011,261 1,323,708 2,334,969 1,673 96 6.06% 8Pine Plains 1,334 $637,201 $828,927 1,466,128 1,099 1,126 640,239 863,233 1,503,472 1,335 236 21.49% 1Poughkeepsie 4,606 $1,935,962 $4,339,669 6,275,631 1,362 4,666 1,837,037 3,749,132 5,586,169 1,197 -165 -12.13% 12Red Hook 2,364 $806,525 $1,744,301 2,550,825 1,079 2,231 860,061 1,911,736 2,771,797 1,242 163 15.14% 2Rhinebeck 1,235 $743,141 $1,148,138 1,891,279 1,531 1,191 651,663 1,064,143 1,715,806 1,441 -91 -5.93% 11Spackenkill 1,826 $966,353 $1,724,992 2,691,345 1,474 1,647 937,018 1,542,083 2,479,101 1,505 31 2.12% 9Wappingers 12,401 $2,952,681 $7,691,559 10,644,240 858 12,406 2,282,668 7,034,607 9,317,275 751 -107 -12.50% 13
Total 47,371 $16,302,445 $32,843,460 $49,145,905 $1,037 45,919 $15,589,042 $32,111,484 $47,700,526 $1,039 $1 0.13%
Note: 1. Building Administrator 2005-06 costs are from ST-3, Code AT2099. 2. Building Administration 2009-10 costs from SAMS, DP code 163. 3. Central Administration 2005-06 costs are from ST-3, Codes A1240, AT1399, and AT1499. 4. Central Administration 2009-10 costs are from SAMS, DP codes 23, 55, and 83. 5. CPI is from SED and % used for transportation contracts:
05/06 3.406/07 4.807/08 2.508/09 4.009/10 -0.1
5 year compounded rate of 23.25%
TABLE X - C - TOTAL ADMINISTRATION PER STUDENT ADJUSTED FOR CPICOMPARISON OF TOTAL ADMINISTRATIVE COSTS ON A PER STUDENT BASIS FOR 2005-06 to 2009-10
2005-06 TOTAL ADMIN. COSTS ADJUSTED FOR CPI

Page 39
05/06 09/10Central Admin. Central Admin. Central Admin. % Central Admin.
District Cost Cost Cost Increase Cost Increase Rank
Arlington $2,326,994 $2,820,046 $493,052 21.19% 7Beacon 828,575 1,008,160 179,585 21.67% 6Dover 563,558 762,050 198,492 35.22% 2Hyde Park 1,046,237 1,436,196 389,959 37.27% 1Millbrook 572,085 757,493 185,408 32.41% 3Northeast (Webutuck) 497,220 585,150 87,930 17.68% 9Pawling 867,630 1,011,261 143,631 16.55% 11Pine Plains 516,999 640,239 123,240 23.84% 5Poughkeepsie 1,570,760 1,837,037 266,277 16.95% 10Red Hook 654,381 860,061 205,680 31.43% 4Rhinebeck 602,954 651,663 48,709 8.08% 12Spackenkill 784,059 937,018 152,959 19.51% 8Wappingers 2,395,684 2,282,668 -113,016 -4.72% 13
Total $13,227,136 $15,589,042 $2,361,906 17.86%
Note: 1. Central Administration 2005-06 costs are from ST-3:AT1240 - Chief School AdministratorAT1399 - FinanceAT1499 - Other Staff, Legal, Personnel, & Public Information
2. Central Administration 2009-10 costs are from SAMS:DP code 23, Chief School AdministratorDP code 55, FinanceDP code 83, Other Staff, Legal, Personnel, & Public Information
TABLE XI - CENTRAL ADMINISTRATIONCOMPARISON OF CENTRAL ADMINISTRATION COSTS 2005-06 to 2009-10

Page 40
05/06 09/10Central Admin. Central Admin. Central Admin. % Central Admin.
District Cost Cost Cost Increase Cost Increase Rank
Arlington $2,868,020 $2,820,046 -$47,974 -1.67% 7Beacon $1,021,219 1,008,160 -13,059 -1.28% 6Dover $694,585 762,050 67,465 9.71% 2Hyde Park $1,289,487 1,436,196 146,709 11.38% 1Millbrook $705,095 757,493 52,398 7.43% 3Northeast (Webutuck) $612,824 585,150 -27,674 -4.52% 9Pawling $1,069,354 1,011,261 -58,093 -5.43% 11Pine Plains $637,201 640,239 3,038 0.48% 5Poughkeepsie $1,935,962 1,837,037 -98,925 -5.11% 10Red Hook $806,525 860,061 53,536 6.64% 4Rhinebeck $743,141 651,663 -91,478 -12.31% 12Spackenkill $966,353 937,018 -29,335 -3.04% 8Wappingers $2,952,681 2,282,668 -670,013 -22.69% 13
Total $16,302,445 $15,589,042 -$713,403 -4.38%
Note: 1. Central Administration 2005-06 costs are from ST-3:AT1240 - Chief School AdministratorAT1399 - FinanceAT1499 - Other Staff, Legal, Personnel, & Public Information
2. Central Administration 2009-10 costs are from SAMS:DP code 23, Chief School AdministratorDP code 55, FinanceDP code 83, Other Staff, Legal, Personnel, & Public Information
3. CPI is from SED and % used for transportation contracts:05/06 3.406/07 4.807/08 2.508/09 4.009/10 -0.1
5 year compounded rate of 23.25%
TABLE XI - A - CENTRAL ADMINISTRATION ADJUSTED FOR CPICOMPARISON OF CENTRAL ADMINISTRATION COSTS 2005-06 to 2009-10
2005-06 CENTRAL ADMIN. COSTS ADJUSTED FOR CPI

Page 41
05/06 05/06 05/06 09/10 09/10 09/10Student Central Admin. Central Admin. Student Central Admin. Central Admin. Central Admin.% Central Admin.
District Enroll. Cost Costs Per Student Enroll. Cost Costs Per Student Cost Increase Cost Increase Rank
Arlington 10,322 $2,326,994 $225 10,041 $2,820,046 $281 $55 24.58% 8Beacon 3,380 828,575 245 3,443 1,008,160 293 48 19.45% 10Dover 1,714 563,558 329 1,612 762,050 473 144 43.78% 3Hyde Park 4,616 1,046,237 227 4,116 1,436,196 349 122 53.95% 1Millbrook 1,213 572,085 472 1,214 757,493 624 152 32.30% 6Northeast (Webutuck) 908 497,220 548 830 585,150 705 157 28.74% 7Pawling 1,452 867,630 598 1,396 1,011,261 724 127 21.23% 9Pine Plains 1,334 516,999 388 1,126 640,239 569 181 46.71% 2Poughkeepsie 4,606 1,570,760 341 4,666 1,837,037 394 53 15.45% 11Red Hook 2,364 654,381 277 2,231 860,061 386 109 39.27% 4Rhinebeck 1,235 602,954 488 1,191 651,663 547 59 12.07% 12Spackenkill 1,826 784,059 429 1,647 937,018 569 140 32.50% 5Wappingers 12,401 2,395,684 193 12,406 2,282,668 184 -9 -4.76% 13
Total 47,371 $13,227,136 $279 45,919 $15,589,042 $339 $60 21.58%
Note: 1. Central Administration 2005-06 costs are from ST-3:AT1240 - Chief School AdministratorAT1399 - FinanceAT1499 - Other Staff, Legal, Personnel, & Public Information
2. Central Administration 2009-10 costs are from SAMS:DP code 23, Chief School AdministratorDP code 55, FinanceDP code 83, Other Staff, Legal, Personnel, & Public Information
TABLE XI - B - CENTRAL ADMINISTRATION PER STUDENTCOMPARISON OF CENTRAL ADMINISTRATION COSTS ON A PER STUDENT BASIS FOR 2005-06 to 2009-10

Page 42
05/06 05/06 05/06 09/10 09/10 09/10Student Central Admin. Central Admin. Student Central Admin. Central Admin. Central Admin.% Central Admin.
District Enroll. Cost Cost Per Student Enroll. Cost Cost Per Student Cost Increase Cost Increase Rank
Arlington 10,322 $2,868,020 $278 10,041 $2,820,046 $281 $3 1.08% 8Beacon 3,380 $1,021,219 302 3,443 1,008,160 293 -9 -3.09% 10Dover 1,714 $694,585 405 1,612 762,050 473 67 16.66% 3Hyde Park 4,616 $1,289,487 279 4,116 1,436,196 349 70 24.91% 1Millbrook 1,213 $705,095 581 1,214 757,493 624 43 7.34% 6Northeast (Webutuck) 908 $612,824 675 830 585,150 705 30 4.46% 7Pawling 1,452 $1,069,354 736 1,396 1,011,261 724 -12 -1.64% 9Pine Plains 1,334 $637,201 478 1,126 640,239 569 91 19.04% 2Poughkeepsie 4,606 $1,935,962 420 4,666 1,837,037 394 -27 -6.33% 11Red Hook 2,364 $806,525 341 2,231 860,061 386 44 13.00% 4Rhinebeck 1,235 $743,141 602 1,191 651,663 547 -55 -9.07% 12Spackenkill 1,826 $966,353 529 1,647 937,018 569 40 7.50% 5Wappingers 12,401 $2,952,681 238 12,406 2,282,668 184 -54 -22.72% 13
Total 47,371 $16,302,445 $344 45,919 $15,589,042 $339 -$5 -1.35%
Note: 1. Central Administration 2005-06 costs are from ST-3:AT1240 - Chief School AdministratorAT1399 - FinanceAT1499 - Other Staff, Legal, Personnel, & Public Information
2. Central Administration 2009-10 costs are from SAMS:DP code 23, Chief School AdministratorDP code 55, FinanceDP code 83, Other Staff, Legal, Personnel, & Public Information
3. CPI is from SED and % used for transportation contracts:05/06 3.406/07 4.807/08 2.508/09 4.009/10 -0.1
5 year compounded rate of 23.25%
TABLE XI - C - CENTRAL ADMINISTRATION PER STUDENT ADJUSTED FOR CPICOMPARISON OF CENTRAL ADMINISTRATION COSTS ON A PER STUDENT BASIS FOR 2005-06 to 2009-10
2005-06 CENTRAL ADMINISTRATION COSTS ADJUSTED FOR CPI

Page 43
05/06 09/10Bldg. Admin. Bldg. Admin. Bldg. Admin. % Bldg. Admin.
District Cost Cost Cost Increase Cost Increase Rank
Arlington $5,192,671 $6,859,619 $1,666,948 32.10% 4Beacon 1,836,884 2,391,957 555,073 30.22% 5Dover 906,768 1,066,843 160,075 17.65% 8Hyde Park 2,651,407 3,118,560 467,153 17.62% 9Millbrook 485,604 677,189 191,585 39.45% 1Northeast (Webutuck) 403,569 508,674 105,105 26.04% 7Pawling 990,338 1,323,708 333,370 33.66% 3Pine Plains 672,557 863,233 190,676 28.35% 6Poughkeepsie 3,521,030 3,749,132 228,102 6.48% 13Red Hook 1,415,254 1,911,736 496,482 35.08% 2Rhinebeck 931,552 1,064,143 132,591 14.23% 10Spackenkill 1,399,588 1,542,083 142,495 10.18% 12Wappingers 6,240,616 7,034,607 793,991 12.72% 11
Total $26,647,838 $32,111,484 $5,463,646 20.50%
Note: 1. Building Administration 2005-06 costs are from ST-3, Code AT2099. 2. Building Administration 2009-10 costs are from SAMS, DP code163.
TABLE XII - BUILDING ADMINISTRATIONCOMPARISON BUILDING ADMINISTRATION COSTS 2005-06 to 2009-10

Page 44
05/06 09/10Bldg. Admin. Bldg. Admin. Bldg. Admin. % Bldg. Admin.
District Cost Cost Cost Increase Cost Increase Rank
Arlington $6,399,967 $6,859,619 $459,652 7.18% 4Beacon $2,263,960 2,391,957 127,997 5.65% 5Dover $1,117,592 1,066,843 -50,749 -4.54% 8Hyde Park $3,267,859 3,118,560 -149,299 -4.57% 9Millbrook $598,507 677,189 78,682 13.15% 1Northeast (Webutuck) $497,399 508,674 11,275 2.27% 7Pawling $1,220,592 1,323,708 103,116 8.45% 3Pine Plains $828,927 863,233 34,306 4.14% 6Poughkeepsie $4,339,669 3,749,132 -590,537 -13.61% 13Red Hook $1,744,301 1,911,736 167,435 9.60% 2Rhinebeck $1,148,138 1,064,143 -83,995 -7.32% 10Spackenkill $1,724,992 1,542,083 -182,909 -10.60% 12Wappingers $7,691,559 7,034,607 -656,952 -8.54% 11
Total $32,843,460 $32,111,484 -$731,976 -2.23%
Note: 1. Building Administration 2005-06 costs are from ST-3, Code AT2099. 2. Building Administration 2009-10 costs are from SAMS, DP code163. 3. CPI is from SED and % used for transportation contracts:
05/06 3.406/07 4.807/08 2.508/09 4.009/10 -0.1
5 year compounded rate of 23.25%
TABLE XII - A - BUILDING ADMINISTRATION ADJUSTED FOR CPICOMPARISON BUILDING ADMINISTRATION COSTS 2005-06 to 2009-10
2005-06 BUILDING ADMIN. COSTS ADJUSTED FOR CPI

Page 45
05/06 09/1005/06 05/06 Bldg. Admin. 09/10 09/10 Bldg. Admin.
Student Bldg. Admin. Cost Student Bldg. Admin. Cost Bldg. Admin.% Bldg. Admin.District Enroll. Cost Per Student Enroll. Cost Per Student Cost Increase Cost Increase Rank
Arlington 10,322 $5,192,671 $503 10,041 $6,859,619 $683 $180 35.80% 6Beacon 3,380 1,836,884 543 3,443 2,391,957 695 151 27.84% 8Dover 1,714 906,768 529 1,612 1,066,843 662 133 25.10% 9Hyde Park 4,616 2,651,407 574 4,116 3,118,560 758 183 31.91% 7Millbrook 1,213 485,604 400 1,214 677,189 558 157 39.34% 3Northeast (Webutuck) 908 403,569 444 830 508,674 613 168 37.89% 5Pawling 1,452 990,338 682 1,396 1,323,708 948 266 39.02% 4Pine Plains 1,334 672,557 504 1,126 863,233 767 262 52.06% 1Poughkeepsie 4,606 3,521,030 764 4,666 3,749,132 804 39 5.11% 13Red Hook 2,364 1,415,254 599 2,231 1,911,736 857 258 43.13% 2Rhinebeck 1,235 931,552 754 1,191 1,064,143 893 139 18.45% 11Spackenkill 1,826 1,399,588 766 1,647 1,542,083 936 170 22.16% 10Wappingers 12,401 6,240,616 503 12,406 7,034,607 567 64 12.68% 12
Total 47,371 $26,647,838 $563 45,919 $32,111,484 $699 $137 24.31%
Note: 1. Building Administration 2005-06 costs are from ST-3, Code AT2099. 2. Building Administration 2009-10 costs are from SAMS, DP code163.
TABLE XII - B - BUILDING ADMINISTRATION PER STUDENTCOMPARISON BUILDING ADMINISTRATION COSTS ON A PER STUDENT BASIS FOR 2005-06 to 2009-10

Page 46
05/06 09/1005/06 05/06 Bldg. Admin. 09/10 09/10 Bldg. Admin.
Student Bldg. Admin. Cost Student Bldg. Admin. Cost Bldg. Admin.% Bldg. Admin.District Enroll. Cost Per Student Enroll. Cost Per Student Cost Increase Cost Increase Rank
Arlington 10,322 $6,399,967 $620 10,041 $6,859,619 $683 $63 10.18% 6Beacon 3,380 $2,263,960 670 3,443 2,391,957 695 25 3.72% 8Dover 1,714 $1,117,592 652 1,612 1,066,843 662 10 1.50% 9Hyde Park 4,616 $3,267,859 708 4,116 3,118,560 758 50 7.02% 7Millbrook 1,213 $598,507 493 1,214 677,189 558 64 13.05% 3Northeast (Webutuck) 908 $497,399 548 830 508,674 613 65 11.88% 5Pawling 1,452 $1,220,592 841 1,396 1,323,708 948 108 12.80% 4Pine Plains 1,334 $828,927 621 1,126 863,233 767 145 23.38% 1Poughkeepsie 4,606 $4,339,669 942 4,666 3,749,132 804 -139 -14.72% 13Red Hook 2,364 $1,744,301 738 2,231 1,911,736 857 119 16.13% 2Rhinebeck 1,235 $1,148,138 930 1,191 1,064,143 893 -36 -3.89% 11Spackenkill 1,826 $1,724,992 945 1,647 1,542,083 936 -8 -0.89% 10Wappingers 12,401 $7,691,559 620 12,406 7,034,607 567 -53 -8.58% 12
Total 47,371 $32,843,460 $693 45,919 $32,111,484 $699 $6 0.86%
Note: 1. Building Administration 2005-06 costs are from ST-3, Code AT2099. 2. Building Administration 2009-10 costs are from SAMS, DP code163. 3. CPI is from SED and % used for transportation contracts:
05/06 3.406/07 4.807/08 2.508/09 4.009/10 -0.1
5 year compounded rate of 23.25%
TABLE XII - C - BUILDING ADMINISTRATION PER STUDENT ADJUSTED FOR CPICOMPARISON BUILDING ADMINISTRATION COSTS ON A PER STUDENT BASIS FOR 2005-06 to 2009-10
2005-06 BUILDING ADMIN. COSTS ADJUSTED FOR CPI

Page 47
05/06 09/10 Employee % EmployeeEmployee Employee Benefits Costs Benefits Costs
District Benefits Costs Benefits Costs Increase Increase Rank
Arlington $29,726,995 $36,555,618 $6,828,623 22.97% 5Beacon 7,818,010 8,807,750 989,740 12.66% 11Dover 4,297,682 4,758,621 460,939 10.73% 12Hyde Park 13,818,365 16,971,907 3,153,542 22.82% 6Millbrook 3,745,415 5,253,285 1,507,870 40.26% 1Northeast (Webutuck) 3,385,090 3,874,637 489,547 14.46% 9Pawling 5,485,244 6,714,835 1,229,591 22.42% 7Pine Plains 5,089,960 5,753,072 663,112 13.03% 10Poughkeepsie 14,481,278 18,130,765 3,649,487 25.20% 3Red Hook 7,473,655 9,276,747 1,803,092 24.13% 4Rhinebeck 4,367,861 5,098,010 730,149 16.72% 8Spackenkill 6,684,117 7,359,092 674,975 10.10% 13Wappingers 34,759,263 46,982,847 12,223,584 35.17% 2
Total $141,132,935 $175,537,186 $34,404,251 24.38%
Note: 1. Employee Benefits 2005-06 are from ST-3, Code A9098. 2. Employee Benefits 2009-10 are from SAMS, DP code 357. (Includes all district employees.)
TABLE XIII - EMPLOYEE BENEFITS COMPARISON OF EMPLOYEE BENEFITS 2005-06 to 2009-10

Page 48
05/06 09/10 Employee % EmployeeEmployee Employee Benefits Costs Benefits Costs
District Benefits Costs Benefits Costs Increase Increase Rank
Arlington $36,638,521 $36,555,618 -$82,903 -0.23% 5Beacon $9,635,697 8,807,750 -827,947 -8.59% 11Dover $5,296,893 4,758,621 -538,272 -10.16% 12Hyde Park $17,031,135 16,971,907 -59,228 -0.35% 6Millbrook $4,616,224 5,253,285 637,061 13.80% 1Northeast (Webutuck) $4,172,123 3,874,637 -297,486 -7.13% 9Pawling $6,760,563 6,714,835 -45,728 -0.68% 7Pine Plains $6,273,376 5,753,072 -520,304 -8.29% 10Poughkeepsie $17,848,175 18,130,765 282,590 1.58% 3Red Hook $9,211,280 9,276,747 65,467 0.71% 4Rhinebeck $5,383,389 5,098,010 -285,379 -5.30% 8Spackenkill $8,238,174 7,359,092 -879,082 -10.67% 13Wappingers $42,840,792 46,982,847 4,142,055 9.67% 2
Total $173,946,342 $175,537,186 $1,590,844 0.91%
Note: 1. Employee Benefits 2005-06 are from ST-3, Code A9098. 2. Employee Benefits 2009-10 are from SAMS, DP code 357. (Includes all district employees.) 3. CPI is from SED and % used for transportation contracts:
05/06 3.406/07 4.807/08 2.508/09 4.009/10 -0.1
5 year compounded rate of 23.25%
TABLE XIII - A - EMPLOYEE BENEFITS ADJUSTED FOR CPI COMPARISON OF EMPLOYEE BENEFITS 2005-06 to 2009-10
2005-06 EMPLOYEES BENEFITS ADJUSTED FOR CPI

Page 49
05/06 09/1005/06 05/06 Employee 09/10 09/10 Employee Employee % Employee
Student Employee Benefits Costs Student Employee Benefits Costs Benefits Costs Benefits CostsDistrict Enroll. Benefits Costs Per Student Enroll. Benefits Costs Per Student Increase Increase Rank
Arlington 10,322 $29,726,995 $2,880 10,041 $36,555,618 $3,641 $761 26.41% 7Beacon 3,380 7,818,010 2,313 3,443 8,807,750 2,558 245 10.60% 13Dover 1,714 4,297,682 2,507 1,612 4,758,621 2,952 445 17.73% 12Hyde Park 4,616 13,818,365 2,994 4,116 16,971,907 4,123 1,130 37.74% 2Millbrook 1,213 3,745,415 3,088 1,214 5,253,285 4,327 1,240 40.14% 1Northeast (Webutuck) 908 3,385,090 3,728 830 3,874,637 4,668 940 25.22% 8Pawling 1,452 5,485,244 3,778 1,396 6,714,835 4,810 1,032 27.33% 6Pine Plains 1,334 5,089,960 3,816 1,126 5,753,072 5,109 1,294 33.91% 4Poughkeepsie 4,606 14,481,278 3,144 4,666 18,130,765 3,886 742 23.59% 9Red Hook 2,364 7,473,655 3,161 2,231 9,276,747 4,158 997 31.53% 5Rhinebeck 1,235 4,367,861 3,537 1,191 5,098,010 4,280 744 21.03% 11Spackenkill 1,826 6,684,117 3,661 1,647 7,359,092 4,468 808 22.06% 10Wappingers 12,401 34,759,263 2,803 12,406 46,982,847 3,787 984 35.11% 3
Total 47,371 $141,132,935 $2,979 45,919 $175,537,186 $3,823 $843 28.31%
Note: 1. Employee Benefits 2005-06 are from ST-3, Code A9098. 2. Employee Benefits 2009-10 are from SAMS, DP code 357. (Includes all district employees.)
TABLE XIII - B - EMPLOYEE BENEFITS PER STUDENTCOMPARISON OF EMPLOYEE BENEFITS ON PER STUDENT BASIS 2005-06 to 2009-10
Page 50
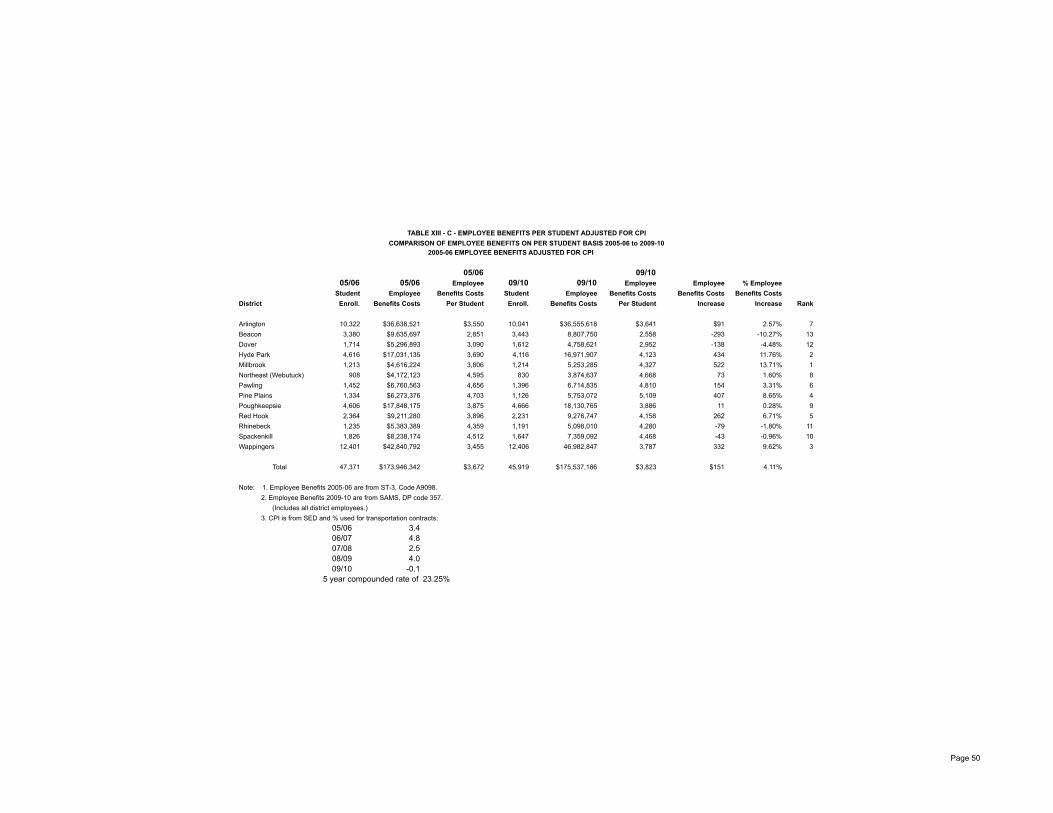
2005-06 EMPLOYEE BENEFITS ADJUSTED FOR CPI
05/06 09/1005/06 05/06 Employee 09/10 09/10 Employee Employee % Employee
Student Employee Benefits Costs Student Employee Benefits Costs Benefits Costs Benefits CostsDistrict Enroll. Benefits Costs Per Student Enroll. Benefits Costs Per Student Increase Increase Rank
Arlington 10,322 $36,638,521 $3,550 10,041 $36,555,618 $3,641 $91 2.57% 7Beacon 3,380 $9,635,697 2,851 3,443 8,807,750 2,558 -293 -10.27% 13Dover 1,714 $5,296,893 3,090 1,612 4,758,621 2,952 -138 -4.48% 12Hyde Park 4,616 $17,031,135 3,690 4,116 16,971,907 4,123 434 11.76% 2Millbrook 1,213 $4,616,224 3,806 1,214 5,253,285 4,327 522 13.71% 1Northeast (Webutuck) 908 $4,172,123 4,595 830 3,874,637 4,668 73 1.60% 8Pawling 1,452 $6,760,563 4,656 1,396 6,714,835 4,810 154 3.31% 6Pine Plains 1,334 $6,273,376 4,703 1,126 5,753,072 5,109 407 8.65% 4Poughkeepsie 4,606 $17,848,175 3,875 4,666 18,130,765 3,886 11 0.28% 9Red Hook 2,364 $9,211,280 3,896 2,231 9,276,747 4,158 262 6.71% 5Rhinebeck 1,235 $5,383,389 4,359 1,191 5,098,010 4,280 -79 -1.80% 11Spackenkill 1,826 $8,238,174 4,512 1,647 7,359,092 4,468 -43 -0.96% 10Wappingers 12,401 $42,840,792 3,455 12,406 46,982,847 3,787 332 9.62% 3
Total 47,371 $173,946,342 $3,672 45,919 $175,537,186 $3,823 $151 4.11%
Note: 1. Employee Benefits 2005-06 are from ST-3, Code A9098. 2. Employee Benefits 2009-10 are from SAMS, DP code 357. (Includes all district employees.) 3. CPI is from SED and % used for transportation contracts:
05/06 3.406/07 4.807/08 2.508/09 4.009/10 -0.1
5 year compounded rate of 23.25%
TABLE XIII - C - EMPLOYEE BENEFITS PER STUDENT ADJUSTED FOR CPICOMPARISON OF EMPLOYEE BENEFITS ON PER STUDENT BASIS 2005-06 to 2009-10
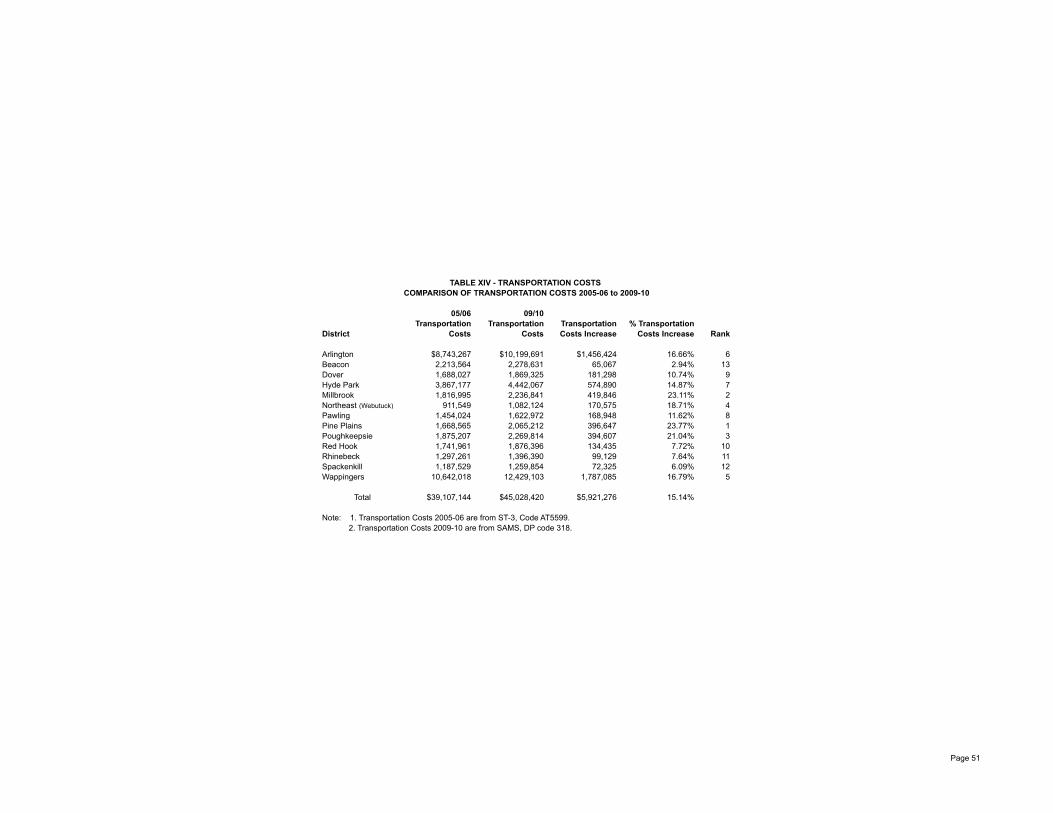
Page 51
05/06 09/10Transportation Transportation Transportation % Transportation
District Costs Costs Costs Increase Costs Increase Rank
Arlington $8,743,267 $10,199,691 $1,456,424 16.66% 6Beacon 2,213,564 2,278,631 65,067 2.94% 13Dover 1,688,027 1,869,325 181,298 10.74% 9Hyde Park 3,867,177 4,442,067 574,890 14.87% 7Millbrook 1,816,995 2,236,841 419,846 23.11% 2Northeast (Webutuck) 911,549 1,082,124 170,575 18.71% 4Pawling 1,454,024 1,622,972 168,948 11.62% 8Pine Plains 1,668,565 2,065,212 396,647 23.77% 1Poughkeepsie 1,875,207 2,269,814 394,607 21.04% 3Red Hook 1,741,961 1,876,396 134,435 7.72% 10Rhinebeck 1,297,261 1,396,390 99,129 7.64% 11Spackenkill 1,187,529 1,259,854 72,325 6.09% 12Wappingers 10,642,018 12,429,103 1,787,085 16.79% 5
Total $39,107,144 $45,028,420 $5,921,276 15.14%
Note: 1. Transportation Costs 2005-06 are from ST-3, Code AT5599. 2. Transportation Costs 2009-10 are from SAMS, DP code 318.
COMPARISON OF TRANSPORTATION COSTS 2005-06 to 2009-10TABLE XIV - TRANSPORTATION COSTS

Page 52
05/06 09/10Transportation Transportation Transportation % Transportation
District Costs Costs Costs Increase Costs Increase Rank
Arlington $10,776,077 $10,199,691 -$576,386 -5.35% 6Beacon $2,728,218 2,278,631 -449,587 -16.48% 13Dover $2,080,493 1,869,325 -211,168 -10.15% 9Hyde Park $4,766,296 4,442,067 -324,229 -6.80% 7Millbrook $2,239,446 2,236,841 -2,605 -0.12% 2Northeast (Webutuck) $1,123,484 1,082,124 -41,360 -3.68% 4Pawling $1,792,085 1,622,972 -169,113 -9.44% 8Pine Plains $2,056,506 2,065,212 8,706 0.42% 1Poughkeepsie $2,311,193 2,269,814 -41,379 -1.79% 3Red Hook $2,146,967 1,876,396 -270,571 -12.60% 10Rhinebeck $1,598,874 1,396,390 -202,484 -12.66% 11Spackenkill $1,463,629 1,259,854 -203,775 -13.92% 12Wappingers $13,116,287 12,429,103 -687,184 -5.24% 5
Total $48,199,555 $45,028,420 -$3,171,135 -6.58%
Note: 1. Transportation Costs 2005-06 are from ST-3, Code T5599. 2. Transportation Costs 2009-10 are from SAMS, DP code 318. 3. CPI is from SED and % used for transportation contracts:
05/06 3.406/07 4.807/08 2.508/09 4.009/10 -0.1
5 year compounded rate of 23.25%
TABLE XIV - A - TRANSPORTATION COSTS ADJUSTED FOR CPICOMPARISON OF TRANSPORTATION COSTS 2005-06 to 2009-10
2005-06 TRANSPORTATION COSTS ADJUSTED FOR CPI

Page 53
05/06 09/1005/06 05/06 Transportation 09/10 09/10 Transportation
Student Transportation Costs Student Transportation Costs Transportation% TransportationDistrict Enroll. Costs Per Student Enroll. Costs Per Student Costs Increase Costs Increase Rank
Arlington 10,322 $8,743,267 $847 10,041 $10,199,691 $1,016 $169 19.92% 5Beacon 3,380 2,213,564 655 3,443 2,278,631 662 7 1.06% 13Dover 1,714 1,688,027 985 1,612 1,869,325 1,160 175 17.75% 7Hyde Park 4,616 3,867,177 838 4,116 4,442,067 1,079 241 28.82% 3Millbrook 1,213 1,816,995 1,498 1,214 2,236,841 1,843 345 23.01% 4Northeast (Webutuck) 908 911,549 1,004 830 1,082,124 1,304 300 29.87% 2Pawling 1,452 1,454,024 1,001 1,396 1,622,972 1,163 161 16.10% 10Pine Plains 1,334 1,668,565 1,251 1,126 2,065,212 1,834 583 46.64% 1Poughkeepsie 4,606 1,875,207 407 4,666 2,269,814 486 79 19.49% 6Red Hook 2,364 1,741,961 737 2,231 1,876,396 841 104 14.14% 11Rhinebeck 1,235 1,297,261 1,050 1,191 1,396,390 1,172 122 11.62% 12Spackenkill 1,826 1,187,529 650 1,647 1,259,854 765 115 17.62% 8Wappingers 12,401 10,642,018 858 12,406 12,429,103 1,002 144 16.75% 9
Total 47,371 $39,107,144 $826 45,919 $45,028,420 $981 $155 18.78%
Note: 1. Transportation Costs 2005-06 are from ST-3, Code AT5599. 2. Transportation Costs 2009-10 are from SAMS, DP code 318.
TABLE XIV - B - TRANSPORTATION COSTS PER STUDENTCOMPARISON OF TRANSPORTATION COSTS ON PER STUDENT BASIS 2005-06 to 2009-10

Page 54
05/06 09/1005/06 05/06 Transportation 09/10 09/10 Transportation
Student Transportation Costs Student Transportation Costs Transportation% TransportationDistrict Enroll. Costs Per Student Enroll. Costs Per Student Costs Increase Costs Increase Rank
Arlington 10,322 $10,776,077 $1,044 10,041 $10,199,691 $1,016 -$28 -2.70% 5Beacon 3,380 $2,728,218 807 3,443 2,278,631 662 -145 -18.01% 13Dover 1,714 $2,080,493 1,214 1,612 1,869,325 1,160 -54 -4.46% 7Hyde Park 4,616 $4,766,296 1,033 4,116 4,442,067 1,079 47 4.52% 3Millbrook 1,213 $2,239,446 1,846 1,214 2,236,841 1,843 -4 -0.20% 4Northeast (Webutuck) 908 $1,123,484 1,237 830 1,082,124 1,304 66 5.37% 2Pawling 1,452 $1,792,085 1,234 1,396 1,622,972 1,163 -72 -5.80% 10Pine Plains 1,334 $2,056,506 1,542 1,126 2,065,212 1,834 293 18.97% 1Poughkeepsie 4,606 $2,311,193 502 4,666 2,269,814 486 -15 -3.05% 6Red Hook 2,364 $2,146,967 908 2,231 1,876,396 841 -67 -7.39% 11Rhinebeck 1,235 $1,598,874 1,295 1,191 1,396,390 1,172 -122 -9.44% 12Spackenkill 1,826 $1,463,629 802 1,647 1,259,854 765 -37 -4.57% 8Wappingers 12,401 $13,116,287 1,058 12,406 12,429,103 1,002 -56 -5.28% 9
Total 47,371 $48,199,555 $1,017 45,919 $45,028,420 $981 -$37 -3.63%
Note: 1. Transportation Costs 2005-06 are from ST-3, Code T5599. 2. Transportation Costs 2009-10 are from SAMS, DP code 318. 3. CPI is from SED and % used for transportation contracts:
05/06 3.406/07 4.807/08 2.508/09 4.009/10 -0.1
5 year compounded rate of 23.25%
TABLE XIV - C - TRANSPORTATION COSTS PER STUDENT ADJUSTED FOR CPICOMPARISON OF TRANSPORTATION COSTS ON PER STUDENT BASIS 2005-06 to 2009-10
2005-06 TRANSPORTATION COSTS ADJUSTED FOR CPI

Page 55
05/06 09/10 Plant % PlantPlant Plant Operations Operations
District Operations Operations Increase Increase Rank
Arlington $9,401,221 $10,379,518 $978,297 10.41% 8Beacon 2,638,402 3,948,414 1,310,012 49.65% 1Dover 1,947,421 2,094,825 147,404 7.57% 10Hyde Park 3,916,888 4,708,770 791,882 20.22% 5Millbrook 1,128,309 1,518,078 389,769 34.54% 2Northeast (Webutuck) 1,307,068 1,350,809 43,741 3.35% 13Pawling 2,073,079 2,543,623 470,544 22.70% 4Pine Plains 1,337,974 1,437,036 99,062 7.40% 11Poughkeepsie 3,518,290 3,839,434 321,144 9.13% 9Red Hook 2,275,917 2,603,158 327,241 14.38% 7Rhinebeck 1,212,698 1,511,695 298,997 24.66% 3Spackenkill 2,177,229 2,277,738 100,509 4.62% 12Wappingers 9,736,328 11,286,456 1,550,128 15.92% 6
Total $42,670,824 $49,499,554 $6,828,730 16.00%
Note: 1. Plant expenditures 2005-06 are from ST-3, Codes A1620 and A1621. 2. Plant expenditures 2009-10 are from SAMS, DP codes 89 and 95.
TABLE XV - PLANT OPERATIONSCOMPARISON OF PLANT OPERATIONS COSTS 2005-06 to 2009-10

Page 56
05/06 09/10 Plant % PlantPlant Plant Operations Operations
District Operations Operations Increase Increase Rank
Arlington $11,587,005 $10,379,518 -$1,207,487 -10.42% 8Beacon $3,251,830 3,948,414 696,584 21.42% 1Dover $2,400,196 2,094,825 -305,371 -12.72% 10Hyde Park $4,827,564 4,708,770 -118,794 -2.46% 5Millbrook $1,390,641 1,518,078 127,437 9.16% 2Northeast (Webutuck) $1,610,961 1,350,809 -260,152 -16.15% 13Pawling $2,555,070 2,543,623 -11,447 -0.45% 4Pine Plains $1,649,053 1,437,036 -212,017 -12.86% 11Poughkeepsie $4,336,292 3,839,434 -496,858 -11.46% 9Red Hook $2,805,068 2,603,158 -201,910 -7.20% 7Rhinebeck $1,494,650 1,511,695 17,045 1.14% 3Spackenkill $2,683,435 2,277,738 -405,697 -15.12% 12Wappingers $12,000,024 11,286,456 -713,568 -5.95% 6
Total $52,591,791 $49,499,554 -$3,092,237 -5.88%
Note: 1. Plant expenditures 2005-06 are from ST-3, Codes A1620 and A1621. 2. Plant expenditures 2009-10 are from SAMS, DP codes 89 and 95. 3. CPI is from SED and % used for transportation contracts:
05/06 3.406/07 4.807/08 2.508/09 4.009/10 -0.1
5 year compounded rate of 23.25%
TABLE XV - A - PLANT OPERATIONS ADJUSTED FOR CPICOMPARISON OF PLANT OPERATIONS COSTS 2005-06 to 2009-10
2005-06 PLANT OPERATIONS ADJUSTED FOR CPI

Page 57
05/06 09/1005/06 05/06 Plant Operation 09/10 09/10 Plant Operation Plant % Plant
Student Plant Costs Student Plant Costs Operations OperationsDistrict Enroll. Operations Per Student Enroll. Operations Per Student Increase Increase Rank
Arlington 10,322 $9,401,221 $911 10,041 $10,379,518 $1,034 $123 13.50% 11Beacon 3,380 2,638,402 781 3,443 3,948,414 1,147 366 46.91% 1Dover 1,714 1,947,421 1,136 1,612 2,094,825 1,300 163 14.38% 10Hyde Park 4,616 3,916,888 849 4,116 4,708,770 1,144 295 34.82% 2Millbrook 1,213 1,128,309 930 1,214 1,518,078 1,250 320 34.43% 3Northeast (Webutuck) 908 1,307,068 1,440 830 1,350,809 1,627 188 13.06% 12Pawling 1,452 2,073,079 1,428 1,396 2,543,623 1,822 394 27.62% 5Pine Plains 1,334 1,337,974 1,003 1,126 1,437,036 1,276 273 27.24% 6Poughkeepsie 4,606 3,518,290 764 4,666 3,839,434 823 59 7.72% 13Red Hook 2,364 2,275,917 963 2,231 2,603,158 1,167 204 21.20% 7Rhinebeck 1,235 1,212,698 982 1,191 1,511,695 1,269 287 29.26% 4Spackenkill 1,826 2,177,229 1,192 1,647 2,277,738 1,383 191 15.99% 8Wappingers 12,401 9,736,328 785 12,406 11,286,456 910 125 15.87% 9
Total 47,371 $42,670,824 $901 45,919 $49,499,554 $1,078 $177 19.67%
Note: 1. Plant expenditures 2005-06 are from ST-3, Codes A1620 and A1621. 2. Plant expenditures 2009-10 are from SAMS, DP codes 89 and 95.
TABLE XV - B - PLANT OPERATION COSTS PER STUDENTCOMPARISON OF PLANT OPERATION COSTS ON PER STUDENT BASIS 2005-06 to 2009-10

Page 58
05/06 09/1005/06 05/06 Plant Operation 09/10 09/10 Plant Operation Plant % Plant
Student Plant Costs Student Plant Costs Operations OperationsDistrict Enroll. Operations Per Student Enroll. Operations Per Student Increase Increase Rank
Arlington 10,322 $11,587,005 $1,123 10,041 $10,379,518 $1,034 -$89 -7.91% 11Beacon 3,380 $3,251,830 962 3,443 3,948,414 1,147 185 19.20% 1Dover 1,714 $2,400,196 1,400 1,612 2,094,825 1,300 -101 -7.20% 10Hyde Park 4,616 $4,827,564 1,046 4,116 4,708,770 1,144 98 9.39% 2Millbrook 1,213 $1,390,641 1,146 1,214 1,518,078 1,250 104 9.07% 3Northeast (Webutuck) 908 $1,610,961 1,774 830 1,350,809 1,627 -147 -8.27% 12Pawling 1,452 $2,555,070 1,760 1,396 2,543,623 1,822 62 3.55% 5Pine Plains 1,334 $1,649,053 1,236 1,126 1,437,036 1,276 40 3.24% 6Poughkeepsie 4,606 $4,336,292 941 4,666 3,839,434 823 -119 -12.60% 13Red Hook 2,364 $2,805,068 1,187 2,231 2,603,158 1,167 -20 -1.67% 7Rhinebeck 1,235 $1,494,650 1,210 1,191 1,511,695 1,269 59 4.88% 4Spackenkill 1,826 $2,683,435 1,470 1,647 2,277,738 1,383 -87 -5.89% 8Wappingers 12,401 $12,000,024 968 12,406 11,286,456 910 -58 -5.98% 9
Total 47,371 $52,591,791 $1,110 45,919 $49,499,554 $1,078 -$32 -2.90%
Note: 1. Plant expenditures 2005-06 are from ST-3, Codes A1620 and A1621. 2. Plant expenditures 2009-10 are from SAMS, DP codes 89 and 95. 3. CPI is from SED and % used for transportation contracts:
05/06 3.406/07 4.807/08 2.508/09 4.009/10 -0.1
5 year compounded rate of 23.25%
TABLE XV - C - PLANT OPERATION COSTS PER STUDENT ADJUSTED FOR CPICOMPARISON OF PLANT OPERATION COSTS ON PER STUDENT BASIS 2005-06 to 2009-10
2005-06 PLANT OPERATIONS COSTS ADJUSTED FOR CPI

Page 59
05/06 09/10Interscholastic Interscholastic Interscholastic % Interscholastic& Cocurricular & Cocurricular & Cocurricular & Cocurricular
District Sports Sports Sports Increase Sports Increase Rank
Arlington $834,794 $1,060,580 $225,786 27.05% 6Beacon 413,340 528,512 115,172 27.86% 5Dover 220,369 254,159 33,790 15.33% 9Hyde Park 421,942 436,448 14,506 3.44% 11Millbrook 153,916 348,830 194,914 126.64% 1Northeast (Webutuck) 191,720 186,543 -5,177 -2.70% 13Pawling 428,608 477,524 48,916 11.41% 10Pine Plains 288,618 335,772 47,154 16.34% 8Poughkeepsie 594,534 788,279 193,745 32.59% 3Red Hook 345,986 428,734 82,748 23.92% 7Rhinebeck 264,415 370,915 106,500 40.28% 2Spackenkill 505,675 654,278 148,603 29.39% 4Wappingers 1,275,311 1,245,932 -29,379 -2.30% 12
Total $5,939,228 $7,116,506 $1,177,278 19.82%
Note: 1. Interscholastic & Co-curricular Sports 2005-06 are from ST-3, Codes A2850 and A2855. 2. Interscholastic & Co-curricular Sports 2009-10 are from SAMS, DP codes 289 and 296.
TABLE XVI - INTERSCHOLASTIC & CO-CURRICULAR SPORTS COSTSCOMPARISON OF INTERSCHOLASTIC & CO-CURRICULAR COSTS 2005-06 to 2009-10

Page 60
05/06 09/10Interscholastic Interscholastic Interscholastic % Interscholastic& Cocurricular & Cocurricular & Cocurricular & Cocurricular
District Sports Sports Sports Increase Sports Increase Rank
Arlington $1,028,884 $1,060,580 $31,696 3.08% 6Beacon $509,442 528,512 19,070 3.74% 5Dover $271,605 254,159 -17,446 -6.42% 9Hyde Park $520,044 436,448 -83,596 -16.07% 11Millbrook $189,701 348,830 159,129 83.88% 1Northeast (Webutuck) $236,295 186,543 -49,752 -21.06% 13Pawling $528,259 477,524 -50,735 -9.60% 10Pine Plains $355,722 335,772 -19,950 -5.61% 8Poughkeepsie $732,763 788,279 55,516 7.58% 3Red Hook $426,428 428,734 2,306 0.54% 7Rhinebeck $325,891 370,915 45,024 13.82% 2Spackenkill $623,244 654,278 31,034 4.98% 4Wappingers $1,571,821 1,245,932 -325,889 -20.73% 12
Total $7,320,099 $7,116,506 -$203,593 -2.78%
Note: 1. Interscholastic & Co-curricular Sports 2005-06 are from ST-3, Codes A2850 and A2855. 2. Interscholastic & Co-curricular Sports 2009-10 are from SAMS, DP codes 289 and 296. 3. CPI is from SED and % used for transportation contracts:
05/06 3.406/07 4.807/08 2.508/09 4.009/10 -0.1
5 year compounded rate of 23.25%
TABLE XVI - A - INTERSCHOLASTIC & CO-CURRICULAR SPORTS COSTS ADJUSTED FOR CPICOMPARISON OF INTERSCHOLASTIC & CO-CURRICULAR COSTS 2005-06 to 2009-10
2005-06 INTERSCHOLASTIC & CO-CURRICULAR COSTS ADJUSTED FOR CPI

Page 61
05/06 09/1005/06 Interscholastic 09/10 Interscholastic
05/06 Interscholastic & Cocurricular 09/10 Interscholastic & Cocurricular Interscholastic % InterscholasticStudent & Cocurricular Sports Student & Cocurricular Sports & Cocurricular & Cocurricular
District Enroll. Sports Per Student Enroll. Sports Per Student Sports Increase Sports Increase Rank
Arlington 10,322 $834,794 $81 10,041 $1,060,580 $106 $25 30.60% 7Beacon 3,380 413,340 122 3,443 528,512 154 31 25.52% 8Dover 1,714 220,369 129 1,612 254,159 158 29 22.63% 9Hyde Park 4,616 421,942 91 4,116 436,448 106 15 16.00% 10Millbrook 1,213 153,916 127 1,214 348,830 287 160 126.45% 1Northeast (Webutuck) 908 191,720 211 830 186,543 225 14 6.44% 12Pawling 1,452 428,608 295 1,396 477,524 342 47 15.88% 11Pine Plains 1,334 288,618 216 1,126 335,772 298 82 37.83% 4Poughkeepsie 4,606 594,534 129 4,666 788,279 169 40 30.88% 6Red Hook 2,364 345,986 146 2,231 428,734 192 46 31.30% 5Rhinebeck 1,235 264,415 214 1,191 370,915 311 97 45.46% 2Spackenkill 1,826 505,675 277 1,647 654,278 397 120 43.45% 3Wappingers 12,401 1,275,311 103 12,406 1,245,932 100 -2 -2.34% 13
Total 47,371 $5,939,228 $125 45,919 $7,116,506 $155 $30 23.61%
Note: 1. Interscholastic & Co-curricular Sports 2005-06 are from ST-3, Codes A2850 and A2855. 2. Interscholastic & Co-curricular Sports 2009-10 are from SAMS, DP codes 289 and 296.
TABLE XVI - B - INTERSCHOLASTIC & CO-CURRICULAR COSTS PER STUDENTCOMPARISON OF INTERSCHOLASTIC & CO-CURRICULAR COSTS ON PER STUDENT BASIS 2005-06 to 2009-10

Page 62
05/06 09/1005/06 Interscholastic 09/10 Interscholastic
05/06 Interscholastic & Cocurricular 09/10 Interscholastic & Cocurricular Interscholastic % InterscholasticStudent & Cocurricular Sports Student & Cocurricular Sports & Cocurricular & Cocurricular
District Enroll. Sports Per Student Enroll. Sports Per Student Sports Increase Sports Increase Rank
Arlington 10,322 $1,028,884 $100 10,041 $1,060,580 $106 $6 5.97% 7Beacon 3,380 $509,442 151 3,443 528,512 154 3 1.85% 8Dover 1,714 $271,605 158 1,612 254,159 158 -1 -0.50% 9Hyde Park 4,616 $520,044 113 4,116 436,448 106 -7 -5.88% 10Millbrook 1,213 $189,701 156 1,214 348,830 287 131 83.73% 1Northeast (Webutuck) 908 $236,295 260 830 186,543 225 -35 -13.64% 12Pawling 1,452 $528,259 364 1,396 477,524 342 -22 -5.98% 11Pine Plains 1,334 $355,722 267 1,126 335,772 298 32 11.83% 4Poughkeepsie 4,606 $732,763 159 4,666 788,279 169 10 6.19% 6Red Hook 2,364 $426,428 180 2,231 428,734 192 12 6.53% 5Rhinebeck 1,235 $325,891 264 1,191 370,915 311 48 18.02% 2Spackenkill 1,826 $623,244 341 1,647 654,278 397 56 16.39% 3Wappingers 12,401 $1,571,821 127 12,406 1,245,932 100 -26 -20.77% 13
Total 47,371 $7,320,099 $155 45,919 $7,116,506 $155 $0 0.29%
Note: 1. Interscholastic & Co-curricular Sports 2005-06 are from ST-3, Codes A2850 and A2855. 2. Interscholastic & Co-curricular Sports 2009-10 are from SAMS, DP codes 289 and 296. 3. CPI is from SED and % used for transportation contracts:
05/06 3.406/07 4.807/08 2.508/09 4.009/10 -0.1
5 year compounded rate of 23.25%
TABLE XVI - C - INTERSCHOLASTIC & CO-CURRICULAR COSTS PER STUDENT ADJUSTED FOR CPICOMPARISON OF INTERSCHOLASTIC & CO-CURRICULAR COSTS ON PER STUDENT BASIS 2005-06 to 2009-10
2005-06 INTERSCHOLASTIC & CO-CURRICULAR COSTS ADJUSTED FOR CPI
leadership | efficiency | innovation | excellence | collaboration
Dutchess County Board of Cooperative Educational Services
5 BOCES Road • Poughkeepsie, NY 12601
voice: 845.486.4800 fax: 845.486.4981
www.dcboces.org
Compiled byBusiness Services
Linda Poleski, Assistant Superintendent – Business ServicesPatricia Richardson, Contract Consultant
Layout and Design byOffice of Communications and Grants Research
Anna Marie Paolercio, Director – Communications and Grants ResearchMaria Hoskins, Public Information Officer
Printing by Shared Printing Service
Genevieve Kellam, Reproduction Coordinator