urban action agenda 2015 village of wappingers fallsthe school district or districts that are...
TRANSCRIPT
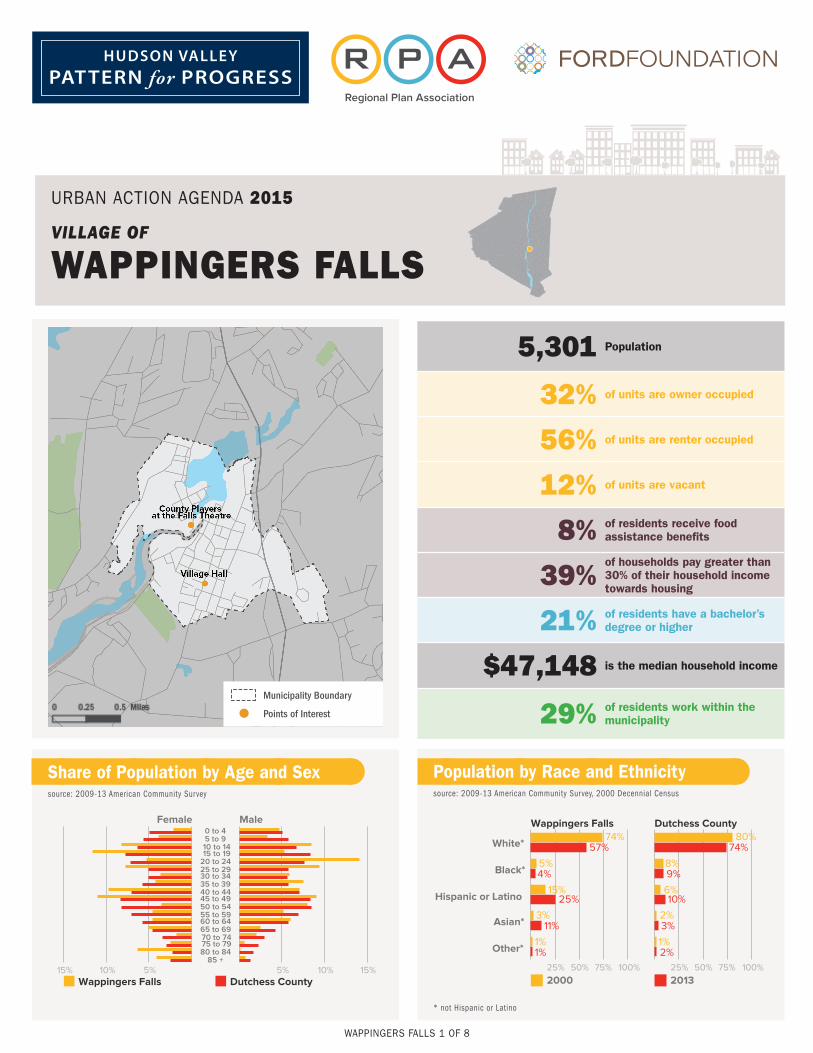
Population by Race and Ethnicity source: 2009-13 American Community Survey, 2000 Decennial Census
Share of Population by Age and Sexsource: 2009-13 American Community Survey
* not Hispanic or Latino
WaPPInGeRS FallS 1 oF 8
URBan acTIon aGenDa 2015
VILLAGE OF
WAPPINGERS FALLS
5% 10% 15%5%10%15%
0 to 4Male
Wappingers Falls
5 to 9 10 to 14 15 to 19
20 to 24 25 to 29 30 to 34 35 to 39 40 to 44 45 to 49 50 to 54 55 to 59 60 to 64 65 to 69 70 to 74 75 to 79 80 to 84
85 +
Female
Dutchess County25% 50% 75% 100% 25% 50% 75% 100%
White*
Wappingers Falls 74%
2000
Black*5%
Hispanic or Latino15%
Asian*3%
Other*1%
57%
2013
4%
25%
11%
1%
Dutchess County80%
8%
6%
2%
1%
74%
9%
10%
3%
2%
5,301 Population
32% of units are owner occupied
56% of units are renter occupied
12% of units are vacant
8% of residents receive food assistance benefits
39%of households pay greater than 30% of their household income towards housing
21% of residents have a bachelor’s degree or higher
$47,148 is the median household income
29% of residents work within the municipality
Municipality Boundary
Points of Interest
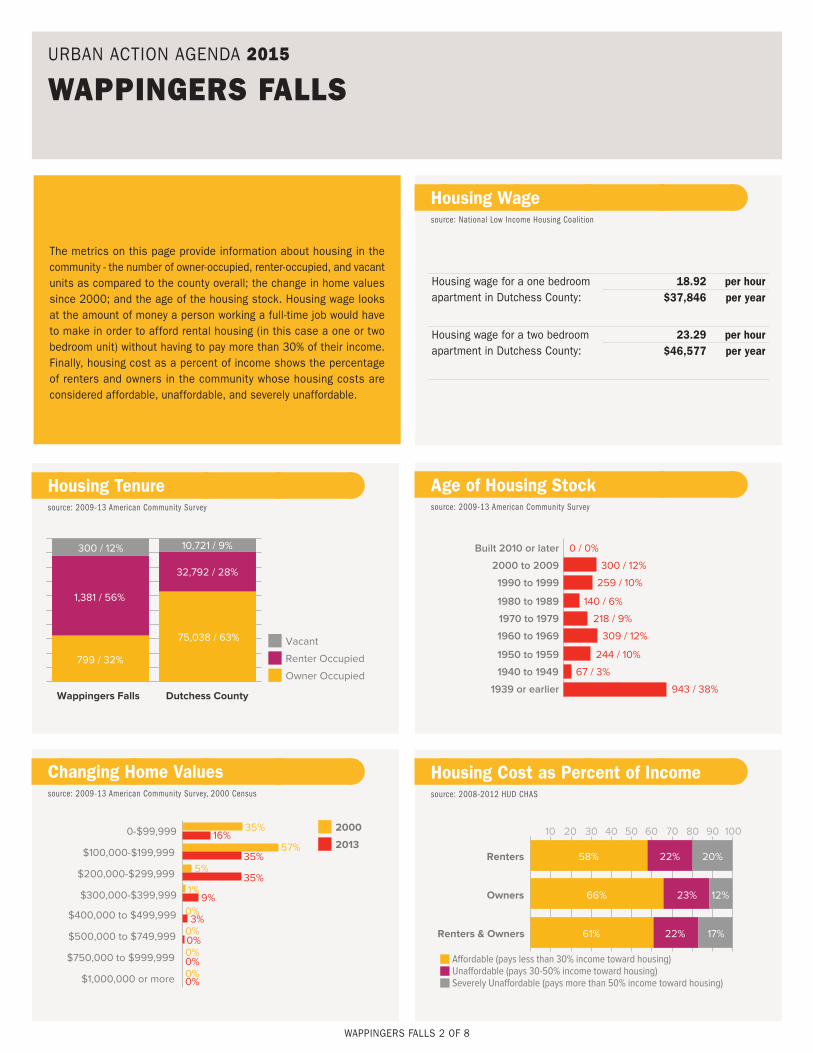
Housing Cost as Percent of Incomesource: 2008-2012 HUD CHAS
Housing Wagesource: National Low Income Housing Coalition
Changing Home Valuessource: 2009-13 American Community Survey, 2000 Census
Age of Housing Stocksource: 2009-13 American Community Survey
HOUSINGThe metrics on this page provide information about housing in the community - the number of owner-occupied, renter-occupied, and vacant units as compared to the county overall; the change in home values since 2000; and the age of the housing stock. Housing wage looks at the amount of money a person working a full-time job would have to make in order to afford rental housing (in this case a one or two bedroom unit) without having to pay more than 30% of their income. Finally, housing cost as a percent of income shows the percentage of renters and owners in the community whose housing costs are considered affordable, unaffordable, and severely unaffordable.
Housing Tenuresource: 2009-13 American Community Survey
WaPPInGeRS FallS 2 oF 8
35%0-$99,999 2000
57%$100,000-$199,999
5%$200,000-$299,999
1%$300,000-$399,999
0%$400,000 to $499,999
0%$500,000 to $749,999
0%$750,000 to $999,999
0%$1,000,000 or more
16%2013
35%
35%
9%
3%
0%
0%
0%
10 20 30 40 50 60 70 80 90 100
58%
Affordable (pays less than 30% income toward housing)
Renters 22%
Unaffordable (pays 30-50% income toward housing)
20%
Severely Unaffordable (pays more than 50% income toward housing)
66%Owners 23% 12%
61%Renters & Owners 22% 17%
799 / 32%
Owner Occupied
Wappingers Falls
1,381 / 56%
Renter Occupied
300 / 12%
Vacant75,038 / 63%
Dutchess County
32,792 / 28%
10,721 / 9% 0 / 0%Built 2010 or later
300 / 12%2000 to 2009
259 / 10%1990 to 1999
140 / 6%1980 to 1989
218 / 9%1970 to 1979
309 / 12%1960 to 1969
244 / 10%1950 to 1959
67 / 3%1940 to 1949
943 / 38%1939 or earlier
URBan acTIon aGenDa 2015
WAPPINGERS FALLS
Housing wage for a one bedroom apartment in Dutchess county:
18.92 per hour$37,846 per year
Housing wage for a two bedroom apartment in Dutchess county:
23.29 per hour$46,577 per year
Melville$353,100 in 2013$169,000 in 2000
Suffolk County$383,400 in 2013$183,500 in 2000
Source: LI Real Estate
Suffolk County
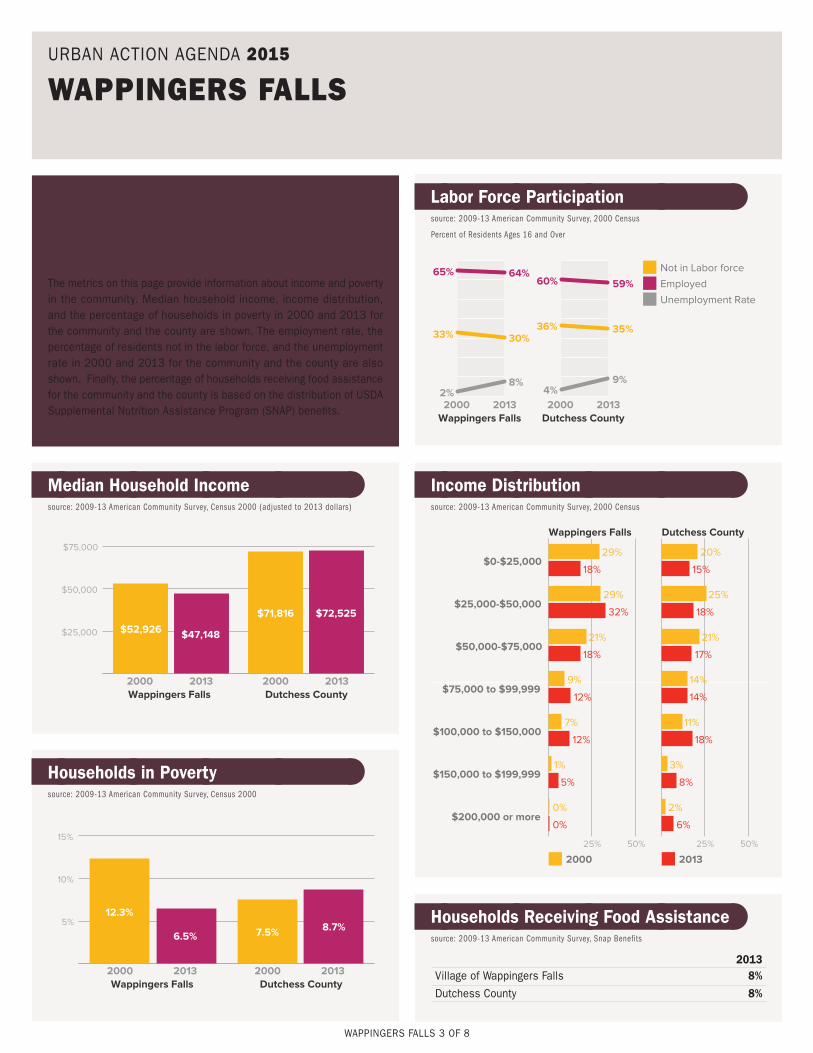
INCOME AND POVERTYThe metrics on this page provide information about income and poverty in the community. Median household income, income distribution, and the percentage of households in poverty in 2000 and 2013 for the community and the county are shown. The employment rate, the percentage of residents not in the labor force, and the unemployment rate in 2000 and 2013 for the community and the county are also shown. Finally, the percentage of households receiving food assistance for the community and the county is based on the distribution of USDa Supplemental nutrition assistance Program (SnaP) benefits.
Households in Povertysource: 2009-13 American Community Survey, Census 2000
Median Household Incomesource: 2009-13 American Community Survey, Census 2000 (adjusted to 2013 dollars)
Labor Force Participation source: 2009-13 American Community Survey, 2000 Census
Households Receiving Food Assistancesource: 2009-13 American Community Survey, Snap Benefits
Income Distributionsource: 2009-13 American Community Survey, 2000 Census
Percent of Residents Ages 16 and Over
WaPPInGeRS FallS 3 oF 8
$25,000
$50,000
$75,000
$52,926
2000
$47,148
2013Wappingers Falls
$71,816
2000
$72,525
2013Dutchess County
25% 50% 25% 50%
$0-$25,000
Wappingers Falls
29%
2000
$25,000-$50,00029%
$50,000-$75,00021%
$75,000 to $99,9999%
$100,000 to $150,0007%
$150,000 to $199,9991%
$200,000 or more0%
18%
2013
32%
18%
12%
12%
5%
0%
Dutchess County
20%
25%
21%
14%
11%
3%
2%
15%
18%
17%
14%
18%
8%
6%
33% 30%
2000 2013Wappingers Falls
Not in Labor force65% 64%Employed
2%8%
Unemployment Rate
36% 35%
2000 2013Dutchess County
60% 59%
4%9%
5%
10%
15%
12.3%
2000
6.5%
2013Wappingers Falls
7.5%
2000
8.7%
2013Dutchess County
URBan acTIon aGenDa 2015
WAPPINGERS FALLS
2013Village of Wappingers Falls 8%Dutchess county 8%
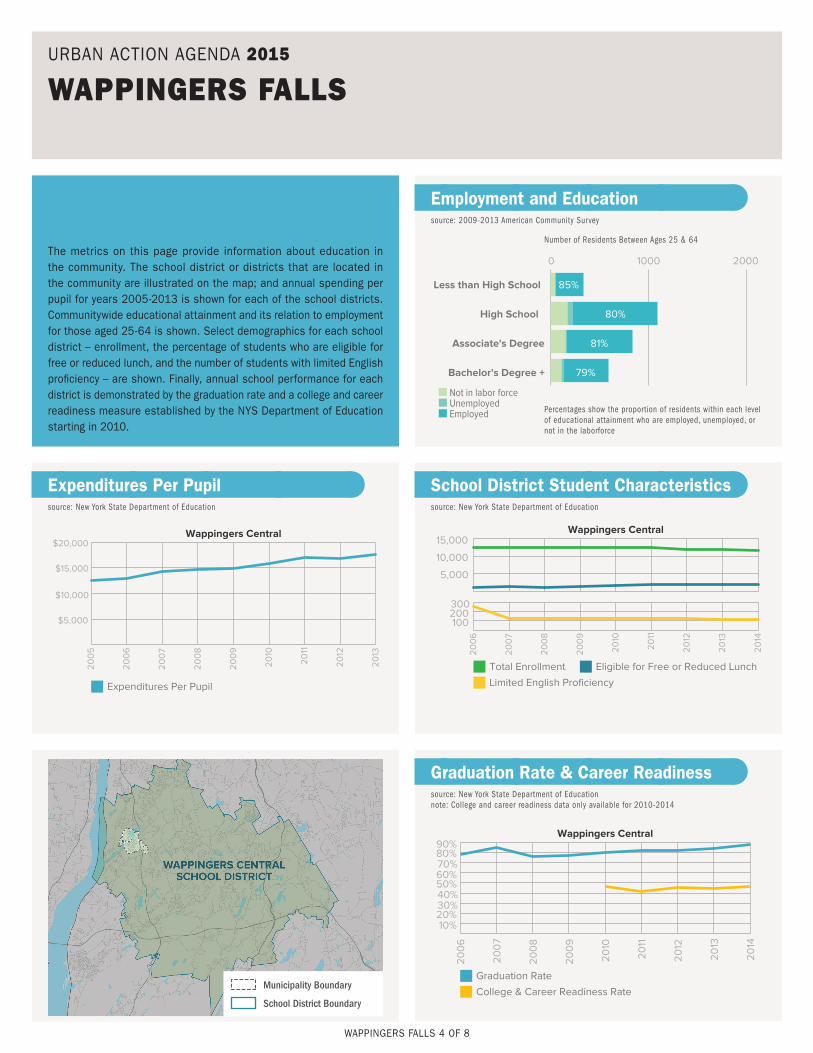
School District Student Characteristicssource: New York State Department of Education
Expenditures Per Pupilsource: New York State Department of Education
Employment and Educationsource: 2009-2013 American Community SurveyEDUCATION
The metrics on this page provide information about education in the community. The school district or districts that are located in the community are illustrated on the map; and annual spending per pupil for years 2005-2013 is shown for each of the school districts. communitywide educational attainment and its relation to employment for those aged 25-64 is shown. Select demographics for each school district – enrollment, the percentage of students who are eligible for free or reduced lunch, and the number of students with limited english proficiency – are shown. Finally, annual school performance for each district is demonstrated by the graduation rate and a college and career readiness measure established by the nYS Department of education starting in 2010.
Graduation Rate & Career Readiness source: New York State Department of Education note: College and career readiness data only available for 2010-2014
Number of Residents Between Ages 25 & 64
Percentages show the proportion of residents within each level of educational attainment who are employed, unemployed, or not in the laborforce
WaPPInGeRS FallS 4 oF 8
$5,000
$10,000
$15,000
$20,000
20
05
20
06
20
07
20
08
20
09
20
10
20
11
20
12
20
13
Expenditures Per Pupil
Wappingers Central
5,000
10,000
15,000
100200300
20
06
20
07
20
08
20
09
20
10
20
11
20
12
20
13
20
14
Total Enrollment Eligible for Free or Reduced Lunch
Limited English Proficiency
Wappingers Central
0 1000 2000
Less than High School
Not in labor forceUnemployed
85%
Employed
High School 80%
Associate's Degree 81%
Bachelor's Degree + 79%
10%20%30%40%50%60%70%80%90%
20
06
20
07
20
08
20
09
20
10
20
11
20
12
20
13
20
14
Graduation Rate
College & Career Readiness Rate
Wappingers Central
URBan acTIon aGenDa 2015
WAPPINGERS FALLS
Municipality Boundary
School District Boundary
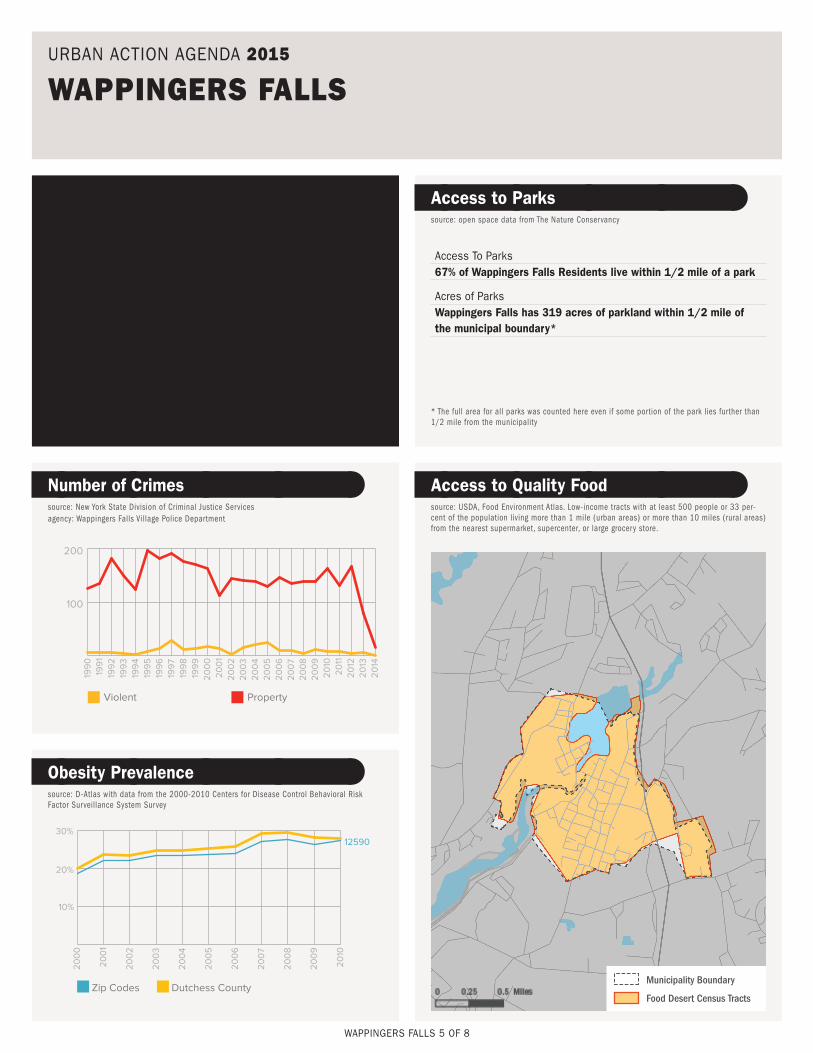
Access to Quality Food source: USDA, Food Environment Atlas. Low-income tracts with at least 500 people or 33 per-cent of the population living more than 1 mile (urban areas) or more than 10 miles (rural areas) from the nearest supermarket, supercenter, or large grocery store.
Obesity Prevalencesource: D-Atlas with data from the 2000-2010 Centers for Disease Control Behavioral Risk Factor Surveillance System Survey
Number of Crimessource: New York State Division of Criminal Justice Services
Access to Parkssource: open space data from The Nature ConservancyQUALITY OF LIFE
Indicators on this page provide information about the quality of life in the community. The annual number of reported crimes going back to 1990 is broken down into two categories – violent and property crimes. obesity prevalence by zip code in comparison to the county provides an indicator of public health. The percent of the population that lives within walking distance of a park as well as the total acres of parks in close proximity of the municipality are expressed. and finally, access to quality food looks at the proximity of people in low-income neighborhoods to the nearest supermarket, supercenter, or large grocery store. areas that are highlighted demonstrate poor access to quality food. * The full area for all parks was counted here even if some portion of the park lies further than
1/2 mile from the municipality
WaPPInGeRS FallS 5 oF 8
10%
20%
30%
20
00
20
01
20
02
20
03
20
04
20
05
20
06
20
07
20
08
20
09
20
10
12590
Zip Codes Dutchess County
URBan acTIon aGenDa 2015
WAPPINGERS FALLS
100
200
199
0
Violent
199
119
92
199
319
94
199
519
96
199
719
98
199
92
00
02
00
12
00
22
00
32
00
42
00
52
00
62
00
72
00
82
00
92
010
20
112
012
20
132
014
Property
agency: Wappingers Falls Village Police Department
access To Parks67% of Wappingers Falls Residents live within 1/2 mile of a park
acres of ParksWappingers Falls has 319 acres of parkland within 1/2 mile of the municipal boundary*
Municipality Boundary
Food Desert Census Tracts
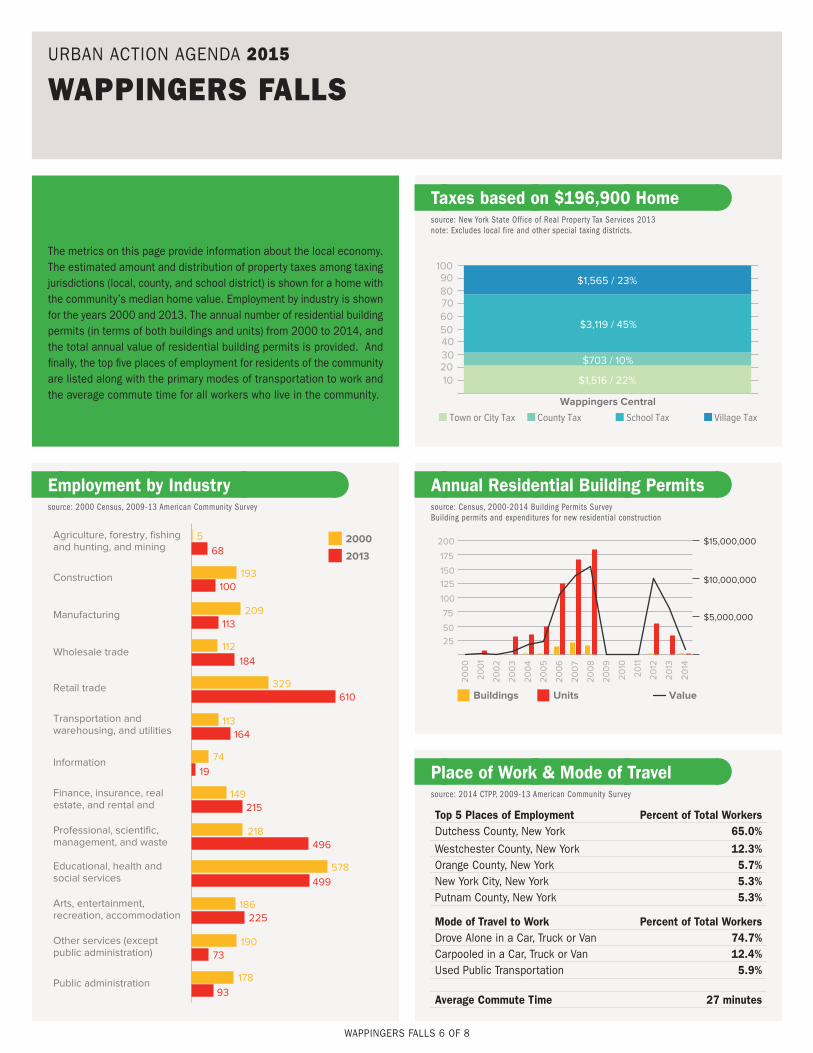
Place of Work & Mode of Travelsource: 2014 CTPP, 2009-13 American Community Survey
Annual Residential Building Permitssource: Census, 2000-2014 Building Permits Survey Building permits and expenditures for new residential construction
Employment by Industrysource: 2000 Census, 2009-13 American Community Survey
ECONOMYThe metrics on this page provide information about the local economy. The estimated amount and distribution of property taxes among taxing jurisdictions (local, county, and school district) is shown for a home with the community’s median home value. employment by industry is shown for the years 2000 and 2013. The annual number of residential building permits (in terms of both buildings and units) from 2000 to 2014, and the total annual value of residential building permits is provided. and finally, the top five places of employment for residents of the community are listed along with the primary modes of transportation to work and the average commute time for all workers who live in the community.
WaPPInGeRS FallS 6 oF 8
5Agriculture, forestry, fishing and hunting, and mining
193Construction
209Manufacturing
112Wholesale trade
329Retail trade
113Transportation and warehousing, and utilities
74Information
149Finance, insurance, real estate, and rental and
218Professional, scientific, management, and waste
578Educational, health and social services
186Arts, entertainment, recreation, accommodation
190Other services (except public administration)
178Public administration
68
100
113
184
610
164
19
215
496
499
225
73
93
2000
2013
URBan acTIon aGenDa 2015
WAPPINGERS FALLS
2550
75
100
125150
175
200
20
00
Buildings
20
01
20
02
20
03
20
04
20
05
20
06
20
07
20
08
20
09
20
10
20
11
20
12
20
13
20
14Units
$5,000,000
$10,000,000
$15,000,000
Value
Taxes based on $196,900 Homesource: New York State Office of Real Property Tax Services 2013 note: Excludes local fire and other special taxing districts.
102030405060708090
100
$1,516 / 22%
Town or City Tax
Wappingers Central
$703 / 10%
County Tax
$3,119 / 45%
School Tax
$1,565 / 23%
Village Tax
Top 5 Places of Employment Percent of Total WorkersDutchess county, new York 65.0%Westchester county, new York 12.3%orange county, new York 5.7%new York city, new York 5.3%Putnam county, new York 5.3%
Mode of Travel to Work Percent of Total WorkersDrove alone in a car, Truck or Van 74.7%carpooled in a car, Truck or Van 12.4%Used Public Transportation 5.9%
Average Commute Time 27 minutes
ABOUT THIS PROJECT
About Regional Plan AssociationRegional Plan association is america’s most distinguished independent urban research and advocacy organization. RPa improves the new York metropolitan region’s economic health, environmental sustainability and quality of life through research, planning and advocacy. Since the 1920s, RPa has produced three landmark plans for the region and is working on a fourth plan that will tackle challenges related to sustained economic growth and opportunity, climate change, infrastructure and the fiscal health of our state and local governments. For more information, please visit www.rpa.org.
About Hudson Valley Pattern for Progresscelebrating our 50th anniversary in 2015, Hudson Valley Pattern for Progress is a not-for-profit policy, planning, advocacy and research organization whose mission is to promote regional, balanced and sustainable solutions that enhance the growth and vitality of the Hudson Valley. Pattern brings together business, nonprofit, academic and government leaders from across as many as nine counties to collaborate on regional issues. For more information, please visit www.pattern-for-progress.org
CitationRegional Plan Association and Hudson Valley Pattern for Progress. November 2015. “Urban Action Agenda 2015: Municipal Profiles.”
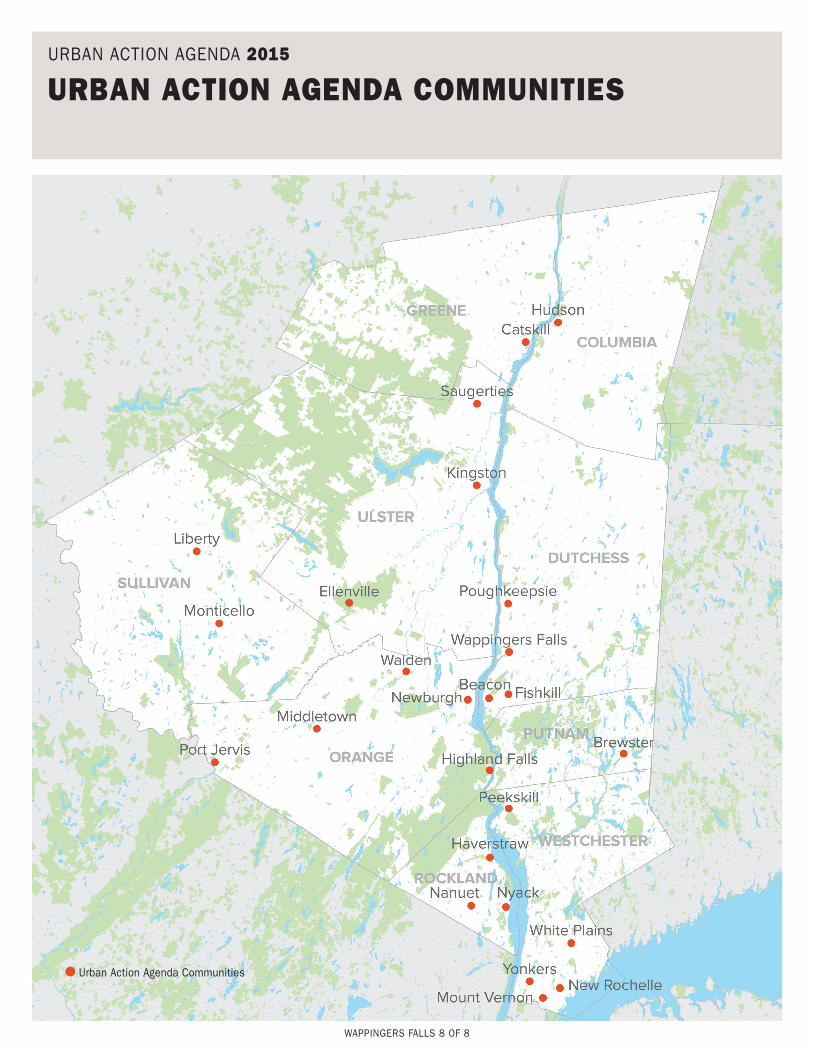
The Urban Action Agenda (UAA) is a three-year initiative led by Hudson Valley Pattern for Progress (Pattern) to promote the revitalization of urban centers throughout the nine-county Hudson Valley Region. Though it is part of the larger NYC Metropolitan Region, the Hudson Valley does not have a single urban center that acts as the region’s heart but instead consists of a constellation of urban centers, large and small, located along the Hudson River and other historic transportation corridors. Today, these places face a number of challenges; but some of the Hudson Valley’s urban centers are starting to turn the corner. Nationally, trends show a renewed interest in urban living. Vibrant downtowns and waterfronts, walkable neighborhoods, access to high quality public spaces and other amenities are bringing people back to cities and other urban places.
Hudson Valley Pattern for Progress sees this as an historic moment to focus attention on the revitalization of the region’s urban centers. With their existing infrastructure, these communities are best suited to accommodate the region’s future growth. A focus on urban centers is consistent with our region’s environmental ethos and also serves to aid in the preservation of the Valley’s special landscape.
The UAA seeks to place the revitalization of our urban centers squarely at the forefront of the region’s policy and investment priorities at the local, regional and state level. Through the UAA we will assess the state of the region and monitor progress; convene and collaborate with local officials, regional agencies, and organizations; use public engagement to solicit ideas; prepare a regional strategy based on local and national best practices that can guide revitalization efforts; integrate UAA research with complementary activities in the larger New
York Region; and educate stakeholders through UAA reports and by periodically hosting urban experts to speak on a variety of topics facing our communities.
Twenty-five communities in the Hudson Valley have agreed to participate directly in the UAA initiative. As part of the project we developed these data profiles for each of the UAA communities. Pattern is also collaborating with each UAA community to identify revitalization strategies that are working and which may be transferable, unique amenities and assets that should be promoted, and transformative projects that can be advocated for under the UAA banner.
The UAA is funded in part through a grant from the Ford Foundation in partnership with the Regional Plan Association (RPA) as part of RPA’s Fourth Regional Plan initiative.
WaPPInGeRS FallS 7 oF 8
URBAN ACTION AGENDA 2015
URBAN ACTION AGENDA COMMUNITIES
Urban action agenda communities
WaPPInGeRS FallS 8 oF 8