facilities maintenance - plant engineering · 2019-02-07 · cmms (58%), in-house...
TRANSCRIPT
Facilities Maintenance
March 2019
Sponsored by

Table of contents
Section Pages
Introduction and methodology 3
Summary of findings 4
Respondent profile 5-9
Facility maintenance 10-24
Additional resources 25
2

Introduction and methodology
3
Objective
This study was completed by Plant Engineering to evaluate the maintenance practices and strategies
currently in place in manufacturing facilities and the effects of maintenance on productivity and
profitability.
Sample
The sample was selected from recipients of Plant Engineering for whom email addresses were
available. Only respondents responsible for maintenance for all or part of their facilities were asked
about maintenance strategies, outsourcing maintenance, training, technologies, and unscheduled
downtime.
Method
Subscribers were sent an email asking them to participate in this study. The email included a URL linked
to the questionnaire.
▪ Data collected: Dec. 21, 2018, through Jan. 9, 2019
▪ Number of respondents: 199
o Margin of error: +/- 6.9% at a 95% confidence level
▪ Incentive: Survey participants were offered the opportunity to enter a drawing for a chance to
receive a $100 Amazon.com gift card.

Summary of findings
4
• Maintenance strategies: Seventy-eight percent of manufacturing facilities follow a preventive
maintenance strategy; 61% have a computerized maintenance management system (CMMS), and
56% use a run-to-failure method.
• Scheduled maintenance: Fifty-three percent of facilities allocate up to 10% of their annual operating
costs to maintenance processes; 30% devote more than 10% of this budget on maintenance. The
average facility spends 20 hours each week on scheduled maintenance.
• Attention to systems: Rotating equipment (motors, power transmission, etc.), fluid power systems
(air, hydraulic, etc.), and plant automation systems are the three areas where facilities dedicate the
most maintenance support, followed by internal electrical distribution systems and material handling
equipment.
• Unscheduled downtime: The leading cause of unscheduled downtime within respondents’ facilities
remains aging equipment (40%), followed by mechanical failure (24%) and operator error (12%). Four
in 10 facilities plan to upgrade their equipment and improve/increase training.
• Training: Maintenance teams are mostly trained on basic mechanical (73%) and electrical skills
(72%), as well as safety (72%). Other types of training include lubrication (55%) and motors,
gearboxes, and bearings (52%).
• Technologies: The most common technologies facilities use to monitor/manage maintenance are
CMMS (58%), in-house spreadsheets/schedules (45%), and paper records of maintenance rounds
(39%).
• Outsourcing: The average facility outsources 19% of their maintenance operations, and the leading
causes are lack of skills among current staff and too many specialized skills being required.

Respondent profile
5

Job title
6
Seventy-seven percent of respondents have engineering, maintenance, and/or supervisory
responsibilities at their facilities.
Q: Which of the following best describes your job title? (n=199)
Engineering, maintenance,
and/or supervisory77%
Generalmanagement
22%
Purchasing, purchasing management, other
1%

Industry experience, facility size
7
Respondents have worked in a plant or engineer-related position for an average of 23 years, with 34%
having been in the industry for 30 years or longer. The average facility employs 360 people.
Q: For approximately how long have your worked in a plant or engineering-related position? (n=180); Q: How many people work at your location? (n=199)
Less than 5 years8% 5 to 9 years
10%
10 to 19 years22%
20 to 29 years26%
30 to 39 years25%
40 years or longer9%
Industry experience
Average
23 years
1 to 1915%
20 to 4914%
50 to 9915%
100 to 24919%
250 to 49912%
500 to 9999%
1,000 or more16%
Facility sizeNo. of employees
Average
360 employees

Location
8
Twenty-seven percent of respondents are located in the North Central region of the United States, and
another 18% are based outside of the U.S. Other countries represented include Canada, India, Mexico,
the United Kingdom, and Venezuela.
*Data gathered by matching respondents to their Plant Engineering audience profile.
Pacific
7%
Mountain
4%
West North
Central
9%
West South
Central
8%
East North
Central
18% New
England
3%
Middle
Atlantic
14%
South
Atlantic
15%
East
South
Central
4%

Primary business
9
The top primary businesses represented by respondents are food, beverage, and tobacco (13%),
government or military (7%), and plastics and rubber manufacturing (7%).
Q: What is the primary business at your location? (n=180)
13%
7%
7%
6%
6%
5%
5%
5%
4%
4%
4%
3%
3%
Food, beverage, tobacco
Government or military
Plastics and rubber
Chemicals
Utilities (incl. electric,gas, water, waste)
Aircraft, aerospace, or defense
Hospitals, health care facilities
Plant/facilities engineeringor maintenance services
Miscellaneous
Oil, gas, and petroleum(incl. refining)
Wood, paper, and relatedprinting activities
Fabricated metals
Instrumentation, controlsystems, test, measurement
3%
3%
2%
2%
2%
2%
2%
2%
2%
1%
1%
6%
Machinery
Mining and mineral products
Agriculture or construction
Automotive and othertransportation equipment
Distribution centers, warehousing
Electrical equipment,appliance, and components
Pharmaceuticals
Primary metals
Textiles, apparel,and leather products
Computers, communications,consumer electronics
System integration, consulting,business, or technical services
Other
Facility maintenance
10

Scheduled maintenance
11
The average facility allocates approximately 9.2% of its annual operating budget to maintenance
processes. One-third of facilities spend 30 hours or more each week on schedule maintenance; average
is 20 hours/week.
Q: What percentage of your plant's annual operating budget is spent on maintenance processes? (n=199);
Q: Approximately how many hours per week does your plant spend on scheduled maintenance? (n=199)
Less than 5%22%
5% to 10%31%11% to
15%14%
More than 15%16%
Don't know17%
Maintenance budget% of operating budget
Less than 5 hours
11%
5 to 9 hours22%
10 to 19 hours21%
20 to 29 hours13%
30 hours or more
33%
Scheduled maintenanceWeekly
Average
9.2%
Average
20 hours

Scheduled maintenance shutdown frequency
12
Thirty-one percent of facilities shutdown standard machinery used in production every month for
scheduled maintenance; 25% shutdown their materials handling equipment two to four times each year
for regular maintenance.
Q: How often are the following areas of your plant shutdown for scheduled maintenance? (n=130;175;165;127;169;184)
13%
15%
12%
12%
10%
17%
7%
7%
11%
9%
9%
13%
19%
13%
14%
17%
17%
10%
28%
31%
28%
25%
26%
26%
19%
13%
16%
13%
21%
14%
5%
10%
10%
12%
7%
8%
0% 10% 20% 30% 40% 50% 60% 70% 80% 90% 100%
Conveyor and productionline systems (automated)
Standard machinery usedin production (automated)
Materials handling equipment
Packaging systems
Specialized productionmachinery (automated)
Less automated (manual) systems
Yearly Twice a year Quarterly Every other month Monthly Twice a month Weekly Daily
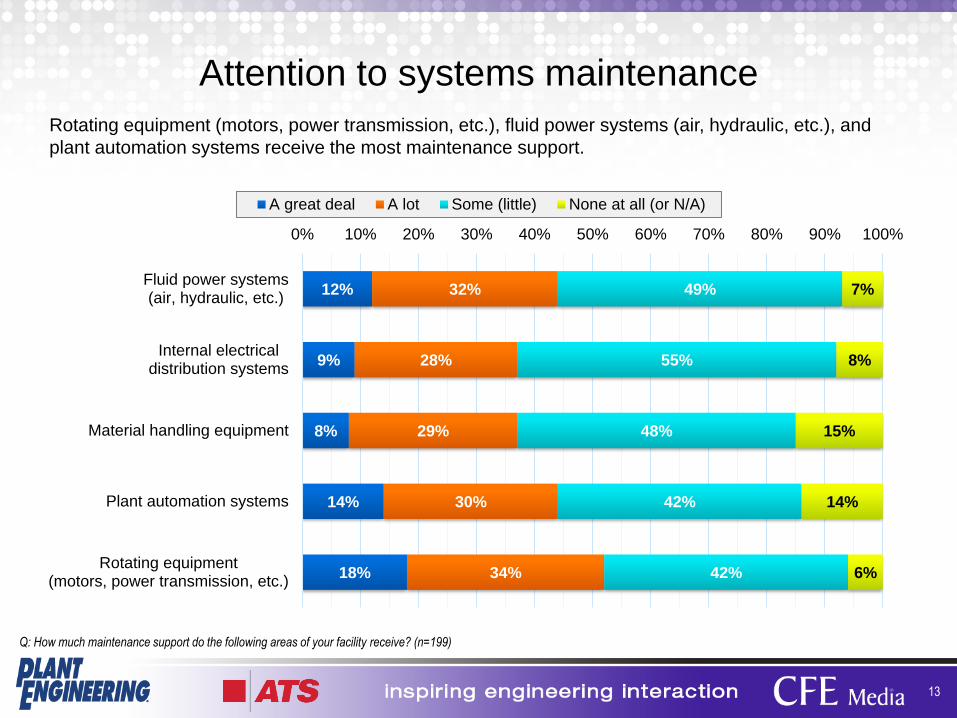
Attention to systems maintenance
13
Rotating equipment (motors, power transmission, etc.), fluid power systems (air, hydraulic, etc.), and
plant automation systems receive the most maintenance support.
Q: How much maintenance support do the following areas of your facility receive? (n=199)
12%
9%
8%
14%
18%
32%
28%
29%
30%
34%
49%
55%
48%
42%
42%
7%
8%
15%
14%
6%
0% 10% 20% 30% 40% 50% 60% 70% 80% 90% 100%
Fluid power systems(air, hydraulic, etc.)
Internal electricaldistribution systems
Material handling equipment
Plant automation systems
Rotating equipment(motors, power transmission, etc.)
A great deal A lot Some (little) None at all (or N/A)

Unscheduled downtime
14
Aging equipment (40%) and mechanical failure (24%) are the leading causes of unscheduled downtime.
In an effort to decrease downtime, 43% of facilities plan to upgrade equipment, 38% aim to
improve/increase frequency of training, and 33% will introduce a preventive maintenance strategy.
Q: What is the leading cause of unscheduled downtime in your plant? (n=199); Q: How do you plan to decrease unscheduled downtime in your plant? Check all that apply. (n=199)
Aging equipment
40%
Mechanical failure24%
Operator error12%
Lack of time to perform
maintenance8%
Lack of proper training
5%
Lack of maintenance
3%
Other7%
Don't know1%
Leading cause
43%
38%
33%
31%
30%
13%
10%
3%
Upgrade equipment
Improve training,increase frequency
Introduce preventivemaintenance strategy
Expand monitoringcapabilities
Change maintenancestrategy
Increase scheduleddowntime
Implement automatedanalytics/machine learning
Other
Plans to decrease downtime

Maintenance personnel training
15
More than half of facilities’ maintenance personnel receives training in basic mechanical skills (73%);
basic electrical skills (72%); safety (72%); lubrication (55%); motors, gearboxes, and bearings (52%);
and predictive maintenance (51%).
Q: What kind of training does your maintenance personnel receive? Check all that apply. (n=199)
73%
72%
72%
55%
52%
51%
46%
41%
38%
35%
33%
33%
32%
32%
28%
4%
5%
Basic mechanical skills
Basic electrical skills
Safety
Lubrication
Motors, gearboxes, bearings
Predictive maintenance
Basic plumbing/pipefitting
Calibration
Computers, data logging, etc.
Equipment/system programming
Process operations
Welding and fabricating
Blueprint reading
Fluid power systems
Machine stop technology
Other
None
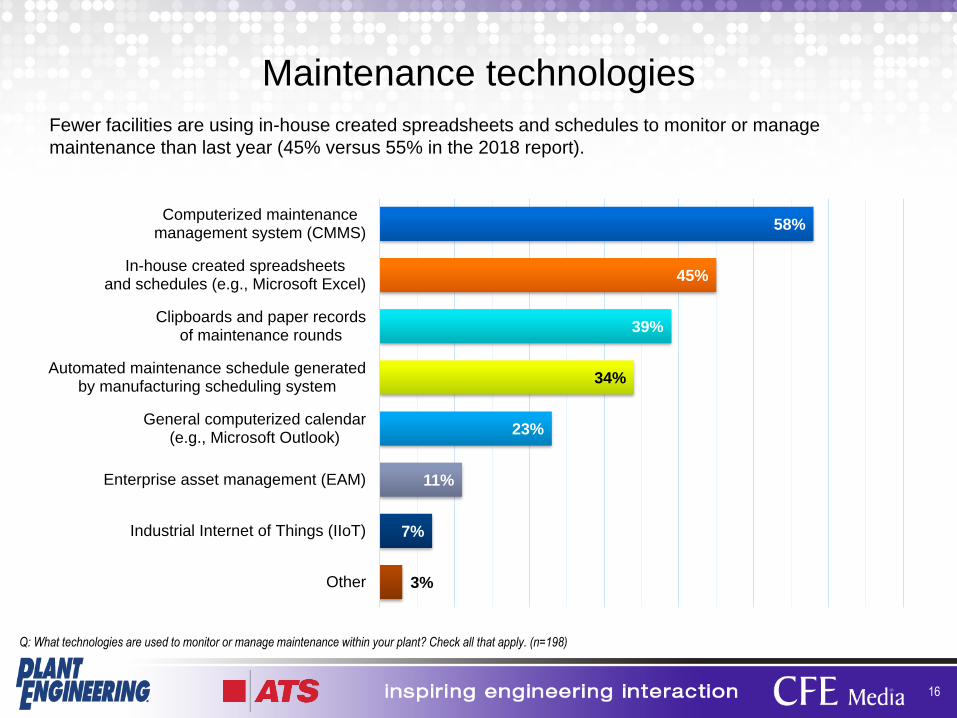
Maintenance technologies
16
Fewer facilities are using in-house created spreadsheets and schedules to monitor or manage
maintenance than last year (45% versus 55% in the 2018 report).
Q: What technologies are used to monitor or manage maintenance within your plant? Check all that apply. (n=198)
58%
45%
39%
34%
23%
11%
7%
3%
Computerized maintenancemanagement system (CMMS)
In-house created spreadsheetsand schedules (e.g., Microsoft Excel)
Clipboards and paper recordsof maintenance rounds
Automated maintenance schedule generatedby manufacturing scheduling system
General computerized calendar(e.g., Microsoft Outlook)
Enterprise asset management (EAM)
Industrial Internet of Things (IIoT)
Other

Percentage of operations that is part of maintenance
17
Looking at the relationship between operations teams and maintenance departments, an average of
21% of a facility’s operations personnel are also responsible for maintenance duties.
Q: What percentage of your plant's operations team is part of your maintenance department? (n=199)
0%
5%
10%
15%
20%
25%
30%
% o
f re
sp
on
ses
% maintenance
Average
21%

Outsourcing maintenance
18
The average facility outsources 19.2% of their maintenance operations. The top reasons for outsourcing,
according to 2019 data, are lack of skills among current staff (52%), too many specialized skills required
(41%), and a desire to lower overall costs (40%).
Q: How much of your plant's maintenance operation is outsourced? (n=199); Q: Which factors led to the outsourcing of maintenance operation at your plant? Check all that apply. (n=268;167;165)
0%12%
1% to 10%31%
11% to 20%21%
21% to 30%15%
31% to 40%3%
More than 40%13%
Don't know5%
Percentage outsourced
0% 20% 40% 60%
Lack of skills amongcurrent staff
Too many specialized skillsrequired to be practical
Desire to lower overall costs
Lack of time, manpower todedicate to maintenance
Lack of necessaryequipment available
Insufficient budget to hire/retain skilled individuals
Skilled individuals simplynot available
Union considerations
Reasons for outsourcing
2017
2018
2019
Average
19.2%

Attitude towards maintenance
19
Fifty-nine percent of engineers and managers see maintenance as a cost center, most of whom
understand the need to spend in order to keep equipment running. Another 34% see maintenance as a
profit center that delivers greater capacity to their facility.
Q: Which of the following statements best describes your attitude toward maintenance? (n=199)
It’s a cost center, but we need to spend in
order to keep equipment running.
44%It’s a profit center where we can deliver
greater capacity to our plant.34%
It’s a cost center, and we need to carefully
control costs.15%
It’s a necessary evil.7%

Challenges to improving maintenance
20
Key challenges to improving facility maintenance include lack of resources or staff (48%), lack of
understanding about new maintenance options and technologies (38), and lack of training (32%).
Q: What are the key challenges for improving maintenance at your facility? Check all that apply. (n=199)
48%
38%
32%
29%
29%
28%
26%
17%
9%
2%
4%
Lack of resources or staff
Lack of understanding of newmaintenance options/technologies
Lack of training
Employee buy-in
Lack of available funding
Outdated technology
Lack of support from management
Poor scheduling,rarely followed through
Safety issues
Security issues
Other
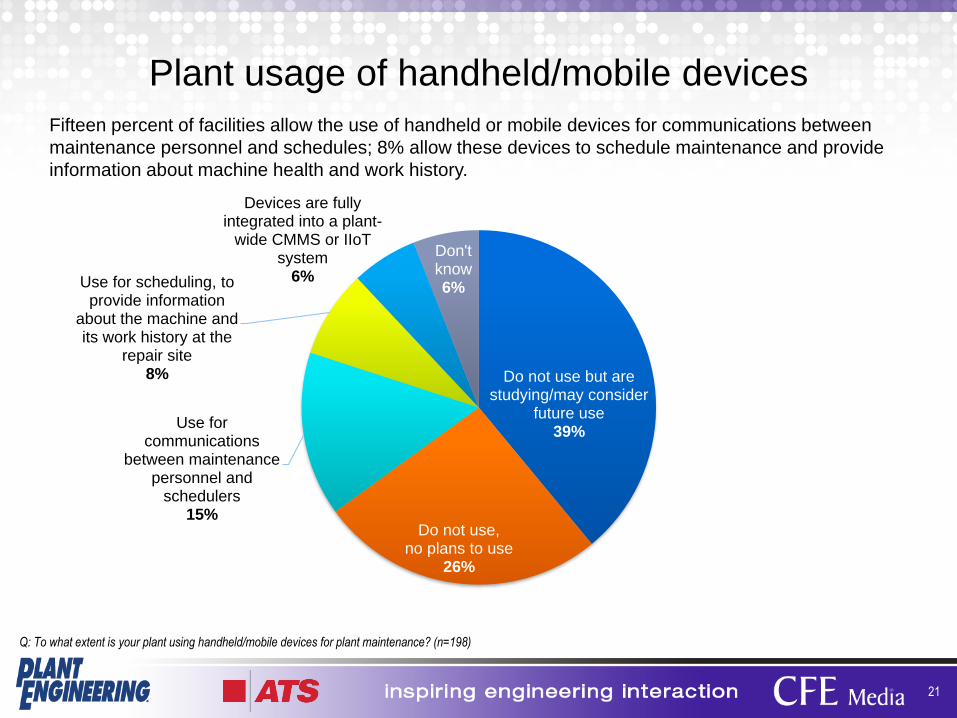
Plant usage of handheld/mobile devices
21
Fifteen percent of facilities allow the use of handheld or mobile devices for communications between
maintenance personnel and schedules; 8% allow these devices to schedule maintenance and provide
information about machine health and work history.
Q: To what extent is your plant using handheld/mobile devices for plant maintenance? (n=198)
Do not use but are studying/may consider
future use39%
Do not use,no plans to use
26%
Use for communications
between maintenance personnel and
schedulers15%
Use for scheduling, to provide information
about the machine and its work history at the
repair site8%
Devices are fully integrated into a plant-
wide CMMS or IIoT system
6%
Don't know6%

Impact of the Industrial Internet of Things
22
Twenty-eight percent of engineers and managers believe that adopting the Industrial Internet of Things
(IIoT) will help them to better understand machine health, and therefore keeping up with planned routine
maintenance. Another 28% are unsure of how or if IIoT would impact their facility’s maintenance
operations.
Q: How will the Industrial Internet of Things (IIoT) impact plant maintenance operations? Check all that apply. (n=199)
28%
27%
25%
22%
28%
Will help to better understand machine health
Will help to better predict andprevent plant shutdowns
Will change how plant maintenance personnelwork and interact with all levels of operation
Will have no impact
Don't know

Maintenance strategies
23
Facilities are using multiple maintenance strategies, depending on the equipment on the plant floor.
Seventy-eight percent use a preventive maintenance strategy, while 61% employ a CMMS, and 56% opt
to use a reactive maintenance approach.
Q: Which of the following maintenance strategies are present within your plant? Check all that apply. (n=322;201;199)
78%
59%
61%
47%
28%
5%
80%
50%
57%
51%
33%
1%
78%
61%
56%
43%
24%
2%
Preventive maintenance information
Computerized maintenancemanagement system (CMMS)
Reactive maintenance (run-to-failure)
Predictive maintenance (PdM)using analytical tools
Reliability-centered maintenance (RCM)using operational data analysis
Other
2017
2018
2019
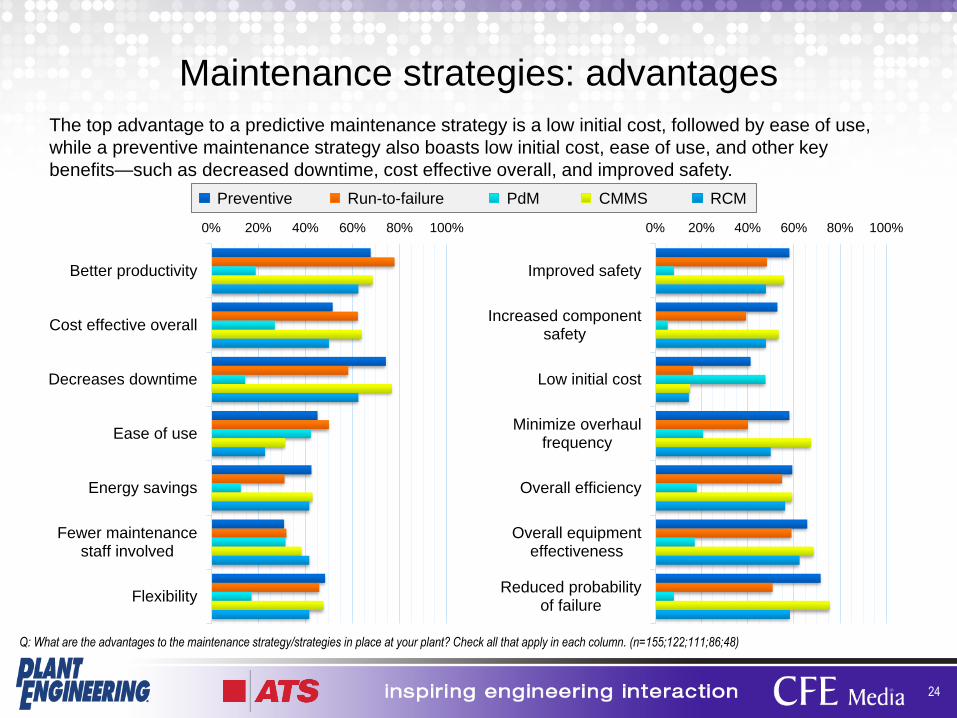
Maintenance strategies: advantages
24
The top advantage to a predictive maintenance strategy is a low initial cost, followed by ease of use,
while a preventive maintenance strategy also boasts low initial cost, ease of use, and other key
benefits—such as decreased downtime, cost effective overall, and improved safety.
Q: What are the advantages to the maintenance strategy/strategies in place at your plant? Check all that apply in each column. (n=155;122;111;86;48)
0% 20% 40% 60% 80% 100%
Better productivity
Cost effective overall
Decreases downtime
Ease of use
Energy savings
Fewer maintenancestaff involved
Flexibility
0% 20% 40% 60% 80% 100%
Improved safety
Increased componentsafety
Low initial cost
Minimize overhaulfrequency
Overall efficiency
Overall equipmenteffectiveness
Reduced probabilityof failure
Preventive Run-to-failure PdM CMMS RCM

Additional resources from Plant Engineering
25
Thank you for downloading the Plant Engineering 2019 Maintenance Study. Use the links below to
access additional information on manufacturing facility maintenance strategies.
Maintenance news and articles
▪ Asset management
▪ Lean maintenance
▪ Contract maintenance
▪ Inventory
▪ Material handling
▪ Maintenance strategy
Other resources
▪ New Products for Engineers
▪ Online training: CFE Edu
▪ Webcasts
▪ Case studies
▪ Ebooks
▪ Maintenance Connection newsletter
▪ Predictive & Preventive Maintenance
newsletter
Editorial research studies
▪ 2018 Salary Survey
▪ 2018 Predictive Maintenance
▪ 2018 Facilities Maintenance
▪ Additional studies available at:
www.plantengineering.com/research
Contact information
Amanda Pelliccione
Director of Research
Bob Vavra
Content Manager