eye tracking with eye glasses306465/fulltext01.pdfeye tracking with eye glasses joakim dahlberg...
TRANSCRIPT

Eye Tracking With Eye Glasses
Joakim Dahlberg
January 25, 2010Master’s Thesis in Physics
Supervisor: Mattias KuldkeppExaminer: Kenneth Bodin
Umea UniversityDepartment of Physics
SE-901 87 UMEASWEDEN

Abstract
This study is concerned with the negative effects of wearing corrective lenses while using eye
trackers, and the correction of those negative effects. The eye tracker technology studied is the
video based real-time Pupil Center and Corneal Reflection method. With a user study, the wearing
of eyeglasses is shown to cause 20 % greater errors in the accuracy of an eye tracker than when not
wearing glasses. The error is shown to depend on where on the eye tracker viewing area the user is
looking.
A model for ray refraction when wearing glasses was developed. Measurements on distortions
on the image of the eye caused by eyeglass lenses were carried out. The distortions were analyzed
with eye tracking software to determine their impact on the image-to-world coordinates mapping.
A typical dependence of 1 mm relative distance change on cornea to 9 degrees of visual field was
found.
The developed mathematical/physiological model for eyeglasses focuses on artifacts not possible
to accommodate for with existing calibration methods, primarily varying combinations of viewing
angles and head rotations. The main unknown in the presented model is the effective strength of
the glasses. Automatic identification is discussed. The model presented here is general in nature
and needs to be developed further in order to be a part of a specific application.
ii
Ogonfoljning med glasogon
Sammanfattning
Denna studie behandlar de negativa effekterna av att anvanda glasogon nar man anvander
ogonfoljningsutrustning, samt mojliga korrektioner for dessa effekter. Studien fokuserar pa videobaserad
ogonfoljningsteknologi i realtid, baserad pa koordinaterna for pupillcenter och reflektioner pa horn-
hinnan.
En anvandarundersokning matte okningen av felet i ogonfoljarens noggrannhet pa grund av
glasogon till 20 %. Undersokningen visar vidare hur felokningens storlek beror pa var pa ogonfoljarens
bildskarm anvandaren tittar.
Matningar pa hur glasogon forvranger bilden av ogat utfordes. Forvrangningarna analyser-
ades med ogonfoljarmjukvara for att undersoka effekten pa koordinatmappningen fran bild- till
varldskoordinater. En typisk mappningsforandring pa 9 grader av synfaltet per 1 mm relativ koor-
dinatskillnad i bilden observerades.
En matematisk/fysikalisk modell for ljusbrytning vid glasogonbarande presenteras. Modellen
fokuserar pa negativa effekter som nuvarande kalibreringsmetoder inte tar hand om, vilket primart
ar varierande blickvinkel- och huvudlages-kombinationer. Den viktigaste okanda paremetern ar
glasogonstyrkan. Den presenterade modellen ar av allman karaktar och behover utvecklas vidare
fore integrering i en given slutprodukt.

iii
Acknowledgements
This work was carried out at Tobii Technology AB in Danderyd, as a Master’s Thesis in Engi-
neering Physics for Umea University.
It would not have been possible without the help of my colleagues and friends at Tobii. I wish to
extend my thanks to all of you, especially the Embedded Components group, whom I’ve bothered
the most.
I am especially grateful to my supervisor Mattias Kuldkepp, for all of your help and support
during the project. I would also like to thank my examiner Kenneth Bodin, for your valuable
observations and remarks.
A special thanks to Rebecca Mork, my love and inspiration!

iv
Contents
1 Introduction 11.1 Outline of the study . . . . . . . . . . . . . . . . . . . . . . . . . . . . . . . . . . . . 11.2 Introduction to eye tracking . . . . . . . . . . . . . . . . . . . . . . . . . . . . . . . . 2
1.2.1 What is eye tracking? . . . . . . . . . . . . . . . . . . . . . . . . . . . . . . . 21.2.2 Remote gaze estimation . . . . . . . . . . . . . . . . . . . . . . . . . . . . . . 2
1.3 Different artifacts introduced by corrective lenses . . . . . . . . . . . . . . . . . . . . 31.4 Aims . . . . . . . . . . . . . . . . . . . . . . . . . . . . . . . . . . . . . . . . . . . . . 3
2 Theory 52.1 The human eye . . . . . . . . . . . . . . . . . . . . . . . . . . . . . . . . . . . . . . . 5
2.1.1 Anatomy of the eye . . . . . . . . . . . . . . . . . . . . . . . . . . . . . . . . 52.1.2 Eye movements . . . . . . . . . . . . . . . . . . . . . . . . . . . . . . . . . . . 7
2.2 Remote Gaze Estimation using Pupil Center and Corneal Reflections . . . . . . . . . 82.3 Theoretical achievable accuracy of PCCR eye tracker . . . . . . . . . . . . . . . . . . 11
2.3.1 The locus of fixations on the fovea . . . . . . . . . . . . . . . . . . . . . . . . 112.3.2 Involuntary eye movements . . . . . . . . . . . . . . . . . . . . . . . . . . . . 12
2.4 A mathematical model for eyeglasses . . . . . . . . . . . . . . . . . . . . . . . . . . . 122.5 Contact lenses . . . . . . . . . . . . . . . . . . . . . . . . . . . . . . . . . . . . . . . 15
3 Method 173.1 Problem formulation . . . . . . . . . . . . . . . . . . . . . . . . . . . . . . . . . . . . 17
3.1.1 Delimitations . . . . . . . . . . . . . . . . . . . . . . . . . . . . . . . . . . . . 173.2 Notes on units . . . . . . . . . . . . . . . . . . . . . . . . . . . . . . . . . . . . . . . 183.3 User study . . . . . . . . . . . . . . . . . . . . . . . . . . . . . . . . . . . . . . . . . . 18
3.3.1 Tobii XL unit and typical angles . . . . . . . . . . . . . . . . . . . . . . . . . 193.3.2 Analysis of data . . . . . . . . . . . . . . . . . . . . . . . . . . . . . . . . . . 20
3.4 Study of calibration compensation . . . . . . . . . . . . . . . . . . . . . . . . . . . . 203.5 Measurements of distortions on images of an eye . . . . . . . . . . . . . . . . . . . . 213.6 Impact of coordinate shifts on mapping results . . . . . . . . . . . . . . . . . . . . . 22
4 Results 254.1 Experimental study of eyeglass wearers with and without glasses . . . . . . . . . . . 25
4.1.1 Accuracy with versus without glasses . . . . . . . . . . . . . . . . . . . . . . . 254.1.2 User survey . . . . . . . . . . . . . . . . . . . . . . . . . . . . . . . . . . . . . 26
4.2 Results on different parts of the screen . . . . . . . . . . . . . . . . . . . . . . . . . . 264.2.1 Results from the larger user study . . . . . . . . . . . . . . . . . . . . . . . . 274.2.2 Results on calibration compensation . . . . . . . . . . . . . . . . . . . . . . . 28
4.3 Eye glass-distortions on images of an eye . . . . . . . . . . . . . . . . . . . . . . . . . 29
v

vi CONTENTS
4.3.1 Measurements on the images . . . . . . . . . . . . . . . . . . . . . . . . . . . 294.3.2 Theoretical model shifts . . . . . . . . . . . . . . . . . . . . . . . . . . . . . . 314.3.3 Comparison between measurements and theory . . . . . . . . . . . . . . . . . 344.3.4 Impact of coordinate shifts on mapping results . . . . . . . . . . . . . . . . . 34
4.4 Results compared - example . . . . . . . . . . . . . . . . . . . . . . . . . . . . . . . . 35
5 Discussion 395.1 Notes on theory . . . . . . . . . . . . . . . . . . . . . . . . . . . . . . . . . . . . . . . 395.2 Method and result . . . . . . . . . . . . . . . . . . . . . . . . . . . . . . . . . . . . . 39
5.2.1 User study . . . . . . . . . . . . . . . . . . . . . . . . . . . . . . . . . . . . . 395.2.2 Measurements on images . . . . . . . . . . . . . . . . . . . . . . . . . . . . . 405.2.3 Impact of coordinate shifts on mapping results . . . . . . . . . . . . . . . . . 40
5.3 Physical model for eyeglasses - discussion . . . . . . . . . . . . . . . . . . . . . . . . 415.3.1 Cons and pros with a physical model . . . . . . . . . . . . . . . . . . . . . . . 415.3.2 Image distortions - Comparison between measurements and theory . . . . . . 425.3.3 Mathematical model . . . . . . . . . . . . . . . . . . . . . . . . . . . . . . . . 425.3.4 Parameters . . . . . . . . . . . . . . . . . . . . . . . . . . . . . . . . . . . . . 435.3.5 Resolving unknowns in implementation . . . . . . . . . . . . . . . . . . . . . 445.3.6 Other properties of glasses . . . . . . . . . . . . . . . . . . . . . . . . . . . . . 45
5.4 Contact lenses . . . . . . . . . . . . . . . . . . . . . . . . . . . . . . . . . . . . . . . 45
6 Further work and Conclusions 476.1 Common features . . . . . . . . . . . . . . . . . . . . . . . . . . . . . . . . . . . . . . 476.2 Calibration . . . . . . . . . . . . . . . . . . . . . . . . . . . . . . . . . . . . . . . . . 476.3 Variant 1 - remove only unique artifacts . . . . . . . . . . . . . . . . . . . . . . . . . 486.4 Variant 2 - remove all effects . . . . . . . . . . . . . . . . . . . . . . . . . . . . . . . 486.5 Notes on software . . . . . . . . . . . . . . . . . . . . . . . . . . . . . . . . . . . . . . 49
A Sample images 53
B Measurement Data 55
Chapter 1
Introduction
To know where a person is looking is interesting and valuable knowledge. The eyes move fast and
the gaze ends up in both intented and unintended places, revealing much about where the person
places his/her attention. Creating a system that could efficiently and unobtrusively follow these
gaze wanderings has been recognized as a challenging but potentially rewarding task.
Today, technology for determining where the human eye is looking is a fast-growing research field
with an ever increasing number of applications. Having evolved from intrusive equipment directly
placed on the eye, to video-based components requiring little or no calibration, the technology is now
available to almost any type of user [17]. However, as the accuracy of the eye tracking systems closes
in on the acuity of the human vision, more and more details of the system will need to be studied
in depth. Some of these details concern the corrective lenses worn by a large part of the population,
to enhance their vision. These eyeglasses and contact lenses generally disturb eye tracking systems,
reducing their effectiveness. This study is concerned with identifying the magnitude and reasons of
the problems the vision corrections can cause.
The work has been done in close cooperation with Tobii Technology AB. The study was carried
out with the help of hardware and software developed by the company, but the results and discussion
presented are general of nature and not limited to only specific types of hardware/software.
1.1 Outline of the study
The study was carried out in three parts:
Preliminary study with focus on examining the problem in quality and magnitude.
Study of corrective lenses in eye tracking. The model was created by examining how the image
of the eye changes when wearing glasses, both in theory and practice. Also, a study was carried
out to analyze the effects of these changes in mapping results.
1
2 Chapter 1. Introduction
Analysis and physical model. The results of the previous part was used for a discussion on
resolving the problems pinpointed by the pre-study.
1.2 Introduction to eye tracking
The concept of eye tracking is here explained in general terms, aimed at the reader unfamiliar with
the field.
1.2.1 What is eye tracking?
Simply put, eye tracking is to determine where the visual attention of a user is placed and to provide
the means to use that information.
The interest in determining the point-of-gaze (POG) of the human eyes is of course based on
the implied connection between where you fix your eyes and where you place your attention. In
other words, knowing where this visual attention is placed, i.e. where a person is looking, is valuable
information that can be used for a variety of applications.
It is of course not always true that a person’s attention is where the eyes are fixed; the basic
example of the opposite is someone involved in deep thinking, not minding where the gaze is placed
at all. In other cases, as when surfing the web, one can rest assured that both the gaze and the
attention will be placed on the screen a large part of the time.
Important applications of eye tracking as of today include, but are not limited to:
Assistive Technology for people with and without special needs. The most striking example
would be using the eyes to control a computer, instead of the hands.
Market research. It is of course highly desirable to know what products or parts of a home page
attracts the most visual attention, which easily can be studied with eye tracking.
Cognitive research - what do people look at and why?
Computer games or video game consoles. Innovative game designs could take advantage of the
extra interaction that eye tracking provides, something that at the time of writing is studied
but not widely available.
More on the diverse areas of interest for eye tracking applications can be found for instance in
Duchowsky [13] or, more concise, in Leimberg et al. [18].
1.2.2 Remote gaze estimation
There have been a multitude of different technologies used for determining the point-of-gaze of the
human eyes. The most commonly used technology for remote, non-intrusive eye tracking today is
the Pupil Center Corneal Reflection (PCCR) video-based method. See Oyekoya [16] for more on this
1.3. Different artifacts introduced by corrective lenses 3
and an overview of other technologies. However, because of the current dominance of this method
among the technologies available, it is the model used in this study.
The basic concept is to illuminate the eye with one or more well-chosen light sources and capture
the image of the eye with one or more cameras. By computer analysis of the image, the pupil and the
reflections in the eye of the light sources can be identified and analyzed. Along with basic refraction
laws, properties of the eye and parameters of the system, the image data can be used to determine
the gaze direction.
The mathematics behind the system and other details can be found in Section 2.2, or (more
thoroughly) in Guestrin [12].
1.3 Different artifacts introduced by corrective lenses
If the user is wearing corrective lenses when using a PCCR eye tracking system, the images of
the eye captured by the camera, as well as the gaze of the eye, will pass through the corrective
lenses. Although the purpose of the lenses is to enhance the users vision, this passing-through also
introduces a number of different artifacts that might affect the chances of the eye tracker working
properly. This study is concerned with the identification and analysis of those artifacts.
Some important artifacts affecting the mapping of acquired eye data are listed here:
– Distorted size/shape of the eye due to magnification/reduction by the eyeglasses
– Distortions of movements of eye due to head/eye movement/inclination
– Multi-focal glasses creating additional artifacts in some parts of the viewing field
– Cornea topography exchanged with contact lens topograpy
– Distortions of glints on cornea due to moving contact lens
This study focuses on the eye model used in the system and the mapping of image coordinates
to gaze point coordinates. Thus, issues related to the process of acquiring images of the eye, or the
image analysis involved, can be said to be of less importance for this study. These issues include:
– Edge of glasses dividing/blocking view of pupil
– Eyeglasses reflecting away eye or illumination of eye altogether
– Additional, erroneous glints created by front or back surface of glasses or contact lenses
1.4 Aims
This study aims to provide better accuracy with PCCR eye tracking technology for users wearing
corrective lenses. The aim is to create an enhanced optical eye model that includes corrective optics

4 Chapter 1. Introduction
based on a few optical parameters deemed to be significant, and adapted for practical use with
PCCR eye trackers. As part of the adaption of the model for practical use, one aim is to provide a
suggestion on how to use this model in the form of a prototype of a system.
As a separate goal, the project also aims to be an integral part of the enveloping project at Tobii
Technology, to enhance the eye model used with the current systems of the company.
A more precise definition of the goals can be found in the Problem Formulation (Sec. 3.1).

Chapter 2
Theory
Key concepts crucial for the understanding of the following chapters are presented here, drawing on
known facts from a fundamental level. Readers familiar with eye tracking may be the most interested
in Section 2.4, presenting mathematics and physics used as a basis for the physical model presented
in the final chapter of this study.
2.1 The human eye
At the heart of eye tracking lies the study of the human eye. There are many details of the human
vision system that go unnoticed for the user of the eye tracker, but are crucial for the system
itself. This section provides an overview of the features of the eye that are the most relevant for a
video-based system determining the point of gaze.
2.1.1 Anatomy of the eye
What an eye is and what it looks like are basic facts known to just about everyone. Still, this study
being scientific of nature, the basic facts of the eye will here be straightforwardly explained (albeit
in a scientific manner) to provide a background to the rest of the article.
An overview of the parts of the human eye can be found in Figure 2.1. The eye is a complex
structure that focuses light in front of the eye through the lens and onto the back of the eye.
Conveniently enough, the back of the eye is where the light-sensitive cells of the retina are located,
allowing us to see. To change what light enters the eye, it can be rotated in its socket by the external
muscles keeping it in place. Besides its ability to rotate, the eye is a fairly static structure, having
few internal muscles. The notable exceptions are the muscles expanding or contracting the lens of
the eye and of course the ones determining the size of the iris and pupil.
Geometrically, the eye may be thought of as a sphere. Generally it is about 24 mm in size
measured vertically, but it is really not perfectly spherical all the way around on the outside - which
happens to be a crucial fact for eye tracking applications. Instead of being spherical, the cornea at
5

6 Chapter 2. Theory
Figure 2.1: Diagram of the human eye [3]
the front of the eye protrudes slightly. This part has a somewhat spherical shape with a smaller
radius (typically around 8 mm) than the rest of the eye, making it appear as a section of a small
sphere placed upon a larger sphere.
The cornea is important for eye tracking applications, but some other features might also be
described. Apart from the cornea, there is the opaque sclera (“the white part of the eye”) on the
outside of the eye. The cornea and the sclera are always wet, covered with a thin tear film, spread
out by blinks. Inside of the cornea lies the lens with the pupil in front of it, the latter governing
how much light that will enter the eye. In the back of the eye is the retina, with its light-sensitive
rods and cones. Between the components of the eye there is a clear fluid called the vitreous humor
(in the back of the eye) or the aqueous humor (between the lens and the cornea). Together, these
components form the system of optics to be studied in eye tracking applications, with the transparent
components being the most important.
Some numbers might also be given. Optically and on average, the eye has a total unaccomodated
refractive power of 59 diopters. The first part is from the cornea that has an average refractive
power of 43, while the second part is the relaxed lens that has a power of 19. The latter can also be
accomodated by an additional amount ranging from 0.5 to 15 diopters; how much depends primarily
on the age of the eyes (younger lenses are by far more flexible than older ones). Why then is this
important? Well, the “goal” of all this refraction is to focus incoming rays of light appropriately
on the retina, and this will only come out neatly if the refraction is just right. Another important
aspect of the eye’s optical system is the actual shape of the cornea - that shape will greatly affect
the refraction of incoming light and the direction of reflections of light reaching its surface. [7]
Another important aspect of the eye is the details of the retina, as this surface of light-sensitive
nerve cells covering the inside of the eye has some design quirks that are imporant to account for.

2.1. The human eye 7
First and foremost, the density of photosensitive cells (rods and cones) vary greatly on the retina,
with the highest concentration centered on a small area called the fovea. This area is not located
directly behind the pupil as might be expected, but rather a few degrees offset [12]. The point of
most eye movements is thus, as one might guess, to change what light falls precisely on the fovea.
As is often the case with physiological systems, the optical system of the eye can be imperfect.
A common medical condition is that images are focused behind or in front of the retina due to
imperfect refraction, leading to a loss of visual acuity. This is called hyperopia (farsightedness) or
myopia (nearsightedness), depending on the sign of the focal imperfection. As many as a quarter
of the adult population of many developed countries are affected by one of these conditions, even
more if age-related conditions are taken into account [15]. Another type of imperfection in the eye
refraction is called astigmatism, which signifies different refractive errors in different sectors of the
visual field.
A very common treatment for all of these common conditions is the use of corrective ophthalmic
lenses such as eyeglasses or contact lenses [5]. The fact that there is a large number of eyeglass
wearers is of course of great interest for this study.
2.1.2 Eye movements
As previously noted, the eye acuity is high only on the fovea, which corresponds to but a small area
of the retina. It would be easy to imagine that being able to see sharply in only a small area of the
visual field would pose a problem, given that a sharp visual acuity is essential for everyday task such
as reading, face recognition etc. Of course, as all humans know (but maybe doesn’t reflect upon),
only being able to see details in a very small area is not a problem. The reason is that the human
vision system has a simple yet very effective solution to provide high visual acuity in all of the visual
field - we move our eyes. This is done in a rapid, automatically triggered fashion.
The eyes move to focus the area of interest of the world onto the fovea. We move our eyes both
voluntarily and involuntarily, and since the eye tracker notices all types of movement, both types of
movements are of interest. These eye movements have a number of interesting artifacts, which are
summarized below. [2] [6]
There are two basic voluntary eye movement types; the saccade and the smooth pursuit. Sac-
cades are very fast movements, simultaneous with both eyes, corresponding to a movement of
approximately 0.5◦ up to half of the visual field. Smooth pursuit on the other hand is the type
of movement that almost exclusively occurs when the gaze follows a moving object, and may be
combined with saccades in the case of very fast moving objects. The latter type of movement also
occurs in a very convenient (and automatic) fashion when the head is moving and the gaze is fixed,
preventing the world from turning into a blur when a viewer does not stay stationary. [6] [11]
Apart from these voluntary eye movements, the eye is also subjected to a number of involuntary
eye movement types that occurs during attempted fixation. These movements go mostly unnoticed
to the viewer, but are indeed noticed by the eye tracker, oftentimes as physiological noise occuring
in the system. The reason why these movements can be considered noise is their nature of being

8 Chapter 2. Theory
involuntary. That is, the goal of eye tracking can be forumlated as determining where the user
wants to look, rather than where the gaze actually is, making involuntary eye movements a source
of aberrations to the voluntary movements.
The three main types of involuntary eye movements during attempted fixation are tremor, mi-
crosaccades and drift. The designations accurately depicts the types of motion. Tremor is thus
a small, high-frequency movement not correlated between the eyes and very random in direction.
Typically there are about 30 to 100 tremor movements per eye and second, ranging from 5- to 30-sec
arc. In other words, there is a small random trembling of the eyes. The second component, drift,
is a low-velocity movement that, uncorrelated between the eyes, causes the gaze to drift away from
the fixation point. Typical speed 1- to 8-min arc per second. The third component of fixational
movements are the microsaccades, essentially the same type of movement as voluntary saccades,
only smaller and involuntary. Microsaccades are correlated between the eyes, they typically have
a frequency of 1 to 2 per second and may range up to 0.5◦ of the visual field. The limit between
saccades and microsaccades is somewhat unclear, as microsaccades often can be error-correcting
(moving the gaze back to the fixation point) which at times could be considered a voluntary eye
movement type. [2]
2.2 Remote Gaze Estimation using Pupil Center and Corneal
Reflections
This section presents a general mathematical model for remote gaze estimation as outlined in Section
1.2.2. It is adapted from Part II of [12], and based upon the model of the optical system outlined in
Figure 2.2 (also from [12]).
The “goal” of this model can be said to be to determine were the user is looking. More specifically,
to determine the visual axes of the eyes of a user, thereby identifying where the eyes are located in
space and in which directions they are looking. Mathematically speaking, the Point-of-gaze (POG)
of a user can be defined as the intersection of the user’s two visual axes in 3D-space1.
As previously hinted, the visual axis is a line between the POG and the point on the retina where
the POG is focused. The visual axis, however, does not pass through the center of the eye (as the
optical axis is designed to do), since the fovea isn’t located exactly at the back of the eye. Thus, first
we are concerned with constructing the optic axes of the eyes, and then with obtaining the visual
axes, thereby determining the POG. A right handed Cartesian world coordinate system is used in
the below calculations, with bold font representing 3D-vectors.
Now, consider the optical rays of Figure 2.2. One goes from the point li on the light source i to
the point qij on the eye, and it is chosen so that the ray will reflect onwards through the nodal point
oj of camera j and intersect the image sensor in the camera at point uij . Assuming the cornea to
1Which, in eye tracking applications, is often simplified as the mean of the intersections between the viewed screenand the visual axes.

2.2. Remote Gaze Estimation using Pupil Center and Corneal Reflections 9
Figure 2.2: Ray tracing diagram of an eye, with camera modeled as pinhole-camera and light source assumedto be a point-source. Not to scale. Note that the light source could be placed very close to the nodal pointof the camera, especially the case of Bright Pupil eye tracking.
be approximately spherical2, with radius R and center c, the point qij will lie on the edge of this
sphere. Expressed in parametric form, the following relationships will hold for the ray:
qij = oj + kq,ij(oj − uij) for some kq,ij (2.1)
‖qij − c‖ = R (2.2)
Another ray goes from the pupil center p, refracting through the cornea at point rj towards the
camera and hits the camera image plane at vj . Constructing another sphere centered at c, this one
with radius K (the distance from p to the pupil), this ray and the requirements of its points can be
expressed with three equations similar to the ones above:
rj = oj + kr,j(oj − vj) for some kr,j (2.3)
‖rj − c‖ = R (2.4)
‖p− c‖ = K (2.5)
Now, the law of reflection states two conditions: 1) the incident ray, the reflected ray and the
normal at the point of reflection lie in the same plane; and 2), the angles of incidence and reflection
are equal. The second ray, however, is refracted rather than reflected. In this case the same condition
2an assertion that generally holds close to the center of the cornea, but not necessarily at its edges [13]

10 Chapter 2. Theory
1) holds, and to get another condition we use Snell’s law for a refracted ray between two media:
n1 sin θ1 = n2 sin θ2, where θ are angles with the normal and n1 and n2 are the refractive indices.
To turn condition 1) into a useful equation, the fact that three coplanar vectors satisfy the relation
a1×a2 ·a3 = 0 can be used. Thus, for the two rays 2.1 and 2.3 separately (not knowing wether they
lie in the same plane as each other), the following will hold:
(li − oj)× (qij − oj) · (c− oj) = 0 (2.6)
(rj − oj)× (c− oj) · (p− oj) = 0 (2.7)
Next, by utilizing that the angle θ between two vectors a and b can be obtained either from
a · b = ‖a‖ ‖b‖ cos θ or from ‖a× b‖ = ‖a‖ ‖b‖ sin θ, the following relations can be posed:
(li − qij) · (qij − c) · ‖oj − qij‖ =
(oj − qij) · (qij − c) · ‖li − qij‖ (2.8)
n1 · ‖(rj − c)× (p− rj)‖ · ‖oj − rj‖ =
n2 · ‖(rj − c)× (oj − rj)‖ · ‖p− rj‖ (2.9)
Given an air refraction index of n2 ≈ 1, that factor can be neglected. n1 is in turn taken to be
homogeneous for the eye between the cornea surface and the lens, an approximation good enough for
this model[12]. Finally, another relation can be posed from the above geometry, further constraining
the system: The distance is K between the center of the corneal curvature c and the pupil center p:
‖p− c‖ = K (2.10)
The Equations 2.1 to 2.10 now give almost enough information to solve the system for c and p,
which corresponds to the optical axis of the eye. Enough information, provided that the position of
the light source(s), camera position(s) and image coordinates (uij and vj) are known, which for a
fixed system can be determined in advance. Only almost enough though, since the subject-specific
parameters N , K and n1 have to be known - they vary from person to person. Depending on
the number of cameras and light sources, this information might need to be estimated through a
calibration procedure or the like. Also, as might be recalled from the beginning of this section, the
visual axis is really what is needed and not the optic axis. The visual axis is here defined as the
axis through the center of corneal curvature c and the center of the fovea, which means it will differ
from the optic axis by some angles θ and φ. These parameters need to be calibrated as well.
Now, it can be noted that when calibrations are done, the accuracy of the system will for a large
part depend on the image coordinates uij and vj , since they represent the location of the pupil and
the glints in the eye - essentially what changes during the eye tracking. The configuration of the

2.3. Theoretical achievable accuracy of PCCR eye tracker 11
light sources, cameras and what image analysis algorithms are used are highly system-specific and
not covered here.
Figure 2.3: IR-illuminated eyes [18]. Bright Pupil (illumination along axis) vs. Dark Pupil (illumination offaxis).
A few notes on the light sources might however be mentioned. The first is that they commonly
work in the infrared spectrum, since this is less “noisy” (meaning that indoor lighting interferes
less), among other desirable properties such as infrared being outside the humanly visible spectrum
is less likely to distract the user. Secondly, one way to classify eye trackers is the Bright Pupil (BP)
or Dark Pupil (DP) distinction, meaning on- or off-axis lighting (that is, camera axis). With lights
placed close around the camera, the back of the retina will be illuminated, at least the part visible
looking straight through the pupil. This makes the pupil appear lighter in the captured image than
the surronding iris. This would thus be Bright Pupil tracking. Vice versa, with Dark pupil tracking,
light sources are placed further from the camera. Further reading on which one is preferable can be
found in [13].
2.3 Theoretical achievable accuracy of PCCR eye tracker
When studying increase in performance in general, the theoretical best performance is of interest.
Thus, an increase of accuracy is interesting both compared to the accuracy before the improvement,
but also compared to the minimum theoretical error. That minimum error can thus be considered
the “goal” of accuracy enhancing, or the best possible result that could be achieved.
The error of the eye tracker is here defined as the distance between the calculated POG of the
user and the point were the user is supposed to be fixing the gaze on. This error can be measured
relative to other measurements or in units of degrees of the visual field.
2.3.1 The locus of fixations on the fovea
When the gaze is fixed on a point, the image of that point will be focused in the eye on a specific
location on the fovea. However, one could hypothesize that this location on the fovea might not be
exactly the same the next time the gaze is fixed on the same point. Remembering that the fovea
covers several minutes of arc of the visual field, and that the visual attention can be focused away
from the exact center of the vision, this seems like a reasonable guess. Considering that the ocular

12 Chapter 2. Theory
muscles that moves the eyes into position most certainly have a finite accuracy, the theory gains
further credibility.
The locus of fixations on the fovea has been studied by Putnam et al. (2005) [7]. By repeatedly
measuring the positions on the fovea of gaze fixations, the center of fixation and the deviations of
the fixations away from that center were determined. Using the numbers obtained from their study,
the fixations were scattered on the fovea, normally distributed, with a mean standard deviation of
0.0562◦, meaning that 95 % of all fixations were placed within 0.112◦ of the center of fixation.
Since eye trackers in general currently cannot measure this deviation (that would require cap-
turing and identifying positions on the retina with very high accuracy), this deviation might lead to
an error being part of the minimum theoretical error achievable.
2.3.2 Involuntary eye movements
As stated in section 2.1.2, the gaze is subject to involuntary eye movements during a fixation. Since
they will make the eye tracker detect a movement in the same way as any other eye movements
would, despite the user trying to hold the gaze perfectly still, they could be experienced as a source
of error in the eye tracking system. These movements, especially tremor and drift that are not
correlated between the eyes, can thus be considered to represent physiological noise (see [2]). While
it is a matter of dicussion whether these movements could actually be error correcting at times
(especially microsaccades), it is clear that they will cause the POG to stray from any starting point
during a fixation. The combined random effect of this type of eye movements has an amplitude of
about 0.08◦.
See discussion part (Sec. 5.1) for further notes on minimum error.
2.4 A mathematical model for eyeglasses
This section is focused on the basic mathematics and physics regarding eyeglasses, since this is a
vital part of the later part of the study. The approximations made are discussed in Section 5.3.3.
For an object viewed through a lens - including those found in a pair of glasses - the image of the
object will be distorted.[19] How it will be distorted depends on the placements of the viewer and
the lens. For instance, if the lens is placed within the focal distance of the lens, a positive lens will
magnify an object while a negative lens will decrease its apparent size. This lens placement happens
to be true for glasses, since the distance between the eye and the lens (typically less than 2 cm) is
always smaller than the focal distance of the lens3.
The linear magnification M of this single lens can conveniently be expressed as: [4]
M =f
f − d0(2.11)
3A focal length shorter than 2 cm would require a lens stronger than 50 diopters, which is far stronger than thestrongest real-life corrective lenses anyone could use.

2.4. A mathematical model for eyeglasses 13
where d0 is the distance from the cornea of the eye to the lens and f is the focal distance of the lens,
i.e. the inverse of its power in diopters.
It is also of interest how a ray of light will be refracted through an eye glass lens more generally,
depending on the lens properties and the point of incidence of the ray. Since the lens thickness varies
with distance from its center, the refraction will vary depending on where the ray intersects the lens.
Mathematically put, the refracted ray will deviate with an angle β from the original path, which
can be calculated theoretically with a few simplifications. One way to do this is to simplify the lens
as a prism in the point where the ray hits its surface, with a top angle α. Ignoring its thickness4, we
can set up the following relations between angle of incidence and refracted angle. Refer to Figure
2.4 for notations on angles and an overview of the prism simplification.
Figure 2.4: Prism approximation at ray entry through lens
sin θ1 = n sin θ2 (2.12)
n sinφ1 = sinφ2 (2.13)
φ1 = θ2 − α (2.14)
(2.13), (2.14)⇒ sin(θ2 − α) =sinφ2n
(2.15)
sin θ2 cosα− cos θ2 sinα =sinφ2n
(2.16)
(2.12)⇒ θ2 = arcsin(sin θ1/n) (2.17)
⇒ sin θ1 cosα/n− cos(arcsin(sin θ1/n)) sinα =sinφ2n
(2.18)
4Typically about 2-4 mm [1], but since only the vertical5 component will cause a shift on the approximately verticalcornea plane and since that component is smaller than the horizontal, this effect might be ignored. See 5.3.3

14 Chapter 2. Theory
Solving eq. 2.18 for φ2 and simplifying we get
φ2 = − arcsin
(sinα
√n2 − sin2 θ1 − cosα sin θ1
)(2.19)
Now, what we want to know is really the deviation of the ray from the original path, and φ2 is
not the answer to this. The difference β between the original path and the new one can instead be
described by the following relation, deduced from figure 2.4:
β = φ2 + θ1 − α (2.20)
∴ β = − arcsin
(sinα
√n2 − sin2 θ1 − cosα sin θ1
)+ θ1 − α (2.21)
However, to use this result we need to know the prism top angle α that represents the difference
in inclination of the two surfaces of the lens. At the exact center of the lens the surfaces will be
parallel, so the top angle will depend on the distance from the center of the lens and the strength of
the lens. The strength will in turn depend on the curvature of the lens and the refraction index of
the glass. With this information, the top angle can be calculated for a ray emanating from a point
on the symmetry line of the lens given the distance d0 from the point to the lens and the angle β
between the ray and the symmetry line, as shown in figure 2.5. This type of ray is interesting since it
could be said to represent the pupil (ideally located at the center of the lens) as seen from a specific
angle.
The calculations are done by comparing the resulting right triangle from the reasoning above
with a superimposed one where the right side x is equal, but the left angle α is the same as the
top angle of the local prism approximation. In this case, the hypotenuse can be obtained from the
lensmaker’s formula, yielding (n− 1)/D. Here, D is the spectacles strength in diopters and n is the
glass refraction index. The equality of the two angles denoted α in the figure, one in the lens where
the “prism” is formed and one in a uniform triangle, can be tested by comparing uniform triangles
aided by relevant geometry. The mathematics is summarized below.
x = d0 tan γ
x = sinαD(n−1)
}⇒ α = arcsin(
d0D
n− 1tan γ) (2.22)
Some approximations were made to simplify the math: d0 is in reality a bit longer (extending
all the way to the lens). Also, note that the unknown independent parameter of the equation is γ,
the angle of incidence after refraction, which differs from the angle of incidence outside the glasses.
The difference between the angles is roughly 6 % at small angles (illustrated in Figure 4.9 of page
33, but with mm on the y scale). The theoretic model predicting this, however, uses the very same
equation 2.22 discussed here, making those results further approximated. The magnitudes of these
approximations are discussed in section 5.3.3.
Furthermore, the shape of the lens in the figure is obviously not that of a real pair of glasses.

2.5. Contact lenses 15
Figure 2.5: Calculation of approximate prism angle at a given entry angle (approximated by refracted angle)
A real pair of glasses is meniscus-shaped - that is, shaped like a convex disc with its two surfaces
non-parallel but curved with different radii, to achieve the correct lens power. The approximation,
however, is only concerned with the difference in surface inclination angles at a specific point, which
will be the same at a given distance even if the lens is curved. This is why the lens sketch in Figure
2.5 remains suitable.
See Section 5.3.3 for further discussion.
2.5 Contact lenses
A contact lens can be described physically as a thin, transparent piece of plastic that corrects the
refraction of light into the eye by adjusting the shape of the cornea. The plastic material is gas-
permeable to allow the cells in the cornea access to the air they need, and are made of various types
of plastic6. It floats in front of the cornea on a thin tear film, effectively forming an elongation of
the eye that gives it the correct refracting power to focus incoming rays on the retina.
Since the very purpose of the contact lens is to alter the surface cornea, a physiological model
of the eye like the one used for eye tracking will be affected. There can be said to be three types of
distortions introduced by the lens. One being the new surface profile of the eye, another being the
dynamic behavior of the lens on the eye. The former because the contact lens will have a specific
surface profile that in almost all cases is not perfectly spherical. The latter implies that the contact
lens does not stay exactly at the same place on the eye during its wearing, mainly because it is
6As a side note, contact lenses of today are also very porous and can contain up to 70 % tear fluid!

16 Chapter 2. Theory
displaced because of eye and eye lid movements [8]. The third distortion would be additional glints
forming on the surfaces of the contact lens, as it might not have exactly the same refractive index
as the cornea. However, if the contact lens is thin compared to the cornea, this would not pose a
significant problem in eye tracking applications. [10]
Chapter 3
Method
Choices and conditions crucial for the study are presented here, to allow the interested reader to
properly assess the results.
3.1 Problem formulation
The question at issue in this study is wether a physical model for eyeglasses is of use for PCCR eye
tracking or not, and if so, how it should look like. To clarify the first part of this question, what
needs to be studied is how eyeglasses or contact lenses affect the system and if that affection has
any unique properties or artifacts that cannot be accounted for with the existing eye model. If so,
those features need to be modeled.
Furthermore, since this study is done from an engineering point of view, it is of great interest
to determine the weight of those properties or artifacts, in order to provide a measurement of the
importance of such model. Factoring into this deliberation are the requirements on usability and
non-intrusiveness of an ideal eye tracker. There are of course no unambiguous specifications on
these “requirements”, but best practices and accurate guidelines can be found in literature. E.g., a
comprehensive list of what classifies a good eye tracker can be found in [16]. See Discussion part for
elaborations on this topic.
3.1.1 Delimitations
Some limitations were made regarding the scope and focus of this study. They are summarized here.
– As mentioned in the introduction, eyeglasses may cause problems with the image capturing.
Possible reasons might include extra reflections, the edges of the glasses blocking eye features
etc. These artifacts are not studied in depth in this work.
– Due to the limitations in the scope of this project, only technology from Tobii and not any
competing hard- or software were used for the measurements. The results should however be
17

18 Chapter 3. Method
general enough to be reproduced with other PCCR-eye tracker type equipment.
– Contact lenses are another type of correction lenses with their own artifacts. They are discussed
briefly in 5.4 but really more of a separate field to study than glasses, and therefore not part
of this work.
3.2 Notes on units
There are a number of units used in this study. The unit of choice for comparisons etc. has been
the millimeter, because of its universality. Among the other units in the system can be noted the
unit used in the raw results from the eye tracker, namely the % of screen size, which for a given
eye tracker model can be converted into mm, degrees of the visual field or pixels. Pixels are, for
instance, the unit in which the positions from image analysis are given. In this study, most units
are converted to mm for clarity. On the XL system1 1 mm = 3.7 px, or 1 px = 0.27 mm.
Degrees of visual field is another important unit; it is common to express eye tracker accuracy
error in this unit. This can of course also be converted to or from pixels or mm on a screen, but the
distance from eye to screen is also required in this case, aside from the screen data. This is a reason
this unit occurs. However, since mm are preferred, a conversion factor is of interest. From simple
trigonometry, one degree of the visual field at a distance of 63 cm2 would convert into 11 mm on
the screen, or 41 px.
As a side note, 1◦ = 60 minutes of arc (′) = 3600 seconds of arc (′′). Thus, fractions of degrees
can either be expressed with decimals or with arcmin/arcsec, e.g. 1.505◦ = 1◦ 30 ′ 18 ′′. For
convenience3, The former is preferred in this study.
3.3 User study
The purpose of this project was to study the effect of corrective lenses on eye tracking systems,
based on the empirical observation that wearers of such lenses had worse accuracy with Tobii eye
trackers than people free of such lenses. To investigate the authenticity of this assumption, and to
quantify the size of it, two brief user studies were carried out. The first of which, slightly larger, is
described here. See the following section for details the other user study (on calibration error).
A suitable procedure for collecting eye tracking data for statistical analysis was available for
internal use with the Tobii XL eye tracker. A few adaptions were made for use in this user study.
For the test subjects, the procedure consisted of watching two identical series of calibrations, the
first while wearing glasses, the second without them. The resulting mean errors were compared for
each user.
1An XL screen is typically set to 1920x1200 px display, see section 3.3.1. Similar conversion factors apply fordifferent Tobii eye trackers
263 cm is the standard distance from screen to eye on T/X series3Or rather, to favorize the decimal system

3.3. User study 19
One of the aims of this study was to analyze what parameters that govern the optics of correc-
tive lenses. Thus, data on each user’s glasses was collected during the survey. The most common
parameters of prescriptions for spectacles are the spherical and cylindrical corrections [1]. The for-
mer represents the overall “strength” of the glasses (focal length of the lenses), while the latter
corresponds to the astigmatic refraction error. Other important factors include if the glasses are
progressive/bi-/trifocal, and of course how strong these aspects are. However, due to reasons dis-
cussed in Section 5.3.6, only the impact of the strength parameter was analyzed thoroughly as a
parameter of the model.
A short user questionnaire was handed out to each participant, aimed at providing insights in
additional problems in eye tracking with eyeglasses not anticipated by the literature study. In other
words, to capture user experience in problems with wearing eyeglasses when using eye trackers.
3.3.1 Tobii XL unit and typical angles
Figure 3.1: The Tobii T60 XL Eye Tracker
As previously mentioned, the Tobii T60 XL eye tracker was used for the user study. The main
reason for this choice was the availability of data collection algorithms custom-made for this partic-
ular model, albeit for internal use within Tobii. Also, since the screen of an XL can be considered
large by computer-screen standards, this system caused larger viewing angles than models with
smaller screens. In this study, this was a good thing since larger viewing angles is supposed to yield
larger distortions by glasses - which could be said to be what the study is essentially all about. As
a consequence, the approximate viewing angles typical for the XL-screen were used in the selection
of data ranges for angles (primarily in Section 3.5).
Some selected characteristics of the XL eye tracker can be found in Table 3.1. For further info,
see [14].
20 Chapter 3. Method
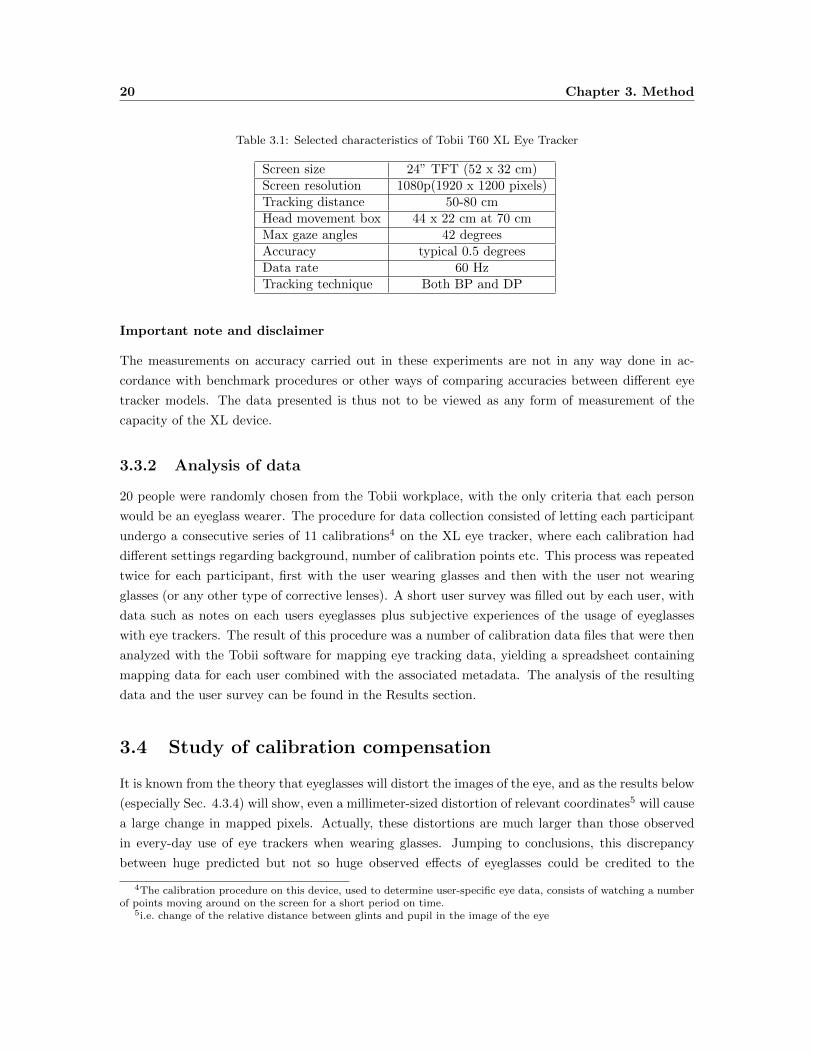
Table 3.1: Selected characteristics of Tobii T60 XL Eye Tracker
Screen size 24” TFT (52 x 32 cm)Screen resolution 1080p(1920 x 1200 pixels)Tracking distance 50-80 cmHead movement box 44 x 22 cm at 70 cmMax gaze angles 42 degreesAccuracy typical 0.5 degreesData rate 60 HzTracking technique Both BP and DP
Important note and disclaimer
The measurements on accuracy carried out in these experiments are not in any way done in ac-
cordance with benchmark procedures or other ways of comparing accuracies between different eye
tracker models. The data presented is thus not to be viewed as any form of measurement of the
capacity of the XL device.
3.3.2 Analysis of data
20 people were randomly chosen from the Tobii workplace, with the only criteria that each person
would be an eyeglass wearer. The procedure for data collection consisted of letting each participant
undergo a consecutive series of 11 calibrations4 on the XL eye tracker, where each calibration had
different settings regarding background, number of calibration points etc. This process was repeated
twice for each participant, first with the user wearing glasses and then with the user not wearing
glasses (or any other type of corrective lenses). A short user survey was filled out by each user, with
data such as notes on each users eyeglasses plus subjective experiences of the usage of eyeglasses
with eye trackers. The result of this procedure was a number of calibration data files that were then
analyzed with the Tobii software for mapping eye tracking data, yielding a spreadsheet containing
mapping data for each user combined with the associated metadata. The analysis of the resulting
data and the user survey can be found in the Results section.
3.4 Study of calibration compensation
It is known from the theory that eyeglasses will distort the images of the eye, and as the results below
(especially Sec. 4.3.4) will show, even a millimeter-sized distortion of relevant coordinates5 will cause
a large change in mapped pixels. Actually, these distortions are much larger than those observed
in every-day use of eye trackers when wearing glasses. Jumping to conclusions, this discrepancy
between huge predicted but not so huge observed effects of eyeglasses could be credited to the
4The calibration procedure on this device, used to determine user-specific eye data, consists of watching a numberof points moving around on the screen for a short period on time.
5i.e. change of the relative distance between glints and pupil in the image of the eye
3.5. Measurements of distortions on images of an eye 21
calibration procedure of the eye tracker that might account for some of the errors. To verify that
this is so, another simple user study was carried out which will be described here.
With the only goal of this study being to verify that the errors caused by glasses would be larger
without the calibration procedure, a simple test setup was used with only a few test subjects. The
test subjects were 6 in total, all wearers of glasses chosen to represent different powers of glasses.
They were each subjected to an ordinary calibration procedure on the Tobii XL-device while wearing
their glasses, followed by two tests. The tests were almost identical and of similar character to a
calibration procedure: fixating in turn on 30 points on the screen, each on a different spot and
appearing in random order. The difference between the two tests was that the first test was done
while wearing glasses, but the second was done without wearing glasses. Since the eye tracker was
not told that the test subject had removed the glasses (i.e. the eye tracker wasn’t recalibrated), the
resulting errors were expected to be larger in the second test. The results were summarized and
compared numerically.
As a side note, the choice of calibrating with glasses and then removing them, instead of cali-
brating without and then putting them back on, was made because of the difficulties for the wearers
of the glasses to calibrate accurately without glasses. These difficulties are of course due to the
problems with seeing the centre of the calibration dots without sharp vision (which many wearers
of eyeglasses lack when not wearing said glasses). See discussion (Section 5.2.1) for more on this.
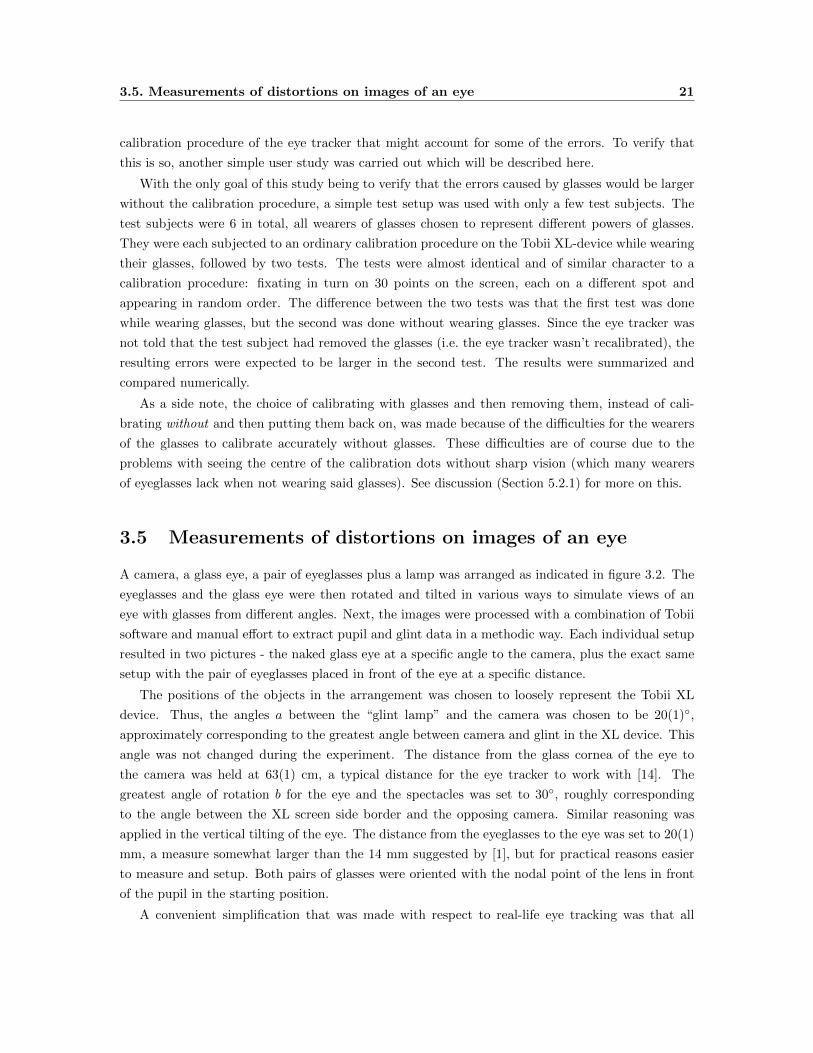
3.5 Measurements of distortions on images of an eye
A camera, a glass eye, a pair of eyeglasses plus a lamp was arranged as indicated in figure 3.2. The
eyeglasses and the glass eye were then rotated and tilted in various ways to simulate views of an
eye with glasses from different angles. Next, the images were processed with a combination of Tobii
software and manual effort to extract pupil and glint data in a methodic way. Each individual setup
resulted in two pictures - the naked glass eye at a specific angle to the camera, plus the exact same
setup with the pair of eyeglasses placed in front of the eye at a specific distance.
The positions of the objects in the arrangement was chosen to loosely represent the Tobii XL
device. Thus, the angles a between the “glint lamp” and the camera was chosen to be 20(1)◦,
approximately corresponding to the greatest angle between camera and glint in the XL device. This
angle was not changed during the experiment. The distance from the glass cornea of the eye to
the camera was held at 63(1) cm, a typical distance for the eye tracker to work with [14]. The
greatest angle of rotation b for the eye and the spectacles was set to 30◦, roughly corresponding
to the angle between the XL screen side border and the opposing camera. Similar reasoning was
applied in the vertical tilting of the eye. The distance from the eyeglasses to the eye was set to 20(1)
mm, a measure somewhat larger than the 14 mm suggested by [1], but for practical reasons easier
to measure and setup. Both pairs of glasses were oriented with the nodal point of the lens in front
of the pupil in the starting position.
A convenient simplification that was made with respect to real-life eye tracking was that all

22 Chapter 3. Method
Figure 3.2: Image distortion measurement setup
objects in the setup were placed in the same horizontal plane.
Six series of pictures were obtained, representing two pairs of eyeglasses and three types of
head/eye rotations. Table 3.2 summarizes the setup parameters for each series.
Table 3.2: *For practical reasons, the vertical rotation was done with the setup rotated 90◦
1 -3.0 D Eye and spectacles rotated clockwise2 -3.0 D Eye rotated clockwise, spectacles fixed3 -3.0 D Eye and spectacles rotated upwards*4 +3.5 D Eye and spectacles rotated counter-clockwise5 +3.5 D Eye rotated counter-clockwise, spectacles fixed6 +3.5 D Eye and spectacles rotated upwards*
3.6 Impact of coordinate shifts on mapping results
To determine the effect of the image distortions from eyeglasses, the image parameters were slightly
perturbed during the mapping process in the Tobii eye tracker software. In other words, the impact
of image distortions from wearing glasses was analyzed by artificially distorting all images in a set,
which in turn was done by modifying certain data.
The parameters of interest that were to be modified were the pupil and glint coordinates plus the
pupil size. I.e., the main data types extracted by the image analysis from image. These parameters
were perturbed by introducing a fixed shift in each of the parameter values, which was done by
altering the source code of the program, introducing the shifts into the image parameters just before
the mapping process was carried out. The resulting mapped values were then compared with the

3.6. Impact of coordinate shifts on mapping results 23
unperturbed data, yielding a difference representing the pixel shift on the screen as a function of
perturbations of the image.
The code that was implemented to perturb the data contained no special algorithms, being
trivial of nature, and is thus not included in detail in this report. It should however be noted that
in the somewhat complex procedure involved for mapping, multiple instances of the same type of
coordinate occured (e.g. multiple glints in an eye, and, as one might guess, mostly there are two
eyes involved, meaning two pupil data sets). This was dealt with by adding the same shifts to each
instance of the modified data type. I.e., when the glint positions were modified, all glints in both
eyes were shifted the same amount. This method was chosen for simplicity.
Naturally, some eye tracking data was also needed to study the effect of coordinate perturbations.
That is, in order to perturb data there was need for unperturbed data to perturb. The data chosen for
this experiment was a large number of static raw calibration files from the Tobii database consisting
of such files, a database used precisely for this type of test situation. Accordingly, the images
taken for the distortion measurements described in the previous section were not used at all here.
This allowed focus of the experiment to remain on only the mapping process. The calibration data
provided a diverse set of data to use for the test, since the files were created with many different users
and settings. There were around 880 calibration files in the database at the time of this experiment.
Due to the somewhat long calculation time of each mapping, only a limited number of pertur-
bations were tested. The perturbations were chosen small, up to 0.5 pixel shifts with increments of
0.1 pixels, since already 0.5 image pixels proved to yield shifts on about 40 screen pixels - a large
error indeed, compared to the eye tracker nominal accuracy 0.5 deg. (approx. 20 px).

24 Chapter 3. Method

Chapter 4
Results
The resulting data acquired with the above method and theory is presented here. The different parts
are pieced together and used for a physical model of glasses in eye tracking in the two final chapters.
4.1 Experimental study of eyeglass wearers with and without
glasses
As described in section 3.3, a calibration study was done on 20 users to quantify the loss of accuracy
when using eyeglasses. Recapping, the aims of this study were:
1. Verify the difference in accuracy of eye tracker with/without glasses
2. Quantify that difference
3. Detect parameters governing this difference, with strength of glasses in particular.
4.1.1 Accuracy with versus without glasses
The calibration data collected in the experimental study was primarily used to quantify the difference
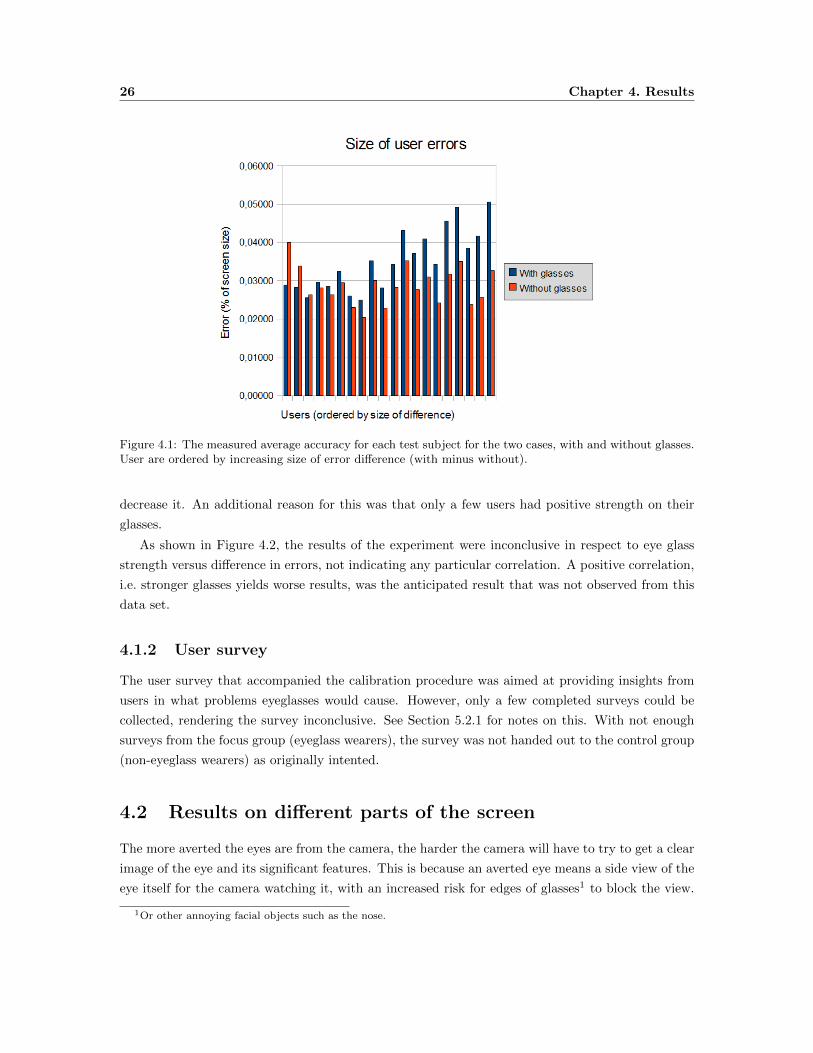
between eye tracker accuracy with glasses and eye tracker accuracy without glasses. Figure 4.1 shows
the mean error for each user, with and without glasses. Most users display a better result without
their glasses, while a few actually had better results with their glasses. The difference in accuracy is
here defined as the mean error with glasses minus the mean error without glasses. Taking an average
of all points for all test subjects, the relative difference for these test subjects is 20 % larger error
on average when using glasses.
To test the hypothesis that stronger glasses decreases the accuracy more than weaker ones, the
difference of each users error size (with minus without glasses) was plotted with mean diopters for
both eyes as the dependent variable. The absolute value of the mean diopters was used, assuming
that neither a positive nor negative focal length would actually enhance the accuracy but rather
25
26 Chapter 4. Results
Figure 4.1: The measured average accuracy for each test subject for the two cases, with and without glasses.User are ordered by increasing size of error difference (with minus without).
decrease it. An additional reason for this was that only a few users had positive strength on their
glasses.
As shown in Figure 4.2, the results of the experiment were inconclusive in respect to eye glass
strength versus difference in errors, not indicating any particular correlation. A positive correlation,
i.e. stronger glasses yields worse results, was the anticipated result that was not observed from this
data set.
4.1.2 User survey
The user survey that accompanied the calibration procedure was aimed at providing insights from
users in what problems eyeglasses would cause. However, only a few completed surveys could be
collected, rendering the survey inconclusive. See Section 5.2.1 for notes on this. With not enough
surveys from the focus group (eyeglass wearers), the survey was not handed out to the control group
(non-eyeglass wearers) as originally intented.
4.2 Results on different parts of the screen
The more averted the eyes are from the camera, the harder the camera will have to try to get a clear
image of the eye and its significant features. This is because an averted eye means a side view of the
eye itself for the camera watching it, with an increased risk for edges of glasses1 to block the view.
1Or other annoying facial objects such as the nose.

4.2. Results on different parts of the screen 27
Figure 4.2: Magnitude of glasses strength (diopters) versus size of errors. No correlation could be detected.
Equally important is that the simplification of a spherical cornea is farther from the truth closer to
its edges, since the cornea really is slightly elliptical in most cases [13]. In practice, this might yield
worse eye tracking results when viewing the edges of the screen in contrast to viewing its center.
This effect is studied in this section.
Mathematically put, viewing the edges of the screen causes a steeper angle of incidence with
respect to the normal of the eye for the optical path between the camera and the eye. This is of
course also true while wearing eyeglasses, but with higher angle of incidence to the glasses as well
as the eyes. Now, the theory (Sec. 2.4) predicts that rays passing through the glasses will deviate
more the more off-centered they pass through the eye glass lenses, a crucial fact. Hypothesizing that
such deviations affects eye tracking results, they might cause a dependency of eyeglasses errors to
where on the screen the gaze is fixed.
Focusing on the optical path between an XL camera and the eye, a simple estimation predicts
that the glasses will refract that path the least when looking directly into the camera. On the XL,
the two cameras are located just underneath the screen, a few cm apart in the middle (Figure 3.1
on p.19). Thus, while looking at the screen, the lower central part is where the glasses should pose
the least bit of a threat, as opposed to the upper left and right corner where the angle of incidence
to the glasses would be the largest.
4.2.1 Results from the larger user study
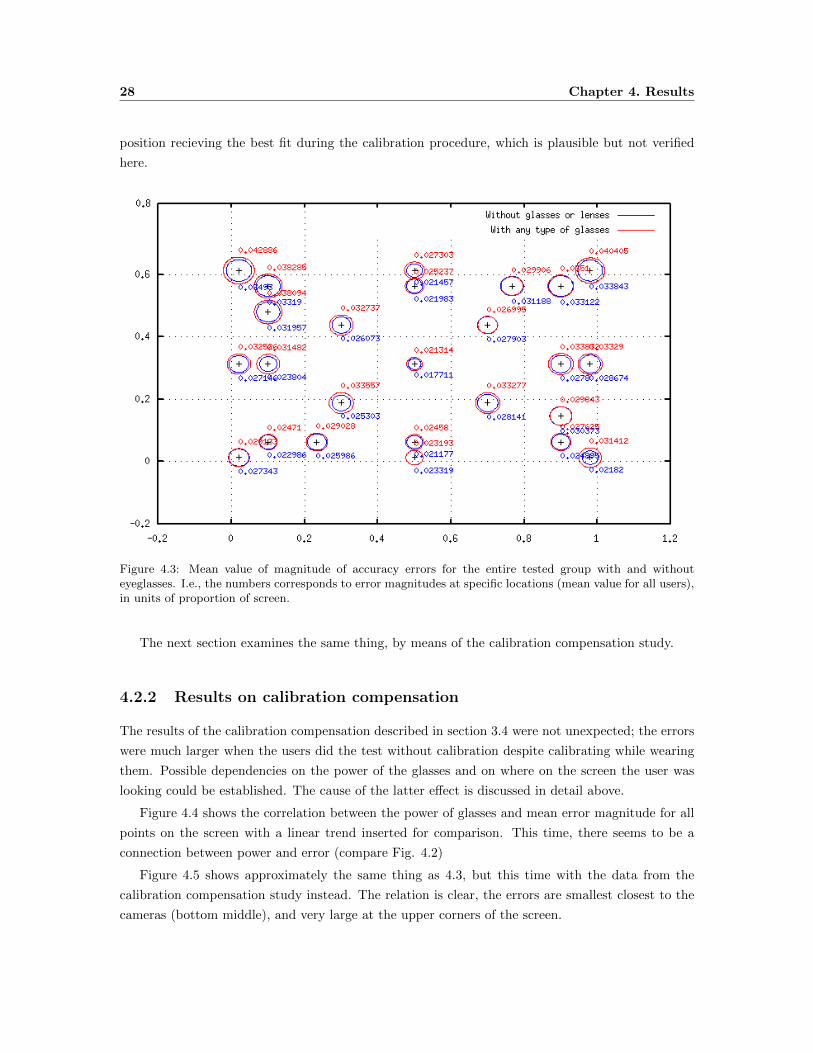
Figure 4.3 illustrates the data from the survey with focus on the errors in the different parts of
the screen. It can be noted that both types of error circles (especially the with-glasses-ones) are
indeed large in the upper corners, and smaller towards the middle horizontally and bottom vertically.
Furthermore, the middle circles displaying the smallest errors might result from the default (middle)
28 Chapter 4. Results
position recieving the best fit during the calibration procedure, which is plausible but not verified
here.
Figure 4.3: Mean value of magnitude of accuracy errors for the entire tested group with and withouteyeglasses. I.e., the numbers corresponds to error magnitudes at specific locations (mean value for all users),in units of proportion of screen.
The next section examines the same thing, by means of the calibration compensation study.
4.2.2 Results on calibration compensation
The results of the calibration compensation described in section 3.4 were not unexpected; the errors
were much larger when the users did the test without calibration despite calibrating while wearing
them. Possible dependencies on the power of the glasses and on where on the screen the user was
looking could be established. The cause of the latter effect is discussed in detail above.
Figure 4.4 shows the correlation between the power of glasses and mean error magnitude for all
points on the screen with a linear trend inserted for comparison. This time, there seems to be a
connection between power and error (compare Fig. 4.2)
Figure 4.5 shows approximately the same thing as 4.3, but this time with the data from the
calibration compensation study instead. The relation is clear, the errors are smallest closest to the
cameras (bottom middle), and very large at the upper corners of the screen.

4.3. Eye glass-distortions on images of an eye 29
4.3 Eye glass-distortions on images of an eye
Here, results are summarized both of the experiments on how eyeglasses distort images and how the
mapping is affected by distortions. These results are also compared with the theoretical model from
section 2.4.
4.3.1 Measurements on the images
The figures of interest obtained in the measurements on how eyeglasses affected eye images were how
the coordinates of the pupil and the glint were changed by the eyeglasses. Thus, all images obtained
in the experiment were paired two-by-two according to their with-and-without-glasses image pairs.
The coordinates used for analysis were then taken to be the differences between the coordinate sets
in each pair. The types of data obtained for each of the images are summarized in Table 4.1. For
the complete list of properties for each of the six different series of images obtained, refer to Table
3.2 on page 22. Some sample images obtained in the experiment can be found in Appendix A on
page 53.
Table 4.1: Columns of data extracted from images. ’Automatic’ in the column Extraction method signifiesvalues extracted with Tobii image analysis software. The measured data can be found in Appendix B.
Data Extraction method1 Pupil position x Automatic2 Pupil position y Automatic3 Pupil major axis size Automatic4 Pupil minor axis size Automatic5 Tilt of pupil ellipse Automatic6 Glint position x Manual7 Glint position y Manual
Figure 4.4: Mean strength of each test subjects glasses plotted versus measured error in pixel (mean valuefor all points on screen)

30 Chapter 4. Results
There are a number of different ways to present the data from the columns mentioned in Table
4.1, regarding which series to choose data from and how to compare the different results. Some
choices that were made include:
– All shift data was represented as the magnitude of the 2D-vector, rather than the two com-
ponents of each point separately. This was of course a simplification, in this case chosen for
clearness.
– Series 2 and 5, representing fixed glasses and rotated eyes, were considered special cases and
are not included in figure 4.6. They are, however, included in the comparison between head
and eye rotation, figure 4.7.
– Another data set obtained was the difference data, meaning the glint shift minus the pupil
shift. Given a constant angle a between the eye-glint/eye-camera (see fig. 3.2 on page 22)
Figure 4.5: Mean error magnitude for all users showing difference between error with and without glasses,based on with-glasses-calibration. Numbers showing errors in pixels, circles radii proportional to numbersand figure scale

4.3. Eye glass-distortions on images of an eye 31
this relative change can be of interest in particular to test the accuracy of a theoretical model.
More on this in Discussion.
Observations from the figures 4.6 and 4.7 include the following:
– All data sets include a coordinate shift even at 0 degrees. The image of the pupil is supposed
to only display a size change, not a shift in either direction, if a lens would be placed centered
in front of it.
– The glints are shifted more than the pupil. This is consistent with theory as the glints rays
pass through the glasses more off-centered than the center of the pupil does. They also pass
through the glasses twice, since the ray is a reflection on the eye.
– As for the Head vs. Eye rotation figure (nr 4.7), it would seem like there is a difference in the
two types of rotations, although the small statistical input makes that difference falls within
the margin of error.
These observations are discussed in Section 5.2.2.
As a final observation, the difference in size of the major and minor pupil axes was analyzed,
yielding magnification factors for the two pairs of glasses. Averaging together these values for all
data pairs of all six series and comparing with theory (Eq. 2.11), the following data was obtained:
Diopters Magnification (std.dev.) Theory-3 D 94.0±1.22 % 94.3 %+3.5 D 109.2±1.61 % 107.5 %
Table 4.2: Magnification
4.3.2 Theoretical model shifts
From section 2.4 we have a number of equations describing typical ray refraction through eyeglasses.
With typical values of the unknown parameters, the results can be combined and compared to the
experimental results. Equation 2.21 can be expressed as a function of angle of incidence θ1 describing
shift in millimeters of a refracted ray on the eye, given a value of α approximated from the angle of
incidence according to equation 2.22. Of course, 2.21 describes a ray refraction in degrees, but for a
given distance between eye and lens, simple trigonometry will yield a shift x in distance instead. A
sketch of of this trigonometry is found in figure 4.8.
x = sin(β) ∗ d0 (4.1)
This simple equation is made possible through a few simplifications. First, note that x is the
2D shift distance measured on a plane perpendicular to the optical axis of the camera, meaning
that even though the shift will change due to the curved surface it hits, it is measured viewed from

32 Chapter 4. Results
Figure 4.6: Coordinate shifts with approximately linear trends
Figure 4.7: Coordinate shift comparison, gaze shift using only eye rotation vs using head rotation withapproximately linear trends. Based on difference data.

4.3. Eye glass-distortions on images of an eye 33
an angle independent of this curvature. However, these angles are considered small. Second, the
distance d0 is not well defined or measured even in general (see section 5.3.5), and the distance
from lens to cornea in this case (off-center in both lens and cornea) varies with the exact ray path,
complicating matters further. See aforementioned section for further discussion.
Figure 4.8: Trigonometry to convert ray deviation to shift on cornea. R denotes the curvature of the cornea.
Figure 4.9 shows the plotted shift values obtained with the theoretical formula, with the typical
values2 of d0 = 20 mm, n = 1.5 and D = −3.0D. A linear trend is inserted in the figure for
comparison and a hint of the slope of the curve, although the function is obviously not linear but
rather displaying a positive first derivative of some sort in the visible area. The linear approximation
might be the most relevant for small angles.
Figure 4.9: Coordinate shifts of points on image for -3.0 D glasses, approximately linear for small angles)
2Chosen for comparison with the experimental setup

34 Chapter 4. Results
Given that the distance between the glasses and the eye is 20 mm, Figure 4.9 shows a reasonably
small shift on the eye (up to 1 mm) for the measured angles.
4.3.3 Comparison between measurements and theory
It is of great interest for this study to correlate the theoretical model with the experimental one,
primarily to verify the results. The data chosen for this comparison was the difference data from
the image series 1,3,4 and 6. See figure 4.10. The results and choices are discussed in Section 5.3.2.
Figure 4.10: Coordinate shifts of points on image with approximately linear trends for small angles
4.3.4 Impact of coordinate shifts on mapping results
To recap the method implemented in this section, the mapping process of the Tobii software, where
image data is converted into coordinates on a screen, was perturbed. This was done by modyfing
certain image coordinates in the program right before the mapping was carried out. The data of
interest is thus the shift between perturbed and unperturbed mapped points on the screen. The
result of the mapping process for the entire calibration file set and for each perturbation setting was
a large set of mapped points, paired up with the corresponding metadata.
Since only the difference in mapped positions was of interest here, the metadata was discarded
and the rest was averaged and compared. Specifically, the mean was taken of all mapped point
coordinates, which was then compared to the corresponding unperturbed mean mapped point coor-
dinates. This difference, in both x- and y-directions, is the data of interest.
The following figures (4.11 and 4.12) show the calculated values provided by the method described
above. Each point represent the difference (in pixels) between original mapped data points and
perturbed data points. They are represented in 1D in the figure, implying correctly that only one

4.4. Results compared - example 35
of the 2D (xy) components of the mapped coordinate shift is shown in each data series. The reason
that the two components of each shift is neglected is that the small component is negligible (typ. 1-2
% of the other) for these results. As for which component is the major and which is the minor, it is
as expected for the first two figures: when perturbing y image coordinates, y mapped coordinates
are more shifted than x, and vice versa. Observing Figure 4.13, it is clear that it is the y coordinate
that is shifted the most as a function of pupil size change, the reason for which is not as obvious.
Figure 4.11: Coordinate shifts of mapped points due to pupil coordinate perturbations, approximatelylinear for small values. The two graphs depict different parameters changed, shown in the same figure forcomparison.
The relation is more or less linear for both glint and pupil coordinate distortions, as can be seen
from the linear fit of the data sets. This linearity holds for small pixel shifts, apparently such as
the ones tested for. The same linearity goes for the pupil size. A probable cause for the y shift
dominating the x shift in the latter case is that while half of the calibration points lie to the right
and half to the left on the screen, all of those points lie above the cameras (by design placed below
the screen), creating an assymmetry in the y direction.
4.4 Results compared - example
In the previous sections of this chapter, different results were presented. This section will compare
a few of the figures to see how well the results fits together.
Example. Consider a typical pair of glasses of strength -3D. Our results indicate that a pupil
observed through these glasses at an angle of, say, 20 degrees will be shifted, as viewed by

36 Chapter 4. Results
Figure 4.12: Coordinate shifts of mapped points due to glint coordinate perturbations, approximately lin-ear for small values. The two graphs depict different parameters changed, shown in the same figure forcomparison.
Figure 4.13: Coordinate shifts of mapped points to pupil size perturbations, approximately linear for smallvalues.

4.4. Results compared - example 37
the camera. Figure 4.6 (p. 32) shows how much for a typical setup. With those numbers (the
coefficient only), the pupil will be shifted 0.4 mm, which corresponds to 1.5 pixels in the image.
Next, Figure 4.11 (p. 35) shows how much 1.5 pixels in the image will move the mapped point
on the screen, which would be 140 px using the given coefficient for x-movements.
Is 140 px error reasonable? Well, as we know, the errors are not quite as large because of
calibration (and other things, see e.g. Sec. 4.2.2), but 140 px is still not unexpected. Checking
Figure 4.5 (p. 30), we see that the top center circles have a radius of approximately 200 pixels.
As it happens, those circles represent average error for different glasses with an average strength
around -3D, and top center on the XL device corresponds roughly to 20 degrees - pretty close
to the example setup, in other words! A more exact relation between glasses strength and error
might have yielded a better correspondence, but 140 px is still close to the rough estimate of
200 px in that figure.

38 Chapter 4. Results

Chapter 5
Discussion
The results and theory from the previous chapter will here be discussed and presented in terms of a
physical model for eyeglasses in eye tracking. The discussion continues in the subsequent, conclusive
chapter.
5.1 Notes on theory
The imperfections of the human gaze stability here addressed are two aspects of the problem. How-
ever, these two aspects cannot without further attention be considered to act independently and
additively. In fact, both involuntary eye movements and fixation point differences could very well
prove to be be two ways to describe more or less the same problem.
In addition, noise can often be removed, e.g. by using an appropriate (software) filter.
Finally, depending on the application of the eye tracking it could be discussed if physiological
noise is a problem or not. The governing factor here can be said to be if it is of interest where the
user wants to look, or simply where the user points the gaze.
5.2 Method and result
5.2.1 User study
First of all, it should be noted that while the data did give a measure on how much worse results
eyeglass wearers score compared to non-glasses wearers, not all objectives with the user study were
accomplished. Some notes on potential ways to enhance the statistical methodology are discussed
below.
Small number of test subjects The number of participants in the study could have been chosen
higher to better verify the results. Especially the expected correspondence with strength of
glasses was notably absent.
39

40 Chapter 5. Discussion
Choice of participants The participants were chosen randomly from the Tobii workplace. Care
could have been taken to choose participants representing a more varied set of eyeglasses
strengths, especially the very strong glasses are scarce in the test.
Determining glasses strength A few of the participants were unable to provide exact information
on the strength of their glasses. Also, as discussed below, the power of diopters as a measure
of glasses strength is further diluted by the fact that the distance eye-to-glasses also influences
the power, since that distance is of course not accounted for by the diopters measure.
Artificial situation not wearing glasses The point of that the users were compared to them-
selves with/without glasses (instead of with people not wearing glasses at all) was of course to
prevent the large differences between different individuals to influence the results as much as
possible. There is another subtle drawback with this, namely that people needing glasses may
score bad results on eye tracking calibration when not wearing their glasses - simply because
they cannot focus accurately on the calibration dots. In other words, if the artifical situation of
not wearing corrective lenses causes problems with accuracy (which is not studied but entirely
possible), this might negate the studied effect of worse results when wearing glasses.
Furthermore, the user survey did not yield any useful results. The reason is here assumed to
be too unclear questions to provide further insight into the question at issue (namely capturing the
users experience in problems when wearing eyeglasses with eye trackers).
5.2.2 Measurements on images
The measurements proved to be time consuming, mainly due to the effort of keeping the parameter
accuracy at the desirable level and because of the semi-manual process of extracting data from the
resulting images. As a result, the number of data values extracted was small. As discussed below,
the results were of the same order of magnitude as the theory predicted, but the small statistical
significance does not put very large confidence into the actual numbers.
Analyzing the image data, it can be observed that the center of pupil was shifted even at zero
degrees of angle. This implies that the pupil of the eye was in fact not placed exactly on the line
through the camera and the nodal point of the lens, but rather somewhat offset.
Because of the discussed imperfections of the measurement outcome, adjusting the theoretical
model against the physical one might require additional measurements.
5.2.3 Impact of coordinate shifts on mapping results
An important note here is that the glints of the mapping shifts are not moved individually but rather
all at the same time, meaning that even though there might be more than one glint (recalling that the
XL unit utilizes both BP and DP tracking), they are moved as a group. This is a very likely reason
why there is only a small difference between the figures 4.11 and 4.12, since they are essentially
describing the same thing: a relative change between the glint group and the pupils. Comparing the
5.3. Physical model for eyeglasses - discussion 41
pupil x shift with the glint x shift, we see from the mentioned figures that the difference between
the proportionality factor is only 0.3 % of the pupil shift (disregarding the obvious opposed sign).
Analogously, the y shifts differs by 0.6 %, thus the results are very similar.
Next, recalling that an XL screen is 1920 px wide, we can see that the image pixel shift needed1
to shift the mapped point from the center of the screen to its side (960 px) would be approximately
10 px, or 2.5 mm. Is this reasonable? Some simple calculations can give us an estimate if so or not:
a typical radius of the imagined cornea-sphere would be 7.8 mm, which gives a circumference of 49
mm. This relates to 2.5 mm as 18◦ to 360◦. Next, 26 cm, the half-width of an XL-screen, in turn
constitutes 24◦ of the visual field at a distance of 63 cm from eye to screen. Thus, since 18◦ is in
the same order of magnitude as 24◦, the factor in question can be deemed reasonable.
Further studies should be correlated to more details of the particular eye model of interest
(e.g. Tobii’s) to clarify these details, one such detail being moving the glints individually.
5.3 Physical model for eyeglasses - discussion
The question at issue, as stated in Section 3, is wether a physical model for eyeglasses is of use or
not, and if so, how it should look like. The discussion is breaked down into parts based on the results
and theory above. A discussion on possible prototypes suggested with the help of the conclusions
here follows in Chapter 6.
5.3.1 Cons and pros with a physical model
The important question of wether a physical model is of use or not can be answered in a number
of ways. Here, extra credit will be awarded to factors that calibration can not compensate for. In
other cases, such as if a more thorough knowledge of the eyes actual position is of interest, a physical
model describing this could be priced otherwise.
If “what factors the calibration does not compensate for” is important, then the knowledge of
what it does compensate for is necessary. After all, the user will look out through the glasses as
well as the camera will look in, possibly compensating for some optic distortions. Against this
we might put that the gaze is never directed straight at the camera2, thus the optical paths will
not travel through the same parts of the glasses. But, one might hypotesize, the distortions might
be proportional from the cameras point of view, thus allowing a good calibration procedure to
compensate for the distortions automatically. Put another way, if the distortions are regular, the
eye tracker might get distorted info on the eyes, that still yield the correct results. Unfortunately,
the calibration procedure has not been evaluated enough in this study to provide a conclusive answer
to this question.
Well then, maybe the other question can be answered: what factors does the calibration not
compensate for, in regards to the mapping? The most important answer obtained from this study
1with the proportionality factor of Figure 4.11 and using the same method as the one described2Well, more or less, since it wouldn’t be useful
42 Chapter 5. Discussion
is the difference between head and eye movement, especially in the case of off-axis glints since the
angles will then be more extreme. This is supported by the results visualized in Figure 4.7, as well
as the experiment-supported theory (Section 4.3.3) that rays passing through different parts of the
glasses yields larger shifts. The magnitude of this is discussed in the next section.
5.3.2 Image distortions - Comparison between measurements and theory
The experimental data series chosen for comparison with the theoretical predictions were from the
image series 1,3,4 and 6, which are all four series captured except the eye-only rotations. As stated,
the data column chosen is the difference between glint and pupil shifts. This column was chosen since
the glint shift provided an interestingly large shift but also represented two ray passes through the
lens (glints being reflected points), why the more basic results of only the pupil shift was subtracted.
It is interesting to note that the two series compare (Fig. 4.10 p. 34) in order of magnitude, but
due to the previously discussed limitations in reliability of these results, the actual numbers are not
discussed further.
5.3.3 Mathematical model
The below summarizes the approximations from the mathematical model and their relative magni-
tudes.
Shift due to lens thickness When simplifying the lens as a thin prism, the effect of the thickness
of the lens on the ray shift is ignored. This is because when a ray travels through an object
with a different index of refraction than its surrondings at an entry angle not parallel to the
normal of the surface, the ray exit point will not lie on the original trajectory of the ray.
The magnitude of this shift depends on the refraction of the ray at the first surface and the
distance it travels before exiting the object. For example, take a ray making an entry angle of
30◦ with the entry surface travelling through a flat slab of glass with refraction index 1.5, which
corresponds to power 0 glasses and a large angle. Using Snell’s law and some trigonometry,
we find the shift the glass surface plane to be 0.24 mm per mm of thickness of the glass. For
comparison, the corresponding shift at an angle of 10◦ would be 0.06 mm. How thick the lens
is varies between 1 mm and up to 5-6 mm for typical glasses [1], with negative lenses being
thinnest in the middle and positive being thickest in the middle. Thus, these shifts are actually
pretty large for large angles, but can be compensated for in an enhanced mathematical model.
Middle of lens The algorithm assumes the viewed object being at the center of the lens, and this
will only be true if the viewed part of the eye is facing the center of the lens. In practice, this
would ideally be true for a viewed pupil gazing straight ahead, since the lens ideally would be
centered in front of the eye gazing in this direction. However, not only the pupil but also the
glints are viewed, and in the case of off-axis glints, or an eye not gazing straight ahead through
the glasses, this will not hold. The remedy to this problem is discussed in Section 6.
5.3. Physical model for eyeglasses - discussion 43
Distance from eye to glasses The distance from eye to glasses could theoretically be determined
at some location (e.g. in the middle) with some accuracy, but it will not be constant for all ray
paths between eye and glasses. Now, modern glasses are in fact always curved in a convex way
away from the eye [1], but with larger radii than the distance from the eye center of rotation
to the glasses (which is only approx. 3 cm), so this curvature does not cancel out the shift in
distance. The exact curvature of the lens is not something that can be easily measured with
an eye tracker. Thus, to get a more accurate measure of the distance, an approximation can be
made. Static as in the model presented here, or dynamic with an increasing d0 for increasing
angles.
A conclusion is that the mathematical model as it is presented in Theory (Section 2.4) reaches
fairly good results, but only under very controlled conditions. The refraction calculation might be
adequate, but a model for eyeglasses worth the trouble would need a different way of calculating
what part of the lens a particular ray would enter through. This is because this factor is what
has been kept abnormally fixed during this study, and need to be taken into account for less ideal
conditions. Development of such a model should not prove to be impossible, since there are no new
unknowns introduced.
5.3.4 Parameters
The eyeglasses will refract a ray passing through, that much is known from the above theoretical
and experimental results. What parameters that governs this refractions are, naturally, of great
importance for the physical model.
To begin with, we have the strength of the glasses, which is a product of the glass refractive
index and the lens curvatures. However, the exact design of a given pair of eyeglasses is not possible
to obtain during eye tracking, which is why the power of the glasses (and maybe the distance from
eye to glasses) might have to suffice for the description of its refractive properties.
Next, we have the orientation of the glasses, meaning what part of the lens an optical ray travels
through. This is important because the theoretical model, supported by the experimental results of
Section 4.3.1 suggests that the refraction will depend on this. This is strengthend by the observations
in Section 4.2, where larger angles between cameras and gaze points displays a correlation with worse
results. The question is now how the position of the glasses may be determined in a typical eye
tracking situation. The answer is that without adding information, it is possible to derive the rotation
of the lenses of the eyeglasses along two axes, while the third rotation remains an unknown parameter.
This can be concluded from the following observations:
– When wearing eyeglasses, the eye glass lenses are placed in front of the wearers eyes, in a (more
or less) fixed relation to the head.
– The eyes can be rotated independently of the glasses. However3, the center of rotation of the
eyeballs will have a fixed relative position to the glasses.
3As the eyes surely will stay in their sockets during the entire eye trackig session
44 Chapter 5. Discussion
– The head can rotate with respect to three axes. A natural way of choosing these axes could
be the following: tilting it to the sides (bending the neck), turning it to the sides (twisting the
neck), and inclining it forwards or backwards (nodding). The wearer’s glasses, given that they
are fixed on the head, will turn in the same way as the head does.
– Two of these rotations will inevitably change the positions of the eyeballs, but the third one
might not. In other words, you can incline your head forwards or backwards in such a way
(moving it slightly at the same time) that the eyeballs remain stationary, but as for the other
two rotations (tilting and turning) this cannot be done. This is because in the first case, both
centers of the eyes could be placed on the axis of rotations, but not so in the other cases.
Thus, knowing the position of the glasses with respect to the head (i.e. the centers of the eyes)
we can thus determine the longed-for position of the eyeglasses, save for one rotational direction.
As a side note, some eye tracking algorithms are not concerned with the centers of rotation of
the eyeballs but rather the centers of the cornea (e.g. the one described in [12] and Sec. 2.2), which
would make those positions also unknown. However, approximating their positions by extrapolating
along the optical axes of the eyes (see, again, Section 2.2) is not impossible and since the proportions
of human eyeballs vary only very slightly[1] this can be done with some accuracy.
5.3.5 Resolving unknowns in implementation
From the above discussion (particulary the approximations of 5.3.3), the unknowns in the system
can be reduced to the following:
Strength of glasses Being the largest factor governing the refraction, the overall strength of the
glasses remain important in all aspects of the physical model presented here. The eyeglasses
strength should be identified by the system. This could either be done by manual input, which
however would require the user to know the exact glasses strength, which from experience
hardly could be assumed. Another way would be to add to the calibration procedure a way
of deriving this unknown, using for instance the magnification effect of the pupil (Eq. 2.11,
p. 12).
Distance from eyeglasses to cornea Naturally, there needs to be a distance between the eye
and the eye glass lens for that lens to actually do anything. This distance could be assigned
a fixed value (as Malacara does [1]) or be dynamically determined through calibration, as a
combined measure with the lens power as the strength of the glasses.
Eyeglasses rotation along horizontal axis (i.e. the axis parallel to the line connecting centers
of eye balls). As discussed above, this could be approximated or ignored. Another possibility
would be the usage of e.g. a facial recognition system to determine the head position, see the
final paragraph in this section for more on this.

5.4. Contact lenses 45
A note on using the magnification as a calibration procedure to obtain the strength of the glasses
is that the measure on the magnification will only provide one extra degree of freedom. Thus, there
is not enough information to determine d0 or D individually but rather as the product of each other.
An approximation or other type of calibration of one or the other is needed to distinguish between
them.
As a final note on resolving unknowns, additional data could be added from other sources than
the eye tracking model presented here. Considering only unotbrusive systems, a prominent example
would be high accuracy facial recognition systems. This type of system could potentially and for
instance provide information on the location of the head (and thus eyes), or maybe even the position
of each eye glass lens. The evaluation of this type of tools are not part of this work.
5.3.6 Other properties of glasses
It should be noted that eyeglasses might have special properties such as bi- or trifocality, progres-
siveness or correction of astigmatism. Features such as these are not accounted for at all by this
study, based on the somewhat uncertain assumption that the other glasses properties (position,
strength) dominates the system. A proper implementation of the physical model presented by this
study could in theory be expanded to include parameters such as these. The trade-offs might include
the following:
– such parameters could be hard to easily and accurately identify automatically.
– The number of users with significant sideffects such as those might be few.
– The model complexity might increase too much.
5.4 Contact lenses
Apart from the discussion in theory about contact lenses, no measurements were carried out on users
with contact lenses. The reason was that the estimated scope of a study on contact lenses would be
beyond the economy of this project, mainly focusing on eyeglasses.
The key point determined by the literature study in how contact lenses affect eye tracking is the
altering of the cornea shape [10]. Further work on a full accounting for contact lenses in eye tracking
would require means to identify that shape and modify the mapping mathematics accordingly. Some
suggestions on how to do this would be to either by experience know/test most common lens shapes,
or by using other known facts of the eye (such as that the cornea radius commonly has a specific
value) to guess lens parameters.
As Chahuan [8] suggests, contact lenses move during and, more importantly, before/after blinks.
These blinking distortions might be accounted for in an eye tracking system simply by considering
the image frames closest in time to the blinks less reliable.

46 Chapter 5. Discussion

Chapter 6
Further work and Conclusions
A discussion on a practical implementation of the physical model for eyeglasses is presented here, as
a conclusion of this study and a guide for further work based on the results.
6.1 Common features
A model for the eyeglasses should include the location and orientation of the eye glass lenses in
relation to the eyes. As concluded in the sections on shift caused by glasses, it is vital do determine
what part of the glasses each ray passes through, to be able to determine how much the ray is
refracted. Enhanced mathematics to determine point of incidence on glasses in relation to center,
optionally combined with the simplifying results of 2.22, are required.
6.2 Calibration
Furthermore, the power of the glasses are needed. To provide this, a calibration method is suggested
here.
By using the magnifying/minifying effect of the lens, the strength of the eyeglasses could be
obtained. Obtaining one or more pictures of the user wearing the glasses using the regular eye
tracking system, directly followed by pictures not wearing them with the users head in the exact
same place, the difference in iris size can be readily obtained. Assuming that the distance between
glasses and eye is constant, the strength of the glasses measured in diopters can thus be determined
by this magnification.
Furthermore, as the differences in head/eye rotation suggests, a simple clarifying instruction to
wearers of eyeglasses could enhance the original calibration procedure. Namely, telling users to move
their gaze in a consequent way regarding the two options of turning the head or rotating the eyes.
One of these two modes may for instance be suggested to the user: Either keeping the head fixed
during calibration and only moving eyes, or keeping the eyes gazing straight ahead and instead turn
47

48 Chapter 6. Further work and Conclusions
the head to move the gaze. The technical reason for this instruction yielding more reliable result
would be to avoid unpredictable distortions during calibrations.
6.3 Variant 1 - remove only unique artifacts
Based on the principle of not bringing out the big guns where only a gentle push is needed, the
prototype model for eyeglasses in eye tracking could be developed to only correct those distortions
caused by glasses that cannot be accounted for by other means. As the discussion in Section 5.3.1
indicates, an area in focus here would be correcting differences in head/eye rotation. Clarifying what
this means, it would imply shifting coordinates of glints and/or pupil in cases where the relation of
the eyeglasses and the pupils are not in their default position. Further clarifying, “not in default
position” is here intented to signify when the user does not move the gaze in a consequent way (as
described in the previous section). E.g., when having the eyeglasses at a large angle to the gaze, as
when watching things through the corner of the glasses.
One straightforward way to implement the above would be to recreate the coordinates the glints
and the pupil would have if the glasses were placed straight in front of the pupil. In this case, the
user would preferably calibrate using the method described above with the eyes always trying to
stare straight ahead.
6.4 Variant 2 - remove all effects
Opposed to the model presented above, the idea of removing all influences of eyeglasses could be
discussed. Ideally, this concept would correspond to mathematically “remove” the eyeglasses and
tell the eye tracker the true coordinates of the eyes (instead of those visible through the glasses).
This would of course be to allow the eye model to operate exactly as intented, without distortions
of the image at all.
Here, this effect is suggested to be achieved in much the same way as the previous variant.
However, since the calibration already takes care of most of the distortions (as shown in Sec. 4.2.2),
a solution of this sort would require calibration without glasses. A solution of this sort would also
typically require much more fine tuning since much more perturbations would be made.
To sum up, a solution of this sort would require more motivation than just to fix artifacts specific
to eyeglasses in eye tracking. Such motivations could be that a smaller solution does not suffice, or
that knowing the true positions of the eyes would yield (possibly eye tracking-unrelated) advantages
not accounted for here.

6.5. Notes on software 49
6.5 Notes on software
Without detailing copyrighted code1, it could be said that shifts in coordinates could either be
applied in image coordinates before the mapping of those points or in the mapped points on the
screen or viewed area. As the attentive reader might have noticed from previous sections, it is here
suggested to move image coordinates after the image analysis but before the mapping of those point
with the corresponding eye model. I.e., as an extra process independent of the mapping affecting
only the coordinates that describes the system.
It should however be noticed that it would also be possible to change the mapping process through
integrating the glasses model directly in the mapping process, or to move the mapped points on the
screen after the mapping has been done.
1Like the one studied in this study, belonging to the Tobii Eye Tracking Server

50 Chapter 6. Further work and Conclusions

Bibliography
[1] D. Malacara and Z. Malacara, Handbook of Optical Design, Marcel Dekker, 2004.
[2] Kenneth J. Ciuffreda, Barry Tannen, Eye movement basics for the clinician, Mosby, 1995.
[3] “Diagram of the eye - NEI health information”, http://www.nei.nih.gov/
health/eyediagram/, 2009.
[4] “Magnification”, http://en.wikipedia.org/wiki/Magnification, 2009.
[5] “Human eye”, http://en.wikipedia.org/wiki/Human eye, 2009.
[6] “Eye movement (sensory)”, http://en.wikipedia.org/wiki
/Eye Movement (sensory), 2009.
[7] Nicole M. Putman et al., “The locus of fixation and the foveal cone mosaic”, Journal of Vision 5,
pp. 632-639, 2005.
[8] Anuj Chauhan and Clayton J. Radke, “Modeling the vertical motion of a soft contact lens”,
Current Eye Research, 22:2, pp. 102-108, 2001.
[9] Carl Nordling and Jonny Osterman, Physics Handbook, Studentlitteratur, 2004.
[10] Mark J. Mannis, Karla Zadnik and Cleusa Coral-Ghanem, Contact lenses in ophthalmic prac-
tice, Springer, 2003.
[11] Jorge Otero-Millan et al., “Saccades and microsaccades during visual fixation”, Journal of
Vision 8 (14):21, pp. 1-18, 2008.
[12] Elias Daniel Guestrin and Moshe Eizenman, “General Theory of Remote Gaze Estimation Using
the Pupil Center and Corneal Reflections”, IEEE Transactions on Biomedical Engineering Vol.
53, 2006.
[13] Andrew T. Duchowski, Eye Tracking Methodology: Theory and Practise, Springer, 2003.
[14] Tobii Technology, “Tobii T/X series Eye Trackers”, available online at http://www.tobii.com.
51

52 BIBLIOGRAPHY
[15] Commission on Behavioral and Social Sciences and Education, Myopia: Prevalence and Pro-
gression, National Academy Press, 1989.
[16] Oyewole Oyekoya, Eye Tracking: A Perceptual Interface for Content Based Image Retrieval,
University College London, 2007.
[17] A.O. Mohamed, M.P. Da Silva, V. Courbolay, A history of eye gaze tracking, 2008.
[18] D. Leimberg, M. Vester-Christensen, Eye tracking, Lyngby, 2005.
[19] Eugene Hecht, Optics, Fourth Edition, Addison Wesley, 2002.

Appendix A
Sample images
53

54 Chapter A. Sample images
Figure A.1: 20 degrees clockwise rotation with/without glasses, uncropped

Appendix B
Measurement Data
The following table are the raw data values from the measurements on the images obtained in the
glass eye measurements (described in Method chapter). Unless otherwise stated, units are given in
pixels, as measured on the image (see previous appendix for sample images.
Table B.1: Pupil with/without glasses data. Setup: -3 Diopters, Horizontal eye+glasses turning
Photo nr x y Degrees Axis 1 Axis 2 Tilt (radianer)1 38,28020 65,50080 0,00 9,76691 10,15640 -2,843872 37,16370 65,50730 0,00 9,97559 11,10170 -2,930393 52,04730 65,69900 5,00 9,36476 10,04540 -2,879554 52,68830 65,50550 5,00 10,12120 10,41490 -2,732455 47,61740 65,63910 10,00 9,39990 9,98206 -3,053706 47,92380 65,53220 10,00 10,20750 10,55090 -2,642307 46,93380 65,81590 15,00 9,33202 9,72173 -2,151068 49,19520 65,48310 15,00 10,09080 10,28050 -2,527689 35,23410 65,44250 20,00 9,15083 9,68219 -2,16838
10 38,00690 65,53870 20,00 9,88318 10,31280 -1,8246811 47,78660 65,44330 25,00 9,04024 9,62404 -1,6336512 52,36830 65,63610 25,00 9,73531 10,44430 -1,69830
55

56 Chapter B. Measurement Data
Table B.2: Pupil with/without glasses data. Setup: -3 Diopters, Horizontal eye only turning
Photo nr x y Degrees Axis 1 Axis 2 Tilt (radianer)13 44,91890 73,22570 0,00 9,14403 9,86464 -0,0612814 43,54630 72,70625 0,00 9,99842 10,53475 -2,9551215 45,69435 73,54245 5,00 9,01521 10,03035 -0,2242016 43,38705 72,64125 5,00 9,78947 10,34375 -2,8687117 62,73050 73,93570 10,00 8,94727 9,72136 -0,7960118 62,21960 72,80780 10,00 10,01590 10,27080 -0,0562019 66,61800 73,70330 15,00 9,19910 9,55295 -1,9881720 64,95640 72,71710 15,00 9,90686 10,06980 -1,6365121 67,19750 73,40510 20,00 9,01006 9,38640 -1,5217622 66,08870 72,69080 20,00 9,75024 9,86928 -1,8667123 70,42045 73,14635 25,00 8,61299 9,37631 -1,4383524 69,82040 72,76930 25,00 8,86397 10,23780 -1,47383
Table B.3: Pupil with/without glasses data. Setup: -3 Diopters, Vertical eye+glasses turning
Photo nr x y Degrees Axis 1 Axis 2 Tilt (radianer)27 80,83607 34,55250 0,00 9,21865 10,42527 -1,6908928 80,16390 34,27160 0,00 9,56000 10,73840 -2,0621329 80,97440 38,38915 5,00 9,52913 9,78850 -2,7838430 79,71160 38,88580 5,00 9,83870 10,53800 -2,2407431 81,37010 34,58310 10,00 9,12819 9,45564 -0,6721232 79,29940 37,06230 10,00 9,85957 10,06470 -3,1394833 80,92140 39,62360 15,00 9,17664 9,36362 -0,8562334 79,42110 42,46400 15,00 9,62640 9,97015 -0,2466335 81,06890 37,65390 20,00 8,96902 9,42638 -0,5278336 79,44610 41,27550 20,00 9,42746 10,10100 -0,3638537 80,94770 27,81840 25,00 9,04762 9,81622 -2,3762538 79,24290 32,19385 25,00 9,33647 10,14880 -0,2232239 81,23970 37,31090 30,00 8,41119 9,50339 -0,1656340 79,33940 43,51110 30,00 9,11066 10,03590 -0,09216
Table B.4: Pupil with/without glasses data. Setup: +3.5 Diopters, Horizontal eye+glasses turning
Photo nr x y Degrees Axis 1 Axis 2 Tilt (radianer)41 55,42090 70,87535 0,00 10,73605 11,06510 -2,8023942 52,43450 71,72585 0,00 9,74513 10,24665 -1,2589643 41,22645 70,76315 5,00 10,68485 10,94345 -2,1700044 39,13205 71,72805 5,00 9,76768 10,50060 -0,3474345 69,41730 70,44780 10,00 10,78480 11,08500 -0,1580846 64,40873 71,65230 10,00 9,75348 10,38557 -0,2553747 69,37430 69,94500 15,00 10,58470 10,84160 -1,7587948 63,04775 71,72965 15,00 9,80977 10,02370 -0,6627449 67,61460 69,92620 20,00 10,73120 11,08980 -1,80817

57
Table B.5: Pupil with/without glasses data. Setup: +3.5 Diopters, Horizontal eye only turning
Photo nr x y Degrees Axis 1 Axis 2 Tilt (radianer)50 62,15230 71,71060 20,00 9,76021 9,94307 -1,2890653 39,98590 74,53060 0,00 10,93460 11,39430 -0,0913454 36,01820 72,79250 0,00 9,82309 10,26490 -2,9844255 38,47320 74,49070 5,00 10,44960 11,53570 -0,0003256 35,08560 72,62410 5,00 9,78941 10,37350 -0,0811257 37,94540 74,29750 10,00 10,68740 10,99270 -0,6097158 35,11590 72,46100 10,00 9,46803 10,85220 -0,1735159 28,84180 74,41940 15,00 10,67460 10,91900 -1,9517160 26,09780 72,48300 15,00 9,84256 9,91391 -2,8384661 16,31070 74,34480 20,00 10,47240 10,76790 -1,4775862 14,72280 72,54560 20,00 9,54909 9,87869 -1,44180
Table B.6: Pupil with/without glasses data. Setup: +3.5 Diopters, Vertical eye+glasses turning
Photo nr x y Degrees Axis 1 Axis 2 Tilt (radianer)65 66,88910 62,77570 0,00 10,57810 11,47440 -0,9722366 64,64840 61,56915 0,00 9,57242 10,36435 -0,8263967 68,13210 84,15440 5,00 10,36883 10,99180 -0,1634468 64,03730 83,27040 5,00 9,67304 10,54935 -0,5294069 68,97680 58,71540 10,00 10,71620 11,00750 -0,5813370 64,89100 58,18240 10,00 9,79158 10,12250 -0,6958371 68,54370 58,77220 15,00 10,64270 11,11780 -0,9953872 64,48390 58,84330 15,00 9,94505 10,12430 -1,5061673 68,66290 61,31470 20,00 10,62700 10,97750 -1,2469074 64,37400 62,16483 20,00 9,51572 10,18180 -1,7440075 69,07225 50,52075 25,00 10,31880 11,14920 -1,5552076 64,56730 53,66690 25,00 9,12133 10,05147 -1,5302577 68,67520 50,30860 30,00 9,84186 10,88900 -1,4252978 64,53050 50,54370 30,00 8,60690 10,13570 -1,57538
Table B.7: Glint with/without glasses data. Setup: -3 Diopters, Horizontal eye+glasses turning
Photo nr X Y Degrees1 46 66 02 45 66 03 61 66 54 63 66 55 60 66 106 62 66 107 63 66 158 67 66 159 56 66 20
10 63 66 20

58 Chapter B. Measurement Data
Table B.8: Glint with/without glasses data. Setup: -3 Diopters, Horizontal eye only turning
Photo nr X Y Degrees13 52 73 014 50 73 015 50 74 516 48 73 517 64 74 1018 64 73 1019 66 74 1520 64 73 1521 64 74 2022 63 73 2023 65 74 2524 64 73 2525 68 73 3026 68 73 30
Table B.9: Glint with/without glasses data. Setup: -3 Diopters, Vertical eye+glasses turning
Photo nr X Y Degrees27 75 35 028 72 34 029 75 41 530 72 42 531 75 40 1032 72 43 1033 74 47 1534 71 51 1535 74 48 2036 71 53 2037 74 41 2538 70 48 2539 74 54 3040 69 66 30
Table B.10: Glint with/without glasses data. Setup: +3.5 Diopters, Horizontal eye+glasses turning
Photo nr X Y Degrees41 65 69 042 60 71 043 53 69 544 49 71 545 87 68 1046 77 70 1047 90 68 1548 79 70 1549 96 66 2050 82 70 20

59
Table B.11: Glint with/without glasses data. Setup: +3.5 Diopters, Horizontal eye only turning
Photo nr X Y Degrees53 53 74 054 46 73 055 54 74 556 47 73 557 60 74 1058 51 73 1059 56 74 1560 47 73 1561 64 75 2062 50 73 20
Table B.12: Glint with/without glasses data. Setup: +3.5 Diopters, Vertical eye+glasses turning
Photo nr X Y Degrees65 76 62 066 72 61 067 79 79 568 73 79 569 79 51 1070 72 52 1071 79 47 1572 72 50 1573 80 45 2074 73 50 2075 81 29 2576 73 38 2577 84 20 3078 73 30 30