eye movement patterns and newspaper design...
TRANSCRIPT

Lund University Cognitive Science 2004 Eye movement patterns and newspaper design factors. An experimental approach Master’s Thesis · Nils Holmberg Supervisor: Kenneth Holmqvist (LU) Co-advisor: Bengt Engwall (NT)
Table of contents
1. Introduction 3 2. Previous research 5 2.1 Newspaper studies 2.2 Integration of text and pictorial content 3. Hypotheses 7 4. Method 8 4.1 Participants 4.2 Apparatus 4.3 Materials 4.4 Procedure 5. Results 12 5.1 Global eye movement data 5.2 Experiment 1: Information graphics 5.3 Experiment 2: Article placement 5.4 Experiment 3: Scan paths 6. Discussion 24
7. References 27
Abstract Readers’ eye movements were recorded as they participated in a newspaper reading experiment. The stimuli consisted of newspaper prototypes that were manipulated systematically according to two experimental conditions: (a) utilization of information graphics in conjunction with article text, and (b) variations of article placement on newspaper spreads. Viewing time of target articles was measured and compared between experimental conditions and control conditions. Readers tended to spend more time viewing articles with information graphics. They also tended to spend more time viewing articles in preferred spatial locations. Order of attention for target articles was also measured and compared between conditions. Readers tended to observe articles with information graphics later than in control conditions; articles with preferred placement was observed earlier than in control conditions. Suggestions about the pictorial properties and cognitive function of information graphics are made. Potential factors determining the spatial structure of scan paths are discussed.
2

1. Introduction Eye movements are an integral part of newspaper reading. During news reading continuous shifts in visual focus are required, and these attentional shifts are accompanied by corresponding changes in gaze position. Overt changes in gaze position can be measured and recorded as eye movements. Eye movements basically consist of saccades and fixations. Saccades are rapid, ballistic relocations of the eye’s pupil, whereas fixations are stable states when visual information is allowed to pass through the pupil and hit the retina (particularly the fovea). With the aid of eye-tracking technology, a graphical representation of the reader’s successive changes in gaze position can be superimposed over an image of the corresponding visual field. The resultant representation of these two layers provides an objective and detailed record of the moment-to-moment unfolding of the reading process. When combined with a behavioural methodology, the eye-tracking approach to newspaper reading puts us in a position to study how changes in the visual layout of newspaper pages affect readers’ eye movement patterns during reading. According to the behavioural paradigm newspaper layout can be regarded as a stimulus, which is taken to elicit eye movement responses in the reader. By isolating and altering various elements in the formal arrangement that constitute a given newspaper layout it is possible to infer (by trial-and-error) what arrangements lead to optimal reading patterns with respect to some predefined editorial goal (e.g. increase the amount of time readers spend on editorial material). In order to yield reliable results this procedure should be encompassed within a fully balanced experimental design. Although eye-tracking research fits nicely within a behavioural paradigm, eye-tracking can also be coupled with a cognitive approach that sets out to investigate relations between eye movements and higher-order cognitive processes such as attention, memory, and attitude. Within the newspaper trade this approach might be interesting when evaluating advertising effectiveness and newspaper content. However, the full impact of the cognitive approach within eye-tracking research probably awaits progress in the brain sciences that could provide better explanatory models of mental phenomena in general. An independent advantage of concentrating on low-level visual cognition (that could be characterized as behaviour) is that these basic aspects of eye movements tend to reflect near-constants of the human visual system. By definition such properties can be generalized over large populations while cognitive aspects of eye movements may be subject to considerable individual variation. Thus, whereas readers’ interest, motivation, and expectations with respect to newspaper content may vary widely between subjects, the responses of the visual system toward the graphic interface tend to be more uniform. This makes newspaper design an interesting area to study experimentally. Newspaper usability with regard to human visual function is a common motivational force behind experimental manipulations of newspaper design. Editorial re-conceptualization and economic considerations centered on advertising effectiveness are also plausible pretexts for experiments on newspaper design. In terms of usability, optimal newspaper design appears to be a compromise between built-in properties of the human visual system and the conventions that constrain the possible manifestations of newspapers considered as a mass medium. When this compromise is made the visual system has an opportunity to adapt to the informational environment of the newspaper, and communication between editors and readers is facilitated on the level of form.
3

In the present study the general motivation has been to determine what impact newspaper design has on reading behaviour. Both newspaper reading and newspaper design are complex phenomena, which need to be analyzed into constituent parts in order to be useful. Starting with newspaper reading, this process could provisionally be analyzed into scanning and reading. Scanning typically consists of short fixations and large saccades, whereas reading is characterized by comparatively small and controlled eye movements. The scanning component in newspaper reading behaviour seems to be more reliant on exogeneous perception than reading. Thus, scan paths could be an interesting correlative of the “cognitive ergonomics of a given newspaper layout” (Hansen, 1994). In order to segment the complex concept of newspaper design, applied editorial units known as design factors have been utilized. Drawing on previous newspaper research, a limited number of design factors qualified as eligible for further investigation. Although lacking precise categorical definitions, the function of these design factors on reading patterns has been a recurrent topic in discussions within the newspaper trade. A cursory list of design factors could be generated with reference to Holmqvist and Wartenberg (forthcoming b).
• article placement • article axiality • picture size • picture content • colour
• fact boxes • drop quotes • information graphics • headline typography • briefs
More specifically, the present study has concentrated on article placement and information graphics. Concerning article placement, we hypothesized that certain positions on a newspaper spread would prove to be more “attractive” in terms of eye movements than other positions. This attractiveness should be reflected by newspaper readers giving earlier attention and proportionately larger amounts of reading time to editorial text placed in these locations. This hypothesis is motivated by findings in earlier newspaper studies which showed that the total amount of reading time over large populations has a tendency to be unequally distributed over the surface area of newspapers. A plausible explanation to such a placement preference or placement heuristic is that long-standing newspaper conventions has conditioned readers to look for desired news at specific locations on the spread. As for information graphics, our hypothesis was that co-occurrence of article text and graphics would enhance readers’ ability to construct mental models of textual content. If the relation between these two modes of information is complementary rather than competitive it would facilitate article comprehension and thus increase the probability of test subjects reading target articles in greater depth. The behavioural index of such a positive correlation between reading interest and information graphics would be greater total fixation times on articles featuring information graphics as compared to conditions in which information graphics were removed. Again, this hypothesis is motivated by similar but inconclusive findings in previous analyses of newspaper reading patterns. Returning to the inventory of design factors, it will be noted that some design factors are local in nature (e.g. information graphics) whereas others are global (e.g. newspaper format, typography). The implication is that local design factors can be
4

applied selectively to an individual article while global design factors tend to affect overall newspaper design. Consequently, contrastive variations of global design factors may involve practical difficulties. Another (gradual) distinction that cuts across the inventory of design factors is whether design factors interact primarily with higher-order cognition or with lower-level reading behaviours. In accordance with this distinction it could be argued that e.g. fact boxes, information graphics, and picture content tend to inform higher-order cognitive processes whereas e.g. article placement and typography probably are a correlative of low-level exogeneous visual perception. Bearing in mind the ad hoc nature of these distinctions, they make up a two dimensional space in which design factors could be plotted. Quantitative psychological testing of design factors is very scarce. Hitherto, only five major studies have been undertaken in which eye-tracking is applied to newspaper reading (Sternvik, 2003). Among the design factors given in the table above only colour has previously been tested under experimental conditions (Garcia and Stark, 1991). In the absence of precise behavioural metrics a qualitative method has often been preferred. Over the last years, however, eye movement measures have proved to yield such a metrics and eye movements during newspaper reading has emerged as an experimental paradigm in which newspaper design can be tested for usability. An opportunity to enrich our understanding of the cognitive and behavioural mechanisms underlying newspaper reading has appeared on account of a recent research cooperation between the LUCS Eye-tracking Laboratory and Norrköpings Tidningar. The assumption behind this cooperation is that design factors can guide and attract readers’ attention. We believe that systematic knowledge of secondary reading abilities associated with newspaper reading has to emerge from quantitative measurement of eye movements combined with a counterbalanced experimental design. Our preliminary study of Norrköpings Tidningar complies with these criteria. The target of the present study is to determine what impact local and global design factors have on newspaper reading behaviour. Indeed, such questions have been articulated earlier, but critical information about this interrelation has been largely inaccessible due to technical and/or methodological reasons. As for technology, this study employs non-invasive head-mounted eye-tracking equipment together with powerful data analysis software. Methodologically, our study investigates design factors in repeated and counterbalanced conditions presented to test subjects as authentic newspaper material. As our study incorporates these features, it manages to meet with experimental criteria as well as with demands on ecological validity. Alongside experimental testing of design factors, this study also utilizes a case study approach in order to describe other aspects of newspaper reading patterns. 2. Previous research 2.1 Newspaper studies Newspaper reading is a great challenge to experimental research on reading behaviour. The difficulty of arriving at predictive theories of newspaper reading is partly due to conditions that are inherent to the communicative situation of newspapers. The fact that newspapers are a clear instance of commercial mass communication, and thus present a wide variety of information in conjunction with advertising makes it probable that any individual reader will experience an information overload in which desired and
5

undesired content has to be differentiated to some extent. In this situation readers seem to acquire a set of secondary reading abilities that typically involve strategies for scanning and integrating text and pictorial information. Ever since eye-tracking technology became available in the late 1960’s, eye movement measures have proved to be an important component in attempts to construe a theory of reading. Understandably, eye-tracking methodology was first applied to what might be called primary reading abilities, which roughly correspond to linguistic decoding of letters ordered linearly into a text. In terms of eye movements, primary reading has become a well-defined process (Rayner, 1978; 1998). Considering the frequent usage of pictures in conjunction with text, surprisingly little is known of how primary reading patterns extend to other areas of reading, e.g. scanning of newspaper content or integrating text and pictorial information. An eye-tracking study conducted by Garcia and Stark (1991) was one of the first inquiries that tried to validate editorial presumptions against eye movement data. A robust finding of their study was that pictures attract very early attention in the reader and that colour has a relatively small impact on overall reading patterns. Notably, Garcia and Stark did not address the question of interaction between text and picture content. Another major insight emerging from Garcia and Stark’s study was that readers skipped a large proportion of editorial text and that scanning was a predominant acquisition strategy in the context of newspaper reading. This insight caused them to hypothesize that readers’ cognitive system utilize certain visual cues when scanning a newspaper page and that the amount of scanning is correlated to the visuo-spatial saliency and structure of these cues. A good newspaper layout should convey a hierarchical sequence of entry points that enable readers to stop scanning and start reading. In our terminology visual cues generally translate into design factors. Previous research indicate that design factors such as newspaper format, headline typography, and advertisement size could be utilized so as to approximate a match between the mechanisms of human visual perception and overall newspaper design. More recently Holmqvist et al. (Holmqvist et al., 2003; Holmqvist and Wartenberg, forthcoming) has elaborated on the research initiated by Garcia and Stark, and has replicated some of their findings in the context of Scandinavian newspaper reading (SND/S). By using efficient analysis software (SMI iView) that allows eye movement data to be filtered through areas of interest (AOI), Holmqvist et al. have been able to provide a more precise account of the interrelation between eye movements and newspaper design. Our eye-tracking analysis software also puts us in a position to address the prevailing question of scan paths, i.e. whether news pages are scanned according to some inter-subject or intra-subject habituated order. Barthelson (2002) has extended this research into the domain of electronic news sites on the Internet. Lundqvist and Holmqvist (2001) found that an increase in advertisement size had a positive effect on how readers recognized and evaluated newspaper advertisements. 2.2 Integration of text and pictorial content Even if pictures may serve as possible entry points into editorial text (Garcia and Stark, 1991), evidence from relevant eye-tracking research strongly suggest that text and pictures tend to be processed separately. As a consequence significant interaction between these two modes of information usually fail to occur. This segregation probably reflects that acquisition of text and pictorial information operates on radically different time scales. According to a rough model of the temporal unfolding of reading, pictures
6

could be decoded during an early processing phase (150–600 ms) while semantic processing of text occurs at a later stage (Radach et al., 2003). Processing mechanism Time period Initial selection • peripheral saliency
• automated scanpath • visual search
• pre fixation: extrafoveal • processing concurrently with other information
Early processing • skimming over text • fast picture scanning
• first few fixations, 150 ms to 600 ms
Late processing • reading of text and scanning of picture detail • semantic processing
• 600 ms up to several seconds
Studies on print advertisements show that test subjects go for the text first in text-picture hybrid scenes, but that subjects would return to inspect picture details after reading the text if they received some kind of instruction (Rayner et al., 2001), or if the pragmatic relation between text and picture was implicit rather than straight forward (Radach et al., 2003). Interestingly, retention of ads was significantly better in conditions where subjects performed re-inspection of picture detail. In conclusion, evidence suggests that pictures have positive effects on how readers build mental models of textual content if subjects manage to exploit both channels of information (Hyönä et al., 1999). However, integration of text and pictorial information does not tend to be overly utilized by readers. A probable explanation is that repeated gaze alteration and processing synchronization between text and graphics are taxing on cognitive resources (in particular short term memory). Consequently, there are good reasons why newspaper editors would want to facilitate integration of text and pictorial content by means of design factors, e.g. information graphics in body text or implicit pragmatics between text and pictures. Such design factors could be tested and evaluated inductively through eye-tracking experiments. 3. Hypotheses In previous case studies on newspaper reading behaviour, Holmqvist and Wartenberg (forthcoming b) have found evidence that information graphics has a strong but poorly understood effect on reading patterns. When information graphics is presented in conjunction with article text, viewing time of the article as a whole is increased considerably. Unlike other pictures, information graphics seems to be deeply involved in the processing of textual content. The first hypothesis in the present study is intended to verify the positive correlation between information graphics and viewing time under experimental conditions. The second hypothesis also concerns information graphics, but on a different level of processing. This hypothesis is based on long-standing evidence that pictures attract early attention, and it states that information graphics will conform to this general pattern and elicit early attention in newspaper readers. Holmqvist and Wartenberg (forthcoming b) found evidence that suggested that information graphics deviated from other kinds of pictures by failing to attract readers’ early attention. The second hypothesis is intended to verify the relationship between information graphics and attention.
7

It is often asserted that article placement is not a neutral factor. On this view, articles placed in some areas of the newspaper spread are more likely to be observed and read. The second pair of hypotheses is intended to substantiate the intuition that some locations on the spread are more “favourable” or “attractive” than other locations. This issue has been investigated by Holmqvist and Wartenberg (forthcoming b), and their findings indicate that article placement does not affect the amount of viewing time spent on target articles. The third hypothesis in the present study is intended to clarify the function of article placement by stating that placement will affect the amount of viewing time spent on articles. This hypothesis runs counter to Holmqvist and Wartenberg’s findings. The forth hypothesis is in consonance with Holmqvist and Wartenberg’s research. It is a corollary of the third hypothesis, and it states that articles with favourable placement will receive earlier attention than articles in less favourable locations. H1: Articles featuring information graphics will elicit longer viewing time as compared to articles without information graphics. H2: Articles featuring information graphics will elicit earlier attention as compared to articles without information graphics. H3: Articles placed in favourable locations will elicit longer viewing time as compared to articles with unfavourable placement. H4: Articles placed in favourable locations will elicit earlier attention as compared to articles with unfavourable placement. 4. Method 4.1 Participants Twelve test subjects with normal or corrected-to-normal vision participated in the experiment on a voluntary basis. Test subjects were mainly recruited from the Lund University community and consisted of two women and ten men. Participants were aged 21–56 years (with an average age of 30 years). All participants stated no prior access to Norrköpings Tidningar during the week preceding the experiment. One test subject had participated in an eye-tracking experiment earlier but stated no prior knowledge as to the objectives of this particular experiment. 4.2 Apparatus Eye movements were recorded with an iView head-mounted eye-tracker from SensoMotoric Instruments (SMI). Although viewing was binocular, only movements of the right (dominant) eye were monitored. Infrared corneal reflex (940 nm) video-based technology was used by the system to keep track of pupil relocations. A Polhemus head-tracker was used in an electromagnetic virtual reality model to compensate for head movements. The system calculated true gaze position as relative to the reading area by means of a vector analysis, which combined the vectors of eye movements and head movements. Eye positions were sampled at 50 Hz. As output, the system generated two kinds of data: MPEG video and eye movement coordinates.
8
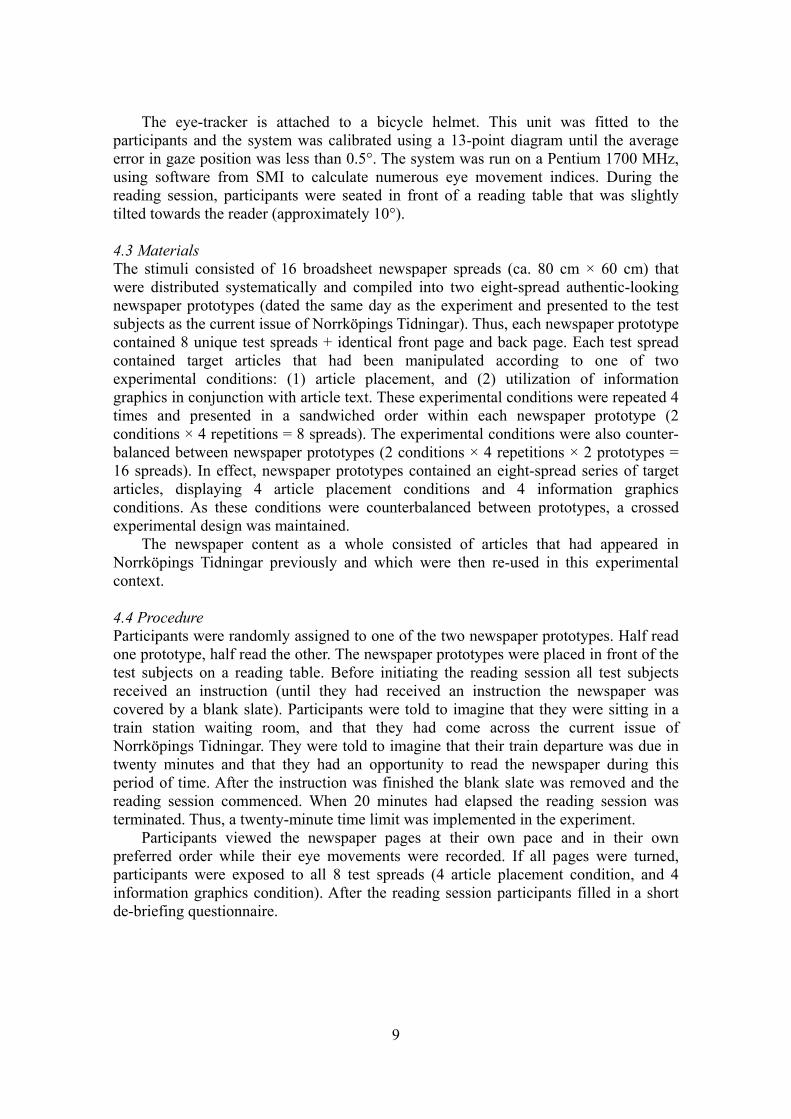
The eye-tracker is attached to a bicycle helmet. This unit was fitted to the participants and the system was calibrated using a 13-point diagram until the average error in gaze position was less than 0.5°. The system was run on a Pentium 1700 MHz, using software from SMI to calculate numerous eye movement indices. During the reading session, participants were seated in front of a reading table that was slightly tilted towards the reader (approximately 10°). 4.3 Materials The stimuli consisted of 16 broadsheet newspaper spreads (ca. 80 cm × 60 cm) that were distributed systematically and compiled into two eight-spread authentic-looking newspaper prototypes (dated the same day as the experiment and presented to the test subjects as the current issue of Norrköpings Tidningar). Thus, each newspaper prototype contained 8 unique test spreads + identical front page and back page. Each test spread contained target articles that had been manipulated according to one of two experimental conditions: (1) article placement, and (2) utilization of information graphics in conjunction with article text. These experimental conditions were repeated 4 times and presented in a sandwiched order within each newspaper prototype (2 conditions × 4 repetitions = 8 spreads). The experimental conditions were also counter-balanced between newspaper prototypes (2 conditions × 4 repetitions × 2 prototypes = 16 spreads). In effect, newspaper prototypes contained an eight-spread series of target articles, displaying 4 article placement conditions and 4 information graphics conditions. As these conditions were counterbalanced between prototypes, a crossed experimental design was maintained. The newspaper content as a whole consisted of articles that had appeared in Norrköpings Tidningar previously and which were then re-used in this experimental context. 4.4 Procedure Participants were randomly assigned to one of the two newspaper prototypes. Half read one prototype, half read the other. The newspaper prototypes were placed in front of the test subjects on a reading table. Before initiating the reading session all test subjects received an instruction (until they had received an instruction the newspaper was covered by a blank slate). Participants were told to imagine that they were sitting in a train station waiting room, and that they had come across the current issue of Norrköpings Tidningar. They were told to imagine that their train departure was due in twenty minutes and that they had an opportunity to read the newspaper during this period of time. After the instruction was finished the blank slate was removed and the reading session commenced. When 20 minutes had elapsed the reading session was terminated. Thus, a twenty-minute time limit was implemented in the experiment. Participants viewed the newspaper pages at their own pace and in their own preferred order while their eye movements were recorded. If all pages were turned, participants were exposed to all 8 test spreads (4 article placement condition, and 4 information graphics condition). After the reading session participants filled in a short de-briefing questionnaire.
9

Figure 1 Representative viewing patterns superimposed on newspaper spreads in the information graphics experiment. Panel A shows viewing patterns elicited by an article in the text-and-graphics condition, and Panel B shows viewing patterns elicited by an article in the counterbalanced text-only condition. Rectangles around target articles represent areas of interest (AOI). Viewing time spent within an AOI (target articles) can be computed as proportional to spread viewing time.
10

Figure 2 Representative viewing patterns superimposed on newspaper spreads in the article placement experiment. Articles in the favourable placement condition are presented on the left page, and articles in the unfavourable placement condition are presented on the right page. The configuration of article placement and article content is counterbalanced between Panel A and Panel B. Rectangles around target articles represent areas of interest (AOI).
11
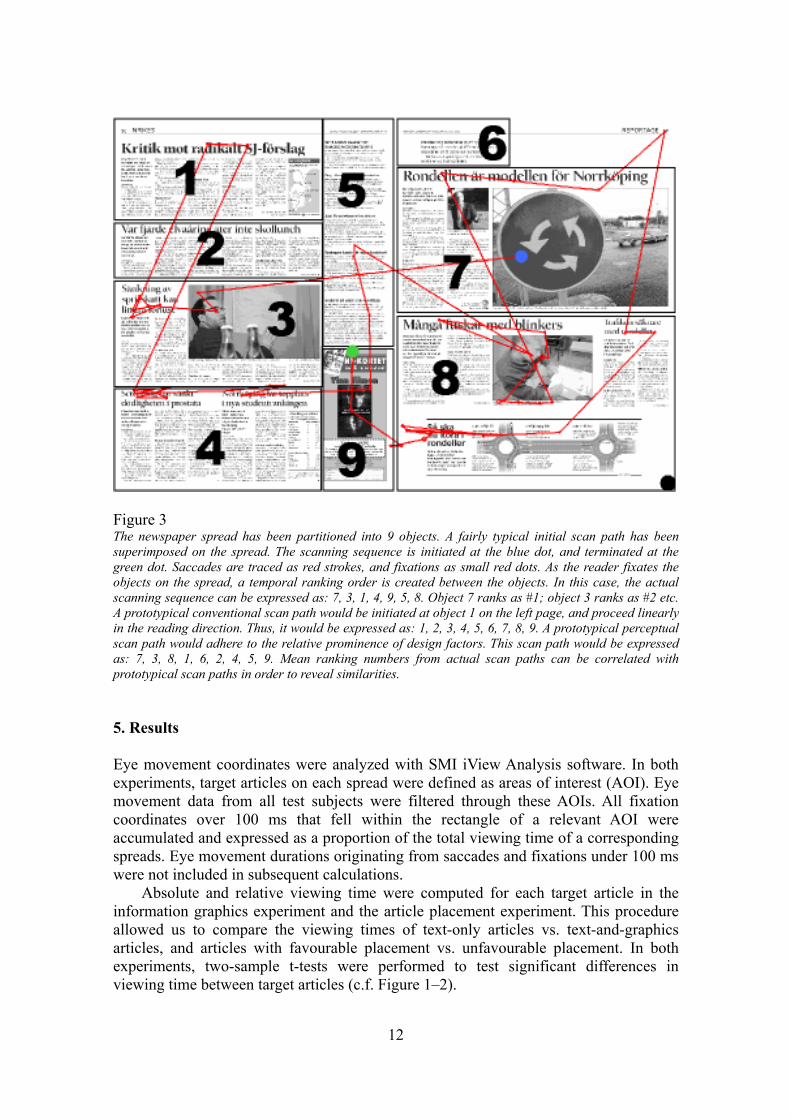
Figure 3 The newspaper spread has been partitioned into 9 objects. A fairly typical initial scan path has been superimposed on the spread. The scanning sequence is initiated at the blue dot, and terminated at the green dot. Saccades are traced as red strokes, and fixations as small red dots. As the reader fixates the objects on the spread, a temporal ranking order is created between the objects. In this case, the actual scanning sequence can be expressed as: 7, 3, 1, 4, 9, 5, 8. Object 7 ranks as #1; object 3 ranks as #2 etc. A prototypical conventional scan path would be initiated at object 1 on the left page, and proceed linearly in the reading direction. Thus, it would be expressed as: 1, 2, 3, 4, 5, 6, 7, 8, 9. A prototypical perceptual scan path would adhere to the relative prominence of design factors. This scan path would be expressed as: 7, 3, 8, 1, 6, 2, 4, 5, 9. Mean ranking numbers from actual scan paths can be correlated with prototypical scan paths in order to reveal similarities. 5. Results Eye movement coordinates were analyzed with SMI iView Analysis software. In both experiments, target articles on each spread were defined as areas of interest (AOI). Eye movement data from all test subjects were filtered through these AOIs. All fixation coordinates over 100 ms that fell within the rectangle of a relevant AOI were accumulated and expressed as a proportion of the total viewing time of a corresponding spreads. Eye movement durations originating from saccades and fixations under 100 ms were not included in subsequent calculations. Absolute and relative viewing time were computed for each target article in the information graphics experiment and the article placement experiment. This procedure allowed us to compare the viewing times of text-only articles vs. text-and-graphics articles, and articles with favourable placement vs. unfavourable placement. In both experiments, two-sample t-tests were performed to test significant differences in viewing time between target articles (c.f. Figure 1–2).
12
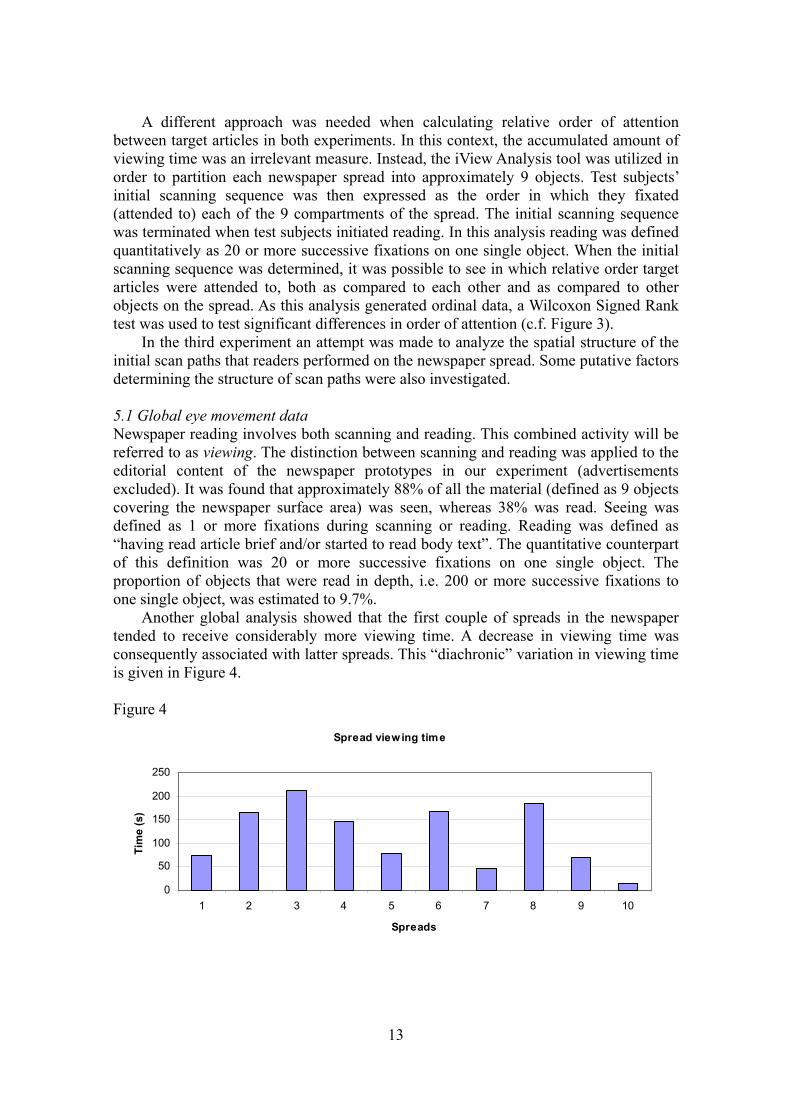
A different approach was needed when calculating relative order of attention between target articles in both experiments. In this context, the accumulated amount of viewing time was an irrelevant measure. Instead, the iView Analysis tool was utilized in order to partition each newspaper spread into approximately 9 objects. Test subjects’ initial scanning sequence was then expressed as the order in which they fixated (attended to) each of the 9 compartments of the spread. The initial scanning sequence was terminated when test subjects initiated reading. In this analysis reading was defined quantitatively as 20 or more successive fixations on one single object. When the initial scanning sequence was determined, it was possible to see in which relative order target articles were attended to, both as compared to each other and as compared to other objects on the spread. As this analysis generated ordinal data, a Wilcoxon Signed Rank test was used to test significant differences in order of attention (c.f. Figure 3). In the third experiment an attempt was made to analyze the spatial structure of the initial scan paths that readers performed on the newspaper spread. Some putative factors determining the structure of scan paths were also investigated. 5.1 Global eye movement data Newspaper reading involves both scanning and reading. This combined activity will be referred to as viewing. The distinction between scanning and reading was applied to the editorial content of the newspaper prototypes in our experiment (advertisements excluded). It was found that approximately 88% of all the material (defined as 9 objects covering the newspaper surface area) was seen, whereas 38% was read. Seeing was defined as 1 or more fixations during scanning or reading. Reading was defined as “having read article brief and/or started to read body text”. The quantitative counterpart of this definition was 20 or more successive fixations on one single object. The proportion of objects that were read in depth, i.e. 200 or more successive fixations to one single object, was estimated to 9.7%. Another global analysis showed that the first couple of spreads in the newspaper tended to receive considerably more viewing time. A decrease in viewing time was consequently associated with latter spreads. This “diachronic” variation in viewing time is given in Figure 4. Figure 4
Spread viewing time
0
50
100
150
200
250
1 2 3 4 5 6 7 8 9 10
Spreads
Tim
e (s
)
13
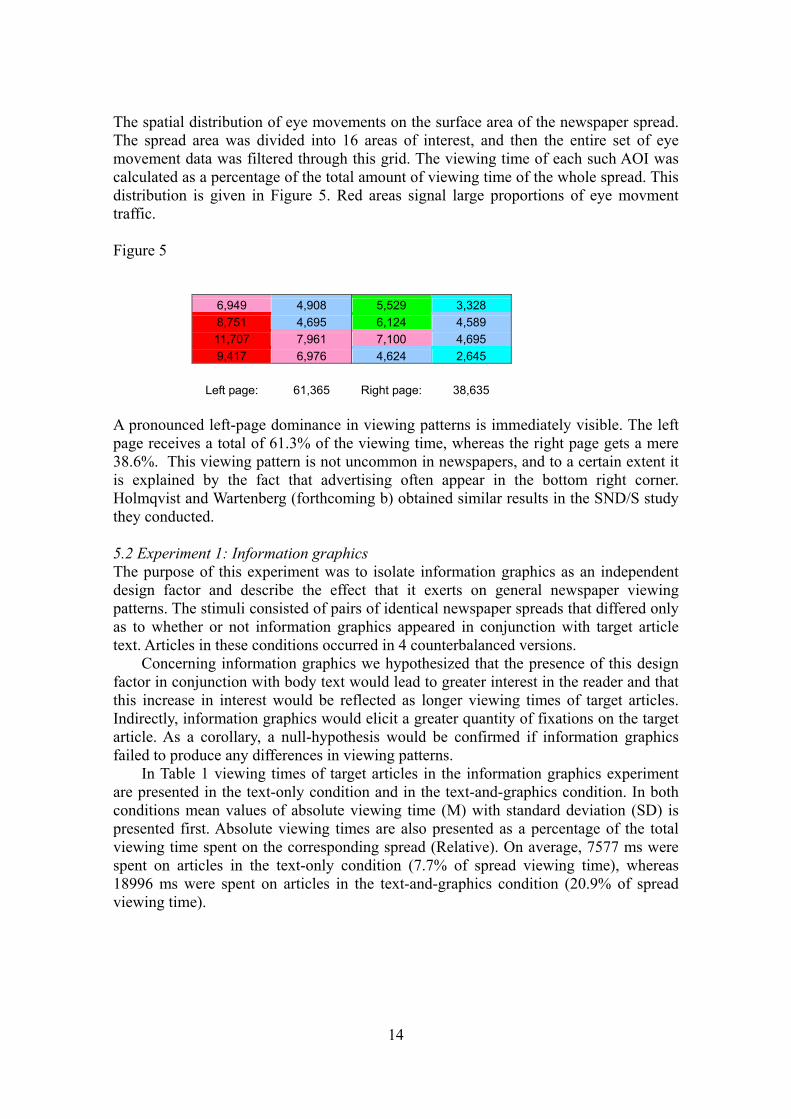
The spatial distribution of eye movements on the surface area of the newspaper spread. The spread area was divided into 16 areas of interest, and then the entire set of eye movement data was filtered through this grid. The viewing time of each such AOI was calculated as a percentage of the total amount of viewing time of the whole spread. This distribution is given in Figure 5. Red areas signal large proportions of eye movment traffic. Figure 5 6,949 4,908 5,529 3,328 8,751 4,695 6,124 4,589 11,707 7,961 7,100 4,695 9,417 6,976 4,624 2,645 Left page: 61,365 Right page: 38,635 A pronounced left-page dominance in viewing patterns is immediately visible. The left page receives a total of 61.3% of the viewing time, whereas the right page gets a mere 38.6%. This viewing pattern is not uncommon in newspapers, and to a certain extent it is explained by the fact that advertising often appear in the bottom right corner. Holmqvist and Wartenberg (forthcoming b) obtained similar results in the SND/S study they conducted. 5.2 Experiment 1: Information graphics The purpose of this experiment was to isolate information graphics as an independent design factor and describe the effect that it exerts on general newspaper viewing patterns. The stimuli consisted of pairs of identical newspaper spreads that differed only as to whether or not information graphics appeared in conjunction with target article text. Articles in these conditions occurred in 4 counterbalanced versions. Concerning information graphics we hypothesized that the presence of this design factor in conjunction with body text would lead to greater interest in the reader and that this increase in interest would be reflected as longer viewing times of target articles. Indirectly, information graphics would elicit a greater quantity of fixations on the target article. As a corollary, a null-hypothesis would be confirmed if information graphics failed to produce any differences in viewing patterns. In Table 1 viewing times of target articles in the information graphics experiment are presented in the text-only condition and in the text-and-graphics condition. In both conditions mean values of absolute viewing time (M) with standard deviation (SD) is presented first. Absolute viewing times are also presented as a percentage of the total viewing time spent on the corresponding spread (Relative). On average, 7577 ms were spent on articles in the text-only condition (7.7% of spread viewing time), whereas 18996 ms were spent on articles in the text-and-graphics condition (20.9% of spread viewing time).
14

Table 1 Absolute and relative viewing times spent on articles in information graphics conditions. Absolute viewing times are in milliseconds and relative viewing times are given as a percentage of spread viewing time.
Text only Text and graphics M SD Relative M SD Relative
1 13658 18388 8.7% 19297 33801 12.1% 2 13619 21320 18.4% 4784 2564 9.1% 3 632 534 2.7% 34879 33171 56.8% 4 1837 2699 3.2% 19076 37374 22.0%
M 7577 7.7% 18996 20.9% Generalizing over all instances of information graphics (1–4), a two-sample equal variance t-test showed that information graphics elicit significantly longer relative viewing times for target articles (p<0.01). This is also true of absolute viewing times, although this measure yields a lower level of significance (p<0.05). When treated separately, each individual instance of information graphics does not replicate the general pattern. In three of four cases (1, 3, 4) a higher percentage of viewing time is spent on articles with information graphics, but only in one case (3) is this effect significant (p<0.001). In one case (2) the general viewing pattern is reversed, but not significantly so (p=0.204). Separate analyses of cases 1 and 4 (p=0.109) suggest a non-significant positive trend exerted by information graphics on viewing patterns. A complication in this analysis is that articles featuring information graphics necessarily occupies a larger surface area than the same article in the counterbalanced version, i.e. text without information graphics (c.f. Figure 1). Consequently, it had to be determined if the positive effect of information graphics on viewing patterns (fixation times) was caused by the trivial fact that information graphics in combination with body text constituted a larger spatial element than body text only. This scenario would undermine any hypothesis about an intrinsic relation of mutual reinforcement (a tandem effect) between body text and information graphics. Previous research findings indicate that spatial size in itself is a powerful factor in graphical design (Lundqvist and Holmqvist, 2001). In order to exclude differences in size as the main cause for the association between information graphics and an increase in viewing durations, a secondary analysis was performed on our data. This analysis was supposed to compensate for differences in size between corresponding articles with and without information graphics. To this end, viewing times were calculated as relative to object area. Articles containing information graphics were measured along with articles in the counterbalanced text-only versions. The respective areas of these objects were calculated in terms of screen pixels. On average, the area of text-only articles was about 65% of the area of text-and-graphics articles. This difference made it reasonable to believe that the amount of time spent on articles in the text-and-graphics condition was exaggerated because of larger surface area. Finally, viewing times were computed in terms of milliseconds per pixel. The result of this proportional analysis is given in Table 2. As comparative figures, absolute viewing times are provided in this analysis also.
15

Mean values (M) and standard deviation (SD) are given of absolute viewing times. Relative viewing times are given as milliseconds per pixel. Table 2 Absolute and relative viewing times spent on articles in information graphics conditions. Absolute viewing times are in milliseconds and relative viewing times are given as milliseconds per pixel.
Text only Text and graphics M SD Relative M SD Relative
1 13658 18388 0.4934 19297 33801 0.3706 2 13619 21320 0.2614 4784 2564 0.0726 3 632 534 0.0171 34879 33171 0.6112 4 1837 2699 0.0255 19076 37374 0.2131
M 7577 0.2127 18996 0.3155 This analysis shows considerable difference in fixation density between conditions in the information graphics experiment. The results conform to the previous analysis as it reveals that text-and-graphics articles (0.3155 ms/pixel) are read to a greater extent than text-only articles (0.2127 ms/pixel). The viewing density values provided by this analysis are compatible with previous calculations of the same measure. In a study concerning looking times toward print advertisements, Rayner et al. (2001) established this measure in the range between 0.112 and 0.020 ms/pixel. The fact that our figures are slightly higher probably reflects that printed newspaper material has a higher inherent informational density than full-page advertisements studied by Rayner et al. When comparing viewing times as relative to article area, the general positive effect on viewing times previously associated with information graphics failed to reach significance (p=0.190). However, a non-significant positive trend was maintained. Looking into each instance of information graphics separately, a significant positive effect occurs only in case 3 (p<0.01). Since the two proportional analyses on relative viewing times of information graphics articles yielded similar but not completely converging results, a closer examination of the interaction between text and graphics in articles featuring these two modes of information was performed. The specific distributional pattern of viewing time over these two elements would indicate how the previous results should be interpreted and evaluated. Articles containing information graphics were divided into two constituent parts (text and graphics), and the individual areas of these constituent parts were calculated in terms of pixels. On average, the graphics portion of the article was approximately 59% of the size of the text portion. Absolute viewing times were then computed separately for each of these areas. Finally, relative viewing times for text regions and graphics regions respectively were computed, both as viewing time per unit area, and as a percentage of total viewing time spent on the relevant spreads. The results of the latter analysis are given in Table 3. As in previous analyses, mean values (M) and standard deviation (SD) are given of absolute viewing times. Absolute viewing times are also presented as a percentage of spread viewing time (Relative).
16
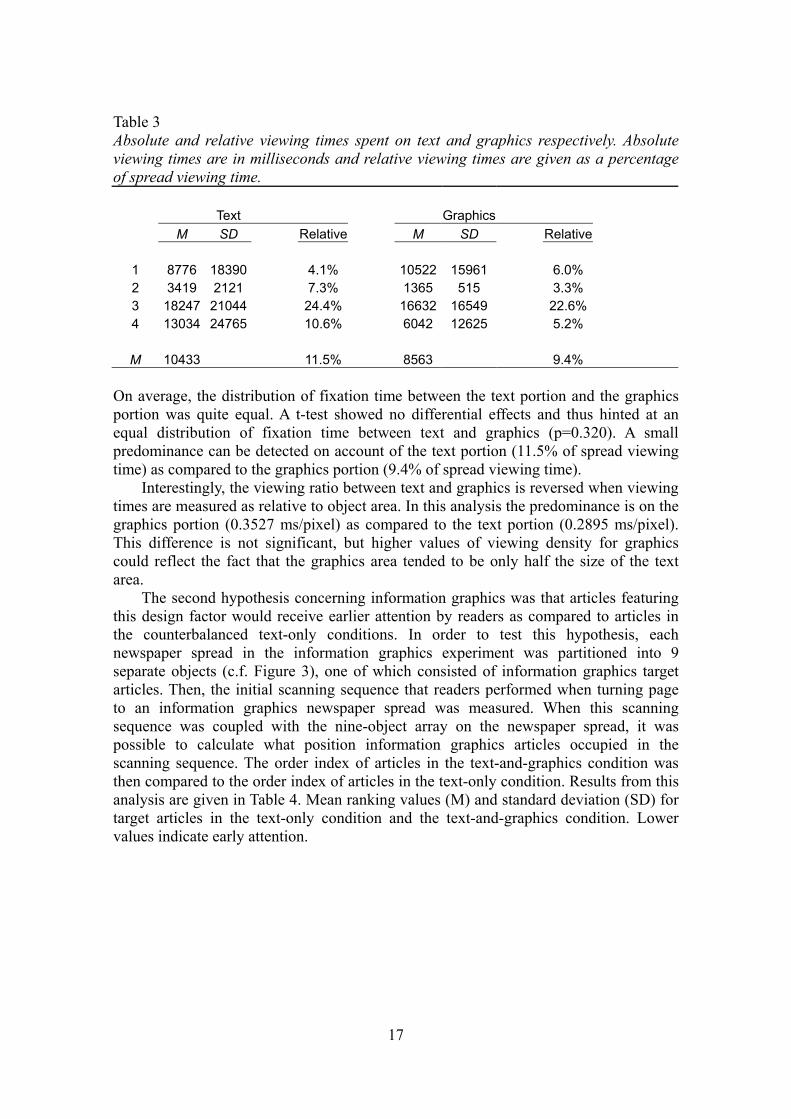
Table 3 Absolute and relative viewing times spent on text and graphics respectively. Absolute viewing times are in milliseconds and relative viewing times are given as a percentage of spread viewing time.
Text Graphics M SD Relative M SD Relative
1 8776 18390 4.1% 10522 15961 6.0% 2 3419 2121 7.3% 1365 515 3.3% 3 18247 21044 24.4% 16632 16549 22.6% 4 13034 24765 10.6% 6042 12625 5.2%
M 10433 11.5% 8563 9.4% On average, the distribution of fixation time between the text portion and the graphics portion was quite equal. A t-test showed no differential effects and thus hinted at an equal distribution of fixation time between text and graphics (p=0.320). A small predominance can be detected on account of the text portion (11.5% of spread viewing time) as compared to the graphics portion (9.4% of spread viewing time). Interestingly, the viewing ratio between text and graphics is reversed when viewing times are measured as relative to object area. In this analysis the predominance is on the graphics portion (0.3527 ms/pixel) as compared to the text portion (0.2895 ms/pixel). This difference is not significant, but higher values of viewing density for graphics could reflect the fact that the graphics area tended to be only half the size of the text area. The second hypothesis concerning information graphics was that articles featuring this design factor would receive earlier attention by readers as compared to articles in the counterbalanced text-only conditions. In order to test this hypothesis, each newspaper spread in the information graphics experiment was partitioned into 9 separate objects (c.f. Figure 3), one of which consisted of information graphics target articles. Then, the initial scanning sequence that readers performed when turning page to an information graphics newspaper spread was measured. When this scanning sequence was coupled with the nine-object array on the newspaper spread, it was possible to calculate what position information graphics articles occupied in the scanning sequence. The order index of articles in the text-and-graphics condition was then compared to the order index of articles in the text-only condition. Results from this analysis are given in Table 4. Mean ranking values (M) and standard deviation (SD) for target articles in the text-only condition and the text-and-graphics condition. Lower values indicate early attention.
17

Table 4 Mean position in scanning sequence for articles in information graphics conditions.
Text only Text and graphics M SD M SD
1 9.7 3.3 11.0 0.0 2 4.8 3.2 7.0 4.2 3 3.6 3.6 5.8 3.8 4 7.8 3.7 10.0 0.0
M 6.6 8.2 As is evident from the mean values, our hypothesis concerning early attention of information graphics articles was not supported. Rather counter-intuitively, it turned out that text-only articles were fixated earlier (6.6) than counterbalanced text-and-graphics articles (8.2) on a scale from 1–10. A Wilcoxon Signed Rank test showed that this difference in scanning sequence was non-significant (p=0.171). Thus, although actual viewing patterns in this analysis run contrary to our second hypothesis concerning information graphics, this pattern did not reach significance. As a consequence, null-hypothesis stating no significant difference in scanning order in the information graphics condition was supported in this experiment. 5.3 Experiment 2: Article placement In the article placement experiment we sought to determine if general newspaper viewing patterns are biased in the sense that editorial material is read to a greater extent if placed in certain favourable spatial locations on the newspaper spread. Conversely, we wondered if unfavourable article placement elicited less viewing times for these articles. Spatial location on a spread was defined as favourable or unfavourable on the basis of previous newspaper research that has found evidence of left-hand page predominance in terms of accumulated viewing time as compared to the right-hand page. According to this evidence, left-hand placement in general would be favourable. However, as these findings build on low-resolution statistical analyses of large amounts of eye movement data, we designed this experiment so as to provide a more detailed picture of how article placement operates as a design factor. Our specific hypotheses concerning article placement was that favourable placement would (a) elicit longer viewing times (total fixation duration), and (b) elicit earlier attention in readers as they initiated a scanning sequence of relevant newspaper spreads. A null-hypothesis would be confirmed if none of these predictions were evidenced in viewing patterns. The stimuli in this condition consisted of pairs of identical newspaper spreads. In one spread a certain article would appear at a favourably biased spatial location and another article would appear at an unfavourable position. In the second spread, this layout would be counterbalanced so that the unfavourable article appeared at the favourable location and vice versa (c.f. Figure 2). The article placement experiment was designed in 4 separate counterbalanced versions. Version 1 tested viewing bias in vertical placement; version 2 tested medial placement; version 3 tested horizontal placement, and version 4 tested diagonal placement.
18

In Table 5 viewing times of articles in the placement experiment are presented in the favourable condition and in the unfavourable condition. For both conditions, mean values of absolute viewing time (M) and standard deviation (SD) are presented in the first columns. Absolute viewing times are also presented as a percentage of the total viewing times of corresponding spreads (Relative). On average, 11415 ms were spent on articles in the unfavourable condition (6.1% of spread viewing time), whereas 14994 ms were spent on articles in the favourable condition (10.2% of spread viewing time). Table 5 Absolute and relative viewing times spent on articles in the placement conditions. Absolute viewing times are in milliseconds and relative viewing times are given as a percentage of spread viewing time.
Unfavourable placement Favourable placement M SD Relative M SD Relative
1 17631 29831 8.2% 9702 19039 5.8% 2 4357 7145 3.3% 7810 13324 7.4% 3 15243 25957 8.6% 33391 39447 22.4% 4 9221 16056 4.4% 8762 13537 4.8%
M 11415 6.1% 14994 10.2% Generalizing over all instances of article placement (1–4), a two-sample equal variance t-test showed that favourable placement elicit significantly longer relative viewing times for target articles (p<0.05). When treated separately, three of four cases (2, 3, 4) show a higher percentage of viewing for articles placed at favourable positions, although this increase in viewing time fails to reach significance, except in case 3 (p<0.05). In one individual case (1) the general pattern is reversed, but not significantly so (p=0.243). Thus, in the article placement experiment a similar picture to that of information graphics emerges. At a general level, favourable article placement elicit significantly longer viewing time of target articles, but at an individual level, only one instance of favourable article placement replicates this viewing pattern to a significant extent; in the other cases a non-significant positive trend prevails. Unlike the information graphics experiment, the article placement experiment does not call for a secondary analysis to counter differences in size between target objects. In the placement experiment articles were almost equal in size, and consequently no proportional analysis was necessary to avoid skewing effects. The second hypothesis concerning article placement stated that articles placed at favourable locations would elicit earlier attention in the reader as compared to articles located at unfavourable locations. Collapsing all instances of the placement experiment into one general Wilcoxon Signed Rank computation of order preference predictably yielded a strong significant effect in favour of articles located in the biased left-hand page of the newspaper spread (p<0.0001). In order to achieve a more fine-grained analysis of how article placement is reflected in readers’ initial scanning sequence of a target spread, each instance of the article placement condition was also treated separately. Results from this analysis are given in Table 6. Mean ranking value (M) and
19
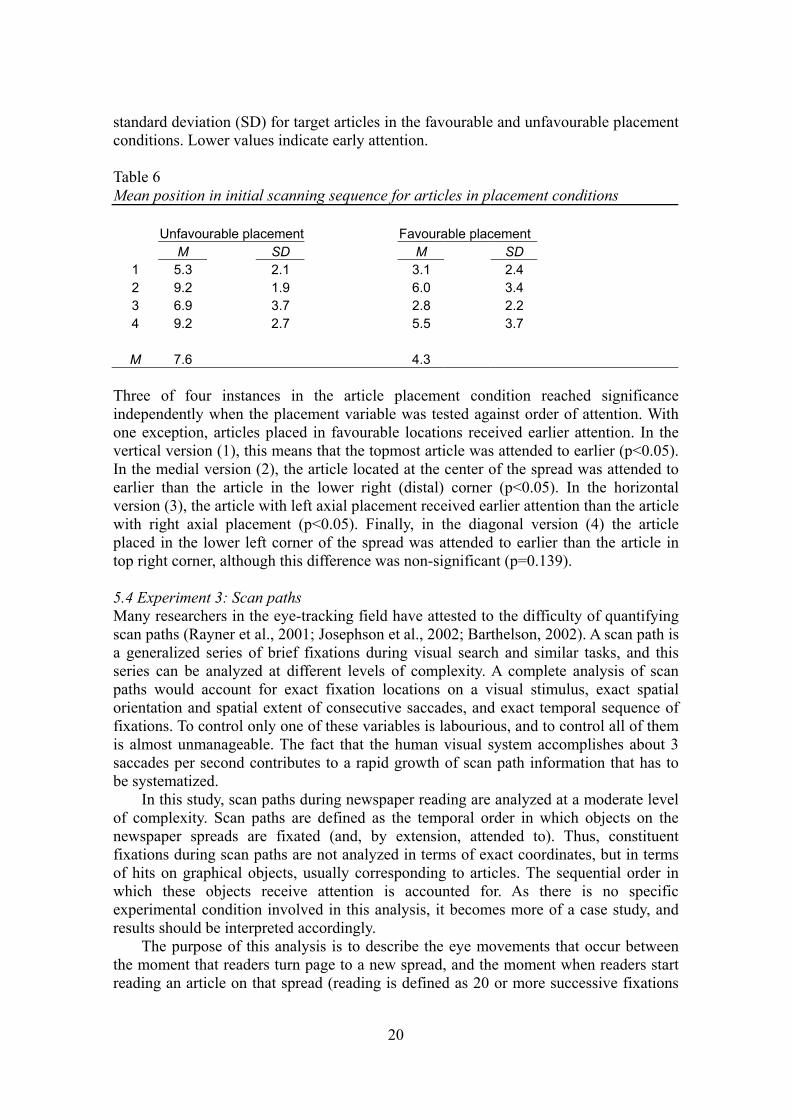
standard deviation (SD) for target articles in the favourable and unfavourable placement conditions. Lower values indicate early attention. Table 6 Mean position in initial scanning sequence for articles in placement conditions
Unfavourable placement Favourable placement M SD M SD
1 5.3 2.1 3.1 2.4 2 9.2 1.9 6.0 3.4 3 6.9 3.7 2.8 2.2 4 9.2 2.7 5.5 3.7
M 7.6 4.3 Three of four instances in the article placement condition reached significance independently when the placement variable was tested against order of attention. With one exception, articles placed in favourable locations received earlier attention. In the vertical version (1), this means that the topmost article was attended to earlier (p<0.05). In the medial version (2), the article located at the center of the spread was attended to earlier than the article in the lower right (distal) corner (p<0.05). In the horizontal version (3), the article with left axial placement received earlier attention than the article with right axial placement (p<0.05). Finally, in the diagonal version (4) the article placed in the lower left corner of the spread was attended to earlier than the article in top right corner, although this difference was non-significant (p=0.139). 5.4 Experiment 3: Scan paths Many researchers in the eye-tracking field have attested to the difficulty of quantifying scan paths (Rayner et al., 2001; Josephson et al., 2002; Barthelson, 2002). A scan path is a generalized series of brief fixations during visual search and similar tasks, and this series can be analyzed at different levels of complexity. A complete analysis of scan paths would account for exact fixation locations on a visual stimulus, exact spatial orientation and spatial extent of consecutive saccades, and exact temporal sequence of fixations. To control only one of these variables is labourious, and to control all of them is almost unmanageable. The fact that the human visual system accomplishes about 3 saccades per second contributes to a rapid growth of scan path information that has to be systematized. In this study, scan paths during newspaper reading are analyzed at a moderate level of complexity. Scan paths are defined as the temporal order in which objects on the newspaper spreads are fixated (and, by extension, attended to). Thus, constituent fixations during scan paths are not analyzed in terms of exact coordinates, but in terms of hits on graphical objects, usually corresponding to articles. The sequential order in which these objects receive attention is accounted for. As there is no specific experimental condition involved in this analysis, it becomes more of a case study, and results should be interpreted accordingly. The purpose of this analysis is to describe the eye movements that occur between the moment that readers turn page to a new spread, and the moment when readers start reading an article on that spread (reading is defined as 20 or more successive fixations
20
to one single object). It is reasonable to believe that this initial scanning sequence is critical when readers orient themselves on the newspaper spread and decides where to start reading. It is also probable that readers rely extensively on graphical entry points such as pictures, headlines, and drop quotes during this initial phase in the reading process. As a preliminary measure, the temporal duration of initial scan paths was measured and calculated over all participants. On average, this scanning sequence lasted during 11.2 seconds. When compared to the average amount of viewing time that readers spent on each spread (115 sec), it appears that the initial scanning sequence occupies about 10% of average spread viewing time. During the initial scanning sequence, readers attended to about 51% of the objects on the spread. A precondition of the scan path analysis was that every newspaper spread was partitioned into a roughly equal number of objects (7–9). This operation was performed in the iView Analysis tool, in which all objects were defined as areas of interest. There was no one-to-one correspondence between articles and AOIs. Instead, one AOI could include several articles, and conversely, an AOI could be defined by a graphical element smaller than an article (c.f. Figure 3). When scan paths from individual readers were superimposed on this array of objects, it was possible to determine on which object the scan path was initiated, and the order in which subsequent objects were fixated. Thus, in this analysis a scan path is equal to temporal ranking order between objects on a newspaper spread. When considering the general structure of newspaper scan paths, a logical point of departure is to begin by inquiring about the starting point of these scan paths in relation to the surface area of the spread. Thus, in the first spatial analysis on scan paths, it was investigated whether readers’ first fixation landed on the left or right page of the spread. This analysis necessarily induced a binominal distribution of the scan path data. Scan paths that were initiated by a fixation on the left page were simply marked “1”, whereas fixations on right page were marked “0”. Subsequently, a chi-square test was applied in order to determine if the frequency of left-initiated scan paths was significantly different from that of right-initiated scan paths. With reference to previous newspaper research, it was expected that a significant right-page predominance would emerge (Holmqvist and Wartenberg, forthcoming b; Hansen, 1994; Garcia and Stark, 1991). However, it turned out that scan paths were initiated equally often on the right page as on the left page, and the difference was non-significant (p=1). This result is surprising since a stable finding in earlier newspaper studies has indicated a definite right-side predominance. It has been suggested that the manual movement with which pages are turned subjects scan paths to a physiological constraint that necessitates initial right page fixations. Results derived from the present data do not support this lateral bias in initial scanning sequences. Having established no significant differences in left-right distribution of initial fixations in scan paths, the unit of analysis was extended from first fixations to include all fixations in initial scan paths. In this analysis, it was queried whether a difference in left-right distribution could be detected over the whole initial scanning sequence. Since each scan path consisted of the temporal rank order in which objects on the corresponding spread had been fixated, it was easy to partition each scan path on a left-right basis in order to determine whether scan paths as a whole were concentrated to the left or right page of the spread.
21
Since the left-page and right-page portions of scan paths consisted of ordinal numbers, the data were submitted to a two-sample Wilcoxon Signed Rank test. In this analysis, scan paths were utilized in order to test the rank order of all the objects/articles on the left page against the rank order of all the on the right page. Generalizing over all data, the results indicate that objects on the left page were viewed earlier than objects on the right page. This effect was strongly significant (p<0.0001). To some extent, these results echo and reinforce the results from the placement analysis, albeit on the level of scan paths. As yet, scan paths have been dismembered and discussed in terms of general distributional patterns, but nothing has been said of the spatial structure of scan paths. In the final analyses, an attempt will be made to answer some questions concerning the properties of objects that elicit early attention during the initial scanning sequence. In other words, this analysis will target the various factors that determine the structure of entire scan path sequences, and the relations between constituent fixations. It will be assumed that the initial scanning sequence that readers perform upon turning to a new newspaper spread consists of a conventional component and a perceptual component. The first component could be perhaps be characterized as a habituated left placement preference, and it attempts to capture the consistent preference (early attention) of objects with left placement on the spread. This component suggests that scan path formation may have been influenced by an editorial convention of placing prioritized news articles in the top left corner of the spread. As a reaction to this convention readers may have responded by subjecting initial scanning to endogeneous control (e.g. a rule stating: “look top left first”). Such a heuristics would account for the left dominance recurrent in scan path data. The second component determining the structure of initial scan paths would be a hard-wired perceptual component, which reacts primarily on graphical properties of newspaper layout (design factors). In contrast to the first component, this component would be an intrinsic property of human visual function, which dictates certain eye movement responses to certain visual stimuli through exogeneous control (Klein et al., 1992). These two components (or factors) probably contribute to the formation of scan paths, although on two different levels of cognitive control (top-down vs. bottom-up). If this conjecture holds true, it should in principle be possible to disentangle the respective influences that these factors exert on initial scanning sequences. In an attempt to separate these two components, two prototypical scan path orders were stipulated; one conventional, and the other perceptual. The conventional order started in the top left corner of the newspaper spread, and proceeded more or less linearly in the reading direction until the bottom right corner was reached. By contrast, the perceptual order was constructed with reference to design factor entry points such as pictures, large headlines, and drop quotes. The perceptual ranking order was established by calculating the relative perceptual saliency of a number of graphical elements that appeared in the newspaper layout. This ranking order is given in Table 7.
22

Table 7 Relative order of attention between design factors Design factor M SD 1. Pictures 1.3 0.5 2. Large headline 1.5 0.5 3. Articles 2.9 0.6 4. Short paragraphs 4.0 0.8 5. Drop quotes 4.4 2.2 6. Information graphics 5.0 1.4 7. Advertisements 5.2 0.8 Through a best match procedure, the actual scan paths performed by readers were then correlated with the two prototypical rankings in order to determine whether actual scan paths were dominated by a conventional component or a perceptual component. High correlation numbers between actual scan paths and the prototypical conventional ranking order would imply that initial scanning was determined by conventional, endogeneous control, whereas a high correlation between actual scan paths and the prototypical perceptual ranking order would imply that initial scanning was determined by perceptual, exogeneous control. Correlation numbers between actual scan paths and the two prototypical scan paths are given in Table 8. Higher correlation numbers indicate a better match between actual scan paths and the respective prototypical scan path. As every spread has a unique layout structure, this analysis was performed separately on each spread (1–8). Table 8 Correlations between readers’ actual scan paths and two prototypical scan paths
Correlation with Correlation with conventional scan path perceptual scan path
1 0.6803 0.3024 2 0.9122 0.6495 3 0.6391 0.7456 4 0.6568 0.7633 5 0.45 0.65 6 0.4833 0.6667 7 0.936 0.3931 8 0.6167 0.6167
M 0.6718 0.5984 Keeping in mind that these correlation numbers are derived through a case study approach and not in a controlled experiment, the results indicate that actual scan paths are slightly biased toward a conventional scanning sequence (0.672) as opposed to a perceptual scanning sequence (0.598). However, a t-test revealed that this difference was non-significant.
23
6. Discussion In the experiment concerning information graphics, readers tended to spend more time viewing articles in the experimental text-and-graphics condition than articles in the text-only control condition. On average, readers spent 7.6 seconds on text-only articles, which is about 7.7% of the time spent on corresponding spreads. By contrast, readers spent a mean viewing time of 19 seconds on articles featuring information graphics, which is about 20.9% of the time spent on corresponding spreads. Thus, articles with information graphics elicited significantly longer viewing times both in absolute and proportional measures than articles without information graphics. This is a general trend, which is not necessarily replicated in each condition of counterbalanced information graphics articles. The same general trend was evident when viewing time of information graphics target articles was calculated as relative to article area in both conditions. However, in this analysis the general positive effect elicited by information graphics failed to reach significance, except in one individual instance of counterbalanced target articles. On average, the viewing density of text-only articles was 0.21 milliseconds per pixel, as compared to 0.32 milliseconds per pixel for text-and-graphics articles. Arguably, the fact that the second analysis yielded weaker results in favour of information graphics could be attributed to differences in size between articles in the control condition and in the experimental condition. Text-only articles measured about 2/3 the size of text-and-graphics articles. When this size difference was accounted for, the general positive effect on viewing time elicited by information graphics was diminished. This means that a size factor probably acts a component that is involved in the overall positive effect elicited by articles with information graphics. However, calculating viewing time as relative to article area did not cancel out the increase in viewing times completely. This suggests that although bigger size could be an effective factor participating in articles with information graphics, this factor remains subordinate to the positive effect elicited by information graphics as a complement to article text, and as a design factor in its own right. When testing the effect that information graphics exerted on early attention, the results were decidedly negative (although statistically non-significant). This finding means that articles with information graphics received later attention than articles without information graphics. When all articles on information graphics newspaper spreads were divided into 9 objects, text-only articles ranked better during readers’ initial scan path sequence (6.6) than text-and-graphics articles (8.2). This result is very intriguing since it suggests that information graphics elicit a completely reversed eye movement pattern in comparison with other kinds of pictures, such as ordinary photos. Photographical pictures in conjunction with text invariably lead to very early attention (i.e. early fixations in readers’ initial scan path). In this study, articles with photographic pictures received a ranking order index of 1.25 on a scale from 1–8. It appears that the general content and function of information graphics pictures is decoded pre-attentively through peripheral vision, and that foveal attention is somehow deferred with regard to these elements. Granted that information graphics can be identified as such through peripheral vision, it is possible that this design factor signals complex information that readers judge as inherently interesting but demanding on cognitive resources. Thus, as readers try to maximize informational intake during a limited period of time (sub-optimal
24

reading conditions), news with more accessible contents is attended to first, and information graphics articles are dealt with if there is time left. The combined results on information graphics show that this design factor elicits longer viewing time, but later attention. These results exactly parallel previous research results obtained by Holmqvist and Wartenberg (forthcoming b). In a large study involving several Nordic newspapers (SND/S), they found evidence that supported significantly longer viewing times and significantly later attention for articles with information graphics. In the present study, significant results is only replicated in terms of viewing time, but the general tendency in the case of attention toward information graphics is very similar. Using a case study approach rather than a controlled experiment, Holmqvist and Wartenberg compared the effect of information graphics with the effect of other kinds of pictorial information (maps, drawings, and photos) and found that information graphics elicited significantly longer viewing time of associated textual information than any other type of picture. They conclude with the following remark: “The special status of information graphics is intriguing: They are seen later, but increase the observation time more than any other of the three types of images [maps, drawings, photos]. Obviously, information graphics is an interesting topic to study further: Does it compete with the text it is supposed to complement, for instance?” (forthcoming b). In an attempt to answer the last question posed by Holmqvist and Wartenberg, the present study has sought to elucidate the relation in terms of eye movements between textual and pictorial information in information graphics articles. When dividing information graphics compound articles into a text portion and a picture portion, it was found that on average the text portion elicited a viewing time of approximately 10.4 seconds (11.5% of the viewing time spent on information graphics spreads as a whole), whereas the graphics portion elicited about 8.6 seconds (9.4% of spread viewing time). Even if these figures reveal a small predominance on account of the text portion, the general pattern indicates a more or less equal distribution of viewing time between text and graphics. This is an interesting finding since it implies that textual and pictorial information can co-exist within the same article. If text and graphics competed for viewing time, then, arguably, a more skewed relation between text and graphics would emerge, and total viewing time of information graphics articles would be negatively affected. There is another interesting aspect on the equal distribution of viewing time between text and graphics. In an eye-tracking experiment concerning looking behaviour toward print advertisements, Rayner et al. (2001) addressed the question of how text and pictorial information are integrated in terms of eye movements. The stimuli in the experiment consisted of full-page advertisements with textual information in conjunction with background pictures, and the analysis of eye movement data involved a division of advertisements into separate portions of text and pictures. An important finding was that the text portion received considerably more looking time (70–80%), and that looking behaviour was text-dominated rather integrative in this respect. Rayner et al. concluded that pictures could be decoded in a only a few fixations, whereas text needed more fixations because of a higher informational density. These results are interesting since they diverge so clearly from the results obtained in the present study concerning interaction between text and information graphics. And the reason for this divergence probably lies in the unique pictorial properties of information graphics. In
25

distinction to other kinds of pictures, utilization of information graphics in conjunction with article text results in comparable viewing times between text and picture portions. Turning to article placement, this experiment showed that readers tended to spend more viewing time on articles in the favourable placement condition than articles in the unfavourable placement condition. On average, readers spent 11.4 seconds on articles with unfavourable placement, which is about 6.1% of the viewing time spent on corresponding spreads. In the favourable placement condition readers spent 15 seconds on target articles, which is equivalent to 10.2% of the spread viewing time. The common denominator of articles with favourable placement is that they reside on the left page of the newspaper spread. This experiment shows that in terms of eye movements there is real motivation behind a nomenclature such as “favourable” vs. “unfavourable” placement: favourable placement leads to more viewing time of target articles. Another aspect of the favourable vs. unfavourable distinction is the relative order of attention between articles in these conditions. In this experiment the placement variable was substantiated in this respect also. Thus, articles with favourable placement were attended to earlier than articles with unfavourable placement. When all articles on the relevant spreads were divided into 9 objects, articles with favourable placement ranked considerably better (4.3) during readers initial scanning sequence than articles with unfavourbale placement (7.6). The placement variable reached significance both in terms of viewing time and in terms of order of attention. These results are reflected on a more general level of analysis. When the entire set of eye movement data was analyzed as relative to 16 areas of interest covering the surface area of one newspaper spread, a strong tendency of left lateralization emerged in general viewing behaviours. The left page (i.e. the 8 leftmost AOIs) received 61.4% of the accumulated viewing time, whereas the right page received a mere 38.6%. To a certain extent, this skewed proportionality can be explained by the fact that advertisements tend to be placed on the right page, and advertisements usually receive low levels of eye movement traffic. However, on the newspaper spreads that were included in the article placement experiment, advertising was very scarce. Thus, the left placement preference evident in the current data probably did not emerge as a consequence of readers trying to evade right-page advertising and thereby ending up on the left page. It is more plausible that the “ad-evasion behaviour” has become generalized in readers, and that this behaviour also affects newspaper spreads that are free from advertising. Interestingly, left lateralization of viewing behaviour was not always pronounced on newspaper spreads that tested article placement. When advertising was absent in the bottom right corner of the spread, readers used a fair amount of time to inspect editorial material in these locations. This might indicate that previously referred to “ad-evasion behaviour is rather flexible and not yet a fixed habit. In the SND/S study conducted by Holmqvist and Wartenberg (forthcoming b), a distributional analysis was made in which eye movement data relating to pages with advertising were removed. The fact that this procedure caused the lateralization effect to vanish also points in the direction that readers tend to inspect all locations on the newspaper spread that are free from advertising. An indication in the opposite direction is given in Hansen (1998). Test subjects’ eye movements were recorded during reading of the Yellow Pages telephone directory, and a left lateralization effect was evidenced in spite of an arbitrary spatial
26
distribution of advertising. These results suggest that lateralized viewing behaviours are not entirely contingent on graphical structure. The experiment concerning scan paths could only hint at possible factors determining the spatial structure of readers’ initial scanning sequence on newspaper spreads. No evidence was found of any left-page or right-page preference regarding the initial starting point of scan paths. Starting points seemed to have an equal left-right distribution. However, as scan paths were extended beyond the starting point, a clear left preference emerged. Objects on the left page were attended to significantly earlier than objects on the right page. This finding consolidates the results concerning article placement. Relative order of attention between objects on the spread was also calculated on the basis of the perceptual cues (e.g. pictures, large headlines, and drop quotes) that objects were furnished with. Objects with pictures ranked best (1.3) in this analysis, which means that objects with pictures received earlier attention during initial scan paths than any other object. Large headlines were a close runner up (1.5). These findings are consistent with previous research. Since it appeared that the structure of readers’ initial scanning sequence was determined both by left placement of objects, and by perceptually salient design factors, it was necessary to perform a secondary analysis on the scan path data in order to establish which determining factor that exerted the strongest influence on scan path structure. The left placement preference was considered a conventional artifact, reflecting editorial habits of placing articles with high news value in the top left corner of the spread. Thus, the left placement preference was expressed as a prototypical conventional scan path, which proceeded from top left to bottom right in the reading direction. By contrast, the attraction exerted by design factors was considered a perceptual constant of the human visual system. This behavioural bias was expressed as a prototypical perceptual scan path, which targeted the most prominent design factors in the same order as they were ranked (i.e. pictures first, then large headlines etc.). Organized by different principles, this pair of distinct prototypical scan paths was then compared to actual scan paths performed by readers. As it turned out, a marginally higher correlation prevailed between actual scan paths and the conventional prototype. Thus, left placement had a greater predictive power than design factors as concerning the spatial structure of scan paths, but this difference did not prove statistically significant. A considerable spatial overlap between conventional and perceptual scan paths made it difficult to disentangle these prototypes from each other. What conclusions can be drawn from the present results concerning eye movements and newspaper reading? Generally speaking this study shows that eye movements actually are sensitive and responsive to various design factors that are applied in building the graphical layout of newspapers. Consequently, reading behaviour can be affected by newspaper design. Under these circumstances the critical concern might be to ensure that reading behaviour is affected in the right manner. That is, eye movement behaviour should be affected in way that is meaningful for the reader; all influences on eye movements are not necessarily beneficial. Concerning information graphics the present study suggests that readers actually take advantage of this pictorial mode of information. Presumably, this utility enables readers to process corresponding textual information more effectively. However, the
27
methodology applied in this study does not provide evidence for such interpretations. If it is proved that information graphics has the cognitive function of allowing better comprehension of textual content, then newspaper designers seem to dispose over a graphical device that increases usability and reading value of newspapers. Concerning article placement the results obtained in this study seem to substantiate an enduring intuition of newspaper designers, namely that placement of articles on a newspaper spread is all but a neutral design factor. It appears that articles with left-page placement elicit longer viewing time and earlier attention than articles placed in other locations. A plausible explanation would be that readers rely on some kind of conventionalized heuristic causing them to look for important news in the top left corner. Newspaper designers’ knowledge of such reader heuristics or reader strategies could motivate efforts to guide readers’ attention toward other areas of the spread that receive less eye movement traffic. In this way, a larger portion of the newspaper’s surface area could be put to use. In conclusion, this study should be an incitement to pursue more research concerning the behavioural and cognitive functions of design factors. A highly relevant question might be to ask how design factors are utilized within readers’ viewing strategies. Another relevant question pertains to the pattern of interaction between various design factors. In the future, it is likely that the newspaper trade will have to take a more conscious stance concerning which designing solutions that are optimal with regard to readers’ eye movement patterns. 7. References Barthelson, M. (2002). Behaviour in online news reading. Master’s thesis. Department of Cognitive Science, Lund University. Carroll, D.W., (1999). Psychology of language. Pacific Grove, Calif.: Brooks, Cole Publications. Garcia, M. and Stark, P. (1991). Eyes on the news. St Petersburg, FL: The Poynter Institute for Media Studies. Gazzaniga, M., Ivry, A., Mangun, G. eds. (2002). Cognitive neuroscience: The biology of the mind. New York: Norton. Hansen, J.P. (1994). Analyse av læsernes informationsprioritering. Kognitiv systemgruppen. Forskningscenter Risø, Roskilde. Hansen, J.P. (1998). Reading in Yellow Pages. Presentation at the Lund-Risø eye-trackning meeting in November 1998. Hegarty, M. (1992). The mechanics of comprehension and comprehension of mechanics. In: K. Rayner (ed.), Eye movements and visual cognition: Scene perception and reading (pp. 428–443). New York: Springer-Verlag.
28
Henderson, J.M. and Hollingworth, A. (2000). Eye movements, visual memory, and scene representation. Michigan State University Eye Movement Laboratory Technical Report, 5, 1–17. Holmqvist, K. et al. (2003). Reading or scanning? A study of newspaper and net paper reading. In: J. Hyönä, R. Radach, and H. Deubel (eds.), The mind’s eye: cognitive and applied aspects of eye movement research (pp. 657–670). Amsterdam: North Holland. Holmqvist, K. and Wartenberg, C. (forthcoming a). Daily newspaper layout – designers’ predictions of readers’ visual behaviour: A case study. Research report for SND/S 2003. Holmqvist, K. and Wartenberg, C. (forthcoming b). The role of local design factors for newspaper reading behaviour – an eye-tracking perspective. Unpublished research report. Hyönä, J. et al. (1999). Utilization of illustrations during learning of science text book passages among low- and high-ability children. Contemporary Educational Psychology, 24, 95–123. Josephson, S. and Holmes, M.E. (2002). Visual attention to repeated internet images: Testing the scan path theory on the world wide web. ETRA’02, New Orleans, Louisiana. Klein, R. et al. (1992). Orienting of visual attention. In: K. Rayner (ed.), Eye movements and visual cognition: Scene perception and reading (pp. 46–62). New York: Springer-Verlag. Küpper, N. (1989). Recording of visual reading activity: Research into newspaper reading behaviour. Available as PDF-file from http://calendardesign.de/leseforschung/Eyetrackstudy.pdf. Lundqvist, D. and Holmqvist, K. (2001). Bigger is better: How size of newspaper advertisement and reader attitude relate to attention and memory. Unpublished research report. Radach, R. et al. (2003). Eye movements in the processing of print advertisements. In: J. Hyönä, R. Radach, and H. Deubel (eds.), The mind’s eye: cognitive and applied aspects of eye movement research (pp. 609–632). Amsterdam: North Holland. Rayner, K. (1978). Eye movements in reading and information processing. Psychological Bulletin, 85, 618–660. Rayner, K., ed. (1992). Eye movements and visual cognition: Scene perception and reading. New York: Springer-Verlag. Rayner, K. (1998). Eye movements in reading and information processing: 20 years of research. Psychological Bulletin, 124, 372–422.
29

30
Rayner, K. (2001). Integrating text and pictorial information: Eye movements when looking at print advertisements. Journal of Experimental Psychology: Applied, 7(3), 219–226. Shaughnessy, J.J. and Zechmeister, E.B. (1997). Research methods in psychology. New York: McGraw-Hill. Sternvik, J. (2003). Ögonrörelsestudier och dagstidningsläsning – en forskningsöversikt. PM från dagspresskollegiet, 52, Gothenburg University. Wells, W.D., ed. (1997). Measuring advertising effectiveness. Mahwah, N.J.: Lawrence Erlbaum.