extraction and enrichment of minor lipid components of...
TRANSCRIPT
Chapter 1 Introduction and objectives
1
School of Chemical Engineering
Supercritical Fluid Technology Research Group
Extraction and Enrichment of Minor Lipid
Components of Palm Fatty Acid Distillate Using
Supercritical Carbon Dioxide
By
Naeema Ibrahim Karam Al-Darmaki
Thesis Submitted to the School of Chemical Engineering of the
University of Birmingham for the Degree of
Doctor of Philosophy
May 2012
University of Birmingham Research Archive
e-theses repository This unpublished thesis/dissertation is copyright of the author and/or third parties. The intellectual property rights of the author or third parties in respect of this work are as defined by The Copyright Designs and Patents Act 1988 or as modified by any successor legislation. Any use made of information contained in this thesis/dissertation must be in accordance with that legislation and must be properly acknowledged. Further distribution or reproduction in any format is prohibited without the permission of the copyright holder.

Chapter 1 Introduction and objectives
2
Synopsis
Currently the extraction of valuable components from oils is of growing interest. Palm fatty
acid distillate is a by-product from palm oil refining process which contains valuable minor
components. The scope of the present work was to investigate the enrichment of high value
low concentration components of palm fatty acid distillate namely squalene (1.8-2.3 wt.%
squalene) using supercritical carbon dioxide as solvent with counter-current packed column
kept under isothermal and longitudinal thermal gradient.
The overall objective of this work was to explore the effect of extraction process parameters
such as pressure, temperature, and solvent to feed ratio to optimize the conditions that lead
to high separation efficiency. This work has been centred on the study of the solubility of the
main lipid components in supercritical carbon dioxide, isothermal counter-current
extraction, longitudinal thermal gradient fractionation and the effect of feed concentration.
Solubility studies have been conducted for binary, ternary and quaternary systems as
function of state of conditions through the application of a dynamic method. Binary systems
of CO2/squalene, CO2/oleic acid, CO2/α-tocopherol, and CO2/pseudo-component palm
olein were measured at temperatures of 313, 333 and 353 K, and at a pressure range of 10 to
30 MPa. A ternary system of CO2/squalene/palm olein and a quaternary system of
CO2/squalene/ palm olein/ oleic acid were also investigated at 313 K and pressures of 10 to
25 MPa. Comparison of the ternary system with the binary system showed a decrease in the
solubility of squalene, with a corresponding rise in the solubility of palm olein. In the
quaternary system, the presence of oleic acid decreased the selectivity of squalene.
Extraction of squalene has been carried out on a counter-current glass beads packed column
with the dimensions of 11.45 mm internal diameter and 1.5 m of effective height. The
pressure and temperature were the operating conditions investigated and they varied from
10 – 20 MPa and 313 – 353K, respectively. Experimentation has demonstrated that squalene
high fraction is achievable, however, squalene recovery has been found to be highly
dependent on the extraction pressure and temperature. Squalene and free fatty acids content
in the extract increased, and triglycerides content decreased during most of the fractionation
runs. Longitudinal thermal gradient profiles along the column were investigated for further
recovery of squalene, results showed the highest squalene recovery of more than 95% was
reached and concentration of squalene was increased from 2wt% in the feed to 16wt% in the
top product.

Chapter 1 Introduction and objectives
3
“In the name of Allah, the Entirely Merciful, the Especially Merciful”
“Say, My Lord, increase me in knowledge.”
Chapter 20: Surat Taha Holly Quran

Chapter 1 Introduction and objectives
4
This Work is dedicated to my beloved Parents
Mama Amina & Baba Karam
Chapter 1 Introduction and objectives
5
Acknowledgments
I wish to deeply thank my main supervisor Dr. Regina Santos; this research project would
not have been possible without her abundant support, invaluable guidance and valued
knowledge. I am also thankful to my co-supervisors Dr. Bushra Al-Duri and Dr. Tiejun Lu
for their valuable support, advice and encouragement throughout the course of the project.
Especial gratitude to Dr. Tiejun Lu, who was abundantly helpful and offered invaluable
assistance particularly in laboratory work.
I am also grateful to Dr. John Harris, Dr. Krish Bhaggan and Dr. T.L.F Favre (Loders
Croklaan/IOI Group), for their guidance and fruitful discussions throughout meetings.
I am as well very grateful for Eng. Peter Bath and I would like to acknowledge his limitless
effort in conducting solubility experiments, Mr. Johan Franx (Loders Croklaan/IOI Group)
for his valued knowledge and abundant help in chromatography lipid analysis, Miss Lynn
for her unlimited support for everything else, and workshop and support staff of the School
of Chemical Engineering for their great help and support.
Deepest gratitude is also due to my dear professor in U.A.E University Dr. Ali Al-Marzouqi
for opening the door for me to pursue my studies in Birmingham University.
I would also like to acknowledge my colleagues and my friends in the School of Chemical
Engineering for being great friends and being invaluable source of knowledge and
experience. To my great friends outside the university, thank you very much for your
invaluable support. When I needed a company to share my happiness or a shoulder to cry,
you’ve been always there.
I would like to acknowledge the never ending support of Miss Ewanna and Miss Farhia
Jabaney (Scholarship Co-ordination Office).
I am especially thankful to my family, especially my father to allow me to go abroad and
pursue my dreams. It took me three months to convince my father in a logical manner, at the
end girl’s tears always very convincing.
Finally, I would like to extend my gratitude to Loders Croklaan- IOI Group in
Wormerveer, the Netherlands and the Scholarship Co-ordination Office in Abu-Dhabi,
United Arab Emirates for their financial support.
Above all I am grateful to God the Most Merciful.
THANK YOU

Chapter 1 Introduction and objectives
6
Table of Contents
CHAPTER 1: INTRODUCTION AND OBJECTIVES ........................................................ 12
1.1 Introduction ..............................................................................................................................................12
1.2 Background ...............................................................................................................................................13
1.3 Aims and objectives ..................................................................................................................................15
1.4 Research Plan ............................................................................................................................................16
1.5 Thesis Structure ........................................................................................................................................18
1.6 Publications ..............................................................................................................................................19
CHAPTER 2: LITERATURE REVIEW, STATE OF THE ART ..................................... 20
2.1 Introduction ..............................................................................................................................................20
2.2 Objectives .................................................................................................................................................21
2.3 Fats and Oils ..............................................................................................................................................22 2.3.1 Sources of Vegetable Fats and Oils .......................................................................................................... 22 2.3.2 Palm Oil Refinery Process ........................................................................................................................ 22 2.3.3 Palm Fatty Acid Distillate Main Components ........................................................................................... 24
2.4 Conventional Separation Methods ............................................................................................................30 2.4.1 Organic Solvent Extraction (Soxhelt Extraction) ...................................................................................... 30 2.4.2 Vacuum Distillation .................................................................................................................................. 32
2.5 Towards Green Solvents ...........................................................................................................................32
2.6 Supercritical Fluids ....................................................................................................................................34 2.6.1 Phase Behavior of Pure Component ........................................................................................................ 34 2.6.2 Supercritical Carbon Dioxide .................................................................................................................... 36 2.6.3 Polarity Attributes of Carbon Dioxide ...................................................................................................... 38 2.6.4 Solubility of Natural Matters in Supercritical Carbon Dioxide ................................................................. 40 2.6.5 Applications of Supercritical Fluids .......................................................................................................... 45
2.7 State of the Art of Supercritical Fluids Extraction and Separation .............................................................52 2.7.1 Selection of Conditions of State; Pressure and Temperature. ................................................................. 62 2.7.2 Effect of Solvent Flow Rate ...................................................................................................................... 63 2.7.3 The Use of Co-solvents ............................................................................................................................. 64 2.7.4 The Effect of Packing Materials ................................................................................................................ 64
2.8 Concluding Remarks ...........................................................................................................................66
CHAPTER 3: MATERIALS AND ANALYTICAL TECHNIQUES.................................. 67
3.1 Introduction ..............................................................................................................................................67
3.2 Materials Used in Solubility and Extraction Experiments ..........................................................................68
Chapter 1 Introduction and objectives
7
3.2.1 Solubility Experiments .............................................................................................................................. 68 3.2.2 Extraction Experiments ............................................................................................................................ 69
3.3 Analytical Methods ...................................................................................................................................71 3.3.1 Analysis of Squalene Content ................................................................................................................... 71 3.3.2 Analysis of FFA Content via GC ................................................................................................................ 73 3.3.3 Analysis of FFA Content via Titration ....................................................................................................... 75
3.4 Samples Storage ........................................................................................................................................77
CHAPTER 4: SOLUBILITY MEASUREMENTS OF LIQUID LIPID BASED COMPONENTS IN SC-CO2 ....................................................................................................... 78
4.1 Introduction ..............................................................................................................................................78
4.2 Objectives .................................................................................................................................................79
4.3 Methodology ............................................................................................................................................79 4.3.1 Solubility Measurement Rig ..................................................................................................................... 79 4.3.2 Calculations .............................................................................................................................................. 85
4.4 Results and Discussions .............................................................................................................................86 4.4.1 Solubility of Binary Systems of Pure Solutes ............................................................................................ 86 4.4.2 Solubility of Solute Mixture System ......................................................................................................... 95
4.5 Conclusions ............................................................................................................................................. 104
CHAPTER 5: COUNTER-CURRENT SUPERCRITICAL FLUID EXTRACTION AND FRACTIONATION OF PFAD COMPONENTS USING SC-CO2 ...................... 105
5.1 Introduction ............................................................................................................................................ 105
5.2 Objectives ............................................................................................................................................... 106
5.3 Methodology .......................................................................................................................................... 107 5.3.1 Counter-Current Fractionation Rig ......................................................................................................... 107 5.3.2 Materials and Analysis ........................................................................................................................... 111 5.3.3 Calculations ............................................................................................................................................ 111
5.4 Results and Discussions ........................................................................................................................... 113 5.4.1 Calculation of Minimum Solvent to Feed Ratio ..................................................................................... 113 5.4.2 Preliminary Experiments ........................................................................................................................ 114 5.4.3 Effect of Extraction Pressure .................................................................................................................. 115 5.4.4 Effect of Extraction Temperature ........................................................................................................... 121 5.4.3 Effect of Solvent to Feed Ratio ............................................................................................................... 126 5.4.3 Overview of Squalene and Free Fatty Acids Selectivities ....................................................................... 128
4.5 Conclusions ............................................................................................................................................. 130
CHAPTER 6: LONGITUDINAL THERMAL GRADIENT COUNTER-CURRENT SUPERCRITICAL FLUID FRACTIONATION OF PFAD COMPONENTS USING SC-CO2 ............................................................................................................................................ 131

Chapter 1 Introduction and objectives
8
6.1 Introduction ............................................................................................................................................ 131
6.2 Objectives ............................................................................................................................................... 132
6.3 Methodology .......................................................................................................................................... 132 6.3.1 Counter-Current Fractionation Rig ......................................................................................................... 132 6.3.2 Materials and analysis ............................................................................................................................ 133 6.3.3 Calculations ............................................................................................................................................ 134
6.4 Results and Discussions ........................................................................................................................... 134 6.3.2 Effect of Pressure ................................................................................................................................... 136 6.3.2 Effect of Temperature Profile ................................................................................................................ 137 6.3.3 FFA Recovery and Concentration Under Thermal Gradient................................................................... 140
6.5 Conclusions ............................................................................................................................................. 141
CHAPTER 7: EFFECT OF FEED COMPOSITION ON THE EXTRACTION AND FRACTIONATION OF SQUALENE ...................................................................................... 142
7.1 Introduction ............................................................................................................................................ 142
7.2 Objectives ............................................................................................................................................... 143
7.3 Methodology .......................................................................................................................................... 143 7.3.1 Counter-Current Fractionation Rig ......................................................................................................... 143 7.3.2 Materials and Analysis ........................................................................................................................... 143 7.3.3 Calculations ............................................................................................................................................ 144
7.4 Results and Discussions ........................................................................................................................... 144
7.4 Conclusions ............................................................................................................................................. 147
CHAPTER 8: CONCLUSIONS AND FUTURE WORK .................................................... 148
8.1 Main Concluding Marks .......................................................................................................................... 149 8.1.1 Solubility Studies .................................................................................................................................... 149 8.1.2 Separation and Fractionation Studies .................................................................................................... 150 8.1.3 Effect of Feed Composition .................................................................................................................... 151
8.2 Suggestions and Future Work ................................................................................................................. 152 8.2.1 The Study of the Effect of Co-Solvents Addition .................................................................................... 152 8.2.2 The Effect of External Reflux and Feed Introduction Location .............................................................. 152 8.2.1 Optimization Using Response Surface Methodology ............................................................................. 152
REFERENCES ............................................................................................................................... 155
APPENDIX..................................................................................................................................... 173

Chapter 1 Introduction and objectives
9
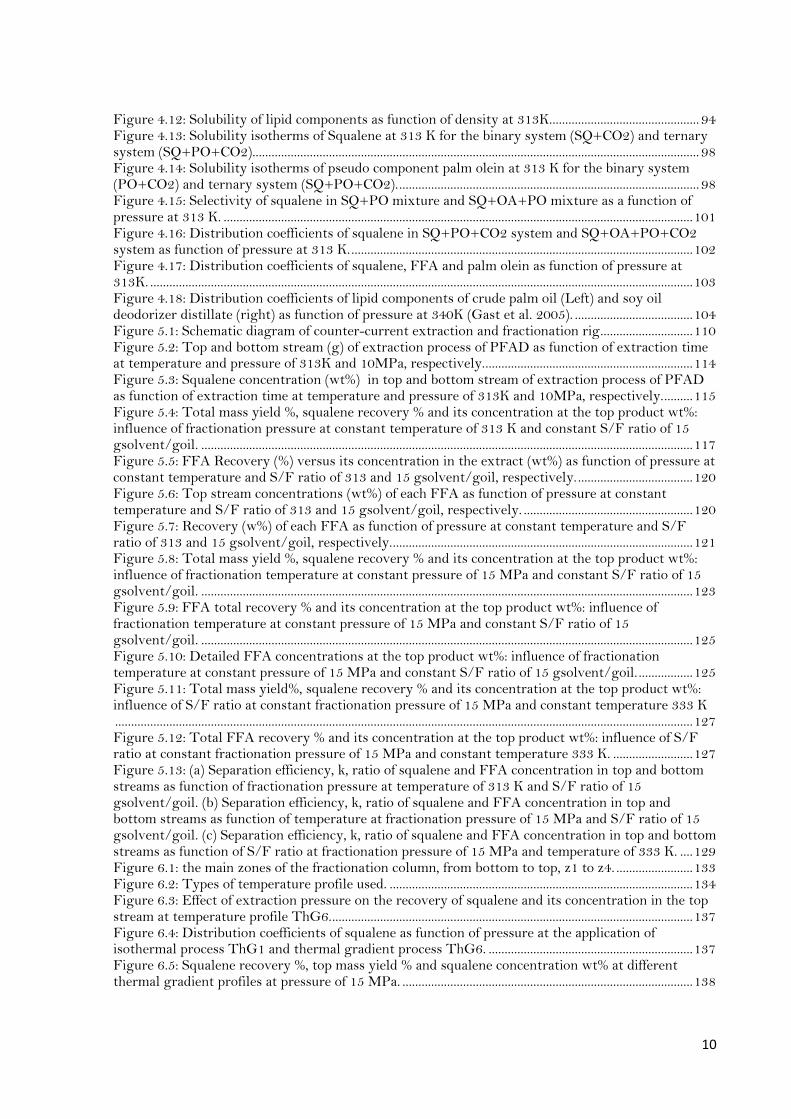
List of Figures Figure 1.1: Main palm oil producers in the world 2009/10 (USDA, 2010). .............................................. 14 Figure 1.2: Distribution of main vegetable oils production 2009/10 (USDA, 2010). ............................. 14 Figure 2.1: Refinery process of crude palm oil (Haslenda and Jamaludin 2011) ....................................... 23 Figure 2.2: Chemical structure of triglycerides where R1, R2 and R3 are free fatty acids chains.. ..... 25 Figure 2.3: Chemical structure of saturated palmitic acid. ............................................................................. 25 Figure 2.4: Chemical structure of unsaturated oleic acid. ............................................................................... 26 Figure 2.5: Chemical structure of unsaturated linoleic acid. .......................................................................... 26 Figure 2.6: Chemical structure of saturated stearic acid. ................................................................................ 26 Figure 2.7: Chemical structure of tocochromanols. ......................................................................................... 27 Figure 2.8: Chemical structure of cholesterol. ................................................................................................... 28 Figure 2.9: Chemical structures of examples of phytosterols present in oil deodorizer distillate; (A) ß.sitosterol, (B) campasterol, (C) stigmasterol and (D) isofucosterol (Sugihara et al.2010). ................. 28 Figure 2.10: Chemical structure of squalene. ..................................................................................................... 29 Figure 2.11: Potential green solvents alternative to common organic solvents (Reichardt, 2007).. ... 33 Figure 2.12: PT diagram of a pure component demonstrating the state of aggregation. ...................... 34 Figure 2.13: Typical phase diagram of CO2 (McHugh and Krukonis, 1994). ........................................... 37 Figure 2.14: Density isotherm of CO2 as function of pressure (liquid CO2 at 25ºC, and Sc-CO2 at 50ºC) ............................................................................................................................................................................. 38 Figure 2.15: Solubility curves of low volatility naphthalene in supercritical fluid solvent (Hurbert and Vitzthum, 1978). ........................................................................................................................................................ 41 Figure 2.16: Unification of chromatography illustrating the supercritical fluid chromatography position compared to liquid and gas chromatography (Taylor, 2009). ....................................................... 46 Figure 2.17: Schematic diagrams of the main categories of supercritical CO2 particle formation: (a) RESS process, (b) SAS process, (c) PGSS process, and (d) DELOS process (Hakuta et.al., 2003). ...... 48 Figure 2.18: Schematic diagram of Sc-CO2 drying for the preparation of titania aerogels (Shimoyama et.al., 2010).................................................................................................................................................................. 49 Figure 2.19: Schematic representation of SCF extraction pilot plant (Reverchon, 1997). .................... 50 Figure 2.20: Schematic representation of continuous counter-currents high pressure column for the fractionation of liquids by supercritical fluid (Brunner, 2009). ..................................................................... 51 Figure 2.21: Density and dielectric constant of CO2 as function of pressure at temperature of 323 K (Hubert and Vitzthum, 1987). ................................................................................................................................ 62 Figure 2.22: HTV values (m) vs. packing materials at a CO2 flow rate of 2000 m/h and S/F ratio of 23.14 kg CO2/Kg olive oil (Hurtado-Benavides et.al, 2004). ........................................................................ 65 Figure 3.1: Typical GC chromatogram showing peaks of internal standard and squalene. .................. 72 Figure 3.2: Typical GC chromatogram showing peaks of internal standard and main components of PFAD; palmitic acid C16:0, linoleic acid C18:2, oleic acid C18:1 and stearic acid C18:0. ...................... 75 Figure 3.3: FFA analysis comparison between GC method and titration (Alenezi, 2010). .................... 72 Figure 4.1: The ‘four S’ flow diagram of the solubility measurements. ...................................................... 80 Figure 4.2: Schematic diagram of dynamic flow type solubility apparatus. ............................................... 80 Figure 4.3: Sample holder ....................................................................................................................................... 81 Figure 4.4: Sample holder ....................................................................................................................................... 82 Figure 4.5: Loading of vegetable oil at different solvent flow rate at pressure of 15 MPa and temperature of 313 K. .............................................................................................................................................. 84 Figure 4.6: Solubility isotherms of oleic acid as function of pressure at temperatures of 313 K, 333K and 353 K. ................................................................................................................................................................... 90
Figure 4.7: Solubility isotherms of α-tocopherol as function of pressure at temperatures of 313 K, 333K and 353 K. ........................................................................................................................................................ 90 Figure 4.8: Solubility isotherms of squalene as function of pressure at temperatures of 313 K, 333K and 353 K. ................................................................................................................................................................... 91 Figure 4.9: Solubility isotherms of pseudo component palm olein as function of pressure at temperatures of 313 K, 333K and 353 K. ............................................................................................................ 91 Figure 4.10: Solubility isotherms of oleic acid at 313 K. ................................................................................. 92
Figure 4.11: Solubility isotherms of α-tocopherol at 313 K. .......................................................................... 93
Chapter 1 Introduction and objectives
10
Figure 4.12: Solubility of lipid components as function of density at 313K............................................... 94 Figure 4.13: Solubility isotherms of Squalene at 313 K for the binary system (SQ+CO2) and ternary system (SQ+PO+CO2)............................................................................................................................................ 98 Figure 4.14: Solubility isotherms of pseudo component palm olein at 313 K for the binary system (PO+CO2) and ternary system (SQ+PO+CO2). .............................................................................................. 98 Figure 4.15: Selectivity of squalene in SQ+PO mixture and SQ+OA+PO mixture as a function of pressure at 313 K. ................................................................................................................................................... 101 Figure 4.16: Distribution coefficients of squalene in SQ+PO+CO2 system and SQ+OA+PO+CO2 system as function of pressure at 313 K. ........................................................................................................... 102 Figure 4.17: Distribution coefficients of squalene, FFA and palm olein as function of pressure at 313K. .......................................................................................................................................................................... 103 Figure 4.18: Distribution coefficients of lipid components of crude palm oil (Left) and soy oil deodorizer distillate (right) as function of pressure at 340K (Gast et al. 2005). ..................................... 104 Figure 5.1: Schematic diagram of counter-current extraction and fractionation rig ............................. 110 Figure 5.2: Top and bottom stream (g) of extraction process of PFAD as function of extraction time at temperature and pressure of 313K and 10MPa, respectively. ................................................................. 114 Figure 5.3: Squalene concentration (wt%) in top and bottom stream of extraction process of PFAD as function of extraction time at temperature and pressure of 313K and 10MPa, respectively. ......... 115 Figure 5.4: Total mass yield %, squalene recovery % and its concentration at the top product wt%: influence of fractionation pressure at constant temperature of 313 K and constant S/F ratio of 15 gsolvent/goil. .......................................................................................................................................................... 117 Figure 5.5: FFA Recovery (%) versus its concentration in the extract (wt%) as function of pressure at constant temperature and S/F ratio of 313 and 15 gsolvent/goil, respectively. .................................... 120 Figure 5.6: Top stream concentrations (wt%) of each FFA as function of pressure at constant temperature and S/F ratio of 313 and 15 gsolvent/goil, respectively. ..................................................... 120 Figure 5.7: Recovery (w%) of each FFA as function of pressure at constant temperature and S/F ratio of 313 and 15 gsolvent/goil, respectively. .............................................................................................. 121 Figure 5.8: Total mass yield %, squalene recovery % and its concentration at the top product wt%: influence of fractionation temperature at constant pressure of 15 MPa and constant S/F ratio of 15 gsolvent/goil. .......................................................................................................................................................... 123 Figure 5.9: FFA total recovery % and its concentration at the top product wt%: influence of fractionation temperature at constant pressure of 15 MPa and constant S/F ratio of 15 gsolvent/goil. .......................................................................................................................................................... 125 Figure 5.10: Detailed FFA concentrations at the top product wt%: influence of fractionation temperature at constant pressure of 15 MPa and constant S/F ratio of 15 gsolvent/goil. ................. 125 Figure 5.11: Total mass yield%, squalene recovery % and its concentration at the top product wt%: influence of S/F ratio at constant fractionation pressure of 15 MPa and constant temperature 333 K ..................................................................................................................................................................................... 127 Figure 5.12: Total FFA recovery % and its concentration at the top product wt%: influence of S/F ratio at constant fractionation pressure of 15 MPa and constant temperature 333 K. ......................... 127 Figure 5.13: (a) Separation efficiency, k, ratio of squalene and FFA concentration in top and bottom streams as function of fractionation pressure at temperature of 313 K and S/F ratio of 15 gsolvent/goil. (b) Separation efficiency, k, ratio of squalene and FFA concentration in top and bottom streams as function of temperature at fractionation pressure of 15 MPa and S/F ratio of 15 gsolvent/goil. (c) Separation efficiency, k, ratio of squalene and FFA concentration in top and bottom streams as function of S/F ratio at fractionation pressure of 15 MPa and temperature of 333 K. .... 129 Figure 6.1: the main zones of the fractionation column, from bottom to top, z1 to z4. ........................ 133 Figure 6.2: Types of temperature profile used. ............................................................................................... 134 Figure 6.3: Effect of extraction pressure on the recovery of squalene and its concentration in the top stream at temperature profile ThG6. ................................................................................................................. 137 Figure 6.4: Distribution coefficients of squalene as function of pressure at the application of isothermal process ThG1 and thermal gradient process ThG6. ................................................................ 137 Figure 6.5: Squalene recovery %, top mass yield % and squalene concentration wt% at different thermal gradient profiles at pressure of 15 MPa. ........................................................................................... 138
Chapter 1 Introduction and objectives
11
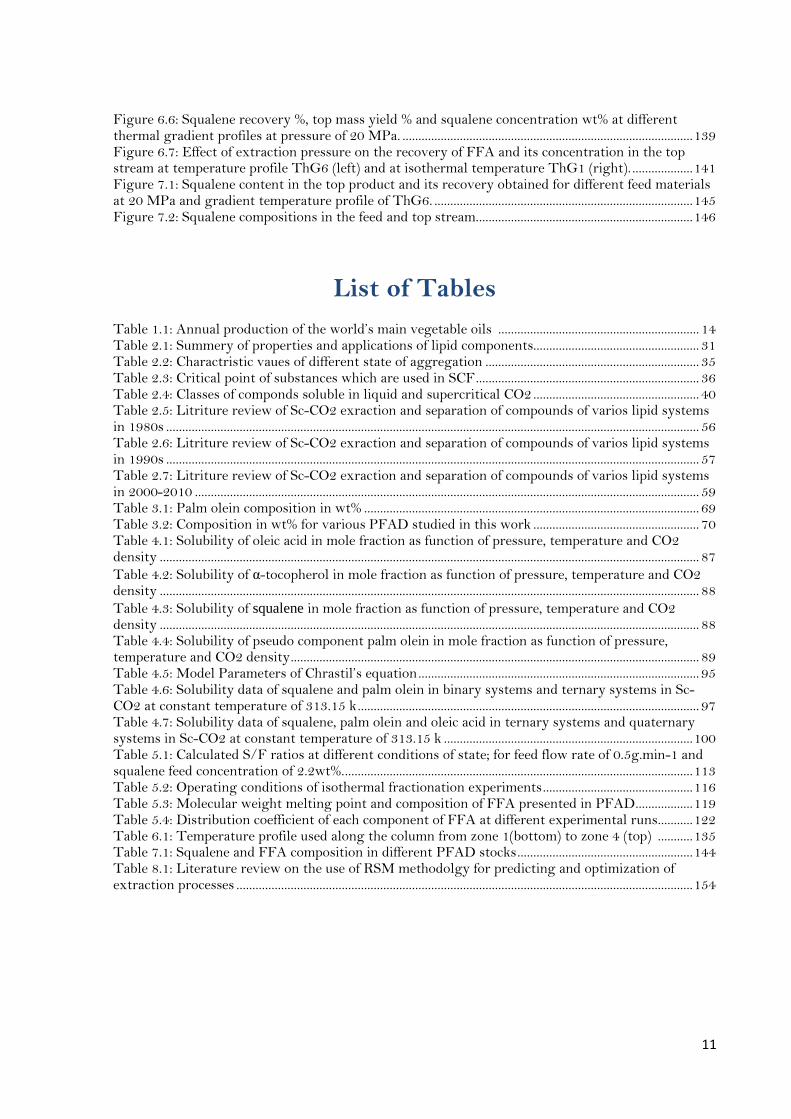
Figure 6.6: Squalene recovery %, top mass yield % and squalene concentration wt% at different thermal gradient profiles at pressure of 20 MPa. ........................................................................................... 139 Figure 6.7: Effect of extraction pressure on the recovery of FFA and its concentration in the top stream at temperature profile ThG6 (left) and at isothermal temperature ThG1 (right). ................... 141 Figure 7.1: Squalene content in the top product and its recovery obtained for different feed materials at 20 MPa and gradient temperature profile of ThG6. ................................................................................. 145 Figure 7.2: Squalene compositions in the feed and top stream.................................................................... 146
List of Tables
Table 1.1: Annual production of the world’s main vegetable oils ............................................................... 14 Table 2.1: Summery of properties and applications of lipid components.................................................... 31 Table 2.2: Charactristic vaues of different state of aggregation ................................................................... 35 Table 2.3: Critical point of substances which are used in SCF ...................................................................... 36 Table 2.4: Classes of componds soluble in liquid and supercritical CO2 .................................................... 40 Table 2.5: Litriture review of Sc-CO2 exraction and separation of compounds of varios lipid systems in 1980s ....................................................................................................................................................................... 56 Table 2.6: Litriture review of Sc-CO2 exraction and separation of compounds of varios lipid systems in 1990s ....................................................................................................................................................................... 57 Table 2.7: Litriture review of Sc-CO2 exraction and separation of compounds of varios lipid systems in 2000-2010 .............................................................................................................................................................. 59 Table 3.1: Palm olein composition in wt% ......................................................................................................... 69 Table 3.2: Composition in wt% for various PFAD studied in this work .................................................... 70 Table 4.1: Solubility of oleic acid in mole fraction as function of pressure, temperature and CO2 density ......................................................................................................................................................................... 87
Table 4.2: Solubility of α-tocopherol in mole fraction as function of pressure, temperature and CO2 density ......................................................................................................................................................................... 88
Table 4.3: Solubility of squalene in mole fraction as function of pressure, temperature and CO2 density ......................................................................................................................................................................... 88 Table 4.4: Solubility of pseudo component palm olein in mole fraction as function of pressure, temperature and CO2 density ................................................................................................................................ 89 Table 4.5: Model Parameters of Chrastil’s equation ........................................................................................ 95 Table 4.6: Solubility data of squalene and palm olein in binary systems and ternary systems in Sc-CO2 at constant temperature of 313.15 k ........................................................................................................... 97 Table 4.7: Solubility data of squalene, palm olein and oleic acid in ternary systems and quaternary systems in Sc-CO2 at constant temperature of 313.15 k .............................................................................. 100 Table 5.1: Calculated S/F ratios at different conditions of state; for feed flow rate of 0.5g.min-1 and squalene feed concentration of 2.2wt%. ............................................................................................................. 113 Table 5.2: Operating conditions of isothermal fractionation experiments ............................................... 116 Table 5.3: Molecular weight melting point and composition of FFA presented in PFAD .................. 119 Table 5.4: Distribution coefficient of each component of FFA at different experimental runs........... 122 Table 6.1: Temperature profile used along the column from zone 1(bottom) to zone 4 (top) ........... 135 Table 7.1: Squalene and FFA composition in different PFAD stocks ....................................................... 144 Table 8.1: Literature review on the use of RSM methodolgy for predicting and optimization of extraction processes ............................................................................................................................................... 154
Chapter 1 Introduction and objectives
12
Chapter 1
Introduction and Objectives
1.1 Introduction
One of the great ancient philosophers, Aristotle, had a statement on solvents and solutions.
The statement in English is “...it is chiefly the liquid substances which ‘react’ ‘’or “...for
instance, liquids are the type of bodies most liable to mixing”. Christian Reichardt
mentioned that solid state chemists were not happy with Aristotle statement (Reichardt,
2006). Adding to that, supercritical fluids chemists neither! However, supercritical fluids
have properties of liquids, but it can’t be identified as liquid yet. Chemistry of solvents is
moving toward new era where basic definitions and statements are narrow compared to the
wide modern research.

Chapter 1 Introduction and objectives
13
The regulations towards using hazardous solvents in food and pharmaceutical industries,
promote research to find neoteric alternative solvents. Extraction has been carried out using
a variety of conventional solvents such as dichloromethane for the decaffeination of coffee
beans (McHugh and Krukonis, 1994) and hexane for the extraction of olive husk oil
(Esquivel et.al, 1999). Cost, accessibility, hazard and post treatment of the extract to
remove solvent residue are main drawbacks of these conventional solvents especially in the
food industry.
Functional foods and cosmetics are in revolution of innovation in food and cosmetic market
due to the growing health awareness among people. This leads to alter and improve the
existing products to be enriched with bioactive compounds such as vitamin E, squalene,
caritenoids, etc. These bioactive valuable compounds can be found in various resources,
mainly in vegetable oils and their by-products, e.g., olive oil, palm oil, sunflower oil, etc. The
extraction of these compounds can be obtained using various extraction methods and it is
vital to locate a suitable method to avoid degradation of these valuable compounds.
The supercritical extraction technology using supercritical carbon dioxide (Sc-CO2) as
solvent makes processing and manufacturing bioactive material at ambient temperature
possible in view of the fact that carbon dioxide (CO2) has near ambient critical temperature.
CO2, which is non-toxic solvent, non-flammable and cheap gas compared to other solvents,
has been investigated intensively in the past decades to design environmental friendly
processes alternative to the tradition separation processes of bioactive materials.
1.2 Background
Vegetable Oils and fats naturally exist in plant seeds and fruits. The highly demand of these
oils lead to its higher production rate. Extraction of these oils from plants such as palm oil,
soybean oil and sunflower oil are produced widely all over the world. The annual
Chapter 1 Introduction and objectives
14
0
5
10
15
20
25
Mill
ion
Met
ric
Ton
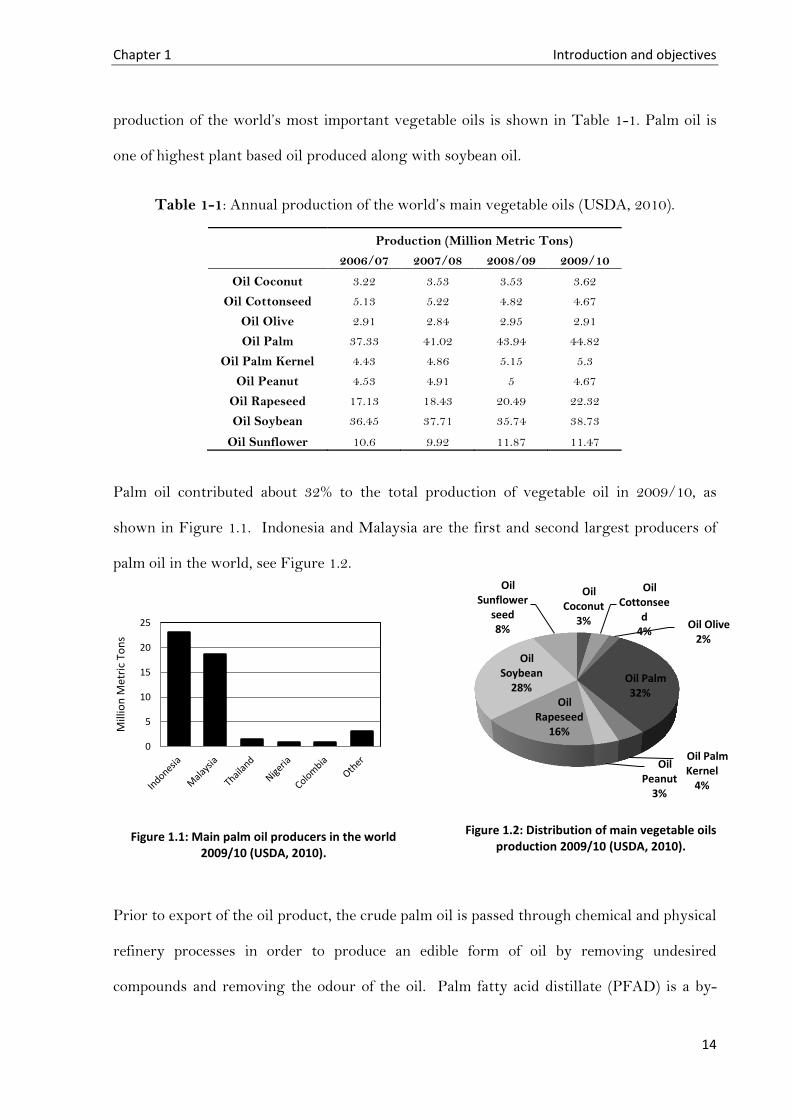
s production of the world’s most important vegetable oils is shown in Table 1-1. Palm oil is
one of highest plant based oil produced along with soybean oil.
Table 1-1: Annual production of the world’s main vegetable oils (USDA, 2010).
Production (Million Metric Tons)
2006/07 2007/08 2008/09 2009/10
Oil Coconut 3.22 3.53 3.53 3.62
Oil Cottonseed 5.13 5.22 4.82 4.67
Oil Olive 2.91 2.84 2.95 2.91
Oil Palm 37.33 41.02 43.94 44.82
Oil Palm Kernel 4.43 4.86 5.15 5.3
Oil Peanut 4.53 4.91 5 4.67
Oil Rapeseed 17.13 18.43 20.49 22.32
Oil Soybean 36.45 37.71 35.74 38.73
Oil Sunflower 10.6 9.92 11.87 11.47
Palm oil contributed about 32% to the total production of vegetable oil in 2009/10, as
shown in Figure 1.1. Indonesia and Malaysia are the first and second largest producers of
palm oil in the world, see Figure 1.2.
Prior to export of the oil product, the crude palm oil is passed through chemical and physical
refinery processes in order to produce an edible form of oil by removing undesired
compounds and removing the odour of the oil. Palm fatty acid distillate (PFAD) is a by-
Oil Coconut
3%
Oil Cottonsee
d 4%
Oil Olive 2%
Oil Palm 32%
Oil Palm Kernel
4%
Oil Peanut
3%
Oil Rapeseed
16%
Oil Soybean
28%
Oil Sunflower
seed 8%
Figure 1.1: Main palm oil producers in the world 2009/10 (USDA, 2010).
Figure 1.2: Distribution of main vegetable oils production 2009/10 (USDA, 2010).
Chapter 1 Introduction and objectives
15
product of deacidification and deodorization processes of the crude palm oil refinery. PFAD
is mainly used in laundry soap industry as well as animal feed industry (Ab Gapor Md,
2010). It is composed mainly of free fatty acids (FFA) and glycerides as well as valuable
components squalene, vitamin E and phytosterols. These components have potential value
mainly for nutraceutical and cosmetic industries. Beside the applications of PFAD in many
industries, it can be a valuable source for the extraction of these added-value components,
especially with the high production rate of PFAD.
Supercritical fluid technology received high interest in many applications and it has high
demand in the area of extraction and fractionation as an interesting alternative to the
conventional separation processes. The fractionation of free fatty acids and tocopherols from
PFAD are commonly carried out in distillation systems and/or two-step condensation
systems. . Moving towards less environmental impact processes is one of the main industrial
policies in this century particularly in the food and pharmaceutical industries.
Supercritical fluid extraction process has several advantages including that the process
operating temperature is near-ambient which can enhance product quality by avoiding
thermal degradation of thermal-sensitive compounds. Supercritical fluid process can be
operated continuously in multistage extraction column and it can be applied in many
potential applications in chemical and food industries.
1.3 Aims and objectives
PFAD contains squalene, FFA, tocopherols and sterols which are of special interests in the
cosmetic, pharmaceutical and food industries. Based on the high production rate of palm oil,
therefore high production of PFAD, it can be great source for the production of commercial
amounts of these valuable components. Therefore, the main objective of this research is to
separate and enrich the minor lipid components namely squalene, from PFAD via the
Chapter 1 Introduction and objectives
16
application of supercritical extraction technology with Sc-CO2 as solvent, by evaluating the
effect of extracting pressure, temperature and flow rate of carbon dioxide on the separation
of lipid components presented in PFAD. The present work is devoted mainly to the recovery
of squalene from PFAD via Sc-CO2 fractionation in counter-current mode. To our
knowledge, there are no studies devoted on the recovery of squalene from PFAD. This raw
material is particularly significant due to its high production rate with the content of
valuable components. The previous investigations of Bondioli and Ruivo were conducted on
counter-current extraction process with squalene feed concentration of 40 to 60% by weight
from olive oil deodorizer distillate (Bondioli et.al, 1993, Ruivo et.al, 2007). The raw material
employed in the present study contains only 2 to 4 wt. % of squalene. There is more
challenge for the recovery of squalene at low concentration than that at higher
concentration found in the olive oil distillate. In this work, the supercritical fluid
fractionation and extractions experiments were designed and carried out in a bench-scale
packed column and operated under isothermal and thermal gradient modes.
1.4 Research Plan
The research plan was developed and conducted based on the following phases to achieve
the main aims and objectives of the project:
Phase I: Project Initiation
1. Literature Review: a literature survey was carried out to identify the main investigations
up to date about supercritical fluids (mainly CO2) and its applications to isolate minor
lipid components.
2. Planning, Design and Construction of equipment: the rigs for the solubility studies and
counter-current fractionation column were previously built, but modifications were
Chapter 1 Introduction and objectives
17
necessary to prior to experimentation. Moreover it was very necessary to learn how to
operate the rig and be familiar with the lab and safety regulation.
3. Identification of the analytical techniques: the analytical methods were determined from the
literature review and training was conducted to learn how to use the analytical
equipment, mainly gas and liquid chromatography.
Phase II: Solubility Studies
1. Solubility Data anthology: previous data were collected from literature, homogenized and
plotted for all minor components and based on that, experiments will be carried out in a
binary system (single component + CO2) in order to have a complete spectrum of the
solubility data required. In order to develop a level of understanding of the solubility of
components in CO2, solubility data were correlated using Chrastil equation (J. Chrastil,
1982).
2. Binary, ternary and quaternary solubility studies: Information on equilibrium solubility
behaviour is essential to obtain basic knowledge regarding the feasibility of supercritical
fluid separation and fractionation processes. Therefore, solubility studies were designed
to be carried out for binary systems and multi-component systems.
Phase III: Fractionation and Enrichment Studies
1. Fractionation rig components: it was necessary to modify the rig and the fractionation
column to meet the main objectives of the study prior to experimentation.
2. Isothermal and thermal gradient Experiments: fractionation experiments were designed
based on various operating conditions namely temperature and pressure, feed flow rate,
CO2 flow rate. The experiments were designed to be conducted in isothermal mode and
temperature gradient along the extraction column.
3. Study various feed materials: Following the fractionation experiment (above) the study of
the effect of different PFAD feed materials was conducted at optimum conditions.

Chapter 1 Introduction and objectives
18
1.5 Thesis Structure
The structure of this research work is presented in eight distinct chapters as following:
Chapter 1: Introduction and Objectives
Chapter 2: State of the Art
Chapter 3: Materials and Analytical Techniques
Chapter 4: Solubility Studies of Lipid Components
Chapter 5: Counter-current Fractionation of PFAD
Chapter 6: Thermal Gradient Fractionation
Chapter 7: Effect of Different Feed Concentrations
Chapter 8: Conclusions and Future Work.
In this thesis, the main objectives of this research work are defined and summarized in
Chapter 1. An overview of the supercritical fluids, minor lipid components and supercritical
fluid extraction, solubility in supercritical fluids, and enrichment of natural matters state of
the art are discussed in Chapter 2. Followed by a full description of materials and analytical
techniques used throughout the research in Chapter 3. Afterwards, concise review of the
results of solubility measurements is discussed in chapter 4. Chapter 5 and chapter 6 are
mainly about the fractionation and enrichment of PFAD components conducted in
isothermal mode and thermal gradient mode along the column, respectively. The feed
compositions effect is discussed in chapter 7. Finally, the thesis is concluded with main
concluding marks and brief statement of future work plans in Chapter 8.
Chapter 1 Introduction and objectives
19
1.6 Publications
The main results of this research work have been published in peer-reviewed journals and
presented in conferences. Full versions of the publications are presented in the Appendix.
1.6.1 Publications
N. Al-Darmaki, T. Lu, B. Al-Duri, J.B. Harris, T.L.F Favre, K. Bhaggan and R.C. D.
Santos, “Isothermal and Temperature Gradient Supercritical Fluid Extraction and
Fractionation of Squalene from Palm Fatty Acid Distillate Using Compressed
Carbon Dioxide” The Journal of Supercritical fluids , 61 (2012) 108-114.
N. Al-Darmaki, T. Lu, B. Al-Duri, J.B. Harris, T.L.F Favre, K. Bhaggan and R.C. D.
Santos, “Solubility Measurements and Analysis of Binary, Ternary and Quaternary
Systems of Palm Olein, Squalene and Oleic Acid in Supercritical Carbon Dioxide”
Separation & Purification Technology, 83 (2011) 189-195.
1.6.2 Conferences
N. Al-Darmaki, B. Al-Duri, T. Lu, J.B. Harris, T.L.F Favre, K. Bhaggan and R.C. D.
Santos, “Phase Equilibria of Squalene, Oleic Acid and Palm Olein in Supercritical
Carbon Dioxide ”, Chemical Engineering Congress, Montreal Canada, August
2009.
N. Al-Darmaki, B. Al-Duri, T. Lu, J.B. Harris, T.L.F Favre, K. Bhaggan and R.C. D.
Santos, “Counter-Current Packed Column Supercritical CO2 Recovery of Squalene”,
UAE Annual Research Conference, Al-Ain, April 2008.
20
Chapter 2:
Literature Review,
State of the Art
2.1 Introduction
The use of supercritical fluids in the extraction and the purification of natural valuable
components have been investigated in the past decades. It is one of the most studied
applications in the field of separation in the last twenty years. This chapter is focusing on
three dominant themes; fats and oils, supercritical fluids, and intensive literature survey on
the extraction and separation of lipid components from liquid raw materials using
supercritical fluids extraction. This particular research project is to examine the extraction
and fractionation of particular lipid components of PFAD; however the scope of this review
is expanded to include studies that examine various systems of feed material.

Chapter 2 State of the Art
21
The first theme of this chapter is on the subject of fats and oils, section 2.3. Sources of main
vegetable fats and oils are illustrated, followed by a brief description of the chemical and
physical palm oil refinery and the main by-products including PFAD are described.
Description and importance of minor lipid components present in PFAD were illustrated.
Summary of conventional extraction methods and its limitations is presented at section 2.4
of this chapter.
Within the second theme of the chapter, definitions of solvent and supercritical fluids are
illustrated. Available alternative green solvents are presented in section 2.5, followed by a
brief discussion of phase behaviour of pure component. Sc-CO2 and its polarity attributes are
discussed in section 2.6. Section 2.6.4 of this chapter is focused on the solubility of lipid
components in Sc-CO2, followed by a presentation of main applications of supercritical
carbon dioxide in chemical and food industries, with more attention on extraction and
fractionation processes.
Finally, on the last theme of the review state of the art of supercritical fluid extraction and
separation using Sc-CO2 is intensively studied in section 2.7. A review on the selection of
parameter for the optimization of supercritical fluid extraction is illuminated. The effect of
the solvent flow rate and the effect of additional of co-solvent are briefly discussed in section
2.7.2 and section 2.7.3, respectively. Finally the choice of the packing material and its effect
on the overall supercritical fluid extraction efficiency is reviewed. This chapter is ended with
main concluding marks found throughout this survey.
2.2 Objectives
The literature review is the initiation of this research project and the main objective of this
review is to present and analyse the directions in the research on using supercritical fluids
for the extraction of natural matters. To spot the perspective in which the research project is

Chapter 2 State of the Art
22
being carried out, thus identifying the implications this research might have on this field.
Also, to highlight basic definitions of solvents, supercritical fluids and solubility.
2.3 Fats and Oils
Oils and fats are an essential commodity in a number of wide applications. In our daily life,
there is hardly a product that we use does not contain fats as one of its ingredients. Oils and
fats are used in various industries such as food products, cosmetics, medicines, paints and
lubricants. Oil and fats are chemically similar however they differ in their physical
properties. At room temperature, oil is in liquid phase while fat is in solid phase. Fats and
oils are known for their hydrophobic property, and they are soluble in non-polar solvents.
They are mainly consists of triglycerides and minor components such as FFA, tocopherols
and phospholipids. They are derived from animal, fish and vegetable matter. This review is
focused on the fats and oils produced from vegetable sources.
2.3.1 Sources of Vegetable Fats and Oils
There are unlimited sources for the derivation of vegetable fats and oils. Crude vegetable oil
is obtained from oil milling units. The oil is further refined before distribution for edible use.
Palm oil, soy bean oil and sunflower are examples of vegetable oil; they are vastly produced
for commercial uses in various industries. Annual production rate of various vegetable oil
are illustrated in Chapter 1 of this work. Palm oil showed higher production rate among
other vegetable oils.
2.3.2 Palm Oil Refinery Process
Crude palm oil (CPO) can be refined either physically or chemically in order to eliminate
impurities such as FFA, soaps and colouring pigments. Refined, bleached and deodorizer
palm oil (RBDPO) is produced after physical refining, and neutralized, bleached and

Chapter 2 State of the Art
23
deodorizer palm oil (NBDPO) is produced chemically. Figure 2.1 illustrates main steps
involved in both physical and chemical refinery of CPO.
Figure 2.1: Refinery process of crude palm oil (Haslenda and Jamaludin 2011).
Degumming using phosphoric acid H3PO4 is an important step to remove phospholipids
from CPO. A vacuum bleaching process is carried out to remove colouring pigments, trace
metals and oxidative substances by applying slurry bleaching earth. Large amount of spent
bleaching earth (SPE) is generated during this process. Steam distillation is applied for
deodorization of CPO under vacuum pressure to ensure complete removal of FFA volatile
compounds and other contaminants. The principal difference in between physical and
chemical refining is the step of neutralization process where phospholipids and FFA are
removed by caustic soda NaOH solution reaction with CPO. In general, physical refining is
Chapter 2 State of the Art
24
preferred where chemical usage and water consumption is minimized (Haslenda and
Jamaludin 2011).
Various by-products are produced from CPO production. Fibre residue is formed from the
mechanical extraction of palm fruits to produce palm oil; the residue is a yellow-reddish
grass shape waste. This waste is mainly burned. The residue contains mainly carotenes;
36.4% α-carotene and 54.4% ß-carotene. Palm tree leaves are another by-product (waste)
that is produced from harvesting palm fruits. They contain α-tocopherol, ß-tocopherol and
y-tocopherol (Birtigh. et al, 1995). During the refining process of CPO several by-products
are generated mainly soap-stock, SBE and PFAD. PFAD has the potential to be sold and
processed to produce value-added products. PFAD is used in two main industries; animal
feed and laundry soap industries. PFAD also can be a good potential source of valuable
components such as squalene, tocopherol and FFA. Composition of PFAD varies and
squalene content is in the range of 0.8 – 4 wt%.
2.3.3 Palm Fatty Acid Distillate Main Components
Recognition of the health benefits of bioactive lipid components has led to growing interest
in understanding the separation and isolation of these components from vegetable source
such PFAD. The properties and application of some of these components present in PFAD
are summarized in Table 2.1. An overview of these components are presented in the
following section.
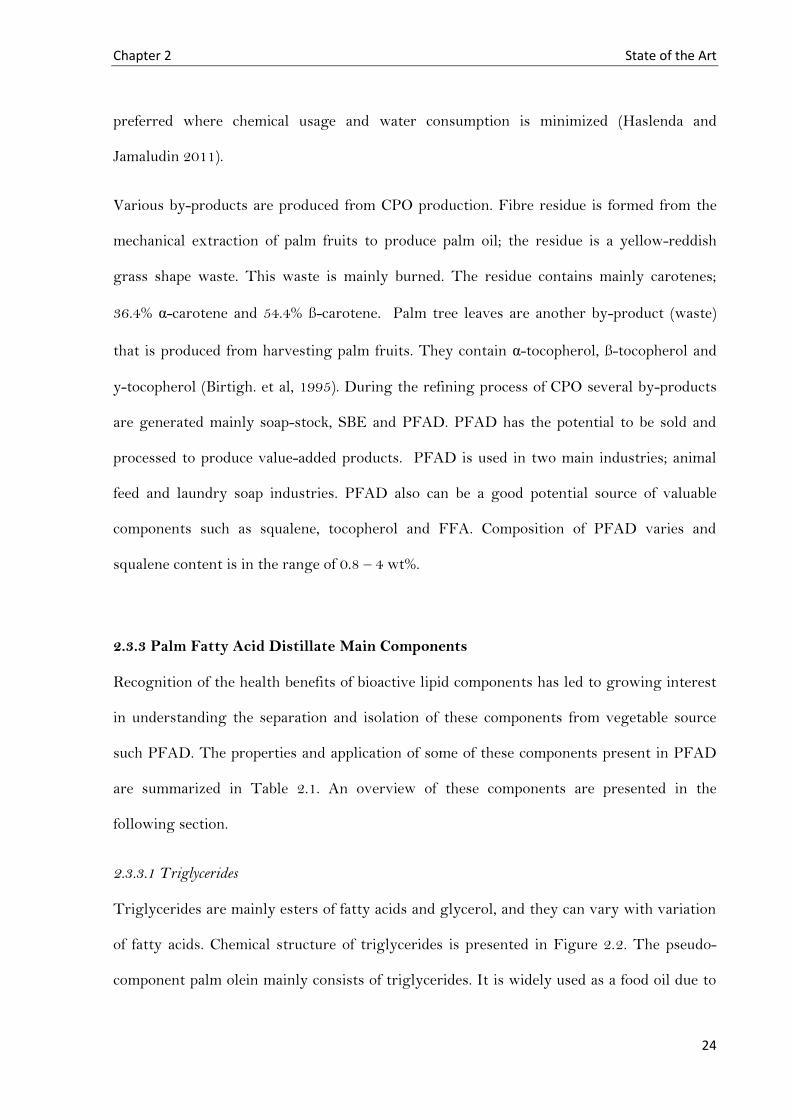
2.3.3.1 Triglycerides
Triglycerides are mainly esters of fatty acids and glycerol, and they can vary with variation
of fatty acids. Chemical structure of triglycerides is presented in Figure 2.2. The pseudo-
component palm olein mainly consists of triglycerides. It is widely used as a food oil due to
Chapter 2 State of the Art
25
the fact that monoacylglycerol production from palm olein increases advantages and
applications in pharmaceutical, cosmetic and food industries (Kaewthong and Kittikun 2004;
Cheirslip et al. 2007).
Figure 2.2: Chemical structure of triglycerides where R1, R2 and R3 are free fatty acids chains.
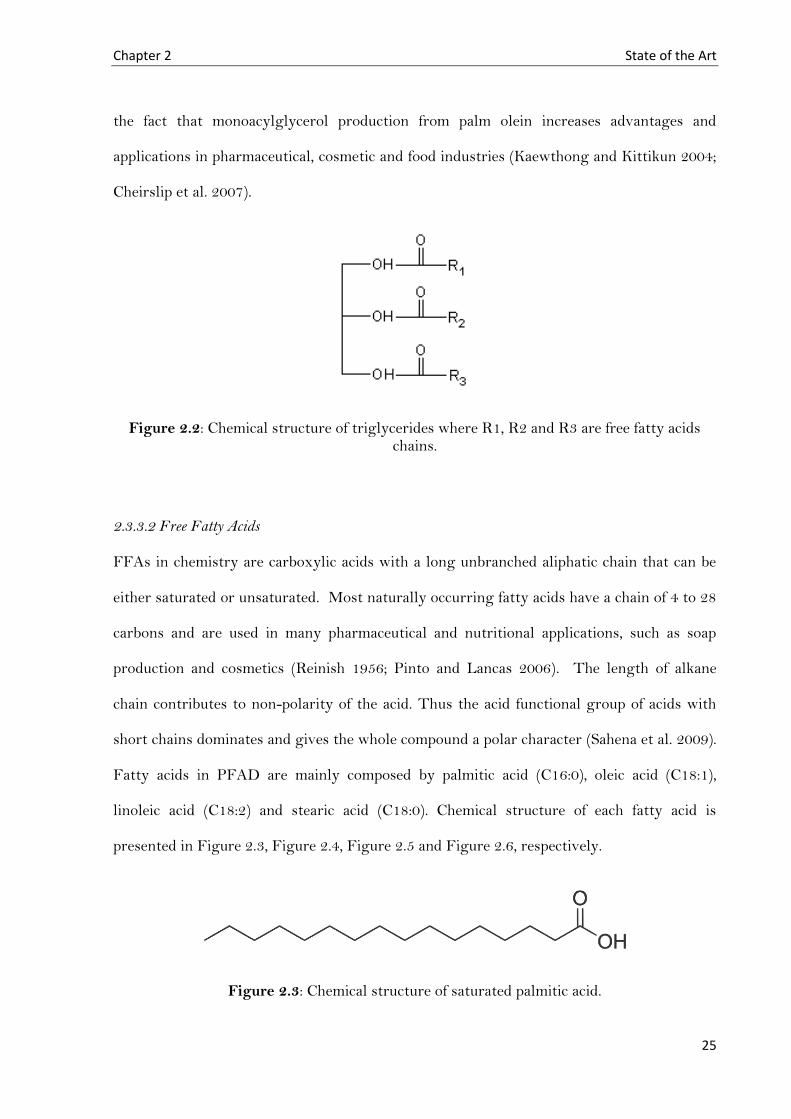
2.3.3.2 Free Fatty Acids
FFAs in chemistry are carboxylic acids with a long unbranched aliphatic chain that can be
either saturated or unsaturated. Most naturally occurring fatty acids have a chain of 4 to 28
carbons and are used in many pharmaceutical and nutritional applications, such as soap
production and cosmetics (Reinish 1956; Pinto and Lancas 2006). The length of alkane
chain contributes to non-polarity of the acid. Thus the acid functional group of acids with
short chains dominates and gives the whole compound a polar character (Sahena et al. 2009).
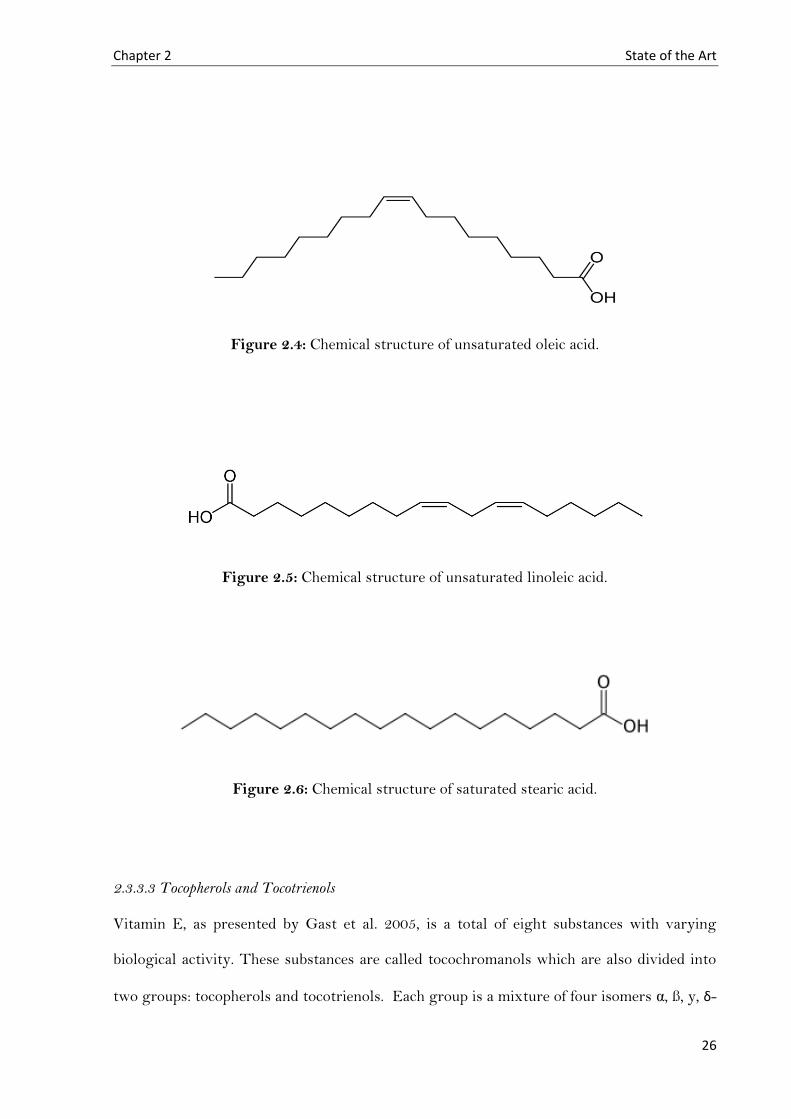
Fatty acids in PFAD are mainly composed by palmitic acid (C16:0), oleic acid (C18:1),
linoleic acid (C18:2) and stearic acid (C18:0). Chemical structure of each fatty acid is
presented in Figure 2.3, Figure 2.4, Figure 2.5 and Figure 2.6, respectively.
Figure 2.3: Chemical structure of saturated palmitic acid.
Chapter 2 State of the Art
26
Figure 2.4: Chemical structure of unsaturated oleic acid.
Figure 2.5: Chemical structure of unsaturated linoleic acid.
Figure 2.6: Chemical structure of saturated stearic acid.
2.3.3.3 Tocopherols and Tocotrienols
Vitamin E, as presented by Gast et al. 2005, is a total of eight substances with varying
biological activity. These substances are called tocochromanols which are also divided into
two groups: tocopherols and tocotrienols. Each group is a mixture of four isomers α, ß, y, δ-

Chapter 2 State of the Art
27
tocos (Mendes et al., 2005). Figure 2.7 shows the chemical structure of tocopherols and
tocotrienols where the double bonds appear in the side chain of the tocotrienols. α–
tocopherol has the highest biological activity and antioxidant characteristic among other
substances of tocochromanols. Tocopherols are antioxidants that eliminate free radicals for
primary defence in our body (Zacchi et al. 2006).
Figure 2.7: Chemical structure of tocochromanols.
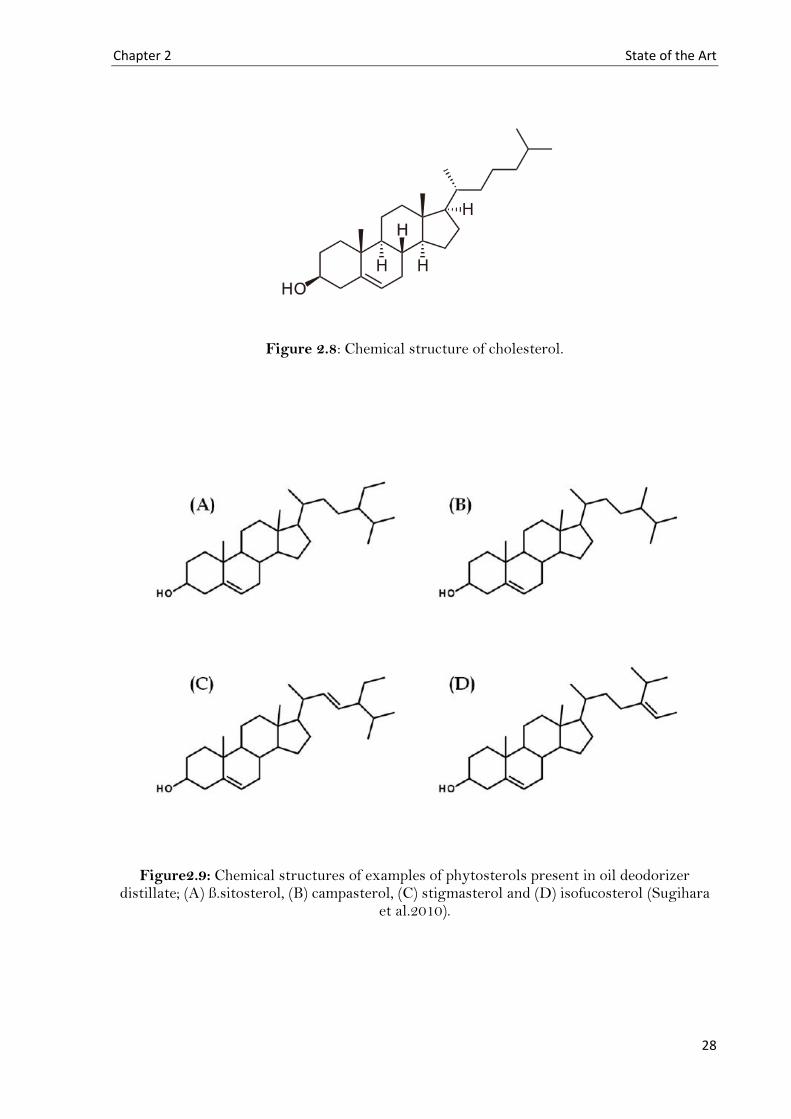
2.3.3.4 Phytosterols
Phytosterols are presented in PFAD in minor concentrations. The main Phytosterols that
are presented in vegetable deodorizer distillate are cholesterol, ß.sitosterol, campasterol,
stigmasterol and isofucosterol. Chemical structures of these components are illustrated in
Figure 2.8 and Figure 2.9. These compounds cover a major portion of the un-saponifiable
portion of the oil. Phytosterols are potential substances for utilization of functional foods
(Dunford and King, 2000).
Chapter 2 State of the Art
28
Figure 2.8: Chemical structure of cholesterol.
Figure2.9: Chemical structures of examples of phytosterols present in oil deodorizer distillate; (A) ß.sitosterol, (B) campasterol, (C) stigmasterol and (D) isofucosterol (Sugihara
et al.2010).

Chapter 2 State of the Art
29
2.3.3.5 Squalene
Squalene C30H50 (2, 6, 10, 15, 19, 23-hexamethyl tetracosaheaxaene) is an important non-
polar hydrocarbon component in the chemical and pharmaceutical industries. The main
natural source of squalene is fish liver oil which contains up to 70% by weight (Bakes and
Nichols. 1995). Also it occurs naturally in olive oil, palm oil, wheat germ oil and other
vegetable oils in lower concentrations. Squalene is also synthesised chemically under
enzymatic reactions (Spanova and Daum, 2011).
Squalene has several advantageous properties. It is responsible for cholesterol biosynthesis
(Mendes et al. 2000) and it is a natural antioxidant. It has been reported that squalene also
enhances blood oxygenation as well as it is considered as anticancer agent. Squalene is being
used as a moisturizing or emollient agent in cosmetic preparation (Bondioli et al. 1993;
Moreda et al, 2001). As Squalene has a very low freezing point (-72 ºC), a high boiling point
(430 ºC at 760 mmHg), and good thermal and frictional resistance, it has also been used to
produce high-grade oil and lubricant for certain scientific instruments (Kayama 1999). The
unique physical properties and physiological functions of squalene construct its importance
as resource for functional food and supplement (Bhilwade et al. 2010). Chemical structure of
squalene is presented in Figure 2.10.
Figure 2.10: Chemical structure of squalene.
Squalene is non-polar hydrocarbon with strong hydrophobic nature. High degree of un-
saturation of squalene causes instability and oxidation of this molecule. Squalene is one of

Chapter 2 State of the Art
30
the important lipids in human skin cells thus it is considered to be one of promising
constituent in cosmetics and skin products.
Shark skins and livers are the main source of natural squalene and squalene present
abundantly in whales with total concentration up to 70 wt. % (Catchpole et al.1997;
Catchpole et al. 2000). Although, shark liver oil can be considered a main source of squalene,
environmental and marine protection has placed regulations on the hunting of shark
(Spanova and Daum 2011). Therefore, motivation on researches towards finding alternative
sources aroused. There is great potential on the extraction and enrichment of squalene from
PFAD.
2.4 Conventional Separation Methods
There are several conventional methods for the extraction of lipids available in the
separation and purification industry. Organic solvent extraction and vacuum distillation are
common separation techniques existing in the industry.
2.4.1 Organic Solvent Extraction (Soxhelt Extraction)
Soxhelt extraction is a traditional extraction technique based on the affinity of the solute to
the solvent. There are many disadvantages of this extraction method; hazardous liquid
solvents are applied, low selectivity extraction, time consuming and costly (Sahena et al.
2009). Additional thermal procedure is required for the removal of solvent from final
product and this aspect limits the applicability of this method on thermal labile compounds.
There is threat on the environment because of the massive wide scale of the use of organic
solvent extraction in global industries.

31
Table 2-1: Summary of properties and applications of squalene, α-tocopherol, oleic acid, palmitic acid and palm olein.
Component Properties
Formula Mw (g/mole) Chemical structure Typical Applications
Squalene C30H50 410.73
Cholesterol biosynthesis
Cosmetics as natural moisturizer
Drug Carrier
α-tocopherol C29H50O2
430.17
Food and pharmaceutical
antioxidants
FFA
Oleic Acid
Palmitic acid
C18H34O2
C16H32O2
282.46
256.42
Soap productions
Cosmetics
Palm Olein 830a
Food oil/ Frying oil
Monoacylglycerol production
Cosmetic and food industries
a Pseudo-component palm olein molecular weight is estimated using its saponification value.
Chapter 2 State of the Art
32
2.4.2 Vacuum Distillation
In vacuum distillation, the operating pressure is reduced to be less than the vapour pressure
of lipid mixture. Thus, components with high volatility evaporate without the need of high
operating temperature to avoid degradation of thermal sensitive components. Boiling point
of a liquid decreases with pressure causing higher relative volatility (Liu et al. 2008). This
extraction process is more advantageous compared to organic solvent extraction. However,
these advantages are offset by the higher capital and operating cost of vacuum process.
Difficulty of extract separation in the condenser is another problem associated with this
technique (Westerman, 2004).
Extraction procedures ideally should have low environmental impact, low capital and
operating cost, and low final product impact. Organic solvent extraction and distillation do
not meet these criteria. Large volumes of contaminated and hazardous solvents are
associated with organic solvent extraction and large cost coupled with vacuum distillation.
Furthermore, there is pressure on the industry from United Nation Environmental Program
to adopt sustainable low environmental impact processes (Herrero et al. 2010). Limitations
of conventional methods and environmental regulations motivated scientists to discover and
utilize alternative green solvents for the extraction of lipid components from natural
matters.
2.5 Towards Green Solvents
In most chemical processes, a solvent is often involved and its importance is well recognized
by the scientists of chemical technology. A chemical process without the solvent utilization
scarcely exists. Therefore, the choice of solvents is of enormous importance. There is a huge
range of solvents available and the number is increasing, indicating there are infinite
numbers of the mixtures of these available solvents. There are 250 to 300 solvents available
Chapter 2 State of the Art
33
for industry and research use (Marcus, 1998; Marcus, 2002; Wypych, 2001). The vast
majority of the solvents used in industry are organic toxic solvents which account high
environmental impact. The hazards characteristics of conventional solvents on the
environment and on the natural products, led to the development of more friendly
alternative solvents. Consequently, moving towards green solvents is of great interest in
this century (Sheldon, 2005).
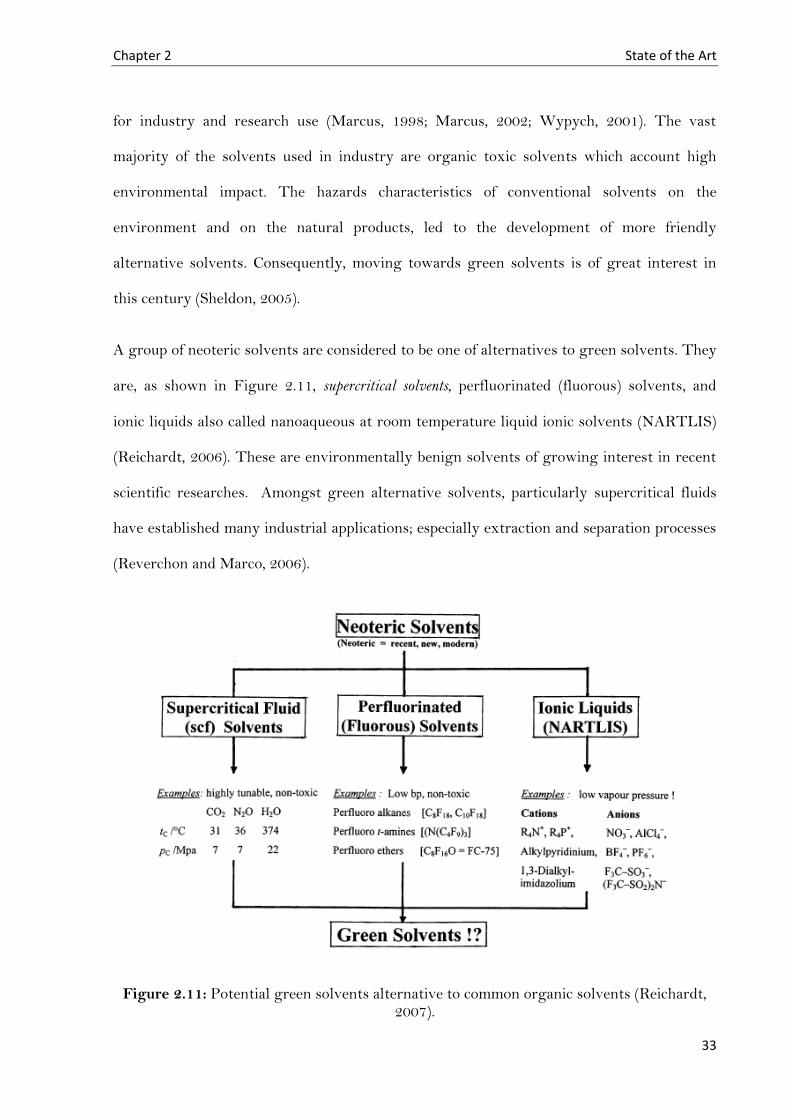
A group of neoteric solvents are considered to be one of alternatives to green solvents. They
are, as shown in Figure 2.11, supercritical solvents, perfluorinated (fluorous) solvents, and
ionic liquids also called nanoaqueous at room temperature liquid ionic solvents (NARTLIS)
(Reichardt, 2006). These are environmentally benign solvents of growing interest in recent
scientific researches. Amongst green alternative solvents, particularly supercritical fluids
have established many industrial applications; especially extraction and separation processes
(Reverchon and Marco, 2006).
Figure 2.11: Potential green solvents alternative to common organic solvents (Reichardt, 2007).
Chapter 2 State of the Art
34
2.6 Supercritical Fluids
Solvent power of compressed gas has been discovered over 100 years ago by Hannay and
Hogarth (1879). It was the beginning of new era in the field of solvents, as supercritical
fluids exhibit liquid-like solvent power. Supercritical fluids became one of the most attractive
fields of research due to their revolutionary properties, which lead to their applications in
many fields in chemical and pharmaceutical industries. Extraction and fractionation of high
value minor (in concentration) lipid components of edible oil using supercritical fluids have
been of particular interest for food and pharmaceutical industries.
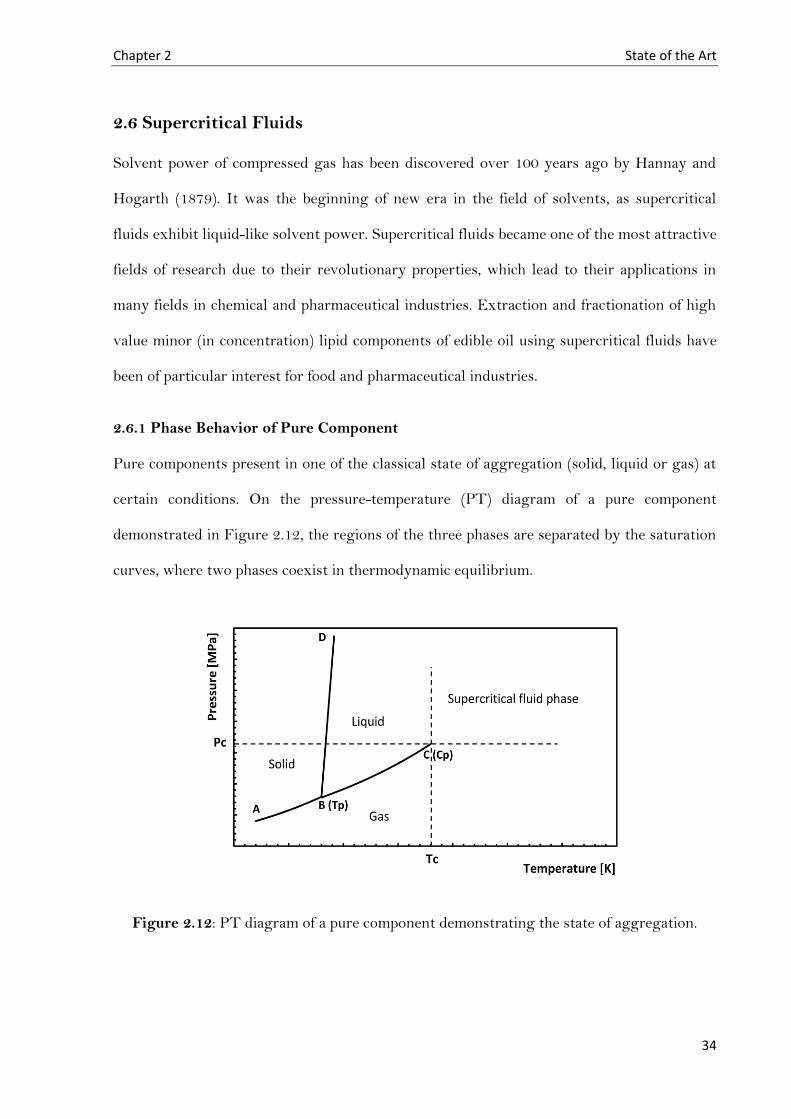
2.6.1 Phase Behavior of Pure Component
Pure components present in one of the classical state of aggregation (solid, liquid or gas) at
certain conditions. On the pressure-temperature (PT) diagram of a pure component
demonstrated in Figure 2.12, the regions of the three phases are separated by the saturation
curves, where two phases coexist in thermodynamic equilibrium.
Figure 2.12: PT diagram of a pure component demonstrating the state of aggregation.
Chapter 2 State of the Art
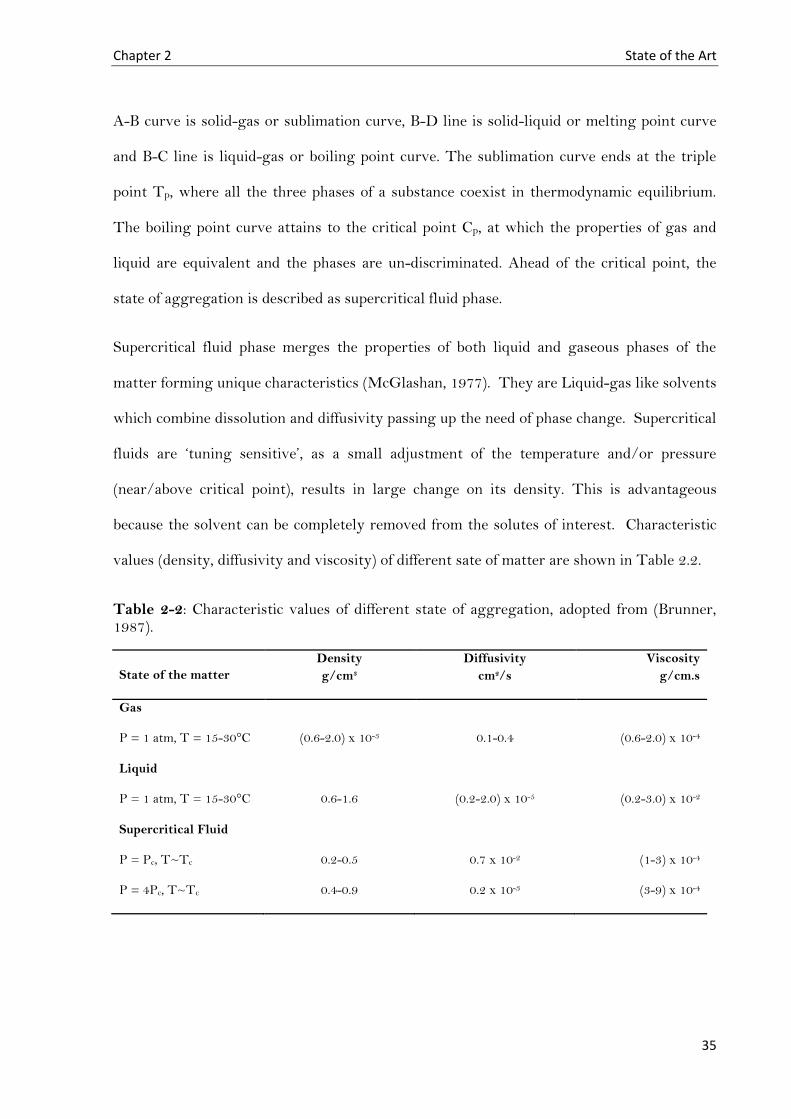
35
A-B curve is solid-gas or sublimation curve, B-D line is solid-liquid or melting point curve
and B-C line is liquid-gas or boiling point curve. The sublimation curve ends at the triple
point Tp, where all the three phases of a substance coexist in thermodynamic equilibrium.
The boiling point curve attains to the critical point Cp, at which the properties of gas and
liquid are equivalent and the phases are un-discriminated. Ahead of the critical point, the
state of aggregation is described as supercritical fluid phase.
Supercritical fluid phase merges the properties of both liquid and gaseous phases of the
matter forming unique characteristics (McGlashan, 1977). They are Liquid-gas like solvents
which combine dissolution and diffusivity passing up the need of phase change. Supercritical
fluids are ‘tuning sensitive’, as a small adjustment of the temperature and/or pressure
(near/above critical point), results in large change on its density. This is advantageous
because the solvent can be completely removed from the solutes of interest. Characteristic
values (density, diffusivity and viscosity) of different sate of matter are shown in Table 2.2.
Table 2-2: Characteristic values of different state of aggregation, adopted from (Brunner, 1987).
State of the matter
Density
g/cm3
Diffusivity
cm2/s
Viscosity
g/cm.s
Gas
P = 1 atm, T = 15-30°C (0.6-2.0) x 10-3 0.1-0.4 (0.6-2.0) x 10-4
Liquid
P = 1 atm, T = 15-30°C 0.6-1.6 (0.2-2.0) x 10-5 (0.2-3.0) x 10-2
Supercritical Fluid
P = Pc, T~Tc 0.2-0.5 0.7 x 10⁻² (1-3) x 10-4
P = 4Pc, T~Tc 0.4-0.9 0.2 x 10⁻³ (3-9) x 10-4

Chapter 2 State of the Art
36
2.6.2 Supercritical Carbon Dioxide
The distinctive properties of supercritical fluids promote scientists to explore and
investigate the utilization of these fluids in various chemical applications. Critical properties
of some substances used as supercritical solvents are shown in Table 2.3 (Arai et al, 2002).
CO2 is well investigated as the main supercritical solvent used in extraction processes of
natural compounds and production of pharmaceuticals due to its superior properties. It is
non-toxic, non-flammable and has mild critical conditions, 304 K and 7.3 MPa for
temperature and pressure respectively (Gast, et al. 2005). Also it has advantages of low cost,
and most importantly, its density (and therefore solvating power) is very sensitive to
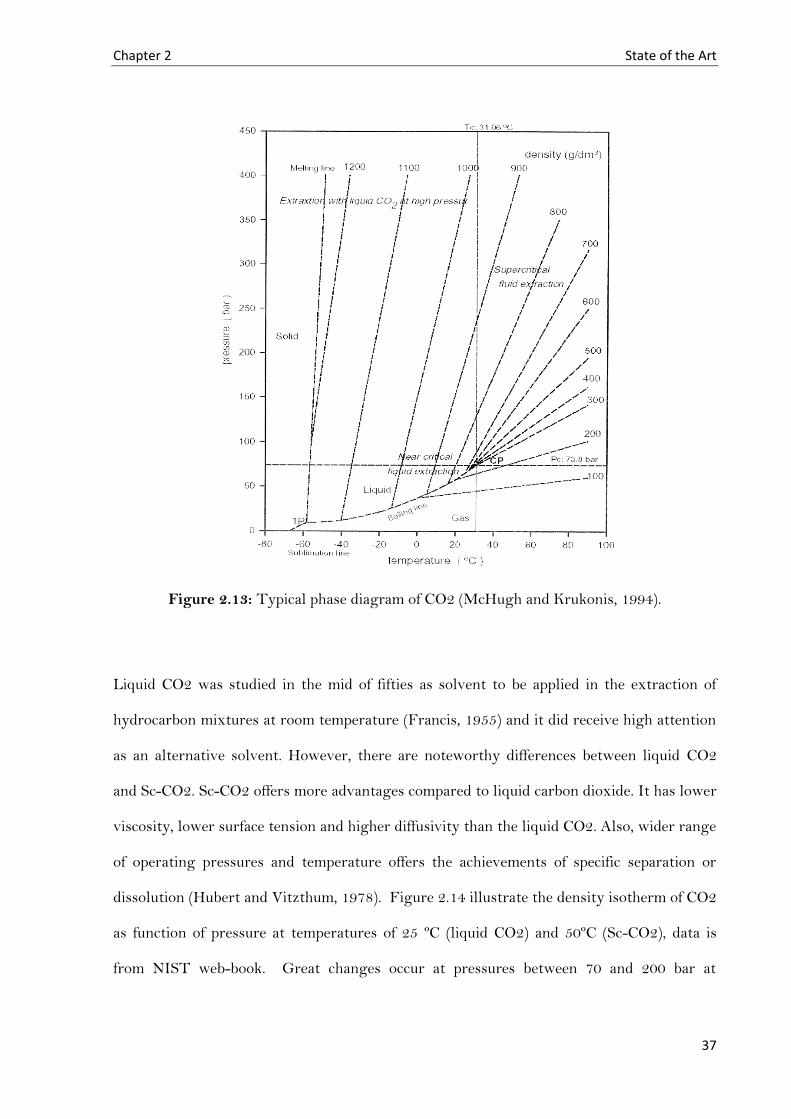
pressure changes around the critical region, typical phase diagram of CO2 is illustrated in
Figure 2.13 revealing density’s lines. This facilitates fractionation of components to a high
degree of purity, according to their solubility in Sc-CO2 (Hurtado-Benavides et al, 2004).
Table 2-3: Critical point of substances which are used as supercritical fluid solvents.
Molecule Formula
Critical Properties Toxicity and
flammability Tc (K) Pc (MPa)
Argon Ar 151 49 -
Methane CH4 191 45 Highly flammable
Carbon Dioxide CO2 304 73 -
Ethane C2H6 305 48 Highly flammable
Propane C3H8 370 42 Extremely flammable
Ammonia NH3 406 111 Toxic
Water H2O 647 218 -
Chapter 2 State of the Art
37
Figure 2.13: Typical phase diagram of CO2 (McHugh and Krukonis, 1994).
Liquid CO2 was studied in the mid of fifties as solvent to be applied in the extraction of
hydrocarbon mixtures at room temperature (Francis, 1955) and it did receive high attention
as an alternative solvent. However, there are noteworthy differences between liquid CO2
and Sc-CO2. Sc-CO2 offers more advantages compared to liquid carbon dioxide. It has lower
viscosity, lower surface tension and higher diffusivity than the liquid CO2. Also, wider range
of operating pressures and temperature offers the achievements of specific separation or
dissolution (Hubert and Vitzthum, 1978). Figure 2.14 illustrate the density isotherm of CO2
as function of pressure at temperatures of 25 ºC (liquid CO2) and 50ºC (Sc-CO2), data is
from NIST web-book. Great changes occur at pressures between 70 and 200 bar at

Chapter 2 State of the Art
38
supercritical conditions compared to that for liquid CO2. Both isotherms show insignificant
changes above pressure of 300 bar.
Figure 2.14: Density isotherm of CO2 as function of pressure (liquid CO2 at 25ºC, and Sc-CO2 at 50ºC)
2.6.3 Polarity Attributes of Carbon Dioxide
Solvent effects or solvation power are usually understood in terms of solvent polarity.
Understanding a solvent and its influence in the solution is of high importance especially
with a highly tuneable solvent like Sc-CO2. Near the critical region of CO2, the solvent
strength is sensitive to any small variation of both pressure and temperature. Therefore, it is
vital to know the solvent strength of Sc-CO2 as function of variables of state. The physical
characteristics such as density and diffusivity of the solvent are not sufficient to understand
its effects, but also the molecular level characteristics are in the same level of importance.
0
0.2
0.4
0.6
0.8
1
1.2
0 100 200 300 400 500 600
ρ[g
/cm
3 ]
P [bar]
Chapter 2 State of the Art
39
The combination of macroscopic and microscopic approaches (solvent polarity) is therefore
important to describe the solvent-solute interactions (Katritzky, 2004).
Historically, Sc-CO2 was considered as a nonpolar solvent with low dielectric constant and
zero dipole moment comparable to that of alkanes, and with the ability of microscopic
measurements of solvent polarity at microscopic level, this view is changing slowly. Hyatt
(1984) and Ikushima et al. (1991) measured Sc-CO2 solvent polarity parameter via Infrared
Spectroscopy. Their findings concluded that the Sc-CO2 behaves very much like a
hydrocarbon solvent with very low molecular polarizability.
Carbon dioxide is also described as a quadrupolar solvent (Kauffman, 2001) because of it
significant quadrupole moment that is caused by the charge-separated molecule with
significant nonzero bond dipole moments. These quadrupole characteristics are considered
to be responsible of the Sc-CO2 polar attributes, as the overall electronic structure of CO2
allows it to act as either a Lewis acid or a Lewis base (Raveendran, 2005).
Molecular level understanding of the nature of CO2 and its polarity characteristics lead to a
further perceptive of the sort of molecular systems that can dissolve in CO2. Classes of
compounds that are soluble in liquid and Sc-CO2 are illustrated in table 2.4.
Although there is no significant difference in polarity between liquid and SC-CO2 (Hyatt,
1984), but the unusual properties of Sc-CO2 (infinite compressibility, low surface tension,
and low viscosity) lead to its utility as solvent for the extraction and separation of natural
matters.
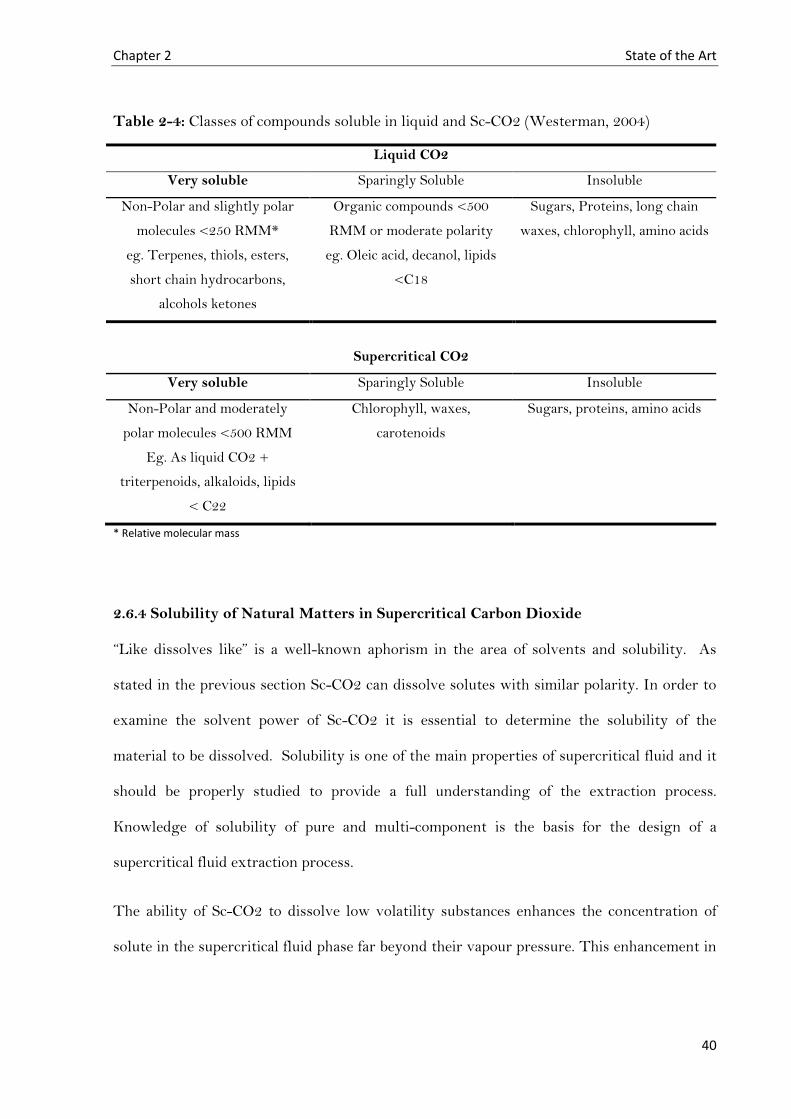
Chapter 2 State of the Art
40
Table 2-4: Classes of compounds soluble in liquid and Sc-CO2 (Westerman, 2004)
Liquid CO2
Very soluble Sparingly Soluble Insoluble
Non-Polar and slightly polar
molecules <250 RMM*
eg. Terpenes, thiols, esters,
short chain hydrocarbons,
alcohols ketones
Organic compounds <500
RMM or moderate polarity
eg. Oleic acid, decanol, lipids
<C18
Sugars, Proteins, long chain
waxes, chlorophyll, amino acids
Supercritical CO2
Very soluble Sparingly Soluble Insoluble
Non-Polar and moderately
polar molecules <500 RMM
Eg. As liquid CO2 +
triterpenoids, alkaloids, lipids
< C22
Chlorophyll, waxes,
carotenoids
Sugars, proteins, amino acids
* Relative molecular mass
2.6.4 Solubility of Natural Matters in Supercritical Carbon Dioxide
“Like dissolves like” is a well-known aphorism in the area of solvents and solubility. As
stated in the previous section Sc-CO2 can dissolve solutes with similar polarity. In order to
examine the solvent power of Sc-CO2 it is essential to determine the solubility of the
material to be dissolved. Solubility is one of the main properties of supercritical fluid and it
should be properly studied to provide a full understanding of the extraction process.
Knowledge of solubility of pure and multi-component is the basis for the design of a
supercritical fluid extraction process.
The ability of Sc-CO2 to dissolve low volatility substances enhances the concentration of
solute in the supercritical fluid phase far beyond their vapour pressure. This enhancement in
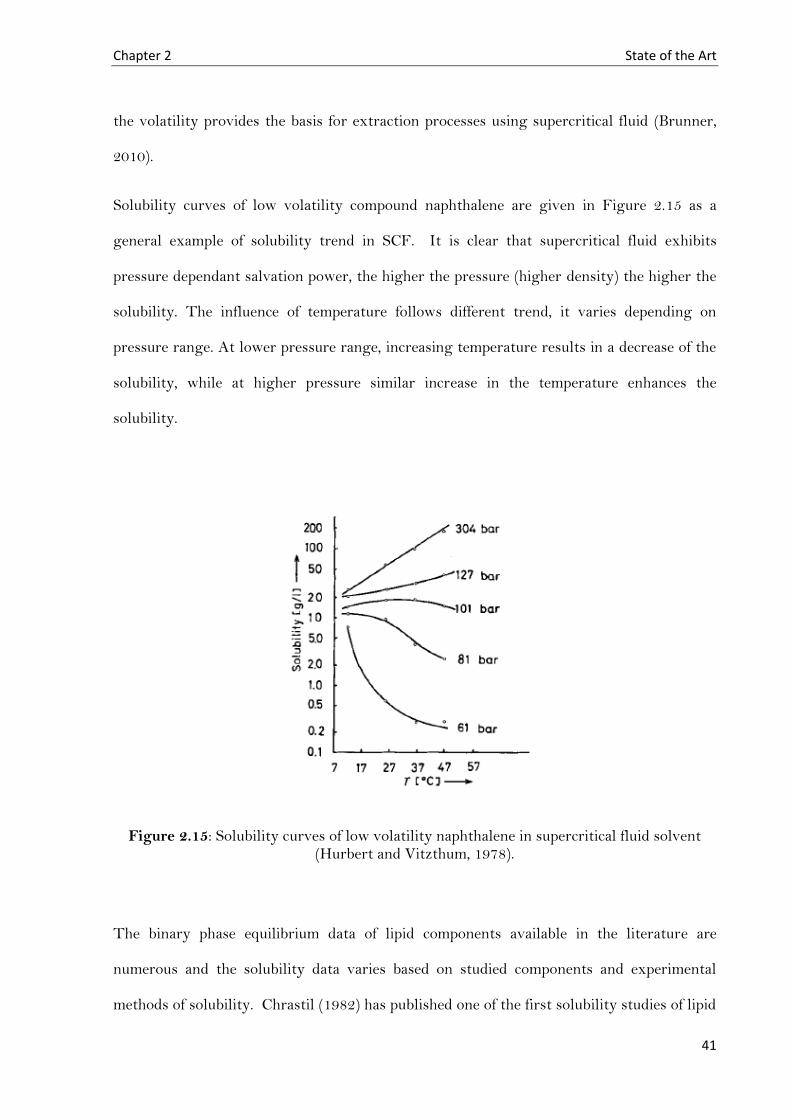
Chapter 2 State of the Art
41
the volatility provides the basis for extraction processes using supercritical fluid (Brunner,
2010).
Solubility curves of low volatility compound naphthalene are given in Figure 2.15 as a
general example of solubility trend in SCF. It is clear that supercritical fluid exhibits
pressure dependant salvation power, the higher the pressure (higher density) the higher the
solubility. The influence of temperature follows different trend, it varies depending on
pressure range. At lower pressure range, increasing temperature results in a decrease of the
solubility, while at higher pressure similar increase in the temperature enhances the
solubility.
Figure 2.15: Solubility curves of low volatility naphthalene in supercritical fluid solvent (Hurbert and Vitzthum, 1978).
The binary phase equilibrium data of lipid components available in the literature are
numerous and the solubility data varies based on studied components and experimental
methods of solubility. Chrastil (1982) has published one of the first solubility studies of lipid

Chapter 2 State of the Art
42
components such as α-tocopherol, triglycerides and fatty acids in supercritical fluids. He
performed solubility measurements in temperature range of 313-353 K and pressure of 8-25
MPa. Triglycerides and fatty acids are the main components present in vegetable and
animal fats. King et al. (1997), Nilsson et al. (1991), and Bharath et al. (1992) have measured
solubility of binary systems of mono-, di- and triglycerides as triolein in temperature range
of 308.2-353.2 at pressures of 0.1-31 MPa. Recently, Fernandez-Roco et al. (2010) have
presented experimental data of the solubility of triglycerides in CO2. The solute was triolein
and measurements were performed at one temperature of 315.2 K in pressure range of 9.8-
30.2 MPa.
FFAs studied by Chrastil (1982) were stearic acid and oleic acid. Maheshwari et al. (1992)
and Skerget et al. (1995) have also studied the solubility of oleic acid in Sc-CO2 at
temperatures of 313K, 333K and 353K at pressure range of 5-30 MPa. Many researchers are
keen to produce new solubility data of lipid components in Sc-CO2 in the last decade because
of the discrepancy in the data developed. Comparison of solubility data are discussed later in
the text (Chapter 4). These differences between authors could be attributed to many factors
such as components purity and the difficulty of sampling of solutes. Recent solubility
measurements of oleic acid were performed by Fernandez-Roco et al. (2010), Hong et al.
(2010) and Penedo et al. (2009).
Components present in trace amounts in many vegetable oils and their by-products have
gained substantial attention in the study if their solubility in supercritical fluids.
Particularly the solubility of α-tocopherol has been measured by several researchers.
Johannsen and Brunner (1997) have measured the solubility of α-tocopherol at temperatures
of 313 K, 333 K and 353 K at pressure range of 19.9-34.9 MPa. They found the highest
solubility at temperature and pressure of 333 K and 35 MPa (higher density), respectively.
Fang et al. (2004) performed α-tocopherol solubility measurements at the same temperature

Chapter 2 State of the Art
43
range but at pressure not more than 29 MPa. Fang found the maximum solubility to be at
temperature of 313 K at 29 MPa. Comparison of the solubility data found in the literature
has been discussed later in the text.
Compared to the other lipid components, few studies have been conducted for the solubility
of squalene. Catchpole et al. (1997) have conducted the first solubility measurements for the
binary system squalene-CO2. The study was performed via continuous packed column
method over pressure range of 10-25 MPa and temperature range of 313-333 K. Another
study was performed by Brunner et al. (2009) over a pressure range of 12-30 MPa and
temperature range of 333-373 K. Recently new squalene solubility data were published by
Hernandez et al. (2010) and Martinez-Correa et al. (2010). Martinez performed the
measurements at pressures above 30 MPa.
Solubility data of binary systems on its own does not provide sufficient information for
estimating if certain substance is extractable from its original matrix. Thus, solubility data
of multi-component systems are essential. The solute-solute interactions are raised in these
systems and adequate understanding of these interactions is important for the design of
supercritical fluids separation processes. Data available on such systems is scarce and a
small number of studies have been found in the literature.
Zou, Yu and Rizvi have developed a series of publications on phase equilibrium studies on
multi-component systems; ternary systems of fatty acids and fatty acid esters (1992), data of
anhydrous milk fat in Sc-CO2 at wide range of pressure and temperature (1992) and phase
equilibrium data of mixture of methyl oleate and oleic acid (1993).
Catchpole et al. (1997) predicted the ternary phase equilibrium of model mixtures of
squalene and triglyceride using Peng. Robinson equation. The interaction between squalene
and triglycerides was assumed to be zero.
Chapter 2 State of the Art
44
Stoldt and Brunner (1998) have investigated the phase equilibrium of real systems of fats
such as crude palm oil and soybean oil deodorizer distillate. All measurements were
conducted at pressures above 20 MPa. A further study was found by Stoldt and Brunner
(1999) focused on the phase equilibrium of complex model systems of palm oil deodorizer
condensates in Sc-CO2. They performed the measurements at pressure range between 20 to
29.5 MPa at temperatures of 343, 353 363 and 373 K. Three mixtures of palm oil deodorizer
condensate where studied with various concentrations of fatty acids and tocopherols.
Squalene has shown great potential in the food and cosmetic industries and the extraction of
it in organic-solvent-free processes is vital according to regulations surrounding these
industries. Few researchers have addressed the solubility of squalene in multi-component
culture. Stoldt and Brunner (1998) have investigated phase equilibrium of soybean oil
deodorizer condensates with different squalene concentrations. However, soybean oil
deodorizer condensates used in their study varies in the content of other components such as
sterols, tocopherols and glycerides. Thus, reliable conclusions on the effect of squalene
content on the solubility are relatively difficult to achieve. Also, investigations were
conducted at pressure above 20 MPa. Two studies on phase equilibrium of ternary system
methyl oleate/squalene/CO2 (Ruivo et al. 2004) and ternary system oleic
acid/squalene/CO2 (Ruivo et al. 2007) have been conducted. The purpose of Ruivo study
was to verify the ability of Sc-CO2 to separate methyl oleate from squalene at pressure and
temperature range of 11-21 MPa and 313-343 K, respectively. The investigations on the
ternary system of oleic acid and squalene were performed at temperatures of 313-333 K at
pressures of 14-22 MPa with various concentrations of squalene content between 25-75
wt%. In both studies, the highest solubility of the mixture was obtained for the oil feed with
the highest content of the most soluble component in CO2.
Chapter 2 State of the Art
45
2.6.5 Applications of Supercritical Fluids
The unique and environmental friendly nature of supercritical fluids has led scientists to
explore the utility of supercritical fluids in various applications especially that for Sc-CO2.
The applications of Sc-CO2 are in continuous grow and are spread worldwide to replace
hazardous solvents. Some of the applications are in the development stage while others
moved forward to the industrial stage. In this context few examples of these applications are
discussed briefly as following:
2.6.5.1 Supercritical Fluid Chromatography
Chromatography is an analytical technique which intends to separate a mixture of
components into individual components. Supercritical fluids chromatography combines
features of both gas chromatography and liquid chromatography therefore it offers many
interesting possibilities under suitable choices of operating parameters, see Figure 2.16;
unification of chromatography (Taylor, 2009). The use of supercritical fluid as carrier
solvent overcome the limitation of high working temperature to reach the required
volatility, especially for the thermal sensitive component systems. In SCF chromatography,
the use of the elevated column pressures can offer new dimensions of flexibility in
controlling the chromatographic retention process (Roth, 1992).

Chapter 2 State of the Art
46
Figure 2.16: Unification of chromatography illustrating the supercritical fluid chromatography position compared to liquid and gas chromatography (Taylor, 2009).
2.6.5.2 Particle Formation
The outstanding features of supercritical fluid transformed it to a great solvent with various
(on-going) applications in many fields. Particle formation is one of the important
applications in numerous industries especially in the area of pharmaceutical. Conventional
methods showed poor control on particle size and harmful solvents residue in the formed
particles (Palakodaty and York, 1999). The advantages of the properties of supercritical fluid
capable of overcoming the limitations of the conventional powder formation processes.
There are four main categories on the application of particle formation using Sc-CO2 based
on the role of CO2 and the application of second solvent (Hakuta et.al., 2003). Sc-CO2
particle formation categories are discussed briefly as following;
Rapid expansion of supercritical solutions (RESS)
In RESS process, the target (active) compound is first dissolved into Sc-CO2 at
certain conditions of state to form supercritical solution. Supercritical solution then
sprayed at atmospheric pressure via capillary nozzle. Rapid drop in pressure leads to
formation of particles with micron size. Schematic diagram of RESS process is
illustrated in Figure 2.17 (a).
Chapter 2 State of the Art
47
Supercritical anti-solvent (SAS)
Contrary to RESS process, Sc-CO2 acts as anti-solvent in SAS particle formation
method. The compound first dissolved in an organic solvent such as
dichloromethane. Subsequently Sc-CO2 is fed into the system which leads to solution
expansion forcing the dissolved compound to drop in micro-size particles. SAS
diagram is illustrated in Figure 2.17 (b).
Particle formation from gas saturated solutions (PGSS)
In the PGSS process, fine particles of polymers can be formed. As Sc-CO2 can
dissolve into melted polymers, polymers first melted at certain temperature then Sc-
CO2 is fed to the process. The saturated solution then sprayed and expanded into a
collection chamber (as shown in Figure 2.17 (c) causing super-cooling, thus fine
particles polymer is produced.
Depressurization of an expanded liquid organic solution (DELOS)
Instead of melting polymers at certain temperature described previously in PGSS
method, in DELOS process polymers are dissolved in organic solvents in order to
avoid thermal degradation. Polymer-organic solvent solution is then mixed with Sc-
CO2 in high pressure mixing vessel as shown in Figure 2.17 (d). Mixed solution is
sprayed in a precipitation vessel where fine particles are formed and collected.

Chapter 2 State of the Art
48
Figure 2.17: Schematic diagrams of the main categories of supercritical CO2 particle formation: (a) RESS process, (b) SAS process, (c) PGSS process, and (d) DELOS process
(Hakuta et.al. 2003).
2.6.5.3 Supercritical Drying
The application of Sc-CO2 drying in the production of aerogels have been reported and
studied by various researchers (Shimoyama et.al. 2010, Kawakami et.al. 2000) because of the
great advantage of surface tension fading in SCFs. In this process, Sc-CO2 is used to remove
an organic solvent, e.g., ethanol or acetone, from the gel. A schematic diagram of the drying
process is given in Figure 2.18 for the production of titania aerogels. Aerogels production
via Sc-CO2 have been investigated for varies functions mainly to be used as catalysts
supports and as pharmaceuticals carriers (Brunner, 2010).
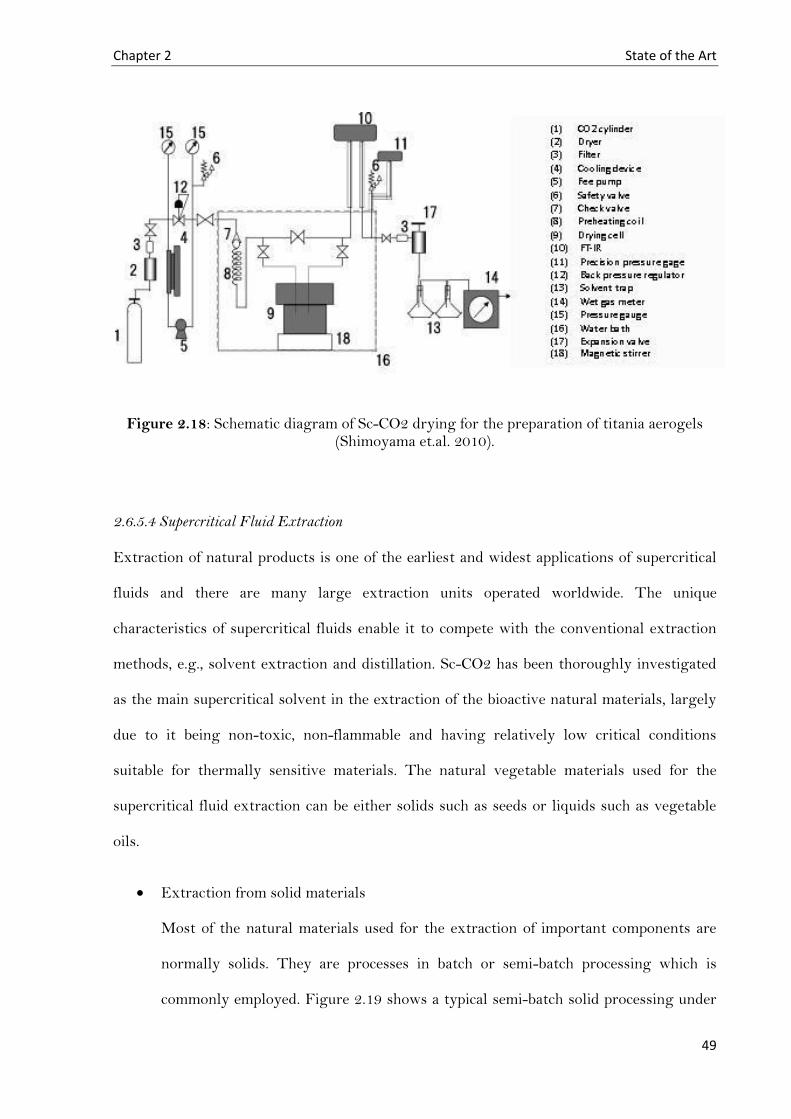
Chapter 2 State of the Art
49
Figure 2.18: Schematic diagram of Sc-CO2 drying for the preparation of titania aerogels (Shimoyama et.al. 2010).
2.6.5.4 Supercritical Fluid Extraction
Extraction of natural products is one of the earliest and widest applications of supercritical
fluids and there are many large extraction units operated worldwide. The unique
characteristics of supercritical fluids enable it to compete with the conventional extraction
methods, e.g., solvent extraction and distillation. Sc-CO2 has been thoroughly investigated
as the main supercritical solvent in the extraction of the bioactive natural materials, largely
due to it being non-toxic, non-flammable and having relatively low critical conditions
suitable for thermally sensitive materials. The natural vegetable materials used for the
supercritical fluid extraction can be either solids such as seeds or liquids such as vegetable
oils.
Extraction from solid materials
Most of the natural materials used for the extraction of important components are
normally solids. They are processes in batch or semi-batch processing which is
commonly employed. Figure 2.19 shows a typical semi-batch solid processing under
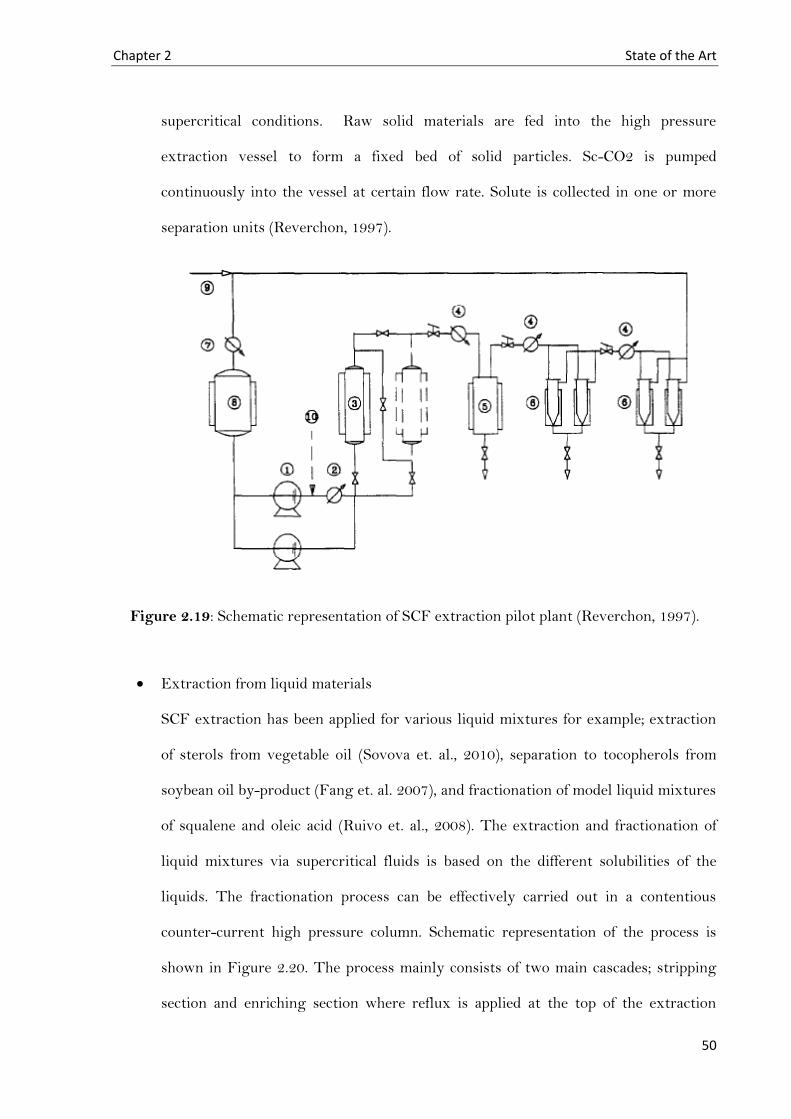
Chapter 2 State of the Art
50
supercritical conditions. Raw solid materials are fed into the high pressure
extraction vessel to form a fixed bed of solid particles. Sc-CO2 is pumped
continuously into the vessel at certain flow rate. Solute is collected in one or more
separation units (Reverchon, 1997).
Figure 2.19: Schematic representation of SCF extraction pilot plant (Reverchon, 1997).
Extraction from liquid materials
SCF extraction has been applied for various liquid mixtures for example; extraction
of sterols from vegetable oil (Sovova et. al., 2010), separation to tocopherols from
soybean oil by-product (Fang et. al. 2007), and fractionation of model liquid mixtures
of squalene and oleic acid (Ruivo et. al., 2008). The extraction and fractionation of
liquid mixtures via supercritical fluids is based on the different solubilities of the
liquids. The fractionation process can be effectively carried out in a contentious
counter-current high pressure column. Schematic representation of the process is
shown in Figure 2.20. The process mainly consists of two main cascades; stripping
section and enriching section where reflux is applied at the top of the extraction
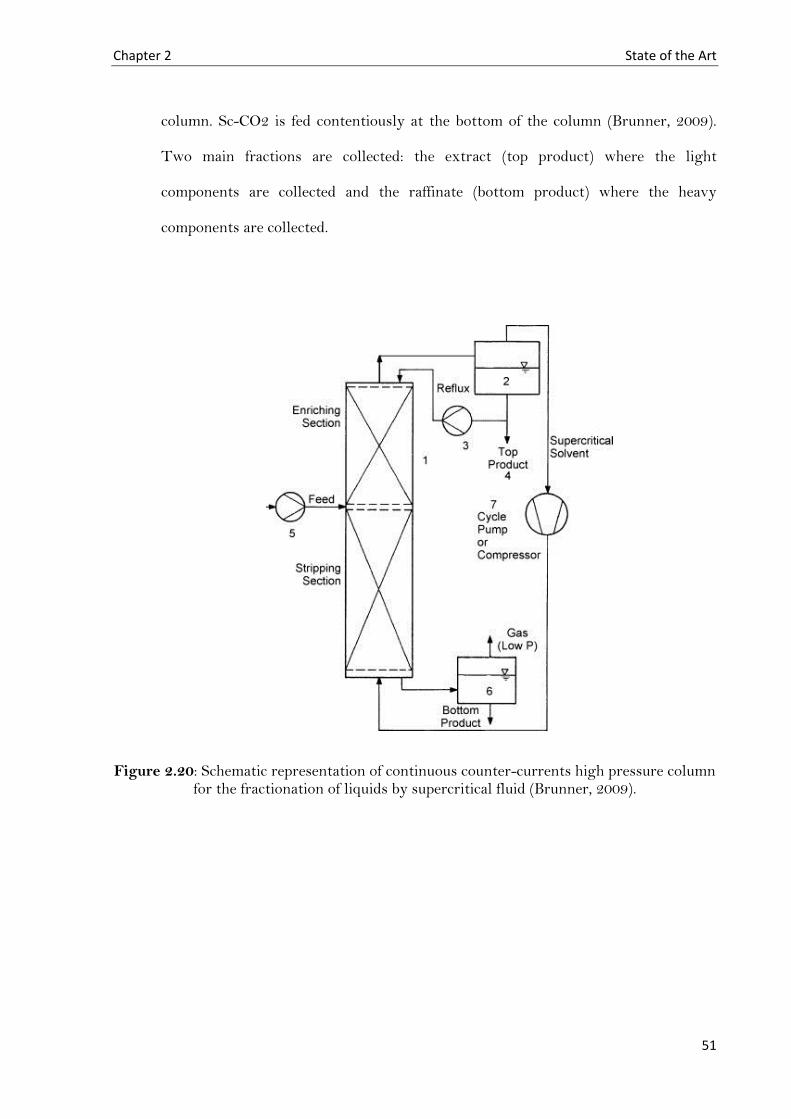
Chapter 2 State of the Art
51
column. Sc-CO2 is fed contentiously at the bottom of the column (Brunner, 2009).
Two main fractions are collected: the extract (top product) where the light
components are collected and the raffinate (bottom product) where the heavy
components are collected.
Figure 2.20: Schematic representation of continuous counter-currents high pressure column for the fractionation of liquids by supercritical fluid (Brunner, 2009).
Chapter 2 State of the Art
52
2.7 State of the Art of Supercritical Fluids Extraction and Separation
The fundamentals of supercritical fluids and its principles in the application of separation
had been known for many years. However, techniques for such processes were only
developed and studied in the fifties and sixties. One of the first studies applying supercritical
fluids for the purpose of separation in the middle of the 1960s was reported by Sie and
Rijnders (1967). Their study was mainly for analytical purposes by applying supercritical
fluids in chromatography. During the period of 1970s till the beginning of the 1980s, many
studies were devoted on the application of supercritical carbon dioxide in chromatography
(Jentoft and Gouw,1972; VanWasen and Schneider, 1975; Springston and Novotny, 1981;
Wilsch and Schneider, 1983; Wilsch et al., 1983).
The first study on the extraction of lipid materials via Sc-CO2 was conducted by Stahl et al.
(1982) with batch process approach. Afterwards the researchers were interested on the
application of supercritical fluids in a continuous mode due to the importance and enormous
advantages of continuous approaches over batch processes. The early supercritical column
fractionation studies were concentrated on the separation of alcohol from alcohol/water
mixtures in a counter-current continuous mode as (Rathkamp et.al, 1987; Lahiere and Fair,
1987; Seibert and Moosberg, 1988). These studies investigated three different modes of
continuous counter-current extraction of alcohol: spray column, sieve tray column and
packed column, under supercritical conditions. Rathkamp investigated the mass transfer
performance of two systems: Sc-CO2/ethanol/water system and Sc-CO2/iso-
propanol/water system in spray and packed column modes. Higher mass transfer efficiencies
were found in packed column compared to those of spray columns. The packing had the
effect of increasing the availability of mass transfer area by decreasing the drop rise velocity
of the dispersed phase. Lahiere and Fair determined the mass transfer efficiencies of
extraction column operated as a spray, a sieve tray, and a packed column for systems similar

Chapter 2 State of the Art
53
to that used by Rathkamp. They concluded that the efficiency of packed column is greater
than that of tray and spray column. Analogous conclusions were found by Seiberst and
Moosberg for the iso-propanol/water system.
By the end of 1980s and the beginning of the 1990s, the interest towards the separation of
real systems received attention such fish oils, vegetable oils and deodorizer distillates. Rizvi
et al. (1988) and Nilsson et al. (1989) have studied the separation of esters from fish oil using
Sc-CO2. Processing of lampante olive oil (Bondioli et al. 1992) and olive oil deodorizer
distillate (Bondioli et al. 1993) in supercritical counter-current extraction were also studied.
Work and investigations conducted on the separation processes via supercritical fluids in the
period of 1980s and 1990s are summarised in Table 2.5 and Table 2.6, respectively.
In the recent years, the number of publications on the extraction and recovery of various
components from real natural matters has grown and the interest towards Sc-CO2 as an
alternative solvent motivated researchers and scientist to put in further investigations on
this area from bench scale to pilot plant scale. Fractionation of crude palm oil was studied
(Markom et al. 2001; Chuang and Brunner 2006). Similar investigations were performed for
shark liver oil and fish oils by several authors (Catchpole et al. 2000; Riha and Brunner 2000;
Vazquez et al. 2008). Table 2.7 summarise the investigations on supercritical fluid
separation process of liquid materials for the period 2000 to 2010.
The interest in the isolation and separation of minor valuable lipid components is in
continuous growth. Particular emphasis has been paid on the separation of these
components from model mixtures and real systems. Separation and extraction of
tocopherols from liquid feed materials has been studied by various researchers: tocopherols
from wheat germ oil (Zacchi et al. 2006), extraction of α-tocopherol from model mixture of
tocopherol/squalene (Mendes et al. 2000) and from crude palm oil and soy oil deodorizer
Chapter 2 State of the Art
54
distillate (Gast et al. 2005) with extraction pressure above 20 MPa. Tocopherols were also
studied to be isolated from soybean oil by-product (Fang et al. 2007) at pressures lower than
20 MPa.
Limited studies were donated for the enrichment of sterols. Sterol extraction and
enrichment from olive oil have been studied intensively by Ibanez et al. (2002) and
Hurtando-Benavides et al. (2004). Rice bran oil found and its deodorization distillate have
found to be good source of phytosterols (Dunford and King 2001; Sugihara et al. 2010).
Investigations concluded that sterols are more likely to be enriched in the raffinate because
of its low solubility in Sc-CO2.
Few works has been carried out on the separation of squalene with the application of Sc-
CO2. Bondioli et al. (1993) carried out counter-current continuous separation of squalene
from olive oil deodorizer distillate. High purity and yields were achieved because of the
conversion of FFA and ester to their corresponding triglycerides. Vazquez et al. (2008) has
also suggested a chemical esterification step of olive oil deodorizer condensate prior to SCF
extraction in order to convert FFA to esters. Thus, raw material composition has great
influence on the extraction of squalene, in supercritical fluid extraction column it can be
either in top product or in the raffinate based on the feed system composition. In the case of
olive oil deodorisation distillate squalene was recovered in the extract (Bondioli et al. 1993),
while squalene from esterified deodorization distillate was recovered in the raffinate
(Vazquez et al. 2008). In the latter, different conditions were carried out for squalene
isolation compared to those used when olive oil deodorizer distillate and shark liver oil are
the raw material.
The squalene content in the raw material is more than 20 wt% in most of the publications
found. Limited research donated on the separation of squalene with relatively low
concentration <5 wt%. Chuang and Brunner (2006) studied the enrichment of minor
Chapter 2 State of the Art
55
constituents from crude palm oil using supercritical fluid mixer-settler. Squalene was
concentrated in the raffinate from 400 ppm to 33000 ppm.
Research studies on processing PFAD are scarce compared to other vegetable oils
condensates. Stoldt and Brunner (1999) have determined experimental phase equilibrium
for Sc-CO2 and complex mixtures of PFAD. Since PFAD concentration can vary, the
mixtures they have analysed were mainly consisting of FFA and tocopherols. To our best
knowledge there is no study found on the extraction of squalene from PFAD using Sc-CO2.

56
Table 2-5: Literature review of Sc-CO2 extraction and separation of compounds of various liquid systems in 1980s.
System Target
Compounds
Pressure
(MPa)
Temperature
(K) Mode Co-solvent Packing material Reference
Soya, Castor
seed oil
TG
Phospholipids
glycolipids
10-30 313 - 353 Semi-continuous Hexane
Water n.a Stahl (1982)
Milk Fat TG and FFA 10-35 323 and 343 Semi-continuous n.a. n.a Arul (1987), Buningpfaue (1989)
Fish oil ethyl
esters Ethyl esters
11- 15
incremental
313 – 373
gradient Semi-continuous n.a. n.a. Nilsson (1989), Rizvi (1988)
Alcohol
water
mixture
Ethanol
Iso--propanol 10 308 and 313
Counter-current
continuous n.a.
Raschig rings packed
column and spray column Rathkamp (1987)
Alcohol
water
mixture
Ethanol
Iso--propanol 10 308 and 313
Counter-current
continuous n.a
Sieve Tray column and
spray column Lahiere (1987)
Alcohol
water
mixture
Iso--propanol 8 to 15 297 - 318 Counter-current
continuous n.a
Sieve tray, packed (Raschig
rings, metal Intalox saddle)
and spray column
Seibert (1988)
Fish oil Ethyl Esters 12 and 15 308 - 333
gradient Semi-continuous n.a. Dixon and stainless ball Suzuki (1989)
n.a. not applicable

Chapter 2 State of the Art
57
Table 2-6: Literature review of Sc-CO2 extraction and separation of compounds of various liquid systems in 1990s.
System Target
Compounds
Pressure
(MPa)
Temperature
(K) Mode Co-solvent Packing material Reference
Lampante
olive oil
TG
Squalene
FFA
8-15
313-343
Thermal
gradient
Counter-current
continuous n.a Sulzer EX rings Bondioli et al. (1992)
Olive oil
deodorizer
distillate
Squalene 11-17
40-60
Temperature
gradient
Counter-current
continuous n.a Sulzer EX rings Bondioli et al. (1993)
Butter Oil TG 10-27 40 Semi-continuous n.a n.a Chen et al. (1992)
Peanut oil FFA 10-20 300-330 Counter-current
continuous n.a
Stainless steel mesh
packing Zaiegler and Liaw (1993)
Soybean
deodorizer
condensate
Tocopherols 20 343 and 353 Counter-current
continuous n.a Teflon rings Brunner et al. (1991)
Soybean
deodorizer
condensate
Tocopherols 13-17.5 323-363 Semi-continuous n.a Teflon rings Brunner et al. (1991)
Model
Mixture of
glycerides
TG, DG
MG 20.7-34.5
340-380
Thermal
gradient
Semi-continuous n.a Propack stainless steel King (1997)
n.a. not applicable
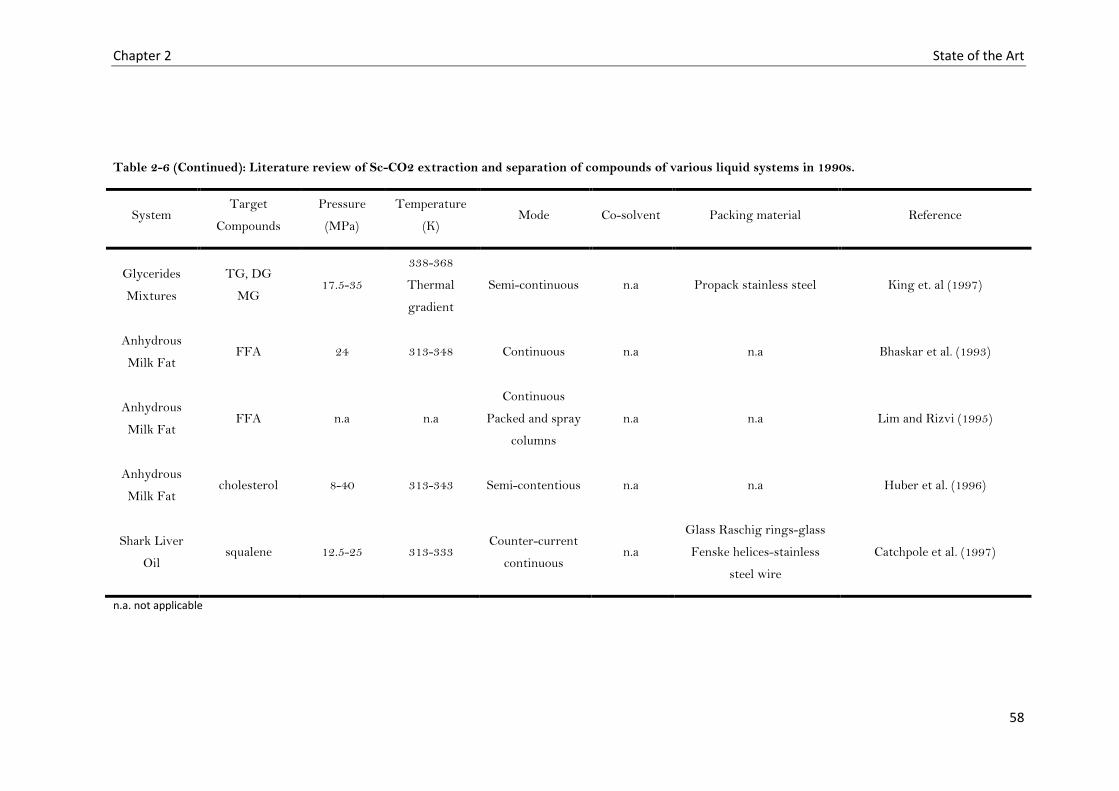
Chapter 2 State of the Art
58
Table 2-6 (Continued): Literature review of Sc-CO2 extraction and separation of compounds of various liquid systems in 1990s.
System Target
Compounds
Pressure
(MPa)
Temperature
(K) Mode Co-solvent Packing material Reference
Glycerides
Mixtures
TG, DG
MG 17.5-35
338-368
Thermal
gradient
Semi-continuous n.a Propack stainless steel King et. al (1997)
Anhydrous
Milk Fat FFA 24 313-348 Continuous n.a n.a Bhaskar et al. (1993)
Anhydrous
Milk Fat FFA n.a n.a
Continuous
Packed and spray
columns
n.a n.a Lim and Rizvi (1995)
Anhydrous
Milk Fat cholesterol 8-40 313-343 Semi-contentious n.a n.a Huber et al. (1996)
Shark Liver
Oil squalene 12.5-25 313-333
Counter-current
continuous n.a
Glass Raschig rings-glass
Fenske helices-stainless
steel wire
Catchpole et al. (1997)
n.a. not applicable
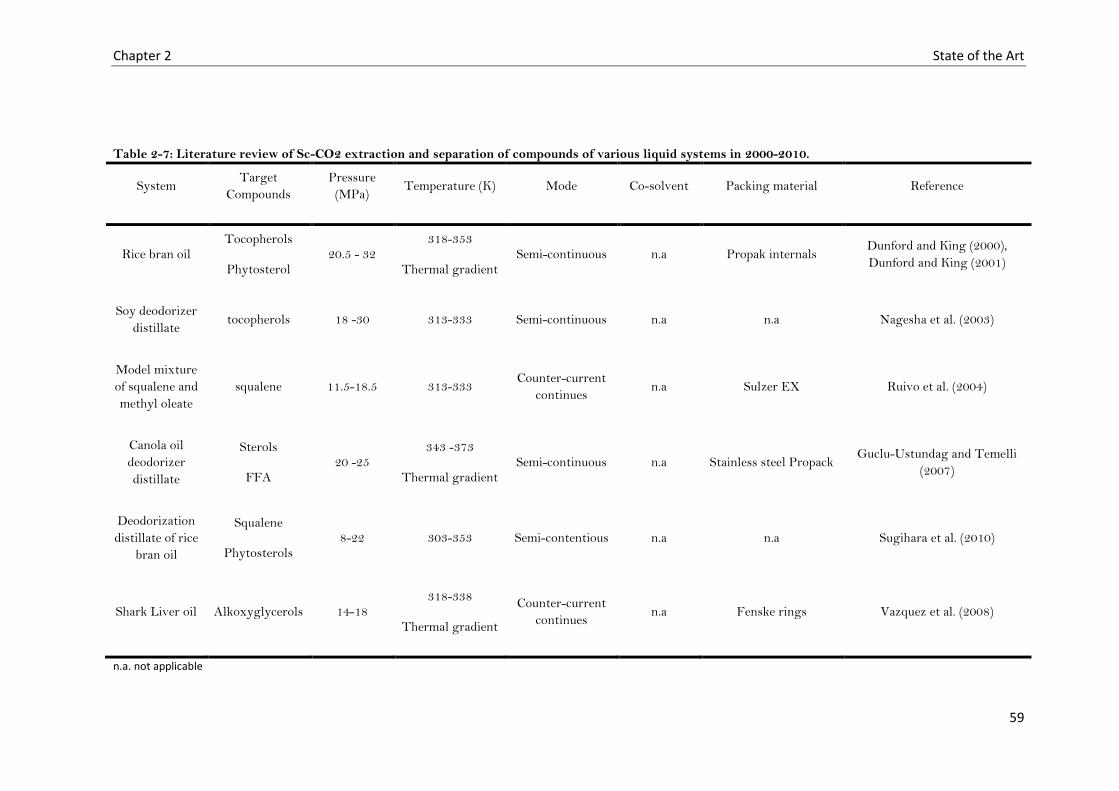
Chapter 2 State of the Art
59
Table 2-7: Literature review of Sc-CO2 extraction and separation of compounds of various liquid systems in 2000-2010.
System Target
Compounds
Pressure
(MPa) Temperature (K) Mode Co-solvent Packing material Reference
Rice bran oil Tocopherols
Phytosterol 20.5 - 32
318-353
Thermal gradient Semi-continuous n.a Propak internals
Dunford and King (2000),
Dunford and King (2001)
Soy deodorizer
distillate tocopherols 18 -30 313-333 Semi-continuous n.a n.a Nagesha et al. (2003)
Model mixture
of squalene and
methyl oleate
squalene 11.5-18.5 313-333 Counter-current
continues n.a Sulzer EX Ruivo et al. (2004)
Canola oil
deodorizer
distillate
Sterols
FFA 20 -25
343 -373
Thermal gradient Semi-continuous n.a Stainless steel Propack
Guclu-Ustundag and Temelli
(2007)
Deodorization
distillate of rice
bran oil
Squalene
Phytosterols 8-22 303-353 Semi-contentious n.a n.a Sugihara et al. (2010)
Shark Liver oil Alkoxyglycerols 14-18 318-338
Thermal gradient
Counter-current
continues n.a Fenske rings Vazquez et al. (2008)
n.a. not applicable
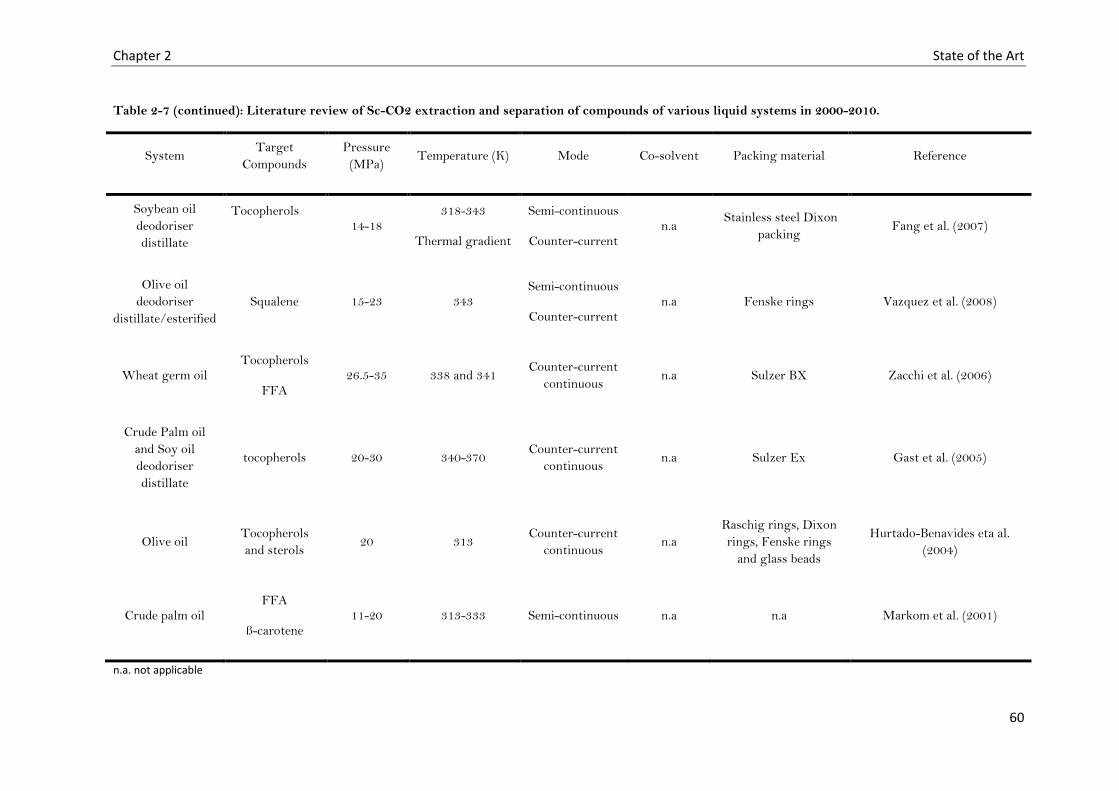
Chapter 2 State of the Art
60
Table 2-7 (continued): Literature review of Sc-CO2 extraction and separation of compounds of various liquid systems in 2000-2010.
System Target
Compounds
Pressure
(MPa) Temperature (K) Mode Co-solvent Packing material Reference
Soybean oil
deodoriser
distillate
Tocopherols
14-18
318-343
Thermal gradient
Semi-continuous
Counter-current n.a
Stainless steel Dixon
packing Fang et al. (2007)
Olive oil
deodoriser
distillate/esterified
Squalene 15-23 343 Semi-continuous
Counter-current n.a Fenske rings Vazquez et al. (2008)
Wheat germ oil Tocopherols
FFA 26.5-35 338 and 341
Counter-current
continuous n.a Sulzer BX Zacchi et al. (2006)
Crude Palm oil
and Soy oil
deodoriser
distillate
tocopherols 20-30 340-370 Counter-current
continuous n.a Sulzer Ex Gast et al. (2005)
Olive oil Tocopherols
and sterols 20 313
Counter-current
continuous n.a
Raschig rings, Dixon
rings, Fenske rings
and glass beads
Hurtado-Benavides eta al.
(2004)
Crude palm oil FFA
ß-carotene 11-20 313-333 Semi-continuous n.a n.a Markom et al. (2001)
n.a. not applicable

Chapter 2 State of the Art
61
Table 2-7 (continued): Literature review of Sc-CO2 extraction and separation of compounds of various liquid systems in 2000-2010.
System Target
Compounds
Pressure
(MPa) Temperature (K) Mode Co-solvent Packing material Reference
Fish oil Ethyle esters 6.5-19.5 313-353 Counter-current
continuous n.a Sulzer CY wire mesh Riha and Brunner (2000)
Fish oil Vitamin A
squalene 20-30 333
Counter-current
continuous ethanol Sulzer EX Catchpole et al. (2000)
Orange
Roughy oil
FFA
peroxides 20-26 333
Counter-current
continuous ethanol Sulzer EX Catchpole et al. (2000)
Synthetic
mixture of
tocopherol
/squalene/FFA
Squalene 13-25 308-363 continuous n.a n.a Mendes et al. (2000)
Soy oil
deodoriser
distillate
Squalene
FFA
sterols
24.1and 31 323 - 363 Semi-continuous n.a Mesh stainless steel
filling Chang et al. (2000)
Shark liver oil
and olive oil
deodoriser
distillate
squalene
Mixer:10-25
Column:
16-25
313-333 Semi-continuous n.a
Static mixer
(helicalstages)
Packed column (Sulzer
EX)
Catchpole et al. (2000)
n.a. not applicable

Chapter 2 State of the Art
62
2.7.1 Selection of Conditions of State; Pressure and Temperature.
These parameters; pressure and temperature, have the scope of achieving the desired
extraction and fractionation. The correct selection of these parameters leads to successful
extraction process of the desired components. The degree of the success of the fractionation
of certain mixtures is based on the selectivity of the Sc-CO2, which is directly related to the
state of conditions.
2.7.1.1 Effect of Pressure
In most studies found in the area of separation and extraction at supercritical conditions,
pressures were in the range of 10 – 35 MPa in order to attain adequate densities. Further
raise in extraction pressure > 35 MPa is not recommended economically. Also, further
enhancement of the extraction is limited. With increasing pressure from 5 to 10 MPa, a
linear sharp increase of CO2 density occurs. Density only slightly increases at pressure
above 35 MPa as shown in Figure 2.21.
Figure 2.21: Density and dielectric constant of CO2 as function of pressure at temperature of 323 K (Hubert and Vitzthum, 1987).
Chapter 2 State of the Art
63
2.7.1.2 Effect of Temperature
The effect of temperature is of special interest in supercritical solvent extraction.
Temperature range studied is virtually similar in most of the research studies on the
extraction of lipid components. Maximum extraction temperature limit was chosen to avoid
heat degradation of thermal sensitive compounds. Minimum temperature was set to ensure
two important parameters: sufficient temperature for CO2 to reach supercritical region and
to ensure that the feed matrix in liquid phase to avoid plugging of the column (Guclu-
Ustundag and Temelli 2007).
The influence of thermal gradients in a counter-current column was investigated: Dunford
and King (2001) have investigated deacidification of rice bran oil under thermal gradients.
In recent years, Fang et al. (2007) and Vazquez et al. (2008) induce internal reflux by
employing thermal gradient in the study of separation of tocopherols from soybean oil by-
product and nonesterified alkoxyglycerols from shark liver, respectively. The effect of
internal reflux was remarkable and improved tocopherols and nonesterified alkoxyglycerols
recovery.
2.7.2 Effect of Solvent Flow Rate
Solvent flow rate is another crucial parameter in the supercritical extraction and
fractionation processes. Usually it is related or referred as solvent to feed (S/F) ratio. As a
role of thumb, supercritical CO2 flows from the bottom to the top of the extraction column,
while the liquid feed material/solution is pumped to the column from the top to assure
counter-current attainment. The conditions taken to account in the traditional packed
column operations, should be also respected when supercritical CO2 used as the medium.
For instant, complete wetting of the packing material with the liquid feed material should be
assured by pumping a required liquid flow. Also, a proper selection of S/F ratio is vital to
Chapter 2 State of the Art
64
avoid flooding in the extraction column (Reverchon and Marco, 2006). An access of CO2
occurs with high S/F ratio, results in unsaturated CO2 and high axial velocity.
Consequently, undesirable components content in the final product will increase (Fang et al.
(2007).
2.7.3 The Use of Co-solvents
In the view of the literature, solvent mixtures are often more appropriate media compared to
pure solvents. However, it is important to note that there are limitations with the use of co-
solvent. These include:
The problem of preferential salvation; this phenomena is particularly related to the
composition of the solvent mixture as the composition of the bulk mixed solvent can
differ from the composition in solute immediate vicinity. This can lead to local
inhomogeneities in multi-component solvent systems (Ben-Naim, 1990, Egorov,
2000).
An additional separation step is required for the separation of the co-solvent from the
product, thus higher capital cost.
Catchpole et al. (2000) have investigated the effect of ethanol mixtures on the solubility and
fractionation of fish oils using Sc-CO2. Solubility increased exponentially with linear
increase of ethanol concentration, and it increased rapidly of polar components than that of
non-polar components. Degree of separation of squalene from shark liver was not superior
2.7.4 The Effect of Packing Materials
The scope of the packing material is to allow adequate contact area between the feed
material and solvent. Usually the packing material is inert material packed in the column
either randomly or discriminately. Hurtado-Benavides determined the efficiency of
supercritical fractionation of olive oil in a counter-current column for different types of

Chapter 2 State of the Art
65
random packing materials (Hurtado-Benavides et.al, 2004). The study was based on the
determination of the number of transfer units (NTU) and height of transfer unit (HTU) of
each packing, and the performance of extraction was analysed by the measurements of
vitamin E and sterols in the extract and the raffinate. Hurtado-Benavides found that each
packing material favoured the separation of certain solute; for instant Dixon rings for the
separation of sterols and glass beads for the separation of vitamin E. In terms of efficiency
and performance of counter-current supercritical system, Fenske rings showed the best
results, Figure 2.22 is adopted from Hurtado-Benavides study. On the other hand, Catchpole
et al (1997) found no reliable results were achieved with Fenske packing in the study of
extraction of squalene from shark liver oil. Excessive holdup of liquid in the column was
caused with Fenske packing.
Figure 2.22: HTV values (m) vs. packing materials at a CO2 flow rate of 2000 m/h and S/F ratio of 23.14 kg CO2/Kg olive oil (Hurtado-Benavides et.al, 2004).
Chapter 2 State of the Art
66
2.8 Concluding Remarks
The main objective of this chapter was to identify and illustrate the context in which this
research project is carried out. After reviewing the main background behind extraction of
lipids via supercritical fluids, the following points might be concluded:
i. Crude vegetable oils, their refined products and deodorizer distillate by-products
provide alternative sources for minor voluble constituent such as squalene.
ii. Squalene gained from natural sources has great potential in the food and cosmetic
industries.
iii. There is an increase on public awareness of health, safety and environment impact
coupled with the use of hazardous organic solvents and there are numerous food
regulations toward the use of these solvents for extraction purposes.
iv. Supercritical fluids extraction offers an alternative method for the extraction of lipid
components, with Sc-CO2 as extraction medium.
Based on the review of this chapter, the separation of lipid component from liquid raw
material is possible and reliable. Therefore, this project is directed towards the investigation
of SCF extraction and separation of squalene from PFAD.

Chapter 3 Material and analytical Techniques
67
Chapter 3
Materials and Analytical
Techniques
3.1 Introduction
PFAD main components have considerable differences in their physical and chemical
properties. Accurate and precise analytical methods are important for the identification and
quantifications of the chemical components of PFAD. Description of main material used and
analytical methods applied is discussed throughout this chapter. Material used for solubility
measurements were described in section 3.2.1, followed by characterization of material used
in extraction experiments in section 3.2.2. Full description of the procedures involved in the
analytical technique use for the quantification of squalene and FFA is illustrated in section
3.3. Also, description of the titration method for FFA quantification is given in section 3.3.3.
Finally this chapter ended with notes on the storage of sample materials throughout the
research.
Chapter 3 Materials and analytical Techniques
68
3.2 Materials Used in Solubility and Extraction Experiments
3.2.1 Solubility Experiments
Throughout this research work, solubility measurements were aimed to be conducted for
binary systems of pure lipid solutes and solubility of ternary and quaternary systems of
solute mixtures in Sc-CO2.
3.2.1.1 Binary System Pure Materials
Four main components were studied; squalene, oleic acid, α-tocopherol and palm olein.
Squalene 98% purity and –tocopherol 96% purity were purchased from Sigma Aldrich. Oleic
acid 98% and pseudo-component palm olein were supplied by IOI Group-Loders Croklaan.
The composition of palm olein is given in Table 3.1, the data provided by IOI Group.
Palm olein is mainly consists of triglycerides 89%. In this work, palm olein was considered
to be pseudo-component for the simplifications of solubility measurements. It should be
emphasized that there is no general rule in solubility measurements exists that can be
applied to simplify a mixture into pseudo-component. In this research project, it was vital to
understand and measure palm olein solubility in Sc-CO2 as it is one of main components in
PFAD.
3.2.1.3 Ternary and Quaternary Systems Solute Mixtures
For solubility measurements of ternary system of squalene and palm olein, a mixture of 10-
wt% squalene were prepared. Two stocks of 100g were prepared by accurately weighing
10g of squalene and 90g of palm olein. The mixture was prepared at room temperature .The
lipid components mixture then mixed appropriately via mixer.
In the case of quaternary system of squalene, oleic acid and palm olein, the concentration of
squalene was kept similar to that of ternary system 10-wt% in order to compare between the
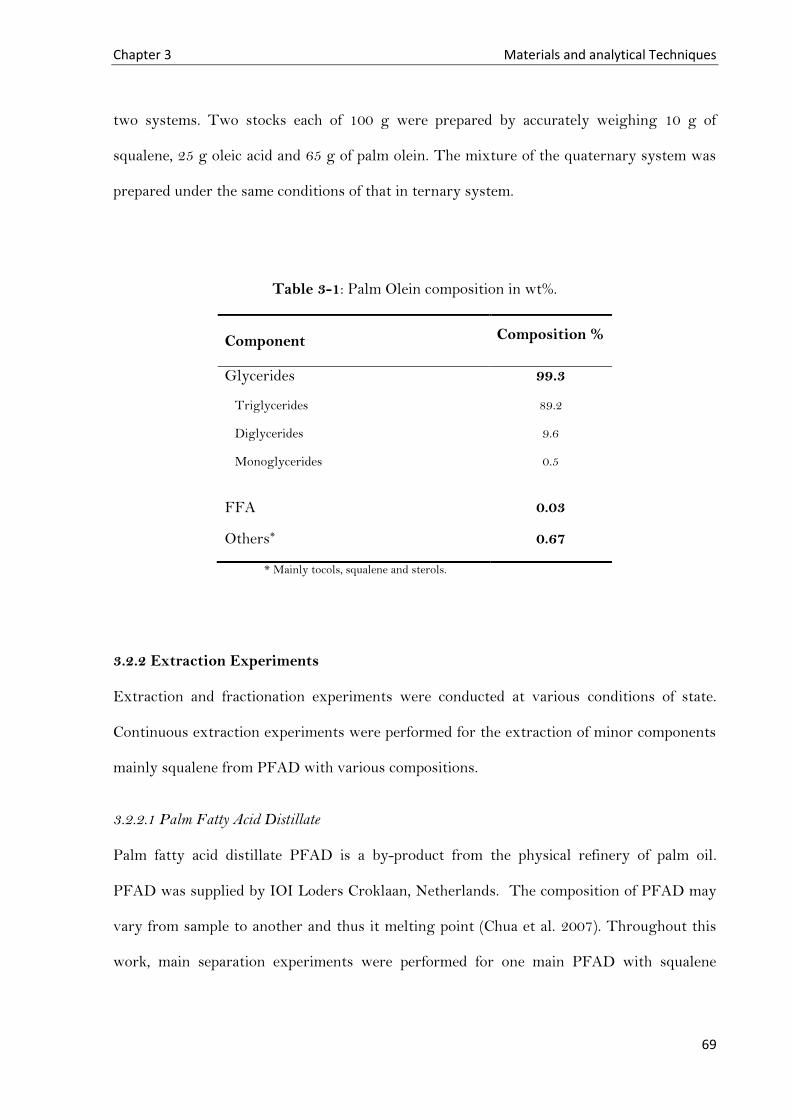
Chapter 3 Materials and analytical Techniques
69
two systems. Two stocks each of 100 g were prepared by accurately weighing 10 g of
squalene, 25 g oleic acid and 65 g of palm olein. The mixture of the quaternary system was
prepared under the same conditions of that in ternary system.
Table 3-1: Palm Olein composition in wt%.
Component Composition %
Glycerides 99.3
Triglycerides 89.2
Diglycerides 9.6
Monoglycerides 0.5
FFA 0.03
Others* 0.67
* Mainly tocols, squalene and sterols.
3.2.2 Extraction Experiments
Extraction and fractionation experiments were conducted at various conditions of state.
Continuous extraction experiments were performed for the extraction of minor components
mainly squalene from PFAD with various compositions.
3.2.2.1 Palm Fatty Acid Distillate
Palm fatty acid distillate PFAD is a by-product from the physical refinery of palm oil.
PFAD was supplied by IOI Loders Croklaan, Netherlands. The composition of PFAD may
vary from sample to another and thus it melting point (Chua et al. 2007). Throughout this
work, main separation experiments were performed for one main PFAD with squalene
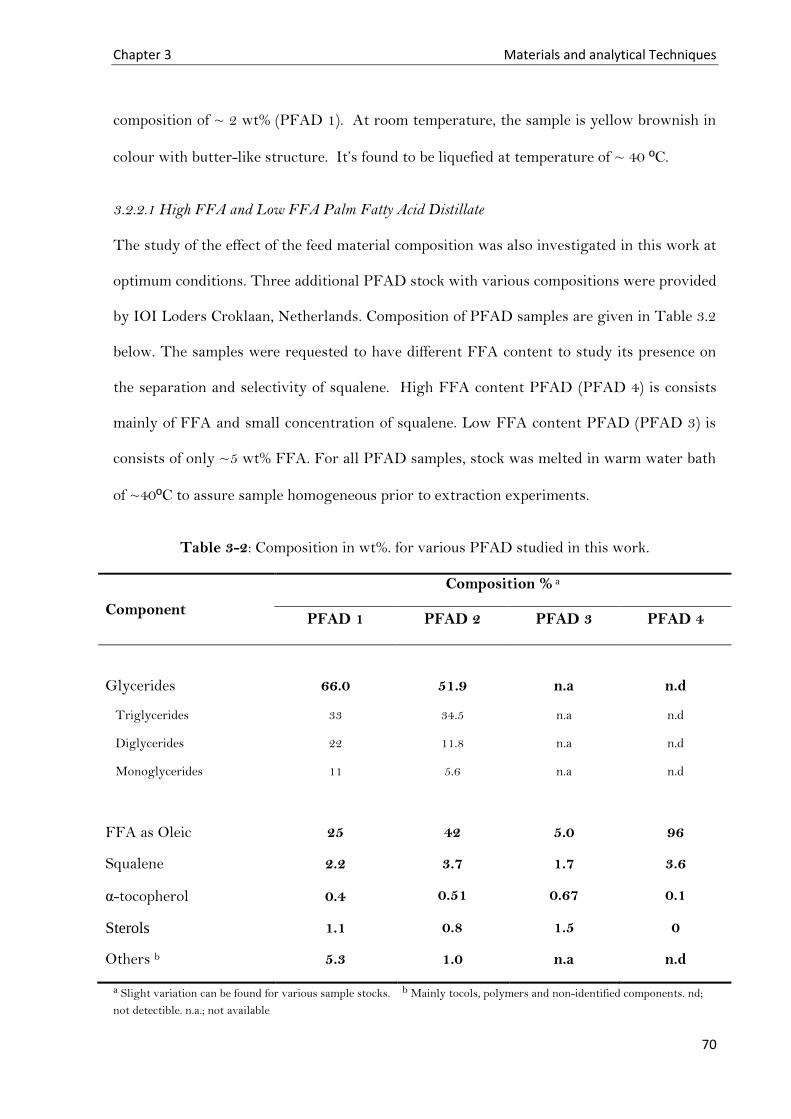
Chapter 3 Materials and analytical Techniques
70
composition of ~ 2 wt% (PFAD 1). At room temperature, the sample is yellow brownish in
colour with butter-like structure. It’s found to be liquefied at temperature of ~ 40 ºC.
3.2.2.1 High FFA and Low FFA Palm Fatty Acid Distillate
The study of the effect of the feed material composition was also investigated in this work at
optimum conditions. Three additional PFAD stock with various compositions were provided
by IOI Loders Croklaan, Netherlands. Composition of PFAD samples are given in Table 3.2
below. The samples were requested to have different FFA content to study its presence on
the separation and selectivity of squalene. High FFA content PFAD (PFAD 4) is consists
mainly of FFA and small concentration of squalene. Low FFA content PFAD (PFAD 3) is
consists of only ~5 wt% FFA. For all PFAD samples, stock was melted in warm water bath
of ~40ºC to assure sample homogeneous prior to extraction experiments.
Table 3-2: Composition in wt%. for various PFAD studied in this work.
Component
Composition % a
PFAD 1 PFAD 2 PFAD 3 PFAD 4
Glycerides 66.0
51.9
n.a
n.d
Triglycerides 33 34.5 n.a n.d
Diglycerides 22 11.8 n.a n.d
Monoglycerides 11 5.6 n.a n.d
FFA as Oleic 25 42 5.0 96
Squalene 2.2 3.7 1.7 3.6
α-tocopherol 0.4 0.51 0.67 0.1
Sterols 1.1 0.8 1.5 0
Others b 5.3 1.0 n.a n.d
a Slight variation can be found for various sample stocks. b Mainly tocols, polymers and non-identified components. nd;
not detectible. n.a.; not available
Chapter 3 Materials and analytical Techniques
71
3.3 Analytical Methods
Modern analytical methods are powerful tools for the identification and quantification of
chemicals. These methods including Gas Chromatography (GC), Mass Spectroscopy Gas
Chromatography (MsGC ) and High Performance Liquid Chromatography (HPLC) have
great potential on the identification of lipid components.
3.3.1 Analysis of Squalene Content
Squalene content of model mixtures and PFAD samples were measured by direct carbon
number GC with 5-α-cholestane added as internal standard. Carbon number peak separation
was optimized to assure two main things: squalene response peak to be as close as possible
to that for the internal standard (5-α-cholestane), and sufficient separation of squalene from
any FFAs. In order to ensure total removal of high molecule weight of triglycerides from
the capillary column, total analysis run interval was extended. Complete elution of these
compounds was necessary to avoid analytical error.
3.3.1.1 Carbon Number GC Conditions
6850 series GC with FID detector from Agilent technologies was used coupled with
capillary column DB-5 (length 30 m x diameter 0.25 mm x film thickness 0.1μm). The GC
was used with split mode, and helium as carrier gas. Oven temperature set to 160ºC followed
by temperature ramp, from 160ºC to 350ºC at 5ºC/min and hold for 2 minutes. Detector
temperature was kept at 350ºC.
3.3.1.2 Internal Standard Preparation and Correction Factor Calculation
A known concentration solution of squalene and internal standard was prepared. Mass of 11
mg of each component was accurately measured and dissolved in 15 ml toluene. Prior to GC
injection, the solution was diluted: 200 µl solution with the addition of 800 µl toluene. This
procedure is required to measure the recovery of squalene against the internal standard. The
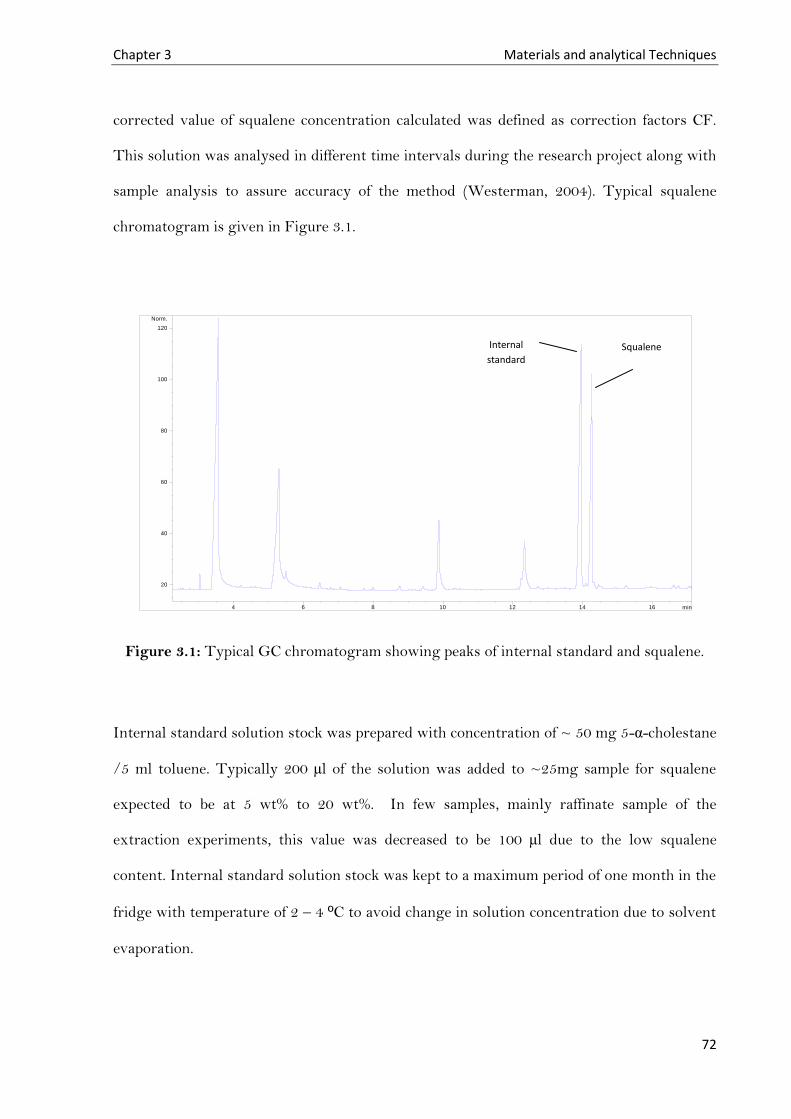
Chapter 3 Materials and analytical Techniques
72
corrected value of squalene concentration calculated was defined as correction factors CF.
This solution was analysed in different time intervals during the research project along with
sample analysis to assure accuracy of the method (Westerman, 2004). Typical squalene
chromatogram is given in Figure 3.1.
Figure 3.1: Typical GC chromatogram showing peaks of internal standard and squalene.
Internal standard solution stock was prepared with concentration of ~ 50 mg 5-α-cholestane
/5 ml toluene. Typically 200 µl of the solution was added to ~25mg sample for squalene
expected to be at 5 wt% to 20 wt%. In few samples, mainly raffinate sample of the
extraction experiments, this value was decreased to be 100 µl due to the low squalene
content. Internal standard solution stock was kept to a maximum period of one month in the
fridge with temperature of 2 – 4 ºC to avoid change in solution concentration due to solvent
evaporation.
min4 6 8 10 12 14 16
Norm.
20
40
60
80
100
120
Internal
standard Squalene
Chapter 3 Materials and analytical Techniques
73
3.3.1.3 Sample Preparation and Squalene Content Calculation
Approximately 20 to 25 mg of oil sample (samples from solubility studies and extraction
experiments) was accurately weighed and recorded. PFAD samples were heated at
temperature of 40 ºC before measurements in order to liquefy the butter-like PFAD samples.
Then, 200 µl of internal standard solution was added followed by 3 ml toluene. The GC used
was equipped with split mode of sample injection and no further dilution is required.
Squalene content in the sample was calculated based on the following equation Eq. 3.1:
Where Peak Area is the area under the curve of components determined from the GC, IS is
stands for the internal standard and CF is the correction factor.
3.3.2 Analysis of FFA Content via GC
FFA content of model mixtures and PFAD samples were measured by direct carbon number
GC with Heptadecanic acid as internal standard. FFAs cannot be directly injected to the GC
system due to their high melting point. Thus, Silylation of FFA was essential to determine
their content. In order to ensure total removal of high molecule weight of triglycerides from
the capillary column, total analysis run interval was extended. Complete elution of these
compounds was necessary to avoid analytical error. The total run time was 53 min.
3.3.2.1 Carbon Number GC Conditions
The FFA concentrations were measured using the same GC and column mentioned above
for squalene analysis but using different conditions. The oven temperature program was 100
ºC for 3 min, 10 °C/min to 150 °C, 5 °C/min to 250 °C, 10 °C/min to 350 °C, with a 15 min
holding time. The GC was used with split mode, and Helium was used as the carrier gas.
Chapter 3 Materials and analytical Techniques
74
3.3.2.2 Internal Standard Preparation
A known concentration sample of FFA mixture was used to determine the correction factors
CF of each FFA component. In this work, this sample was mainly PFAD because the
concentration of FFA was known. This sample was prepared and analyzed along with other
sample analysis with unknown FFA to assure accuracy of the method.
Internal standard solution stock was prepared with concentration of ~ 50 mg Heptadecanic
acid /5 ml toluene. 200 µl (2 mg internal standard) of the solution was added to ~25mg
sample. Internal standard solution stock was kept to a maximum period of one month in the
fridge with temperature of 2 – 4 ºC.
3.3.2.3 Sample Preparation and FFA Content Calculation
Approximately a drop of oil samples (approximately equal to 20 to 25 mg) was accurately
weighed and recorded. Then, 200 µl of internal standard solution was added followed by 1
ml Chloroform as solvent. For Silylation of FFA, 1ml of Hexamethyldisilazane (HMDS)
was added to the sample solution. Solution then was heated at temperature of 50 to 60 ºC for
50 minutes (Alenezi et al. 2009). Sample solution was then left to cool down to room
temperature prior to GC injection. Each of FFA component content in the sample was
calculated based on the following equation Eq. 3.2:
Where Peak Area is the area under the curve of components determined from the GC, IS is
stands for the internal standard and CF is the correction factor. Typical FFA chromatogram
showing FFA main components present in PFAD is given in Figure 3.2. FFA are palmitic
acid C16:0, linoleic acid C18:2, oleic acid C18:1 and stearic acid C18:0.
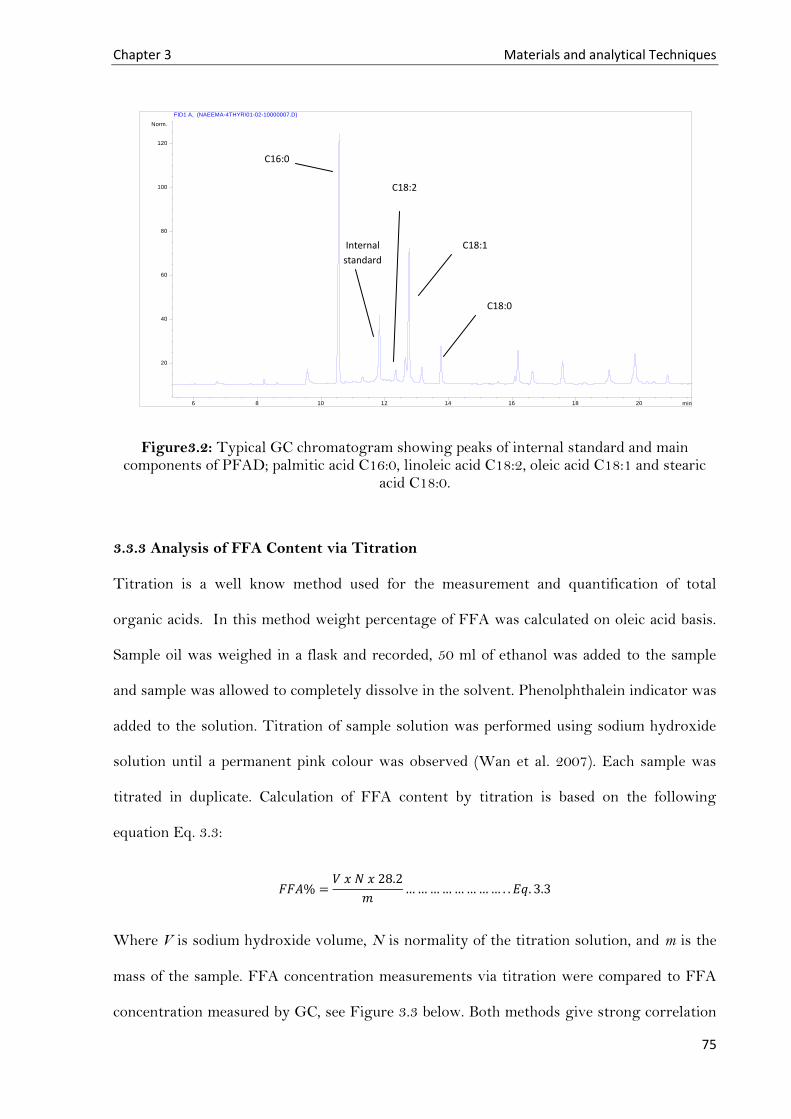
Chapter 3 Materials and analytical Techniques
75
Figure3.2: Typical GC chromatogram showing peaks of internal standard and main components of PFAD; palmitic acid C16:0, linoleic acid C18:2, oleic acid C18:1 and stearic
acid C18:0.
3.3.3 Analysis of FFA Content via Titration
Titration is a well know method used for the measurement and quantification of total
organic acids. In this method weight percentage of FFA was calculated on oleic acid basis.
Sample oil was weighed in a flask and recorded, 50 ml of ethanol was added to the sample
and sample was allowed to completely dissolve in the solvent. Phenolphthalein indicator was
added to the solution. Titration of sample solution was performed using sodium hydroxide
solution until a permanent pink colour was observed (Wan et al. 2007). Each sample was
titrated in duplicate. Calculation of FFA content by titration is based on the following
equation Eq. 3.3:
Where V is sodium hydroxide volume, N is normality of the titration solution, and m is the
mass of the sample. FFA concentration measurements via titration were compared to FFA
concentration measured by GC, see Figure 3.3 below. Both methods give strong correlation
min6 8 10 12 14 16 18 20
Norm.
20
40
60
80
100
120
FID1 A, (NAEEMA-4THYR\01-02-10000007.D)
C16:0
Internal
standard
C18:2
C18:1
C18:0

Chapter 3 Materials and analytical Techniques
76
of R2=0.98, therefore both methods are acceptable for the measurements of FFA
concentration in PFAD samples. The main advantage of GC is the capability of the
equipment to identify the quantification of individual FFA presented in the oil sample
compared to titration. Titration analytical method can identify only the total FFA presented
in the sample. Few samples were analyzed for FFA content via titration and GC analysis
was skipped in order to measure total FFA.
Figure 3.3: FFA analysis comparison between GC method and titration (Alenezi, 2010).
Chapter 3 Materials and analytical Techniques
77
3.4 Samples Storage
Each chemical were stored based on Material Safety Data Sheet MSDS provided by the
manufacturer. Stocks of 2 and 2.5 litres of PFAD samples were provided from IOI Group-
Loders Croklaan as requested. Samples in use were stored in fridges available in the
laboratory at temperature between 2-4 ºC. The rest of PFAD samples were stored in cold
room provided by the School of Chemical Engineering. Stock solutions prepared for
analytical purposes were not stored for long period, solution kept for maximum one month.
All samples (Chemicals and/or PFAD) stored at low temperature environment were kept in
the laboratory until they reached room temperature before start working.
Chapter 4 Solubility Measurements
78
Chapter 4
Solubility Measurements of
Liquid Lipid Based
Components in Sc-CO2
4.1 Introduction
Solubility measurements are essential for the development of supercritical fluid extraction
and fractionation processes. In order to find the optimum conditions of a separation process
it is necessary to know the solubility of the components of interest in supercritical fluid. It
provides information about the capacity of the solvent, the selectivity of the solvent, and the
dependence of solvent properties on conditions of state, pressure and temperature. If this
information is known, a good prediction can be made about whether the separation is
possible (Brunner, 2005). Solubility of a substance at given solvent strength (given
temperature and pressure) is determined by finding the mass of solute saturated in 1 kg
solvent.
Chapter 4 Solubility Measurements
79
This chapter explores the flow type method used in this work for the determination of
PFAD main lipid components solubilities at several solvation strength of Sc-CO2. Followed
by a full presentation of the results in section 4.4 of this chapter, binary solubility studies,
ternary solubility studies and quaternary solubility studies are discussed in section 4.4.1and
4.4.2, respectively.
4.2 Objectives
This study has three main objectives. The first objective is to determine the solubility of
individual component; squalene, α-tocopherol, oleic acid and palm olein in Sc-CO2 under
certain conditions of pressure and temperature. The second objective is to determine the
solubility of the multi-component system of squalene and palm olein as ternary system. The
third objective is to study the effect of the presence of FFA (as oleic acid) on the solubility of
squalene in Sc-CO2, and to provide an analogue to assess the likeliness of these components
to dissolve in Sc-CO2.
4.3 Methodology
4.3.1 Solubility Measurement Rig
Solubility measurements were carried out using a dynamic flow-type apparatus, this method
was adopted by various researchers (Li et al. 2009, Jin et al. 2005, Markum et al. 2001,
Sovova et al. 1997). It is capable of operating at a maximum pressure and temperature of 30
MPa and 343 K, respectively. The dynamic flow-type methods consists of four main stages;
sample preparation and loading, system pressurization, solvent-sample contact and
depressurization/solute collection. Each stage will be discussed in details as following.
Solubility flow diagram is shown in Figure 4.1. Solubility apparatus illustrated schematically
in Figure 4.2.

Chapter 4 Solubility Measurements
80
Figure 4.1: The ‘four S’ flow diagram of the solubility measurements.
Figure 4.2: Schematic diagram of dynamic flow type solubility apparatus.
4.3.1.1 Sample Preparation and Loading
All of the lipid samples (either pure component or mixture) were at liquid phase at room
temperature. More information about the lipid components and the preparations of the lipid
mixtures were discussed in section 3.2.1 of Chapter 3; Materials and Analytical techniques.
The sample is loaded in a special liquid sample holder designed to insure solvent-sample
Sample preparation and
loading
System pressurization
Solvent-sample contact
Solute collection/depress
uization

Chapter 4 Solubility Measurements
81
contact. Sample holder consists of three pieces made of glass material connected to each
other as shown in Figure 4.3.
Figure 4.3: Sample holder
The middle section with a capacity of 15ml is where the liquid sample is held. During the
run, carbon dioxide passes through the small diameter m-shape tubes (~3mm diameter) in
the middle section and develops small bubbles for better contact area with liquid sample.
The bottom section is designed to prevent any liquid leakage to the system solvent streams
during the run with easy solvent access. The top part is filled with glass wool to trap carried
liquid sample (not-dissolved in CO2). The glass sample holder is placed in to another
stainless steel holder, illustrated in Figure 4.4, which is finally fitted in the pressure vessel.
The system then is ready for solvent delivery.
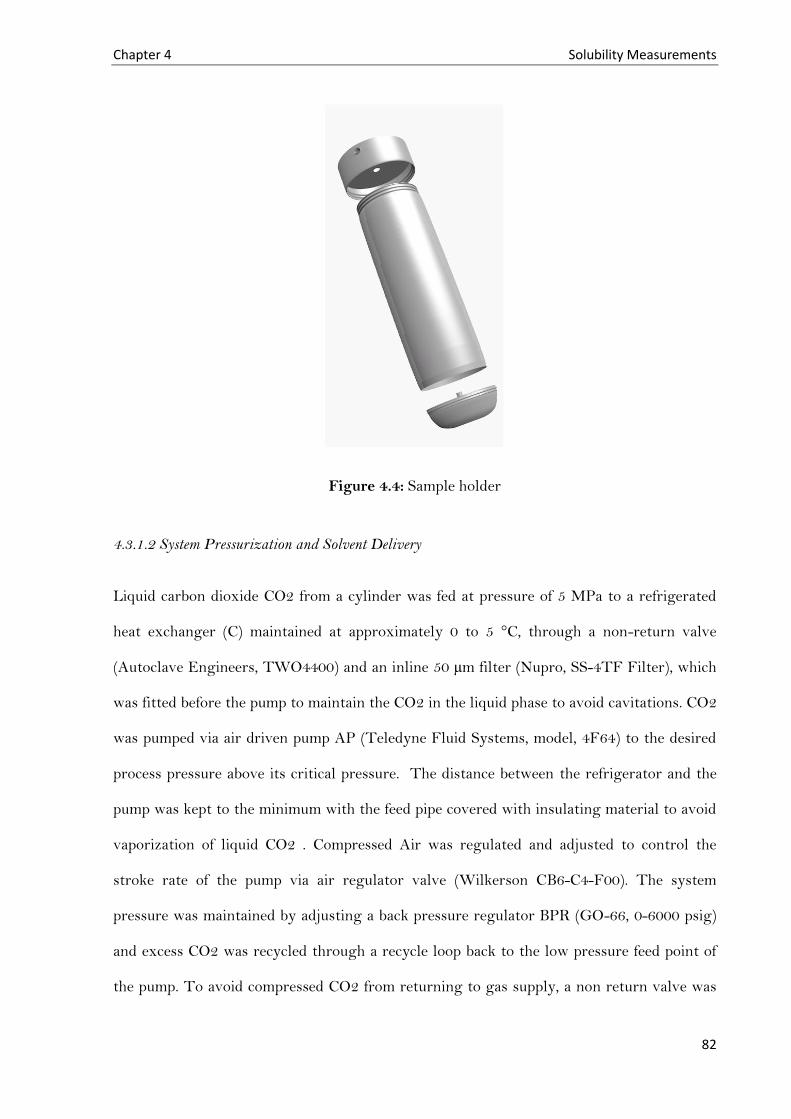
Chapter 4 Solubility Measurements
82
Figure 4.4: Sample holder
4.3.1.2 System Pressurization and Solvent Delivery
Liquid carbon dioxide CO2 from a cylinder was fed at pressure of 5 MPa to a refrigerated
heat exchanger (C) maintained at approximately 0 to 5 °C, through a non-return valve
(Autoclave Engineers, TWO4400) and an inline 50 µm filter (Nupro, SS-4TF Filter), which
was fitted before the pump to maintain the CO2 in the liquid phase to avoid cavitations. CO2
was pumped via air driven pump AP (Teledyne Fluid Systems, model, 4F64) to the desired
process pressure above its critical pressure. The distance between the refrigerator and the
pump was kept to the minimum with the feed pipe covered with insulating material to avoid
vaporization of liquid CO2 . Compressed Air was regulated and adjusted to control the
stroke rate of the pump via air regulator valve (Wilkerson CB6-C4-F00). The system
pressure was maintained by adjusting a back pressure regulator BPR (GO-66, 0-6000 psig)
and excess CO2 was recycled through a recycle loop back to the low pressure feed point of
the pump. To avoid compressed CO2 from returning to gas supply, a non return valve was
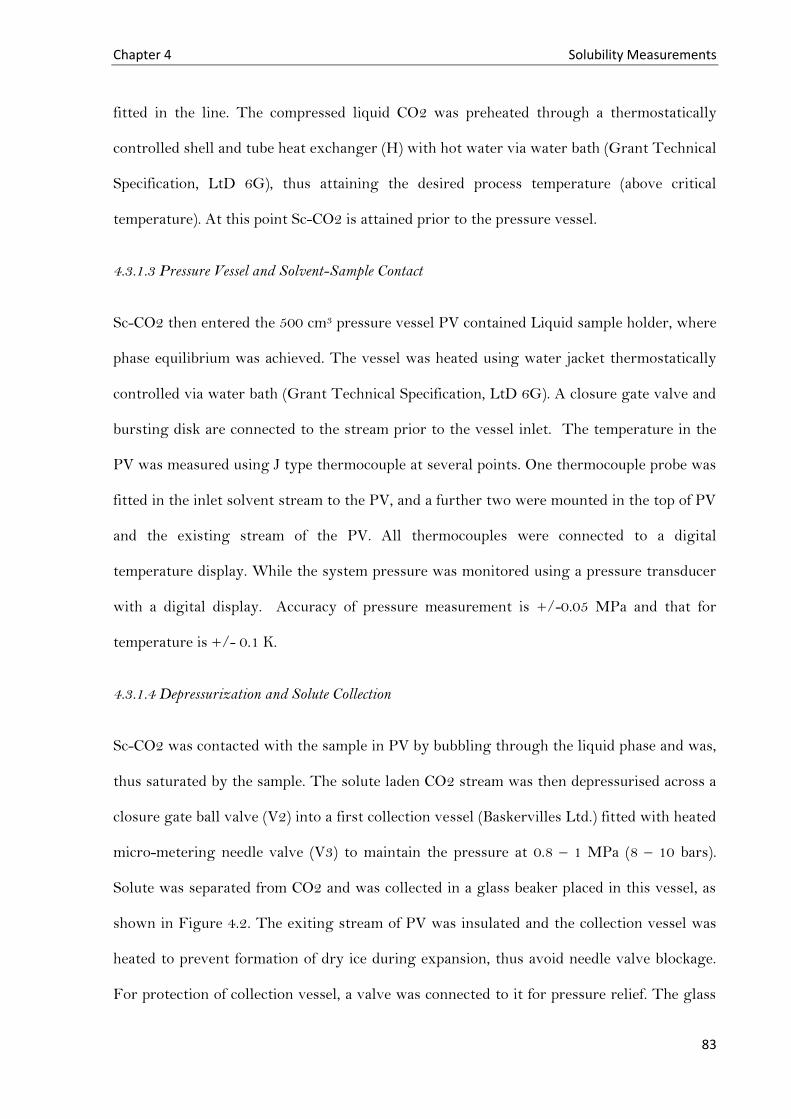
Chapter 4 Solubility Measurements
83
fitted in the line. The compressed liquid CO2 was preheated through a thermostatically
controlled shell and tube heat exchanger (H) with hot water via water bath (Grant Technical
Specification, LtD 6G), thus attaining the desired process temperature (above critical
temperature). At this point Sc-CO2 is attained prior to the pressure vessel.
4.3.1.3 Pressure Vessel and Solvent-Sample Contact
Sc-CO2 then entered the 500 cm3 pressure vessel PV contained Liquid sample holder, where
phase equilibrium was achieved. The vessel was heated using water jacket thermostatically
controlled via water bath (Grant Technical Specification, LtD 6G). A closure gate valve and
bursting disk are connected to the stream prior to the vessel inlet. The temperature in the
PV was measured using J type thermocouple at several points. One thermocouple probe was
fitted in the inlet solvent stream to the PV, and a further two were mounted in the top of PV
and the existing stream of the PV. All thermocouples were connected to a digital
temperature display. While the system pressure was monitored using a pressure transducer
with a digital display. Accuracy of pressure measurement is +/-0.05 MPa and that for
temperature is +/- 0.1 K.
4.3.1.4 Depressurization and Solute Collection
Sc-CO2 was contacted with the sample in PV by bubbling through the liquid phase and was,
thus saturated by the sample. The solute laden CO2 stream was then depressurised across a
closure gate ball valve (V2) into a first collection vessel (Baskervilles Ltd.) fitted with heated
micro-metering needle valve (V3) to maintain the pressure at 0.8 – 1 MPa (8 – 10 bars).
Solute was separated from CO2 and was collected in a glass beaker placed in this vessel, as
shown in Figure 4.2. The exiting stream of PV was insulated and the collection vessel was
heated to prevent formation of dry ice during expansion, thus avoid needle valve blockage.
For protection of collection vessel, a valve was connected to it for pressure relief. The glass

Chapter 4 Solubility Measurements
84
beaker fitted in the collection vessel was filled with glass wool to prevent solute lost within
the collection vessel. In order to avoid dry ice formation, the collection vessel was
maintained at conditions above triple point of CO2 where the phase changes are from
supercritical phase to liquid and gas phases. The exiting solvent stream was passing through
another solute trap at atmospheric pressure through another micro-metering needle valve.
The second trap is a U-shape trap placed to capture mainly the volatile components; it was
filled with glass wool and immersed in dry ice. The solute free CO2 left the solute trap was
measured by passing through a flow-meter (U.G.I METERS LTD, model, 804741) and
finally vented off from the laboratory. Subsequently, the extract was weighed and analysed.
Measurements were made at flow rate range of 0.6 to 0.9 kg.hr-1 where there was no effect
on the observed solubilities found. In order to ensure CO2 saturation, loading measurements
were carried out at various solvent flow rates ranged between 0.3 and 1.3 kg.hr-1. The
system is deemed to have reached equilibrium when no further change was recorded in the
solute concentration with the CO2 flow rate, see Figure 4.5 below.
Figure 4.5: Loading of vegetable oil at different solvent flow rate at pressure of 15 MPa and temperature of 313 K.
0
2
4
6
8
0.0 0.2 0.4 0.6 0.8 1.0 1.2 1.4
Solu
bil
ity
g/k
g C
O2
CO2 [kg.hr-1]

Chapter 4 Solubility Measurements
85
Equilibrium was achieved at solvent flow rate of 0.6-0.9 kg.hr-1 at which the solvent was
saturated with the solute and considered as solubility measurements. As the solvent flow
rate was increased (above 0.9 kg.hr-1), the solubility was decreased due to the insufficient
contact time to reach saturation.
4.3.2 Calculations
The following are the equations used for solubility calculation and they are applied to all
solubility measurements. While conducting a solubility experiment, certain data were
recorded which are used later to carry out the main calculations.
4.3.2.1 Gas consumption calculation
The CO2 flow rate used during extraction experiments was between 0.6 to 0.9 kg.hr-1 and
was calculated by the following calculation procedure (equation 4.1). Atmospheric pressure
and laboratory temperature were taken to account; the ideal gas equation was used:
Where stands for mass flow rate of CO2 in g.h-1, is CO2 volumetric flow rate measured
during the experiment expressed in Litres per hour, P is the atmospheric pressure in atm, T
is room temperature in Kelvin, and R is gas constant 0.08206 L.atm. K-1.mol-1.
4.5.2.2 Solubility Calculations
Solubility S (g.kg-1) of a certain component i in Sc-CO2 was presented in two forms, first as
mass (g) of component i dissolved in one kg of solvent (Sc-CO2), as stated in equation 4.2.
Also, it was calculated as mole fraction of component i, yi, expressed in equation 4.3.

Chapter 4 Solubility Measurements
86
4.5.2.2 Standard Deviation Calculations
Each run of solubility measurements at certain conditions of state, was reproduced to and N
number of times and variation of the results were calculated via standard deviation StDEV,
see equation 4.4. The results were represented in the figures as error bars.
√
∑
Where, (x1, x2,..., xN) are the observed values of solubility at each run of N, and is the
mean value of these solubility observations.
4.4 Results and Discussions
4.4.1 Solubility of Binary Systems of Pure Solutes
In order to understand the solubility behaviour in multi-component systems, it is first
essential to investigate the solubility of the binary systems of the component. The
experimental solubility of the binary systems of α-tocopherol (αT/Sc-CO2), oleic acid
(OA/Sc-CO2), squalene (SQ/Sc-CO2), and pseudo-component palm olein (PO/Sc-CO2)
were measured in the temperature range of 313-353 K and pressure range of 10-30 MPa. To
our knowledge, the solubility of the binary system of pseudo-component palm olein in Sc-
CO2 has not been reported in the literature. The solubility results in mole fraction for each
component in the binary systems are presented in Table 4.1, Table 4.2, Table 4.3 and Table

Chapter 4 Solubility Measurements
87
4.4 respectively, with each point being the average of a minimum of three measurements.
Density data of Sc-CO2 is obtained from NIST web-book.
Solubility isotherms for the four main components are illustrated in Figure 4.6 – Figure 4.9.
Solubility isotherms for lipid components follow similar trends of increasing with rising
pressure at constant temperature. Solubilities of oleic acid and tocopherol at temperature of
313 K is higher than that at higher temperatures at pressure lower than 25 MPa, while at
pressure higher than 25 MPa the effect was reversed. At pressure higher than 25 MPa, the
increase in vapour pressure of oleic acid and α-tocopherol predominates over the decreasing
of solvent power of Sc-CO2. Fang et al. (2004) observed this effect in his investigations on
the solubility of α-tocopherol in Sc-CO2, his results shown that solubility isotherms at 353
K is higher than 313 k and 333 K isotherms at pressure above 25 MPa.
Table 4-1: Solubility of oleic acid in mole fraction as function of pressure (MPa),
temperature (K) and CO2 density ρ (kg.m-3).
T (K) P (MPa) ρ (Kg.m-3) yx104
313.15 10.0 628.61 2.57±0.40
15.0 780.23 7.49±0.27
20.0 839.81 8.99±0.57
25.0 879.49 12.2±0.7
30.0 909.89 14.07±0.40
333.15 15.0 604.09 2.59±0.10
20.0 723.68 6.25±0.45
25.0 786.55 19.7±1.7
30.0 829.71 22.4±1.2
353.15 10.0 221.60 0.04±0.02
15.0 427.15 0.19±0.05
20.0 593.89 3.10±0.10
25.0 686.22 10.9±1.8
30.0 745.60 22.0±1.2
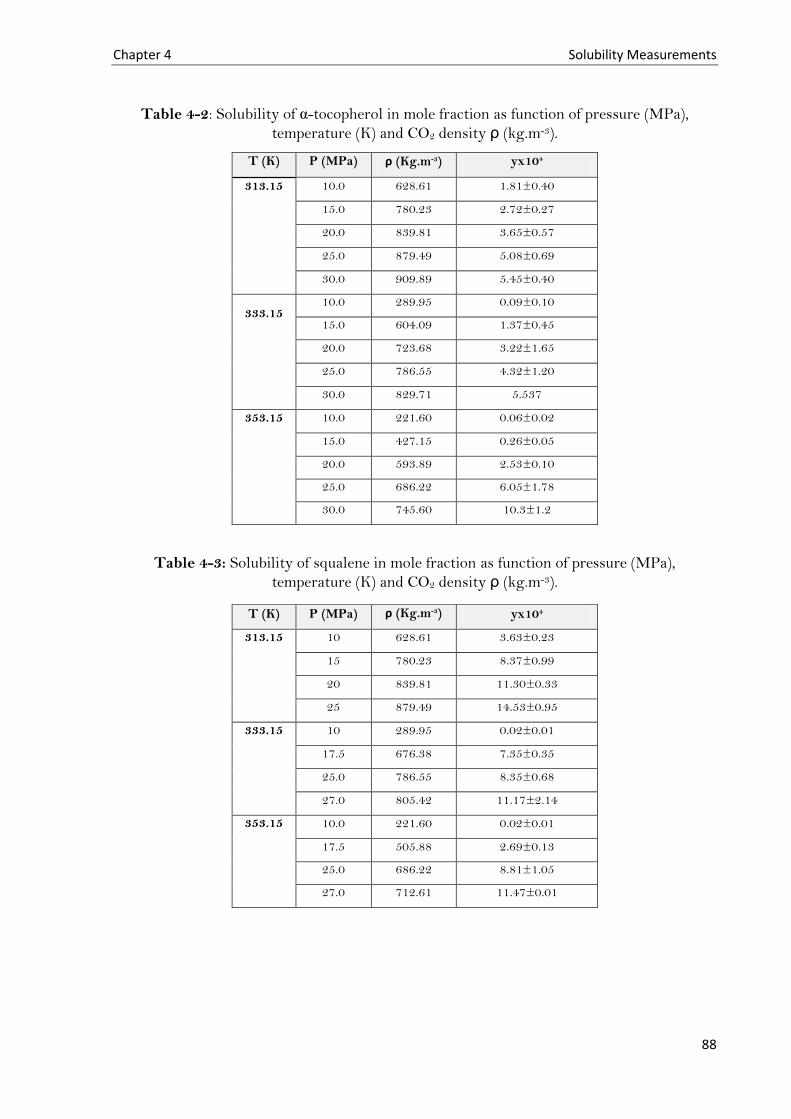
Chapter 4 Solubility Measurements
88
Table 4-2: Solubility of α-tocopherol in mole fraction as function of pressure (MPa),
temperature (K) and CO2 density ρ (kg.m-3).
Table 4-3: Solubility of squalene in mole fraction as function of pressure (MPa),
temperature (K) and CO2 density ρ (kg.m-3).
T (K) P (MPa) ρ (Kg.m-3) yx104
313.15 10.0 628.61 1.81±0.40
15.0 780.23 2.72±0.27
20.0 839.81 3.65±0.57
25.0 879.49 5.08±0.69
30.0 909.89 5.45±0.40
333.15 10.0 289.95 0.09±0.10
15.0 604.09 1.37±0.45
20.0 723.68 3.22±1.65
25.0 786.55 4.32±1.20
30.0 829.71 5.537
353.15 10.0 221.60 0.06±0.02
15.0 427.15 0.26±0.05
20.0 593.89 2.53±0.10
25.0 686.22 6.05±1.78
30.0 745.60 10.3±1.2
T (K) P (MPa) ρ (Kg.m-3) yx104
313.15 10 628.61 3.63±0.23
15 780.23 8.37±0.99
20 839.81 11.30±0.33
25 879.49 14.53±0.95
333.15 10 289.95 0.02±0.01
17.5 676.38 7.35±0.35
25.0 786.55 8.35±0.68
27.0 805.42 11.17±2.14
353.15 10.0 221.60 0.02±0.01
17.5 505.88 2.69±0.13
25.0 686.22 8.81±1.05
27.0 712.61 11.47±0.01

Chapter 4 Solubility Measurements
89
Table 4-4: Solubility of pseudo component palm olein in mole fraction as function of
pressure (MPa), temperature (K) and CO2 density ρ (kg.m-3). T (K) P (MPa) ρ (Kg.m-3) yx104
313.15 10.0 628.61 0.24±0.06
15.0 780.23 0.39±0.04
20.0 839.81 0.58±0.06
25.0 879.49 1.20±0.20
30.0 909.89 1.89±0.07
333.15 10.0 289.95 0.02±0.01
15.0 604.09 0.11±0.01
20.0 723.68 0.57±0.05
25.0 786.55 0.68±0.11
30.0 829.71 1.25±0.16
353.15 15.0 427.15 0.03±0.01
20.0 593.89 0.23±0.02
25.0 686.22 0.99±0.05
30.0 745.60 1.04±0.21
Whereas the solubility isotherms of squalene and palm olein at 313 K is higher than 333 K
and 353 K over the pressure range investigated. Nevertheless, at pressure of 25 MPa, the
effect of temperature is nearly negligible over the solubility of squalene. At constant
pressure, the solubility decreases with increasing temperature. This observation is in
agreement with studies found in the literature on the solubility of squalene by Catchpole and
Kamp (1997) and Brunner et al. (2009).
At the conditions studied the Sc-CO2 solubility of pseudo-component palm olein is low
compared to other lipid components. In view of the fact that pseudo-component palm olein
consists mainly of triglycerides, and it was determined that Sc-CO2 has very low affinity
towards triglycerides (Markom et al. 2001).

Chapter 4 Solubility Measurements
90
Figure 4.6: Solubility isotherms of oleic acid as function of pressure at temperatures of 313 K, 333K and 353 K.
Figure 4.7: Solubility isotherms of α-tocopherol as function of pressure at temperatures of 313 K, 333K and 353 K.
0
5
10
15
20
25
5 10 15 20 25 30 35
y
OA
x1
04
Pressure [MPa]
313K
333K
353K
0
2
4
6
8
10
12
14
5 10 15 20 25 30 35
yto
c x
10
4
Pressure [MPa]
313K
333K
353K

Chapter 4 Solubility Measurements
91
Figure 4.8: Solubility isotherms of squalene as function of pressure at temperatures of 313 K, 333K and 353 K.
Figure 4.9: Solubility isotherms of pseudo component palm olein as function of pressure at temperatures of 313 K, 333K and 353 K.
0
8
16
24
32
40
5 10 15 20 25 30
yS
Qx
10
4
P [MPa]
313K
323K
333K
0.00
0.50
1.00
1.50
2.00
2.50
3.00
5 10 15 20 25 30 35
yP
Ox
10
4
Pressure [MPa]
313K
333K
353K

Chapter 4 Solubility Measurements
92
In order to assess the reliability of the equipment and method used, OA solubility data were
compared with the values found in the literature (Chrastil, 1982; Maheshwari et al., 1992;
Skerget et al., 1995) and presented in Figure 4.10.
Figure 4.10: Solubility isotherms of oleic acid at 313 K.
The data for oleic acid solubility is in good concurrence with other investigators at pressure
range between 10 to 20MPa. However, at higher pressure a discrepancy of approximately
35% was observed with the data obtained by Chrastil and Skerget. The solubility values
reported by Maheshwari deviated significantly from the values found by Chrastil and
Skerget and the data gathered by this investigation. This may be due to the impurities
present in the reagent, which led to either positive or negative effects. Dobbs has found that
when small amounts of entrainer are presenting, solubility in supercritical fluids can be
affected by several orders of magnitude (Dobbs et al., 1987). The purity of the reagent used
in this work was more than 98%. Another possible cause of these discrepancies is the
sampling technique used during solubility measurements. During sampling, entrainment of
0
10
20
30
40
5 10 15 20 25 30
yO
Ax
10
4
Pressure [MPa]
J. Chrastil
P. Maheshwari
M. Skerget
This work

Chapter 4 Solubility Measurements
93
the solute in the vapour phase can be the cause of a high degree of solubility. Similar
discrepancies observed with the data of α-tocopherol (Chrastil (1982), Chen et al. (2000),
Skerget et al. (2003), as shown in Figure 4.11. There is slight discrepancy between this work
and the work obtained by Skerget, while Chen Data showed higher solubility at all pressure
range studied compared to others.
Figure 4.11: Solubility isotherms of α-tocopherol at 313 K.
The data were correlated using Chrastil’s density related empirical equation, in order to
examine the general trend of solubility behaviour, as follows:
In this equation, S denotes the solubility of solute in Sc-CO2 (g.kg-1), ρ is the density of CO2
(kg.m-3), T is the temperature (K), a and b are constants, and k is the association number.
Densities of CO2 were obtained from NIST Web-book. The fit of equation 4.5 to the
experimental data is shown in Figure 4.12. There is nearly linear relationship between
density of Sc-CO2 and logarithm of solubility of the compounds studied in the region of
1
10
100
1000
10000
5 10 15 20 25 30 35
yto
cx1
06
P ressure [MPa]
This work
Chrastil (1982)
Chen (2000)
Skerget (2003)

Chapter 4 Solubility Measurements
94
pressure investigated. Johannsen and Brunner (1997) have found similar trend in their
investigation of the solubility of α-tocopherol in Sc-CO2.
Figure 4.12: Solubility of lipid components as function of density at 313K.
It demonstrates that squalene has the highest solubility in CO2 among the lipid components
in this study; while pseudo-component the lowest is shown by palm olein. This result
matched expectations, since CO2 in its supercritical conditions is a non-polar solvent which
preferably dissolves non-polar components. Squalene is a relatively non-polar hydrocarbon,
while a palm olein structure has hydroxyl groups that enhance its polarity making it
relatively more soluble in polar solvents. Meanwhile, oleic acid has a hydroxyl group
attached to a non-polar chain, with the result that it is less polar than squalene (Reichardt,
2006). Model parameters for each lipid component are given in Table 4.5 with the average
absolute relative deviation (AARD), defined as follows:
∑
| |
Points: Experiments
Lines: Model0 .1
1
10
100
600 700 800 900 1000
Density (kg/m3)
So
lub
ilit
y y
x1
06
SqualeneSqualene Chrastila-tocopherola-tocopherol ChrastilPalm OleinPalm Olein ChrastilOleic AcidOleic Acid Chrastil

Chapter 4 Solubility Measurements
95
Obtained constants k, b and a were used to calculate the solubility and the calculated
solubilities were in good agreement with the measured values with maximum deviation in
terms of AARD is 18%, which is lower than the acceptable deviation values of 20% used for
empirical equations (Jouyban et al., 2002).
Table 4-5: Model parameters of Chrastil’s equation.
Lipid Component k a b AARD
Squalene 6.005 -2543.53 -29.913 12.1%
Oleic acid 5.056 -3566.41 -21.043 14.1%
α-tocopherol 5.209 -3628.39 -21.987 16.4%
Pal Olein 5.079 -731.212 -31.362 18.3%
4.4.2 Solubility of Solute Mixture System
4.4.2.1 Ternary Systems
The majority of the solubility data are presented as binary systems and there have been
relatively few investigations into multi-components systems or real systems (refer to
chapter 2 for more detailed information on literature found in this field of study).
Knowledge of these kinds of complex systems is essential, however, in determining the
selectivity of a specific solute presented in a mixture, as well as in understanding the
intermolecular interactions in the solvation process. Squalene and other lipid components
such as tocopherols and sterols are present in very small concentrations in palm oil refinery
by-products. A mixture of 10 wt% squalene and 90 wt% palm olein (SQ +PO) was prepared
to determine solubility in Sc-CO2 (ternary system) as function of pressure at a constant

Chapter 4 Solubility Measurements
96
temperature of 313 K. The solubility data of the ternary mixture (SQ + PO +CO2) are
compared with their binary solubility data (SQ+CO2, PO+CO2) are shown in Table 4.6.
Selectivity α is calculated as the ratio of respective mole fractions of squalene and palm olein
in the solvent stream. It is clear that when pseudo component palm olein was added to
squalene, squalene solubility showed a dramatic reduction, while palm olein solubility
increased at pressures above 15 MPa. This finding is in agreement with the study obtained
by Ruivo et al. (2007), the higher the content of more soluble component in Sc-CO2 the
higher the solubility of the mixture. In this case, the addition of 10 wt% of squalene (more
soluble) to palm olein (less soluble) has increased the solubility of the mixture. Ruivo has
studied this effect with squalene concentration up to 75 wt%. However, this observation was
found over all pressure range studied by Ruivo, while in this work only at pressure above 15
MPa. The reason might be behind the concentration of squalene used in both studies. The
concentration of squalene used in this work is less than minimum concentration of 25 wt%
used by Ruivo in his study.
Selectivity isotherms for squalene and palm olein as function of pressure are shown in
Figure 4.13 and 4.14, respectively. There is significant reduction of squalene solubility in
palm olein mixture compared to its solubility in the binary system squalene/Sc-CO2.
Solubility diminution of a solute has been observed in various studies when another solute is
added, as the vapour pressure of the solute is proportional to its concentration in the
mixture, as stated in Raoult’s law (Guclu-Ustundag and Temelli, 2007).

Chapter 4 Solubility Measurements
97
Table 4-6: Solubility data of squalene and palm olein in binary systems (SQ/PO +CO2) and ternary systems (SQ +PO +CO2) in Sc-CO2 at constant temperature of 313.15 K.
P (MPa) SQ (yx105) PO (yx105) α
(ySQ/yPO)
SQ + CO2 SQ+PO+CO2 PO + CO2 SQ+PO+CO2
10 35.35±0.07 7.55±0.09 2.43±0.23 0.33±0.25 23.1
15 83.69±0.12 8.15±0.21 3.94±0.09 3.54±0.38 2.30
20 113.0±0.03 9.96±0.15 5.78±0.02 11.29±0.14 0.88
25 145.3±0.07 12.96±0.11 12.01±0.17 15.14±0.27 0.86

Chapter 4 Solubility Measurements
98
Figure 4.13: Solubility isotherms of Squalene at 313 K for the binary system (SQ+CO2) and ternary system (SQ+PO+CO2).
Figure 4.14: Solubility isotherms of pseudo component palm olein at 313 K for the binary system (PO+CO2) and ternary system (SQ+PO+CO2).
The behaviour of multi-component systems in Sc-CO2 is poorly understood. These multi-
component systems are characterised by further non-ideality and more solute-solute
interactions in their system than solute-solvent interactions in binary systems. However, it
0
2
4
6
8
10
12
14
16
0 5 10 15 20 25 30
SQ S
olu
bili
ty (
yx1
04)
P ressure (MPa)
SQ+CO2
0
0.2
0.4
0.6
0.8
1
1.2
1.4
1.6
0 5 10 15 20 25 30
PO
So
lub
ility
( y
x10
4)
Pressure (MPa)
PO+CO2

Chapter 4 Solubility Measurements
99
is possible to highlight that under high pressure the vapour pressure of the highly
concentrated palm olein increases, leads to higher solubility, which is aided by the higher
interactions with squalene and Sc-CO2 in the ternary mixture leading to further enhanced
solubility of palm olein. This finding is in agreement with King et al. (1997) on his study of
semi-batch extraction of mixture of glycerides, the solubilities of a component with low
binary-solubility increase when it is present in a mixture with other component with high
binary-solubility with Sc-CO2; in this case it is squalene. This is unlike the afore-mentioned,
behaviour of squalene which exists at a much lower concentration. Although squalene
solubility decreased dramatically after the introduction of palm olein into the system, it still
dominated the extract composition at the lower pressure range (less than 15 MPa) as the
selectivity shows its highest value at low pressures. This indicates that a one-step separation
of squalene with a concentration of 90 wt% at a pressure of 10 MPa at temperature of 313.15
K is favoured.
It is clear that when a higher pressure is used, CO2 will dissolve more palm olein which
effectively dilutes the concentration of squalene in the solvent phase. Catchpole reports
similar results, finding that the selectivity toward squalene is best at lower pressure.
Solubility data were predicted using Peng Robinson equation for mixture system (Catchpole
and vonKamp, 1997).
4.4.2.2 Quaternary systems
Since FFA exists at a relatively high concentration in the deodorisation distillate of palm oil
compared to squalene, the solubility behaviour in this work was studied in the presence of
FFA for the quaternary systems (SQ + PO + OA + CO2). The concentration of squalene was
kept the same as in the ternary system at 10 wt%, with addition of 25 wt% OA (as FFA) and
65 wt% palm olein under the same conditions. The solubility data of the quaternary system
SQ +PO +OA +CO2 are provided in Table 4-7.
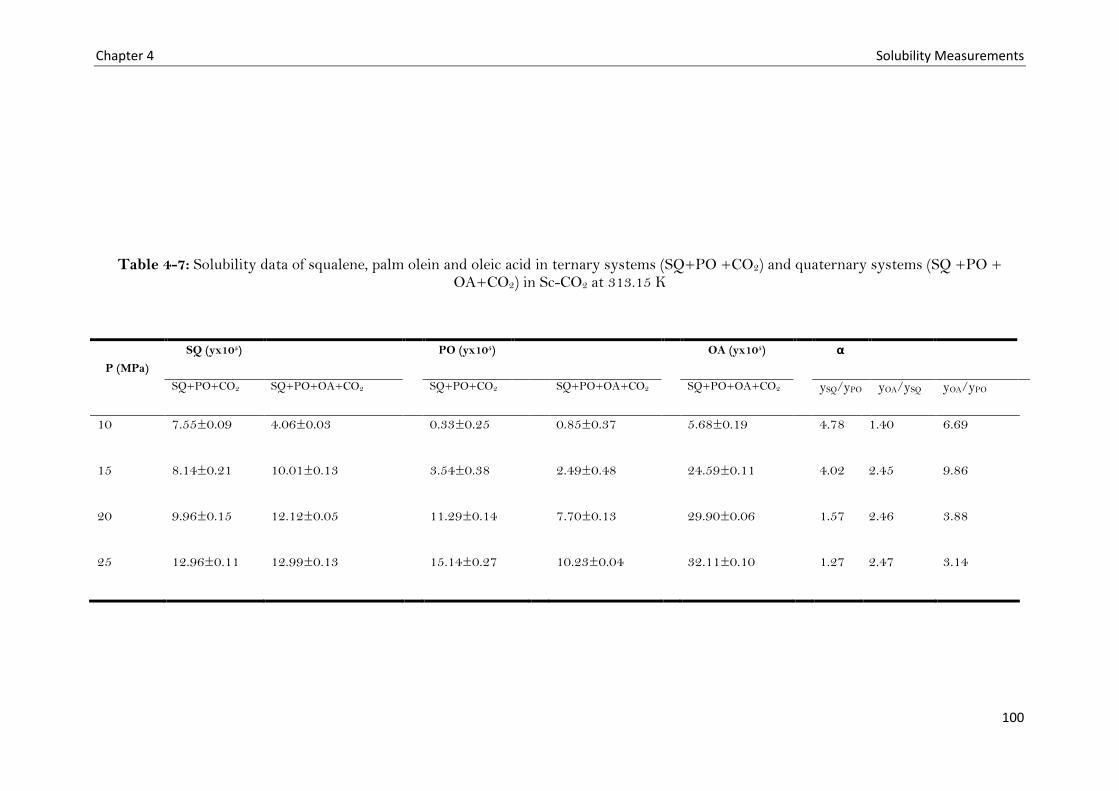
Chapter 4 Solubility Measurements
100
Table 4-7: Solubility data of squalene, palm olein and oleic acid in ternary systems (SQ+PO +CO2) and quaternary systems (SQ +PO + OA+CO2) in Sc-CO2 at 313.15 K
P (MPa)
SQ (yx105) PO (yx105) OA (yx105) α
SQ+PO+CO2 SQ+PO+OA+CO2 SQ+PO+CO2 SQ+PO+OA+CO2 SQ+PO+OA+CO2 ySQ/yPO yOA/ySQ yOA/yPO
10 7.55±0.09 4.06±0.03 0.33±0.25 0.85±0.37 5.68±0.19 4.78 1.40 6.69
15 8.14±0.21 10.01±0.13 3.54±0.38 2.49±0.48 24.59±0.11 4.02 2.45 9.86
20 9.96±0.15 12.12±0.05 11.29±0.14 7.70±0.13 29.90±0.06 1.57 2.46 3.88
25 12.96±0.11 12.99±0.13 15.14±0.27 10.23±0.04 32.11±0.10 1.27 2.47 3.14
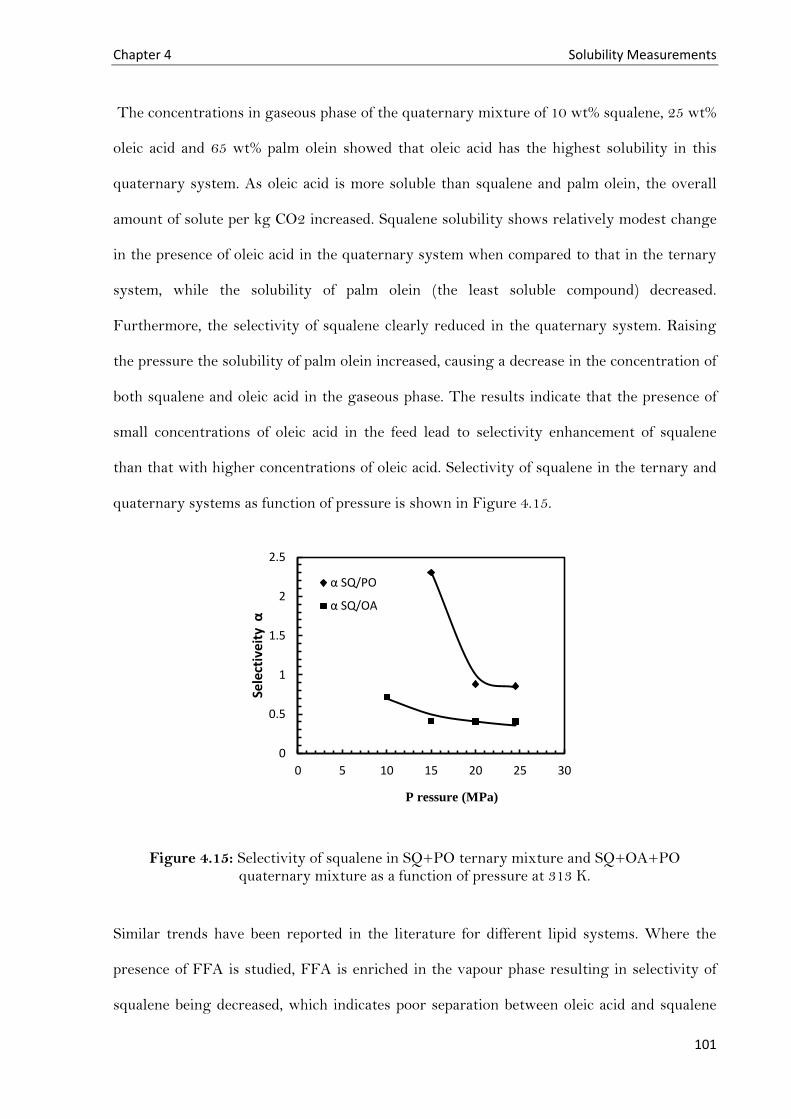
Chapter 4 Solubility Measurements
101
The concentrations in gaseous phase of the quaternary mixture of 10 wt% squalene, 25 wt%
oleic acid and 65 wt% palm olein showed that oleic acid has the highest solubility in this
quaternary system. As oleic acid is more soluble than squalene and palm olein, the overall
amount of solute per kg CO2 increased. Squalene solubility shows relatively modest change
in the presence of oleic acid in the quaternary system when compared to that in the ternary
system, while the solubility of palm olein (the least soluble compound) decreased.
Furthermore, the selectivity of squalene clearly reduced in the quaternary system. Raising
the pressure the solubility of palm olein increased, causing a decrease in the concentration of
both squalene and oleic acid in the gaseous phase. The results indicate that the presence of
small concentrations of oleic acid in the feed lead to selectivity enhancement of squalene
than that with higher concentrations of oleic acid. Selectivity of squalene in the ternary and
quaternary systems as function of pressure is shown in Figure 4.15.
Figure 4.15: Selectivity of squalene in SQ+PO ternary mixture and SQ+OA+PO quaternary mixture as a function of pressure at 313 K.
Similar trends have been reported in the literature for different lipid systems. Where the
presence of FFA is studied, FFA is enriched in the vapour phase resulting in selectivity of
squalene being decreased, which indicates poor separation between oleic acid and squalene
0
0.5
1
1.5
2
2.5
0 5 10 15 20 25 30
Sele
ctiv
eity
α
P ressure (MPa)
α SQ/PO
α SQ/OA

Chapter 4 Solubility Measurements
102
(Simoes and Brunner, 1996; Ruivo et al., 2007). In order to investigate the distribution of
lipid components in both gaseous and liquid phases, the distribution coefficient Ki of each
component was calculated using equation (4.7):
Ki =yi/xi..........................................Eq. 4.7
Here yi is the mass fraction of component i in the gaseous phase and xi is the mass fraction in
the liquid phase. Distribution coefficients of squalene in the ternary system and quaternary
system are presented in Figure 4.16. Distribution coefficients are higher than 1 in both
systems which gives the indication that squalene is enriched in the gaseous phase. In ternary
system, distribution coefficient of squalene is almost double of that in quaternary system.
This result shows the importance of the consideration of the composition of the whole
mixture when the behaviour of individual component is discussed (Stoldt and Brunner
1999).
Figure 4.16: Distribution coefficients of squalene in SQ+PO+CO2 ternary system and SQ+OA+PO+CO2 quaternary system as function of pressure at 313 K.
Both squalene and FFA distribution coefficients were found to be higher than 1, therefore
both components can be enriched in the gaseous phase. The distribution of squalene
Pressure [MPa]
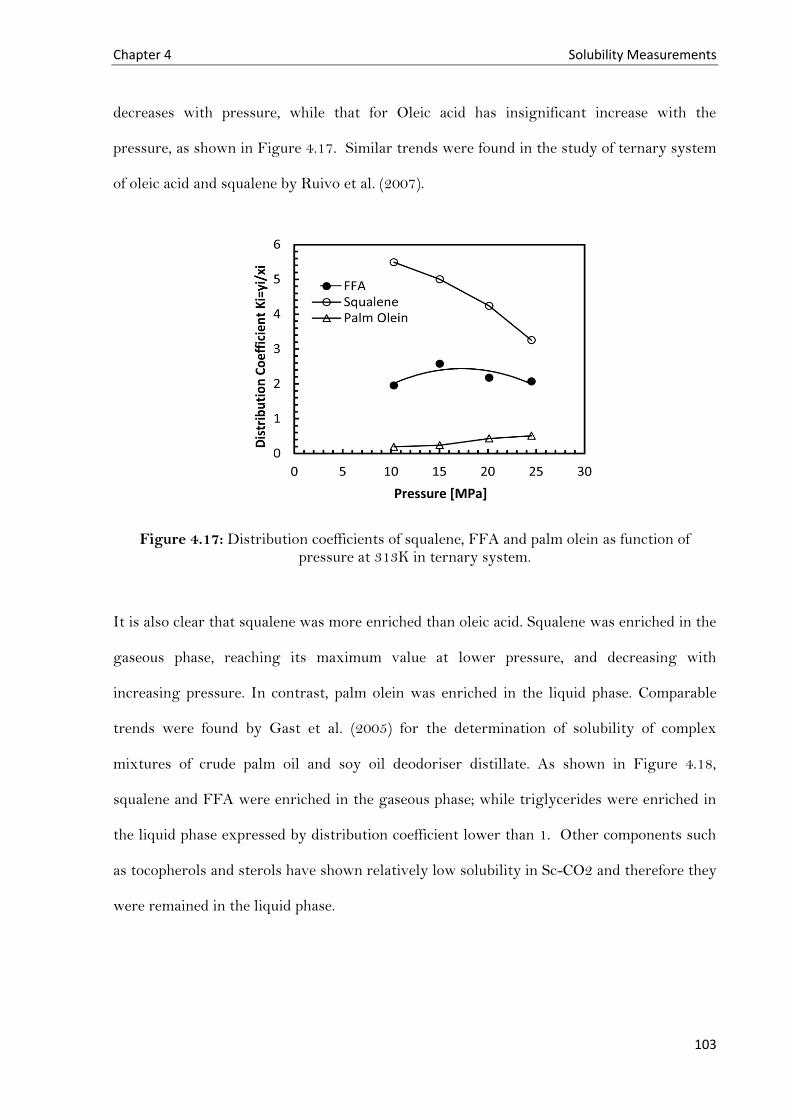
Chapter 4 Solubility Measurements
103
decreases with pressure, while that for Oleic acid has insignificant increase with the
pressure, as shown in Figure 4.17. Similar trends were found in the study of ternary system
of oleic acid and squalene by Ruivo et al. (2007).
Figure 4.17: Distribution coefficients of squalene, FFA and palm olein as function of pressure at 313K in ternary system.
It is also clear that squalene was more enriched than oleic acid. Squalene was enriched in the
gaseous phase, reaching its maximum value at lower pressure, and decreasing with
increasing pressure. In contrast, palm olein was enriched in the liquid phase. Comparable
trends were found by Gast et al. (2005) for the determination of solubility of complex
mixtures of crude palm oil and soy oil deodoriser distillate. As shown in Figure 4.18,
squalene and FFA were enriched in the gaseous phase; while triglycerides were enriched in
the liquid phase expressed by distribution coefficient lower than 1. Other components such
as tocopherols and sterols have shown relatively low solubility in Sc-CO2 and therefore they
were remained in the liquid phase.
Pressure [MPa]

Chapter 4 Solubility Measurements
104
Figure 4.18: Distribution coefficients of lipid components of crude palm oil (Left) and soy oil deodorizer distillate (right) as function of pressure at 340K (Gast et al. 2005).
4.5 Conclusions
Squalene has been shown to have a higher solubility than the other lipid components in the
binary systems studied due to its hydrocarbon and non-polar nature. Solubility investigation
for the ternary and quaternary systems demonstrates the high selectivity of carbon dioxide
towards squalene and free fatty acids. The presence of less soluble components, such as palm
olein, affects the loading of the whole mixture, especially at a high concentration. The
introduction of FFA into the SQ/PO mixture results in a decrease of carbon dioxide
selectivity towards squalene. This is likely because the solubility of FFA is higher than the
solubility of palm olein in CO2, which reduces squalene vapour pressure, resulting in low
selectivity. Solute-solute interactions have also been shown to affect the solubility in Sc-
CO2. In conclusion this study demonstrates the feasibility of separating squalene and FFA
from palm olein, by using the Sc-CO2 fractionation process.

105
Chapter 5
Counter-Current Supercritical
Fluid Extraction and
Fractionation of PFAD
Components Using Sc-CO2
5.1 Introduction
There is paramount interest in the isolation of minor lipid components from their complex
mixtures because of their potential health benefits. This work is devoted to study the
extraction and recovery of squalene from PFAD mixture via the technology of continuous
multistage Sc-CO2 extraction. The principles of the design of liquid-liquid extraction can be
applied to the supercritical fluid extraction processes, as they are identical in concept.
Liquid-liquid extraction is based on the relative solubilities of the compounds in two
immiscible solvents, while in the case of supercritical fluid solvent extraction the separation
of compound from a mixture is bases on its preferential solubility in supercritical fluid

Chapter 5 Counter-current SCF Extraction and fractionation
106
solvent. Multistage supercritical fluid extraction has several advantages and it can be a
promising alternative to distillation and organic solvent extraction. This chapter explores
the feasibility of squalene extraction and enrichment from PFAD using Sc-CO2 in counter-
current fractionation column as function of different extraction conditions. Full
presentation of the experimental apparatus and extraction procedures are stated in section
5.3 of this chapter, followed by a discussion of the main results in section 5.4, where the
effect of pressure, temperature and solvent (S) to feed (F) ratio (S/F ratio) on the separation
of squalene and FFA is presented. Finally this chapter closing stages are with an overview
of the separation efficiency of both squalene and FFA, and final concluding marks.
5.2 Objectives
The overall objective of this chapter is to investigate the extraction and recovery of squalene
from PFAD in counter-current extraction column runs isothermally by means of Sc-CO2 as
extraction solvent. The investigation is carried out in terms of total yield measurements and
concentration of squalene in the extract product, as function of state conditions; extraction
pressure and temperature, and S/F ratio. Furthermore, the investigation covered the effect
of state conditions on FFA presented in PFAD.
Extraction and fractionation experiments have been carried out at temperature of 313 K-
353 K, and pressures between 10 and 20 MPa. Temperature lower than 313 K at pressures
above 15 MPa, flooding was occurred in the column due to high solvent density. Sc-CO2 is
known for its main advantage of having ambient critical temperature, therefore temperature
above 353 K where not studied to avoid sample degradation. At pressure lower than 10
MPa, the solvent density was very low and there was no extraction occurred (extract mass
was unquantifiable). The extraction column used in this project was capable to work at
maximum pressure of 20 MPa. There is significant increase on Sc-CO2 density at pressures
between 10 to 20 MPa. At pressure above 20 MPa, density isotherm showed insignificant

Chapter 5 Counter-current SCF Extraction and fractionation
107
changes (refer to Figure 2.21 in chapter 2 of this work; density isotherm as function of
pressure).
5.3 Methodology
5.3.1 Counter-Current Fractionation Rig
A schematic diagram of the continuous counter-current extraction process used in this work
is illustrated in Figure 5.1. Its maximum operating pressure and temperature were 20 MPa
and 373, K respectively. It consists of a separation column, 2 m in height with 11.5 mm I.D.,
constructed with high pressure pipes. The separation column is equally divided into 4
sections; top three sections were packed with glass beads packing at effective height of
0.5m× 3. The left half a meter of the bottom of the column is packing free for raffinate
collection.
Each section was heated individually using heating tape, and connected by cross fittings
where thermocouples and feeding connections were installed. A three-channel temperature
control unit (workshop, University of Birmingham) was used for maintain the temperature
of the high pressure separation column. The column pipe lines were isolated to avoid heat
lost.
Before starting extraction experiment, the heating system of the column was first turned on
and regulated in order to achieve the desired extraction temperature. The compressed CO2
was passed through heat exchanger (HE 2) and heated to the designed process temperature
(Thar Technologies Inc., Model HE) and introduced to the column. Carbon dioxide is
introduced continuously between the third and bottom sections of the column via automated
piston pump (Thar Technologies Inc., Model P-50) which delivers a constant flow rate. The
flow of carbon dioxide enhances the column heating. The pressure inside the column was
Chapter 5 Counter-current SCF Extraction and fractionation
108
increased slowly in anticipation of the desired extraction temperature and pressure
achievement.
When the operating pressure and temperature were reached, preheated PFAD was pumped
to the column by HPLC pump (Waters 510 HPLC Pump) o.5 m below the top section of the
column, 1 m above carbon dioxide inlet. The feed location was chosen based on Fang et al.
(2007) study of the effect of feed location on the separation of tocopherols from soybean oil
deodorizer distillate. Although higher contact between feed material and solvent accelerates
the extraction and makes fractionation process more efficient, there is insufficient height for
rectification. Thus, insufficient rectification results in an increase of non-desired components
in the top product. In this work, rectification and counter-current were taken in
consideration; height of counter-current contact and height of rectification were 1 m and 0.5
m, respectively. The feed pipe line was heated via heating tape to prevent PFAD
solidification. Also, the HPLC pump heads were manually heated continuously during the
extraction run by means of heating gun.
The solute laden CO2 was depressurized through an automated back pressure regulator
(BPR) with heating valve (Thar Technologies Inc., Model ABPR200) to a collection glass
vessel with known weight. Subsequently, the extract was weighed and analysed. CO2 used
in this work was in once-through mode, and its flow rate was regulated via solvent
automated piston pump. The piston pump (Thar Technologies Inc., Model P-50) is
designed to deliver up to maximum solvent flow rate value of 50g CO2 per minute. In all
extraction experimental runs, a constant volumetric feed flow rate of 0.6 ml/min was used.
The feed mass flow rate was calculated with the measured feed density multiplied by the
volumetric flow rate. The feed volumetric flow was controlled by observing its level in the
graduate cylindrical glass vessel.
Chapter 5 Counter-current SCF Extraction and fractionation
109
Limitations in the available experimental device do not allow the extraction column to be
operated with liquid external reflux. The length of experiments time was fixed to be 5 h for
each run to ensure system reached equilibrium. However, some extraction runs can take up
to 7 hours due to fluctuations on the feed pumping causing delay on time for the system to
reach steady state. Starting time of each extraction experiment is the time when PFAD is
introduced to the column. Samples of extract (top product) and raffinate (bottom product)
were taken and measured by weighing every 1 hour time interval.

Chapter 5 Counter-current SCF Extraction and fractionation
110
Figure 5.1: Schematic diagram of counter-current extraction and fractionation rig

Chapter 5 Counter-current SCF Extraction and fractionation
111
5.3.2 Materials and Analysis
In this study, PFAD was used as feed material with certain composition of squalene, FFA,
tocotrienols and other minor lipid components. More details about PFAD samples were
discussed previously in Chapter 3; Materials and Analytical Techniques. The three main
streams of the fractionation rig; feed, extract and raffinate were analysed using gas
chromatography. Details on the analytical techniques used were discussed previously in
Chapter 3.
5.3.3 Calculations
The analysis of counter-current Sc-CO2 extraction feasibility needs information regarding
total product yield, product recovery and target component’s concentration. During and
subsequent to each fractionation run, certain calculations were performed. Throughout
conducting an extraction experiment, certain data were recorded which were used
afterwards to carry out the main calculations.
5.3.3.1 Overall Material Balance
An overall mass balance was calculated based on the following equation;
Where F is feed flow rate in g.h-1, E is top product flow rate (Extract) in g.h-1 and R is
bottom product flow rate (Raffinate) in g.h-1. Furthermore, material balance for each
component i of study was calculated subsequent to each run;
Where is the total mass of component i in the feed stream F. While and are
the mass fraction wt% of component i in the feed, extract and raffinate streams, respectively.

Chapter 5 Counter-current SCF Extraction and fractionation
112
5.3.3.2 Product Yield and Recovery
Top mass yield of the extraction process, and squalene (or any component, i) recovery were
calculated based on Eq. 5.3 and Eq. 5.4, respectively as following;
5.3.3.3 Standard Deviation Calculations
Each run of extraction measurements at certain conditions of state, was reproduced to and N
number of times and variation of the results were calculated via standard deviation StDEV,
see equation 5.5.
√
∑
Where, (x1, x2,..., xN) are the observed values of certain response (e.g. concentration, top and
bottom mass) at each run of N, and is the mean value of these responses.
5.3.3.4 Experimental Error
The experimental error of each extraction run was calculated based on total mass balance:

Chapter 5 Counter-current SCF Extraction and fractionation
113
5.4 Results and Discussions
5.4.1 Calculation of Minimum Solvent to Feed Ratio
Prior to experimental initiation of the separation of squalene, the minimum S/F ratio was
obtained based on the solubility data conducted previously, refer to Chapter 4. The
separation experiments should be conducted at solvent flow rate greater to the minimum
value to assure solvent saturation. Calculated S/F ratio is shown in Table 5.1 at different
conditions of state. The minimum S/F ratio was estimated to be 8.8 gCO2/gFeed, along for
this range of temperatures, pressures and PFAD compositions. Thus, the minimum solvent
flow rate used throughout this study was 5 g.min-1.
Table 5-1: Calculated S/F ratios at different conditions of state; for feed flow rate of 0.5g.min-1 and squalene feed concentration of 2.2wt%.
T (K) P (MPa) Solubility
(gSQ/ kgCO2)
MCO2
(g.min-1) S/F gCO2/gFeed
313 10 3.3 3.5 6.7
15 7.8 1.5 2.8
20 10.6 1.1 2.1
25 13.6 0.9 1.6
333 17.5 6.69 1.7 3.3
25 7.79 1.5 2.8
27 10.44 1.1 2.1
353 17.5 2.51 4.6 8.8
25 8.23 1.4 2.7
27 10.71 1.1 2.1
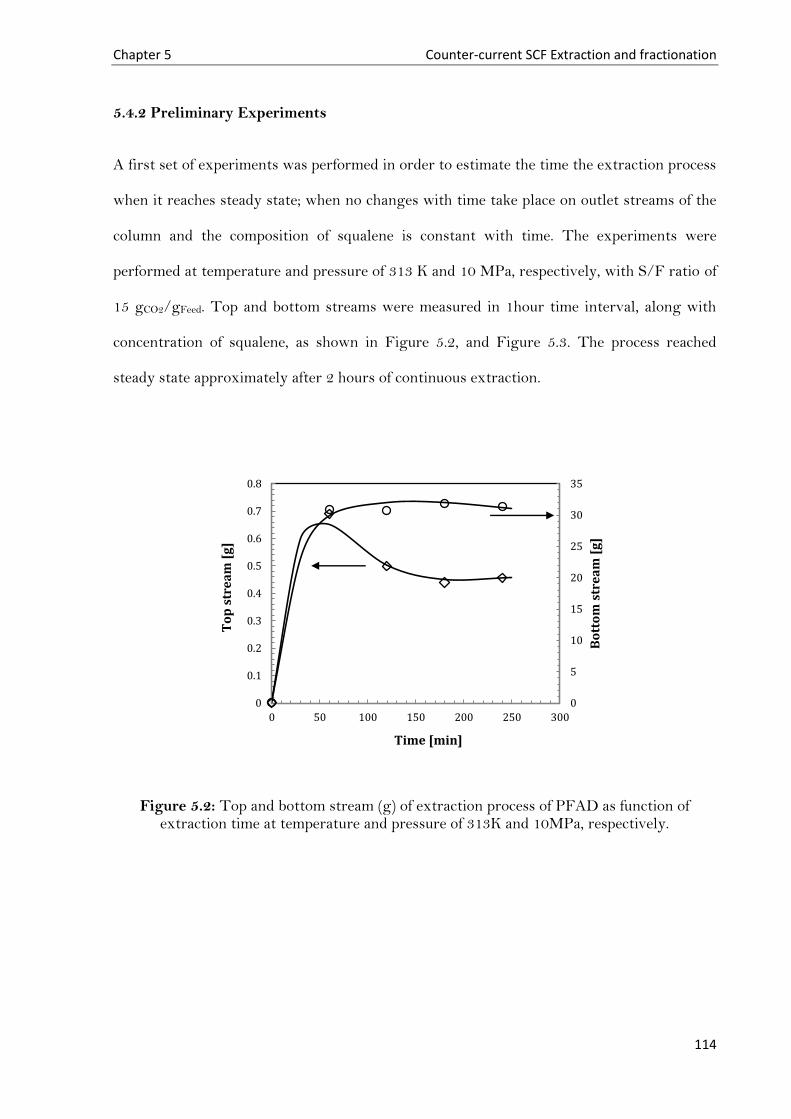
Chapter 5 Counter-current SCF Extraction and fractionation
114
5.4.2 Preliminary Experiments
A first set of experiments was performed in order to estimate the time the extraction process
when it reaches steady state; when no changes with time take place on outlet streams of the
column and the composition of squalene is constant with time. The experiments were
performed at temperature and pressure of 313 K and 10 MPa, respectively, with S/F ratio of
15 gCO2/gFeed. Top and bottom streams were measured in 1hour time interval, along with
concentration of squalene, as shown in Figure 5.2, and Figure 5.3. The process reached
steady state approximately after 2 hours of continuous extraction.
Figure 5.2: Top and bottom stream (g) of extraction process of PFAD as function of extraction time at temperature and pressure of 313K and 10MPa, respectively.
0
5
10
15
20
25
30
35
0
0.1
0.2
0.3
0.4
0.5
0.6
0.7
0.8
0 50 100 150 200 250 300
Bo
tto
m s
tre
am
[g
]
To
p s
tre
am
[g
]
Time [min]

Chapter 5 Counter-current SCF Extraction and fractionation
115
Figure 5.3: Squalene concentration (wt%) in top and bottom stream of extraction process of PFAD as function of extraction time at temperature and pressure of 313K and 10MPa,
respectively.
5.4.3 Effect of Extraction Pressure
Fractionation experiments with PFAD were performed at temperatures between 313 and
353 K and pressures between 10 and 18 MPa. The S/F ratio was varied in the range from 10
to 35 gCO2/gFeed. The conditions of the experiments are listed in details in Table 5.2; each
run was reproduced at least 3 times.
0
0.5
1
1.5
2
2.5
3
3.5
4
0
2
4
6
8
10
12
0 50 100 150 200 250 300
SQ
Bo
tto
m s
tre
am
[w
t%]
SQ
To
p s
tre
am
[w
t%]
Time [min]

Chapter 5 Counter-current SCF Extraction and fractionation
116
Table 5-2: Operating conditions of isothermal fractionation experiments.
Test Pressure
[MPa]
Temperature
[K]
S/F Ratio
[g/g]
Solvent flux
[Kg.m-2.h-1]
Mean value of
Top Product
[g.h-1]
gaseous phase loading
with top product
[g.kg CO2-1]
1 10 313 15 4661 0.46 0.9680
2 12 313 15 4661 1.21 2.5229
3 15 313 15 4661 2.17 4.5302
4 18 313 15 4661 3.68 7.6576
5 15 323 15 4661 1.01 2.0976
6 15 333 15 4661 0.48 0.9953
7 15 353 15 4661 0.33 0.6840
8 15 333 10 2913 0.25 0.8422
9 15 333 25 7574 0.74 0.9491
10 15 333 35 11070 1.24 1.0868
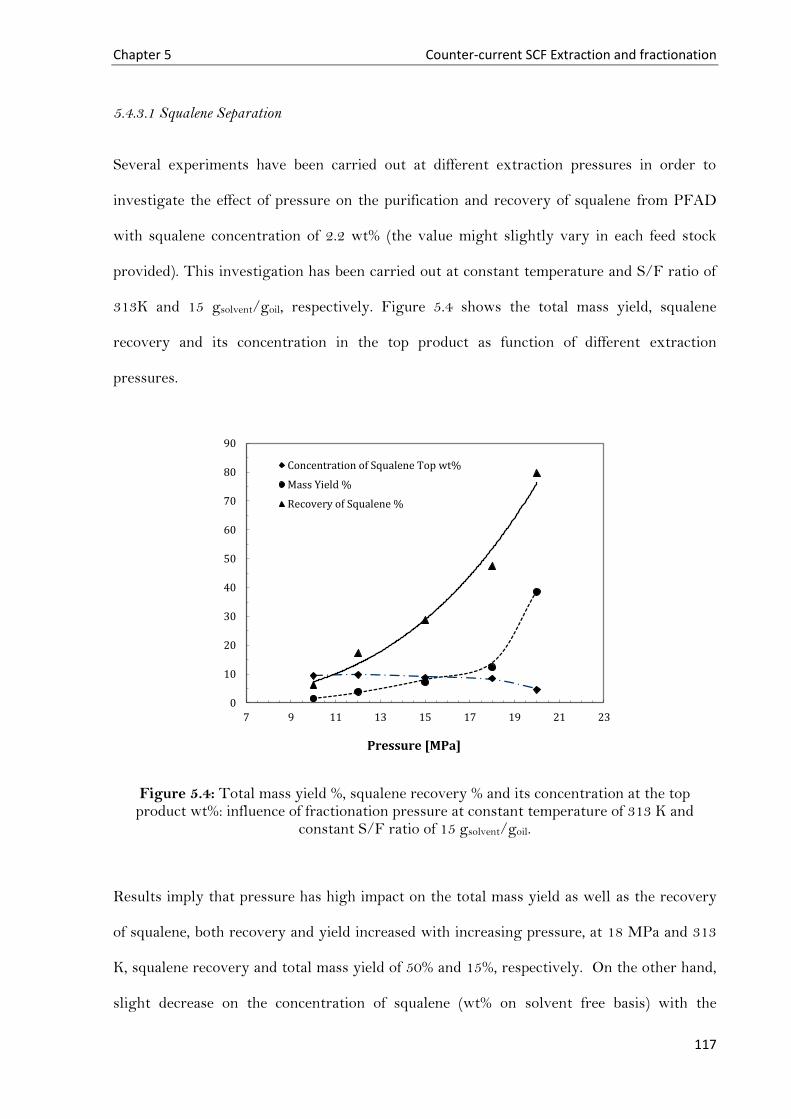
Chapter 5 Counter-current SCF Extraction and fractionation
117
5.4.3.1 Squalene Separation
Several experiments have been carried out at different extraction pressures in order to
investigate the effect of pressure on the purification and recovery of squalene from PFAD
with squalene concentration of 2.2 wt% (the value might slightly vary in each feed stock
provided). This investigation has been carried out at constant temperature and S/F ratio of
313K and 15 gsolvent/goil, respectively. Figure 5.4 shows the total mass yield, squalene
recovery and its concentration in the top product as function of different extraction
pressures.
Figure 5.4: Total mass yield %, squalene recovery % and its concentration at the top product wt%: influence of fractionation pressure at constant temperature of 313 K and
constant S/F ratio of 15 gsolvent/goil.
Results imply that pressure has high impact on the total mass yield as well as the recovery
of squalene, both recovery and yield increased with increasing pressure, at 18 MPa and 313
K, squalene recovery and total mass yield of 50% and 15%, respectively. On the other hand,
slight decrease on the concentration of squalene (wt% on solvent free basis) with the
0
10
20
30
40
50
60
70
80
90
7 9 11 13 15 17 19 21 23
Pressure [MPa]
Concentration of Squalene Top wt%
Mass Yield %
Recovery of Squalene %

Chapter 5 Counter-current SCF Extraction and fractionation
118
increasing of the pressure has been observed at pressure between 10 to 18 MPa. However,
at 20 MPa squalene concentration showed about 50% decrease compared to its
concentration at 10 MPa. This is due to the higher capacity (higher density) of Sc-CO2 with
the increase of the pressure, therefore it can dissolve more of other PFAD components at
these conditions. This observation is in agreement with the common rule that solubility
generally increase with increasing pressure. This trend agreed with the solubility behaviour
of ternary system of squalene/palm olein/CO2 performed in this work, selectivity of Sc-CO2
towards squalene inversely related to pressure, refer to Figure 4.15 in chapter 4. At elevated
pressures, the solubility of lower volatility components increases more than that of higher
volatility components, thus makes the Sc-CO2 less selective (Chao et al., 1993).
5.4.3.2 Free Fatty Acids Separation
The solubilities of triglycerides, di-glycerides and mono-glycerides (Hammam, 1992) in CO2
are very low compared to FFA and squalene, and they are preferentially recovered in the
raffinate. This also has been proved in the first part of this research project; palm olein is
more likely to be enriched in the bottom stream, the distribution coefficient K of palm olein
was less than 1. Refer to solubility studies on quaternary systems studied previously in
chapter 4, section 4.4.2.2. Therefore, this work is focused on the separation of squalene and
FFA only as they are enriched in the top stream. The physical properties of FFA and the
composition of main FFA are given in Table 5.3.
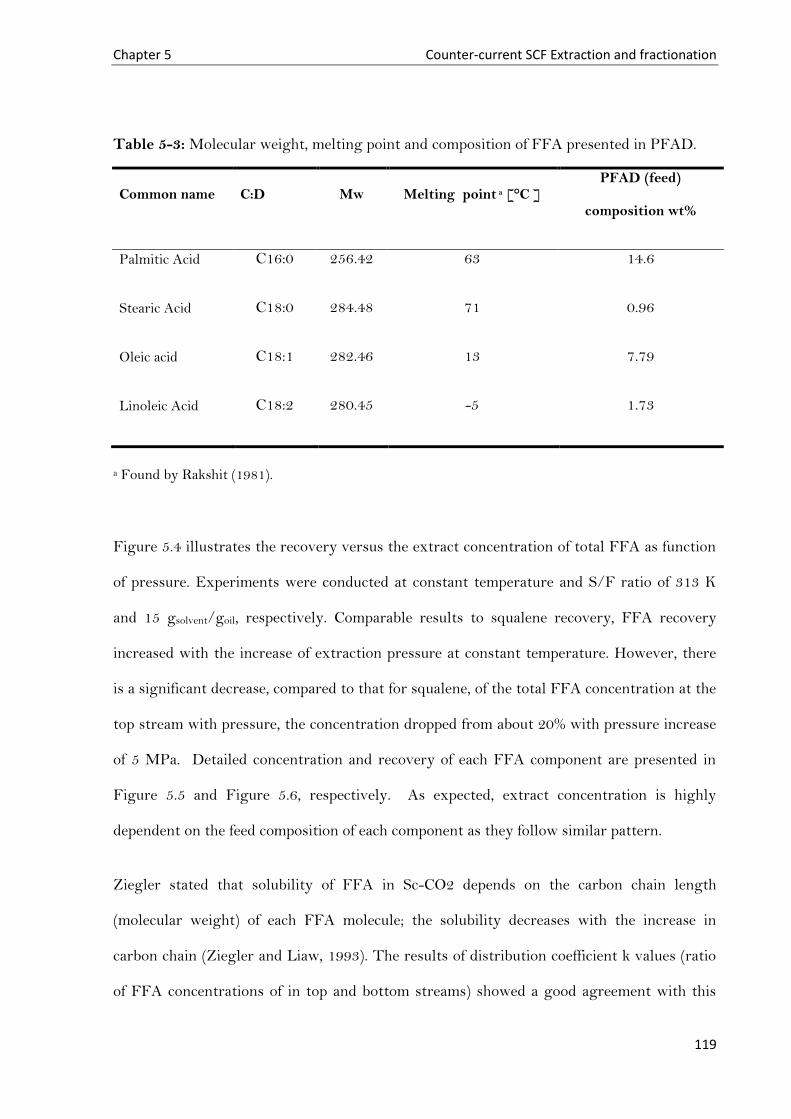
Chapter 5 Counter-current SCF Extraction and fractionation
119
Table 5-3: Molecular weight, melting point and composition of FFA presented in PFAD.
Common name C:D Mw Melting point a [°C ] PFAD (feed)
composition wt%
Palmitic Acid C16:0 256.42 63 14.6
Stearic Acid C18:0 284.48 71 0.96
Oleic acid C18:1 282.46 13 7.79
Linoleic Acid C18:2 280.45 -5 1.73
a Found by Rakshit (1981).
Figure 5.4 illustrates the recovery versus the extract concentration of total FFA as function
of pressure. Experiments were conducted at constant temperature and S/F ratio of 313 K
and 15 gsolvent/goil, respectively. Comparable results to squalene recovery, FFA recovery
increased with the increase of extraction pressure at constant temperature. However, there
is a significant decrease, compared to that for squalene, of the total FFA concentration at the
top stream with pressure, the concentration dropped from about 20% with pressure increase
of 5 MPa. Detailed concentration and recovery of each FFA component are presented in
Figure 5.5 and Figure 5.6, respectively. As expected, extract concentration is highly
dependent on the feed composition of each component as they follow similar pattern.
Ziegler stated that solubility of FFA in Sc-CO2 depends on the carbon chain length
(molecular weight) of each FFA molecule; the solubility decreases with the increase in
carbon chain (Ziegler and Liaw, 1993). The results of distribution coefficient k values (ratio
of FFA concentrations of in top and bottom streams) showed a good agreement with this
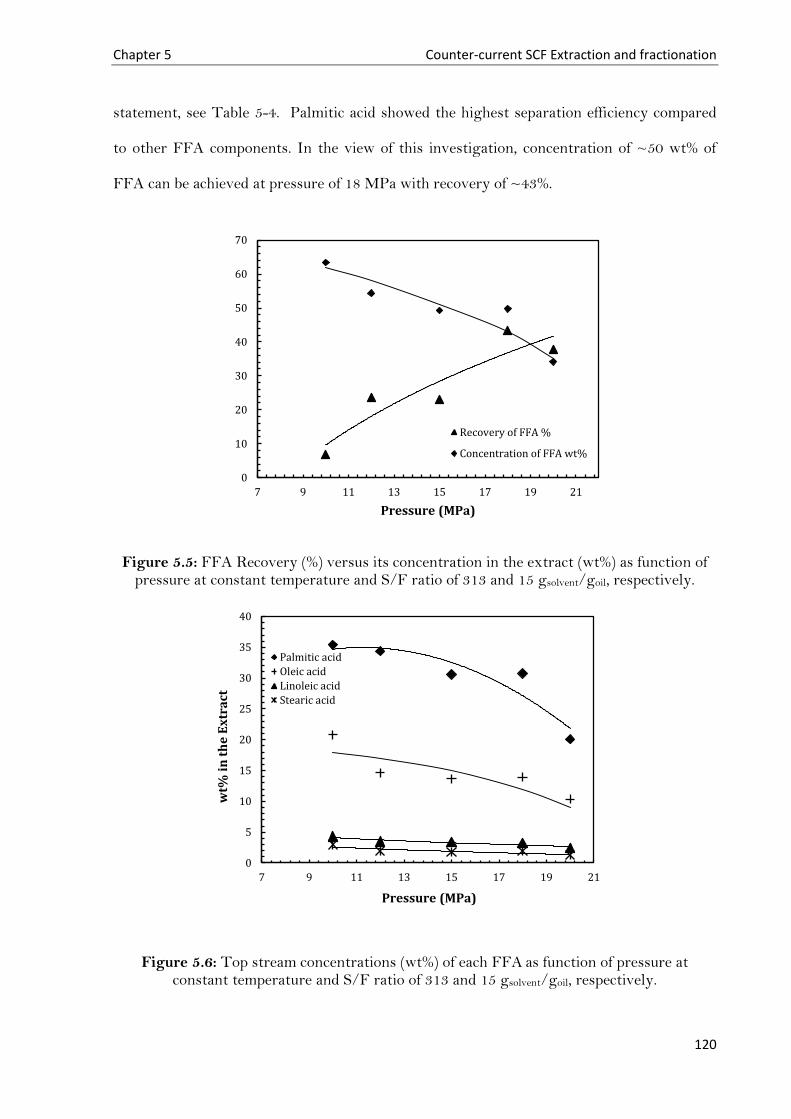
Chapter 5 Counter-current SCF Extraction and fractionation
120
statement, see Table 5-4. Palmitic acid showed the highest separation efficiency compared
to other FFA components. In the view of this investigation, concentration of ~50 wt% of
FFA can be achieved at pressure of 18 MPa with recovery of ~43%.
Figure 5.5: FFA Recovery (%) versus its concentration in the extract (wt%) as function of pressure at constant temperature and S/F ratio of 313 and 15 gsolvent/goil, respectively.
Figure 5.6: Top stream concentrations (wt%) of each FFA as function of pressure at constant temperature and S/F ratio of 313 and 15 gsolvent/goil, respectively.
0
10
20
30
40
50
60
70
7 9 11 13 15 17 19 21
Pressure (MPa)
Recovery of FFA %
Concentration of FFA wt%
0
5
10
15
20
25
30
35
40
7 9 11 13 15 17 19 21
wt%
in
th
e E
xtr
act
Pressure (MPa)
Palmitic acid
Oleic acid
Linoleic acid
Stearic acid

Chapter 5 Counter-current SCF Extraction and fractionation
121
Figure 5.7: Recovery (w%) of each FFA as function of pressure at constant temperature and S/F ratio of 313 and 15 gsolvent/goil, respectively.
5.4.4 Effect of Extraction Temperature
5.4.4.1 Squalene Separation
To investigate the effect of extraction temperature, both pressure and S/F ratio were kept at
constant value of 15 MPa and 15 gsolvent/goil, respectively. In contradictory to the effect of
pressure, increasing temperature leads to decrease the yield and recovery of squalene along
with insignificant decrease in the concentration of squalene in the top product, see Figure
5.8. Decreasing extract (top product) yield with increasing temperature has been also
reported in the literature for the fractionation of canola oil deodorizer distillate (Guclu-
Ustundag and Temelli, 2007) and esterified olive oil deodorizer distillate (Bondioli et al.,
1993), at conditions of 343 K to 373 K at 25 MPa and 313 K to 333 K at 13 – 15 MPa,
respectively.
0
5
10
15
20
25
30
7 9 11 13 15 17 19 21
Re
cov
ery
%
Pressure (MPa)
Palmitic acid
Oleic acid
Linoleic acid
Stearic acid

Chapter 5 Counter-current SCF Extraction and fractionation
122
Table 5-4: Distribution coefficient K of each component of FFA at different experimental runs; the conditions of each run are presented previously in Table 5.2.
Ratio of component compositions in top and bottom streams, K
Experiment
No. 1 2 3 4 5 6 7 8 9 10
C16:0 2.61 2.74 2.52 2.60 2.67 3.03 3.13 2.41 2.98 3.09
C18:0 3.06 2.08 1.99 2.17 2.12 2.25 2.15 2.20 2.20 2.29
C18:1 2.72 2.04 1.97 2.04 1.96 2.10 1.97 1.79 2.05 2.12
C18:2 2.42 2.13 2.11 2.18 2.02 2.11 1.79 1.59 2.04 2.22

Chapter 5 Counter-current SCF Extraction and fractionation
123
Squalene extraction dependence on solvent selectivity shows that with increasing solubility
(by increasing pressure and decreasing temperature) selectivity of Sc-CO2 decreases towards
squalene. According to the solubility measurement earlier in chapter 4 of this work
supported with Hernandez measurements on the solubility of the binary system squalene
and CO2, the results obtained showed strong dependence of solubility with pressure.
Analogous to the presented work solubility of squalene increases with increasing pressure
and decreasing temperature (Hernandez et.al, 2010).
Figure 5.8: Total mass yield %, squalene recovery % and its concentration at the top product wt%: influence of fractionation temperature at constant pressure of 15 MPa and
constant S/F ratio of 15 gsolvent/goil.
5.4.4.1 Free Fatty Acid Separation
While the concentration of squalene decreases with temperature at constant pressure, FFA
showed the opposite effect as illustrated in Figure 5.9. FFA concentration in the top stream
increased from ~50 wt% at 313 K to concentration of ~65 wt% at temperature of 333 K. At
temperature higher than 333 K, the concentration of FFA showed no difference because of
0
5
10
15
20
25
30
35
303 313 323 333 343 353 363
Temperature [K]
Concentration of Squalene Top wt%
Mass Yield %
Recovery of Squalene %

Chapter 5 Counter-current SCF Extraction and fractionation
124
the cross over effect of solubility isotherms where no effect of temperature take place. At
higher temperatures the density of CO2 decreases, therefore a reduction in the recovery of
FFA was observed. In isobaric separation processes at relatively higher temperatures, Sc-
CO2 is more selective to FFA. Similar investigations on FFA separation were obtained from
soybean oil (Friedrich and List, 1982; Jokic et al., 2011) at pressures and temperature of 10
to 30 MPa and 313 to 323 K. They found there is clearly no effect of temperature on the
concentration of Linoleic acid, Oleic acid and stearic acid.
Looking at the detailed FFAs compositions illustrated in Figure 5.10, comparable findings
were obtained. However, comprehensible opposite effect on palmitic acid can be observed.
At temperature from 313 K to 323 K at constant pressure of 15 MPa, palmitic acid in Jokic
(2011) investigation increased from 13.47 wt% to 13.95 wt%, about 3.5% increase. While in
this investigation at exact separation conditions of state, palmitic acid concentration
increased from 30.58 wt% to 36.85 wt%, about 17% of increase. One can explain this
phenomenon based on the variation of feed composition of palmitic acid in both systems, as
PFAD consists of higher palmitic acid compared to soybean in Jokic study (Jokic et al.,
2011). However, linoleic acid composition showed no change with temperature at isobaric
conditions while it has the highest composition in Jokic system (Jokic et al., 2011).
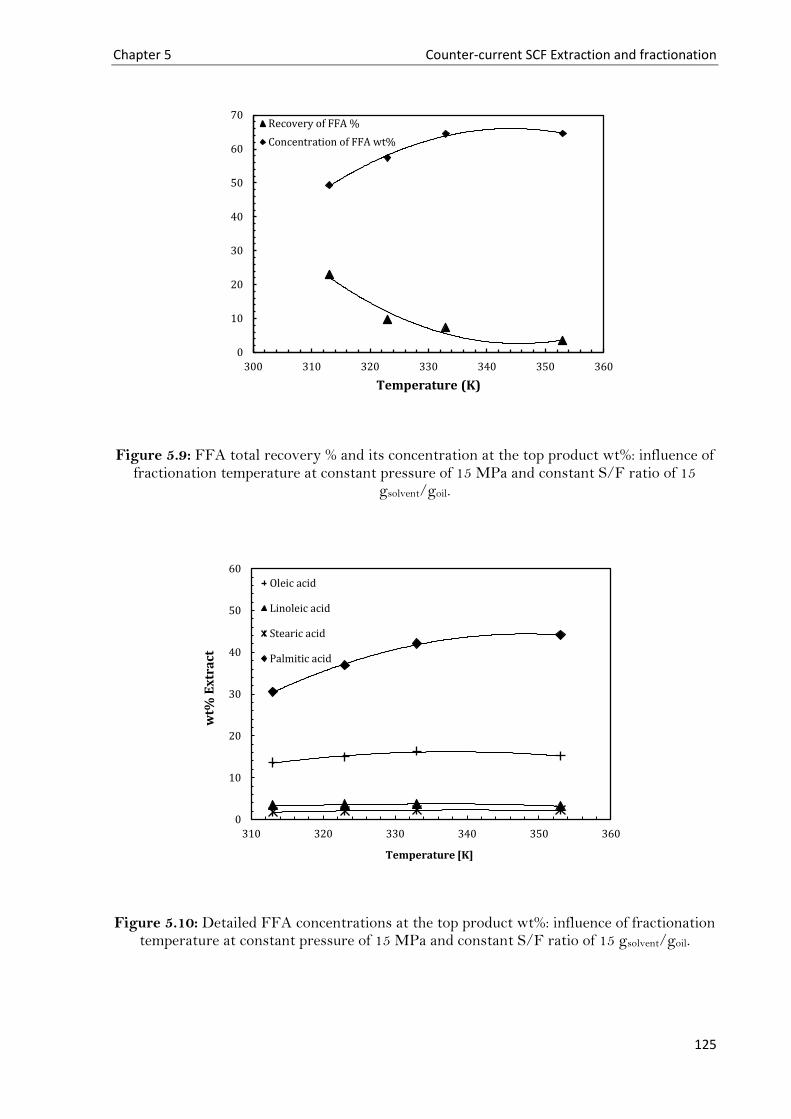
Chapter 5 Counter-current SCF Extraction and fractionation
125
Figure 5.9: FFA total recovery % and its concentration at the top product wt%: influence of fractionation temperature at constant pressure of 15 MPa and constant S/F ratio of 15
gsolvent/goil.
Figure 5.10: Detailed FFA concentrations at the top product wt%: influence of fractionation temperature at constant pressure of 15 MPa and constant S/F ratio of 15 gsolvent/goil.
0
10
20
30
40
50
60
70
300 310 320 330 340 350 360
Temperature (K)
Recovery of FFA %
Concentration of FFA wt%
0
10
20
30
40
50
60
310 320 330 340 350 360
wt%
Ex
tra
ct
Temperature [K]
Oleic acid
Linoleic acid
Stearic acid
Palmitic acid

Chapter 5 Counter-current SCF Extraction and fractionation
126
5.4.3 Effect of Solvent to Feed Ratio
The recovery of squalene enhanced with increasing S/F ration from 5 to 35 by factor of 4 as
shown in Figure 5.11. Total mass yield increased and squalene purity decreased with
increasing S/F ratio. Contrary correlation was observed by Vazquez wt al. (2008) in the
study of squalene isolation from esterified deodorizer distillate. This is due to the isolation of
squalene in the raffinate, while in this work squalene is recovered in the extract.
There was a limitation on studying higher S/F ratios with column used in order to avoid
flooding. Therefore, the upper bond was fixed to 35 S/F ratio. The capacity of Sc-CO2
strongly depends on pressure and temperature, higher pressures and lower temperatures
enhance the capacity of the solvent. Recovery of squalene reached up to 50% at pressure and
temperature of 18 MPa and 313 K, respectively. With the column used in this study at
isothermal conditions, a higher enrichment of squalene was not possible. However, recovery
of 50% squalene was achieved.
Analogous effect was observed according to FFA recovery, see Figure 5.12. Recovery
increased from ~3% to ~15% with increase of S/F ratio. There is an increase observed on
the FFA concentration between S/F of 10 to 20 gsolvent/goil. At S/F ratio more than 20
gsolvent/goil, no concentration enhancement of FFA at top product was observed. Analogous
findings were observed by Dunford and King (2001) on their study on the deacidfication of
rice bran oil by Sc-CO2: there was no significant effect on the extract composition with the
increase of solvent flow-rate within the range of conditions of state investigated.
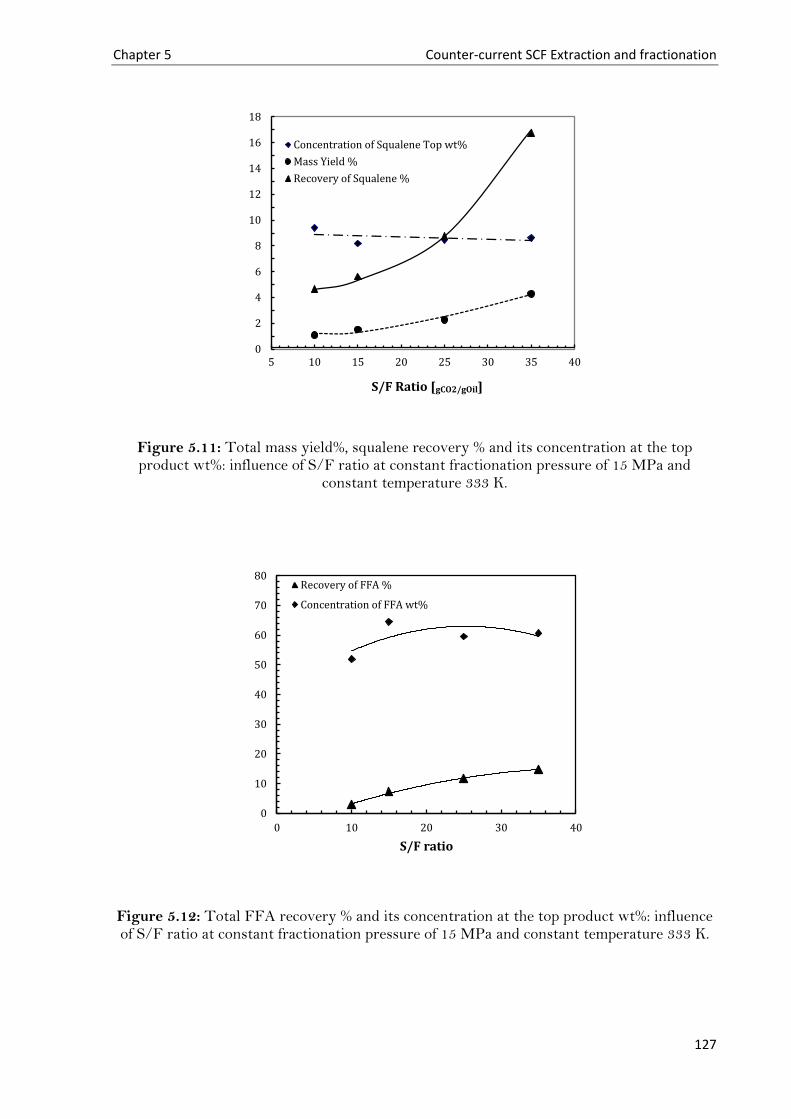
Chapter 5 Counter-current SCF Extraction and fractionation
127
Figure 5.11: Total mass yield%, squalene recovery % and its concentration at the top product wt%: influence of S/F ratio at constant fractionation pressure of 15 MPa and
constant temperature 333 K.
Figure 5.12: Total FFA recovery % and its concentration at the top product wt%: influence of S/F ratio at constant fractionation pressure of 15 MPa and constant temperature 333 K.
0
2
4
6
8
10
12
14
16
18
5 10 15 20 25 30 35 40
S/F Ratio [gCO2/gOil]
Concentration of Squalene Top wt%
Mass Yield %
Recovery of Squalene %
0
10
20
30
40
50
60
70
80
0 10 20 30 40
S/F ratio
Recovery of FFA %
Concentration of FFA wt%
Chapter 5 Counter-current SCF Extraction and fractionation
128
5.4.3 Overview of Squalene and Free Fatty Acids Selectivities
The effectiveness of the separation of the column was characterized by the ratios of the
concentrations of squalene and FFA components in the top and bottom streams, distribution
coefficient k. Distribution coefficients of each FFA component are given in Table 5.4.
Figure 5.13 a–c reveals k values for both squalene and total FFA as function of pressure,
temperature and S/F ratio. Squalene shows higher separation efficiency compared to that for
the FFA at all conditions. At constant pressure of 15 MPa an increase of temperature
reduces k value of squalene and gradually increases k value of FFA. This is due to the
crossover of FFA solubility at pressure lower than 15 MPa as observed by Chrastil for oleic
acid and stearic acid (Chrastil, 1982), while it is above 25 MPa for squalene (Hernandez et
al., 2010).
At crossover point, the effect of temperature is negligible. Above the crossover point,
solubility increases with increasing temperature. k values of squalene and FFA are almost
equivalent at temperature of 353 K, which means that the separation of squalene and FFA
are not achievable at these conditions. For each FFA component, palmitic acid has higher k
value mostly at all conditions tested, as palmitic acid has low molecular mass compared to
other FFA, therefore higher selectivity.
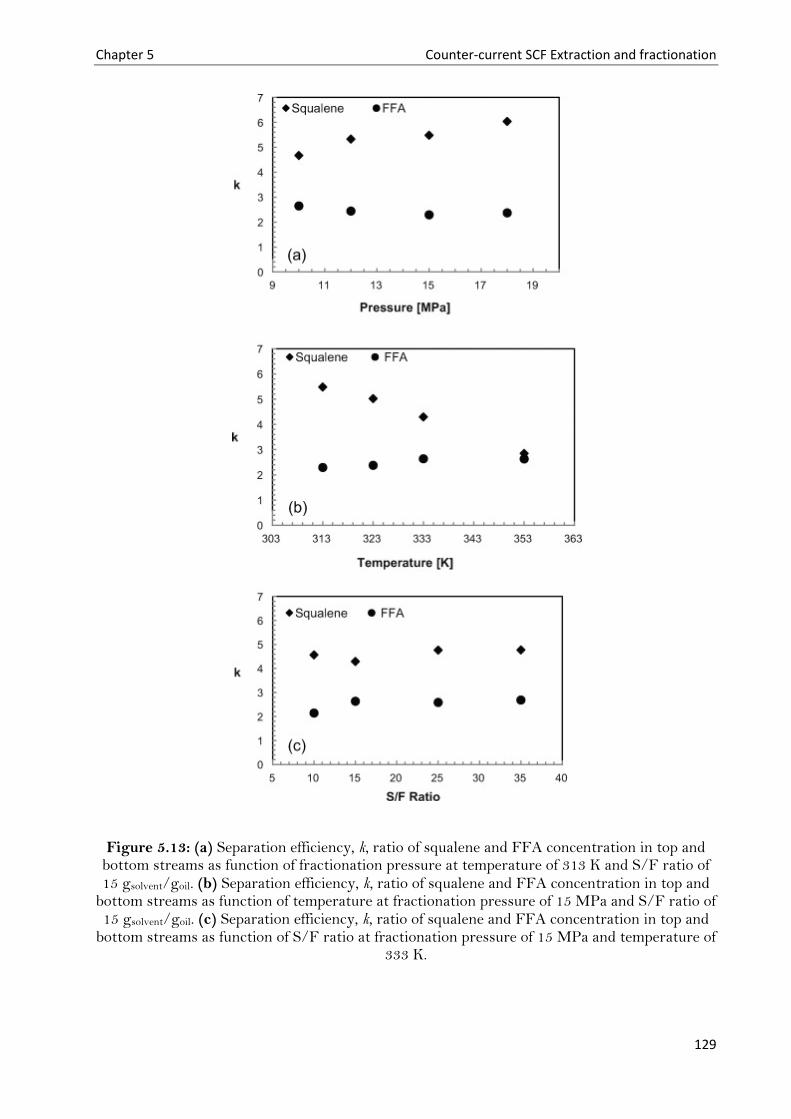
Chapter 5 Counter-current SCF Extraction and fractionation
129
Figure 5.13: (a) Separation efficiency, k, ratio of squalene and FFA concentration in top and bottom streams as function of fractionation pressure at temperature of 313 K and S/F ratio of 15 gsolvent/goil. (b) Separation efficiency, k, ratio of squalene and FFA concentration in top and
bottom streams as function of temperature at fractionation pressure of 15 MPa and S/F ratio of 15 gsolvent/goil. (c) Separation efficiency, k, ratio of squalene and FFA concentration in top and
bottom streams as function of S/F ratio at fractionation pressure of 15 MPa and temperature of 333 K.

Chapter 5 Counter-current SCF Extraction and fractionation
130
4.5 Conclusions
Squalene in PFAD could be significantly enriched by means of supercritical fluid fractionation.
The process has shown higher sensitivity to pressure and temperature compared to solvent to
feed ratio. The optimum conditions at isothermal fractionation experiments were found to be at
18 MPa and 313K with squalene concentration of 8 wt% from a 2.2wt% concentration in
PFAD and recovery of 50%. FFA separation has shown diverse trend compared to squalene in
the study of the effect of extraction temperature. Higher separation between squalene and FFA
can be accomplished at relatively lower temperature at constant pressure. In general terms,
Solvent power has an inverse correlation with the selectivity of squalene; therefore Sc-CO2 is
less selective at higher extraction pressures. However, there is direct relationship between
solvent power and the extraction yield has been observed. This relationship between solvent
power and selectivity put in challenges on the developing of extraction processes, an efficient
process requires high values of selectivity and total throughput.
131
Chapter 6
Longitudinal Thermal Gradient
Counter-Current Supercritical
Fluid Fractionation of PFAD
Components Using Sc-CO2
6.1 Introduction
PFAD main components have considerable differences in their physical and chemical
properties such as molecular weight and vapour pressures, along with their solubility
parameters in Sc-CO2. These differences have a vital role on the distribution coefficient of
these components in the liquid and co2 phases. Distributions of these components are also
highly affected by the separation conditions such as pressure temperature and external flux
ratio. As sighted on the previous study, chapter 5, there is a challenge in supercritical fluid
extraction process to keep higher selectivities along with higher throughputs. Selectivity
enhancement can be achieved by means of external flux. However, there is limitation of the
Sc-CO2 experimental device column used which did not allow the use of the external reflux.
In turn, this chapter explores the effect of longitudinal thermal gradient on the recovery of
Chapter 6 Temperature gradient fractionation
132
squalene. There is great interest on the study of thermal gradient in supercritical fluid
separation processes. Thermal gradient along the column results on density gradient of CO2
within the extraction column where the bottom zone of the column is used for the extraction
due to high CO2 density and the top zone is used for fractionation and rectification of high
Sc-CO2-affinity components due to the internal reflux phenomena. This chapter contains
description of the introduction of thermal gradient on the column used in this study. The
effect of thermal gradient was investigated at various separation pressures.
6.2 Objectives
This chapter is aimed to achieve three main investigations; first to study and investigate the
effect of thermal gradient along the column on total yield and concentration of squalene in
the extract product, as function of extraction pressure. Second objective is to conduct full
study on the effect of each temperature zone along the extraction column. Ultimately, the
investigation covered the effect of state conditions on other components presented in PFAD;
such as FFA components. Extraction and fractionation experiments have been carried out at
temperature of 313K- 363K at different column zones, and pressures between 15 and 20
MPa.
6.3 Methodology
6.3.1 Counter-Current Fractionation Rig
A schematic diagram of the continuous counter-current extraction process used in this work
is illustrated in chapter 5, Figure 5.1. For Full presentation of the experimental apparatus
and extraction procedures refer to chapter 5, section 5.3. For thermal gradient attainment,
each section was heated and controlled individually using heating tape. The main zones of

Chapter 6 Temperature gradient fractionation
133
the fractionation column where the temperature was measured and controlled are illustrated
in Figure 6.1.
Figure 6.1: Main zones of the fractionation column, from bottom to top, z1 to z4.
6.3.2 Materials and analysis
In this study, the same stock material of PFAD used in the isothermal fractionation studies
was used for this investigation. In order to attain full comparison between the effect of
isothermal fractionation with that at thermal gradient conditions. More details about PFAD
samples were discussed previously in Chapter 3; Materials and Analytical Techniques. The
three main streams of the fractionation rig; feed, extract and raffinate were analysed using
gas chromatography. Details on the analytical techniques used were discussed previously in
Chapter 3.
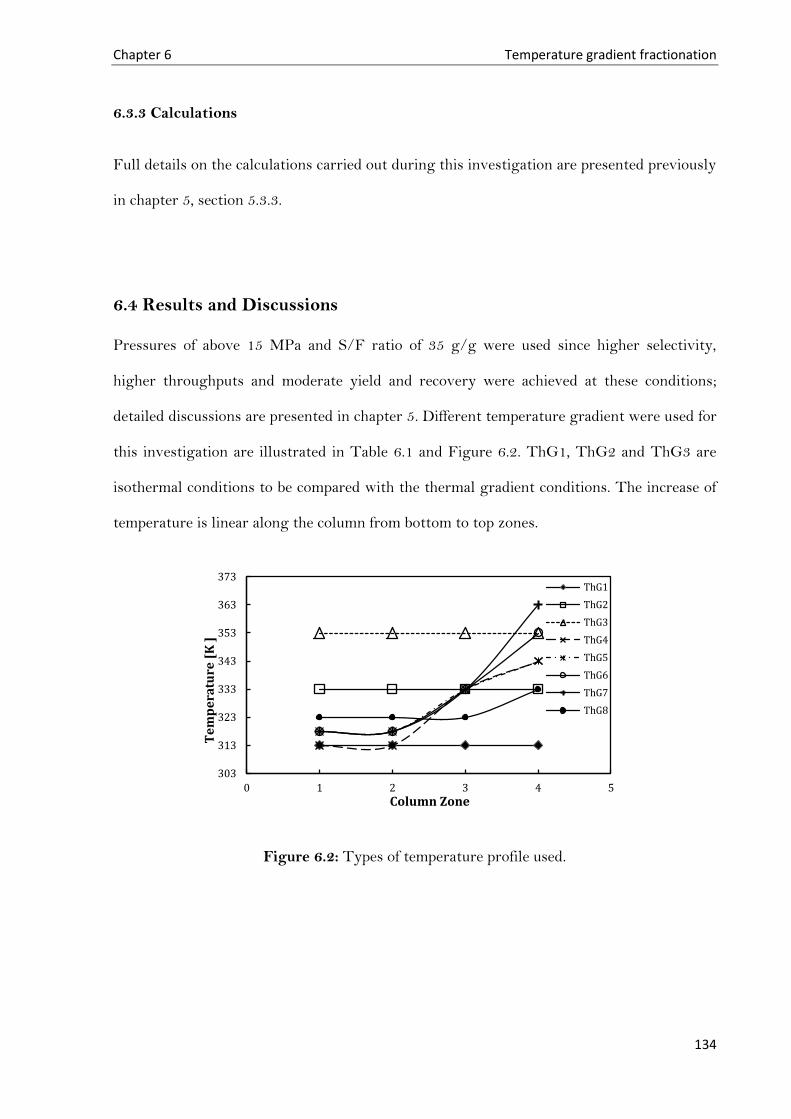
Chapter 6 Temperature gradient fractionation
134
6.3.3 Calculations
Full details on the calculations carried out during this investigation are presented previously
in chapter 5, section 5.3.3.
6.4 Results and Discussions
Pressures of above 15 MPa and S/F ratio of 35 g/g were used since higher selectivity,
higher throughputs and moderate yield and recovery were achieved at these conditions;
detailed discussions are presented in chapter 5. Different temperature gradient were used for
this investigation are illustrated in Table 6.1 and Figure 6.2. ThG1, ThG2 and ThG3 are
isothermal conditions to be compared with the thermal gradient conditions. The increase of
temperature is linear along the column from bottom to top zones.
Figure 6.2: Types of temperature profile used.
303
313
323
333
343
353
363
373
0 1 2 3 4 5
Te
mp
era
ture
[K
]
Column Zone
ThG1
ThG2
ThG3
ThG4
ThG5
ThG6
ThG7
ThG8
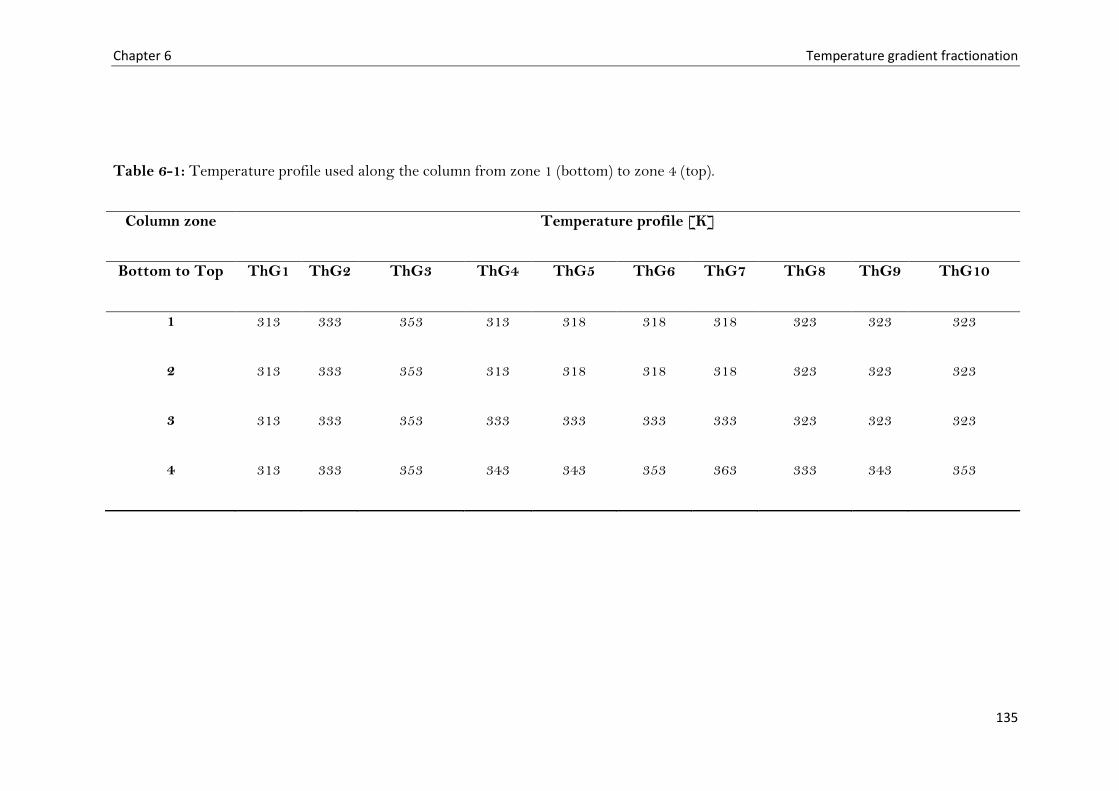
Chapter 6 Temperature gradient fractionation
135
Table 6-1: Temperature profile used along the column from zone 1 (bottom) to zone 4 (top).
Column zone Temperature profile [K]
Bottom to Top ThG1 ThG2 ThG3 ThG4 ThG5 ThG6 ThG7 ThG8 ThG9 ThG10
1 313 333 353 313 318 318 318 323 323 323
2 313 333 353 313 318 318 318 323 323 323
3 313 333 353 333 333 333 333 323 323 323
4 313 333 353 343 343 353 363 333 343 353

136
6.3.2 Effect of Pressure
The effect of pressure under thermal gradient mode was studied at temperature profile of
ThG6, by increasing the pressure at constant thermal gradient along the fractionation
column, the squalene recovery was increased significantly as illustrated in Figure 6.3.
Temperature gradient profiles ThG8, ThG9 and ThG10 are designed to study the
temperature of the top zone of the column.
The process shows higher squalene recovery of approximately 90% compared to that at
isothermal conditions 50% recovery at 20 MPa. Distribution coefficients of squalene
increased significantly when thermal gradient applied to the fractionation column, see
Figure 6.4. It is clear that non-isothermal process shows significant improvement in the
squalene recovery and concentration. Vazquez studied recently the thermal gradient effect
on the separation of fatty acid methyl esters, parallel to this study; there was significant
positive effect on the separation observed (Vazquez et al., 2008). Although higher
throughputs can be attained at higher pressure, however divergence effect was observed on
the extent of squalene concentration at the top stream.
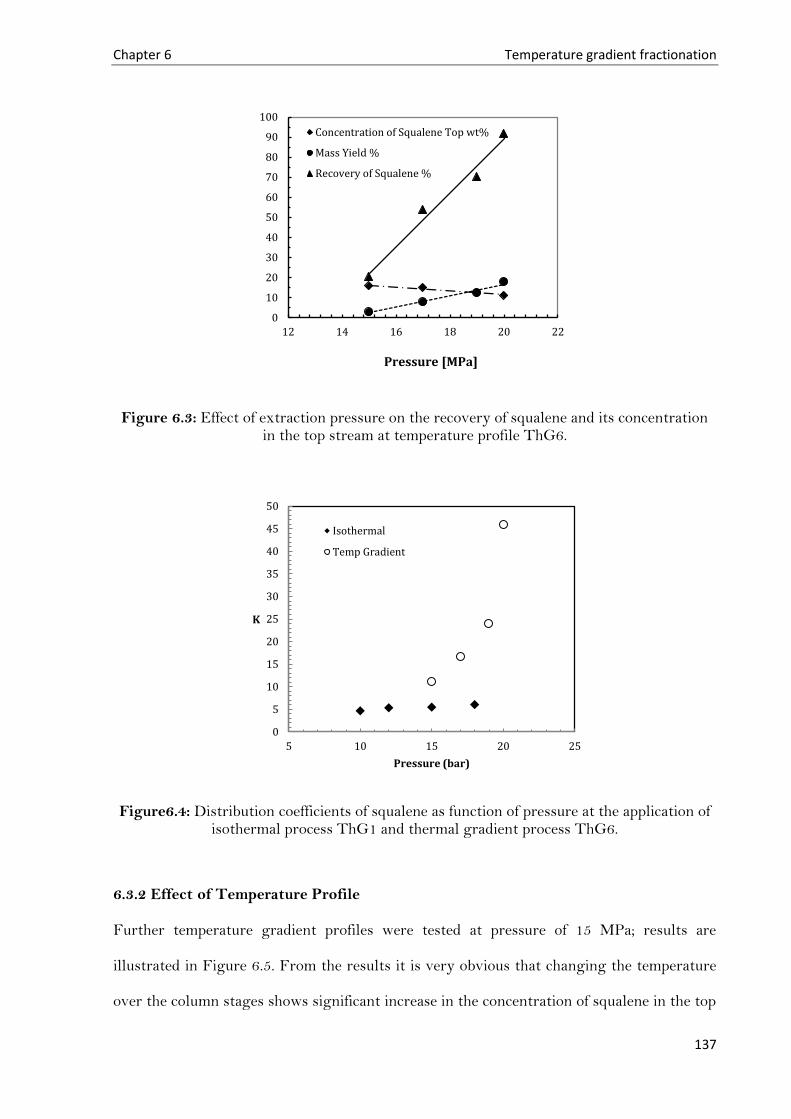
Chapter 6 Temperature gradient fractionation
137
Figure 6.3: Effect of extraction pressure on the recovery of squalene and its concentration in the top stream at temperature profile ThG6.
Figure6.4: Distribution coefficients of squalene as function of pressure at the application of isothermal process ThG1 and thermal gradient process ThG6.
6.3.2 Effect of Temperature Profile
Further temperature gradient profiles were tested at pressure of 15 MPa; results are
illustrated in Figure 6.5. From the results it is very obvious that changing the temperature
over the column stages shows significant increase in the concentration of squalene in the top
0
10
20
30
40
50
60
70
80
90
100
12 14 16 18 20 22
Pressure [MPa]
Concentration of Squalene Top wt%
Mass Yield %
Recovery of Squalene %
0
5
10
15
20
25
30
35
40
45
50
5 10 15 20 25
K
Pressure (bar)
Isothermal
Temp Gradient
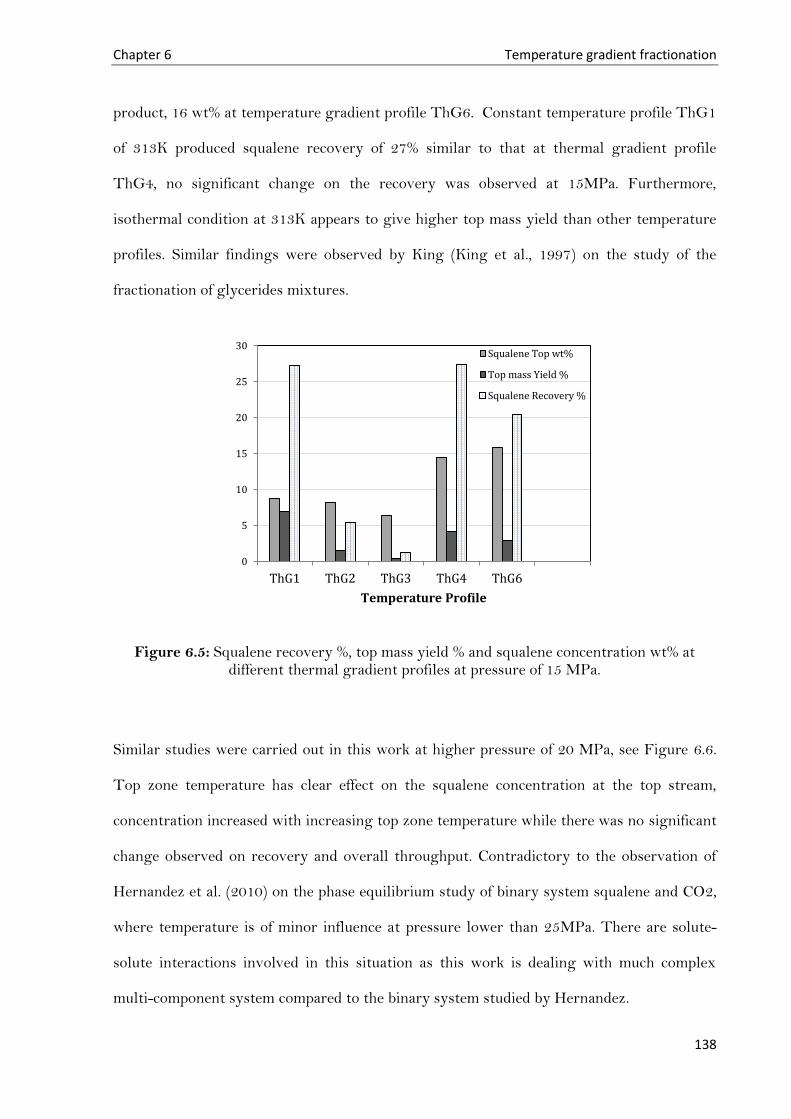
Chapter 6 Temperature gradient fractionation
138
product, 16 wt% at temperature gradient profile ThG6. Constant temperature profile ThG1
of 313K produced squalene recovery of 27% similar to that at thermal gradient profile
ThG4, no significant change on the recovery was observed at 15MPa. Furthermore,
isothermal condition at 313K appears to give higher top mass yield than other temperature
profiles. Similar findings were observed by King (King et al., 1997) on the study of the
fractionation of glycerides mixtures.
Figure 6.5: Squalene recovery %, top mass yield % and squalene concentration wt% at different thermal gradient profiles at pressure of 15 MPa.
Similar studies were carried out in this work at higher pressure of 20 MPa, see Figure 6.6.
Top zone temperature has clear effect on the squalene concentration at the top stream,
concentration increased with increasing top zone temperature while there was no significant
change observed on recovery and overall throughput. Contradictory to the observation of
Hernandez et al. (2010) on the phase equilibrium study of binary system squalene and CO2,
where temperature is of minor influence at pressure lower than 25MPa. There are solute-
solute interactions involved in this situation as this work is dealing with much complex
multi-component system compared to the binary system studied by Hernandez.
0
5
10
15
20
25
30
ThG1 ThG2 ThG3 ThG4 ThG6
Temperature Profile
Squalene Top wt%
Top mass Yield %
Squalene Recovery %

Chapter 6 Temperature gradient fractionation
139
Figure 6.6: Squalene recovery %, top mass yield % and squalene concentration wt% at different thermal gradient profiles at pressure of 20 MPa.
Also, by imposing thermal gradient conditions, at the bottom and middle zones of the
fractionation column where the density is high (at low temperature and high pressure of 20
MPa), the extract is produced at this stage after that it is followed by a refining step at
higher temperature (top zone) where the squalene is concentrated. At these conditions,
internal reflux pattern is formed. Lower section of the column is operated near to higher
density of CO2, therefore higher solvent loading while upper section operated at relatively
lower density where the selectivity of squalene is enhanced relative to that of heavier
molecules. Under these conditions both extraction and distillation are met. Bondioli et al.
(1993) studied thermal gradient for the purpose of squalene enrichment enhancement from
olive oil deodorizer distillate. Total yield and purity of squalene were improved at
temperature profile from bottom to top of 318:333:353 K compared to that of 318:333:363 K.
0
10
20
30
40
50
60
70
80
90
100
ThG5 ThG6 ThG7 ThG8 ThG9 ThG10
Temperature Profile
Squalene Top wt%
Top mass Yield %
Squalene Recovery %

Chapter 6 Temperature gradient fractionation
140
6.3.3 FFA Recovery and Concentration Under Thermal Gradient
The recovery of FFA at temperature profile follows similar trend at isothermal conditions as
function of pressure, comparison is shown in Figure 6.7. However, the recovery slop at
thermal gradient ThG6 is steeper than that of isothermal temperature of ThG1. That’s
mean a small increase in the pressure can enhance the recovery more compared to the
isothermal conditions. Pressure increase from 15 to 18 MPa at isothermal conditions lead to
an increase of FFA recovery from 23% to 43%, while an increase from 15 to 17 MPa under
thermal gradient lead to an increase from 15% to 40% recovery with almost no influence on
the FFA concentration.
In the case of the concentration of FFA in the top stream at isothermal conditions there was
a linear decrease with increase of pressure. Similar to what have been explained earlier; the
column under thermal gradient (from lower temperature at the bottom) is basically divided
to two main sections; extraction section and enrichment section. In the extraction section
most of FFA along with other components is extracted because of the high density of the
solvent. Moving toward the top of the column, the density of CO2 decreases associated with
the increase of temperature. The less soluble components start to precipitate causing an
enrichment of FFA.
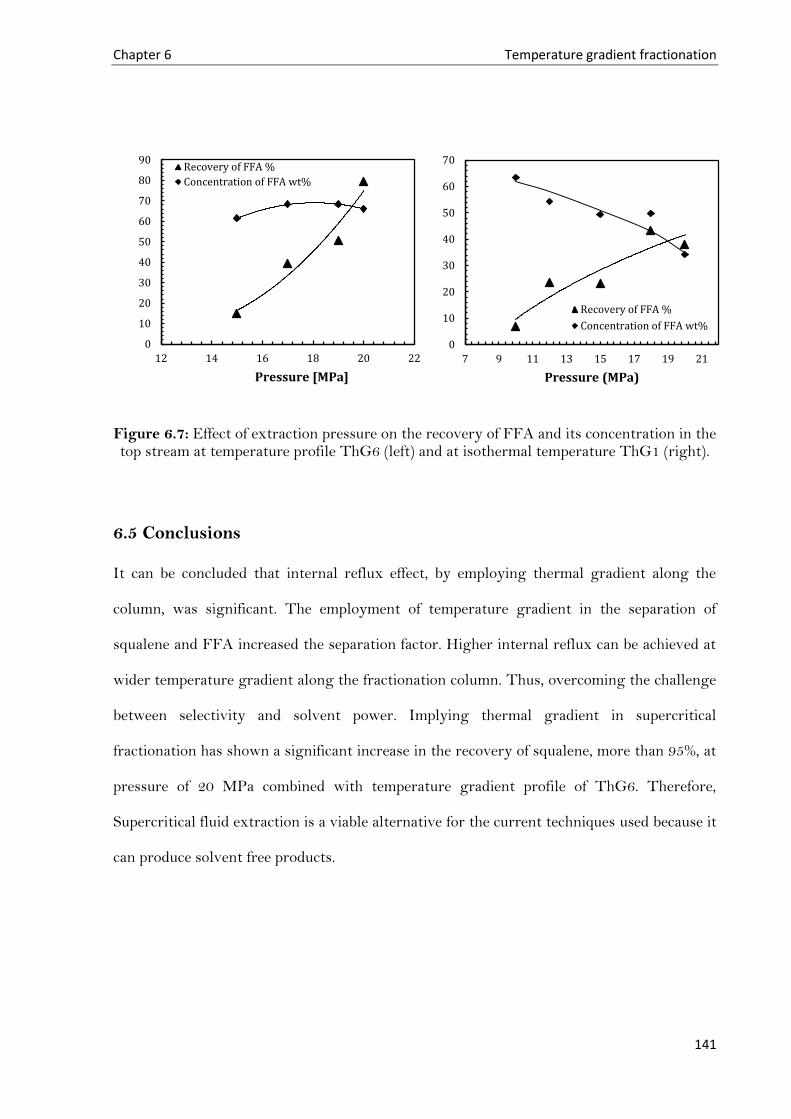
Chapter 6 Temperature gradient fractionation
141
Figure 6.7: Effect of extraction pressure on the recovery of FFA and its concentration in the top stream at temperature profile ThG6 (left) and at isothermal temperature ThG1 (right).
6.5 Conclusions
It can be concluded that internal reflux effect, by employing thermal gradient along the
column, was significant. The employment of temperature gradient in the separation of
squalene and FFA increased the separation factor. Higher internal reflux can be achieved at
wider temperature gradient along the fractionation column. Thus, overcoming the challenge
between selectivity and solvent power. Implying thermal gradient in supercritical
fractionation has shown a significant increase in the recovery of squalene, more than 95%, at
pressure of 20 MPa combined with temperature gradient profile of ThG6. Therefore,
Supercritical fluid extraction is a viable alternative for the current techniques used because it
can produce solvent free products.
0
10
20
30
40
50
60
70
80
90
12 14 16 18 20 22
Pressure [MPa]
Recovery of FFA %
Concentration of FFA wt%
0
10
20
30
40
50
60
70
7 9 11 13 15 17 19 21
Pressure (MPa)
Recovery of FFA %
Concentration of FFA wt%

142
Chapter 7
Effect of Feed Composition on
the Extraction and
Fractionation of Squalene
7.1 Introduction
In the view of previous results chapters, the application of supercritical fluid extraction
(isothermally and under thermal gradient) on the separation and enrichment of PFAD
components, both squalene and FFA showed higher enrichment in the top stream of the
extraction column. As sighted on the earlier study of this research project, chapter 4, there
is a challenge in the separation of FFA and squalene, especially with higher FFA
concentration in the feed system. Squalene selectivity enhancement was achieved by means
of external flux. However, FFA also enhanced along with squalene. This chapter explores
the effect of feed compositions on the recovery of squalene. There is great interest on the
study of different feed materials of PFAD in supercritical fluid separation processes. This
chapter contains description of the introduction of different PFAD feed material and its
Chapter 7 Effect of different feed materials
143
effect on the separation and enrichment of squalene. All experiments were performed at
optimum conditions of 20 MPa and temperature gradient profile ThG6.
7.2 Objectives
This chapter is aimed on the study of the effect of PFAD feed compositions mainly squalene
and FFA content on the recovery and enrichment of squalene in the top product. In this
investigation four different PFAD stocks were used at different compositions of FFA and
squalene.
7.3 Methodology
7.3.1 Counter-Current Fractionation Rig
A schematic diagram of the continuous counter-current extraction process used in this work
is illustrated in chapter 5, Figure 5.1. For full presentation of the experimental apparatus
and extraction procedures refer to chapter 5, section 5.3. For the study of different PFAD
feed stocks, each run of extraction experiment was conducted three times. The first run was
for the purpose of cleaning. Since PFAD feed stocks consist of similar component but with
variant compositions, a cleaning step of the pipe lines of the extraction column by the means
of organic solvent was skipped. Alternatively, each PFAD stock was used for this purpose.
7.3.2 Materials and Analysis
In this study, four different PFAD were used. More details about PFAD samples were
discussed previously in Chapter 3; Materials and Analytical Techniques. The three main
streams of the fractionation rig; feed, extract and raffinate were analysed using gas
chromatography. Details on the analytical techniques used were discussed previously in
Chapter 3.
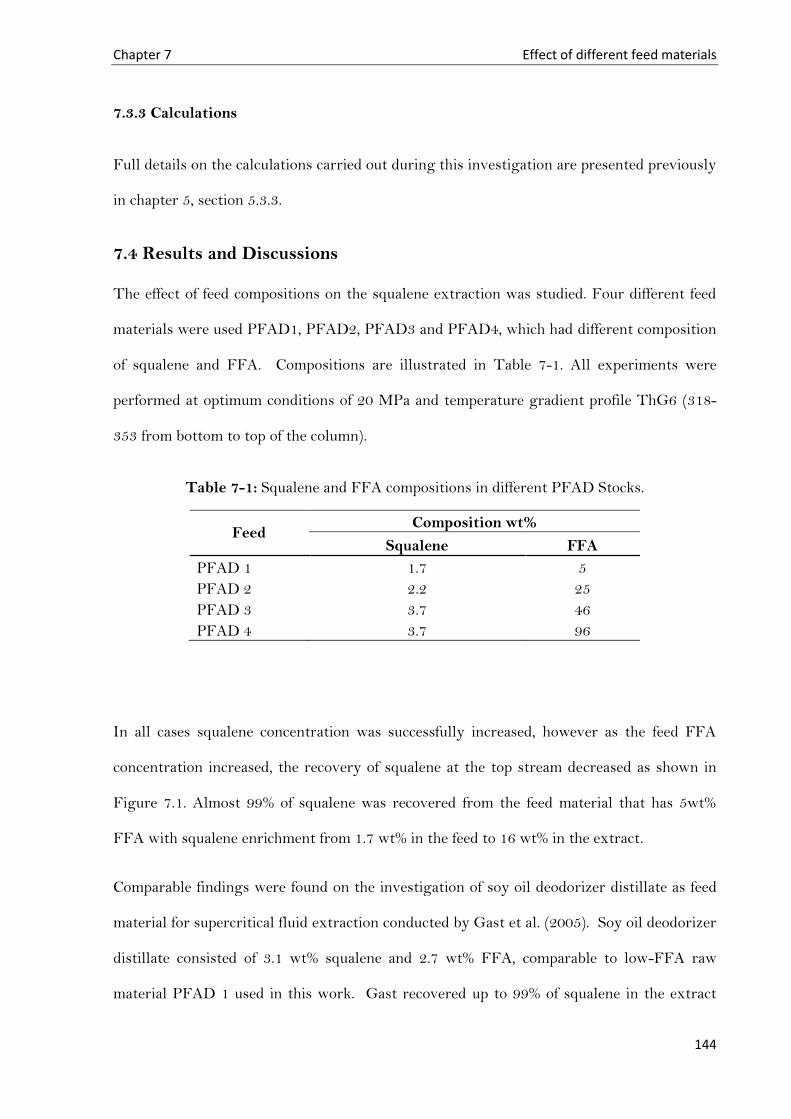
Chapter 7 Effect of different feed materials
144
7.3.3 Calculations
Full details on the calculations carried out during this investigation are presented previously
in chapter 5, section 5.3.3.
7.4 Results and Discussions
The effect of feed compositions on the squalene extraction was studied. Four different feed
materials were used PFAD1, PFAD2, PFAD3 and PFAD4, which had different composition
of squalene and FFA. Compositions are illustrated in Table 7-1. All experiments were
performed at optimum conditions of 20 MPa and temperature gradient profile ThG6 (318-
353 from bottom to top of the column).
Table 7-1: Squalene and FFA compositions in different PFAD Stocks.
Feed Composition wt%
Squalene FFA
PFAD 1 1.7 5
PFAD 2 2.2 25
PFAD 3 3.7 46
PFAD 4 3.7 96
In all cases squalene concentration was successfully increased, however as the feed FFA
concentration increased, the recovery of squalene at the top stream decreased as shown in
Figure 7.1. Almost 99% of squalene was recovered from the feed material that has 5wt%
FFA with squalene enrichment from 1.7 wt% in the feed to 16 wt% in the extract.
Comparable findings were found on the investigation of soy oil deodorizer distillate as feed
material for supercritical fluid extraction conducted by Gast et al. (2005). Soy oil deodorizer
distillate consisted of 3.1 wt% squalene and 2.7 wt% FFA, comparable to low-FFA raw
material PFAD 1 used in this work. Gast recovered up to 99% of squalene in the extract
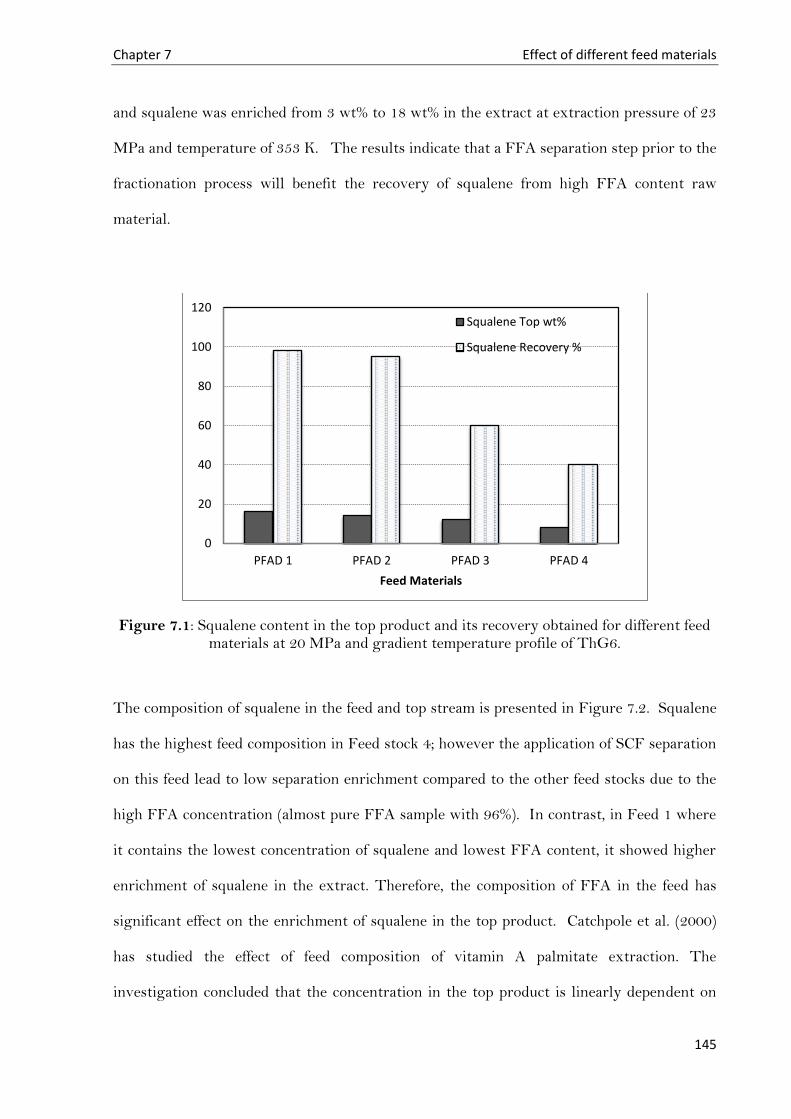
Chapter 7 Effect of different feed materials
145
and squalene was enriched from 3 wt% to 18 wt% in the extract at extraction pressure of 23
MPa and temperature of 353 K. The results indicate that a FFA separation step prior to the
fractionation process will benefit the recovery of squalene from high FFA content raw
material.
Figure 7.1: Squalene content in the top product and its recovery obtained for different feed materials at 20 MPa and gradient temperature profile of ThG6.
The composition of squalene in the feed and top stream is presented in Figure 7.2. Squalene
has the highest feed composition in Feed stock 4; however the application of SCF separation
on this feed lead to low separation enrichment compared to the other feed stocks due to the
high FFA concentration (almost pure FFA sample with 96%). In contrast, in Feed 1 where
it contains the lowest concentration of squalene and lowest FFA content, it showed higher
enrichment of squalene in the extract. Therefore, the composition of FFA in the feed has
significant effect on the enrichment of squalene in the top product. Catchpole et al. (2000)
has studied the effect of feed composition of vitamin A palmitate extraction. The
investigation concluded that the concentration in the top product is linearly dependent on
0
20
40
60
80
100
120
PFAD 1 PFAD 2 PFAD 3 PFAD 4
Feed Materials
Squalene Top wt%
Squalene Recovery %
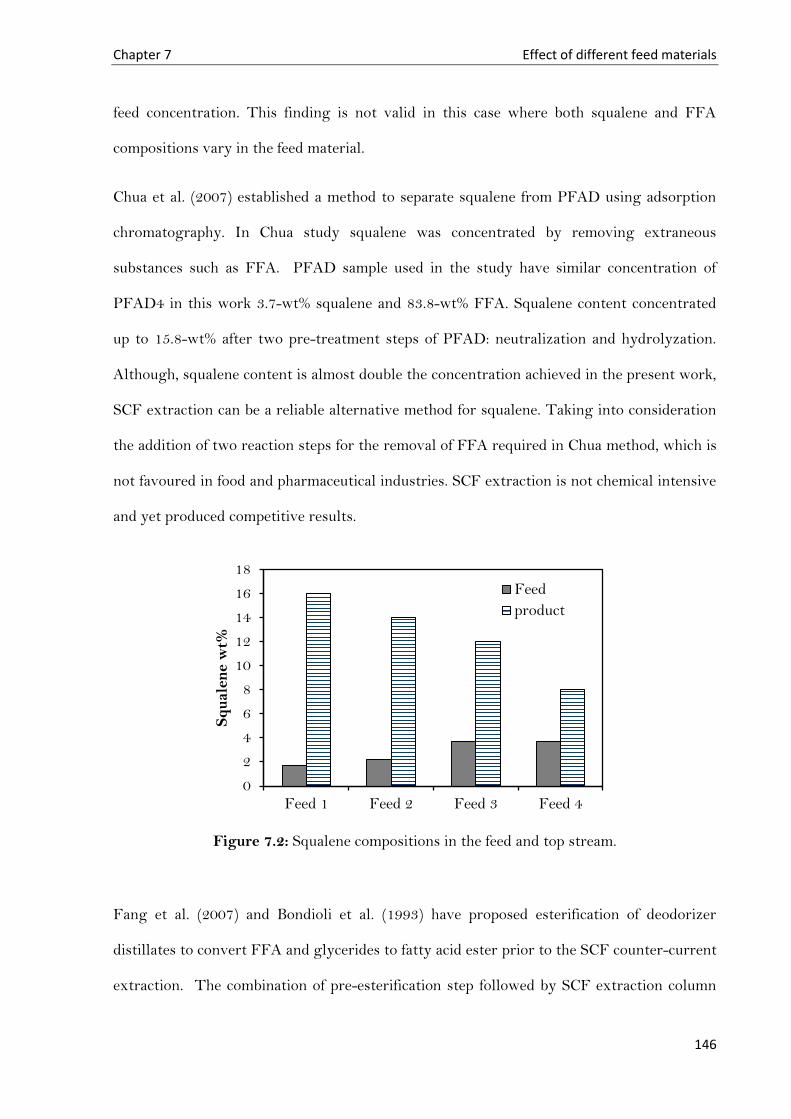
Chapter 7 Effect of different feed materials
146
feed concentration. This finding is not valid in this case where both squalene and FFA
compositions vary in the feed material.
Chua et al. (2007) established a method to separate squalene from PFAD using adsorption
chromatography. In Chua study squalene was concentrated by removing extraneous
substances such as FFA. PFAD sample used in the study have similar concentration of
PFAD4 in this work 3.7-wt% squalene and 83.8-wt% FFA. Squalene content concentrated
up to 15.8-wt% after two pre-treatment steps of PFAD: neutralization and hydrolyzation.
Although, squalene content is almost double the concentration achieved in the present work,
SCF extraction can be a reliable alternative method for squalene. Taking into consideration
the addition of two reaction steps for the removal of FFA required in Chua method, which is
not favoured in food and pharmaceutical industries. SCF extraction is not chemical intensive
and yet produced competitive results.
Figure 7.2: Squalene compositions in the feed and top stream.
Fang et al. (2007) and Bondioli et al. (1993) have proposed esterification of deodorizer
distillates to convert FFA and glycerides to fatty acid ester prior to the SCF counter-current
extraction. The combination of pre-esterification step followed by SCF extraction column
0
2
4
6
8
10
12
14
16
18
Feed 1 Feed 2 Feed 3 Feed 4
Sq
uale
ne w
t%
Feed
product

Chapter 7 Effect of different feed materials
147
can enhance the enrichment of squalene in the extract. The addition of external reflux to the
fractionation column can also enhance the top product concentration of squalene. It is
needed to create counter-current flow regime inside the extraction column (Riha and
Brunner 2000). Investigations on the enrichment of squalene from soy oil deodorizer
distillate were conducted by Gast el al. (2005) at fractionation column of 6m height coupled
with external reflux. Nevertheless, the concentration of squalene was found to 6 times more
than its concentration in the feed material, while in this research project with elimination of
external reflux squalene enriched 10 times its concentration in the feed PFAD1. This might
be because of high concentrations of other components such as tocopherol and sterols in soy
oil deodorizer distillate and/or the effect of internal reflux due to thermal gradient along the
column.
7.4 Conclusions
The effect of feed composition was investigated in this chapter. The results showed that
there is a significant effect of FFA content on the enrichment of squalene. Almost 99% of
squalene was recovered from the feed material that has 5 wt% of FFA only. The results
indicate that a FFA separation step prior to the fractionation process will benefit the
recovery and the enrichment of squalene.

148
Chapter 8
Conclusions and Future Work

Chapter 8 Conclusions and future work
149
8.1 Main Concluding Marks
The main objectives of this research project were fulfilled. Solubility of main PFAD
components was measured at various pressures and temperatures. Fractionation and
enrichment investigations were conducted on PFAD components under isothermal
conditions along the extraction column. The use of temperature gradient throughout the
fractionation column was also investigated. Effect of PFAD feed compositions were studied.
The following are the main concluding marks of this research project:
8.1.1 Solubility Studies
Binary systems of CO2/squalene, CO2/oleic acid, CO2/α-tocopherol, and CO2/pseudo-
component palm olein were measured at temperatures of 313, 333 and 353 K, and at a
pressure range of 10 to 30 MPa. A ternary system of CO2/squalene/palm olein and a
quaternary system of CO2/squalene/ palm olein/ oleic acid were also investigated at 313 K
and pressures of 10 to 25 MPa. Among lipid components mentioned above, squalene has
been shown to have a higher solubility in the binary systems studied due to its hydrocarbon
and non-polar nature, while palm olein has the lowest solubility within the studied state of
conditions. The data of binary solubility measurements were correlated using Chrastil’s
density related empirical equation, and calculated solubilities were in good agreement with
the measured values with maximum deviation in terms of AARD is 18%.
A mixture of 10 wt% squalene and 90 wt% palm olein (SQ +PO+ CO2) was prepared to
determine solubility in Sc-CO2 (ternary system) and for the quaternary systems (SQ + PO +
OA + CO2), squalene was kept at 10 wt%, with addition of 25 wt% OA (as FFA) and 65 wt%
palm olein under the same conditions. Solubility investigations for the ternary and
quaternary systems exhibit the high selectivity of carbon dioxide towards squalene and free
fatty acids. The presence of less soluble components, such as palm olein, affects the loading
of the whole mixture, especially at high concentration. The introduction of FFA into the
Chapter 8 Conclusions and future work
150
mixture results in a decrease of carbon dioxide selectivity towards squalene. This is likely
because the solubility of FFA is higher than the solubility of palm olein in CO2, which
reduces squalene vapour pressure, resulting in low selectivity. Solute-solute interactions
have also been shown to influence the solubility in Sc-CO2. In conclusion, solubility studies
demonstrate the feasibility of separating squalene and FFA from palm olein. Squalene and
FFA distribution coefficients were found to be higher than 1, therefore both components can
be enriched in the gaseous phase. Squalene was enriched in the gaseous phase, reaching its
maximum value at lower pressure, and decreasing with increasing pressure.
8.1.2 Separation and Fractionation Studies
In the separation experiments, the optimum operating conditions were determined by
studying the effect of pressure, temperature and solvent to feed ratio (S/F). Fractionation
experiments with PFAD were performed at temperatures between 313 and 353K and
pressures between 10 and 18MPa. The S/F ratio was varied in the range from 10 to 35
gsolvent/goil. The process has shown higher sensitivity to pressure and temperature
compared to solvent to feed ratio. The optimum conditions at isothermal fractionation
experiments were found to be at 18 MPa and 313K with squalene concentration of 8 wt%
from a 2.2wt% concentration in PFAD and squalene recovery of 50%.
FFA separation has shown different trend compared to squalene in the study of the effect of
extraction temperature. Higher separation between squalene and FFA can be accomplished
at relatively lower temperature at constant pressure. In general terms, solvent power has an
inverse correlation with the selectivity of squalene; therefore Sc-CO2 is less selective at
higher extraction pressures. However, there is direct relationship between solvent power
and the extraction yield has been observed. This relationship between solvent power and
selectivity put in challenges on the developing of extraction processes, an efficient process

Chapter 8 Conclusions and future work
151
requires high values of selectivity and total throughput. Squalene in PFAD could be
significantly enriched by means of supercritical fluid fractionation.
The employment of temperature gradient in the separation of squalene and FFA increased
the separation factor, due to the internal reflux effect. Higher internal reflux can be achieved
at wider temperature gradient along the fractionation column. Thus, overcoming the
challenge between selectivity and solvent power which occurred when applying isothermal
fractionation measurements. Implying thermal gradient in supercritical fractionation has
shown a significant increase in the recovery of squalene, more than 95%, at pressure of
20MPa combined with temperature gradient profile of ThG6.
8.1.3 Effect of Feed Composition
Although squalene showed higher distribution coefficients compared to FFA, the high
concentration of FFA present in PFAD has an influence on the selectivity of squalene.
Therefore, the effect of feed composition was investigated in this project. The results showed
that there is a significant effect of FFA content on the enrichment of squalene. Almost 99%
of squalene was recovered from the feed material that has 5 wt% of FFA only. The results
indicate that a FFA separation step prior to the fractionation process will benefit the
recovery and the enrichment of squalene.
In conclusion, squalene and FFA in PFAD could be significantly enriched by means of
supercritical fluid fractionation. Different fractions with various concentration of squalene
can be achieved by tuning the conditions of state. Supercritical fluid extraction is a viable
alternative for the current techniques used because it can produce solvent free products
especially for food and pharmaceutical industry where the quality of the product is required.

Chapter 8 Conclusions and future work
152
8.2 Suggestions and Future Work
This research project has recognized several areas of interest that require further
investigation in the lipid components fractionation from real PFAD systems.
8.2.1 The Study of the Effect of Co-Solvents Addition
In this work it was found that the high selectivities of Sc-CO2 at low pressure come at the
expense of throughput, the product yield decreased at lower pressure. Therefore the use of
organic co-solvent may enhance the selectivity and total throughput. Catchpole studied the
effect of ethanol addition on the solubility of squalene and his results showed solubility
enhancement of squalene (Catchpole et. al, 2000). However, an additional operating unit will
be required for the removal of the organic solvent from the final product.
8.2.2 The Effect of External Reflux and Feed Introduction Location
The extraction and enrichment of squalene investigation in this research project was
conducted without the use of external reflux. More detailed knowledge of the effect of
external reflux would allow more knowledge on the purification of squalene extracted from
PFAD. All fractionation experiments conducted at certain feed sample introduction point
into the extraction column. Further work with varying sample introduction position would
be required to fully compare the extraction results.
8.2.1 Optimization Using Response Surface Methodology
Optimization supercritical fluid extraction using response surface methodology RSM has
great interest among researchers, as it can minimize the number of experimental runs.
Summary of recent studies on this area is given in Table 8-1. All of the research studies on
the SCF extraction where applied on batch system mode. To our knowledge, there is no
study applying this method on a continuous SCF fractionation process. It is suggested to
discuss the advantages and limitation of the use of RSM analysis on continuous SCF
Chapter 8 Conclusions and future work
153
extraction process. The experimental design using a computer program Design Expert 7.1
was applied on the fractionation experiments in this work; however time constraints
prohibited the investigations on its application as statistical analytical tool for the
optimization of the process. Detailed work on this area is presented in the Appendix A.

Chapter 8 Conclusions and future work
154
Table 8-1: Literature review on the use of RSM methodology for predicting and optimization of extraction processes.
Target
compound(s) Matrix Phase Factors Responses Extraction Mode Statistical Method Reference
Vitamin E, oil
Solids (wheat germ), Kalahari melon and
roselle seeds
3Factors and 3levels Pressure temperature,
Solvent flow rate
Concentration of VE
Batch Central Composite rotate design
CCRD and RSM (GE, et.al,2002), (Shao et al., 2008),
(Nyam et al, 2010)
Oil, tocopherol Solids; (Olive Husk),
microalgae Spirulina
P, T, Solvent flow rate, particle size
Oil yield %, tocopherol
concentration Batch
RSM Full 2 factorial design
(de Lucas, et.al, 2002), (de Lucas, et.al, 2003), (Mendiola et.al, 2008),
(Gracia et. Al, 2011)
Beta-carotene Solids (apricot
pomace) P, T, Ethanol %
Beta-carotene concentration
Batch 23 full factorial central composite
design (Sanal. et.al, 2005)
oil Solids (cottonseeds) P, T, extraction time Yield% Batch CCRD and RSM (Bhattacharjee. Et.al, 2007)
FFA, triglycerides,
orizanols Solids (rice bran) P, T concentrations Batch
2 factor central composite design, RSM
(Wang et al., 2008)
triglycerides
Solids (Jatropha seeds, Aquilaria crassna seeds,
soybean
P, T, solvent to solid rate, extraction time
concentration of triglycerides, total
yield %
Batch CCRD, RSM (Chen et.al, 2009), (Chen et.al, 2010),
(Jokic et al, 2010)
phytosterol Solids, Roselle seeds P, T, Solvent flow rate Yield% and
concentration Batch RSM (Nyam et al, 2010),
arotenoids, squalene and
sterols
Solids, lotus bee pollen
P, T Yield% and
concentration Batch
two-factor central composite rotatable design
(Xu et al, 2011)
FFA Boletus edulis P, extraction time Yield % Batch RSM (Vidovic et.al, 2011)
Squalene Liquid (olive oil
deodorizer distillate)
P, T, extraction time Squalene
concentration Batch RSM (Akgun, 2011)

155
References
Ab Gapor Md, T., Production and utilization of palm fatty acid distillate (PFAD). Lipid
Technology, 2010. 22(1): p. 11-13.
Akgun, N.A., Separation of squalene from olive oil deodorizer distillate using supercritical fluids.
European Journal of Lipid Science and Technology, 2011. 113(12): p. 1558-1565.
Alenezi, R., Biodiesel Production From Different Methods, in School of Chemical Engineering.
2010, University of Birmingham: Birmingham.
Arai, Y., T. Sako, and Y. Takebayashi, Supercritical fluids: molecular interactions, physical
properties, and new applications. 2002, New York: Springer.
Araus, K.A., et al., Effect of triolein addition on the solubility of capsanthin in supercritical carbon
dioxide. The Journal of Chemical Thermodynamics, 2012. 51(0): p. 190-194.
Arul, J., et al., Fractionation of Anhydrous Milk Fat by Superficial Carbon Dioxide. Journal of
Food Science, 1987. 52(5): p. 1231-1236.
Bakes, M.J. and P.D. Nichols, LIPID, FATTY-ACID AND SQUALENE COMPOSITION
OF LIVER OIL FROM 6 SPECIES OF DEEP-SEA SHARKS COLLECTED IN
SOUTHERN AUSTRALIAN WATERS. Comparative Biochemistry and Physiology B-
Biochemistry & Molecular Biology, 1995. 110(1): p. 267-275.
Ben-Naim, A., Preferential solvation in two-and in three-component systems. Pure and Applied
Chemistry, 1990. 62(1): p. 25-34.
Bharath, R., et al., PHASE-EQUILIBRIUM STUDY FOR THE SEPARATION AND
FRACTIONATION OF FATTY OIL COMPONENTS USING SUPERCRITICAL
CARBON-DIOXIDE. Fluid Phase Equilibria, 1992. 81(1-2): p. 307-320.
Bhaskar, A.R., S.S.H. Rizvi, and J.W. Sherbon, ANHYDROUS MILK-FAT
FRACTIONATION WITH CONTINUOUS COUNTERCURRENT SUPERCRITICAL
CARBON-DIOXIDE. Journal of Food Science, 1993. 58(4): p. 748-752.

156
Bhattacharjee, P. and R.S. Singhal, Extraction of squalene from yeast by supercritical carbon
dioxide. World Journal of Microbiology & Biotechnology, 2003. 19(6): p. 605-608.
Bhattacharjee, P., R.S. Singhal, and S.R. Tiwari, Supercritical carbon dioxide extraction of
cottonseed oil. Journal of Food Engineering, 2007. 79(3): p. 892-898.
Bhilwade, H.N., et al., Squalene as Novel Food Factor. Current Pharmaceutical Biotechnology,
2010. 11(8): p. 875-880.
Birtigh, A., et al., SUPERCRITICAL-FLUID EXTRACTION OF OIL-PALM
COMPONENTS. Journal of Supercritical Fluids, 1995. 8(1): p. 46-50.
Bondioli, P., et al., LAMPANTE OLIVE OIL REFINING WITH SUPERCRITICAL
CARBON-DIOXIDE. Journal of the American Oil Chemists Society, 1992. 69(5): p. 477-
480.
Bondioli, P., et al., Squalene recovery from olive oil deodorizer distillates. Journal of the
American Oil Chemists' Society, 1993. 70(8): p. 763-766.
Brunner, G., Stofftrennung mit überkritischen Gasen (Gasextraktion). Chemie Ingenieur
Technik, 1987. 59(1): p. 12-22.
Brunner, G., Industrial process development: Countercurrent multistage gas extraction (SFE)
processes. The Journal of Supercritical Fluids, 1998. 13(1–3): p. 283-301.
Brunner, G., Supercritical fluids: technology and application to food processing. Journal of Food
Engineering, 2005. 67(1-2): p. 21-33.
Brunner, G., Counter-current separations. Journal of Supercritical Fluids, 2009. 47(3): p. 574-
582.
Brunner, G., Applications of Supercritical Fluids, in Annual Review of Chemical and Biomolecular
Engineering, Vol 1, J.M. Prausnitz, M.F. Doherty, and M.A. Segalman, Editors. 2010. p. 321-
342.
Brunner, G., et al., Separation of tocopherols from deodorizer condensates by countercurrent
extraction with carbon dioxide. The Journal of Supercritical Fluids, 1991. 4(1): p. 72-80.
157
Brunner, G., C. Saure, and D. Buss, Phase Equilibrium of Hydrogen, Carbon Dioxide, Squalene,
and Squalane. Journal of Chemical and Engineering Data, 2009. 54(5): p. 1598-1609.
Buningpfaue, H., R. Eggers, and A. Bartsch, COMPARISON OF MILK-FAT FRACTIONS
OBTAINED BY CRYSTALLIZATION WITH THOSE OBTAINED IN A CONTINUOUS
FRACTIONATION PROCESS USING SUPERCRITICAL CARBON-DIOXIDE. Fett
Wissenschaft Technologie-Fat Science Technology, 1989. 91(3): p. 92-99.
Catchpole, O.J., J.B. Grey, and K.A. Noermark, Fractionation of fish oils using supercritical CO2
and CO2+ethanol mixtures. The Journal of Supercritical Fluids, 2000. 19(1): p. 25-37.
Catchpole, O.J., et al., Fractionation of Lipids in a Static Mixer and Packed Column Using
Supercritical Carbon Dioxide. Industrial & Engineering Chemistry Research, 2000. 39(12): p.
4820-4827.
Catchpole, O.J., J.-C. von Kamp, and J.B. Grey, Extraction of Squalene from Shark Liver Oil in
a Packed Column Using Supercritical Carbon Dioxide. Industrial & Engineering Chemistry
Research, 1997. 36(10): p. 4318-4324.
Chang, C.M.J., et al., Supercritical carbon dioxide extraction of high-value substances from soybean
oil deodorizer distillate. Industrial & Engineering Chemistry Research, 2000. 39(12): p. 4521-
4525.
Chao, R.R., S.J. Mulvaney, and H.M. Huang, EFFECTS OF EXTRACTION AND
FRACTIONATION PRESSURES ON SUPERCRITICAL EXTRACTION OF
CHOLESTEROL FROM BEEF TALLOW. Journal of the American Oil Chemists Society,
1993. 70(2): p. 139-143.
Cheirsilp, B., W. Kaewthong, and A. H-Kittikun, Kinetic study of glycerolysis of palm olein for
monoacylglycerol production by immobilized lipase. Biochemical Engineering Journal, 2007.
35(1): p. 71-80.
158
Chen, C.C., C.M.J. Chang, and P.W. Yang, Vapor-liquid equilibria of carbon dioxide with
linoleic acid, alpha-tocopherol and triolein at elevated pressures. Fluid Phase Equilibria, 2000.
175(1-2): p. 107-115.
Chen, H., S.J. Schwartz, and G.A. Spanos, FRACTIONATION OF BUTTER OIL BY
SUPERCRITICAL CARBON-DIOXIDE. Journal of Dairy Science, 1992. 75(10): p. 2659-
2669.
Chen, W.H., et al., Supercritical carbon dioxide extraction of triglycerides from Aquilaria crassna
seeds. Separation and Purification Technology, 2010. 73(2): p. 135-141.
Chrastil, J., SOLUBILITY OF SOLIDS AND LIQUIDS IN SUPERCRITICAL GASES.
Journal of Physical Chemistry, 1982. 86(15): p. 3016-3021.
Christianson, D.D., et al., Supercritical Fluid Extraction of Dry-Milled Corn Germ with Carbon
Dioxide. Journal of Food Science, 1984. 49(1): p. 229-232.
Chua, C.S.L., et al., Separation of squalene from palm fatty acid distillate using adsorption
chromatography. European Journal of Lipid Science and Technology, 2007. 109(11): p. 1083-
1087.
Chuang, M.H. and G. Brunner, Concentration of minor components in crude palm oil. Journal of
Supercritical Fluids, 2006. 37(2): p. 151-156.
de Lucas, A., et al., Supercritical fluid extraction of tocopherol concentrates from olive tree leaves.
Journal of Supercritical Fluids, 2002. 22(3): p. 221-228.
de Lucas, A., J. Rincon, and I. Gracia, Influence of operation variables on quality parameters of
olive husk oil extracted with CO2: Three-step sequential extraction. Journal of the American Oil
Chemists Society, 2003. 80(2): p. 181-188.

159
Dobbs, J.M., et al., MODIFICATION OF SUPERCRITICAL FLUID PHASE-BEHAVIOR
USING POLAR COSOLVENTS. Industrial & Engineering Chemistry Research, 1987.
26(1): p. 56-65.
Dunford, N.T. and J.W. King, Phytosterol enrichment of rice bran oil by a supercritical carbon
dioxide fractionation technique. Journal of Food Science, 2000. 65(8): p. 1395-1399.
Dunford, N.T. and J.W. King, Thermal gradient deacidification of crude rice bran oil utilizing
supercritical carbon dioxide. Journal of the American Oil Chemists Society, 2001. 78(2): p.
121-125.
Egorov, S.A., Preferential solvation in supercritical fluids: An integral equation study. Journal of
Chemical Physics, 2000. 113(17): p. 7502-7510.
Esquivel, M.M., M.G. Bernardo-Gil, and M.B. King, Mathematical models for supercritical
extraction of olive husk oil. Journal of Supercritical Fluids, 1999. 16(1): p. 43-58.
Fang, T., et al., Separation of natural tocopherols from soybean oil byproduct with supercritical
carbon dioxide. Journal of Supercritical Fluids, 2007. 40(1): p. 50-58.
Fang, T., et al., Phase equilibria for binary systems of methyl oleate–supercritical CO2 and α-
tocopherol–supercritical CO2. The Journal of Supercritical Fluids, 2004. 30(1): p. 1-16.
Fernández-Ronco, M.P., et al., High-pressure phase equilibria of binary and ternary mixtures of
carbon dioxide, triglycerides and free fatty acids: Measurement and modeling with the GC-EOS.
Fluid Phase Equilibria, 2010. 295(1): p. 1-8.
Francis, A.W., Solvent Extraction with Liquid Carbon Dioxide. Industrial & Engineering
Chemistry, 1955. 47(2): p. 230-233.
160
Friedrich, J.P. and G.R. List, CHARACTERIZATION OF SOYBEAN OIL EXTRACTED
BY SUPERCRITICAL CARBON-DIOXIDE AND HEXANE. Journal of Agricultural and
Food Chemistry, 1982. 30(1): p. 192-193.
Gast, K., et al., Purification of tocochromanols from edible oil. The Journal of Supercritical
Fluids, 2005. 34(1): p. 17-25.
Ge, Y., et al., Optimization of the supercritical fluid extraction of natural vitamin E from wheat
germ using response surface methodology. Journal of Food Science, 2002. 67(1): p. 239-243.
Gracia, I., et al., Optimization of supercritical CO2 process for the concentration of tocopherol,
carotenoids and chlorophylls from residual olive husk. Journal of Supercritical Fluids, 2011. 59: p.
72-77.
Guclu-Ustundag, O. and F. Temelli, Column fractionation of canola oil deodorizer distillate
using supercritical carbon dioxide. Journal of the American Oil Chemists Society, 2007. 84(10):
p. 953-961.
Hakuta, Y., H. Hayashi, and K. Arai, Fine particle formation using supercritical fluids. Current
Opinion in Solid State & Materials Science, 2003. 7(4-5): p. 341-351.
Hannay, J.B. and J. Hogarth, On the Solubility of Solids in Gases. J Proceedings of the Royal
Society of London, 1879. 29: p. 324-326.
Haslenda, H. and M.Z. Jamaludin, Industry to Industry By-products Exchange Network towards
zero waste in palm oil refining processes. Resources, Conservation and Recycling, 2011. 55(7):
p. 713-718.
He, H.P., H. Corke, and J.G. Cai, Supercritical carbon dioxide extraction of oil and squalene from
Amaranthus grain. Journal of Agricultural and Food Chemistry, 2003. 51(27): p. 7921-7925.
161
Herna ndez, E.J., et al., High-Pressure Phase Equilibria of Squalene + Carbon Dioxide: New
Data and Thermodynamic Modeling. Journal of Chemical & Engineering Data, 2010. 55(9): p.
3606-3611.
Herrero, M., et al., Supercritical fluid extraction: Recent advances and applications. Journal of
Chromatography A, 2010. 1217(16): p. 2495-2511.
Hong, S.A., et al., Phase equilibria of palm oil, palm kernel oil, and oleic acid plus supercritical
carbon dioxide and modeling using Peng-Robinson EOS. Journal of Industrial and Engineering
Chemistry, 2010. 16(5): p. 859-865.
Huber, W., et al., Dynamic supercritical CO2 extraction for removal of cholesterol from anhydrous
milk fat. International Journal of Food Science and Technology, 1996. 31(2): p. 143-151.
Hubert, P. and O.G. Vitzthum, Fluid Extraction of Hops, Spices, and Tobacco with Supercritical
Gases. Angewandte Chemie International Edition in English, 1978. 17(10): p. 710-715.
Hurtado-Benavides, A.M., et al., Countercurrent packed column supercritical CO2 extraction of
olive oil. Mass transfer evaluation. The Journal of Supercritical Fluids, 2004. 28(1): p. 29-35.
Hyatt, J.A., Liquid and supercritical carbon dioxide as organic solvents. The Journal of Organic
Chemistry, 1984. 49(26): p. 5097-5101.
banez, E., et al., Concentration of sterols and tocopherols from olive oil with supercritical carbon
dioxide. Journal of the American Oil Chemists Society, 2002. 79(12): p. 1255-1260.
162
Ikushima, Y., et al., SOLVENT POLARITY PARAMETERS OF SUPERCRITICAL
CARBON-DIOXIDE AS MEASURED BY INFRARED-SPECTROSCOPY. Bulletin of the
Chemical Society of Japan, 1991. 64(7): p. 2224-2229.
Jentoft, R.E. and T.H. Gouw, Apparatus for supercritical fluid chromatography with carbon
dioxide as the mobile phase. Analytical Chemistry, 1972. 44(4): p. 681-686.
Jin, J.S., et al., Solubility of propyl p-hydroxybenzoate in supercritical carbon dioxide with and
without a cosolvent. Journal of Chemical and Engineering Data, 2005. 50(3): p. 801-803.
Johannsen, M. and G. Brunner, Solubilities of the Fat-Soluble Vitamins A, D, E, and K in
Supercritical Carbon Dioxide. Journal of Chemical & Engineering Data, 1997. 42(1): p. 106-
111.
okic, S., et al., Solubility and kinetics of soybean oil and fatty acids in supercritical CO2. European
Journal of Lipid Science and Technology, 2011. 113(5): p. 644-651.
Jokic, S., et al., Supercritical CO2 extraction of soybean oil: process optimisation and triacylglycerol
composition. International Journal of Food Science and Technology, 2010. 45(9): p. 1939-
1946.
Jouyban, A., H.K. Chan, and N.R. Foster, Mathematical representation of solute solubility in
supercritical carbon dioxide using empirical expressions. Journal of Supercritical Fluids, 2002.
24(1): p. 19-35.
Kaewthong, W. and A. H-Kittikun, Glycerolysis of palm olein by immobilized lipase PS in
organic solvents. Enzyme and Microbial Technology, 2004. 35(2-3): p. 218-222.
163
Katritzky, A.R., et al., Quantitative Measures of Solvent Polarity. ChemInform, 2004. 35(14): p.
175-198.
Kauffman, J.F., Quadrupolar Solvent Effects on Solvation and Reactivity of Solutes Dissolved in
Supercritical CO2. The Journal of Physical Chemistry A, 2001. 105(14): p. 3433-3442.
Kawakami, N., et al., Preparation of highly porous silica aerogel thin film by supercritical drying.
Japanese Journal of Applied Physics Part 2-Letters, 2000. 39(3AB): p. L182-L184.
Kayama, M., Marine biogenic lipids. Nippon Suisan Gakkaishi, 2001. 67(6): p. 1039-1050.
King, J.W., et al., Thermal gradient fractionation of glyceride mixtures under super-critical fluid
conditions. Journal of Supercritical Fluids, 1997. 10(2): p. 127-137.
Lahiere, R.J. and J.R. Fair, Mass-transfer efficiencies of column contactors in supercritical
extraction service. Industrial & Engineering Chemistry Research, 1987. 26(10): p. 2086-2092.
Li, J.L., et al., Solubility of p-Toluenesulfonamide in Pure and Modified Supercritical Carbon
Dioxide. Journal of Chemical and Engineering Data, 2009. 54(3): p. 1142-1146.
Lim, S. and S.S.H. Rizvi, CONTINUOUS SUPERCRITICAL-FLUID PROCESSING OF
ANHYDROUS MILK-FAT IN A PACKED-COLUMN. Journal of Food Science, 1995.
60(5): p. 889-893.
Liu, D.H., et al., Separating tocotrienols from palm oil by molecular distillation. Food Reviews
International, 2008. 24(4): p. 376-391.

164
Maheshwari, P., et al., SOLUBILITY OF FATTY-ACIDS IN SUPERCRITICAL
CARBON-DIOXIDE. Journal of the American Oil Chemists Society, 1992. 69(11): p. 1069-
1076.
Marcus, Y., The properties of solvents. 1998, New York: Wiley.
Marcus, Y., Solvent mixtures: properties and selective solvation. 2002, New York: Marcel
Dekker.
Markom, M., H. Singh, and M. Hasan, Supercritical CO2 fractionation of crude palm oil. The
Journal of Supercritical Fluids, 2001. 20(1): p. 45-53.
Martinez-Correa, H.A., et al., Measurements and thermodynamic modeling of the solubility of
squalene in supercritical carbon dioxide. Journal of Food Engineering, 2010. 96(1): p. 43-50.
McGlashan, M.L., Chemical Thermodynamics. Vol. 2. 1977, Cambridge: Royal Society of
Chemistry.
McHugh, M.A. and V.J. Krukonis, Supercritical Fluid Extraction - Principles and Practice. 2nd
ed. 1994, Boston: Butterworth-Heinemann.
Mendes, M.F., et al., Recovery of the high aggregated compounds present in the deodorizer distillate
of the vegetable oils using supercritical fluids. Journal of Supercritical Fluids, 2005. 34(2): p.
157-162.
Mendes, M.F., A.M.C. Uller, and F.L.P. Pessoa, Simulation and thermodynamic modeling of the
extraction of tocopherol from a synthetic mixture of tocopherol, squalene and CO(2). Brazilian
Journal of Chemical Engineering, 2000. 17(4-7): p. 761-769.
165
Mendiola, J.A., et al., Enrichment of vitamin E from Spirulina platensis microalga by SFE.
Journal of Supercritical Fluids, 2008. 43(3): p. 484-489.
Moreda, W., M.C. Perez-Camino, and A. Cert, Gas and liquid chromatography of hydrocarbons
in edible vegetable oils. Journal of Chromatography A, 2001. 936(1-2): p. 159-171.
Nagesha, G.K., B. Manohar, and K.U. Sankar, Enrichment of tocopherols in modified soy
deodorizer distillate using supercritical carbon dioxide extraction. European Food Research and
Technology, 2003. 217(5): p. 427-433.
Nilsson, W., E. Gauglitz, and J. Hudson, Supercritical fluid fractionation of fish oil esters using
incremental pressure programming and a temperature gradient. Journal of the American Oil
Chemists' Society, 1989. 66(11): p. 1596-1600.
Nilsson, W.B., E.J. Gauglitz, and J.K. Hudson, SOLUBILITIES OF METHYL OLEATE,
OLEIC-ACID, OLEYL GLYCEROLS, AND OLEYL GLYCEROL MIXTURES IN
SUPERCRITICAL CARBON-DIOXIDE. Journal of the American Oil Chemists Society,
1991. 68(2): p. 87-91.
NIST. Web-Book 2008; Available from: http://webbook.nist.gov/chemistry/.
Nyam, K.L., et al., Extraction of tocopherol-enriched oils from Kalahari melon and roselle seeds by
supercritical fluid extraction (SFE-CO2). Food Chemistry, 2010. 119(3): p. 1278-1283.
Palakodaty, S. and P. York, Phase behavioral effects on particle formation processes using
supercritical fluids. Pharmaceutical Research, 1999. 16(7): p. 976-985.
166
Penedo, P.L., G.L.V. Coelho, and M.F. Mendes, Phase equilibria of oleic, palmitic, stearic,
linoleic and linolenic acids in supercritical CO2. Brazilian Journal of Chemical Engineering,
2009. 26: p. 137-142.
Pinto, J.S.S. and F.M. Lancas, Hydrolysis of corn oil using subcritical water. Journal of the
Brazilian Chemical Society, 2006. 17(1): p. 85-89.
Rakshit, A.K., et al., MONOLAYER PROPERTIES OF FATTY-ACIDS .2. SURFACE
VAPOR-PRESSURE AND THE FREE-ENERGY OF COMPRESSION. Journal of
Colloid and Interface Science, 1981. 80(2): p. 466-473.
Rathkamp, P.J., J.L. Bravo, and J.R. Fair, Evaluation of Packed-Columns in Supercritical
Extraction Processes. Solvent Extraction and Ion Exchange, 1987. 5(3): p. 367-391.
Raveendran, P., Y. Ikushima, and S.L. Wallen, Polar Attributes of Supercritical Carbon
Dioxide. Accounts of Chemical Research, 2005. 38(6): p. 478-485.
Reichardt, C., Solvents and Solvent Effects: An Introduction. Organic Process Research &
Development, 2006. 11(1): p. 105-113.
Reinish, M.D., FAT-SPLITTING 1956. Journal of the American Oil Chemists Society,
1956. 33(10): p. 516-520.
Reverchon, E., Supercritical fluid extraction and fractionation of essential oils and related products.
Journal of Supercritical Fluids, 1997. 10(1): p. 1-37.

167
Reverchon, E. and I. De Marco, Supercritical fluid extraction and fractionation of natural matter.
The Journal of Supercritical Fluids, 2006. 38(2): p. 146-166.
Riha, V. and G. Brunner, Separation of fish oil ethyl esters with supercritical carbon dioxide.
Journal of Supercritical Fluids, 2000. 17(1): p. 55-64.
Rizvi, S.S.H., R.R. Chao, and Y.J. Liaw, Concentration of Omega-3 Fatty Acids from Fish Oil
Using Supercritical Carbon Dioxide, in Supercritical Fluid Extraction and Chromatography, B.A.
Charpentier, Editor. 1988, American Chemical Society: California. p. 89-108.
Roth, M., STATISTICAL THERMODYNAMIC TREATMENT OF HIGH-PRESSURE
PHASE-EQUILIBRIA IN SUPERCRITICAL FLUID CHROMATOGRAPHY .2.
PARAMETRIZATION AND TESTING OF THE MODEL. Journal of Physical Chemistry,
1992. 96(21): p. 8552-8556.
Ruivo, R., R. Couto, and P.C. Simoes, Supercritical carbon dioxide fractionation of the model
mixture squalene/oleic acid in a membrane contactor. Separation and Purification Technology,
2008. 59(3): p. 231-237.
Ruivo, R., et al., Dynamic model of a countercurrent packed column operating at high pressure
conditions. Journal of Supercritical Fluids, 2004. 32(1-3): p. 183-192.
Ruivo, R., A. Paiva, and P. Simoes, Phase equilibria of the ternary system methyl
oleate/squalene/carbon dioxide at high pressure conditions. Journal of Supercritical Fluids, 2004.
29(1-2): p. 77-85.
Ruivo, R.M., R.M. Couto, and P.C. Simões, High-Pressure Phase Equilibria of the Ternary
System Oleic Acid + Squalene + Carbon Dioxide. Journal of Chemical & Engineering Data,
2007. 52(2): p. 566-570.

168
Sahena, F., et al., Application of supercritical CO2 in lipid extraction – A review. Journal of Food
Engineering, 2009. 95(2): p. 240-253.
Sanal, I.S., et al., Determination of optimum conditions for SC-(CO2 plus ethanol) extraction of
beta-carotene from apricot pomace using response surface methodology. Journal of Supercritical
Fluids, 2005. 34(3): p. 331-338.
Seibert, A.F. and D.G. Moosberg, Performance of Spray, Sieve Tray, and Packed Contactors for
High Pressure Extraction. Separation Science and Technology, 1988. 23(12-13): p. 2049-
2063.
Shao, P., P.L. Sun, and Y.J. Ying, Response surface optimization of wheat germ oil yield by
supercritical carbon dioxide extraction. Food and Bioproducts Processing, 2008. 86(C3): p. 227-
231.
Sheldon, R.A., Green solvents for sustainable organic synthesis: state of the art. Green Chemistry,
2005. 7(5): p. 267-278.
Shimoyama, Y., et al., Drying processes for preparation of titania aerogel using supercritical carbon
dioxide. Chemical Engineering Research & Design, 2010. 88(10A): p. 1427-1431.
Sie, S.T. and G.W.A. Rijnders, Chromatography with supercritical fluids. Analytica Chimica
Acta, 1967. 38(0): p. 31-44.
Simoes, P.C. and G. Brunner, Multicomponent phase equilibria of an extra-virgin olive oil in
supercritical carbon dioxide. Journal of Supercritical Fluids, 1996. 9(2): p. 75-81.
169
Skerget, M., Z. Knez, and M. Habulin, SOLUBILITY OF BETA-CAROTENE AND
OLEIC-ACID IN DENSE CO2 AND DATA CORRELATION BY A DENSITY BASED
MODEL. Fluid Phase Equilibria, 1995. 109(1): p. 131-138.
Skerget, M., P. Kotnik, and Z. Knez, Phase equilibria in systems containing alpha-tocopherol and
dense gas. Journal of Supercritical Fluids, 2003. 26(3): p. 181-191.
Sovova, H., et al., Supercritical fluid extraction of minor components of vegetable oils: beta-
Sitosterol. Journal of Food Engineering, 2010. 101(2): p. 201-209.
Sovova, H., J. Jez, and M. Khachaturyan, Solubility of squalane, dinonyl phthalate and glycerol in
supercritical CO2. Fluid Phase Equilibria, 1997. 137(1-2): p. 185-191.
Spanova, M. and G. Daum, Squalene - biochemistry, molecular biology, process biotechnology, and
applications. European Journal of Lipid Science and Technology, 2011. 113(11): p. 1299-
1320.
Springston, S. and M. Novotny, Kinetic optimization of capillary supercritical fluid
chromatography using carbon dioxide as the mobile phase. Chromatographia, 1981. 14(12): p.
679-684.
Stahl, E., K.W. Quirin, and H.K. Mangold, Extraction and fractionation of complex lipid
mixtures with dense carbon dioxide on a micro scale. Chemistry and Physics of Lipids, 1982.
31(4): p. 319-324.
Stoldt, J. and G. Brunner, Phase equilibrium measurements in complex systems of fats, fat
compounds and supercritical carbon dioxide. Fluid Phase Equilibria, 1998. 146(1-2): p. 269-295.
170
Stoldt, J. and G. Brunner, Phase equilibria in complex systems of palm oil deodorizer condensates
and supercritical carbon dioxide: experiments and correlation. Journal of Supercritical Fluids,
1999. 14(3): p. 181-195.
Sugihara, N., et al., Novel Fractionation Method for Squalene and Phytosterols Contained in the
Deodorization Distillate of Rice Bran Oil. Journal of Oleo Science, 2010. 59(2): p. 65-70.
Suzuki, Y., et al., FRACTIONATION OF MONO-ESTERS DERIVED FROM FISH OIL
USING SUPERCRITICAL FLUID EXTRACTION TOWER. Kagaku Kogaku Ronbunshu,
1989. 15(3): p. 439-445.
Taylor, L.T., Separation of Ionic Analytes using Supercritical Fluid Chromatography. Lc Gc
Europe, 2009. 22(5): p. 232-+.
Tenllado, D., G. Reglero, and C.F. Torres, A combined procedure of supercritical fluid extraction
and molecular distillation for the purification of alkylglycerols from shark liver oil. Separation and
Purification Technology, 2011. 83(0): p. 74-81.
USDA. United States Department of Agriculture. 2010; Available from:
http://www.usda.gov/wps/portal/usda/usdahome?navid=AGENCY_REPORTS.
van Wasen, U. and G. Schneider, Pressure and density dependence of capacity ratios in
supercritical fluid chromatography (SFC) with carbon dioxide as mobile phase. Chromatographia,
1975. 8(6): p. 274-276.
Vazquez, L., et al., Supercritical carbon dioxide fractionation of nonesterified alkoxyglycerols
obtained from shark liver oil. Journal of Agricultural and Food Chemistry, 2008. 56(3): p.
1078-1083.
171
Vidovic, S., et al., Extraction of Fatty Acids from Boletus edulis by Subcritical and Supercritical
Carbon Dioxide. Journal of the American Oil Chemists Society, 2011. 88(8): p. 1189-1196.
Wang, C.H., et al., Designing supercritical carbon dioxide extraction of rice bran oil that contain
oryzanols using response surface methodology. Journal of Separation Science, 2008. 31(8): p.
1399-1407.
Westerman, D., Extraction and Enrichment of Physiologically Active Lipids and Nutrients from
Plant Materials Using Supercritical Fluid Extraction. 2004, University of Birmingham.
Wilsch, A., R. Feist, and G.M. Schneider, Capacity ratios and diffusion coefficients of low-
volatile organic compounds in supercritical carbon dioxide from supercritical fluid chromatography
(SFC). Fluid Phase Equilibria, 1983. 10(2–3): p. 299-306.
Wilsch, A. and G. Schneider, Determination of the capacity ratios of some fatty acid phenyl esters
in supercritical carbon dioxide by supercritical fluid chromatography (SFC). Fresenius' Journal of
Analytical Chemistry, 1983. 316(2): p. 265-267.
Wong, J.M. and K.P. Johnston, Solubilization of Biomolecules in Carbon Dioxide Based
Supercritical Fluids. Biotechnology Progress, 1986. 2(1): p. 29-39.
Wypych, G., Handbook of solvents. 2001, Toronto: ChemTec.
Xu, W., et al., Extraction of Lepidium apetalum Seed Oil Using Supercritical Carbon Dioxide and
Anti-Oxidant Activity of the Extracted Oil. Molecules, 2011. 16(12): p. 10029-10045.
172
Yu, Z.R., S.S.H. Rizvi, and J.A. Zollweg, PHASE-EQUILIBRIA OF OLEIC-ACID,
METHYL OLEATE, AND ANHYDROUS MILK-FAT IN SUPERCRITICAL CARBON-
DIOXIDE. Journal of Supercritical Fluids, 1992. 5(2): p. 114-122.
Yu, Z.R., S.S.H. Rizvi, and J.A. Zollweg, FLUID LIQUID EQUILIBRIA OF ANHYDROUS
MILK-FAT WITH SUPERCRITICAL CARBON-DIOXIDE. Journal of Supercritical
Fluids, 1992. 5(2): p. 123-129.
Yu, Z.R., et al., FLUID-LIQUID EQUILIBRIA OF SUPERCRITICAL CARBON
DIOXIDE+METHYL OLEATE+OLEIC ACID. Journal of Supercritical Fluids, 1993. 6(2):
p. 63-68.
Zacchi, P., et al., Extraction/fractionation and deacidification of wheat germ oil using supercritical
carbon dioxide. Brazilian Journal of Chemical Engineering, 2006. 23: p. 105-110.
Ziegler, G.R. and Y.J. Liaw, DEODORIZATION AND DEACIDIFICATION OF EDIBLE
OILS WITH DENSE CARBON-DIOXIDE. Journal of the American Oil Chemists Society,
1993. 70(10): p. 947-953.

173
APPENDIX
Appendix A
Application of central composite design in the Optimization of Sc-
CO2 Extraction of Squalene from PFAD Using Response Surface
Methodology RSM
A.1 Introduction
Optimization of a process is basically determining the required and necessary inputs
(variables) to obtain the desired outputs (responses). Response surface methodology
(RSM) is a powerful statistical tool used widely in the optimization of supercritical fluid
extraction batch processes. It is basically used for experimental design, building efficient
models, factors and variables evaluation and optimum conditions calculation. RSM was
successfully applied in supercritical fluid extraction processes by various researchers in
the field (refer to table 8.1 in chapter 8 for all references). However, all the studies found
were based on batch mode extraction. This work discusses the advantages and limitation
of the use of RSM analysis on a continuous SCF extraction process. The overall aim
was to investigate the applicability of the statistical analysis in the optimization of the Sc-
CO2 extraction of squalene from PFAD via the application of RSM, in order to find the
best conditions of the main variables.
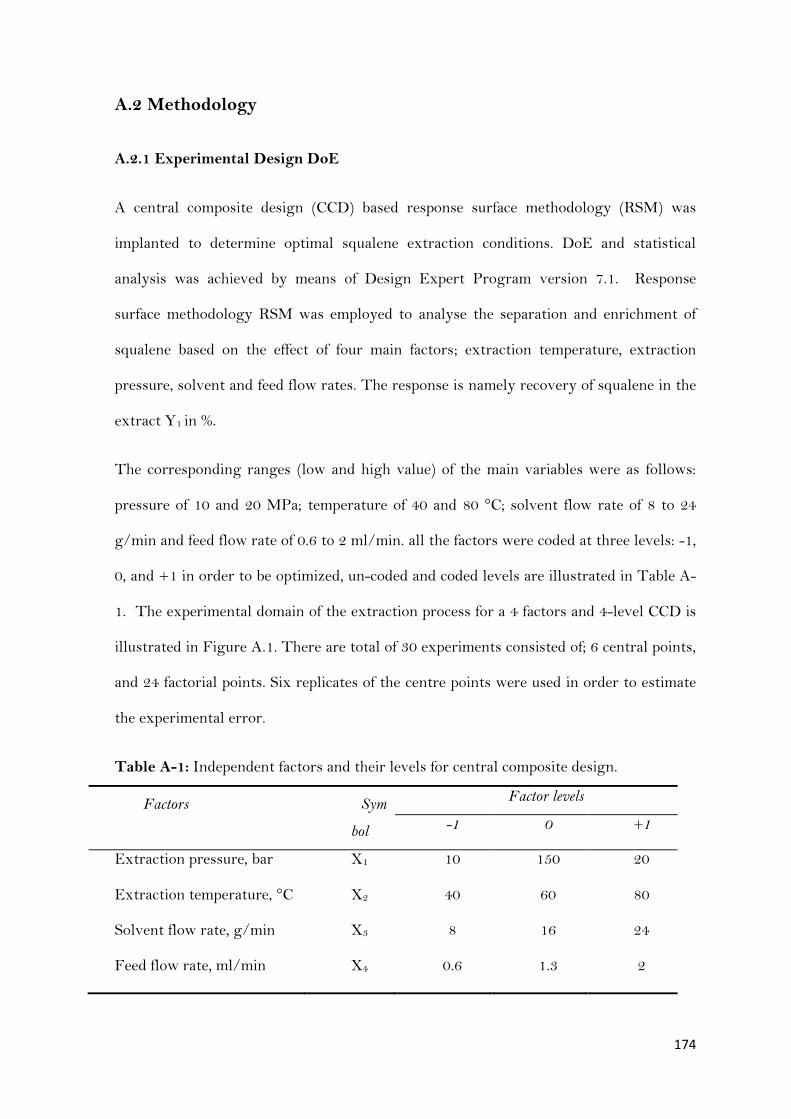
174
A.2 Methodology
A.2.1 Experimental Design DoE
A central composite design (CCD) based response surface methodology (RSM) was
implanted to determine optimal squalene extraction conditions. DoE and statistical
analysis was achieved by means of Design Expert Program version 7.1. Response
surface methodology RSM was employed to analyse the separation and enrichment of
squalene based on the effect of four main factors; extraction temperature, extraction
pressure, solvent and feed flow rates. The response is namely recovery of squalene in the
extract Y1 in %.
The corresponding ranges (low and high value) of the main variables were as follows:
pressure of 10 and 20 MPa; temperature of 40 and 80 °C; solvent flow rate of 8 to 24
g/min and feed flow rate of 0.6 to 2 ml/min. all the factors were coded at three levels: -1,
0, and +1 in order to be optimized, un-coded and coded levels are illustrated in Table A-
1. The experimental domain of the extraction process for a 4 factors and 4-level CCD is
illustrated in Figure A.1. There are total of 30 experiments consisted of; 6 central points,
and 24 factorial points. Six replicates of the centre points were used in order to estimate
the experimental error.
Table A-1: Independent factors and their levels for central composite design.
Factors Sym
bol
Factor levels
-1 0 +1
Extraction pressure, bar
Extraction temperature, °C
Solvent flow rate, g/min
Feed flow rate, ml/min
X1
X2
X3
X4
10
40
8
0.6
150
60
16
1.3
20
80
24
2

175
Figure A.1: Graphical representation of factors levels, center point and star points α-
level of the CCD of three variables.
A.2.2 Statistical analysis
For the responses prediction of optimization of the fractionation of squalene, Design
Expert 7.1 software was used and a quadratic polynomial regression model was used.
The model proposed for each response Y was as following:
jiijiiiii XXAXAXAAY 2
Where Y represents response, Xi and Xj are independent variables, A is constant, iA is
linear coefficient of the model, iiA representing quadratic coefficient and ijA is interactive
coefficient of the model. The model was evaluated by comparing the experimental and
predicted responses and analysis of variance (ANOVA).
176
A.2.3 Counter-current continuous fractionation rig
Full description of counter-current SCF extraction and separation of squalene is
discussed intensively previously in chapter 5, section 5.3.1.
A.2.4 Materials and analysis
In this study, the same stock material of PFAD used in the isothermal fractionation
studies was used for this investigation. More details about PFAD samples were discussed
previously in Chapter 3; Materials and Analytical Techniques. The three main streams of
the fractionation rig; feed, extract and raffinate were analysed using gas chromatography.
Details on the analytical techniques used were discussed previously in Chapter 3.
A.2.5 Calculations
Full details on the calculations carried out during this investigation are presented
previously in chapter 5, section 5.3.3.
A.3 Results and Discussions
A.3.1 Design of Experiments DoE
A.3.1.2 Full Type Design
Experiments were designed statically using computer programme Design Expert 7.1
after defining the main variables and their levels. As a result, a total of 30 experiments
were designed for full design type with alpha (axial point) value of 1.414. The four
factors values for each run are represented in Table A-2. Centre point was designed to be
at Pressure, temperature, solvent flow rate and feed flow rate at their zero level. Axial
points designed by the software were difficult to be achieved experimentally. For
example Run 2, the feed flow rate FF was at value of -0.1. In this case, the value was
changed to be at a minimum value possible to conduct experimentally. Similar changes
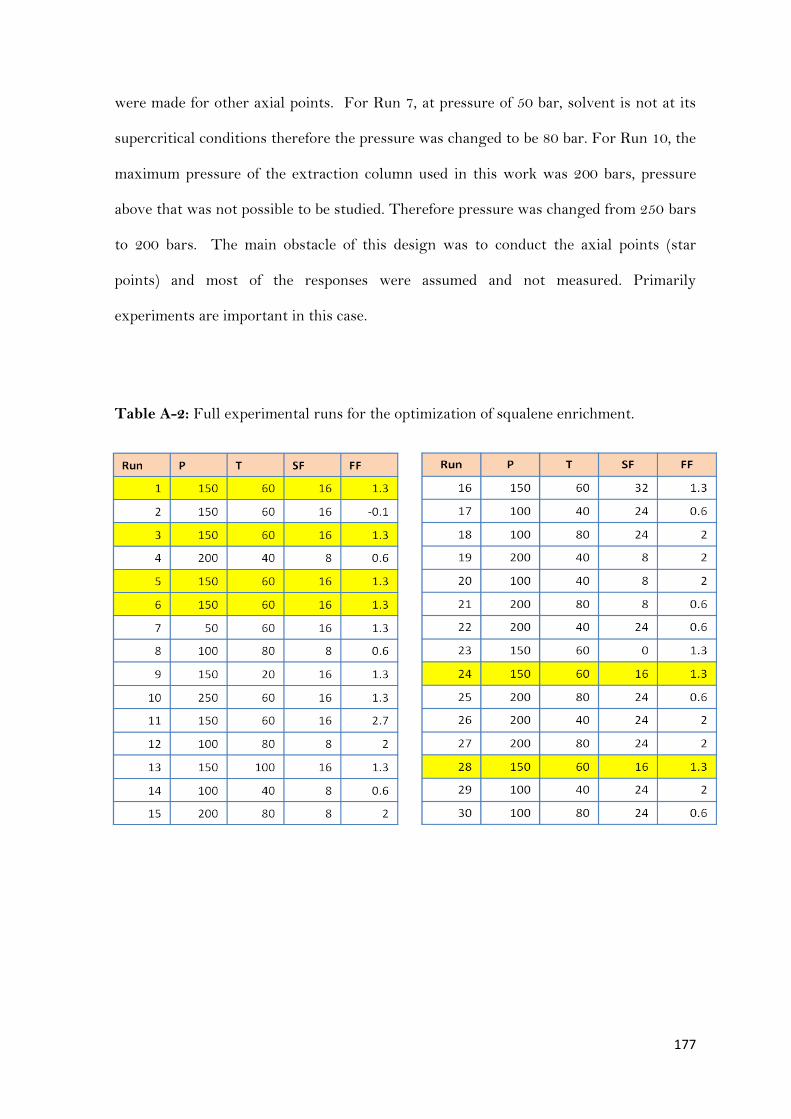
177
were made for other axial points. For Run 7, at pressure of 50 bar, solvent is not at its
supercritical conditions therefore the pressure was changed to be 80 bar. For Run 10, the
maximum pressure of the extraction column used in this work was 200 bars, pressure
above that was not possible to be studied. Therefore pressure was changed from 250 bars
to 200 bars. The main obstacle of this design was to conduct the axial points (star
points) and most of the responses were assumed and not measured. Primarily
experiments are important in this case.
Table A-2: Full experimental runs for the optimization of squalene enrichment.

178
Responses of the experiments are given in Table A-3. For certain experimental runs at
given conditions, there were either no extraction occurred or the column reached
flooding point. In these two main cases assumption were made for the values of the
responses; at flooding point squalene SQ recovery was assumed to be 100% and at low
extraction points SQ recovery was assumed to be 0.001%.
Table A-3: Response (SQ Recovery) at each run of the full type design.
Factor 1 Factor 2 Factor 3 Factor 4 Response 1
Run A:P B:T C:SF D:FF SQ Recovery
bar oC g/min ml/min %
1 150.00 60.00 16.00 1.30 10.1
2 150.00 60.00 16.00 0.30 38.8
3 150.00 60.00 16.00 1.30 10.6
4 200.00 40.00 8.00 0.60 100
5 150.00 60.00 16.00 1.30 10
6 150.00 60.00 16.00 1.30 8.7
7 80.00 60.00 16.00 1.30 0.001
8 100.00 80.00 8.00 0.60 0.001
9 150.00 40.00 16.00 1.30 62
10 200.00 60.00 16.00 1.30 33.7
11 150.00 60.00 16.00 2.70 3.6
12 100.00 80.00 8.00 2.00 0.001
13 150.00 100.00 16.00 1.30 0.9
14 100.00 40.00 8.00 0.60 12.8
15 200.00 80.00 8.00 2.00 3.9
16 150.00 60.00 32.00 1.30 3.6
17 100.00 40.00 24.00 0.60 18.9
18 100.00 80.00 24.00 2.00 0.001
19 200.00 40.00 8.00 2.00 100
20 100.00 40.00 8.00 2.00 2.7
21 200.00 80.00 8.00 0.60 13
22 200.00 40.00 24.00 0.60 100
23 150.00 60.00 2.00 1.30 0.001
24 150.00 60.00 16.00 1.30 10.8
25 200.00 80.00 24.00 0.60 41
26 200.00 40.00 24.00 2.00 100
27 200.00 80.00 24.00 2.00 13
28 150.00 60.00 16.00 1.30 8.5
29 100.00 40.00 24.00 2.00 4.6
30 100.00 80.00 24.00 0.60 0.001
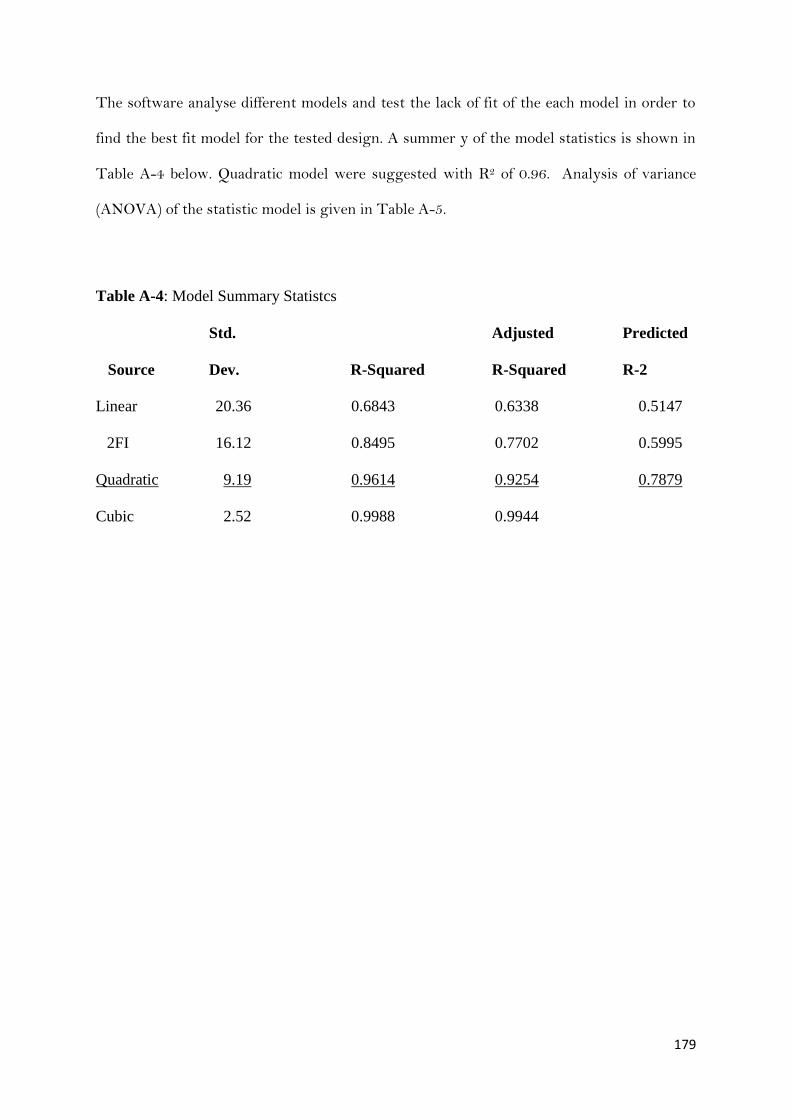
179
The software analyse different models and test the lack of fit of the each model in order to
find the best fit model for the tested design. A summer y of the model statistics is shown in
Table A-4 below. Quadratic model were suggested with R2 of 0.96. Analysis of variance
(ANOVA) of the statistic model is given in Table A-5.
Table A-4: Model Summary Statistcs
Std. Adjusted Predicted
Source Dev. R-Squared R-Squared R-2
Linear 20.36 0.6843 0.6338 0.5147
2FI 16.12 0.8495 0.7702 0.5995
Quadratic 9.19 0.9614 0.9254 0.7879
Cubic 2.52 0.9988 0.9944

180
Table A-5: ANOVA for response surface quadratic model.
Sum of Mean F p-value
Source Squares df Square Value Prob > F
Model 31547.70 14 2253.41 26.69< 0.0001significant
A-P12283.15 1 12283.15 145.49 < 0.0001
B-T11086.53 1 11086.53 131.32 < 0.0001
C-SF 138.75 1 138.75 1.64 0.2193
D-FF 729.45 1 729.45 8.64 0.0101
AB5260.02 1 5260.02 62.31 < 0.0001
AC52.93 1 52.93 0.63 0.4408
AD10.08 1 10.08 0.12 0.7345
BC52.93 1 52.93 0.63 0.4408
BD10.08 1 10.08 0.12 0.7345
CD33.35 1 33.35 0.40 0.5391
A2717.14 1 717.14 8.49 0.0107
B21746.54 1 1746.54 20.69 0.0004
C2186.21 1 186.21 2.21 0.1582
D2139.00 1 139.00 1.65 0.2189
Residual 1266.36 15 84.42
Lack of Fit 1261.69 10 126.17 135.13< 0.0001significant
Pure Error 4.67 5 0.93
Cor Total 32814.05 29

181
Final Equaltion of SQ Recovery based on quadratic model is given below:
SQ Recovery = +38.37841 +0.41372 * P -1.80816* T + 0.70149 * SF - 12.12163 * FF -
0.018131 * P * T+ 4.54688E-003 * P * SF-0.022679 * P * FF +0.011367 * T * SF-
0.056696 * T * FF-0.25781 * SF * FF +3.81499E-003 * P2 + 0.026623 * T2 -0.044438* SF2
+5.61547 * FF2
Model Graphs
Responce Y (SQ recovery) is plotted agains two main factors temperature and pressure. The
remaining twe factors were located at certain values; FF at center value and SF at its
maximum level. Figure A-2 reperesent SQ recovery as finction of temperature and
pressure.
Figure A-2: Graphic model 3D surface of SQ recovery as function of Temperature and
pressure.
Design-Expert® Software
SQ Recovery
100
0.001
X1 = A: P
X2 = B: T
Actual Factors
C: SF = 24.00
D: FF = 1.30
100.00
125.00
150.00
175.00
200.00
40.00
50.00
60.00
70.00
80.00
-10
17.5
45
72.5
100
S
Q R
eco
ve
ry
A: P B: T

182
Its clear from the Figure A-2 that pressure has significant effect on SQ recovery from
PFAD. Higher extraction pressureand lower extraction temperature lead tohigher SQ
recovery based on the model.
A.4 Conclusions
Modeling and optimization using responce surface methodolgy is very promising statistical
tool in the filed of supercritical extraction. However, full examination and study is required
for its application in extraction processes conducted in countinous mode. Based on this
investgation it was found that experimnetation perior to DoE was vital to evaluate each
factor and define significant variables. Moreover, a full study on the extraction column and
predection of flooding points are required perior to statistical design in order to avoid
incorrect assumptions.
183
Appendix B: Publications

Contents lists available at SciVerse ScienceDirect
Keywords:SolubilitySupercritical carbon dioxideSqualenePalm oleinOleic acidSelectivity
1. Introduction
In the chemical and pharmaceutical inand their distillates from oil refining are prable components such as squalene, vitamacids. The use of supercritical carbon dioxthese components has been the subject othe field [1,2]. Carbon dioxide has been tas the main supercritical solvent in thematerials, largely due to it being non-toxhaving mild critical conditions of 304.19 K aature and pressure, respectively [3,4]. Requilibrium solubility behaviour is essentiaedge regarding the feasibility of supercriticand fractionation processes. However, the mdata are presented as binary systems andtively few investigations into multi-comKnowledge of these kinds of complex sydetermining the selectivity of a specific solture, as well as understanding the intermthe solvation process. This investigation isa dynamic method for the measurement olipid components: squalene (SQ), oleic a
1383-5866/$ - see front matter � 2011 Elsevier B.V. Adoi:10.1016/j.seppur.2011.09.043
⇑ Corresponding author.E-mail addresses: [email protected], n.aldarmaki
Separation and Purification Technology 83 (2011) 189–195
Separation and Purification Technology
bisu
.F.y of
a dys mcid (
35temthe
.e l
Solubility measurements and analysis ofof palm olein, squalene and oleic acid in
N. Al-Darmaki a,⇑, T. Lu a, B. Al-Duri a, J.B. Harris b, T.La College of Engineering and Physical Sciences, School of Chemical Engineering, Universitb IOI Loders Croklaan bv, Hogeweg, 1521 AZ Wormerveer, The Netherlands
a r t i c l e i n f o
Article history:Received 1 November 2010Received in revised form 22 September2011Accepted 23 September 2011Available online 1 October 2011
a b s t r a c t
Through the application ofatilities and polarities wasqualene (SQ), CO2/oleic aperatures of 313, 333 andPO and a quaternary sys10–25 MPa. Comparison of
journal homepage: www
of SQ, with a corresponding rdecreased the selectivity of SQthe general trend of solubility
dustries, vegetable oilsincipal sources of valu-
ins, sterols and fattyide (SC-CO2) to extractf abundant research inhoroughly investigatedextraction of bioactiveic, non-flammable andnd 7.3 MPa for temper-
eliable information onl to obtain basic knowl-al fluid (SCF) separation
ajority of the solubilitythere have been rela-ponents systems [5].stems is essential for
ute presented in a mix-olecular interactions inbased upon the use of
f the solubility of threecid (OA) and (pseudo-
ll rights reserved.
@gmail.com (N. Al-Darmaki).
nary, ternary and quaternary systemspercritical carbon dioxide
Favre b, K. Bhaggan b, R.C.D. Santos a
Birmingham, Birmingham B15 2TT, UK
namic method, the solubility of three lipid components with different vol-easured in supercritical carbon dioxide (SC-CO2). Binary systems of CO2/OA) and CO2/pseudo-component palm olein (PO) were measured at tem-
3 K, and at a pressure range of 10–30 MPa. A ternary system of CO2/SQ/of CO2/SQ/PO/OA were also investigated at 313 K and pressures of
ternary system with the binary system showed a decrease in the solubilityise in the solubility of PO. In the quaternary system, the presence of OA. The data were correlated using Chrastil’s equation in order to examinebehaviour.
� 2011 Elsevier B.V. All rights reserved.
sevier .com/ locate /seppur
component) palm olein (PO) in SC-CO2 in binary, ternary and qua-ternary systems.
Recognition of the health benefits of bioactive lipid componentshas led to growing interest in understanding the separation andisolation of these components. SQ is an important non-polarhydrocarbon in chemical and pharmaceutical industries. It occursnaturally in fish liver oils and vegetable oils, acting as a precursorfor cholesterol biosynthesis [6], as well as enhancing oxygenationof the blood, acting as an anti-cancer agent [7], and being usedas a moisturizing or emollient agent in cosmetic preparation[8,9]. As squalene has a very low freezing point (�72 �C), a highboiling point (430 �C at 760 mm Hg), and good thermal and fric-tional resistance, it has also been used to produce high-grade oiland lubricant for certain scientific instruments [10]. Free fattyacids (FFA) in chemistry are carboxylic acids with a long un-branched aliphatic chain that can be either saturated or unsatu-rated. Most naturally occurring fatty acids have a chain of 4–28carbons and are used in many pharmaceutical and nutritionalapplications, such as soap production and cosmetics [11,12]. Thepseudo-component (PO) is widely used as a food oil due to the factthat monoacylglycerol production from palm olein increasesadvantages and applications in pharmaceutical, cosmetic and foodindustries [13,14]. The properties and application of these compo-nents are summarized in Table 1. This work is concentrated on thefractionation of minor components (less than 3 wt.%) present indeodoriser distillate of palm oil refinery. This work aims to

Ifd
Na
b
a
ARRA
KSSFT
1
iivaa
aliobbTls
r
0d
J. of Supercritical Fluids 61 (2012) 108– 114
Contents lists available at SciVerse ScienceDirect
The Journal of Supercritical Fluids
.e ls
pety a
.L.F
ty of B
f valu
j ourna l ho me p ag e: www
sothermal and temperature gradient suractionation of squalene from palm fatioxide
. Al-Darmakia,∗, T. Lua, B. Al-Duria, J.B. Harrisb, TCollege of Engineering and Physical Sciences, School of Chemical Engineering, UniversiIOI Loders Croklaan bv, Hogeweg, 1521 AZ Wormerveer, The Netherlands
r t i c l e i n f o
rticle history:
a b s t r a c t
Currently the extraction o
eceived 23 May 2011eceived in revised form 18 October 2011ccepted 19 October 2011eywords:qualeneupercritical carbon dioxideractionationhermal gradient
(PFAD) is a by-product from pwork investigated the extractias solvent from PFAD. The procwith the dimensions of 11.45the experiment conditions ontemperature were the operatin353 K, respectively. Squalene acontent decreased during mostcolumn was investigated for furecovery of more than 95% wafeed to 16 wt% in the top produ
. Introduction
There is high production growth in the past decades of palm oiln Malaysia and Indonesia [1,2]. Palm fatty acid distillate (PFAD)s a by-product from deodorization of the palm oil that containsaluable minor components that are of commercial interest suchs natural squalene and tocopherols (vitamin E), which have widepplications in food and pharmaceutical industries.
Squalene C30H50 is an important component in the chemicalnd pharmaceutical industries. The main natural source of squa-ene is fish liver oil of which contains up to 70% by weight [3]. Alsot occurs in olive oil, palm oil, wheat germ oil and other vegetableils in lower concentrations. It is responsible for the cholesteroliosynthesis [4]. It has been reported that squalene also enhanceslood oxygenation as well as it is considered as anticancer agent.he unique physical properties and physiological functions of squa-ene construct its importance as resource for functional food andupplement [5].
The regulations towards protection of marine life, promoteesearch on the extraction of squalene from alternative resources.
∗ Corresponding author.E-mail address: [email protected] (N. Al-Darmaki).
896-8446/$ – see front matter © 2011 Elsevier B.V. All rights reserved.oi:10.1016/j.supflu.2011.10.011
evier .com/ lo cate /supf lu
rcritical fluid extraction andcid distillate using compressed carbon
Favreb, K. Bhagganb, R.C.D. Santosa
irmingham, Edgbaston, B15 2TT, UK
able components from oils is of growing interest. Palm fatty acid distillatealm oil refining process which contains valuable minor components. Thison and recovery of squalene using supercritical carbon dioxide (Sc-CO2)ess has been carried out on a counter-current glass beads packed column
mm internal diameter (I.D.) and 1.5 m of effective height. The effect of the squalene purity and recovery has been studied. The pressure andg conditions investigated and they varied from 10 to 20 MPa and 313 to
nd free fatty acids (FFA) content in the extract increased, and triglycerides of the fractionation runs. Longitudinal thermal gradient profiles along therther recovery of squalene from PFAD, results showed the highest squalenes reached and concentration of squalene was increased from 2 wt% in thect.
© 2011 Elsevier B.V. All rights reserved.
Therefore, edible oils and their distillates are alternative resourcesfor the production of ‘vegetal’ squalene [6]. Supercritical car-bon dioxide (Sc-CO2) is well investigated as the main non-polarsupercritical solvent used in extraction processes of naturalcompounds due to its superior properties. Supercritical fluid frac-tionation (SFF) of squalene can substitute the conventional organicsolvent extraction processes which are un-preferable in foodindustries [7].
Squalene recovery from olive oil deodorizer distillate (OODD)using Sc-CO2 has been studied in the literature by variousresearchers [6,8]. Also an extensive study on the fractionation ofsqualene in a model mixture was done by Ruivo et al. [9]. Thepresent work is devoted to the recovery of squalene from PFADvia Sc-CO2 fractionation in counter-current mode. To our knowl-edge, there are no studies devoted on the recovery of squalenefrom PFAD. This row material is particularly significant due to itshigh production rate with the content of valuable components. Theprevious investigations of Bondioli and Ruivo were conducted oncounter-current extraction process with squalene feed concentra-tion of 40–60% by weight [8,9]. The raw material employed in thepresent study contains only 2–4 wt% of squalene. There is morechallenge for the recovery of squalene at low concentration thanthat at higher concentration found in the OODD. In this work, theSFF experiments were designed and carried out in a bench-scale