extended theoretical considerations for mass resolution in ...94)85008-9.pdf · quadrupole ion trap...
TRANSCRIPT

Extended Theoretical Considerations for MassResolution in the Resonance Ejection Mode ofQuadrupole Ion Trap Mass Spectrometry
Neil S. Arnold, Cyorgy Hars,* and Henk L. C. MeuzelaarCenter for Micro Analysis and Reaction Chemistry, University of Utah, Salt Lake City, Utah, USA
Proceeding from the pseudopotential-well approximation for ion motion in a quadrupole iontrap, mathematical expressions are derived to describe the excitation amplitude of an ionpacket at a given mass-to-charge ratio. Ion-neutral collisions are incorporated to describe thedamping of ion trajectories and to describe the distribution of individual ion trajectoriesabout a mean amplitude for the ion packet. The rate of increase of the amplitude duringscanning is related to expressions that describe the amplitude dispersion of the ions at thetime of ejection from the trap, which is operating in a resonance ejection scanning mode todescribe the temporal line width of the ejected ion packet. The temporal line width is relatedto mass resolution under a number of different scanning conditions. Included in thediscussion are considerations of the effect on resolution of the resonance excitation voltage,temperature, pressure, noise, and buffer-gas composition. An expression for the maximumpossible resolution at high ion mass-to-charge ratios is developed, and these results arecompared to an existing theoretical construction. The expressions derived under the pseudopotential-well approximation are further extended to high qz values and compared toexperimental data previously published by two other researchers. (J Am Soc Mass Spectrom1994, 5, 676-688)
~cent work on high mass, high resolution ion
trap mass spectrometry has shown that threeimensional Paul-type [1] quadrupole instru
ments are capable of resolution exceeding one million[2, 3] and detection of ions with mass-to-charge ratiosgreater than 50,000 [4] during operation in the resonance ejection mode [5]. Although the theory thatdescribes the mass scanning properties of ion-trap-typeinstruments in both the mass-selective instability mode[6, 7] and in the resonance ejection modes [8] is wellestablished, even in systems incorporating nonlinearhexapole and octapole fields [9], theory that describesthe resolution characteristics for the purpose of furtheroptimization of instrument performance has been slowto develop.
In a recent article, Goeringer et al. [10] proposed atheoretical basis for understanding high resolutionmass spectra obtained in quadrupole ion traps viaresonance ejection. This theory is based on two fundamental assumptions. The first assumption requires thata pseudopotential-well description of ion motion,which was extended to include ion-molecule collisions, allows the amplitude excitations of the ion to be
Address reprint requests to Or. Neil S. Arnold, Center for MicroAnalysis and Reaction Chemistry, The University of Utah, EMRL,Building 61, Room 214, Salt Lake City, UT R4112.
'"On leave from the Department of Atomic Physics, Technical University of Budapest, Budapest, Hungary.
© 1994 American Society for Mass Spectrometry1044-0305/94/$7.00
described by the response of a damped harmonic oscillator to an external driving frequency, The basis of thisassumption is the work of Major and Dehmelt [11].
By using this assumption, the authors derived theamplitude response of an ion in the case of a linearlyscanned excitation frequency. This response showed aclear dependence on scan rate and ion damping, andthe width of this response line in frequency space wassubsequently related to a mass line width to determinethe mass resolution. The use of this frequency linewidth for ion excitations implies a second assumption.This assumption is that frequency dispersion of theamplitude excitation is equivalent (or at least proportional) to the spatial dispersion of the ion packet atejection. In effect, this assumption implies that ions ofa given resonant frequency are being ejected from thetrap during the entire time that the excitation amplitude of the ion packet is nonzero, so that the temporalline width is the same as if the ions were not ejected atall.
In addition to not directly addressing the physics ofion packet ejection, this second assumption is troubling because it does not allow for a description of theeffect of excitation amplitude on mass resolution. Furthermore, it is well known that a classical externallydriven damped harmonic oscillator has no impliedamplitude dispersion [12] beyond that implied by transient excitations and phase-angle differences. If scanned
Received November 29, 1993Revised February 10, 1994
Accepted Febmary 10, 1994
JAm Soc Mass Spectrom 1994, 5, 676-688 MASS RESOLUTIONIN QUADRUPOLE ION TRAP 677
where
(4)
(3)dZ ( c ) - if.- + - + iii Z = --dt 2 w 2w
-if. (-x iX2)
Z(x) = --exp - --2wli 1i'T 2
(g 'e)x fX exp ~ + _I- dg
-00 va r 2
where Llw = Ws - w.It may be shown that if the secular frequency is
swept linearly with time such that AIV = at, where a isthe scan rate in radians per square second, then Z canbe written as
LlALlt= -
dA/dt
The terms are defined as follows: z is the mean axialion position, V is the fundamental rf drive voltage, e isthe ion charge, m is the ion mass, ro is the ringelectrode radius, n is the fundamental angular drivefrequency, Vs is the supplemental end cap excitationvoltage, Ws is the supplemental end cap excitationfrequency, and c is the reduced collision frequencydiscussed below. The term w, is the secular frequencyof unforced resonant oscillations, and I. is amplitudeof external forcing normalized per unit mass.
The substitution of z = Z(t)exp(iwst) into eq 2along with an assumption that Z( t) is a slowly varyingfunction of time, w '" W" and W >- c allows us to write
Axial Excitation of Ion Motion
Ignoring the radial motion equations, we describe theaxial motions as
may be approximated by the expression
Here Llt is the temporal line width, Ll A is the amplitude dispersion at ejection, and dAjdt is the rate ofincrease of the ion packet amplitude at ejection. Byusing the pseudopotential-well approximation [7, 11],we compute dAjdt on the basis of considerationssimilar to those used by Goeringer et al. [10], whereasIi A is derived from dispersion considerations inion-molecule collisions.
Theory
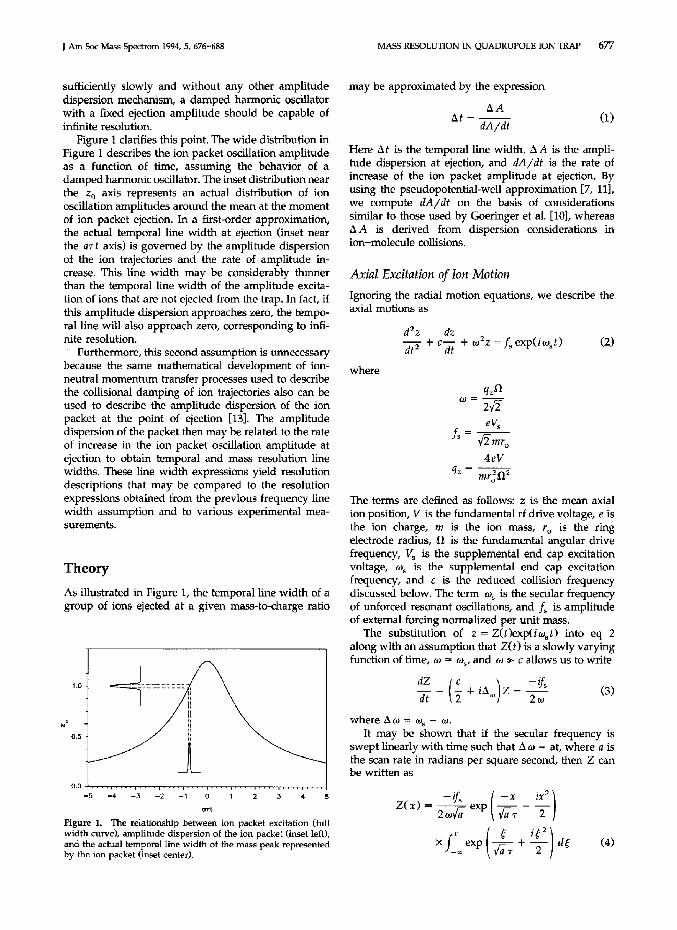
As illustrated in Figure 1, the temporal line width of agroup of ions ejected at a given mass-to-charge ratio
an
Figure 1. The relationship between ion packet excitation (fullwidth curve), amplitude dispersion of the ion packet (inset left),and the actual temporal line width of the mass peak representedby the ion packet (inset center).
sufficiently slowly and without any other amplitudedispersion mechanism, a damped harmonic oscillatorwith a fixed ejection amplitude should be capable ofinfinite resolution.
Figure 1 clarifies this point. The wide distribution inFigure 1 describes the ion packet oscillation amplitudeas a function of time, assuming the behavior of adamped harmonic oscillator. The inset distribution nearthe Zo axis represents an actual distribution of ionoscillation amplitudes around the mean at the momentof ion packet ejection. In a first-order approximation,the actual temporal line width at ejection (inset nearthe art axis) is governed by the amplitude dispersionof the ion trajectories and the rate of amplitude increase. This line width may be considerably thinnerthan the temporal line width of the amplitude excitation of ions that are not ejected from the trap. In fact, ifthis amplitude dispersion approaches zero, the temporal line will also approach zero, corresponding to infinite resolution.
Furthermore, this second assumption is unnecessarybecause the same mathematical development of ionneutral momentum transfer processes used to describethe collisional damping of ion trajectories also can beused to describe the amplitude dispersion of the ionpacket at the point of ejection [13]. The amplitudedispersion of the packet then may be related to the rateof increase in the ion packet oscillation amplitude atejection to obtain temporal and mass resolution linewidths. These line width expressions yield resolutiondescriptions that may be compared to the resolutionexpressions obtained from the previous frequency linewidth assumption and to various experimental measurements.
1.0 =4N° l!
0.5
10.0
-5 -4 -3 -2 -1 2 3 4 5

678 ARNOLD ET AL. JAm Soc Mass Speclrom 1994, 5, 676-688
where Ft x) is given by
gives the excitation amplitude. This expression may bedifferentiated with respect to time to obtain
2iJ)/Ii ZiJ)/iiF(x) = --!Z(x)! = --A(x) (5)
t, Is
(II)c = (~)nVr(]"Dm+M
(10)
dF
dx
2 - kT C* 4m + M M(~Vz) =v;-vJ~-;;+ 3 2m+M-;;;-vJ (lZ)
(~ +C( i:))cos(~) + (~ +S(i:))Sin( ~)
(~+C(J;)r+(~+S(J;)r
Amplitude Dispersion
The average rate of momentum loss due to collisions isrelated to the reduced collision frequency c. A mathematical derivation for c is given by
where m is the ion mass, M is the mass of collidingneutrals, n is the number density of neutrals, v, is theaverage relative speed of the colliding ion and neutral,and lTD is the collision cross section, and proceedsfrom momentum transfer arguments that are outlinedelsewhere [13], wherein the ion is assumed to be"drifting" in a constant electric field. The present developments assume that although the ions undergoaccelerated motion in the ion trap oscillations, theaverage momentum damping is still the same.
The same arguments that allow the development ofthe reduced collision frequency expressions also maybe applied to velocity dispersion of the ion packet [13)caused by collisions with neutrals. This dispersion isbased on the discontinuous nature of the ion damping.Following Mason and McDaniel [13] and consideringonly the axial excitations of the ions, we write therelative velocity dispersion as for ions traveling at driftvelocity Vd
shows a square root dependence of the diffractionintensity pattern produced by an infinite straight edgein wave optics [15]. Subsequent differentiation withrespect to x gives
(7)
(8)dF (/Iidxdx (I + aT 2 x2 )3/2
F(x) =exp ( - ~J[(f exp ( ~T)COS( ~22) d~r+(fexP(~T)sin(~2)d~rr2 (6)
This latter equation describes the rate of increase of theion envelope near ejection.
For the case of al/ 2T » 1 we require an approxima
tion that describes the rising side of the amplitudeenvelope so that the slope in the vicinity of resonantfrequency at x = 0 may be determined. In this limit,we can rewrite eq 6 in terms of Fresnel integrals [14],so that
Direct evaluation of these integrals is difficult, andclosed-form solutions do not exist, but as shown in refs10 and 11, it is possible to utilize approximations forthe two cases where al/~ ~ 1 and a1
/2T "", 1. These
integrals also may be evaluated numerically in regionswhere these simple approximations are not available.
For al/~"", 1, we utilize a result obtained by integration by parts, so that
where x ~ a1/ 2t and T = 2/c. The amplitude of thesecular oscillation is determined by the absolute valueof Zl x), such that the amplitude A = !Z(x)l. To simplify subsequent operations, we define F(x) as a dimensionless amplitude
F(x) = {7i (~+ c(~ )r+(~ +s( ~)r(9)
(We)Ct x) == fax cos -2- d~
x ( 7Te )S(x)== fa sin -Z- dg
where (~Vz)2 is the velocity dispersion about the meanvd in the z direction, v; is the thermal average of thesquare of ion velocity in the z direction, k is theBoltzmann constant, T is absolute temperature, andC* is a constant that has a value on the order of 1depending on the m/M ratio and the nature of ionneutral scattering.
As mentioned before, eqs 11 and 12 are both developed for the case of constant electric field. Use of eq 11in the present case requires the assumption that theoverall ion packet is in dynamic equilibrium with the

J Am Soc Mass Spectrom 1994, 5, 676-688 MASS RESOLUTION IN QUADRUPOLE ION TRAP 679
where vnn s is the rms velocity amplitude due to theexternal driving field. At the point of ejection, A ej =r",/21
/2
, vnns = ws r",/ 2 and substitution into eq 13 gives
neutrals via collisions, so that c may represent theaverage damping of the ion packet. Equation 12 represents the fluctuations around this equilibrium, and theearlier assumption that ill >- C implies that the velocitydispersion may be averaged over time by using theroot mean square (rms) value of vd . Further, becausethat particle is undergoing simple harmonic motion,the expression V z = wz allows us to relate the velocitydispersion to the amplitude dispersion of the ionpacket.
The amplitude dispersion of the ion packet in dynamical equilibrium with the surrounding neutralsmay therefore be represented as
for Is to obtain
rJa dF(xej)
/2F(xej ) dx
dA-=dt
dAldt is proportional to the ratio of dFIdx to F. Thisratio, also expressed as din FIdx, is plotted for various values of a1
/27 in Figure 2. Two different scalings
are provided in this figure because the limiting caseal/~ ~ 1 has a natural scaling of art, as seen in eqs 7and 8, whereas the case a1
/2r>- 1 scales to a1
/2 t, as
seen in eqs 9 and 10. At a given scan speed anddamping, the maximum resolution depends on maximizing dIn FIdx. This maximum occurs at tm =
-liar, as illustrated in Figure 2a, for all scan-rate anddamping values! This result establishes the temporalshift of the ion ejection point (obtained at maximumresolution) relative to the resonant frequency of ionoscillations.
The maximum of dAldt at ion ejection as a functionof a and r may be obtained for the two limiting caseson the basis of a similar evaluation as was performedto obtain eqs 8 and 10. For al/2r --c 1, the rate of
(14)
(13)kT + C* 4m + M M v2
m 3 2m + M m rms
kT C* 4m + M M--+- -r2
w;m 122m + M m 0
4A =
14A~-
Ws
3
2
b
2
a"2 , = 0 aa112t = .2
a''', = .5
a" 2, =1
a''',=2a1J2T ;;;; 5
o
a
-2
-.-
-1
atl
-4
-2
-6
a112, -> infinity
a'l2, =5
a'l2, =2a""t = 1
a'I2y = .5a'I2y = .2
-3
-8
-4
0.0
-5
0.0 ~--,.--,-~---,~_.."_-.-,,,--~r-i"....-'-,r'-r-.y-,r+
-10
0.5
i 0.5
~
(15)
Minimum Ejection Line Width
Direct substitution into eq 1 of eq 14 along with eq 8 or10 yields an expression for temporal line width Atdepending on the actual time of ion packet ejection tei'Although this substitution may be performed at anyvalue, the primary interest is in the maximum obtainable resolution at a given scan speed that will occur atthe minimum of At or the maximum of dAldt.
At the point in time Xej (= a1/
2 tej) where the ionpackage is ejected, the amplitude of oscillation is givenby A(xej) = ro/ 21/2. Based on eq 5, this ejection pointis determined by the excitation amplitude Is, so that
IThis expression indicates that the amplitude dispersi~n at ion ejection is directly related to the effectiveion temperature in the axial direction [13). Additionalconsideration of velocity dispersion in the radial direction would allow m(4V)2 (similar to eq 12) to berelated to the effective ion temperature as discussed inMason and McDaniel [13). This fact has additionalimplications for instrument resolution and spectralquality, which may be degraded by collision-induceddissociation of ions caused by scanning of the ionsfrom the trap.
describes the excitation required to eject the ion packetat time Xej'
To evaluate the maximum of dAldt, eq 5 is differentiated with respect to t whereas eq 15 is substituted
a/2tFigure 2. Derivative of the log of F(x) for various scan-rate anddamping factors as a function of ar t and all;'. All curves sharea maximum at art ~ -1. The maximum on each curve indicatesthe optirnwn excitation amplitude and resolution.

680 ARNOLD ET AL. J Am Soc Mass Spectrum 1994,5, 676~-688
maximum amplitude increase is given by By using mlM » I, we obtain eqs 22 and 23 for thetwo regimes:
whereas for a1/2r» 1, the rate of maximum amplitude
increase is given by
dAIdt max
dAI rJidt max ~ &
(17)
(18)
m w
t.m18
kT C* M--+--mr;w 2 6 m
m ta
tl.m/27Ta
kT C* M---+--mr;w 2 6 m
Ii r -« 1 (22)
As previously indicated, eq 1 provides an expression for temporal line width of a mass peak based onthe amplitude dispersion and the rate of increase of theamplitude of ion motion. If eq 14, along with eq 17 or18, is substituted into eq 1 to give the minimum linewidth at fixed scan-rate and damping conditions, thetemporal line width is given by
These two expressions may be used directly to obtainthe limiting behavior of the resolution in the high andlow scan speed cases. Lower and upper bounds for themaximum obtainable resolution can be determinedfrom the limiting behavior, and two such bounds aregiven by
(24)1
(iii 1--+-
2 r
kT C'M---+--mr;w 2 6 m
m-~-m ~ --r=='7=:===::=;=:=:=- --;=~--
18
and(19)
kT C* 4m + M M--2-2 +mr0 W s 12 2 m + M m
2fit.t=
aT
and
w
kT C* M---+-mr;w 2 6 m
1(25)
Mass Resolution
The work of Goeringer et al. [10] established the relationship between temporal line width and mass resolution as
2o-1
-2 +-~~~~~~~'"'r-~~~",~~~n.Jo
-2
These last four equations describe for various limitsthe maximum obtainable resolution at a given scanspeed and damping. Figure 3 illustrates the actualscan-rate dependence of the mass resolution as a function of a1
/2r. This scan-rate dependence is based on
numerical integration of din F/dx at t = -liar. Alsoincluded in the figure are the bounds provided by eqs24 and 25, which are established by the limiting behavior of the resolution.
Log(a1l2r)
Figure 3. Resolution as a function of the scan rate and dampingfactor all'" in the limiting case kT --> 0 and C' ~ 1. Dotted lineis based on numerical integration, whereas solid lines are basedon the bounds presented in eqs 23 and 24.
(20)
(21)wwm
kT C* 4m + M M--+- mr;w~ 122m + M m
Results and Discussion
(Note that the subscript "s" has been dropped fromthis and subsequent secular frequency w references.)This expression, along with those in eqs 19 and 20,allows the evaluation of mass resolution, but a necessary condition for the use of eq 1 in the derivation ofthese equations is that t. A must be small relative toro/ 21
/2 at ejection. In practice, this condition is equiva
lent to m1M» 1 and is readily met by the use of alight buffer gas during mass analysis. Additionally, thederivation of eqs 8 and 10 requires that w be nearresonance at ejection. This condition is met by the useof maximum dAjdt values for the two cases.

J Am Soc Mass Spectrom 1994, 5, 676-688 MASS RESOLUTION IN QUADRUPOLE ION TRAP 681
Mass Dependence of Instrument Resolution
Equations 24 and 25 describe the mass dependence ofthe maximum obtainable resolution, but in fact both aand T have mass dependence that should be madeexplicit. This affects both the resolution expressions ofeqs 22 through 25 as well as appropriate axial excitation amplitudes discussed subsequently in eqs 37through 40.
The mass dependence of a is straightforward: a isdirectly related to the mass scan rate via the differential form of eq 21 as seen in
Like a, T also has mass dependence because 7"= 2/eand c is defined in eq 11. In addition to the explicitterms, vr and eTa may also carry some mass dependence. The special case utilized by Goeringer et al, [10]involved an induced dipole-interaction model betweenthe ion and the neutral molecules, because for thismodel, the collision frequency is truly independent ofion velocity in vr . In such a case (by using m » M) weobtain
(29)
(31)1
{(ir= -7Tn
m
tim
where up is the polarizability of the neutral and 8 0 isthe permittivity of free space.
The velocity independence of c is essential to thesolution of eq 2 as presented in eqs 7 through 10. Inthis ion-induced dipole-interaction model, this velocityindependence is preserved, although as seen in eq 11,the reduced collision frequency e in general dependson the relative velocity between the ion and a collidingneutral molecule. However, even in a more generalion-neutral interaction model, the relative velocity Vr
(and therefore c) is still velocity independent if kT»C*Mr;w2/6. This condition is the same as that whichwill be discussed subsequently as a temperaturelimited resolution regime (see eq 32).
Nevertheless, this expression has some general applicability for lower mass ions, and utilizing eq 29, onemay rewrite eq 22 as
This is the low scan speed analog of eq 27.It must be noted that eqs 27, 28, and 30 all show a
difference in resolution between ions of the samemass-to-charge ratio when these ions have differentcharge states. More explicitly, each equation can bewritten as a function of mle multiplied by m1/ 2 . Inthis situation, the improvement in resolution for amultiply charged ion at a given mre value is proportional to the number of elemental charges. It is important to note that this implies that under a fixed set ofscanning conditions, the maximum mass resolutionwill be obtained for the singly charged ion.
The primary means of delineating the two operatingregimes has been to consider the value of a1
/ 27" relativeto 1. This value also has an explicit mass dependence,based on eqs 26 and 29, as is given by
It is clear that the primary dependence in this expression is pressure, whereas all other factors are ex-
(30)
(28)
(26)
(27)
d(mle)2wie1T-
d-t-
dta eos d(mle)a=-=----
dt m dt
d(mle)eM--
dt
~ = (m1211m
~am/tim
Although the frequency scan rate for a given mass-tocharge ratio remains constant over the course of thescan, the effective (frequency) scan rate decreases withincreasing mass. This important result may be coupledimmediately to eq 23 (high scan speed limit) to obtain
The ion-mass m and neutral-molecule buffer-massM [20] dependence of this expression are in goodagreement with the known behavior of the classicmass-selective instability scan. The scan-rate dependence also agrees with high scan speed behavior described by Louris et al. [19] (see Figure 6a). This resultfurther implies that resolution is independent of pressure if ions are sufficiently cooled prior to spectrumscanning [6, 7, 21].
This result, where resolution is directly proportional tomass, may be used to illustrate clearly why unit massresolution is readily maintained over the entire scanrange of the "classic" ion trap [16, 17] system.
A brief qualitative argument illustrates this fact. Itis well recognized that an ion trap that uses axialmodulation [8] qualitatively gives resolution behaviorsimilar to the classic mass-selective instability scan,whereas various researchers [10, 18, 19] have notedthat line width behavior at higher qz values (i.e.,qz > 0.4) should yield qualitatively similar characteristics. At the high qz values (near qz = 0.9) that are usedfor axial modulation, kT < C'Mr~w2/6, so that in classic mass-selective instability at high scan speeds, eq 28pertains:

682 ARNOLD ET AL. J Am Soc Mass Speclrom 1994, 5, 676-688
3
a
2-1 aLog[kT/(roro)2]
-2
a1==========-------;-
-4 +-~~~~~~__~_~~__~_~"""
-3
pressed as the square root. Nevertheless, under fullscan experiments, the mass dependence does providefor differences of a factor of 3 or 4 for different ions ina given scan, yielding distinctive resolution behavior.
Temperature and Collisional Focusing
The effect of temperature on resolution arises from theion packet dispersion term in the denominator of eqs22 through 25. The dependence of resolution on temperature is governed by the relative values of thetemperature itself and the frequency of supplementalexcitation. The critical point occurs when
(32)
where VM is the mean thermal velocity of the neutrals.This point occurs when the average axial ion velocityat ejection (vnns = ro wl 2) exceeds the mean thermalvelocity of the neutrals. For ejection frequencies (q,values) below this critical point, the resolution is limited by the dispersion of the "stationary" ion packetbefore excitation, which is a function of system temperature and may be represented as
(33)
This expression clarifies that increases in ejection frequency greatly enhance the resolution until the condition of eq 32 is met. In a standard commercial ion trapmass spectrometry (lTMS) instrument (ro = 1 em, n =
6.911 x 10⁶ S-l) at DoC, the condition of eq 32 iscomputed to occur at a supplemental frequency of 29.3kHz (qz = 0.075) for helium buffer gas and 11.1 kHz(qz = 0.028) for nitrogen (assuming C* ~ 1). Abovethese values, the increase in resolution with increasingfrequency will be a modified linear relationship described by
be varied by adjustment of the excitation frequency.One interesting feature of the low scan speed limit isthe fact that helium rather than hydrogen provides thehighest resolution. This is primarily due to the significantly lower polarizability (by more than a factor of 2)of helium.
The temperature of neutral buffer molecules hasbeen used in the development of amplitude dispersionequations 12 through 14. This approach is consistentwith the pseudopotential-well model developments ofMajor and Dehmelt [11]. It is clear that the actual iontemperatures reported in the literature [21-23], whichare typically higher than the buffer ion temperature,depend also on the effective ion temperatures produced by non-thermal excitations of the ion trajectories. Several means for these excitations have beendiscussed including nonlinear resonances [9, 24], drivefrequency harmonics [24], parasitic electrical signals,mechanical vibrations, and electrical noise [25].
Although these excitation sources must be recognized for their temperature-related effects in any ionchemistry experiment, it is clear that the hottest pointfor ions in virtually all ion trap experiments occurs ation ejection. At ejection, the amplitude dispersion described by eq 14 has a direct thermal component and
Log[kT/ (r,ro)2]
Figure 4. Temperature dependence of resolution for variousbuffer gases: (a) high scan speed limit a' / 2 .,. .. 1; (b) low scanspeed limit a' / 2 T .. 1.
( w/V8)y6m/C*M
.;;a12 + liT
m-->.im -
This is, of course, the opposite limiting case from eq33. In this case, we see that buffer molecular massbecomes an important limiting factor in higher ejectionfrequency cases. In either case, increasing the ion massor the excitation frequency yields increased resolution.
Figure 4 illustrates the relationship between temperature, buffer mass, and excitation frequency for fivedifferent buffer gases in both low and high scan speedlimits. At low temperatures (the buffer-mass-limitedcase of eq. 28), the condition of maximum resolution isobtained, whereas increasing temperature provides adegraded resolution although the inflection point may

J Am Soc Mass Spectrom 1994, 5, 676-688 MASS RESOLUTION IN QUADRUPOLE ION TRAP 683
an axial excitation component. The axial excitationcomponent of this dispersion is proportional to theproduct Aw, as was described in the derivation of eq14, for each frequency component. As long as the Awproduct for other non-secular oscillation frequencies issmall with respect to To w5/ 21
/2
, the dispersion factorsfor these other oscillations may be neglected in thespatial amplitude dispersion term.
plitude, ions may be ejected at any time prior toresonance, so that the minimum ejection time t is notlimited by any boundary.
Because maximum resolution occurs at x'" =-1 /(a1(2,-), as seen in Figure 2, substitution of thisvalue into eq 15 provides an expression for optimumexcitation amplitude. Combined with the definition offs in eq 2, f. can be directly related to the excitationvoltage amplitude, so that
Excitation Amplitude andMass Shift
During the development of minimum ejection linewidth expressions, eq 15 described the relationshipbetween the ejection point of the ion packet and thesupplementary excitation amplitude. Further it wasobserved that dA/dt has a clear maximum for given aand T values when the ejection point occurs at atm asgiven by
Iimrof. 2 wmr;;1IiV = = (38)
s e F(-I/{aT)
The behavior of V. as a function of a1(~ is the inverseof the behavior of resolution in Figure 3. The value ofVs may be approximated in a manner similar to thatfor m/am in eqs 24 and 25. The limiting cases aregiven by the expressions
These expressions may again be substituted with eqs26 and 29 to illustrate the mass dependencies at maximum resolution conditions. Further, substituting eq 26for the case a1
/2r
l> 1 yields
1(35)
aT
(see Figure 2). This time is measured relative to theresonance point in the scan (e.g., t = 0 occurs at w =ws)' Substituting eqs 26 and 29 into this expressiongives eq 36, which illustrates the effect of pressure,scan rate (d(m/e)/dt), and ejection frequency on theejection time at maximum resolution;
(36)
and
21iwmr;;rr:faV;:: -+-
• e T2
~
21iwmrg ( 1 iii)V < -+-.- e T r:;
(39)
(40)
This ejection time implies a mass shift that can bedetermined based on eq 21 to offer a comparisonbetween mass shift and mass resolution. The relativemass shift at maximum resolution is given by
which is independent of scan rate, but clearly dependent on ion mass-to-charge ratio, buffer mass, andpressure. For low scan speeds (a1/ 2,- -e 1) this valuemay be directly compared to those in eqs 22 and 30.
This result is somewhat limited in that it onlyapplies to the mass shift after the excitation amplitudef5 is adjusted to obtain maximum resolution. If theamplitude of the secular drive is not adjusted to yieldmaximum resolution for the ion mass of interest, it isclear that eq 15 will govern the mass shifts. The maximum delay possible in an ion ejection system occurs atthe maximum value of amplitude envelope. In Figure2 this corresponds to the point where d In F/ dx = O.At scan-rate extremes, ejection can only be delayed fora small time after resonance. For a1/ 2r -c 1, the maximum delay occurs approximately at t = +2r, whereasfor a1/2,- l> 1, the maximum delay occurs at aboutt = +2/a1/ 2• By overdriving the axial excitation am-
(42)
mw d(mle)----tre dt
whereas substituting eq 29 in the case a1/
2T -c 1 yields
Of particular interest is the mass dependence of bothexpressions, which indicate that excitation frequencyamplitudes may benefit from scanning in a mannersimilar to the rf scanning of the instrument. It shouldbe noted that eq 41 describes a behavior that is qualitatively similar to that of a classical ITMS system foradjustment of the excitation amplitude relative to thescan rate and ion mass variables [26] and agrees wellwith ref 19 at 4.2 V.
This analysis is based on the assumption that asimple dipole field describes the electric field produced by the supplemental end cap voltages. Actualfield values vary considerably from this dipole ideal.Even near the origin, correction values for the axialexcitation electric field have been reported as 0.8 [27]and 0.877 [28] based on experimental and theoreticalconsiderations, respectively. These dipole field correc-
(37)m wm Rfio- = -wr= --- ---am trne npM

684 ARNOLD ET AI.. J Am Soc Mass Spectrom lYY4. 5, 676-688
2-,--~~~~~~~~~~~~~~~~-----,
b
a
o
Log(a' 12t )
-I
mlM = 1250mlM = 250mlM = 50m/M= 10Freq. Line Width
<,<,
-----~:-":
-- Res. Limit ", '-..--- 'r = 10 ms -, "<, '..:::-- t=50ms ", <, "<,- - t = 250 ms , '-..
-2
o
-4
-3
-2
iE 0:3.sOi -1a
...J
SE -1
~C; -2.3
temporal fluctuations in the amplitude of the ion packetduring scanning.
Geometrical considerations also have been neglected. In a standard commercial instrument, the axialposition that corresponds to the ion exit aperture is afunction of radius. If the exit aperture is only 3.5 mmin radius, the ll. A of the aperture may be as large asO.04ro' which is the same as collision-based dispersionproduced by an mlM ratio of 92 (e.g., mrz 370 inHe buffer) in the low temperature limit. Clearly forhigher masses the aperture size could easily be theresolution-limiting element.
Geometrical variations already mentioned with respect to the supplemental axial excitation field willalso reduce resolution because the effective excitationvoltage is a function of radius in the trap. This secondeffect has the potential to be more important than thefirst, given the strong radial dependence of the excitation field strength already discussed. It is our opinionthat these geometrical effects are the dominant resolu-
-5 -h~"",~rrmr~""",~~~~,,,,---~-nnr~"""'r""""""""'1
-1 0 2 3 4 5 6 7
Log(a)
Figure 5. (a) Comparison of mass resolution at four differentm/M values in the low temperature limit. Both upper and lowerbounds are shown. The behavior of the previous frequency linewith model is also shown for comparison. (b) Specific comparison of the present model at m/M = 125 with the existing frequency line width modeL The upper four broken curves illustrate the present model at three damping factors, whereas thelower 3 illustrate the frequency line width model of the samethree values. The two solid lines indicate the maximum obtainable resolution as a function of scan rate for the two models.
Limitations and Comparison to Existing Theory
The present theoretical construction is an importantdeparture from previous theoretical work [10] for threereasons. First, the high scan speed behavior is notdependent on pressure and proceeds as a1
/2 rather
than ar as in the previous analysis. It should be notedthat this result is consistent with a large body of datathat show resolution to be constant over a broad rangeof pressures when sufficient time is allowed to thermalize the ions before scanning [7, 22].
Second, the present theory predicts, via eqs 39through 42, the excitation voltages required to obtainmaximum resolution at any scan speed. However, wereiterate that important nonlinear field effects weredisregarded in the derivation of these two equations. Acorrection factor is necessary to predict required excitation voltages accurately for a given resolution; onecorrection factor is probably obtained best from experiment, but the scan-rate dependencies and temporalline shifts should not be altered by these considerations.
Third, the ion dispersion description implies thatresolutions are directly dependent on the relativemasses of the buffer neutrals and the ions themselvesowing to collisional focusing. Furthermore, this effectis independent of the scan-rate regime. This effectdescribes how higher resolutions are produced forhigher masses in any continuous scan. This term alsoincorporates the effects of temperature (and, qualitatively, electrical noise) into the consideration of resolution.
Figure 5 illustrates a predicted resolution comparison between the present result and the previous frequency line width mode [10]. The resolution predictedin the present theory is actually higher in both scan-rateregimes. In the slow scan regime the resolution ishigher owing to the collisional focusing of the highermass ions by the light neutrals. This focusing effect isalso present at high scan speeds, but it is more important to note that the 1/a1
/2 behavior of the resolution
implies higher resolution even without this focusingeffect.
Note that several important sources of amplitudedispersion have been neglected in the present theory tofocus on the ion behavior in a damped harmonicoscillator model. During the previous discussion oftemperature, electrical noise was dismissed as a majorsource of spatial ion packet dispersion, but temporaland frequency dispersion effects, which could resultfrom noise in the radiofrequency drive or other electrical and mechanical sources, were not considered. It isworth noting that ll."'s is directly proportional to ll.Vin the drive voltage and that this may yield significant
tion values are a function of both radial and axialpositions, and they are expected to be considerablysmaller with radial displacements near the ring and toincrease to unity near the center of the end caps.

J Am Soc Mass Spectrom 1994, 5, 676-688 MASS RESOLUTION IN QUADRUPOLE ION TRAP 685
(43)
(46)
(45)
C*1Ii'T -< 1, kT ~ (;Mr~w2
C·1Ii'T <C 1, kT > (;Mr;w 2
(47)
r,,(q.!l)2 m5/ 6
nM
,;;:mqz<Vfro)
47rnJ2o.pMkT
m-aam
mt.m
When the ion dimensions are on the order of bo' wemay expect that a hard-space-type scattering modelwill take over, so that the mass dependence of o, as pereq 11, will relate to the molecular cross section of theion (i.e., CTD is proportional to m2/ 3 ) . Once this limit isreached, the analog on eq 43 becomes
which describes the maximum possible resolution foran ion of mass m at operating point qz. The ratio Vfrocomes from electrical-discharge considerations andrepresents a maximum value that is related to a maximum electric field strength. It is also important tonotice that this result is independent of the electricalcharge of the ion.
It is important to recognize that this result is basedon the temperature-limited regime, but that reductionsin operating frequency actually increase the secularfrequency w so that the kT;l> C*Mr;w2/ 6 conditionmay be altered. It is also important to note that asimilar evaluation of eq 33 to describe the maximumpossible resolution for any ion is more difficult andbeyond the scope of this paper.
The analysis that produced eqs 43 through 45 utilized the ion-induced dipole-interaction model. Oncean ion is sufficiently large, the probability that a neutral molecule will interact with the charge center ratherthan a neutral portion of the ion structure becomesincreasingly small. The ion-neutral interaction radius isgiven by
that this procedure may only continue until a maximum effective operating point for the trap is reached.This maximum effective value from other experimentsappears to be qz ~ 0.73 [10, 18] rather than the expected stability limit of qz = 0.91.
A clear impression of the maximum possible resolution at high mass may be obtained by a differentsubstitution of q. into eq 43. Substituting for the product ro U2
, we obtain
(44)C*
1Ii'T -< 1, rt » (;Mr;w 2
m {i;,eV 2
11m 'TT"nr;n2.,j2o. pmMkT
m
11m
which is the primary resolution expression for highmass analyses.
The m3/2 dependence in eq 43 indicates promising
resolution possibilities, but is in itself misleading. Ifthe operating voltage could increase without limit, thiswould describe the mass dependence of resolution. Inpractice, the highest mass-to-charge ratio detectable isdirectly proportional to the maximum operating voltage according to the definition of qz in eq 2. Substitution of the qz expression into eq 43 allows expectedresolution at high masses to be written as
Implications for High Mass Analyses
The driving force behind examinations of ion trapresolution in mass-selective instability scans has beenattempts to obtain high resolution mass spectra at veryhigh mass-to-charge ratios [10, 29]. Because a giveninstrument is generally limited to a maximum operating voltage either by electrical discharge or engineering constraints, three means have been used to extendthe mass range of the ion trap to allow ejection of highmass ions: reduction of the resonance ejection operating point qz [5, 30], reduction of the operating frequency n [31, 32], and reduction of the trap radius r 0
[31, 32]. When one or more of these means is coupledwith slow scan speeds, a combination of high massanalysis and high resolution may be obtained.
Use of anyone of these three means to expand themass range results in temperature-limited resolutionbecause kT;l> C*Mr;w 2 / 6. In the case of this limit, eq32 may be rewritten as
tion-limiting effects for high mass analyses in commercial instruments. A full accounting of these geometricaleffects is beyond the scope of this article, but it is clearthat both effects may be mitigated by use of smallapertures, which limit ion detection to those trajectories near the axis of symmetry.
Equation 44 clarifies that once the maximum value ofV has been reached, resolution as expected decreaseswith increasing mass because the operating point qzmust be reduced to extend the mass range of theinstrument.
It is not clear that reductions in To or n in eq 44 areaccompanied by an increase in the operating point and
for very large m. Similar analogies to eqs 44 and 45indicate that resolution decreases with increasing mass(once the voltage limit is reached) by factors of m-7/ 6
and m- I/
6, respectively.
Ultimately the improvement of resolution will ceaseto keep up with the increasing mass. By using values

686 ARNOLD ET AL. J Am Soc Mass Spectrom 1994. 5.676-688
for the polarizability of N z and He included in Mason[13], we can show that the collision radius bo is 12.5 Afor N z and 7.3 A for He with respect to a singlycharged ion. These values are easily exceeded by thedimensions of a singly charged ion at 10,000 u, so thatexpected resolutions for such high mass ions will require extremely low pressures to compensate for theless favorable hard-sphere-type interaction conditions.
the distribution will remain largely unchanged duringscanning. It is interesting to note that by substitutionthis expression can be shown to be equivalent to thecondition a1/Zr l!' 1.
At low-scan speeds, this implies that the ions mayactually "diffuse" out of the trap prior to the normalejection point of the distribution. In other words, mostions will enter a sufficiently high trajectory for ejectionprior to the time when the bulk of the unaltereddistribution would have reached the edge of the trap
Beyond the Pseudopotentiai-Well Approximation
At several times during this discussion, we alluded tobehavior of resonance ejection scans for qz valuesbeyond the 0.4 limit of the pseudopotential-well approximation. This is of course because the resonancephenomena themselves are still active at these higherqz values [8, 9]. Furthermore, we believe there is nothing conceptually flawed about the use of this description at higher qz values if appropriate considerationsare developed. It is for this reason that we have typically utilized w rather than qzll in resolution (andother) expressions so that they may be extended tohigh qz values.
The first consideration that must be addressed toextend the present work beyond the pseudopotentialwell region is the use of a harmonic oscillation modelto determine the amplitude dispersion in eq 14. Outside the pseudopotential region, vrms as used in eq 13is no longer accurate because harmonic components ofthe oscillation make important contributions to the rmsvelocity. Therefore <iA as developed in eq 14 is typically too small at high qz values. This should becompared to the results of Louris et al. [19], whichindicate resolution decreases for qz values above 0.73.
Second, the use of eq 1 implies a more basic assumption; this is, the amplitude distribution is unchanged during the scanning of the mass peak. At highscan speeds (i.e., a1/Zr:o- 1) this is clearly true, but atlow scan speeds, additional questions are raised. Ineffect, ions may "diffuse" from low to high amplituderegions of the distribution because of collisions withneutrals. This diffusion occurs at a rate that is proportional to the reduced collision frequency times thewidth of the distribution. Therefore as long as eq 48 isobeyed,
aperture. This effect may alter the ejection time forions, but it does not alter the peak width because therelaxation time r is proportional to 6.AIUlAI8t) inthe pseudopotential-well region and in a diffusive ejection process, the peak width is also proportional to thisrelaxation time.
At high qz values the rate at which ions maychange amplitude trajectories is altered by a secondaryeffect. The oscillation amplitude now is based on asuperposition of multiple frequencies. Without collisions the phase relationship between the secular andtrapping frequencies is determined by the voltagesdriving the oscillations and the initial conditions, butthe presence of collisions may alter the phase relationship between the two oscillation frequencies. If thedifferent oscillations have amplitudes on the sameorder of magnitude, it is clear that minor changes inphase due to collisions may produce alterations inamplitude on the order of <i A from a single collision.In other words, the collision frequency of the ions withindividual neutrals may determine the rate at whichions diffuse out of the trap at lower scan speeds.Therefore the actual collision frequency c' describedby
(49)m+M
c' ~ nv a: ~ ---crPM
determines the relaxation ti me constant r ', and thetemporal line width 6.t may be expressed as thesmaller of eq 20 and t ' == 4c'.
These additional caveats are added to the previousgeometrical considerations. Figure 6 illustrates a comparison between theoretical predictions and recent experimental results published by the Finnigan group(Lauds et al. [19]) and by Laundry et al. [3]. Both setsof results illustrate resolutions between 2 and 4 ordersof magnitude greater than the frequency line widthmodel predicts. Figure 6a compares the maximumresolution prediction of the present model to valuesobtained by Louris et a1. [19] for the mrz 129 ion ofxenon ejected at q, = 0.73. It already has been notedthat a voltage prediction of 4.2 V to obtain maximumresolution agrees very well with the value of - 5 Vobtained by Louris et a1. [19] at a scan rate of 5500 u.zs.It should be noted that eq 41 predicts that maximumresolution will be obtained at Vs values beyond thecapability of the commercial instrument for highermass ions (mlz > 100). Resolution improvements forhigh mass ions produced by using axial excitationvoltages between 6 and 25 V were recently demonstrated in our laboratory [26].
Figure 6b compares predictions of the present modelwith results recently reported by Loundry et a1. [3].The lack of a1/ 2 dependence (which is indicated by thesolid line), the lack of mass dependence, and the factthat that present theoretical construction still underestimates the resolution line by a factor of 10 are ofconsiderable concern. The authors believe this is due to
(48)dA-:0- c <iAdt

J Am Soc Mass Spectrom 1994, 5, 676-688 MASS RESOLUTION IN QUADRUPOLE ION TRAP 687
-2 athe initial amplitude dispersion is wider for the lowermass ions.
AcknowledgmentsThis work was sponsored by the Army Research Office undercontract DAAL03-91-G-0296.
Conclusion
The present amplitude-dispersion-based additions tothe frequency line-width-based model of Goeringer etal. [10] offer considerable insight into the phenomenathat affect resolution in ion-trap-based instruments.Furthermore, it appears to do so at high scan speedsand qz values that are beyond the limiting cases usedin the construction of the theory, even though considerable effort may be required to develop the appropriate correction values required to make the theoryquantitative for predictions in these regions. Ongoingefforts by other researchers in the areas of temperatureestimation [21-23], nonlinear resonances [9, 24], andion trajectory studies [33, 34] as well as additionalefforts in the areas of geometrical issues [27, 28] andcollisional effects [33, 34] on ion packet trajectories willall contribute to the ultimate understanding of ion trapresolution properties.
87
Log(s)
85
000000000 o
m/z 129
4
DDD'b
0
S-1E
::;!EC; -20...J
-3 D mlz614
0 mlz414
-4
a collection of the previously mentioned secondaryeffects. The dotted line in this figure corresponds to
2 3 4 5 6 7
Log(a)
Figure 6. Comparison of the present model with results obtained by (a) Louris et al. (19) and by (b) Loundry et al. (3). Thesolid line indicates predicted maximum resolution. Additionaldetails are in the text.
This is the expected scan-rate dependence when thetemporal line width is determined by the collisionrelaxation time r'. In this case, we took the pressure tobe 10-4 torr and temperature to be 300 K. The highestresolution is obtained at a1/ 2.r '" 1 in this curve, andthe peak width is determined by the 'T' until eq 20again becomes the limiting expression for line width.At the higher scan speeds, the all2 dependence returns, but the resolution is less than predicted becauseof (at least) two factors we have already mentioned: (1)the geometrical considerations in aperture shape anddipole excitation and (2) limitation of excitation amplitudes to 6 V on commercial instruments, Two reasonsfor not observing this same phenomenon in Figure 6aalso should be noted: (1) the lower q. value in theLouris et al. [19] data reduces the drive frequencyamplitude with respect to secular amplitude and (2)
m we'
2a(50)
References
1. Paul, W.; Reinhard, H. P.; Von Zahn, U. Z. Phys. 1958, 152,143.
2. Williams, J. D.; Cox, K.; Morand, K. L.; Cooks, R. G.; Julian,R. K.; Kaiser, R. E. In Proceedings of the39th ASMS Conferenceon Mass Spectrometry and Allied Topics, Nashville, 1991; P1481.
3. Loundry, F. A.; Wells, G. J.; March, R. E. Rnpid Commun. MassSpectrom. 1993, 7,43.
4. Kaiser, R. E., Jr.; Cooks, R. G.; Stafford, G. c, Syka, J. E. P.;Hemberger, P. H. Int. [. Mass Spectrom. Ion Process. 1991, 106,79.
5. Kaiser, R. E.; Louris, J. N.; Amy, J. W.; Cooks, R. G. RnpidCommun. Mass Spectrom. 1989, 3, 225.
6. Kelley, P. E.; Stafford, G. c, Stephens, D. R. U.S. Patent4,540,884, September 10, 1985.
7. March, R. E.; Hughes, R. J- In Quadrupole Storage Mass Spectrometry; Winefurdner, J. D.; Kolthoff, I. M., Eds.; ChemicalAnalysis Series 102; Wiley: New York, 1989.
8 Syka, J. E. P.; Louris, J. N.; Kelley, P. E.; Stafford, G. c,Reynolds, W. E. U.S. Patent 4,736,101, 1988.
9. Franzen, J.; Gabling, R.-H.; Heinen, G.; Weiss, G. U'S. Patent4,882,484, November 21, 1989_
10. Goeringer, D. E.; Whitten, W. B.; Ramsey, J.M.; McLuckey, S.A.; Glish, G. L. Anal. Chern. 1992,64,1434.
11. Major, F. G.; Dehmelt, H. G. Phys. Rev. 1968, 170,91-107.12. Marion, J. B. Classifcal Dynamics of Particles and Systems; Aca
demic Press: New York, 1970; p 117.13. Mason, E. A.; McDaniel, E. W. Transport Properties of Ions in
Gases; Wiley Interscience: New York, 1988; p 144.14. Gautschi, W. In Handbook of Mathematical Functions;
Abramowitz, M.; Stegun, I. A., Eds.; Dover: New York, 1972;pp 295-330.
15. Fowles, G. R. Introduction to Modern Optics; Holt, Rinehart,and Winston: New York, 1975; pp 125-135.

688 ARNOLD ET AL. JAm Soc Mass Spectrom 1994, S,676-688
16. Stafford, G. C; Kelley, P. K; Syka, J. E. P.; Reynolds, W. E.;Todd, J. F. J. Int. J. Mass Spectrom. Ion Process. 1984, 60, 85.
17. Weber-Grabau, M.; Kelley, P. E.; Bradshaw, S. C; Heckmann,D. J. In Proceedings of the 36th ASMS Conference on MassSpec/rome/ry and AlliedTopics, San Francisco, 1988; p 1106.
18. Schwarz, J. C; Syka, J. E. P.; Jardine, 1. J. Am. Soc. MassSpec/rom. 1991,2, 198.
19. Louris, j.; Freuler, S.; Kirkish, J.; Schwartz, J.; Statford, G.;Syka, j.; Taylor, D.; Tucker, D.; Zhun, J. In Proceedings of the39th ASMS Conference on Mass Spectrometry and Allied Topics,Nashville, TN, 1991; P 542.
20. Cameron, D.; Hemberger, P. H.; Alarid, J. E.; Liebman, C. P.;Williams, J. D. J. Am. Soc. Mass Spectro. 1993, 4, 774.
21. Vedel, F. Int. J. Mass Spectrom. Ion Process. 1991, 106,33.22. we. H.-F.; Brodbelt, J. S. Int. J. Mass Spectrom. Ion Process.
1992, 115, 617.23. Basic, C; Eyles, J. R; Yost, R A. J. Am. Soc. Mass Spectrom.
1992, 3, 716.24. Vede1, F.; Vedel, M.; March, R. E. Int. J. Mass Spectrom. Ion
Process. 1990, 99, 125.
25. McLuckey, S. A; Goeringer, D. E.; Glish, G. 1.. Anal. Chem.1992, 64, 1455.
26. Arnold, N. S.; McClennen, W. H.; Meuzelaar, H. L. C InProceedings of the 41st ASMS Conference on Mass SpectrometryandAlliedTopics, San Francisco, CA, 1993; P 21a.
27. Philip, M. A.; Gelbard, F.; Arnold, S. J. J. Colloid Interface Sci.1980, 75,566.
28. Davis, E. J. Langmuir 1985, 1, 379.29. Cooks, R. G.; Amy, J.; Bier, M.; Schwartz, J.; Schey, K. Adv.
Mass Spectrom. 1989, 11A, 33.30. Fulford, J.E.; Hoa, D.-N.; Hughes, R. J.; March, R. E.; Bonner,
R. F.; Wong, G. 1. J. Vac. Sci. Technol. 1980, 17,829.31. Kaiser, R. E.; Cooks, R. G. Rapid Commun. Mass Spectrom.
1989, 3,50.32. Kaiser, R E.; Cooks, R. G.; Moss, J.;Hemberger, P. H. Rapid
Commun. Mass Spectrom. 1989, 3, 50.33. Williams, J. D.; Cooks, R. G.; Syka, j. E. P.; Hemberger, P. H.;
Nogar, N. S. J. Am. Soc. Mass Spectrom. 1993, 4, 792.34. Loundry, F. A.; Alfred, R 1.; March, R E. J. Am. Soc. Mass
Spectrom. 1993, 4, 687.