organic spectroscopy mass spectrometry. general the mass spectrum is a plot of ion abundance versus...
TRANSCRIPT
Organic SpectroscopyMass Spectrometry

General
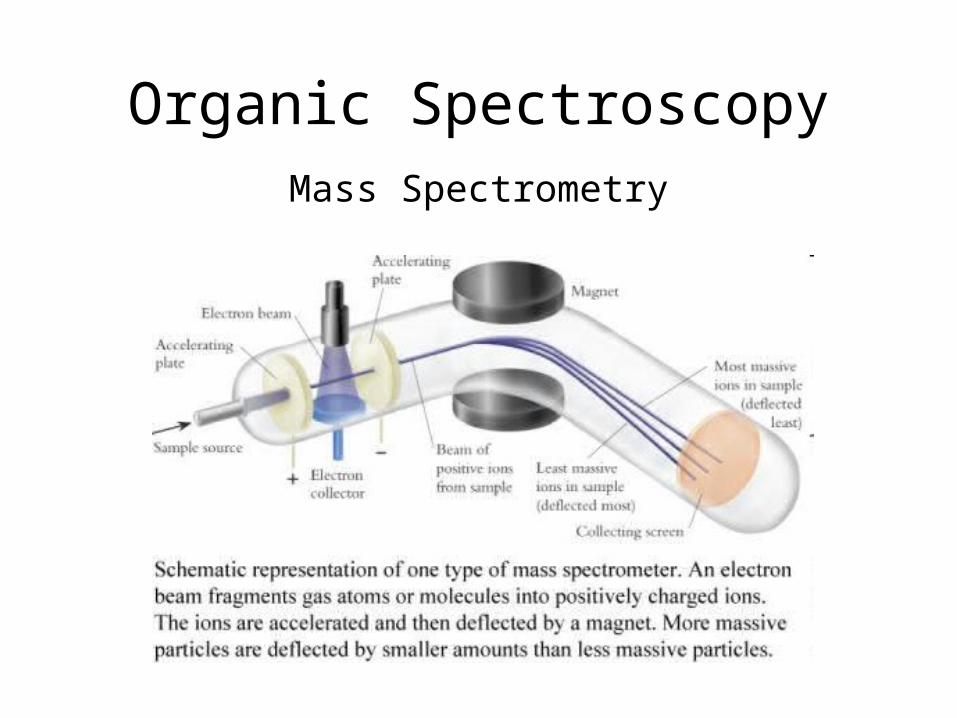
The mass spectrum is a plot of ion abundance versus m/e ratio (mass/charge ratio).The most abundant ion formed in the ionization chamber gives to rise the tallest peak in the mass spectrum, called the base peak.
By using one of the many ionization methods, the simple removal of an electron from a molecule yields a positively charged radical cation, known as the molecular ion and symbolized as [M]+.
After formation of molecular Ion in the ionization chamber, excess energy causes further fragmentation of the molecular ion. Various positively charged masses (and/or positively charged radical cations) show up in the spectrum.
The mass of the molecular ion can be determined to an accuracy of ± 0.0001 of a mass unit, which yields a high resolution (hi-res) mass spectrum.
Ionization MethodsThe most common method of ionization involves Electron impact (EI) in which molecule is bombarded with high-energy electrons. This is the strongest ionization method which usually causes further fragmentation. Since the molecular ion gets fragmented, the molecular ion usually produces a small peak with this method.

105(base peak)
molecular ion, M(148)
Mass Spectrum of Isobutyrophenone
O
molecular weight = 148
C6H5CO+
77C6H5
+
M+1

Facts Concerning the Molecular Ion Peak
1. The peak must correspond to the ion of highest mass excluding theusually much smaller isotopic peaks that occur at M+1, M+2, etc.
2. To be a molecular ion, the ion must contain an odd number of electrons. One electron is lost, forming a radical-cation.
To determine this, calculate the IHD. It must be a whole number. Consider an ion at m/z = 112. A possible molecular formula is C6H8O2.The IHD = 3 (a whole number), so this could be the molecular ion.However, an ion at 105 could correspond to a molecular formula ofC7H5O. The IHD is 5.5 (not a whole number), so this can’t be the molecular ion.
3. The ion must be capable of producing smaller, fragment ions by loss of neutral fragments of predictable structure.

Aromatics > conjugated alkenes > alicyclic compounds> organic sulfides >unbranched hydrocarbons > mercaptans > ketones > amines > esters >ethers > carboxylic acids > branched hydrocarbons > alcohols
Therefore, alcohols produce small or non-existent molecular ions because their lifetimes are too short. They fragment before they can be detected.
The Lifetimes of Various Molecular Ions
CH3CH2CH2CH2OHMW = 74
No Mvisible

The Nitrogen RuleThe nitrogen rule states that an odd number of nitrogen atoms will form
a molecular ion with an odd mass number. An even number of nitrogen
atoms (or none at all) will produce a molecular ion with an even mass
number. This occurs because nitrogen has an odd-numbered valence.
Examples: C6H5CH2NH2 MW = 107
H2NCH2CH2NH2 MW = 60

Determining Possible Molecular Formulas from the Molecular Ion: Rule of 13
• Rule of Thirteen: Based upon the assumption that CnHn and its mass of 13 is present in most organic compounds.
• Divide the molecular ion by 13. This gives a value for n and any remainder (R) = additional H’s.
• For a M+ = 106, n = 8(106/13) with a R of 2. A possible molecular formula for this ion is C8H8+2 = C8H10
• For each CH there are heteroatom equivalents.

Rule of 13 Heteroatom Equivalents
Element CH Equivalent
Element CH Equivalent
1H12 C 31P C2H7
16O CH432S C2H8
14N CH216O32S C4
16O14N C2H635Cl C2H11
19F CH779Br C6H7
28Si C2H4127I C10H7
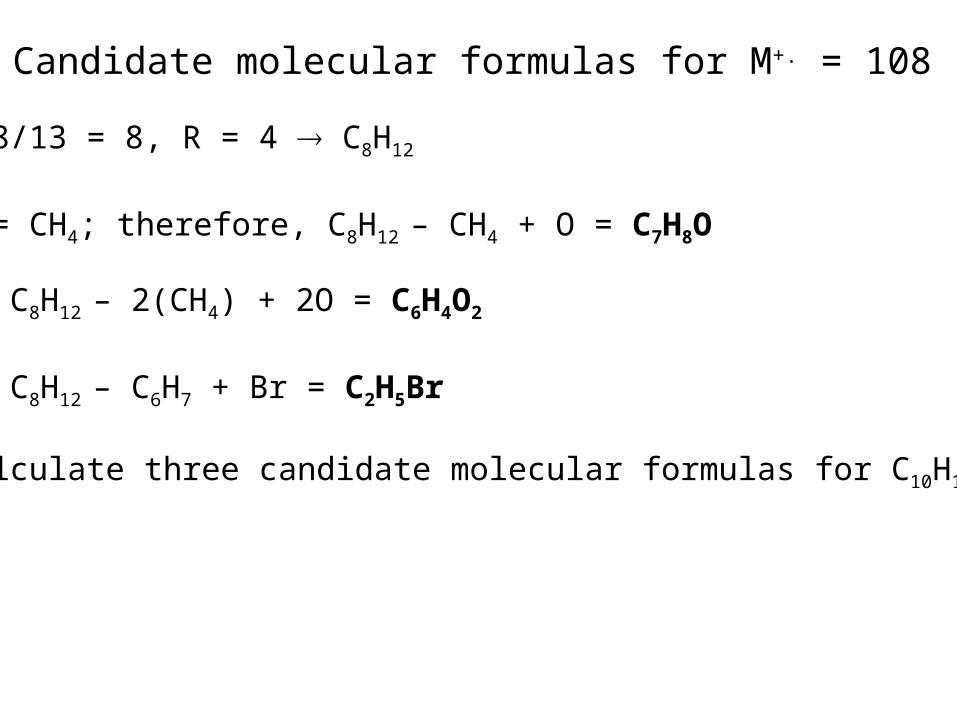
Candidate molecular formulas for M+. = 108
108/13 = 8, R = 4 C8H12
O = CH4; therefore, C8H12 – CH4 + O = C7H8O
or C8H12 – 2(CH4) + 2O = C6H4O2
or C8H12 – C6H7 + Br = C2H5Br
Calculate three candidate molecular formulas for C10H18.

When an odd amu M+. is seen, suspect one nitrogen or an odd multiple. Candidate molecular formulas for a M+. = 121 are:
121/13 = 9, R = 4 C9H13; IHD = 3.5 so it can’t be M+.
O = CH4; N = CH2
or C9H13 – CH2 + N = C8H11N; IHD = 3, so it may be M+.
or C9H13 – 2(CH2) + 2N = C7H9N2; IHD = 4.5 so it can’t be M+.
or C9H13 – 3(CH2) + 3N = C6H7N3; IHD = 5, so it may be M+.
or C9H13 – (CH2) – (CH4) + N + O = C7H7NO IHD = 5, so it may be M+.

Determining the Molecular Formula from the Molecular Ion: Isotope Ratio Data
In this method, the relative intensities of the peaks due to the molecular ionand related isotopic peaks are examined.
Advantage:• Does not require an expensive high-res MS instrument.
Disadvantages:• Isotopic peaks may be difficult to locate.• Useless when the molecular ion peak is very weak or does not appear.
3-pentanone

Element IsotopeRelative
Abun-dance
IsotopeRelative
Abun-dance
IsotopeRelative
Abun-dance
Carbon 12C 100 13C 1.08
Hydrogen 1H 100 2H 0.016
Nitrogen 14N 100 15N 0.38
Oxygen 16O 100 17O 0.04 18O 0.20
Sulfur 32S 100 33S 0.78 34S 4.40
Chlorine 35Cl 100 37Cl 32.5
Bromine 79Br 100 81Br 98.0
Relative Abundances of Common Elements and Their isotopes

Example: 3-pentanone, C5H10O%(M + 1) = 100 (M + 1)/M = 1.08 x # C atoms + 0.016 x # H atoms + 0.04 x # O atoms
= 1.08 x 5 + 0.016 x 10 + 0.04 x 1= 5.60 Actual spectrum: [1% (M +1)/17.4% (M)] x 100 = 5.75

Halogen M M + 2 M + 4 M + 6
Br 100 97.7
Br2 100 195.0 95.4
Br3 100 293.0 286.0 93.4
Cl 100 32.6
Cl2 100 65.3 10.6
Cl3 100 97.8 31.9 3.47
BrCl 100 130.0 31.9
Br2Cl 100 228.0 159.0 31.2
Cl2Br 100 163.0 74.4 10.4
Relative Intensities of Isotope Peaks for Bromine and Chlorine

156 158
Br
MW = 156

Br
Br
MW = 234234
236
238

Cl
MW = 112
112
114

Cl
Br
MW = 190
190
192
194

Determining the Molecular Formula from the Molecular Ion: High Resolution MS (HRMS)
Using low resolution (LR) MS, you could not distinguish between the followingmolecular formulas, each of which has a mass of 60:
C3H8O = (3 x 12) + (8 x 1) + 16 = 60
C2H8N2 = (2 x 12) + (8 x 1) + (2 x 14) = 60
C2H4O2 = (2 x 12) + (4 x 1) + (2 x 16) = 60
CH4N2O = 12 + (4 x 1) + (2 x 14) + 16 = 60
However, they can be distinguished using HRMS.
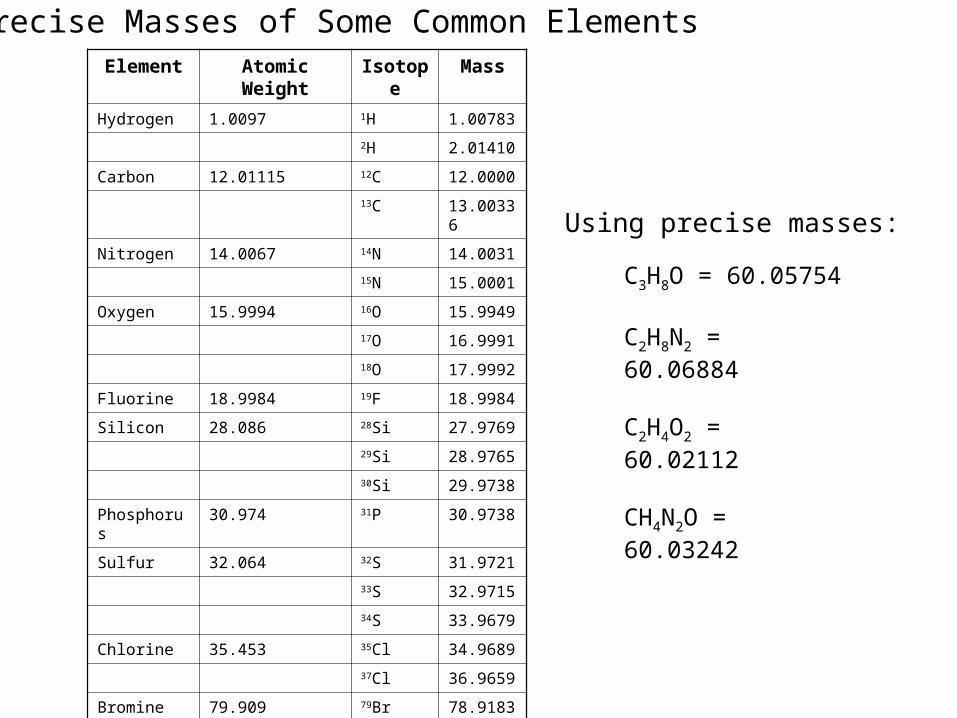
Precise Masses of Some Common ElementsElement Atomic Weight Isotope Mass
Hydrogen 1.0097 1H 1.00783
2H 2.01410
Carbon 12.01115 12C 12.0000
13C 13.00336
Nitrogen 14.0067 14N 14.0031
15N 15.0001
Oxygen 15.9994 16O 15.9949
17O 16.9991
18O 17.9992
Fluorine 18.9984 19F 18.9984
Silicon 28.086 28Si 27.9769
29Si 28.9765
30Si 29.9738
Phosphorus 30.974 31P 30.9738
Sulfur 32.064 32S 31.9721
33S 32.9715
34S 33.9679
Chlorine 35.453 35Cl 34.9689
37Cl 36.9659
Bromine 79.909 79Br 78.9183
81Br 80.9163
Iodine 126.904 127I 126.9045
C3H8O = 60.05754
C2H8N2 = 60.06884
C2H4O2 = 60.02112
CH4N2O = 60.03242
Using precise masses:

Fragmentation Patterns
Most common: one-bond cleavage to produce an odd-electron neutral fragment,(radical, which is not detected) and an even-electron carbocation. Ease of frag-mentation to form cations follows the scheme below:
CH3+ < RCH2
+ < R2CH+ < R3C+ < CH2=CH-CH2+ < C6H5-CH2
+
Difficult Easy
Radical (not detected)

Fragmentation Patterns (cont.)Two-bond cleavage: The odd-electron molecular ion produces an odd-electronfragment ion and an even-electron neutral fragment (not detected).
Not detected
McLafferty Rearrangement
O
H3C O
H R
OH3C
O H
+R
+ +
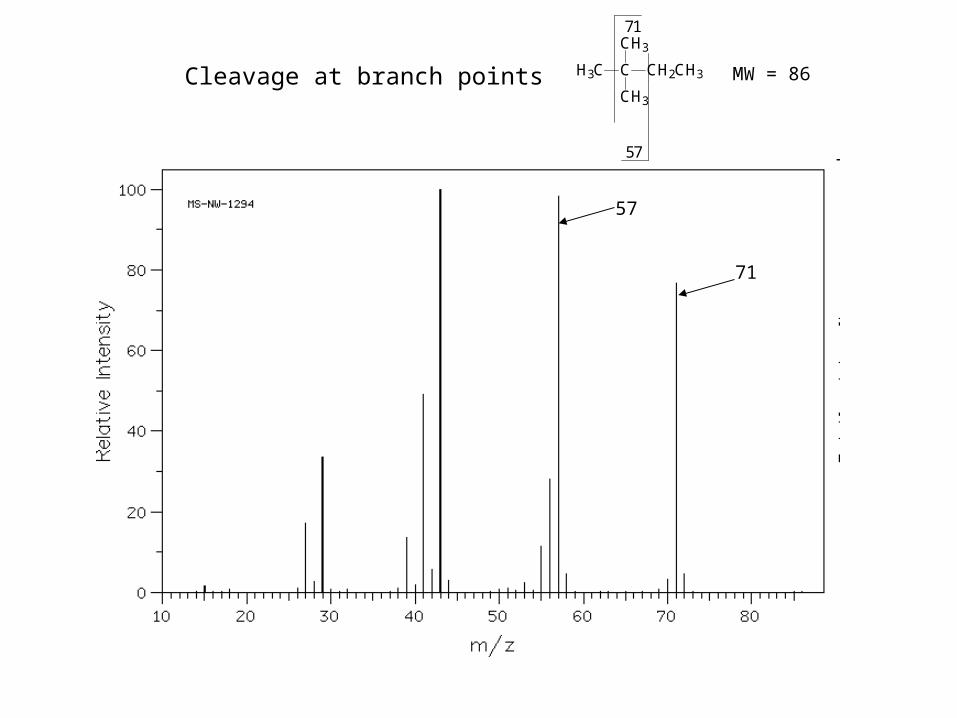
71
57
71
C
CH3
H3C
CH3
CH2CH3
57
Cleavage at branch points MW = 86

87
MW = 102-cleavage to hetero atoms OH3C
CH3 CH3
CH3
87
43
cleavage to hetero atoms
43
CH3-CH=OH+

-cleavage to aromatic ring
91
91
MW = 134
CH2
92 (from McLaffertyRearrangement)

43
43
O
H3C CH3
Cleavage to carbonyl groups MW = 86

60
60
OH
O
CH2 C
OH
OH
McLafferty rearrangementcarboxylic acids

74
74
O
O
CH3
McLafferty rearrangementesters
CH2 C
OH
OCH3
MW = 102

Hexane C6H14
MW = 86.18Molecular ion peaks are present, possibly with low intensity. The fragmentation pattern contains clusters of peaks 14 mass units apart (which represent loss of (CH2)nCH3).

3-Pentanol C5H12O
MW = 88.15
An alcohol's molecular ion is small or non-existent. Cleavage of the C-C bond next to the oxygen usually occurs. A loss of H2O may occur as in the spectrum below.

3-Phenyl-2-propenal C9H8O
MW = 132.16
Cleavage of bonds next to the carboxyl group results in the loss of hydrogen (molecular ion less 1)
or the loss of CHO (molecular ion less 29).

3-Methylbutyramide C5H11NO
MW = 101.15
Primary amides show a base peak
due to the McLafferty rearrangement.

n-Butylamine C4H11N
MW = 73.13
Molecular ion peak is an odd number.
Alpha-cleavage dominates aliphatic amines.

n-Methylbenzylamine C8H11N MW = 121.18Another example is a secondary amine shown below. Again, the molecular ion peak is an odd number.
The base peak is from the C-C cleavage adjacent to the C-N bond.

Naphthalene C10H8
MW = 128.17Molecular ion peaks are strong due to the stable structure.

2-Butenoic acid C4H6O2
MW = 86.09In short chain acids, peaks due to the loss of OH
(molecular ion less 17) and COOH (molecular ion less 45) are prominent due to cleavage of bonds next to C=O.

Fragments appear due to bond cleavage next to C=O (alkoxy group loss, -OR) and hydrogen rearrangements.
Ethyl acetate C4H8O2
MW = 88.11

Fragmentation tends to occur alpha to the oxygen atom (C-C bond next to the oxygen).
Ethyl methyl ether C3H8O
MW = 60.10

The presence of chlorine or bromine atoms is usually recognizable from isotopic peaks.
1-Bromopropane C3H7Br
MW = 123.00

Major fragmentation peaks result from cleavage of the C-C bonds adjacent to the carbonyl.
4-Heptanone C7H14O
MW = 114.19

MW = 100 MW = 100 MW = 114
MW = 100 MW = 86
Which structure supports the following mass spectrum?

Which structure supports the following mass spectrum?
NH2 NH2
NH2
MW = 101 MW = 87 MW = 87
MW = 87 MW = 73
NH
NH2
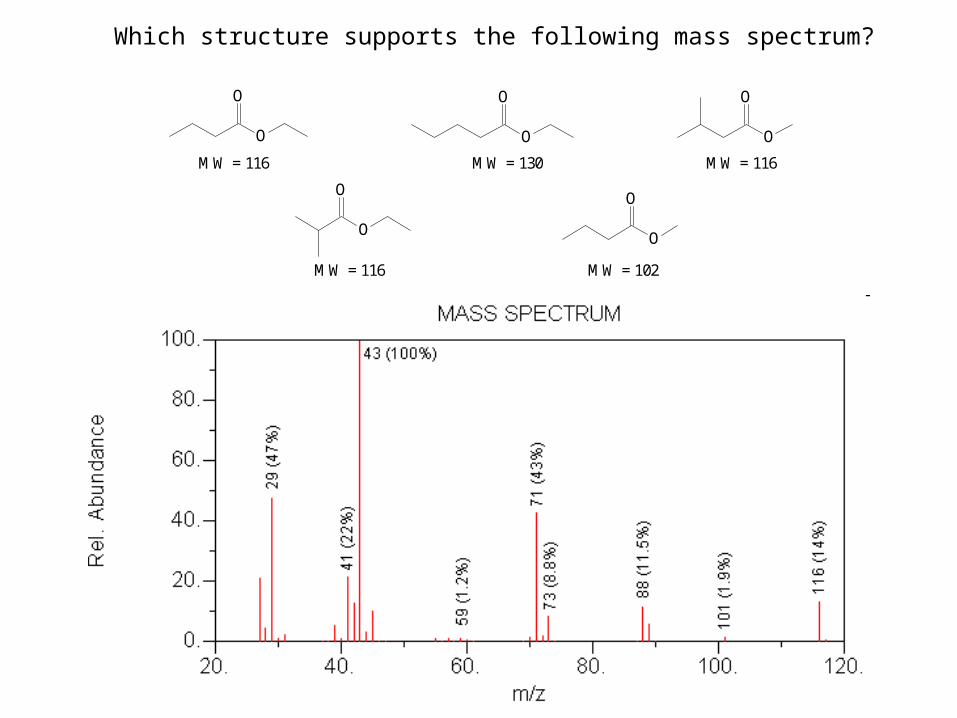
MW = 116 MW = 130 MW = 116
MW = 116 MW = 102
O
O
O
O
O
O
O
O
O
O
Which structure supports the following mass spectrum?

An unknown compound has the mass spectrum shown below. The IR spectrum shows peaks in the 3100-3030 and the 2979-2879 cm-1 ranges and a strong absorption at 1688 cm-1. Suggest a structure consistent with this data.

An unknown compound has the mass spectrum shown below. The IR spectrum shows peaks in the 2963-2861 cm-1 range and a strong absorption at 1718 cm-1. Suggest a structure consistent with this data.