experimental study of gas rise velocity and its effect on...
TRANSCRIPT

SPESociety of Petroleum Engineers
SPE 23160
Experimental Study of Gas Rise Velocity and Its Effect onBottomhole Pressure in a Vertical WellP. Skalle, U. of Trondheim; A.L. Podio, U. of Texas; and J. Tronvoll, U. of TrondheimSPE Members
Copyright 1991, Society of Petroleum Engineers, Inc.
This paper was prepared for presentation at the Offshore Europe Conference held in Aberdeen, 3-6 September 1991.
This paper was selected for presentation by an SPE Program Committee following review of information contained in an abstract submitted by the author(s). Contents of the paper,as presented, have not been reviewed by the Society of Petroleum Engineers and are subject to correction by the author(s). The material, as presented, does not necessarily reflectany position of the Society of Petroleum Engineers, its officers, or members. Papers presented at SPE meetings are subject to publication review by Editorial Committees of the Societyof Petroleum Engineers. Permission to copy is restricted to an abstract of not more than 300 words. Illustrations may not be copied. The abstract should contain conspicuous acknowledgmentof where and by whom the paper is presented. Write Librarian, SPE, P.O. Box 833836, Richardson, TX 75083-3836 U.S.A. Telex, 730989 SPEDAL.
ABSTRACT INTRODUCTION
in which vgS is the superficial gas velocity(qg/A), and Vg is the absolute gas bubblevelocity in the flowing mixture, which wasdetermined experimentally.
During drilling into a shallow gas sand orduring circulating out a gas kick it isimportant to know the bottom hole pressure.If not known, it is difficult to bring thewell under control.
A problem of experimental two-phase studiesis the determination of liquid hold up.Quick operating valves to shut off arepresentative part of the flowing mixturehave been commonly applied, while localcapacitance measurements have been used inmore recent studies. Hold up was determinedin this study through the bubble risevelocity derived from material balanceconsiderations:
Few two-phase studies have been performed inlarge scale annular geometries. Most haveinvolved tubing with diameters of 2" or lessand short distances. The annulus of theexperimental model in the present work has ahydraulic diameter of 3", which isequivalent to a 5" 00 drill pipe in a 9 5/8"casing or a 8 1/2" hole and has a totallength of 550 feet. The drill pipe ismounted with tool joints similar to those inthe field.
(1)
V S
H=~g vg
A 500 ft vertical well was used to studyslip velocity of air in mud and pressuregradients through a 2.93" annulus (5.43 2.50") during continuous two phase flow inflowing liquids and in stagnant liquidcolumns. The well was instrumented tomeasure liquid- and air flow rate, surfaceback pressure and annular pressuregradients.
Tests were undertaken with a broad range ofair and liquid rates, different liquidproperties, and with the injection of airslugs at different rate combinations. Itwas possible to detect these slugs as theypassed the pressure transducers in theannulus. Results were applied to determinegas rise velocity.
Correlation has been developed for gas risevelocity, which was used to estimate gas andliquid hold up. The in situ gas velocityand terminal settling velocity weredetermined for both dispersed bubbly flowand slug flow. The resulting pressuregradients have been compared to estimatesfrom 8 different empirical correlations.The best results were obtained by using theZuber & Findley correlation for holdupestimation with a gas holdup of 0.6 todistinguish the boundary between bubble andslug flow. This high transition value wasmainly caused by the geometry of the well(tool joints) and partly by the rheology ofthe mud. A very good agreement betweenrecorded and estimated downhole pressure wasachieved, with a mean error of approximately1% and a standard derivation of 2.9%.
References and illustrations at end of paper.
527

2 EXPERIMENTAL STUDY OF GAS RISE VELOCITY AND ITS EFFECT ON BOTTOM HOLE ... SPE 23160
THE PRESSURE GRADIENT EQUATION
composed of a gravitational component (g),an accelerational component (a) and africtional component (f).
As a modification of the general energyequation the one-dimensional pressuregradient in the z-direction may be written
Two-phase flow obeys all the basic laws offluid dynamics. In general, this involvesdeveloping expressions for conservation ofmass, linear momentum and energy.
where V m is the mixture velocity «qg +qL) /A) and p the pressure at point ofinterest. The acceleration component waslater shown to be negligible for practicalpurposes.
In horizontal pipe flow the total energyloss is caused by change in kinetic energyand frictional pressure loss only. Thefrictional pressure loss is caused byviscous shear at the pipe wall. The ratioof wall shear stress, ~w, to kinetic energy
per unit volume, 1/2 PVm2, reflects therelative importance of wall shear stress tototal pressure losses. This ratio forms adimensionless group and defines a frictionfactor
(2)dp = (dP) + (dP) + (dP)dz dz g dz a dzf
Transforming shear stress into pressure, thefriction gradient in terms of the Moodyfriction factor, f m, yields
The equation is usually adapted for twophase flow by assuming that the gas-liquidmixture can be considered homogeneous over afinite volume in the pipe.
The gravitational or elevation changecomponent in two-phase flow becomes
f=~= 2~wpv~/2 pv~ (8)
(:) = g Pm sin ~g (3)
(dP) = fmpv~dz f 2d ( 9)
where Pm is the density of the gas-liquidmixture in the volume under considerationand ~ the deviation from horizontal. Considering a pipe element which containsliquid and gas, the density of the mixturecan be calculated from
(4)
where d is the pipe diameter.
Two-phase frictional pressure losses must bedetermined by experiments, and are normallycalculated using modified versions of thesingle phase flow equations. The principalconsiderations for developing pressuregradient equations, are developing methodsfor predicting liquid holdup and two-phasefriction factor.
where HL is the liquid holdup and is definedas
and
H =volume occupied by liquid in the pipe elementL volume ofpipe element (5)
Published correlations for vertical flow arenormally divided into three categories, asfirst proposed by Orkiszewski2 . The differences in theoretical concepts of eachcategory and the corresponding correlationsare summarised below.
(6) Category 1
The acceleration component has been ignoredby most investigators, based on variousassumptions regarding the relative magnitudeof the parameters involved. This isnecessary in order to derive a simplifiedprocedure to determine the pressure drop dueto change in kinetic energy. In this workthe method of Beggs & Brill1 was applied
The experimental determinationbeen made in various ways byinvestigators.
(dP) = vm . v~ . Pmdz a P
of HL hasdifferent
(7 )
Liquid holdup is not considered in thecomputation of the mixture density, i.e. noslip is assumed. Thus, mixture density isbased on produced (top-hole) fluids composition, corrected for down-hole temperatureand pressure. Only a correlation for twophase friction factor is required. Nodistinction is made for different flowregimes. The methods in this category thatwere studied include:
Poettmann and Carpenter3
Baxendell and Thomas 4
Fancher and BrownS
528

SPE 23160 P. SKALLE, A.L. PODIO, J. TRONVOLL, R. TRYLAND 3
Category 2
Slip, which means relative velocity betweenthe two phases, is considered. The liquidholdup is either correlated separately orcombined in some form with the wall frictionlosses. The friction losses are based onthe composite properties of liquid and gas.The same correlation for liquid holdup andfriction factor are. used for all flowregimes.
Only the Hagedorn and Brown6 correlation wasselected from this category.
Category 3
Both slip and different flow patterns areconsidered. Thus, methods for determiningflow regime transitions are necessary. Oncethe correct flow regime is established, theappropriate holdup and friction factorcorrelations are given. These correlationsare usually different for each flow regime.Three different correlations from thiscategory have been studied
The Duns and Ros correlation7The Orkiszewski correlation2The Beggs & Brill correlation1
For circular channels in vertical andinclined systems, the in situ velocity ofthe gas phase has been expressed as the sumof the bubble rise velocity in stagnantliquid, Vt, and the mixture velocity vm(Zuber and Findley8 Hasan et al. 9). Hence
(10)
Co in Eq. 10 is a correction factorresulting from the combined effects of thevolumetric flux and gas concentrationprofiles in the cross-section of the flowchannel. The values of Co and Vt aredefined differently for each flow regime.
For bubble flow and slug flow, experiments8have shown that Co is about 1.2. Hasan10found that the presence of an inner tube didnot appear to influence neither the terminalrise velocity, Vt, nor the bubbleconcentration profile. However, thisphenomenon was only tested for a restricteddiameter range and has to be furtherinvestigated for larger diameters.
For bubble flow, Zuber and Findleycalculated the terminal rise velocity fromthe following expression (in consistentunits)
THE MODIFIED ANNULAR CORRELATION(11 )
Compared to the large amount of researchwhich has been conducted in the area of twophase flow in circular pipes, othergeometries have gained little attention.However, developing accurate models forother geometries is necessary. The modifiedannular flow correlation belongs to category3 as described above and is based on thebasic relationships (eqs. (1) through (9».The following modifications have beenincluded:
Bubble rise velocityPressure loss due to tool jointsFlow regime transition
in which s is the surface tension. Thoughthe most widely used expression is probablyHarmathy'sll correlation, which is given by
(12)
For slug flow, Hasan found that the presenceof an inner tube tends to make the Taylorbubble nose sharper causing an increase inthe terminal rise velocity VtT. Data showeda linear relationship of VtT with thediameter ratio dildo. Thus, Hasan suggestedthe following expression for Taylor bubblerise velocity for vertical annular systems
When the fluids are circulated through theannulus in the experimental well, the tooljoints or collars produce a certainresistance to the flowing fluids. The flowrestrictions are shown in Fig. 1. Gruppinget al. 12 investigated how collars influencedupward flowing gas slugs. They concludedthat major fragmentation occurs when a gasbubble passes a tool joint. They also foundthat a much stronger fragmentation occurredwhen the inner tube was concentric, comparedto an eccentric inner tube.
Rise velocity
As seen previously, the problem in two-phaseflow is to find an appropriate expressionfor the mixture density, Pm' by estimatingthe liquid holdup, HL. The liquid holdup orthe gas void fraction (1 - HL) depends onthe in situ velocity of the gas phase, Vg.The gas velocity is greater than the mixturevelocity, Vm, because of the buoyancy effectand the tendency of the gas phase to flowthrough the central portion of the pipewhere local mixture velocity is greater thanthe average mixture velocity. Both of theseeffects depend on the existing flow pattern,and various expressions for the gas velocityhave been published.
529
VtT =[0.345 + 0.10 (dildo)] • ficIJ.PL - pg)'V -PL
Pressure Loss due to Tool Joints
(13)

4 EXPERIMENTAL STUDY OF GAS RISE VELOCITY AND ITS EFFECT ON BOTTOM HOLE ..• SPE 23160
where KE is a constant depending on thegeometry of the feature.
~p =KE!Pm v~(14)
This gives reasons to believe that the tooljoints will influence the transition frombubble to slug flow. Thus, due to increasedturbulence and fragmentation, bubble flowwill probably occur at higher gas voidfractions than in circular pipes or smoothannuli. Further research is necessary toestablish any functional dependencies.
One common way of calculating frictionallosses at local features in single-phaseflow is to express the resistance of thefeature in terms of the equivalent length ofstraight pipe. In general the equivalentlength tends to be somewhat longer for twophase flows. In single-phase flow thevelocity profile is fully developed at amaximum of 10 - 12 pipe diameters downstreamof the feature. In two-phase flow thisdistance is greatly increased (by up to tentimes)13. Thus, pressure loss due to asudden contraction or enlargement can becalculated from
Collier 13 has presented a solutiondetermination of the less constant forphase pressure drop in fittings. Theconstant KE is composed of two parts
fortwoloss
Flow regime transition
Earlier research by Taitel et al. 14 statedthat the transition from bubble flow to slugflow occurs at a gas void fraction of about0.25 when turbulent forces are negligible.At higher flow rates, shear stress caus'ed byturbulence tends to break-up the largerbubbles, inhibiting transition to slug flowwhen void fraction exceeds the value of0.25. Taitel et al. 14 showed that even forsmall gas bubbles, the gas void fractioncannot exceed 0.52. This conclusion wasadapted from the fact that tightest packingof uniformly sized bubbles corresponds to avoid fraction of 0.52.
Furthermore, it is known that the shape of amoving gas bubble is viscosity dependent.In more viscous fluids the bubbles willassume more streamlined shapes. Increasedviscosity also reduces the axial interactionof the bubbles and hence the collisionfrequency is reduced. Grupping et al. 12found that in a Kelzan XC polymer solution,when bubbles collided, they did not alwayscoalesce to form larger slugs. It was alsoobserved that the existence of collars andtool joints caused both top and bottomfragmentation of already formed slugs. Thetransition values above do all refer to aNewtonian liquid phase. However, testresults with high-viscous liquids havereported void fractions up to 0.90 in whichbubble flow pattern still existed1S .
KE = [~ - 1] 2 + (1 - ee) 2
(15)
where
contraction coefficient (Ac/Al)enlargement coefficient (A2)area of contractionarea before (1) and after (2)the contraction
KE in Eq. (15) is obtained from single phaseconsiderations and is assumed to be validalso for two-phase flow. For the experimental well applied in this work KEdetermined from the single-phase flow tablepresented by Collier gives a value of 0.111for each contraction and 0.121 for eachenlargement, thus adding up to 0.232 foreach tool joint.
To include effects of restriction-geometry(very sharp edges) and the development oflarge-turbulence, the loss constant KE wasvaried between 0.23 and 0.6 in Eq. (14)during the fitting of estimated pressuregradients to measured ones.
530
In addition, the upward velocity of a singlebubble varies with its diameter. Thisimplies that different bubble sizes will bedistributed randomly in a fluid volume andthe theory of equally sized sphericalbubbles is not applicable.
These findings support the assumption thatthe void fraction at which transition toslug flow occurs, is very dependant onviscosity and turbulence. A gas kick indrilling mud (flowing past tool joints) willmost likely be on the form "dispersed bubbleflow" .
EXPERIMENTS
Experimental Set-up
The 550 ft experimental well at theUniversity of Texas at Austin (UT) ispermanently completed with a 9 5/8" casing.The well is equipped with two tubings, a5.90" x 5.43" outer tubing and a 2.5" x 2.0"inner tubing. A standard single wing treeis installed at the top. Eight pressuretransducers were installed inside the wellat the locations shown in Fig. 2. Thepressure transducers wiring was routedthrough the casinghead valve in specialsealing assembly.

SPE 23160 P. SKALLE, A.L. pODIa, J. TRONVOLL, R. TRYLAND 5
Liquid was pumped through a metering stationto the well by means of three centrifugalpumps, each with a capacity of 150 gpm. Airwas compressed to approximately 300 psig atthe surface by two compressors prior toinjection. The gas was then sent through ametering unit into the well. The surfaceequipment is shown in Fig. 3, and includesalso a separator and two 500 gal storagetanks.
To determine the empirical constants in Eq.(10); vg = Co Vm + Vt, the in situ velocityof the gas phase, Vg, was plotted againstthe mixture velocity Vm as shown in fig. 5.v m was calculated from the sum of recordedinput flow rates, while Vg was estimated inthe following way: The gas void fraction,Hg , is related to the superficial gasvelocity by the material balance consideration
In the experiments the pressure gradient wasmeasured and the void fraction estimated by
The plotted results are shown in Fig. 5 forcontinuous gas injection, assumed to bedispersed bubble flow.
Although (dp/dz) measured is dynamic,involving friction and acceleration loss,and (dp/dz) liquid is static and given thevalue 0.434 psi/ft, this gives a usefulestimation of Vg.
(1 )
(16)
or
Hg
= 1 _(dp/dzkeasured(dp/dzftiquid
H-~g -vg
The returning fluids at the wellhead wereconducted to the separator, and theindividual phases were separated by gravity.Adjusting the separator pressure made itpossible to exert additional pressure to thewell (Psurf) to simulate various depths.
Gas and liquid were injected through theinner tubing and the outer annulusrespectively. The two phases were mixed atthe tubing outlet downhole, and flowed tothe surface through the inner annulus, asillustrated by the arrows in Fig. 2.Pressure transducer no. 3 was located 180hydraulic diameters upstream, and this wasconsidered to be a sufficient mixing length.In addition, it was assumed that the gas andliquid phase would distribute homogeneouslyin the annulus due to the mixing caused bythe turbulence at the tool joints.
Significant well and fluid data during theexperiments are presented in Table 1. Themud rheology is given in Table 2.
Test Procedure and Data recording
Before starting a series of pressurerecordings, the flow situation wasstabilised by applying maximum liquid flowrate. The gas rate was then graduallyincreased to the intended value. Thepressure at each transducer in the well wasrecorded at constant gas rate starting at ahigh liquid rate which was graduallyreduced. The minimum gas rate was limitedby the well pressure.
Liquid flow rate was measured by two turbinemeters, calibrated by a mass flow meter to. 'cover both hlgh and low flow rates. The gasflow was recorded by a rotameter for lowflow rate measurements while an orificeplate metering row was used for high flowrates. Pressure data from the transducersin the well were recorded in a "DPI 420multitransducer pressure indicator". Allother data were constant for a given testand were thus recorded manually. A typicalpressure depth plot is shown in Fig. 4.
RESULTS
Recorded results
The results of the gas velocity measurementsand the pressure gradient calculations arepresented next.
A new series of tests involved the injectionof large slugs of air. It was possible todetect the top of the slugs by means ofsharp pressure changes just as they flowedpast a pressure trancducer.
Fig. 6 shows the test data for slugs (Taylorbubbles), though v g is measured at the topof the bubble. The average velocity isthought to be lower.
The dispersed bubble flow and slug flowtests in figs. (5) and (6) were curvefitted. Curve fitting of data from flowtest with water and air gave too low datareliability to be presented. The reason forpoor results were a) low test range and b)test methodology was not strict enough atthose tests. Flow tests with two differentmud rheologies gave the following result:
Dispersed bubble flow:
Viscosity 1 : Vg 1.19 Vm + 0,74 (17)
Viscosity 2 : Vg 1.19 Vm + 0,99 (18)
Slug flow:
Viscosity 1 : Vg 1.25 Vm + 2.45 (19)
viscosity 2 : vg 1.15 Vm + 2.45 (20)
The resulting values of Co. are in averageequal to 1.2, both for dispersed bubble flowand for slug flow. This is in very goodagreement with previsous presented resultson Co 9,lO,lS.
531

6 EXPERIMENTAL STUDY OF GAS RISE VELOCITY AND ITS EFFECT ON BOTTOM HOLE ... SPE 23160
The terminal rise velocity, Vt, is equal to0,74 and 0,99 ft/s for viscosity 1 and 2respectively in dispersed bubble flow, and2,45 ft/s for both muds in the slug flowregime.
The bubble rise velocities were alsocalculated by using Eqs. (11-13). For thebubble flow regime, Eq. (11) givesapproximately
Vt = 1.41 ~0.0981 . 65.0/104 . 3.281 =0.735 ft/sec
and Eq. (12) gives approximately
Vt = 1.53 ~0.0981 . 65.0/104 • 3.281 = 0.797 ft/sec
Thus, according to these values and theresult obtained from Fig. 5 (Eqs. (17) and(18», a terminal rise velocity of 0.75 ft/swas selected for later applications.
For slug flow regime, Eq. (13) yields anapproximate value of
VtT = [0.345 + 0.10 (2.50/5.43D "';32.2 . 5.43/12 = 1.49 ft/sec
and this value was applied as terminal slugrise velocity. From Fig. 6 (Eqs. (19) and(20» it can be seen that the top of thebubble has a higher velocity than 1.49ft/sec.
It was also investigated if the size of theslug could influence on the terminal traveltime. In one of the experiments the gasinjection volume was gradually increased,and the resulting slug velocity is presentedin fig. 7. From this figure it can be seenthat the top bubble travel time is varyingbetween 1.5 ft/s for small slugs and 2.5ft/s for large slugs. The capacity of theflow loop seems to be reached at a bubblesize of 110 scft.
Calculated pressure gradients
From all the pressure data points that weregathered, the measured bottom hole pressurewas compared to the calculated bottomholepressure. Pressure gradients were calculated in accordance with 8 of the previouslydiscussed correlations in addition to themodified correlation. In the modifiedcorrelation three modifications areincluded; a) the influence of higherpressure losses due to tool joints, b) theinfluence of later flow regime transitionand c) the hold up calculation is based onthe exact estimation of bubble risevelocity. To obtain a measure of theaccuracy of the investigated correlations astatistical analysis was performed. Theresults are given in table 3.
It should be mentioned that the observedpressure is recorded by pressure-transducerno. 1 (see Fig. 2). Thus, the experimental
532
well had a simulated depth of 504.64 ft, andthe calculated bottom hole pressure is theactual pressure at this location. Thesurface pressure is obtained by transducerno. 8, which is mounted at the annulus exit.
Results for four correlations, one from eachcategory, are presented graphically in Fig.8. All calculated pressures are lower thanrecorded pressure.
The modified correlation had several parameters which could be individually adjusted.
However, all parameter values were based onpublished expressions and own results.
Through a methodic variation of thetransition value it was found that thetransition from bubble flow to slug flowregime that best fitted calculated pressureto observed bottom hole pressure at a gasvoid fraction of 0.60 for the viscositiesused in the experiments.
PISCUSSION
The gas supply at the well bottom wasvarying due to fluctuations in thecompressor pressure. The resultingfluctuating in the average gas flow ratewas, nevertheless, negligible.
Liquid flow rate has been checked by a massflow meter. The calibration showed a ratedependent error, which revealed that theobtained volume flow-meter rates used forcomparison could involve errors up to 2.5%.
The measuring instruments do not involve anyconsiderable inaccuracies. The pressuretransducers have an error of ± 1% of fullscale.
General observations
The different correlations tested seem tohave some features in common. The onlyexception is the Beggs and Brill methodwhich is based upon flow pattern transitionsfor horizontal pipes.
All the correlations seem to underestimatethe bottom hole pressure to a variousextent. A proper explanation of thisbehaviour is difficult to find. MagcobarMud Manual16 proposes that the viscoelasticeffects of polymer fluids are important insudden changes of cross sectional area suchas tool joints and collars. The rapidchange in deformation to which the fluid issubjected causes an increase in the pressuregradient. This effect is not included inany of the original correlations and mightthus be one of the reasons for the highermeasured than predicted pressure.

SPE 23160 P. SKALLE, A.L. PODIO, J. TRONVOLL, R. TRYLAND 7
Another common behaviour is the fact thatmost of the correlations show a cleartendency to improve their accuracy withincreasing bottom hole pressure, isinteresting. This can also be seen by thesevere scatter of data points at low liquidand gas rates in Fig. 9. The estimated dataare obtained by using the Duns and Roscorrelation.
The discrepancy in the terminal risevelocities obtained from Fig. 6 is assumedto be mainly caused by considerable scatterin the rheological data of viscosity group2. The slightly higher viscosity in thesedata also caused an increased bubble risevelocity also as proposed by Grupping etal. 13 .
Frictional pressure drop
Calculated frictional pressure drop based onthree common rheological models resulted inconsiderable discrepancies between thethree. As can be seen from Fig. 10, theDodge and Metzner method gave surprisingly africtional pressure loss up to twice as highas the Bingham friction loss.
It is assumed that one reason for thesedifferences, is the encountered range of theflow behaviour index n due to the fact thatthe frictional pressure drop is dependent onthe flow behaviour index n. This has beenrevealed by experiments of Jensen andSharma18 . A common flow behaviour indexrange for mud is between 0.5 and 1.0 whilethe flow behaviour index in the polymer mudof this work are within 0.35 and 0.53 asdisplayed in Table 2.
Future studies
The two killing methods called Bull headingand Volumetric Method have up to now notbeen extensively studied on experimentalbasis. The laboratory equipment at theUniversity of Texas at Austin is well suitedfor such studies. Available computerprograms for two-phase downward flow are nowbeing tested and fitted for this purpose.
CONCLUSIONS
Full scale investigations of two-phase flow,through geometry and with fluid rheologiestypical for shallow drilling operations havebeen carried out. The results areconfirming earlier investigations, eventhough previous investigations mostly havebeen performed in small diameter pipes andwith Newtonian fluids.
For dispersed bubble flow the in situ gasvelocity can be estimated (in ft/sec.)through the empirical relationship
vg = 1,2 Vm + 0,75
533
The in situ velocity of a gas slug can beestimated through the equation
vg = 1,2 Vm + 1,5
The terminal velocity of 1.5 ft/sec was onlypartly confirmed since the experimental setup was only capable of recording themovement of the top interface of the gasslug.
As a result of the presented study, thefollowing conclusions can be drawn:
• Drilling underbalanced through a gasreservoir will result in a two-phasemixture of drilling mud and formationgas which have to be considered. Duringnormal kick conditions only thedispersed bubble flow pattern willprobably occur. This is due to atransition boundary between bubble andslug flow given by a gas void fractionof 0.6 (for the experimentalconfiguration) . This high transitionvoid fraction is caused by the turbulentforces exerted by the tool joints whichfragment the larger bubbles. Theviscosity of the drilling mud is alsoassumed to increase this transitionvalue.
• The simplified correlations of category1 (no-slip assumed and liquid holdup notconsidered) were found to be inadequatefor the flow conditions encounteredwhile drilling. The Hagedorn and Browncorrelation (from category 2) whichusually gives good over-all predictionresults, was also found to beinaccurate. This was caused by the latetransition from bubble flow behaviour toslug flow.
• Over the range of parameters covered bythe data, the best results were obtainedby using the Zuber and Findlay correlation for holdup estimation and themodified criteria to distinguish betweenbubble and slug flow. A very goodagreement have been achieved with astandard deviation of 2.9%.
• The Duns and-Ros method was found to bethe second most accurate correlation.The bottom hole pressures wereunderestimated with an mean error of 3.7% and a standard deviation of 2.8%.
• The frictional component does notcontribute more than maximum 5 percentto the total pressure gradient. Theaccelerational component is negligible.
• Tool joints and collars exert asignificant contribution to the frictional pressure loss. However, furtherresearch on the extension of singlephase theory to two-phase conditions,and also on the identification of the

8 EXPERIMENTAL STUDY OF GAS RISE VELOCITY AND ITS EFFECT ON BOTTOM HOLE SPE 23160
functional dependency of the transitionvoid fraction on viscosity, tool jointsand other parameters are necessary.
5. Fancher, G.H. jr. and Brown, K.E.:"Prediction of Pressure Gradients forMultiphase flow in TUbing", Soc. Pet.Eng. J., March 1963; 59-69
NOMENCLATURE
A cross sectional areaCo velocity profile factord diameterf friction factorg gravitational constantH hold up or void fractionKE geometry dependent energyp pressureq volumetric flow ratet timev velocityV S superficial velocityz vertical coordinate
loss constant
6.
7.
8.
Hagedorn, A.R. and Brown, K.E.: "Experimental Study of Pressure GradientsOccurring During Continuous Two-PhaseFlow in Small-Diameter VerticalConduits", J. of Pet. Tech., April 1965;475-484.
Duns, H. Jr. and Ros, N.C.J.: "VerticalFlow of Gas and Liquid Mixtures inWells", 6th World Pet. Congress Proc.,1963; 451-465.
Zuber, N. and Findley, J . A.: "AverageVolumetric Concentration in Two-PhaseFlow Systems", J. Heat Transfer 87; 453468.
E surface roughness
I.l. viscosityp density
t shear stress
<I> porosity
cr surface tension
Subscripts
a accelerationf frictionalg gas or gravitationali inner (diameter)L liquidm mixture (of water and gas)o outer (diameter)t terminalT Taylorw wall
REFERENCES
1. Beggs, H.D. and Brill, J.P.: "A Study ofTwo-Phase Flow in Inclined Pipes", J.Pet. Tech., May 1973; 607-617, TransAlME, 255.
2. Orkiszewski, J.: "Predicting Two-PhasePressure Drops in Vertical Pipes", J.Pet. Tech., June 1967; 829-838.
3. Poettmann, F.H. and Carpenter, P.G.:"The Multiphase Flow of Gas, Oil andWater Through Vertical Flow Strings withApplication to the Design of Gas-LiftInstallations", Drill. and Prod. Prac.,API 1952; 257-317.
4. Baxendell, P.B. and Thomas, R.: "TheCalculation of Pressure Gradients inHigh-Rate Flowing Wells", J. Pet. Tech.,May 1973; 607-617.
534
9. Hasan, A.R. and Kabir, C.S.: "PredictingLiquid Gradient in A Pumping WellAnnulus", SPE Prod. Eng., Feb. 1987.
10. Hasan, A.R.: "Two-Phase Up-Flow inVertical and Inclined Annuli",University of North Dakota, 1989.
11. Harmathy, T.Z.: "Velocity of Large Dropsand Bubbles in Media of Infinite orRestricted Extent", AIChE J. t, 1960;281.
12. Grupping, A.W., Hofland, J.P. andHermsen, F.J.: "Major fragmentation ofgas slugs caused by collars", Oil & GasJournal, Dec. 1986; 105-110.
13. Collier, J. G.: "Convecting Boiling andCondensation", McGraw-Hill Book Co.Inc., New York City, 1981.
14. Taitel, Y., Bornea, D. and Dukler, A.E.:"Modelling Flow Pattern Transitions ForSteady Upward Gas-Liquid Flow inVertical Tubes", AIChE J., May 1980;345-354.
15. Govier, G.W. and Aziz, K.: "The Flow ofComplex Mixtures in Pipes", Van NostrandReinhold, New York City, 1972.
16. Magcobar - Division Oilfield ProductsGroup: "Drilling Fluid EngineeringManual, Dresser Industries Inc.,Houston, Tx.
17. Dodge, D.G. and Metzner, A.B.:"Turbulent Flow of Non-NewtonianSystems", AlChE J. 5, 1959; 189.
18. Jensen, T. and Sharma, M.P.: "Analysisof Friction Factor and EquivalentDiameter Correlations for Annular Flowof Drilling Fluids", 10th Annu. ASMEEnergy-sources tech. conf., DrillingSymp. Proc., Dallas, Feb. 1987.

SPE 23160 P. SKALLE, A.L. PODIO, J. TRONVOLL, R. TRYLAND 9
Significant well and fluid data in-:::he experiment.
Predicted frictional pressure dropusing different models as afunction of liquid flow rate andgas flow rate.
Carpenter (Category I), Hagedorn &Brown (Category 2), Beggs & Brill(Category 3) and Modifiedcorrelation (Category 3) .
Error in bottomhole pressureprediction applying the Duns & Roscorrelation. The average error isa function of liquid and gas flowrate.
the ivestiCalculated
are compared
Overall results fromgated correlations.bottom hole pressureswith recorded.
The rheology of the water based mud(Kelzan XC) throughout the tests.The average rheology of "viscosityI-mud" and "viscosity 2-mud" were:PVl = 2 cP, YPI = 3 Ib/100 ft 2
PV2 = 3 cP, YP2 = 5,5 Ib/100ft2
Table 1
Fig. 9
Table 2
Fig. 10
Table 3
Geometry of the flow restrictions(tool joints) in the experimentalwell.
Schematic layout of fluid and gasflow system and surface operationaland control equipment.
Sketch showing the fluid flow pathand the pressure metering stationsno. 1 to 8 in the UT experimentalwell. The vertical distances aregiven in feet.
A typical pressure-depth plot forone of the two-phase flow tests.
Gas velocity for dispersed bubbleflow in water, mud 1 and mud 2.
Gas velocity for slug flow (Taylorbubble) in water, mud 1 and mud 2.
Stagnant gas slug velocity vs.injected bubble volume. Velocitywere calculated from travel time ofslug top from bottom of well topressure transducer no. 4, 5 and 7.
Predicted bottom pressure vs.measured pressure from fourselected correlations; Poettmann &
Fig. 2
Fig. 1
Fig. 3
Fig. 4
Fig. 5
Fig. 6
Fig. 7
Fig. 8
TABLE 1-SIGNIFICANT WELL AND FLUID DATA IN THE EXPERIMENT
Well Data Oilfield Units (OU) SI Units
Dwell
Dtubi
Dtubo
Psurf
Tsurf
!1T/!1z
E/d
Numb. of toolioints
550 ft
do : 2.50" di x 2.00"
do : 5.90" di x 5.43"
32.2 - 73.9 psia
75.00 F/ft
0.00 F/ft
0.0006
17
167.9 m
do : 63.5 mm di x 50.8 rom
do : 149.9 rom di x 137.9 rom
2.22 - 5.10 105 Pa
24.0 0 C
0.00 C/m
0.0006
17
Fluid Data
qL
qgsurf
PLPairstc
crair-mud
o - 128 gpm
o - 10818 scft/h
62.41b/ft3
0.0625 Ib/ft3
0.02 cP
65.0 dyn/cm
o - 8.074 10-3 m3 /s
o - 0.0851 m3/s
1000 kg/m3
1. 23 kg/m3
2.0 10-5 Pas
0.065 N/m
535
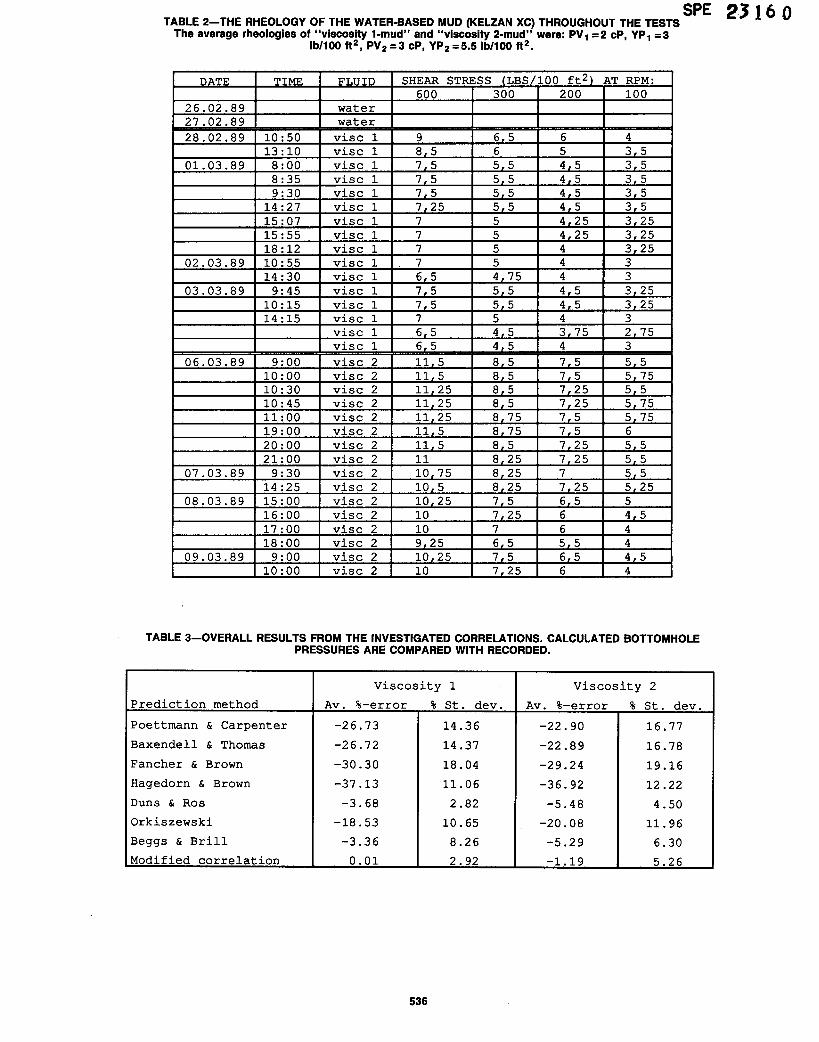
SPE 2.3160TABLE 2-THE RHEOLOGY OF THE WATER-BASED MUD (KELZAN XC) THROUGHOUT THE TESTS
The average rheologies of "viscosity 1-mud" and "viscosity 2-mud" were: PV 1 =2 cP, YP 1 =3Ib/100 ft2, PV2 =3 cP, YP 2 =5.5 Ib/100 ft2.
DATE TIME FLUID SHEAR STRESS (LBS/100 ft 2) AT RPM:600 300 200 100
26.02.89 water27.02.89 water28.02.89 10:50 vise 1 9 6 5 6 4
13:10 vise 1 8,5 6 5 3 501.03.89 8:00 vise 1 7,5 5 5 4 5 3 5
8:35 vise 1 7,5 5 5 4,5 3 59:30 vise 1 7,5 5,5 4 5 3 5
14:27 vise 1 7,25 5 5 4 5 3 515:07 vise 1 7 5 4 25 3 2515:55 vise 1 7 5 4 25 3 2518:12 vise 1 7 5 4 3 25
02.03.89 10:55 vise 1 7 5 4 314:30 vise 1 6,5 4,75 4 3
03.03.89 9:45 vise 1 7,5 5,5 4,5 3 2510:15 vise 1 7,5 5,5 4,5 3 2514:15 vise 1 7 5 4 3
vise 1 6,5 4 5 3 75 2 75vise 1 6 5 4,5 4 3
06.03.89 9:00 vise 2 11 5 8 5 7 5 5 510:00 vise 2 11 5 8 5 7 5 5 7510:30 vise 2 11 25 8,5 7,25 5 510:45 vise 2 11 25 8,5 7,25 5 7511 :00 vise 2 11 25 8,75 7,5 5,7519:00 vise 2 11 5 8,75 7 5 620:00 vise 2 11 5 8 5 7 25 5 521:00 vise 2 11 8,25 7,25 5 5
07.03.89 9:30 vise 2 10 75 8,25 7 5 514:25 vise 2 10 5 8,25 7,25 5 25
08.03.89 15:00 vise 2 10 25 7,5 6,5 516:00 vise 2 10 7,25 6 4,517:00 vise 2 10 7 6 418:00 vise 2 9 25 6,5 5,5 4
09.03.89 9:00 vise 2 10 25 7,5 6,5 4,510:00 vise 2 10 7,25 6 4
TABLE 3-0VERALL RESULTS FROM THE INVESTIGATED CORRELATIONS. CALCULATED BOTTOMHOLEPRESSURES ARE COMPARED WITH RECORDED.
Viscosity 1 Viscosity 2
Prediction method Av. %-error % St. dev. Av. %-error % St. dev.
Poettmann & Carpenter -26.73 14.36 -22.90 16.77
Baxendell & Thomas -26.72 14.37 -22.89 16.78
Fancher & Brown -30.30 18.04 -29.24 19.16
Hagedorn & Brown -37.13 11. 06 -36.92 12.22
Duns & Ros -3.68 2.82 -5.48 4.50
Orkiszewski -18.53 10.65 -20.08 11.96
Beggs & Brill -3.36 8.26 -5.29 6.30
Modified correlation 0.01 2.92 -1.19 5.26
536

GAS seE 2316 0
3.5"
Fig. 1-Geometry of the flow restrictions (tool Joints) in theexperimental well.
mSEPARAmR
--1 55.45 I
f155.7
~
55~2+
1299.55 f '.
1179.38 ~
t A
64.97
+
LIQUID
5.45":1 ••:1-
2. " •~ 1\
It 1/2
5.91"
~.....
Fig. 2-Sketch showing the fluid-flow path and the pressure metering stations Nos. 1 to 8In the UT experimental well. The vertical distances are given In feet.

652 3 4Vrn ( ft/s )
I WiiT8i' J8 i i
7
6
SPE 23160
.-51'1}
~4...--3~
;> 26CBCB
computerplotters
liqUidstoragetank
printer
large small compressorcompressor
separator
I.YOI"~
volumetank
meter
turbinemeter
the well
UICo)co
Fig. 3-Schematic layout of fluid and gas flow system and surface operationaland control equipment.
"'~ -- Qg =1185scf/h
~~ Qg =2310scf/h
'\
~"."1'.." f'....
0
·100
-200 ----.c·300 -a.
CD-400 C
-500
o 100 200·600
300
Pressure(psia)
Fig. 4-A typical pressure-depth plot for one of the twophase flow tests.

I y = 1,6784 + 2,2691 x R;;-U;4fl)
10
8
~ 1 II
C:::6lEI
-'
:4;;;i>
2
00 234
Vm (ft/s)5 6
SPE 23160
~ = 2,4518 + 1,2565x R - 0,921
15010050o
2
5-4~
III 0-7.!!='- • 0-5Cl
..:! • 0-4I/)
>
3
65234Vm (ft/s)
IViscosity 1 I10
8
---~ 6......,
UI.a 4
wCD
<I.l
i>2
00
VOL bubble (set)
Fig. 7-Stagnant gas slug velocity vs. injected bubblevolume. Velocity was calculated from travel timeot slug top from bottom of well to pressuretransducers Nos. 4, 5, and 7.
Fig. 6-Gas velocity for slug flow (Taylor bubble) Inwater, Muds 1 and 2.

SPE 231605.'0 r-L--------------1
0.00
70.00 1< [, , """" i , , , , i ' , , , , , , , , , , i , , , , , I70.00 120.00 170.00 220.00
Measured Pressure (psia)
o ••.
.o
160.00
..............
'..~......
..
...a •
-2O·~go ' ,.;a,ho' ," 'so.bo" '[,'20:00" ,, IQ-liquid (gpm)
0.00
-15.00
...~ -10.00
UJ
"'" -5.00!&
5.00 J ,
,...~ -5.00'-'...e... -10.00
I.U
-15,00
...0 ...• lD
o.
,p
~ .
•
e
... ".
.....
PRESSURE PREDICTIONModified Correlati·on - Viscosity
250.00
50.00 ¥:,"" i , , i , , , , , , , , , i , , , , , [ , , , i , , , , , , , , , , , I50.00 100.00 150.00 200.00 250.00
Measured Pressure (psia)
~OO. A
PRESSURE PREDICTIONHageaorn de Brown - Viscosity
----o';;j0
'-'200.00
'I)..:lg)g)
V 150.00..a.."'CV....0100.00
"UV..
a..•,p
•ee.o
...lD
. ......
PRESSURE PREDICTIONBeggs & Brill - V:scosity
PRESSURE PREDICTIONPoettmann & Carpenter - \.r.scosity
1 /1(1)...:l~ 170.00(1)...a."'C
2120.00.~"'C
~a.
---...o'iii 220.000-
'-"
8
-20'~.&i' 2oocl.0i3 4080.00 6ll&1.'OD 80&1:0010000.oil2OOb.00(scft/h)
Fig. 9-Error in bottomhole pressure prediction applying the Dunsand Ros correlation. The average error is a function ofliqUid and gas flow rates.
U1Lf Dod9. and lAettnoru...s.aJI Genlf"Ol Flower Low= Singh'''' Plastie
5.00 j Z
g,.00o
:;:;u;t 0.00 1"" "",,,,, '" " "'" ,,,,,,,,,,,,,,,,,,,,,,,'" '"'''''''' d
0.00 20.00 40.00 60.00 eo.OO 100.00 120.00 140.00Q - liquid (gpm)
Fig. 10-Predicted frictional pressure drop using different modelsas a function of liquid flow rate and gas flow rate.
;-..
'iii~4.000.e°3.00Q)...:l(/l
~2.00...Q..
~:240.000 .. ---...
.Q 0.0
~210"00 ~."III ..
"a. " " "'-" ".". ." . "V .5190.00
... ..."". :l
III 0 rIl ~ u{.III IIIV V.. .. ...a.. " a..
] 140.00... "U 160,00
" • V
~/0..... 0
.....~ u %"U 0'" "'CV . V... ...a.. a..
90.00140.00 190.00 240.00 110.00 "
160".00 210.00 260.90.00 110.00Measured Pressure (psia) Measured Pressure (psia)
Fig. 8-Predlcted bottom pressure vs. measured pressure from four selected correlations: Poettman and Carpenter(Category 1), Hagedorn and Brown (Category 2), Beggs and Brill (Category 3), and modified correlation(Category 3).