velocity versus time outline instantaneous velocity getting velocity from the position graph
TRANSCRIPT
Velocity versus Time
Outline
• Instantaneous Velocity
• Getting Velocity from the Position Graph
QQ20: Draw
Example
A rock is dropped straight down from a bridge and steadily speeds up as it falls. Draw the position versus time graph, as well as the associated velocity versus time graph. Think carefully about the signs!Ignore air resistance.

Answer QQ20
Answer
Turning Points
Turning Points
• When graphing, there are important points that can help you to quickly show the character of a curve
• The point at which the position versus time graph goes from heading in one direction to heading in another is a turning point
• A turning point on the position versus time graph is associated with a zero-crossing point on the velocity versus time graph
If you have a turning point at 5 seconds, you have a zero-crossing point at 5 seconds
If you have a turning point at 5 seconds, you have a zero-crossing point at 5 seconds
QQ21: smoot
h curve
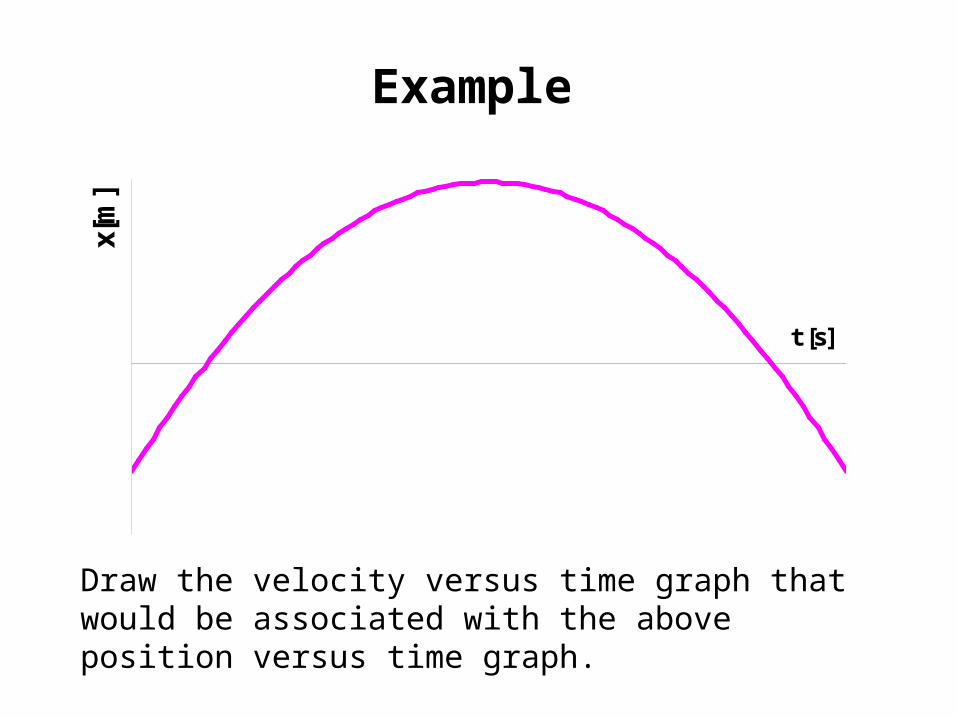
Example
t [s]
x[m
]
Draw the velocity versus time graph that would be associated with the above position versus time graph.

Answer QQ21
Answer
Constant Acceleration
Outline
• Going from Velocity to Position
• Acceleration versus Time
• Getting Acceleration from the Velocity Graph
Position from Velocity
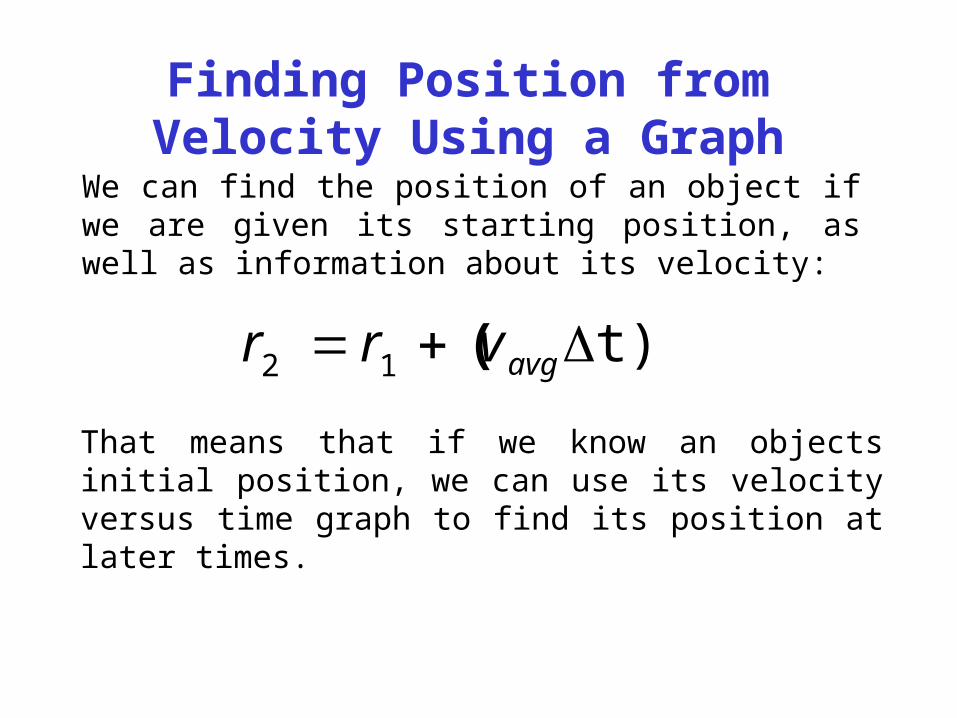
Finding Position from Velocity Using a Graph
t)12 avgvrr
(
We can find the position of an object if we are given its starting position, as well as information about its velocity:
That means that if we know an objects initial position, we can use its velocity versus time graph to find its position at later times.
v [
m/s
]
t [s]
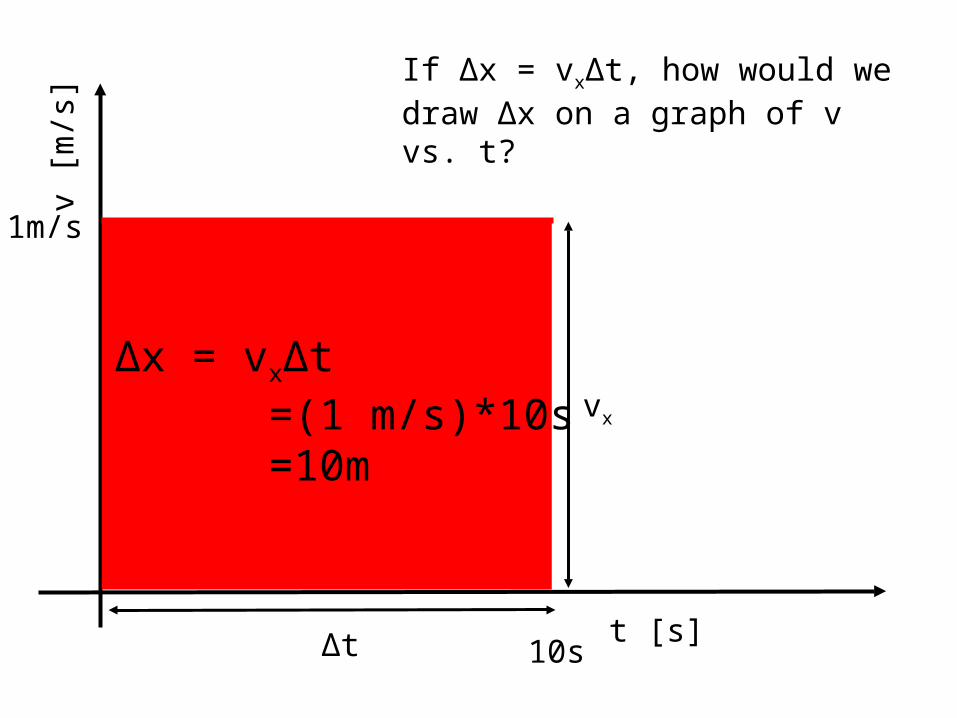
If Δx = vxΔt, how would we draw Δx on a graph of v vs. t?
vx
Δt
Δx = vxΔt =(1 m/s)*10s =10m
10s
1m/s
v [
m/s
]
t [s]
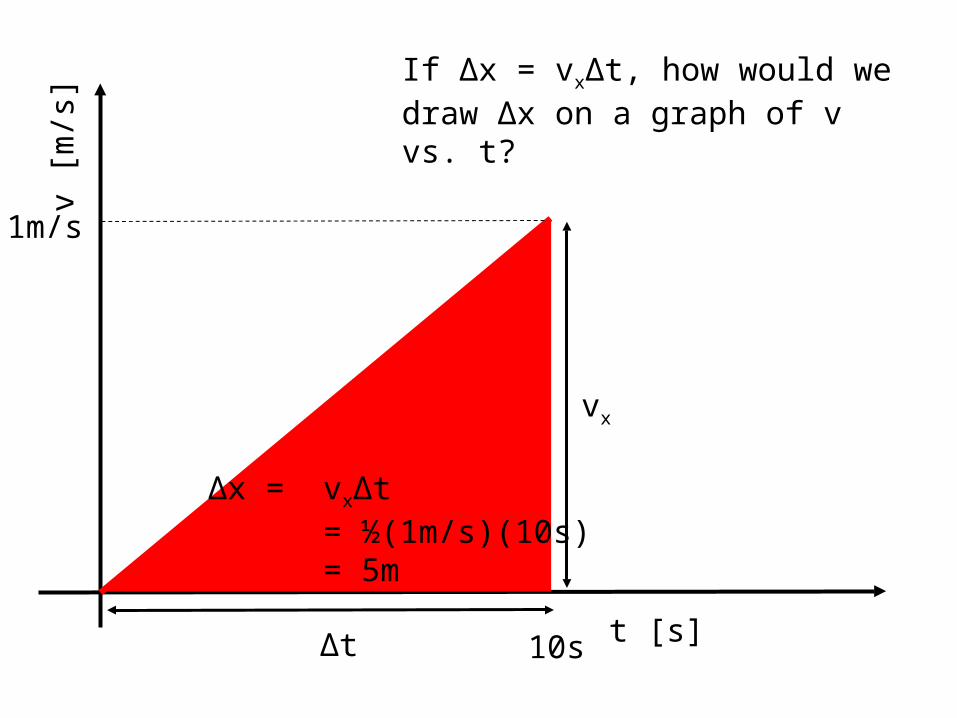
If Δx = vxΔt, how would we draw Δx on a graph of v vs. t?
vx
Δt
Δx = ½vxΔt = ½(1m/s)(10s) = 5m
1m/s
10s
Ex. Finding Velocity
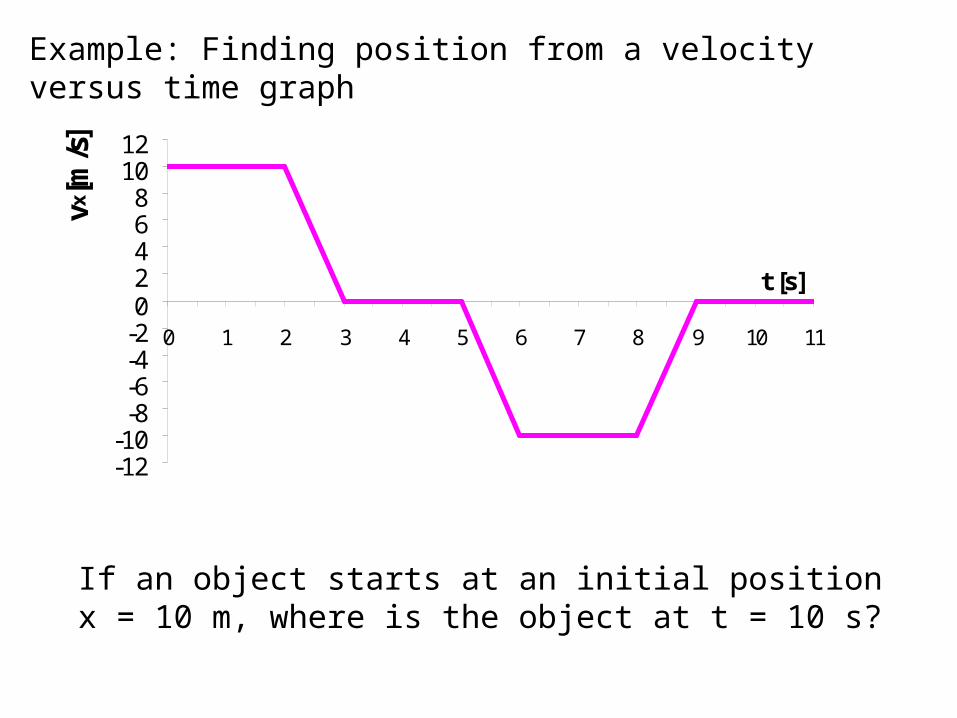
Example: Finding position from a velocity versus time graph
If an object starts at an initial position x = 10 m, where is the object at t = 10 s?
-12-10-8-6-4-202468
1012
0 1 2 3 4 5 6 7 8 9 10 11
t [s]
vx[m
/s]
Ex. Finding Velocity
-12-10-8-6-4-202468
1012
0 1 2 3 4 5 6 7 8 9 10 11
t [s]
vx[m
/s]
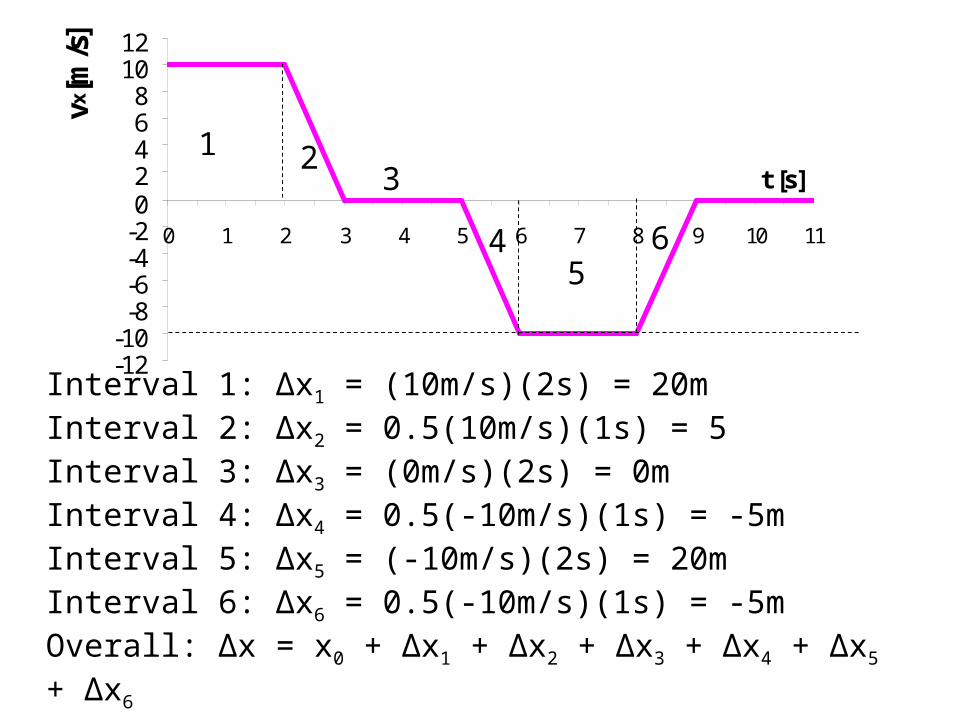
Interval 1: Δx1 = (10m/s)(2s) = 20mInterval 2: Δx2 = 0.5(10m/s)(1s) = 5Interval 3: Δx3 = (0m/s)(2s) = 0mInterval 4: Δx4 = 0.5(-10m/s)(1s) = -5mInterval 5: Δx5 = (-10m/s)(2s) = 20mInterval 6: Δx6 = 0.5(-10m/s)(1s) = -5mOverall: Δx = x0 + Δx1 + Δx2 + Δx3 + Δx4 + Δx5 + Δx6
= 10m + 20m + 5m + 0m – 5m + 20m – 5m
= 5m
1 23
45
6
QQ22: Find
Velocity
Example
-20
-15
-10
-5
0
5
10
15
0 1 2 3 4 5 6 7 8 9 10 11
t [s]
vx[m
/s]
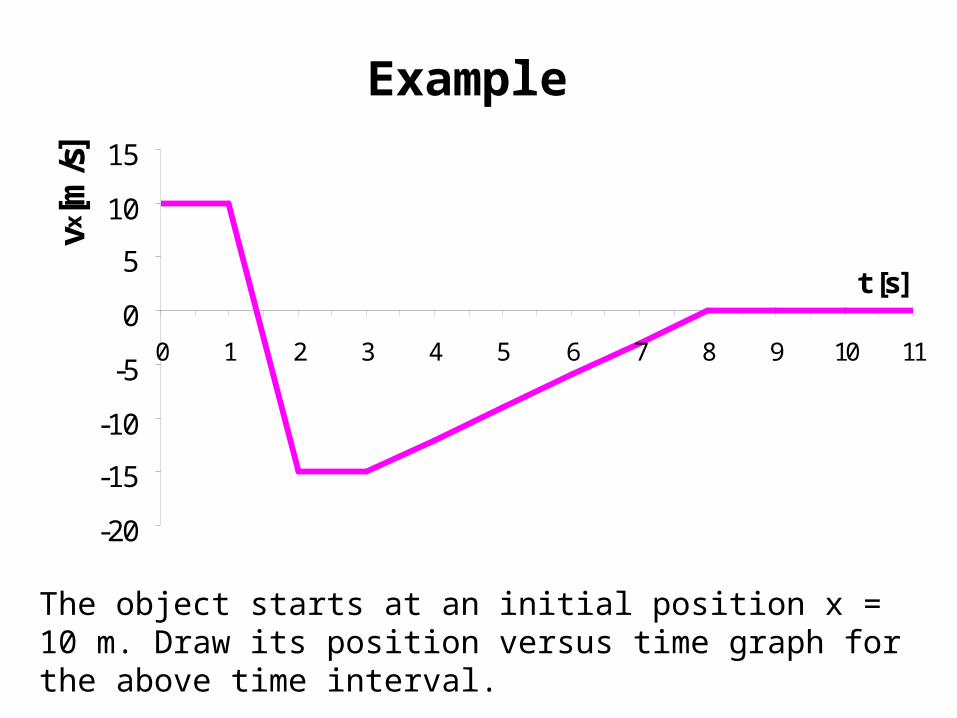
The object starts at an initial position x = 10 m. Draw its position versus time graph for the above time interval.
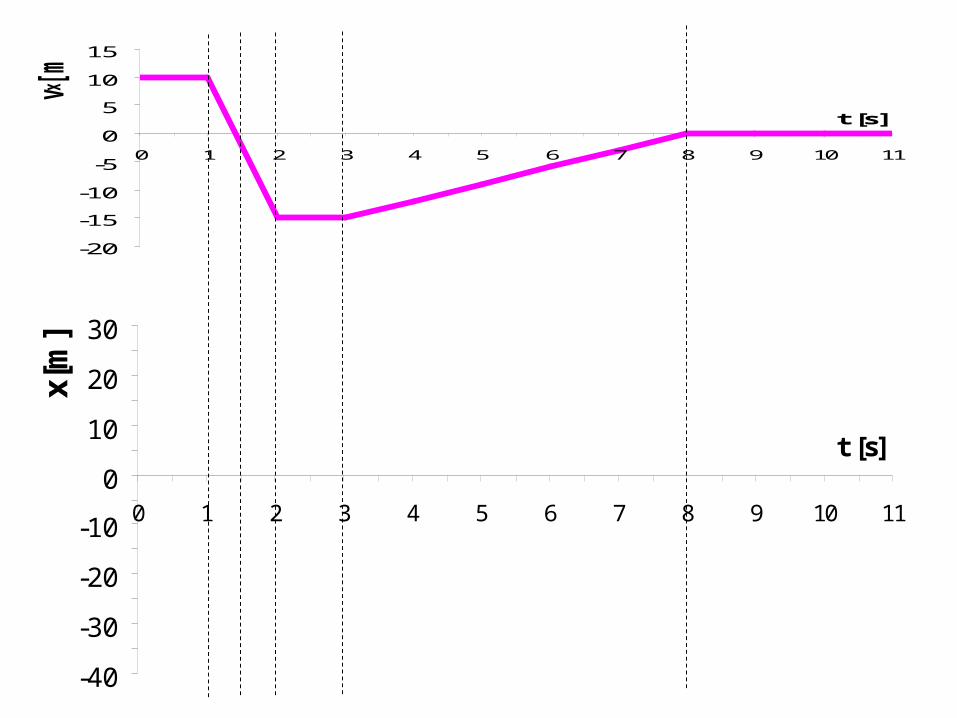
Answer QQ22
-20
-15
-10
-5
0
5
10
15
0 1 2 3 4 5 6 7 8 9 10 11
t [s]
vx[m
/s]
-40
-30
-20
-10
0
10
20
30
0 1 2 3 4 5 6 7 8 9 10 11
t [s]
x[m
]
Do for next class:
• Read: sections 2.5, 2.6
• Suggested problems: 2.13, 2.19 (no calculator: use
g=10m/s2)