expectancy-value in the enrollment factor of …
TRANSCRIPT

University of Kentucky University of Kentucky
UKnowledge UKnowledge
Theses and Dissertations--Community & Leadership Development Community & Leadership Development
2016
EXPECTANCY-VALUE IN THE ENROLLMENT FACTOR OF EXPECTANCY-VALUE IN THE ENROLLMENT FACTOR OF
AGRICULTURAL EDUCATION YOUTH AGRICULTURAL EDUCATION YOUTH
Morgan Schafbuch University of Kentucky, [email protected] Digital Object Identifier: https://doi.org/10.13023/ETD.2016.518
Right click to open a feedback form in a new tab to let us know how this document benefits you. Right click to open a feedback form in a new tab to let us know how this document benefits you.
Recommended Citation Recommended Citation Schafbuch, Morgan, "EXPECTANCY-VALUE IN THE ENROLLMENT FACTOR OF AGRICULTURAL EDUCATION YOUTH" (2016). Theses and Dissertations--Community & Leadership Development. 29. https://uknowledge.uky.edu/cld_etds/29
This Master's Thesis is brought to you for free and open access by the Community & Leadership Development at UKnowledge. It has been accepted for inclusion in Theses and Dissertations--Community & Leadership Development by an authorized administrator of UKnowledge. For more information, please contact [email protected].

STUDENT AGREEMENT: STUDENT AGREEMENT:
I represent that my thesis or dissertation and abstract are my original work. Proper attribution
has been given to all outside sources. I understand that I am solely responsible for obtaining
any needed copyright permissions. I have obtained needed written permission statement(s)
from the owner(s) of each third-party copyrighted matter to be included in my work, allowing
electronic distribution (if such use is not permitted by the fair use doctrine) which will be
submitted to UKnowledge as Additional File.
I hereby grant to The University of Kentucky and its agents the irrevocable, non-exclusive, and
royalty-free license to archive and make accessible my work in whole or in part in all forms of
media, now or hereafter known. I agree that the document mentioned above may be made
available immediately for worldwide access unless an embargo applies.
I retain all other ownership rights to the copyright of my work. I also retain the right to use in
future works (such as articles or books) all or part of my work. I understand that I am free to
register the copyright to my work.
REVIEW, APPROVAL AND ACCEPTANCE REVIEW, APPROVAL AND ACCEPTANCE
The document mentioned above has been reviewed and accepted by the student’s advisor, on
behalf of the advisory committee, and by the Director of Graduate Studies (DGS), on behalf of
the program; we verify that this is the final, approved version of the student’s thesis including all
changes required by the advisory committee. The undersigned agree to abide by the statements
above.
Morgan Schafbuch, Student
Dr. Stacy K. Vincent, Major Professor
Dr. Patricia H. Dyk, Director of Graduate Studies

EXPECTANCY-VALUE IN THE ENROLLMENT FACTORS OF AGRICULTURAL EDUCATION YOUTH
THESIS
A thesis submitted in partial fulfillment of the requirements for the degree of Master of Science in the
College of Agriculture, Food and Environment at the University of Kentucky
By
Morgan Lynn Schafbuch
Lexington, Kentucky
Director: Dr. Stacy K. Vincent, Assisstant Professor
Lexington, Kentucky
2016

ABSTRACT OF THESIS
EXPECTANCY-VALUE IN THE ENROLLMENT FACTORS OF AGRICULTURAL EDUCATION YOUTH
This quantitative study considers the motivating factors for enrollment in secondary agricultural education courses from students whose home background is not from a farm. This study utilizes expectancy-value theory, and looks at students (n=211) from different agricultural backgrounds and the impact on their ability beliefs, expectancies for success, and usefulness, importance, and interest for enrollment in agricultural education courses. The results indicate that students who have no affiliation to a farm have the highest ability beliefs and expectancies for success towards agricultural education in relation to students who are from traditional agricultural backgrounds.
KEYWORDS: Expectancy-value, agricultural education, non-traditional
Morgan Schafbuch
December 12, 2016

EXPECTANCY-VALUE IN THE ENROLLMENT FACTORS OF AGRICULTURAL By
Morgan Lynn Schafbuch

iii
ACKNOWLEDGEMENTS
The following thesis would not be possible without the guidance, support, and
direction from several different people. First, I wish to extend thanks to my thesis chair
and graduate advisor, Dr. Stacy Vincent. Dr. Vincent has provided tremendous levels of
support through feedback, guidance, direction, and suggestions. I am truly grateful for
Dr. Vincent’s mentorship during the thesis process. Next, I would like to thank the
additional members on my thesis committee: Dr. Kenneth Jones and Dr. Ellen Usher.
Both individuals provided insights in respect to their academic disciplines that
strengthened my thesis and challenged my thinking.
In addition to my academic support, I have received instrumental encouragement
from my family. First, to my parents, Darrell and Tracy Schafbuch, for always believing
in me and supporting my goals and decisions, no matter where they may take me. Tyler,
for his patience, encouragement, and gracious understanding, and for being the support I
needed to reach this accomplishment. I am also grateful for my grandparents, John and
Judy VanBuren and Marilyn Schafbuch for their love and constant encouragement during
the past two years. My colleagues, Tiffany, Courtney, and Alex deserve thanks, as well,
for their feedback and good conversations. Lastly, I wish to extend thanks to the
administration, teachers, and students for their contribution to the study. Their
participation has paved a path for the advancement of agricultural education in the United
States.

iv
TABLE OF CONTENTS
Acknowledgements………………………………………………………………………iii
List of Tables……………………………………………………………………………..vi
List of Figures……………………………………………………………………………vii
Chapter One: Introduction Background and Setting….………………………………………………………..1 Need for the Study……………………………………………………...................3 Purpose of the Study.……………………………………………………………...3 Research Questions.………………..……………………………………………...4 Theoretical Framework……………………………………………………………4 Definition of Terms………………………………………………………………..5
Chapter Two: Literature Review Introduction………………………………….…………………………………….8 Theoretical Framework……………………………………………………………9 Expectancy-Value Theory in Education…...…………………………………….12 Expectancy-Value Theory in CTE…………………………………...…………..12 Expectancy-Value Theory in Agricultural Education……………………………13 Summary…………………………………………………………………………14
Chapter Three: Methodology Participants………………………...………………………………….………….16 Research Questions ……………………………………………………………...16 Research Design…………………………..………………………………….…..17 Research Setting………………………………………………………………….18 Instrumentation…………………………………………………………………..19
Validity and Reliability…………………………………………………..21 Data Analysis…………………………………………………………………….21
Chapter Four: Results Research Questions………………..…………………………………………….23 Findings………………………………………………………………………….23
Chapter Five: Conclusions and Recommendations Summary of Research with Conclusions, Implications, Recommendations, and Recommendations for Further Research…………………………………………35 Implications for Expectancy-Value Theory……………………………………...41 Recommendations for Future Research………………………………………….42 Limitations……………………………………………………………………….44 Discussion………………………………………………………………………..44

v
Appendices Appendix A: IRB Approval……………………………………………………...47 Appendix B: Principal Consent………………………………………………….48 Appendix C: JCTC Board Approval……………………………………………..49 Appendix D: Assent Form……………………………………………………….50 Appendix E: Parent Consent Form………………………………………………52 Appendix F: Consent Form………………………………………………………54 Appendix G: Survey Instrument………………………………………………....56
References………………………………………………………………………………..62
Vita………………………………………………………………….……………………66
vi
LIST OF TABLES
Table 3.1 Ability Beliefs Items…………………………………………………………..19 Table 3.2 Expectancy Items……………………………………………………………...19 Table 3.3 Usefulness, Importance, and Interest Items…………………………………...20 Table 3.4 Student Questions………………..…………………………………………....20 Table 4.1 Grade Level in Affiliation to Home Residency in Relation to a Farm………..24 Table 4.2 Sex in Affiliation to Home Residency in Relation to a Farm………………....25 Table 4.3 Agriculture Pathway in Affiliation to Home Residency in Relation to a Farm.26 Table 4.4 Ability Belief Items…………………………………………………...……....27 Table 4.5 Expectancies for Success…….……………………………………………..…28 Table 4.6 Usefulness, Interest, and Importance Items………………...............................28 Table 4.7 Differences in Ability Beliefs…………………………………………...…….29 Table 4.8 Independent t-test on Ability Beliefs………………………………….………30 Table 4.9 Differences in Expectancies for Success……………………………………...31 Table 4.10 Independent t-tests on Expectancies for Success…………………………….32 Table 4.11 Differences in Usefulness, Importance, and Interest………………..……….33 Table 4.12 Independent t-tests in Usefulness, Importance, and Interest ………...……...34

vii
LIST OF FIGURES
Figure 1.1 FFA Student Membership…………………………………………………2 Figure 2.1 Eccles, Wigfield, and colleagues’ expectancy-value model of achievement motivation (1983)…………………………………………………………………….10
1
CHAPTER 1 INTRODUCTION
Background and Setting
Agricultural education experienced peak enrollments during the 1970s; however,
the farm crisis of the 1980s led to a decline enrollment in FFA (previously called Future
Farmers of America, now referred to as the National FFA Organization) student
membership by up to 60% (Dyer & Osborne, 1994). While numbers in FFA and
agricultural education enrollment have increased again, research has shown that numbers
in agricultural education and FFA involvement are dependent on the perceived steadiness
of the agriculture industry, the image of agriculture, and the student’s perceived value of
agricultural education (Breja & Dyer, 1999; Hoover & Scanlon, 1991). During the same
time as the farm crisis of the 80s and dwindling numbers in FFA, “A Nation at Risk”
(United States, 1983) called for students to take more academic based classes and did not
place emphasis on career and technical education classes. In response, agricultural
education professionals responded to “A Nation at Risk.” The National Council for
Agricultural Education was formed and as a result, course offerings in agriculture
changed. New classes were offered such as Food Science, Animal Welfare,
Environmental Science, and Aquaculture. Vocational agriculture was modified to a more
scientific based agriculture, and as a result, enrollment numbers increased and FFA
membership is at an all-time high (Case & Cloud, 2007).
At the turn of the 21st century, Igo and White (1999) anticipated the future image
of a typical FFA member would be different than in the past. Igo and White went on to
describe FFA members as more urban than rural, and few would have direct, production
farming backgrounds, and as a result, it is expected that food production will need to be
2
dramatically increased by 2050 to feed the world’s anticipated population (Godfray et al.,
2010). Enrollment in agricultural education courses is rising; meanwhile, fewer children
are being raised on farms (Retallick & Martin, 2008). A study conducted by Reis and
Kahler (1997) focused on influencing factors of enrollment in agricultural education, but
did not focus on traditional verse non-traditional agriculture students and their reasons for
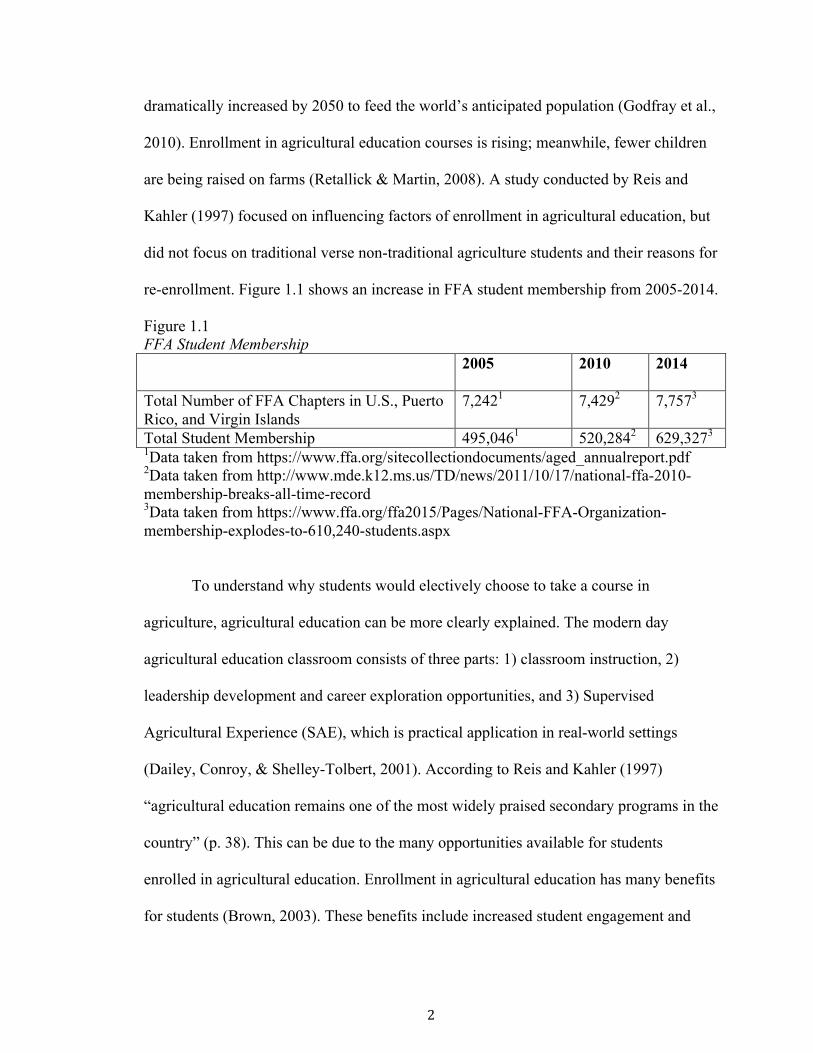
re-enrollment. Figure 1.1 shows an increase in FFA student membership from 2005-2014.
Figure 1.1 FFA Student Membership
2005 2010 2014
Total Number of FFA Chapters in U.S., Puerto Rico, and Virgin Islands
7,2421 7,4292 7,7573
Total Student Membership 495,0461 520,2842 629,3273
1Data taken from https://www.ffa.org/sitecollectiondocuments/aged_annualreport.pdf 2Data taken from http://www.mde.k12.ms.us/TD/news/2011/10/17/national-ffa-2010-membership-breaks-all-time-record 3Data taken from https://www.ffa.org/ffa2015/Pages/National-FFA-Organization-membership-explodes-to-610,240-students.aspx
To understand why students would electively choose to take a course in
agriculture, agricultural education can be more clearly explained. The modern day
agricultural education classroom consists of three parts: 1) classroom instruction, 2)
leadership development and career exploration opportunities, and 3) Supervised
Agricultural Experience (SAE), which is practical application in real-world settings
(Dailey, Conroy, & Shelley-Tolbert, 2001). According to Reis and Kahler (1997)
“agricultural education remains one of the most widely praised secondary programs in the
country” (p. 38). This can be due to the many opportunities available for students
enrolled in agricultural education. Enrollment in agricultural education has many benefits
for students (Brown, 2003). These benefits include increased student engagement and
3
retention, hands-on activities with knowledge application, adult mentorships, and
learning transferrable skills to the workplace (Brown, 2003; Cohen & Besharov, 2002).
Need for the Study
This study will help answer why students who are from non-traditional agriculture
backgrounds enroll in secondary agriculture courses. For the purpose of this study, non-
traditional agriculture education students are students who either have no affiliation to a
farm or have parents who own a farm, but do not live on one. A traditional agriculture
student is defined as living or working on a farm. The mission of the National FFA
Organization states, “FFA makes a positive difference in the lives of students by
developing their potential for premier leadership, personal growth and career success
through agricultural education” (National FFA, 2016). The mission statement of the
organization affiliated with agricultural education allows for a well-rounded educational
experience that is not limited only to farm kids and allows for a plethora of opportunities
for non-traditional agriculture students to find a place in agriculture.
Purpose of the Study
The purpose of this study is first, to determine the level of ability, expectancy, and
interest, importance, and usefulness students with no affiliation to a farm find in
agriculture courses when being compared against their peers from more traditional
agriculture backgrounds. The study also determined what kept students enrolled and
interested in agriculture and considered the values students place on elective agriculture
courses and what students expected to get out of such courses.
4
Research Questions
The guiding research questions for this quantitative study were:
RQ1: What are the characteristics [sex, grade, affiliation to a farm (live on a farm,
work on a farm, parents own a farm but do not live on one, no affiliation to a
farm), and agriculture pathway] of the student participants?
RQ2: What are the ability beliefs of the student participants?
RQ3: What are the expectancies for success of the student participants
RQ4: What are the differences of usefulness, importance, and interest levels of the
student participants?
RQ5: What are the differences in ability beliefs by the participants’ affiliation to a
farm (traditional v non-traditional)?
RQ6: What are the differences in expectancies for success by the participants’
affiliation to a farm (traditional v non-traditional)?
RQ7: What are the differences in usefulness, importance, and interest levels by
the participants’ affiliation to a farm (traditional v non-tradional)?
Theoretical Framework
Expectancy-value theory is based on the concept that choice, persistence, and
performance can be explained by an individual’s beliefs about his or her competency and
value towards a particular activity (Wigfield & Eccles, 2000). Wigfield and Eccles (2000)
explain that the expectancies and values possessed by an individual directly impacts the
performance, effort, and persistence he or she places on a goal. “Expectancies and values
are assumed to be influenced by task-specific beliefs such as ability beliefs, the perceived
difficulty of different tasks, and individuals’ goals, self-schema, and affective memories”
5
(Wigfield & Eccles, 2000, p. 69). Expectancies and task values are the two main
constructs that come together to form expectancy-value theory, a motivational theory that
combines the values on a goal and the expectancies for success (Wigfield & Eccles,
2000).
There are four main constructs of task value that comprise this portion of the
theory. The constructs are attainment value - the personal importance of doing well on a
given task (Wigfield & Eccles, 2000), intrinsic value - the enjoyment or perceived
enjoyment of a task (Wigfield & Eccles, 2000), and utility value – the usefulness of and
how a task fits into an individual’s plans for the future (Wigfield & Eccles, 2000). Of
attainment value, intrinsic value, and utility value, utility value is the most extrinsic. Most
likely, the individual will be committed to a particular task in the efforts of reaching a
sought after ending, rather than for the sake of merely completing it (Wigfield & Eccles,
2000). Lastly there is perceived cost, which can be defined as an individual’s evaluation
of the emotional cost, perceived effort, and time constraints spent on the activity or task
versus another activity (Wigfield & Eccles, 2000).
From the constructs of expectancy-value theory, two main questions are created.
Expectancies formulate the question “Will I do well on this task?” (Eccles, 2009). Task
value formulates “Why should I do this task?” (Eccles, 2009).
Definition of Terms
Agricultural Education – Modern day agricultural education is comprised of three
dependent variables commonly known as 1) classroom instruction, 2) leadership
activities, and 3) experiential learning (Dailey, Conroy, & Shelley-Tolbert, 2001).

6
Agriculture Pathway – A set of course offerings in a particular area which provide
knowledge and skills pertaining to the specific career area, with seven total career
pathways being related to agriculture (Slusher, Robinson, & Edwards, 2011).
Career and Technical Education – Set of courses which prepare students with
college and career readiness, such as skills regarding job-specific, technical, and
academic skills (ACTE, 2015).
FFA – In the three-circle model of agricultural education, the National FFA
Organization (previously called Future Farmers of America, commonly known as FFA) is
the leadership portion for secondary students enrolled in agriculture (Talbert &
Balschweid, 2004). The National FFA organization lists the components of FFA as
premier leadership, personal growth, and career success through engagement in FFA
(National FFA Organization, 2016).
Non-traditional agriculture student – Any student not raised on a farm or has
parents who own a farm, but the student does not live on one.
Rural – Rural “encompasses all population, housing, and territory not included
within an urban area” (United States Census Bureau, 2015), and comprises areas of open
country or settlements with less than 2,500 residents (USDA Economic Research Service,
2015).
SAE – A supervised agricultural experience provides experiential activities for
students to learn more about agriculture and gain skills necessary for future agriculturally
related careers (Moore & Flowers, 1993).
Traditional agriculture student – Any student living on- or working on a farm.

7
Urban – A densely populated area with designated space for residential,
commercial, and recreational land use (United States Census Bureau, 2015), comprising
of more than 2,500 residents (USDA Economic Research Service, 2015).

8
CHAPTER 2
REVIEW OF THE LITERATURE
A simple Google search of “why do we need agricultural education” led me to the
following speech given in 2010 at the 83rd National FFA Convention by United States
Secretary of Education Arne Duncan. His remarks regarding the importance of
agricultural education include the following:
“And finally, look behind me. You will see the outstanding students from the
Chicago High School for the Agricultural Sciences who just introduced me. I’ve
been to their school many times, and I loved those visits. It is an amazing school.
I remember when a calf was born there. It is one of the ten largest FFA chapters in
the nation. Every day, the Chicago Ag School refutes the myth that agricultural
education is just for rural students. Every day, the school dispels the
misconception that agricultural education is a relic with little relevance in the
information age. Every day, their school illustrates the power of rigorous
agricultural education to engage students and transform lives and communities.
My message to you today is simple. We need you. Our nation needs your skills
and talents to compete and prosper in the global economy…I am not sure if most
Americans realize that agriculture is the biggest employer in the nation. Twenty-
one million Americans, or 20 percent of the U.S. workforce, work in the
agricultural sector. And the agricultural sector is growing despite the economic
downturn. The math here is simple. For the U.S. economy to continue to rebound
and grow, America’s biggest employer has to help lead the way. That can only
happen if FFA members—and all students in agricultural education—get a first-

9
rate education that genuinely prepares them for careers and college and readies
them to compete in the global economy” (U.S. Department of Education, 2010).
The remarks given by Mr. Duncan describe the importance of agricultural
education beyond rural communities and students raised in an agriculture setting. He also
expresses how both rural and urban students alike have a large void to fill with the future
of agriculture and the changing scope of production of food, fiber, and natural resources.
The theory that frames the groundwork for this research is expectancy-value theory,
which helps guide the answers to the question of why non-traditional agriculture students
are interested in enrolling in agricultural education courses at the secondary level.
Theoretical Framework
Expectancy-value theory, a motivational theory that connects values placed on a
goal and the expectancies for success, is formed by two main constructs - expectancies
and task values (Wigfield & Eccles, 2000), which is comprised of choice, persistence,
and performance (Wigfield & Eccles, 2000). The theory is explained by an individual’s
competency beliefs and his or her value towards a particular activity.
Figure 2.1, depicted below, shows the constructs of expectancy-value theory. The
model describes the theory in a fashion that is based on a child’s assumption about how
well he or she will do on an upcoming task. This particular figure is from Eccles et al.
(1983), which the researchers constructed in relation to expectancies and values. Figure
2.1 shows expectations and values are built on perceptions rather than on past success
(Eccles et al. 1983).

10
Figure 2.1 Eccles, Wigfield, Adler, Futterman, Goff, Kaczala, Meece, Midgley’s expectancy-value model of achievement motivation (1983)
This expectancy-value model of achievement motivation provides insight to the
development of the theory. Two critical areas of the model are expectancies and
subjective task values. Expectancies and task values lead to achievement choices.
Expectancies for success are influenced by factors including both long and short-term
goals; self-concept of ability; and gender role stereotypes. Task values, which include
intrinsic value, utility value, and cost, are influenced by affective memory, previous
experiences, and beliefs and behaviors. As explained by Wigfield and Eccles (2000),
expectancies and values directly influence achievement choices, performance, effort, and
persistence one places on a goal. From the constructs of expectancy-value theory, two
main questions are created. Expectancies produce the question “Will I do well on this
task?” (Eccles, 2009). Task value asks “Why should I do this task?” (Eccles, 2009).
Values are defined by Rokeach (1973) as beliefs about desired end states of a
goal, of which achievement is related. Eccles et al. (1983) introduce subjective task
values as how certain tasks meet different needs of individuals. As shown in Figure 2.1,

11
there are four components that comprise subjective task values which are attainment
value - the personal importance of doing well on a given task (Wigfield & Eccles, 2000),
intrinsic value - the enjoyment or perceived enjoyment of a task (Wigfield & Eccles,
2000), and utility value – the usefulness of and how a task fits into an individual’s plans
for the future (Wigfield & Eccles, 2000). Lastly there is perceived cost, which can be
defined as an individual’s evaluation of the emotional cost, perceived effort, and time
constraints spent on the activity or task versus another activity (Wigfield & Eccles,
2000). Of attainment value, intrinsic value, and utility value, utility value is the most
extrinsic. Most likely, the individual will be committed to a particular task in the efforts
of reaching a sought after ending, rather than for the sake of merely completing it
(Wigfield & Eccles, 2000).
To begin outlining the concepts of expectancies, Wigfield (1994) defined
expectancy as beliefs a child has about how well he or she will do on a future task. In this
context, ability beliefs are a person’s beliefs about his or her ability on a task in the
current state, while an expectancy belief is based off one’s perception about success in
the future (Wigfield & Eccles, 2000).
Atkinson (1957) was the initial pioneer of expectancy-value theory, while
exploring risk-taking behavior. His 1957 study of approach and avoidance in relation to
motive, expectancy and incentive explained if an individual found a task difficult, his
probability for success was low. On the contrary, an easy task would result in high
success. When the individual’s expectancy for success was low, there is little
embarrassment in failure. A high expectancy for success would result in high
embarrassment for a failed task (Atkinson, 1957).
12
Expectancy-Value Theory in Education
Many studies conducted over expectancy-value theory in education revolve
around students in math and their self-concepts of ability, gender differences,
expectancies, and beliefs. Eccles and Wigfield (2000) conducted a study over gender
differences, achievement beliefs and values in math and English. Findings from this study
led the researchers to conclude the importance a student places on mathematics results in
lower anxiety for the subject (Meece, Wigfield & Eccles, 1990). Math anxiety resulted in
students’ performance expectancies and perceived importance of math (Meece et al.,
1990). This study was conducted over a two-year period with 860 5th through 12th grade
students. The researchers measured student attitudes, math anxiety, and math
achievement to determine students’ self-evaluation and perception regarding their
performance in mathematics. It was discovered through the study that when students
placed greater importance on high math achievement, the students had less math anxiety,
and the importance students placed on achievement in mathematics was not correlated to
effects of expectancies on anxiety (Meece et al., 1990).
Past research indicates that as students age, they believe they are less competent
in many activities, therefore, valuing those activities less (Wigfield & Eccles, 2000). One
suggestion for this is that students have a better self-assessment over certain activities
(2000). This self-assessment can also occur through self-comparison with their peers.
Expectancy-Value Theory in Career and Technical Education (CTE)
Dykeman et al. (2003) used expectancy-value theory in a career development and
academic motivation study. The purpose of the study was to measure the relationship of
career development course involvement to academic self-efficacy and motivation of high
13
school students. Bandura (1977) hypothesized that self-efficacy affects the choices, effort
and persistence an individual makes towards activities. Findings related to academic
motivation reported that helping students see the applicability of mathematics skills and
how those skills can relate to future career goals could increase students’ motivation
towards mathematics (Dykeman et al., 2003). It was suggested that an intervention with
students, such as academic planning counseling, should be given more priority among
educational administrators and professionals in CTE.
Expectancy-Value Theory in Agricultural Education
Three studies from the Journal of Agricultural Education are cited for referencing
or basing the study on expectancy-value theory. The first one sought to determine the
expectations and values of students participating in supervised agricultural experience
programs from first year teachers in Oklahoma who were alternatively certified. The
findings from this study suggested the alternatively certified teachers had expectations for
their students to manage their own supervised agricultural experience, keep accurate
records, and do so with high quality and effort (Robinson & Haynes, 2011). The
researchers also summarized from the teachers’ findings that students are more willing to
participate in supervised agricultural experiences when students realize the value and
impact completing an SAE will have on their lives (Eccles, 2007; Robinson & Haynes,
2011). In addition, the researchers noted that while the teachers recognized the
importance and value of SAE, and placed high expectations on students’ ownership and
management, the teachers need to be aware of how they implement and evaluate the
programs to have optimum student effect.

14
Another study that utilized a form of expectancy-value theory was over science
credit for agriculture classes based on Arkansas teachers. In this 1996 study by Johnson,
teacher support and teacher perceptions were measured concerning the effects of offering
science credit for agriculture. Results indicated Arkansas agriculture teachers are in high
favor of supporting science credit for agriculture. Agriculture teachers supported science
credit for agriculture due to the science credit enhancing agriculture’s status within the
school and the added student benefit. Student benefits, negative impact, program benefits,
enrollment, and science content are five components concluded to having significant
effects in predicting teacher support for science credit.
The third study from the Journal of Agricultural Education to use expectancy-
value theory as a framework for study was conducted over teacher immediacy and
student motivation. The findings in regards to expectancy-value theory proposed the
nonverbal communication teachers emit is associated with students expectancy-value
motivation in regards to a class. The researchers concluded “expectancies for success
appear to be created and enhanced through consistent, positive, and supportive nonverbal
communication” (Velez & Cano, 2008, p. 81). The researchers concluded through the
findings that teacher body language has a large impact on student motivation, and
teachers need to be aware of how they come across to students during classroom
interactions (Velez & Cano, 2008).
Summary
Expectancy-value theory in education helps to answer many questions regarding
one’s perceived expectations or values for completing a set goal or participating in a
given activity. Chosen as the theoretical framework of this study, expectancy-value

15
theory considers how children perceive their long-term goals, including career plans
(Wigfield, 1994). When students at the secondary level define their expectancies for
success and values for enrollment in an elective course, teachers, guidance counselors,
and administrators can help meet the needs of these students to help them be successful.
16
CHAPTER 3
METHODOLOGY
The purpose of this study is first, to determine the level of ability, expectancy, and
interest, importance, and usefulness students with no affiliation to a farm find in
agriculture courses when being compared against their peers from more traditional
agriculture backgrounds. The study also determined what kept students enrolled and
interested in agriculture and considered the values students place on elective agriculture
courses and what students expected to get out of such courses.
Participants
Data were collected during the fall 2015 semester from 211 agriculture students in
grades 8-12 from an urban career center in Kentucky. Students were largely non-
traditional (57%) while 43% of students reported being from traditional agriculture
backgrounds. Students and parents, if applicable, were required to provide written
consent to participate in the study (see Appendixes D, E, and F). Research approval has
been granted by the University of Kentucky’s Internal Review Board (IRB), IRB Number
15-0604-F4S and approval can be found under Appendix A.
Research Questions
The guiding research questions for this quantitative study were:
RQ1: What are the characteristics [sex, grade, affiliation to a farm (live on a farm,
work on a farm, parents own a farm but do not live on one, no affiliation to a
farm), and agriculture pathway] of the student participants?
RQ2: What are the ability beliefs of the student participants?
RQ3: What are the expectancies for success of the student participants

17
RQ4: What are the usefulness, importance, and interest levels of the student
participants?
RQ5: What are the differences in ability beliefs by the participants’ affiliation to a
farm (traditional v non-traditional)?
RQ6: What are the differences in expectancies for success by the participants’
affiliation to a farm (traditional v non-traditional)?
RQ7: What are the differences in usefulness, importance, and interest levels by
the participants’ affiliation to a farm (traditional v non-tradional)?
Research Design
Data was collected via online survey (Qualtrics®) at a local high school with a
high number of non-traditional agriculture students enrolled in agriculture courses. For
this study, the survey served as the main data collection instrument. Data was collected
solely on the survey administered to students enrolled in agriculture courses in grades
eight through twelve. The study followed a descriptive-correlational research design.
Descriptive research looks at the situation, as it is currently occurring. Descriptive
research strives to identify attributes of an occurrence based on observation (Williams,
2007). Correlational research is when two characteristics of a group are examined for
their differences (Williams, 2007). According to Creswell and Creswell (2005),
correlational research looks for relationships between two or more variables. The
researcher sought to obtain a census of the students enrolled at the school, but can bring
inference to a broader audience that includes future students enrolled at the selected
school as well as students similar in demographics at other schools. Dong, Yang, Tang,
Yang, & Chawla (2014) conducted a study with mobile phone users and inferred from

18
their results they could predict the same mobile phone usage traits among similar
demographics. From the results, inference can be made these results can apply to schools
across the United States that have similar demographics to the high school being studied,
and infer their agricultural education enrollment would be similar.
Research Setting
The county the study was conducted in has a rural population of 12,583 and an
urban population of 36,003, accounting for a total population of 48.586 residents. As of
2012, there were a total number of 668 farms in the county (USDA, 2012). The average
farm size was 125 acres (USDA, 2012). Of the land being used for farming, 43.6% was
considered pastureland, 40.1% was cropland, 8.8% was woodland, and 7.5% was for
other uses (USDA, 2012). The research setting serves as a bedroom community to an
urban city with a population of 290,000+.
Students who attend the career center attend one of two high schools located in
the county. The career center houses courses in health sciences, public safety,
information technology, business and marketing, family and consumer sciences, STEM
courses, and agriculture sciences. Agriculture courses offered in the program include
Agribusiness/Farm Management, Animal Science, Environmental Science and
Technology, Floral Design, Food Science and Technology, Greenhouse Technology,
Horticulture and Plant Science Systems, Interdisciplinary Agri-Biology, Landscape and
Turf Management, Middle School Exploratory, Plant and Land Science, Principles of
Agri-Science and Technology, Small Animal Technology, Vet Assisting 1, and Wildlife
Resources.

19
Instrumentation
The questionnaire was designed using the items used to assess children’s ability
beliefs and subjective task values items from Wigfield and Eccles (2000). Due to the
original math related items, the word “math” was replaced with “ag” or “agriculture”
where appropriate to make the questionnaire relevant to the current study. In survey
design, multiple-choice anchors of 3, 5, and 7 were used throughout the study, due to
researcher choice. Through the duration of the study, participants were asked to complete
the questionnaire one time. There was no pre- or post-tests to follow up with, and no
control group. Tables 3.1, 3.2, and 3.3 describe the questions asked of the participants
according to ability beliefs, expectancies, and usefulness, importance, and interest items,
respectively. Table 3.4 describes the specific questions asked to the student participants.
Table 3.1 lists the ability belief items asked of the students. These items ask the
student’s present ability.
Table 3.1 Ability Beliefs Items Survey Item Item Statement
1 How good are you in your agriculture class(es)?
2 If you were to list all of the students in your agriculture class from best to worst, where would you rank yourself?
3 Some kids are better in one subject than another. For example, you might be better in agriculture than reading. Compared to most of your other school subjects, how good are you at agriculture?
Table 3.2 lists the expectancy items asked of the students. These items ask how
the student expects to do in the future on a given task.
Table 3.2 Expectancy Items Survey Item Item Statement
4 How well do you expect to do in agriculture this year? 5 How good are you at learning something new in agriculture?

20
The items listed in Table 3.3 are the usefulness, importance, and interest items,
which measure how the student sees the course(s) fitting in to his or her future, the
intrinsic value attained from being enrolled in an agriculture class, and the importance of
doing well in agriculture.
Table 3.3 Usefulness, Importance, and Interest Items Survey Item Item Statement
6 In general, how useful is what you learn in agriculture? 7 For me, being good in agriculture is... 8 In general, I find working on agriculture assignments 9 How much do you like being enrolled in agriculture?
Table 3.4 lists the demographic questions asked of the students. These questions
were asked to help the researcher identify any common themes with students when they
were divided in to traditional and non-traditional groupings.
Table 3.4 Student Questions Survey Item Item Statement
10 Why did you enroll in your first agricultural education class? 11 What motivates you to stay enrolled in agricultural education?
12 To what degree does your teacher influence you to stay enrolled in agricultural education?
13 To what degree do your parents influence you to stay enrolled in agricultural education?
14 To what degree do your peers influence you to stay enrolled? 15 Where do you see yourself five years from now? 16 What are your future career goals? 17 Do you have any affiliation with a farm? 18 What is your gender (sex)? 19 What grade are you currently in? 20 What agriculture pathway are you in? 21 Where do you rank yourself in this pathway, among your peers? 22 Was this pathway an interest before enrolling in agriculture?
22a If this pathway was not an interest previous to enrolling in agriculture, who inspired you to enroll?
23 Why are you staying in this pathway?

21
Validity and reliability.
Once a panel of experts reviewed the survey, the chair of the study gave
suggestions for demographic/characteristic questions. Ary, Jacobs, Razavieh, and
Sorensen (2006) recommend utilizing pilot testing to help with clarity issues and
wording. The survey was piloted at an area high school with similar student
demographics the research site. The class size of nineteen (N=19) students completed the
survey to help with reliability and a focus group of three (n=3) students assisted with face
validity. The supervising teacher recommended these students to the researcher and
together they provided feedback on confusing wording, repetitive questions, and areas of
clarification for improved understanding of the questionnaire. Additions and corrections
were made to the study based on student recommendations.
According to George and Mallory (2003) the following is a guideline to follow
for Cronbach’s alpha reliability of a “_ > .9 – Excellent, _ > .8 – Good, _ > .7 –
Acceptable, _ > .6 – Questionable, _ > .5 – Poor, and _ < .5 – Unacceptable” (p. 231). All
three areas of the instrument (Ability Beliefs, Expectancy, and Usefulness, Importance,
and Interest Items) were tested and no group fell below .75, which resulted in acceptable
reliability. Due to great success through previous administration of this instrument,
psychometric properties have been established, specifically reliability, construct validity,
and content validity through the previous work of Wigfield and Eccles (2000).
Data Analysis
The quantitative data were analyzed using Statistical Package for the Social
Sciences® (SPSS) 23 for Windows.

22
RQ1: What are the characteristics [sex, grade, affiliation to a farm (live on a farm,
work on a farm, parents own a farm but do not live on one, no affiliation to a
farm), and agriculture pathway] of the student participants? To explain the
characteristics, frequencies and percentages will be utilized.
RQ2: What are the ability beliefs of the student participants? Measures of central
tendencies were used to explain the ability beliefs of the student participants.
RQ3: What are the expectancies for success of the student participants?
Expectancies for success were explained utilizing measures of central tendencies.
RQ4: What are the usefulness, importance, and interest levels of the student
participants? To describe the usefulness importance and interest levels, measures
of central tendencies were utilized.
RQ5: What are the differences in ability beliefs by the participants’ affiliation to a
farm (traditional v non-traditional)? To explain the differences, t-tests were
utilized.
RQ6: What are the differences in expectancies for success by the participants’
affiliation to a farm (traditional v non-traditional)? A standardized t-test was used
to explain the differences between traditional and non-traditional students based
upon their expectancies for success.
RQ7: What are the differences in usefulness, importance, and interest levels by
the participants’ affiliation to a farm (traditional v non-traditional)? To describe
the differences, a t-test was utilized.

23
CHAPTER 4
RESULTS
Research Questions
RQ1: What are the characteristics [sex, grade, affiliation to a farm (live on a farm,
work on a farm, parents own a farm but do not live on one, no affiliation to a
farm), and agriculture pathway] of the student participants?
RQ2: What are the ability beliefs of the student participants?
RQ3: What are the expectancies for success of the student participants?
RQ4: What are the usefulness, importance, and interest levels of the student
participants?
RQ5: What are the differences in ability beliefs by the participants’ affiliation to a
farm (traditional v non-traditional)?
RQ6: What are the differences in expectancies for success by the participants’
affiliation to a farm (traditional v non-traditional)?
RQ7: What are the differences in usefulness, importance, and interest levels by
the participants’ affiliation to a farm (traditional v non-traditional)?
Findings
Research Question 1: What are the characteristics [sex, grade, affiliation to a farm
(live on a farm, work on a farm, parents own a farm but do not live on one, no
affiliation to a farm), and agriculture pathway] of the student participants?
Part one sought to describe the characteristics of the students enrolled in
agriculture courses at JCTC. The following characteristics were deemed appropriate for
the study – affiliation to farm, sex, grade, and agriculture pathway – which helped answer

24
other research questions and describe trends in findings. Data were summarized via
frequency and percentages, and displayed in tables. Table 1 describes the grades (8th
grade through 12th grade) of the students. As shown in the results, 6.00% (n = 13) were in
8th grade. Freshmen accounted for the largest percentage of students, 46.67% (n = 98);
while 30.78% (n = 64) of the students were sophomores. Twenty-two (10.48%) of
students were juniors and there were 13 (6.19%) seniors. To compare across the data sets
even deeper, non-traditional students had the largest number of students, with 6.67% (n =
8) eighth graders, 52.50% (n = 63) freshmen, 27.50% (n = 33) sophomores, 5.83% (n =
7) juniors, and 7.50% (n = 9) seniors. Traditional students accounted for the least number
of students, with 5.56% (n = 5) eighth graders, 38.89% (n = 35) for freshmen, 34.44% (n
= 31) sophomores, 16.67% (n = 15) juniors and 4.44% (n = 4) seniors.
Table 4.1 Grade Level in Affiliation to Home Residency in Relation to a Farm
Traditional Non-Traditional Live on Farm or Work
on Farm (n = 90)
Parents own farm, but don’t live on or No
Affiliation to a Farm (n = 120)
Total (N = 210)
Characteristic f % f % f % Grade 8th 5 5.56 8 6.67 13 6.20 9th 35 38.89 63 52.50 98 46.67 10th 31 34.44 33 27.50 64 30.78 11th 15 16.67 7 5.83 22 10.48 12th 4 4.44 9 7.50 13 6.19
Table 2 shows sex of students in affiliation to home residency in relation to a
farm. Traditional males accounted for 56.56% (n = 51) of students and females accounted
for 43.33% (n = 39). Non-traditional males accounted for 47.50% (n = 57) of students
and females represented 52.50% (n = 63) of the non-traditional students.

25
Table 4.2 Sex in Affiliation to Home Residency in Relation to a Farm
Traditional Non-Traditional Live on Farm or Work
on Farm (n = 90)
Parents own farm, but don’t live on or No
Affiliation to a Farm (n = 120)
Total (N = 210)
Characteristic f % f % f % Sex Male 51 56.67 57 47.50 108 51.49 Female 39 43.33 63 52.50 102 48.57
Five students reported pursuing the agribiotechnology pathway, for a percentage
of 2.38% of the total. Three students (3.33%) are traditional and two students (2.13%) are
from a non-traditional background.
The agribusiness pathway consisted of sixteen students, which is 7.62% of
agriculture students. Three (3.33%) come from a traditional agriculture background and
two (1.67%) are from a non-traditional background.
Agriculture power, structural and technical systems has 9.52% (n = 20) students
enrolled. Nine students (10.00%) are traditional and 9.17% (n = 11) students are non-
traditional.
From the overall sample, the animal science pathway accounted for over half of
the students, with a total percentage of 56.00% (n = 118) students enrolled. For students
pursuing the animal science pathway, 55.55% (n = 50) are from traditional agriculture
backgrounds and 56.67%% (n = 68) are non-traditional.
The environmental science and natural resources pathway was the next most
populated pathway, with 10.48% (n = 22) of students enrolled. Seven students (7.77%)
are traditional and fifteen students (12.50%) are non-traditional.

26
The food science and processing pathway also had a total of five students (2.38%)
pursuing the pathway. Two students (2.22%) are traditional and three students (2.50%)
are from a non-traditional background.
Plant and horticulture systems pathway has a total of 23 students, which make up
10.95% of the total student agriculture pathway enrollment. Twelve (13.33%) students
are traditional, while 9.17% (n = 11) are non-traditional.
Table 4.3 Agriculture Pathway in Affiliation to Home Residency in Relation to a Farm
Traditional Non-Traditional Live on Farm or Work on Farm
(n = 90)
Parents own farm, but don’t live on or No
Affiliation to a Farm (n = 120)
Total (N = 210)
Agriculture Pathway f % f % f % Agribiotechnology 3 3.33 2 1.67 5 2.38 Agribusiness 6 6.66 10 8.33 16 7.62 Agriculture Power, Structural, and Technical Systems
9 10.00 11 9.17 20 9.52
Animal Science 50 55.55 68 56.67 118 56.19 Environmental Science/Natural Resources
7 7.77 15 12.50 22 10.48
Food Science and Processing
2 2.22 3 2.50 5 2.38
Plant and Horticulture Systems
12 13.33 11 9.17 23 10.95
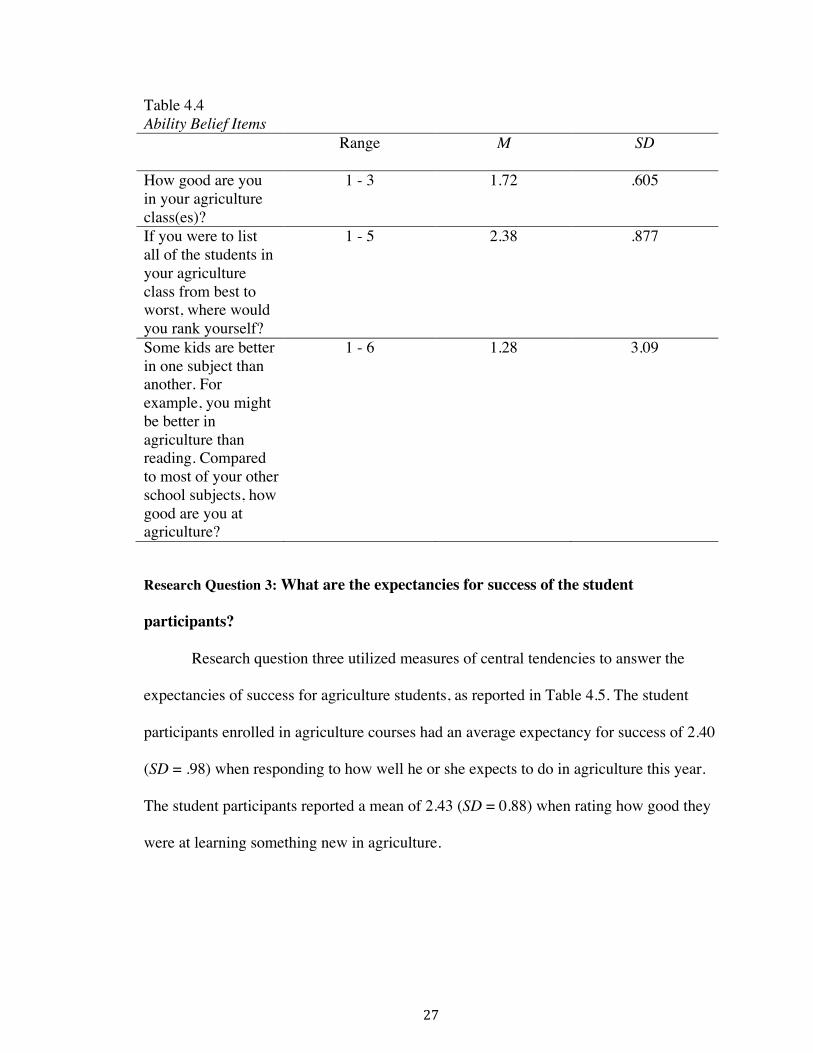
Research Question 2: What are the ability beliefs of the student participants?
Table 4.4 summarizes the ability beliefs of students. Students reported a mean of
1.72 (SD = .605) for how good they were in their agriculture class(es). The mean for
students self-ranking themselves in comparison to their classmates in agriculture class
was 2.38 (SD = .877). When students compared their performance in agriculture to their
performance in other courses, students reported a mean of 1.28 (SD = 3.09).
27
Table 4.4 Ability Belief Items
Range M SD
How good are you in your agriculture class(es)?
1 - 3 1.72 .605
If you were to list all of the students in your agriculture class from best to worst, where would you rank yourself?
1 - 5 2.38 .877
Some kids are better in one subject than another. For example, you might be better in agriculture than reading. Compared to most of your other school subjects, how good are you at agriculture?
1 - 6 1.28 3.09
Research Question 3: What are the expectancies for success of the student
participants?
Research question three utilized measures of central tendencies to answer the
expectancies of success for agriculture students, as reported in Table 4.5. The student
participants enrolled in agriculture courses had an average expectancy for success of 2.40
(SD = .98) when responding to how well he or she expects to do in agriculture this year.
The student participants reported a mean of 2.43 (SD = 0.88) when rating how good they
were at learning something new in agriculture.

28
Table 4.5 Expectancies for Success Items
Range M SD How well do you expect to do in agriculture this year?
1 - 5 2.40 .98
How good are you at learning something new in agriculture?
1 - 5 2.43 .88
Research Question 4: What are the usefulness, importance, and interest levels of the student participants?
Table 4.6 describes the usefulness, interests, and ability beliefs in student participants.
Students reported a mean of 2.50 (SD = 1.24) when rating the usefulness of what they learn in
their agriculture class(es). A mean of 2.55 was reported (SD = 1.23) for students rating how
important it was to them to be good in agriculture. Working on agriculture assignments received a
mean of 2.58 (SD = 1.09). Students reported a mean of 2.10 (SD = .87) when rating how much
they liked being enrolled in agriculture.
Table 4.6 Usefulness, Interest, and Importance Items
Range M SD
In general, how useful is what you learn in agriculture?
1 - 7 2.50 1.24
For me, being good in agriculture is...
1 - 7 2.55 1.23
In general, I find working on agriculture assignments
1 - 6 2.58 1.09
How much do you like being enrolled in agriculture?
1 - 5 2.10 0.86

29
Research Question 5: What are the differences in ability beliefs by the participants’ affiliation to a farm (traditional v non-traditional)?
Table 4.7 compares the means between the traditional and non-traditional students
in reference to their differences in ability beliefs. When students were asked how good
they were in their agriculture class, traditional students reported a mean of 1.59 and non-
traditional students’ responses resulted in a mean of 1.82, for a total mean of 1.72. When
students were asked to list all of the students in their agriculture class from best to worst,
and then rank themselves compared to their peers, traditional students had a mean of 2.13
and non-traditional students had a mean of 2.56, for a total mean of 2.38. Finally,
students were asked to compare their performance in agriculture classes compared to
their other school subjects. Traditional students had a mean of 2.59 and non-traditional
students had a mean of 3.47.
Table 4.7 Differences in Ability Beliefs
Traditional Non-Traditional Live on Farm or Work on Farm
(n = 90)
Parents own farm, but don’t live on or No
Affiliation to a Farm (n = 121)
Total (N = 211)
Ability Beliefs Mean Mean Mean How good are you in your agriculture classes?
1.59
2.13
2.59
1.82
2.56
3.47
1.72
2.38
3.09
If you were to list all of the students in your agriculture class from best to worst, where would you rank yourself?Some kids are better in one subject than another. For example, you might be better in agriculture than

30
reading. Compared to most of your other school subjects, how good are you at agriculture?
Research question five describes the differences in ability beliefs by the
participants’ affiliation to a farm (traditional v non-traditional). When students were
asked how good they were in their agriculture class, traditional students reported a mean
score of 1.59 (SD = 0.56) while non-traditional students received a mean score of 1.81
(SD = 0.62). Students ranking themselves in their agriculture class among their peers
yielded a mean score of 2.13 (SD = 0.82) for traditional students and for non-traditional
students, a mean score of 2.56 (SD = 0.88) was reported. The third question for ability
beliefs, regarding students ranking how well they do in their agriculture class compared
to other courses at school reported a mean of 2.59 (SD = 1.17) for traditional students and
a mean of 3.47 (SD = 1.23).
Table 4.8 Independent t-test on Ability Beliefs Variables n M SD t Cohen’s d How good are you in your agriculture class? Small Traditional 90 1.59 0.56 -2.70 -0.37Non-traditional 121 1.81 0.62 If you were to list all of the students in your agriculture class from best to worst, where would you rank yourself? Small Traditional 90 2.13 0.82 -3.64 -0.51Non-Traditional 121 2.56 0.88 Some kids are better in one subject than another. For example, you might be better in agriculture than reading. Compared to most Small

31
of your other school subjects, how good are you at agriculture?Traditional 90 2.59 1.17 -5.30 -0.07Non-Traditional 121 3.47 1.23
Research Question 6: What are the differences in expectancies for success by the
participants’ affiliation to a farm (traditional v non-traditional)?
Table 4.9 describes the differences of expectancies for success between traditional
and non-traditional students. Traditional students reported a mean of 2.21 when asked
how well they expected to do in agriculture this year, while non-traditional students
reported a mean of 2.54, for a total mean of 2.40. Traditional students being asked how
good they are at learning something new in agriculture reported a mean score of 2.21 and
non-traditional students reported a mean score of 2.59, for an overall mean of 2.43.
Table 4.9 Differences in Expectancies for Success
Traditional Non-Traditional Live on Farm or Work on Farm
(n = 90)
Parents own farm, but don’t live on or No
Affiliation to a Farm (n = 121)
Total (N = 211)
Expectancies for Success
Mean Mean Mean
How well do you expect to do in agriculture this year? How good are you at learning something new in agriculture?
2.21
2.21
2.54
2.59
2.40
2.43
Research question six sought to describe the differences in expectancies for
success between traditional and non-traditional students. Traditional students reporting
how well they expect to do in agriculture this year reported a mean score of 2.21 (SD =
0.91) and non-traditional students reported a mean of 2.54 (SD = 1.01). In ranking how

32
good they were at learning something new in agriculture, traditional students reported a
mean of 2.21 (SD = 0.77) and non-traditional students had a mean of 2.59 (SD = 0.92).
See Table 4.10.
Table 4.10 Independent t-tests on Expectancies for Success Variables n M SD t Cohen’s d How well do you expect to do in agriculture this year? Small Traditional 90 2.21 0.92 -2.45 -0.34Non-traditional 121 2.54 1.01 How good are you at learning something new in agriculture? Small Traditional 90 2.21 0.77 -3.25 -0.45Non-Traditional 121 2.59 0.92
Research Question 7: What are the differences in usefulness, importance, and
interest levels by the participants’ affiliation to a farm (traditional v non-
traditional)?
Table 4.11 describes traditional and non-traditional students’ differences in
usefulness, importance, and interest levels. Traditional students had a mean of 2.00 and
non-traditional students had a mean of 2.87 for a total mean of 2.50 when reporting how
useful what they learned in agriculture was. When students answered how important it
was that they were good in agriculture, traditional students had a mean score of 2.12 and
non-traditional students had a mean score of 2.87 for a total mean of 2.55. When students
reported the ease they found working on agriculture assignments, traditional students had
a mean score of 2.44 and non-traditional students had a mean of 2.69, for a total mean
score of 2.58. The last question, how much do you like being enrolled in agriculture, had
33
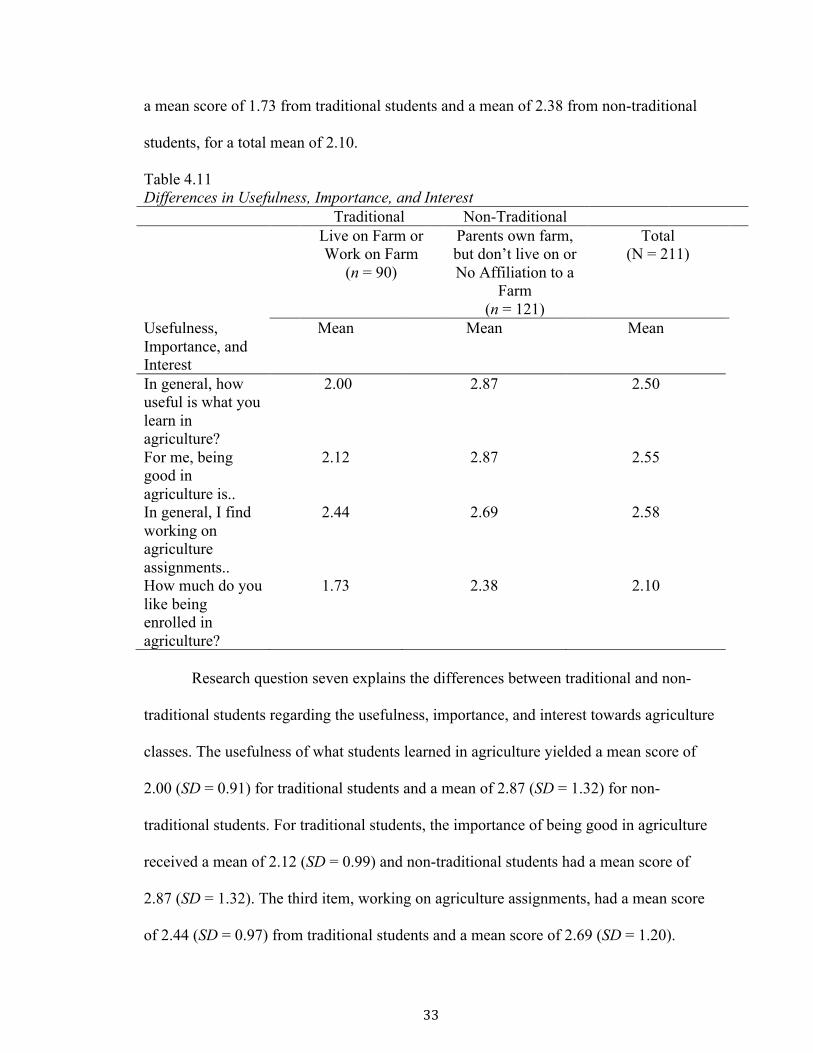
a mean score of 1.73 from traditional students and a mean of 2.38 from non-traditional
students, for a total mean of 2.10.
Table 4.11 Differences in Usefulness, Importance, and Interest
Traditional Non-Traditional Live on Farm or Work on Farm
(n = 90)
Parents own farm, but don’t live on or No Affiliation to a
Farm (n = 121)
Total (N = 211)
Usefulness, Importance, and Interest
Mean Mean Mean
In general, how useful is what you learn in agriculture?
2.00 2.87 2.50
For me, being good in agriculture is..
2.12 2.87 2.55
In general, I find working on agriculture assignments..
2.44 2.69 2.58
How much do you like being enrolled in agriculture?
1.73 2.38 2.10
Research question seven explains the differences between traditional and non-
traditional students regarding the usefulness, importance, and interest towards agriculture
classes. The usefulness of what students learned in agriculture yielded a mean score of
2.00 (SD = 0.91) for traditional students and a mean of 2.87 (SD = 1.32) for non-
traditional students. For traditional students, the importance of being good in agriculture
received a mean of 2.12 (SD = 0.99) and non-traditional students had a mean score of
2.87 (SD = 1.32). The third item, working on agriculture assignments, had a mean score
of 2.44 (SD = 0.97) from traditional students and a mean score of 2.69 (SD = 1.20).

34
Traditional students had a mean score of 1.76 (SD = 0.78) for how much they liked being
enrolled in agriculture and non-traditional students had a mean of 2.38 (SD = 0.94).
Table 4.12 Independent t-tests in Usefulness, Importance, and Interest Variables n M SD t Cohen’s d In general, how useful is what you learn in agriculture? Small Traditional 90 2.00 0.91 -5.62 -0.77Non-traditional 120 2.87 1.32 For me, being good in agriculture is... Small Traditional 89 2.12 0.99 -4.69 -0.65Non-Traditional 120 2.87 1.30 In general, I find working on agriculture assignments Small Traditional 90 2.44 0.97 -1.65 -0.23Non-Traditional 121 2.69 1.20 How much do you like being enrolled in agriculture? Small Traditional 90 1.76 0.78 -5.43 -0.72Non-Traditional 121 2.38 0.94

35
CHAPTER 5
CONCLUSIONS AND RECOMMENDATIONS
By conducting this study and reviewing data, the influencing factors of youth’s
motivation to continue enrolling in agricultural education, how they perceive themselves
performing in the class compared to other subjects and their peers, and the importance
they place on their classes and agriculture pathway were determined. The results of this
study will continue to help current agricultural educators to understand the needs the
diverse student population of agriculture will demand in future years.
The purpose of this study is first, to determine the level of ability, expectancy, and
interest, importance, and usefulness students with no affiliation to a farm find in
agriculture courses when being compared against their peers from more traditional
agriculture backgrounds. The study also determined what kept students enrolled and
interested in agriculture and considered the values students place on elective agriculture
courses and what students expected to get out of such courses.
Summary of Research with Conclusions, Implications, Recommendations, and
Recommendations for Further Research
Research Question 1 – Student Characteristics
Of the 211 students who participated in this study, six percent were in eighth
grade, 46.67% were freshmen, 30.78% were sophomores, 10.48% were juniors, and
6.19% were seniors.
Of the students, 108 were male, and 102 were female. For agricultural pathway
enrollment, Agriculture Power, Structural, and Technical Systems had 20 students
enrolled, 118 students chose Animal Science, Environmental Science and Natural

36
Resources had 22 students, 23 students were in Plant and Horticulture Systems, five
students are in agribiotechnology, and five students were in food science and processing.
Agriculture students in this study, regardless of home background (traditional or
non-traditional in relation to living on a farm) participated in all of the agriculture
pathways offered at JCTC. Animal science by far had the largest amount of students
enrolled. This could be implied that students enrolled in the animal science pathway are
most interested in animal science courses and potential animal science related careers.
Another implication is students enjoy the opportunities available to them in class, such as
labs, hands on experiences with animals, and topics covered in classes.
It can be concluded from the high enrollment in the animal science pathway is
expand the number of animal science courses available to continue catering to animal
science interests. Since many concepts learned in animal science are transferrable to other
science based agricultural courses, teachers and guidance counselors should market
transferrable skills to other agricultural science courses to show students other
possibilities for courses and job opportunities.
Food science and processing and agribiotechnology pathways had the least
amount of students pursuing the pathways. To help with increased numbers in the
pathways, again, teachers and guidance counselors could help market course topics to
potential career paths to students who may be unfamiliar with such topics.
Research Question 2 - What are the ability beliefs of the student participants?
When students were reporting how good they were in their agriculture classes,
they reported a mean of 1.72 (SD = .605) with a range of 1-3, answered on a 3-point
scale. The mean for students self-ranking themselves in comparison to their classmates in

37
agriculture class was 2.38 (SD = .877) with a range of 1-5, answered on a 5-point scale.
When students compared their performance in agriculture to their performance in other
courses, students reported a mean of 1.28 (SD = 3.09) with a range of 1-6, answered on a
7-point scale. From the results, it can be implied that the students feel they have the
ability to perform well in agriculture classes compared to other courses they are taking,
meanwhile, the mean was quite average when responding to how good they were in
agriculture. Students are saying they are average in their agriculture classes, but do well
in agriculture compared to other courses they take in school. What could be implied from
the findings is that students believe they are more capable in agriculture courses than they
are in other school subjects.
Research Question 3 - What are the expectancies for success of the student
participants?
Students reporting how well they expected to do in agriculture this year had a
mean score of 2.40 (SD = .98) with a range of 1-5 on a 5-point scale. The question of how
good are you at learning something new in agriculture had a mean score of 2.43 (SD =
.88) with a range of 1-5 on a 5-point scale. Implications from the results show that the
student population as a whole, in general, expects to do well in their agriculture class for
the academic year, and they are good at learning something new in agriculture. These
results show that students have generally high expectancies for success in their
agriculture class(es).

38
Research Question 4 - What are the usefulness, importance, and interest levels of
the student participants?
When students reported in general, how useful is what they learn in agriculture,
the question yielded a mean score of 2.50 (SD = 1.24) with a range of 1-7 on a 7-point
scale. For students, being good in agriculture is (extremely important through not at all
important) had a mean score of 2.55 (SD = 1.23) with a range of 1-7 on a 7-point scale.
The question regarding students working on agriculture assignments (very easy through
very difficult) had a mean score of 2.58 (SD = 1.09) with a range of 1-6 on a 7-point
scale. When students were asked how much they liked being enrolled in agriculture,
responses yielded a mean of 2.10 (SD = 0.86) with a range of 1-5 on a 5-point scale.
These results show that students have high usefulness, importance, and interest
levels regarding agriculture. This is encouraging considering the student demographics of
the participants who participated in this study, in which the responses to “How much do
you like being enrolled in agriculture?” and “In general, how useful is what you learn in
agriculture?” yielded the highest means. Implications from the results can be that even
though over half of the student population is considered non-traditional, students are still
finding their agriculture classes interesting and useful.
Research Question 5 - What are the differences in ability beliefs by the participants’
affiliation to a farm (traditional v non-traditional)?
Ability beliefs are one construct of the items used to assess ability beliefs and
subjective task values (Wigfield & Eccles, 2000). Traditional students revealed the
highest ability beliefs in all three ability variables, while non-traditional students had

39
means that scored below traditional students. The difference was considered small
between traditional and non-traditional students for all three ability items.
Based upon these findings, it is concluded that traditional students are most
confident in their abilities in the agriculture classroom and non-traditional students are
less confident in their ability beliefs. This could be due to students who are from a farm
are in agriculture class due to genuine interest in the subject from their backgrounds or
they are confident in their abilities because of their home background through
involvement on the farm. Students who are from a non-traditional are provided new
opportunities that they may have never experienced before, therefore, perhaps they are
not as confident in their abilities for learning new things outside of their backgrounds as
traditional agriculture students. One item to be considered is the thought of pushing
traditional agriculture students away from agricultural education.
An area of future research could be that students need to be broken down more by
the extent of their involvement of agriculture and farming. An additional area of future
research could be in the retention rates of students who come from a farming background
and how they feel their needs are being met or unmet in agricultural education.
Research Question 6 - What are the differences in expectancies for success by the
participants’ affiliation to a farm (traditional v non-traditional)?
Traditional students revealed the highest expectancies for success in both
construct areas (Table 4.9), followed by non-traditional students with small differences
for both expectancy items being asked.
Based on the findings, students who are from a traditional agriculture background
report greater expectancies for success in their agriculture classes. This data concludes

40
these students feel they will do well in their agriculture course(s). This could be due to
these students feeling like they have opportunities to expand on material and information
that is already interesting to the, parent encouragement for enrollment in agriculture is
positive reinforcement, or perhaps they are truly invested in their course due to the skills
the classes provide or career opportunities available.
Guidance counselors, agricultural education teachers, and CTE directors should
be commended for recruiting an audience of students who are previously unrelated to
agriculture and giving them opportunities to find success in a future career path. While it
is encouraging that traditional students are enrolled in agriculture and report higher
expectancies for success than non-traditional students, the demographics of the traditional
farmer and agriculturalist are continually changing. Agriculture and it’s employees are
continuing to be more diversified, so as educators, it is imperative that we are providing
opportunities for success for the non-traditional agriculture.
While the results were not surprising that students classified as a traditional
agriculture had the highest expectancies for success, it would be interesting to see how
the students scored if there were additional groups the students could be categorized into
by their extent of agriculture and farming.
Research Question 7 - What are the differences in usefulness, importance, and
interest levels by the participants’ affiliation to a farm (traditional v non-
traditional)?
Usefulness, importance, and interest of the student participants by their
association to a farm resulted in traditional students reporting the highest means. When
41
students were classified in to traditional and non-traditional for the usefulness,
importance, and interest items the effect size was small between the groups.
These results imply students find what they are learning from their agriculture
classes are useful to them. Students with a traditional background find the most
usefulness in agriculture, which can imply the material being taught in the average
agriculture class is still more relevant to a traditional student than it is to a student not
from a farming background.
Future research in regards to usefulness, interest, and importance in agriculture
for students could be in the area of how important they perceive agriculture to be, for
food production, future careers, and how it applies to their life, in all areas of home
background, with students being categorized more specifically into categories regarding
their relation to a farm or agriculture. This could be telling for agriculture teachers,
especially if most of their students have no affiliation to a farm or are from a non-
traditional agriculture background. Results from this type of study could show areas of
improvement in agricultural education pursuits to these types of students.
Implications from Expectancy-Value Theory
With the help of expectancy-value theory, the results of this study imply students
who have a traditional background to a farm report greatest abilities, expectancies for
success, and usefulness, interest, and importance for their agriculture courses when being
compared to their non- traditional peers. Through the findings, it can be concluded that
traditional students have high value placed in agriculture and the future of the agriculture
industry, and they have confidence in their expectancies for success. While this is
exciting for the agriculture industry, future jobs will be need to be filled with people from
42
diverse backgrounds that will have different perspectives on agriculture. Therefore, how
can we as educators better prepare the future employees of agriculture enrolled in our
agricultural education courses to have just as high of ability beliefs, expectancies for
success, and find as much usefulness, importance, and interest in agriculture as their more
traditional peers?
Recommendations for Future Research
A theory to consider for the future of this research would be Apprenticeship of
Observation Theory (Lortie, 1975). Lortie (1975) coined the term “apprenticeship of
observation” (p. 65), while working with pre-service teachers. Through his work, Lortie
claimed in Schoolteacher pre-service teachers have spent considerable amounts of time
learning from and observing the teachers that taught them during their school years.
Therefore, by the time pre-service teachers are ready to begin formal teacher education,
teacher education programs have little effect on improving methods and practices of pre-
service teachers (Mewborn & Tyminski, 2006). Due to the results of the study, it would
be interesting to look at this study again through the lens of Apprenticeship of
Observation, since the traditional students had higher ability beliefs, expectancy values,
and interest, importance in agricultural education classes than did non-traditional
students. Therefore, studying traditional students, their previous farm work, and what
they gain from observing and working with parents, bosses, or family members on the
farm before entering an agriculture class would be telling for educators in motivating
traditional students, and how to increase the ability beliefs, expectancies for success, and
usefulness, interest, and importance in agriculture classes for non-traditional students.
43
As the diversity of agricultural education continues to expand over the years, it
will be crucial that agricultural education teachers provide opportunity to the wide variety
of students they will serve. Knowing what motivates students to enroll in agricultural
education and what keeps them enrolled in agriculture will be vital to the success of
diversity in agricultural education and helping fill the large voids that currently exist in
agriculture careers.
One important area of research to consider for the future is studying what
influences students who see themselves as above average in their agriculture classes,
especially the students that have no affiliation to a farm. Additionally, connecting
agriculture content with all students to their ability beliefs, expectancies for success, and
making agriculture useful to students not actively involved in farming can help students
view agriculture not only as a class to fulfill a class period, but make help all students
make strides towards a future in agriculture. If a student chooses to not pursue a career in
agriculture, then at least agriculture will be making an impact in the student’s life.
There was a constant decrease in student response from freshman year to senior
year (Table 4.1), showing an assumption that more and more students choose to
discontinue enrollment in agriculture classes as they get farther into their high school
career. If I were to do this study again, I would want to administer a survey to those
students who had previously enrolled in agriculture courses, but for some reason have not
continued in agriculture to see how priority levels change as students continue on their
educational journey and to discover why agricultural education could no longer serve
their needs. It would also be interesting to consider the effect of family structure on
students’ enrollment and motivational choices. For example, in the demographics section
44
of the questionnaire, asking about parent marital status and family structure (married,
divorced, raised by a single parent, raised by grandparents or other family members, etc.)
could be telling in enrollment choices, due to family structure and home environment
having effects on a child’s academic motivation (Eccles, 2009). It would also be
interesting to compare motivations for FFA involvement as compared to academic
motivation in agriculture, especially for students who report low ability beliefs,
expectancies for success, and usefulness, importance, and interest items.
Limitations
This survey was replicated and adapted from Wigfield and Eccles (2000) study.
However, during the pilot-test, the focus group recommended removing two of the
questions in the “Usefulness, Importance, and Interest Items” due to repetitiveness. The
research took this into consideration and removed the two items – “Compared to most of
your other activities, how useful is what you learn in math?” and “Compared to most of
your other activities, how important is it for you to be good at math?” Should the
researcher repeat this study again, those two items would be added back into the study
and modified to fit an agricultural classroom. Additionally, in the classroom with the
long-term substitute teacher at JCTC, there were a high number of students who either
did not turn in parent consent forms or chose not to do the survey. Also, when students
were absent from school or not in class, no effort was made to reach those students.
Discussion
At the beginning of this study, I was expecting students who live on a farm to
have the highest ability beliefs, expectancies for success, and the most usefulness,
interest, and importance for agriculture, which ended up being the case. Through the

45
findings of this study, it was encouraging to learn so many students who are of non-
traditional backgrounds have beliefs about their abilities and expectancies, and
importance in agriculture not far behind their traditional peers. I also learned that as a
future educator, I need to be mindful about how I teach agriculture to a non-traditional
agriculture student to not push them away or alienate them among their traditional peers,
by offering a variety of courses that appeal to traditional farm students who plan to return
to the farm, students who have never stepped foot of a farm, and everyone in between,
while at the same time, connecting content to all audiences and engaging them with skills
for the future.
The results from this study will be valuable to guidance counselors,
administrators, current and future agriculture teachers, and the FFA organization. Based
on the results specific to this school, guidance counselors should be commended for
guiding the non-traditional agriculture student to enroll in agriculture courses, due to the
large number enrolled in the courses at JCTC. There is still a belief floating around in
high schools that ag classes are an “easy A”, however, the skills acquired and career
advancement opportunities refute that myth. In order to continue capturing a large
audience of students, retaining them during their four years of high school, and hopefully
guiding them towards an agriculturally related career, piquing students’ interest in
agriculture should begin long before the start of their freshman year through active
agriculture exposure and recruitment in elementary and middle school.
These findings are also exciting for administrators, especially those pondering the
future of their CTE program or those without an agricultural education program. Students
reporting a head start on their future career path, new skills acquired, and real-world

46
application should be an encouragement to administrators to continue support and
funding for their agricultural programs.
As a future agricultural educator, the results from this study only scratch the
surface at what is currently occurring in agricultural education. Due to the changing
demographics in agricultural education, a lot of focus and attention has been towards the
retention of diverse students in agricultural education and FFA. While this is certainly
important, it is also important to create and keep a balance between non-traditional
agriculture and traditional production agriculture. As agricultural educators, we have a
large responsibility to teach the skills and science behind modern day food production,
while not only focusing on “cows, sows and plows”, and at the same time, not removing
the agriculture from agriculture. No matter how much advanced technology changes the
way food is grown in the United States, traditional production agriculture will always
have a place in American agriculture.

47
APPENDIX A: IRB APPROVAL

48
APPENDIX B: PRINCIPAL CONSENT

49
APPENDIX C: JCTC BOARD APPROVAL
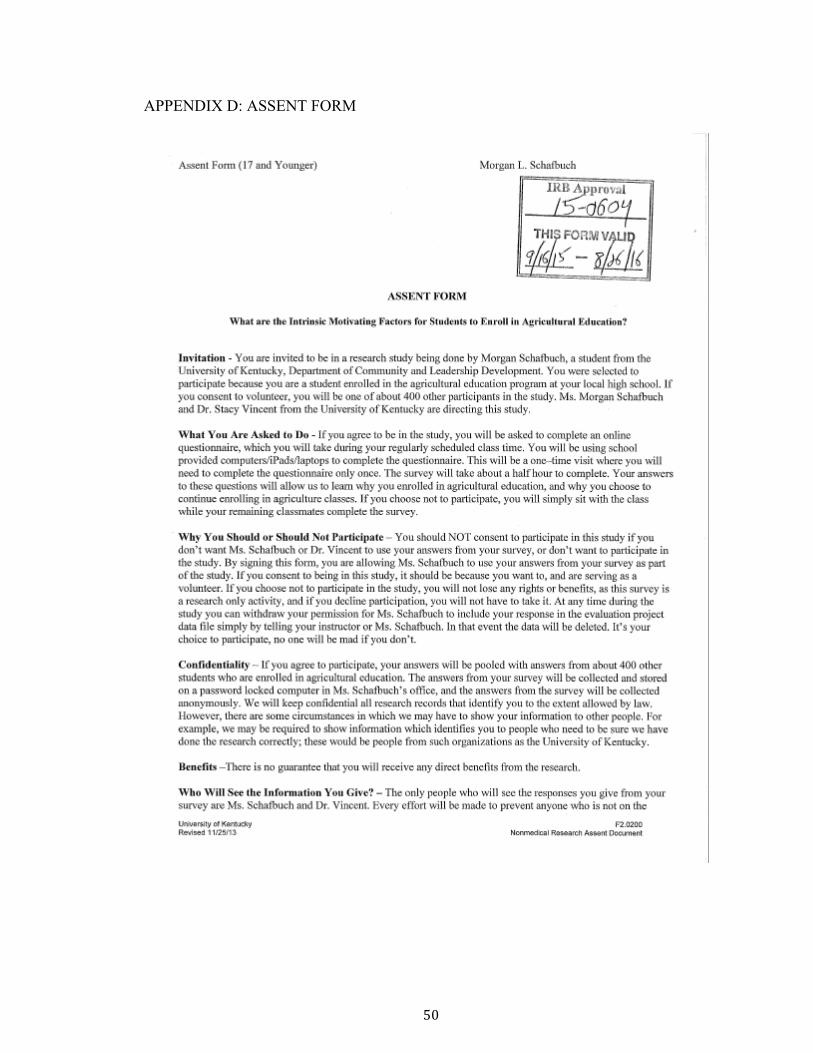
50
APPENDIX D: ASSENT FORM
51
52
APPENDIX E: PARENT CONSENT FORM

53
54
APPENDIX F: CONSENT FORM

55

56
APPENDIX G: SURVEY INSTRUMENT
Jessamine High School
Q31 First and last name as appears on roster
Q1 How good are you in your agriculture class(es)?
m Above Average (1) m Average (2) m Below Average (3)
Q2 If you were to list all of the students in your agriculture class from best to worst, where would you put yourself?
m One of the Best (1) m Above Average (2) m Average (3) m Below Average (4) m One of the Worst (5)
Q3 Some kids are better in one subject than another. For example, you might be better in agriculture than reading. Compared to most of your other school subjects, how good are you at agriculture?
m Much Better (1) m Better (2) m Somewhat Better (3) m About the Same (4) m Somewhat Worse (5) m Worse (6) m Much Worse (7)

57
Q4 How well do you expect to do in agriculture this year?
m Excellent (1) m Very Good (2) m Good (3) m Fair (4) m Poor (5)
Q5 How good are you at learning something new in agriculture?
m Excellent (1) m Very Good (2) m Good (3) m Fair (4) m Poor (5)
Q6 In general, how useful is what you learn in agriculture?
m Very Useful (1) m Useful (2) m Somewhat Useful (3) m Neutral (4) m Somewhat Useless (5) m Useless (6) m Very Useless (7)
Q7 For me, being good in agriculture is...
m Extremely Important (1) m Very Important (2) m Somewhat Important (3) m Neither Important nor Unimportant (4) m Somewhat Unimportant (5) m Very Unimportant (6) m Not at all Important (7)

58
Q8 In general, I find working on agriculture assignments
m Very Easy (1) m Easy (2) m Somewhat Easy (3) m Neutral (4) m Somewhat Difficult (5) m Difficult (6) m Very Difficult (7)
Q9 How much do you like being enrolled in agriculture?
m Like Extremely (1) m Like Very Much (2) m Neither Like nor Dislike (3) m Dislike Very Much (4) m Dislike Extremely (5)
Q10 Why did you enroll in your first agricultural education class?
Q11 What motivates you to stay enrolled in agricultural education?
Q12 To what degree does your teacher influence you to stay enrolled in agricultural education? 1 being low, 7 being high
m 1 (1) m 2 (2) m 3 (3) m 4 (4) m 5 (5) m 6 (6) m 7 (7)
Q12a If so, how? Q12a should be answered if the participant selected “4”, “5”, ‘6”, or “7” for Q12.
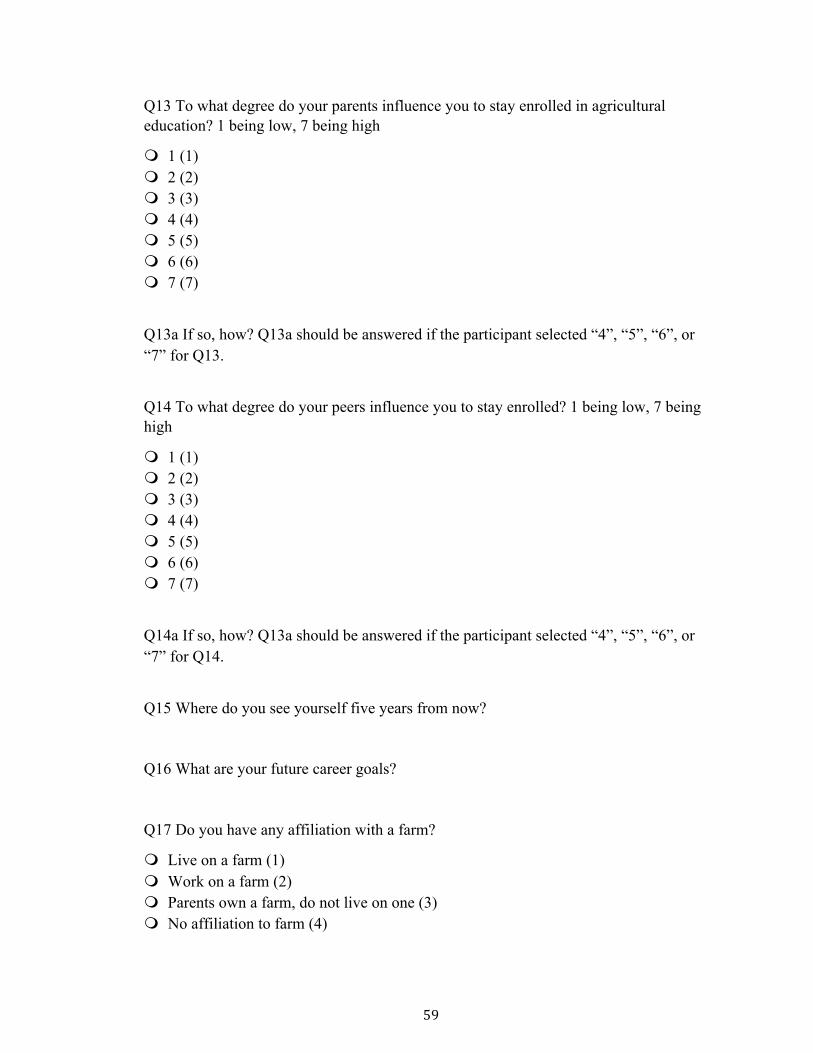
59
Q13 To what degree do your parents influence you to stay enrolled in agricultural education? 1 being low, 7 being high
m 1 (1) m 2 (2) m 3 (3) m 4 (4) m 5 (5) m 6 (6) m 7 (7)
Q13a If so, how? Q13a should be answered if the participant selected “4”, “5”, “6”, or “7” for Q13.
Q14 To what degree do your peers influence you to stay enrolled? 1 being low, 7 being high
m 1 (1) m 2 (2) m 3 (3) m 4 (4) m 5 (5) m 6 (6) m 7 (7)
Q14a If so, how? Q13a should be answered if the participant selected “4”, “5”, “6”, or “7” for Q14.
Q15 Where do you see yourself five years from now?
Q16 What are your future career goals?
Q17 Do you have any affiliation with a farm?
m Live on a farm (1) m Work on a farm (2) m Parents own a farm, do not live on one (3) m No affiliation to farm (4)

60
Q18 What is your gender?
m Male (1) m Female (2)
Q19 What grade are you currently in?
m 8th (1) m 9th (2) m 10th (3) m 11th (4) m 12th (5)
Q20 What agriculture pathway are you in? (List)
m Agribiotechnology (1) m Agribusiness (2) m Agriculture Power, Structural, and Technical Systems (3) m Animal Science (4) m Environmental Science/Natural Resources (5) m Food Science and Processings (6) m Plant and Horticulture Systems (7)
Q21 Where do you rank yourself in this pathway, among your peers?
m Above Average (1) m Average (2) m Below Average (3)
Q22 Was this pathway an interest before enrolling in agriculture?
m Yes (1) m No (2)
61
Q22a should be answered if “no” was selected for Q22.
Q22a If this pathway was not an interest previous to enrolling in agriculture, who inspired you to enroll in the pathway course(s)?
m Teacher (1) m Parent/Guardian (2) m Friends (3) m Other (4)
Answer If this pathway was not an interest previous to enrolling in agriculture, who inspired you to enroll in the pathway course Other Is Selected Q22b Explain
Q23 Why are you staying in this pathway?

62
REFERENCES
ACTE. (2015). Association for Career and Technical Education. https://www.acteonline.org/cte/#.VyOniNQrIdU
Atkinson, J. W. (1957). Motivational determinants of risk taking behavior. Psychological Review, 64, 359-372.
Bandura, A. (1977). Self-efficacy: Toward a unifying theory of behavioral change. Psychological Review, 84(2), 191-215.
Breja, L. & Dyer, J. (1999). Attitudes of Agriculture Teachers, Teacher Educators, and State Staff Toward Recruitment. Paper presented at the 26th Annual National Agricultural Education Research Conference, Orlando, FL.
Brown, B. L. (2003). The benefits of career and technical education. Retrieved March 7, 2004. http://calpro-online.org/eric/docs/tia00117.pdf
Case, L. D., & Cloud, A. (2007). Agricultural Education: Meeting Needs of Yesterday, Today and Tomorrow. The Agricultural Education Magazine, 80(3), 21.
Cohen, M. & Besharov, D. J. (2002). The role of career and technical education: Implications for the federal government. Paper commissioned for “Preparing America’s Future: The High School Symposium,” Washington, DC, April 4, 2002. (ED 466 939) http://www.ed/gov/about/offices/list/ovae/pi/hs/besharov/doc.
Creswell, J. W. & Creswell, J. D. (2005). Mixed methods research: Developments, debates, and dilemmas. Research in organizations: Foundations and methods of inquiry, 315-325.
Dailey, A. L., Conroy, C. A., & Shelley-Tolbert, C. A. (2001). Using agricultural education as the context to teach life skills. Journal of Agricultural Education, 42(1), 11-20. doi: 10.5032/jae.2001.01011
Dong, Y., Yang, Y., Tang, J., Yang, Y., & Chawla, N.V. (2014). Inferring user demographics and social strategies in mobile social networks. In Proceedings of the 20th ACM SIGKDD international conference on Knowledge discovery and data mining (pp. 15-24). ACM.
Dyer, J. E., & Osborne, E.W. (1994). The influence of science-based agriculture courses on the attitudes of Illinois guidance counselors. Paper presented at the 48th Annual Central Region Agricultural Educational Research Conference.
Dykeman, C., Wood, C., Ingram, M., Gitelman, A., Mandsager, N., Chen, M., & Herr,
63
E.L. (2003). Career development interventions and academic self-efficacy andmotivation: A pilot study. National Research Center.
Eccles, J., Adler, T.F., Futterman, R., Goff, S.B., Kaczala, C.M., et al. (1983). Expectancies, values, and academic behaviors. In Achievement and Achievement Motivation, ed. JT Spence, 75-146. San Francisco: Freeman.
Eccles, J. (2009). Who am I and what am I going to do with my life? Personal and collective identities as motivators of action. Educational Psychologist, 44(2), 78-89.
Field, A. (2013). Discovering statistics using IBM SPSS statistics. London, England: Sage. 4th Ed.
Godfray, H., Beddington, J., Crute, I., Haddad, L., Lawrence, D., Muir, J., Pretty, J., Robinson, S., Thomas, S., & Toulmin, C. (2010). Food security: The challenge of feeding 9 billion people. Science, 327(5967), 812-818. doi: 10.1126/science.1185383
Hoover, T.S. & Scanlon, D.C. (1991). Enrollment issues in agricultural education programs and FFA membership. Journal of Agricultural Education, 32(4), 2-10. doi: 10.5032/jae.1991.04002
Igo, C. G., & White, J. D. (1999). It has gone without saying too long already! Agricultural education magazine.
Johnson, D. M. (1996). Science credit for agriculture: Relationship between perceived effects and teacher support. Journal of Agricultural Education, 37(3), 9-17. doi: 10.5032/jae.1996.03009
Lortie, D. (1975). Schoolteacher. Chicago, ILL and London, England: The University of Chicago Press.
Meece, J. L., Wigfield, A., & Eccles, J. S. (1990). Predictors of math anxiety and its Influence on young adolescents’ course enrollment intentions and performance in mathematics. Journal of Educational Psychology, 82(1), 60-70.
Mewborn, D. S. & Tyminski, A. M. (2006). Lortie’s apprenticeship of observation revisited. For the Learning of Mathematics, 23(3), 30-32.
Moore, G. E. & Flowers, J. (1993). Strengthening programs through an expanded model for SAE. The Agricultural Education Magazine, 66(1), 18-19, 23.
National FFA. (2016). National FFA Organization, https://www.ffa.org/about/who-we- are/mission-motto
Talbert, B. A. & Balschweid, M. A. (2004). Engaging students in the agricultural

64
education model: Factors affecting student participation in the national FFA organization. Journal of Agricultural Education, 45(1), 29-41. doi: 10.5032/jae.2004.01029
Reis, R., & Kahler, A. A. (1997). Factors influencing enrollment in agricultural education programs as expressed by Iowa secondary agricultural education students. Journal of Agricultural Education, 38(2), 38-48.
Retallick, M. & Martin, R. (2008). Fifteen-year enrollment trends related to the three components of comprehensive agricultural education programs. Journal of Agricultural Education, 49(1), 28-38. doi: 10.2035/jae.2008.01028
Robinson, J. S. & Haynes, J. C. (2011). Value and expectations of supervised agricultural experiences as expressed by agriculture instructors in Oklahoma who were alternatively certified. Journal of Agricultural Education, 52(2), 47-57. doi: 10.5032/jae.2011.02047
Rokeach, M. (1973). The nature of human values (Vol. 438). New York: Free press.
Slusher, W.L., Robinson, J.S., & Edwards, M. C. (2011). Assessing the animal science technical skills needed by secondary agricultural education graduates for employment in the animal industries: A modified Delphi study. Journal of Agricultural Education, 52(2), 95-106. doi: 10.5032/jae.2011.02095
United States. National Commission on Excellence in Education. (1983). A nation at risk: The imperative for educational reform. An open letter to the American people. A report to the Nation and the Secretary of Education.
(USDA) 2015. 2010 Census urban and rural classification and urban area criteria. (Retreived May 2, 2016). http://www.census.gov/geo/reference/ua/urban-rural-2010.html
(USDA) 2015. Jessamine County population statistics. (Retrieved December 18, 2015) http://www.ers.usda.gov/data-products/county-level-data sets/population.aspx?reportPath=/State_Fact_Sheets/PopulationReport&fips_st=21
USDoE. (2010). Agricultural education in the 21st century: Secretary Arne Duncan’s remarks at the FFA convention. http://www.ed.gov/news/speeches/agricultural-education-21st-century-secretary-arne-duncans-remarks-ffa-convention
Velez, J. J. & Cano, J. (2008). The relationship between teacher immediacy and student motivation. Journal of Agricultural Education, 49(3), 76-86. doi: 10.5032.jae.2008.03076
Wigfield, A. (1994). Expectancy-value theory of achievement motivation: A

65
developmental perspective. Educational Psychology Review, 6(1), 49-78.
Wigfield, A. & Eccles, J. S. (2000). Expectancy-value theory of achievement motivation. Contemporary Educational Psychology, 25, 68-81. doi: 10.1006/ceps.1999.1015
Williams, C. (2011). Research methods. Journal of Business & Economics Research (JBER), 5(3).

66
VITA
1. Place of birth: Grinnell, Iowa2. Educational Institutions:
Iowa State University, 2014College of Agriculture and Life SciencesB.S. Agricultural and Life Sciences EducationUniversity of Kentucky, 2016College of Agriculture, Food, and Environment
3. Morgan Lynn Schafbuch