health expectancy belgium
TRANSCRIPT
I
Health Expectancy by socio-economic status in Belgium
Bossuyt N., Van Oyen H. Scientific Institute of Public Health Unit of Epidemiology Rue Juliette Wytsman 14 B-1050 Brussels ( 32 2 642 57 40 fax. 32 2 642 54 10 email: [email protected] http://www.iph.fgov.be/epidemio/
II
Table of contents
Table of contents II Table of tables IV Table of figures IX Summary X
1. Introduction 1 1. Socio-economic differences in health 2
1.1 Indications of socio-economic differences in health 2 1.2 Explanatory mechanisms for socio-economic differences in
health 3 1.3 Points of action for intervention 5 1.4 Development of the health of a population 5
1.4.1 Epidemiologic transition 5 1.4.2 Ageing 6 1.4.3 Recent developments in health indicators 7
2. Material and methods 10 2.1 Calculation method 10
2.1.1 Methods for calculating health expectancy 10 2.1.2 Practical application of the Sullivan method 10 2.1.3 Age groups 15
2.2 Figures 16 2.2.1 Breakdown of the mortality and morbidity data according to
socio-economic status 16 2.2.2 Mortality data of this study 18 2.2.3 Morbidity data in this study 18
2.3 Selection of indicators 22 2.3.1 Indicators of socio-economic status 22 2.3.2 Indicators of state of health 24
2.4 Measuring differences 26 2.5 Conversion from absolute to relative socio-economic status 27
3. Results 30 3.1 Life expectancy according to sex and education level 30 3.2 Prevalences according to education level 31 3.3 Life expectancy in good perceived health 34
3.3.1 Life expectancy in good perceived health according to sex 34 3.3.2 Life expectancy in good perceived health according to
education level 35
III
3.3.3 Partial life expectancy in good perceived health, age 25 to 75 years, according to relative education level 38
3.4 Disability-free life expectancy 42 3.4.1 Disability-free life expectancy according to sex 42 3.4.2 Disability-free life expectancy according to educational level 42 3.4.3 Partial disability-free life expectancy, aged 25 to 75 years,
according to relative education level 45 3.5 Life expectancy in good mental health 46
3.5.1 Life expectancy in good mental health according to sex 46 3.5.2 Life expectancy in good mental health according to
education level 46 3.5.3 Partial life expectancy in good mental health at the age of 25
to 75 years, according to relative education level 49 4. Discussion 51
4.1 Informative value of the basic data 51 4.2 The health expectancy indicator 52 4.3 Nature of the relationship between health expectancy and
education level 52 4.4 Size of the differences in health expectancy 53
4.4.1 Absolute education level 53 4.4.2 Relative education level 55
4.5 Which groups spend the most years in poor health? 56 5. Conclusion 58 6. References 59 7. Annexes 67
7.1 Questions in the 1991 census on the highest qualification achieved 67
7.2 Tables 18-20: Questions from the Health Interview Survey 1997 67 7.3 Results 72
7.3.1 Tables 21-26: Life expectancy 72 7.3.2 Tables 27- 36: Life expectancy in good perceived health 75 7.3.3 Tables 37- 66: Disability-free life expectancy and life
expectancy with limitations 79 7.3.4 Tables 67 - 76: Life expectancy in good mental health 91
IV
Table of tables Table 1 Sullivan’s Method: production of a life table (age groups of 5
years) 11 Table 2 Sullivan Method: addition of prevalences to the mortality table 14 Table 3 Subjects covered by the Health Interview Survey 1997 19 Table 4 Partial life expectancy, aged 25 to 75 years, according to relative
education level, Belgium, 1991-1996 31 Table 5 Age specific prevalence of poor perceived health according to sex,
Health Interview Survey 1997 , Belgium 32 Table 6 Age specific prevalence of disabilities according to sex, Health
Interview Survey 1997 , Belgium 32 Table 7 Age specific prevalence of poor mental health according to sex,
Health Interview Survey 1997 , Belgium 34 Table 8 Ratio of life expectancy in poor perceived health with respect to
the total life expectancy aged 25 years, Belgium, 1991-1996/1997 38
Table 9 Life expectancy in good perceived health, age 25 to 75 years, according to relative education level, Belgium, 1991-1996/1997 39
Table 10 Comparison of lost health expectancy, ages 25 to 75 years in men in Belgium, Norway and Finland (79) 41
Table 11 Comparison of lost health expectancy, ages 25 to 75 years in women in Belgium, Norway and Finland(79) 41
Table 12 Relationship of life expectancy with disabilities with respect to the life expectancy at the age of 25 years, Belgium, 1991-1996/1997 45
Table 13 Disability-free life expectancy, aged 25 to 75 years, according to relative education level, Belgium, 1991-1996/1997 45
Table 14 Ratio of life expectancy in poor mental health to total life expectancy at the age of 25 years, Belgium, 1991-1996/1997 49
Table 15 Life expectancy in good mental health, aged 25 to 75 years, according to relative education level, Belgium, 1991-1996/1997 50
Table 16 Partial life expectancy and health expectancy, aged 25 to 75 years according to relative education level, Belgium, 1991-1996/1997 55
Table 17 Part of question IV 7 in the 1991 census 67 Table 18 Questions on perceived health (Health Interview Survey 1997) 67 Table 19 Questionnaire on disabilities (CBS – WHO) (Health Interview Survey
1997) 68 Table 20 General Health Questionnaire 70 Table 21 Life expectancy according to education level. Men, Belgium, 1991-
1996 / 1997 72 Table 22 Life expectancy according to education level. Women, Belgium,
1991-1996 / 1997 72 Table 23 Partial life expectancy between ages 25 and 75 years according to
education level. Men, Belgium, 1991-1996 / 1997 73
V
Table 24 Partial life expectancy between ages 25 and 75 years according to education level. Women, Belgium, 1991-1996 / 1997 73
Table 25 Partial life expectancy between ages 25 and 75 years according to relative education level, Men, Belgium, 1991-1996 / 1997 74
Table 26 Partial life expectancy between ages 25 and 75 years according to relative education level, Women, Belgium, 1991-1996 / 1997 74
Table 27 Life expectancy in good perceived health according to education level . Men, Belgium, 1991-1996 / 1997 75
Table 28 Life expectancy in good perceived health according to education level, Men, 55+, Belgium, 1991-1996 / 1997 75
Table 29 Life expectancy in good perceived health according to education level, Women, Belgium, 1991-1996 / 1997 76
Table 30 Life expectancy in good perceived health according to education level Women, 55+, Belgium, 1991-1996 / 1997 76
Table 31 Partial life expectancy in good perceived health between ages 25 and 75 years according to education level Men, Belgium, 1991-1996 / 1997 77
Table 32 Partial life expectancy in good perceived health between ages 25 and 75 years according to education level Men, 55+, Belgium, 1991-1996 / 1997 77
Table 33 Partial life expectancy in good perceived health between ages 25 and 75 years according to relative education level, Men, Belgium, 1991-1996 / 1997 77
Table 34 Partial life expectancy in good perceived health between ages 25 and 75 years according to education level Women, Belgium, 1991-1996 / 1997 78
Table 35 Partial life expectancy in good perceived health between ages 25 and 75 years according to education level Women, 55+, Belgium, 1991-1996 / 1997 78
Table 36 Partial life expectancy in good perceived health between ages 25 and 75 years according to relative education level, Women, Belgium, 1991-1996 / 1997 78
Table 37 Disability-free life expectancy according to education level Men, Belgium, 1991-1996 / 1997 79
Table 38 Disability-free life expectancy according to education level Men, 55+, Belgium, 1991-1996 / 1997 79
Table 39 Life expectancy with moderate limitations according to education level Men, Belgium, 1991-1996 / 1997 80
Table 40 Life expectancy with moderate limitations according to education level Men, 55+, Belgium, 1991-1996 / 1997 80
Table 41 Life expectancy with serious limitations according to education level Men, Belgium, 1991-1996 / 1997 81
Table 42 Life expectancy with serious limitations according to education level Men, 55+, Belgium, 1991-1996 / 1997 81
VI
Table 43 Disability-free life expectancy according to education level Women, Belgium, 1991-1996 / 1997 82
Table 44 Disability-free life expectancy according to education level Women, 55+, Belgium, 1991-1996 / 1997 82
Table 45 Life expectancy with moderate limitations according to education level Women, Belgium, 1991-1996 / 1997 83
Table 46 Life expectancy with moderate limitations according to education level Women, 55+, Belgium, 1991-1996 / 1997 83
Table 47 Life expectancy with serious limitations between ages 25 and 75 years according to education level Women, Belgium, 1991-1996 / 1997 84
Table 48 Partial life expectancy with serious limitations between ages 25 and 75 years according to education level Women, 55+, Belgium, 1991-1996 / 1997 84
Table 49 Partial disability-free life expectancy between ages 25 and 75 years according to education level Men, Belgium, 1991-1996 / 1997 85
Table 50 Partial disability-free life expectancy between ages 25 and 75 years according to education level Men, 55+, Belgium, 1991-1996 / 1997 85
Table 51 Partial disability-free life expectancy between ages 25 and 75 years according to relative education level, Men, Belgium, 1991-1996 / 1997 85
Table 52 Partial life expectancy with moderate limitations between ages 25 and 75 years according to education level Men, Belgium, 1991-1996 / 1997 86
Table 53 Partial life expectancy with moderate limitations between ages 25 and 75 years according to education level Men, 55+, Belgium, 1991-1996 / 1997 86
Table 54 Partial life expectancy with moderate limitations between ages 25 and 75 years en fonction du niveau relatif d’enseignement. Men, Belgium, 1991-1996 / 1997 86
Table 55 Partial life expectancy with serious limitations between ages 25 and 75 years according to education level Men, Belgium, 1991-1996 / 1997 87
Table 56 Partial life expectancy with serious limitations between ages 25 and 75 years according to education level Men, 55+, Belgium, 1991-1996 / 1997 87
Table 57 Partial life expectancy with serious limitations between ages 25 and 75 years en fonction du niveau relatif d’enseignement. Men, Belgium, 1991-1996 / 1997 87
Table 58 Partial disability-free life expectancy between ages 25 and 75 years according to education level Women, Belgium, 1991-1996 / 1997 88
Table 59 Partial disability-free life expectancy between ages 25 and 75 years according to education level Women, 55+, Belgium, 1991-1996 / 1997 88
VII
Table 60 Partial disability-free life expectancy between ages 25 and 75 years according to education level Women, Belgium, 1991-1996 / 1997 88
Table 61 Partial life expectancy with moderate limitations between ages 25 and 75 years according to education level Women, Belgium, 1991-1996 / 1997 89
Table 62 Partial life expectancy with moderate limitations between ages 25 and 75 years according to education level Women, 55+, Belgium, 1991-1996 / 1997 89
Table 63 Partial life expectancy with moderate limitations between ages 25 and 75 years according to education level Women, Belgium, 1991-1996 / 1997 89
Table 64 Partial life expectancy with serious limitations between ages 25 and 75 years according to education level Women, Belgium, 1991-1996 / 1997 90
Table 65 Partial life expectancy with serious limitations between ages 25 and 75 years according to education level Women, 55+, Belgium, 1991-1996 / 1997 90
Table 66 Partial life expectancy with serious limitations between ages 25 and 75 years according to relative education level, Women, Belgium, 1991-1996 / 1997 90
Table 67 Life expectancy in good mental health according to education level Men, Belgium, 1991-1996 / 1997 91
Table 68 Life expectancy in good mental health according to education level Men, 55+, Belgium, 1991-1996 / 1997 91
Table 69 Life expectancy in good mental health according to education level Women, Belgium, 1991-1996 / 1997 92
Table 70 Life expectancy in good mental health according to education level Women, 55+, Belgium, 1991-1996 / 1997 92
Table 71 Partial life expectancy in good mental health between ages 25 and 75 years according to education level, Men, Belgium, 1991-1996 / 1997 93
Table 72 Partial life expectancy in good mental health between ages 25 and 75 years according to education level, Men, 55+, Belgium, 1991-1996 / 1997 93
Table 73 Partial life expectancy in good mental health between ages 25 and 75 years according to relative education level, Men, Belgium, 1991-1996 / 1997 93
Table 74 Life expectancy in good mental health between ages 25 and 75 years according to education level, Women, Belgium, 1991-1996 / 1997 94
Table 75 Partial life expectancy in good mental health between ages 25 and 75 years according to education level , Women, 55+, Belgium, 1991-1996 / 1997 94
VIII
Table 76 Partial life expectancy in good mental health between ages 25 and 75 years according to education level , Women, Belgium, 1991-1996 / 1997 94
IX
Table of figures Figure 1 Education breakdown according to age (men, 1991 census) 28 Figure 2 Breakdown of education according to age (women, 1991 census) 28 Figure 3 Regression method for cohort i 29 Figure 4 Life expectancy at 25 years according to education level,
Belgium, 1991-1996 31 Figure 5 Prevalence of poor perceived health according to education level,
standardised according to age and sex, with 95% confidence intervals, Health Interview Survey 1997 , Belgium 33
Figure 6 Prevalence of physical disabilities according to education level, standardised according to age and sex, with 95% confidence intervals, Health Interview Survey 1997 , Belgium 33
Figure 7 Prevalence of poor mental health according to education level, standardised according to age and sex, with 95 % confidence interval, Health Interview Survey 1997 , Belgium 35
Figure 8 Life expectancy in good perceived health aged 25 years according to education level, men, Belgium, 1991-1996/1997 36
Figure 9 Life expectancy in good perceived health at 25 years of age according to education level, women, Belgium, 1991-1996/1997 37
Figure 10 Life expectancy in good perceived health, aged 25 to 75 years, according to relative education level (Belgium, 1991-1996/1997) 40
Figure 11 Disability-free life expectancy at 25 years according to education level, men, Belgium, 1991-1996/1997 42
Figure 12 Disability-free life expectancy at 25 years of age according to education level, women, Belgium,1991-1996/1997 43
Figure 13 Partial disability-free life expectancy at 25 years of age according to relative education level, Belgium, 1991-1996/1997 46
Figure 14 Life expectancy in good mental health at the age of 25 years, men, Belgium, 1991-1996/1997 47
Figure 15 Life expectancy in good mental health at the age of 25 years, women, Belgium, 1991-1996/1997 48
Figure 16 Life expectancy in good mental health, aged 25 to 75 years, according to relative education level, Belgium, 1991-1996/1997 50
X
Summary Various international studies have demonstrated socio-economic differences in health, both with regard to mortality and morbidity. In certain western countries it has turned out that, despite increased welfare, these differences have not been reduced and have even increased. For some years, it was difficult to do such studies in Belgium as information on mortality and morbidity and information on socio-economic status could not be linked together at an individual level. Recent initiatives, such as linking the 1991 census to the National Register and the Health Interview Survey 1997, have indeed enabled individual links to be made and have given rise to a number of new studies in this field. The purpose of this study is to describe the link between socio-economic status and health on the basis of a composite indicator: ‘health expectancy’. The state of health of a population can be described by only using the mortality or morbidity of the population. This approach forms the basic information. The figures are clear and enable different populations in time and space to be easily compared to one another. On the other hand, only one aspect of the state of health is revealed and no account is taken of the often complex interaction between mortality and morbidity. That is why the state of health of a population is increasingly assessed using a composite indicator that contains information on both mortality and morbidity. Monitoring the state of health over time using such an indicator, e.g. health expectancy, can also provide more clarity over whether morbidity is compressing or expanding. Analogous to life expectancy, health expectancy gives the number of years that a person of a certain age can still expect to live in good health. The benefits of health expectancy over other composite indicators, such as DALY (Disability Adjusted Life Years), lie in its simplicity and conceptual relationship with a well understood indicator (life expectancy), the availability of basic data, and the scope for visual presentation. Health is a very broad concept and can be measured in diverse ways depending on the interpretation. Better understanding of the health of a population is obtained by investigating health through a number of dimensions. That is why in this research the health expectancy was calculated for 3 health conditions: perceived health, the absence of limiting long-standing illness and mental health.
XI
Although the three most important dimensions of socio-economic status - profession, income and education - are strongly related to one another, each has its own specific influence on health. Differences in health expectancy have only been determined against one dimension in this study, i.e. the highest level of education reached. This was done for practical reasons, i.e. the availability of probabilities of death according to educational level. In addition, the education dimension has some clear benefits compared with other dimensions: the information is available for practically everyone in our society and remains relatively stable over time. The various health expectancy indicators have been calculated using the Sullivan method. This method uses probabilities of death and the prevalence of health problems. The probabilities of death were obtained by linking the 1991 census to the National Register over a 5 year period (1991-1996). The prevalences came from the Health Interview Survey 1997. For a number of reasons (accounting for the relative size of each educational group, correction for the cohort effect, international comparability) the differences in health expectancy have not only been determined according to absolute educational level, but also relative educational level. That is why the age-specific probabilities of death and prevalences were again weighted using a weighted linear regression model for each age. The categorical variable of education is thereby converted into a numeric scale from 0 to 100 by allocating a certain position in the socio-economic hierarchy to each education category. The positioning of certain education classes (mainly general secondary education) is not determined empirically. This also has to be taken into account in the interpretation of the results obtained with this method. Both the absolute and relative differences in health between different socio-economic groups can be calculated. Relative differences are generally easier to understand, but the importance for general public health is sometimes demonstrated more clearly by absolute differences. That is why the emphasis has been placed on the absolute differences in the results of this study and the relative differences have been added more as a supplement. As the health expectancy indicator contains information on mortality and morbidity, there are many different aspects of the indicator that can be compared. The absolute difference in total health expectancy (the difference in years) between two groups is an aspect that can almost always be compared. The partial life and health expectancies enable a large number of other aspects to be compared, such as life lost and health expectancy between two age groups.
XII
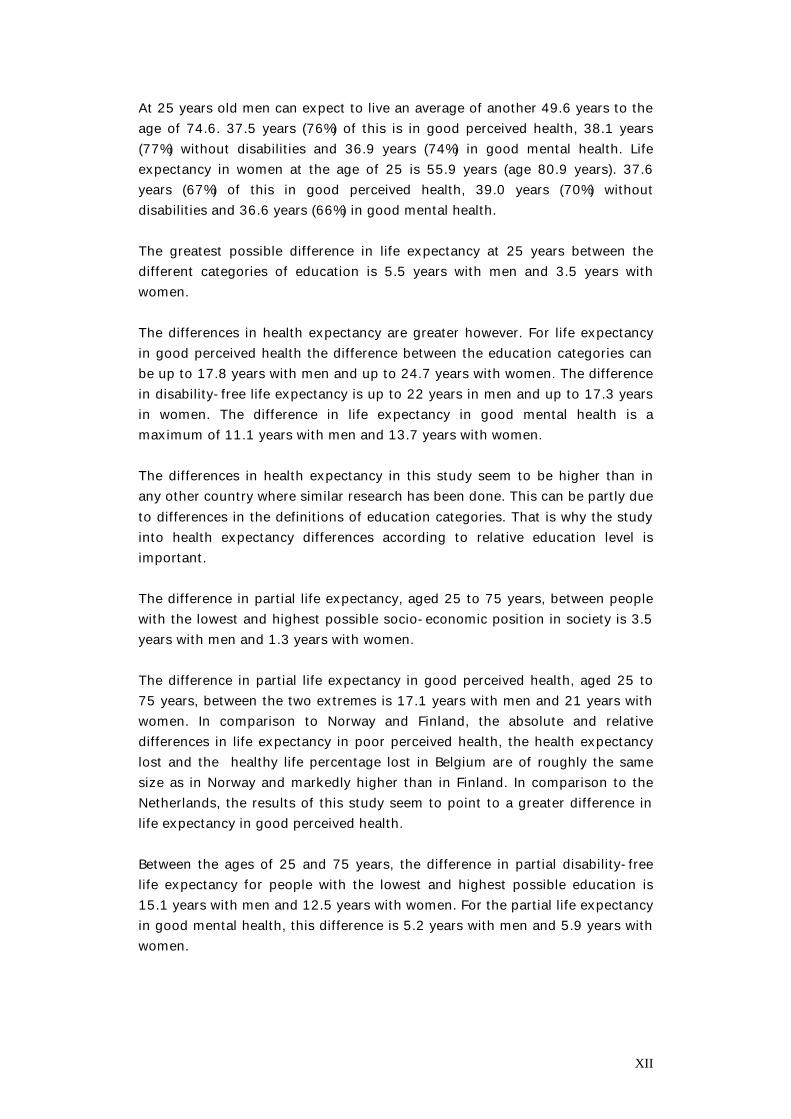
At 25 years old men can expect to live an average of another 49.6 years to the age of 74.6. 37.5 years (76%) of this is in good perceived health, 38.1 years (77%) without disabilities and 36.9 years (74%) in good mental health. Life expectancy in women at the age of 25 is 55.9 years (age 80.9 years). 37.6 years (67%) of this in good perceived health, 39.0 years (70%) without disabilities and 36.6 years (66%) in good mental health. The greatest possible difference in life expectancy at 25 years between the different categories of education is 5.5 years with men and 3.5 years with women. The differences in health expectancy are greater however. For life expectancy in good perceived health the difference between the education categories can be up to 17.8 years with men and up to 24.7 years with women. The difference in disability-free life expectancy is up to 22 years in men and up to 17.3 years in women. The difference in life expectancy in good mental health is a maximum of 11.1 years with men and 13.7 years with women. The differences in health expectancy in this study seem to be higher than in any other country where similar research has been done. This can be partly due to differences in the definitions of education categories. That is why the study into health expectancy differences according to relative education level is important. The difference in partial life expectancy, aged 25 to 75 years, between people with the lowest and highest possible socio-economic position in society is 3.5 years with men and 1.3 years with women. The difference in partial life expectancy in good perceived health, aged 25 to 75 years, between the two extremes is 17.1 years with men and 21 years with women. In comparison to Norway and Finland, the absolute and relative differences in life expectancy in poor perceived health, the health expectancy lost and the healthy life percentage lost in Belgium are of roughly the same size as in Norway and markedly higher than in Finland. In comparison to the Netherlands, the results of this study seem to point to a greater difference in life expectancy in good perceived health. Between the ages of 25 and 75 years, the difference in partial disability-free life expectancy for people with the lowest and highest possible education is 15.1 years with men and 12.5 years with women. For the partial life expectancy in good mental health, this difference is 5.2 years with men and 5.9 years with women.
XIII
The absolute number of years in poor perceived health is greater with women than men in all education categories. Between their twenty fifth year and the time of death, the lowest educated men will have almost 10 more years in poor perceived health in comparison to the higher educated people, while this figure can reach 21.2 years with women. The maximum difference in years with disabilities is 16.6 years with men and 14.2 years with women, and the maximum difference in poor mental health is 8.6 years with men and 13.4 years with women. The conclusions of this study agree with those from comparable international research. People with a low position in the socio-economic hierarchy, in this case the highest education level attained, have shorter lives than people with a higher position. But they also have fewer years in good perceived health. Moreover, in their shorter lives, they can expect more years in poor health, both absolutely and relatively. The inequality is thus greater in terms of quality of life than quantity. The purpose of this study is to describe and quantify the differences according to socio-economic gradient on the basis of the highest education level reached. The fact that the differences in life expectancy are less than with health expectancies points to the existence of a compression of morbidity according to socio-economic position. The determination of the size of these differences is a criterion for evaluating policy measures in order to reduce this inequality in health. Intervention strategies must be aimed at the intermediate factors that determine the relationship between education level and health. These factors are, for example, behaviour and lifestyle (smoking behaviour, diet, etc), use of health facilities and structural factors (living and working conditions, etc). In the immediate future, targeted research is required in the following fields: • Determination of the relative importance of these intermediate factors in
Belgium with respect to the relationship between socio-economic position and health.
• Determination of the impact of chronic diseases and conditions on the quality and quantity of life - by studying the effect of the theoretical elimination of certain diseases
on life expectancy and disability-free life expectancy. - from the breakdown of the differences in life expectancy and disability-
free life expectancy according to socio-economic status in order to examine what diseases are responsible for these differences.
1
Introduction The purpose of this study is to describe and quantify the link between socio-economic status and health using a composite indicator: ‘health expectancy’. Socio-economic status is determined on the basis of one dimension, the highest education level reached. The study fits in with the AGORA programme (research agreement No. AG/03/007-AG/50/021) of the Departments of Scientific, Technical and Cultural Affairs (DSTC). The purpose of the AGORA project is to facilitate access to the information content of the federal public databases, to take measures to scientifically support their usage on request of the institutions concerned, and to supplement the information by collecting surveys of socio-economic data of a non-government nature. This study is based on a combination of data from the census (1991), the National Register (1991-1996) and the national health survey (1997). The project was done by the Epidemiology Department of the Scientific Institute of Public Health, together with the Demographics Centre1 of the Free University of Brussels and the Population Sciences and Socio-Scientific Methodology Department2 of the University of Gent. It was done between 1 February 1999 and 31 December 1999. In this report a brief overview is first given of the general problem and the way in which socio-economic differences in health are demonstrated. Then the aim and results of this study are described.
1 R. Lesthaeghe, P. Deboosere & S. Gadeyne 2 H. Page
2
1. Socio-economic differences in health 1.1 Indications of socio-economic differences in health Resources are not equally distributed between individuals in our society. A social hierarchy has developed on the basis of this distribution. The position of a person within this hierarchy determines his socio-economic status (1). The relationship between socio-economic status (SES) and health has been studied for a long time. In the United Kingdom, as early as 1837, at the time of the foundation of the General Register Office, William Farr endeavoured to trace determinants of mortality by analysing national mortality statistics, including socio-economic factors (2). Since the beginning of the Twenties, the report of the Registrar General has contained an analysis of mortality according to social class for employed and retired men and for children. Five social classes are distinguished on the basis of occupation. Children are classified according to the profession of their father (3) . After World War II it was generally expected that socio-economic mortality differences would become smaller with increasing welfare. The Black Report(4)(5) in 1980, however, found that the differences in the United Kingdom had not disappeared, but on the contrary had actually increased. These findings lay at the basis of renewed attention to social inequality in health during the Eighties and Nineties, in the form of new studies and intervention strategies as developed by the World Health Organisation, for example. The World Health Organisation mainly uses the concept of ‘equity in health’ here. This term means the condition in which all people have a fair opportunity to realize their full health potential , rather than a situation in which everyone is in the same state of health. In 1980 the member states of the Regional Office for Europe of the World Health Organisation, which includes Belgium, undertook to work on the joint health strategy ‘Health for All by the Year 2000’. In 1984, 38 objectives were accepted in this respect by the member states. The ultimate objective was that ‘in the year 2000 the current inequalities in the state of health between countries and (socio-economic) groups within countries had to be reduced by at least 25%, by improving the level of health in the less favourable countries and groups’(6). Attention to socio-economic differences in health is again central to ‘Health 21’ as well(7).
3
Many international studies over the last twenty years have shown the existence of socio-economic differences in health in Western Europe and Scandinavia(8). Differences in mortality according to profession or education have been demonstrated in Finland(9), Norway(8), Italy(8), Denmark(10), Sweden(11), France(12), the United Kingdom (3), Ireland, Switzerland, Spain and Portugal(13,14). Differences in morbidity (defined, for example, as perceived health , presence of chronic conditions, long-term disabilities and long-term health problems) have also been found according to professional class, income and education(14). Over the last twenty years in Belgium, research has also been done into social inequality and health. These studies were often limited because individual health information could not be linked to individual socio-economic information. This meant that the majority of research in the period 1980 – 1990 mainly consisted of ecological studies that described geographic differences and differences in mortality at birth. Studies into socio-economic differences in morbidity were often based on one-off and rather small-scale surveys that sometimes related to one specific condition (15)(16-33) The situation has changed more recently, however. The link between the individual socio-economic information from the 1991 census to the National Register and the data on causes of death have made it possible to further explore the phenomenon of differential mortality. In this way, for example, differential mortality was found for a number of indicators of socio-economic status in men aged 45-64 years that was comparable to the trends shown by the international literature from Europe and the United States (34). Alongside this, the Health Interview Survey 1997 provided new opportunities to establish socio-economic differences in health. The 'health expectancy' health indicator combines information on both mortality and morbidity. Data from 1989 have shown that there are geographic differences in health expectancy between Flanders and Wallonia (35).
1.2 Explanatory mechanisms for socio-economic differences in health
The foregoing shows that there are many indications of a relationship between health and socio-economic status. There are, however, different hypotheses on the direction of this relationship and what underlying mechanisms can explain this relationship. A brief description of the commonest theories now follows.
4
According to the artefact hypothesis, observed differences in health according to a socio-economic gradient largely rest on artefacts within the research. This bias can appear in different ways such as the 'numerator-denominator' bias. This error occurs if the information on socio-economic status for the number of unhealthy people or deaths and for the total population come from different sources, each with their own definitions. For example, one source considers the last active profession as a socio-economic indicator, the other the current profession(36). Many studies suffer from a form of bias and a number of the observed socio-economic differences in health possibly originate in part from this bias. The fact that indications of socio-economic differences in health are always found, from the most divergent research methods, makes it reasonable to assume that such differences are really there(37). The social selection hypothesis states that the state of health of a person influences his socio-economic status. The socio-economic position is thus determined by the state of health and not vice-versa. This theory assumes that there is a selection in social mobility on the basis of health. The hypothesis of genetic predisposition is closely linked to the selection theory. Genetically determined conditions can influence the socio-economic status. Through social mobility, people with an unfavourable genetic predisposition are concentrated over time into the lowest social groups. According to current scientific literature there are indeed indications of such selection processes, but to an insufficient extent to be able to adequately explain all social health differences(37). The social causation theory is based on the assumption that the socio-economic status has an influence, via intermediate factors, on the state of health. Cultural factors are closely connected to socio-economic position and also play a role here. Social health differences arise if the factors that influence health are unequally distributed between different socio-economic groups. The first group of intermediate factors are the behavioural factors and way of life, such as diet, smoking, physical exercise, risk behaviour and the use of health facilities. The next group contains the structural factors, which comprise the material living and working conditions, the individual financial condition and health insurance. Psychosocial factors, finally, also influence health. This heading includes stress factors (such as life events) and mechanisms for dealing with these stress factors, such as the individual coping style and the social network(37). Not only the current socio-economic position, but also the socio-economic position during the total course of life would show a causal link with health(38).
5
1.3 Points of action for intervention Socio-economic differences in health constitute an important challenge for policy makers as the differences are often considered to be unfair and avoidable up to a certain level. In this sense it is both reasonable and effective to reduce this excess of health problems in the disadvantaged groups (1), and to do this by acting on the intermediate factors whereby the socio-economic status impacts on health, both in terms of supply of medical services and individual circumstances and behaviour. In the first place, a concrete strategy presupposes information on the extent of the problem and an understanding of the most important determinants. Different points of intervention are possible: proceeding on the basis of a specific health problem, an important causal factor or a group with an increased risk(39).
1.4 Development of the health of a population 1.4.1 Epidemiologic transition Over the last 150 years, the state of health of the population has changed markedly. The fall in mortality in this period has been linked to a certain pattern of disease. This development was described in 1971 by A. Omran as the ‘epidemiologic transition’(40). The theory is based on the assumption that mortality is a fundamental factor in population dynamics. Up until halfway through the seventeenth century, mortality worldwide was highly variable but always very high, and the world population hardly increased at all. As of 1650 the world population growth curve lost its cyclic pattern and the population started to grow at increasing rates. However, mortality remained at a very high level. Around 1850, in the western world mortality began to fall and life expectancy at birth increased. This phenomenon of falling mortality with a shift in the death rates from high and unstable levels to low and more stable levels, is called the ‘demographic transition’. During this transition there was a long-term shift in the causes of mortality and disease patterns, such that infectious conditions that occurred in cyclic epidemics were replaced by degenerative and man-caused conditions that did not have a cyclic nature. This change is defined as the epidemiologic transition. The most radical changes in health and disease patterns occurred in children and young women, probably because these groups were the most sensitive to infections and diseases as a result of deficiencies.
6
The epidemiologic transition is divided into different periods. The first stage is characterised by epidemics and famine and the vast majority of death could be attributed to infectious conditions, malnutrition and pregnancy complications. In the second stage the pandemics decreased. Infectious conditions lost their importance while cardiovascular conditions, cancer and accidents increasingly set the picture. The last phase is completely characterised by degenerative conditions and conditions caused by man. At the end of this last stage mortality in old age decreased such that the age at which degenerative conditions cause death is greater. The last 25 years have seen the greatest fall in mortality in the oldest age groups. This phenomenon has been so unexpected and spectacular that some people indicate this period as the fourth stage of the epidemiologic transition(41). The shift in health and disease patterns, which characterises the epidemiologic transition, is not only closely associated with the demographic transition, but also with socio-economic development. A fall in mortality and infections results in more effective labour and economic productivity as a result of the better functioning of the professionally active population and a rise in the proportion of children who will survive and grow into productive members of society (40). 1.4.2 Ageing As a result of these transitions, and in particular the increase in life expectancy, the world population has not only become larger, but is also markedly older on average. The question is, however, how long this development will continue and what the consequences will be on the quality of life, for example. The greater the average life expectancy, the more the mortality figures have to fall in order to obtain a significant rise. On the assumption that life expectancy will no longer rise so spectacularly, the proportion of old people in society will still not immediately stabilise. Two phenomena have had a great influence on the ageing of the population. The baby boom after World War II increased the basis of the age structure of the total population. The ageing of this generation, together with the fall in fertility rates, provides for a faster ageing of the population. Alongside this, the process is further accelerated by the decrease in mortality at very old age (42). It is not clear how the ageing of the population influences morbidity. A pessimistic view (‘expansion of morbidity’) sees an increase in morbidity. On the one hand medical intervention is reducing the number of fatal complications of degenerative conditions such that chronically ill people live longer(43). On the other hand, falling mortality in the oldest age groups means that people reach an age where the risk of non-fatal medical conditions is very high (44).
7
A more optimistic view was presented in 1980 by Fries(45). His model (‘compression of morbidity’) assumes a maximum possible lifetime, a genetically determined limit, for an individual who is not under the influence of exogenous risk factors(46). Chronic conditions can be postponed until later in life by a healthy lifestyle, for example. Chronic morbidity is then compressed in the shorter period between the commencement of the morbidity and the predetermined age of death. This results in a fall in the total quantity of morbidity. A third hypothesis (the equilibrium) has been developed by Manton(47). He states that there will be an increase in the number of years of morbidity with a further rise in life expectancy, but the number of years of serious morbidity and disabilities will remain constant because medical intervention reduces the progression of chronic conditions. In this way a dynamic equilibrium is reached between life expectancy and functioning in old age. There are currently insufficient empirical data to rule out one or another hypothesis. The terms compression and expansion of morbidity can not only be applied to development in time, but also in the mutual comparison of different groups. 1.4.3 Recent developments in health indicators The health of a population is traditionally expressed on the basis of life expectancy. The data are generally known for members of the population and the definition is unambiguous such that the measure easily allows populations to be compared with one another over time and space. It was also accepted for a long time that there was a positive association between mortality and morbidity. A fall in mortality was associated with a fall in morbidity(43,46-48). The previous paragraphs show, however, that this relationship cannot be accepted just like that. Furthermore, the impact on mortality and morbidity is highly condition related. Some medical conditions, for example, result in rapid death with a very short period of morbidity. Other imply a long period of morbidity, but do not lead to death(46,49). In addition, as a result of the occurrence of morbidity or mortality, a shift in risk factors can occur or a stronger or weaker population may arise. These factors in turn have an impact on overall morbidity and mortality(46).
8
The state of health of a population is thus better assessed on the basis of an indicator that includes information on mortality and morbidity. Monitoring the state of health over time on the basis of such an indicator can provide greater clarity as to whether there is compression or expansion of morbidity. In the Sixties the idea arose of integrating the quality and quantity of life into one single health indicator. Sanders(50) presented figures in 1964 on linking the ability to fulfil a social role with mortality figures. An index, the health expectancy, was calculated on the basis of a changed mortality table. The calculation in the way presented by Sanders was first applied in practice by Sullivan in the early Seventies (51). Health expectancy gives the average number of years that a person can expect to live in a certain state of health, if the current patterns of morbidity and mortality continue to apply. It is a generic term comprising a family of indicators. An example of such an indicator is the disability-free life expectancy, the number of years that a person can expect to live on average without disabilities (52). Health expectancy has a number of benefits over other composite health measure, such as the Daly (Disability-adjusted life years)(58). The visual presentation of the indicator contains a lot of information in a single figure. Moreover, the health expectancy is simple to calculate and is an extension of a generally known concept: life expectancy. The basic data can be collected relatively easily and are therefore often available. In 1980, Colvez calculated the disability-free life expectancy for the United States and came to the conclusion that the gain in life expectancy between 1966 and 1978 only led to an increase in disabilities in the population. This gave rise to a series of studies in Europe, the United States and Canada in which the health expectancy was calculated on the basis of the Sullivan (53) method. The international network, REVES (The International Network on Health expectancy and the Disability Process), was set up in 1989. In 1994, the European network, Euro-REVES, was added to this. The objective is to promote the indicator for policy purposes and to harmonise the calculation methods (54).
9
In 1996, the indicator had been calculated for 37 countries. A survey of the countries of the European Union showed that this was the case for 11 of the 15 member states(54). The results have been used in policy documents in six countries. In most other countries pronounced interest in the indicator has been shown by policy makers. In Belgium the publication of results(35,55,56) led to the approval of the proposal to organise a national health survey. One of the research reports describes health expectancy as an instrument for planning and policy making in healthcare (57).
10
2. Material and methods 2.1 Calculation method 2.1.1 Methods for calculating health expectancy
2.1.1.a Multistate method The multistate method uses incidences (59). During his life, a person goes through a number of (reversible) health levels. The health expectancy can be calculated at a certain point in time on the basis of estimates of the incidence of the transition between these health levels at that age and at that time. This requires longitudinal data. The collection of longitudinal data relating to the transitions between different health levels is a very long and labour intensive process. Such data are not available for Belgium.
2.1.1.b Sullivan method In 1971 Sullivan developed an alternative method for calculating health expectancy. He used age specific probabilities of death and age specific prevalences of the different states of health, instead of incidences of the transitions between the different health levels. The calculated health expectancy gives the current state of health of a population, irrespective of the age structure of this population. Age specific prevalences are, in contrast to incidence data, available on a large scale. The results of the Sullivan method are comparable to those of the multistate method, on condition that there are no sudden changes in incidence or mortality. The health expectancy calculated using the Sullivan method reflects the state of health of a population as it has grown at that time, while the multistate method gives the health expectancy at an individual level based on extrapolations from the current transitions between health levels(57,60). 2.1.2 Practical application of the Sullivan method The following is based on the book, 'The life table and its applications', by C. L. Chiang(61) and reports regarding the REVES network and a previous DSTC project(57,59). For more detailed information we refer to these basic works.
2.1.2.a Construction of a life table
11
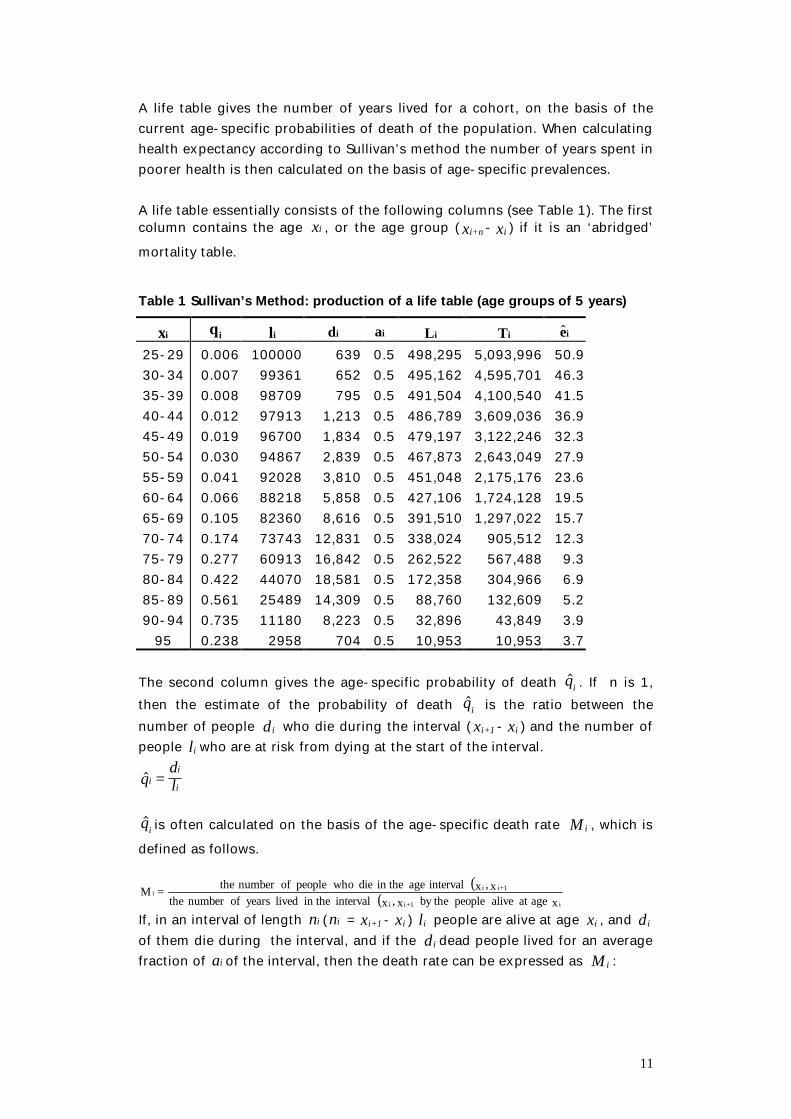
A life table gives the number of years lived for a cohort, on the basis of the current age-specific probabilities of death of the population. When calculating health expectancy according to Sullivan’s method the number of years spent in poorer health is then calculated on the basis of age-specific prevalences. A life table essentially consists of the following columns (see Table 1). The first column contains the age ix , or the age group ( x n+i - xi ) if it is an ‘abridged’ mortality table. Table 1 Sullivan’s Method: production of a life table (age groups of 5 years)
ix iq il id ia iL iT ie 25-29 0.006 100000 639 0.5 498,295 5,093,996 50.9 30-34 0.007 99361 652 0.5 495,162 4,595,701 46.3 35-39 0.008 98709 795 0.5 491,504 4,100,540 41.5 40-44 0.012 97913 1,213 0.5 486,789 3,609,036 36.9 45-49 0.019 96700 1,834 0.5 479,197 3,122,246 32.3 50-54 0.030 94867 2,839 0.5 467,873 2,643,049 27.9 55-59 0.041 92028 3,810 0.5 451,048 2,175,176 23.6 60-64 0.066 88218 5,858 0.5 427,106 1,724,128 19.5 65-69 0.105 82360 8,616 0.5 391,510 1,297,022 15.7 70-74 0.174 73743 12,831 0.5 338,024 905,512 12.3 75-79 0.277 60913 16,842 0.5 262,522 567,488 9.3 80-84 0.422 44070 18,581 0.5 172,358 304,966 6.9 85-89 0.561 25489 14,309 0.5 88,760 132,609 5.2 90-94 0.735 11180 8,223 0.5 32,896 43,849 3.9
95 0.238 2958 704 0.5 10,953 10,953 3.7 The second column gives the age-specific probability of death iq$ . If n is 1, then the estimate of the probability of death iq$ is the ratio between the number of people id who die during the interval ( i+1x - ix ) and the number of people il who are at risk from dying at the start of the interval. $q
dli
i
i=
iq$ is often calculated on the basis of the age-specific death rate iM , which is
defined as follows.
( )( ) x ageat alive people by the x,x interval in the lived years ofnumber the
x,x interval age in the die whopeople ofnumber the=Mi1+ii
1+iii
If, in an interval of length ni (ni = i+1x - ix ) il people are alive at age ix , and id of them die during the interval, and if the id dead people lived for an average fraction of ai of the interval, then the death rate can be expressed as iM :
12
( )Md
n l d a n di
i
i i i i i i= − +
The relationship between the death rate iM and the probability of death iq in the age interval is:
( ) iii
iii
MnaMnq
−+=
11ˆ
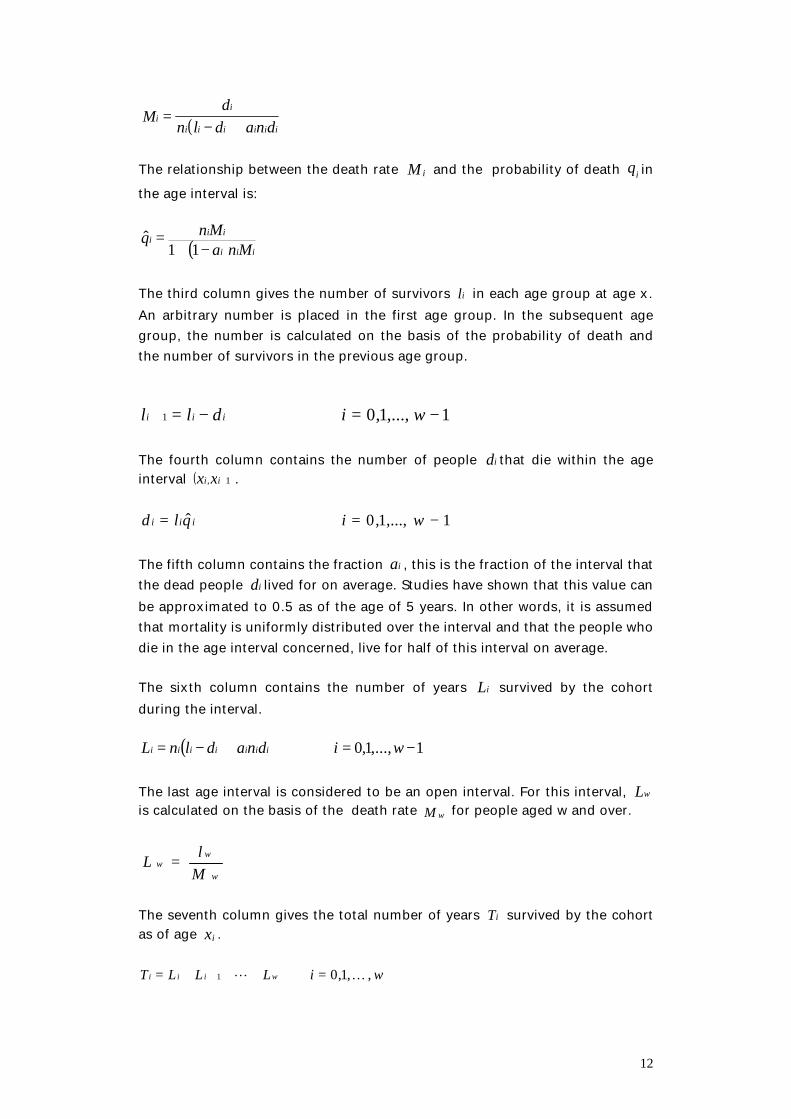
The third column gives the number of survivors il in each age group at age x. An arbitrary number is placed in the first age group. In the subsequent age group, the number is calculated on the basis of the probability of death and the number of survivors in the previous age group.
1,...,1,01 −=−=+ widll iii The fourth column contains the number of people id that die within the age interval ( )1, +ii xx .
1,...,1,0ˆ −== wiqld iii The fifth column contains the fraction ia , this is the fraction of the interval that the dead people id lived for on average. Studies have shown that this value can be approximated to 0.5 as of the age of 5 years. In other words, it is assumed that mortality is uniformly distributed over the interval and that the people who die in the age interval concerned, live for half of this interval on average. The sixth column contains the number of years iL survived by the cohort during the interval.
( ) 1,...,1,0 −=+−= widnadlnL iiiiiii The last age interval is considered to be an open interval. For this interval, wL is calculated on the basis of the death rate M w for people aged w and over.
w
ww
MlL =
The seventh column gives the total number of years iT survived by the cohort as of age ix .
wiLLLT wiii ,,1,01 KL =+++= +
13
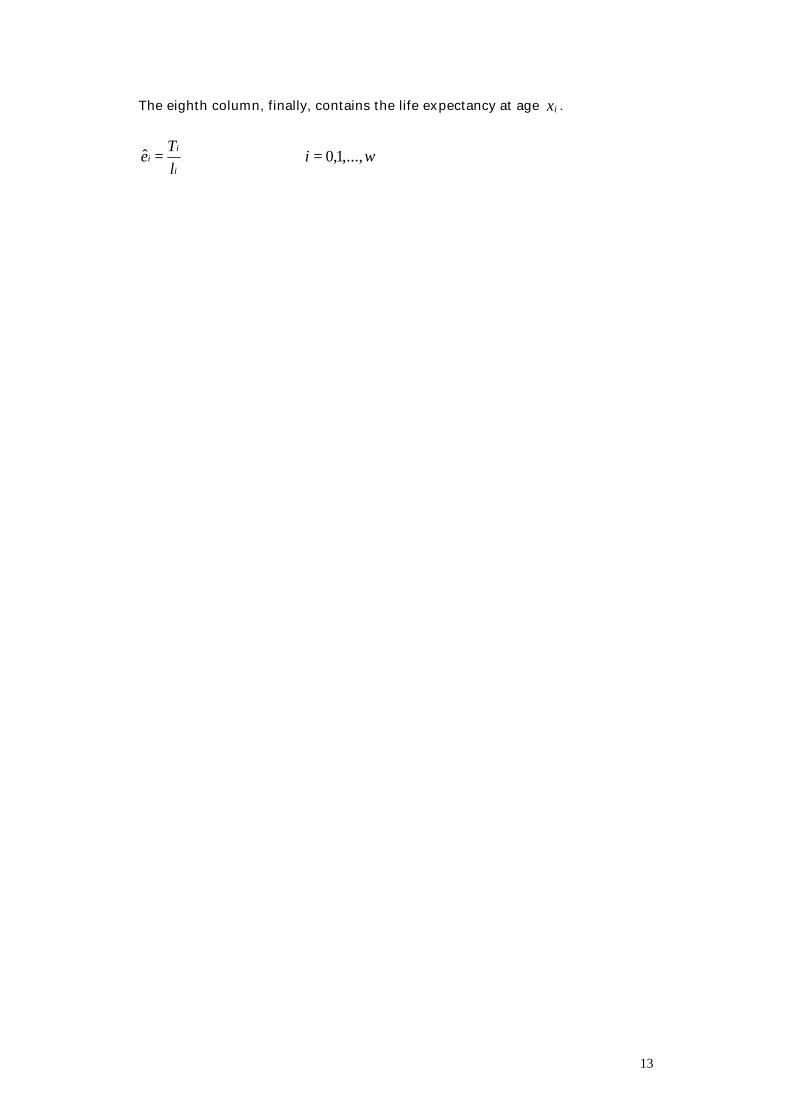
The eighth column, finally, contains the life expectancy at age ix .
wilT
ei
ii ,...,1,0ˆ ==
14
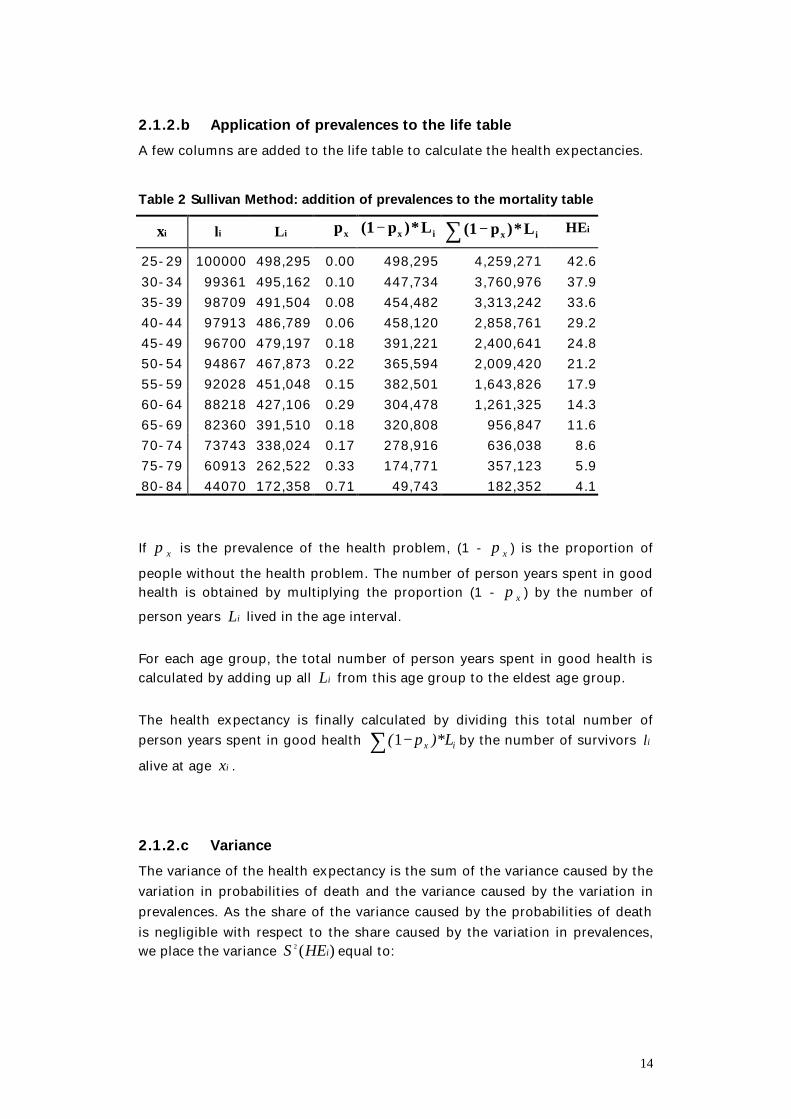
2.1.2.b Application of prevalences to the life table A few columns are added to the life table to calculate the health expectancies. Table 2 Sullivan Method: addition of prevalences to the mortality table
ix il iL xp ix L*)p(1 − ∑ − ix L*)p(1
iHE 25-29 100000 498,295 0.00 498,295 4,259,271 42.6 30-34 99361 495,162 0.10 447,734 3,760,976 37.9 35-39 98709 491,504 0.08 454,482 3,313,242 33.6 40-44 97913 486,789 0.06 458,120 2,858,761 29.2 45-49 96700 479,197 0.18 391,221 2,400,641 24.8 50-54 94867 467,873 0.22 365,594 2,009,420 21.2 55-59 92028 451,048 0.15 382,501 1,643,826 17.9 60-64 88218 427,106 0.29 304,478 1,261,325 14.3 65-69 82360 391,510 0.18 320,808 956,847 11.6 70-74 73743 338,024 0.17 278,916 636,038 8.6 75-79 60913 262,522 0.33 174,771 357,123 5.9 80-84 44070 172,358 0.71 49,743 182,352 4.1 If xπ is the prevalence of the health problem, (1 - xπ ) is the proportion of people without the health problem. The number of person years spent in good health is obtained by multiplying the proportion (1 - xπ ) by the number of person years iL lived in the age interval. For each age group, the total number of person years spent in good health is calculated by adding up all iL from this age group to the eldest age group. The health expectancy is finally calculated by dividing this total number of person years spent in good health ∑ − ix )*Lp(1 by the number of survivors il alive at age ix .
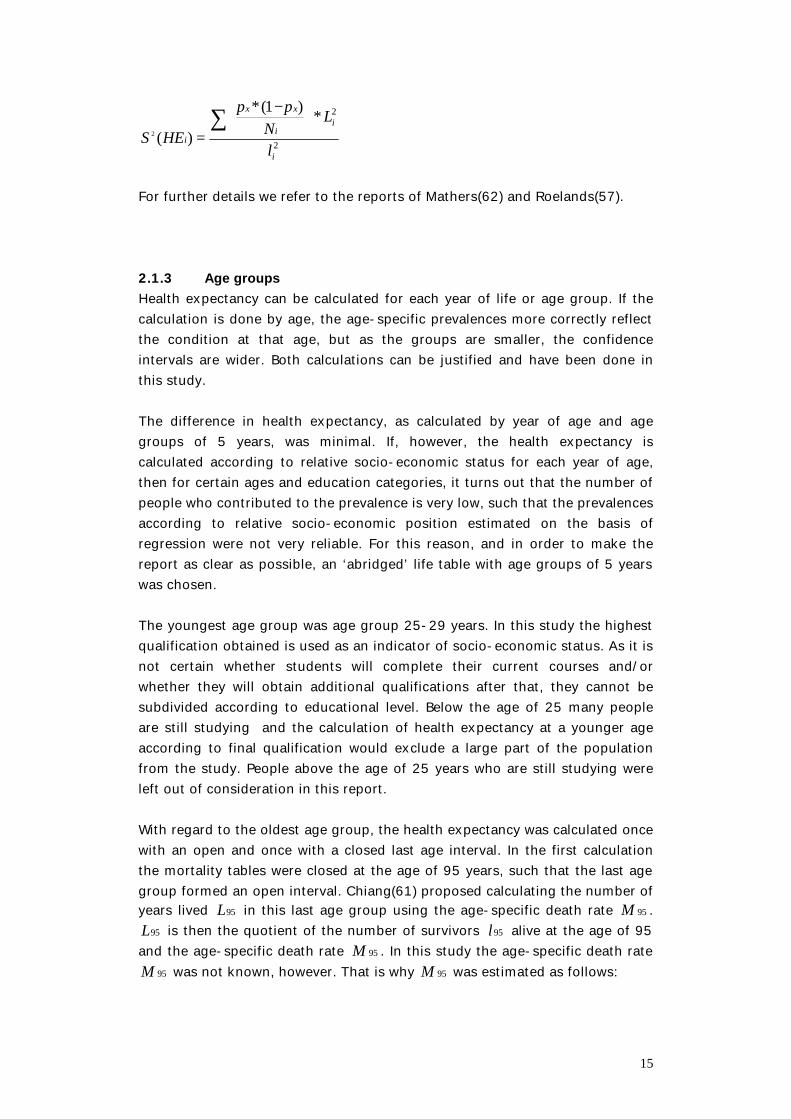
2.1.2.c Variance The variance of the health expectancy is the sum of the variance caused by the variation in probabilities of death and the variance caused by the variation in prevalences. As the share of the variance caused by the probabilities of death is negligible with respect to the share caused by the variation in prevalences, we place the variance )(2
iHES equal to:
15
2
2*)1(*
)(2
i
ii
xx
il
LNHES
∑
−
=
ππ
For further details we refer to the reports of Mathers(62) and Roelands(57). 2.1.3 Age groups Health expectancy can be calculated for each year of life or age group. If the calculation is done by age, the age-specific prevalences more correctly reflect the condition at that age, but as the groups are smaller, the confidence intervals are wider. Both calculations can be justified and have been done in this study. The difference in health expectancy, as calculated by year of age and age groups of 5 years, was minimal. If, however, the health expectancy is calculated according to relative socio-economic status for each year of age, then for certain ages and education categories, it turns out that the number of people who contributed to the prevalence is very low, such that the prevalences according to relative socio-economic position estimated on the basis of regression were not very reliable. For this reason, and in order to make the report as clear as possible, an ‘abridged’ life table with age groups of 5 years was chosen. The youngest age group was age group 25-29 years. In this study the highest qualification obtained is used as an indicator of socio-economic status. As it is not certain whether students will complete their current courses and/or whether they will obtain additional qualifications after that, they cannot be subdivided according to educational level. Below the age of 25 many people are still studying and the calculation of health expectancy at a younger age according to final qualification would exclude a large part of the population from the study. People above the age of 25 years who are still studying were left out of consideration in this report. With regard to the oldest age group, the health expectancy was calculated once with an open and once with a closed last age interval. In the first calculation the mortality tables were closed at the age of 95 years, such that the last age group formed an open interval. Chiang(61) proposed calculating the number of years lived 95L in this last age group using the age-specific death rate 95M .
95L is then the quotient of the number of survivors 95l alive at the age of 95 and the age-specific death rate 95M . In this study the age-specific death rate
95M was not known, however. That is why 95M was estimated as follows:
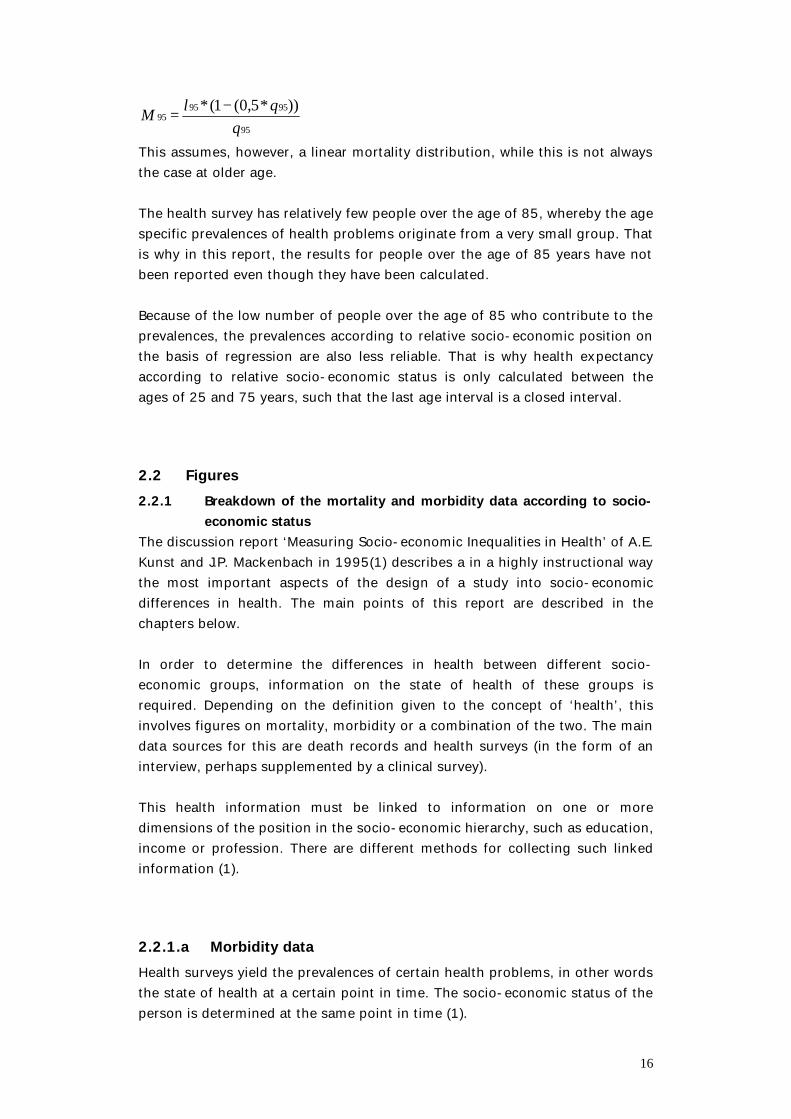
16
95
959595
))*5,0(1(*q
qlM −=
This assumes, however, a linear mortality distribution, while this is not always the case at older age. The health survey has relatively few people over the age of 85, whereby the age specific prevalences of health problems originate from a very small group. That is why in this report, the results for people over the age of 85 years have not been reported even though they have been calculated. Because of the low number of people over the age of 85 who contribute to the prevalences, the prevalences according to relative socio-economic position on the basis of regression are also less reliable. That is why health expectancy according to relative socio-economic status is only calculated between the ages of 25 and 75 years, such that the last age interval is a closed interval.
2.2 Figures 2.2.1 Breakdown of the mortality and morbidity data according to socio-
economic status The discussion report ‘Measuring Socio-economic Inequalities in Health’ of A.E. Kunst and J.P. Mackenbach in 1995(1) describes a in a highly instructional way the most important aspects of the design of a study into socio-economic differences in health. The main points of this report are described in the chapters below. In order to determine the differences in health between different socio- economic groups, information on the state of health of these groups is required. Depending on the definition given to the concept of ‘health’, this involves figures on mortality, morbidity or a combination of the two. The main data sources for this are death records and health surveys (in the form of an interview, perhaps supplemented by a clinical survey). This health information must be linked to information on one or more dimensions of the position in the socio-economic hierarchy, such as education, income or profession. There are different methods for collecting such linked information (1).
2.2.1.a Morbidity data Health surveys yield the prevalences of certain health problems, in other words the state of health at a certain point in time. The socio-economic status of the person is determined at the same point in time (1).
17
2.2.1.b Mortality data Mortality data reflect the death rates in a certain group of people over a certain observation period. Linking mortality information to the socio-economic position of the person in question can be done in 4 ways (1). Up until a few years ago, most studies into socio-economic differences in health in our country were ecological studies. This type of study involves data at a population level, such that the population is divided into subgroups, as a rule on the basis of geographic residence. The average socio-economic status is determined for each geographic unit and the mortality figure within this unit is related to that socio-economic level. The disadvantage of this method is that the differences in mortality found between the different regions do not reflect the differences in mortality at an individual level just like that. This form of study does not allow an estimate to be made of the health differences at an individual level, but can nevertheless provide useable information for policy makers, by identifying the regions with an excess of health problems. There are two further forms of information on mortality according to socio-economic status: linked cross-sectional data and non-linked cross-sectional data. Linked cross-sectional data are based on records such that the socio-economic status of the people and the reason why they have been removed from the register (including death) are known. These data provide information on the socio-economic status of the deceased and on the number of people per socio-economic group who are at risk of dying and are called linked cross-sectional data because the information on mortality and socio-economic status refer to the same period. If such information is not available, unlinked cross-sectional data can be used, such that the information on the socio-economic condition of the dead people and the people at risk of dying originate from different sources, i.e. the death certificate for dead people and the census for the exposed population. By dividing the number of deaths per socio-economic status by the number of person years per socio-economic status, the socio-economic specific mortality figures are obtained. This information is less accurate because the socio-economic status on the death certificate and that in the census are often not fully comparable.
18
Longitudinal data are used in the most recommended method. At a certain point in time the socio-economic position of a number of people is determined (for example, further to a census). As of that moment, this group is monitored for a period of time and the survival duration is recorded in this period for each person. For example, this can be done by linking the data of the census to those of the mortality records using the national registration number or by monitoring a panel. Such data have recently become available in our country and the mortality figures according to socio-economic status in this study are based on longitudinal data with a link to the individual level. 2.2.2 Mortality data of this study The people in the 1991 census were monitored by the Demographics Centre of the Free University of Brussels for a period of 5 years. The database was divided according to age, sex, region, and socio-economic status. A link was made between this database and the National Register. Life tables for different socio-economic groups have been drawn up on the basis of this follow-up. There are some limitations to this data. The people with an unknown level of education, who have a high mortality, have not been included in this study for example. For further information on these data we refer to the Demographics Centre, Free University of Brussels reports (34,63). 2.2.3 Morbidity data in this study
2.2.3.a Description of the Health Interview Survey 1997 In 1997, a large scale national health interview survey was done in Belgium for the first time. This survey was commissioned by and done together with the competent ministers and departments of the Federal Government, the Flemish, French and German Communities and the Walloon and Brussels Regions. It was done in compliance with the European guidelines in this respect. The complete questionnaire consisted of three sections: a questionnaire for households, a face-to-face questionnaire and a written questionnaire. The household questionnaire contained 31 questions and was completed by the interviewer. The individual face-to-face questionnaire, which contained 239 questions, was also completed by the interviewer. For people who were too ill and/or who had cognitive disabilities, and for children below the age of 15, the questions were answered by another member of the household. People aged 15 and over also completed a written questionnaire of 147 questions.
19
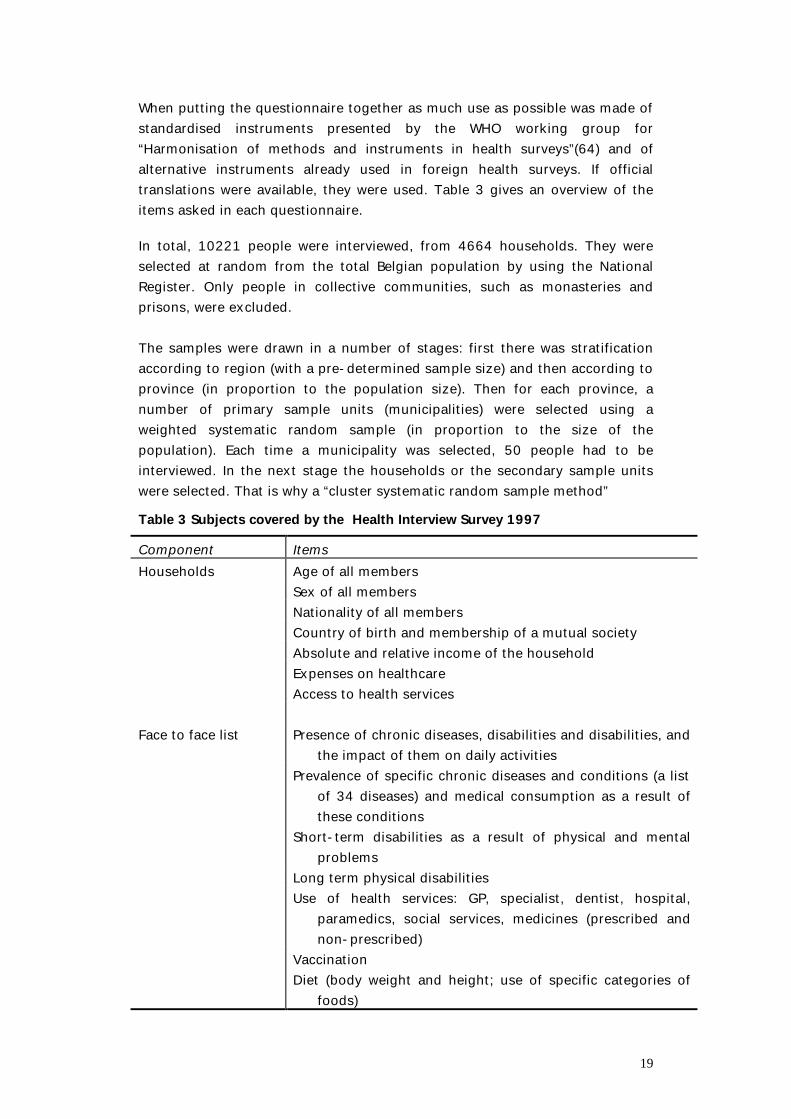
When putting the questionnaire together as much use as possible was made of standardised instruments presented by the WHO working group for “Harmonisation of methods and instruments in health surveys”(64) and of alternative instruments already used in foreign health surveys. If official translations were available, they were used. Table 3 gives an overview of the items asked in each questionnaire.
In total, 10221 people were interviewed, from 4664 households. They were selected at random from the total Belgian population by using the National Register. Only people in collective communities, such as monasteries and prisons, were excluded. The samples were drawn in a number of stages: first there was stratification according to region (with a pre-determined sample size) and then according to province (in proportion to the population size). Then for each province, a number of primary sample units (municipalities) were selected using a weighted systematic random sample (in proportion to the size of the population). Each time a municipality was selected, 50 people had to be interviewed. In the next stage the households or the secondary sample units were selected. That is why a “cluster systematic random sample method” Table 3 Subjects covered by the Health Interview Survey 1997 Component Items
Age of all members Households Sex of all members
Nationality of all members Country of birth and membership of a mutual society Absolute and relative income of the household Expenses on healthcare Access to health services
Presence of chronic diseases, disabilities and disabilities, and the impact of them on daily activities
Face to face list
Prevalence of specific chronic diseases and conditions (a list of 34 diseases) and medical consumption as a result of these conditions
Short-term disabilities as a result of physical and mental problems
Long term physical disabilities Use of health services: GP, specialist, dentist, hospital,
paramedics, social services, medicines (prescribed and non-prescribed)
Vaccination Diet (body weight and height; use of specific categories of
foods)
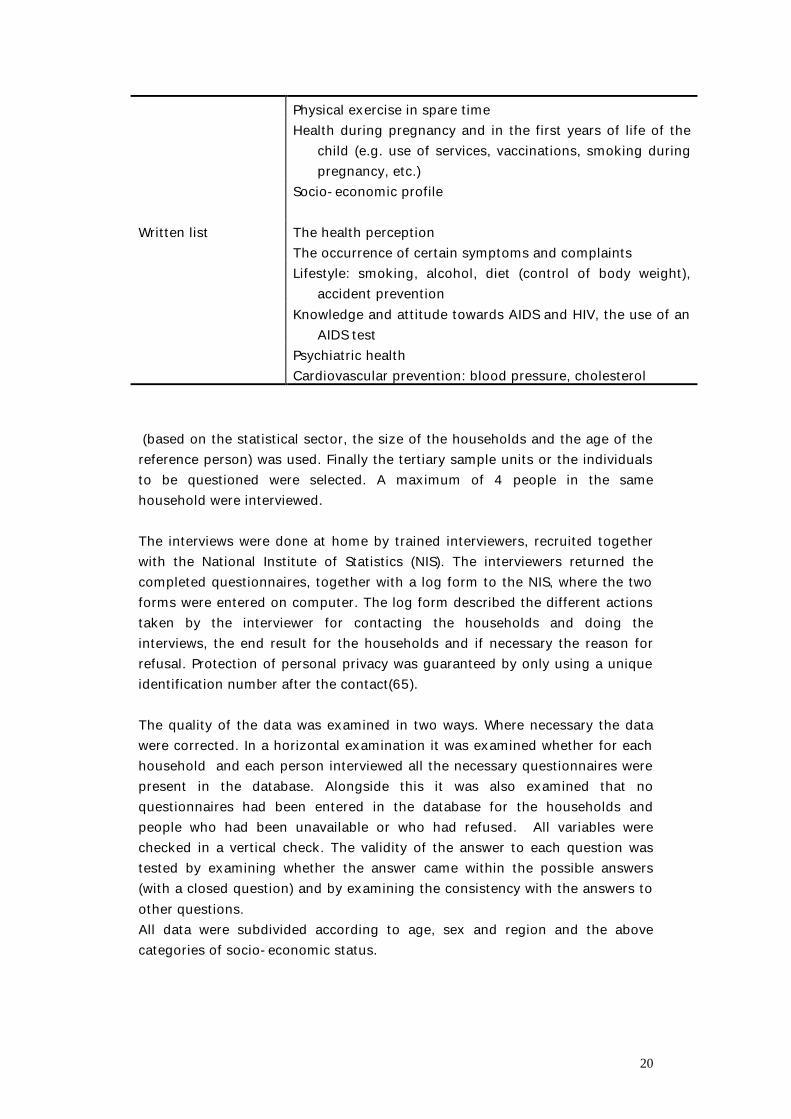
20
Physical exercise in spare time Health during pregnancy and in the first years of life of the
child (e.g. use of services, vaccinations, smoking during pregnancy, etc.)
Socio-economic profile
The health perception Written list The occurrence of certain symptoms and complaints
Lifestyle: smoking, alcohol, diet (control of body weight), accident prevention
Knowledge and attitude towards AIDS and HIV, the use of an AIDS test
Psychiatric health Cardiovascular prevention: blood pressure, cholesterol (based on the statistical sector, the size of the households and the age of the reference person) was used. Finally the tertiary sample units or the individuals to be questioned were selected. A maximum of 4 people in the same household were interviewed. The interviews were done at home by trained interviewers, recruited together with the National Institute of Statistics (NIS). The interviewers returned the completed questionnaires, together with a log form to the NIS, where the two forms were entered on computer. The log form described the different actions taken by the interviewer for contacting the households and doing the interviews, the end result for the households and if necessary the reason for refusal. Protection of personal privacy was guaranteed by only using a unique identification number after the contact(65). The quality of the data was examined in two ways. Where necessary the data were corrected. In a horizontal examination it was examined whether for each household and each person interviewed all the necessary questionnaires were present in the database. Alongside this it was also examined that no questionnaires had been entered in the database for the households and people who had been unavailable or who had refused. All variables were checked in a vertical check. The validity of the answer to each question was tested by examining whether the answer came within the possible answers (with a closed question) and by examining the consistency with the answers to other questions. All data were subdivided according to age, sex and region and the above categories of socio-economic status.
21
2.2.3.b People in institutions In general it is recommended doing a health survey among a population that includes people who live in a private household and people who do not. The second group mainly consists of people who live in collective households and people with no fixed abode (64). The last group is much more difficult to reach. In order to satisfy this recommendation it was decided that the random sample of the Health Interview Survey 1997 must, in principle, include people who live in an institution (excluding prisons and monasteries) and people who are not institutionalised (66). The interviewers contacted the selected households at the address of the domicile given in the national register. In Belgium, however, it seems that only around one third of the people who live in an institution (rest homes and nursing homes) are actually domiciled there. The other two thirds are registered at the address of a non-collective household, generally the address of the person’s family. In the health survey, the interviewers found on many occasions that an elderly person who was part of the household according to his list did not live at that address. If it was a reference person in a single person household, another household with the same characteristics (same statistical sector, same age), was contacted. If it was a reference person in a household with several people, or if it did not involve a reference person, he or she was deleted from the list and not interviewed. In this way a significant proportion of the selected people who live in an institution were not reached. For further details refer to the Quataert(66) report and the health survey manual. The health problem prevalences provided by the health survey are therefore rather representative of the non-institutionalised population. The breakdown according to SES and sex for people in collective households can be found from the National Institute of Statistics (NIS). This information comes from the 1991 census. However, because of the same problem of registration of domicile the total number of people in a collective household is not known. The National Institute of Health and Disability Insurance (RIZIV) has information on the total number of people in an institution, but neither the breakdown according to socio-economic status nor sex is known.
22
The combination of the two databases should in principle provide an answer to the question of whether the assumptions used in this report are correct (see further). Because both data sources each exhibit significant gaps, the uncertainty increases, however. Because of these data limitations it was decided, in contrast to other calculations of health expectancy, not to use the number of years lived in an institution as a specific health status when determining health expectancy (67). For this report it was accepted that all institutionalised and non-institutionalised people who satisfied the other admission criteria, were included in the random sample framework of the health survey. The calculations were done using the prevalences for all the people in the health survey and those prevalences were considered to originate from a population that is representative of the total population, both institutionalised and non-institutionalised. This approach is based on a number of assumptions: 1) The prevalence of health problems is the same with people in an institution
who are domiciled in an institution as with people who are not domiciled there.
2) The breakdown according to socio-economic status is the same for people in an institution who are domiciled there and for people in an institution who are not domiciled there
These assumptions can thus be a source of error. As a check it was attempted to estimate the state of health of the institutionalised people from the health survey. As only 43 people seemed to live in an institution, this number was too small to do a sensible evaluation.
2.3 Selection of indicators 2.3.1 Indicators of socio-economic status The three dimensions that most strongly determine the position on the social hierarchy are education, income and profession (1). Sometimes other proxy indicators of socio-economic position are used such as the type of household, ownership of a home, comfort of the home or ownership of a car. The education level mainly determines access to information and the skill to derive benefit from new information and is an important determinant of income and profession. Income mainly relates to access to ‘scarce goods’, both in terms of environmental factors and access to healthcare. Profession also partly influences factors where income and training have an impact and adds specific advantages, related to the performance of certain jobs, such as prestige, privileges, power and social and technical skills.
23
The ‘education’ dimension has the advantage of being available to most people in the population and is also very stable. It is therefore a very easily applied indicator. In comparison, the dimensions of income and profession have a number of disadvantages that somewhat reduce usability. Income is difficult to define and in view of its sensitivity the response level to it is low or the answers are inaccurate. The profession dimension is not available for a substantial proportion of the population and it is also difficult to hierarchically organise the different professional classes. Education level can be measured in a number of different ways. The most direct measure is the highest level for which a qualification has been obtained. In order to be able to adequately identify the most disadvantaged groups a minimum number of categories have to be able to be distinguished between. If no information is available on the qualification achieved, then as an alternative the number of years the person has spent in education can be used, or the age at which he completed his education. The biggest disadvantage with these indicators is that they take no account of educational level. In this study the socio-economic position was determined on the basis of the highest qualification achieved. The education dimension was selected for practical reasons: probabilities of death are only available according to education level. On the other hand the 'education' dimension undoubtedly has a number of benefits over the 'profession' and ‘income' dimensions. Ten different categories of education were selected:
1. No qualifications 2. Lower education 3. Lower vocational secondary education (lower BSO) 4. Lower technical secondary education (lower TSO) 5. Lower general and art secondary education (now called lower
general secondary education) (lower ASO) 6. Higher vocational secondary education (higher BSO) 7. Higher technical secondary education (higher TSO) 8. Higher general and art secondary education (now called higher
general secondary education) (higher ASO) 9. Higher education of the short type (1-3 years of higher education) 10. Higher education of the long type (more than 3 years of higher
education)
24
2.3.2 Indicators of state of health There is growing interest in the concept of ‘quality of life’ and more specifically ‘quality of life relating to health’. This concept has already been defined in many ways. In brief, the concept has evolved from a model that was only targeted at disease into a model that also relates to health and well-being. Most contemporary definitions comprise the aspects of physical functioning and psychological well-being, social support and activities. Bowling defined the term as, for example, the optimum levels of mental, physical, social and role functioning(68). Further to a meeting of the Regional Office for Europe of the World Health Organisation in 1992 a number of health indicators were designated as suitable for monitoring progress towards the various objectives of ‘Health for All’. The generalised use of these indicators would largely contribute to obtaining internationally comparable information on inequalities in health (1,69). The health survey by means of an interview is seen as the most advisable source of data for the information required to determine and monitor differences in health(64). A health survey provides unique information as data are collected from different fields on the same person at the same time. It is thereby possible to examine the relationship between the different fields. Moreover, a survey not only provides information on diagnosed health problems, but also on health problems for which no medical help can be found and on the perception of a person’s own health. It also concerns health information for a group of people who are representative of the total population(70). In this research, health expectancy has been calculated for three health states: the perceived health, limiting long-standing illness and mental health. The health expectancy in which the perceived health is used is by convention called the 'life expectancy in good perceived health' or 'healthy life expectancy'. Health expectancy based on the absence of disabilities is called 'disability-free health expectancy’ and the health expectancy based on the absence of psychiatric problems 'life expectancy in good mental health'.
2.3.2.a Perceived health The perceived health indicator was measured in this study on the basis of a single question: ‘In general, would you say your health is: There were five possible answers ‘very good’, ‘good, ‘fair (reasonable), ‘bad’ and ‘very bad’. The answers were encoded again, such that the answers ‘very good’ and ‘good’ were considered as ‘good perceived health’ and the answers ‘fair (reasonable), ‘bad’ or ‘very bad’ as ‘poor perceived health’.
25
The indicator really focuses on the impact of the state of perceived health and the possibility of leading a life that offers sufficient satisfaction, and is a measure of the ‘quality of life relating to health’ in the widest sense of the word(71). The indicator seems to be stable and a highly negative relationship was found between the perceived health and the annual number of contacts with a doctor. The indicator has a highly predictive value for health, e.g. for physical fitness and for mortality(72-76). The perceived health is one of the most important indicators for monitoring health and the quality of life. This indicator is included in objective 2 of the WHO strategy.
2.3.2.b Long term disabilities The questionnaire which probes the presence of disabilities consists of two parts. The first part is formed by the ‘Physical Functioning’ component of the SF-36 questionnaire, a component in which the possibility to lift, carry, mobility, climb stairs, bend over, kneel and self care were questioned (77). People below the age of 60 years who did not indicate any disabilities in this first questionnaire were automatically given the final score of ‘no disabilities’. The questionnaire recommended by the Dutch Central Bureau of Statistics and the World Health Organisation on disabilities was given to the others. 11 questions gauge disabilities in locomotion, movement, getting dressed and undressed, washing hands and face, eating, going to the toilet, continence problems, impaired hearing and impaired vision. Each question has 3 possible answers, ‘no limitation’, ‘moderate limitation’ or ‘serious limitation’. The score is also calculated by adding up the number of moderate and serious disabilities. People who state at least 2 moderate disabilities or at least 1 serious limitation are considered as ‘people with serious disabilities’, People who reported at least 1 moderate disability are considered as ‘people with moderate disabilities’.(69). The first part of the questionnaire acts as a screening instrument, because the health survey organisers believed that the instrument of the CBS-WHO alone was not sufficiently sensitive for young people.
2.3.2.c Mental health
26
The General Health Questionnaire (GHQ) is the most commonly used international screening instrument for general psychiatric conditions in front line health care. The scale was developed during the Sixties and Seventies by Goldberg. The instrument detects recent problems by gauging symptoms that have been observed over the last 2 weeks more or less than normal by the person(68,78,79). In the health survey the abridged version with 12 questions was used, in which three fields of psychiatric morbidity were investigated: anxiety and sleeplessness, social dysfunctioning and depressive frame of mind. The score could vary between 0 and 12: a score of 0 or 1 was considered normal, while a score of 2 or 3 pointed to a moderate psychiatric condition and a score of 4 or more to a serious psychiatric condition.
2.4 Measuring differences The socio-economic differences in health can be expressed in a number of ways (1). Firstly a distinction is made between absolute and relative differences. The differences can be expressed in relative terms, for example by presenting the mortality figure of the highest socio-economic group as a percentage of that of the lowest group. On the other hand, the absolute differences can also be given, for example by taking the difference in the mortality figures of two different socio-economic groups. Relative differences are easier to understand in general, but the importance for public health is sometimes demonstrated more clearly by absolute differences. Secondly it has to be decided whether only the effect or the total impact is to be described. The impact on general public health can be estimated by taking account of the relative size of the different groups. This relative size is of course partly outside the sphere of influence of the policy makers. The way in which the differences are presented depends on the level to which the emphasis is only to be placed on the variable aspect of these differences.
27
A third distinction is made between simple and more sophisticated measures. Simple measures, such as rate ratios for example between different groups, have the advantage that they can be easily calculated and understood, and that relatively few requirements are placed on the basic data. On the other hand such simple measures conceal part of the available information. For example, by only showing the difference between the highest and lowest group, you know nothing about the middle groups. More sophisticated measures, for example, based on regression, take more account of all available information, but are more complex and higher requirements are placed on the basic data. A requirement is, for example, that the socio-economic variable can be presented on an interval scale. Different measures are used in this study. The differences in health expectancy between the existing education categories are presented as an absolute difference in years and as a ratio of the different health expectancies. These are thus two simple measures, an absolute and a relative difference, which are both restricted to the effect of the education level. In addition, these health differences are also calculated on the basis of a regression method, in which account has been taken of the relative size of the different socio-economic groups in our society and their relative position in the hierarchy.
2.5 Conversion from absolute to relative socio-economic status The absolute qualification takes no account of the relative size of the education groups, which has implications for the relative status of the qualification. For example: people now study longer than they used to (Figure 1 and Figure 2) whereby the socio-economic status given by a certain qualification can change. The education system in our country also differs on a couple of points from those of other countries, such that it is difficult to make international comparisons. These problems are solved however by using a method whereby a linear regression is done on the age specific prevalences and death rates. This method was first used by Pamuk(3) and recently more specifically for health expectancy by Sihvonen(80). Figure 3 briefly sets out the method in a more visual way. The lowest bar shows the education distribution of the population for a certain cohort. Each block represents an education category. The first block, for example, represents the percentage of people without qualifications, the second the percentage of people with a lower education qualification, etc. The categories are then ranked from low to high education. This ranking is rather arbitrary for some education categories. A scale from 0 to 100% is formed by the rankings
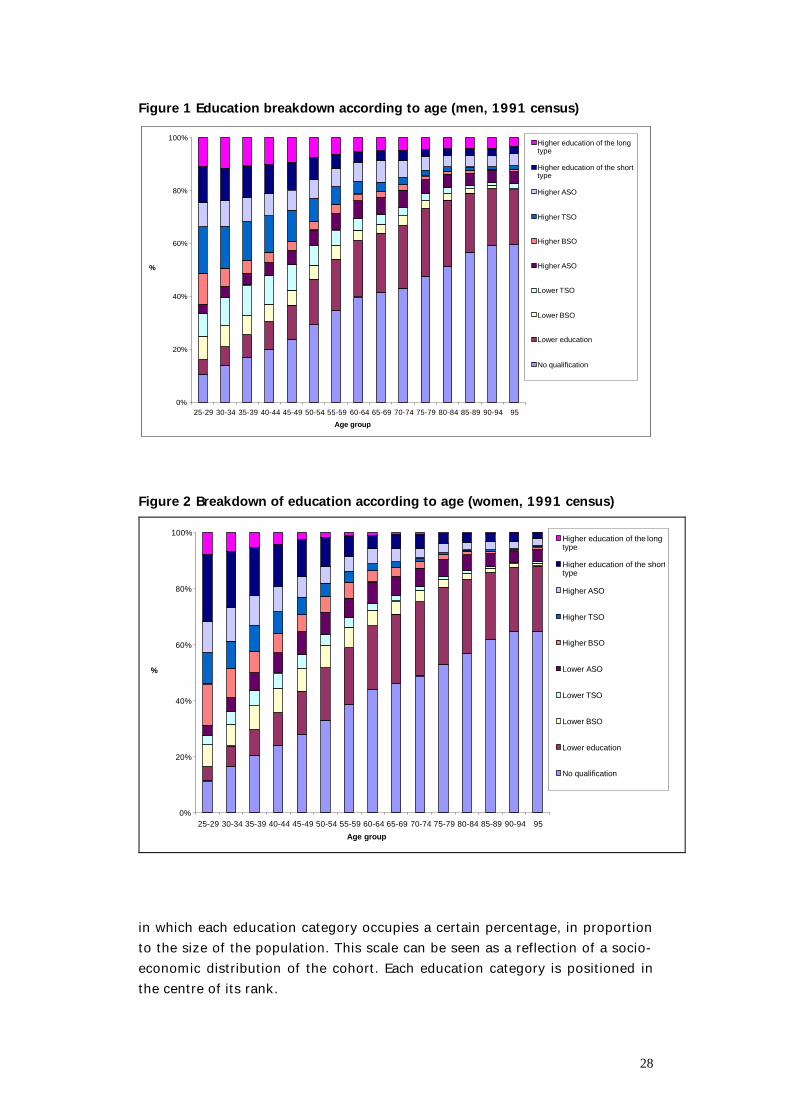
28
Figure 1 Education breakdown according to age (men, 1991 census)
0%
20%
40%
60%
80%
100%
25-29 30-34 35-39 40-44 45-49 50-54 55-59 60-64 65-69 70-74 75-79 80-84 85-89 90-94 95
Age group
%
Higher education of the longtype
Higher education of the shorttype
Higher ASO
Higher TSO
Higher BSO
Higher ASO
Lower TSO
Lower BSO
Lower education
No qualification
Figure 2 Breakdown of education according to age (women, 1991 census)
0%
20%
40%
60%
80%
100%
25-29 30-34 35-39 40-44 45-49 50-54 55-59 60-64 65-69 70-74 75-79 80-84 85-89 90-94 95
Age group
%
Higher education of the longtype
Higher education of the shorttype
Higher ASO
Higher TSO
Higher BSO
Lower ASO
Lower TSO
Lower BSO
Lower education
No qualification
in which each education category occupies a certain percentage, in proportion to the size of the population. This scale can be seen as a reflection of a socio-economic distribution of the cohort. Each education category is positioned in the centre of its rank.
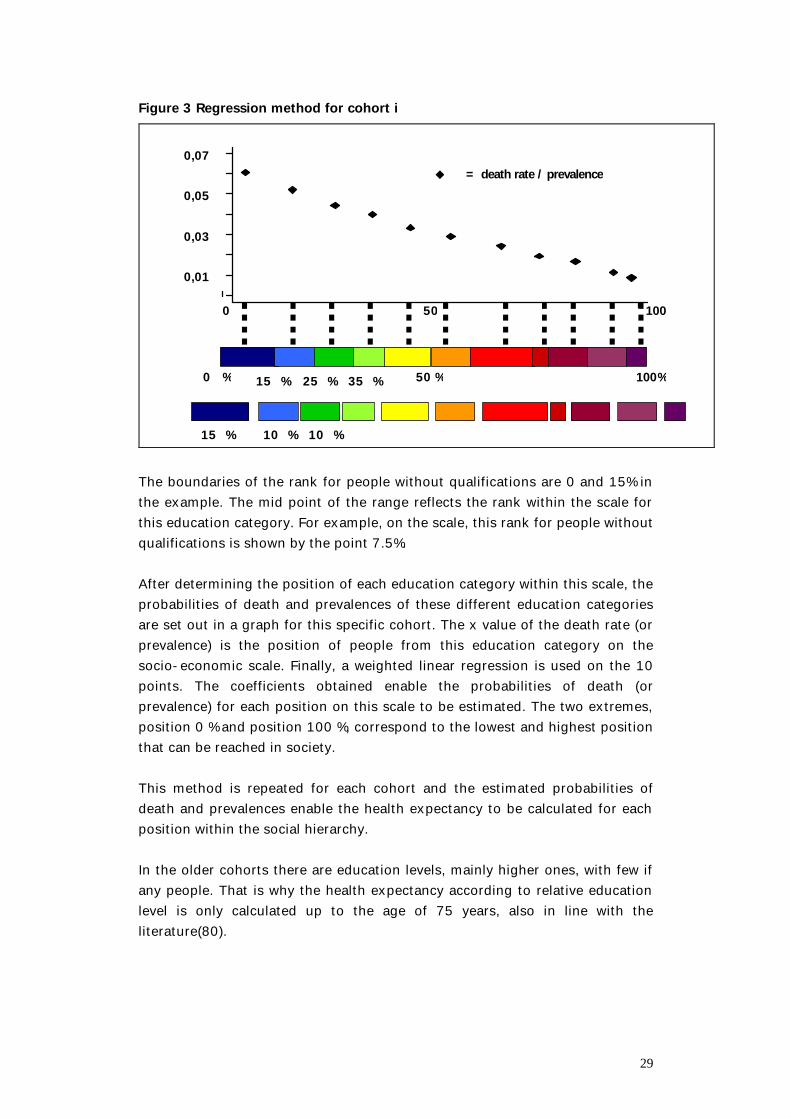
29
Figure 3 Regression method for cohort i
100
0 % 50 % 100%15 % 25 % 35 %
0,01
0,03
0,05
0,07
0 50
15 % 10 % 10 %
u = death rate / prevalence
The boundaries of the rank for people without qualifications are 0 and 15% in the example. The mid point of the range reflects the rank within the scale for this education category. For example, on the scale, this rank for people without qualifications is shown by the point 7.5%. After determining the position of each education category within this scale, the probabilities of death and prevalences of these different education categories are set out in a graph for this specific cohort. The x value of the death rate (or prevalence) is the position of people from this education category on the socio-economic scale. Finally, a weighted linear regression is used on the 10 points. The coefficients obtained enable the probabilities of death (or prevalence) for each position on this scale to be estimated. The two extremes, position 0 % and position 100 %, correspond to the lowest and highest position that can be reached in society. This method is repeated for each cohort and the estimated probabilities of death and prevalences enable the health expectancy to be calculated for each position within the social hierarchy. In the older cohorts there are education levels, mainly higher ones, with few if any people. That is why the health expectancy according to relative education level is only calculated up to the age of 75 years, also in line with the literature(80).
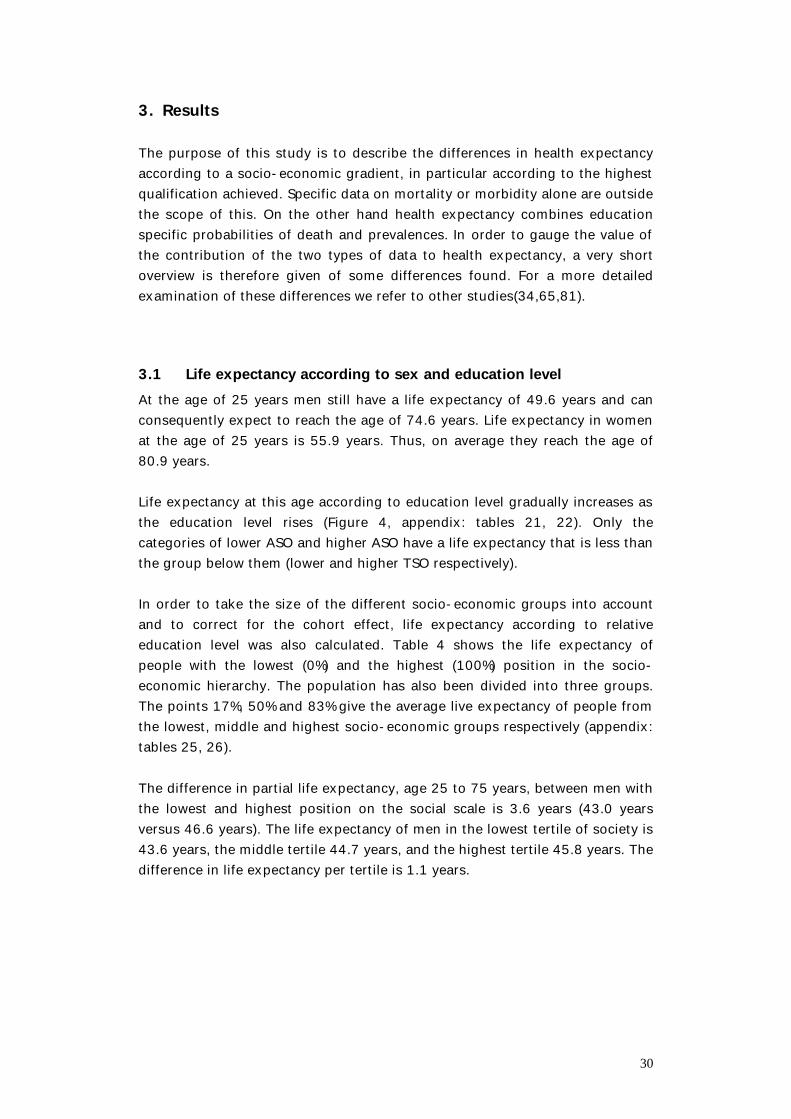
30
3. Results The purpose of this study is to describe the differences in health expectancy according to a socio-economic gradient, in particular according to the highest qualification achieved. Specific data on mortality or morbidity alone are outside the scope of this. On the other hand health expectancy combines education specific probabilities of death and prevalences. In order to gauge the value of the contribution of the two types of data to health expectancy, a very short overview is therefore given of some differences found. For a more detailed examination of these differences we refer to other studies(34,65,81).
3.1 Life expectancy according to sex and education level At the age of 25 years men still have a life expectancy of 49.6 years and can consequently expect to reach the age of 74.6 years. Life expectancy in women at the age of 25 years is 55.9 years. Thus, on average they reach the age of 80.9 years. Life expectancy at this age according to education level gradually increases as the education level rises (Figure 4, appendix: tables 21, 22). Only the categories of lower ASO and higher ASO have a life expectancy that is less than the group below them (lower and higher TSO respectively). In order to take the size of the different socio-economic groups into account and to correct for the cohort effect, life expectancy according to relative education level was also calculated. Table 4 shows the life expectancy of people with the lowest (0%) and the highest (100%) position in the socio-economic hierarchy. The population has also been divided into three groups. The points 17%, 50% and 83% give the average live expectancy of people from the lowest, middle and highest socio-economic groups respectively (appendix: tables 25, 26). The difference in partial life expectancy, age 25 to 75 years, between men with the lowest and highest position on the social scale is 3.6 years (43.0 years versus 46.6 years). The life expectancy of men in the lowest tertile of society is 43.6 years, the middle tertile 44.7 years, and the highest tertile 45.8 years. The difference in life expectancy per tertile is 1.1 years.
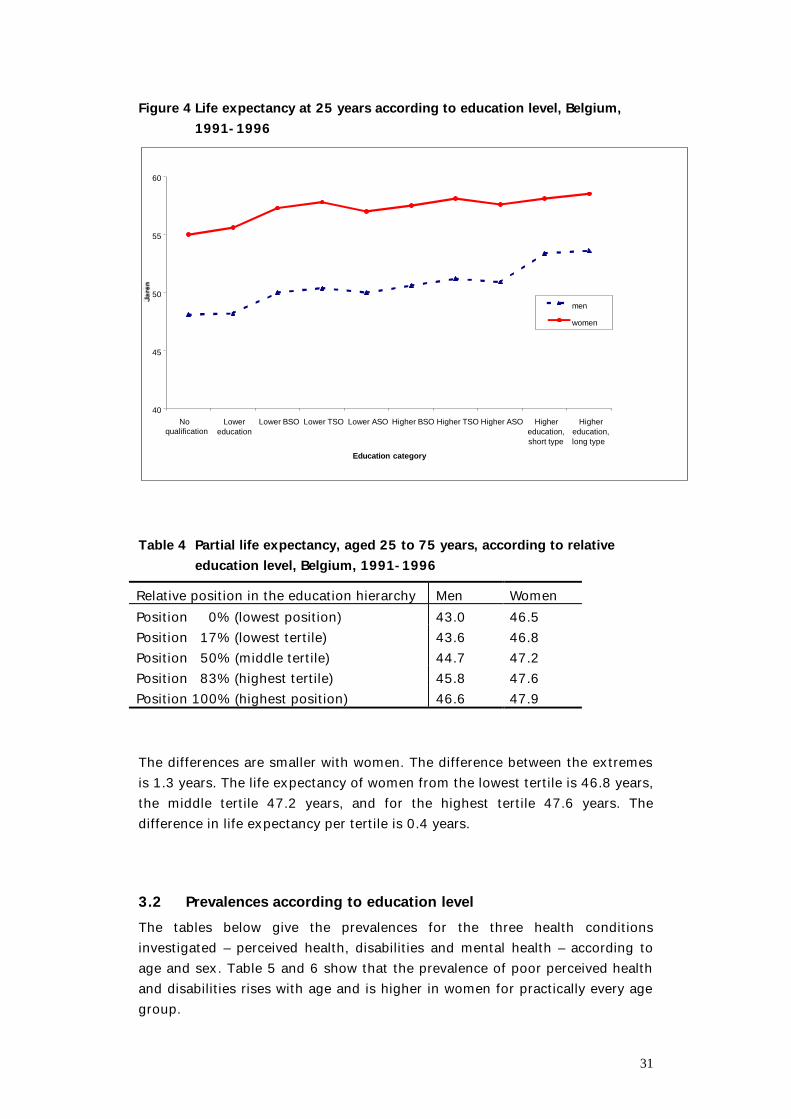
31
Figure 4 Life expectancy at 25 years according to education level, Belgium, 1991-1996
40
45
50
55
60
Noqualification
Lowereducation
Lower BSO Lower TSO Lower ASO Higher BSO Higher TSO Higher ASO Highereducation,short type
Highereducation,long type
Education category
men
women
Table 4 Partial life expectancy, aged 25 to 75 years, according to relative
education level, Belgium, 1991-1996 Relative position in the education hierarchy Men Women Position 0% (lowest position) 43.0 46.5 Position 17% (lowest tertile) 43.6 46.8 Position 50% (middle tertile) 44.7 47.2 Position 83% (highest tertile) 45.8 47.6 Position 100% (highest position) 46.6 47.9 The differences are smaller with women. The difference between the extremes is 1.3 years. The life expectancy of women from the lowest tertile is 46.8 years, the middle tertile 47.2 years, and for the highest tertile 47.6 years. The difference in life expectancy per tertile is 0.4 years.
3.2 Prevalences according to education level The tables below give the prevalences for the three health conditions investigated – perceived health, disabilities and mental health – according to age and sex. Table 5 and 6 show that the prevalence of poor perceived health and disabilities rises with age and is higher in women for practically every age group.
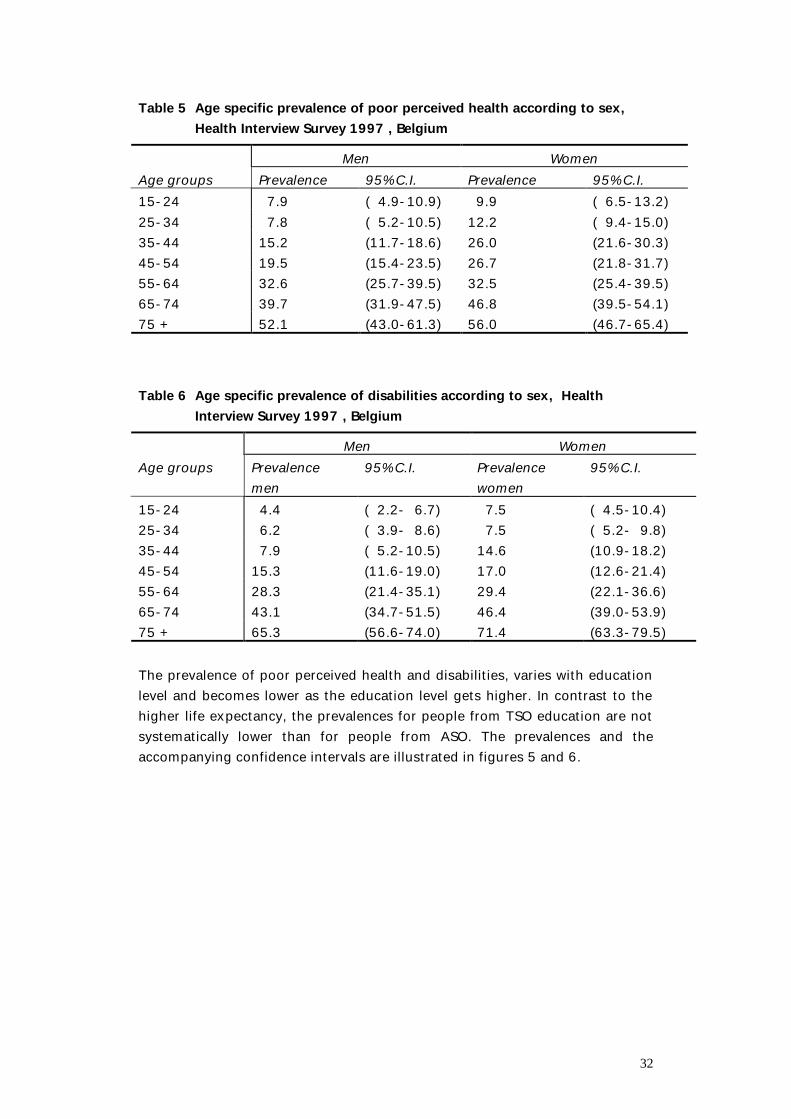
32
Table 5 Age specific prevalence of poor perceived health according to sex, Health Interview Survey 1997 , Belgium
Men Women Age groups Prevalence 95% C.I. Prevalence 95% C.I. 15-24 7.9 ( 4.9-10.9) 9.9 ( 6.5-13.2) 25-34 7.8 ( 5.2-10.5) 12.2 ( 9.4-15.0) 35-44 15.2 (11.7-18.6) 26.0 (21.6-30.3) 45-54 19.5 (15.4-23.5) 26.7 (21.8-31.7) 55-64 32.6 (25.7-39.5) 32.5 (25.4-39.5) 65-74 39.7 (31.9-47.5) 46.8 (39.5-54.1) 75 + 52.1 (43.0-61.3) 56.0 (46.7-65.4) Table 6 Age specific prevalence of disabilities according to sex, Health
Interview Survey 1997 , Belgium Men Women Age groups Prevalence
men 95% C.I. Prevalence
women 95% C.I.
15-24 4.4 ( 2.2- 6.7) 7.5 ( 4.5-10.4) 25-34 6.2 ( 3.9- 8.6) 7.5 ( 5.2- 9.8) 35-44 7.9 ( 5.2-10.5) 14.6 (10.9-18.2) 45-54 15.3 (11.6-19.0) 17.0 (12.6-21.4) 55-64 28.3 (21.4-35.1) 29.4 (22.1-36.6) 65-74 43.1 (34.7-51.5) 46.4 (39.0-53.9) 75 + 65.3 (56.6-74.0) 71.4 (63.3-79.5) The prevalence of poor perceived health and disabilities, varies with education level and becomes lower as the education level gets higher. In contrast to the higher life expectancy, the prevalences for people from TSO education are not systematically lower than for people from ASO. The prevalences and the accompanying confidence intervals are illustrated in figures 5 and 6.
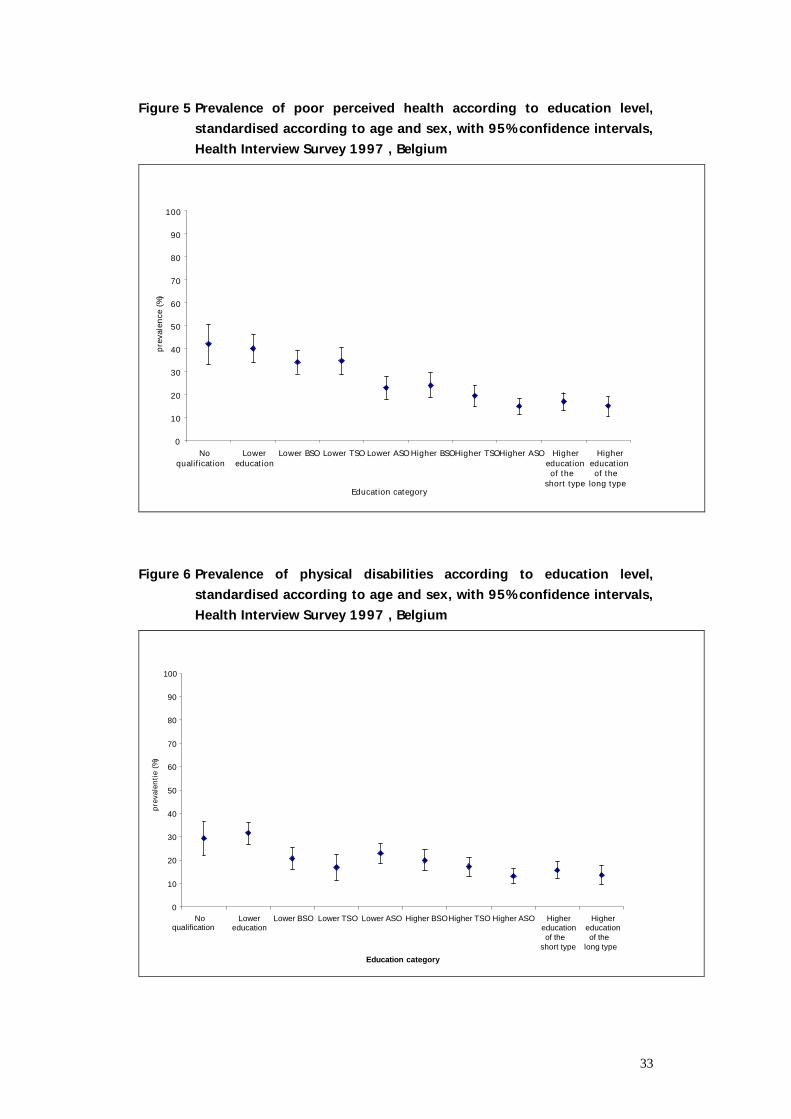
33
Figure 5 Prevalence of poor perceived health according to education level, standardised according to age and sex, with 95% confidence intervals, Health Interview Survey 1997 , Belgium
0
10
20
30
40
50
60
70
80
90
100
Noqualification
Lowereducation
Lower BSO Lower TSO Lower ASOHigher BSOHigher TSOHigher ASO Highereducationof the
short type
Highereducationof the
long typeEducation category
preva
lence
(%)
Figure 6 Prevalence of physical disabilities according to education level,
standardised according to age and sex, with 95% confidence intervals, Health Interview Survey 1997 , Belgium
0
10
20
30
40
50
60
70
80
90
100
Noqualification
Lowereducation
Lower BSO Lower TSO Lower ASO Higher BSOHigher TSO Higher ASO Highereducationof the
short type
Highereducationof the
long type
Education category
preva
lentie
(%)
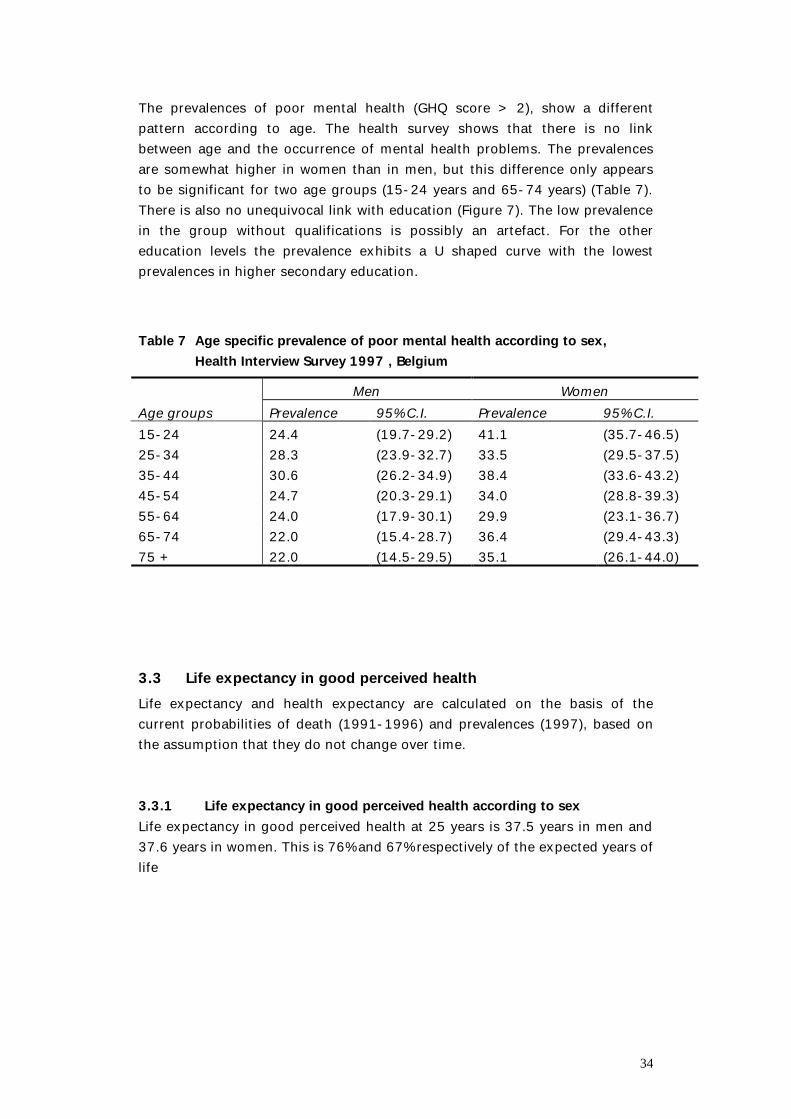
34
The prevalences of poor mental health (GHQ score > 2), show a different pattern according to age. The health survey shows that there is no link between age and the occurrence of mental health problems. The prevalences are somewhat higher in women than in men, but this difference only appears to be significant for two age groups (15-24 years and 65-74 years) (Table 7). There is also no unequivocal link with education (Figure 7). The low prevalence in the group without qualifications is possibly an artefact. For the other education levels the prevalence exhibits a U shaped curve with the lowest prevalences in higher secondary education. Table 7 Age specific prevalence of poor mental health according to sex,
Health Interview Survey 1997 , Belgium Men Women Age groups Prevalence 95% C.I. Prevalence 95% C.I. 15-24 24.4 (19.7-29.2) 41.1 (35.7-46.5) 25-34 28.3 (23.9-32.7) 33.5 (29.5-37.5) 35-44 30.6 (26.2-34.9) 38.4 (33.6-43.2) 45-54 24.7 (20.3-29.1) 34.0 (28.8-39.3) 55-64 24.0 (17.9-30.1) 29.9 (23.1-36.7) 65-74 22.0 (15.4-28.7) 36.4 (29.4-43.3) 75 + 22.0 (14.5-29.5) 35.1 (26.1-44.0)
3.3 Life expectancy in good perceived health Life expectancy and health expectancy are calculated on the basis of the current probabilities of death (1991-1996) and prevalences (1997), based on the assumption that they do not change over time. 3.3.1 Life expectancy in good perceived health according to sex Life expectancy in good perceived health at 25 years is 37.5 years in men and 37.6 years in women. This is 76% and 67% respectively of the expected years of life
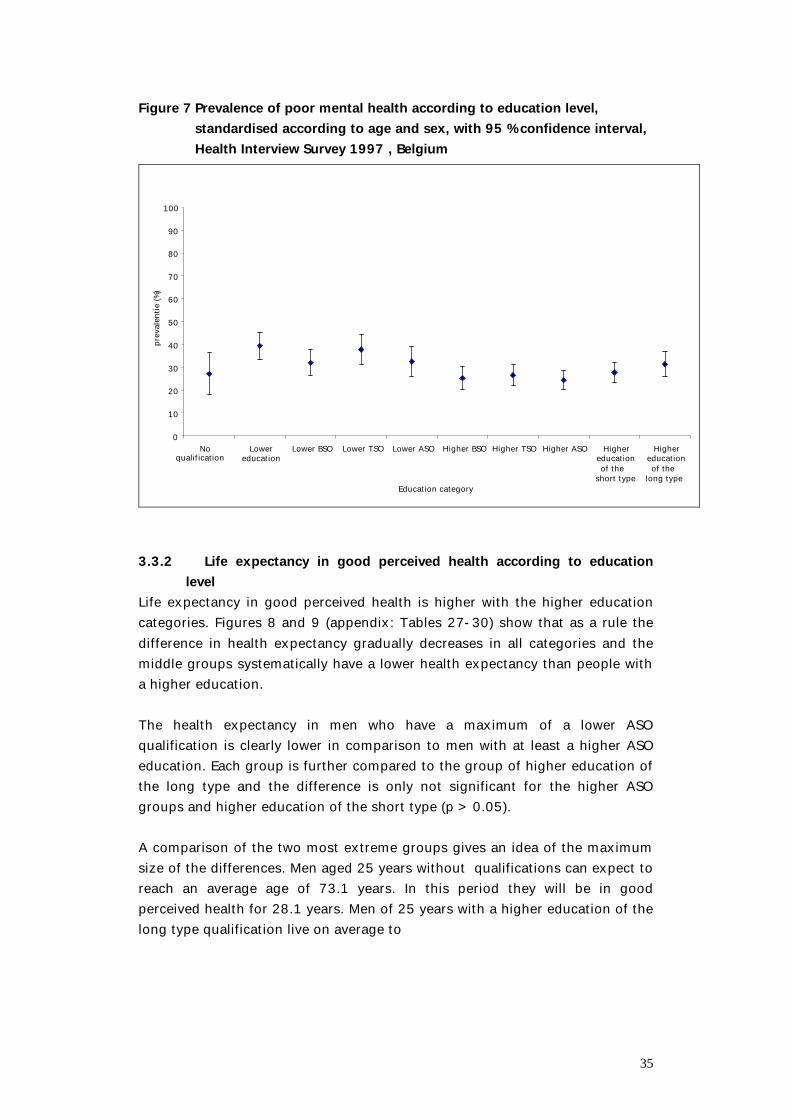
35
Figure 7 Prevalence of poor mental health according to education level, standardised according to age and sex, with 95 % confidence interval, Health Interview Survey 1997 , Belgium
0
10
20
30
40
50
60
70
80
90
100
Noqualification
Lowereducation
Lower BSO Lower TSO Lower ASO Higher BSO Higher TSO Higher ASO Highereducationof the
short type
Highereducationof the
long typeEducation category
preva
lentie
(%)
3.3.2 Life expectancy in good perceived health according to education
level Life expectancy in good perceived health is higher with the higher education categories. Figures 8 and 9 (appendix: Tables 27-30) show that as a rule the difference in health expectancy gradually decreases in all categories and the middle groups systematically have a lower health expectancy than people with a higher education. The health expectancy in men who have a maximum of a lower ASO qualification is clearly lower in comparison to men with at least a higher ASO education. Each group is further compared to the group of higher education of the long type and the difference is only not significant for the higher ASO groups and higher education of the short type (p > 0.05). A comparison of the two most extreme groups gives an idea of the maximum size of the differences. Men aged 25 years without qualifications can expect to reach an average age of 73.1 years. In this period they will be in good perceived health for 28.1 years. Men of 25 years with a higher education of the long type qualification live on average to
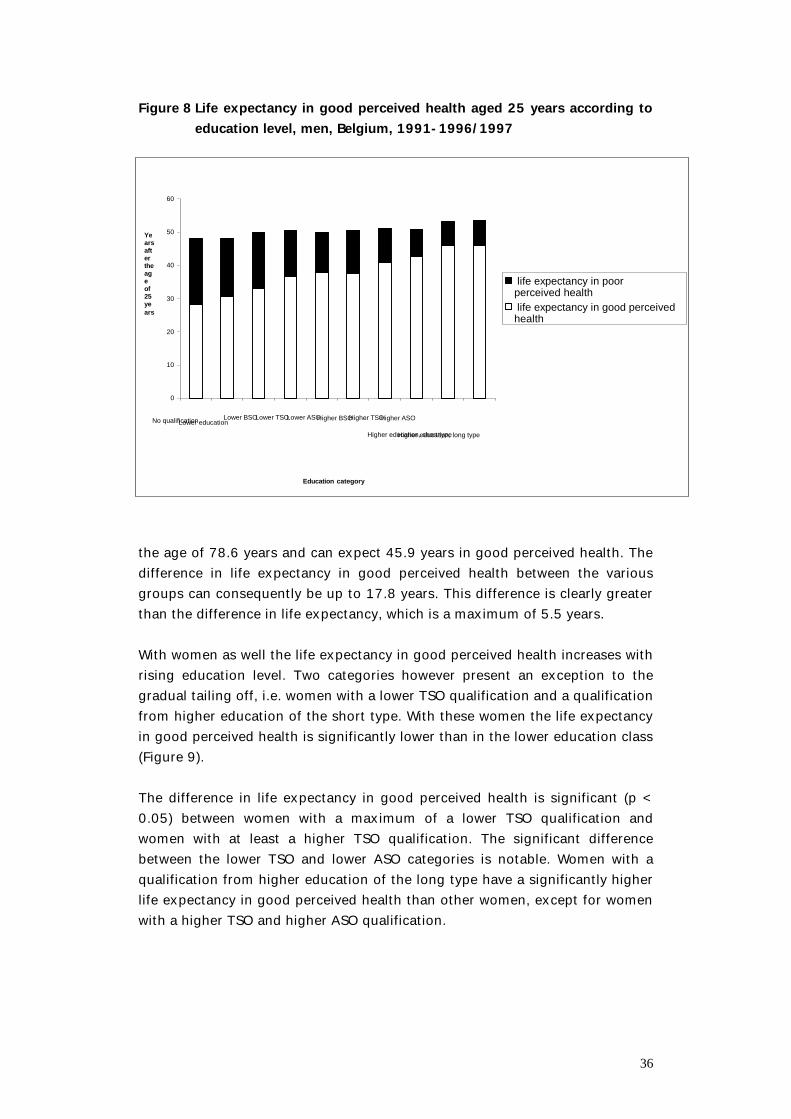
36
Figure 8 Life expectancy in good perceived health aged 25 years according to education level, men, Belgium, 1991-1996/1997
the age of 78.6 years and can expect 45.9 years in good perceived health. The difference in life expectancy in good perceived health between the various groups can consequently be up to 17.8 years. This difference is clearly greater than the difference in life expectancy, which is a maximum of 5.5 years. With women as well the life expectancy in good perceived health increases with rising education level. Two categories however present an exception to the gradual tailing off, i.e. women with a lower TSO qualification and a qualification from higher education of the short type. With these women the life expectancy in good perceived health is significantly lower than in the lower education class (Figure 9). The difference in life expectancy in good perceived health is significant (p < 0.05) between women with a maximum of a lower TSO qualification and women with at least a higher TSO qualification. The significant difference between the lower TSO and lower ASO categories is notable. Women with a qualification from higher education of the long type have a significantly higher life expectancy in good perceived health than other women, except for women with a higher TSO and higher ASO qualification.
0
10
20
30
40
50
60
No qualificationLower educationLower BSOLower TSOLower ASOHigher BSOHigher TSOHigher ASO
Higher education, short typeHigher education, long type
Education category
Yearsaftertheageof25years
life expectancy in poorperceived health life expectancy in good perceivedhealth
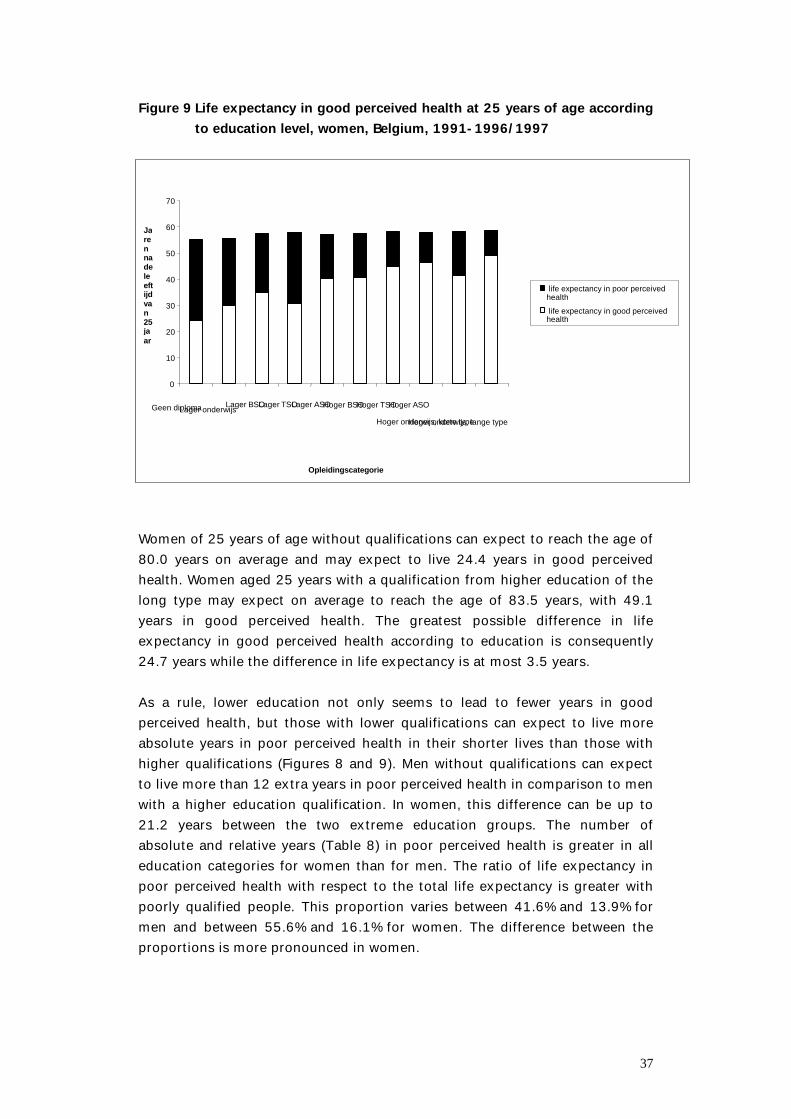
37
Figure 9 Life expectancy in good perceived health at 25 years of age according to education level, women, Belgium, 1991-1996/1997
Women of 25 years of age without qualifications can expect to reach the age of 80.0 years on average and may expect to live 24.4 years in good perceived health. Women aged 25 years with a qualification from higher education of the long type may expect on average to reach the age of 83.5 years, with 49.1 years in good perceived health. The greatest possible difference in life expectancy in good perceived health according to education is consequently 24.7 years while the difference in life expectancy is at most 3.5 years. As a rule, lower education not only seems to lead to fewer years in good perceived health, but those with lower qualifications can expect to live more absolute years in poor perceived health in their shorter lives than those with higher qualifications (Figures 8 and 9). Men without qualifications can expect to live more than 12 extra years in poor perceived health in comparison to men with a higher education qualification. In women, this difference can be up to 21.2 years between the two extreme education groups. The number of absolute and relative years (Table 8) in poor perceived health is greater in all education categories for women than for men. The ratio of life expectancy in poor perceived health with respect to the total life expectancy is greater with poorly qualified people. This proportion varies between 41.6% and 13.9% for men and between 55.6% and 16.1% for women. The difference between the proportions is more pronounced in women.
0
10
20
30
40
50
60
70
Geen diplomaLager onderwijsLager BSOLager TSOLager ASOHoger BSOHoger TSOHoger ASO
Hoger onderwijs, korte typeHoger onderwijs, lange type
Opleidingscategorie
Jarennadeleeftijdvan25jaar
life expectancy in poor perceivedhealth in slechte ervarenhealth
life expectancy in good perceivedhealth goede ervarenhealth
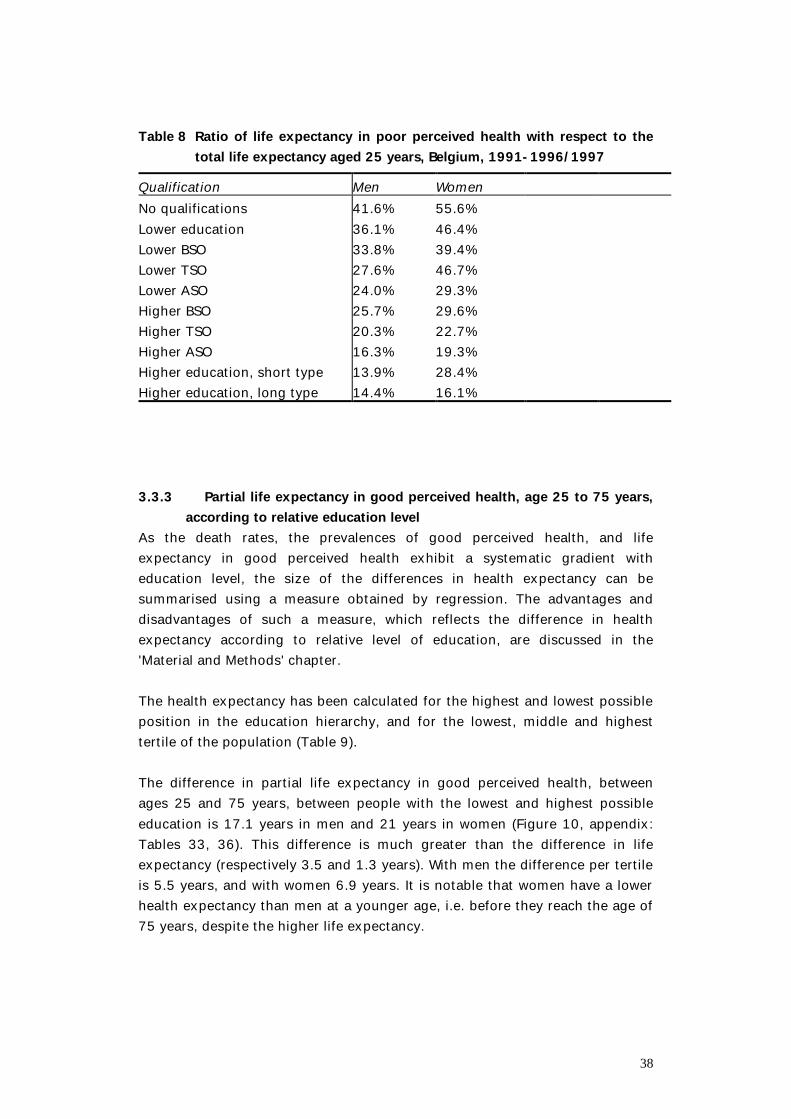
38
Table 8 Ratio of life expectancy in poor perceived health with respect to the
total life expectancy aged 25 years, Belgium, 1991-1996/1997 Qualification Men Women No qualifications 41.6% 55.6% Lower education 36.1% 46.4% Lower BSO 33.8% 39.4% Lower TSO 27.6% 46.7% Lower ASO 24.0% 29.3% Higher BSO 25.7% 29.6% Higher TSO 20.3% 22.7% Higher ASO 16.3% 19.3% Higher education, short type 13.9% 28.4% Higher education, long type 14.4% 16.1% 3.3.3 Partial life expectancy in good perceived health, age 25 to 75 years,
according to relative education level As the death rates, the prevalences of good perceived health, and life expectancy in good perceived health exhibit a systematic gradient with education level, the size of the differences in health expectancy can be summarised using a measure obtained by regression. The advantages and disadvantages of such a measure, which reflects the difference in health expectancy according to relative level of education, are discussed in the 'Material and Methods' chapter. The health expectancy has been calculated for the highest and lowest possible position in the education hierarchy, and for the lowest, middle and highest tertile of the population (Table 9). The difference in partial life expectancy in good perceived health, between ages 25 and 75 years, between people with the lowest and highest possible education is 17.1 years in men and 21 years in women (Figure 10, appendix: Tables 33, 36). This difference is much greater than the difference in life expectancy (respectively 3.5 and 1.3 years). With men the difference per tertile is 5.5 years, and with women 6.9 years. It is notable that women have a lower health expectancy than men at a younger age, i.e. before they reach the age of 75 years, despite the higher life expectancy.
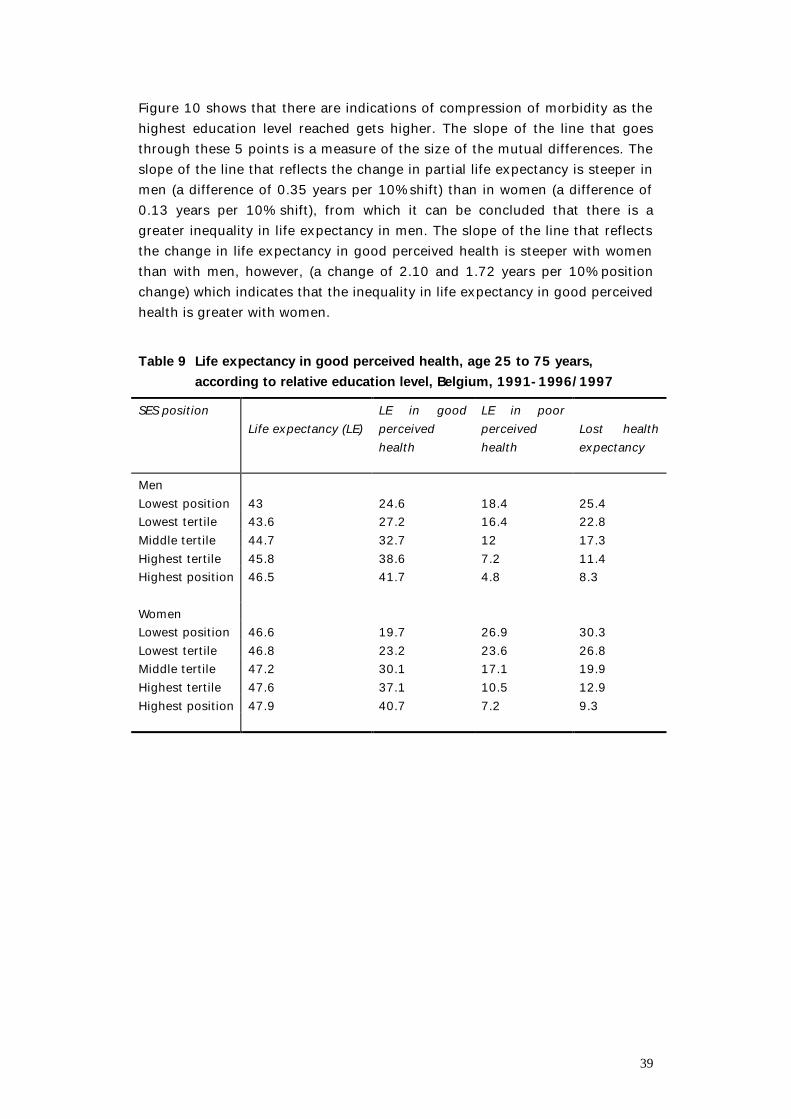
39
Figure 10 shows that there are indications of compression of morbidity as the highest education level reached gets higher. The slope of the line that goes through these 5 points is a measure of the size of the mutual differences. The slope of the line that reflects the change in partial life expectancy is steeper in men (a difference of 0.35 years per 10% shift) than in women (a difference of 0.13 years per 10% shift), from which it can be concluded that there is a greater inequality in life expectancy in men. The slope of the line that reflects the change in life expectancy in good perceived health is steeper with women than with men, however, (a change of 2.10 and 1.72 years per 10% position change) which indicates that the inequality in life expectancy in good perceived health is greater with women. Table 9 Life expectancy in good perceived health, age 25 to 75 years,
according to relative education level, Belgium, 1991-1996/1997 SES position
Life expectancy (LE)
LE in good perceived health
LE in poor perceived health
Lost health expectancy
Men Lowest position 43 24.6 18.4 25.4 Lowest tertile 43.6 27.2 16.4 22.8 Middle tertile 44.7 32.7 12 17.3 Highest tertile 45.8 38.6 7.2 11.4 Highest position 46.5 41.7 4.8 8.3 Women Lowest position 46.6 19.7 26.9 30.3 Lowest tertile 46.8 23.2 23.6 26.8 Middle tertile 47.2 30.1 17.1 19.9 Highest tertile 47.6 37.1 10.5 12.9 Highest position 47.9 40.7 7.2 9.3
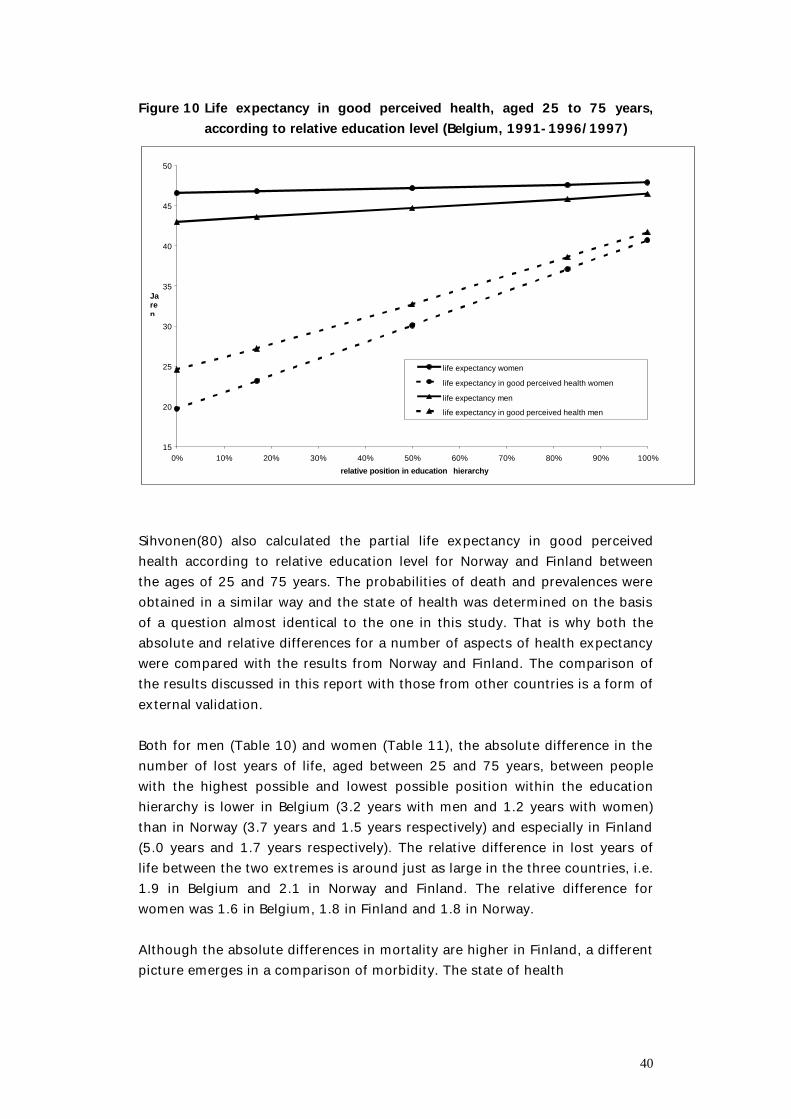
40
Figure 10 Life expectancy in good perceived health, aged 25 to 75 years, according to relative education level (Belgium, 1991-1996/1997)
15
20
25
30
35
40
45
50
0% 10% 20% 30% 40% 50% 60% 70% 80% 90% 100%
relative position in education hierarchy
Jaren
life expectancy women
life expectancy in good perceived health women
life expectancy men
life expectancy in good perceived health men
Sihvonen(80) also calculated the partial life expectancy in good perceived health according to relative education level for Norway and Finland between the ages of 25 and 75 years. The probabilities of death and prevalences were obtained in a similar way and the state of health was determined on the basis of a question almost identical to the one in this study. That is why both the absolute and relative differences for a number of aspects of health expectancy were compared with the results from Norway and Finland. The comparison of the results discussed in this report with those from other countries is a form of external validation. Both for men (Table 10) and women (Table 11), the absolute difference in the number of lost years of life, aged between 25 and 75 years, between people with the highest possible and lowest possible position within the education hierarchy is lower in Belgium (3.2 years with men and 1.2 years with women) than in Norway (3.7 years and 1.5 years respectively) and especially in Finland (5.0 years and 1.7 years respectively). The relative difference in lost years of life between the two extremes is around just as large in the three countries, i.e. 1.9 in Belgium and 2.1 in Norway and Finland. The relative difference for women was 1.6 in Belgium, 1.8 in Finland and 1.8 in Norway. Although the absolute differences in mortality are higher in Finland, a different picture emerges in a comparison of morbidity. The state of health
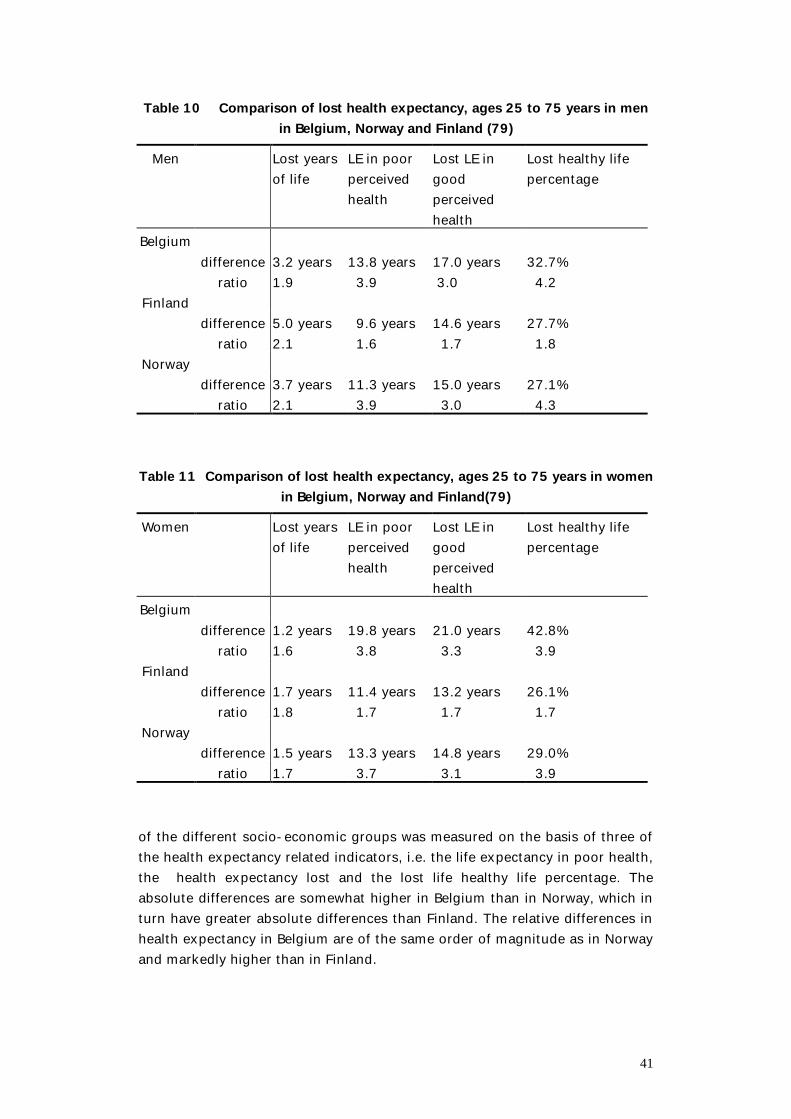
41
Table 10 Comparison of lost health expectancy, ages 25 to 75 years in men in Belgium, Norway and Finland (79)
Men Lost years of life
LE in poor perceived health
Lost LE in good perceived health
Lost healthy life percentage
Belgium difference 3.2 years 13.8 years 17.0 years 32.7% ratio 1.9 3.9 3.0 4.2
Finland difference 5.0 years 9.6 years 14.6 years 27.7% ratio 2.1 1.6 1.7 1.8
Norway difference 3.7 years 11.3 years 15.0 years 27.1% ratio 2.1 3.9 3.0 4.3
Table 11 Comparison of lost health expectancy, ages 25 to 75 years in women
in Belgium, Norway and Finland(79) Women Lost years
of life LE in poor perceived health
Lost LE in good perceived health
Lost healthy life percentage
Belgium difference 1.2 years 19.8 years 21.0 years 42.8% ratio 1.6 3.8 3.3 3.9
Finland difference 1.7 years 11.4 years 13.2 years 26.1% ratio 1.8 1.7 1.7 1.7
Norway difference 1.5 years 13.3 years 14.8 years 29.0% ratio 1.7 3.7 3.1 3.9
of the different socio-economic groups was measured on the basis of three of the health expectancy related indicators, i.e. the life expectancy in poor health, the health expectancy lost and the lost life healthy life percentage. The absolute differences are somewhat higher in Belgium than in Norway, which in turn have greater absolute differences than Finland. The relative differences in health expectancy in Belgium are of the same order of magnitude as in Norway and markedly higher than in Finland.
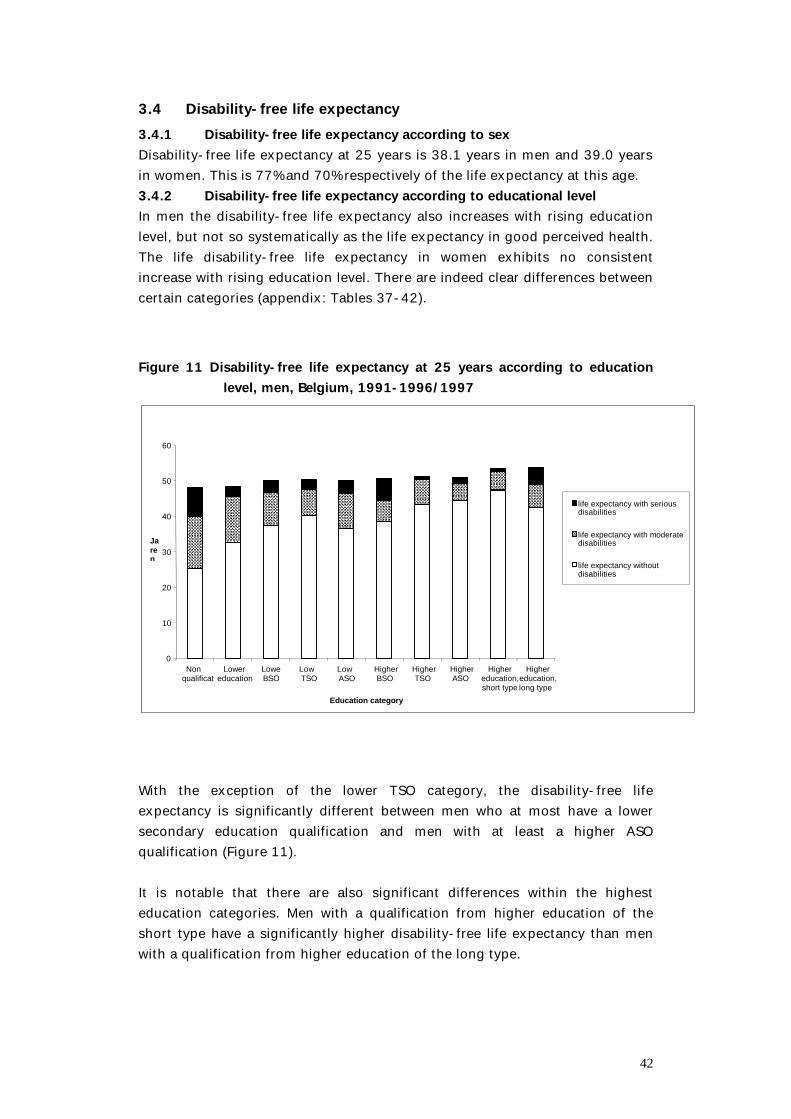
42
3.4 Disability-free life expectancy 3.4.1 Disability-free life expectancy according to sex Disability-free life expectancy at 25 years is 38.1 years in men and 39.0 years in women. This is 77% and 70% respectively of the life expectancy at this age. 3.4.2 Disability-free life expectancy according to educational level In men the disability-free life expectancy also increases with rising education level, but not so systematically as the life expectancy in good perceived health. The life disability-free life expectancy in women exhibits no consistent increase with rising education level. There are indeed clear differences between certain categories (appendix: Tables 37-42). Figure 11 Disability-free life expectancy at 25 years according to education
level, men, Belgium, 1991-1996/1997
0
10
20
30
40
50
60
Nonqualification
Lowereducation
LoweBSO
LowTSO
LowASO
HigherBSO
HigherTSO
HigherASO
Highereducation,short type
Highereducation,long type
Education category
Jaren
life expectancy with seriousisabiltyevensverwachting metdisabilities
life expectancy with moderatedisabilities
life expectancy withoutdisabilities
With the exception of the lower TSO category, the disability-free life expectancy is significantly different between men who at most have a lower secondary education qualification and men with at least a higher ASO qualification (Figure 11). It is notable that there are also significant differences within the highest education categories. Men with a qualification from higher education of the short type have a significantly higher disability-free life expectancy than men with a qualification from higher education of the long type.
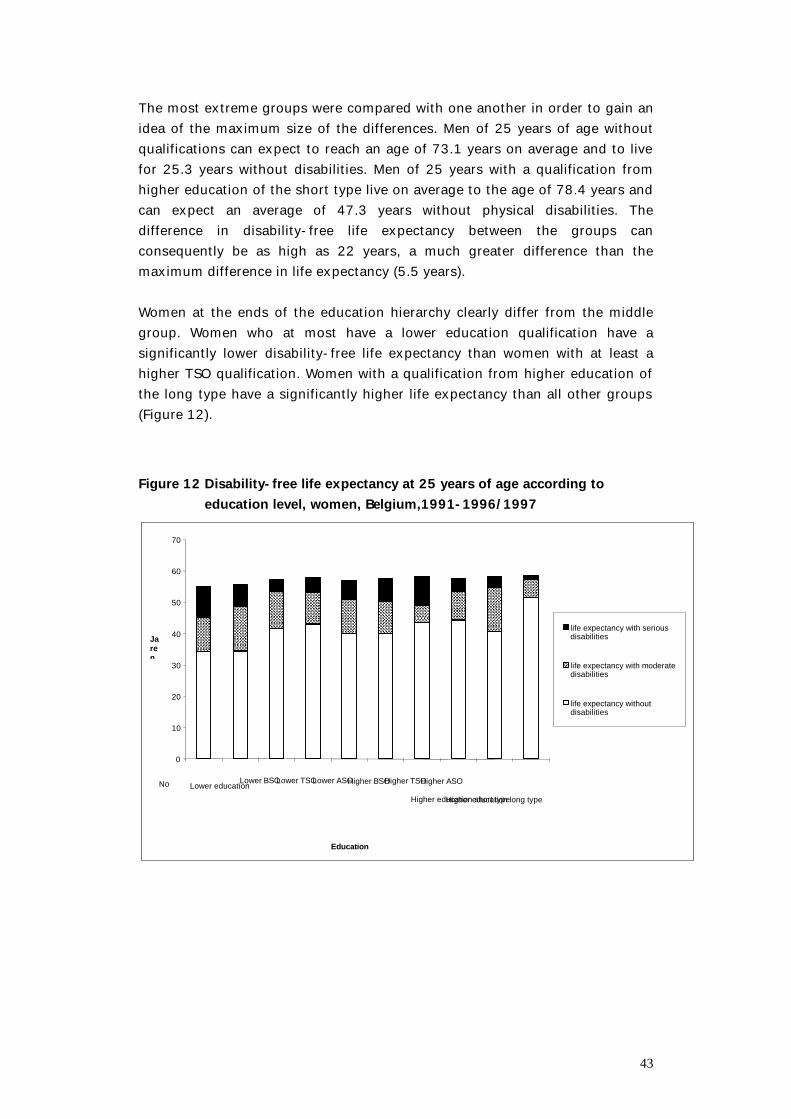
43
The most extreme groups were compared with one another in order to gain an idea of the maximum size of the differences. Men of 25 years of age without qualifications can expect to reach an age of 73.1 years on average and to live for 25.3 years without disabilities. Men of 25 years with a qualification from higher education of the short type live on average to the age of 78.4 years and can expect an average of 47.3 years without physical disabilities. The difference in disability-free life expectancy between the groups can consequently be as high as 22 years, a much greater difference than the maximum difference in life expectancy (5.5 years). Women at the ends of the education hierarchy clearly differ from the middle group. Women who at most have a lower education qualification have a significantly lower disability-free life expectancy than women with at least a higher TSO qualification. Women with a qualification from higher education of the long type have a significantly higher life expectancy than all other groups (Figure 12). Figure 12 Disability-free life expectancy at 25 years of age according to
education level, women, Belgium,1991-1996/1997
0
10
20
30
40
50
60
70
Noqualification
Lower educationLower BSOLower TSOLower ASOHigher BSOHigher TSOHigher ASO
Higher education short typeHigher education long type
Educationcategories
Jaren
life expectancy with seriousdisabilities
life expectancy with moderatedisabilities
life expectancy withoutdisabilities
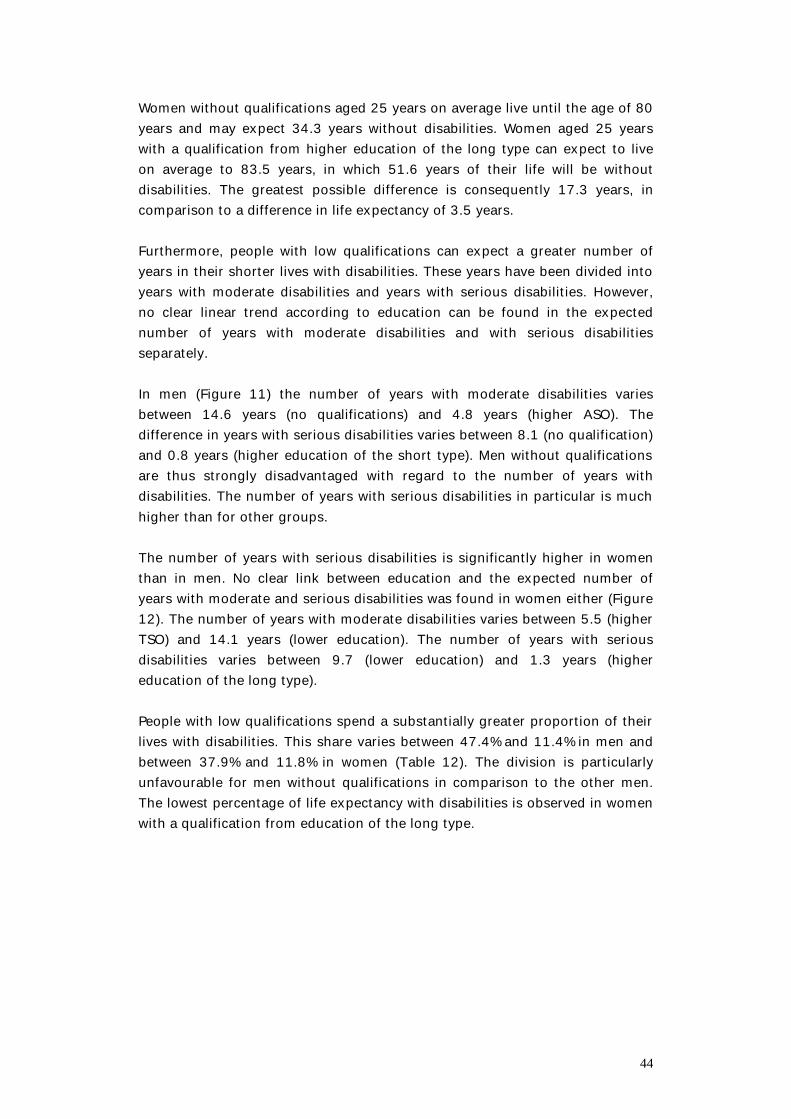
44
Women without qualifications aged 25 years on average live until the age of 80 years and may expect 34.3 years without disabilities. Women aged 25 years with a qualification from higher education of the long type can expect to live on average to 83.5 years, in which 51.6 years of their life will be without disabilities. The greatest possible difference is consequently 17.3 years, in comparison to a difference in life expectancy of 3.5 years. Furthermore, people with low qualifications can expect a greater number of years in their shorter lives with disabilities. These years have been divided into years with moderate disabilities and years with serious disabilities. However, no clear linear trend according to education can be found in the expected number of years with moderate disabilities and with serious disabilities separately. In men (Figure 11) the number of years with moderate disabilities varies between 14.6 years (no qualifications) and 4.8 years (higher ASO). The difference in years with serious disabilities varies between 8.1 (no qualification) and 0.8 years (higher education of the short type). Men without qualifications are thus strongly disadvantaged with regard to the number of years with disabilities. The number of years with serious disabilities in particular is much higher than for other groups. The number of years with serious disabilities is significantly higher in women than in men. No clear link between education and the expected number of years with moderate and serious disabilities was found in women either (Figure 12). The number of years with moderate disabilities varies between 5.5 (higher TSO) and 14.1 years (lower education). The number of years with serious disabilities varies between 9.7 (lower education) and 1.3 years (higher education of the long type). People with low qualifications spend a substantially greater proportion of their lives with disabilities. This share varies between 47.4% and 11.4% in men and between 37.9% and 11.8% in women (Table 12). The division is particularly unfavourable for men without qualifications in comparison to the other men. The lowest percentage of life expectancy with disabilities is observed in women with a qualification from education of the long type.
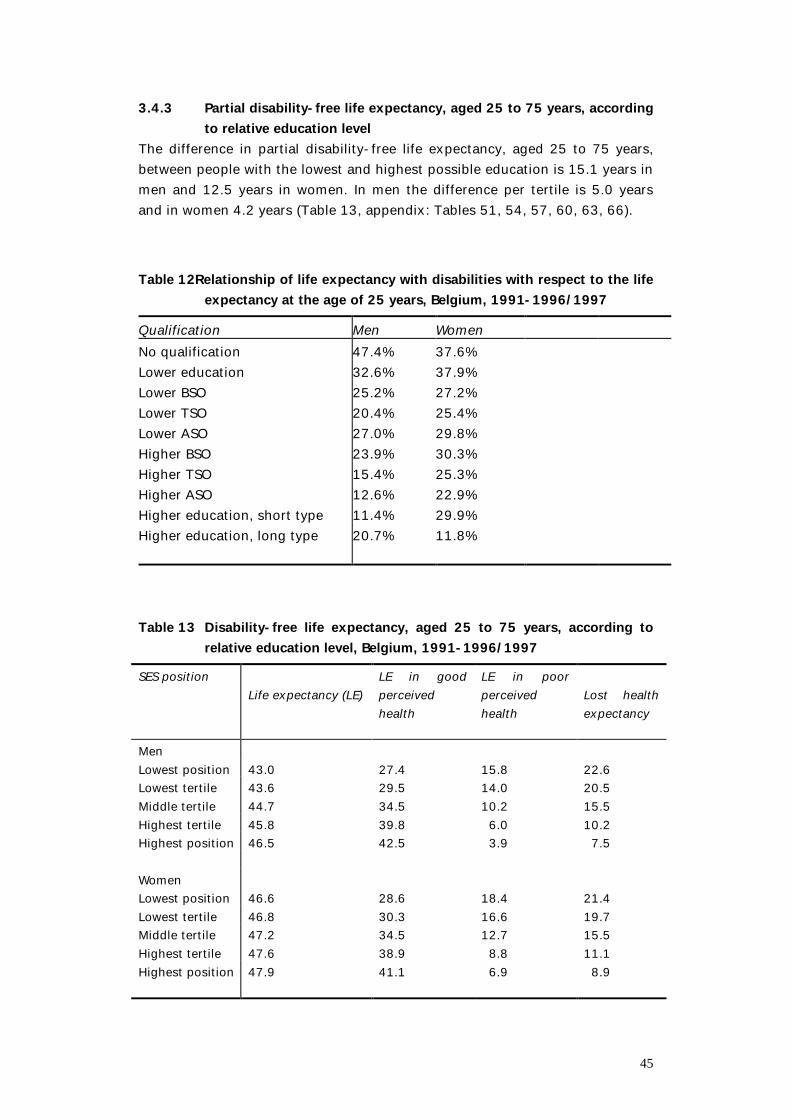
45
3.4.3 Partial disability-free life expectancy, aged 25 to 75 years, according to relative education level
The difference in partial disability-free life expectancy, aged 25 to 75 years, between people with the lowest and highest possible education is 15.1 years in men and 12.5 years in women. In men the difference per tertile is 5.0 years and in women 4.2 years (Table 13, appendix: Tables 51, 54, 57, 60, 63, 66). Table 12Relationship of life expectancy with disabilities with respect to the life
expectancy at the age of 25 years, Belgium, 1991-1996/1997 Qualification Men Women No qualification 47.4% 37.6% Lower education 32.6% 37.9% Lower BSO 25.2% 27.2% Lower TSO 20.4% 25.4% Lower ASO 27.0% 29.8% Higher BSO 23.9% 30.3% Higher TSO 15.4% 25.3% Higher ASO 12.6% 22.9% Higher education, short type 11.4% 29.9% Higher education, long type 20.7% 11.8% Table 13 Disability-free life expectancy, aged 25 to 75 years, according to
relative education level, Belgium, 1991-1996/1997 SES position
Life expectancy (LE)
LE in good perceived health
LE in poor perceived health
Lost health expectancy
Men Lowest position 43.0 27.4 15.8 22.6 Lowest tertile 43.6 29.5 14.0 20.5 Middle tertile 44.7 34.5 10.2 15.5 Highest tertile 45.8 39.8 6.0 10.2 Highest position 46.5 42.5 3.9 7.5 Women Lowest position 46.6 28.6 18.4 21.4 Lowest tertile 46.8 30.3 16.6 19.7 Middle tertile 47.2 34.5 12.7 15.5 Highest tertile 47.6 38.9 8.8 11.1 Highest position 47.9 41.1 6.9 8.9
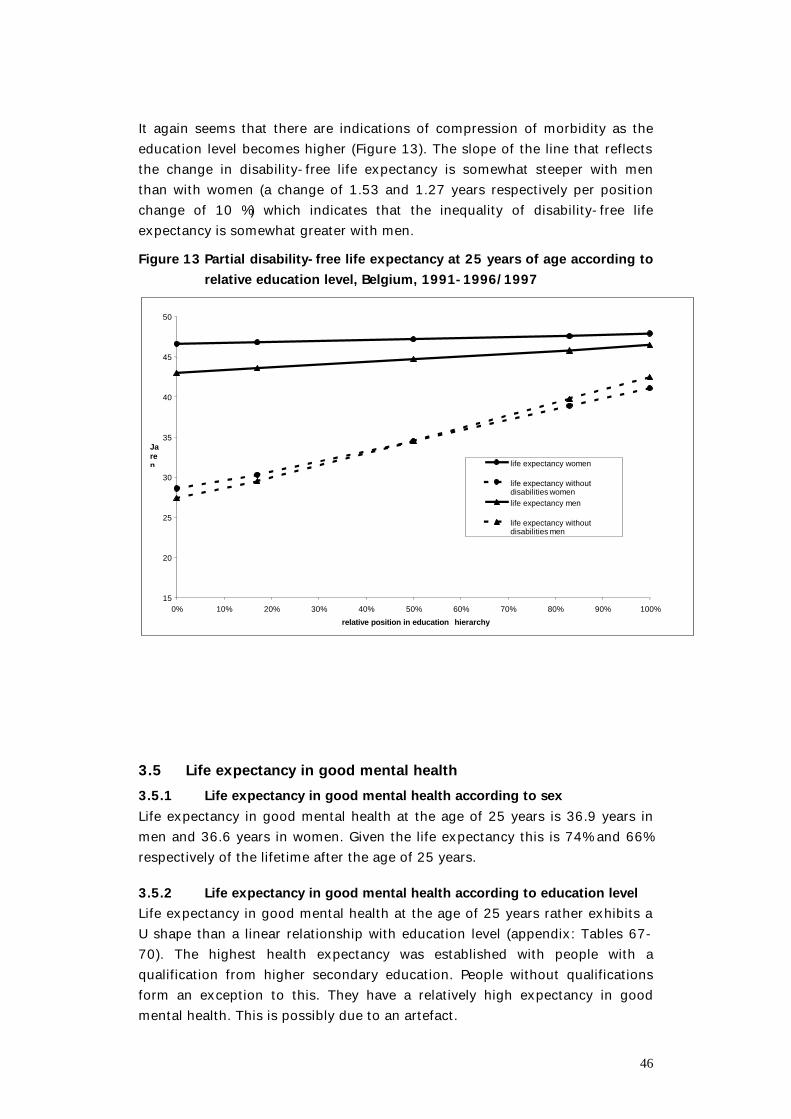
46
It again seems that there are indications of compression of morbidity as the education level becomes higher (Figure 13). The slope of the line that reflects the change in disability-free life expectancy is somewhat steeper with men than with women (a change of 1.53 and 1.27 years respectively per position change of 10 %) which indicates that the inequality of disability-free life expectancy is somewhat greater with men. Figure 13 Partial disability-free life expectancy at 25 years of age according to
relative education level, Belgium, 1991-1996/1997
15
20
25
30
35
40
45
50
0% 10% 20% 30% 40% 50% 60% 70% 80% 90% 100%
relative position in education hierarchy
Jaren life expectancy women
life expectancy withoutdisabilities womenlife expectancy men
life expectancy withoutdisabilities men
3.5 Life expectancy in good mental health 3.5.1 Life expectancy in good mental health according to sex Life expectancy in good mental health at the age of 25 years is 36.9 years in men and 36.6 years in women. Given the life expectancy this is 74% and 66% respectively of the lifetime after the age of 25 years.
3.5.2 Life expectancy in good mental health according to education level Life expectancy in good mental health at the age of 25 years rather exhibits a U shape than a linear relationship with education level (appendix: Tables 67-70). The highest health expectancy was established with people with a qualification from higher secondary education. People without qualifications form an exception to this. They have a relatively high expectancy in good mental health. This is possibly due to an artefact.
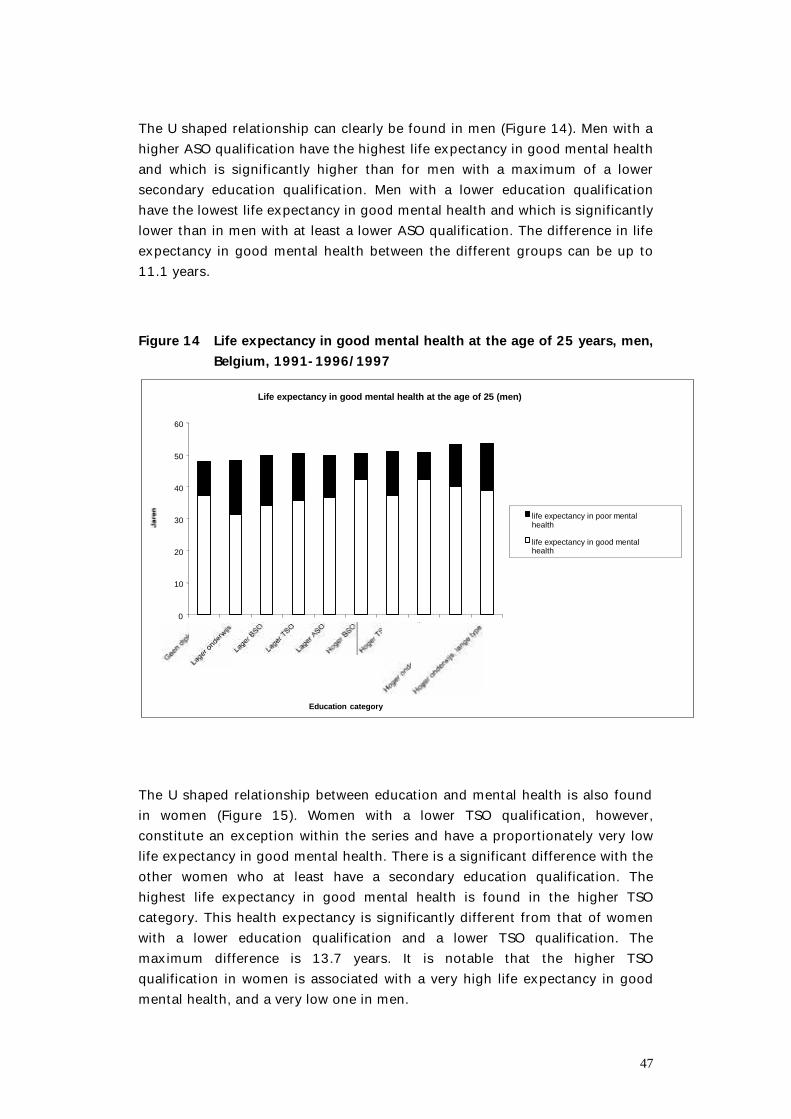
47
The U shaped relationship can clearly be found in men (Figure 14). Men with a higher ASO qualification have the highest life expectancy in good mental health and which is significantly higher than for men with a maximum of a lower secondary education qualification. Men with a lower education qualification have the lowest life expectancy in good mental health and which is significantly lower than in men with at least a lower ASO qualification. The difference in life expectancy in good mental health between the different groups can be up to 11.1 years. Figure 14 Life expectancy in good mental health at the age of 25 years, men,
Belgium, 1991-1996/1997 Life expectancy in good mental health at the age of 25 (men)
0
10
20
30
40
50
60
Education category
life expectancy in poor mentalhealth
life expectancy in good mentalhealth
The U shaped relationship between education and mental health is also found in women (Figure 15). Women with a lower TSO qualification, however, constitute an exception within the series and have a proportionately very low life expectancy in good mental health. There is a significant difference with the other women who at least have a secondary education qualification. The highest life expectancy in good mental health is found in the higher TSO category. This health expectancy is significantly different from that of women with a lower education qualification and a lower TSO qualification. The maximum difference is 13.7 years. It is notable that the higher TSO qualification in women is associated with a very high life expectancy in good mental health, and a very low one in men.
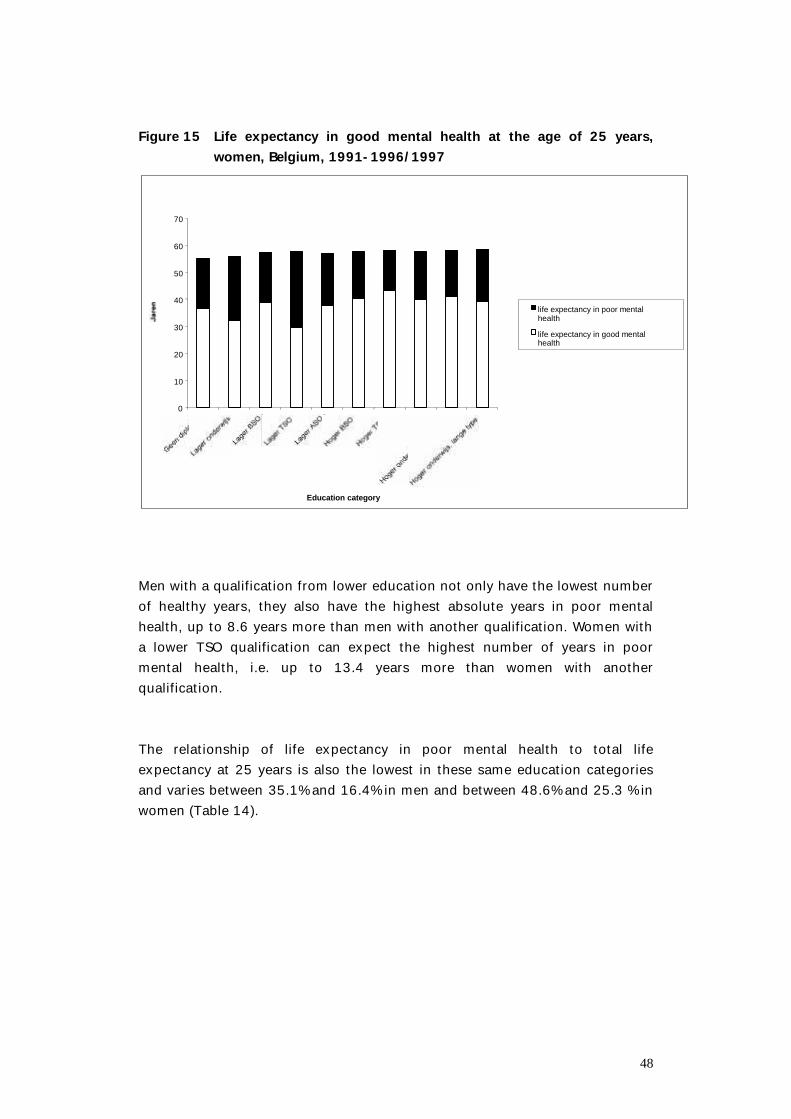
48
Figure 15 Life expectancy in good mental health at the age of 25 years,
women, Belgium, 1991-1996/1997 Levensverwachting in goede geestelijke gezondheid op 25 jaar (vrouwen)
0
10
20
30
40
50
60
70
Education category
life expectancy in poor mentalgeestelijkehealth
life expectancy in good mentalhealth
Men with a qualification from lower education not only have the lowest number of healthy years, they also have the highest absolute years in poor mental health, up to 8.6 years more than men with another qualification. Women with a lower TSO qualification can expect the highest number of years in poor mental health, i.e. up to 13.4 years more than women with another qualification. The relationship of life expectancy in poor mental health to total life expectancy at 25 years is also the lowest in these same education categories and varies between 35.1% and 16.4% in men and between 48.6% and 25.3 % in women (Table 14).
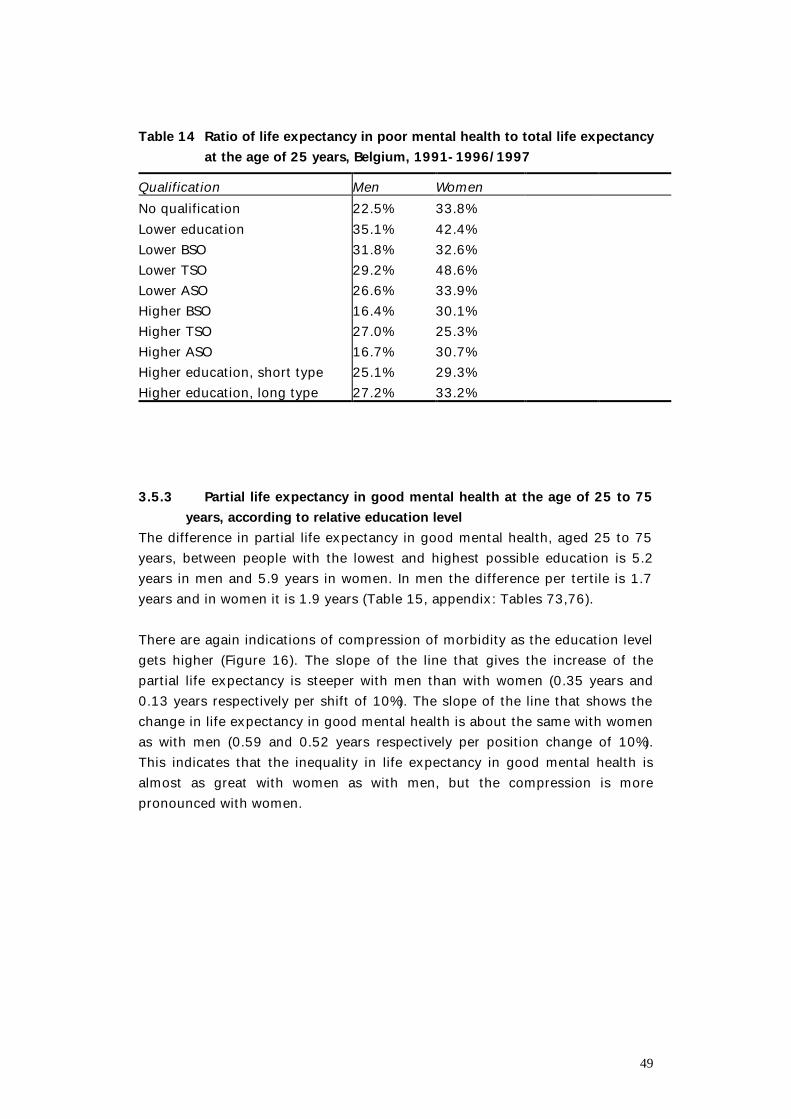
49
Table 14 Ratio of life expectancy in poor mental health to total life expectancy
at the age of 25 years, Belgium, 1991-1996/1997 Qualification Men Women No qualification 22.5% 33.8% Lower education 35.1% 42.4% Lower BSO 31.8% 32.6% Lower TSO 29.2% 48.6% Lower ASO 26.6% 33.9% Higher BSO 16.4% 30.1% Higher TSO 27.0% 25.3% Higher ASO 16.7% 30.7% Higher education, short type 25.1% 29.3% Higher education, long type 27.2% 33.2% 3.5.3 Partial life expectancy in good mental health at the age of 25 to 75
years, according to relative education level The difference in partial life expectancy in good mental health, aged 25 to 75 years, between people with the lowest and highest possible education is 5.2 years in men and 5.9 years in women. In men the difference per tertile is 1.7 years and in women it is 1.9 years (Table 15, appendix: Tables 73,76). There are again indications of compression of morbidity as the education level gets higher (Figure 16). The slope of the line that gives the increase of the partial life expectancy is steeper with men than with women (0.35 years and 0.13 years respectively per shift of 10%). The slope of the line that shows the change in life expectancy in good mental health is about the same with women as with men (0.59 and 0.52 years respectively per position change of 10%). This indicates that the inequality in life expectancy in good mental health is almost as great with women as with men, but the compression is more pronounced with women.
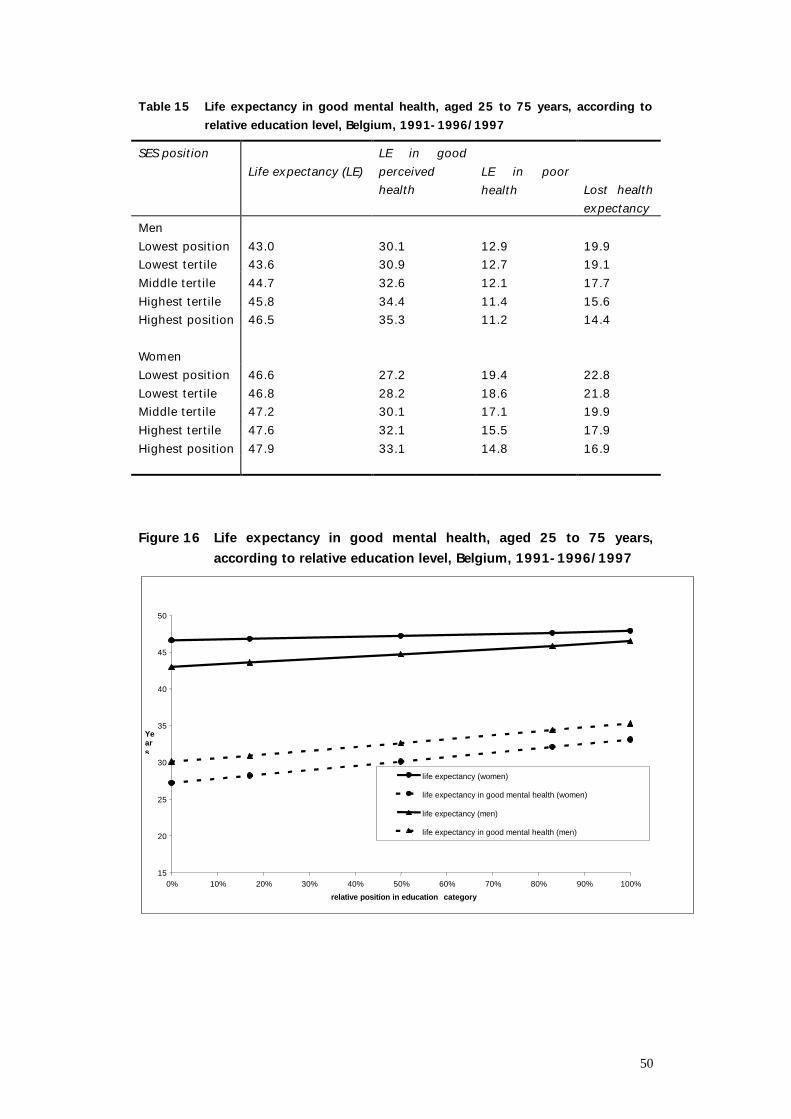
50
Table 15 Life expectancy in good mental health, aged 25 to 75 years, according to relative education level, Belgium, 1991-1996/1997
SES position Life expectancy (LE)
LE in good perceived health
LE in poor health
Lost health expectancy
Men Lowest position 43.0 30.1 12.9 19.9 Lowest tertile 43.6 30.9 12.7 19.1 Middle tertile 44.7 32.6 12.1 17.7 Highest tertile 45.8 34.4 11.4 15.6 Highest position 46.5 35.3 11.2 14.4 Women Lowest position 46.6 27.2 19.4 22.8 Lowest tertile 46.8 28.2 18.6 21.8 Middle tertile 47.2 30.1 17.1 19.9 Highest tertile 47.6 32.1 15.5 17.9 Highest position 47.9 33.1 14.8 16.9 Figure 16 Life expectancy in good mental health, aged 25 to 75 years,
according to relative education level, Belgium, 1991-1996/1997
15
20
25
30
35
40
45
50
0% 10% 20% 30% 40% 50% 60% 70% 80% 90% 100%
relative position in education category
Years
life expectancy (women)
life expectancy in good mental health (women)
life expectancy (men)
life expectancy in good mental health (men)
51
4. Discussion 4.1 Informative value of the basic data Relevant conclusions for policy purposes are only possible if the basic data that the composite indicator has been calculated from are recent enough. In this study both the probabilities of death (1991-1996) and the prevalences (1997) satisfy this condition. The total population contributes to the calculation of the probabilities of death according to education level. The prevalences were obtained from the Health Interview Survey 1997 , in which a total of 0.1% of the population was interviewed. In this research, the health expectancy according to the highest education level reached was determined for men and women at the age of 25 years and older, thus for the largest proportion of the population. The advantage of the education dimension is that the information is known for the large majority of people interviewed and is relatively stable over time. An important limitation in the data is the fact that the health survey, in contrast to the aim, clearly did not access the institutionalised population adequately. This problem was not taken into account in this exercise and the limitations of the various assumptions relating to the socio-economic position and health association have been discussed. The main limitation of the mortality data is that people with an unknown education level, who are also in a high mortality group, have not been included in this study. The information on mortality and the morbidity data have been linked at an individual level to socio-economic position. The probabilities of death were also obtained from longitudinal research. These two factors increase the internal validity. The fact, too, that no less than ten homogenous education categories were used contributes to the internal validity. In other studies fewer education classes were used which were not so homogenous. The breakdown used also has its limitations, mainly with respect to the relative method. It is plausible for the ASO discipline to be given the highest rank in lower secondary education and higher secondary education. In a ranking using the highest qualification obtained, strictly speaking this is not correct as in principle these two types of education do not lead to a final qualification. They are preparatory stages for further education. The precision of the mortality figures, which are the result of a 5 year follow-up of the total population, is much greater than in the health survey where only 0.1% of the total population was interviewed. Hence, for calculating the variance of the health expectancy only the uncertainty in the prevalences were used.
52
4.2 The health expectancy indicator Health is a very broad concept and can be measured in various ways depending on the interpretation. Studies of the different health dimensions enable a deeper understanding of the health of a population to be obtained. In this research the health expectancy was calculated for 3 states of health: 1) perceived health because, irrespective of the objective health, it is an important predictor of mortality and morbidity(76), 2) mental health, because it is an essential component of general health and over the next few years it will be one of the most important subjects in public health(76,82), and 3) disability-free life expectancy, because this is the basic indictor of the family of health expectancy indicators and because this indicator is closely related to the concept of health at increased age (83) The composite indicator of health expectancy is used to express the health of the different socio-economic groups in one figure, which combines information on mortality and morbidity. The benefits of health expectancy over other composite health indicators are the simple calculation and interpretation, the availability of the basic data, the possibility to present the indicator visually in an understandable way, and the conceptual relationship with an already well known indicator, life expectancy. Alongside the basic indicator of health expectancy, derived statistics (such as the number of years in poor health, the healthy life percentage, the lost life expectancy and the lost health expectancy) can widen understanding.
4.3 Nature of the relationship between health expectancy and education level
For the three dimensions of health, the health expectancy of the groups with low qualifications is lower than for the highly qualified. Life expectancy in good perceived health increases systematically in both men and women through the different education categories.
53
In men, disability-free life expectancy also increases with increasing education level, but in comparison to the life expectancy in good perceived health, the increase is not so systematic. It is notable that there are still significant differences within the highest education categories. Men with a qualification from 'higher education of the short type' score remarkably well. The increase in disability-free life expectancy in women is less systematic. Clear differences between certain categories can be seen. Women at the ends of the education hierarchy are clearly different from the middle group. Women with a maximum of a lower education qualification have a significantly lower disability-free life expectancy than almost all other groups. Women with a qualification from 'higher education of the long type' have a significantly higher life expectancy than all other groups. Life expectancy in good mental health exhibits a U shaped pattern whereby the ‘higher secondary education’ scores better than those with higher and lower qualifications.
4.4 Size of the differences in health expectancy 4.4.1 Absolute education level The greatest possible difference in health expectancy at the age of 25 years between the different education categories is 5.5 years with men and 3.5 years with women. Differences in health expectancy are greater, however. The difference in life expectancy in good perceived health between the different education categories can be up to 17.8 years in men and up to 24.7 years in women. In men, only the higher BSO category has a lower health expectancy than the category below it. In women, the life expectancy in good perceived health for those with a TSO qualification and a qualification from ‘higher education of the short type’ is a little lower than the neighbouring groups in the education hierarchy. The difference in disability-free life expectancy between the different groups can be up to 22 years in men and 17.3 years in women. The difference in life expectancy in good mental health between the different groups is a maximum of 11.1 years in men and 13.7 years in women. It is notable that for this health condition the highest life expectancy in good mental health is not with people with a higher education qualification. Men with a higher ASO general secondary education qualification can expect the highest number of healthy years. The highest life expectancy in good mental health in women is found in the higher TSO category.
54
Health expectancy according to socio-economic status has only been calculated in a few western countries, either on the basis of perceived health, or on the basis of the absence of disabilities. This report is the first to give life expectancy in good mental health according to socio-economic gradient. The current results confirm the previous publications, i.e. that people in a lower socio-economic position do not live as long, have fewer years of life in good perceived health and more years in poor health, and that the number of poor years takes up a greater percentage of their total lifetime. In Canada, Wilkins(84), for example, showed a difference in life expectancy in good perceived health at birth between the 20% of people with the highest and lowest incomes. The difference was 14.3 years in men and 7.6 years in women. Bebbington(85) calculated life expectancy without disabilities for men in Great Britain at the beginning of the Eighties. The difference between the lowest and highest (of three) professional categories at the age of 20 years was 6.9 years for life expectancy without functional disabilities and 9.2 years for life expectancy without long term disabilities. Cambois(86) found a difference of 7.3 years in 1980 and 6.8 years in 1991 in disability-free life expectancy at the age of 35 years between labourers and executives. In the Netherlands, differences in life expectancy in good perceived health according to education level have also been demonstrated(87). Three education categories were used and the difference in life expectancy in good perceived health at birth between the highest and lowest category was 11.9 years in men and 11.5 years in women. Because of the use of different age categories and different definitions of states of health and socio-economic dimensions, it is difficult to compare the figures with one another. The differences in health expectancy in this study seem to be higher than in other countries, but this is certainly partly due to the fact that many more different socio-economic categories have been used in this study, such that the extreme groups are further apart and more homogenous.
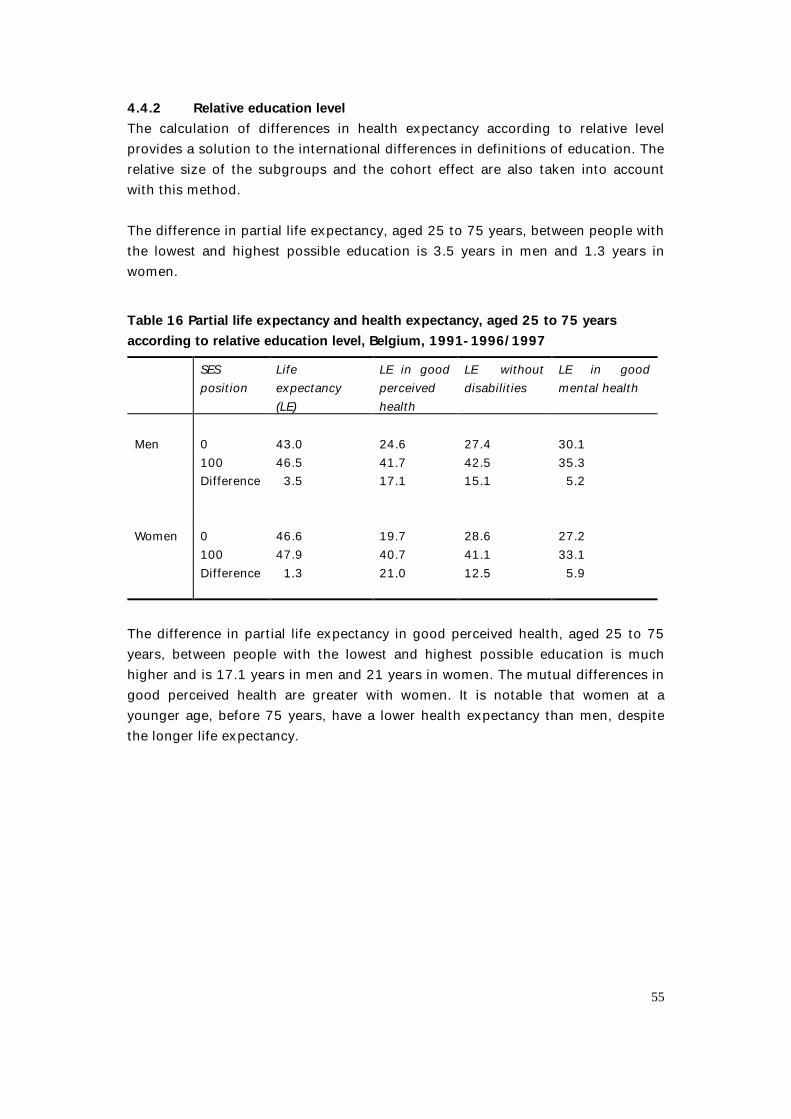
55
4.4.2 Relative education level The calculation of differences in health expectancy according to relative level provides a solution to the international differences in definitions of education. The relative size of the subgroups and the cohort effect are also taken into account with this method. The difference in partial life expectancy, aged 25 to 75 years, between people with the lowest and highest possible education is 3.5 years in men and 1.3 years in women. Table 16 Partial life expectancy and health expectancy, aged 25 to 75 years according to relative education level, Belgium, 1991-1996/1997 SES
position Life expectancy (LE)
LE in good perceived health
LE without disabilities
LE in good mental health
Men
0
43.0
24.6
27.4
30.1
100 46.5 41.7 42.5 35.3 Difference 3.5 17.1 15.1 5.2 Women 0 46.6 19.7 28.6 27.2 100 47.9 40.7 41.1 33.1 Difference 1.3 21.0 12.5 5.9
The difference in partial life expectancy in good perceived health, aged 25 to 75 years, between people with the lowest and highest possible education is much higher and is 17.1 years in men and 21 years in women. The mutual differences in good perceived health are greater with women. It is notable that women at a younger age, before 75 years, have a lower health expectancy than men, despite the longer life expectancy.
56
Life expectancy in good perceived health according to relative education level was calculated in almost the same way in a study in Norway and Finland(80). This exercise showed that, for men and for women, the absolute difference in number of lost years of life between the extreme positions within the education hierarchy is smaller in Belgium than in Norway and Finland in particular. For both sexes the relative difference in lost years of life in the three countries is about the same. The absolute differences in the health expectancy lost is somewhat higher in Belgium than in Norway, and much higher than in Finland. The relative difference in Belgium is of the same size as in Norway and markedly higher than in Finland. In the Netherlands, life expectancy in good perceived health at birth was also calculated according to relative education level, for three categories. The difference between the lowest and the highest category was 11.6 years in men and 11.0 years in women(87). The difference in partial disability-free life expectancy, aged 25 to 75 years, between people with the lowest and highest possible education is 15.1 years in men and 12.5 years in women. The mutual differences in life expectancy without disabilities are thus greater with men. With regard to partial life expectancy, 25 to 75 years, in good mental health, the differences between the lowest position and highest position are 5.2 years in men and 5.9 years in women.
4.5 Which groups spend the most years in poor health? As a rule the lower qualified can expect to spend more absolute years in poor health in their shorter lives than the higher qualified. The number of absolute years in which health is perceived as poor is greater with women than with men in all education categories. Men with the lowest qualifications can expect almost 10 more years in poor health, while the maximum difference is 21.2 years in women. The most disadvantaged groups are men who at most have been through lower education and women without qualifications or with a lower TSO qualification.
57
The lower qualified can also expect a greater number of years with disabilities in their shorter lives. The maximum difference is 16.6 years with men and 14.2 years with women. However, no clear trend according to education can be found when these years are broken down according to seriousness. Men without qualifications are highly disadvantaged with respect to the others for the number of years with disabilities, and especially when it comes to serious disabilities. The number of years with serious disabilities is significantly higher with women than with men. The maximum difference in years in poor mental health is 8.6 years in men, while the difference can be up to 13.4 years in women.
58
5. Conclusion A socio-economic gradient according to the highest education level reached has been found for both life expectancy and health expectancy. There are indications of compression of morbidity with increasing education level. The inequality in Belgium is thus greater in terms of qualit y of health than quantity. The results are along the same line as comparable research in other countries. Health expectancy as a composite indicator has a number of advantages over the more classically used simple health indicators. There is, however, still a great deal of debate over the most correct and informative way of presenting the differences in health expectancy. In view of the increasing importance of the indicator attention is required in this respect. Although not as great for all dimensio ns of health, the differences in Belgium seem to be impressive enough to justify an active policy, targeted at driving down this inequality of health. The evaluation of this policy presupposes, of course, a regular measurement of the size of the difference s. The intermediate factors, such as behavioural factors and way of life (e.g. smoking, diet, physical exercise, etc), use of health facilities and stru ctural factors (e.g. living and working conditions, financial position, etc) form points of action for intervention. Targeted research into the relative importance of these factors in Belgium is required. Another important area of further research is a study of the impact of chronic medical conditions on the quality and quantity of life according to socio -economic breakdown. This can be done by determining the increase in life expectancy and disability -free life expectancy after elimination of a condition. On the other hand, recent methodological developments in the breakdown of differences in life expectancy and disability -free life expectancy (88) will enable research into what medical conditions are responsible for t he observed differences.
59
6. References 1. Kunst AE, Mackenbach JP. Measuring socio -economic inequalities in health.
Copenhagen: WHO Regional Office; 1994.
2. Acheson, D., Barker, D., Chambers, J., Graham, H., Marmot, M., and Whitehead, M. Independent Inquir y into Inequalities in Health. 1-165. 1998. London, The Stationary O ffice.
3. Pamuk E. Social Class Inequality in Mortality from 1921 to 1972 in England and Wales. Population Studies. 1985;39:17 -31.
4. Black D. Inequalities in health, Report of a rese arch working group. London: Department of Health and Social Security; 1980.
5. MacIntyre S. The Black Report and beyond: what are the issues? Soc Sci Med. 1997;44:723 -745.
6. WHO Regional Office for Europe. Targets for Health for All . The health policy for Europe . Summary of the updated edition . September 1991 . WHO.
7. WHO Regional Office for Europe. Health 21 - Health for All in the 21st Century, an Introduction. Copenhagen: 1998.
8. Kunst AE, Groenhof F, Anderson O, et al. Occupational class an d ischemic heart disease mortality in the United States and 11 European countries. Am J Public Health. 1999;89:47 -53.
9. Valkonen T. Adult mortality and level of education: a comparison of six countries. In: Fox J, ed. Health inequalities in European Cou ntries. Aldershot: Gower; 1989.
10. Kunst AE, Mackenbach JP. The size of mortality differences associated with educational level in nine industrialized countries. Am J Public Health. 1994;84:932 -937.
11. Vagerö D, Lundberg O. Health inequalities in Brit ain and Sweden. The Lancet. 1989;35-36.
12. Desplanques G. [Social inequality of mortality in France (1975 -1980): a longitudinal st udy]. Soz Praventivmed . 1984;29:268 -272.
13. Kunst AE, Groenhof F, Mackenbach JP. Occupational class and cause specific mortality in middle aged men in 11 European countries: comparison of population based st udies. BMJ. 1998;316:1636 -1641.
60
14. Mackenbach JP, Kunst AE, Cavelaars AEJM, et al. Socioeconomic inequalities in morbidity and mortality in western Europe. Lancet. 1997;349:1655 -1659.
15. Lagasse R, Godin I, Leveque A. Gelijkheid op het vlak van gezondheid. Een status questionis voor België. In: Raes V, Kerkhofs E, Louckx F, eds. Sociale ongelijkheid en verschillen in gezondheid. Brussel: VUBpress; 1993:75 -90.
16. De Wals P, Bertrand F, Verlinden M, Beckers R. Perinatal mortality in Belgium. Biol Neonate. 1989;55:10 -18.
17. Hooft P, Van d, V. [Relative risk areas in the Louvain region. An ordinal geographical an alysis of the health status and the distribution of health care]. Arch Belg. 1989;47:157 -160.
18. Kornitzer M, Bara L. Differences between North and South in coronary risk factors, food habits and mortality in Belgium. Acta Cardiol. 1989;XLIV,2:145 -155.
19. Bouckaert A, Theunissen I, Van Lierde M. Poid s et taille du nouveau -né, différence entre garçons et filles. J.Gynecol.Obstet.Biol.Reprod. 1992;21:398 -402.
20. Lagasse R, Humblet PC, Lenaerts A, Godin I, Moens GFG. Health and social inequities in Belgium. Soc Sci Med. 1990;31:237 -248.
21. Buekens P, MacGillivray I, Campbell D, et al. Social differences in low birthweight and preterm deliveries in twins. Paediatr Perinat Epidemiol. 1991;5:276 -285.
22. Honggokoesoemo S. Vroegneonatale sterfte in Belgie 1981: analyse naar geboorteg ewicht, gezondheid toetand van de moeder en sociale beroepsgroep van de vader. Arch.B.Méd.Soc.,Hyg.,Méd.Tr.& Méd.Lég. 1988;46:359 -378.
23. Masuy-Stroobant G. Social inequalities in perinatal health. Biol Neonate. 1989;55:42 -49.
24. De Backer G. Physical activity and psyc hosocial variables in atherosclerosis. Acta Cardiologica. 1988;107 -112.
25. Sand EA, Verhaegen L, Meyer J. [Depressive symptoms in adolescents (1). Prevalence - remedy]. Arch Belg. 1989;47:29 -33.
26. Van Nieuwenhuysen J -P, D'Hoore W, Vreven J. Le bilan carieux et l'hygiène dentaire dans un groupe d'enfants en âge scolaire. Archives Belges Méd Soc,Hyg Tr et Méd Leg. 1989;1 -4:38-41.
27. Sucs FE, Guiot A, Nizetic BZ. Aspects cliniques et socio -épidémiologiques d'affections chorio -rétiniennes chez les enf ants d'âge scolaire. Bull.Soc.belge Ophtalmol. 1990;239:19 -28.
61
28. Toppet M, Malfroot A, Hofman B, Casimir G, Cantraine F, Dab I. Tuberculosis in children : a 13 -year follow up of 1714 patients in a Belgian home care centre. Eur J Pediatr. 1991;150:331 -335.
29. Nollevaux MA. Protection de la grossesse: problème administratif, médical et social. Arch.B.Méd.Soc.,Hyg.,Méd.Tr.& Méd.Lég. 1988;46:284 -301.
30. De Laet H. [The spatial organization of health care in Flanders]. Arch Belg. 1989;47:128 -132.
31. Van Der Stuyft P, De Muynck A, Schillemans L, Timmerman C. Migration, acculturation and utilization of primary health care. Soc Sci Med. 1989;29:53 -60.
32. D'Hoore W, Van Nieuwenhuysen J -P. Application de la méthode des traceurs à l'évaluation de la qua lité des soins dentaires chez 3237 écoliers belges. Revue Epid.et Sa nté Publ. 1991;39:63 -69.
33. de Craene I, De Backer G, Kornitzer M, et al. Determinants of fat consumption in a general population. Revue Epid.et Santé Publ. 1990;38:539 -543.
34. Deboo sere, P. and Gadeyne, S. Socio -economische factoren in differentiële sterfte van mannen van 45 -64 jaar in België. 2000-1, 1-31. 2000. Brussel, Vrije Universiteit Bru ssel; Universiteit Gent. Working Papers Steunpunt Demografie.
35. Van Oyen H, Tafforeau J , Roelands M. Regional inequities in health expectancy in Belgium. Soc Sci Med. 1996;43:1673 -1678.
36. Mackenbach JP, van der Maas P. Sociale ongelijkheid en verschillen in gezondheid; een overzicht van de belangrijkste onderzoeksbevindingen. In: De ongelijke verdeling van gezondheid. WRR voorstudies en achtergronden V58. Den Haag: Staat suitgeverij; 1987:59 -95.
37. Stronks K, van de Mheen DH, Mackenbach J. Achtergronden van soc iaal-economische gezondheidsverschillen. Een overzicht van de literatuur en ee n onderzoeksmodel. In: Raes V, Kerkhofs E, Louckx F, eds. Sociale ongelijkheid en verschillen in gezon dheid. Brussel: VUBpress; 1993:11 -26.
38. Blane D. The life course, the social gradient, and health. In: Marmot M, Wi lkinson RG, eds. Social Determinants of Health. New York: Oxford University Press; 1999:64-80.
39. Dahlgren, G. and Whitehead, M. Policies and strategies to promote equity in health. 1-50. 2000. Copenhagen, WHO Regional Office for Europe.
40. Omran AR. The epidemiologic transition. A theory of the epidemiology of population change. Milbank Memorial Fund Quarterly. 1971;49:503 -538.
62
41. Olshansky SJ, Ault AB. The fourth stage of the epidemiologic transition : The age of delayed degenerative diseases. Milbank Memorial Fund Quarterly. 1986;64:355-391.
42. Olshansky SJ, Carnes BA, Cassel CK. In Search of Methuselah: estimating the Upper limits to Human Longevity. Science. 1990;250:634 -640.
43. Kramer M. The rising pandemic of mental disorders and associated chronic diseases and disabiliti es. Acta Psychiatrica Scandinavica. 1980;62 (supplement 285):382 -397.
44. Olshansky SJ, Rudberg MA, Carnes BA, Cassel CK, Brody JA. Trading off longer Life for worsening health. The expansion of morbidity hypothesis. Journal of aging and health. 1991;3 (2):194-216.
45. Fries JF. Aging, natural death and the compression of morbidity. N Engl J Med. 1980;303:130 -135.
46. Nusselder, W. J. Compression or expansion of morbidity? A life table approach. 1-253. 1998. Erasmus University Rotterdam.
47. Manton KG. Changing concepts of morbidity and mortality in the elderly population. Milbank Memorial Fund Quarterly/Health and Soc iety. 1982;60:183 -244.
48. Verbrugge LM. Longer life but worsening health? Trends in health and mortality of middle -aged and older persons. Milbank Memorial Fund Quarterly/Health and Society. 1984;62:475 -519.
49. Chapman SH, Laplante MP, Wilensky G. Life expectancy and health status of the aged. Soc.Secur.Bull. 1986;49:24 -48.
50. Sanders BS. Measuring Community Health Levels. Am J Public Health. 1964;54:1063 -1070.
51. Sullivan DF. A single index of mortality and morbidity. HSMHA Health Reports. 1971;86:347 -354.
52. Mathers CD, Robine J -M, Wilkins R. Health expectancy indicators: recommend ations for terminology. In: Mathers CD, McCallum J, Robine J -M, eds. Advances in health e xpectancies: Proceedings of the 7th meeting of the International Network on health Expectancy (REVES), Canberra, February 1994. Canberra: Australian Institute of Health and Welfare: AGPS; 1994:34 -41.
63
53. Murray CJL. Rethinking Dalys. In: Murray CJL, Lopez AD, eds. The global burden of disease. A comprehensive assessment of mortality and disability from diseases, inj uries, and risk factors in 1990 and projected to 2020. Boston: Havard School of Public Healt h; 1996:1 -98.
54. Robine JM, Ritchie K. Healthy life expectancy: evaluation of global indicator of change in population health. BMJ. 1991;302:457 -460.
55. Van De Water HPA. Policy relevance of the health expectancy indicators. Planning the next steps. In: REVES, ed. REVES Conference 19 -21 February. Ottawa: 1992.
56. Van Oyen H, Roelands M. Ongelijkheden in de gezondheidsverwachting. In: AnonymousOuderen in solidariteit. Zaventem: Kluwer Editor ial; 1993:95 -108.
57. Van Oyen H, Roelands M, Vandenbroele H . De gezondheidsverwachting. Tijdschrift voor Geneeskunde. 1993;49:1169 -1176.
58. Roelands, M. and Van Oyen, H. De levensverwachting zonder invaliditeit op hogere lee ftijd: een methode voor planning en besluitvorming in de welzijnssector. 1994. Bru ssels, Federale diensten voor wetenschappelijke, technische en culturele aangelegenh eden.
59. Jagger, C. Health Expectancy Calculation by the Sullivan Method: a Practical Guide. NUPRI Research Papers Series 68, 1 -37. 1999. Tokyo, NUPRI. NUPRI Research P apers Series. 1999.
60. Crimmins E, Saito Y, Hayward M. Sullivan and multistate methods of estimating active life expectancy: two methods, two answers. In: Robine JM, Mathers C, Bone M, Romieu I, eds. Calculation of health expectancies: harmonization, consensus achieved and future perspectives . France: John Libbey; 1993:155 -160.
61. Chiang CL. The life table and its applications. Malabar, Florida: Robert E. Krieger Publishing Company; 1984.
62. Mathers C, Robine JM. Health expectancy indicators: a review of the work of REVES to date. In: Robine JM, Mathers C, Bone M, Romieu I, eds. Calculation of health expe ctancies: harmonization, consensus achieved and future perspectives. London: J. Li bbey; 1993:1 -21.
63. Deboosere, P. and Gadeyne, S. De Nationale Databan k Mortaliteit. 1999-7, 1-26. 1999. Brussel, Vrije Universiteit Brussel; Universiteit Gent. Working Papers Steunpunt D emografie.
64
64. de Bruin A, Picavet H, Nossikov A. Health interview surveys. Towards international ha rmonization of methods and instrument s. Copenhagen: WHO -Europe, CBS -Netherlands; 1996.
65. Van Oyen, H., Demarest, S., Leurquin, P., Tafforeau, J., Tellier, V., and Van der Heyden, J. De gezondheid van de bevolking in Belgium, in de Vlaamse Gemeenschap en in het Brussels Gewest. Gezondheids enquête, Belgium, 1997. 1998. Brussel, Ce ntrum voor Operationeel Onderzoek in Volksgezondheid, Wetenschappelijk I nstituut Volksgezondheid.
66. Quataert P, Van Oyen H, Tafforeau J, et al. Health Interview Survey, 1997. Protocol for the selection of the households and the respondents. Brussel: S.P.H.; 1998.
67. Robine JM, Mormiche P. Estimation de la valeur de l'espérance de vie sans incapacité en France en 1991. Solidarité Santé. 1994;17 -36.
68. Bowling A. Measuring Disease. A review of disease -specif ic quality of life measurement scales. Buckingham - Philadelphia: Open University Press; 1995.
69. CBS Netherlands, WHO Regional Office for Europe. Third consultation to develop common methods and instruments for Health interview surveys, 22 -24 September 1992. Copenhagen: WHO - CBS; 1993.
70. Hermans, H., Lambert, M., Reginster, G., Tafforeau, J., and Van Oyen, H. Naar een gezondheidsenquête door middel van interview in Belgium. IHE/Episerie N°3, 1-193. 1995. Brussel, IHE.
71. Bullinger M, Anderson R, C ella D, Aaronson N. Developing and evaluating cross -cultural instruments from minimum requirements to optimal models. Qual.Life Res. 1993;2:451 -459.
72. Miilunpalo S, Vuori I, Oja P, Pasanen M, Urponen H. Self -rated health status as a health measure - the predictive value of self -reported health status on the use of physician services and on mortality in the working -age population. J Clin Epidemiol. 1997;50:517 -528.
73. Goldstein MS, Siegel JM, Boyer R. Predicting changes in perceived health status. Am J Public Health. 1984;74:611 -615.
74. Maddox GL, Douglass EB. Self-assessment of health: a longitudinal study of elderly su bjects. J.Health Soc.Behav. 1973;14:87 -93.
75. Wilson IB, Cleary PD. Linking clinical variables with health -related quality of li fe. A conceptual model of patient outcomes. JAMA. 1995;273:59 -65.
65
76. Lee Y. The predictive value of self assessed general, physical, and mental health on functional decline and mortality in older adults [In Process Citation]. J.Epidemiol.Community.Heal th 2000.Feb.;54. (2.):123. -9. 54:123 -129.
77. Ware Jr JE. SF-36 Health Survey: manual and interpretation guide. Boston: The Health Institute, New England Medical Center; 1993.
78. Goldberg DP, Cooper B, Eastwood MR, Kedward HB, Shepherd M. A standardized psychiatric interview for use in community surveys. Br.J.Prev.Soc.Med. 1970;24:18 -23.
79. Goldberg DP, Williams P. A User' s Guide to the General Health Questionnaire. Windsor: NFER - Nelson; 1988.
80. Sihvonen AP, Kunst AE, Lahelma E, Valkonen T, Mack enbach JP. Socio-economic inequalities in health expectancy in Finland and Norway in the late 1980s. Soc Sci Med. 1998;47:303 -315.
81. Demarest, S., Leurquin, P., Tellier, V., Van der Heyden, J., Van Oyen, H., and Tafforeau, J. La santé de la population en Belgium. Enquête de santé par interview, Belgium, 1997. 1998. Centre de Recherche Opérationelle en Santé Publique, Institute Scient ific de la Santé Publique.
82. STAKES (National Research and Development Centre for Welfare and Health - Finland). Framework for Promoting Mental Health in Europe. Helsinki: STAKES (National R esearch and Development Centre for Welfare and Health - Finland); 1999.
83. Strawbridge WJ, Cohen RD, Shema SJ, Kaplan GA. Successful aging : predictors and associated activities. Am J Epidemiol. 1996;144:135 -141.
84. Wilkins R, Adams OB. Health expectancy in Canada, late 1970s: demographic, regional, and social dimensions. Am J Public Health. 1983;73:1073 -1080.
85. Bebbington AC. Regional and social variations in disability -free life expectancy in Great Britain. In: Robine J -M, Mathers CD, Bone M, Romieu I, eds. Calculation of health e xpectancies: harmonization, consensus achieved and future perspectives. Paris: Co lloque INSERM / John Li bbey Eurotext Ltd; 1993:175 -191.
86. Cambois, E. and Brouard, N. Calcul d'espérance de vie sans incapacité suivant le statut social dans la population masculine française, 1980 -1991. Un indicateur de l'évolution des inégalités sociales de santé. 1 -321. 1999. Institut d'Etudes Politiques de Paris - Cycle de Démographie Economique.
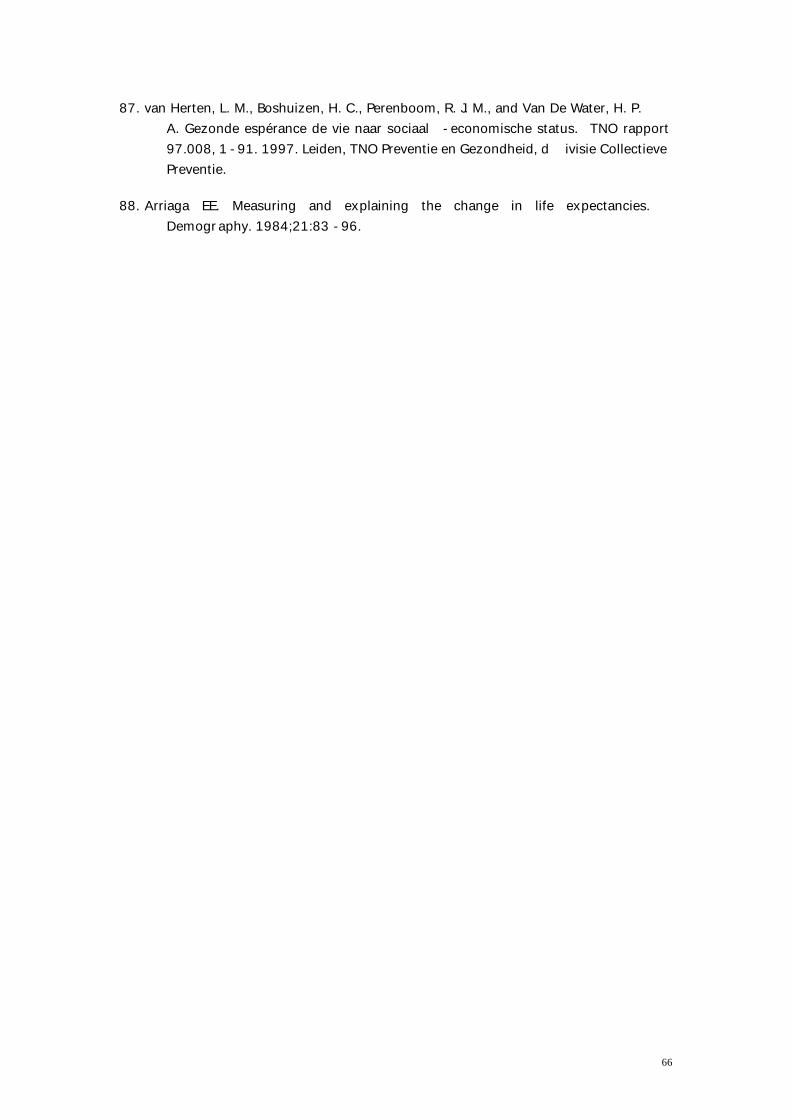
66
87. van Herten, L. M., Boshuizen, H. C., Perenboom, R. J. M., and Van De Water, H. P. A. Gezonde espérance de vie naar sociaal -economische status. TNO rapport 97.008, 1 -91. 1997. Leiden, TNO Preventie en Gezondheid, d ivisie Collectieve Preventie.
88. Arriaga EE. Measuring and explaining the change in life expectancies. Demography. 1984;21:83 -96.
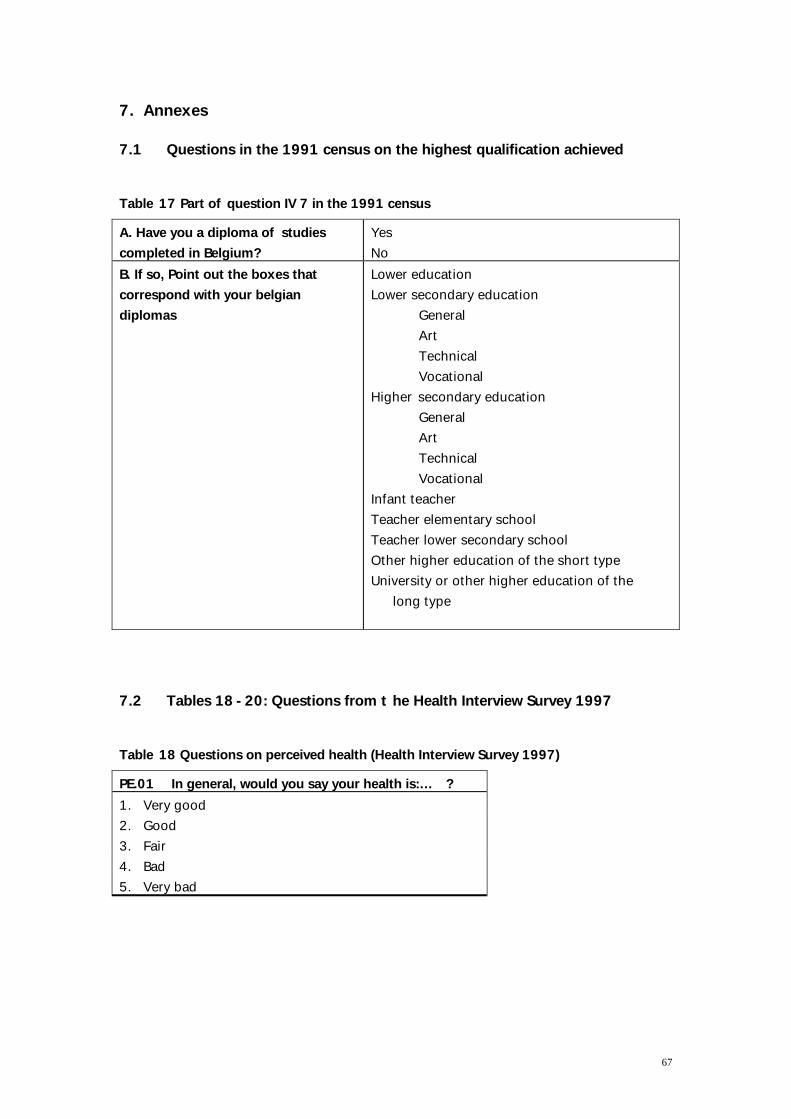
67
7. Annexes 7.1 Questions in the 1991 census on the highest qualification achieved Table 17 Part of question IV 7 in the 1991 census A. Have you a diploma of studies completed in Belgium?
Yes No
B. If so, Point out the boxes that correspond with your belgian diplomas
Lower education Lower secondary education
General Art Technical Vocational
Higher secondary education General Art Technical Vocational
Infant teacher Teacher elementary school Teacher lower secondary school Other higher education of the short type University or other higher education of the
long type
7.2 Tables 18 -20: Questions from t he Health Interview Survey 1997 Table 18 Questions on perceived health (Health Interview Survey 1997) PE.01 In general, would you say your health is:… ? 1. Very good 2. Good 3. Fair 4. Bad 5. Very bad
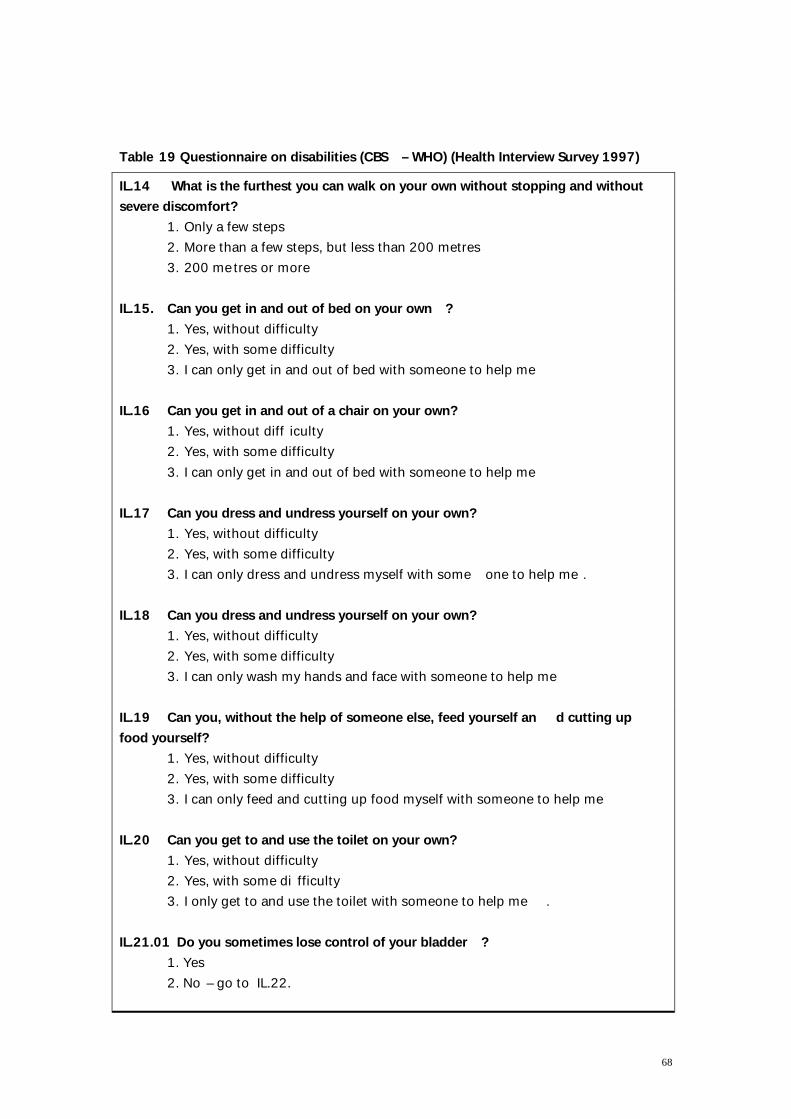
68
Table 19 Questionnaire on disabilities (CBS – WHO) (Health Interview Survey 1997) IL.14 What is the furthest you can walk on your own without stopping and without severe discomfort?
1. Only a few steps 2. More than a few steps, but less than 200 metres 3. 200 metres or more
IL.15. Can you get in and out of bed on your own ? 1. Yes, without difficulty 2. Yes, with some difficulty 3. I can only get in and out of bed with someone to help me
IL.16 Can you get in and out of a chair on your own? 1. Yes, without diff iculty 2. Yes, with some difficulty 3. I can only get in and out of bed with someone to help me
IL.17 Can you dress and undress yourself on your own? 1. Yes, without difficulty 2. Yes, with some difficulty 3. I can only dress and undress myself with some one to help me .
IL.18 Can you dress and undress yourself on your own? 1. Yes, without difficulty 2. Yes, with some difficulty 3. I can only wash my hands and face with someone to help me
IL.19 Can you, without the help of someone else, feed yourself an d cutting up food yourself?
1. Yes, without difficulty 2. Yes, with some difficulty 3. I can only feed and cutting up food myself with someone to help me
IL.20 Can you get to and use the toilet on your own? 1. Yes, without difficulty 2. Yes, with some di fficulty 3. I only get to and use the toilet with someone to help me .
IL.21.01 Do you sometimes lose control of your bladder ? 1. Yes 2. No – go to IL.22.
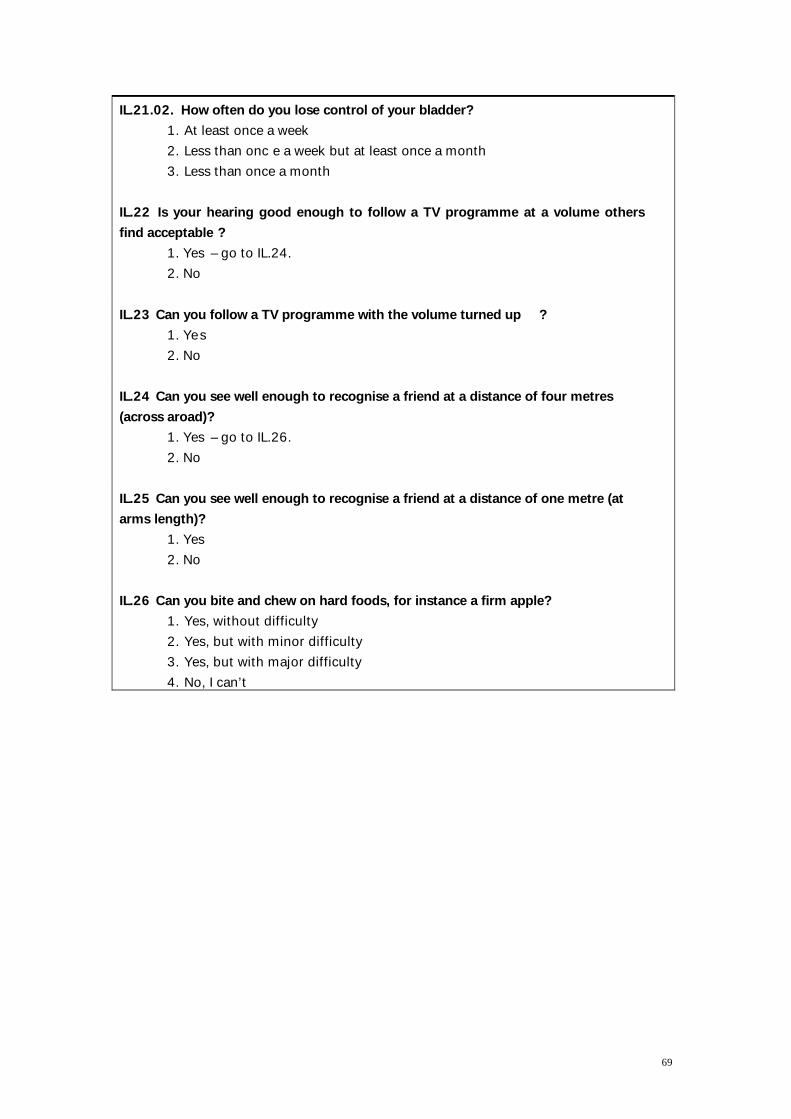
69
IL.21.02. How often do you lose control of your bladder? 1. At least once a week 2. Less than onc e a week but at least once a month 3. Less than once a month
IL.22 Is your hearing good enough to follow a TV programme at a volume others find acceptable ?
1. Yes – go to IL.24. 2. No
IL.23 Can you follow a TV programme with the volume turned up ? 1. Yes 2. No
IL.24 Can you see well enough to recognise a friend at a distance of four metres (across aroad)?
1. Yes – go to IL.26. 2. No
IL.25 Can you see well enough to recognise a friend at a distance of one metre (at arms length)?
1. Yes 2. No
IL.26 Can you bite and chew on hard foods, for instance a firm apple? 1. Yes, without difficulty 2. Yes, but with minor difficulty 3. Yes, but with major difficulty 4. No, I can’t

70
Table 20 General Health Questionnaire Now we’ re going to ask you some questions about your current general health and your health of the past weeks . WB.01 Have you recently lost much sleep over worry?
1. Not at all 2. No more than usual 3. Rather more than usual 4. Much more than usual
WB.02 Have you rece ntly felt constantly under strain? 1. Not at all 2. No more than usual 3. Rather more than usual 4. Much more than usual
WB.03 Have you recently been able to concentrate on whatever you’ re doing? ? 1. Better than usual 2. Same as usual 3. Less than usual 4. Much less than usual
WB.04 Have you recently felt you were playing a useful part in things? 1. More so than usual 2. Same as usual 3. Less useful than usual 4. Much less useful
WB.05 Have you recently been able to face up to your problems? 1. More so than usual 2. Same as usual 3. Less able than usual 4. Much less able
WB.06 Have you recently felt capable of making decisions about things? 1. More so than usual 2. Same as usual 3. Less so than usual 4. Much less capable

71
WB.07 Have you recently felt you couldn’ t overcome your difficulties? ? 1. Not at all 2. No more than usual 3. Rather more than usual 4. Much more than usual
WB.08 Have you recently been feeling reasonably happy, all things considered?
1. More happy than usual 2. About same as usual 3. Less happy than usual 4. Much less happy than usual
WB.09 Have you recently been able to enjoy your normal day -to-day activities ? 1. More so than usual 2. Same as usual 3. Less so than usual 4. Much less than usual
WB.10 Have you recently been feeling unhappy and depressed? 1. Not at all 2. Same as usual 3. Less so than usual 4. Much less than usual
WB.11 Have you recently been losing confidence in yourself? 1. Not at all 2. No more than usual 3. Rather more than usual 4. Much more than usual
WB.12 Have you recently been thinking of yourself as a worthless person? 1. Not at all 2. No more than usual 3. Rather more than usual 4. Much more than usual
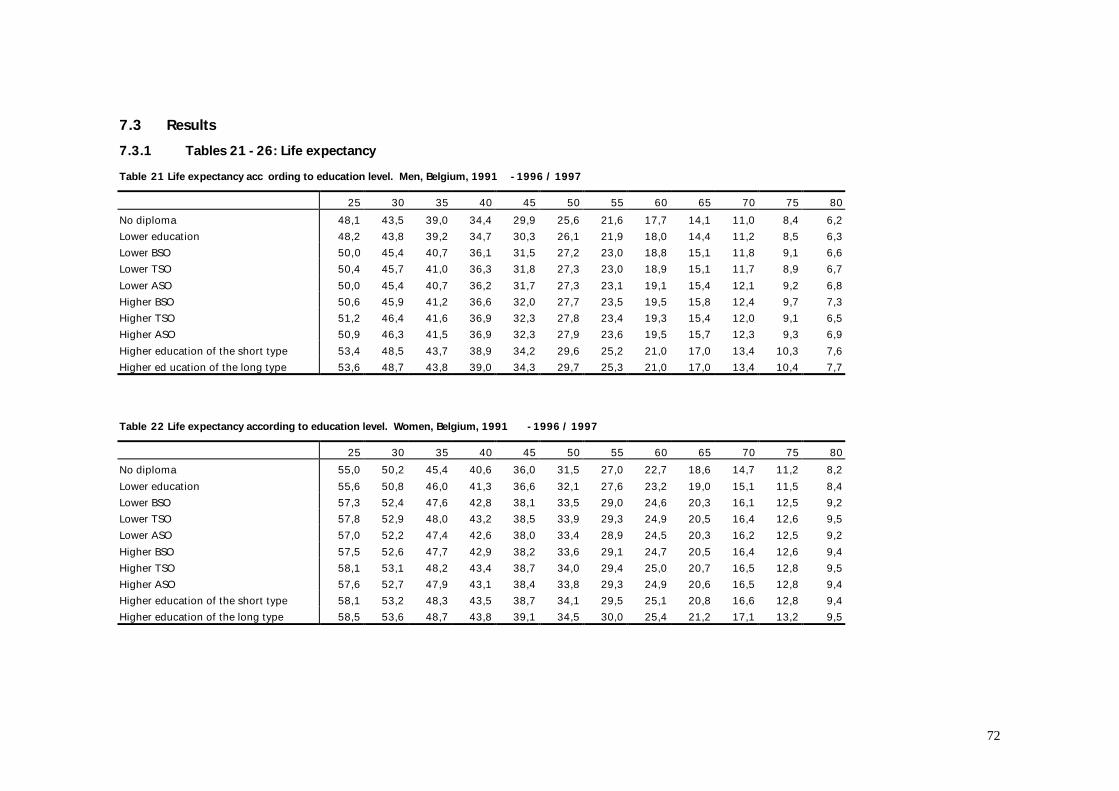
72
7.3 Results 7.3.1 Tables 21 -26: Life expectancy Table 21 Life expectancy acc ording to education level. Men, Belgium, 1991 -1996 / 1997 25 30 35 40 45 50 55 60 65 70 75 80 No diploma 48,1 43,5 39,0 34,4 29,9 25,6 21,6 17,7 14,1 11,0 8,4 6,2 Lower education 48,2 43,8 39,2 34,7 30,3 26,1 21,9 18,0 14,4 11,2 8,5 6,3 Lower BSO 50,0 45,4 40,7 36,1 31,5 27,2 23,0 18,8 15,1 11,8 9,1 6,6 Lower TSO 50,4 45,7 41,0 36,3 31,8 27,3 23,0 18,9 15,1 11,7 8,9 6,7 Lower ASO 50,0 45,4 40,7 36,2 31,7 27,3 23,1 19,1 15,4 12,1 9,2 6,8 Higher BSO 50,6 45,9 41,2 36,6 32,0 27,7 23,5 19,5 15,8 12,4 9,7 7,3 Higher TSO 51,2 46,4 41,6 36,9 32,3 27,8 23,4 19,3 15,4 12,0 9,1 6,5 Higher ASO 50,9 46,3 41,5 36,9 32,3 27,9 23,6 19,5 15,7 12,3 9,3 6,9 Higher education of the short type 53,4 48,5 43,7 38,9 34,2 29,6 25,2 21,0 17,0 13,4 10,3 7,6 Higher ed ucation of the long type 53,6 48,7 43,8 39,0 34,3 29,7 25,3 21,0 17,0 13,4 10,4 7,7 Table 22 Life expectancy according to education level. Women, Belgium, 1991 -1996 / 1997 25 30 35 40 45 50 55 60 65 70 75 80 No diploma 55,0 50,2 45,4 40,6 36,0 31,5 27,0 22,7 18,6 14,7 11,2 8,2 Lower education 55,6 50,8 46,0 41,3 36,6 32,1 27,6 23,2 19,0 15,1 11,5 8,4 Lower BSO 57,3 52,4 47,6 42,8 38,1 33,5 29,0 24,6 20,3 16,1 12,5 9,2 Lower TSO 57,8 52,9 48,0 43,2 38,5 33,9 29,3 24,9 20,5 16,4 12,6 9,5 Lower ASO 57,0 52,2 47,4 42,6 38,0 33,4 28,9 24,5 20,3 16,2 12,5 9,2 Higher BSO 57,5 52,6 47,7 42,9 38,2 33,6 29,1 24,7 20,5 16,4 12,6 9,4 Higher TSO 58,1 53,1 48,2 43,4 38,7 34,0 29,4 25,0 20,7 16,5 12,8 9,5 Higher ASO 57,6 52,7 47,9 43,1 38,4 33,8 29,3 24,9 20,6 16,5 12,8 9,4 Higher education of the short type 58,1 53,2 48,3 43,5 38,7 34,1 29,5 25,1 20,8 16,6 12,8 9,4 Higher education of the long type 58,5 53,6 48,7 43,8 39,1 34,5 30,0 25,4 21,2 17,1 13,2 9,5
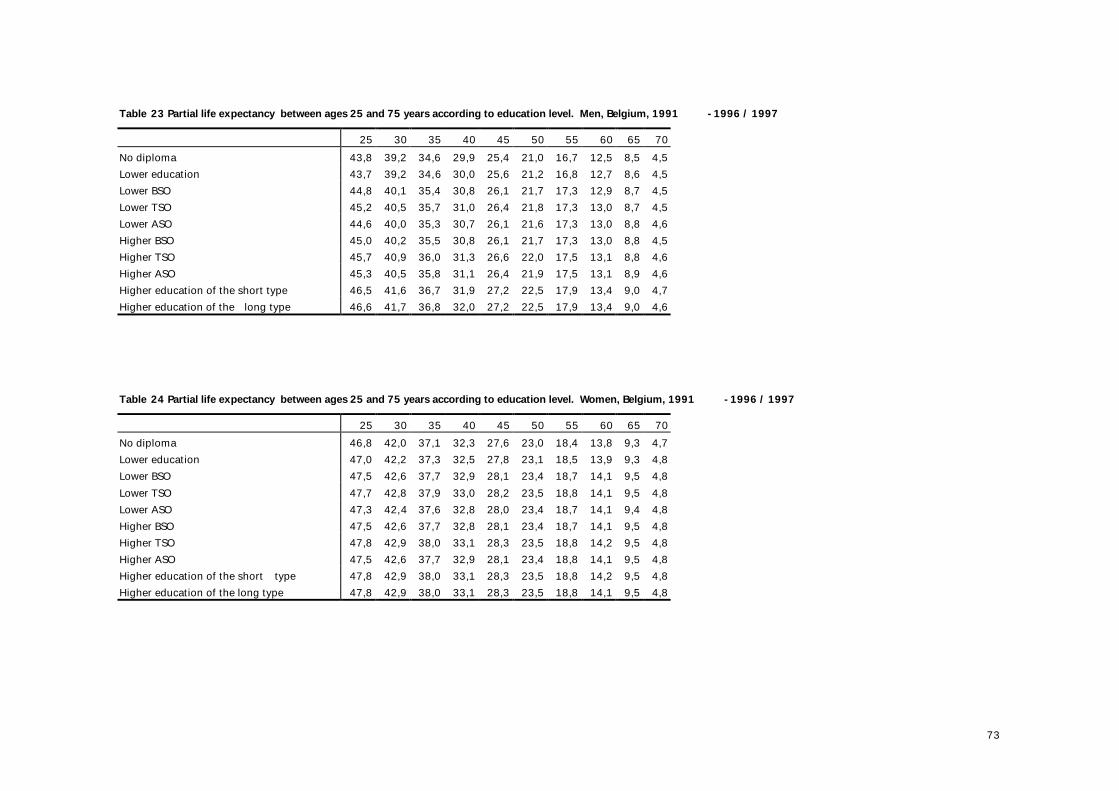
73
Table 23 Partial life expectancy between ages 25 and 75 years according to education level. Men, Belgium, 1991 -1996 / 1997 25 30 35 40 45 50 55 60 65 70 No diploma 43,8 39,2 34,6 29,9 25,4 21,0 16,7 12,5 8,5 4,5 Lower education 43,7 39,2 34,6 30,0 25,6 21,2 16,8 12,7 8,6 4,5 Lower BSO 44,8 40,1 35,4 30,8 26,1 21,7 17,3 12,9 8,7 4,5 Lower TSO 45,2 40,5 35,7 31,0 26,4 21,8 17,3 13,0 8,7 4,5 Lower ASO 44,6 40,0 35,3 30,7 26,1 21,6 17,3 13,0 8,8 4,6 Higher BSO 45,0 40,2 35,5 30,8 26,1 21,7 17,3 13,0 8,8 4,5 Higher TSO 45,7 40,9 36,0 31,3 26,6 22,0 17,5 13,1 8,8 4,6 Higher ASO 45,3 40,5 35,8 31,1 26,4 21,9 17,5 13,1 8,9 4,6 Higher education of the short type 46,5 41,6 36,7 31,9 27,2 22,5 17,9 13,4 9,0 4,7 Higher education of the long type 46,6 41,7 36,8 32,0 27,2 22,5 17,9 13,4 9,0 4,6 Table 24 Partial life expectancy between ages 25 and 75 years according to education level. Women, Belgium, 1991 -1996 / 1997 25 30 35 40 45 50 55 60 65 70 No diploma 46,8 42,0 37,1 32,3 27,6 23,0 18,4 13,8 9,3 4,7 Lower education 47,0 42,2 37,3 32,5 27,8 23,1 18,5 13,9 9,3 4,8 Lower BSO 47,5 42,6 37,7 32,9 28,1 23,4 18,7 14,1 9,5 4,8 Lower TSO 47,7 42,8 37,9 33,0 28,2 23,5 18,8 14,1 9,5 4,8 Lower ASO 47,3 42,4 37,6 32,8 28,0 23,4 18,7 14,1 9,4 4,8 Higher BSO 47,5 42,6 37,7 32,8 28,1 23,4 18,7 14,1 9,5 4,8 Higher TSO 47,8 42,9 38,0 33,1 28,3 23,5 18,8 14,2 9,5 4,8 Higher ASO 47,5 42,6 37,7 32,9 28,1 23,4 18,8 14,1 9,5 4,8 Higher education of the short type 47,8 42,9 38,0 33,1 28,3 23,5 18,8 14,2 9,5 4,8 Higher education of the long type 47,8 42,9 38,0 33,1 28,3 23,5 18,8 14,1 9,5 4,8
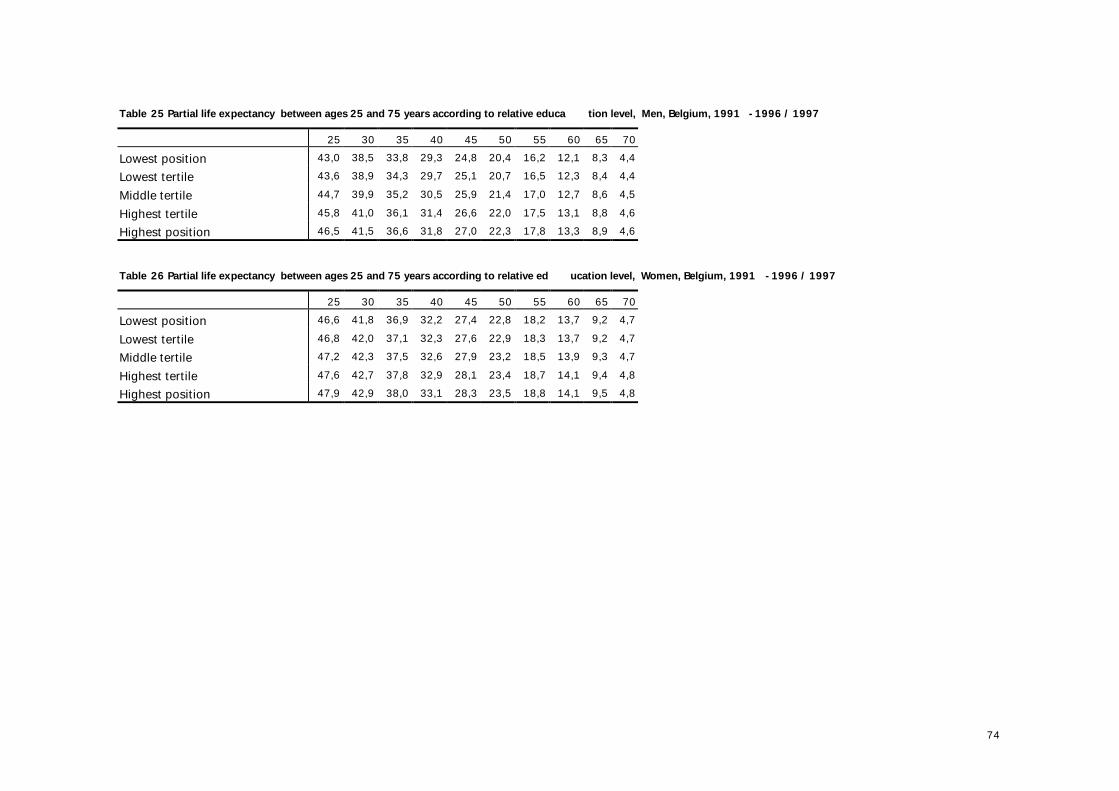
74
Table 25 Partial life expectancy between ages 25 and 75 years according to relative educa tion level, Men, Belgium, 1991 -1996 / 1997 25 30 35 40 45 50 55 60 65 70 Lowest position 43,0 38,5 33,8 29,3 24,8 20,4 16,2 12,1 8,3 4,4 Lowest tertile 43,6 38,9 34,3 29,7 25,1 20,7 16,5 12,3 8,4 4,4 Middle tertile 44,7 39,9 35,2 30,5 25,9 21,4 17,0 12,7 8,6 4,5 Highest tertile 45,8 41,0 36,1 31,4 26,6 22,0 17,5 13,1 8,8 4,6 Highest position 46,5 41,5 36,6 31,8 27,0 22,3 17,8 13,3 8,9 4,6 Table 26 Partial life expectancy between ages 25 and 75 years according to relative ed ucation level, Women, Belgium, 1991 -1996 / 1997 25 30 35 40 45 50 55 60 65 70 Lowest position 46,6 41,8 36,9 32,2 27,4 22,8 18,2 13,7 9,2 4,7 Lowest tertile 46,8 42,0 37,1 32,3 27,6 22,9 18,3 13,7 9,2 4,7 Middle tertile 47,2 42,3 37,5 32,6 27,9 23,2 18,5 13,9 9,3 4,7 Highest tertile 47,6 42,7 37,8 32,9 28,1 23,4 18,7 14,1 9,4 4,8 Highest position 47,9 42,9 38,0 33,1 28,3 23,5 18,8 14,1 9,5 4,8
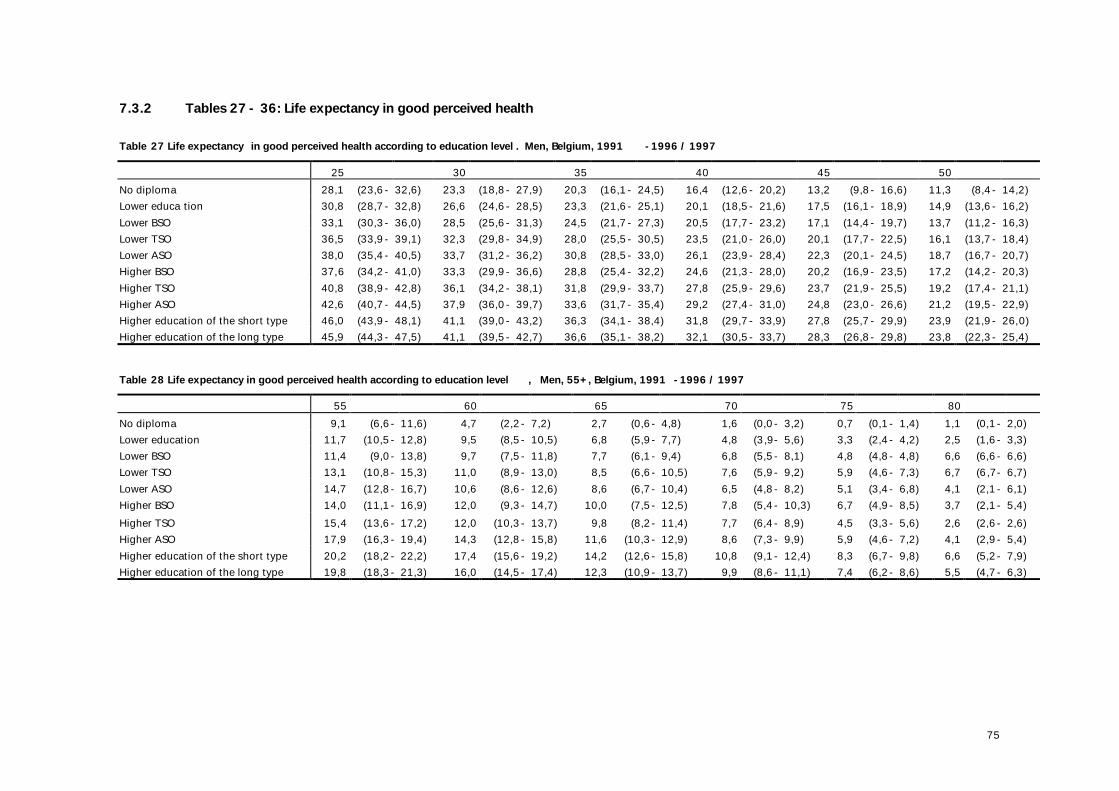
75
7.3.2 Tables 27 - 36: Life expectancy in good perceived health
Table 27 Life expectancy in good perceived health according to education level . Men, Belgium, 1991 -1996 / 1997 25 30 35 40 45 50 No diploma 28,1 (23,6- 32,6) 23,3 (18,8- 27,9) 20,3 (16,1- 24,5) 16,4 (12,6- 20,2) 13,2 (9,8- 16,6) 11,3 (8,4- 14,2) Lower educa tion 30,8 (28,7- 32,8) 26,6 (24,6- 28,5) 23,3 (21,6- 25,1) 20,1 (18,5- 21,6) 17,5 (16,1- 18,9) 14,9 (13,6- 16,2) Lower BSO 33,1 (30,3- 36,0) 28,5 (25,6- 31,3) 24,5 (21,7- 27,3) 20,5 (17,7- 23,2) 17,1 (14,4- 19,7) 13,7 (11,2- 16,3) Lower TSO 36,5 (33,9- 39,1) 32,3 (29,8- 34,9) 28,0 (25,5- 30,5) 23,5 (21,0- 26,0) 20,1 (17,7- 22,5) 16,1 (13,7- 18,4) Lower ASO 38,0 (35,4- 40,5) 33,7 (31,2- 36,2) 30,8 (28,5- 33,0) 26,1 (23,9- 28,4) 22,3 (20,1- 24,5) 18,7 (16,7- 20,7) Higher BSO 37,6 (34,2- 41,0) 33,3 (29,9- 36,6) 28,8 (25,4- 32,2) 24,6 (21,3- 28,0) 20,2 (16,9- 23,5) 17,2 (14,2- 20,3) Higher TSO 40,8 (38,9- 42,8) 36,1 (34,2- 38,1) 31,8 (29,9- 33,7) 27,8 (25,9- 29,6) 23,7 (21,9- 25,5) 19,2 (17,4- 21,1) Higher ASO 42,6 (40,7- 44,5) 37,9 (36,0- 39,7) 33,6 (31,7- 35,4) 29,2 (27,4- 31,0) 24,8 (23,0- 26,6) 21,2 (19,5- 22,9) Higher education of the short type 46,0 (43,9- 48,1) 41,1 (39,0- 43,2) 36,3 (34,1- 38,4) 31,8 (29,7- 33,9) 27,8 (25,7- 29,9) 23,9 (21,9- 26,0) Higher education of the long type 45,9 (44,3- 47,5) 41,1 (39,5- 42,7) 36,6 (35,1- 38,2) 32,1 (30,5- 33,7) 28,3 (26,8- 29,8) 23,8 (22,3- 25,4) Table 28 Life expectancy in good perceived health according to education level , Men, 55+, Belgium, 1991 -1996 / 1997 55 60 65 70 75 80 No diploma 9,1 (6,6- 11,6) 4,7 (2,2- 7,2) 2,7 (0,6- 4,8) 1,6 (0,0- 3,2) 0,7 (0,1- 1,4) 1,1 (0,1- 2,0) Lower education 11,7 (10,5- 12,8) 9,5 (8,5- 10,5) 6,8 (5,9- 7,7) 4,8 (3,9- 5,6) 3,3 (2,4- 4,2) 2,5 (1,6- 3,3) Lower BSO 11,4 (9,0- 13,8) 9,7 (7,5- 11,8) 7,7 (6,1- 9,4) 6,8 (5,5- 8,1) 4,8 (4,8- 4,8) 6,6 (6,6- 6,6) Lower TSO 13,1 (10,8- 15,3) 11,0 (8,9- 13,0) 8,5 (6,6- 10,5) 7,6 (5,9- 9,2) 5,9 (4,6- 7,3) 6,7 (6,7- 6,7) Lower ASO 14,7 (12,8- 16,7) 10,6 (8,6- 12,6) 8,6 (6,7- 10,4) 6,5 (4,8- 8,2) 5,1 (3,4- 6,8) 4,1 (2,1- 6,1) Higher BSO 14,0 (11,1- 16,9) 12,0 (9,3- 14,7) 10,0 (7,5- 12,5) 7,8 (5,4- 10,3) 6,7 (4,9- 8,5) 3,7 (2,1- 5,4) Higher TSO 15,4 (13,6- 17,2) 12,0 (10,3- 13,7) 9,8 (8,2- 11,4) 7,7 (6,4- 8,9) 4,5 (3,3- 5,6) 2,6 (2,6- 2,6) Higher ASO 17,9 (16,3- 19,4) 14,3 (12,8- 15,8) 11,6 (10,3- 12,9) 8,6 (7,3- 9,9) 5,9 (4,6- 7,2) 4,1 (2,9- 5,4) Higher education of the short type 20,2 (18,2- 22,2) 17,4 (15,6- 19,2) 14,2 (12,6- 15,8) 10,8 (9,1- 12,4) 8,3 (6,7- 9,8) 6,6 (5,2- 7,9) Higher education of the long type 19,8 (18,3- 21,3) 16,0 (14,5- 17,4) 12,3 (10,9- 13,7) 9,9 (8,6- 11,1) 7,4 (6,2- 8,6) 5,5 (4,7- 6,3)
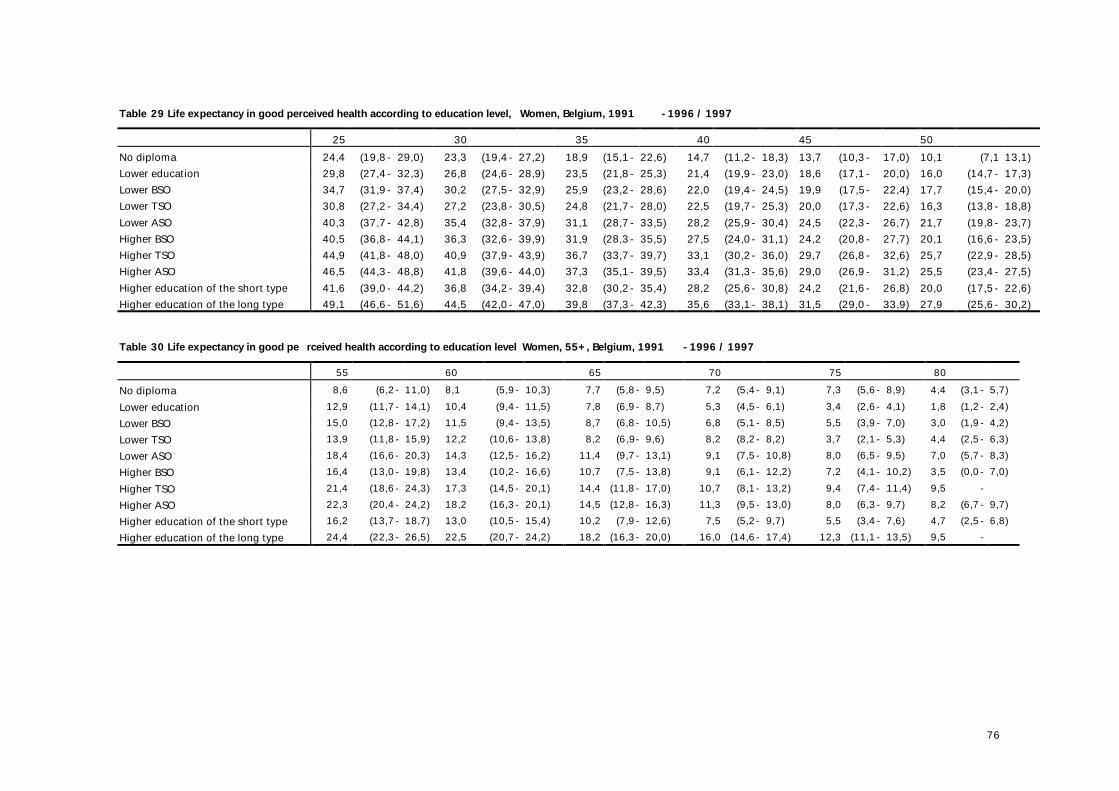
76
Table 29 Life expectancy in good perceived health according to education level, Women, Belgium, 1991 -1996 / 1997 25 30 35 40 45 50 No diploma 24,4 (19,8- 29,0) 23,3 (19,4- 27,2) 18,9 (15,1- 22,6) 14,7 (11,2- 18,3) 13,7 (10,3- 17,0) 10,1 (7,1 13,1) Lower education 29,8 (27,4- 32,3) 26,8 (24,6- 28,9) 23,5 (21,8- 25,3) 21,4 (19,9- 23,0) 18,6 (17,1- 20,0) 16,0 (14,7- 17,3) Lower BSO 34,7 (31,9- 37,4) 30,2 (27,5- 32,9) 25,9 (23,2- 28,6) 22,0 (19,4- 24,5) 19,9 (17,5- 22,4) 17,7 (15,4- 20,0) Lower TSO 30,8 (27,2- 34,4) 27,2 (23,8- 30,5) 24,8 (21,7- 28,0) 22,5 (19,7- 25,3) 20,0 (17,3- 22,6) 16,3 (13,8- 18,8) Lower ASO 40,3 (37,7- 42,8) 35,4 (32,8- 37,9) 31,1 (28,7- 33,5) 28,2 (25,9- 30,4) 24,5 (22,3- 26,7) 21,7 (19,8- 23,7) Higher BSO 40,5 (36,8- 44,1) 36,3 (32,6- 39,9) 31,9 (28,3- 35,5) 27,5 (24,0- 31,1) 24,2 (20,8- 27,7) 20,1 (16,6- 23,5) Higher TSO 44,9 (41,8- 48,0) 40,9 (37,9- 43,9) 36,7 (33,7- 39,7) 33,1 (30,2- 36,0) 29,7 (26,8- 32,6) 25,7 (22,9- 28,5) Higher ASO 46,5 (44,3- 48,8) 41,8 (39,6- 44,0) 37,3 (35,1- 39,5) 33,4 (31,3- 35,6) 29,0 (26,9- 31,2) 25,5 (23,4- 27,5) Higher education of the short type 41,6 (39,0- 44,2) 36,8 (34,2- 39,4) 32,8 (30,2- 35,4) 28,2 (25,6- 30,8) 24,2 (21,6- 26,8) 20,0 (17,5- 22,6) Higher education of the long type 49,1 (46,6- 51,6) 44,5 (42,0- 47,0) 39,8 (37,3- 42,3) 35,6 (33,1- 38,1) 31,5 (29,0- 33,9) 27,9 (25,6- 30,2) Table 30 Life expectancy in good pe rceived health according to education level Women, 55+, Belgium, 1991 -1996 / 1997 55 60 65 70 75 80 No diploma 8,6 (6,2- 11,0) 8,1 (5,9- 10,3) 7,7 (5,8- 9,5) 7,2 (5,4- 9,1) 7,3 (5,6- 8,9) 4,4 (3,1- 5,7) Lower education 12,9 (11,7- 14,1) 10,4 (9,4- 11,5) 7,8 (6,9- 8,7) 5,3 (4,5- 6,1) 3,4 (2,6- 4,1) 1,8 (1,2- 2,4) Lower BSO 15,0 (12,8- 17,2) 11,5 (9,4- 13,5) 8,7 (6,8- 10,5) 6,8 (5,1- 8,5) 5,5 (3,9- 7,0) 3,0 (1,9- 4,2) Lower TSO 13,9 (11,8- 15,9) 12,2 (10,6- 13,8) 8,2 (6,9- 9,6) 8,2 (8,2- 8,2) 3,7 (2,1- 5,3) 4,4 (2,5- 6,3) Lower ASO 18,4 (16,6- 20,3) 14,3 (12,5- 16,2) 11,4 (9,7- 13,1) 9,1 (7,5- 10,8) 8,0 (6,5- 9,5) 7,0 (5,7- 8,3) Higher BSO 16,4 (13,0- 19,8) 13,4 (10,2- 16,6) 10,7 (7,5- 13,8) 9,1 (6,1- 12,2) 7,2 (4,1- 10,2) 3,5 (0,0- 7,0) Higher TSO 21,4 (18,6- 24,3) 17,3 (14,5- 20,1) 14,4 (11,8- 17,0) 10,7 (8,1- 13,2) 9,4 (7,4- 11,4) 9,5 - Higher ASO 22,3 (20,4- 24,2) 18,2 (16,3- 20,1) 14,5 (12,8- 16,3) 11,3 (9,5- 13,0) 8,0 (6,3- 9,7) 8,2 (6,7- 9,7) Higher education of the short type 16,2 (13,7- 18,7) 13,0 (10,5- 15,4) 10,2 (7,9- 12,6) 7,5 (5,2- 9,7) 5,5 (3,4- 7,6) 4,7 (2,5- 6,8) Higher education of the long type 24,4 (22,3- 26,5) 22,5 (20,7- 24,2) 18,2 (16,3- 20,0) 16,0 (14,6- 17,4) 12,3 (11,1- 13,5) 9,5 -
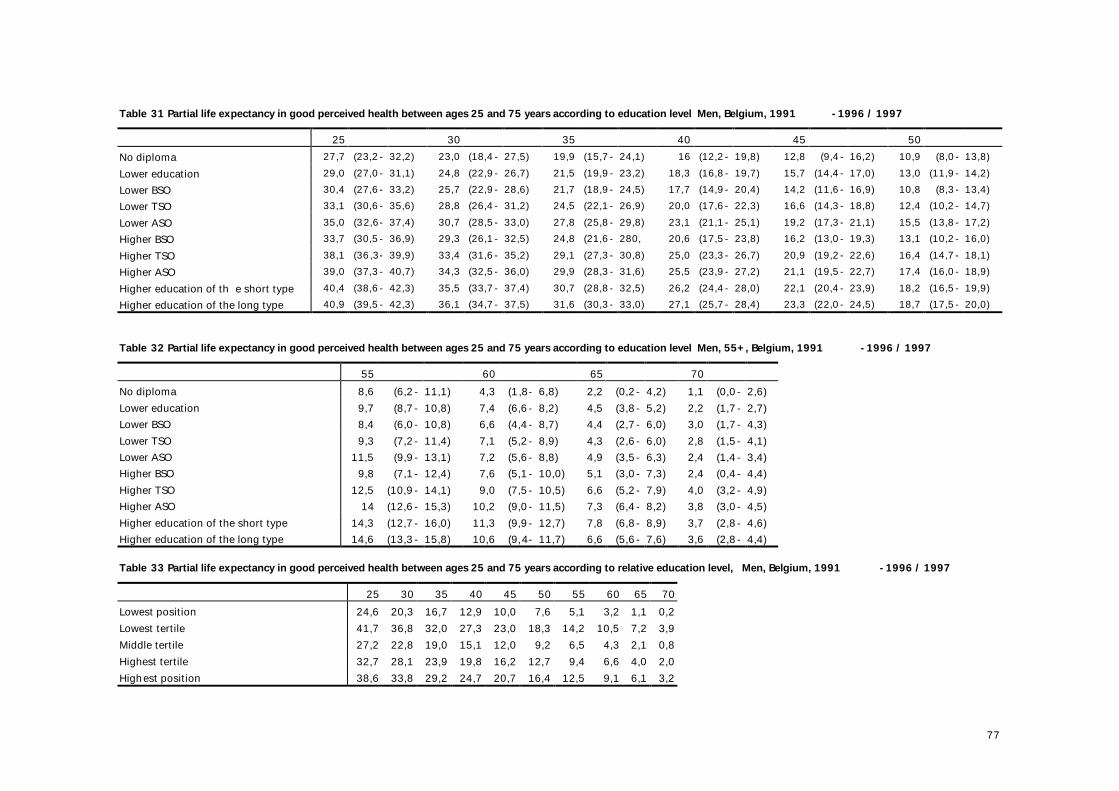
77
Table 31 Partial life expectancy in good perceived health between ages 25 and 75 years according to education level Men, Belgium, 1991 -1996 / 1997 25 30 35 40 45 50 No diploma 27,7 (23,2- 32,2) 23,0 (18,4- 27,5) 19,9 (15,7- 24,1) 16 (12,2- 19,8) 12,8 (9,4- 16,2) 10,9 (8,0- 13,8) Lower education 29,0 (27,0- 31,1) 24,8 (22,9- 26,7) 21,5 (19,9- 23,2) 18,3 (16,8- 19,7) 15,7 (14,4- 17,0) 13,0 (11,9- 14,2) Lower BSO 30,4 (27,6- 33,2) 25,7 (22,9- 28,6) 21,7 (18,9- 24,5) 17,7 (14,9- 20,4) 14,2 (11,6- 16,9) 10,8 (8,3- 13,4) Lower TSO 33,1 (30,6- 35,6) 28,8 (26,4- 31,2) 24,5 (22,1- 26,9) 20,0 (17,6- 22,3) 16,6 (14,3- 18,8) 12,4 (10,2- 14,7) Lower ASO 35,0 (32,6- 37,4) 30,7 (28,5- 33,0) 27,8 (25,8- 29,8) 23,1 (21,1- 25,1) 19,2 (17,3- 21,1) 15,5 (13,8- 17,2) Higher BSO 33,7 (30,5- 36,9) 29,3 (26,1- 32,5) 24,8 (21,6- 280, 20,6 (17,5- 23,8) 16,2 (13,0- 19,3) 13,1 (10,2- 16,0) Higher TSO 38,1 (36,3- 39,9) 33,4 (31,6- 35,2) 29,1 (27,3- 30,8) 25,0 (23,3- 26,7) 20,9 (19,2- 22,6) 16,4 (14,7- 18,1) Higher ASO 39,0 (37,3- 40,7) 34,3 (32,5- 36,0) 29,9 (28,3- 31,6) 25,5 (23,9- 27,2) 21,1 (19,5- 22,7) 17,4 (16,0- 18,9) Higher education of th e short type 40,4 (38,6- 42,3) 35,5 (33,7- 37,4) 30,7 (28,8- 32,5) 26,2 (24,4- 28,0) 22,1 (20,4- 23,9) 18,2 (16,5- 19,9) Higher education of the long type 40,9 (39,5- 42,3) 36,1 (34,7- 37,5) 31,6 (30,3- 33,0) 27,1 (25,7- 28,4) 23,3 (22,0- 24,5) 18,7 (17,5- 20,0) Table 32 Partial life expectancy in good perceived health between ages 25 and 75 years according to education level Men, 55+, Belgium, 1991 -1996 / 1997 55 60 65 70 No diploma 8,6 (6,2- 11,1) 4,3 (1,8- 6,8) 2,2 (0,2- 4,2) 1,1 (0,0- 2,6) Lower education 9,7 (8,7- 10,8) 7,4 (6,6- 8,2) 4,5 (3,8- 5,2) 2,2 (1,7- 2,7) Lower BSO 8,4 (6,0- 10,8) 6,6 (4,4- 8,7) 4,4 (2,7- 6,0) 3,0 (1,7- 4,3) Lower TSO 9,3 (7,2- 11,4) 7,1 (5,2- 8,9) 4,3 (2,6- 6,0) 2,8 (1,5- 4,1) Lower ASO 11,5 (9,9- 13,1) 7,2 (5,6- 8,8) 4,9 (3,5- 6,3) 2,4 (1,4- 3,4) Higher BSO 9,8 (7,1- 12,4) 7,6 (5,1- 10,0) 5,1 (3,0- 7,3) 2,4 (0,4- 4,4) Higher TSO 12,5 (10,9- 14,1) 9,0 (7,5- 10,5) 6,6 (5,2- 7,9) 4,0 (3,2- 4,9) Higher ASO 14 (12,6- 15,3) 10,2 (9,0- 11,5) 7,3 (6,4- 8,2) 3,8 (3,0- 4,5) Higher education of the short type 14,3 (12,7- 16,0) 11,3 (9,9- 12,7) 7,8 (6,8- 8,9) 3,7 (2,8- 4,6) Higher education of the long type 14,6 (13,3- 15,8) 10,6 (9,4- 11,7) 6,6 (5,6- 7,6) 3,6 (2,8- 4,4)
Table 33 Partial life expectancy in good perceived health between ages 25 and 75 years according to relative education level, Men, Belgium, 1991 -1996 / 1997 25 30 35 40 45 50 55 60 65 70 Lowest position 24,6 20,3 16,7 12,9 10,0 7,6 5,1 3,2 1,1 0,2 Lowest tertile 41,7 36,8 32,0 27,3 23,0 18,3 14,2 10,5 7,2 3,9 Middle tertile 27,2 22,8 19,0 15,1 12,0 9,2 6,5 4,3 2,1 0,8 Highest tertile 32,7 28,1 23,9 19,8 16,2 12,7 9,4 6,6 4,0 2,0 Highest position 38,6 33,8 29,2 24,7 20,7 16,4 12,5 9,1 6,1 3,2

78
Table 34 Partial life expectancy in good perceived health between ages 25 and 75 years according to education level Women, Belgium, 1991 -1996 / 1997 25 30 35 40 45 50 No diploma 19,1 (14,7- 23,5) 18,0 (14,2- 21,7) 13,5 (9,9- 17,1) 9,3 (6,0- 12,6) 8,2 (5,1- 11,4) 4,6 (1,8- 7,3) Lower education 27,3 (24,9- 29,7) 24,2 (22,2- 26,2) 21,0 (19,4- 22,6) 18,9 (17,5- 20,3) 16,0 (14,7- 17,3) 13,4 (12,2- 14,6) Lower BSO 30,4 (27,9- 32,9) 25,9 (23,4- 28,3) 21,6 (19,2- 24,0) 17,6 (15,4- 19,9) 15,6 (13,5- 17,6) 13,3 (11,4- 15,2) Lower TSO 27,8 (24,2- 31,4) 24,2 (20,8- 27,6) 21,8 (18,7- 25,0) 19,5 (16,7- 22,3) 17,0 (14,3- 19,6) 13,2 (10,7- 15,7) Lower ASO 34,0 (31,8- 36,2) 29,1 (26,9- 31,4) 24,8 (22,7- 26,9) 21,8 (19,9- 23,8) 18,1 (16,3- 19,9) 15,3 (13,7- 16,8) Higher BSO 34,8 (32,1- 37,6) 30,6 (27,9- 33,3) 26,2 (23,5- 28,9) 21,8 (19,2- 24,5) 18,5 (16,1- 21,0) 14,3 (11,9- 16,7) Higher TSO 37,4 (34,8- 40,0) 33,4 (30,8- 36,0) 29,2 (26,7- 31,7) 25,5 (23,1- 28,0) 22,1 (19,7- 24,5) 18,0 (15,7- 20,3) Higher ASO 40,2 (38,4- 42,0) 35,4 (33,7- 37,2) 31,0 (29,3- 32,7) 27,0 (25,4- 28,7) 22,6 (21,0- 24,2) 18,9 (17,4- 20,4) Higher education of the short type 37,1 (35,2- 39,1) 32,4 (30,4- 34,4) 28,3 (26,4- 30,3) 23,7 (21,8- 25,7) 19,7 (17,8- 21,6) 15,5 (13,6- 17,4) Higher education of the long type 39,2 (36,8- 41,5) 34,6 (32,3- 36,9) 29,9 (27,5- 32,2) 25,6 (23,3- 27,9) 21,4 (19,2- 23,6) 17,7 (15,6- 19,9) Table 35 Partial life expectancy in good perceived health between ages 25 and 75 years according to education level Women, 55+, Belgium, 1991 -1996 / 1997 55 60 65 70 No diploma 3,0 (1,0- 5,0) 2,3 (0,5- 4,0) 1,6 (0,3- 2,9) 0,8 (0,0- 1,9) Lower education 10,2 (9,2- 11,2) 7,7 (6,9- 8,5) 4,9 (4,2- 5,6) 2,3 (1,9- 2,7) Lower BSO 10,5 (8,8- 12,3) 6,9 (5,3- 8,4) 3,9 (2,7- 5,2) 1,9 (0,9- 2,8) Lower TSO 10,8 (8,7- 12,8) 9,1 (7,5- 10,7) 5,0 (3,7- 6,3) 4,8 (4,8- 4,8) Lower ASO 11,9 (10,5- 13,2) 7,6 (6,3- 8,9) 4,5 (3,4- 5,6) 1,8 (1,0- 2,7) Higher BSO 10,5 (8,3- 12,8) 7,4 (5,4- 9,3) 4,4 (2,7- 6,1) 2,6 (1,3- 3,8) Higher TSO 13,7 (11,4- 15,9) 9,4 (7,2- 11,6) 6,2 (4,3- 8,2) 2,1 (0,3- 3,9) Higher ASO 15,7 (14,4- 17,0) 11,4 (10,3- 12,6) 7,6 (6,6- 8,5) 3,9 (3,2- 4,6) Higher education of the short type 11,6 (9,8- 13,4) 8,3 (6,6- 9,9) 5,4 (3,9- 6,9) 2,4 (1,3- 3,4) Higher education of the long type 14,1 (12,2- 15,9) 12 (10,5- 13,4) 7,3 (5,8- 8,8) 4,6 (3,7- 5,5)
Table 36 Partial life expectancy in good perceived health between ages 25 and 75 years according to relative education level, Women, Belgium, 1991 -1996 / 1997 25 30 35 40 45 50 55 60 65 70 Lowest position 19,7 16,0 12,3 10,0 8,3 6,2 4,2 2,7 1,5 0,6 Lowest tertile 23,2 19,2 15,4 12,7 10,5 8,1 5,8 3,9 2,3 1,0 Middle tertile 30,1 25,8 21,7 18,2 15,1 12,0 9,0 6,3 3,9 1,8 Highest tertile 37,1 32,5 28,1 23,8 19,8 16,0 12,3 8,8 5,5 2,6 Highest position 40,7 35,8 31,3 26,6 22,2 18,0 13,9 10,1 6,3 3,0
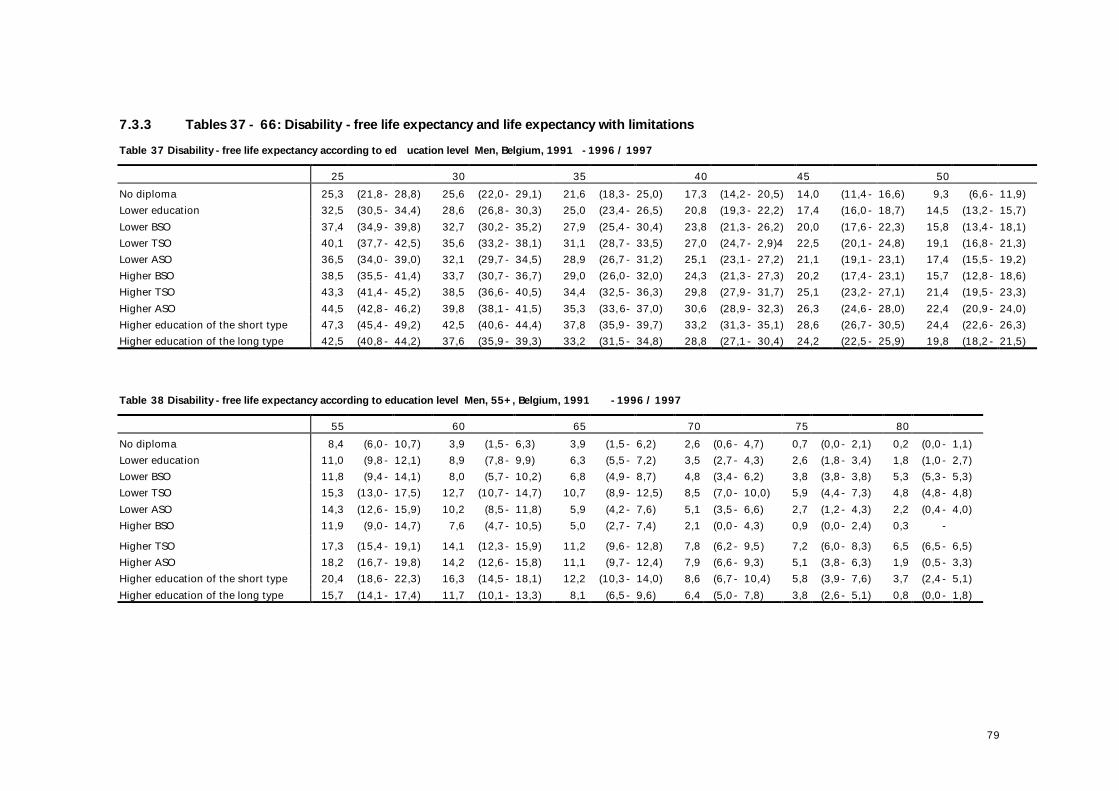
79
7.3.3 Tables 37 - 66: Disability -free life expectancy and life expectancy with limitations Table 37 Disability -free life expectancy according to ed ucation level Men, Belgium, 1991 -1996 / 1997 25 30 35 40 45 50 No diploma 25,3 (21,8- 28,8) 25,6 (22,0- 29,1) 21,6 (18,3- 25,0) 17,3 (14,2- 20,5) 14,0 (11,4- 16,6) 9,3 (6,6- 11,9) Lower education 32,5 (30,5- 34,4) 28,6 (26,8- 30,3) 25,0 (23,4- 26,5) 20,8 (19,3- 22,2) 17,4 (16,0- 18,7) 14,5 (13,2- 15,7) Lower BSO 37,4 (34,9- 39,8) 32,7 (30,2- 35,2) 27,9 (25,4- 30,4) 23,8 (21,3- 26,2) 20,0 (17,6- 22,3) 15,8 (13,4- 18,1) Lower TSO 40,1 (37,7- 42,5) 35,6 (33,2- 38,1) 31,1 (28,7- 33,5) 27,0 (24,7- 2,9)4 22,5 (20,1- 24,8) 19,1 (16,8- 21,3) Lower ASO 36,5 (34,0- 39,0) 32,1 (29,7- 34,5) 28,9 (26,7- 31,2) 25,1 (23,1- 27,2) 21,1 (19,1- 23,1) 17,4 (15,5- 19,2) Higher BSO 38,5 (35,5- 41,4) 33,7 (30,7- 36,7) 29,0 (26,0- 32,0) 24,3 (21,3- 27,3) 20,2 (17,4- 23,1) 15,7 (12,8- 18,6) Higher TSO 43,3 (41,4- 45,2) 38,5 (36,6- 40,5) 34,4 (32,5- 36,3) 29,8 (27,9- 31,7) 25,1 (23,2- 27,1) 21,4 (19,5- 23,3) Higher ASO 44,5 (42,8- 46,2) 39,8 (38,1- 41,5) 35,3 (33,6- 37,0) 30,6 (28,9- 32,3) 26,3 (24,6- 28,0) 22,4 (20,9- 24,0) Higher education of the short type 47,3 (45,4- 49,2) 42,5 (40,6- 44,4) 37,8 (35,9- 39,7) 33,2 (31,3- 35,1) 28,6 (26,7- 30,5) 24,4 (22,6- 26,3) Higher education of the long type 42,5 (40,8- 44,2) 37,6 (35,9- 39,3) 33,2 (31,5- 34,8) 28,8 (27,1- 30,4) 24,2 (22,5- 25,9) 19,8 (18,2- 21,5) Table 38 Disability -free life expectancy according to education level Men, 55+, Belgium, 1991 -1996 / 1997 55 60 65 70 75 80 No diploma 8,4 (6,0- 10,7) 3,9 (1,5- 6,3) 3,9 (1,5- 6,2) 2,6 (0,6- 4,7) 0,7 (0,0- 2,1) 0,2 (0,0- 1,1) Lower education 11,0 (9,8- 12,1) 8,9 (7,8- 9,9) 6,3 (5,5- 7,2) 3,5 (2,7- 4,3) 2,6 (1,8- 3,4) 1,8 (1,0- 2,7) Lower BSO 11,8 (9,4- 14,1) 8,0 (5,7- 10,2) 6,8 (4,9- 8,7) 4,8 (3,4- 6,2) 3,8 (3,8- 3,8) 5,3 (5,3- 5,3) Lower TSO 15,3 (13,0- 17,5) 12,7 (10,7- 14,7) 10,7 (8,9- 12,5) 8,5 (7,0- 10,0) 5,9 (4,4- 7,3) 4,8 (4,8- 4,8) Lower ASO 14,3 (12,6- 15,9) 10,2 (8,5- 11,8) 5,9 (4,2- 7,6) 5,1 (3,5- 6,6) 2,7 (1,2- 4,3) 2,2 (0,4- 4,0) Higher BSO 11,9 (9,0- 14,7) 7,6 (4,7- 10,5) 5,0 (2,7- 7,4) 2,1 (0,0- 4,3) 0,9 (0,0- 2,4) 0,3 - Higher TSO 17,3 (15,4- 19,1) 14,1 (12,3- 15,9) 11,2 (9,6- 12,8) 7,8 (6,2- 9,5) 7,2 (6,0- 8,3) 6,5 (6,5- 6,5) Higher ASO 18,2 (16,7- 19,8) 14,2 (12,6- 15,8) 11,1 (9,7- 12,4) 7,9 (6,6- 9,3) 5,1 (3,8- 6,3) 1,9 (0,5- 3,3) Higher education of the short type 20,4 (18,6- 22,3) 16,3 (14,5- 18,1) 12,2 (10,3- 14,0) 8,6 (6,7- 10,4) 5,8 (3,9- 7,6) 3,7 (2,4- 5,1) Higher education of the long type 15,7 (14,1- 17,4) 11,7 (10,1- 13,3) 8,1 (6,5- 9,6) 6,4 (5,0- 7,8) 3,8 (2,6- 5,1) 0,8 (0,0- 1,8)
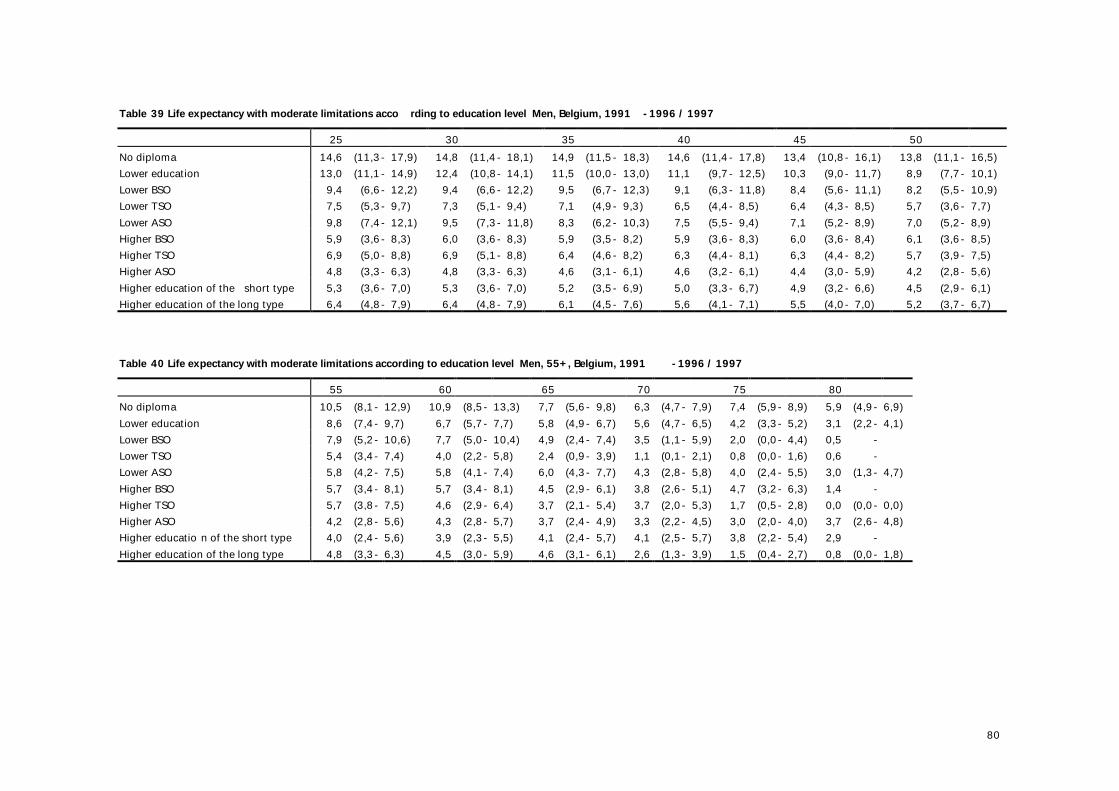
80
Table 39 Life expectancy with moderate limitations acco rding to education level Men, Belgium, 1991 -1996 / 1997 25 30 35 40 45 50 No diploma 14,6 (11,3- 17,9) 14,8 (11,4- 18,1) 14,9 (11,5- 18,3) 14,6 (11,4- 17,8) 13,4 (10,8- 16,1) 13,8 (11,1- 16,5) Lower education 13,0 (11,1- 14,9) 12,4 (10,8- 14,1) 11,5 (10,0- 13,0) 11,1 (9,7- 12,5) 10,3 (9,0- 11,7) 8,9 (7,7- 10,1) Lower BSO 9,4 (6,6- 12,2) 9,4 (6,6- 12,2) 9,5 (6,7- 12,3) 9,1 (6,3- 11,8) 8,4 (5,6- 11,1) 8,2 (5,5- 10,9) Lower TSO 7,5 (5,3- 9,7) 7,3 (5,1- 9,4) 7,1 (4,9- 9,3) 6,5 (4,4- 8,5) 6,4 (4,3- 8,5) 5,7 (3,6- 7,7) Lower ASO 9,8 (7,4- 12,1) 9,5 (7,3- 11,8) 8,3 (6,2- 10,3) 7,5 (5,5- 9,4) 7,1 (5,2- 8,9) 7,0 (5,2- 8,9) Higher BSO 5,9 (3,6- 8,3) 6,0 (3,6- 8,3) 5,9 (3,5- 8,2) 5,9 (3,6- 8,3) 6,0 (3,6- 8,4) 6,1 (3,6- 8,5) Higher TSO 6,9 (5,0- 8,8) 6,9 (5,1- 8,8) 6,4 (4,6- 8,2) 6,3 (4,4- 8,1) 6,3 (4,4- 8,2) 5,7 (3,9- 7,5) Higher ASO 4,8 (3,3- 6,3) 4,8 (3,3- 6,3) 4,6 (3,1- 6,1) 4,6 (3,2- 6,1) 4,4 (3,0- 5,9) 4,2 (2,8- 5,6) Higher education of the short type 5,3 (3,6- 7,0) 5,3 (3,6- 7,0) 5,2 (3,5- 6,9) 5,0 (3,3- 6,7) 4,9 (3,2- 6,6) 4,5 (2,9- 6,1) Higher education of the long type 6,4 (4,8- 7,9) 6,4 (4,8- 7,9) 6,1 (4,5- 7,6) 5,6 (4,1- 7,1) 5,5 (4,0- 7,0) 5,2 (3,7- 6,7) Table 40 Life expectancy with moderate limitations according to education level Men, 55+, Belgium, 1991 -1996 / 1997 55 60 65 70 75 80 No diploma 10,5 (8,1- 12,9) 10,9 (8,5- 13,3) 7,7 (5,6- 9,8) 6,3 (4,7- 7,9) 7,4 (5,9- 8,9) 5,9 (4,9- 6,9) Lower education 8,6 (7,4- 9,7) 6,7 (5,7- 7,7) 5,8 (4,9- 6,7) 5,6 (4,7- 6,5) 4,2 (3,3- 5,2) 3,1 (2,2- 4,1) Lower BSO 7,9 (5,2- 10,6) 7,7 (5,0- 10,4) 4,9 (2,4- 7,4) 3,5 (1,1- 5,9) 2,0 (0,0- 4,4) 0,5 - Lower TSO 5,4 (3,4- 7,4) 4,0 (2,2- 5,8) 2,4 (0,9- 3,9) 1,1 (0,1- 2,1) 0,8 (0,0- 1,6) 0,6 - Lower ASO 5,8 (4,2- 7,5) 5,8 (4,1- 7,4) 6,0 (4,3- 7,7) 4,3 (2,8- 5,8) 4,0 (2,4- 5,5) 3,0 (1,3- 4,7) Higher BSO 5,7 (3,4- 8,1) 5,7 (3,4- 8,1) 4,5 (2,9- 6,1) 3,8 (2,6- 5,1) 4,7 (3,2- 6,3) 1,4 - Higher TSO 5,7 (3,8- 7,5) 4,6 (2,9- 6,4) 3,7 (2,1- 5,4) 3,7 (2,0- 5,3) 1,7 (0,5- 2,8) 0,0 (0,0- 0,0) Higher ASO 4,2 (2,8- 5,6) 4,3 (2,8- 5,7) 3,7 (2,4- 4,9) 3,3 (2,2- 4,5) 3,0 (2,0- 4,0) 3,7 (2,6- 4,8) Higher educatio n of the short type 4,0 (2,4- 5,6) 3,9 (2,3- 5,5) 4,1 (2,4- 5,7) 4,1 (2,5- 5,7) 3,8 (2,2- 5,4) 2,9 - Higher education of the long type 4,8 (3,3- 6,3) 4,5 (3,0- 5,9) 4,6 (3,1- 6,1) 2,6 (1,3- 3,9) 1,5 (0,4- 2,7) 0,8 (0,0- 1,8)
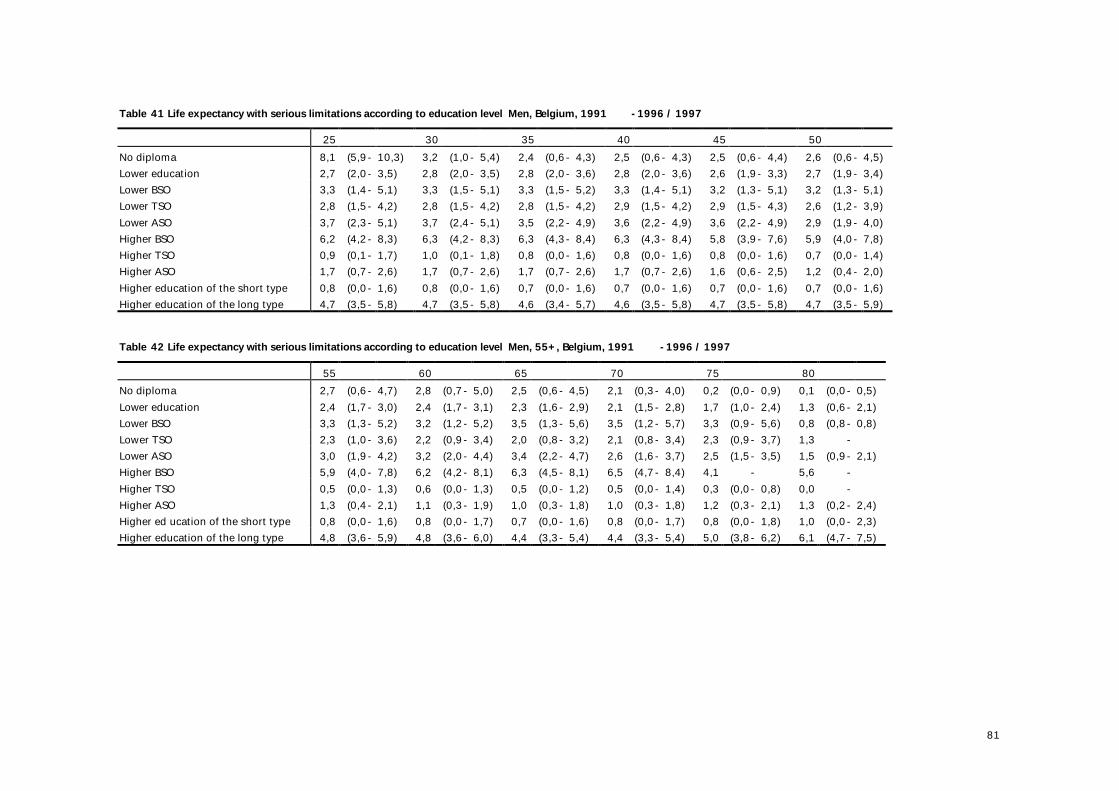
81
Table 41 Life expectancy with serious limitations according to education level Men, Belgium, 1991 -1996 / 1997 25 30 35 40 45 50 No diploma 8,1 (5,9- 10,3) 3,2 (1,0- 5,4) 2,4 (0,6- 4,3) 2,5 (0,6- 4,3) 2,5 (0,6- 4,4) 2,6 (0,6- 4,5) Lower education 2,7 (2,0- 3,5) 2,8 (2,0- 3,5) 2,8 (2,0- 3,6) 2,8 (2,0- 3,6) 2,6 (1,9- 3,3) 2,7 (1,9- 3,4) Lower BSO 3,3 (1,4- 5,1) 3,3 (1,5- 5,1) 3,3 (1,5- 5,2) 3,3 (1,4- 5,1) 3,2 (1,3- 5,1) 3,2 (1,3- 5,1) Lower TSO 2,8 (1,5- 4,2) 2,8 (1,5- 4,2) 2,8 (1,5- 4,2) 2,9 (1,5- 4,2) 2,9 (1,5- 4,3) 2,6 (1,2- 3,9) Lower ASO 3,7 (2,3- 5,1) 3,7 (2,4- 5,1) 3,5 (2,2- 4,9) 3,6 (2,2- 4,9) 3,6 (2,2- 4,9) 2,9 (1,9- 4,0) Higher BSO 6,2 (4,2- 8,3) 6,3 (4,2- 8,3) 6,3 (4,3- 8,4) 6,3 (4,3- 8,4) 5,8 (3,9- 7,6) 5,9 (4,0- 7,8) Higher TSO 0,9 (0,1- 1,7) 1,0 (0,1- 1,8) 0,8 (0,0- 1,6) 0,8 (0,0- 1,6) 0,8 (0,0- 1,6) 0,7 (0,0- 1,4) Higher ASO 1,7 (0,7- 2,6) 1,7 (0,7- 2,6) 1,7 (0,7- 2,6) 1,7 (0,7- 2,6) 1,6 (0,6- 2,5) 1,2 (0,4- 2,0) Higher education of the short type 0,8 (0,0- 1,6) 0,8 (0,0- 1,6) 0,7 (0,0- 1,6) 0,7 (0,0- 1,6) 0,7 (0,0- 1,6) 0,7 (0,0- 1,6) Higher education of the long type 4,7 (3,5- 5,8) 4,7 (3,5- 5,8) 4,6 (3,4- 5,7) 4,6 (3,5- 5,8) 4,7 (3,5- 5,8) 4,7 (3,5- 5,9) Table 42 Life expectancy with serious limitations according to education level Men, 55+, Belgium, 1991 -1996 / 1997 55 60 65 70 75 80 No diploma 2,7 (0,6- 4,7) 2,8 (0,7- 5,0) 2,5 (0,6- 4,5) 2,1 (0,3- 4,0) 0,2 (0,0- 0,9) 0,1 (0,0- 0,5) Lower education 2,4 (1,7- 3,0) 2,4 (1,7- 3,1) 2,3 (1,6- 2,9) 2,1 (1,5- 2,8) 1,7 (1,0- 2,4) 1,3 (0,6- 2,1) Lower BSO 3,3 (1,3- 5,2) 3,2 (1,2- 5,2) 3,5 (1,3- 5,6) 3,5 (1,2- 5,7) 3,3 (0,9- 5,6) 0,8 (0,8- 0,8) Lower TSO 2,3 (1,0- 3,6) 2,2 (0,9- 3,4) 2,0 (0,8- 3,2) 2,1 (0,8- 3,4) 2,3 (0,9- 3,7) 1,3 - Lower ASO 3,0 (1,9- 4,2) 3,2 (2,0- 4,4) 3,4 (2,2- 4,7) 2,6 (1,6- 3,7) 2,5 (1,5- 3,5) 1,5 (0,9- 2,1) Higher BSO 5,9 (4,0- 7,8) 6,2 (4,2- 8,1) 6,3 (4,5- 8,1) 6,5 (4,7- 8,4) 4,1 - 5,6 - Higher TSO 0,5 (0,0- 1,3) 0,6 (0,0- 1,3) 0,5 (0,0- 1,2) 0,5 (0,0- 1,4) 0,3 (0,0- 0,8) 0,0 - Higher ASO 1,3 (0,4- 2,1) 1,1 (0,3- 1,9) 1,0 (0,3- 1,8) 1,0 (0,3- 1,8) 1,2 (0,3- 2,1) 1,3 (0,2- 2,4) Higher ed ucation of the short type 0,8 (0,0- 1,6) 0,8 (0,0- 1,7) 0,7 (0,0- 1,6) 0,8 (0,0- 1,7) 0,8 (0,0- 1,8) 1,0 (0,0- 2,3) Higher education of the long type 4,8 (3,6- 5,9) 4,8 (3,6- 6,0) 4,4 (3,3- 5,4) 4,4 (3,3- 5,4) 5,0 (3,8- 6,2) 6,1 (4,7- 7,5)
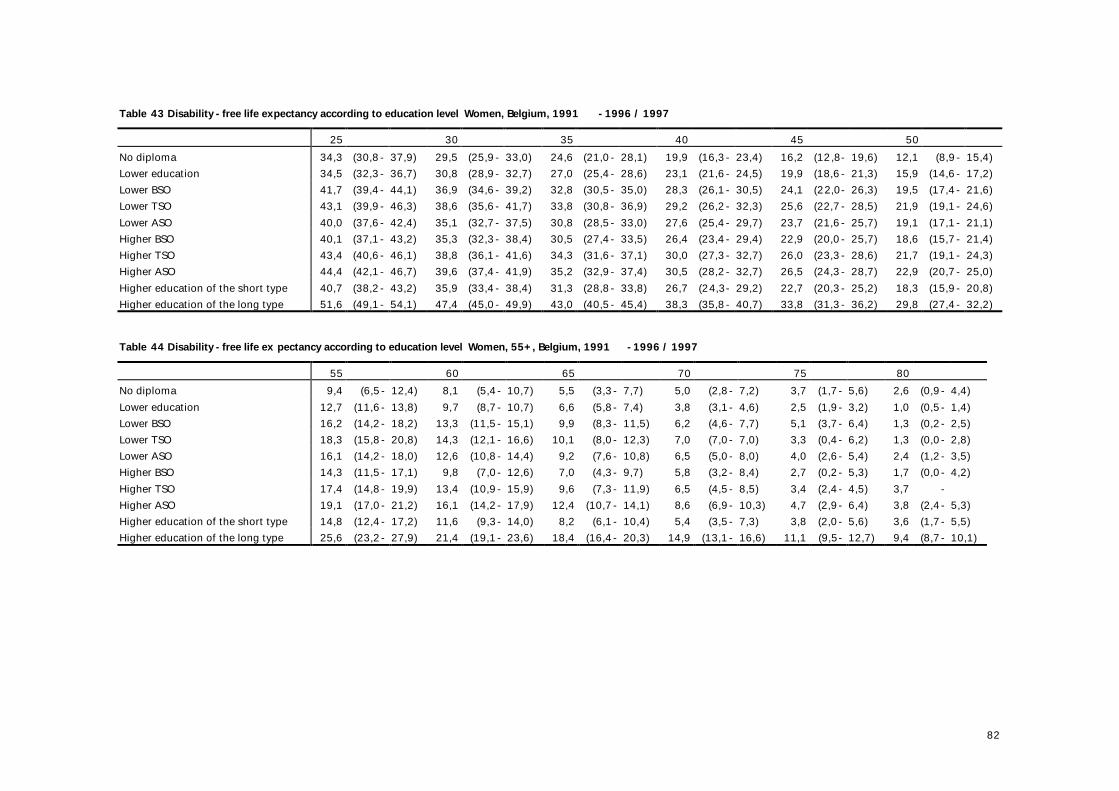
82
Table 43 Disability -free life expectancy according to education level Women, Belgium, 1991 -1996 / 1997 25 30 35 40 45 50 No diploma 34,3 (30,8- 37,9) 29,5 (25,9- 33,0) 24,6 (21,0- 28,1) 19,9 (16,3- 23,4) 16,2 (12,8- 19,6) 12,1 (8,9- 15,4) Lower education 34,5 (32,3- 36,7) 30,8 (28,9- 32,7) 27,0 (25,4- 28,6) 23,1 (21,6- 24,5) 19,9 (18,6- 21,3) 15,9 (14,6- 17,2) Lower BSO 41,7 (39,4- 44,1) 36,9 (34,6- 39,2) 32,8 (30,5- 35,0) 28,3 (26,1- 30,5) 24,1 (22,0- 26,3) 19,5 (17,4- 21,6) Lower TSO 43,1 (39,9- 46,3) 38,6 (35,6- 41,7) 33,8 (30,8- 36,9) 29,2 (26,2- 32,3) 25,6 (22,7- 28,5) 21,9 (19,1- 24,6) Lower ASO 40,0 (37,6- 42,4) 35,1 (32,7- 37,5) 30,8 (28,5- 33,0) 27,6 (25,4- 29,7) 23,7 (21,6- 25,7) 19,1 (17,1- 21,1) Higher BSO 40,1 (37,1- 43,2) 35,3 (32,3- 38,4) 30,5 (27,4- 33,5) 26,4 (23,4- 29,4) 22,9 (20,0- 25,7) 18,6 (15,7- 21,4) Higher TSO 43,4 (40,6- 46,1) 38,8 (36,1- 41,6) 34,3 (31,6- 37,1) 30,0 (27,3- 32,7) 26,0 (23,3- 28,6) 21,7 (19,1- 24,3) Higher ASO 44,4 (42,1- 46,7) 39,6 (37,4- 41,9) 35,2 (32,9- 37,4) 30,5 (28,2- 32,7) 26,5 (24,3- 28,7) 22,9 (20,7- 25,0) Higher education of the short type 40,7 (38,2- 43,2) 35,9 (33,4- 38,4) 31,3 (28,8- 33,8) 26,7 (24,3- 29,2) 22,7 (20,3- 25,2) 18,3 (15,9- 20,8) Higher education of the long type 51,6 (49,1- 54,1) 47,4 (45,0- 49,9) 43,0 (40,5- 45,4) 38,3 (35,8- 40,7) 33,8 (31,3- 36,2) 29,8 (27,4- 32,2) Table 44 Disability -free life ex pectancy according to education level Women, 55+, Belgium, 1991 -1996 / 1997 55 60 65 70 75 80 No diploma 9,4 (6,5- 12,4) 8,1 (5,4- 10,7) 5,5 (3,3- 7,7) 5,0 (2,8- 7,2) 3,7 (1,7- 5,6) 2,6 (0,9- 4,4) Lower education 12,7 (11,6- 13,8) 9,7 (8,7- 10,7) 6,6 (5,8- 7,4) 3,8 (3,1- 4,6) 2,5 (1,9- 3,2) 1,0 (0,5- 1,4) Lower BSO 16,2 (14,2- 18,2) 13,3 (11,5- 15,1) 9,9 (8,3- 11,5) 6,2 (4,6- 7,7) 5,1 (3,7- 6,4) 1,3 (0,2- 2,5) Lower TSO 18,3 (15,8- 20,8) 14,3 (12,1- 16,6) 10,1 (8,0- 12,3) 7,0 (7,0- 7,0) 3,3 (0,4- 6,2) 1,3 (0,0- 2,8) Lower ASO 16,1 (14,2- 18,0) 12,6 (10,8- 14,4) 9,2 (7,6- 10,8) 6,5 (5,0- 8,0) 4,0 (2,6- 5,4) 2,4 (1,2- 3,5) Higher BSO 14,3 (11,5- 17,1) 9,8 (7,0- 12,6) 7,0 (4,3- 9,7) 5,8 (3,2- 8,4) 2,7 (0,2- 5,3) 1,7 (0,0- 4,2) Higher TSO 17,4 (14,8- 19,9) 13,4 (10,9- 15,9) 9,6 (7,3- 11,9) 6,5 (4,5- 8,5) 3,4 (2,4- 4,5) 3,7 - Higher ASO 19,1 (17,0- 21,2) 16,1 (14,2- 17,9) 12,4 (10,7- 14,1) 8,6 (6,9- 10,3) 4,7 (2,9- 6,4) 3,8 (2,4- 5,3) Higher education of the short type 14,8 (12,4- 17,2) 11,6 (9,3- 14,0) 8,2 (6,1- 10,4) 5,4 (3,5- 7,3) 3,8 (2,0- 5,6) 3,6 (1,7- 5,5) Higher education of the long type 25,6 (23,2- 27,9) 21,4 (19,1- 23,6) 18,4 (16,4- 20,3) 14,9 (13,1- 16,6) 11,1 (9,5- 12,7) 9,4 (8,7- 10,1)
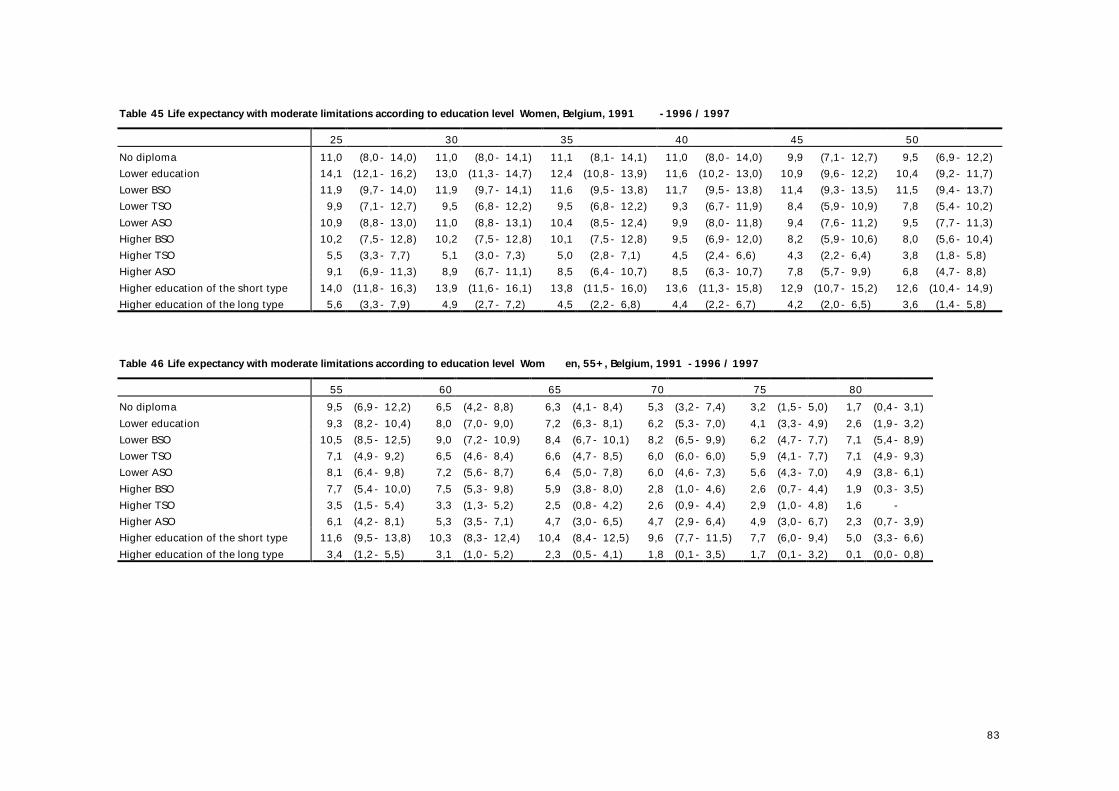
83
Table 45 Life expectancy with moderate limitations according to education level Women, Belgium, 1991 -1996 / 1997 25 30 35 40 45 50 No diploma 11,0 (8,0- 14,0) 11,0 (8,0- 14,1) 11,1 (8,1- 14,1) 11,0 (8,0- 14,0) 9,9 (7,1- 12,7) 9,5 (6,9- 12,2) Lower education 14,1 (12,1- 16,2) 13,0 (11,3- 14,7) 12,4 (10,8- 13,9) 11,6 (10,2- 13,0) 10,9 (9,6- 12,2) 10,4 (9,2- 11,7) Lower BSO 11,9 (9,7- 14,0) 11,9 (9,7- 14,1) 11,6 (9,5- 13,8) 11,7 (9,5- 13,8) 11,4 (9,3- 13,5) 11,5 (9,4- 13,7) Lower TSO 9,9 (7,1- 12,7) 9,5 (6,8- 12,2) 9,5 (6,8- 12,2) 9,3 (6,7- 11,9) 8,4 (5,9- 10,9) 7,8 (5,4- 10,2) Lower ASO 10,9 (8,8- 13,0) 11,0 (8,8- 13,1) 10,4 (8,5- 12,4) 9,9 (8,0- 11,8) 9,4 (7,6- 11,2) 9,5 (7,7- 11,3) Higher BSO 10,2 (7,5- 12,8) 10,2 (7,5- 12,8) 10,1 (7,5- 12,8) 9,5 (6,9- 12,0) 8,2 (5,9- 10,6) 8,0 (5,6- 10,4) Higher TSO 5,5 (3,3- 7,7) 5,1 (3,0- 7,3) 5,0 (2,8- 7,1) 4,5 (2,4- 6,6) 4,3 (2,2- 6,4) 3,8 (1,8- 5,8) Higher ASO 9,1 (6,9- 11,3) 8,9 (6,7- 11,1) 8,5 (6,4- 10,7) 8,5 (6,3- 10,7) 7,8 (5,7- 9,9) 6,8 (4,7- 8,8) Higher education of the short type 14,0 (11,8- 16,3) 13,9 (11,6- 16,1) 13,8 (11,5- 16,0) 13,6 (11,3- 15,8) 12,9 (10,7- 15,2) 12,6 (10,4- 14,9) Higher education of the long type 5,6 (3,3- 7,9) 4,9 (2,7- 7,2) 4,5 (2,2- 6,8) 4,4 (2,2- 6,7) 4,2 (2,0- 6,5) 3,6 (1,4- 5,8) Table 46 Life expectancy with moderate limitations according to education level Wom en, 55+, Belgium, 1991 -1996 / 1997 55 60 65 70 75 80 No diploma 9,5 (6,9- 12,2) 6,5 (4,2- 8,8) 6,3 (4,1- 8,4) 5,3 (3,2- 7,4) 3,2 (1,5- 5,0) 1,7 (0,4- 3,1) Lower education 9,3 (8,2- 10,4) 8,0 (7,0- 9,0) 7,2 (6,3- 8,1) 6,2 (5,3- 7,0) 4,1 (3,3- 4,9) 2,6 (1,9- 3,2) Lower BSO 10,5 (8,5- 12,5) 9,0 (7,2- 10,9) 8,4 (6,7- 10,1) 8,2 (6,5- 9,9) 6,2 (4,7- 7,7) 7,1 (5,4- 8,9) Lower TSO 7,1 (4,9- 9,2) 6,5 (4,6- 8,4) 6,6 (4,7- 8,5) 6,0 (6,0- 6,0) 5,9 (4,1- 7,7) 7,1 (4,9- 9,3) Lower ASO 8,1 (6,4- 9,8) 7,2 (5,6- 8,7) 6,4 (5,0- 7,8) 6,0 (4,6- 7,3) 5,6 (4,3- 7,0) 4,9 (3,8- 6,1) Higher BSO 7,7 (5,4- 10,0) 7,5 (5,3- 9,8) 5,9 (3,8- 8,0) 2,8 (1,0- 4,6) 2,6 (0,7- 4,4) 1,9 (0,3- 3,5) Higher TSO 3,5 (1,5- 5,4) 3,3 (1,3- 5,2) 2,5 (0,8- 4,2) 2,6 (0,9- 4,4) 2,9 (1,0- 4,8) 1,6 - Higher ASO 6,1 (4,2- 8,1) 5,3 (3,5- 7,1) 4,7 (3,0- 6,5) 4,7 (2,9- 6,4) 4,9 (3,0- 6,7) 2,3 (0,7- 3,9) Higher education of the short type 11,6 (9,5- 13,8) 10,3 (8,3- 12,4) 10,4 (8,4- 12,5) 9,6 (7,7- 11,5) 7,7 (6,0- 9,4) 5,0 (3,3- 6,6) Higher education of the long type 3,4 (1,2- 5,5) 3,1 (1,0- 5,2) 2,3 (0,5- 4,1) 1,8 (0,1- 3,5) 1,7 (0,1- 3,2) 0,1 (0,0- 0,8)
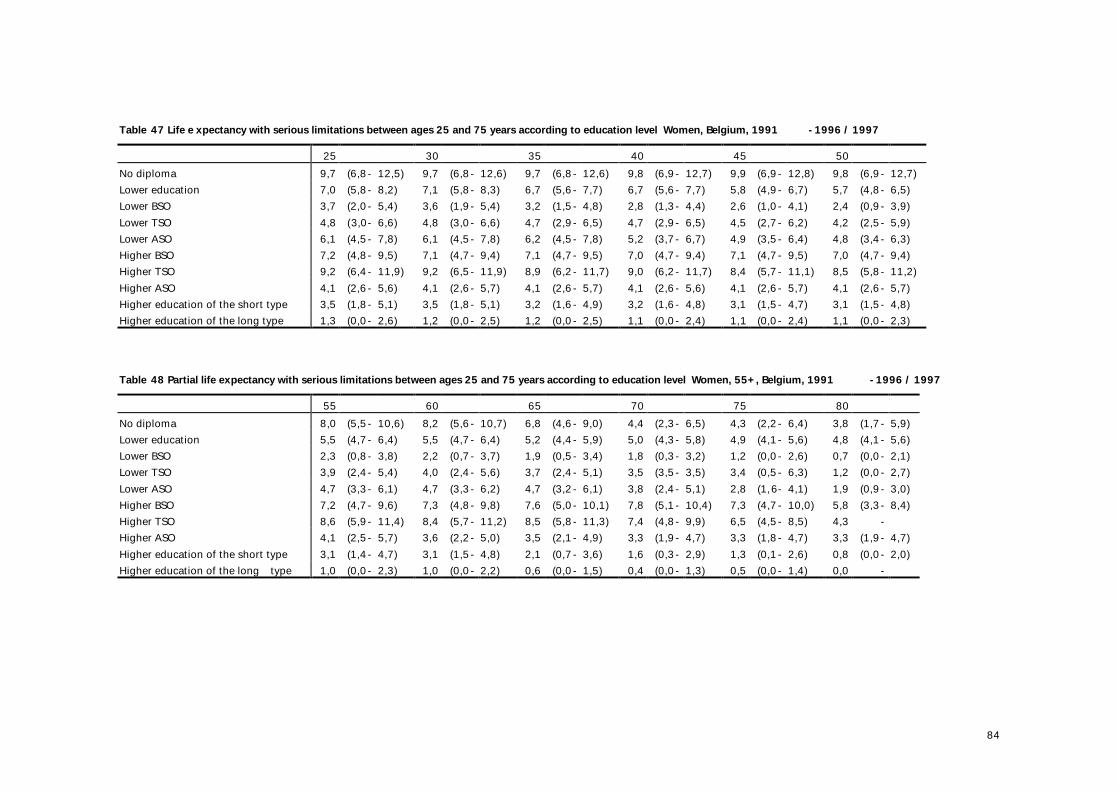
84
Table 47 Life e xpectancy with serious limitations between ages 25 and 75 years according to education level Women, Belgium, 1991 -1996 / 1997 25 30 35 40 45 50 No diploma 9,7 (6,8- 12,5) 9,7 (6,8- 12,6) 9,7 (6,8- 12,6) 9,8 (6,9- 12,7) 9,9 (6,9- 12,8) 9,8 (6,9- 12,7) Lower education 7,0 (5,8- 8,2) 7,1 (5,8- 8,3) 6,7 (5,6- 7,7) 6,7 (5,6- 7,7) 5,8 (4,9- 6,7) 5,7 (4,8- 6,5) Lower BSO 3,7 (2,0- 5,4) 3,6 (1,9- 5,4) 3,2 (1,5- 4,8) 2,8 (1,3- 4,4) 2,6 (1,0- 4,1) 2,4 (0,9- 3,9) Lower TSO 4,8 (3,0- 6,6) 4,8 (3,0- 6,6) 4,7 (2,9- 6,5) 4,7 (2,9- 6,5) 4,5 (2,7- 6,2) 4,2 (2,5- 5,9) Lower ASO 6,1 (4,5- 7,8) 6,1 (4,5- 7,8) 6,2 (4,5- 7,8) 5,2 (3,7- 6,7) 4,9 (3,5- 6,4) 4,8 (3,4- 6,3) Higher BSO 7,2 (4,8- 9,5) 7,1 (4,7- 9,4) 7,1 (4,7- 9,5) 7,0 (4,7- 9,4) 7,1 (4,7- 9,5) 7,0 (4,7- 9,4) Higher TSO 9,2 (6,4- 11,9) 9,2 (6,5- 11,9) 8,9 (6,2- 11,7) 9,0 (6,2- 11,7) 8,4 (5,7- 11,1) 8,5 (5,8- 11,2) Higher ASO 4,1 (2,6- 5,6) 4,1 (2,6- 5,7) 4,1 (2,6- 5,7) 4,1 (2,6- 5,6) 4,1 (2,6- 5,7) 4,1 (2,6- 5,7) Higher education of the short type 3,5 (1,8- 5,1) 3,5 (1,8- 5,1) 3,2 (1,6- 4,9) 3,2 (1,6- 4,8) 3,1 (1,5- 4,7) 3,1 (1,5- 4,8) Higher education of the long type 1,3 (0,0- 2,6) 1,2 (0,0- 2,5) 1,2 (0,0- 2,5) 1,1 (0,0- 2,4) 1,1 (0,0- 2,4) 1,1 (0,0- 2,3) Table 48 Partial life expectancy with serious limitations between ages 25 and 75 years according to education level Women, 55+, Belgium, 1991 -1996 / 1997 55 60 65 70 75 80 No diploma 8,0 (5,5- 10,6) 8,2 (5,6- 10,7) 6,8 (4,6- 9,0) 4,4 (2,3- 6,5) 4,3 (2,2- 6,4) 3,8 (1,7- 5,9) Lower education 5,5 (4,7- 6,4) 5,5 (4,7- 6,4) 5,2 (4,4- 5,9) 5,0 (4,3- 5,8) 4,9 (4,1- 5,6) 4,8 (4,1- 5,6) Lower BSO 2,3 (0,8- 3,8) 2,2 (0,7- 3,7) 1,9 (0,5- 3,4) 1,8 (0,3- 3,2) 1,2 (0,0- 2,6) 0,7 (0,0- 2,1) Lower TSO 3,9 (2,4- 5,4) 4,0 (2,4- 5,6) 3,7 (2,4- 5,1) 3,5 (3,5- 3,5) 3,4 (0,5- 6,3) 1,2 (0,0- 2,7) Lower ASO 4,7 (3,3- 6,1) 4,7 (3,3- 6,2) 4,7 (3,2- 6,1) 3,8 (2,4- 5,1) 2,8 (1,6- 4,1) 1,9 (0,9- 3,0) Higher BSO 7,2 (4,7- 9,6) 7,3 (4,8- 9,8) 7,6 (5,0- 10,1) 7,8 (5,1- 10,4) 7,3 (4,7- 10,0) 5,8 (3,3- 8,4) Higher TSO 8,6 (5,9- 11,4) 8,4 (5,7- 11,2) 8,5 (5,8- 11,3) 7,4 (4,8- 9,9) 6,5 (4,5- 8,5) 4,3 - Higher ASO 4,1 (2,5- 5,7) 3,6 (2,2- 5,0) 3,5 (2,1- 4,9) 3,3 (1,9- 4,7) 3,3 (1,8- 4,7) 3,3 (1,9- 4,7) Higher education of the short type 3,1 (1,4- 4,7) 3,1 (1,5- 4,8) 2,1 (0,7- 3,6) 1,6 (0,3- 2,9) 1,3 (0,1- 2,6) 0,8 (0,0- 2,0) Higher education of the long type 1,0 (0,0- 2,3) 1,0 (0,0- 2,2) 0,6 (0,0- 1,5) 0,4 (0,0- 1,3) 0,5 (0,0- 1,4) 0,0 -
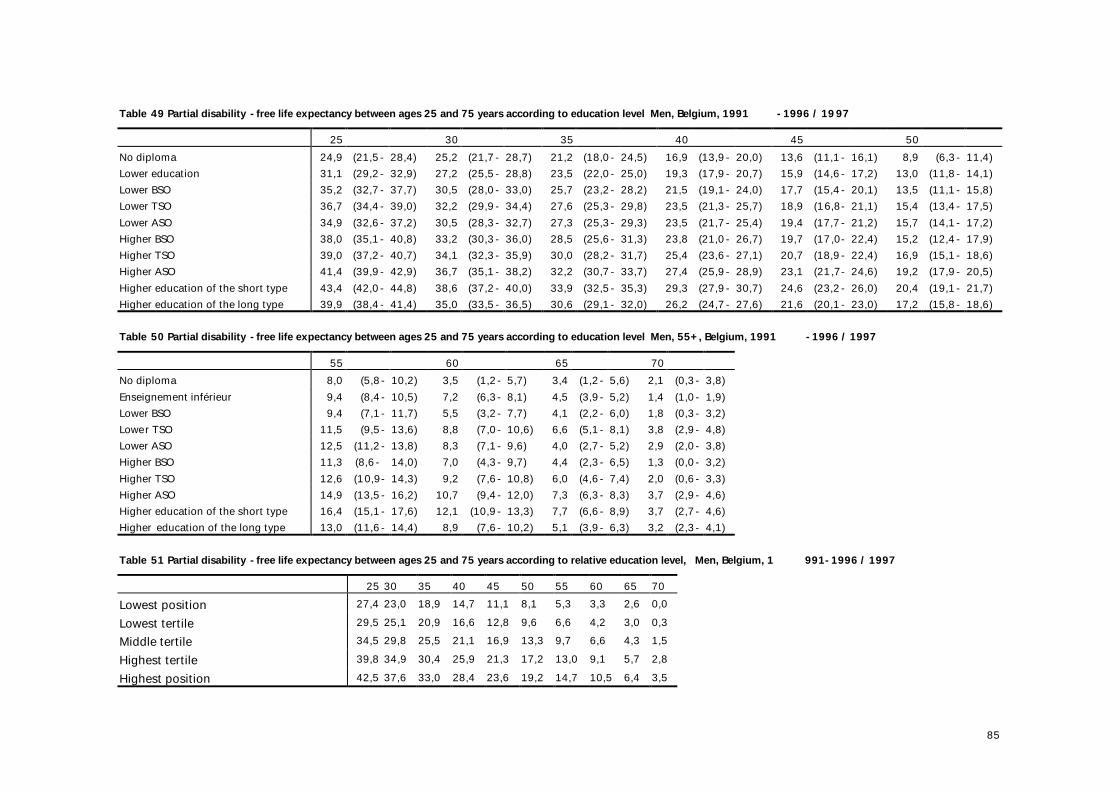
85
Table 49 Partial disability -free life expectancy between ages 25 and 75 years according to education level Men, Belgium, 1991 -1996 / 1997 25 30 35 40 45 50 No diploma 24,9 (21,5- 28,4) 25,2 (21,7- 28,7) 21,2 (18,0- 24,5) 16,9 (13,9- 20,0) 13,6 (11,1- 16,1) 8,9 (6,3- 11,4) Lower education 31,1 (29,2- 32,9) 27,2 (25,5- 28,8) 23,5 (22,0- 25,0) 19,3 (17,9- 20,7) 15,9 (14,6- 17,2) 13,0 (11,8- 14,1) Lower BSO 35,2 (32,7- 37,7) 30,5 (28,0- 33,0) 25,7 (23,2- 28,2) 21,5 (19,1- 24,0) 17,7 (15,4- 20,1) 13,5 (11,1- 15,8) Lower TSO 36,7 (34,4- 39,0) 32,2 (29,9- 34,4) 27,6 (25,3- 29,8) 23,5 (21,3- 25,7) 18,9 (16,8- 21,1) 15,4 (13,4- 17,5) Lower ASO 34,9 (32,6- 37,2) 30,5 (28,3- 32,7) 27,3 (25,3- 29,3) 23,5 (21,7- 25,4) 19,4 (17,7- 21,2) 15,7 (14,1- 17,2) Higher BSO 38,0 (35,1- 40,8) 33,2 (30,3- 36,0) 28,5 (25,6- 31,3) 23,8 (21,0- 26,7) 19,7 (17,0- 22,4) 15,2 (12,4- 17,9) Higher TSO 39,0 (37,2- 40,7) 34,1 (32,3- 35,9) 30,0 (28,2- 31,7) 25,4 (23,6- 27,1) 20,7 (18,9- 22,4) 16,9 (15,1- 18,6) Higher ASO 41,4 (39,9- 42,9) 36,7 (35,1- 38,2) 32,2 (30,7- 33,7) 27,4 (25,9- 28,9) 23,1 (21,7- 24,6) 19,2 (17,9- 20,5) Higher education of the short type 43,4 (42,0- 44,8) 38,6 (37,2- 40,0) 33,9 (32,5- 35,3) 29,3 (27,9- 30,7) 24,6 (23,2- 26,0) 20,4 (19,1- 21,7) Higher education of the long type 39,9 (38,4- 41,4) 35,0 (33,5- 36,5) 30,6 (29,1- 32,0) 26,2 (24,7- 27,6) 21,6 (20,1- 23,0) 17,2 (15,8- 18,6)
Table 50 Partial disability -free life expectancy between ages 25 and 75 years according to education level Men, 55+, Belgium, 1991 -1996 / 1997 55 60 65 70 No diploma 8,0 (5,8- 10,2) 3,5 (1,2- 5,7) 3,4 (1,2- 5,6) 2,1 (0,3- 3,8) Enseignement inférieur 9,4 (8,4- 10,5) 7,2 (6,3- 8,1) 4,5 (3,9- 5,2) 1,4 (1,0- 1,9) Lower BSO 9,4 (7,1- 11,7) 5,5 (3,2- 7,7) 4,1 (2,2- 6,0) 1,8 (0,3- 3,2) Lower TSO 11,5 (9,5- 13,6) 8,8 (7,0- 10,6) 6,6 (5,1- 8,1) 3,8 (2,9- 4,8) Lower ASO 12,5 (11,2- 13,8) 8,3 (7,1- 9,6) 4,0 (2,7- 5,2) 2,9 (2,0- 3,8) Higher BSO 11,3 (8,6- 14,0) 7,0 (4,3- 9,7) 4,4 (2,3- 6,5) 1,3 (0,0- 3,2) Higher TSO 12,6 (10,9- 14,3) 9,2 (7,6- 10,8) 6,0 (4,6- 7,4) 2,0 (0,6- 3,3) Higher ASO 14,9 (13,5- 16,2) 10,7 (9,4- 12,0) 7,3 (6,3- 8,3) 3,7 (2,9- 4,6) Higher education of the short type 16,4 (15,1- 17,6) 12,1 (10,9- 13,3) 7,7 (6,6- 8,9) 3,7 (2,7- 4,6) Higher education of the long type 13,0 (11,6- 14,4) 8,9 (7,6- 10,2) 5,1 (3,9- 6,3) 3,2 (2,3- 4,1)
Table 51 Partial disability -free life expectancy between ages 25 and 75 years according to relative education level, Men, Belgium, 1 991-1996 / 1997 25 30 35 40 45 50 55 60 65 70 Lowest position 27,4 23,0 18,9 14,7 11,1 8,1 5,3 3,3 2,6 0,0 Lowest tertile 29,5 25,1 20,9 16,6 12,8 9,6 6,6 4,2 3,0 0,3 Middle tertile 34,5 29,8 25,5 21,1 16,9 13,3 9,7 6,6 4,3 1,5 Highest tertile 39,8 34,9 30,4 25,9 21,3 17,2 13,0 9,1 5,7 2,8 Highest position 42,5 37,6 33,0 28,4 23,6 19,2 14,7 10,5 6,4 3,5
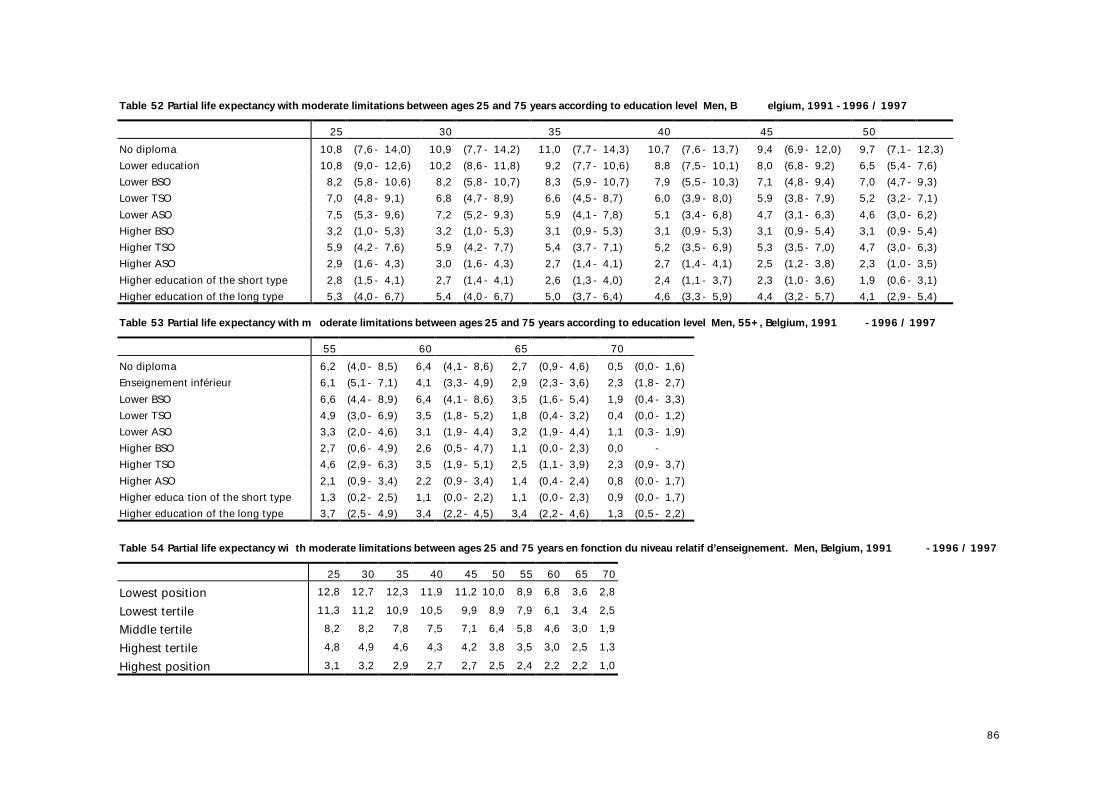
86
Table 52 Partial life expectancy with moderate limitations between ages 25 and 75 years according to education level Men, B elgium, 1991 -1996 / 1997 25 30 35 40 45 50 No diploma 10,8 (7,6- 14,0) 10,9 (7,7- 14,2) 11,0 (7,7- 14,3) 10,7 (7,6- 13,7) 9,4 (6,9- 12,0) 9,7 (7,1- 12,3) Lower education 10,8 (9,0- 12,6) 10,2 (8,6- 11,8) 9,2 (7,7- 10,6) 8,8 (7,5- 10,1) 8,0 (6,8- 9,2) 6,5 (5,4- 7,6) Lower BSO 8,2 (5,8- 10,6) 8,2 (5,8- 10,7) 8,3 (5,9- 10,7) 7,9 (5,5- 10,3) 7,1 (4,8- 9,4) 7,0 (4,7- 9,3) Lower TSO 7,0 (4,8- 9,1) 6,8 (4,7- 8,9) 6,6 (4,5- 8,7) 6,0 (3,9- 8,0) 5,9 (3,8- 7,9) 5,2 (3,2- 7,1) Lower ASO 7,5 (5,3- 9,6) 7,2 (5,2- 9,3) 5,9 (4,1- 7,8) 5,1 (3,4- 6,8) 4,7 (3,1- 6,3) 4,6 (3,0- 6,2) Higher BSO 3,2 (1,0- 5,3) 3,2 (1,0- 5,3) 3,1 (0,9- 5,3) 3,1 (0,9- 5,3) 3,1 (0,9- 5,4) 3,1 (0,9- 5,4) Higher TSO 5,9 (4,2- 7,6) 5,9 (4,2- 7,7) 5,4 (3,7- 7,1) 5,2 (3,5- 6,9) 5,3 (3,5- 7,0) 4,7 (3,0- 6,3) Higher ASO 2,9 (1,6- 4,3) 3,0 (1,6- 4,3) 2,7 (1,4- 4,1) 2,7 (1,4- 4,1) 2,5 (1,2- 3,8) 2,3 (1,0- 3,5) Higher education of the short type 2,8 (1,5- 4,1) 2,7 (1,4- 4,1) 2,6 (1,3- 4,0) 2,4 (1,1- 3,7) 2,3 (1,0- 3,6) 1,9 (0,6- 3,1) Higher education of the long type 5,3 (4,0- 6,7) 5,4 (4,0- 6,7) 5,0 (3,7- 6,4) 4,6 (3,3- 5,9) 4,4 (3,2- 5,7) 4,1 (2,9- 5,4) Table 53 Partial life expectancy with m oderate limitations between ages 25 and 75 years according to education level Men, 55+, Belgium, 1991 -1996 / 1997 55 60 65 70 No diploma 6,2 (4,0- 8,5) 6,4 (4,1- 8,6) 2,7 (0,9- 4,6) 0,5 (0,0- 1,6) Enseignement inférieur 6,1 (5,1- 7,1) 4,1 (3,3- 4,9) 2,9 (2,3- 3,6) 2,3 (1,8- 2,7) Lower BSO 6,6 (4,4- 8,9) 6,4 (4,1- 8,6) 3,5 (1,6- 5,4) 1,9 (0,4- 3,3) Lower TSO 4,9 (3,0- 6,9) 3,5 (1,8- 5,2) 1,8 (0,4- 3,2) 0,4 (0,0- 1,2) Lower ASO 3,3 (2,0- 4,6) 3,1 (1,9- 4,4) 3,2 (1,9- 4,4) 1,1 (0,3- 1,9) Higher BSO 2,7 (0,6- 4,9) 2,6 (0,5- 4,7) 1,1 (0,0- 2,3) 0,0 - Higher TSO 4,6 (2,9- 6,3) 3,5 (1,9- 5,1) 2,5 (1,1- 3,9) 2,3 (0,9- 3,7) Higher ASO 2,1 (0,9- 3,4) 2,2 (0,9- 3,4) 1,4 (0,4- 2,4) 0,8 (0,0- 1,7) Higher educa tion of the short type 1,3 (0,2- 2,5) 1,1 (0,0- 2,2) 1,1 (0,0- 2,3) 0,9 (0,0- 1,7) Higher education of the long type 3,7 (2,5- 4,9) 3,4 (2,2- 4,5) 3,4 (2,2- 4,6) 1,3 (0,5- 2,2)
Table 54 Partial life expectancy wi th moderate limitations between ages 25 and 75 years en fonction du niveau relatif d’enseignement. Men, Belgium, 1991 -1996 / 1997 25 30 35 40 45 50 55 60 65 70 Lowest position 12,8 12,7 12,3 11,9 11,2 10,0 8,9 6,8 3,6 2,8 Lowest tertile 11,3 11,2 10,9 10,5 9,9 8,9 7,9 6,1 3,4 2,5 Middle tertile 8,2 8,2 7,8 7,5 7,1 6,4 5,8 4,6 3,0 1,9 Highest tertile 4,8 4,9 4,6 4,3 4,2 3,8 3,5 3,0 2,5 1,3 Highest position 3,1 3,2 2,9 2,7 2,7 2,5 2,4 2,2 2,2 1,0
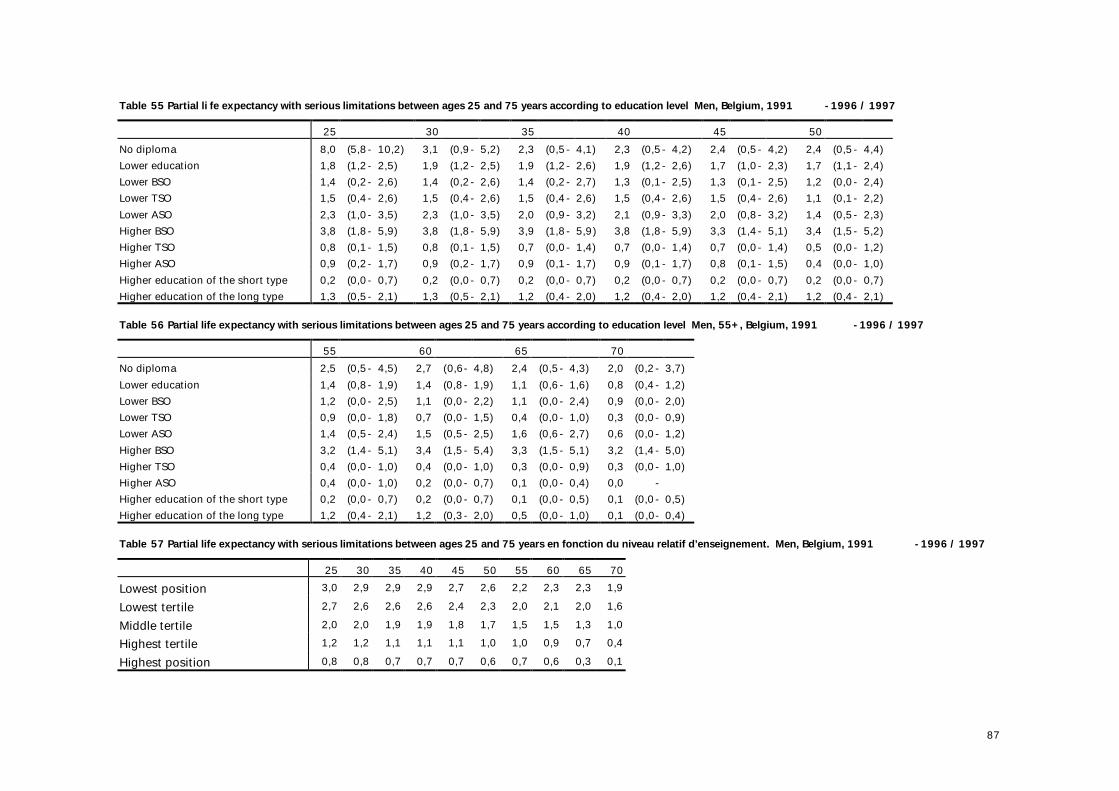
87
Table 55 Partial li fe expectancy with serious limitations between ages 25 and 75 years according to education level Men, Belgium, 1991 -1996 / 1997 25 30 35 40 45 50 No diploma 8,0 (5,8- 10,2) 3,1 (0,9- 5,2) 2,3 (0,5- 4,1) 2,3 (0,5- 4,2) 2,4 (0,5- 4,2) 2,4 (0,5- 4,4) Lower education 1,8 (1,2- 2,5) 1,9 (1,2- 2,5) 1,9 (1,2- 2,6) 1,9 (1,2- 2,6) 1,7 (1,0- 2,3) 1,7 (1,1- 2,4) Lower BSO 1,4 (0,2- 2,6) 1,4 (0,2- 2,6) 1,4 (0,2- 2,7) 1,3 (0,1- 2,5) 1,3 (0,1- 2,5) 1,2 (0,0- 2,4) Lower TSO 1,5 (0,4- 2,6) 1,5 (0,4- 2,6) 1,5 (0,4- 2,6) 1,5 (0,4- 2,6) 1,5 (0,4- 2,6) 1,1 (0,1- 2,2) Lower ASO 2,3 (1,0- 3,5) 2,3 (1,0- 3,5) 2,0 (0,9- 3,2) 2,1 (0,9- 3,3) 2,0 (0,8- 3,2) 1,4 (0,5- 2,3) Higher BSO 3,8 (1,8- 5,9) 3,8 (1,8- 5,9) 3,9 (1,8- 5,9) 3,8 (1,8- 5,9) 3,3 (1,4- 5,1) 3,4 (1,5- 5,2) Higher TSO 0,8 (0,1- 1,5) 0,8 (0,1- 1,5) 0,7 (0,0- 1,4) 0,7 (0,0- 1,4) 0,7 (0,0- 1,4) 0,5 (0,0- 1,2) Higher ASO 0,9 (0,2- 1,7) 0,9 (0,2- 1,7) 0,9 (0,1- 1,7) 0,9 (0,1- 1,7) 0,8 (0,1- 1,5) 0,4 (0,0- 1,0) Higher education of the short type 0,2 (0,0- 0,7) 0,2 (0,0- 0,7) 0,2 (0,0- 0,7) 0,2 (0,0- 0,7) 0,2 (0,0- 0,7) 0,2 (0,0- 0,7) Higher education of the long type 1,3 (0,5- 2,1) 1,3 (0,5- 2,1) 1,2 (0,4- 2,0) 1,2 (0,4- 2,0) 1,2 (0,4- 2,1) 1,2 (0,4- 2,1)
Table 56 Partial life expectancy with serious limitations between ages 25 and 75 years according to education level Men, 55+, Belgium, 1991 -1996 / 1997 55 60 65 70 No diploma 2,5 (0,5- 4,5) 2,7 (0,6- 4,8) 2,4 (0,5- 4,3) 2,0 (0,2- 3,7) Lower education 1,4 (0,8- 1,9) 1,4 (0,8- 1,9) 1,1 (0,6- 1,6) 0,8 (0,4- 1,2) Lower BSO 1,2 (0,0- 2,5) 1,1 (0,0- 2,2) 1,1 (0,0- 2,4) 0,9 (0,0- 2,0) Lower TSO 0,9 (0,0- 1,8) 0,7 (0,0- 1,5) 0,4 (0,0- 1,0) 0,3 (0,0- 0,9) Lower ASO 1,4 (0,5- 2,4) 1,5 (0,5- 2,5) 1,6 (0,6- 2,7) 0,6 (0,0- 1,2) Higher BSO 3,2 (1,4- 5,1) 3,4 (1,5- 5,4) 3,3 (1,5- 5,1) 3,2 (1,4- 5,0) Higher TSO 0,4 (0,0- 1,0) 0,4 (0,0- 1,0) 0,3 (0,0- 0,9) 0,3 (0,0- 1,0) Higher ASO 0,4 (0,0- 1,0) 0,2 (0,0- 0,7) 0,1 (0,0- 0,4) 0,0 - Higher education of the short type 0,2 (0,0- 0,7) 0,2 (0,0- 0,7) 0,1 (0,0- 0,5) 0,1 (0,0- 0,5) Higher education of the long type 1,2 (0,4- 2,1) 1,2 (0,3- 2,0) 0,5 (0,0- 1,0) 0,1 (0,0- 0,4)
Table 57 Partial life expectancy with serious limitations between ages 25 and 75 years en fonction du niveau relatif d’enseignement. Men, Belgium, 1991 -1996 / 1997 25 30 35 40 45 50 55 60 65 70 Lowest position 3,0 2,9 2,9 2,9 2,7 2,6 2,2 2,3 2,3 1,9 Lowest tertile 2,7 2,6 2,6 2,6 2,4 2,3 2,0 2,1 2,0 1,6 Middle tertile 2,0 2,0 1,9 1,9 1,8 1,7 1,5 1,5 1,3 1,0 Highest tertile 1,2 1,2 1,1 1,1 1,1 1,0 1,0 0,9 0,7 0,4 Highest position 0,8 0,8 0,7 0,7 0,7 0,6 0,7 0,6 0,3 0,1
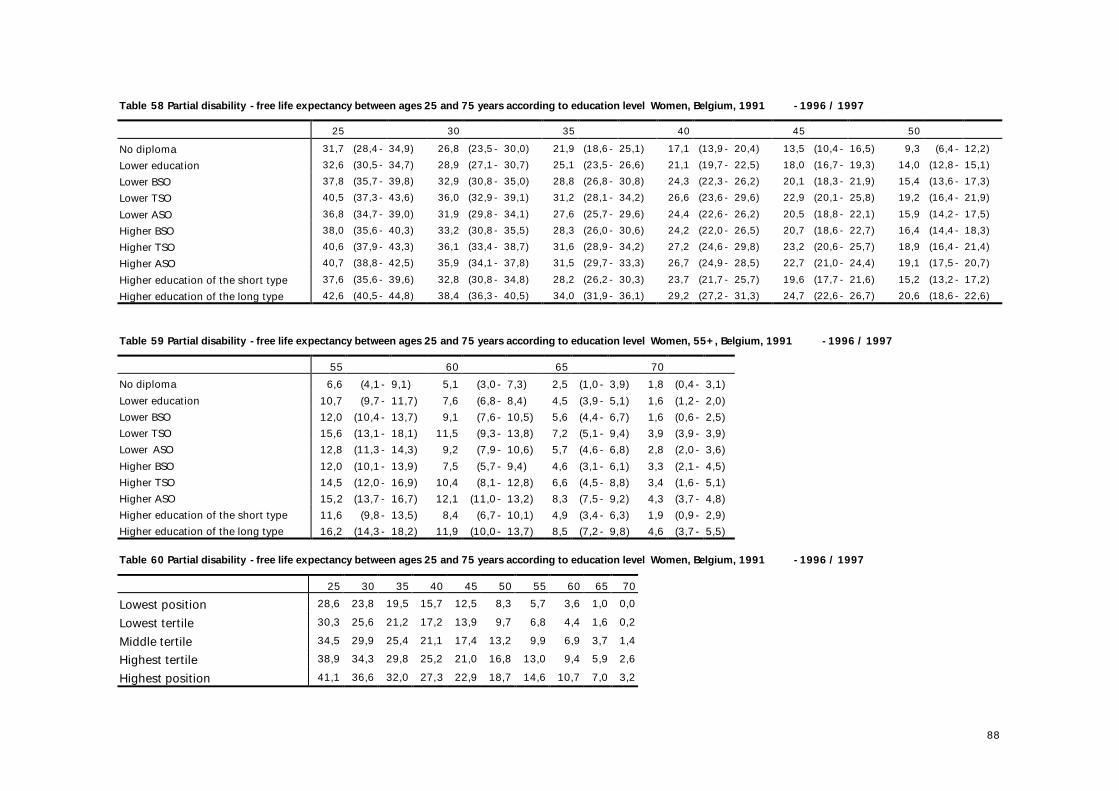
88
Table 58 Partial disability -free life expectancy between ages 25 and 75 years according to education level Women, Belgium, 1991 -1996 / 1997 25 30 35 40 45 50 No diploma 31,7 (28,4- 34,9) 26,8 (23,5- 30,0) 21,9 (18,6- 25,1) 17,1 (13,9- 20,4) 13,5 (10,4- 16,5) 9,3 (6,4- 12,2) Lower education 32,6 (30,5- 34,7) 28,9 (27,1- 30,7) 25,1 (23,5- 26,6) 21,1 (19,7- 22,5) 18,0 (16,7- 19,3) 14,0 (12,8- 15,1) Lower BSO 37,8 (35,7- 39,8) 32,9 (30,8- 35,0) 28,8 (26,8- 30,8) 24,3 (22,3- 26,2) 20,1 (18,3- 21,9) 15,4 (13,6- 17,3) Lower TSO 40,5 (37,3- 43,6) 36,0 (32,9- 39,1) 31,2 (28,1- 34,2) 26,6 (23,6- 29,6) 22,9 (20,1- 25,8) 19,2 (16,4- 21,9) Lower ASO 36,8 (34,7- 39,0) 31,9 (29,8- 34,1) 27,6 (25,7- 29,6) 24,4 (22,6- 26,2) 20,5 (18,8- 22,1) 15,9 (14,2- 17,5) Higher BSO 38,0 (35,6- 40,3) 33,2 (30,8- 35,5) 28,3 (26,0- 30,6) 24,2 (22,0- 26,5) 20,7 (18,6- 22,7) 16,4 (14,4- 18,3) Higher TSO 40,6 (37,9- 43,3) 36,1 (33,4- 38,7) 31,6 (28,9- 34,2) 27,2 (24,6- 29,8) 23,2 (20,6- 25,7) 18,9 (16,4- 21,4) Higher ASO 40,7 (38,8- 42,5) 35,9 (34,1- 37,8) 31,5 (29,7- 33,3) 26,7 (24,9- 28,5) 22,7 (21,0- 24,4) 19,1 (17,5- 20,7) Higher education of the short type 37,6 (35,6- 39,6) 32,8 (30,8- 34,8) 28,2 (26,2- 30,3) 23,7 (21,7- 25,7) 19,6 (17,7- 21,6) 15,2 (13,2- 17,2) Higher education of the long type 42,6 (40,5- 44,8) 38,4 (36,3- 40,5) 34,0 (31,9- 36,1) 29,2 (27,2- 31,3) 24,7 (22,6- 26,7) 20,6 (18,6- 22,6)
Table 59 Partial disability -free life expectancy between ages 25 and 75 years according to education level Women, 55+, Belgium, 1991 -1996 / 1997 55 60 65 70 No diploma 6,6 (4,1- 9,1) 5,1 (3,0- 7,3) 2,5 (1,0- 3,9) 1,8 (0,4- 3,1) Lower education 10,7 (9,7- 11,7) 7,6 (6,8- 8,4) 4,5 (3,9- 5,1) 1,6 (1,2- 2,0) Lower BSO 12,0 (10,4- 13,7) 9,1 (7,6- 10,5) 5,6 (4,4- 6,7) 1,6 (0,6- 2,5) Lower TSO 15,6 (13,1- 18,1) 11,5 (9,3- 13,8) 7,2 (5,1- 9,4) 3,9 (3,9- 3,9) Lower ASO 12,8 (11,3- 14,3) 9,2 (7,9- 10,6) 5,7 (4,6- 6,8) 2,8 (2,0- 3,6) Higher BSO 12,0 (10,1- 13,9) 7,5 (5,7- 9,4) 4,6 (3,1- 6,1) 3,3 (2,1- 4,5) Higher TSO 14,5 (12,0- 16,9) 10,4 (8,1- 12,8) 6,6 (4,5- 8,8) 3,4 (1,6- 5,1) Higher ASO 15,2 (13,7- 16,7) 12,1 (11,0- 13,2) 8,3 (7,5- 9,2) 4,3 (3,7- 4,8) Higher education of the short type 11,6 (9,8- 13,5) 8,4 (6,7- 10,1) 4,9 (3,4- 6,3) 1,9 (0,9- 2,9) Higher education of the long type 16,2 (14,3- 18,2) 11,9 (10,0- 13,7) 8,5 (7,2- 9,8) 4,6 (3,7- 5,5)
Table 60 Partial disability -free life expectancy between ages 25 and 75 years according to education level Women, Belgium, 1991 -1996 / 1997 25 30 35 40 45 50 55 60 65 70 Lowest position 28,6 23,8 19,5 15,7 12,5 8,3 5,7 3,6 1,0 0,0 Lowest tertile 30,3 25,6 21,2 17,2 13,9 9,7 6,8 4,4 1,6 0,2 Middle tertile 34,5 29,9 25,4 21,1 17,4 13,2 9,9 6,9 3,7 1,4 Highest tertile 38,9 34,3 29,8 25,2 21,0 16,8 13,0 9,4 5,9 2,6 Highest position 41,1 36,6 32,0 27,3 22,9 18,7 14,6 10,7 7,0 3,2
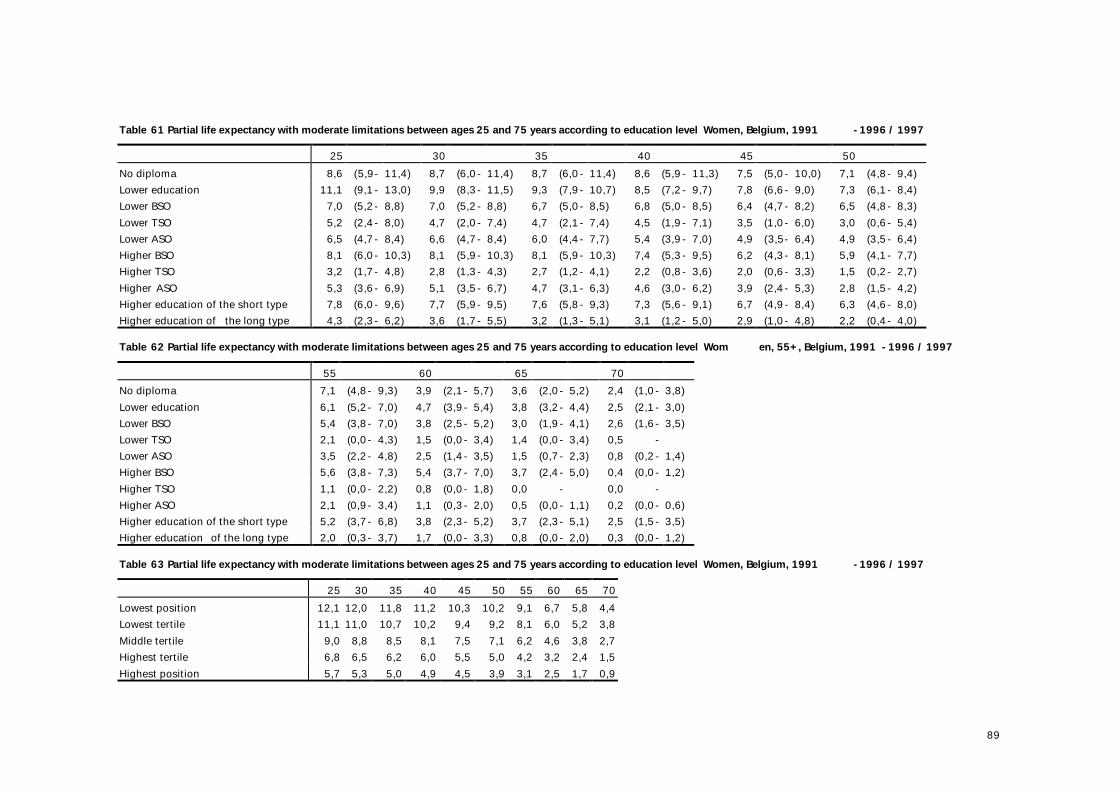
89
Table 61 Partial life expectancy with moderate limitations between ages 25 and 75 years according to education level Women, Belgium, 1991 -1996 / 1997 25 30 35 40 45 50 No diploma 8,6 (5,9- 11,4) 8,7 (6,0- 11,4) 8,7 (6,0- 11,4) 8,6 (5,9- 11,3) 7,5 (5,0- 10,0) 7,1 (4,8- 9,4) Lower education 11,1 (9,1- 13,0) 9,9 (8,3- 11,5) 9,3 (7,9- 10,7) 8,5 (7,2- 9,7) 7,8 (6,6- 9,0) 7,3 (6,1- 8,4) Lower BSO 7,0 (5,2- 8,8) 7,0 (5,2- 8,8) 6,7 (5,0- 8,5) 6,8 (5,0- 8,5) 6,4 (4,7- 8,2) 6,5 (4,8- 8,3) Lower TSO 5,2 (2,4- 8,0) 4,7 (2,0- 7,4) 4,7 (2,1- 7,4) 4,5 (1,9- 7,1) 3,5 (1,0- 6,0) 3,0 (0,6- 5,4) Lower ASO 6,5 (4,7- 8,4) 6,6 (4,7- 8,4) 6,0 (4,4- 7,7) 5,4 (3,9- 7,0) 4,9 (3,5- 6,4) 4,9 (3,5- 6,4) Higher BSO 8,1 (6,0- 10,3) 8,1 (5,9- 10,3) 8,1 (5,9- 10,3) 7,4 (5,3- 9,5) 6,2 (4,3- 8,1) 5,9 (4,1- 7,7) Higher TSO 3,2 (1,7- 4,8) 2,8 (1,3- 4,3) 2,7 (1,2- 4,1) 2,2 (0,8- 3,6) 2,0 (0,6- 3,3) 1,5 (0,2- 2,7) Higher ASO 5,3 (3,6- 6,9) 5,1 (3,5- 6,7) 4,7 (3,1- 6,3) 4,6 (3,0- 6,2) 3,9 (2,4- 5,3) 2,8 (1,5- 4,2) Higher education of the short type 7,8 (6,0- 9,6) 7,7 (5,9- 9,5) 7,6 (5,8- 9,3) 7,3 (5,6- 9,1) 6,7 (4,9- 8,4) 6,3 (4,6- 8,0) Higher education of the long type 4,3 (2,3- 6,2) 3,6 (1,7- 5,5) 3,2 (1,3- 5,1) 3,1 (1,2- 5,0) 2,9 (1,0- 4,8) 2,2 (0,4- 4,0) Table 62 Partial life expectancy with moderate limitations between ages 25 and 75 years according to education level Wom en, 55+, Belgium, 1991 -1996 / 1997 55 60 65 70 No diploma 7,1 (4,8- 9,3) 3,9 (2,1- 5,7) 3,6 (2,0- 5,2) 2,4 (1,0- 3,8) Lower education 6,1 (5,2- 7,0) 4,7 (3,9- 5,4) 3,8 (3,2- 4,4) 2,5 (2,1- 3,0) Lower BSO 5,4 (3,8- 7,0) 3,8 (2,5- 5,2) 3,0 (1,9- 4,1) 2,6 (1,6- 3,5) Lower TSO 2,1 (0,0- 4,3) 1,5 (0,0- 3,4) 1,4 (0,0- 3,4) 0,5 - Lower ASO 3,5 (2,2- 4,8) 2,5 (1,4- 3,5) 1,5 (0,7- 2,3) 0,8 (0,2- 1,4) Higher BSO 5,6 (3,8- 7,3) 5,4 (3,7- 7,0) 3,7 (2,4- 5,0) 0,4 (0,0- 1,2) Higher TSO 1,1 (0,0- 2,2) 0,8 (0,0- 1,8) 0,0 - 0,0 - Higher ASO 2,1 (0,9- 3,4) 1,1 (0,3- 2,0) 0,5 (0,0- 1,1) 0,2 (0,0- 0,6) Higher education of the short type 5,2 (3,7- 6,8) 3,8 (2,3- 5,2) 3,7 (2,3- 5,1) 2,5 (1,5- 3,5) Higher education of the long type 2,0 (0,3- 3,7) 1,7 (0,0- 3,3) 0,8 (0,0- 2,0) 0,3 (0,0- 1,2) Table 63 Partial life expectancy with moderate limitations between ages 25 and 75 years according to education level Women, Belgium, 1991 -1996 / 1997 25 30 35 40 45 50 55 60 65 70 Lowest position 12,1 12,0 11,8 11,2 10,3 10,2 9,1 6,7 5,8 4,4 Lowest tertile 11,1 11,0 10,7 10,2 9,4 9,2 8,1 6,0 5,2 3,8 Middle tertile 9,0 8,8 8,5 8,1 7,5 7,1 6,2 4,6 3,8 2,7 Highest tertile 6,8 6,5 6,2 6,0 5,5 5,0 4,2 3,2 2,4 1,5 Highest position 5,7 5,3 5,0 4,9 4,5 3,9 3,1 2,5 1,7 0,9
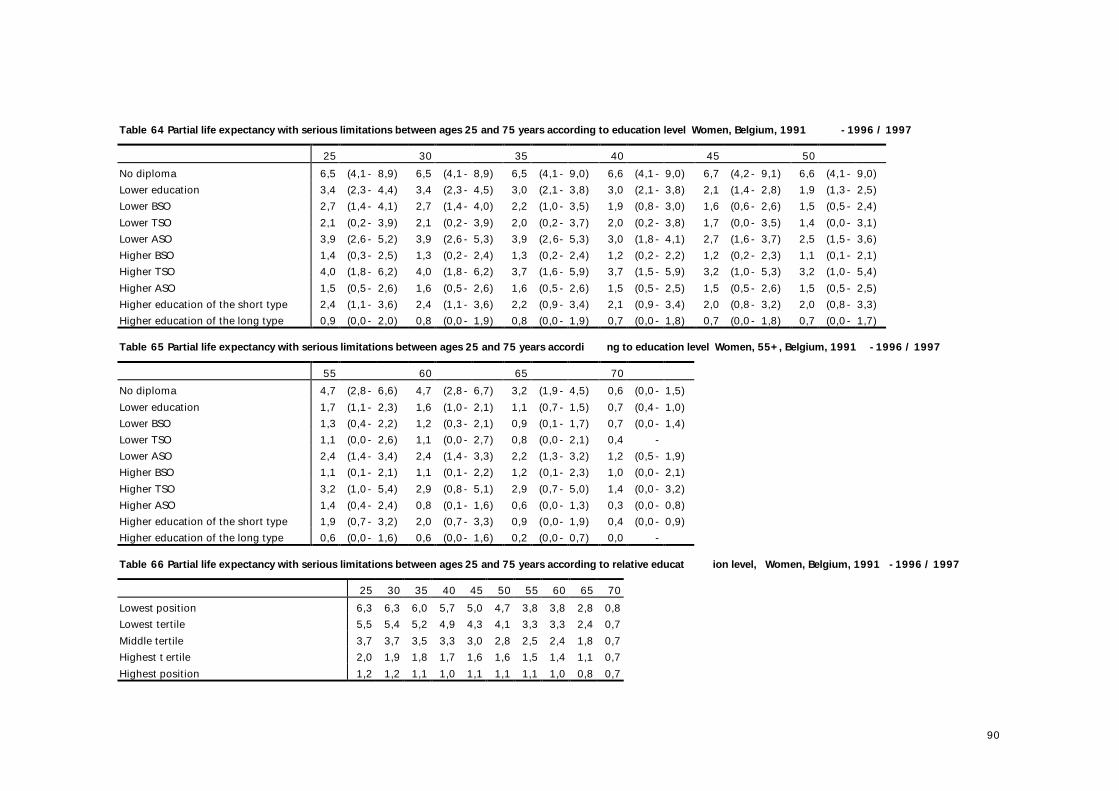
90
Table 64 Partial life expectancy with serious limitations between ages 25 and 75 years according to education level Women, Belgium, 1991 -1996 / 1997 25 30 35 40 45 50 No diploma 6,5 (4,1- 8,9) 6,5 (4,1- 8,9) 6,5 (4,1- 9,0) 6,6 (4,1- 9,0) 6,7 (4,2- 9,1) 6,6 (4,1- 9,0) Lower education 3,4 (2,3- 4,4) 3,4 (2,3- 4,5) 3,0 (2,1- 3,8) 3,0 (2,1- 3,8) 2,1 (1,4- 2,8) 1,9 (1,3- 2,5) Lower BSO 2,7 (1,4- 4,1) 2,7 (1,4- 4,0) 2,2 (1,0- 3,5) 1,9 (0,8- 3,0) 1,6 (0,6- 2,6) 1,5 (0,5- 2,4) Lower TSO 2,1 (0,2- 3,9) 2,1 (0,2- 3,9) 2,0 (0,2- 3,7) 2,0 (0,2- 3,8) 1,7 (0,0- 3,5) 1,4 (0,0- 3,1) Lower ASO 3,9 (2,6- 5,2) 3,9 (2,6- 5,3) 3,9 (2,6- 5,3) 3,0 (1,8- 4,1) 2,7 (1,6- 3,7) 2,5 (1,5- 3,6) Higher BSO 1,4 (0,3- 2,5) 1,3 (0,2- 2,4) 1,3 (0,2- 2,4) 1,2 (0,2- 2,2) 1,2 (0,2- 2,3) 1,1 (0,1- 2,1) Higher TSO 4,0 (1,8- 6,2) 4,0 (1,8- 6,2) 3,7 (1,6- 5,9) 3,7 (1,5- 5,9) 3,2 (1,0- 5,3) 3,2 (1,0- 5,4) Higher ASO 1,5 (0,5- 2,6) 1,6 (0,5- 2,6) 1,6 (0,5- 2,6) 1,5 (0,5- 2,5) 1,5 (0,5- 2,6) 1,5 (0,5- 2,5) Higher education of the short type 2,4 (1,1- 3,6) 2,4 (1,1- 3,6) 2,2 (0,9- 3,4) 2,1 (0,9- 3,4) 2,0 (0,8- 3,2) 2,0 (0,8- 3,3) Higher education of the long type 0,9 (0,0- 2,0) 0,8 (0,0- 1,9) 0,8 (0,0- 1,9) 0,7 (0,0- 1,8) 0,7 (0,0- 1,8) 0,7 (0,0- 1,7) Table 65 Partial life expectancy with serious limitations between ages 25 and 75 years accordi ng to education level Women, 55+, Belgium, 1991 -1996 / 1997 55 60 65 70 No diploma 4,7 (2,8- 6,6) 4,7 (2,8- 6,7) 3,2 (1,9- 4,5) 0,6 (0,0- 1,5) Lower education 1,7 (1,1- 2,3) 1,6 (1,0- 2,1) 1,1 (0,7- 1,5) 0,7 (0,4- 1,0) Lower BSO 1,3 (0,4- 2,2) 1,2 (0,3- 2,1) 0,9 (0,1- 1,7) 0,7 (0,0- 1,4) Lower TSO 1,1 (0,0- 2,6) 1,1 (0,0- 2,7) 0,8 (0,0- 2,1) 0,4 - Lower ASO 2,4 (1,4- 3,4) 2,4 (1,4- 3,3) 2,2 (1,3- 3,2) 1,2 (0,5- 1,9) Higher BSO 1,1 (0,1- 2,1) 1,1 (0,1- 2,2) 1,2 (0,1- 2,3) 1,0 (0,0- 2,1) Higher TSO 3,2 (1,0- 5,4) 2,9 (0,8- 5,1) 2,9 (0,7- 5,0) 1,4 (0,0- 3,2) Higher ASO 1,4 (0,4- 2,4) 0,8 (0,1- 1,6) 0,6 (0,0- 1,3) 0,3 (0,0- 0,8) Higher education of the short type 1,9 (0,7- 3,2) 2,0 (0,7- 3,3) 0,9 (0,0- 1,9) 0,4 (0,0- 0,9) Higher education of the long type 0,6 (0,0- 1,6) 0,6 (0,0- 1,6) 0,2 (0,0- 0,7) 0,0 - Table 66 Partial life expectancy with serious limitations between ages 25 and 75 years according to relative educat ion level, Women, Belgium, 1991 -1996 / 1997 25 30 35 40 45 50 55 60 65 70 Lowest position 6,3 6,3 6,0 5,7 5,0 4,7 3,8 3,8 2,8 0,8 Lowest tertile 5,5 5,4 5,2 4,9 4,3 4,1 3,3 3,3 2,4 0,7 Middle tertile 3,7 3,7 3,5 3,3 3,0 2,8 2,5 2,4 1,8 0,7 Highest t ertile 2,0 1,9 1,8 1,7 1,6 1,6 1,5 1,4 1,1 0,7 Highest position 1,2 1,2 1,1 1,0 1,1 1,1 1,1 1,0 0,8 0,7
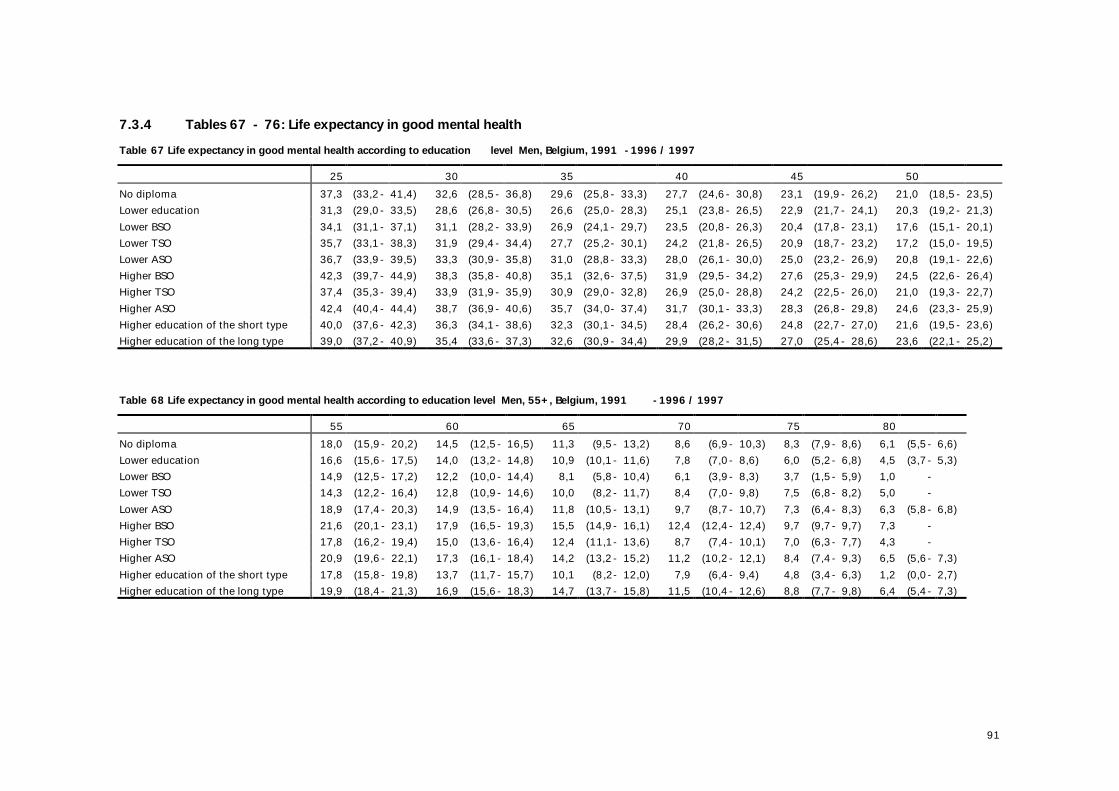
91
7.3.4 Tables 67 - 76: Life expectancy in good mental health Table 67 Life expectancy in good mental health according to education level Men, Belgium, 1991 -1996 / 1997 25 30 35 40 45 50 No diploma 37,3 (33,2- 41,4) 32,6 (28,5- 36,8) 29,6 (25,8- 33,3) 27,7 (24,6- 30,8) 23,1 (19,9- 26,2) 21,0 (18,5- 23,5) Lower education 31,3 (29,0- 33,5) 28,6 (26,8- 30,5) 26,6 (25,0- 28,3) 25,1 (23,8- 26,5) 22,9 (21,7- 24,1) 20,3 (19,2- 21,3) Lower BSO 34,1 (31,1- 37,1) 31,1 (28,2- 33,9) 26,9 (24,1- 29,7) 23,5 (20,8- 26,3) 20,4 (17,8- 23,1) 17,6 (15,1- 20,1) Lower TSO 35,7 (33,1- 38,3) 31,9 (29,4- 34,4) 27,7 (25,2- 30,1) 24,2 (21,8- 26,5) 20,9 (18,7- 23,2) 17,2 (15,0- 19,5) Lower ASO 36,7 (33,9- 39,5) 33,3 (30,9- 35,8) 31,0 (28,8- 33,3) 28,0 (26,1- 30,0) 25,0 (23,2- 26,9) 20,8 (19,1- 22,6) Higher BSO 42,3 (39,7- 44,9) 38,3 (35,8- 40,8) 35,1 (32,6- 37,5) 31,9 (29,5- 34,2) 27,6 (25,3- 29,9) 24,5 (22,6- 26,4) Higher TSO 37,4 (35,3- 39,4) 33,9 (31,9- 35,9) 30,9 (29,0- 32,8) 26,9 (25,0- 28,8) 24,2 (22,5- 26,0) 21,0 (19,3- 22,7) Higher ASO 42,4 (40,4- 44,4) 38,7 (36,9- 40,6) 35,7 (34,0- 37,4) 31,7 (30,1- 33,3) 28,3 (26,8- 29,8) 24,6 (23,3- 25,9) Higher education of the short type 40,0 (37,6- 42,3) 36,3 (34,1- 38,6) 32,3 (30,1- 34,5) 28,4 (26,2- 30,6) 24,8 (22,7- 27,0) 21,6 (19,5- 23,6) Higher education of the long type 39,0 (37,2- 40,9) 35,4 (33,6- 37,3) 32,6 (30,9- 34,4) 29,9 (28,2- 31,5) 27,0 (25,4- 28,6) 23,6 (22,1- 25,2) Table 68 Life expectancy in good mental health according to education level Men, 55+, Belgium, 1991 -1996 / 1997 55 60 65 70 75 80 No diploma 18,0 (15,9- 20,2) 14,5 (12,5- 16,5) 11,3 (9,5- 13,2) 8,6 (6,9- 10,3) 8,3 (7,9- 8,6) 6,1 (5,5- 6,6) Lower education 16,6 (15,6- 17,5) 14,0 (13,2- 14,8) 10,9 (10,1- 11,6) 7,8 (7,0- 8,6) 6,0 (5,2- 6,8) 4,5 (3,7- 5,3) Lower BSO 14,9 (12,5- 17,2) 12,2 (10,0- 14,4) 8,1 (5,8- 10,4) 6,1 (3,9- 8,3) 3,7 (1,5- 5,9) 1,0 - Lower TSO 14,3 (12,2- 16,4) 12,8 (10,9- 14,6) 10,0 (8,2- 11,7) 8,4 (7,0- 9,8) 7,5 (6,8- 8,2) 5,0 - Lower ASO 18,9 (17,4- 20,3) 14,9 (13,5- 16,4) 11,8 (10,5- 13,1) 9,7 (8,7- 10,7) 7,3 (6,4- 8,3) 6,3 (5,8- 6,8) Higher BSO 21,6 (20,1- 23,1) 17,9 (16,5- 19,3) 15,5 (14,9- 16,1) 12,4 (12,4- 12,4) 9,7 (9,7- 9,7) 7,3 - Higher TSO 17,8 (16,2- 19,4) 15,0 (13,6- 16,4) 12,4 (11,1- 13,6) 8,7 (7,4- 10,1) 7,0 (6,3- 7,7) 4,3 - Higher ASO 20,9 (19,6- 22,1) 17,3 (16,1- 18,4) 14,2 (13,2- 15,2) 11,2 (10,2- 12,1) 8,4 (7,4- 9,3) 6,5 (5,6- 7,3) Higher education of the short type 17,8 (15,8- 19,8) 13,7 (11,7- 15,7) 10,1 (8,2- 12,0) 7,9 (6,4- 9,4) 4,8 (3,4- 6,3) 1,2 (0,0- 2,7) Higher education of the long type 19,9 (18,4- 21,3) 16,9 (15,6- 18,3) 14,7 (13,7- 15,8) 11,5 (10,4- 12,6) 8,8 (7,7- 9,8) 6,4 (5,4- 7,3)

92
Table 69 Life expectancy in good mental health according to education level Women, Belgium, 1991 -1996 / 1997 25 30 35 40 45 50 No diploma 36,4 (32,3- 40,5) 31,5 (27,5- 35,5) 26,6 (22,5- 30,7) 23,2 (19,4- 27,0) 19,3 (15,7- 22,9) 17,6 (14,4- 20,8) Lower education 32,0 (29,5- 34,4) 29,2 (27,1- 31,3) 27,2 (25,4- 28,9) 25,5 (24,0- 27,1) 23,3 (21,8- 24,7) 20,2 (18,8- 21,5) Lower BSO 38,6 (35,9- 41,3) 36,0 (33,4- 38,6) 33,5 (31,1- 36,0) 31,1 (28,8- 33,4) 28,3 (26,2- 30,4) 24,4 (22,4- 26,5) Lower TSO 29,7 (26,4- 32,9) 28,9 (25,8- 32,0) 26,1 (23,3- 28,9) 24,7 (22,1- 27,2) 21,0 (18,5- 23,4) 17,0 (14,7- 19,2) Lower ASO 37,7 (34,7- 40,7) 35,2 (32,6- 37,9) 32,5 (30,1- 34,8) 29,4 (27,2- 31,6) 26,3 (24,2- 28,3) 22,4 (20,5- 24,3) Higher BSO 40,2 (37,2- 43,1) 36,8 (33,9- 39,7) 33,5 (30,7- 36,3) 29,4 (26,7- 32,1) 26,3 (23,8- 28,9) 24,6 (22,2- 27,0) Higher TSO 43,4 (40,6- 46,1) 40,2 (37,5- 42,8) 36,8 (34,2- 39,3) 33,5 (31,1- 36,0) 30,4 (28,1- 32,8) 27,9 (25,7- 30,1) Higher ASO 39,9 (37,3- 42,5) 36,1 (33,6- 38,6) 32,2 (29,7- 34,6) 29,6 (27,2- 32,1) 26,4 (24,1- 28,8) 23,5 (21,3- 25,8) Higher education of the short type 41,1 (38,6- 43,6) 37,5 (35,0- 39,9) 34,0 (31,6- 36,5) 30,7 (28,3- 33,1) 28,1 (25,7- 30,4) 24,7 (22,4- 27,0) Higher education of the long type 39,1 (36,0- 42,3) 36,5 (33,4- 39,6) 33,1 (30,0- 36,2) 29,5 (26,5- 32,5) 26,7 (23,7- 29,6) 23,7 (20,8- 26,5) Table 70 Life expectancy in good mental health according to education level Women, 55+, Belgium, 1991 -1996 / 1997 55 60 65 70 75 80 No diploma 14,2 (11,4- 17,0) 13,5 (11,0- 16,0) 10,0 (7,9- 12,1) 8,6 (6,6- 10,6) 8,1 (6,4- 9,8) 4,4 (2,2- 6,6) Lower education 17,4 (16,3- 18,5) 14,5 (13,4- 15,5) 11,2 (10,3- 12,2) 8,9 (8,1- 9,8) 6,3 (5,5- 7,2) 4,6 (3,8- 5,3) Lower BSO 21,6 (19,7- 23,5) 17,4 (15,5- 19,2) 14,3 (12,7- 16,0) 10,5 (8,8- 12,2) 8,1 (6,6- 9,6) 5,6 (4,4- 6,8) Lower TSO 13,7 (11,8- 15,6) 10,7 (9,2- 12,1) 6,5 (5,3- 7,7) 6,5 (6,5- 6,5) 5,2 (2,8- 7,7) 5,1 (3,6- 6,7) Lower ASO 19,1 (17,2- 20,9) 16,7 (15,0- 18,4) 14,1 (12,6- 15,6) 12,1 (10,7- 13,5) 9,6 (8,3- 10,9) 8,3 (7,4- 9,2) Higher BSO 20,7 (18,4- 23,0) 17,0 (14,9- 19,1) 13,8 (11,9- 15,8) 12,0 (10,3- 13,7) 9,6 (8,3- 10,9) 7,7 - Higher TSO 26,0 (24,0- 28,0) 22,7 (20,9- 24,4) 19,3 (17,8- 20,8) 15,7 (14,4- 17,0) 11,9 (10,5- 13,3) 9,1 (9,1- 9,1) Higher ASO 20,8 (18,7- 22,9) 16,7 (14,6- 18,7) 14,2 (12,3- 16,2) 11,7 (9,9- 13,6) 9,3 (7,5- 11,0) 6,9 (5,5- 8,4) Higher education of the short type 21,6 (19,4- 23,8) 18,0 (15,9- 20,2) 15,1 (13,1- 17,2) 12,0 (10,1- 13,9) 10,2 (8,4- 11,9) 7,7 (6,0- 9,4) Higher education of the long type 20,5 (17,8- 23,2) 19,9 (17,4- 22,5) 16,6 (14,2- 19,0) 13,7 (11,6- 15,9) 12,5 (11,4- 13,6) 9,5 -
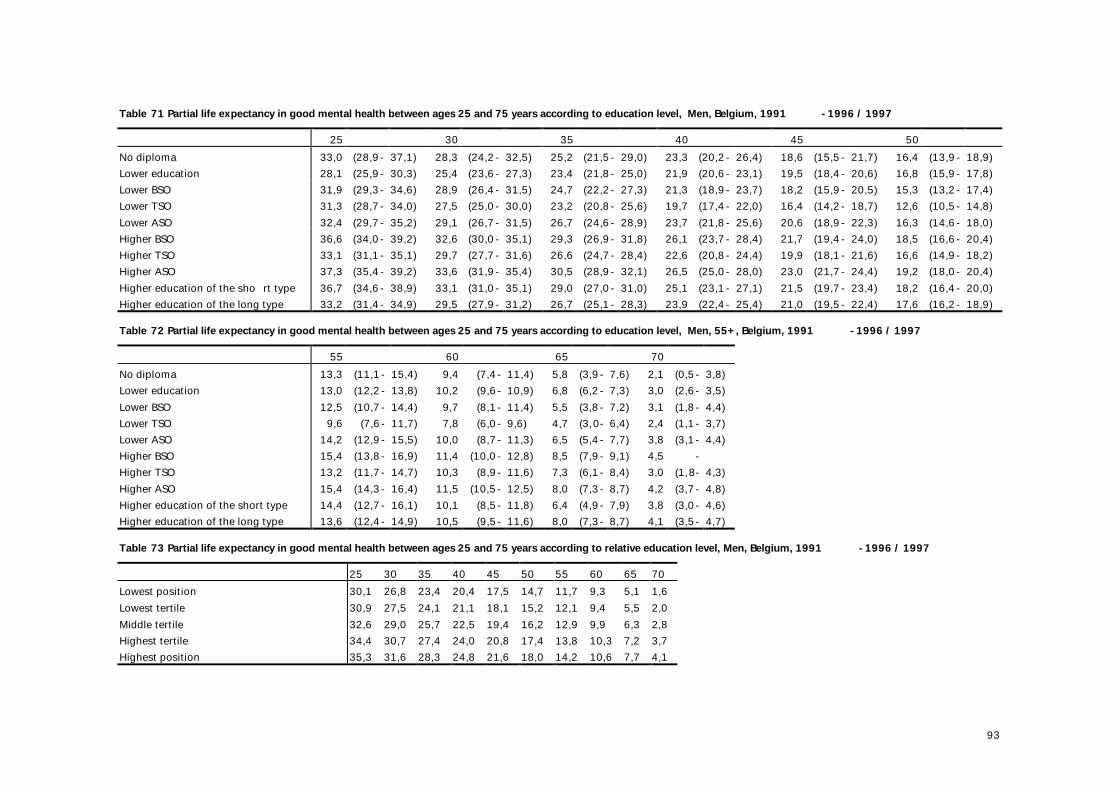
93
Table 71 Partial life expectancy in good mental health between ages 25 and 75 years according to education level, Men, Belgium, 1991 -1996 / 1997 25 30 35 40 45 50 No diploma 33,0 (28,9- 37,1) 28,3 (24,2- 32,5) 25,2 (21,5- 29,0) 23,3 (20,2- 26,4) 18,6 (15,5- 21,7) 16,4 (13,9- 18,9) Lower education 28,1 (25,9- 30,3) 25,4 (23,6- 27,3) 23,4 (21,8- 25,0) 21,9 (20,6- 23,1) 19,5 (18,4- 20,6) 16,8 (15,9- 17,8) Lower BSO 31,9 (29,3- 34,6) 28,9 (26,4- 31,5) 24,7 (22,2- 27,3) 21,3 (18,9- 23,7) 18,2 (15,9- 20,5) 15,3 (13,2- 17,4) Lower TSO 31,3 (28,7- 34,0) 27,5 (25,0- 30,0) 23,2 (20,8- 25,6) 19,7 (17,4- 22,0) 16,4 (14,2- 18,7) 12,6 (10,5- 14,8) Lower ASO 32,4 (29,7- 35,2) 29,1 (26,7- 31,5) 26,7 (24,6- 28,9) 23,7 (21,8- 25,6) 20,6 (18,9- 22,3) 16,3 (14,6- 18,0) Higher BSO 36,6 (34,0- 39,2) 32,6 (30,0- 35,1) 29,3 (26,9- 31,8) 26,1 (23,7- 28,4) 21,7 (19,4- 24,0) 18,5 (16,6- 20,4) Higher TSO 33,1 (31,1- 35,1) 29,7 (27,7- 31,6) 26,6 (24,7- 28,4) 22,6 (20,8- 24,4) 19,9 (18,1- 21,6) 16,6 (14,9- 18,2) Higher ASO 37,3 (35,4- 39,2) 33,6 (31,9- 35,4) 30,5 (28,9- 32,1) 26,5 (25,0- 28,0) 23,0 (21,7- 24,4) 19,2 (18,0- 20,4) Higher education of the sho rt type 36,7 (34,6- 38,9) 33,1 (31,0- 35,1) 29,0 (27,0- 31,0) 25,1 (23,1- 27,1) 21,5 (19,7- 23,4) 18,2 (16,4- 20,0) Higher education of the long type 33,2 (31,4- 34,9) 29,5 (27,9- 31,2) 26,7 (25,1- 28,3) 23,9 (22,4- 25,4) 21,0 (19,5- 22,4) 17,6 (16,2- 18,9) Table 72 Partial life expectancy in good mental health between ages 25 and 75 years according to education level, Men, 55+, Belgium, 1991 -1996 / 1997 55 60 65 70 No diploma 13,3 (11,1- 15,4) 9,4 (7,4- 11,4) 5,8 (3,9- 7,6) 2,1 (0,5- 3,8) Lower education 13,0 (12,2- 13,8) 10,2 (9,6- 10,9) 6,8 (6,2- 7,3) 3,0 (2,6- 3,5) Lower BSO 12,5 (10,7- 14,4) 9,7 (8,1- 11,4) 5,5 (3,8- 7,2) 3,1 (1,8- 4,4) Lower TSO 9,6 (7,6- 11,7) 7,8 (6,0- 9,6) 4,7 (3,0- 6,4) 2,4 (1,1- 3,7) Lower ASO 14,2 (12,9- 15,5) 10,0 (8,7- 11,3) 6,5 (5,4- 7,7) 3,8 (3,1- 4,4) Higher BSO 15,4 (13,8- 16,9) 11,4 (10,0- 12,8) 8,5 (7,9- 9,1) 4,5 - Higher TSO 13,2 (11,7- 14,7) 10,3 (8,9- 11,6) 7,3 (6,1- 8,4) 3,0 (1,8- 4,3) Higher ASO 15,4 (14,3- 16,4) 11,5 (10,5- 12,5) 8,0 (7,3- 8,7) 4,2 (3,7- 4,8) Higher education of the short type 14,4 (12,7- 16,1) 10,1 (8,5- 11,8) 6,4 (4,9- 7,9) 3,8 (3,0- 4,6) Higher education of the long type 13,6 (12,4- 14,9) 10,5 (9,5- 11,6) 8,0 (7,3- 8,7) 4,1 (3,5- 4,7) Table 73 Partial life expectancy in good mental health between ages 25 and 75 years according to relative education level, Men, Belgium, 1991 -1996 / 1997 25 30 35 40 45 50 55 60 65 70 Lowest position 30,1 26,8 23,4 20,4 17,5 14,7 11,7 9,3 5,1 1,6 Lowest tertile 30,9 27,5 24,1 21,1 18,1 15,2 12,1 9,4 5,5 2,0 Middle tertile 32,6 29,0 25,7 22,5 19,4 16,2 12,9 9,9 6,3 2,8 Highest tertile 34,4 30,7 27,4 24,0 20,8 17,4 13,8 10,3 7,2 3,7 Highest position 35,3 31,6 28,3 24,8 21,6 18,0 14,2 10,6 7,7 4,1
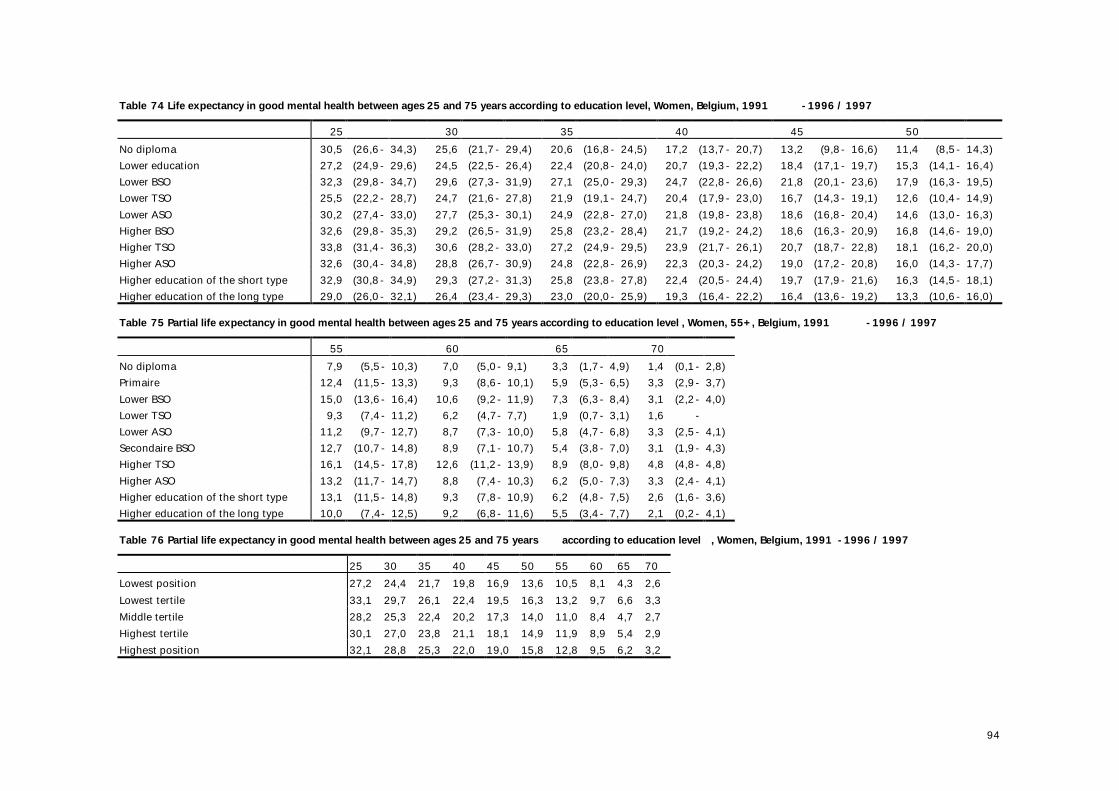
94
Table 74 Life expectancy in good mental health between ages 25 and 75 years according to education level, Women, Belgium, 1991 -1996 / 1997 25 30 35 40 45 50 No diploma 30,5 (26,6- 34,3) 25,6 (21,7- 29,4) 20,6 (16,8- 24,5) 17,2 (13,7- 20,7) 13,2 (9,8- 16,6) 11,4 (8,5- 14,3) Lower education 27,2 (24,9- 29,6) 24,5 (22,5- 26,4) 22,4 (20,8- 24,0) 20,7 (19,3- 22,2) 18,4 (17,1- 19,7) 15,3 (14,1- 16,4) Lower BSO 32,3 (29,8- 34,7) 29,6 (27,3- 31,9) 27,1 (25,0- 29,3) 24,7 (22,8- 26,6) 21,8 (20,1- 23,6) 17,9 (16,3- 19,5) Lower TSO 25,5 (22,2- 28,7) 24,7 (21,6- 27,8) 21,9 (19,1- 24,7) 20,4 (17,9- 23,0) 16,7 (14,3- 19,1) 12,6 (10,4- 14,9) Lower ASO 30,2 (27,4- 33,0) 27,7 (25,3- 30,1) 24,9 (22,8- 27,0) 21,8 (19,8- 23,8) 18,6 (16,8- 20,4) 14,6 (13,0- 16,3) Higher BSO 32,6 (29,8- 35,3) 29,2 (26,5- 31,9) 25,8 (23,2- 28,4) 21,7 (19,2- 24,2) 18,6 (16,3- 20,9) 16,8 (14,6- 19,0) Higher TSO 33,8 (31,4- 36,3) 30,6 (28,2- 33,0) 27,2 (24,9- 29,5) 23,9 (21,7- 26,1) 20,7 (18,7- 22,8) 18,1 (16,2- 20,0) Higher ASO 32,6 (30,4- 34,8) 28,8 (26,7- 30,9) 24,8 (22,8- 26,9) 22,3 (20,3- 24,2) 19,0 (17,2- 20,8) 16,0 (14,3- 17,7) Higher education of the short type 32,9 (30,8- 34,9) 29,3 (27,2- 31,3) 25,8 (23,8- 27,8) 22,4 (20,5- 24,4) 19,7 (17,9- 21,6) 16,3 (14,5- 18,1) Higher education of the long type 29,0 (26,0- 32,1) 26,4 (23,4- 29,3) 23,0 (20,0- 25,9) 19,3 (16,4- 22,2) 16,4 (13,6- 19,2) 13,3 (10,6- 16,0) Table 75 Partial life expectancy in good mental health between ages 25 and 75 years according to education level , Women, 55+, Belgium, 1991 -1996 / 1997 55 60 65 70 No diploma 7,9 (5,5- 10,3) 7,0 (5,0- 9,1) 3,3 (1,7- 4,9) 1,4 (0,1- 2,8) Primaire 12,4 (11,5- 13,3) 9,3 (8,6- 10,1) 5,9 (5,3- 6,5) 3,3 (2,9- 3,7) Lower BSO 15,0 (13,6- 16,4) 10,6 (9,2- 11,9) 7,3 (6,3- 8,4) 3,1 (2,2- 4,0) Lower TSO 9,3 (7,4- 11,2) 6,2 (4,7- 7,7) 1,9 (0,7- 3,1) 1,6 - Lower ASO 11,2 (9,7- 12,7) 8,7 (7,3- 10,0) 5,8 (4,7- 6,8) 3,3 (2,5- 4,1) Secondaire BSO 12,7 (10,7- 14,8) 8,9 (7,1- 10,7) 5,4 (3,8- 7,0) 3,1 (1,9- 4,3) Higher TSO 16,1 (14,5- 17,8) 12,6 (11,2- 13,9) 8,9 (8,0- 9,8) 4,8 (4,8- 4,8) Higher ASO 13,2 (11,7- 14,7) 8,8 (7,4- 10,3) 6,2 (5,0- 7,3) 3,3 (2,4- 4,1) Higher education of the short type 13,1 (11,5- 14,8) 9,3 (7,8- 10,9) 6,2 (4,8- 7,5) 2,6 (1,6- 3,6) Higher education of the long type 10,0 (7,4- 12,5) 9,2 (6,8- 11,6) 5,5 (3,4- 7,7) 2,1 (0,2- 4,1) Table 76 Partial life expectancy in good mental health between ages 25 and 75 years according to education level , Women, Belgium, 1991 -1996 / 1997 25 30 35 40 45 50 55 60 65 70 Lowest position 27,2 24,4 21,7 19,8 16,9 13,6 10,5 8,1 4,3 2,6 Lowest tertile 33,1 29,7 26,1 22,4 19,5 16,3 13,2 9,7 6,6 3,3 Middle tertile 28,2 25,3 22,4 20,2 17,3 14,0 11,0 8,4 4,7 2,7 Highest tertile 30,1 27,0 23,8 21,1 18,1 14,9 11,9 8,9 5,4 2,9 Highest position 32,1 28,8 25,3 22,0 19,0 15,8 12,8 9,5 6,2 3,2