life expectancy after catastrophic injury - · pdf filelife expectancy after catastrophic...
TRANSCRIPT
1
1
AAIM 123rd Annual Meeting
Philadelphia, PA
September 30, 2014
Life Expectancy After Catastrophic Injury
Robert Shavelle, PhD, FAACPDM
Life Expectancy Project, San Francisco
2
2
3
Outline of Today’s Talk
• Basic ideas related to life expectancy
(terminology, the life table, mortality rates)
• The scientific approach to life expectancy
• Life expectancy in the general population (GP)
• Life expectancy in three catastrophic
conditions: cerebral palsy (CP), traumatic
brain injury (TBI), and spinal cord injury (SCI)
4
Basic Ideas Related to Life Expectancy
• The biggest point: Survival time can’t be
predicted.
• Two summary measures of survival time
–Median survival time = 50% mark
–Life expectancy = average (arithmetic mean)
survival time
• A simple example: 1, 2, 9
–Median = 2
–Life expectancy = (1+2+9)/3 = 4
3
5
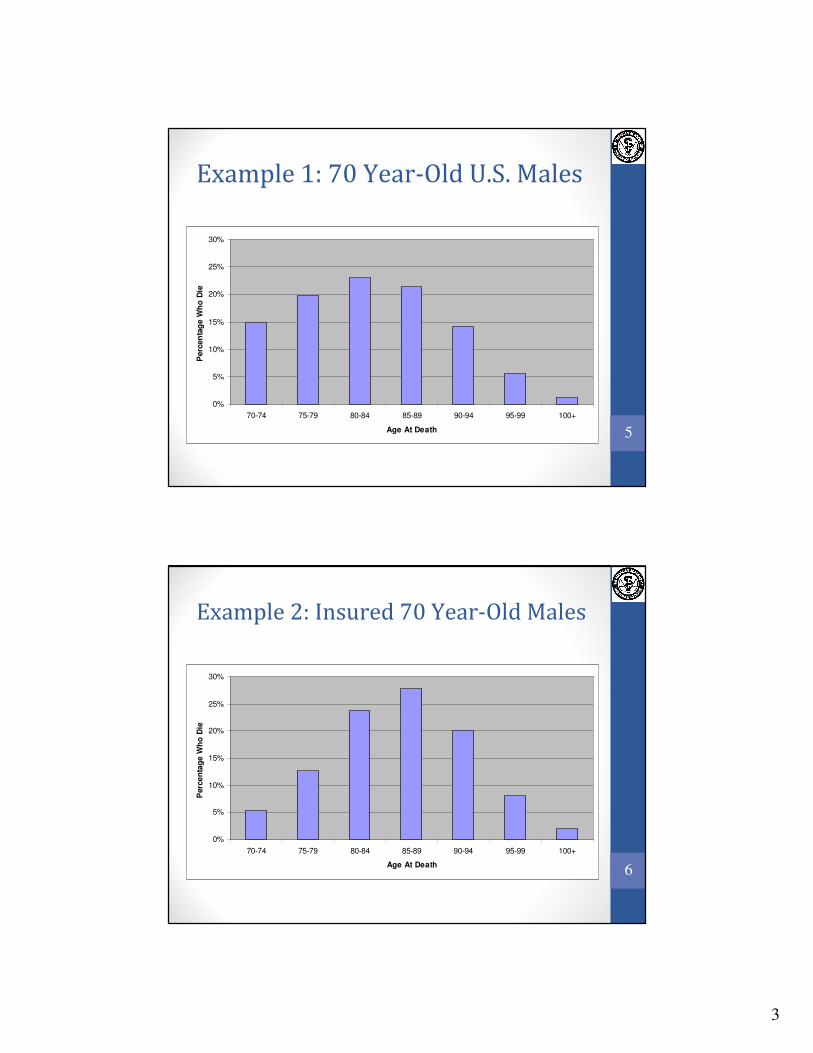
Example 1: 70 Year-Old U.S. Males
0%
5%
10%
15%
20%
25%
30%
70-74 75-79 80-84 85-89 90-94 95-99 100+
Age At Death
Perc
en
tag
e W
ho
Die
6
Example 2: Insured 70 Year-Old Males
0%
5%
10%
15%
20%
25%
30%
70-74 75-79 80-84 85-89 90-94 95-99 100+
Age At Death
Perc
en
tag
e W
ho
Die
4
7
8
age (years)
su
rviv
al p
erc
en
t
0
10
20
30
40
50
60
70
80
90
100
10 20 30 40 50 60 70 80 90 100
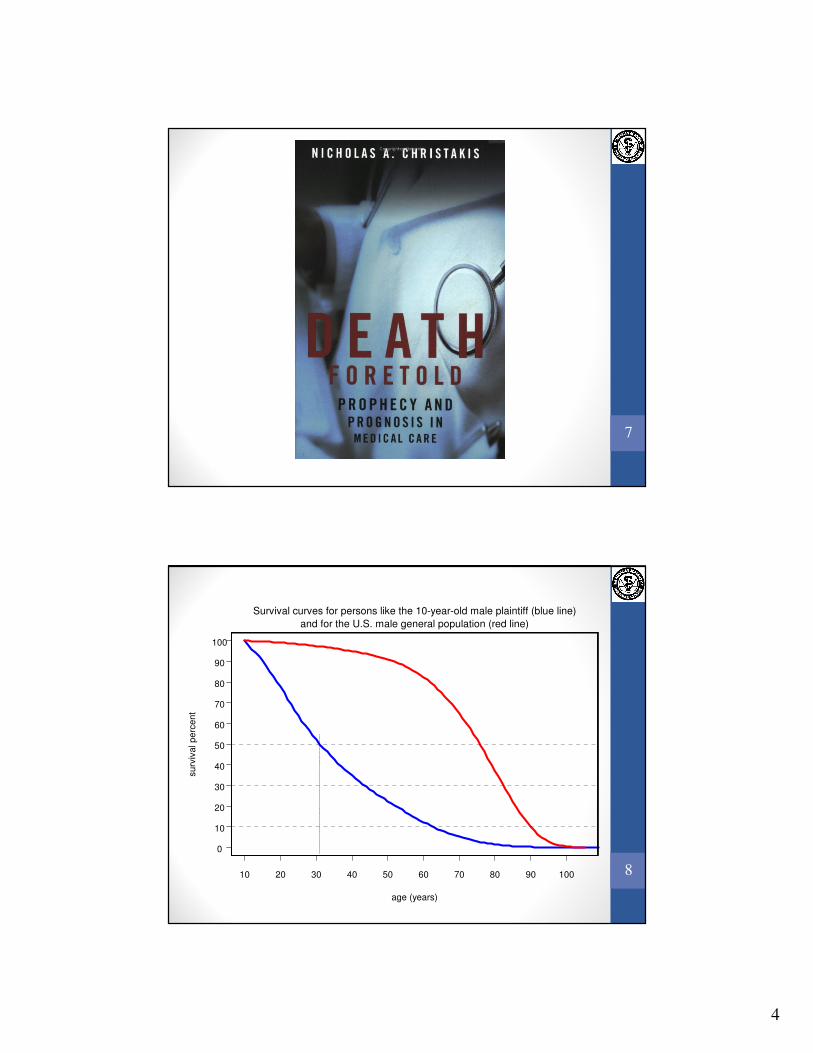
Survival curves for persons like the 10-year-old male plaintiff (blue line)
and for the U.S. male general population (red line)
5
9
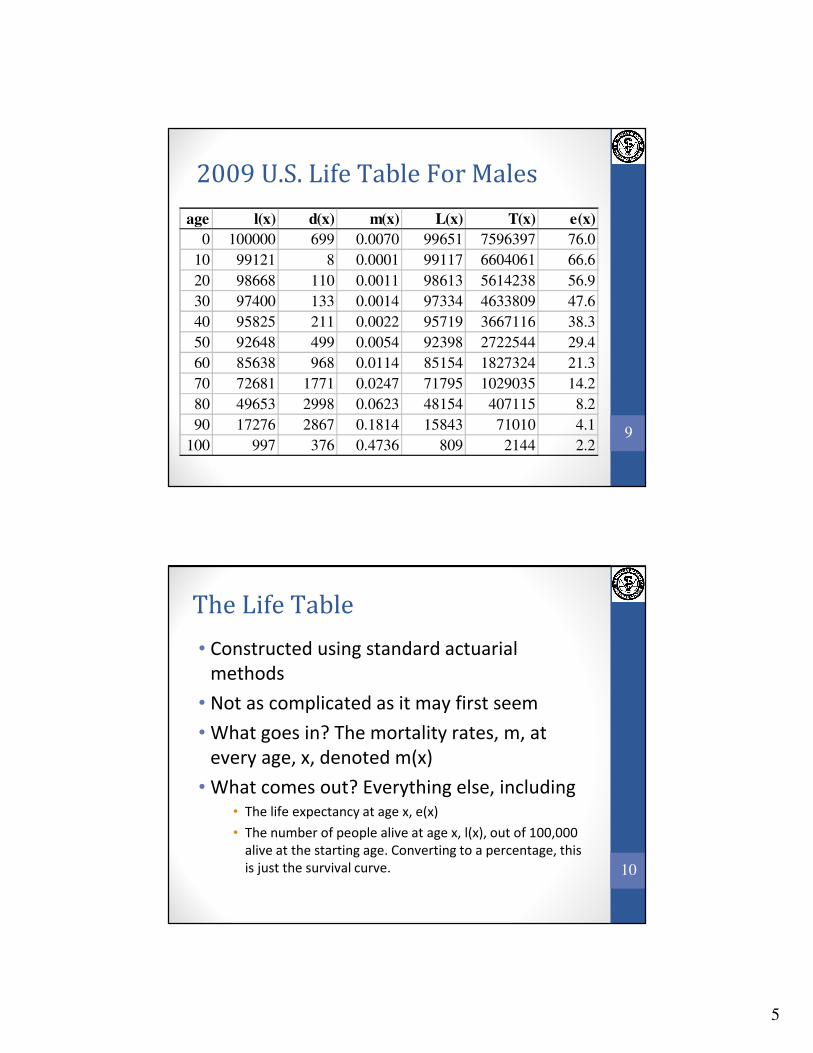
2009 U.S. Life Table For Males
age l(x) d(x) m(x) L(x) T(x) e(x)
0 100000 699 0.0070 99651 7596397 76.0
10 99121 8 0.0001 99117 6604061 66.6
20 98668 110 0.0011 98613 5614238 56.9
30 97400 133 0.0014 97334 4633809 47.6
40 95825 211 0.0022 95719 3667116 38.3
50 92648 499 0.0054 92398 2722544 29.4
60 85638 968 0.0114 85154 1827324 21.3
70 72681 1771 0.0247 71795 1029035 14.2
80 49653 2998 0.0623 48154 407115 8.2
90 17276 2867 0.1814 15843 71010 4.1
100 997 376 0.4736 809 2144 2.2
10
The Life Table
• Constructed using standard actuarial
methods
• Not as complicated as it may first seem
• What goes in? The mortality rates, m, at
every age, x, denoted m(x)
• What comes out? Everything else, including• The life expectancy at age x, e(x)
• The number of people alive at age x, l(x), out of 100,000
alive at the starting age. Converting to a percentage, this
is just the survival curve.
6
11
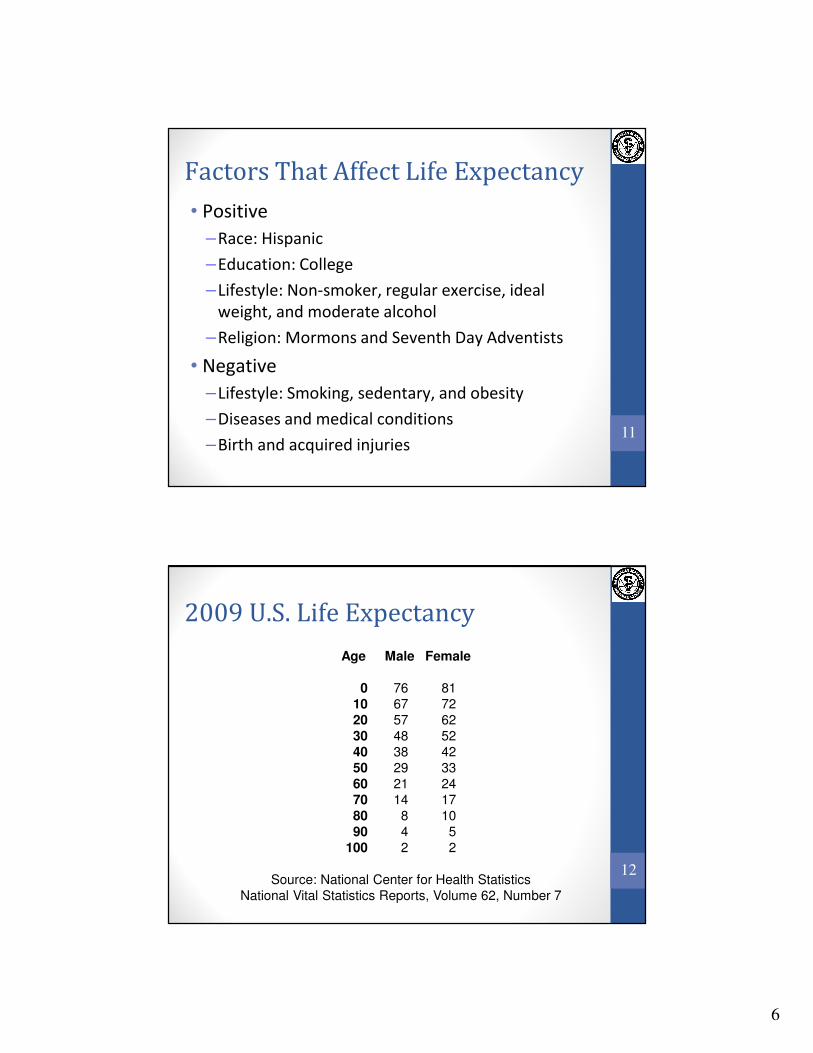
Factors That Affect Life Expectancy
• Positive
–Race: Hispanic
–Education: College
–Lifestyle: Non-smoker, regular exercise, ideal
weight, and moderate alcohol
–Religion: Mormons and Seventh Day Adventists
• Negative
–Lifestyle: Smoking, sedentary, and obesity
–Diseases and medical conditions
–Birth and acquired injuries
12
2009 U.S. Life Expectancy
Age Male Female
0 76 81
10 67 72
20 57 62
30 48 52
40 38 42
50 29 33
60 21 24
70 14 17
80 8 10
90 4 5
100 2 2
Source: National Center for Health Statistics
National Vital Statistics Reports, Volume 62, Number 7
7
13
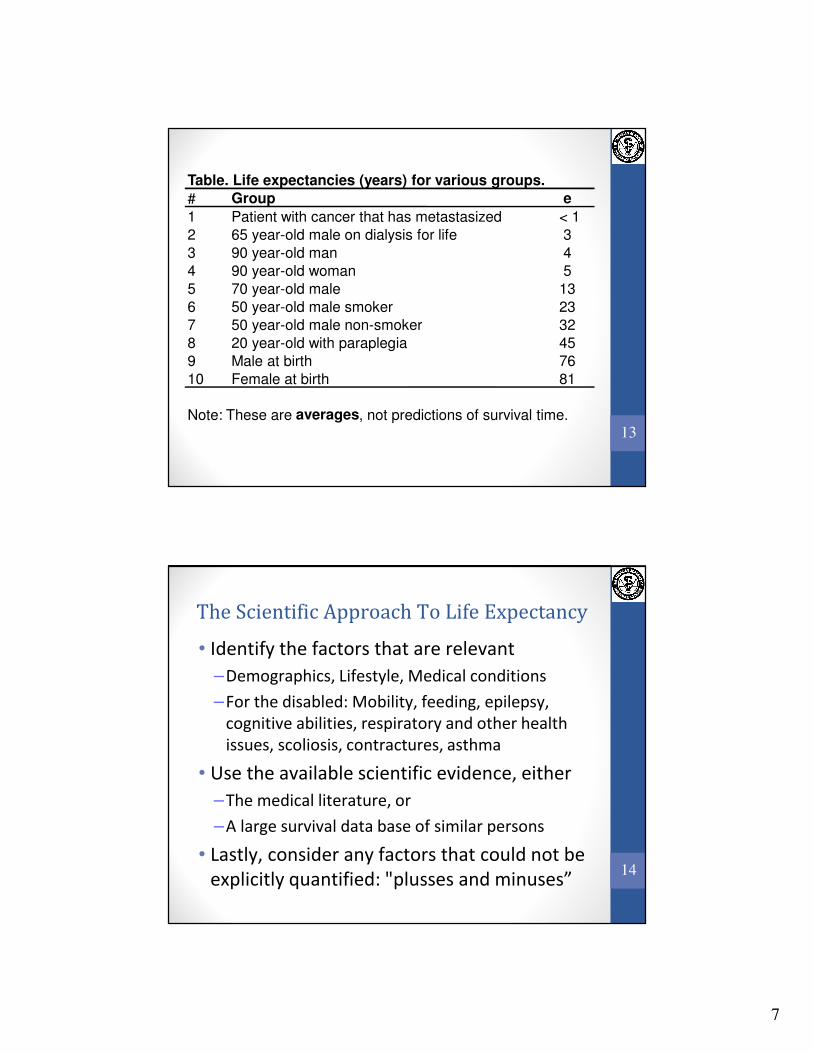
Table. Life expectancies (years) for various groups.
# Group e
1 Patient with cancer that has metastasized < 1
2 65 year-old male on dialysis for life 3
3 90 year-old man 4
4 90 year-old woman 5
5 70 year-old male 13
6 50 year-old male smoker 23
7 50 year-old male non-smoker 32
8 20 year-old with paraplegia 45
9 Male at birth 76
10 Female at birth 81
Note: These are averages, not predictions of survival time.
14
The Scientific Approach To Life Expectancy
• Identify the factors that are relevant
–Demographics, Lifestyle, Medical conditions
–For the disabled: Mobility, feeding, epilepsy,
cognitive abilities, respiratory and other health
issues, scoliosis, contractures, asthma
• Use the available scientific evidence, either
–The medical literature, or
–A large survival data base of similar persons
• Lastly, consider any factors that could not be
explicitly quantified: "plusses and minuses”
8
15
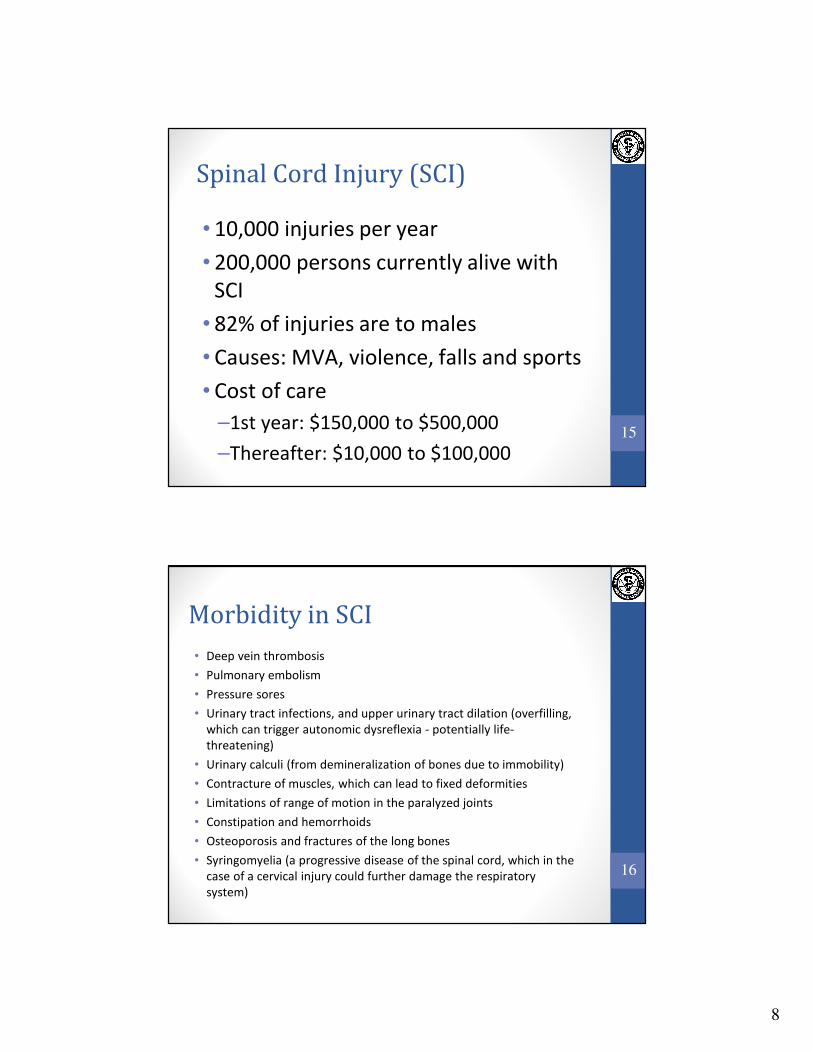
Spinal Cord Injury (SCI)
• 10,000 injuries per year
• 200,000 persons currently alive with
SCI
• 82% of injuries are to males
• Causes: MVA, violence, falls and sports
• Cost of care
–1st year: $150,000 to $500,000
–Thereafter: $10,000 to $100,000
16
Morbidity in SCI
• Deep vein thrombosis
• Pulmonary embolism
• Pressure sores
• Urinary tract infections, and upper urinary tract dilation (overfilling,
which can trigger autonomic dysreflexia - potentially life-
threatening)
• Urinary calculi (from demineralization of bones due to immobility)
• Contracture of muscles, which can lead to fixed deformities
• Limitations of range of motion in the paralyzed joints
• Constipation and hemorrhoids
• Osteoporosis and fractures of the long bones
• Syringomyelia (a progressive disease of the spinal cord, which in the
case of a cervical injury could further damage the respiratory
system)
9
17
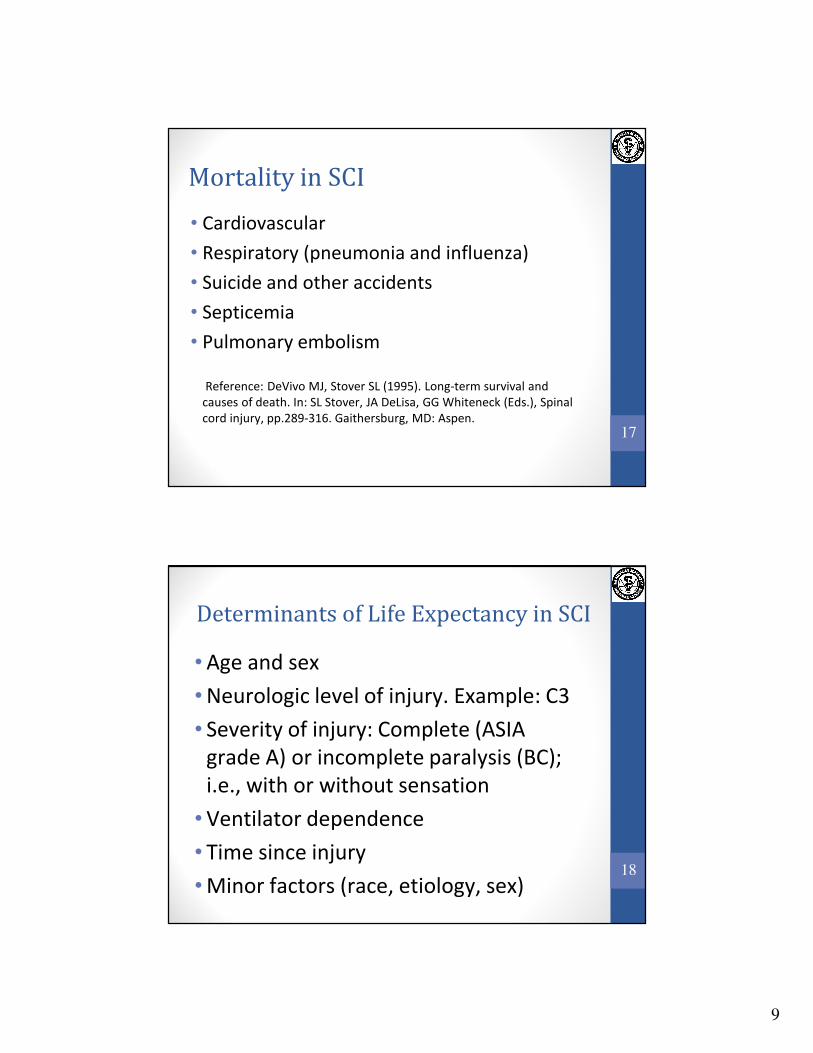
Mortality in SCI
• Cardiovascular
• Respiratory (pneumonia and influenza)
• Suicide and other accidents
• Septicemia
• Pulmonary embolism
Reference: DeVivo MJ, Stover SL (1995). Long-term survival and
causes of death. In: SL Stover, JA DeLisa, GG Whiteneck (Eds.), Spinal
cord injury, pp.289-316. Gaithersburg, MD: Aspen.
18
Determinants of Life Expectancy in SCI
• Age and sex
• Neurologic level of injury. Example: C3
• Severity of injury: Complete (ASIA
grade A) or incomplete paralysis (BC);
i.e., with or without sensation
• Ventilator dependence
• Time since injury
• Minor factors (race, etiology, sex)
10
19
20
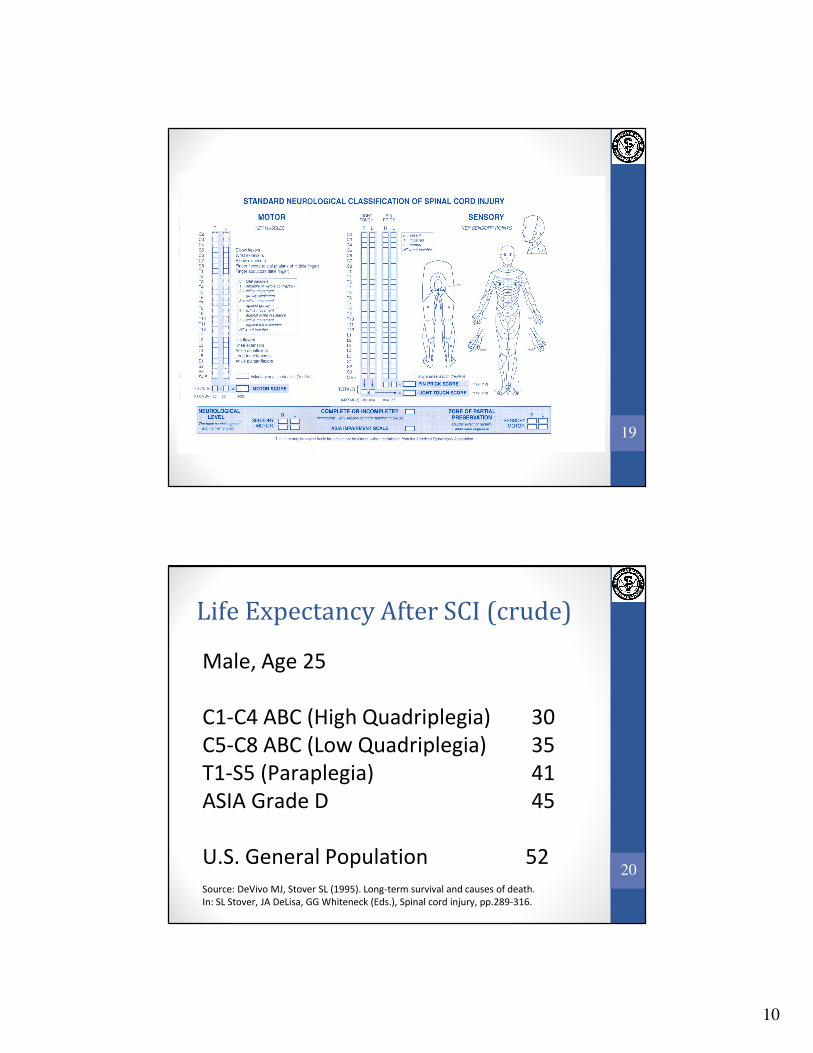
Life Expectancy After SCI (crude)
Male, Age 25
C1-C4 ABC (High Quadriplegia) 30
C5-C8 ABC (Low Quadriplegia) 35
T1-S5 (Paraplegia) 41
ASIA Grade D 45
U.S. General Population 52
Source: DeVivo MJ, Stover SL (1995). Long-term survival and causes of death.
In: SL Stover, JA DeLisa, GG Whiteneck (Eds.), Spinal cord injury, pp.289-316.
11
21
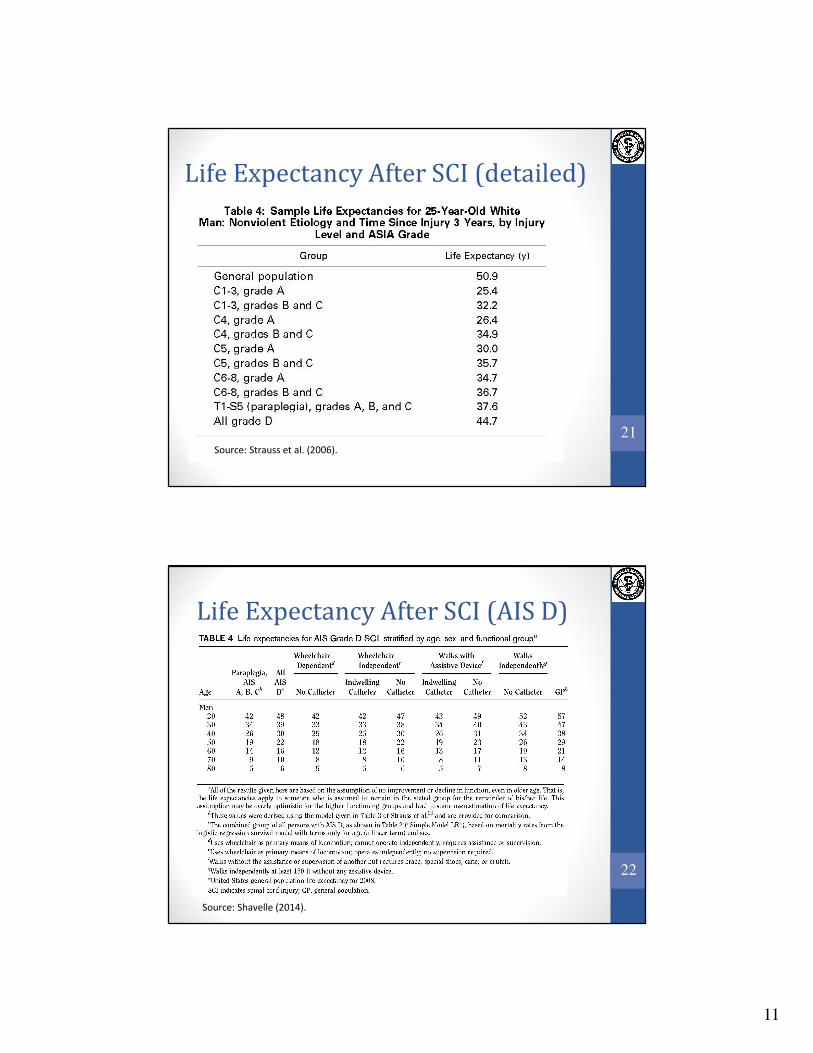
Life Expectancy After SCI (detailed)
Source: Strauss et al. (2006).
22
Life Expectancy After SCI (AIS D)
Source: Shavelle (2014).
12
23
How to Rate Co-Morbid Factors
• Suppose the person has factor x, which
usually has a rating of +50 (MR=rr=1.5)
[Note: Of course the rating could
depend on the baseline condition.]
• How to account for factor x?
• If all persons with SCI have x, then no
adjustment is necessary
• If none have it, full adjustment
24
How to Rate Co-Morbid Factors
(continued)
• Let p = proportion who have it
• Let r = relative risk of mortality for
those who have it compared with
those who do not
• Then the proper adjustment factor
(adjusted relative risk) is:
f = r / [pr+(1-p)]
• Check: If p = 0, r = r and if p = 1, f = 1
13
25
Recent SCI Literature
• Shavelle RM, Paculdo DR, Tran LM, Strauss DJ, Brooks JC, DeVivo MJ (2014).
Mobility, continence, and life expectancy in persons with ASIA impairment
scale grade D spinal cord injuries. American Journal of Physical Medicine &
Rehabilitation, June 2014 [epub ahead of print].
• Strauss D, DeVivo M, Shavelle R, Brooks J, Paculdo D (2008). Economic factors
and longevity in spinal cord injury: A reappraisal. Archives of Physical Medicine
and Rehabilitation, 89:572-574.
• Shavelle RM, DeVivo MJ, Paculdo DR, Vogel LC, Strauss DJ (2007). Long-term
survival after childhood spinal cord injury. Journal of Spinal Cord Medicine,
30:S48-S54.
• Shavelle RM, DeVivo MJ, Strauss DJ, Paculdo DR, Lammertse DP, Day SM
(2006). Long-term survival of persons ventilator dependent after spinal cord
injury. Journal of Spinal Cord Medicine, 29:511-519.
• Strauss DJ, DeVivo MJ, Paculdo DR, Shavelle RM (2006). Trends in life
expectancy after spinal cord injury. Archives of Physical Medicine and
Rehabilitation, 87:1079-1085.
26
Traumatic Brain Injury (TBI)
• 1.5 million injuries per year at cost of $25
billion to society
• 50,000 deaths per year
• 230,000 are hospitalized and survive
• 85,000 experience long-term disability
• Etiology: MVA, violence, and falls
14
27
Morbidity/Mortality in TBI
• Seizures
• Respiratory infections
• Choking and other accidents
• Cardiovascular disease
Reference: Shavelle RM, Strauss DJ, Whyte J, Day SM, Yu YL (2001).
Long-term causes of death after traumatic brain injury. American
Journal of Physical Medicine & Rehabilitation, 80:510-516.
28
Depression Holsinger T, Steffens DC, Phillips C, Helms MJ, Havlik
RJ, Breitner JC, Guralnik JM, Plassman BL (2002).
Head injury in early adulthood and the lifetime risk of
depression. Archives of General Psychiatry, 59:17-22.
Alzheimer’s Plassman BL, Havlik RJ, Steffens DC, et al. (2000).
Documented head injury in early adulthood and risk of
Alzheimer's disease and other dementias. Neurology,
55:1158-1166.
Parkinson’s Stern M, Dulaney E, Gruber SB, Golbe L, Bergen M,
Hurtig H, Gollomp S, Stolley P. The epidemiology of
Parkinson's disease (1991). A case-control study of
young-onset and old-onset patients. Archives of
Neurology, 48:903-907.
Neuroendocrine Behan LA, Phillips J, Thompson CJ, Agha A (2008).
Neuroendocrine disorders after traumatic brain injury.
Journal of Neurology, Neurosurgery & Psychiatry,
79:753-759.
Conditions Caused by TBI?
15
29
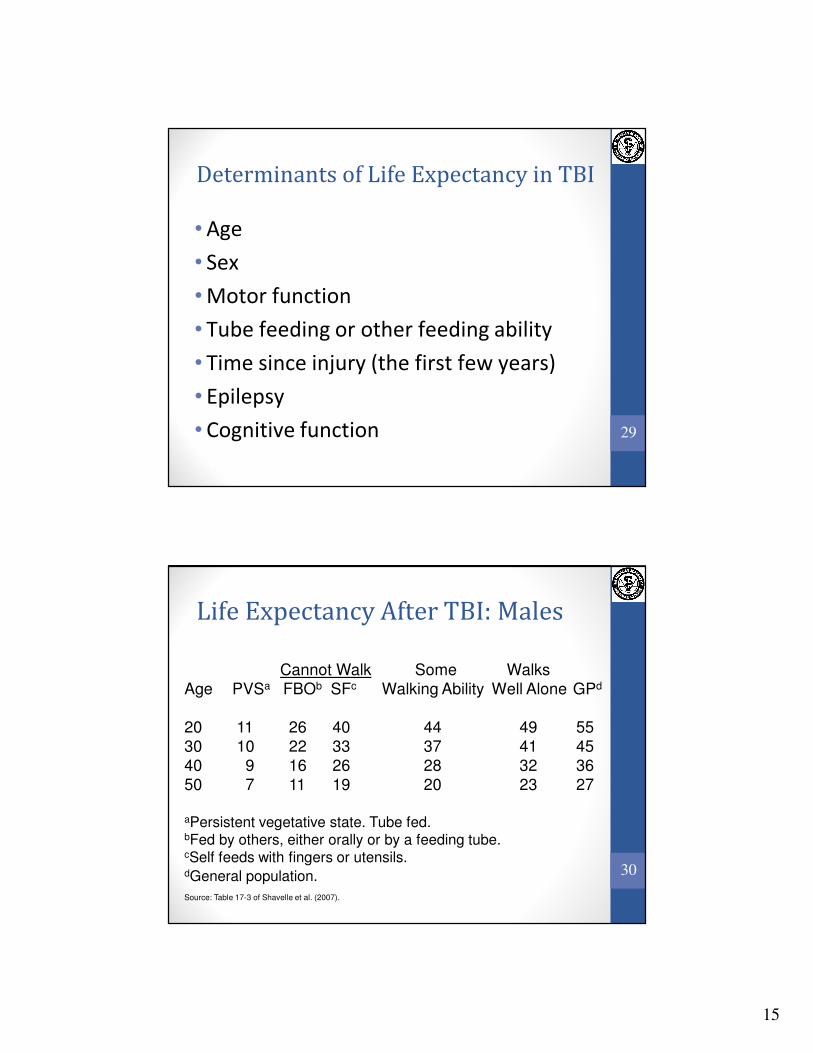
Determinants of Life Expectancy in TBI
• Age
• Sex
• Motor function
• Tube feeding or other feeding ability
• Time since injury (the first few years)
• Epilepsy
• Cognitive function
30
Life Expectancy After TBI: Males
Cannot Walk Some Walks
Age PVSa FBOb SFc Walking Ability Well Alone GPd
20 11 26 40 44 49 55
30 10 22 33 37 41 45
40 9 16 26 28 32 36
50 7 11 19 20 23 27
aPersistent vegetative state. Tube fed.bFed by others, either orally or by a feeding tube.cSelf feeds with fingers or utensils.dGeneral population.
Source: Table 17-3 of Shavelle et al. (2007).
16
31
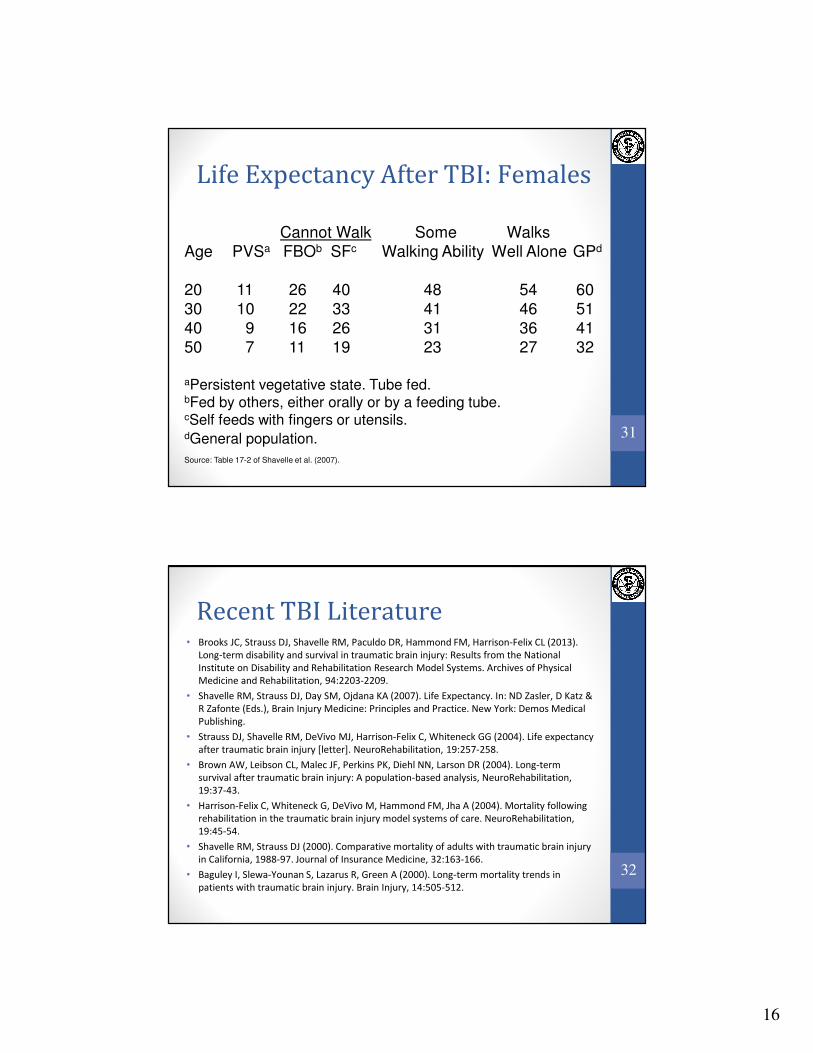
Life Expectancy After TBI: Females
Cannot Walk Some Walks
Age PVSa FBOb SFc Walking Ability Well Alone GPd
20 11 26 40 48 54 60
30 10 22 33 41 46 51
40 9 16 26 31 36 41
50 7 11 19 23 27 32
aPersistent vegetative state. Tube fed.bFed by others, either orally or by a feeding tube.cSelf feeds with fingers or utensils.dGeneral population.
Source: Table 17-2 of Shavelle et al. (2007).
32
Recent TBI Literature• Brooks JC, Strauss DJ, Shavelle RM, Paculdo DR, Hammond FM, Harrison-Felix CL (2013).
Long-term disability and survival in traumatic brain injury: Results from the National
Institute on Disability and Rehabilitation Research Model Systems. Archives of Physical
Medicine and Rehabilitation, 94:2203-2209.
• Shavelle RM, Strauss DJ, Day SM, Ojdana KA (2007). Life Expectancy. In: ND Zasler, D Katz &
R Zafonte (Eds.), Brain Injury Medicine: Principles and Practice. New York: Demos Medical
Publishing.
• Strauss DJ, Shavelle RM, DeVivo MJ, Harrison-Felix C, Whiteneck GG (2004). Life expectancy
after traumatic brain injury [letter]. NeuroRehabilitation, 19:257-258.
• Brown AW, Leibson CL, Malec JF, Perkins PK, Diehl NN, Larson DR (2004). Long-term
survival after traumatic brain injury: A population-based analysis, NeuroRehabilitation,
19:37-43.
• Harrison-Felix C, Whiteneck G, DeVivo M, Hammond FM, Jha A (2004). Mortality following
rehabilitation in the traumatic brain injury model systems of care. NeuroRehabilitation,
19:45-54.
• Shavelle RM, Strauss DJ (2000). Comparative mortality of adults with traumatic brain injury
in California, 1988-97. Journal of Insurance Medicine, 32:163-166.
• Baguley I, Slewa-Younan S, Lazarus R, Green A (2000). Long-term mortality trends in
patients with traumatic brain injury. Brain Injury, 14:505-512.
17
33
Cerebral Palsy (CP)
• A term of convenience to describe motor
disorders due to brain impairment
• Affects roughly 1 in 500 live births
• Non-progressive; appears early in life
• Possible causes include hypoxia before or
during delivery, head trauma, and
infections.
• The exact cause in most cases cannot be
determined.
• Effects range from very mild to very severe
34
Morbidity/Mortality in CP
• Respiratory diseases, especially in the young
• Spasticity, contractures, scoliosis, asthma
• GERD, UTI, accidents
• Heart disease and other effects of
immobility
Reference: Strauss DJ, Cable W, Shavelle RM (1999). Causes
of excess mortality in cerebral palsy. Developmental Medicine
and Child Neurology, 41:580-585.
18
35
Complications Of Immobility
• Cardiovascular: Decreased cardiac output, contributing to decreased
aerobic capacity; orthostatic intolerance; venous thrombophlebitis
• Pulmonary: Atelectasis; relative hypoxemia; pneumonia
• Musculoskeletal: Muscle atrophy and loss of strength; decreased muscle
oxidative capacity contributing to decreased aerobic capacity;
osteoporosis (bone loss); contractures; osteoarthritis
• Gastrointestinal: Constipation
• Genitourinary: Incontinence; renal calculi and urinary tract infections
• Skin: Pressure ulcers due to tissue ischemia
• Functional: Impaired ambulation and activity intolerance
• Psychological: Depression; altered sensory perception
Reference: Porth CM (2002). Pathophysiology: Onset of Altered Health
State, 6th edition, Lippincott, Williams and Wilkins, p. 241.
36
Determinants of Life Expectancy in CP
• Many potential factors
–Etiology
–Type of CP
–Severity of MR (mental retardation level)
–Ethnicity, Socioeconomic status
–Type of residence
–Many don’t matter (e.g., hair color)
• The biggest factors
–Motor function: rolling, sitting, crawling, walking
–Feeding: gastrostomy tube, FBO, self feeds
19
37
The Normal Developmental Sequence
• Lifts head (at age 0-1 month)
• Lifts head and chest (2-4 months)
• Rolls (3-7 months)
• Sits (5-9 months)
• Crawls (6-12 months)
• Stands (7-13 months)
• Cruises, walks with support, then walks
alone (8-17 months)
38
Two Other Factors
• Quality of care: "With good care normal life
expectancy”.
–True for a normal child. Not true for the
disabled.
–Does care matter? If “good” versus “bad”, then
yes. If “excellent” versus “reasonable &
necessary”, then no.
• Secular (time) trend:
–“Those old historical studies do not apply in
today’s age of modern medicine!”
–Evidence of a trend in the past 20 years!
20
39
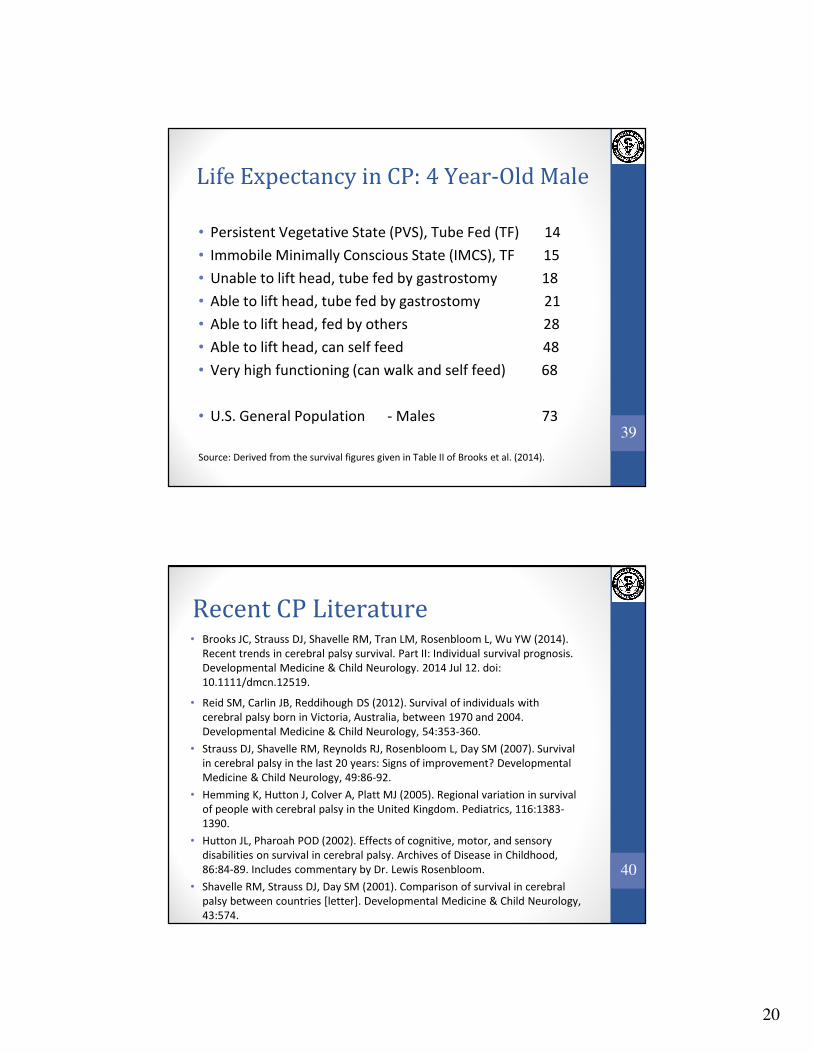
Life Expectancy in CP: 4 Year-Old Male
• Persistent Vegetative State (PVS), Tube Fed (TF) 14
• Immobile Minimally Conscious State (IMCS), TF 15
• Unable to lift head, tube fed by gastrostomy 18
• Able to lift head, tube fed by gastrostomy 21
• Able to lift head, fed by others 28
• Able to lift head, can self feed 48
• Very high functioning (can walk and self feed) 68
• U.S. General Population - Males 73
Source: Derived from the survival figures given in Table II of Brooks et al. (2014).
40
Recent CP Literature• Brooks JC, Strauss DJ, Shavelle RM, Tran LM, Rosenbloom L, Wu YW (2014).
Recent trends in cerebral palsy survival. Part II: Individual survival prognosis.
Developmental Medicine & Child Neurology. 2014 Jul 12. doi:
10.1111/dmcn.12519.
• Reid SM, Carlin JB, Reddihough DS (2012). Survival of individuals with
cerebral palsy born in Victoria, Australia, between 1970 and 2004.
Developmental Medicine & Child Neurology, 54:353-360.
• Strauss DJ, Shavelle RM, Reynolds RJ, Rosenbloom L, Day SM (2007). Survival
in cerebral palsy in the last 20 years: Signs of improvement? Developmental
Medicine & Child Neurology, 49:86-92.
• Hemming K, Hutton J, Colver A, Platt MJ (2005). Regional variation in survival
of people with cerebral palsy in the United Kingdom. Pediatrics, 116:1383-
1390.
• Hutton JL, Pharoah POD (2002). Effects of cognitive, motor, and sensory
disabilities on survival in cerebral palsy. Archives of Disease in Childhood,
86:84-89. Includes commentary by Dr. Lewis Rosenbloom.
• Shavelle RM, Strauss DJ, Day SM (2001). Comparison of survival in cerebral
palsy between countries [letter]. Developmental Medicine & Child Neurology,
43:574.
21
41
Amusing Statements About Life
Expectancy By Clinicians
• His life expectancy at the time of the accident, 3 years ago, was
10 years, so it’s now 10 - 3 = 7 years
• With optimal medical care, the life expectancy [of this person in
the vegetative state] is near normal
• He could die any day, so his life expectancy could be very short
• Very few of my patients have died, so with good care I believe
his life expectancy will be normal
• This man is 20, but will likely make it to age 50, when the life
expectancy is 30 years, so his life expectancy is to age 80
• Most of my patients are in their 40’s, 50’s or 60’s, so I think this
man’s life expectancy is to the middle of this range -- his 50’s
42
Summary
• Life expectancy is not a prediction of the
person’s actual survival time.
• Life expectancy in cerebral palsy, traumatic
brain injury, and spinal cord injury varies
according to the severity of disability.
• A large body of medical literature can be
used to estimate life expectancy.