executive summary - epd.gov.hk · no non-conformance to the environmental requirements was ... -...
TRANSCRIPT


1
EXECUTIVE SUMMARY With the main civil works contracts of the South Island Line (East) (SIL(E)) Project awarded in May 2011, the commencement date of construction of the Project was on 25 June 2011. The Environmental Monitoring and Audit (EM&A) programme of the Project also commenced on 25 June 2011. This is the third Monthly EM&A Report for SIL(E) Project. The Report presents the results of EM&A works undertaken during the period of 1 September 2011 to 30 September 2011. The major construction activities in the reporting period included site preparation, piling and slope stabilization works. Impact monitoring for air quality and noise were conducted in the reporting period. No exceedance was found and there was no breach of Action / Limit Levels for air quality and noise. Impact water quality monitoring was undertaken at Aberdeen Channel in the reporting period. Exceedances in DO against Action/ Limit Levels were recorded and the exceedances were considered not related to the project works. No environmental complaint, notification of summon or prosecution related to the environmental issue was received in the reporting period. Regular site inspections were conducted by the Environmental Team (ET) to check the implementation of environmental mitigation measures. No non-conformance to the environmental requirements was identified in the reporting period. Future key issues envisaged in the coming month include noise and dust emission from site works. The ET will continue the implementation of the EM&A programme in accordance to the EM&A Manual.
2
EXECUTIVE SUMMARY
1 INTRODUCTION 1.1 Project Background 1.2 Project Programme 1.3 Coverage of the EM&A Report
2 PROJECT INFORMATION 2.1 Project Organization and Management Structure 2.2 Construction Activities in the Reporting Month 2.3 Construction Activities for the Coming Month 2.4 Project Areas and Environmental Monitoring Locations 2.5 Summary of EM&A Requirements
3 IMPACT MONITORING 3.1 Air Quality 3.2 Noise 3.3 Water Quality 3.4 Action taken in Event of Exceedence
4 LANDSCAPE AND VISUAL 4.1 EM&A Requirements 4.2 Site Audit Results
5 ECOLOGY 5.1 EM&A Requirements 5.2 Site Audit Results
6 WASTE MANAGEMENT
7 RECORD OF ENVIRONMENTAL COMPLAINTS
8 RECORD OF NON- COMPLIANCES
9 RECORD OF NOTIFICATION OF SUMMONS AND SUCCESSFUL PROSECUTIONS
10 STATUS OF STATUTORY SUBMISSIONS 10.1 Submissions required under Environmental Permit 10.2 Statutory Permits and Licenses
11 SITE INSPECTIONS 11.1 Implementation of Environmental Mitigation Measures 11.2 Observations 11.3 Solid and Liquid Waste Management Status 11.4 Other Notable Events
12 FUTURE KEY ISSUES
13 CONCLUSIONS
3
List of Figures Figures 1 to 2 Works Areas of the Project Figures 3 to 6 Location of Construction Air Quality Monitoring Stations Figures 7 to 8 Location of Construction Noise Monitoring Stations Figures 9 Location of Water Quality Monitoring Stations List of Appendices Appendix A1 Project Organization Appendix A2 Contact List of Key Personnel of the Project Appendix B1 Action and Limit Levels for Construction Noise and Air Quality Appendix B2 Action and Limit Levels for Water Quality Appendix C Calibration Details Appendix D Graphical Plots of Air Quality, Noise & Water Quality Impact Monitoring and
Monitoring Results for Water Quality Appendix E Review of Exceedance in Water Quality Monitoring

4
1 INTRODUCTION 1.1 Project Background
The South Island Line (East) (SIL(E)) of 7.0km approximately is a new medium capacity railway with stations at South Horizons (SOH), Lei Tung (LET), Wong Chuk Hang (WCH), Ocean Park (OCP) and Admiralty (ADM), comprising underground and elevated structures. A depot is required at Wong Chuk Hang to provide maintenance support for the SIL(E).
1.2 Project Programme Main civil works contracts of the SIL(E) was awarded in May 2011. The commencement date of construction of the Project was on 25 June 2011. The construction of the Project is expected to complete in 2015.
1.3 Coverage of EM&A Report The Environmental Monitoring and Audit (EM&A) programme of the Project commenced on 25 June 2011. This is the third Monthly Environmental Monitoring and Audit (EM&A) Report for the Project. The Report presents the results of EM&A undertaken during the period of 1 to 30 September 2011.
2 PROJECT INFORMATION 2.1 Project Organization and Management Structure
The project organization is shown in Appendix A1. Contacts of key personnel of the Project are shown in Appendix A2.
2.2 Construction Activities in the Reporting Month
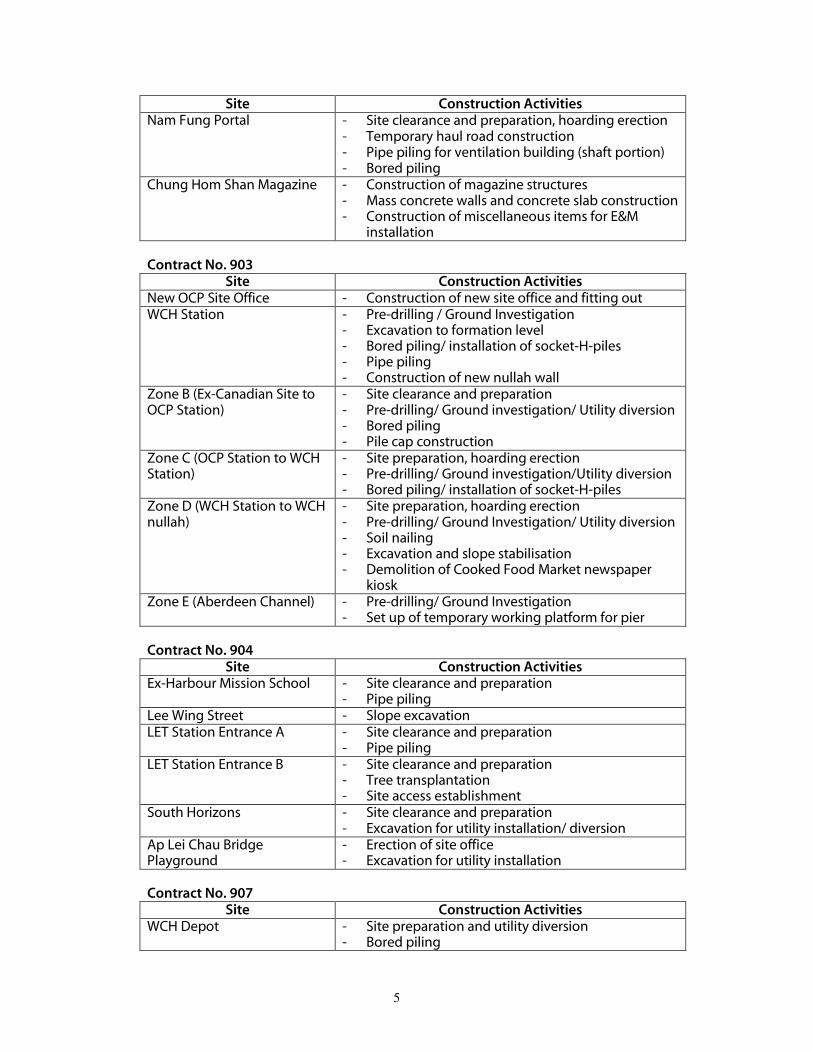
Major construction activities carried out by the respective SIL(E) civil works contractors during the reporting period include: Contract No. 901
Site Construction Activities Harcourt Garden - Site clearance and preparation, hoarding erection
- Pre-drilling - EVA construction - FSD water tanks installation - Demolition of LCSD office and CITIC footbridge
staircase - Installation of socket H-piles - Installation of bulkhead at Entrance E
Contract No. 902
Site Construction Activities Hong Kong Park Ventilation Shaft
- Demolition of LCSD structure - Fencing and hoarding erection - Trial pit excavation - Pipe piling/ sheet piling at the upper platform
5
Site Construction Activities Nam Fung Portal - Site clearance and preparation, hoarding erection
- Temporary haul road construction - Pipe piling for ventilation building (shaft portion) - Bored piling
Chung Hom Shan Magazine - Construction of magazine structures - Mass concrete walls and concrete slab construction - Construction of miscellaneous items for E&M
installation Contract No. 903
Site Construction Activities New OCP Site Office - Construction of new site office and fitting out WCH Station - Pre-drilling / Ground Investigation
- Excavation to formation level - Bored piling/ installation of socket-H-piles - Pipe piling - Construction of new nullah wall
Zone B (Ex-Canadian Site to OCP Station)
- Site clearance and preparation - Pre-drilling/ Ground investigation/ Utility diversion - Bored piling - Pile cap construction
Zone C (OCP Station to WCH Station)
- Site preparation, hoarding erection - Pre-drilling/ Ground investigation/Utility diversion - Bored piling/ installation of socket-H-piles
Zone D (WCH Station to WCH nullah)
- Site preparation, hoarding erection - Pre-drilling/ Ground Investigation/ Utility diversion - Soil nailing - Excavation and slope stabilisation - Demolition of Cooked Food Market newspaper
kiosk Zone E (Aberdeen Channel) - Pre-drilling/ Ground Investigation
- Set up of temporary working platform for pier Contract No. 904
Site Construction Activities Ex-Harbour Mission School - Site clearance and preparation
- Pipe piling Lee Wing Street - Slope excavation LET Station Entrance A - Site clearance and preparation
- Pipe piling LET Station Entrance B - Site clearance and preparation
- Tree transplantation - Site access establishment
South Horizons - Site clearance and preparation - Excavation for utility installation/ diversion
Ap Lei Chau Bridge Playground
- Erection of site office - Excavation for utility installation
Contract No. 907
Site Construction Activities WCH Depot - Site preparation and utility diversion
- Bored piling
6
Site Construction Activities - Pipe piling - Preparatory works for blasting - Construction of the bus terminus (EPIW)
Lee Nam Road Barging Facility
- Miscellaneous installation of barging facility
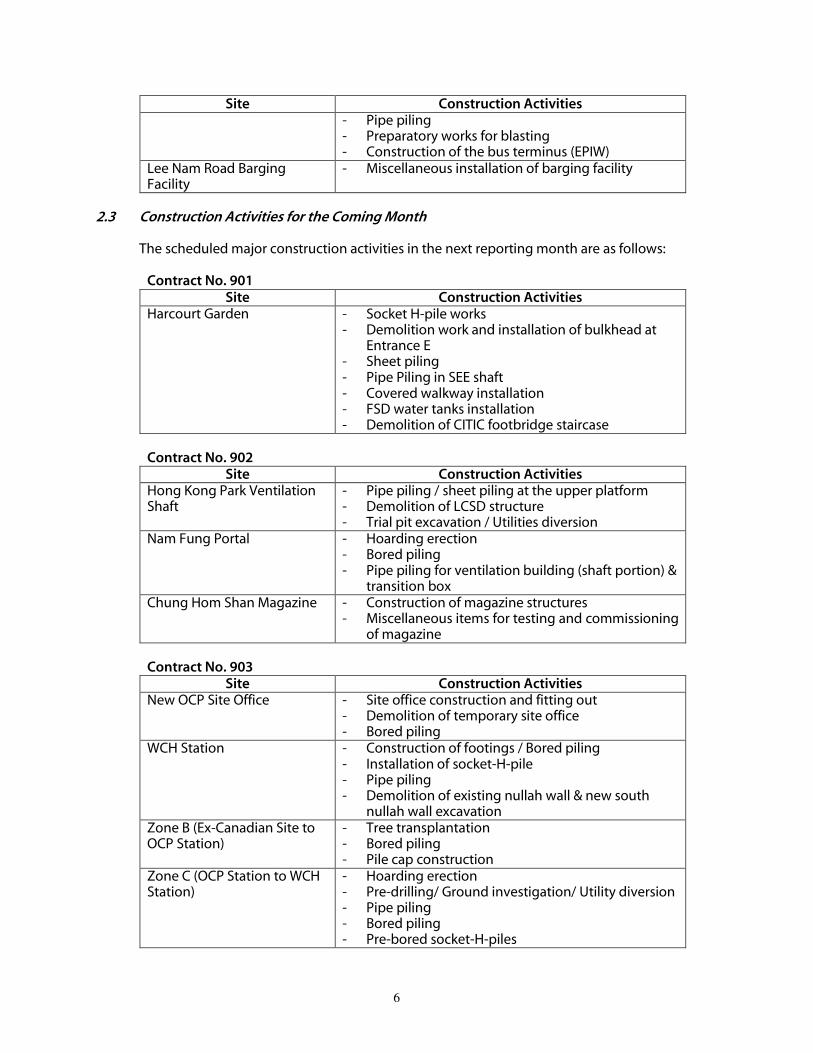
2.3 Construction Activities for the Coming Month
The scheduled major construction activities in the next reporting month are as follows: Contract No. 901
Site Construction Activities Harcourt Garden - Socket H-pile works
- Demolition work and installation of bulkhead at Entrance E
- Sheet piling - Pipe Piling in SEE shaft - Covered walkway installation - FSD water tanks installation - Demolition of CITIC footbridge staircase
Contract No. 902
Site Construction Activities Hong Kong Park Ventilation Shaft
- Pipe piling / sheet piling at the upper platform - Demolition of LCSD structure - Trial pit excavation / Utilities diversion
Nam Fung Portal - Hoarding erection - Bored piling - Pipe piling for ventilation building (shaft portion) &
transition box Chung Hom Shan Magazine - Construction of magazine structures
- Miscellaneous items for testing and commissioning of magazine
Contract No. 903
Site Construction Activities New OCP Site Office - Site office construction and fitting out
- Demolition of temporary site office - Bored piling
WCH Station - Construction of footings / Bored piling - Installation of socket-H-pile - Pipe piling - Demolition of existing nullah wall & new south
nullah wall excavation Zone B (Ex-Canadian Site to OCP Station)
- Tree transplantation - Bored piling - Pile cap construction
Zone C (OCP Station to WCH Station)
- Hoarding erection - Pre-drilling/ Ground investigation/ Utility diversion - Pipe piling - Bored piling - Pre-bored socket-H-piles

7
Site Construction Activities - Construction of platform crossing nullah
Zone D (WCH Station to WCH nullah)
- Hoarding erection - Pre-drilling/ Ground investigation - Slope stabilisation - Demolition of Cooked Food Market kiosk
Zone E (Aberdeen Channel) - Pre-drilling / Ground investigation from temporary working platform
- Bored piling - Construction of pile cap
Contract No. 904
Site Construction Activities Ex-Harbour Mission School - Pipe piling
- Site formation Lee Wing Street - Slope excavation and stabilization LET Station Entrance A - Fencing and hoarding erection
- Site formation LET Station Entrance B - Site clearance and preparation
- Tree transplantation - Utility installation
South Horizons - Site clearance and preparation - Tree transplantation - Installation of king post/soldier piles
Ap Lei Chau Bridge Playground
- Erection of site office
Contract No. 907
Site Construction Activities WCH Depot - Bored piling
- Pipe piling - Preparatory works for blasting - Construction of the bus terminus (EPIW)
Lee Nam Road Barging Facility
- Barging facility in operation
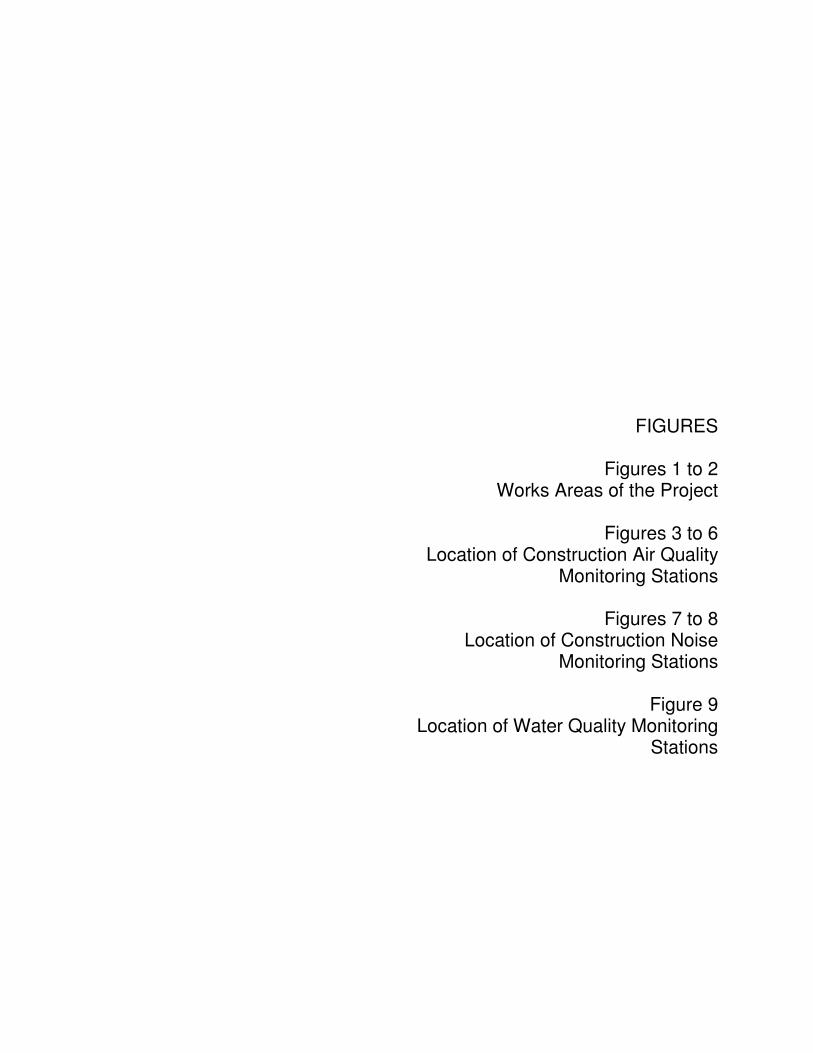
2.4 Project Areas and Environmental Monitoring Locations The works areas of the Project are shown in Figures 1 and 2. The locations of environmental monitoring stations are shown in Figures 3 to 9. Tables 1 and 2 below shows the details of the active monitoring stations as reported in Sections 3.1 to 3.3 below.
Table 1 Summary of impact dust and noise monitoring stations
ID Monitoring Station
Dust
CD1 Wong Chuk Hang San Wai
CD2 Police College – Police Quarters
8
ID Monitoring Station
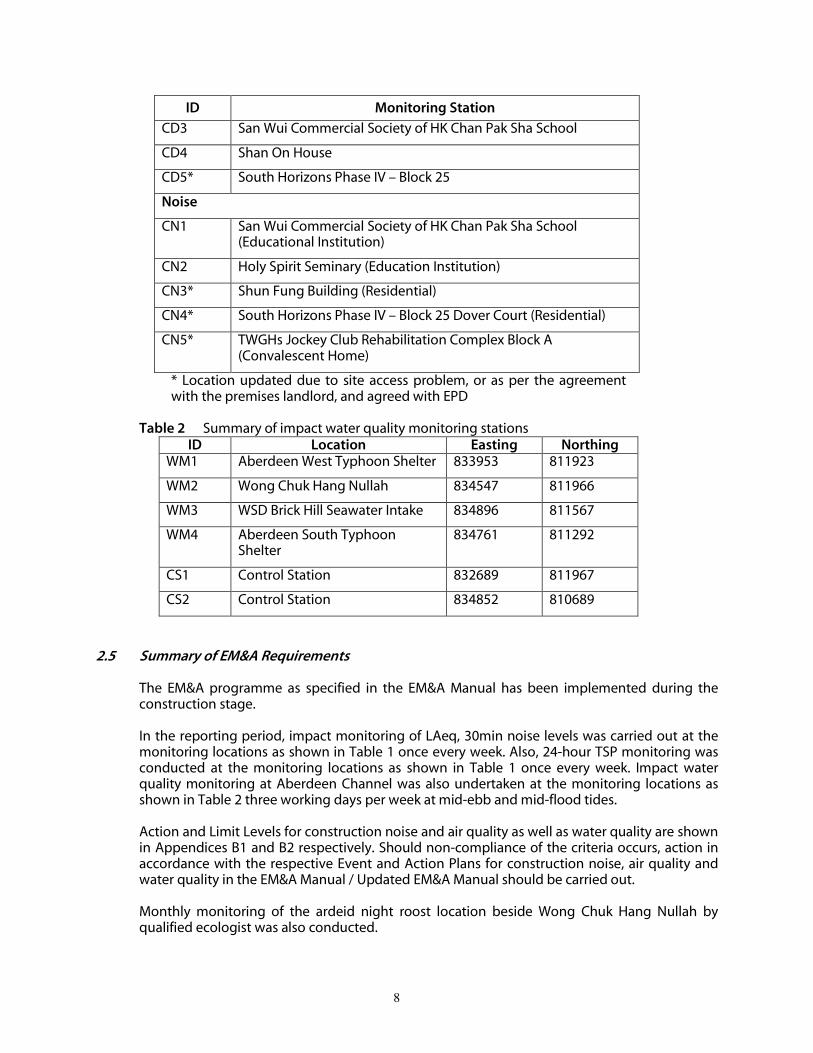
CD3 San Wui Commercial Society of HK Chan Pak Sha School
CD4 Shan On House
CD5* South Horizons Phase IV – Block 25
Noise
CN1 San Wui Commercial Society of HK Chan Pak Sha School (Educational Institution)
CN2 Holy Spirit Seminary (Education Institution)
CN3* Shun Fung Building (Residential)
CN4* South Horizons Phase IV – Block 25 Dover Court (Residential)
CN5* TWGHs Jockey Club Rehabilitation Complex Block A (Convalescent Home)
* Location updated due to site access problem, or as per the agreement with the premises landlord, and agreed with EPD
Table 2 Summary of impact water quality monitoring stations
ID Location Easting Northing WM1 Aberdeen West Typhoon Shelter 833953 811923
WM2 Wong Chuk Hang Nullah 834547 811966
WM3 WSD Brick Hill Seawater Intake 834896 811567
WM4 Aberdeen South Typhoon Shelter
834761 811292
CS1 Control Station 832689 811967
CS2 Control Station 834852 810689
2.5 Summary of EM&A Requirements
The EM&A programme as specified in the EM&A Manual has been implemented during the construction stage. In the reporting period, impact monitoring of LAeq, 30min noise levels was carried out at the monitoring locations as shown in Table 1 once every week. Also, 24-hour TSP monitoring was conducted at the monitoring locations as shown in Table 1 once every week. Impact water quality monitoring at Aberdeen Channel was also undertaken at the monitoring locations as shown in Table 2 three working days per week at mid-ebb and mid-flood tides. Action and Limit Levels for construction noise and air quality as well as water quality are shown in Appendices B1 and B2 respectively. Should non-compliance of the criteria occurs, action in accordance with the respective Event and Action Plans for construction noise, air quality and water quality in the EM&A Manual / Updated EM&A Manual should be carried out. Monthly monitoring of the ardeid night roost location beside Wong Chuk Hang Nullah by qualified ecologist was also conducted.
9
In addition, regular site inspection to active works areas was carried out. The areas of inspection included the pollution control and mitigation measures within the site. Waste management and landscape and visual aspects were covered.
3 IMPACT MONITORING
3.1 Air Quality
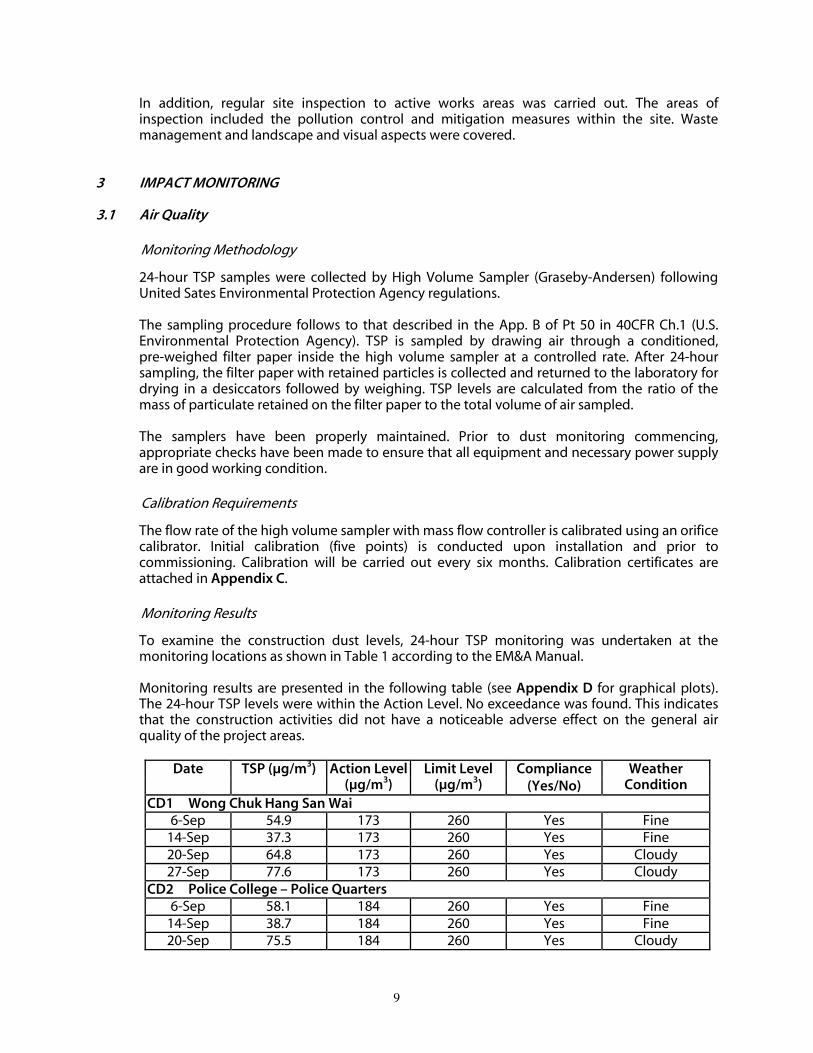
Monitoring Methodology
24-hour TSP samples were collected by High Volume Sampler (Graseby-Andersen) following United Sates Environmental Protection Agency regulations. The sampling procedure follows to that described in the App. B of Pt 50 in 40CFR Ch.1 (U.S. Environmental Protection Agency). TSP is sampled by drawing air through a conditioned, pre-weighed filter paper inside the high volume sampler at a controlled rate. After 24-hour sampling, the filter paper with retained particles is collected and returned to the laboratory for drying in a desiccators followed by weighing. TSP levels are calculated from the ratio of the mass of particulate retained on the filter paper to the total volume of air sampled. The samplers have been properly maintained. Prior to dust monitoring commencing, appropriate checks have been made to ensure that all equipment and necessary power supply are in good working condition.
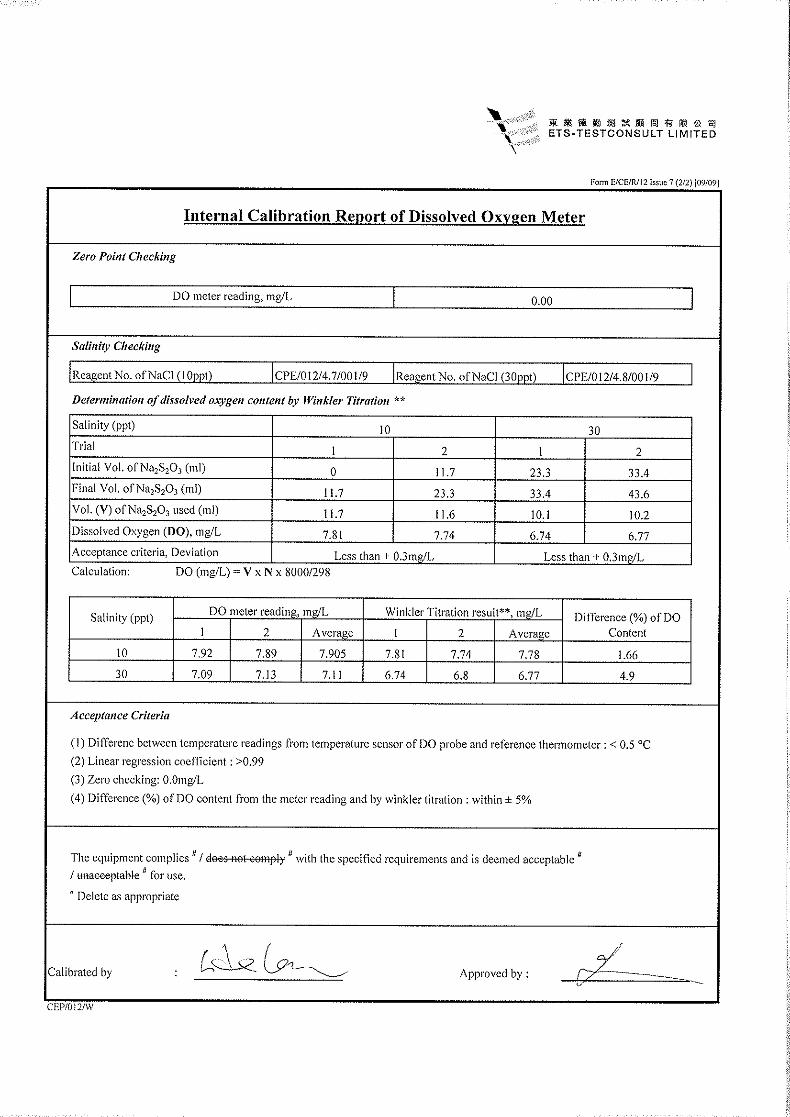
Calibration Requirements
The flow rate of the high volume sampler with mass flow controller is calibrated using an orifice calibrator. Initial calibration (five points) is conducted upon installation and prior to commissioning. Calibration will be carried out every six months. Calibration certificates are attached in Appendix C.
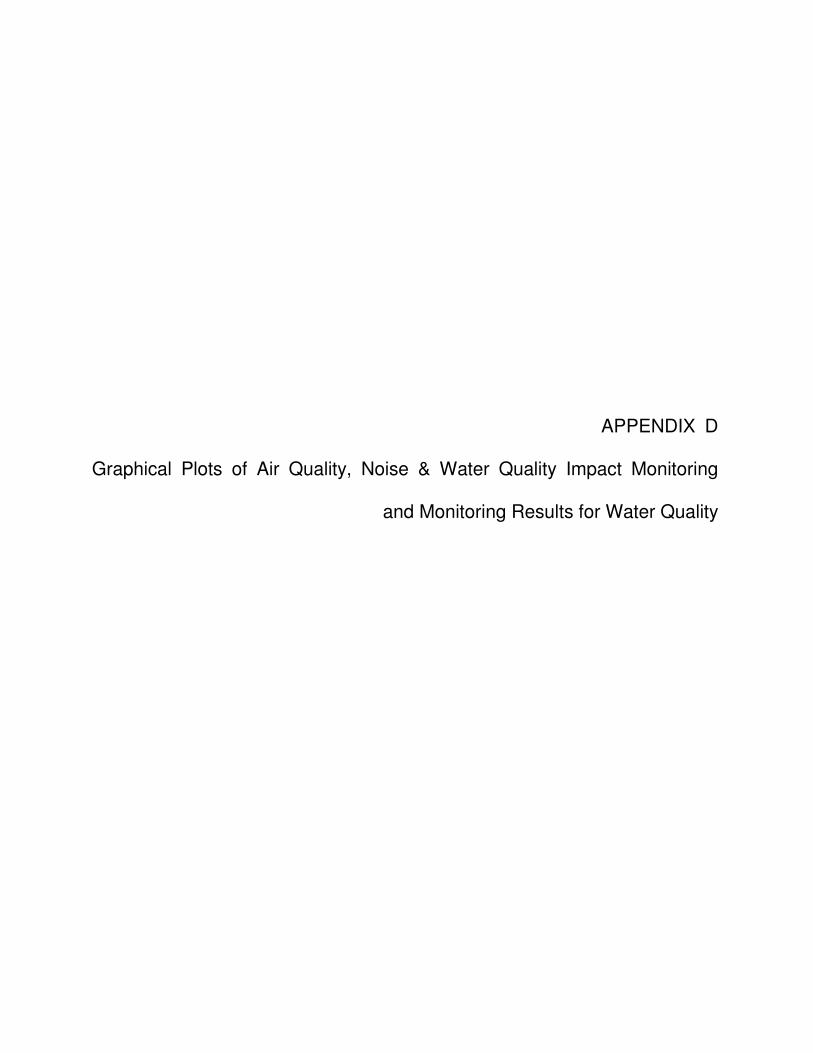
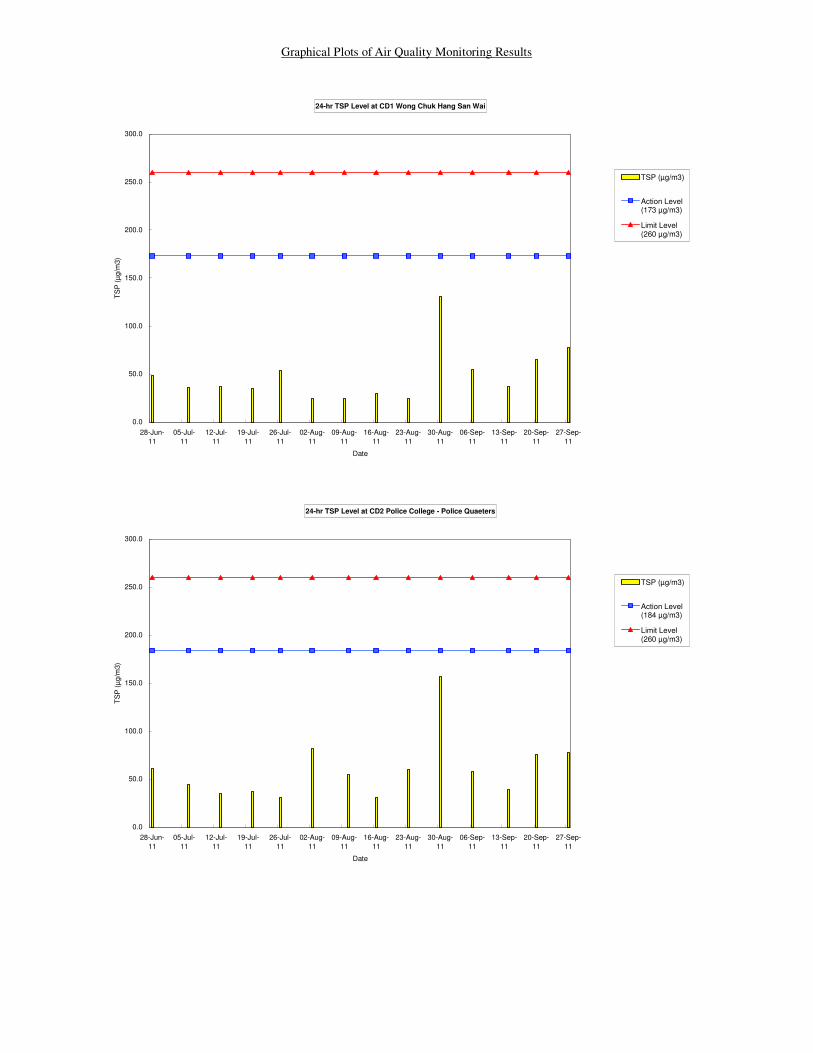
Monitoring Results
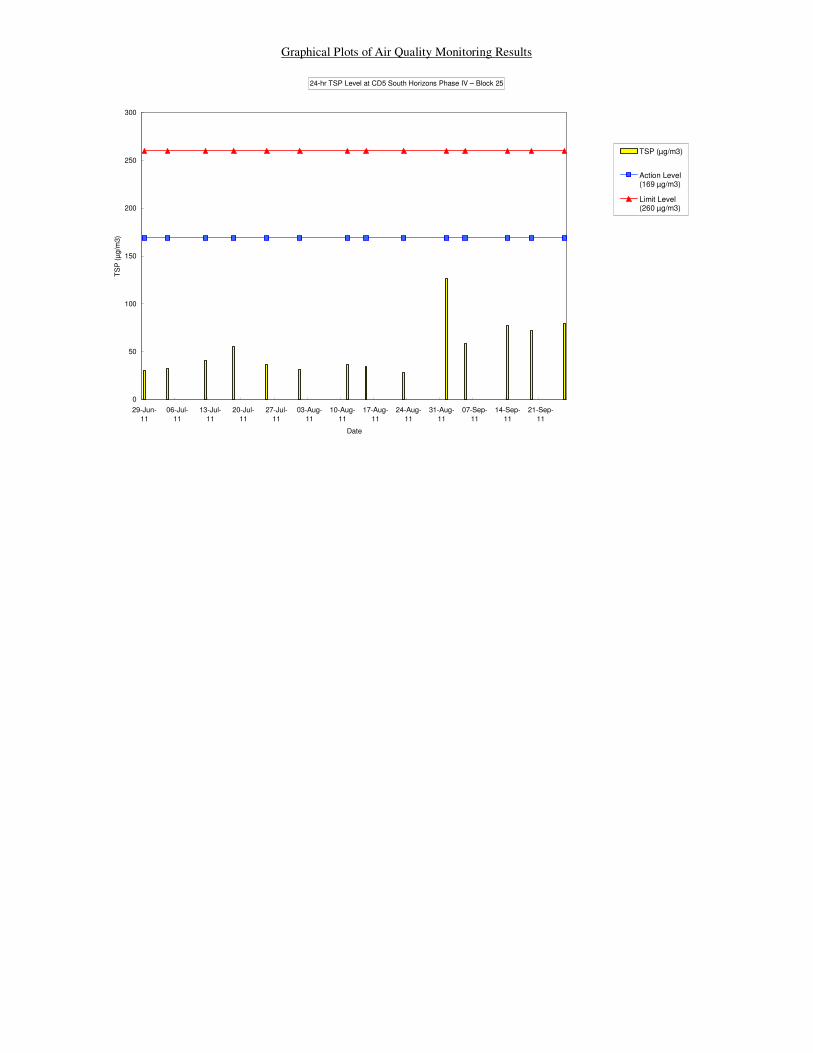
To examine the construction dust levels, 24-hour TSP monitoring was undertaken at the monitoring locations as shown in Table 1 according to the EM&A Manual. Monitoring results are presented in the following table (see Appendix D for graphical plots). The 24-hour TSP levels were within the Action Level. No exceedance was found. This indicates that the construction activities did not have a noticeable adverse effect on the general air quality of the project areas.
Compliance Date TSP (µg/m3) Action Level (µg/m3)
Limit Level (µg/m3) (Yes/No)
Weather Condition
CD1 Wong Chuk Hang San Wai 6-Sep 54.9 173 260 Yes Fine 14-Sep 37.3 173 260 Yes Fine 20-Sep 64.8 173 260 Yes Cloudy 27-Sep 77.6 173 260 Yes Cloudy
CD2 Police College – Police Quarters 6-Sep 58.1 184 260 Yes Fine 14-Sep 38.7 184 260 Yes Fine 20-Sep 75.5 184 260 Yes Cloudy
10
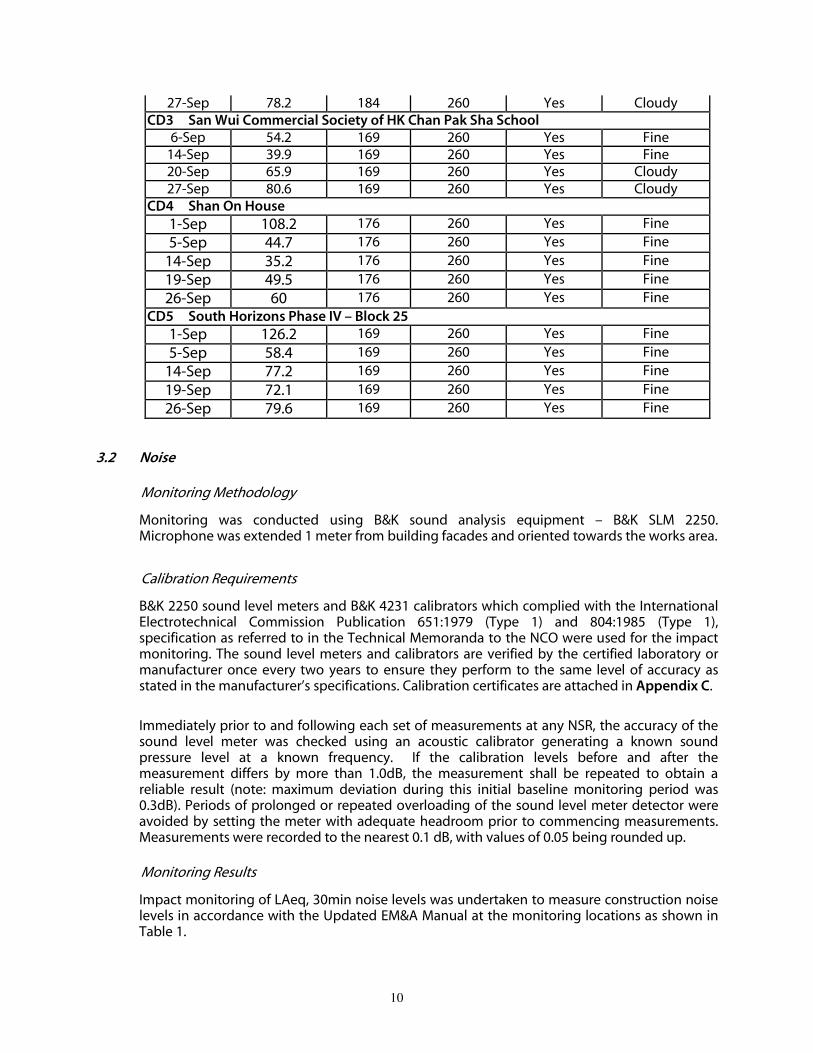
27-Sep 78.2 184 260 Yes Cloudy CD3 San Wui Commercial Society of HK Chan Pak Sha School
6-Sep 54.2 169 260 Yes Fine 14-Sep 39.9 169 260 Yes Fine 20-Sep 65.9 169 260 Yes Cloudy 27-Sep 80.6 169 260 Yes Cloudy
CD4 Shan On House
1-Sep 108.2 176 260 Yes Fine
5-Sep 44.7 176 260 Yes Fine
14-Sep 35.2 176 260 Yes Fine
19-Sep 49.5 176 260 Yes Fine
26-Sep 60 176 260 Yes Fine
CD5 South Horizons Phase IV – Block 25
1-Sep 126.2 169 260 Yes Fine
5-Sep 58.4 169 260 Yes Fine
14-Sep 77.2 169 260 Yes Fine
19-Sep 72.1 169 260 Yes Fine
26-Sep 79.6 169 260 Yes Fine
3.2 Noise
Monitoring Methodology
Monitoring was conducted using B&K sound analysis equipment – B&K SLM 2250. Microphone was extended 1 meter from building facades and oriented towards the works area.
Calibration Requirements
B&K 2250 sound level meters and B&K 4231 calibrators which complied with the International Electrotechnical Commission Publication 651:1979 (Type 1) and 804:1985 (Type 1), specification as referred to in the Technical Memoranda to the NCO were used for the impact monitoring. The sound level meters and calibrators are verified by the certified laboratory or manufacturer once every two years to ensure they perform to the same level of accuracy as stated in the manufacturer’s specifications. Calibration certificates are attached in Appendix C.
Immediately prior to and following each set of measurements at any NSR, the accuracy of the sound level meter was checked using an acoustic calibrator generating a known sound pressure level at a known frequency. If the calibration levels before and after the measurement differs by more than 1.0dB, the measurement shall be repeated to obtain a reliable result (note: maximum deviation during this initial baseline monitoring period was 0.3dB). Periods of prolonged or repeated overloading of the sound level meter detector were avoided by setting the meter with adequate headroom prior to commencing measurements. Measurements were recorded to the nearest 0.1 dB, with values of 0.05 being rounded up.
Monitoring Results
Impact monitoring of LAeq, 30min noise levels was undertaken to measure construction noise levels in accordance with the Updated EM&A Manual at the monitoring locations as shown in Table 1.
11
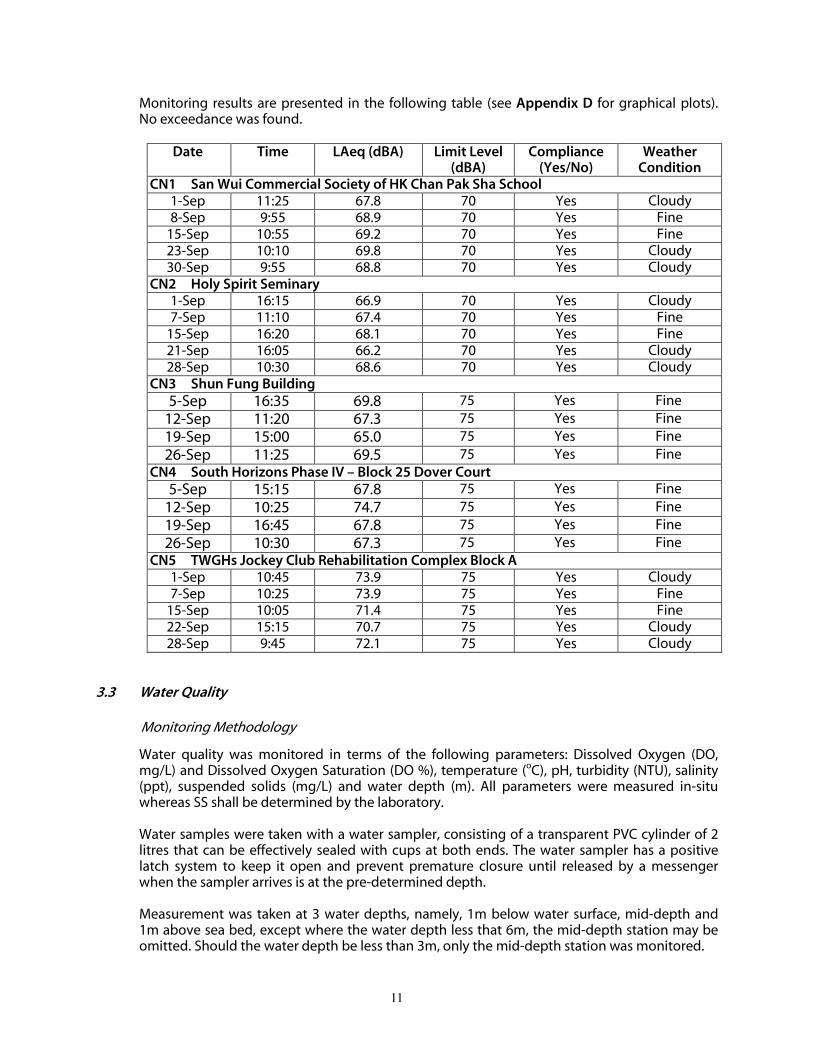
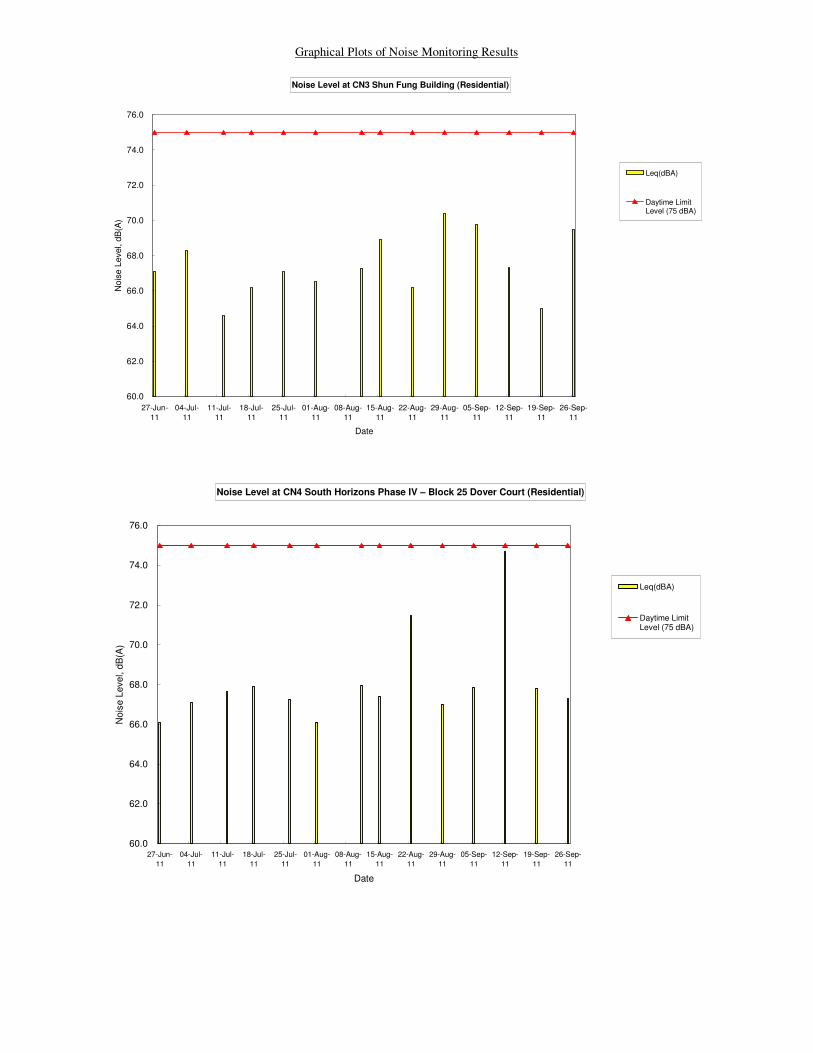
Monitoring results are presented in the following table (see Appendix D for graphical plots). No exceedance was found.
Date Time LAeq (dBA) Limit Level
(dBA) Compliance (Yes/No)
Weather Condition
CN1 San Wui Commercial Society of HK Chan Pak Sha School 1-Sep 11:25 67.8 70 Yes Cloudy 8-Sep 9:55 68.9 70 Yes Fine 15-Sep 10:55 69.2 70 Yes Fine 23-Sep 10:10 69.8 70 Yes Cloudy 30-Sep 9:55 68.8 70 Yes Cloudy
CN2 Holy Spirit Seminary 1-Sep 16:15 66.9 70 Yes Cloudy 7-Sep 11:10 67.4 70 Yes Fine 15-Sep 16:20 68.1 70 Yes Fine 21-Sep 16:05 66.2 70 Yes Cloudy 28-Sep 10:30 68.6 70 Yes Cloudy
CN3 Shun Fung Building 5-Sep 16:35 69.8 75 Yes Fine
12-Sep 11:20 67.3 75 Yes Fine
19-Sep 15:00 65.0 75 Yes Fine
26-Sep 11:25 69.5 75 Yes Fine
CN4 South Horizons Phase IV – Block 25 Dover Court 5-Sep 15:15 67.8 75 Yes Fine
12-Sep 10:25 74.7 75 Yes Fine
19-Sep 16:45 67.8 75 Yes Fine
26-Sep 10:30 67.3 75 Yes Fine
CN5 TWGHs Jockey Club Rehabilitation Complex Block A 1-Sep 10:45 73.9 75 Yes Cloudy 7-Sep 10:25 73.9 75 Yes Fine 15-Sep 10:05 71.4 75 Yes Fine 22-Sep 15:15 70.7 75 Yes Cloudy 28-Sep 9:45 72.1 75 Yes Cloudy
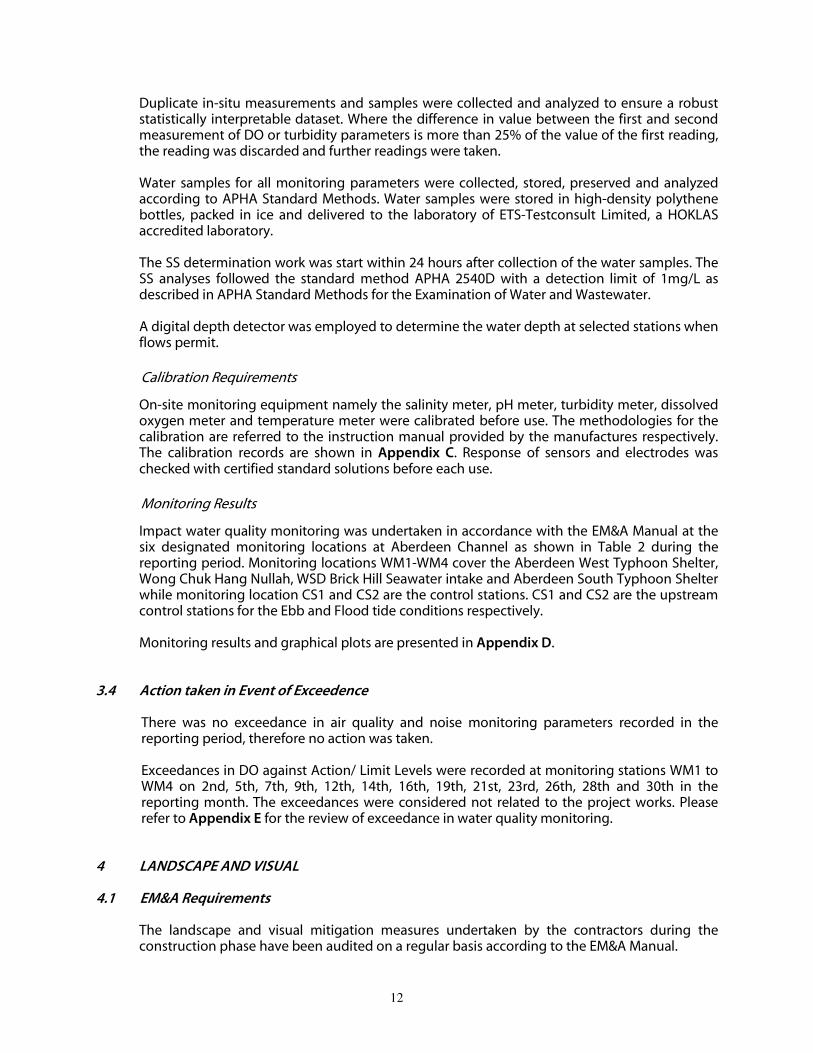
3.3 Water Quality
Monitoring Methodology
Water quality was monitored in terms of the following parameters: Dissolved Oxygen (DO, mg/L) and Dissolved Oxygen Saturation (DO %), temperature (oC), pH, turbidity (NTU), salinity (ppt), suspended solids (mg/L) and water depth (m). All parameters were measured in-situ whereas SS shall be determined by the laboratory. Water samples were taken with a water sampler, consisting of a transparent PVC cylinder of 2 litres that can be effectively sealed with cups at both ends. The water sampler has a positive latch system to keep it open and prevent premature closure until released by a messenger when the sampler arrives is at the pre-determined depth. Measurement was taken at 3 water depths, namely, 1m below water surface, mid-depth and 1m above sea bed, except where the water depth less that 6m, the mid-depth station may be omitted. Should the water depth be less than 3m, only the mid-depth station was monitored.
12
Duplicate in-situ measurements and samples were collected and analyzed to ensure a robust statistically interpretable dataset. Where the difference in value between the first and second measurement of DO or turbidity parameters is more than 25% of the value of the first reading, the reading was discarded and further readings were taken. Water samples for all monitoring parameters were collected, stored, preserved and analyzed according to APHA Standard Methods. Water samples were stored in high-density polythene bottles, packed in ice and delivered to the laboratory of ETS-Testconsult Limited, a HOKLAS accredited laboratory. The SS determination work was start within 24 hours after collection of the water samples. The SS analyses followed the standard method APHA 2540D with a detection limit of 1mg/L as described in APHA Standard Methods for the Examination of Water and Wastewater. A digital depth detector was employed to determine the water depth at selected stations when flows permit.
Calibration Requirements
On-site monitoring equipment namely the salinity meter, pH meter, turbidity meter, dissolved oxygen meter and temperature meter were calibrated before use. The methodologies for the calibration are referred to the instruction manual provided by the manufactures respectively. The calibration records are shown in Appendix C. Response of sensors and electrodes was checked with certified standard solutions before each use.
Monitoring Results
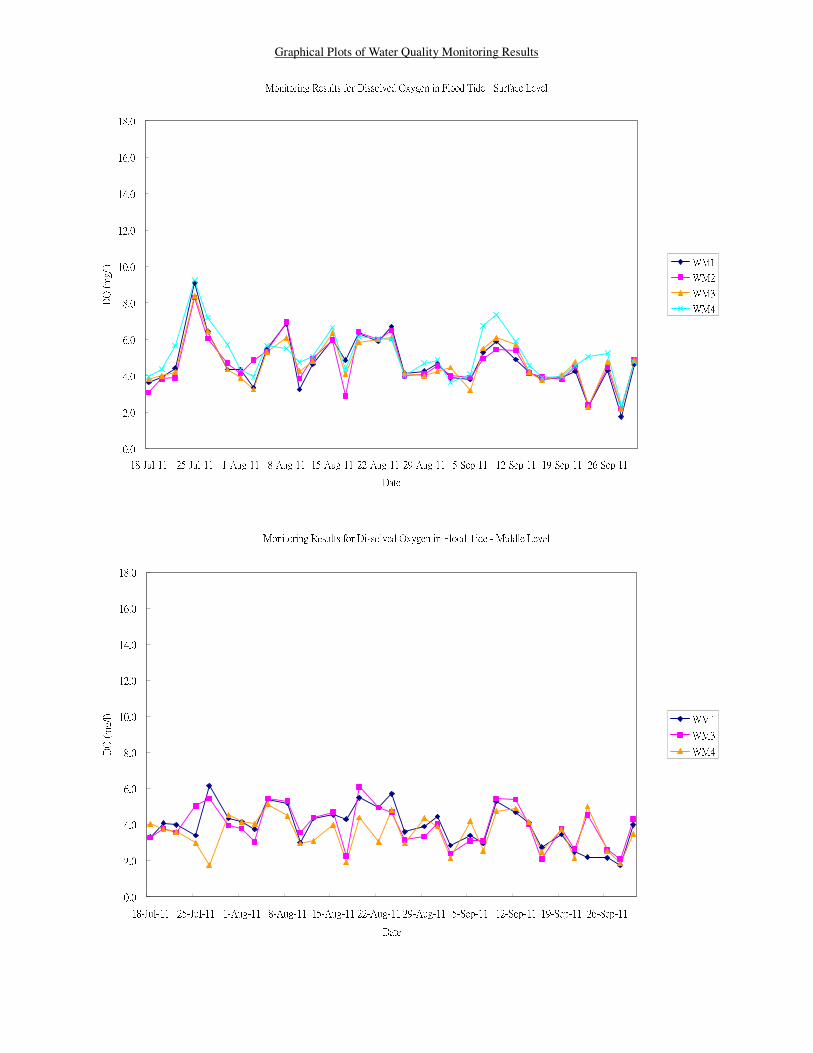
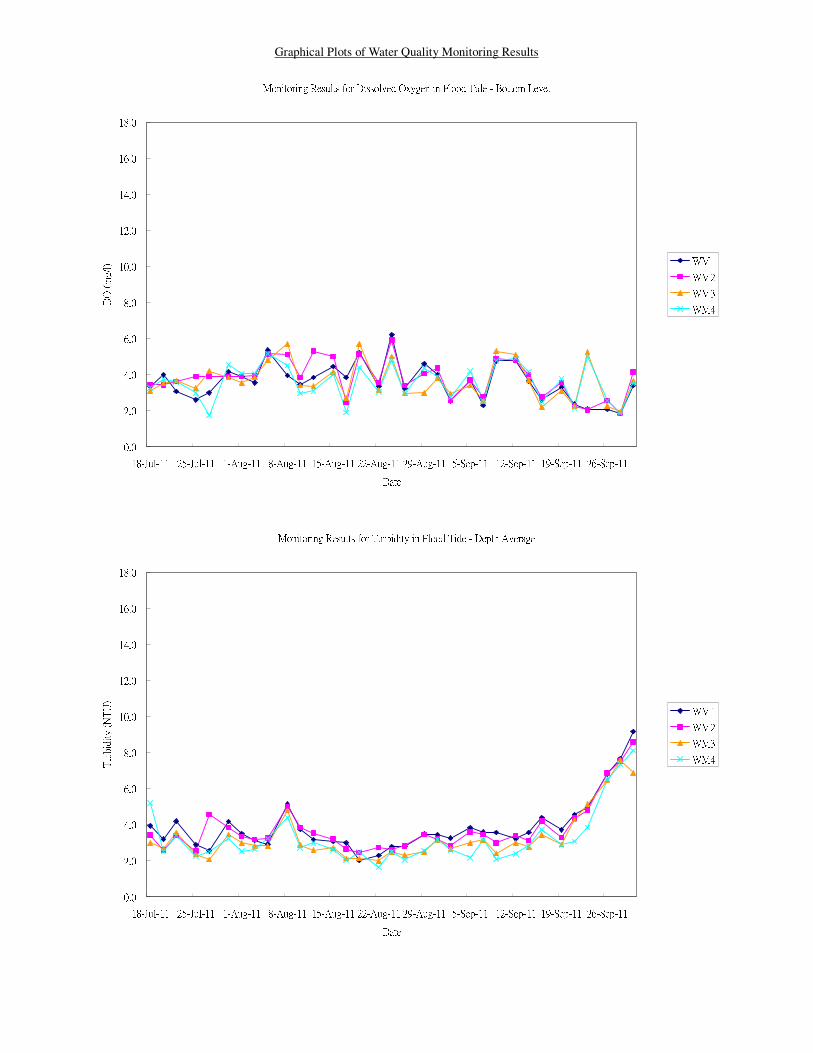
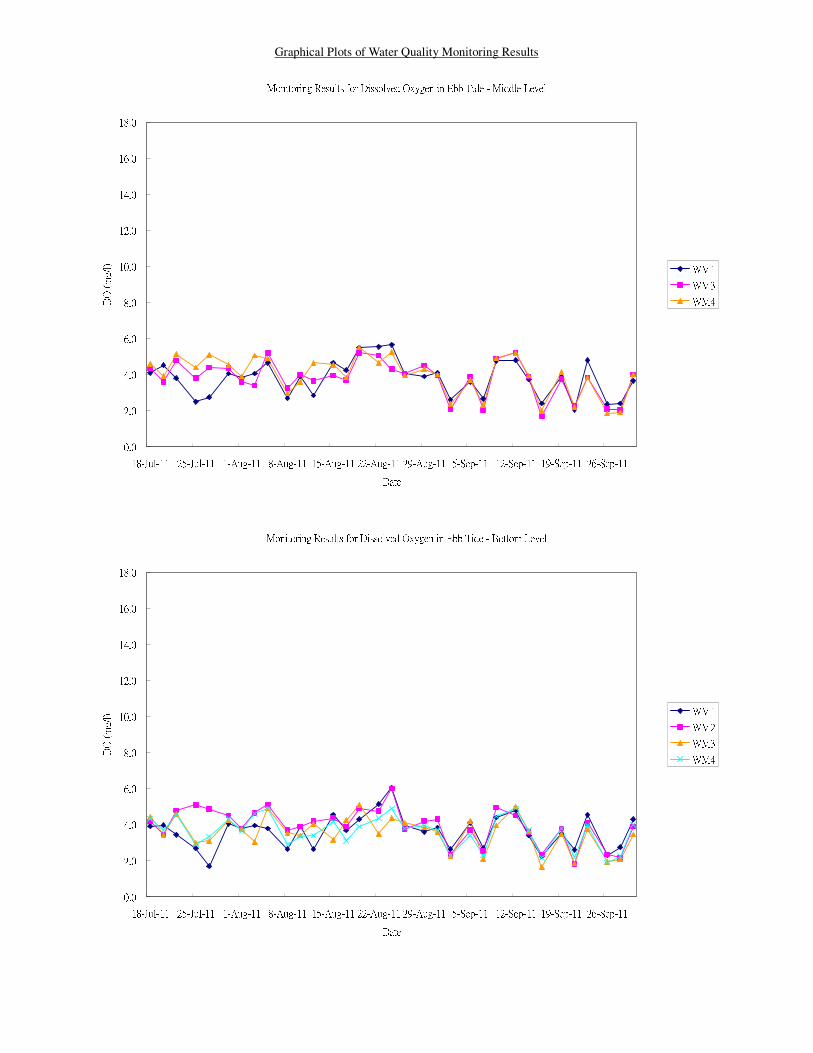
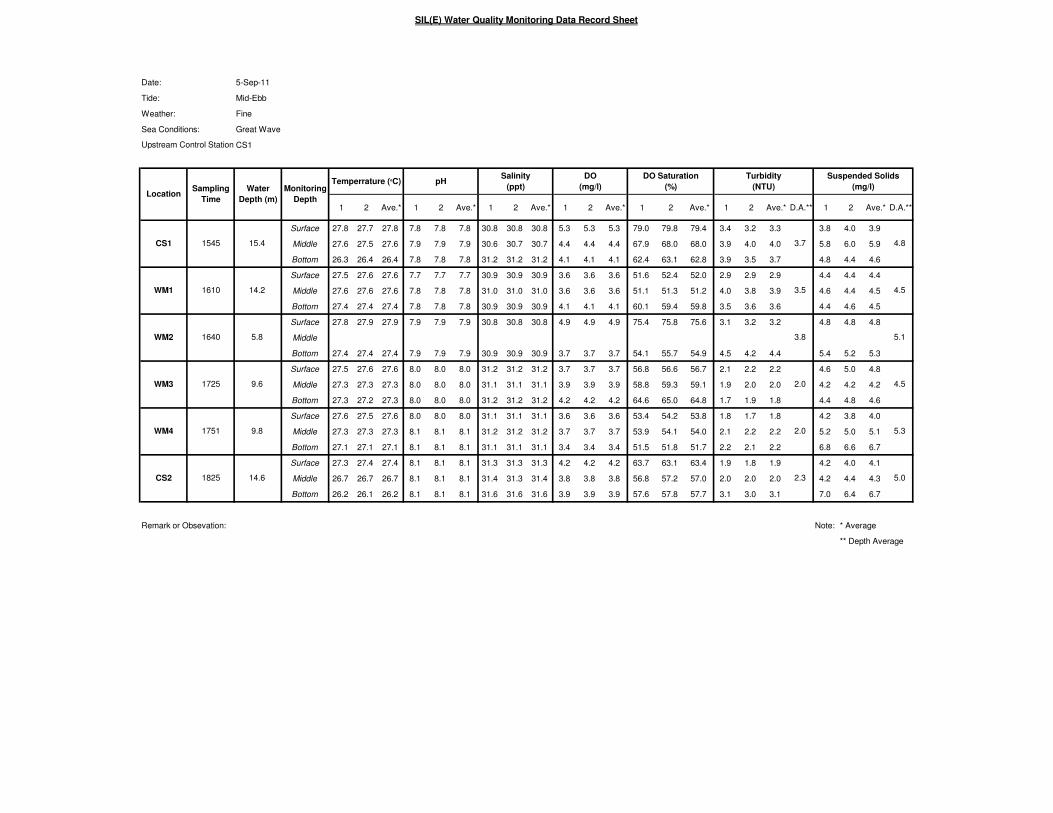
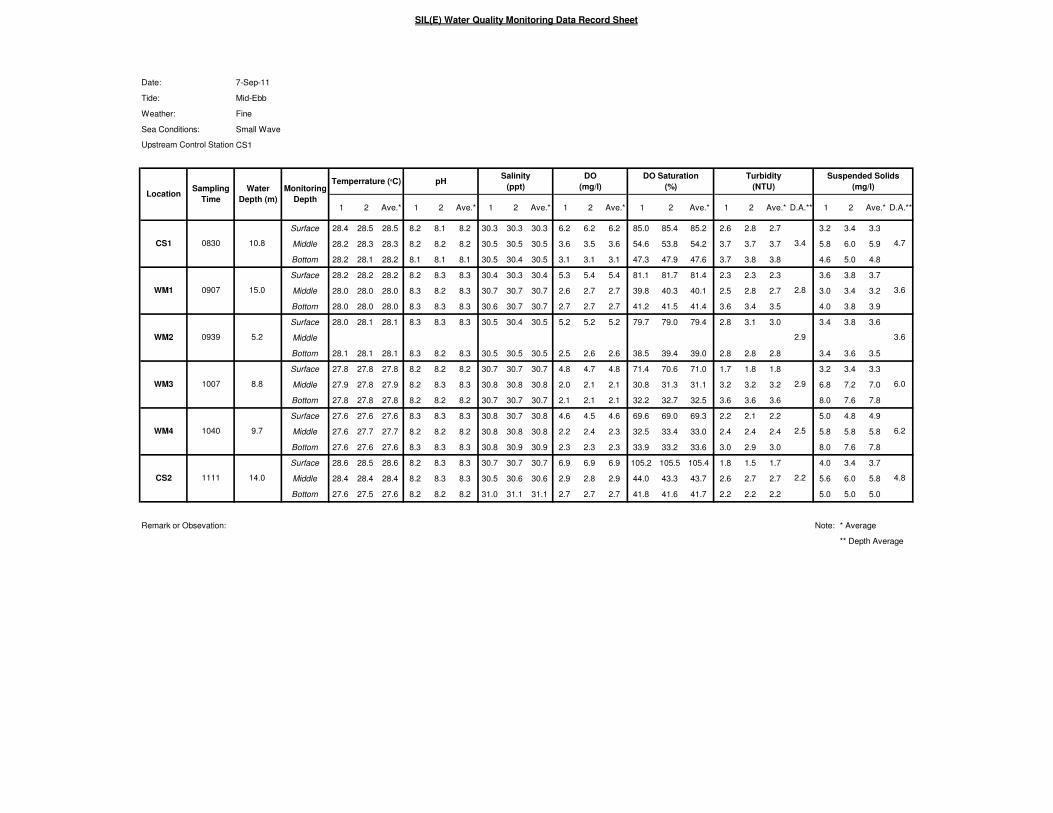
Impact water quality monitoring was undertaken in accordance with the EM&A Manual at the six designated monitoring locations at Aberdeen Channel as shown in Table 2 during the reporting period. Monitoring locations WM1-WM4 cover the Aberdeen West Typhoon Shelter, Wong Chuk Hang Nullah, WSD Brick Hill Seawater intake and Aberdeen South Typhoon Shelter while monitoring location CS1 and CS2 are the control stations. CS1 and CS2 are the upstream control stations for the Ebb and Flood tide conditions respectively. Monitoring results and graphical plots are presented in Appendix D.
3.4 Action taken in Event of Exceedence
There was no exceedance in air quality and noise monitoring parameters recorded in the reporting period, therefore no action was taken. Exceedances in DO against Action/ Limit Levels were recorded at monitoring stations WM1 to WM4 on 2nd, 5th, 7th, 9th, 12th, 14th, 16th, 19th, 21st, 23rd, 26th, 28th and 30th in the reporting month. The exceedances were considered not related to the project works. Please refer to Appendix E for the review of exceedance in water quality monitoring.
4 LANDSCAPE AND VISUAL 4.1 EM&A Requirements
The landscape and visual mitigation measures undertaken by the contractors during the construction phase have been audited on a regular basis according to the EM&A Manual.

13
4.2 Site Audit Results
Regular inspections and audits were conducted by the Certified Arborist as required by the EP and it was found that the transplanting works and the tree protection works being carried out by the civil works and transplantation contractors were in accordance with the EP/ EIA. No non compliance was identified in the reporting period. Retained Trees No immediate hazards were noted for any of the OVTs during reporting period. Health conditions of the two retained and pruned trees, Ficus elastica, located at Wong Chuk Hang San Wai have been monitored. The contractor was reminded to properly maintain the tree protection zone. Transplanted Tree Total of 323 trees of the SIL(E) had been transplanted as of the reporting month. They were mostly transplanted to the holding nursery at Chung Hom Shan and Kellett Bay, permanent receptor sites such as Lok Ma Chau or in-situ under project areas.
5 ECOLOGY 5.1 EM&A Requirements
Auditing of the ecological mitigation measures during the construction phase have been carried out on a regular basis according to the EM&A Manual.
5.2 Site Audit Results
Ardeid Night Roost Regular inspections to the works areas around the ardeid night roost have been conducted by the ecologist to check the ecological mitigation measures with regard to the ardeids at Wong Chuk Hang Nullah. Inspections of the ardeid night roost have been made for any active ardeid nests. Whilst ardeids have never been recorded nesting at this site, precautionary checks for active nests or signs of breeding have been made. Monthly monitoring of the ardeid night roost location was also conducted by the ecologist from a vantage point, the Ap Lei Chau Bridge (on the Wong Chuk Hang side), with an unobstructed view over the area. According to the EM&A Manual, the surveys have been commenced approximately one hour before sunset and continue for 20 minutes after sunset, or until nightfall, which comes sooner. Any aggregation of night roosting ardeid in the degraded woodland or adjacent area have been located and counted. The monthly night ardeid survey was conducted on 15 September 2011 at 5:45 pm.. A total of 158 ardeids, all of which were Little Egrets, arrived at the roost location at Wong Chuk Hang Nullah and no ardeid breeding behaviour was recorded during the monitoring survey. Proper tree protection measures have been implemented as practical as possible by the contractor to the current and potential roost trees retained on site. However, potential risks of

14
some of these slope trees are noted and recommendation has been made to remove the these slope trees due to the safety concerns. Plant Species of Conservation Interest Detailed field survey led by the ecologist was undertaken in March and early May 2011 to ascertain the presence of any rare or protected flora species to be affected. The surveys covered all above ground works areas of the project and the survey results were presented in the Detailed Transplanting Baseline Survey Report submitted under the Environmental Permit. As in the Detailed Transplantating Baseline Survey Report, two plant species of conservation interest recorded in the degraded woodland to the south of Wong Chuk Hang Nullah, namely herb Houttuynia cordata and tree Aquilaria sinensis (including seedlings), and planted young tree Ailanthus fordii (including seedlings) recorded in a plantation area near Hong Kong Park will be influenced by the project works. Other plant species of conservation interest identified will be protected on-site and appropriate tree protection measures would be established if needed. Health condition of the most plant species generally remained unchanged as in the Detailed Transplanting Baseline Survey Report. However, it is noted that health condition of Ailanthus fordii (tree no. OCP-T2231), which is outside the active works area at Wong Chuk Hang San Wai, was found to be declining. Two Aquilaria sinensis, which are located outside the active works area to the north of Nam Fung Road, were also found in very poor health condition and suspected to be dead specimens. Regular monitoring on the transplanted H. cordata and the root-pruned Aq. sinensis has been conducted. The transplanted herb has sustained its colony well in the receptor site. A protection fence has been maintained around the receptor site. The two root-pruned, Aq. sinensis, have remained in fair health condition and have been supported by guying to ensure their stability on the slope.
6 WASTE MANAGEMENT Mitigation measures on waste management have been implemented in accordance with the site waste management plans for the respective civil works contracts. The C&D materials have been disposed of at the public fill reception facilities while C&D wastes have been disposed of at the landfills. Quantities of wastes disposed in the reporting period are summarized in the following table: Contract No Inert C&D
Materials Disposed at Public Fill (m3)
Inert C&D Materials Reused
(m3)
Non-inert Waste Disposed at Landfill (m3)
Chemical Waste to Designated Treatment Facility (litre)
Reporting Period: September 2011 Contract 901 N/A 1,458 30 N/A Contract 902 2,316 N/A 72 N/A Contract 903 27 2,931 197 N/A Contract 904 2,143 105 50 N/A Contract 907 27,917 989 64 400
7 RECORD OF ENVIRONMENTAL COMPLAINTS
No public environmental complaint was received in the reporting period.
15
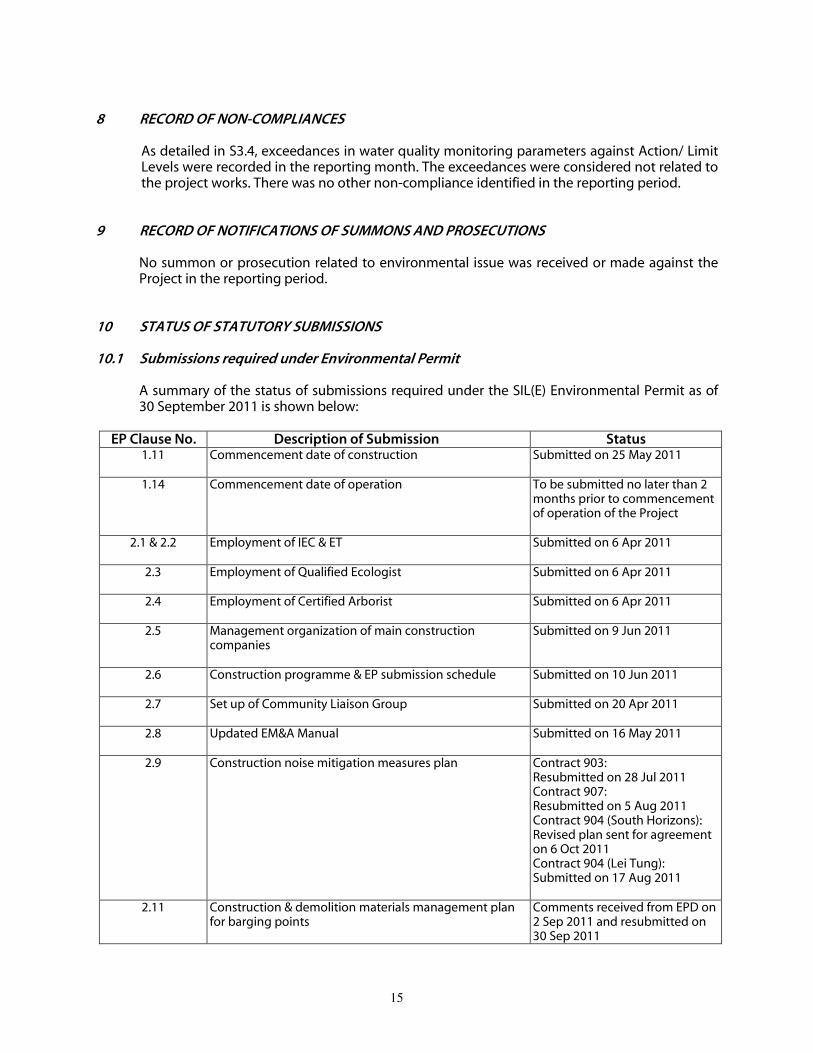
8 RECORD OF NON-COMPLIANCES
As detailed in S3.4, exceedances in water quality monitoring parameters against Action/ Limit Levels were recorded in the reporting month. The exceedances were considered not related to the project works. There was no other non-compliance identified in the reporting period.
9 RECORD OF NOTIFICATIONS OF SUMMONS AND PROSECUTIONS
No summon or prosecution related to environmental issue was received or made against the Project in the reporting period.
10 STATUS OF STATUTORY SUBMISSIONS 10.1 Submissions required under Environmental Permit
A summary of the status of submissions required under the SIL(E) Environmental Permit as of 30 September 2011 is shown below:
EP Clause No. Description of Submission Status 1.11 Commencement date of construction Submitted on 25 May 2011
1.14 Commencement date of operation To be submitted no later than 2
months prior to commencement of operation of the Project
2.1 & 2.2 Employment of IEC & ET Submitted on 6 Apr 2011
2.3 Employment of Qualified Ecologist Submitted on 6 Apr 2011
2.4 Employment of Certified Arborist Submitted on 6 Apr 2011
2.5 Management organization of main construction companies
Submitted on 9 Jun 2011
2.6 Construction programme & EP submission schedule Submitted on 10 Jun 2011
2.7 Set up of Community Liaison Group Submitted on 20 Apr 2011
2.8 Updated EM&A Manual Submitted on 16 May 2011
2.9 Construction noise mitigation measures plan Contract 903: Resubmitted on 28 Jul 2011 Contract 907: Resubmitted on 5 Aug 2011 Contract 904 (South Horizons): Revised plan sent for agreement on 6 Oct 2011 Contract 904 (Lei Tung): Submitted on 17 Aug 2011
2.11 Construction & demolition materials management plan for barging points
Comments received from EPD on 2 Sep 2011 and resubmitted on 30 Sep 2011
16
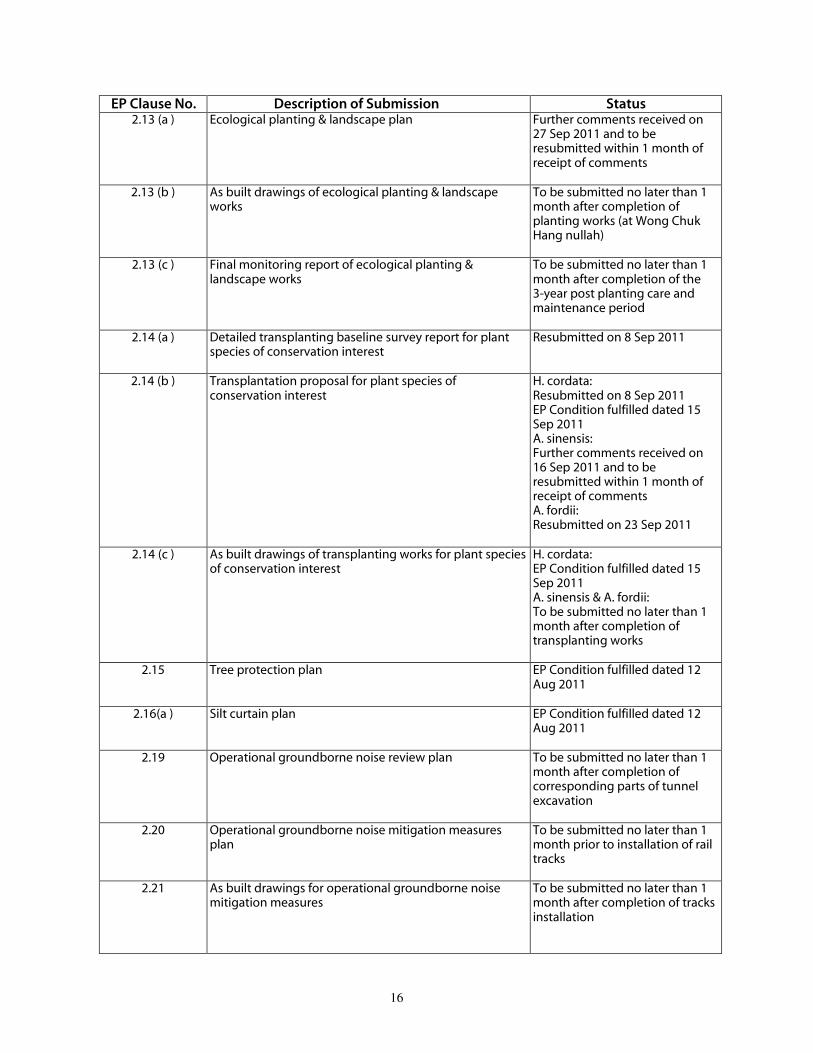
EP Clause No. Description of Submission Status 2.13 (a ) Ecological planting & landscape plan Further comments received on
27 Sep 2011 and to be resubmitted within 1 month of receipt of comments
2.13 (b ) As built drawings of ecological planting & landscape
works To be submitted no later than 1 month after completion of planting works (at Wong Chuk Hang nullah)
2.13 (c ) Final monitoring report of ecological planting & landscape works
To be submitted no later than 1 month after completion of the 3-year post planting care and maintenance period
2.14 (a ) Detailed transplanting baseline survey report for plant species of conservation interest
Resubmitted on 8 Sep 2011
2.14 (b ) Transplantation proposal for plant species of conservation interest
H. cordata: Resubmitted on 8 Sep 2011 EP Condition fulfilled dated 15 Sep 2011 A. sinensis: Further comments received on 16 Sep 2011 and to be resubmitted within 1 month of receipt of comments A. fordii: Resubmitted on 23 Sep 2011
2.14 (c ) As built drawings of transplanting works for plant species of conservation interest
H. cordata: EP Condition fulfilled dated 15 Sep 2011 A. sinensis & A. fordii: To be submitted no later than 1 month after completion of transplanting works
2.15 Tree protection plan EP Condition fulfilled dated 12 Aug 2011
2.16(a ) Silt curtain plan EP Condition fulfilled dated 12 Aug 2011
2.19 Operational groundborne noise review plan To be submitted no later than 1 month after completion of corresponding parts of tunnel excavation
2.20 Operational groundborne noise mitigation measures plan
To be submitted no later than 1 month prior to installation of rail tracks
2.21 As built drawings for operational groundborne noise mitigation measures
To be submitted no later than 1 month after completion of tracks installation
17
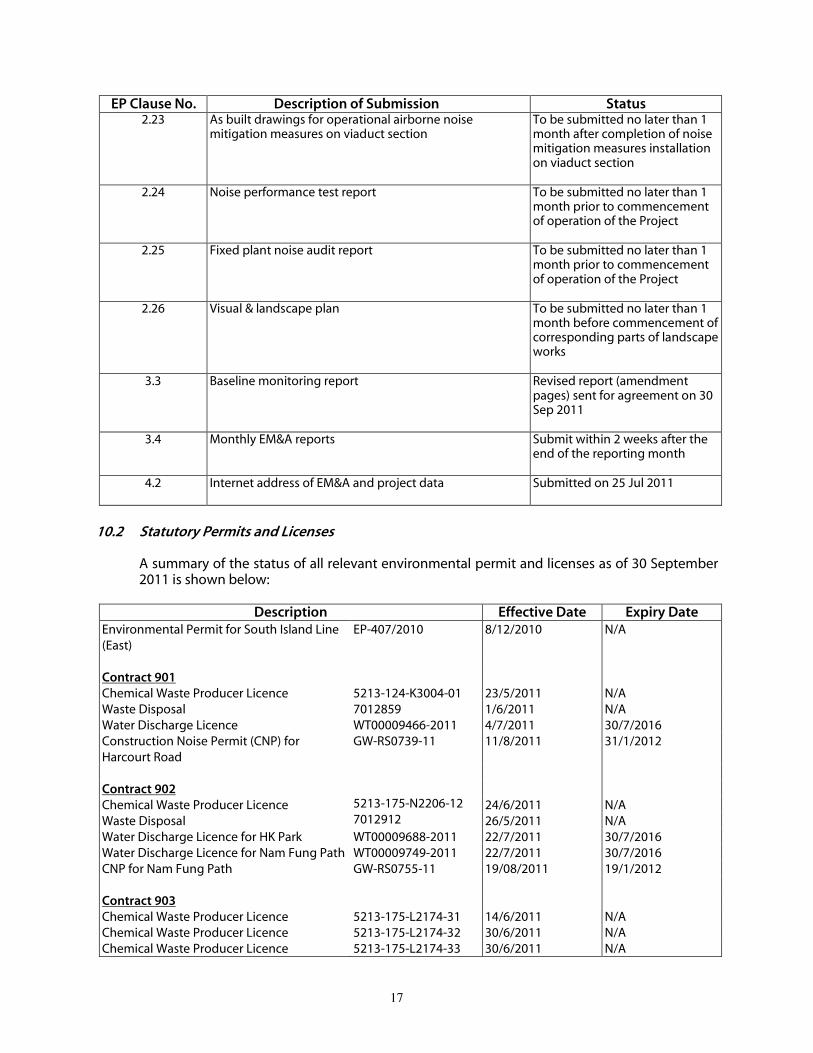
EP Clause No. Description of Submission Status 2.23 As built drawings for operational airborne noise
mitigation measures on viaduct section To be submitted no later than 1 month after completion of noise mitigation measures installation on viaduct section
2.24 Noise performance test report To be submitted no later than 1 month prior to commencement of operation of the Project
2.25 Fixed plant noise audit report To be submitted no later than 1 month prior to commencement of operation of the Project
2.26 Visual & landscape plan To be submitted no later than 1 month before commencement of corresponding parts of landscape works
3.3 Baseline monitoring report Revised report (amendment pages) sent for agreement on 30 Sep 2011
3.4 Monthly EM&A reports Submit within 2 weeks after the end of the reporting month
4.2 Internet address of EM&A and project data Submitted on 25 Jul 2011
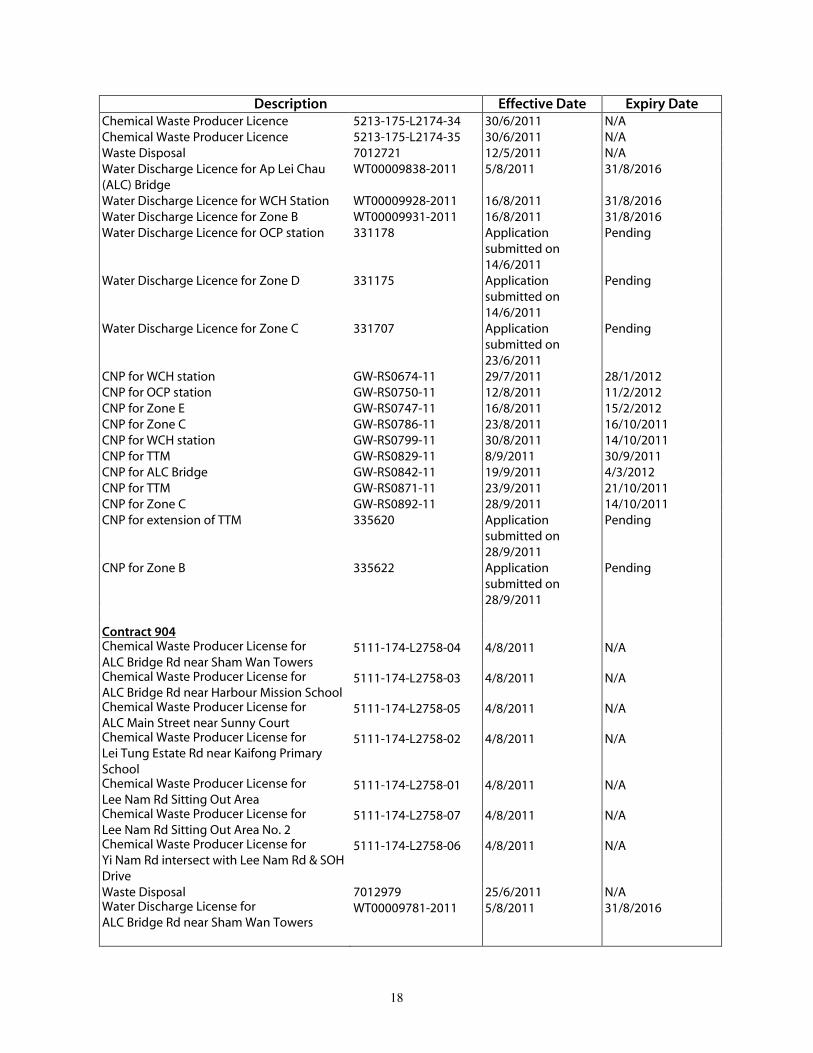
10.2 Statutory Permits and Licenses
A summary of the status of all relevant environmental permit and licenses as of 30 September 2011 is shown below:
Description Effective Date Expiry Date Environmental Permit for South Island Line (East)
EP-407/2010 8/12/2010 N/A
Contract 901 Chemical Waste Producer Licence 5213-124-K3004-01 23/5/2011 N/A Waste Disposal 7012859 1/6/2011 N/A Water Discharge Licence WT00009466-2011 4/7/2011 30/7/2016 Construction Noise Permit (CNP) for Harcourt Road
GW-RS0739-11 11/8/2011 31/1/2012
Contract 902 Chemical Waste Producer Licence 5213-175-N2206-12 24/6/2011 N/A Waste Disposal 7012912 26/5/2011 N/A Water Discharge Licence for HK Park WT00009688-2011 22/7/2011 30/7/2016 Water Discharge Licence for Nam Fung Path WT00009749-2011 22/7/2011 30/7/2016 CNP for Nam Fung Path GW-RS0755-11 19/08/2011 19/1/2012 Contract 903 Chemical Waste Producer Licence 5213-175-L2174-31 14/6/2011 N/A Chemical Waste Producer Licence 5213-175-L2174-32 30/6/2011 N/A Chemical Waste Producer Licence 5213-175-L2174-33 30/6/2011 N/A
18
Description Effective Date Expiry Date Chemical Waste Producer Licence 5213-175-L2174-34 30/6/2011 N/A Chemical Waste Producer Licence 5213-175-L2174-35 30/6/2011 N/A Waste Disposal 7012721 12/5/2011 N/A Water Discharge Licence for Ap Lei Chau (ALC) Bridge
WT00009838-2011 5/8/2011 31/8/2016
Water Discharge Licence for WCH Station WT00009928-2011 16/8/2011 31/8/2016 Water Discharge Licence for Zone B WT00009931-2011 16/8/2011 31/8/2016 Water Discharge Licence for OCP station 331178 Application
submitted on 14/6/2011
Pending
Water Discharge Licence for Zone D 331175 Application submitted on 14/6/2011
Pending
Water Discharge Licence for Zone C 331707 Application submitted on 23/6/2011
Pending
CNP for WCH station GW-RS0674-11 29/7/2011 28/1/2012 CNP for OCP station GW-RS0750-11 12/8/2011 11/2/2012 CNP for Zone E GW-RS0747-11 16/8/2011 15/2/2012 CNP for Zone C GW-RS0786-11 23/8/2011 16/10/2011 CNP for WCH station GW-RS0799-11 30/8/2011 14/10/2011 CNP for TTM GW-RS0829-11 8/9/2011 30/9/2011 CNP for ALC Bridge GW-RS0842-11 19/9/2011 4/3/2012 CNP for TTM GW-RS0871-11 23/9/2011 21/10/2011 CNP for Zone C GW-RS0892-11 28/9/2011 14/10/2011 CNP for extension of TTM 335620 Application
submitted on 28/9/2011
Pending
CNP for Zone B 335622 Application submitted on 28/9/2011
Pending
Contract 904 Chemical Waste Producer License for
ALC Bridge Rd near Sham Wan Towers 5111-174-L2758-04 4/8/2011 N/A
Chemical Waste Producer License for ALC Bridge Rd near Harbour Mission School
5111-174-L2758-03 4/8/2011 N/A
Chemical Waste Producer License for ALC Main Street near Sunny Court
5111-174-L2758-05 4/8/2011 N/A
Chemical Waste Producer License for Lei Tung Estate Rd near Kaifong Primary School
5111-174-L2758-02 4/8/2011 N/A
Chemical Waste Producer License for Lee Nam Rd Sitting Out Area
5111-174-L2758-01 4/8/2011 N/A
Chemical Waste Producer License for Lee Nam Rd Sitting Out Area No. 2
5111-174-L2758-07 4/8/2011 N/A
Chemical Waste Producer License for Yi Nam Rd intersect with Lee Nam Rd & SOH Drive
5111-174-L2758-06 4/8/2011 N/A
Waste Disposal 7012979 25/6/2011 N/A Water Discharge License for ALC Bridge Rd near Sham Wan Towers
WT00009781-2011 5/8/2011 31/8/2016
19
Description Effective Date Expiry Date Water Discharge License for ALC Bridge Rd near Harbour Mission School
WT00009778-2011 5/8/2011 31/8/2016
Water Discharge License for ALC Main Street near Sunny Court
WT00009777-2011 5/8/2011 31/8/2016
Water Discharge License for Lei Tung Estate Rd near Kaifong Primary School
WT00009780-2011 5/8/2011 31/8/2016
Water Discharge License for Lee Nam Rd Sitting Out Area
WT00009779-2011 5/8/2011 31/8/2016
Water Discharge License for Lee Nam Rd Sitting Out Area No. 2
WT00009783-2011 5/8/2011 31/8/2016
Water Discharge License for Yi Nam Rd intersect with Lee Nam Rd & SOH Drive
WT00009775-2011 5/8/2011 31/8/2016
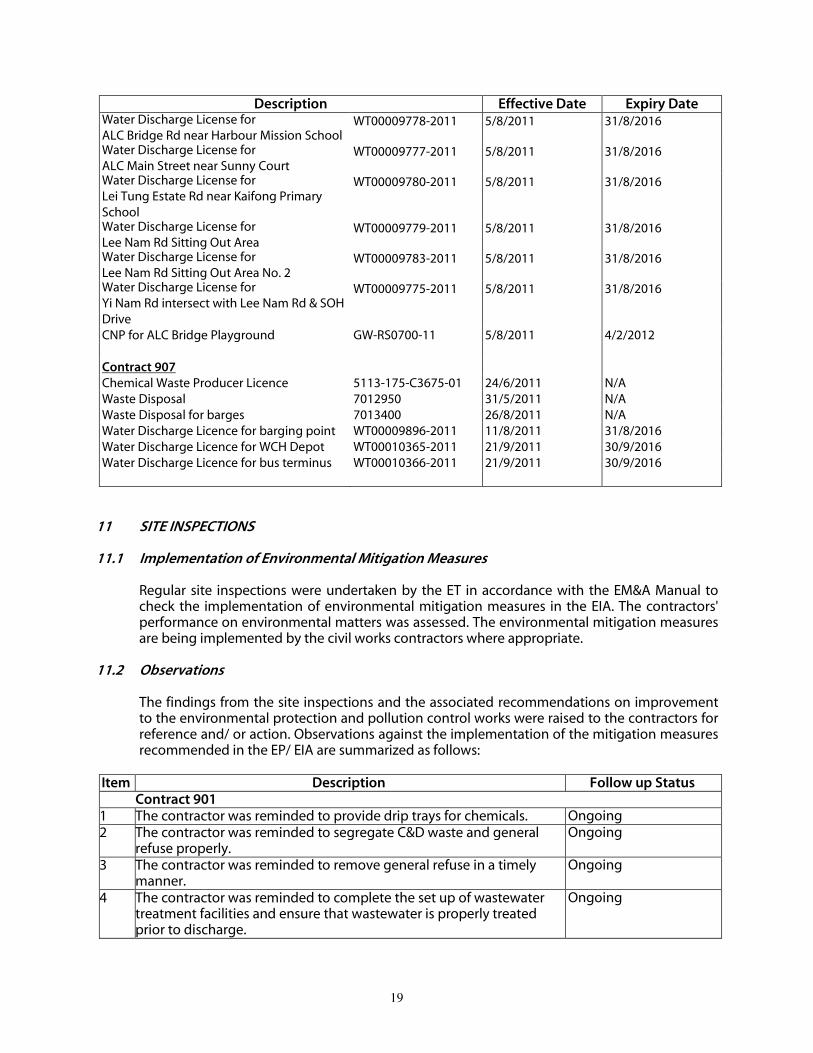
CNP for ALC Bridge Playground GW-RS0700-11 5/8/2011 4/2/2012 Contract 907 Chemical Waste Producer Licence 5113-175-C3675-01 24/6/2011 N/A Waste Disposal 7012950 31/5/2011 N/A Waste Disposal for barges 7013400 26/8/2011 N/A Water Discharge Licence for barging point WT00009896-2011 11/8/2011 31/8/2016 Water Discharge Licence for WCH Depot WT00010365-2011 21/9/2011 30/9/2016 Water Discharge Licence for bus terminus WT00010366-2011 21/9/2011 30/9/2016
11 SITE INSPECTIONS
11.1 Implementation of Environmental Mitigation Measures Regular site inspections were undertaken by the ET in accordance with the EM&A Manual to check the implementation of environmental mitigation measures in the EIA. The contractors' performance on environmental matters was assessed. The environmental mitigation measures are being implemented by the civil works contractors where appropriate.
11.2 Observations The findings from the site inspections and the associated recommendations on improvement to the environmental protection and pollution control works were raised to the contractors for reference and/ or action. Observations against the implementation of the mitigation measures recommended in the EP/ EIA are summarized as follows:
Item Description Follow up Status Contract 901
1 The contractor was reminded to provide drip trays for chemicals. Ongoing 2 The contractor was reminded to segregate C&D waste and general
refuse properly. Ongoing
3 The contractor was reminded to remove general refuse in a timely manner.
Ongoing
4 The contractor was reminded to complete the set up of wastewater treatment facilities and ensure that wastewater is properly treated prior to discharge.
Ongoing
20
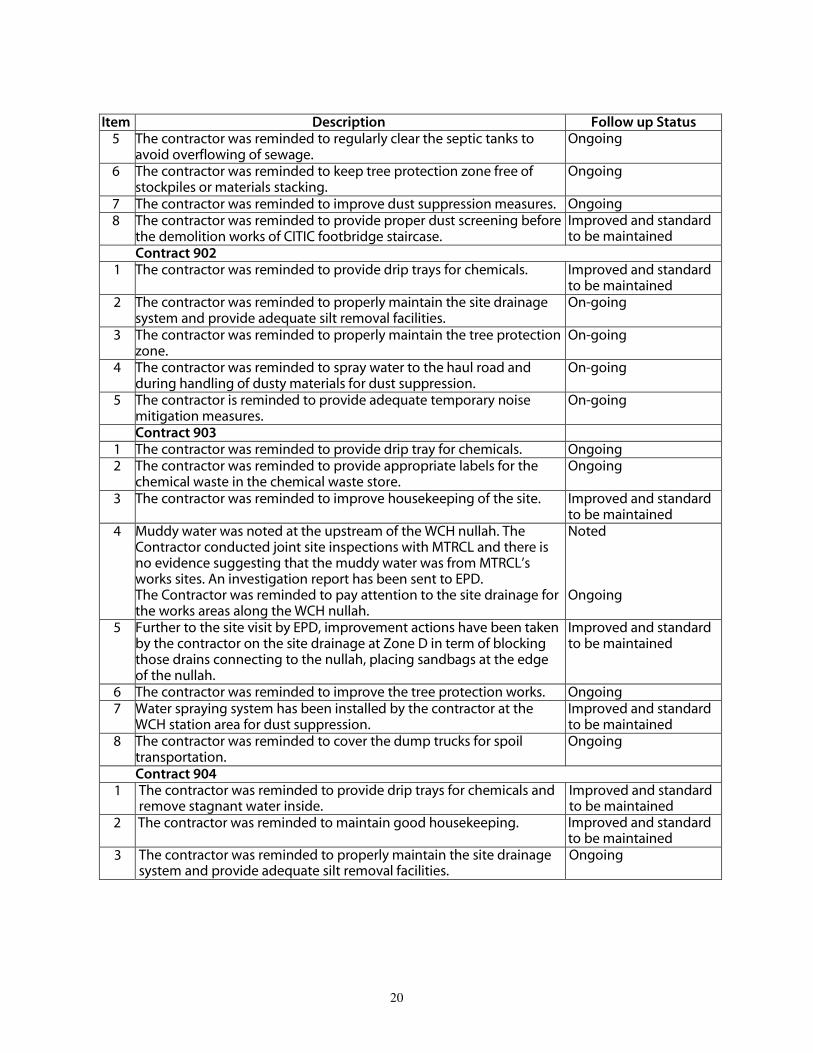
Item Description Follow up Status 5 The contractor was reminded to regularly clear the septic tanks to
avoid overflowing of sewage. Ongoing
6 The contractor was reminded to keep tree protection zone free of stockpiles or materials stacking.
Ongoing
7 The contractor was reminded to improve dust suppression measures. Ongoing 8 The contractor was reminded to provide proper dust screening before
the demolition works of CITIC footbridge staircase. Improved and standard to be maintained
Contract 902 1 The contractor was reminded to provide drip trays for chemicals. Improved and standard
to be maintained 2 The contractor was reminded to properly maintain the site drainage
system and provide adequate silt removal facilities. On-going
3 The contractor was reminded to properly maintain the tree protection zone.
On-going
4 The contractor was reminded to spray water to the haul road and during handling of dusty materials for dust suppression.
On-going
5 The contractor is reminded to provide adequate temporary noise mitigation measures.
On-going
Contract 903 1 The contractor was reminded to provide drip tray for chemicals. Ongoing 2 The contractor was reminded to provide appropriate labels for the
chemical waste in the chemical waste store. Ongoing
3 The contractor was reminded to improve housekeeping of the site. Improved and standard to be maintained
4 Muddy water was noted at the upstream of the WCH nullah. The Contractor conducted joint site inspections with MTRCL and there is no evidence suggesting that the muddy water was from MTRCL’s works sites. An investigation report has been sent to EPD. The Contractor was reminded to pay attention to the site drainage for the works areas along the WCH nullah.
Noted Ongoing
5 Further to the site visit by EPD, improvement actions have been taken by the contractor on the site drainage at Zone D in term of blocking those drains connecting to the nullah, placing sandbags at the edge of the nullah.
Improved and standard to be maintained
6 The contractor was reminded to improve the tree protection works. Ongoing 7 Water spraying system has been installed by the contractor at the
WCH station area for dust suppression. Improved and standard to be maintained
8 The contractor was reminded to cover the dump trucks for spoil transportation.
Ongoing
Contract 904 1 The contractor was reminded to provide drip trays for chemicals and
remove stagnant water inside. Improved and standard to be maintained
2 The contractor was reminded to maintain good housekeeping. Improved and standard to be maintained
3 The contractor was reminded to properly maintain the site drainage system and provide adequate silt removal facilities.
Ongoing

21
Item Description Follow up Status 4 The contractor was reminded to improve dust suppression measures. Ongoing 5 The contractor was reminded to provide adequate temporary noise
barrier. Ongoing
Contract 907 1 The contractor was reminded to provide drip tray for chemicals. Ongoing 2 The contractor was reminded to provide drip tray / tarpaulin sheet
during equipment maintenance works to prevent oil leakage. Ongoing
3 The contractor was reminded to provide appropriate labels for the chemical waste in the chemical waste store.
Improved and standard to be maintained
4 The contractor was reminded to maintain good housekeeping. Ongoing 5 The contractor was reminded to spray water to the haul/ access roads
for dust suppression. Improved and standard to be maintained
6 Movable noise barriers have been provided for the designated PMEs. In addition, the contractor was reminded to provide adequate acoustic fabric for the piling machine.
Ongoing
11.3 Solid and Liquid Waste Management Status Base on the findings of the site inspections, the Contractors’ performance in solid and liquid waste management were acceptable and compliance with the EIA requirements were demonstrated. The current management standard should be maintained.
11.4 Other Notable Events IEC Site Inspections The IEC conducted site inspections for respective works areas on 5, 7, 14, 15 and 20 September 2011. Minor irregularities including provision of movable noise barriers as necessary, paying attention to the tree protection zone were observed during the site inspections. Follow up actions had been taken by the respective civil works contractors.
12 FUTURE KEY ISSUES Future key issues envisaged in the coming month include noise and dust emission from site works, disposal of C&D wastes arising as well as tree protection on site. The ET will continue the implementation of the EM&A programme in accordance to the EM&A Manual.
13 CONCLUSIONS It is concluded from the environmental monitoring and audit works for the SIL(E) Project that the construction works were undertaken in an appropriately environmentally sensitive manner in the reporting period. The environmental protection and pollution control measures provided by the respective civil works contractors were generally acceptable apart from some minor irregularities which were rectified timely by the contractors. The ET will continue the implementation of the EM&A programme in accordance to the EM&A Manual and to a level consistent with MTRCL's Corporate Sustainability Policy.
FIGURES
Figures 1 to 2 Works Areas of the Project
Figures 3 to 6
Location of Construction Air Quality Monitoring Stations
Figures 7 to 8
Location of Construction Noise Monitoring Stations
Figure 9
Location of Water Quality Monitoring Stations
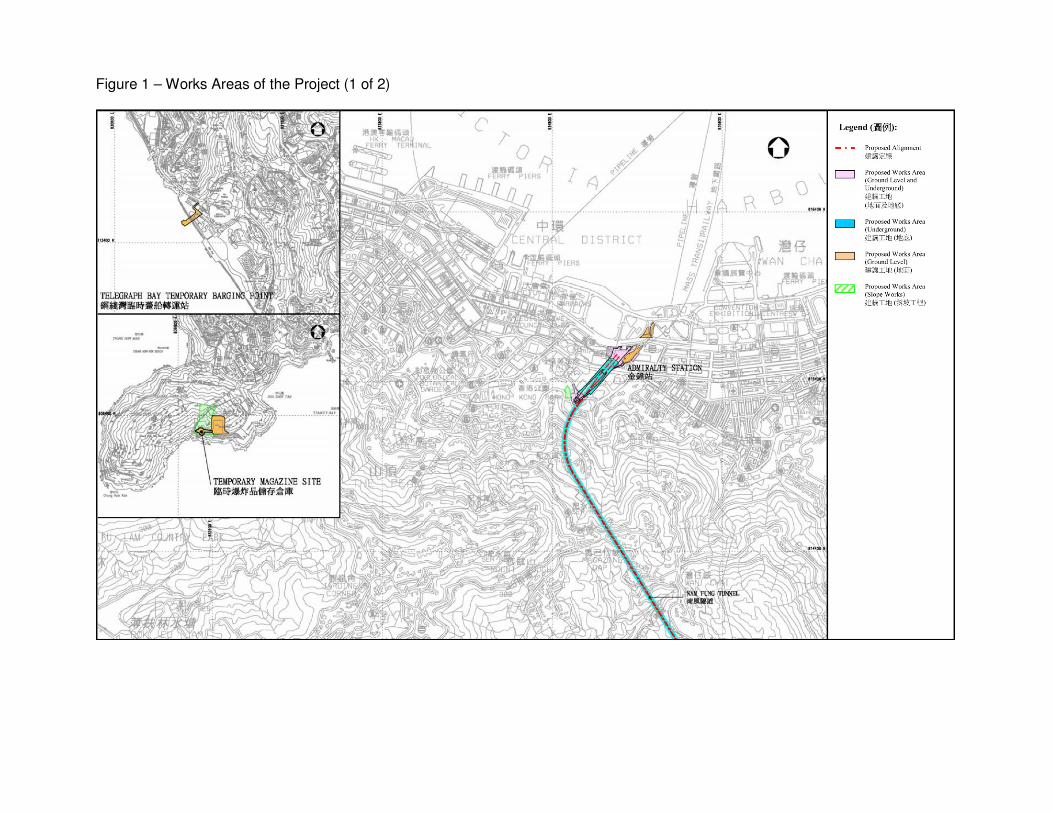
Figure 1 – Works Areas of the Project (1 of 2)
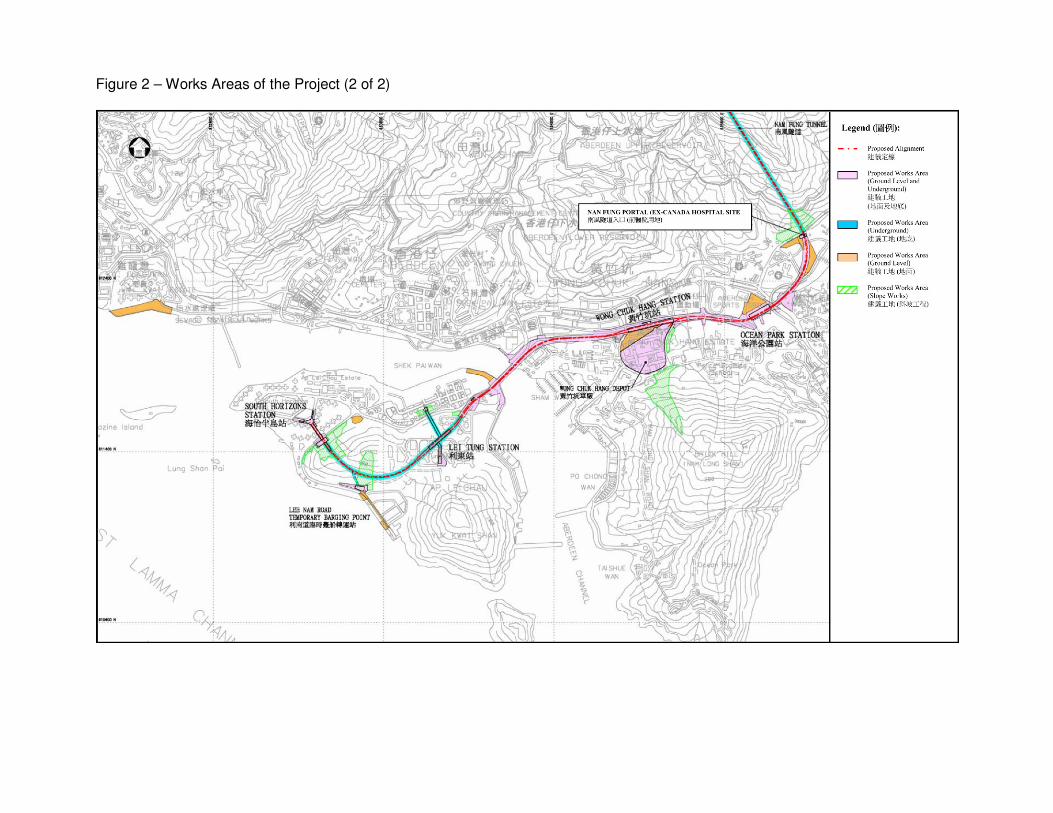
Figure 2 – Works Areas of the Project (2 of 2)
Figure 3 – Location of Construction Air Quality Monitoring Stations (1 of 4)
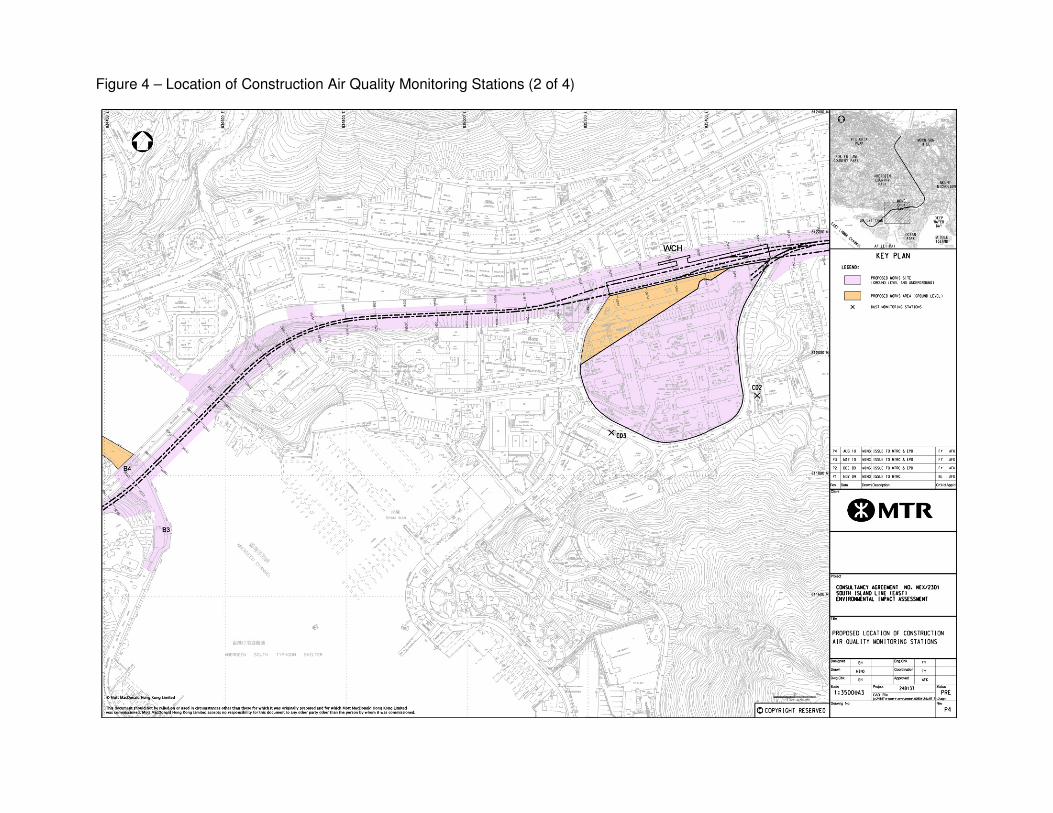
Figure 4 – Location of Construction Air Quality Monitoring Stations (2 of 4)

Figure 5 – Location of Construction Air Quality Monitoring Stations (3 of 4)

Figure 6 – Location of Construction Air Quality Monitoring Stations (4 of 4)
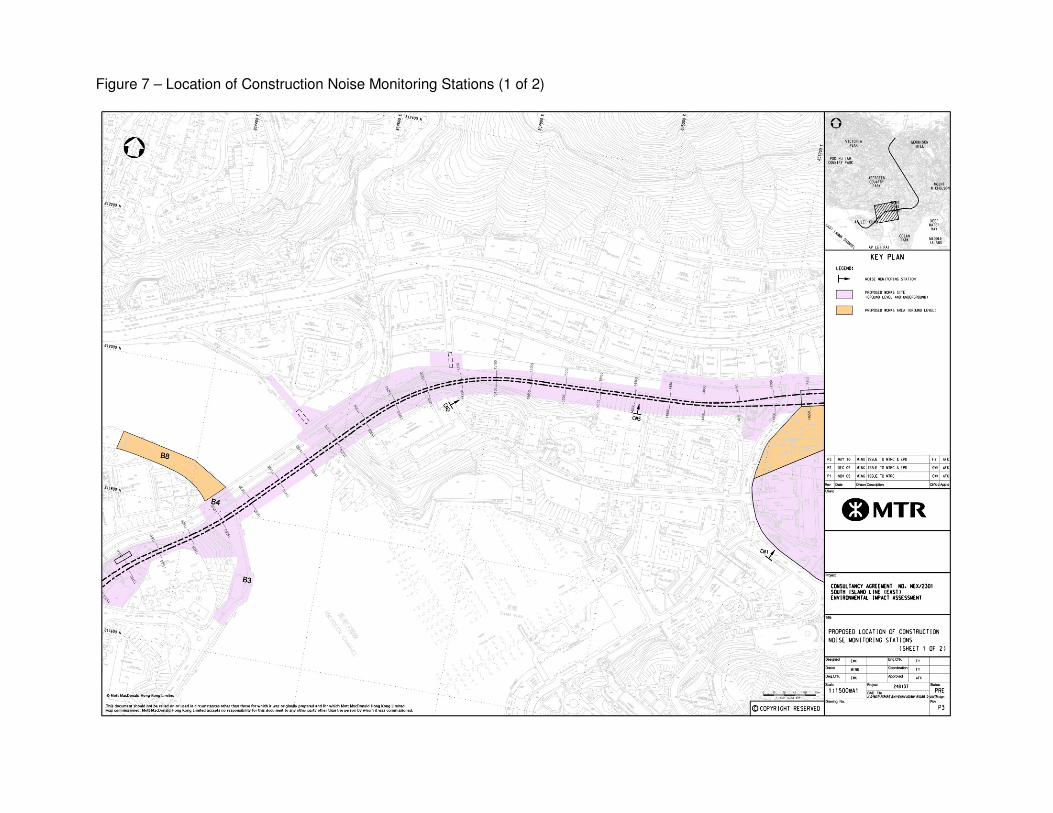
Figure 7 – Location of Construction Noise Monitoring Stations (1 of 2)
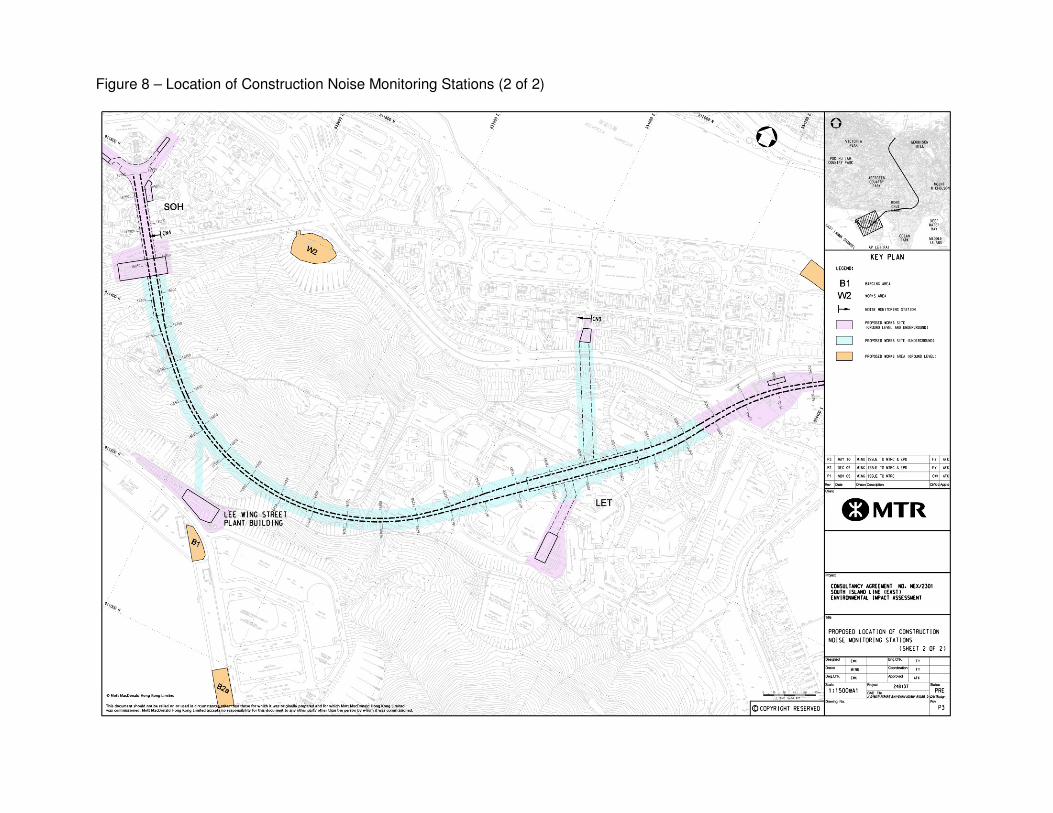
Figure 8 – Location of Construction Noise Monitoring Stations (2 of 2)
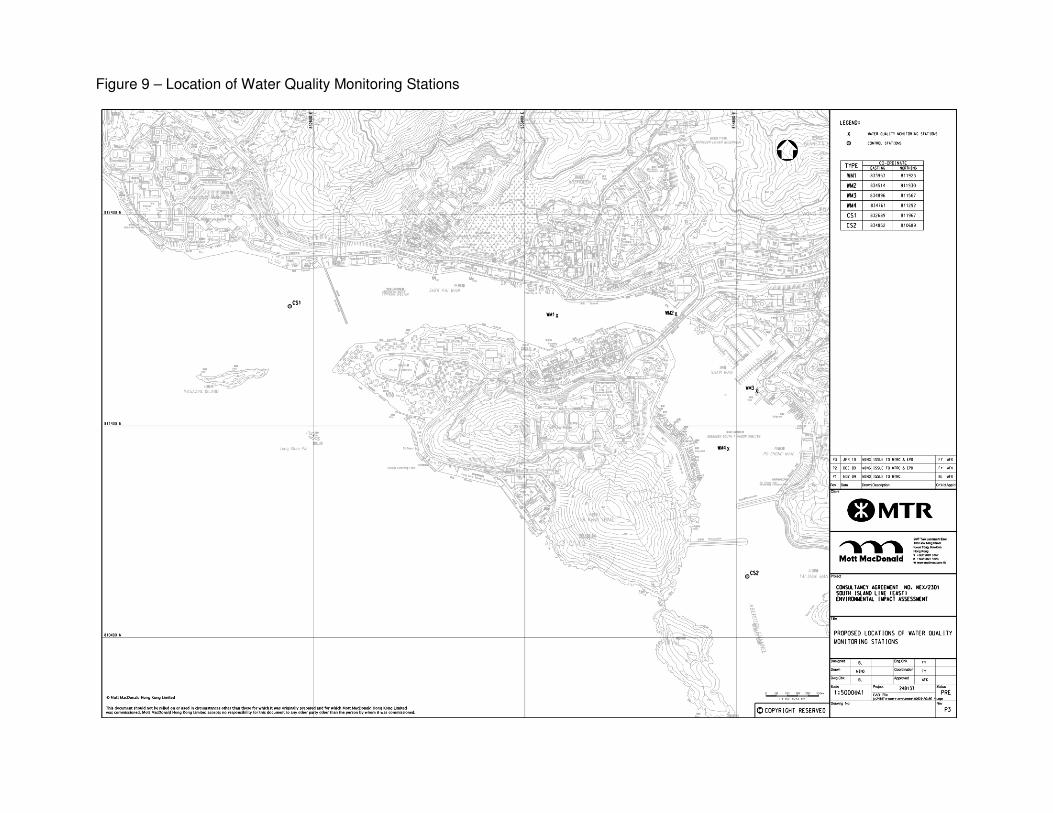
Figure 9 – Location of Water Quality Monitoring Stations

APPENDIX A1
Project Organization
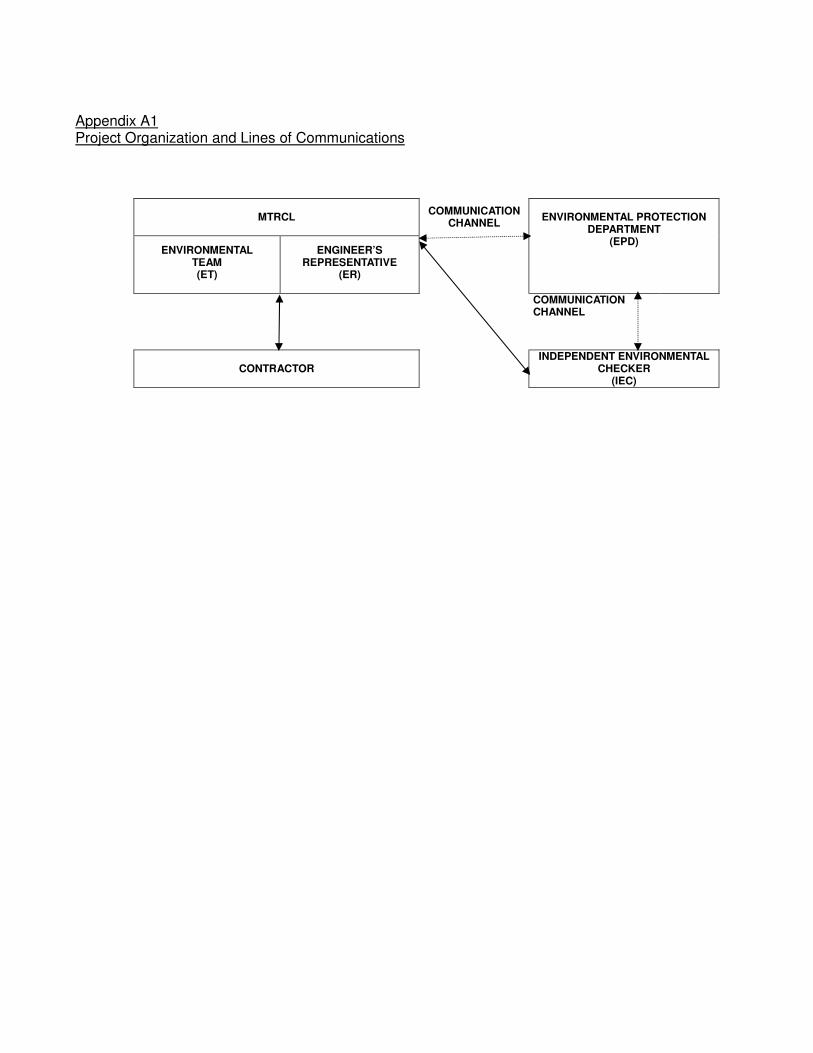
Appendix A1 Project Organization and Lines of Communications
MTRCL
COMMUNICATION CHANNEL
ENVIRONMENTAL TEAM (ET)
ENGINEER’S REPRESENTATIVE
(ER)
ENVIRONMENTAL PROTECTION
DEPARTMENT (EPD)
COMMUNICATION CHANNEL
CONTRACTOR
INDEPENDENT ENVIRONMENTAL CHECKER
(IEC)
APPENDIX A2
Contact List of Key Personal of the Project

Appendix A2 Contact List of Key Personnel
Table A2.1 Contact List of Key Personnel of Project Management
Organization Name Telephone
Independent Environmental Checker Mr. Thomas Chan 2268 3093
Environmental Team Leader Dr. Glenn Frommer 2688 1552
Mr. Richard Kwan
(with effective from 1 Oct 2011)
2688 1179
Engineer’s Representative
Project Manager – SIL Civil Mr. Mark Cuzner 3987 8288
Construction Manager – SIL (901) Mr. Neil Smith 2206 8688
Construction Manager – SIL (902 / 904) Mr. Ken Wong 3987 8388
Construction Manager – SIL (903 / 907 / 908) Mr. Kit Chan 2871 5888
Contract No. 901
Admiralty Integrated Station and SCL Enabling Works
Main Contractor: Kier – Laing O’Rourke – Kaden Joint Venture
Project Director Mr. Matthew Bowe 9726 6117
QA & Environmental Manager Mr. Ronald Fung 9777 7667
Contract No. 902
Nam Fung Tunnel and Ventilation Buildings
Main Contractor: Nishimatsu Construction Co., Ltd.
Contractors Representative Mr. Colin Birky 9641 2485
Project Manager Mr. Kozo Suguta 9227 9717
Contract No. 903
Ocean Park Station, Wong Chuk Hang Station, Viaduct and Aberdeen Channel Bridge
Main Contractor: Leighton Contractors (Asia) Ltd.
Project Director Mr. Paul Freeman 9856 1988
Project Manager, Stations and Nullah Mr. Ian Rawsthorne 9383 0735
Project Manager, Viaducts, Bridge and Precast Mr. Jon Kitching 9101 9013
Organization Name Telephone
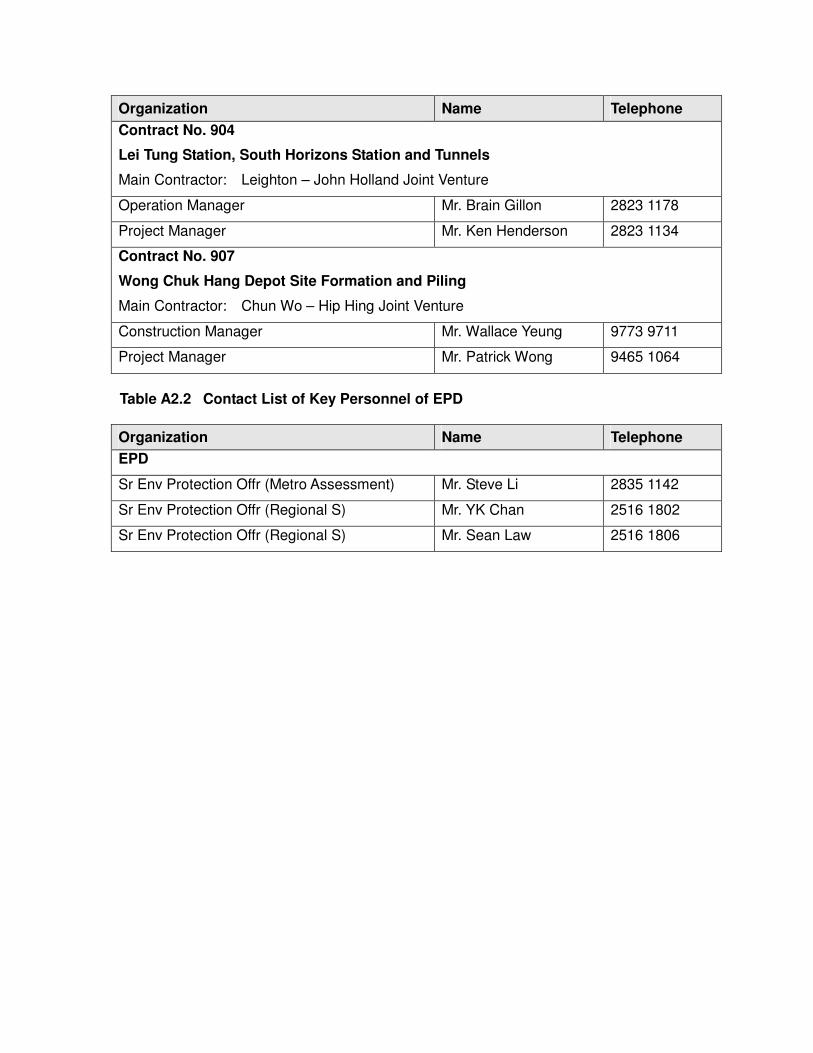
Contract No. 904
Lei Tung Station, South Horizons Station and Tunnels
Main Contractor: Leighton – John Holland Joint Venture
Operation Manager Mr. Brain Gillon 2823 1178
Project Manager Mr. Ken Henderson 2823 1134
Contract No. 907
Wong Chuk Hang Depot Site Formation and Piling
Main Contractor: Chun Wo – Hip Hing Joint Venture
Construction Manager Mr. Wallace Yeung 9773 9711
Project Manager Mr. Patrick Wong 9465 1064
Table A2.2 Contact List of Key Personnel of EPD
Organization Name Telephone
EPD
Sr Env Protection Offr (Metro Assessment) Mr. Steve Li 2835 1142
Sr Env Protection Offr (Regional S) Mr. YK Chan 2516 1802
Sr Env Protection Offr (Regional S) Mr. Sean Law 2516 1806
APPENDIX B1
Action and Limit Levels for Construction Noise and Air Quality
Appendix B1 Action and Limit Levels for Construction Noise and Air Quality
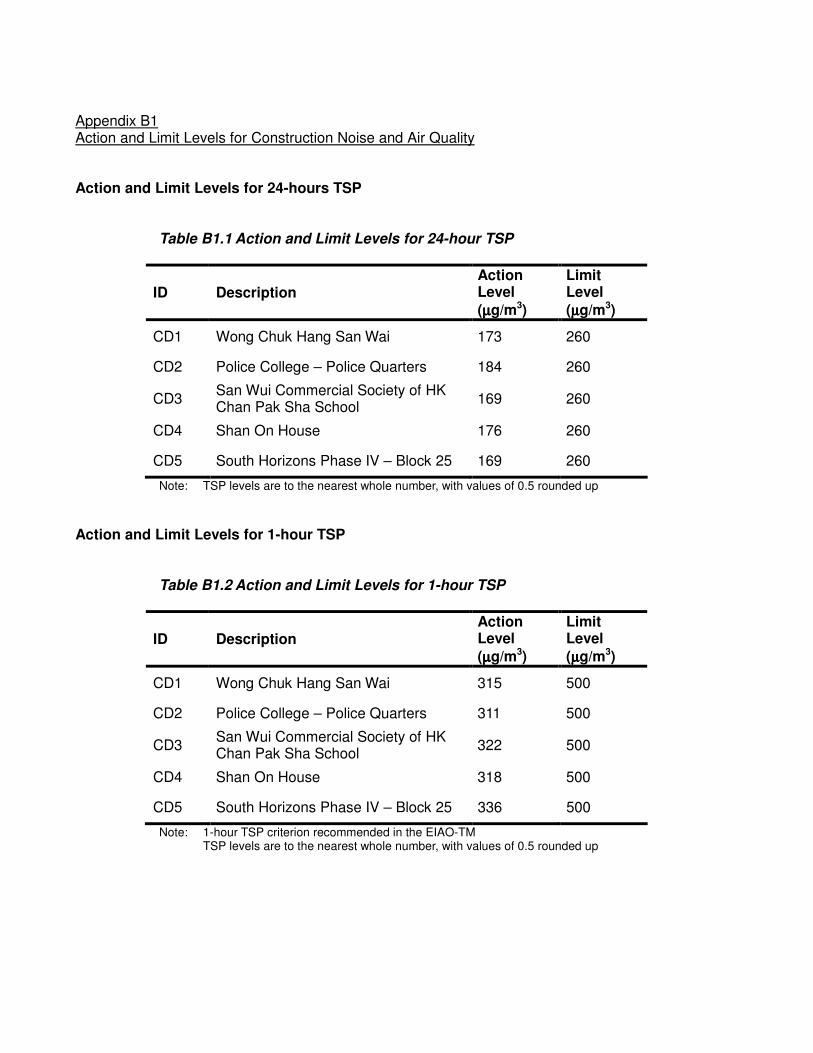
Action and Limit Levels for 24-hours TSP
Table B1.1 Action and Limit Levels for 24-hour TSP
ID Description Action Level
(µµµµg/m3)
Limit Level
(µµµµg/m3)
CD1 Wong Chuk Hang San Wai 173 260
CD2 Police College – Police Quarters 184 260
CD3 San Wui Commercial Society of HK Chan Pak Sha School
169 260
CD4 Shan On House 176 260
CD5 South Horizons Phase IV – Block 25 169 260
Note: TSP levels are to the nearest whole number, with values of 0.5 rounded up
Action and Limit Levels for 1-hour TSP
Table B1.2 Action and Limit Levels for 1-hour TSP
ID Description Action Level
(µµµµg/m3)
Limit Level
(µµµµg/m3)
CD1 Wong Chuk Hang San Wai 315 500
CD2 Police College – Police Quarters 311 500
CD3 San Wui Commercial Society of HK Chan Pak Sha School
322 500
CD4 Shan On House 318 500
CD5 South Horizons Phase IV – Block 25 336 500
Note: 1-hour TSP criterion recommended in the EIAO-TM TSP levels are to the nearest whole number, with values of 0.5 rounded up
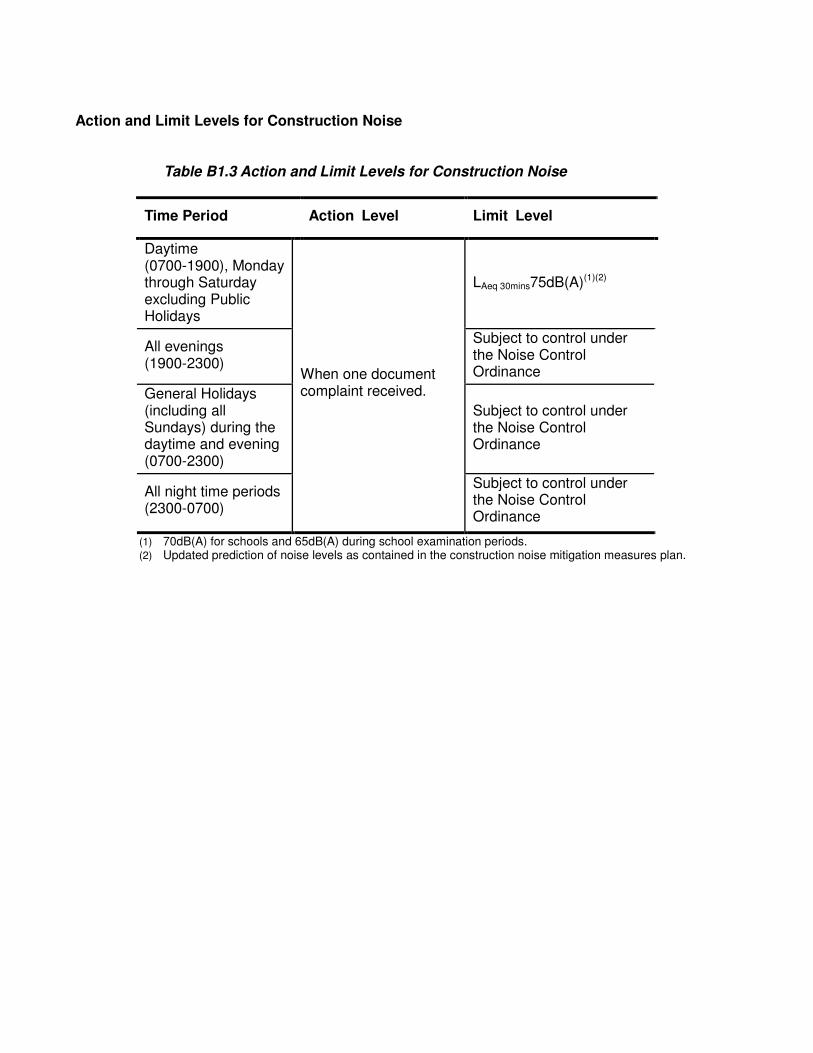
Action and Limit Levels for Construction Noise
Table B1.3 Action and Limit Levels for Construction Noise
Time Period Action Level Limit Level
Daytime (0700-1900), Monday through Saturday excluding Public Holidays
LAeq 30mins75dB(A)(1)(2)
All evenings (1900-2300)
Subject to control under the Noise Control Ordinance
General Holidays (including all Sundays) during the daytime and evening (0700-2300)
Subject to control under the Noise Control Ordinance
All night time periods (2300-0700)
When one document complaint received.
Subject to control under the Noise Control Ordinance
(1) 70dB(A) for schools and 65dB(A) during school examination periods. (2) Updated prediction of noise levels as contained in the construction noise mitigation measures plan.
APPENDIX B2
Action and Limit Levels for Water Quality
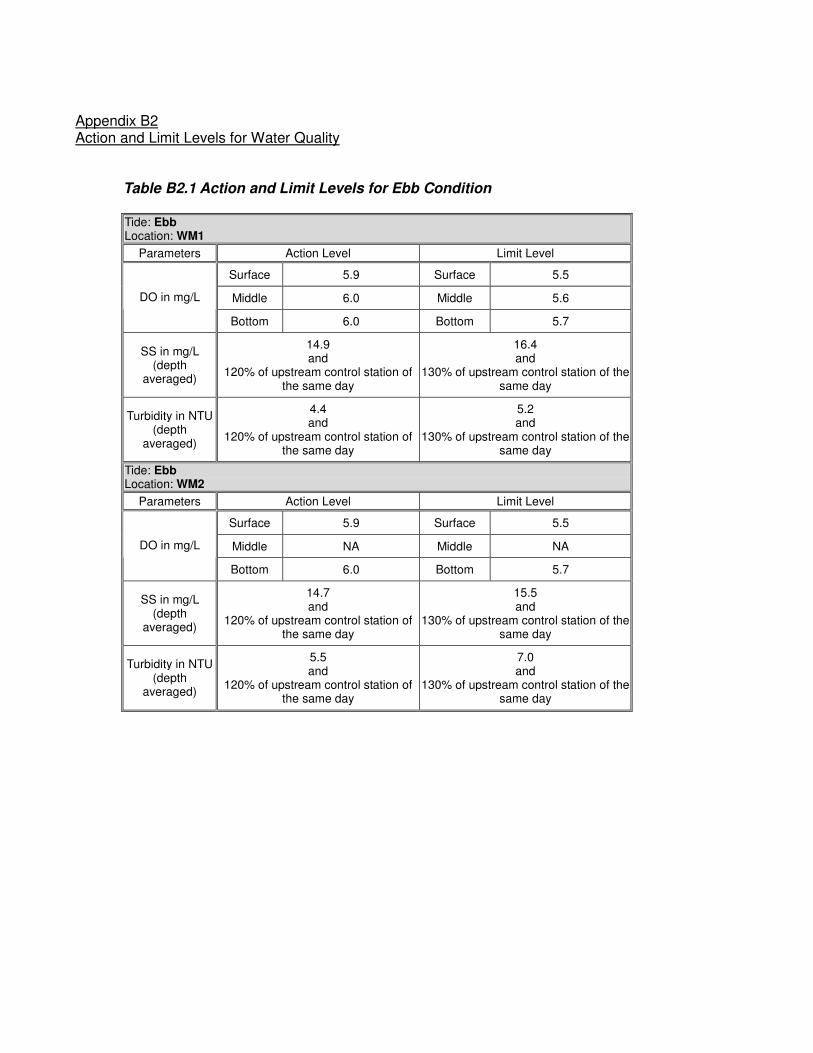
Appendix B2 Action and Limit Levels for Water Quality
Table B2.1 Action and Limit Levels for Ebb Condition Tide: Ebb Location: WM1
Parameters Action Level Limit Level
Surface 5.9 Surface 5.5
Middle 6.0 Middle 5.6 DO in mg/L
Bottom 6.0 Bottom 5.7
SS in mg/L (depth
averaged)
14.9 and
120% of upstream control station of the same day
16.4 and
130% of upstream control station of the same day
Turbidity in NTU (depth
averaged)
4.4 and
120% of upstream control station of the same day
5.2 and
130% of upstream control station of the same day
Tide: Ebb Location: WM2
Parameters Action Level Limit Level
Surface 5.9 Surface 5.5
Middle NA Middle NA DO in mg/L
Bottom 6.0 Bottom 5.7
SS in mg/L (depth
averaged)
14.7 and
120% of upstream control station of the same day
15.5 and
130% of upstream control station of the same day
Turbidity in NTU (depth
averaged)
5.5 and
120% of upstream control station of the same day
7.0 and
130% of upstream control station of the same day

Tide: Ebb Location: WM3
Parameters Action Level Limit Level
Surface 6.1 Surface 5.7
Middle 6.1 Middle 5.7 DO in mg/L
Bottom 6.3 Bottom 5.9
SS in mg/L (depth
averaged)
14.4 and
120% of upstream control station of the same day
16.0 and
130% of upstream control station of the same day
Turbidity in NTU (depth
averaged)
3.4 and
120% of upstream control station of the same day
3.8 and
130% of upstream control station of the same day
Tide: Ebb Location: WM4
Parameters Action Level Limit Level
Surface 6.1 Surface 5.8
Middle 6.3 Middle 6.0 DO in mg/L
Bottom 6.5 Bottom 6.2
SS in mg/L (depth
averaged)
14.0 and
120% of upstream control station of the same day
15.5 and
130% of upstream control station of the same day
Turbidity in NTU (depth
averaged)
3.0 and
120% of upstream control station of the same day
3.2 and
130% of upstream control station of the same day
Table B2.2 Action and Limit Levels for Flood Condition Tide: Flood Location: WM1
Parameters Action Level Limit Level
Surface 5.9 Surface 5.6
Middle 6.1 Middle 5.7 DO in mg/L
Bottom 6.2 Bottom 5.8
SS in mg/L (depth
averaged)
12.7 and
120% of upstream control station of the same day
12.9 and
130% of upstream control station of the same day
Turbidity in NTU (depth
averaged)
3.8 and
120% of upstream control station of the same day
4.0 and
130% of upstream control station of the same day
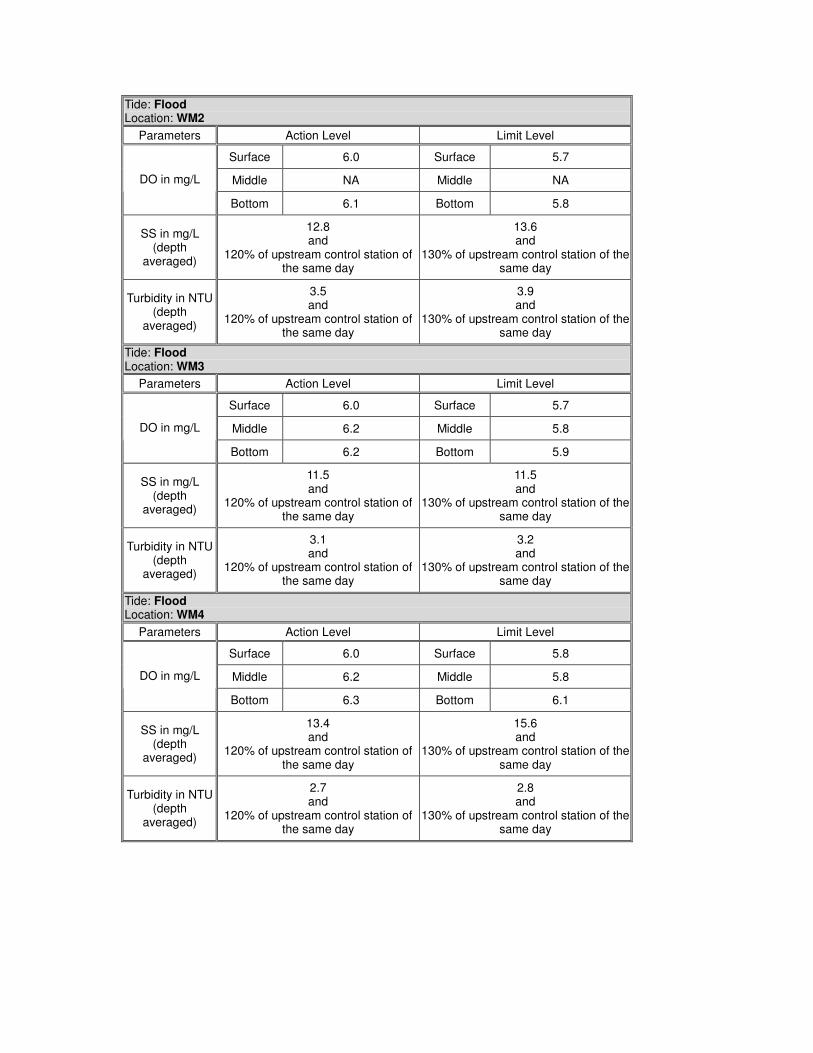
Tide: Flood Location: WM2
Parameters Action Level Limit Level
Surface 6.0 Surface 5.7
Middle NA Middle NA DO in mg/L
Bottom 6.1 Bottom 5.8
SS in mg/L (depth
averaged)
12.8 and
120% of upstream control station of the same day
13.6 and
130% of upstream control station of the same day
Turbidity in NTU (depth
averaged)
3.5 and
120% of upstream control station of the same day
3.9 and
130% of upstream control station of the same day
Tide: Flood Location: WM3
Parameters Action Level Limit Level
Surface 6.0 Surface 5.7
Middle 6.2 Middle 5.8 DO in mg/L
Bottom 6.2 Bottom 5.9
SS in mg/L (depth
averaged)
11.5 and
120% of upstream control station of the same day
11.5 and
130% of upstream control station of the same day
Turbidity in NTU (depth
averaged)
3.1 and
120% of upstream control station of the same day
3.2 and
130% of upstream control station of the same day
Tide: Flood Location: WM4
Parameters Action Level Limit Level
Surface 6.0 Surface 5.8
Middle 6.2 Middle 5.8 DO in mg/L
Bottom 6.3 Bottom 6.1
SS in mg/L (depth
averaged)
13.4 and
120% of upstream control station of the same day
15.6 and
130% of upstream control station of the same day
Turbidity in NTU (depth
averaged)
2.7 and
120% of upstream control station of the same day
2.8 and
130% of upstream control station of the same day

APPENDIX C
Calibration Details
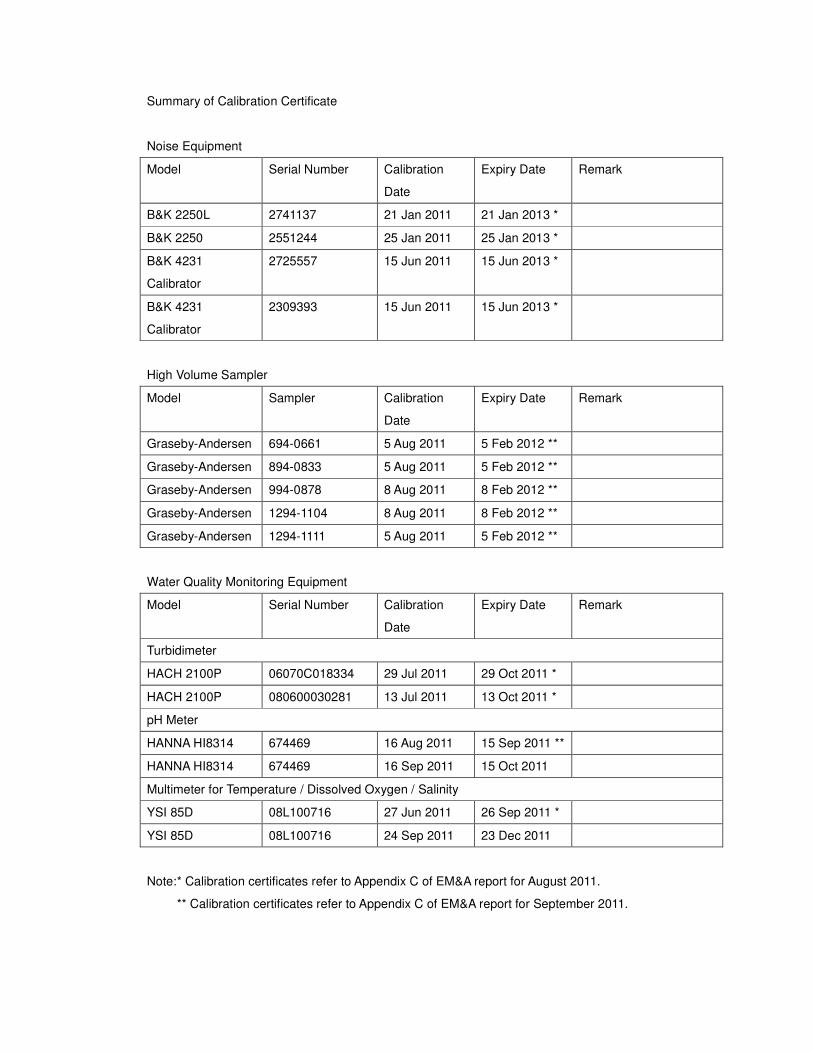
Summary of Calibration Certificate
Noise Equipment
Model Serial Number Calibration
Date
Expiry Date Remark
B&K 2250L 2741137 21 Jan 2011 21 Jan 2013 *
B&K 2250 2551244 25 Jan 2011 25 Jan 2013 *
B&K 4231
Calibrator
2725557 15 Jun 2011 15 Jun 2013 *
B&K 4231
Calibrator
2309393 15 Jun 2011 15 Jun 2013 *
High Volume Sampler
Model Sampler Calibration
Date
Expiry Date Remark
Graseby-Andersen 694-0661 5 Aug 2011 5 Feb 2012 **
Graseby-Andersen 894-0833 5 Aug 2011 5 Feb 2012 **
Graseby-Andersen 994-0878 8 Aug 2011 8 Feb 2012 **
Graseby-Andersen 1294-1104 8 Aug 2011 8 Feb 2012 **
Graseby-Andersen 1294-1111 5 Aug 2011 5 Feb 2012 **
Water Quality Monitoring Equipment
Model Serial Number Calibration
Date
Expiry Date Remark
Turbidimeter
HACH 2100P 06070C018334 29 Jul 2011 29 Oct 2011 *
HACH 2100P 080600030281 13 Jul 2011 13 Oct 2011 *
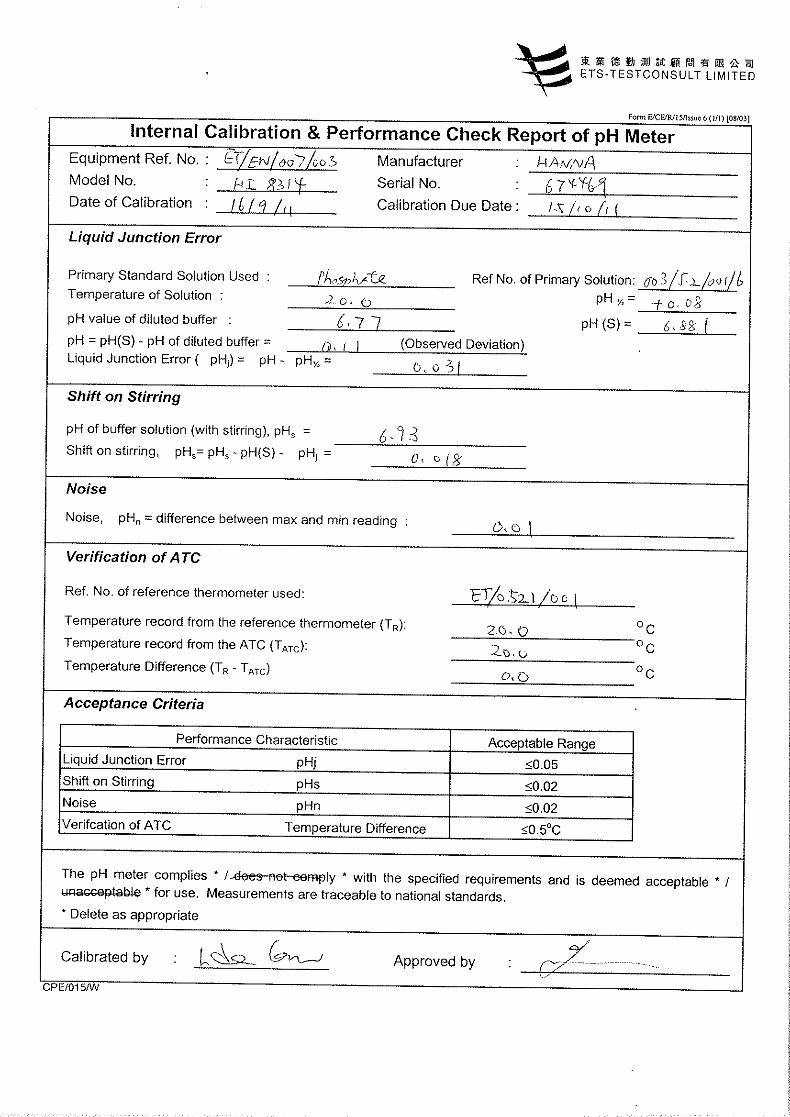
pH Meter
HANNA HI8314 674469 16 Aug 2011 15 Sep 2011 **
HANNA HI8314 674469 16 Sep 2011 15 Oct 2011
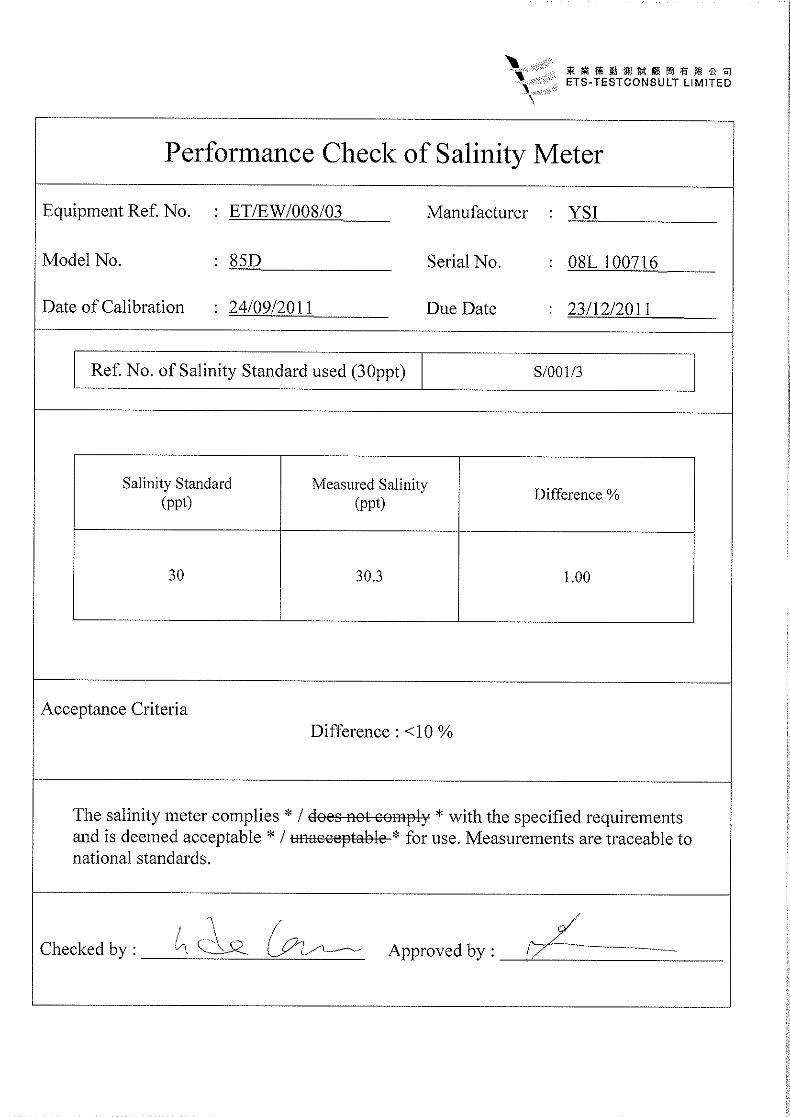
Multimeter for Temperature / Dissolved Oxygen / Salinity
YSI 85D 08L100716 27 Jun 2011 26 Sep 2011 *
YSI 85D 08L100716 24 Sep 2011 23 Dec 2011
Note: * Calibration certificates refer to Appendix C of EM&A report for August 2011.
** Calibration certificates refer to Appendix C of EM&A report for September 2011.

APPENDIX D
Graphical Plots of Air Quality, Noise & Water Quality Impact Monitoring
and Monitoring Results for Water Quality
Graphical Plots of Air Quality Monitoring Results
24-hr TSP Level at CD1 Wong Chuk Hang San Wai
0.0
50.0
100.0
150.0
200.0
250.0
300.0
28-Jun-
11
05-Jul-
11
12-Jul-
11
19-Jul-
11
26-Jul-
11
02-Aug-
11
09-Aug-
11
16-Aug-
11
23-Aug-
11
30-Aug-
11
06-Sep-
11
13-Sep-
11
20-Sep-
11
27-Sep-
11
Date
TS
P (
µg/m
3)
TSP (µg/m3)
Action Level(173 µg/m3)
Limit Level(260 µg/m3)
24-hr TSP Level at CD2 Police College - Police Quaeters
0.0
50.0
100.0
150.0
200.0
250.0
300.0
28-Jun-
11
05-Jul-
11
12-Jul-
11
19-Jul-
11
26-Jul-
11
02-Aug-
11
09-Aug-
11
16-Aug-
11
23-Aug-
11
30-Aug-
11
06-Sep-
11
13-Sep-
11
20-Sep-
11
27-Sep-
11
Date
TS
P (
µg/m
3)
TSP (µg/m3)
Action Level(184 µg/m3)
Limit Level(260 µg/m3)
Graphical Plots of Air Quality Monitoring Results
24-hr TSP Level at CD3 San Wui Commercial Society of HK Chan Pak Sha School
0.0
50.0
100.0
150.0
200.0
250.0
300.0
28-Jun-
11
05-Jul-
11
12-Jul-
11
19-Jul-
11
26-Jul-
11
02-Aug-
11
09-Aug-
11
16-Aug-
11
23-Aug-
11
30-Aug-
11
06-Sep-
11
13-Sep-
11
20-Sep-
11
27-Sep-
11
Date
TS
P (
µg/m
3)
TSP (µg/m3)
Action Level(169 µg/m3)
Limit Level(260 µg/m3)
24-hr TSP Level at CD4 Shan On House
0
50
100
150
200
250
300
29-Jun-
11
06-Jul-
11
13-Jul-
11
20-Jul-
11
27-Jul-
11
03-Aug-
11
10-Aug-
11
17-Aug-
11
24-Aug-
11
31-Aug-
11
07-Sep-
11
14-Sep-
11
21-Sep-
11
Date
TS
P (
µg/m
3)
TSP (µg/m3)
Action Level(176 µg/m3)
Limit Level(260 µg/m3)
Graphical Plots of Air Quality Monitoring Results
24-hr TSP Level at CD5 South Horizons Phase IV – Block 25
0
50
100
150
200
250
300
29-Jun-
11
06-Jul-
11
13-Jul-
11
20-Jul-
11
27-Jul-
11
03-Aug-
11
10-Aug-
11
17-Aug-
11
24-Aug-
11
31-Aug-
11
07-Sep-
11
14-Sep-
11
21-Sep-
11
Date
TS
P (
µg/m
3)
TSP (µg/m3)
Action Level(169 µg/m3)
Limit Level(260 µg/m3)

Graphical Plots of Noise Monitoring Results
Noise Level at CN1 San Wui Commercial Society of HK Chan Pak Sha School (Educational Institution)
60.0
62.0
64.0
66.0
68.0
70.0
72.0
74.0
76.0
29-Jun-
11
06-Jul-
11
13-Jul-
11
20-Jul-
11
27-Jul-
11
03-Aug-
11
10-Aug-
11
17-Aug-
11
24-Aug-
11
31-Aug-
11
07-Sep-
11
14-Sep-
11
21-Sep-
11
28-Sep-
11
Date
Nois
e L
eve
l, d
B(A
)
Leq(dBA)
Daytime LimitLevel (70 dBA)
Noise Level at CN2 Holy Spirit Seminary (Educational Institution)
60.0
62.0
64.0
66.0
68.0
70.0
72.0
74.0
76.0
30-Jun-
11
07-Jul-
11
14-Jul-
11
21-Jul-
11
28-Jul-
11
04-Aug-
11
11-Aug-
11
18-Aug-
11
25-Aug-
11
01-Sep-
11
08-Sep-
11
15-Sep-
11
22-Sep-
11
Date
Nois
e L
evel, d
B(A
)
Leq(dBA)
Daytime LimitLevel (70 dBA)
Graphical Plots of Noise Monitoring Results
Noise Level at CN3 Shun Fung Building (Residential)
60.0
62.0
64.0
66.0
68.0
70.0
72.0
74.0
76.0
27-Jun-11
04-Jul-11
11-Jul-11
18-Jul-11
25-Jul-11
01-Aug-11
08-Aug-11
15-Aug-11
22-Aug-11
29-Aug-11
05-Sep-11
12-Sep-11
19-Sep-11
26-Sep-11
Date
Nois
e L
eve
l, dB
(A)
Leq(dBA)
Daytime LimitLevel (75 dBA)
Noise Level at CN4 South Horizons Phase IV – Block 25 Dover Court (Residential)
60.0
62.0
64.0
66.0
68.0
70.0
72.0
74.0
76.0
27-Jun-
11
04-Jul-
11
11-Jul-
11
18-Jul-
11
25-Jul-
11
01-Aug-
11
08-Aug-
11
15-Aug-
11
22-Aug-
11
29-Aug-
11
05-Sep-
11
12-Sep-
11
19-Sep-
11
26-Sep-
11
Date
Nois
e L
evel, d
B(A
)
Leq(dBA)
Daytime LimitLevel (75 dBA)

Graphical Plots of Noise Monitoring Results
Noise Level at CN5 TWGHs Jockey Club Rehabilitation Complex Block A (Convalescent Home)
60.0
62.0
64.0
66.0
68.0
70.0
72.0
74.0
76.0
29-Jun-
11
06-Jul-
11
13-Jul-
11
20-Jul-
11
27-Jul-
11
03-Aug-
11
10-Aug-
11
17-Aug-
11
24-Aug-
11
31-Aug-
11
07-Sep-
11
14-Sep-
11
21-Sep-
11
28-Sep-
11
Date
No
ise L
evel, d
B(A
)
Leq(dBA)
Daytime LimitLevel (75 dBA)
Graphical Plots of Water Quality Monitoring Results Monitoring Results for Dissolved Oxygen in Flood Tide - Surface Level
0.02.04.06.08.010.012.014.016.018.0
18-Jul-11 25-Jul-11 1-Aug-11 8-Aug-11 15-Aug-11 22-Aug-11 29-Aug-11 5-Sep-11 12-Sep-11 19-Sep-11 26-Sep-11DateDO (mg/l) WM1WM2WM3WM4
Monitoring Results for Dissolved Oxygen in Flood Tide - Middle Level
0.02.04.06.08.010.012.014.016.018.0
18-Jul-11 25-Jul-11 1-Aug-11 8-Aug-11 15-Aug-11 22-Aug-11 29-Aug-11 5-Sep-11 12-Sep-11 19-Sep-11 26-Sep-11DateDO (mg/l) WM1WM3WM4
Graphical Plots of Water Quality Monitoring Results Monitoring Results for Dissolved Oxygen in Flood Tide - Bottom Level
0.02.04.06.08.010.012.014.016.018.0
18-Jul-11 25-Jul-11 1-Aug-11 8-Aug-11 15-Aug-11 22-Aug-11 29-Aug-11 5-Sep-11 12-Sep-11 19-Sep-11 26-Sep-11DateDO (mg/l) WM1WM2WM3WM4
Monitoring Results for Turbidity in Flood Tide - Depth Average
0.02.04.06.08.010.012.014.016.018.0
18-Jul-11 25-Jul-11 1-Aug-11 8-Aug-11 15-Aug-11 22-Aug-11 29-Aug-11 5-Sep-11 12-Sep-11 19-Sep-11 26-Sep-11DateTurbidity (NTU) WM1WM2WM3WM4

Graphical Plots of Water Quality Monitoring Results Monitoring Results for Suspended Solids in Flood Tide - Depth Average
0.02.04.06.08.010.012.014.016.018.0
18-Jul-11 25-Jul-11 1-Aug-11 8-Aug-11 15-Aug-11 22-Aug-11 29-Aug-11 5-Sep-11 12-Sep-11 19-Sep-11 26-Sep-11DateSS (mg/l) WM1WM2WM3WM4
Monitoring Results for Dissolved Oxygen in Ebb Tide - Surface Level
0.02.04.06.08.010.012.014.016.018.0
18-Jul-11 25-Jul-11 1-Aug-11 8-Aug-11 15-Aug-11 22-Aug-11 29-Aug-11 5-Sep-11 12-Sep-11 19-Sep-11 26-Sep-11DateDO (mg/l) WM1WM2WM3WM4
Graphical Plots of Water Quality Monitoring Results Monitoring Results for Dissolved Oxygen in Ebb Tide - Middle Level
0.02.04.06.08.010.012.014.016.018.0
18-Jul-11 25-Jul-11 1-Aug-11 8-Aug-11 15-Aug-11 22-Aug-11 29-Aug-11 5-Sep-11 12-Sep-11 19-Sep-11 26-Sep-11DateDO (mg/l) WM1WM3WM4
Monitoring Results for Dissolved Oxygen in Ebb Tide - Bottom Level
0.02.04.06.08.010.012.014.016.018.0
18-Jul-11 25-Jul-11 1-Aug-11 8-Aug-11 15-Aug-11 22-Aug-11 29-Aug-11 5-Sep-11 12-Sep-11 19-Sep-11 26-Sep-11DateDO (mg/l) WM1WM2WM3WM4

Graphical Plots of Water Quality Monitoring Results Monitoring Results for Turbidity in Ebb Tide - Depth Average
0.02.04.06.08.010.012.014.016.018.0
18-Jul-11 25-Jul-11 1-Aug-11 8-Aug-11 15-Aug-11 22-Aug-11 29-Aug-11 5-Sep-11 12-Sep-11 19-Sep-11 26-Sep-11DateTurbidity (NTU) WM1WM2WM3WM4
Monitoring Results for Suspended Solids in Ebb Tide - Depth Average
0.02.04.06.08.010.012.014.016.018.0
18-Jul-11 25-Jul-11 1-Aug-11 8-Aug-11 15-Aug-11 22-Aug-11 29-Aug-11 5-Sep-11 12-Sep-11 19-Sep-11 26-Sep-11DateSS (mg/l) WM1WM2WM3WM4

SIL(E) Water Quality Monitoring Data Record Sheet
Date: 2-Sep-11
Tide: Mid-Flood
Weather: Cloudy
Sea Conditions: Small Wave
CS2
1 2 Ave.* 1 2 Ave.* 1 2 Ave.* 1 2 Ave.* 1 2 Ave.* 1 2 Ave.* D.A.** 1 2 Ave.* D.A.**
Surface 26.2 26.1 26.2 8.0 8.1 8.1 31.3 31.3 31.3 4.3 4.3 4.3 63.3 62.6 63.0 3.7 3.6 3.7 8.4 8.2 8.3
Middle 26.1 26.1 26.1 8.1 8.0 8.1 31.5 31.5 31.5 2.6 2.5 2.6 38.7 38.4 38.6 3.9 3.9 3.9 8.8 9.0 8.9
Bottom 25.8 25.9 25.9 8.1 8.1 8.1 31.7 31.6 31.7 3.0 3.0 3.0 44.0 44.5 44.3 4.1 4.1 4.1 5.2 5.0 5.1
Surface 26.1 26.1 26.1 8.2 8.1 8.2 31.5 31.5 31.5 3.9 3.9 3.9 57.9 57.1 57.5 2.9 2.8 2.9 3.6 3.8 3.7
Middle 26.2 26.1 26.2 8.2 8.2 8.2 31.4 31.5 31.5 2.8 2.9 2.9 43.1 44.3 43.7 3.4 3.4 3.4 4.4 4.6 4.5
Bottom 26.0 26.1 26.1 8.1 8.1 8.1 31.5 31.4 31.5 2.5 2.6 2.6 37.2 37.8 37.5 3.7 3.4 3.6 7.0 6.4 6.7
Surface 26.0 26.0 26.0 8.1 8.1 8.1 31.4 31.5 31.5 4.0 4.0 4.0 59.4 59.9 59.7 2.3 2.6 2.5 5.2 5.8 5.5
Middle
Bottom 26.2 26.1 26.2 8.0 8.1 8.1 31.3 31.4 31.4 2.6 2.5 2.6 38.5 37.6 38.1 3.2 3.2 3.2 4.4 4.4 4.4
Surface 26.2 26.2 26.2 8.1 8.2 8.2 31.3 31.2 31.3 4.4 4.5 4.5 61.7 62.4 62.1 2.4 2.6 2.5 3.2 3.6 3.4
Middle 26.3 26.3 26.3 8.2 8.1 8.2 31.3 31.4 31.4 2.4 2.4 2.4 35.5 35.8 35.7 2.8 2.8 2.8 7.0 6.6 6.8
Bottom 26.3 26.3 26.3 8.1 8.1 8.1 31.5 31.5 31.5 2.9 3.0 3.0 42.2 43.4 42.8 2.8 2.6 2.7 5.4 5.0 5.2
Surface 26.3 26.2 26.3 8.1 8.0 8.1 31.2 31.2 31.2 3.7 3.6 3.7 53.3 52.9 53.1 2.6 2.5 2.6 6.2 6.0 6.1
Middle 26.3 26.4 26.4 8.1 8.1 8.1 31.3 31.3 31.3 2.2 2.1 2.2 33.2 32.4 32.8 2.3 2.3 2.3 5.2 5.4 5.3
Bottom 26.2 26.2 26.2 8.0 8.1 8.1 31.3 31.3 31.3 2.7 2.8 2.8 49.4 50.1 49.8 2.9 3.0 3.0 7.2 7.4 7.3
Surface 26.7 26.6 26.7 8.1 8.0 8.1 30.3 30.4 30.4 5.5 5.5 5.5 81.6 82.2 81.9 1.4 1.7 1.6 2.8 3.2 3.0
Middle 26.3 26.3 26.3 8.1 8.1 8.1 31.1 31.0 31.1 3.9 3.9 3.9 54.0 54.6 54.3 3.4 3.5 3.5 6.4 6.8 6.6
Bottom 26.4 26.4 26.4 8.0 8.0 8.0 31.4 31.4 31.4 3.0 3.1 3.1 39.7 40.5 40.1 2.7 2.9 2.8 6.0 6.6 6.3
Remark or Obsevation: Note: * Average
** Depth Average
DO Saturation
(%)
Turbidity
(NTU)
2.7
2.6
2.6
7.4
5.0
5.0
5.1
6.2
5.3
CS1 11.0
Monitoring
Depth
Temperrature (oC) pHSalinity
(ppt)
DO
(mg/l)
0900
WM1
WM2
WM3
WM4
1054
1027
0957
0926
14.7
LocationSampling
Time
Water
Depth (m)
14.5
5.8
10.2
10.4
CS2
1135
Upstream Control Station:
Suspended Solids
(mg/l)
3.9
3.3
2.8

SIL(E) Water Quality Monitoring Data Record Sheet
Date: 2-Sep-11
Tide: Mid-Ebb
Weather: Cloudy
Sea Conditions: Great Wave
CS1
1 2 Ave.* 1 2 Ave.* 1 2 Ave.* 1 2 Ave.* 1 2 Ave.* 1 2 Ave.* D.A.** 1 2 Ave.* D.A.**
Surface 26.2 26.2 26.2 8.1 8.1 8.1 31.3 31.4 31.4 6.5 6.6 6.6 95.7 96.5 96.1 5.9 5.2 5.6 6.0 5.4 5.7
Middle 26.2 26.2 26.2 8.0 8.1 8.1 31.5 31.5 31.5 4.7 4.6 4.7 69.6 67.3 68.5 5.2 5.5 5.4 7.0 7.6 7.3
Bottom 26.0 25.8 25.9 8.2 8.1 8.2 31.6 31.7 31.7 3.7 3.7 3.7 56.3 54.1 55.2 4.6 4.7 4.7 6.2 6.6 6.4
Surface 26.3 26.3 26.3 8.2 8.2 8.2 31.4 31.4 31.4 3.8 3.6 3.7 56.1 53.4 54.8 3.8 3.9 3.9 5.8 5.8 5.8
Middle 26.1 26.1 26.1 8.1 8.2 8.2 31.5 31.5 31.5 2.5 2.7 2.6 36.7 39.1 37.9 4.6 4.7 4.7 5.2 5.6 5.4
Bottom 25.9 25.9 25.9 8.0 8.2 8.1 31.6 31.6 31.6 2.7 2.6 2.7 40.3 37.8 39.1 5.1 5.3 5.2 5.4 5.8 5.6
Surface 26.1 26.2 26.2 8.0 8.1 8.1 31.3 31.4 31.4 3.8 3.7 3.8 55.4 55.0 55.2 5.2 5.1 5.2 7.0 6.8 6.9
Middle
Bottom 26.3 26.3 26.3 8.2 8.2 8.2 31.3 31.4 31.4 2.5 2.2 2.4 37.5 32.6 35.1 4.7 4.3 4.5 5.8 5.4 5.6
Surface 26.2 26.2 26.2 8.2 8.2 8.2 31.5 31.4 31.5 3.8 3.8 3.8 56.6 56.2 56.4 3.7 3.5 3.6 6.8 6.4 6.6
Middle 26.4 26.5 26.5 8.2 8.3 8.3 31.4 31.5 31.5 2.1 2.1 2.1 30.7 30.4 30.6 3.3 3.5 3.4 5.0 5.4 5.2
Bottom 26.4 26.5 26.5 8.2 8.3 8.3 31.4 31.4 31.4 2.4 2.1 2.3 35.6 31.8 33.7 6.0 5.9 6.0 11.2 11.0 11.1
Surface 26.1 26.2 26.2 8.2 8.1 8.2 31.5 31.5 31.5 4.0 3.8 3.9 58.7 56.1 57.4 3.6 3.5 3.6 7.6 7.4 7.5
Middle 26.2 26.3 26.3 8.0 8.0 8.0 31.4 31.4 31.4 2.4 2.3 2.4 35.4 34.5 35.0 3.8 3.4 3.6 8.4 7.8 8.1
Bottom 26.2 26.2 26.2 8.0 8.1 8.1 31.5 31.5 31.5 2.4 2.2 2.3 35.1 32.2 33.7 4.8 4.1 4.5 10.2 9.2 9.7
Surface 27.1 27.1 27.1 8.1 8.1 8.1 31.4 31.5 31.5 6.5 6.2 6.4 97.1 94.2 95.7 2.4 2.5 2.5 5.2 5.4 5.3
Middle 25.9 25.9 25.9 8.2 8.0 8.1 31.7 31.8 31.8 2.6 2.5 2.6 38.3 37.4 37.9 5.2 5.0 5.1 9.8 9.4 9.6
Bottom 25.4 25.4 25.4 8.2 8.1 8.2 32.0 32.1 32.1 2.7 2.6 2.7 39.7 37.9 38.8 7.8 7.6 7.7 11.8 12.0 11.9
Remark or Obsevation: Note: * Average
** Depth Average
Upstream Control Station:
Salinity
(ppt)
DO
(mg/l)Location
Sampling
Time
Water
Depth (m)
Monitoring
Depth
DO Saturation
(%)
Turbidity
(NTU)
Suspended Solids
(mg/l)
CS1 1400 10.7 5.2 6.5
Temperrature (oC) pH
5.6
WM2 1510 5.2 4.8 6.3
WM1 1440 14.2 4.6
7.6
WM4 1611 9.8 3.9 8.4
WM3 1540 9.7 4.3
8.9CS2 1638 14.2 5.1

SIL(E) Water Quality Monitoring Data Record Sheet
Date: 5-Sep-11
Tide: Mid-Flood
Weather: Fine
Sea Conditions: Great Wave
CS2
1 2 Ave.* 1 2 Ave.* 1 2 Ave.* 1 2 Ave.* 1 2 Ave.* 1 2 Ave.* D.A.** 1 2 Ave.* D.A.**
Surface 27.5 27.4 27.5 7.9 7.9 7.9 30.5 30.5 30.5 4.4 4.4 4.4 63.8 64.0 63.9 4.3 4.4 4.4 9.2 9.0 9.1
Middle 27.2 27.1 27.2 7.9 7.9 7.9 30.7 30.6 30.7 3.9 3.9 3.9 60.4 60.1 60.3 2.9 3.2 3.1 7.2 7.8 7.5
Bottom 27.3 27.2 27.3 7.9 7.9 7.9 30.7 30.8 30.8 4.0 4.0 4.0 59.8 60.1 60.0 3.9 4.1 4.0 4.4 4.8 4.6
Surface 27.4 27.4 27.4 7.8 7.8 7.8 30.5 30.4 30.5 3.8 3.8 3.8 56.6 56.2 56.4 4.0 4.0 4.0 4.8 5.0 4.9
Middle 27.1 27.1 27.1 7.8 7.8 7.8 30.7 30.7 30.7 3.4 3.4 3.4 50.3 51.2 50.8 4.0 3.5 3.8 5.0 4.4 4.7
Bottom 27.0 27.1 27.1 7.9 7.9 7.9 30.8 30.8 30.8 3.7 3.7 3.7 57.2 57.8 57.5 3.6 3.8 3.7 7.2 7.6 7.4
Surface 27.4 27.4 27.4 7.7 7.7 7.7 30.6 30.6 30.6 3.9 3.9 3.9 58.6 58.4 58.5 4.0 3.8 3.9 8.8 8.4 8.6
Middle
Bottom 27.2 27.2 27.2 7.8 7.8 7.8 30.7 30.7 30.7 3.7 3.7 3.7 55.8 55.7 55.8 3.2 3.4 3.3 4.8 5.4 5.1
Surface 27.5 27.5 27.5 7.8 7.8 7.8 30.8 30.8 30.8 3.2 3.2 3.2 47.8 48.2 48.0 3.0 3.2 3.1 4.4 4.8 4.6
Middle 27.2 27.2 27.2 7.7 7.7 7.7 30.9 30.9 30.9 3.1 3.1 3.1 47.6 48.0 47.8 2.8 2.8 2.8 7.0 6.8 6.9
Bottom 27.0 27.1 27.1 7.7 7.7 7.7 31.0 31.0 31.0 3.4 3.4 3.4 50.7 50.9 50.8 3.2 3.0 3.1 5.0 4.6 4.8
Surface 27.4 27.4 27.4 7.9 7.9 7.9 30.8 30.7 30.8 4.1 4.1 4.1 60.5 60.8 60.7 2.0 2.2 2.1 4.4 4.6 4.5
Middle 27.2 27.2 27.2 7.7 7.7 7.7 30.7 30.8 30.8 4.1 4.1 4.1 57.7 57.9 57.8 1.8 1.9 1.9 4.0 4.2 4.1
Bottom 27.1 27.1 27.1 7.6 7.6 7.6 30.9 30.9 30.9 4.2 4.2 4.2 60.5 61.2 60.9 2.5 2.5 2.5 5.4 5.6 5.5
Surface 28.1 28.2 28.2 7.9 7.9 7.9 26.4 26.4 26.4 6.5 6.5 6.5 97.3 96.2 96.8 3.2 3.4 3.3 7.2 7.8 7.5
Middle 27.7 27.8 27.8 8.0 8.0 8.0 30.8 30.8 30.8 4.6 4.6 4.6 69.7 68.3 69.0 2.4 2.4 2.4 3.8 3.8 3.8
Bottom 27.1 27.2 27.2 8.0 8.0 8.0 31.0 31.0 31.0 3.9 3.9 3.9 60.5 60.2 60.4 3.8 3.8 3.8 9.4 9.8 9.6
Remark or Obsevation: Note: * Average
** Depth Average
Upstream Control Station:
Suspended Solids
(mg/l)
3.8
3.8
3.6
14.0
LocationSampling
Time
Water
Depth (m)
14.0
5.6
9.0
10.4
CS2
1115
1340
WM1
WM2
WM3
WM4
1146
1205
1230
1258
pHSalinity
(ppt)
DO
(mg/l)
CS1 14.4
Monitoring
Depth
Temperrature (oC)
7.1
5.7
6.9
5.4
4.7
7.0
DO Saturation
(%)
Turbidity
(NTU)
3.0
2.2
3.2
SIL(E) Water Quality Monitoring Data Record Sheet
Date: 5-Sep-11
Tide: Mid-Ebb
Weather: Fine
Sea Conditions: Great Wave
CS1
1 2 Ave.* 1 2 Ave.* 1 2 Ave.* 1 2 Ave.* 1 2 Ave.* 1 2 Ave.* D.A.** 1 2 Ave.* D.A.**
Surface 27.8 27.7 27.8 7.8 7.8 7.8 30.8 30.8 30.8 5.3 5.3 5.3 79.0 79.8 79.4 3.4 3.2 3.3 3.8 4.0 3.9
Middle 27.6 27.5 27.6 7.9 7.9 7.9 30.6 30.7 30.7 4.4 4.4 4.4 67.9 68.0 68.0 3.9 4.0 4.0 5.8 6.0 5.9
Bottom 26.3 26.4 26.4 7.8 7.8 7.8 31.2 31.2 31.2 4.1 4.1 4.1 62.4 63.1 62.8 3.9 3.5 3.7 4.8 4.4 4.6
Surface 27.5 27.6 27.6 7.7 7.7 7.7 30.9 30.9 30.9 3.6 3.6 3.6 51.6 52.4 52.0 2.9 2.9 2.9 4.4 4.4 4.4
Middle 27.6 27.6 27.6 7.8 7.8 7.8 31.0 31.0 31.0 3.6 3.6 3.6 51.1 51.3 51.2 4.0 3.8 3.9 4.6 4.4 4.5
Bottom 27.4 27.4 27.4 7.8 7.8 7.8 30.9 30.9 30.9 4.1 4.1 4.1 60.1 59.4 59.8 3.5 3.6 3.6 4.4 4.6 4.5
Surface 27.8 27.9 27.9 7.9 7.9 7.9 30.8 30.8 30.8 4.9 4.9 4.9 75.4 75.8 75.6 3.1 3.2 3.2 4.8 4.8 4.8
Middle
Bottom 27.4 27.4 27.4 7.9 7.9 7.9 30.9 30.9 30.9 3.7 3.7 3.7 54.1 55.7 54.9 4.5 4.2 4.4 5.4 5.2 5.3
Surface 27.5 27.6 27.6 8.0 8.0 8.0 31.2 31.2 31.2 3.7 3.7 3.7 56.8 56.6 56.7 2.1 2.2 2.2 4.6 5.0 4.8
Middle 27.3 27.3 27.3 8.0 8.0 8.0 31.1 31.1 31.1 3.9 3.9 3.9 58.8 59.3 59.1 1.9 2.0 2.0 4.2 4.2 4.2
Bottom 27.3 27.2 27.3 8.0 8.0 8.0 31.2 31.2 31.2 4.2 4.2 4.2 64.6 65.0 64.8 1.7 1.9 1.8 4.4 4.8 4.6
Surface 27.6 27.5 27.6 8.0 8.0 8.0 31.1 31.1 31.1 3.6 3.6 3.6 53.4 54.2 53.8 1.8 1.7 1.8 4.2 3.8 4.0
Middle 27.3 27.3 27.3 8.1 8.1 8.1 31.2 31.2 31.2 3.7 3.7 3.7 53.9 54.1 54.0 2.1 2.2 2.2 5.2 5.0 5.1
Bottom 27.1 27.1 27.1 8.1 8.1 8.1 31.1 31.1 31.1 3.4 3.4 3.4 51.5 51.8 51.7 2.2 2.1 2.2 6.8 6.6 6.7
Surface 27.3 27.4 27.4 8.1 8.1 8.1 31.3 31.3 31.3 4.2 4.2 4.2 63.7 63.1 63.4 1.9 1.8 1.9 4.2 4.0 4.1
Middle 26.7 26.7 26.7 8.1 8.1 8.1 31.4 31.3 31.4 3.8 3.8 3.8 56.8 57.2 57.0 2.0 2.0 2.0 4.2 4.4 4.3
Bottom 26.2 26.1 26.2 8.1 8.1 8.1 31.6 31.6 31.6 3.9 3.9 3.9 57.6 57.8 57.7 3.1 3.0 3.1 7.0 6.4 6.7
Remark or Obsevation: Note: * Average
** Depth Average
5.0CS2 1825 14.6 2.3
4.5
WM4 1751 9.8 2.0 5.3
WM3 1725 9.6 2.0
4.5
WM2 1640 5.8 3.8 5.1
WM1 1610 14.2 3.5
DO Saturation
(%)
Turbidity
(NTU)
Suspended Solids
(mg/l)
CS1 1545 15.4 3.7 4.8
Temperrature (oC) pHSalinity
(ppt)
DO
(mg/l)Location
Sampling
Time
Water
Depth (m)
Monitoring
Depth
Upstream Control Station:

SIL(E) Water Quality Monitoring Data Record Sheet
Date: 7-Sep-11
Tide: Mid-Flood
Weather: Fine
Sea Conditions: Great Wave
CS2
1 2 Ave.* 1 2 Ave.* 1 2 Ave.* 1 2 Ave.* 1 2 Ave.* 1 2 Ave.* D.A.** 1 2 Ave.* D.A.**
Surface 28.6 28.5 28.6 8.3 8.3 8.3 30.4 30.4 30.4 6.7 6.6 6.7 103.4 101.5 102.5 3.2 3.5 3.4 8.0 8.2 8.1
Middle 28.4 28.5 28.5 8.4 8.3 8.4 30.3 30.4 30.4 3.6 3.4 3.5 55.4 52.6 54.0 3.3 3.4 3.4 7.4 7.6 7.5
Bottom 27.8 27.9 27.9 8.3 8.3 8.3 30.7 30.7 30.7 2.9 3.0 3.0 43.6 44.9 44.3 3.8 3.8 3.8 5.2 5.0 5.1
Surface 28.2 28.3 28.3 8.3 8.4 8.4 30.6 30.5 30.6 5.3 5.3 5.3 81.1 80.4 80.8 3.3 3.4 3.4 3.8 3.8 3.8
Middle 28.0 28.1 28.1 8.2 8.2 8.2 30.8 30.8 30.8 3.0 2.9 3.0 45.7 44.4 45.1 3.4 3.5 3.5 4.0 4.2 4.1
Bottom 27.8 27.8 27.8 8.2 8.3 8.3 30.9 31.0 31.0 2.4 2.2 2.3 36.6 33.7 35.2 3.9 4.0 4.0 7.4 7.6 7.5
Surface 28.2 28.2 28.2 8.3 8.2 8.3 30.6 30.6 30.6 5.0 4.9 5.0 76.6 74.5 75.6 3.0 3.1 3.1 6.8 7.0 6.9
Middle
Bottom 28.1 28.0 28.1 8.3 8.3 8.3 30.7 30.6 30.7 2.7 2.8 2.8 40.4 42.3 41.4 3.9 3.8 3.9 5.2 5.2 5.2
Surface 28.3 28.4 28.4 8.2 8.3 8.3 30.7 30.7 30.7 5.6 5.4 5.5 85.0 82.2 83.6 3.3 3.2 3.3 5.2 4.8 5.0
Middle 28.2 28.3 28.3 8.3 8.3 8.3 30.7 30.8 30.8 3.3 2.9 3.1 50.3 45.6 48.0 3.0 2.8 2.9 7.4 7.0 7.2
Bottom 28.2 28.2 28.2 8.2 8.3 8.3 30.8 30.9 30.9 2.6 2.5 2.6 39.1 38.5 38.8 3.2 3.4 3.3 6.0 6.4 6.2
Surface 28.7 28.8 28.8 8.3 8.3 8.3 30.8 30.7 30.8 6.9 6.6 6.8 106.1 100.6 103.4 2.1 2.2 2.2 5.6 5.6 5.6
Middle 28.1 28.0 28.1 8.4 8.3 8.4 30.9 30.9 30.9 2.8 2.6 2.7 41.8 40.4 41.1 2.9 2.8 2.9 6.4 6.2 6.3
Bottom 27.4 27.5 27.5 8.2 8.3 8.3 31.2 31.3 31.3 2.5 2.6 2.6 38.1 39.8 39.0 4.5 4.6 4.6 10.2 10.2 10.2
Surface 29.4 29.4 29.4 8.3 8.2 8.3 30.4 30.3 30.4 9.3 9.4 9.4 144.4 146.8 145.6 2.5 2.6 2.6 5.4 5.6 5.5
Middle 29.0 28.9 29.0 8.3 8.3 8.3 30.7 30.6 30.7 4.7 4.5 4.6 72.6 70.3 71.5 3.1 3.0 3.1 5.8 5.6 5.7
Bottom 27.1 27.2 27.2 8.2 8.3 8.3 31.5 31.6 31.6 3.0 2.9 3.0 44.8 43.7 44.3 3.8 3.7 3.8 9.0 8.6 8.8
Remark or Obsevation: Note: * Average
** Depth Average
Upstream Control Station:
Suspended Solids
(mg/l)
3.5
3.6
3.5
14.1
LocationSampling
Time
Water
Depth (m)
15.3
5.9
8.4
9.6
CS2
1625
1345
WM1
WM2
WM3
WM4
1545
1514
1443
1412
pHSalinity
(ppt)
DO
(mg/l)
CS1 11.2
Monitoring
Depth
Temperrature (oC)
6.9
5.1
6.1
6.1
7.4
6.7
DO Saturation
(%)
Turbidity
(NTU)
3.2
3.2
3.1
SIL(E) Water Quality Monitoring Data Record Sheet
Date: 7-Sep-11
Tide: Mid-Ebb
Weather: Fine
Sea Conditions: Small Wave
CS1
1 2 Ave.* 1 2 Ave.* 1 2 Ave.* 1 2 Ave.* 1 2 Ave.* 1 2 Ave.* D.A.** 1 2 Ave.* D.A.**
Surface 28.4 28.5 28.5 8.2 8.1 8.2 30.3 30.3 30.3 6.2 6.2 6.2 85.0 85.4 85.2 2.6 2.8 2.7 3.2 3.4 3.3
Middle 28.2 28.3 28.3 8.2 8.2 8.2 30.5 30.5 30.5 3.6 3.5 3.6 54.6 53.8 54.2 3.7 3.7 3.7 5.8 6.0 5.9
Bottom 28.2 28.1 28.2 8.1 8.1 8.1 30.5 30.4 30.5 3.1 3.1 3.1 47.3 47.9 47.6 3.7 3.8 3.8 4.6 5.0 4.8
Surface 28.2 28.2 28.2 8.2 8.3 8.3 30.4 30.3 30.4 5.3 5.4 5.4 81.1 81.7 81.4 2.3 2.3 2.3 3.6 3.8 3.7
Middle 28.0 28.0 28.0 8.3 8.2 8.3 30.7 30.7 30.7 2.6 2.7 2.7 39.8 40.3 40.1 2.5 2.8 2.7 3.0 3.4 3.2
Bottom 28.0 28.0 28.0 8.3 8.3 8.3 30.6 30.7 30.7 2.7 2.7 2.7 41.2 41.5 41.4 3.6 3.4 3.5 4.0 3.8 3.9
Surface 28.0 28.1 28.1 8.3 8.3 8.3 30.5 30.4 30.5 5.2 5.2 5.2 79.7 79.0 79.4 2.8 3.1 3.0 3.4 3.8 3.6
Middle
Bottom 28.1 28.1 28.1 8.3 8.2 8.3 30.5 30.5 30.5 2.5 2.6 2.6 38.5 39.4 39.0 2.8 2.8 2.8 3.4 3.6 3.5
Surface 27.8 27.8 27.8 8.2 8.2 8.2 30.7 30.7 30.7 4.8 4.7 4.8 71.4 70.6 71.0 1.7 1.8 1.8 3.2 3.4 3.3
Middle 27.9 27.8 27.9 8.2 8.3 8.3 30.8 30.8 30.8 2.0 2.1 2.1 30.8 31.3 31.1 3.2 3.2 3.2 6.8 7.2 7.0
Bottom 27.8 27.8 27.8 8.2 8.2 8.2 30.7 30.7 30.7 2.1 2.1 2.1 32.2 32.7 32.5 3.6 3.6 3.6 8.0 7.6 7.8
Surface 27.6 27.6 27.6 8.3 8.3 8.3 30.8 30.7 30.8 4.6 4.5 4.6 69.6 69.0 69.3 2.2 2.1 2.2 5.0 4.8 4.9
Middle 27.6 27.7 27.7 8.2 8.2 8.2 30.8 30.8 30.8 2.2 2.4 2.3 32.5 33.4 33.0 2.4 2.4 2.4 5.8 5.8 5.8
Bottom 27.6 27.6 27.6 8.3 8.3 8.3 30.8 30.9 30.9 2.3 2.3 2.3 33.9 33.2 33.6 3.0 2.9 3.0 8.0 7.6 7.8
Surface 28.6 28.5 28.6 8.2 8.3 8.3 30.7 30.7 30.7 6.9 6.9 6.9 105.2 105.5 105.4 1.8 1.5 1.7 4.0 3.4 3.7
Middle 28.4 28.4 28.4 8.2 8.3 8.3 30.5 30.6 30.6 2.9 2.8 2.9 44.0 43.3 43.7 2.6 2.7 2.7 5.6 6.0 5.8
Bottom 27.6 27.5 27.6 8.2 8.2 8.2 31.0 31.1 31.1 2.7 2.7 2.7 41.8 41.6 41.7 2.2 2.2 2.2 5.0 5.0 5.0
Remark or Obsevation: Note: * Average
** Depth Average
4.8CS2 1111 14.0 2.2
6.0
WM4 1040 9.7 2.5 6.2
WM3 1007 8.8 2.9
3.6
WM2 0939 5.2 2.9 3.6
WM1 0907 15.0 2.8
DO Saturation
(%)
Turbidity
(NTU)
Suspended Solids
(mg/l)
CS1 0830 10.8 3.4 4.7
Temperrature (oC) pHSalinity
(ppt)
DO
(mg/l)Location
Sampling
Time
Water
Depth (m)
Monitoring
Depth
Upstream Control Station:
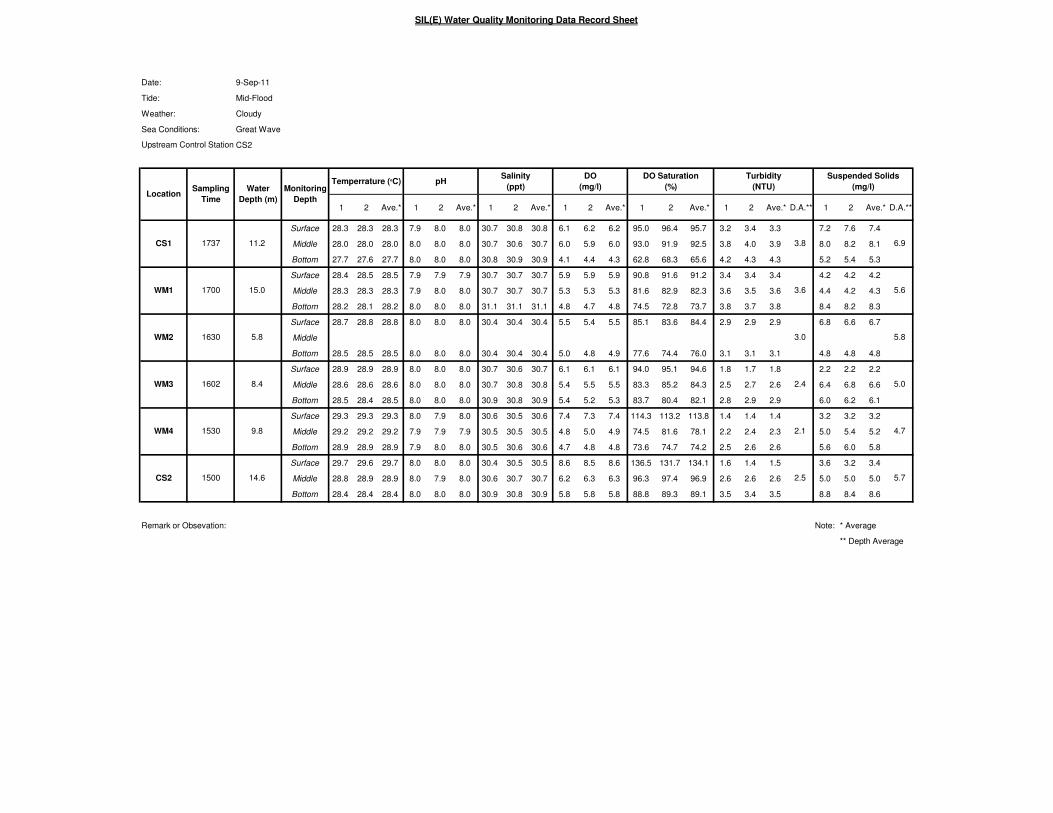
SIL(E) Water Quality Monitoring Data Record Sheet
Date: 9-Sep-11
Tide: Mid-Flood
Weather: Cloudy
Sea Conditions: Great Wave
CS2
1 2 Ave.* 1 2 Ave.* 1 2 Ave.* 1 2 Ave.* 1 2 Ave.* 1 2 Ave.* D.A.** 1 2 Ave.* D.A.**
Surface 28.3 28.3 28.3 7.9 8.0 8.0 30.7 30.8 30.8 6.1 6.2 6.2 95.0 96.4 95.7 3.2 3.4 3.3 7.2 7.6 7.4
Middle 28.0 28.0 28.0 8.0 8.0 8.0 30.7 30.6 30.7 6.0 5.9 6.0 93.0 91.9 92.5 3.8 4.0 3.9 8.0 8.2 8.1
Bottom 27.7 27.6 27.7 8.0 8.0 8.0 30.8 30.9 30.9 4.1 4.4 4.3 62.8 68.3 65.6 4.2 4.3 4.3 5.2 5.4 5.3
Surface 28.4 28.5 28.5 7.9 7.9 7.9 30.7 30.7 30.7 5.9 5.9 5.9 90.8 91.6 91.2 3.4 3.4 3.4 4.2 4.2 4.2
Middle 28.3 28.3 28.3 7.9 8.0 8.0 30.7 30.7 30.7 5.3 5.3 5.3 81.6 82.9 82.3 3.6 3.5 3.6 4.4 4.2 4.3
Bottom 28.2 28.1 28.2 8.0 8.0 8.0 31.1 31.1 31.1 4.8 4.7 4.8 74.5 72.8 73.7 3.8 3.7 3.8 8.4 8.2 8.3
Surface 28.7 28.8 28.8 8.0 8.0 8.0 30.4 30.4 30.4 5.5 5.4 5.5 85.1 83.6 84.4 2.9 2.9 2.9 6.8 6.6 6.7
Middle
Bottom 28.5 28.5 28.5 8.0 8.0 8.0 30.4 30.4 30.4 5.0 4.8 4.9 77.6 74.4 76.0 3.1 3.1 3.1 4.8 4.8 4.8
Surface 28.9 28.9 28.9 8.0 8.0 8.0 30.7 30.6 30.7 6.1 6.1 6.1 94.0 95.1 94.6 1.8 1.7 1.8 2.2 2.2 2.2
Middle 28.6 28.6 28.6 8.0 8.0 8.0 30.7 30.8 30.8 5.4 5.5 5.5 83.3 85.2 84.3 2.5 2.7 2.6 6.4 6.8 6.6
Bottom 28.5 28.4 28.5 8.0 8.0 8.0 30.9 30.8 30.9 5.4 5.2 5.3 83.7 80.4 82.1 2.8 2.9 2.9 6.0 6.2 6.1
Surface 29.3 29.3 29.3 8.0 7.9 8.0 30.6 30.5 30.6 7.4 7.3 7.4 114.3 113.2 113.8 1.4 1.4 1.4 3.2 3.2 3.2
Middle 29.2 29.2 29.2 7.9 7.9 7.9 30.5 30.5 30.5 4.8 5.0 4.9 74.5 81.6 78.1 2.2 2.4 2.3 5.0 5.4 5.2
Bottom 28.9 28.9 28.9 7.9 8.0 8.0 30.5 30.6 30.6 4.7 4.8 4.8 73.6 74.7 74.2 2.5 2.6 2.6 5.6 6.0 5.8
Surface 29.7 29.6 29.7 8.0 8.0 8.0 30.4 30.5 30.5 8.6 8.5 8.6 136.5 131.7 134.1 1.6 1.4 1.5 3.6 3.2 3.4
Middle 28.8 28.9 28.9 8.0 7.9 8.0 30.6 30.7 30.7 6.2 6.3 6.3 96.3 97.4 96.9 2.6 2.6 2.6 5.0 5.0 5.0
Bottom 28.4 28.4 28.4 8.0 8.0 8.0 30.9 30.8 30.9 5.8 5.8 5.8 88.8 89.3 89.1 3.5 3.4 3.5 8.8 8.4 8.6
Remark or Obsevation: Note: * Average
** Depth Average
DO Saturation
(%)
Turbidity
(NTU)
2.4
2.1
2.5
6.9
5.6
5.8
5.0
4.7
5.7
CS1 11.2
Monitoring
Depth
Temperrature (oC) pHSalinity
(ppt)
DO
(mg/l)
1500
WM1
WM2
WM3
WM4
1700
1630
1602
1530
14.6
LocationSampling
Time
Water
Depth (m)
15.0
5.8
8.4
9.8
CS2
1737
Upstream Control Station:
Suspended Solids
(mg/l)
3.8
3.6
3.0
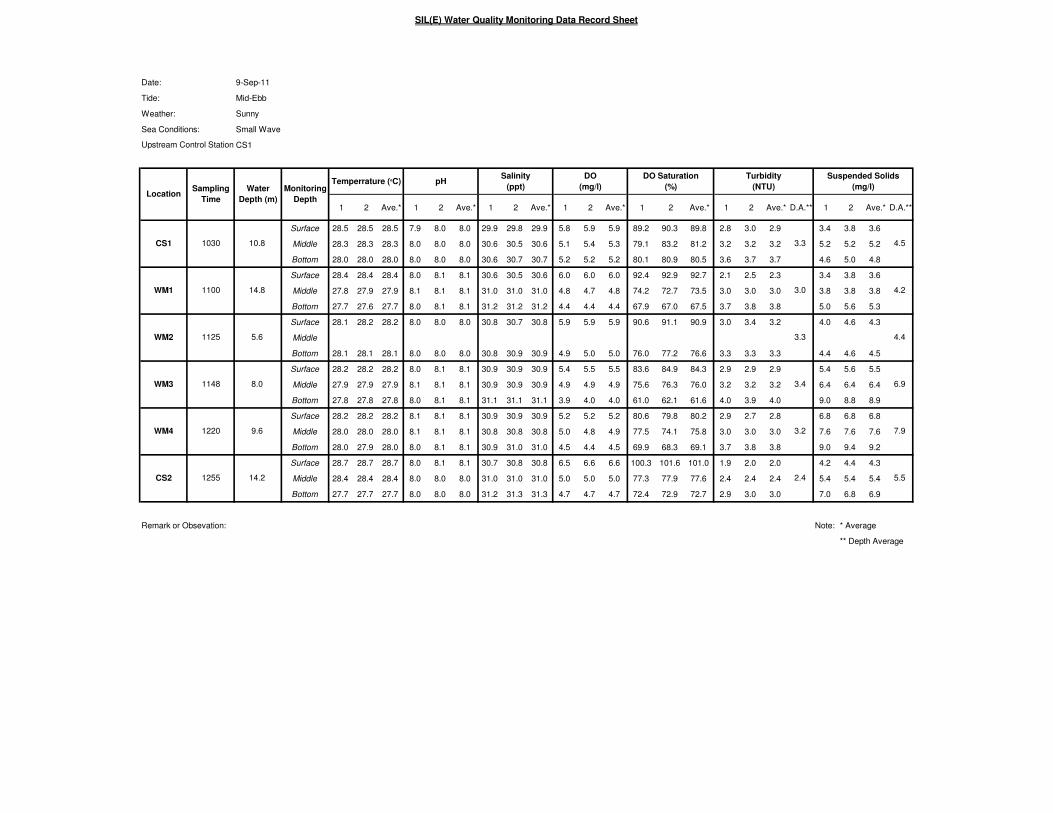
SIL(E) Water Quality Monitoring Data Record Sheet
Date: 9-Sep-11
Tide: Mid-Ebb
Weather: Sunny
Sea Conditions: Small Wave
CS1
1 2 Ave.* 1 2 Ave.* 1 2 Ave.* 1 2 Ave.* 1 2 Ave.* 1 2 Ave.* D.A.** 1 2 Ave.* D.A.**
Surface 28.5 28.5 28.5 7.9 8.0 8.0 29.9 29.8 29.9 5.8 5.9 5.9 89.2 90.3 89.8 2.8 3.0 2.9 3.4 3.8 3.6
Middle 28.3 28.3 28.3 8.0 8.0 8.0 30.6 30.5 30.6 5.1 5.4 5.3 79.1 83.2 81.2 3.2 3.2 3.2 5.2 5.2 5.2
Bottom 28.0 28.0 28.0 8.0 8.0 8.0 30.6 30.7 30.7 5.2 5.2 5.2 80.1 80.9 80.5 3.6 3.7 3.7 4.6 5.0 4.8
Surface 28.4 28.4 28.4 8.0 8.1 8.1 30.6 30.5 30.6 6.0 6.0 6.0 92.4 92.9 92.7 2.1 2.5 2.3 3.4 3.8 3.6
Middle 27.8 27.9 27.9 8.1 8.1 8.1 31.0 31.0 31.0 4.8 4.7 4.8 74.2 72.7 73.5 3.0 3.0 3.0 3.8 3.8 3.8
Bottom 27.7 27.6 27.7 8.0 8.1 8.1 31.2 31.2 31.2 4.4 4.4 4.4 67.9 67.0 67.5 3.7 3.8 3.8 5.0 5.6 5.3
Surface 28.1 28.2 28.2 8.0 8.0 8.0 30.8 30.7 30.8 5.9 5.9 5.9 90.6 91.1 90.9 3.0 3.4 3.2 4.0 4.6 4.3
Middle
Bottom 28.1 28.1 28.1 8.0 8.0 8.0 30.8 30.9 30.9 4.9 5.0 5.0 76.0 77.2 76.6 3.3 3.3 3.3 4.4 4.6 4.5
Surface 28.2 28.2 28.2 8.0 8.1 8.1 30.9 30.9 30.9 5.4 5.5 5.5 83.6 84.9 84.3 2.9 2.9 2.9 5.4 5.6 5.5
Middle 27.9 27.9 27.9 8.1 8.1 8.1 30.9 30.9 30.9 4.9 4.9 4.9 75.6 76.3 76.0 3.2 3.2 3.2 6.4 6.4 6.4
Bottom 27.8 27.8 27.8 8.0 8.1 8.1 31.1 31.1 31.1 3.9 4.0 4.0 61.0 62.1 61.6 4.0 3.9 4.0 9.0 8.8 8.9
Surface 28.2 28.2 28.2 8.1 8.1 8.1 30.9 30.9 30.9 5.2 5.2 5.2 80.6 79.8 80.2 2.9 2.7 2.8 6.8 6.8 6.8
Middle 28.0 28.0 28.0 8.1 8.1 8.1 30.8 30.8 30.8 5.0 4.8 4.9 77.5 74.1 75.8 3.0 3.0 3.0 7.6 7.6 7.6
Bottom 28.0 27.9 28.0 8.0 8.1 8.1 30.9 31.0 31.0 4.5 4.4 4.5 69.9 68.3 69.1 3.7 3.8 3.8 9.0 9.4 9.2
Surface 28.7 28.7 28.7 8.0 8.1 8.1 30.7 30.8 30.8 6.5 6.6 6.6 100.3 101.6 101.0 1.9 2.0 2.0 4.2 4.4 4.3
Middle 28.4 28.4 28.4 8.0 8.0 8.0 31.0 31.0 31.0 5.0 5.0 5.0 77.3 77.9 77.6 2.4 2.4 2.4 5.4 5.4 5.4
Bottom 27.7 27.7 27.7 8.0 8.0 8.0 31.2 31.3 31.3 4.7 4.7 4.7 72.4 72.9 72.7 2.9 3.0 3.0 7.0 6.8 6.9
Remark or Obsevation: Note: * Average
** Depth Average
Upstream Control Station:
Salinity
(ppt)
DO
(mg/l)Location
Sampling
Time
Water
Depth (m)
Monitoring
Depth
DO Saturation
(%)
Turbidity
(NTU)
Suspended Solids
(mg/l)
CS1 1030 10.8 3.3 4.5
Temperrature (oC) pH
4.2
WM2 1125 5.6 3.3 4.4
WM1 1100 14.8 3.0
6.9
WM4 1220 9.6 3.2 7.9
WM3 1148 8.0 3.4
5.5CS2 1255 14.2 2.4
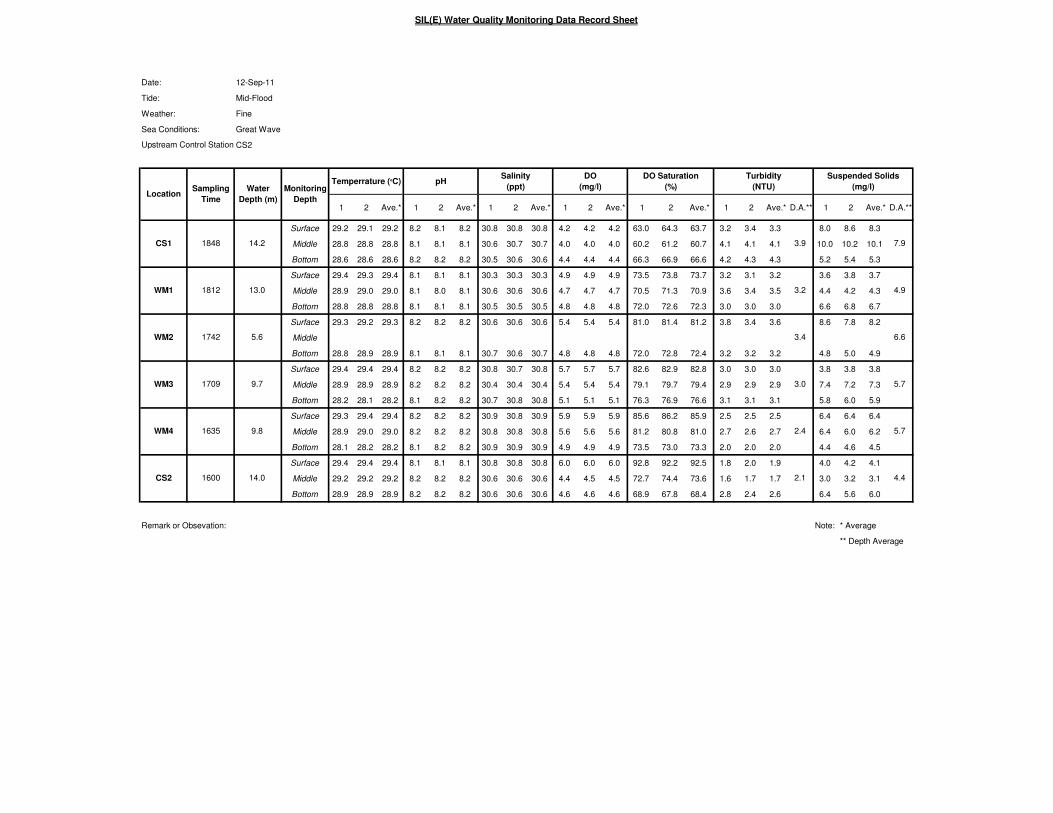
SIL(E) Water Quality Monitoring Data Record Sheet
Date: 12-Sep-11
Tide: Mid-Flood
Weather: Fine
Sea Conditions: Great Wave
CS2
1 2 Ave.* 1 2 Ave.* 1 2 Ave.* 1 2 Ave.* 1 2 Ave.* 1 2 Ave.* D.A.** 1 2 Ave.* D.A.**
Surface 29.2 29.1 29.2 8.2 8.1 8.2 30.8 30.8 30.8 4.2 4.2 4.2 63.0 64.3 63.7 3.2 3.4 3.3 8.0 8.6 8.3
Middle 28.8 28.8 28.8 8.1 8.1 8.1 30.6 30.7 30.7 4.0 4.0 4.0 60.2 61.2 60.7 4.1 4.1 4.1 10.0 10.2 10.1
Bottom 28.6 28.6 28.6 8.2 8.2 8.2 30.5 30.6 30.6 4.4 4.4 4.4 66.3 66.9 66.6 4.2 4.3 4.3 5.2 5.4 5.3
Surface 29.4 29.3 29.4 8.1 8.1 8.1 30.3 30.3 30.3 4.9 4.9 4.9 73.5 73.8 73.7 3.2 3.1 3.2 3.6 3.8 3.7
Middle 28.9 29.0 29.0 8.1 8.0 8.1 30.6 30.6 30.6 4.7 4.7 4.7 70.5 71.3 70.9 3.6 3.4 3.5 4.4 4.2 4.3
Bottom 28.8 28.8 28.8 8.1 8.1 8.1 30.5 30.5 30.5 4.8 4.8 4.8 72.0 72.6 72.3 3.0 3.0 3.0 6.6 6.8 6.7
Surface 29.3 29.2 29.3 8.2 8.2 8.2 30.6 30.6 30.6 5.4 5.4 5.4 81.0 81.4 81.2 3.8 3.4 3.6 8.6 7.8 8.2
Middle
Bottom 28.8 28.9 28.9 8.1 8.1 8.1 30.7 30.6 30.7 4.8 4.8 4.8 72.0 72.8 72.4 3.2 3.2 3.2 4.8 5.0 4.9
Surface 29.4 29.4 29.4 8.2 8.2 8.2 30.8 30.7 30.8 5.7 5.7 5.7 82.6 82.9 82.8 3.0 3.0 3.0 3.8 3.8 3.8
Middle 28.9 28.9 28.9 8.2 8.2 8.2 30.4 30.4 30.4 5.4 5.4 5.4 79.1 79.7 79.4 2.9 2.9 2.9 7.4 7.2 7.3
Bottom 28.2 28.1 28.2 8.1 8.2 8.2 30.7 30.8 30.8 5.1 5.1 5.1 76.3 76.9 76.6 3.1 3.1 3.1 5.8 6.0 5.9
Surface 29.3 29.4 29.4 8.2 8.2 8.2 30.9 30.8 30.9 5.9 5.9 5.9 85.6 86.2 85.9 2.5 2.5 2.5 6.4 6.4 6.4
Middle 28.9 29.0 29.0 8.2 8.2 8.2 30.8 30.8 30.8 5.6 5.6 5.6 81.2 80.8 81.0 2.7 2.6 2.7 6.4 6.0 6.2
Bottom 28.1 28.2 28.2 8.1 8.2 8.2 30.9 30.9 30.9 4.9 4.9 4.9 73.5 73.0 73.3 2.0 2.0 2.0 4.4 4.6 4.5
Surface 29.4 29.4 29.4 8.1 8.1 8.1 30.8 30.8 30.8 6.0 6.0 6.0 92.8 92.2 92.5 1.8 2.0 1.9 4.0 4.2 4.1
Middle 29.2 29.2 29.2 8.2 8.2 8.2 30.6 30.6 30.6 4.4 4.5 4.5 72.7 74.4 73.6 1.6 1.7 1.7 3.0 3.2 3.1
Bottom 28.9 28.9 28.9 8.2 8.2 8.2 30.6 30.6 30.6 4.6 4.6 4.6 68.9 67.8 68.4 2.8 2.4 2.6 6.4 5.6 6.0
Remark or Obsevation: Note: * Average
** Depth Average
Upstream Control Station:
Suspended Solids
(mg/l)
3.9
3.2
3.4
14.0
LocationSampling
Time
Water
Depth (m)
13.0
5.6
9.7
9.8
CS2
1848
1600
WM1
WM2
WM3
WM4
1812
1742
1709
1635
pHSalinity
(ppt)
DO
(mg/l)
CS1 14.2
Monitoring
Depth
Temperrature (oC)
7.9
4.9
6.6
5.7
5.7
4.4
DO Saturation
(%)
Turbidity
(NTU)
3.0
2.4
2.1

SIL(E) Water Quality Monitoring Data Record Sheet
Date: 12-Sep-11
Tide: Mid-Ebb
Weather: Fine
Sea Conditions: Great Wave
CS1
1 2 Ave.* 1 2 Ave.* 1 2 Ave.* 1 2 Ave.* 1 2 Ave.* 1 2 Ave.* D.A.** 1 2 Ave.* D.A.**
Surface 28.9 28.8 28.9 8.1 8.1 8.1 30.4 30.4 30.4 3.9 3.9 3.9 59.8 59.2 59.5 3.8 4.0 3.9 4.6 5.0 4.8
Middle 28.6 28.6 28.6 8.1 8.1 8.1 30.5 30.5 30.5 4.5 4.5 4.5 66.5 67.2 66.9 4.2 4.2 4.2 7.0 6.8 6.9
Bottom 28.7 28.7 28.7 8.1 8.1 8.1 30.4 30.4 30.4 4.2 4.2 4.2 61.9 60.8 61.4 3.8 3.9 3.9 4.2 4.2 4.2
Surface 28.9 28.8 28.9 8.0 8.0 8.0 30.5 30.5 30.5 4.7 4.7 4.7 72.8 73.4 73.1 3.0 3.0 3.0 4.6 4.6 4.6
Middle 29.0 29.0 29.0 8.0 8.0 8.0 30.5 30.5 30.5 4.8 4.8 4.8 73.5 73.9 73.7 3.4 3.4 3.4 4.2 4.4 4.3
Bottom 28.7 28.8 28.8 8.0 8.0 8.0 30.4 30.4 30.4 4.8 4.8 4.8 73.9 72.0 73.0 3.8 3.8 3.8 4.8 5.2 5.0
Surface 29.0 29.0 29.0 8.0 8.0 8.0 30.4 30.4 30.4 5.1 5.1 5.1 75.3 75.8 75.6 3.4 3.4 3.4 4.2 4.2 4.2
Middle
Bottom 28.9 28.9 28.9 8.0 8.0 8.0 30.0 30.1 30.1 4.5 4.5 4.5 73.7 75.1 74.4 4.2 4.2 4.2 5.2 5.6 5.4
Surface 29.0 29.0 29.0 8.1 8.1 8.1 30.5 30.5 30.5 4.7 4.7 4.7 72.1 72.9 72.5 2.8 2.8 2.8 6.2 6.2 6.2
Middle 28.8 28.9 28.9 8.1 8.1 8.1 30.2 30.2 30.2 5.2 5.2 5.2 77.4 78.4 77.9 3.0 3.0 3.0 6.4 6.8 6.6
Bottom 28.0 28.1 28.1 8.1 8.1 8.1 30.6 30.6 30.6 5.0 5.0 5.0 75.4 75.6 75.5 3.2 3.2 3.2 7.2 6.8 7.0
Surface 29.0 29.0 29.0 8.1 8.1 8.1 30.6 30.7 30.7 5.0 5.0 5.0 75.9 75.1 75.5 2.8 2.8 2.8 6.2 6.4 6.3
Middle 28.7 28.6 28.7 8.1 8.1 8.1 30.7 30.6 30.7 5.2 5.2 5.2 78.2 79.0 78.6 3.1 3.1 3.1 7.0 7.2 7.1
Bottom 28.2 28.3 28.3 8.1 8.1 8.1 30.7 30.7 30.7 4.9 4.9 4.9 74.2 76.6 75.4 3.4 3.4 3.4 9.6 9.0 9.3
Surface 29.0 29.0 29.0 8.0 8.0 8.0 30.8 30.8 30.8 5.2 5.2 5.2 79.4 79.2 79.3 2.9 2.9 2.9 6.2 6.6 6.4
Middle 28.7 28.7 28.7 8.0 8.0 8.0 30.9 30.8 30.9 5.1 5.1 5.1 76.9 76.3 76.6 3.2 3.1 3.2 6.8 6.4 6.6
Bottom 28.7 28.7 28.7 8.0 8.0 8.0 31.0 31.0 31.0 4.8 4.8 4.8 72.9 72.6 72.8 3.1 3.1 3.1 7.0 7.0 7.0
Remark or Obsevation: Note: * Average
** Depth Average
6.7CS2 1405 14.0 3.1
6.6
WM4 1335 9.0 3.1 7.6
WM3 1305 8.2 3.0
4.6
WM2 1235 5.8 3.8 4.8
WM1 1200 12.0 3.4
DO Saturation
(%)
Turbidity
(NTU)
Suspended Solids
(mg/l)
CS1 1130 14.4 4.0 5.3
Temperrature (oC) pHSalinity
(ppt)
DO
(mg/l)Location
Sampling
Time
Water
Depth (m)
Monitoring
Depth
Upstream Control Station:

SIL(E) Water Quality Monitoring Data Record Sheet
Date: 14-Sep-11
Tide: Mid-Flood
Weather: Fine
Sea Conditions: Great Wave
CS2
1 2 Ave.* 1 2 Ave.* 1 2 Ave.* 1 2 Ave.* 1 2 Ave.* 1 2 Ave.* D.A.** 1 2 Ave.* D.A.**
Surface 28.4 28.2 28.3 8.0 8.1 8.1 30.5 30.6 30.6 5.1 5.2 5.2 78.2 79.9 79.1 3.6 3.5 3.6 8.0 7.8 7.9
Middle 28.1 28.1 28.1 8.0 8.0 8.0 30.6 30.6 30.6 4.8 4.8 4.8 73.5 74.1 73.8 3.7 3.6 3.7 9.4 8.8 9.1
Bottom 28.0 28.0 28.0 8.0 8.0 8.0 30.7 30.8 30.8 4.4 4.3 4.4 67.5 65.9 66.7 4.1 4.0 4.1 4.4 4.4 4.4
Surface 29.4 29.4 29.4 8.0 8.0 8.0 30.4 30.5 30.5 4.2 4.2 4.2 64.1 65.0 64.6 3.3 3.4 3.4 4.0 4.2 4.1
Middle 29.3 29.3 29.3 8.0 8.0 8.0 30.4 30.3 30.4 4.1 4.1 4.1 62.3 63.5 62.9 3.6 3.6 3.6 4.8 5.0 4.9
Bottom 29.2 29.1 29.2 8.0 8.0 8.0 30.6 30.7 30.7 3.7 3.6 3.7 57.3 55.3 56.3 3.7 3.8 3.8 7.8 8.0 7.9
Surface 29.4 29.4 29.4 8.0 8.0 8.0 30.4 30.3 30.4 4.1 4.2 4.2 63.8 65.1 64.5 3.1 3.1 3.1 7.6 7.8 7.7
Middle
Bottom 29.4 29.3 29.4 8.0 8.0 8.0 30.4 30.4 30.4 4.0 4.0 4.0 61.3 62.0 61.7 3.1 3.2 3.2 4.8 5.0 4.9
Surface 29.7 29.7 29.7 8.0 8.0 8.0 30.5 30.5 30.5 4.2 4.2 4.2 64.1 64.8 64.5 2.8 2.8 2.8 4.2 4.2 4.2
Middle 29.6 29.6 29.6 8.0 8.0 8.0 30.4 30.4 30.4 4.1 4.0 4.1 63.3 61.2 62.3 2.6 2.6 2.6 6.6 6.6 6.6
Bottom 29.4 29.4 29.4 8.0 8.0 8.0 30.5 30.5 30.5 3.7 3.7 3.7 56.2 57.3 56.8 2.9 2.9 2.9 6.2 6.0 6.1
Surface 29.5 29.6 29.6 7.9 8.0 8.0 30.6 30.6 30.6 4.6 4.5 4.6 71.1 69.2 70.2 3.0 2.8 2.9 7.6 7.2 7.4
Middle 29.6 29.6 29.6 8.0 8.0 8.0 30.6 30.6 30.6 3.9 4.0 4.0 59.8 61.7 60.8 3.0 3.1 3.1 6.6 7.0 6.8
Bottom 29.4 29.4 29.4 8.0 8.0 8.0 30.8 30.7 30.8 4.2 4.1 4.2 65.1 62.9 64.0 2.5 2.6 2.6 6.4 6.6 6.5
Surface 29.8 29.9 29.9 7.9 7.9 7.9 29.2 29.3 29.3 5.5 5.6 5.6 84.1 86.0 85.1 3.3 3.1 3.2 7.4 7.0 7.2
Middle 29.5 29.5 29.5 7.9 8.0 8.0 30.5 30.6 30.6 4.7 4.8 4.8 72.2 74.1 73.2 2.8 2.9 2.9 4.4 4.4 4.4
Bottom 29.2 29.2 29.2 8.0 8.0 8.0 30.8 30.9 30.9 4.2 4.3 4.3 64.1 66.3 65.2 2.9 3.0 3.0 7.4 7.6 7.5
Remark or Obsevation: Note: * Average
** Depth Average
DO Saturation
(%)
Turbidity
(NTU)
2.8
2.8
3.0
7.1
5.6
6.3
5.6
6.9
6.4
CS1 11.8
Monitoring
Depth
Temperrature (oC) pHSalinity
(ppt)
DO
(mg/l)
1630
WM1
WM2
WM3
WM4
1835
1805
1736
1705
14.8
LocationSampling
Time
Water
Depth (m)
12.6
5.8
10.0
10.4
CS2
1912
Upstream Control Station:
Suspended Solids
(mg/l)
3.8
3.6
3.1
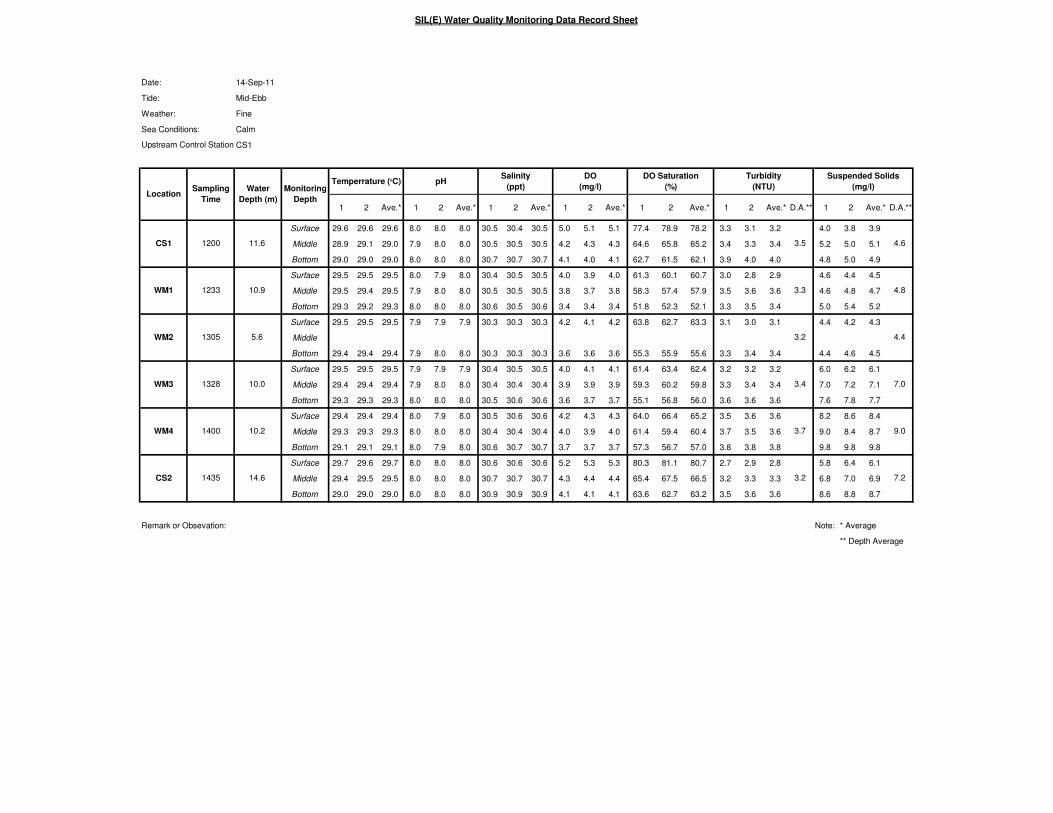
SIL(E) Water Quality Monitoring Data Record Sheet
Date: 14-Sep-11
Tide: Mid-Ebb
Weather: Fine
Sea Conditions: Calm
CS1
1 2 Ave.* 1 2 Ave.* 1 2 Ave.* 1 2 Ave.* 1 2 Ave.* 1 2 Ave.* D.A.** 1 2 Ave.* D.A.**
Surface 29.6 29.6 29.6 8.0 8.0 8.0 30.5 30.4 30.5 5.0 5.1 5.1 77.4 78.9 78.2 3.3 3.1 3.2 4.0 3.8 3.9
Middle 28.9 29.1 29.0 7.9 8.0 8.0 30.5 30.5 30.5 4.2 4.3 4.3 64.6 65.8 65.2 3.4 3.3 3.4 5.2 5.0 5.1
Bottom 29.0 29.0 29.0 8.0 8.0 8.0 30.7 30.7 30.7 4.1 4.0 4.1 62.7 61.5 62.1 3.9 4.0 4.0 4.8 5.0 4.9
Surface 29.5 29.5 29.5 8.0 7.9 8.0 30.4 30.5 30.5 4.0 3.9 4.0 61.3 60.1 60.7 3.0 2.8 2.9 4.6 4.4 4.5
Middle 29.5 29.4 29.5 7.9 8.0 8.0 30.5 30.5 30.5 3.8 3.7 3.8 58.3 57.4 57.9 3.5 3.6 3.6 4.6 4.8 4.7
Bottom 29.3 29.2 29.3 8.0 8.0 8.0 30.6 30.5 30.6 3.4 3.4 3.4 51.8 52.3 52.1 3.3 3.5 3.4 5.0 5.4 5.2
Surface 29.5 29.5 29.5 7.9 7.9 7.9 30.3 30.3 30.3 4.2 4.1 4.2 63.8 62.7 63.3 3.1 3.0 3.1 4.4 4.2 4.3
Middle
Bottom 29.4 29.4 29.4 7.9 8.0 8.0 30.3 30.3 30.3 3.6 3.6 3.6 55.3 55.9 55.6 3.3 3.4 3.4 4.4 4.6 4.5
Surface 29.5 29.5 29.5 7.9 7.9 7.9 30.4 30.5 30.5 4.0 4.1 4.1 61.4 63.4 62.4 3.2 3.2 3.2 6.0 6.2 6.1
Middle 29.4 29.4 29.4 7.9 8.0 8.0 30.4 30.4 30.4 3.9 3.9 3.9 59.3 60.2 59.8 3.3 3.4 3.4 7.0 7.2 7.1
Bottom 29.3 29.3 29.3 8.0 8.0 8.0 30.5 30.6 30.6 3.6 3.7 3.7 55.1 56.8 56.0 3.6 3.6 3.6 7.6 7.8 7.7
Surface 29.4 29.4 29.4 8.0 7.9 8.0 30.5 30.6 30.6 4.2 4.3 4.3 64.0 66.4 65.2 3.5 3.6 3.6 8.2 8.6 8.4
Middle 29.3 29.3 29.3 8.0 8.0 8.0 30.4 30.4 30.4 4.0 3.9 4.0 61.4 59.4 60.4 3.7 3.5 3.6 9.0 8.4 8.7
Bottom 29.1 29.1 29.1 8.0 7.9 8.0 30.6 30.7 30.7 3.7 3.7 3.7 57.3 56.7 57.0 3.8 3.8 3.8 9.8 9.8 9.8
Surface 29.7 29.6 29.7 8.0 8.0 8.0 30.6 30.6 30.6 5.2 5.3 5.3 80.3 81.1 80.7 2.7 2.9 2.8 5.8 6.4 6.1
Middle 29.4 29.5 29.5 8.0 8.0 8.0 30.7 30.7 30.7 4.3 4.4 4.4 65.4 67.5 66.5 3.2 3.3 3.3 6.8 7.0 6.9
Bottom 29.0 29.0 29.0 8.0 8.0 8.0 30.9 30.9 30.9 4.1 4.1 4.1 63.6 62.7 63.2 3.5 3.6 3.6 8.6 8.8 8.7
Remark or Obsevation: Note: * Average
** Depth Average
Upstream Control Station:
Salinity
(ppt)
DO
(mg/l)Location
Sampling
Time
Water
Depth (m)
Monitoring
Depth
DO Saturation
(%)
Turbidity
(NTU)
Suspended Solids
(mg/l)
CS1 1200 11.6 3.5 4.6
Temperrature (oC) pH
4.8
WM2 1305 5.6 3.2 4.4
WM1 1233 10.9 3.3
7.0
WM4 1400 10.2 3.7 9.0
WM3 1328 10.0 3.4
7.2CS2 1435 14.6 3.2
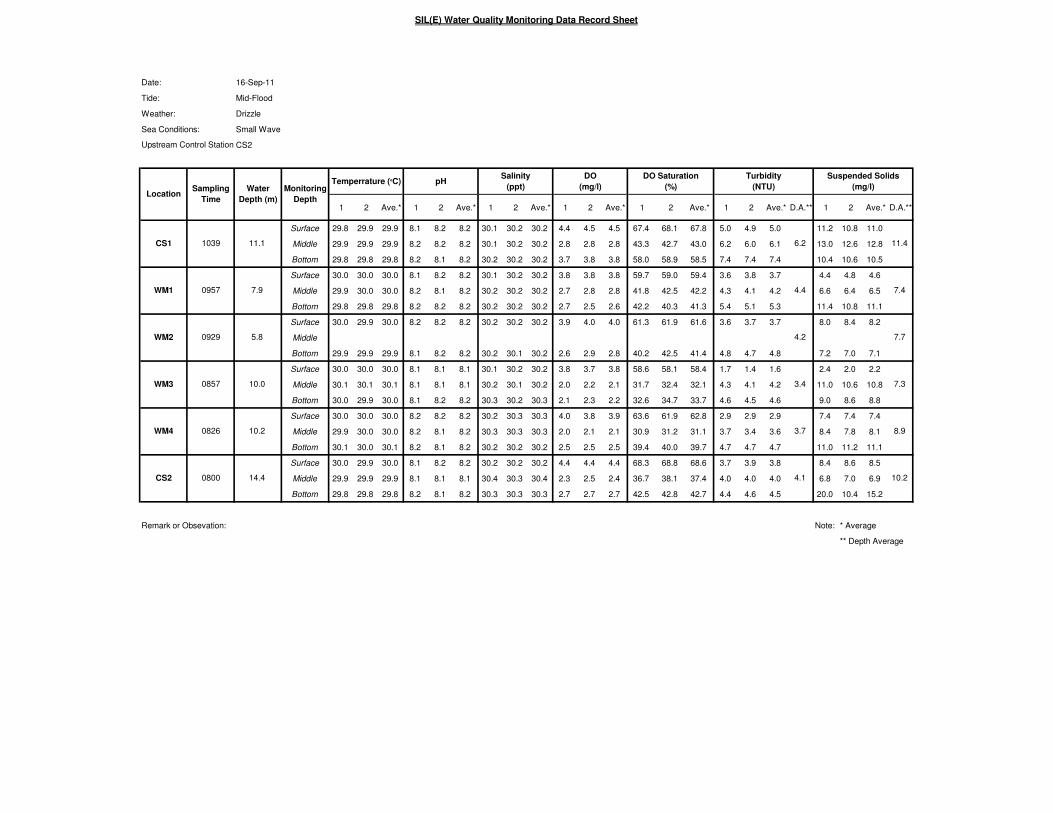
SIL(E) Water Quality Monitoring Data Record Sheet
Date: 16-Sep-11
Tide: Mid-Flood
Weather: Drizzle
Sea Conditions: Small Wave
CS2
1 2 Ave.* 1 2 Ave.* 1 2 Ave.* 1 2 Ave.* 1 2 Ave.* 1 2 Ave.* D.A.** 1 2 Ave.* D.A.**
Surface 29.8 29.9 29.9 8.1 8.2 8.2 30.1 30.2 30.2 4.4 4.5 4.5 67.4 68.1 67.8 5.0 4.9 5.0 11.2 10.8 11.0
Middle 29.9 29.9 29.9 8.2 8.2 8.2 30.1 30.2 30.2 2.8 2.8 2.8 43.3 42.7 43.0 6.2 6.0 6.1 13.0 12.6 12.8
Bottom 29.8 29.8 29.8 8.2 8.1 8.2 30.2 30.2 30.2 3.7 3.8 3.8 58.0 58.9 58.5 7.4 7.4 7.4 10.4 10.6 10.5
Surface 30.0 30.0 30.0 8.1 8.2 8.2 30.1 30.2 30.2 3.8 3.8 3.8 59.7 59.0 59.4 3.6 3.8 3.7 4.4 4.8 4.6
Middle 29.9 30.0 30.0 8.2 8.1 8.2 30.2 30.2 30.2 2.7 2.8 2.8 41.8 42.5 42.2 4.3 4.1 4.2 6.6 6.4 6.5
Bottom 29.8 29.8 29.8 8.2 8.2 8.2 30.2 30.2 30.2 2.7 2.5 2.6 42.2 40.3 41.3 5.4 5.1 5.3 11.4 10.8 11.1
Surface 30.0 29.9 30.0 8.2 8.2 8.2 30.2 30.2 30.2 3.9 4.0 4.0 61.3 61.9 61.6 3.6 3.7 3.7 8.0 8.4 8.2
Middle
Bottom 29.9 29.9 29.9 8.1 8.2 8.2 30.2 30.1 30.2 2.6 2.9 2.8 40.2 42.5 41.4 4.8 4.7 4.8 7.2 7.0 7.1
Surface 30.0 30.0 30.0 8.1 8.1 8.1 30.1 30.2 30.2 3.8 3.7 3.8 58.6 58.1 58.4 1.7 1.4 1.6 2.4 2.0 2.2
Middle 30.1 30.1 30.1 8.1 8.1 8.1 30.2 30.1 30.2 2.0 2.2 2.1 31.7 32.4 32.1 4.3 4.1 4.2 11.0 10.6 10.8
Bottom 30.0 29.9 30.0 8.1 8.2 8.2 30.3 30.2 30.3 2.1 2.3 2.2 32.6 34.7 33.7 4.6 4.5 4.6 9.0 8.6 8.8
Surface 30.0 30.0 30.0 8.2 8.2 8.2 30.2 30.3 30.3 4.0 3.8 3.9 63.6 61.9 62.8 2.9 2.9 2.9 7.4 7.4 7.4
Middle 29.9 30.0 30.0 8.2 8.1 8.2 30.3 30.3 30.3 2.0 2.1 2.1 30.9 31.2 31.1 3.7 3.4 3.6 8.4 7.8 8.1
Bottom 30.1 30.0 30.1 8.2 8.1 8.2 30.2 30.2 30.2 2.5 2.5 2.5 39.4 40.0 39.7 4.7 4.7 4.7 11.0 11.2 11.1
Surface 30.0 29.9 30.0 8.1 8.2 8.2 30.2 30.2 30.2 4.4 4.4 4.4 68.3 68.8 68.6 3.7 3.9 3.8 8.4 8.6 8.5
Middle 29.9 29.9 29.9 8.1 8.1 8.1 30.4 30.3 30.4 2.3 2.5 2.4 36.7 38.1 37.4 4.0 4.0 4.0 6.8 7.0 6.9
Bottom 29.8 29.8 29.8 8.2 8.1 8.2 30.3 30.3 30.3 2.7 2.7 2.7 42.5 42.8 42.7 4.4 4.6 4.5 20.0 10.4 15.2
Remark or Obsevation: Note: * Average
** Depth Average
Upstream Control Station:
Suspended Solids
(mg/l)
6.2
4.4
4.2
14.4
LocationSampling
Time
Water
Depth (m)
7.9
5.8
10.0
10.2
CS2
1039
0800
WM1
WM2
WM3
WM4
0957
0929
0857
0826
pHSalinity
(ppt)
DO
(mg/l)
CS1 11.1
Monitoring
Depth
Temperrature (oC)
11.4
7.4
7.7
7.3
8.9
10.2
DO Saturation
(%)
Turbidity
(NTU)
3.4
3.7
4.1

SIL(E) Water Quality Monitoring Data Record Sheet
Date: 16-Sep-11
Tide: Mid-Ebb
Weather: Cloudy
Sea Conditions: Great Wave
CS1
1 2 Ave.* 1 2 Ave.* 1 2 Ave.* 1 2 Ave.* 1 2 Ave.* 1 2 Ave.* D.A.** 1 2 Ave.* D.A.**
Surface 30.3 30.2 30.3 8.1 8.2 8.2 30.0 30.0 30.0 5.4 5.5 5.5 85.4 86.6 86.0 3.2 3.4 3.3 4.0 4.4 4.2
Middle 30.3 30.3 30.3 8.3 8.2 8.3 30.1 30.2 30.2 3.4 3.2 3.3 52.4 50.0 51.2 4.2 4.5 4.4 6.8 7.2 7.0
Bottom 30.1 30.0 30.1 8.2 8.2 8.2 30.3 30.3 30.3 3.2 3.1 3.2 50.5 48.0 49.3 6.1 6.2 6.2 7.4 7.6 7.5
Surface 30.1 30.1 30.1 8.2 8.3 8.3 30.0 30.0 30.0 4.3 4.2 4.3 67.1 65.2 66.2 4.5 4.3 4.4 7.0 6.6 6.8
Middle 30.1 30.2 30.2 8.2 8.1 8.2 30.1 30.1 30.1 2.3 2.5 2.4 36.7 38.5 37.6 4.9 4.7 4.8 6.6 6.2 6.4
Bottom 30.0 29.9 30.0 8.3 8.3 8.3 30.2 30.3 30.3 2.2 2.3 2.3 34.6 35.1 34.9 7.1 6.9 7.0 8.6 8.6 8.6
Surface 30.2 30.3 30.3 8.1 8.2 8.2 30.0 30.0 30.0 4.0 4.1 4.1 61.8 63.5 62.7 4.3 4.4 4.4 5.4 5.8 5.6
Middle
Bottom 30.1 30.2 30.2 8.2 8.1 8.2 29.9 30.0 30.0 2.5 2.2 2.4 38.5 34.4 36.5 4.1 4.7 4.4 5.6 6.4 6.0
Surface 29.9 30.0 30.0 8.1 8.2 8.2 30.1 30.0 30.1 3.7 4.0 3.9 57.9 62.4 60.2 5.1 4.7 4.9 8.0 7.4 7.7
Middle 29.9 29.9 29.9 8.3 8.2 8.3 30.2 30.0 30.1 1.7 1.7 1.7 27.6 26.2 26.9 5.2 5.3 5.3 9.8 10.2 10.0
Bottom 30.0 29.9 30.0 8.2 8.2 8.2 30.1 30.1 30.1 1.7 1.6 1.7 26.1 24.9 25.5 5.5 5.7 5.6 12.0 12.6 12.3
Surface 30.0 30.0 30.0 8.3 8.3 8.3 30.1 30.0 30.1 3.8 3.9 3.9 59.1 60.7 59.9 3.8 3.7 3.8 8.4 8.4 8.4
Middle 30.0 29.9 30.0 8.2 8.2 8.2 30.1 30.1 30.1 2.1 1.9 2.0 32.4 30.1 31.3 4.4 4.2 4.3 10.8 10.2 10.5
Bottom 29.7 29.8 29.8 8.2 8.3 8.3 30.2 30.1 30.2 2.2 2.1 2.2 33.9 33.1 33.5 4.6 4.8 4.7 12.0 12.8 12.4
Surface 30.1 30.2 30.2 8.2 8.3 8.3 30.2 30.2 30.2 4.7 4.9 4.8 74.3 76.2 75.3 2.2 2.4 2.3 4.6 5.2 4.9
Middle 30.0 30.0 30.0 8.1 8.2 8.2 30.2 30.3 30.3 2.6 2.5 2.6 40.2 39.1 39.7 3.2 3.3 3.3 6.0 6.4 6.2
Bottom 29.9 29.9 29.9 8.1 8.2 8.2 30.2 30.2 30.2 2.4 2.7 2.6 37.5 41.4 39.5 3.1 3.3 3.2 7.8 8.4 8.1
Remark or Obsevation: Note: * Average
** Depth Average
6.4CS2 1542 14.6 2.9
10.0
WM4 1514 9.9 4.3 10.4
WM3 1442 10.0 5.3
7.3
WM2 1410 5.2 4.4 5.8
WM1 1336 9.3 5.4
DO Saturation
(%)
Turbidity
(NTU)
Suspended Solids
(mg/l)
CS1 1300 11.4 4.6 6.2
Temperrature (oC) pHSalinity
(ppt)
DO
(mg/l)Location
Sampling
Time
Water
Depth (m)
Monitoring
Depth
Upstream Control Station:

SIL(E) Water Quality Monitoring Data Record Sheet
Date: 19-Sep-11
Tide: Mid-Flood
Weather: Fine
Sea Conditions: Small Wave
CS2
1 2 Ave.* 1 2 Ave.* 1 2 Ave.* 1 2 Ave.* 1 2 Ave.* 1 2 Ave.* D.A.** 1 2 Ave.* D.A.**
Surface 29.6 29.7 29.7 7.9 7.9 7.9 30.2 30.2 30.2 4.6 4.7 4.7 71.1 73.2 72.2 3.0 3.1 3.1 5.0 5.6 5.3
Middle 29.5 29.4 29.5 7.9 8.0 8.0 30.3 30.4 30.4 4.3 4.2 4.3 66.7 65.3 66.0 3.8 4.0 3.9 7.2 6.8 7.0
Bottom 29.4 29.4 29.4 7.9 8.0 8.0 30.6 30.7 30.7 3.9 3.9 3.9 60.3 61.0 60.7 4.8 4.9 4.9 7.8 7.8 7.8
Surface 29.7 29.7 29.7 8.0 8.0 8.0 30.3 30.3 30.3 3.9 3.9 3.9 59.8 60.3 60.1 3.3 3.4 3.4 7.0 7.4 7.2
Middle 29.7 29.7 29.7 8.0 8.0 8.0 30.3 30.4 30.4 3.4 3.5 3.5 53.1 54.6 53.9 3.3 3.3 3.3 10.2 10.4 10.3
Bottom 29.4 29.5 29.5 8.0 7.9 8.0 30.5 30.4 30.5 3.3 3.3 3.3 50.9 51.8 51.4 4.6 4.4 4.5 6.4 6.6 6.5
Surface 29.6 29.6 29.6 7.9 8.0 8.0 30.2 30.2 30.2 3.8 3.8 3.8 58.5 59.3 58.9 3.2 3.1 3.2 8.0 7.8 7.9
Middle
Bottom 29.6 29.6 29.6 7.9 7.9 7.9 30.2 30.2 30.2 3.5 3.6 3.6 54.5 56.0 55.3 3.4 3.4 3.4 5.0 5.2 5.1
Surface 29.7 29.7 29.7 7.9 7.9 7.9 30.3 30.3 30.3 4.1 4.0 4.1 63.9 61.8 62.9 2.2 2.4 2.3 3.0 3.4 3.2
Middle 29.5 29.5 29.5 7.9 8.0 8.0 30.3 30.4 30.4 3.8 3.8 3.8 58.1 59.4 58.8 2.9 3.0 3.0 7.4 7.6 7.5
Bottom 29.4 29.5 29.5 7.9 8.0 8.0 30.4 30.5 30.5 3.0 3.2 3.1 47.1 50.2 48.7 3.5 3.4 3.5 6.6 6.2 6.4
Surface 29.7 29.8 29.8 7.8 7.9 7.9 30.3 30.3 30.3 3.9 4.0 4.0 60.2 61.5 60.9 3.0 3.1 3.1 7.6 7.8 7.7
Middle 29.8 29.8 29.8 7.9 7.9 7.9 30.3 30.3 30.3 3.7 3.7 3.7 56.8 57.7 57.3 2.9 2.9 2.9 6.4 6.4 6.4
Bottom 29.6 29.5 29.6 8.0 7.9 8.0 30.5 30.6 30.6 3.7 3.8 3.8 57.5 58.6 58.1 2.7 2.7 2.7 6.6 6.8 6.7
Surface 29.7 29.6 29.7 7.9 7.9 7.9 30.5 30.5 30.5 4.6 4.7 4.7 70.8 72.8 71.8 2.4 2.6 2.5 5.4 5.8 5.6
Middle 29.6 29.6 29.6 7.9 8.0 8.0 30.6 30.6 30.6 4.3 4.2 4.3 66.2 64.7 65.5 3.4 3.2 3.3 5.4 5.0 5.2
Bottom 28.9 29.0 29.0 8.0 7.9 8.0 30.8 30.9 30.9 3.8 3.9 3.9 59.1 62.7 60.9 3.1 3.1 3.1 9.0 9.0 9.0
Remark or Obsevation: Note: * Average
** Depth Average
DO Saturation
(%)
Turbidity
(NTU)
2.9
2.9
3.0
6.7
8.0
6.5
5.7
6.9
6.6
CS1 14.6
Monitoring
Depth
Temperrature (oC) pHSalinity
(ppt)
DO
(mg/l)
0900
WM1
WM2
WM3
WM4
1053
1023
0956
0930
14.8
LocationSampling
Time
Water
Depth (m)
14.0
5.8
8.6
9.0
CS2
1134
Upstream Control Station:
Suspended Solids
(mg/l)
3.9
3.7
3.3

SIL(E) Water Quality Monitoring Data Record Sheet
Date: 19-Sep-11
Tide: Mid-Ebb
Weather: Cloudy
Sea Conditions: Small Wave
CS1
1 2 Ave.* 1 2 Ave.* 1 2 Ave.* 1 2 Ave.* 1 2 Ave.* 1 2 Ave.* D.A.** 1 2 Ave.* D.A.**
Surface 29.9 29.8 29.9 8.0 8.0 8.0 29.4 29.4 29.4 5.8 5.7 5.8 89.6 87.7 88.7 4.4 4.5 4.5 5.4 5.6 5.5
Middle 29.8 29.7 29.8 8.0 8.0 8.0 30.5 30.6 30.6 4.5 4.6 4.6 69.6 71.4 70.5 4.2 4.0 4.1 6.2 6.2 6.2
Bottom 29.5 29.4 29.5 8.0 8.0 8.0 30.7 30.8 30.8 4.0 3.9 4.0 62.1 60.3 61.2 4.3 4.4 4.4 5.8 6.0 5.9
Surface 29.9 29.9 29.9 8.0 8.0 8.0 29.6 29.7 29.7 4.1 4.2 4.2 63.5 65.4 64.5 3.1 3.3 3.2 4.6 5.0 4.8
Middle 29.8 29.8 29.8 8.0 7.9 8.0 30.4 30.4 30.4 4.0 3.8 3.9 61.9 58.8 60.4 3.6 3.6 3.6 4.8 5.2 5.0
Bottom 29.4 29.4 29.4 8.0 8.0 8.0 30.5 30.6 30.6 3.5 3.5 3.5 53.7 54.8 54.3 4.0 4.2 4.1 5.8 6.2 6.0
Surface 29.9 29.9 29.9 8.0 7.9 8.0 29.9 30.0 30.0 4.2 4.2 4.2 65.1 64.3 64.7 3.4 3.6 3.5 4.6 5.0 4.8
Middle
Bottom 29.8 29.8 29.8 8.0 8.0 8.0 30.3 30.3 30.3 3.8 3.8 3.8 58.1 61.1 59.6 4.0 4.0 4.0 5.4 5.4 5.4
Surface 29.6 29.7 29.7 7.9 8.0 8.0 30.6 30.7 30.7 4.0 4.0 4.0 61.2 62.4 61.8 3.4 3.5 3.5 6.2 6.2 6.2
Middle 29.6 29.6 29.6 8.0 8.0 8.0 30.5 30.5 30.5 3.8 3.7 3.8 59.3 57.7 58.5 3.9 3.9 3.9 7.4 7.6 7.5
Bottom 29.4 29.4 29.4 8.0 8.0 8.0 30.7 30.8 30.8 3.5 3.5 3.5 53.5 54.7 54.1 4.3 4.5 4.4 9.2 9.6 9.4
Surface 29.9 29.8 29.9 7.9 7.9 7.9 30.6 30.7 30.7 4.4 4.5 4.5 67.9 69.3 68.6 2.4 2.1 2.3 6.0 5.4 5.7
Middle 29.8 29.7 29.8 7.9 8.0 8.0 30.5 30.5 30.5 4.1 4.2 4.2 63.5 65.4 64.5 2.5 2.7 2.6 6.4 6.8 6.6
Bottom 29.5 29.5 29.5 8.0 7.9 8.0 30.8 30.8 30.8 3.8 3.8 3.8 58.4 59.2 58.8 3.9 4.0 4.0 12.2 12.6 12.4
Surface 29.9 29.9 29.9 7.9 8.0 8.0 30.8 30.9 30.9 5.8 5.6 5.7 88.7 86.1 87.4 2.2 2.0 2.1 4.6 4.6 4.6
Middle 29.6 29.6 29.6 8.0 8.0 8.0 31.0 31.0 31.0 4.9 4.9 4.9 75.2 76.0 75.6 3.4 3.6 3.5 7.2 7.6 7.4
Bottom 29.2 29.2 29.2 8.0 8.0 8.0 31.4 31.3 31.4 4.0 4.0 4.0 61.2 62.4 61.8 4.6 4.7 4.7 11.6 12.0 11.8
Remark or Obsevation: Note: * Average
** Depth Average
Upstream Control Station:
Salinity
(ppt)
DO
(mg/l)Location
Sampling
Time
Water
Depth (m)
Monitoring
Depth
DO Saturation
(%)
Turbidity
(NTU)
Suspended Solids
(mg/l)
CS1 1330 14.0 4.3 5.9
Temperrature (oC) pH
5.3
WM2 1433 5.6 3.8 5.1
WM1 1403 13.6 3.6
7.7
WM4 1538 8.8 2.9 8.2
WM3 1507 8.6 3.9
7.9CS2 1615 14.4 3.4

SIL(E) Water Quality Monitoring Data Record Sheet
Date: 21-Sep-11
Tide: Mid-Flood
Weather: Fine
Sea Conditions: Great Wave
CS2
1 2 Ave.* 1 2 Ave.* 1 2 Ave.* 1 2 Ave.* 1 2 Ave.* 1 2 Ave.* D.A.** 1 2 Ave.* D.A.**
Surface 29.6 29.6 29.6 8.2 8.3 8.3 31.2 31.2 31.2 5.1 5.0 5.1 80.2 78.1 79.2 4.0 4.1 4.1 8.8 9.2 9.0
Middle 29.3 29.4 29.4 8.1 8.1 8.1 31.2 31.3 31.3 2.9 3.0 3.0 45.2 46.8 46.0 4.6 4.7 4.7 11.8 11.8 11.8
Bottom 29.3 29.3 29.3 8.2 8.1 8.2 31.0 31.0 31.0 3.1 3.0 3.1 47.6 46.8 47.2 6.0 5.7 5.9 9.2 8.8 9.0
Surface 29.6 29.7 29.7 8.2 8.2 8.2 30.8 30.8 30.8 4.2 4.3 4.3 65.3 66.7 66.0 3.9 3.8 3.9 4.6 4.6 4.6
Middle 29.5 29.6 29.6 8.1 8.2 8.2 30.9 30.9 30.9 2.6 2.4 2.5 39.7 37.9 38.8 4.4 4.5 4.5 6.0 6.0 6.0
Bottom 29.5 29.5 29.5 8.2 8.2 8.2 31.0 30.9 31.0 2.4 2.3 2.4 37.7 36.1 36.9 5.3 5.4 5.4 11.2 11.2 11.2
Surface 29.7 29.7 29.7 8.2 8.3 8.3 31.0 31.0 31.0 4.5 4.5 4.5 70.4 69.1 69.8 3.9 3.7 3.8 9.6 9.0 9.3
Middle
Bottom 29.4 29.4 29.4 8.3 8.2 8.3 30.9 31.0 31.0 2.3 2.2 2.3 36.5 34.7 35.6 5.1 4.7 4.9 7.4 6.8 7.1
Surface 29.7 29.7 29.7 8.1 8.2 8.2 31.1 31.1 31.1 4.7 4.8 4.8 73.5 75.1 74.3 3.4 3.6 3.5 4.8 5.4 5.1
Middle 29.5 29.6 29.6 8.2 8.3 8.3 31.0 31.1 31.1 2.7 2.6 2.7 42.1 40.2 41.2 4.2 4.1 4.2 10.6 10.4 10.5
Bottom 29.3 29.3 29.3 8.3 8.2 8.3 31.1 31.1 31.1 2.3 2.2 2.3 36.6 34.4 35.5 5.3 5.1 5.2 9.6 9.4 9.5
Surface 29.6 29.6 29.6 8.2 8.2 8.2 31.0 30.9 31.0 4.7 4.4 4.6 73.7 68.7 71.2 2.2 2.3 2.3 5.2 5.4 5.3
Middle 29.4 29.5 29.5 8.1 8.2 8.2 31.1 31.0 31.1 2.6 2.4 2.5 40.3 37.5 38.9 3.2 3.0 3.1 7.2 6.8 7.0
Bottom 29.5 29.5 29.5 8.2 8.2 8.2 31.2 31.1 31.2 2.2 2.1 2.2 34.7 33.4 34.1 3.8 3.9 3.9 8.6 9.0 8.8
Surface 29.8 29.8 29.8 8.3 8.2 8.3 30.2 30.1 30.2 8.1 7.7 7.9 125.8 120.3 123.1 3.7 3.8 3.8 7.8 8.2 8.0
Middle 29.6 29.6 29.6 8.2 8.2 8.2 31.1 31.1 31.1 3.5 3.2 3.4 54.7 50.6 52.7 4.1 4.2 4.2 7.4 7.8 7.6
Bottom 29.5 29.6 29.6 8.2 8.1 8.2 31.1 31.2 31.2 3.0 2.8 2.9 46.7 43.3 45.0 4.6 4.8 4.7 11.6 12.0 11.8
Remark or Obsevation: Note: * Average
** Depth Average
DO Saturation
(%)
Turbidity
(NTU)
4.3
3.1
4.2
9.9
7.3
8.2
8.4
7.0
9.1
CS1 9.4
Monitoring
Depth
Temperrature (oC) pHSalinity
(ppt)
DO
(mg/l)
1600
WM1
WM2
WM3
WM4
1800
1727
1655
1625
14.4
LocationSampling
Time
Water
Depth (m)
8.2
5.8
9.6
9.8
CS2
1838
Upstream Control Station:
Suspended Solids
(mg/l)
4.9
4.6
4.4

SIL(E) Water Quality Monitoring Data Record Sheet
Date: 21-Sep-11
Tide: Mid-Ebb
Weather: Cloudy
Sea Conditions: Small Wave
CS1
1 2 Ave.* 1 2 Ave.* 1 2 Ave.* 1 2 Ave.* 1 2 Ave.* 1 2 Ave.* D.A.** 1 2 Ave.* D.A.**
Surface 29.9 29.8 29.9 8.1 8.1 8.1 30.8 30.8 30.8 7.4 7.4 7.4 116.3 116.9 116.6 4.2 4.2 4.2 5.2 5.4 5.3
Middle 29.4 29.4 29.4 8.2 8.1 8.2 30.9 31.0 31.0 3.2 3.3 3.3 48.5 49.2 48.9 4.2 4.3 4.3 6.8 7.0 6.9
Bottom 29.5 29.6 29.6 8.1 8.1 8.1 30.8 30.8 30.8 3.5 3.6 3.6 55.4 56.6 56.0 4.5 4.5 4.5 4.6 5.0 4.8
Surface 29.7 29.8 29.8 8.2 8.1 8.2 30.6 30.6 30.6 3.7 3.6 3.7 57.4 56.7 57.1 3.3 3.5 3.4 5.4 5.8 5.6
Middle 29.5 29.5 29.5 8.2 8.2 8.2 30.7 30.6 30.7 2.0 2.1 2.1 31.3 32.2 31.8 4.2 4.2 4.2 5.2 5.2 5.2
Bottom 29.6 29.5 29.6 8.1 8.2 8.2 30.7 30.7 30.7 2.6 2.6 2.6 41.0 41.5 41.3 5.1 5.0 5.1 6.2 6.0 6.1
Surface 29.6 29.7 29.7 8.1 8.2 8.2 30.6 30.6 30.6 3.4 3.5 3.5 53.8 54.6 54.2 2.9 3.0 3.0 5.2 5.4 5.3
Middle
Bottom 29.2 29.2 29.2 8.2 8.2 8.2 30.4 30.3 30.4 1.8 1.8 1.8 27.4 27.9 27.7 2.9 2.9 2.9 6.8 6.4 6.6
Surface 29.5 29.4 29.5 8.1 8.1 8.1 30.7 30.8 30.8 3.5 3.5 3.5 55.2 55.6 55.4 2.7 2.8 2.8 6.0 6.4 6.2
Middle 29.3 29.3 29.3 8.1 8.2 8.2 30.6 30.6 30.6 2.3 2.2 2.3 35.7 34.4 35.1 2.8 2.8 2.8 6.0 6.0 6.0
Bottom 29.3 29.3 29.3 8.1 8.2 8.2 30.7 30.7 30.7 1.8 1.9 1.9 27.1 27.8 27.5 3.0 3.2 3.1 7.6 8.2 7.9
Surface 29.5 29.4 29.5 8.2 8.2 8.2 30.6 30.5 30.6 3.7 3.6 3.7 58.0 57.3 57.7 2.4 2.4 2.4 6.2 6.4 6.3
Middle 29.3 29.4 29.4 8.2 8.2 8.2 30.7 30.7 30.7 2.1 2.3 2.2 33.2 35.4 34.3 2.9 3.0 3.0 7.6 7.8 7.7
Bottom 29.5 29.4 29.5 8.2 8.1 8.2 30.8 30.7 30.8 2.2 2.2 2.2 34.7 34.5 34.6 2.7 3.0 2.9 8.2 8.8 8.5
Surface 29.7 29.6 29.7 8.2 8.1 8.2 31.0 31.0 31.0 4.8 4.8 4.8 74.8 74.3 74.6 3.3 3.5 3.4 7.4 7.8 7.6
Middle 29.2 29.2 29.2 8.1 8.2 8.2 31.0 31.1 31.1 2.5 2.4 2.5 39.4 38.5 39.0 3.7 3.7 3.7 7.0 7.2 7.1
Bottom 29.1 29.2 29.2 8.1 8.1 8.1 31.0 31.0 31.0 2.2 2.1 2.2 34.7 34.3 34.5 3.6 3.7 3.7 9.0 9.0 9.0
Remark or Obsevation: Note: * Average
** Depth Average
Upstream Control Station:
Salinity
(ppt)
DO
(mg/l)Location
Sampling
Time
Water
Depth (m)
Monitoring
Depth
DO Saturation
(%)
Turbidity
(NTU)
Suspended Solids
(mg/l)
CS1 0545 10.3 4.3 5.7
Temperrature (oC) pH
5.6
WM2 0653 5.5 2.9 6.0
WM1 0622 14.6 4.2
6.7
WM4 0753 8.6 2.7 7.5
WM3 0720 8.4 2.9
7.9CS2 0824 14.2 3.6
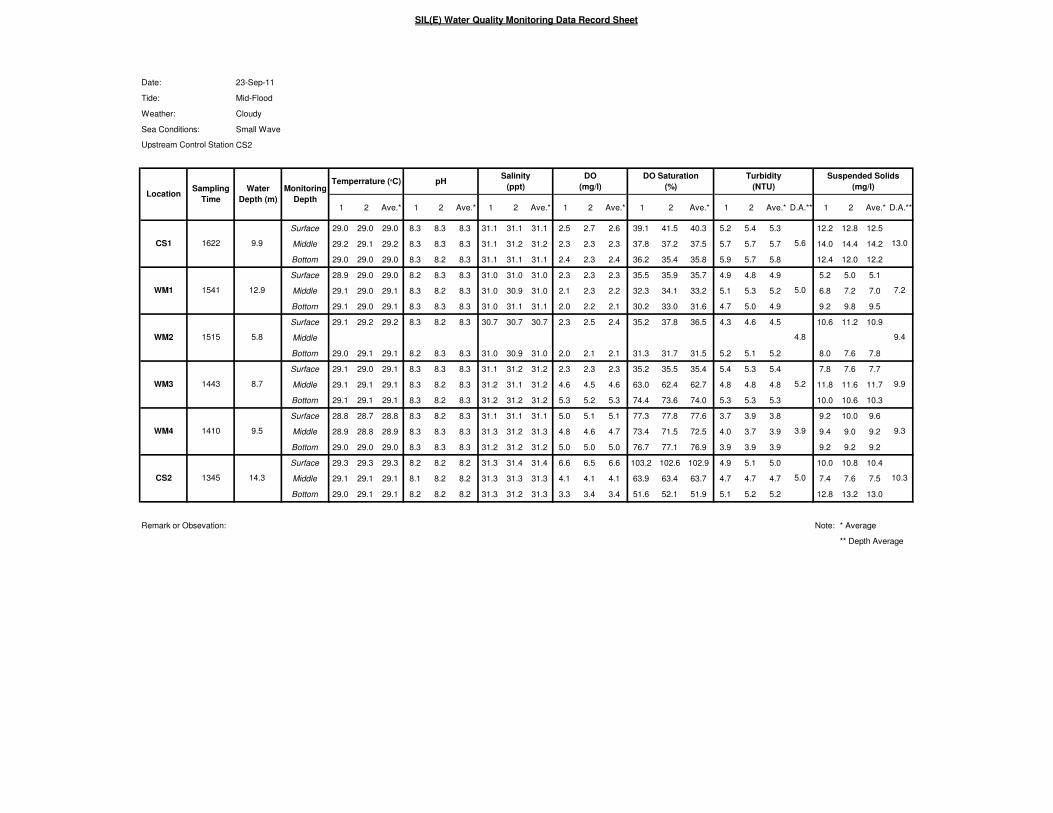
SIL(E) Water Quality Monitoring Data Record Sheet
Date: 23-Sep-11
Tide: Mid-Flood
Weather: Cloudy
Sea Conditions: Small Wave
CS2
1 2 Ave.* 1 2 Ave.* 1 2 Ave.* 1 2 Ave.* 1 2 Ave.* 1 2 Ave.* D.A.** 1 2 Ave.* D.A.**
Surface 29.0 29.0 29.0 8.3 8.3 8.3 31.1 31.1 31.1 2.5 2.7 2.6 39.1 41.5 40.3 5.2 5.4 5.3 12.2 12.8 12.5
Middle 29.2 29.1 29.2 8.3 8.3 8.3 31.1 31.2 31.2 2.3 2.3 2.3 37.8 37.2 37.5 5.7 5.7 5.7 14.0 14.4 14.2
Bottom 29.0 29.0 29.0 8.3 8.2 8.3 31.1 31.1 31.1 2.4 2.3 2.4 36.2 35.4 35.8 5.9 5.7 5.8 12.4 12.0 12.2
Surface 28.9 29.0 29.0 8.2 8.3 8.3 31.0 31.0 31.0 2.3 2.3 2.3 35.5 35.9 35.7 4.9 4.8 4.9 5.2 5.0 5.1
Middle 29.1 29.0 29.1 8.3 8.2 8.3 31.0 30.9 31.0 2.1 2.3 2.2 32.3 34.1 33.2 5.1 5.3 5.2 6.8 7.2 7.0
Bottom 29.1 29.0 29.1 8.3 8.3 8.3 31.0 31.1 31.1 2.0 2.2 2.1 30.2 33.0 31.6 4.7 5.0 4.9 9.2 9.8 9.5
Surface 29.1 29.2 29.2 8.3 8.2 8.3 30.7 30.7 30.7 2.3 2.5 2.4 35.2 37.8 36.5 4.3 4.6 4.5 10.6 11.2 10.9
Middle
Bottom 29.0 29.1 29.1 8.2 8.3 8.3 31.0 30.9 31.0 2.0 2.1 2.1 31.3 31.7 31.5 5.2 5.1 5.2 8.0 7.6 7.8
Surface 29.1 29.0 29.1 8.3 8.3 8.3 31.1 31.2 31.2 2.3 2.3 2.3 35.2 35.5 35.4 5.4 5.3 5.4 7.8 7.6 7.7
Middle 29.1 29.1 29.1 8.3 8.2 8.3 31.2 31.1 31.2 4.6 4.5 4.6 63.0 62.4 62.7 4.8 4.8 4.8 11.8 11.6 11.7
Bottom 29.1 29.1 29.1 8.3 8.2 8.3 31.2 31.2 31.2 5.3 5.2 5.3 74.4 73.6 74.0 5.3 5.3 5.3 10.0 10.6 10.3
Surface 28.8 28.7 28.8 8.3 8.2 8.3 31.1 31.1 31.1 5.0 5.1 5.1 77.3 77.8 77.6 3.7 3.9 3.8 9.2 10.0 9.6
Middle 28.9 28.8 28.9 8.3 8.3 8.3 31.3 31.2 31.3 4.8 4.6 4.7 73.4 71.5 72.5 4.0 3.7 3.9 9.4 9.0 9.2
Bottom 29.0 29.0 29.0 8.3 8.3 8.3 31.2 31.2 31.2 5.0 5.0 5.0 76.7 77.1 76.9 3.9 3.9 3.9 9.2 9.2 9.2
Surface 29.3 29.3 29.3 8.2 8.2 8.2 31.3 31.4 31.4 6.6 6.5 6.6 103.2 102.6 102.9 4.9 5.1 5.0 10.0 10.8 10.4
Middle 29.1 29.1 29.1 8.1 8.2 8.2 31.3 31.3 31.3 4.1 4.1 4.1 63.9 63.4 63.7 4.7 4.7 4.7 7.4 7.6 7.5
Bottom 29.0 29.1 29.1 8.2 8.2 8.2 31.3 31.2 31.3 3.3 3.4 3.4 51.6 52.1 51.9 5.1 5.2 5.2 12.8 13.2 13.0
Remark or Obsevation: Note: * Average
** Depth Average
Upstream Control Station:
Suspended Solids
(mg/l)
5.6
5.0
4.8
14.3
LocationSampling
Time
Water
Depth (m)
12.9
5.8
8.7
9.5
CS2
1622
1345
WM1
WM2
WM3
WM4
1541
1515
1443
1410
pHSalinity
(ppt)
DO
(mg/l)
CS1 9.9
Monitoring
Depth
Temperrature (oC)
13.0
7.2
9.4
9.9
9.3
10.3
DO Saturation
(%)
Turbidity
(NTU)
5.2
3.9
5.0
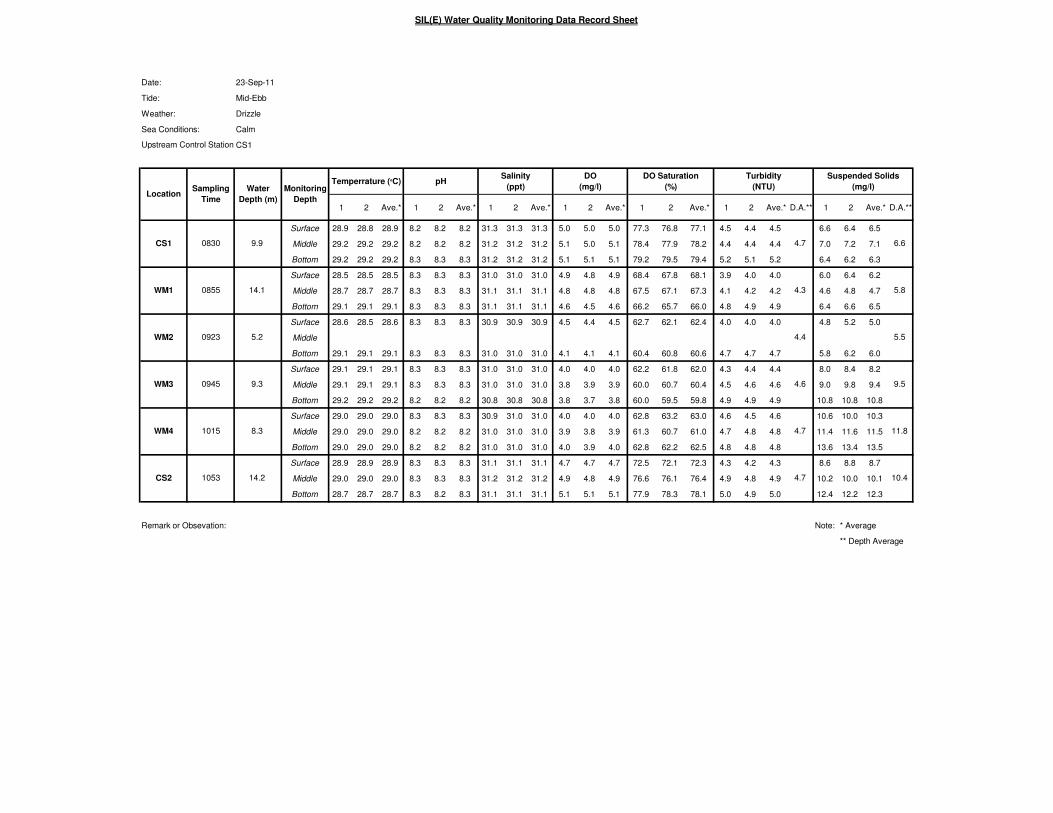
SIL(E) Water Quality Monitoring Data Record Sheet
Date: 23-Sep-11
Tide: Mid-Ebb
Weather: Drizzle
Sea Conditions: Calm
CS1
1 2 Ave.* 1 2 Ave.* 1 2 Ave.* 1 2 Ave.* 1 2 Ave.* 1 2 Ave.* D.A.** 1 2 Ave.* D.A.**
Surface 28.9 28.8 28.9 8.2 8.2 8.2 31.3 31.3 31.3 5.0 5.0 5.0 77.3 76.8 77.1 4.5 4.4 4.5 6.6 6.4 6.5
Middle 29.2 29.2 29.2 8.2 8.2 8.2 31.2 31.2 31.2 5.1 5.0 5.1 78.4 77.9 78.2 4.4 4.4 4.4 7.0 7.2 7.1
Bottom 29.2 29.2 29.2 8.3 8.3 8.3 31.2 31.2 31.2 5.1 5.1 5.1 79.2 79.5 79.4 5.2 5.1 5.2 6.4 6.2 6.3
Surface 28.5 28.5 28.5 8.3 8.3 8.3 31.0 31.0 31.0 4.9 4.8 4.9 68.4 67.8 68.1 3.9 4.0 4.0 6.0 6.4 6.2
Middle 28.7 28.7 28.7 8.3 8.3 8.3 31.1 31.1 31.1 4.8 4.8 4.8 67.5 67.1 67.3 4.1 4.2 4.2 4.6 4.8 4.7
Bottom 29.1 29.1 29.1 8.3 8.3 8.3 31.1 31.1 31.1 4.6 4.5 4.6 66.2 65.7 66.0 4.8 4.9 4.9 6.4 6.6 6.5
Surface 28.6 28.5 28.6 8.3 8.3 8.3 30.9 30.9 30.9 4.5 4.4 4.5 62.7 62.1 62.4 4.0 4.0 4.0 4.8 5.2 5.0
Middle
Bottom 29.1 29.1 29.1 8.3 8.3 8.3 31.0 31.0 31.0 4.1 4.1 4.1 60.4 60.8 60.6 4.7 4.7 4.7 5.8 6.2 6.0
Surface 29.1 29.1 29.1 8.3 8.3 8.3 31.0 31.0 31.0 4.0 4.0 4.0 62.2 61.8 62.0 4.3 4.4 4.4 8.0 8.4 8.2
Middle 29.1 29.1 29.1 8.3 8.3 8.3 31.0 31.0 31.0 3.8 3.9 3.9 60.0 60.7 60.4 4.5 4.6 4.6 9.0 9.8 9.4
Bottom 29.2 29.2 29.2 8.2 8.2 8.2 30.8 30.8 30.8 3.8 3.7 3.8 60.0 59.5 59.8 4.9 4.9 4.9 10.8 10.8 10.8
Surface 29.0 29.0 29.0 8.3 8.3 8.3 30.9 31.0 31.0 4.0 4.0 4.0 62.8 63.2 63.0 4.6 4.5 4.6 10.6 10.0 10.3
Middle 29.0 29.0 29.0 8.2 8.2 8.2 31.0 31.0 31.0 3.9 3.8 3.9 61.3 60.7 61.0 4.7 4.8 4.8 11.4 11.6 11.5
Bottom 29.0 29.0 29.0 8.2 8.2 8.2 31.0 31.0 31.0 4.0 3.9 4.0 62.8 62.2 62.5 4.8 4.8 4.8 13.6 13.4 13.5
Surface 28.9 28.9 28.9 8.3 8.3 8.3 31.1 31.1 31.1 4.7 4.7 4.7 72.5 72.1 72.3 4.3 4.2 4.3 8.6 8.8 8.7
Middle 29.0 29.0 29.0 8.3 8.3 8.3 31.2 31.2 31.2 4.9 4.8 4.9 76.6 76.1 76.4 4.9 4.8 4.9 10.2 10.0 10.1
Bottom 28.7 28.7 28.7 8.3 8.2 8.3 31.1 31.1 31.1 5.1 5.1 5.1 77.9 78.3 78.1 5.0 4.9 5.0 12.4 12.2 12.3
Remark or Obsevation: Note: * Average
** Depth Average
10.4CS2 1053 14.2 4.7
9.5
WM4 1015 8.3 4.7 11.8
WM3 0945 9.3 4.6
5.8
WM2 0923 5.2 4.4 5.5
WM1 0855 14.1 4.3
DO Saturation
(%)
Turbidity
(NTU)
Suspended Solids
(mg/l)
CS1 0830 9.9 4.7 6.6
Temperrature (oC) pHSalinity
(ppt)
DO
(mg/l)Location
Sampling
Time
Water
Depth (m)
Monitoring
Depth
Upstream Control Station:
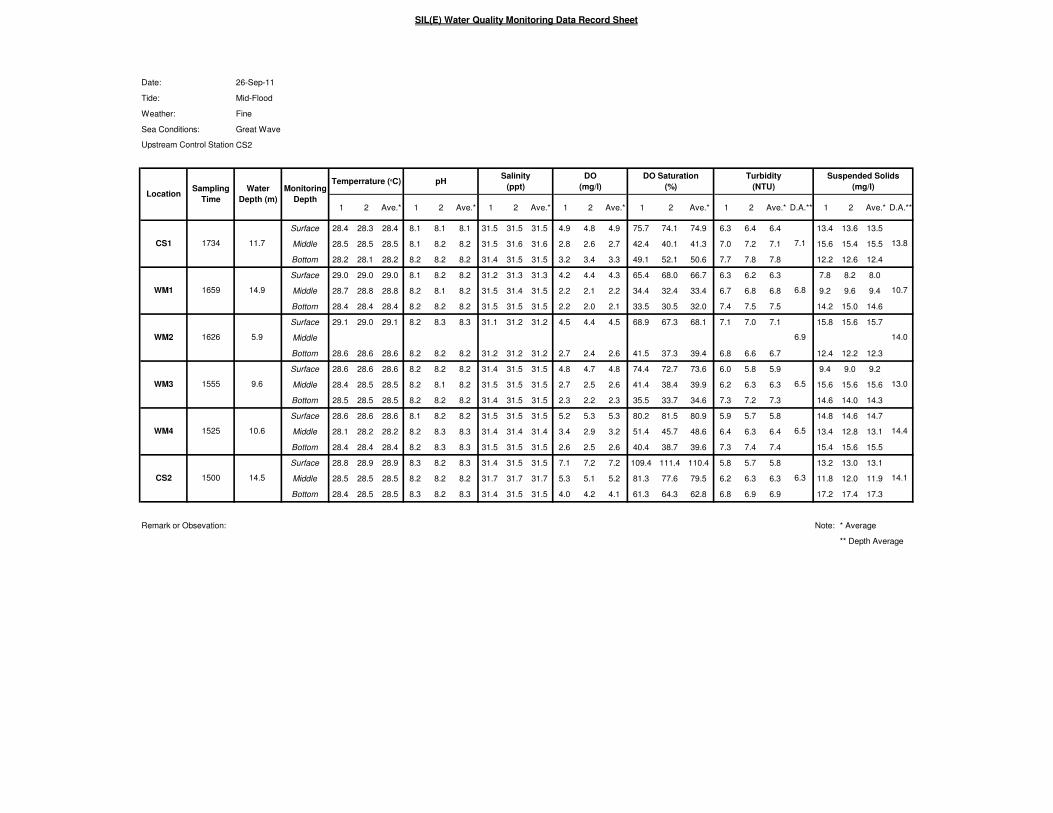
SIL(E) Water Quality Monitoring Data Record Sheet
Date: 26-Sep-11
Tide: Mid-Flood
Weather: Fine
Sea Conditions: Great Wave
CS2
1 2 Ave.* 1 2 Ave.* 1 2 Ave.* 1 2 Ave.* 1 2 Ave.* 1 2 Ave.* D.A.** 1 2 Ave.* D.A.**
Surface 28.4 28.3 28.4 8.1 8.1 8.1 31.5 31.5 31.5 4.9 4.8 4.9 75.7 74.1 74.9 6.3 6.4 6.4 13.4 13.6 13.5
Middle 28.5 28.5 28.5 8.1 8.2 8.2 31.5 31.6 31.6 2.8 2.6 2.7 42.4 40.1 41.3 7.0 7.2 7.1 15.6 15.4 15.5
Bottom 28.2 28.1 28.2 8.2 8.2 8.2 31.4 31.5 31.5 3.2 3.4 3.3 49.1 52.1 50.6 7.7 7.8 7.8 12.2 12.6 12.4
Surface 29.0 29.0 29.0 8.1 8.2 8.2 31.2 31.3 31.3 4.2 4.4 4.3 65.4 68.0 66.7 6.3 6.2 6.3 7.8 8.2 8.0
Middle 28.7 28.8 28.8 8.2 8.1 8.2 31.5 31.4 31.5 2.2 2.1 2.2 34.4 32.4 33.4 6.7 6.8 6.8 9.2 9.6 9.4
Bottom 28.4 28.4 28.4 8.2 8.2 8.2 31.5 31.5 31.5 2.2 2.0 2.1 33.5 30.5 32.0 7.4 7.5 7.5 14.2 15.0 14.6
Surface 29.1 29.0 29.1 8.2 8.3 8.3 31.1 31.2 31.2 4.5 4.4 4.5 68.9 67.3 68.1 7.1 7.0 7.1 15.8 15.6 15.7
Middle
Bottom 28.6 28.6 28.6 8.2 8.2 8.2 31.2 31.2 31.2 2.7 2.4 2.6 41.5 37.3 39.4 6.8 6.6 6.7 12.4 12.2 12.3
Surface 28.6 28.6 28.6 8.2 8.2 8.2 31.4 31.5 31.5 4.8 4.7 4.8 74.4 72.7 73.6 6.0 5.8 5.9 9.4 9.0 9.2
Middle 28.4 28.5 28.5 8.2 8.1 8.2 31.5 31.5 31.5 2.7 2.5 2.6 41.4 38.4 39.9 6.2 6.3 6.3 15.6 15.6 15.6
Bottom 28.5 28.5 28.5 8.2 8.2 8.2 31.4 31.5 31.5 2.3 2.2 2.3 35.5 33.7 34.6 7.3 7.2 7.3 14.6 14.0 14.3
Surface 28.6 28.6 28.6 8.1 8.2 8.2 31.5 31.5 31.5 5.2 5.3 5.3 80.2 81.5 80.9 5.9 5.7 5.8 14.8 14.6 14.7
Middle 28.1 28.2 28.2 8.2 8.3 8.3 31.4 31.4 31.4 3.4 2.9 3.2 51.4 45.7 48.6 6.4 6.3 6.4 13.4 12.8 13.1
Bottom 28.4 28.4 28.4 8.2 8.3 8.3 31.5 31.5 31.5 2.6 2.5 2.6 40.4 38.7 39.6 7.3 7.4 7.4 15.4 15.6 15.5
Surface 28.8 28.9 28.9 8.3 8.2 8.3 31.4 31.5 31.5 7.1 7.2 7.2 109.4 111.4 110.4 5.8 5.7 5.8 13.2 13.0 13.1
Middle 28.5 28.5 28.5 8.2 8.2 8.2 31.7 31.7 31.7 5.3 5.1 5.2 81.3 77.6 79.5 6.2 6.3 6.3 11.8 12.0 11.9
Bottom 28.4 28.5 28.5 8.3 8.2 8.3 31.4 31.5 31.5 4.0 4.2 4.1 61.3 64.3 62.8 6.8 6.9 6.9 17.2 17.4 17.3
Remark or Obsevation: Note: * Average
** Depth Average
DO Saturation
(%)
Turbidity
(NTU)
6.5
6.5
6.3
13.8
10.7
14.0
13.0
14.4
14.1
CS1 11.7
Monitoring
Depth
Temperrature (oC) pHSalinity
(ppt)
DO
(mg/l)
1500
WM1
WM2
WM3
WM4
1659
1626
1555
1525
14.5
LocationSampling
Time
Water
Depth (m)
14.9
5.9
9.6
10.6
CS2
1734
Upstream Control Station:
Suspended Solids
(mg/l)
7.1
6.8
6.9
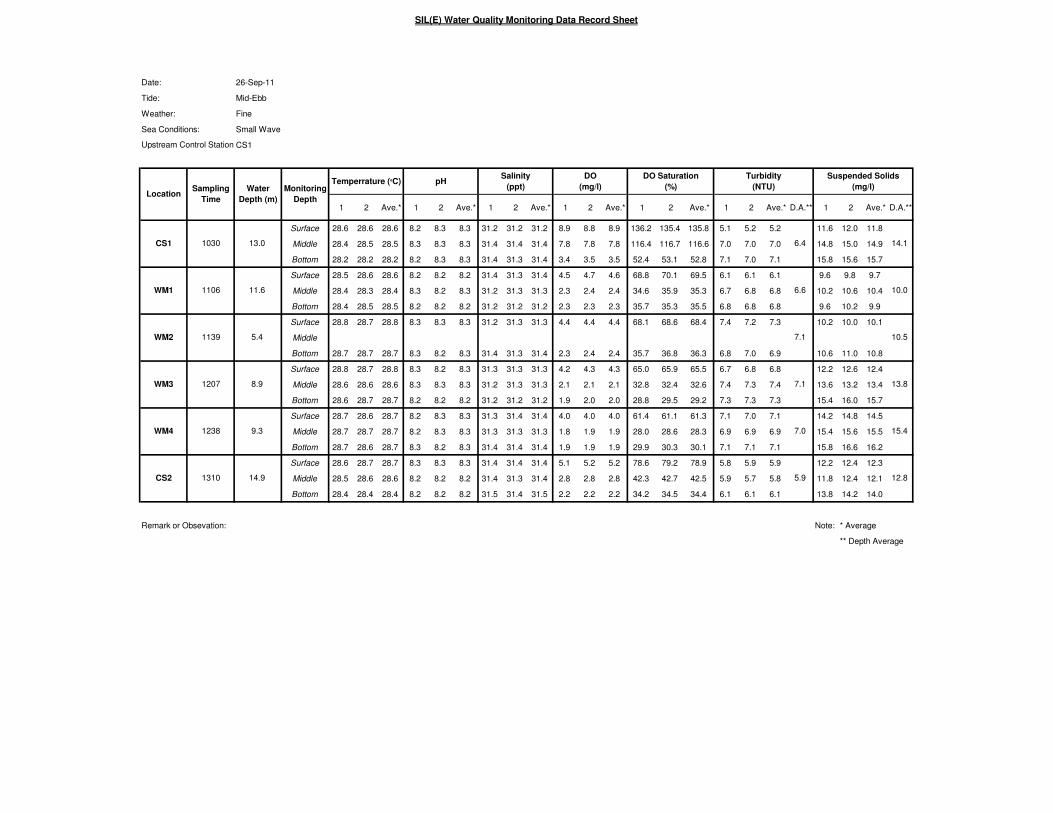
SIL(E) Water Quality Monitoring Data Record Sheet
Date: 26-Sep-11
Tide: Mid-Ebb
Weather: Fine
Sea Conditions: Small Wave
CS1
1 2 Ave.* 1 2 Ave.* 1 2 Ave.* 1 2 Ave.* 1 2 Ave.* 1 2 Ave.* D.A.** 1 2 Ave.* D.A.**
Surface 28.6 28.6 28.6 8.2 8.3 8.3 31.2 31.2 31.2 8.9 8.8 8.9 136.2 135.4 135.8 5.1 5.2 5.2 11.6 12.0 11.8
Middle 28.4 28.5 28.5 8.3 8.3 8.3 31.4 31.4 31.4 7.8 7.8 7.8 116.4 116.7 116.6 7.0 7.0 7.0 14.8 15.0 14.9
Bottom 28.2 28.2 28.2 8.2 8.3 8.3 31.4 31.3 31.4 3.4 3.5 3.5 52.4 53.1 52.8 7.1 7.0 7.1 15.8 15.6 15.7
Surface 28.5 28.6 28.6 8.2 8.2 8.2 31.4 31.3 31.4 4.5 4.7 4.6 68.8 70.1 69.5 6.1 6.1 6.1 9.6 9.8 9.7
Middle 28.4 28.3 28.4 8.3 8.2 8.3 31.2 31.3 31.3 2.3 2.4 2.4 34.6 35.9 35.3 6.7 6.8 6.8 10.2 10.6 10.4
Bottom 28.4 28.5 28.5 8.2 8.2 8.2 31.2 31.2 31.2 2.3 2.3 2.3 35.7 35.3 35.5 6.8 6.8 6.8 9.6 10.2 9.9
Surface 28.8 28.7 28.8 8.3 8.3 8.3 31.2 31.3 31.3 4.4 4.4 4.4 68.1 68.6 68.4 7.4 7.2 7.3 10.2 10.0 10.1
Middle
Bottom 28.7 28.7 28.7 8.3 8.2 8.3 31.4 31.3 31.4 2.3 2.4 2.4 35.7 36.8 36.3 6.8 7.0 6.9 10.6 11.0 10.8
Surface 28.8 28.7 28.8 8.3 8.2 8.3 31.3 31.3 31.3 4.2 4.3 4.3 65.0 65.9 65.5 6.7 6.8 6.8 12.2 12.6 12.4
Middle 28.6 28.6 28.6 8.3 8.3 8.3 31.2 31.3 31.3 2.1 2.1 2.1 32.8 32.4 32.6 7.4 7.3 7.4 13.6 13.2 13.4
Bottom 28.6 28.7 28.7 8.2 8.2 8.2 31.2 31.2 31.2 1.9 2.0 2.0 28.8 29.5 29.2 7.3 7.3 7.3 15.4 16.0 15.7
Surface 28.7 28.6 28.7 8.2 8.3 8.3 31.3 31.4 31.4 4.0 4.0 4.0 61.4 61.1 61.3 7.1 7.0 7.1 14.2 14.8 14.5
Middle 28.7 28.7 28.7 8.2 8.3 8.3 31.3 31.3 31.3 1.8 1.9 1.9 28.0 28.6 28.3 6.9 6.9 6.9 15.4 15.6 15.5
Bottom 28.7 28.6 28.7 8.3 8.2 8.3 31.4 31.4 31.4 1.9 1.9 1.9 29.9 30.3 30.1 7.1 7.1 7.1 15.8 16.6 16.2
Surface 28.6 28.7 28.7 8.3 8.3 8.3 31.4 31.4 31.4 5.1 5.2 5.2 78.6 79.2 78.9 5.8 5.9 5.9 12.2 12.4 12.3
Middle 28.5 28.6 28.6 8.2 8.2 8.2 31.4 31.3 31.4 2.8 2.8 2.8 42.3 42.7 42.5 5.9 5.7 5.8 11.8 12.4 12.1
Bottom 28.4 28.4 28.4 8.2 8.2 8.2 31.5 31.4 31.5 2.2 2.2 2.2 34.2 34.5 34.4 6.1 6.1 6.1 13.8 14.2 14.0
Remark or Obsevation: Note: * Average
** Depth Average
Upstream Control Station:
Salinity
(ppt)
DO
(mg/l)Location
Sampling
Time
Water
Depth (m)
Monitoring
Depth
DO Saturation
(%)
Turbidity
(NTU)
Suspended Solids
(mg/l)
CS1 1030 13.0 6.4 14.1
Temperrature (oC) pH
10.0
WM2 1139 5.4 7.1 10.5
WM1 1106 11.6 6.6
13.8
WM4 1238 9.3 7.0 15.4
WM3 1207 8.9 7.1
12.8CS2 1310 14.9 5.9

SIL(E) Water Quality Monitoring Data Record Sheet
Date: 28-Sep-11
Tide: Mid-Flood
Weather: Cloudy
Sea Conditions: Great Wave
CS2
1 2 Ave.* 1 2 Ave.* 1 2 Ave.* 1 2 Ave.* 1 2 Ave.* 1 2 Ave.* D.A.** 1 2 Ave.* D.A.**
Surface 28.6 28.6 28.6 8.3 8.3 8.3 31.4 31.4 31.4 3.2 3.2 3.2 50.2 50.5 50.4 9.4 9.6 9.5 14.2 14.8 14.5
Middle 28.6 28.5 28.6 8.3 8.2 8.3 31.3 31.4 31.4 3.7 3.6 3.7 56.4 55.1 55.8 9.8 9.8 9.8 15.4 15.4 15.4
Bottom 28.5 28.5 28.5 8.3 8.3 8.3 31.4 31.4 31.4 2.5 2.7 2.6 38.8 40.0 39.4 9.4 9.5 9.5 15.0 14.4 14.7
Surface 28.8 28.7 28.8 8.3 8.2 8.3 31.3 31.3 31.3 1.7 1.8 1.8 25.6 26.3 26.0 7.3 7.1 7.2 8.2 8.2 8.2
Middle 28.8 28.7 28.8 8.2 8.2 8.2 31.3 31.4 31.4 1.7 1.8 1.8 26.0 26.7 26.4 7.7 7.7 7.7 11.0 10.2 10.6
Bottom 28.9 28.9 28.9 8.3 8.3 8.3 31.3 31.3 31.3 1.8 1.9 1.9 27.8 28.3 28.1 8.1 8.0 8.1 14.8 14.6 14.7
Surface 28.8 28.8 28.8 8.3 8.3 8.3 31.3 31.2 31.3 2.1 2.3 2.2 32.7 34.2 33.5 7.2 7.4 7.3 13.0 13.8 13.4
Middle
Bottom 28.7 28.8 28.8 8.2 8.3 8.3 31.2 31.2 31.2 1.9 1.8 1.9 28.8 28.5 28.7 7.8 7.7 7.8 11.8 12.2 12.0
Surface 28.9 28.9 28.9 8.3 8.3 8.3 31.4 31.4 31.4 2.3 2.1 2.2 36.3 34.9 35.6 7.2 7.2 7.2 11.0 11.2 11.1
Middle 28.8 28.9 28.9 8.3 8.3 8.3 31.3 31.4 31.4 2.1 2.1 2.1 32.6 33.1 32.9 7.6 7.6 7.6 16.0 15.4 15.7
Bottom 28.8 28.9 28.9 8.2 8.3 8.3 31.4 31.4 31.4 2.0 1.9 2.0 30.5 29.4 30.0 7.9 8.0 8.0 14.8 14.6 14.7
Surface 28.9 28.9 28.9 8.2 8.2 8.2 31.4 31.3 31.4 2.3 2.5 2.4 35.2 37.6 36.4 6.8 7.0 6.9 14.4 15.2 14.8
Middle 28.9 28.8 28.9 8.3 8.2 8.3 31.3 31.3 31.3 1.9 2.0 2.0 29.7 30.5 30.1 7.3 7.4 7.4 15.2 15.0 15.1
Bottom 28.8 28.8 28.8 8.2 8.2 8.2 31.3 31.4 31.4 1.9 1.8 1.9 30.0 28.3 29.2 7.8 7.8 7.8 14.8 15.2 15.0
Surface 29.4 29.4 29.4 8.1 8.2 8.2 31.2 31.2 31.2 4.1 4.1 4.1 64.9 64.2 64.6 6.2 6.2 6.2 13.2 13.0 13.1
Middle 28.9 29.0 29.0 8.1 8.1 8.1 31.4 31.3 31.4 3.0 3.1 3.1 46.3 47.4 46.9 6.8 6.6 6.7 12.8 12.4 12.6
Bottom 28.8 28.9 28.9 8.1 8.1 8.1 31.4 31.4 31.4 3.0 3.0 3.0 47.0 47.5 47.3 7.3 7.3 7.3 15.4 14.8 15.1
Remark or Obsevation: Note: * Average
** Depth Average
Upstream Control Station:
Suspended Solids
(mg/l)
9.6
7.7
7.5
15.4
LocationSampling
Time
Water
Depth (m)
15.5
5.9
10.1
10.6
CS2
1759
1600
WM1
WM2
WM3
WM4
1729
1710
1644
1619
pHSalinity
(ppt)
DO
(mg/l)
CS1 17.4
Monitoring
Depth
Temperrature (oC)
14.9
11.2
12.7
13.8
15.0
13.6
DO Saturation
(%)
Turbidity
(NTU)
7.6
7.4
6.7
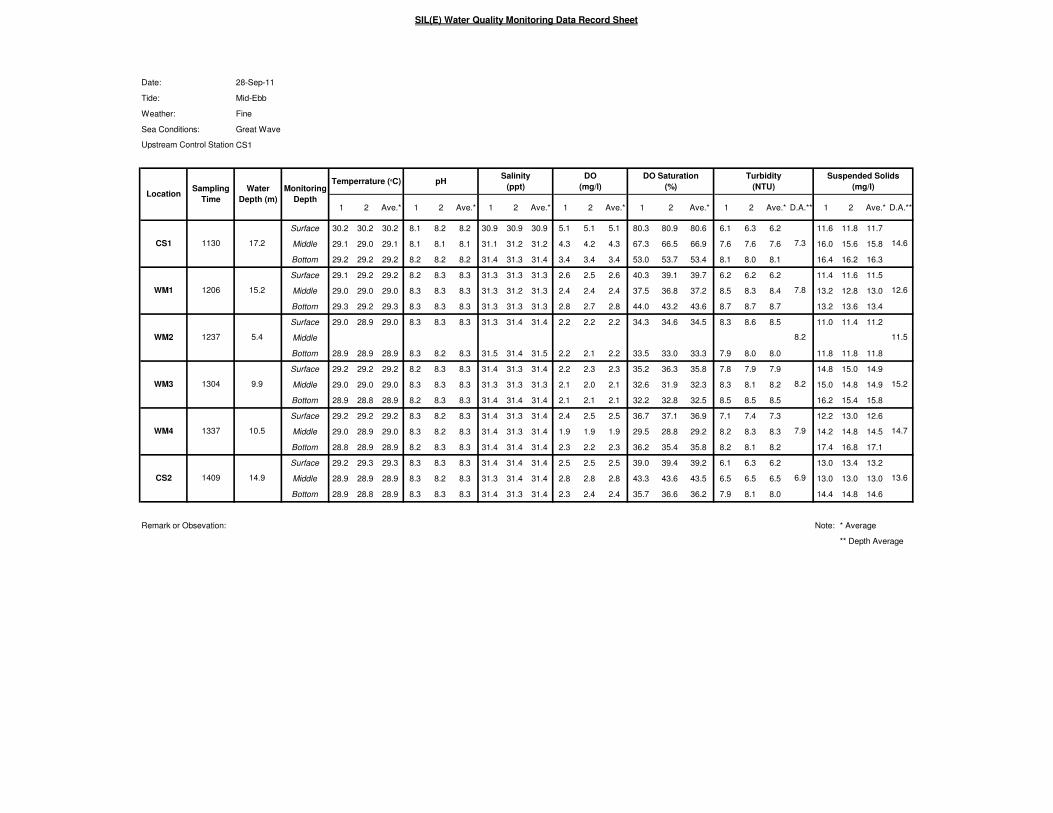
SIL(E) Water Quality Monitoring Data Record Sheet
Date: 28-Sep-11
Tide: Mid-Ebb
Weather: Fine
Sea Conditions: Great Wave
CS1
1 2 Ave.* 1 2 Ave.* 1 2 Ave.* 1 2 Ave.* 1 2 Ave.* 1 2 Ave.* D.A.** 1 2 Ave.* D.A.**
Surface 30.2 30.2 30.2 8.1 8.2 8.2 30.9 30.9 30.9 5.1 5.1 5.1 80.3 80.9 80.6 6.1 6.3 6.2 11.6 11.8 11.7
Middle 29.1 29.0 29.1 8.1 8.1 8.1 31.1 31.2 31.2 4.3 4.2 4.3 67.3 66.5 66.9 7.6 7.6 7.6 16.0 15.6 15.8
Bottom 29.2 29.2 29.2 8.2 8.2 8.2 31.4 31.3 31.4 3.4 3.4 3.4 53.0 53.7 53.4 8.1 8.0 8.1 16.4 16.2 16.3
Surface 29.1 29.2 29.2 8.2 8.3 8.3 31.3 31.3 31.3 2.6 2.5 2.6 40.3 39.1 39.7 6.2 6.2 6.2 11.4 11.6 11.5
Middle 29.0 29.0 29.0 8.3 8.3 8.3 31.3 31.2 31.3 2.4 2.4 2.4 37.5 36.8 37.2 8.5 8.3 8.4 13.2 12.8 13.0
Bottom 29.3 29.2 29.3 8.3 8.3 8.3 31.3 31.3 31.3 2.8 2.7 2.8 44.0 43.2 43.6 8.7 8.7 8.7 13.2 13.6 13.4
Surface 29.0 28.9 29.0 8.3 8.3 8.3 31.3 31.4 31.4 2.2 2.2 2.2 34.3 34.6 34.5 8.3 8.6 8.5 11.0 11.4 11.2
Middle
Bottom 28.9 28.9 28.9 8.3 8.2 8.3 31.5 31.4 31.5 2.2 2.1 2.2 33.5 33.0 33.3 7.9 8.0 8.0 11.8 11.8 11.8
Surface 29.2 29.2 29.2 8.2 8.3 8.3 31.4 31.3 31.4 2.2 2.3 2.3 35.2 36.3 35.8 7.8 7.9 7.9 14.8 15.0 14.9
Middle 29.0 29.0 29.0 8.3 8.3 8.3 31.3 31.3 31.3 2.1 2.0 2.1 32.6 31.9 32.3 8.3 8.1 8.2 15.0 14.8 14.9
Bottom 28.9 28.8 28.9 8.2 8.3 8.3 31.4 31.4 31.4 2.1 2.1 2.1 32.2 32.8 32.5 8.5 8.5 8.5 16.2 15.4 15.8
Surface 29.2 29.2 29.2 8.3 8.2 8.3 31.4 31.3 31.4 2.4 2.5 2.5 36.7 37.1 36.9 7.1 7.4 7.3 12.2 13.0 12.6
Middle 29.0 28.9 29.0 8.3 8.2 8.3 31.4 31.3 31.4 1.9 1.9 1.9 29.5 28.8 29.2 8.2 8.3 8.3 14.2 14.8 14.5
Bottom 28.8 28.9 28.9 8.2 8.3 8.3 31.4 31.4 31.4 2.3 2.2 2.3 36.2 35.4 35.8 8.2 8.1 8.2 17.4 16.8 17.1
Surface 29.2 29.3 29.3 8.3 8.3 8.3 31.4 31.4 31.4 2.5 2.5 2.5 39.0 39.4 39.2 6.1 6.3 6.2 13.0 13.4 13.2
Middle 28.9 28.9 28.9 8.3 8.2 8.3 31.3 31.4 31.4 2.8 2.8 2.8 43.3 43.6 43.5 6.5 6.5 6.5 13.0 13.0 13.0
Bottom 28.9 28.8 28.9 8.3 8.3 8.3 31.4 31.3 31.4 2.3 2.4 2.4 35.7 36.6 36.2 7.9 8.1 8.0 14.4 14.8 14.6
Remark or Obsevation: Note: * Average
** Depth Average
13.6CS2 1409 14.9 6.9
15.2
WM4 1337 10.5 7.9 14.7
WM3 1304 9.9 8.2
12.6
WM2 1237 5.4 8.2 11.5
WM1 1206 15.2 7.8
DO Saturation
(%)
Turbidity
(NTU)
Suspended Solids
(mg/l)
CS1 1130 17.2 7.3 14.6
Temperrature (oC) pHSalinity
(ppt)
DO
(mg/l)Location
Sampling
Time
Water
Depth (m)
Monitoring
Depth
Upstream Control Station:
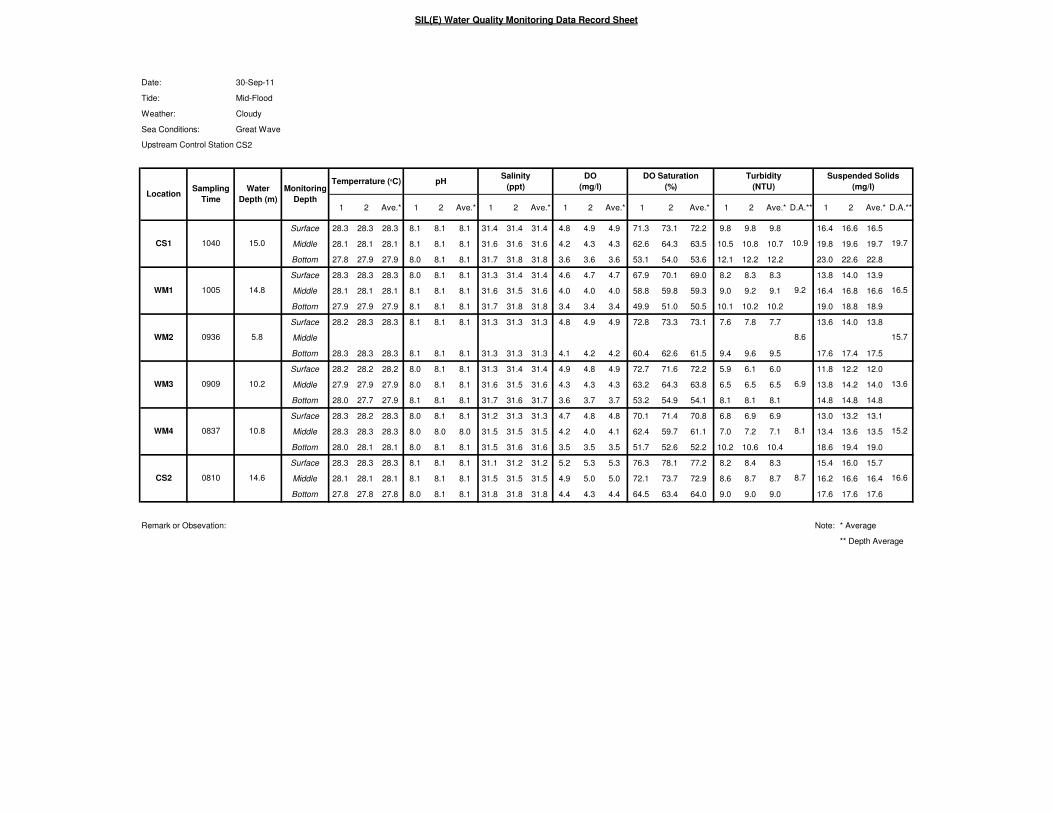
SIL(E) Water Quality Monitoring Data Record Sheet
Date: 30-Sep-11
Tide: Mid-Flood
Weather: Cloudy
Sea Conditions: Great Wave
CS2
1 2 Ave.* 1 2 Ave.* 1 2 Ave.* 1 2 Ave.* 1 2 Ave.* 1 2 Ave.* D.A.** 1 2 Ave.* D.A.**
Surface 28.3 28.3 28.3 8.1 8.1 8.1 31.4 31.4 31.4 4.8 4.9 4.9 71.3 73.1 72.2 9.8 9.8 9.8 16.4 16.6 16.5
Middle 28.1 28.1 28.1 8.1 8.1 8.1 31.6 31.6 31.6 4.2 4.3 4.3 62.6 64.3 63.5 10.5 10.8 10.7 19.8 19.6 19.7
Bottom 27.8 27.9 27.9 8.0 8.1 8.1 31.7 31.8 31.8 3.6 3.6 3.6 53.1 54.0 53.6 12.1 12.2 12.2 23.0 22.6 22.8
Surface 28.3 28.3 28.3 8.0 8.1 8.1 31.3 31.4 31.4 4.6 4.7 4.7 67.9 70.1 69.0 8.2 8.3 8.3 13.8 14.0 13.9
Middle 28.1 28.1 28.1 8.1 8.1 8.1 31.6 31.5 31.6 4.0 4.0 4.0 58.8 59.8 59.3 9.0 9.2 9.1 16.4 16.8 16.6
Bottom 27.9 27.9 27.9 8.1 8.1 8.1 31.7 31.8 31.8 3.4 3.4 3.4 49.9 51.0 50.5 10.1 10.2 10.2 19.0 18.8 18.9
Surface 28.2 28.3 28.3 8.1 8.1 8.1 31.3 31.3 31.3 4.8 4.9 4.9 72.8 73.3 73.1 7.6 7.8 7.7 13.6 14.0 13.8
Middle
Bottom 28.3 28.3 28.3 8.1 8.1 8.1 31.3 31.3 31.3 4.1 4.2 4.2 60.4 62.6 61.5 9.4 9.6 9.5 17.6 17.4 17.5
Surface 28.2 28.2 28.2 8.0 8.1 8.1 31.3 31.4 31.4 4.9 4.8 4.9 72.7 71.6 72.2 5.9 6.1 6.0 11.8 12.2 12.0
Middle 27.9 27.9 27.9 8.0 8.1 8.1 31.6 31.5 31.6 4.3 4.3 4.3 63.2 64.3 63.8 6.5 6.5 6.5 13.8 14.2 14.0
Bottom 28.0 27.7 27.9 8.1 8.1 8.1 31.7 31.6 31.7 3.6 3.7 3.7 53.2 54.9 54.1 8.1 8.1 8.1 14.8 14.8 14.8
Surface 28.3 28.2 28.3 8.0 8.1 8.1 31.2 31.3 31.3 4.7 4.8 4.8 70.1 71.4 70.8 6.8 6.9 6.9 13.0 13.2 13.1
Middle 28.3 28.3 28.3 8.0 8.0 8.0 31.5 31.5 31.5 4.2 4.0 4.1 62.4 59.7 61.1 7.0 7.2 7.1 13.4 13.6 13.5
Bottom 28.0 28.1 28.1 8.0 8.1 8.1 31.5 31.6 31.6 3.5 3.5 3.5 51.7 52.6 52.2 10.2 10.6 10.4 18.6 19.4 19.0
Surface 28.3 28.3 28.3 8.1 8.1 8.1 31.1 31.2 31.2 5.2 5.3 5.3 76.3 78.1 77.2 8.2 8.4 8.3 15.4 16.0 15.7
Middle 28.1 28.1 28.1 8.1 8.1 8.1 31.5 31.5 31.5 4.9 5.0 5.0 72.1 73.7 72.9 8.6 8.7 8.7 16.2 16.6 16.4
Bottom 27.8 27.8 27.8 8.0 8.1 8.1 31.8 31.8 31.8 4.4 4.3 4.4 64.5 63.4 64.0 9.0 9.0 9.0 17.6 17.6 17.6
Remark or Obsevation: Note: * Average
** Depth Average
DO Saturation
(%)
Turbidity
(NTU)
6.9
8.1
8.7
19.7
16.5
15.7
13.6
15.2
16.6
CS1 15.0
Monitoring
Depth
Temperrature (oC) pHSalinity
(ppt)
DO
(mg/l)
0810
WM1
WM2
WM3
WM4
1005
0936
0909
0837
14.6
LocationSampling
Time
Water
Depth (m)
14.8
5.8
10.2
10.8
CS2
1040
Upstream Control Station:
Suspended Solids
(mg/l)
10.9
9.2
8.6

SIL(E) Water Quality Monitoring Data Record Sheet
Date: 30-Sep-11
Tide: Mid-Ebb
Weather: Cloudy
Sea Conditions: Great Wave
CS1
1 2 Ave.* 1 2 Ave.* 1 2 Ave.* 1 2 Ave.* 1 2 Ave.* 1 2 Ave.* D.A.** 1 2 Ave.* D.A.**
Surface 28.5 28.6 28.6 8.1 8.1 8.1 31.2 31.3 31.3 7.0 6.9 7.0 103.1 102.4 102.8 7.7 7.9 7.8 14.6 14.8 14.7
Middle 28.4 28.4 28.4 8.0 8.1 8.1 31.2 31.2 31.2 5.4 5.6 5.5 79.8 83.2 81.5 8.2 8.1 8.2 15.8 16.0 15.9
Bottom 28.1 28.1 28.1 8.0 8.1 8.1 31.4 31.4 31.4 4.4 4.5 4.5 65.2 67.3 66.3 9.0 8.8 8.9 17.2 16.8 17.0
Surface 28.5 28.5 28.5 8.0 8.1 8.1 31.2 31.2 31.2 4.5 4.6 4.6 66.7 68.7 67.7 7.5 7.5 7.5 13.6 13.6 13.6
Middle 28.4 28.4 28.4 8.1 8.1 8.1 31.4 31.3 31.4 3.7 3.6 3.7 54.4 53.5 54.0 8.7 8.9 8.8 14.8 15.4 15.1
Bottom 28.2 28.2 28.2 8.1 8.1 8.1 31.2 31.2 31.2 4.4 4.2 4.3 64.8 62.6 63.7 9.5 9.6 9.6 17.2 17.0 17.1
Surface 28.4 28.4 28.4 8.1 8.1 8.1 31.2 31.3 31.3 4.8 4.7 4.8 70.6 69.3 70.0 8.1 8.4 8.3 14.8 15.2 15.0
Middle
Bottom 28.3 28.4 28.4 8.1 8.1 8.1 31.3 31.2 31.3 4.0 3.8 3.9 59.3 57.0 58.2 9.1 9.0 9.1 16.6 16.4 16.5
Surface 28.4 28.4 28.4 8.1 8.1 8.1 31.2 31.2 31.2 5.0 4.9 5.0 73.5 72.7 73.1 8.6 8.8 8.7 14.8 15.4 15.1
Middle 28.3 28.4 28.4 8.1 8.1 8.1 31.2 31.2 31.2 4.0 4.0 4.0 59.5 60.1 59.8 9.0 8.8 8.9 16.6 15.8 16.2
Bottom 28.1 28.2 28.2 8.1 8.1 8.1 31.4 31.3 31.4 3.5 3.4 3.5 52.7 51.1 51.9 10.2 10.0 10.1 20.0 19.2 19.6
Surface 28.4 28.3 28.4 8.1 8.1 8.1 31.2 31.3 31.3 4.8 4.6 4.7 70.5 68.7 69.6 7.2 7.6 7.4 12.8 13.4 13.1
Middle 28.3 28.3 28.3 8.1 8.1 8.1 31.3 31.3 31.3 4.1 3.9 4.0 61.5 58.2 59.9 8.6 8.8 8.7 16.0 15.6 15.8
Bottom 28.1 28.1 28.1 8.1 8.1 8.1 31.3 31.3 31.3 4.1 3.9 4.0 61.5 58.2 59.9 8.6 8.8 8.7 19.8 19.6 19.7
Surface 28.5 28.5 28.5 8.1 8.1 8.1 31.3 31.4 31.4 5.3 5.4 5.4 79.1 80.2 79.7 7.4 7.8 7.6 14.2 14.8 14.5
Middle 28.3 28.2 28.3 8.1 8.1 8.1 31.5 31.5 31.5 5.0 4.8 4.9 74.0 71.3 72.7 8.5 8.7 8.6 16.2 16.6 16.4
Bottom 28.1 28.1 28.1 8.1 8.1 8.1 31.6 31.5 31.6 4.0 4.1 4.1 59.5 61.5 60.5 9.2 9.0 9.1 17.4 16.6 17.0
Remark or Obsevation: Note: * Average
** Depth Average
Upstream Control Station:
Salinity
(ppt)
DO
(mg/l)Location
Sampling
Time
Water
Depth (m)
Monitoring
Depth
DO Saturation
(%)
Turbidity
(NTU)
Suspended Solids
(mg/l)
CS1 1300 13.2 8.3 15.9
Temperrature (oC) pH
15.3
WM2 1403 5.4 8.7 15.8
WM1 1333 14.2 8.6
17.0
WM4 1505 10.0 8.3 16.2
WM3 1433 9.6 9.2
16.0CS2 1540 13.8 8.4
APPENDIX E
Review of Exceedance in Water Quality Monitoring
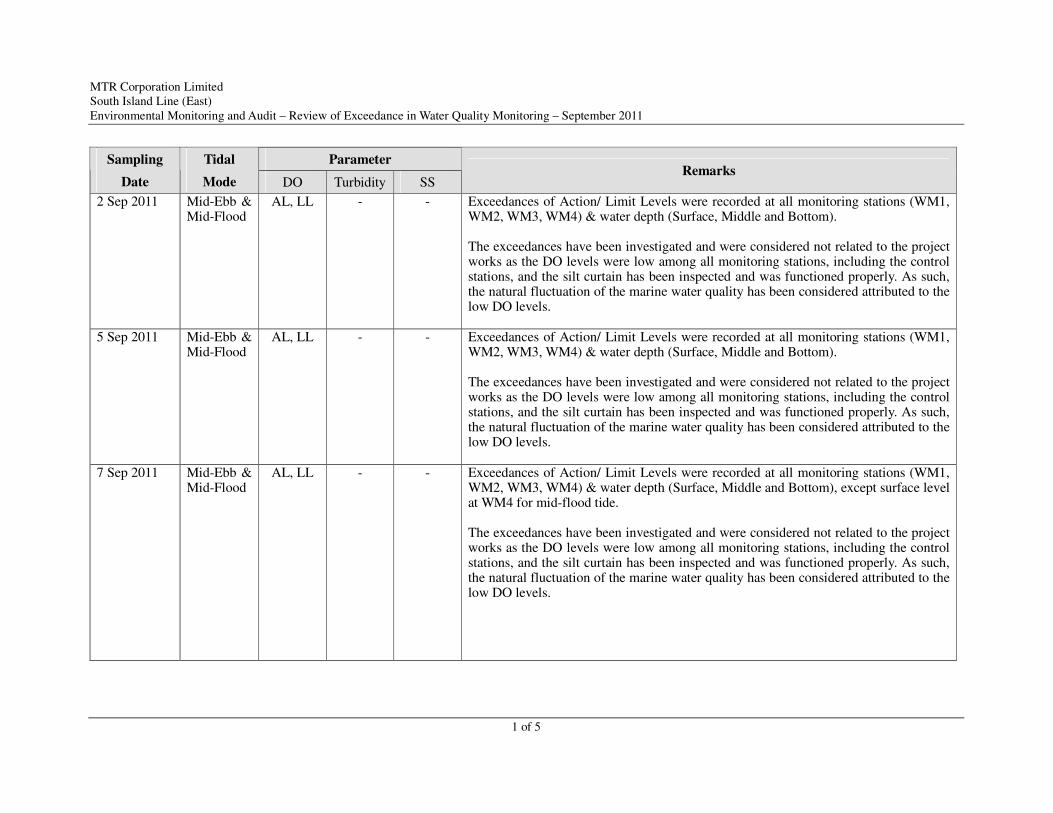
MTR Corporation Limited
South Island Line (East)
Environmental Monitoring and Audit – Review of Exceedance in Water Quality Monitoring – September 2011
1 of 5
Parameter Sampling
Date
Tidal
Mode DO Turbidity SS Remarks
2 Sep 2011 Mid-Ebb &
Mid-Flood
AL, LL - - Exceedances of Action/ Limit Levels were recorded at all monitoring stations (WM1,
WM2, WM3, WM4) & water depth (Surface, Middle and Bottom).
The exceedances have been investigated and were considered not related to the project
works as the DO levels were low among all monitoring stations, including the control
stations, and the silt curtain has been inspected and was functioned properly. As such,
the natural fluctuation of the marine water quality has been considered attributed to the
low DO levels.
5 Sep 2011 Mid-Ebb &
Mid-Flood
AL, LL - - Exceedances of Action/ Limit Levels were recorded at all monitoring stations (WM1,
WM2, WM3, WM4) & water depth (Surface, Middle and Bottom).
The exceedances have been investigated and were considered not related to the project
works as the DO levels were low among all monitoring stations, including the control
stations, and the silt curtain has been inspected and was functioned properly. As such,
the natural fluctuation of the marine water quality has been considered attributed to the
low DO levels.
7 Sep 2011 Mid-Ebb &
Mid-Flood
AL, LL - - Exceedances of Action/ Limit Levels were recorded at all monitoring stations (WM1,
WM2, WM3, WM4) & water depth (Surface, Middle and Bottom), except surface level
at WM4 for mid-flood tide.
The exceedances have been investigated and were considered not related to the project
works as the DO levels were low among all monitoring stations, including the control
stations, and the silt curtain has been inspected and was functioned properly. As such,
the natural fluctuation of the marine water quality has been considered attributed to the
low DO levels.
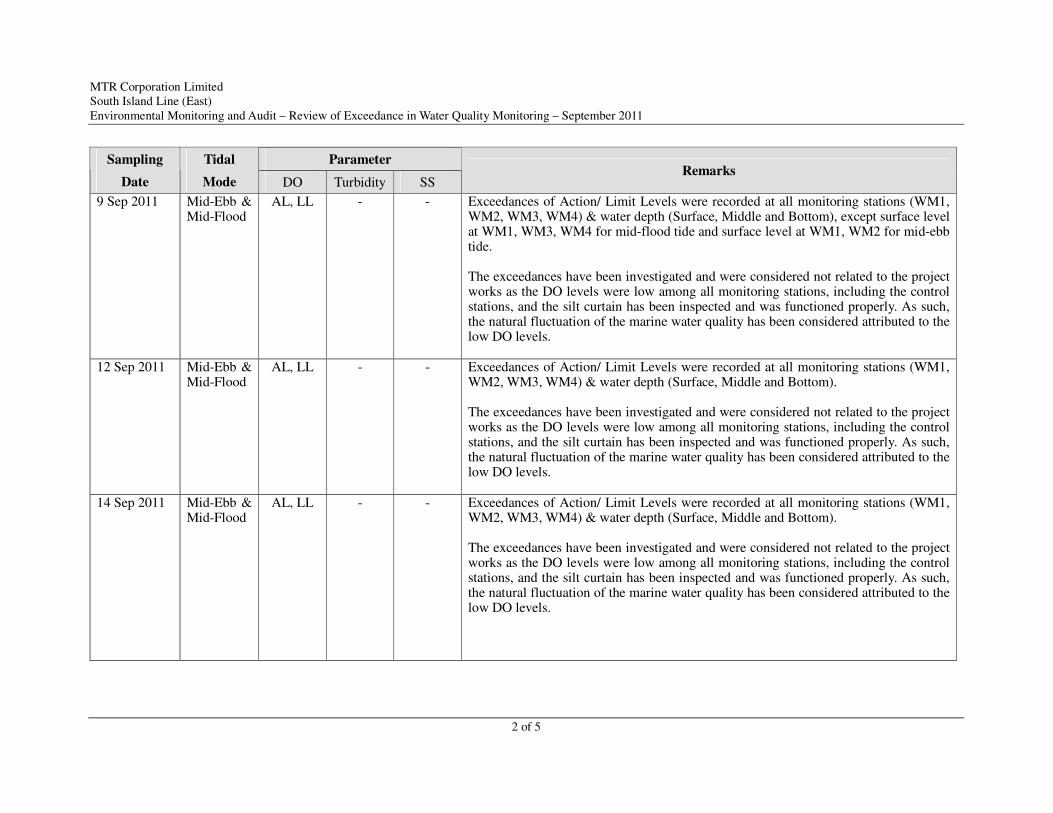
MTR Corporation Limited
South Island Line (East)
Environmental Monitoring and Audit – Review of Exceedance in Water Quality Monitoring – September 2011
2 of 5
Parameter Sampling
Date
Tidal
Mode DO Turbidity SS Remarks
9 Sep 2011 Mid-Ebb &
Mid-Flood
AL, LL - - Exceedances of Action/ Limit Levels were recorded at all monitoring stations (WM1,
WM2, WM3, WM4) & water depth (Surface, Middle and Bottom), except surface level
at WM1, WM3, WM4 for mid-flood tide and surface level at WM1, WM2 for mid-ebb
tide.
The exceedances have been investigated and were considered not related to the project
works as the DO levels were low among all monitoring stations, including the control
stations, and the silt curtain has been inspected and was functioned properly. As such,
the natural fluctuation of the marine water quality has been considered attributed to the
low DO levels.
12 Sep 2011 Mid-Ebb &
Mid-Flood
AL, LL - - Exceedances of Action/ Limit Levels were recorded at all monitoring stations (WM1,
WM2, WM3, WM4) & water depth (Surface, Middle and Bottom).
The exceedances have been investigated and were considered not related to the project
works as the DO levels were low among all monitoring stations, including the control
stations, and the silt curtain has been inspected and was functioned properly. As such,
the natural fluctuation of the marine water quality has been considered attributed to the
low DO levels.
14 Sep 2011 Mid-Ebb &
Mid-Flood
AL, LL - - Exceedances of Action/ Limit Levels were recorded at all monitoring stations (WM1,
WM2, WM3, WM4) & water depth (Surface, Middle and Bottom).
The exceedances have been investigated and were considered not related to the project
works as the DO levels were low among all monitoring stations, including the control
stations, and the silt curtain has been inspected and was functioned properly. As such,
the natural fluctuation of the marine water quality has been considered attributed to the
low DO levels.

MTR Corporation Limited
South Island Line (East)
Environmental Monitoring and Audit – Review of Exceedance in Water Quality Monitoring – September 2011
3 of 5
Parameter Sampling
Date
Tidal
Mode DO Turbidity SS Remarks
16 Sep 2011 Mid-Ebb &
Mid-Flood
AL, LL - - Exceedances of Action/ Limit Levels were recorded at all monitoring stations (WM1,
WM2, WM3, WM4) & water depth (Surface, Middle and Bottom).
The exceedances have been investigated and were considered not related to the project
works as the DO levels were low among all monitoring stations, including the control
stations, and the silt curtain has been inspected and was functioned properly. As such,
the natural fluctuation of the marine water quality has been considered attributed to the
low DO levels.
19 Sep 2011 Mid-Ebb &
Mid-Flood
AL, LL - - Exceedances of Action/ Limit Levels were recorded at all monitoring stations (WM1,
WM2, WM3, WM4) & water depth (Surface, Middle and Bottom).
The exceedances have been investigated and were considered not related to the project
works as the DO levels were low among all monitoring stations, including the control
stations, and the silt curtain has been inspected and was functioned properly. As such,
the natural fluctuation of the marine water quality has been considered attributed to the
low DO levels.
21 Sep 2011 Mid-Ebb &
Mid-Flood
AL, LL - - Exceedances of Action/ Limit Levels were recorded at all monitoring stations (WM1,
WM2, WM3, WM4) & water depth (Surface, Middle and Bottom).
The exceedances have been investigated and were considered not related to the project
works as the DO levels were low among all monitoring stations, including the control
stations, and the silt curtain has been inspected and was functioned properly. As such,
the natural fluctuation of the marine water quality has been considered attributed to the
low DO levels.
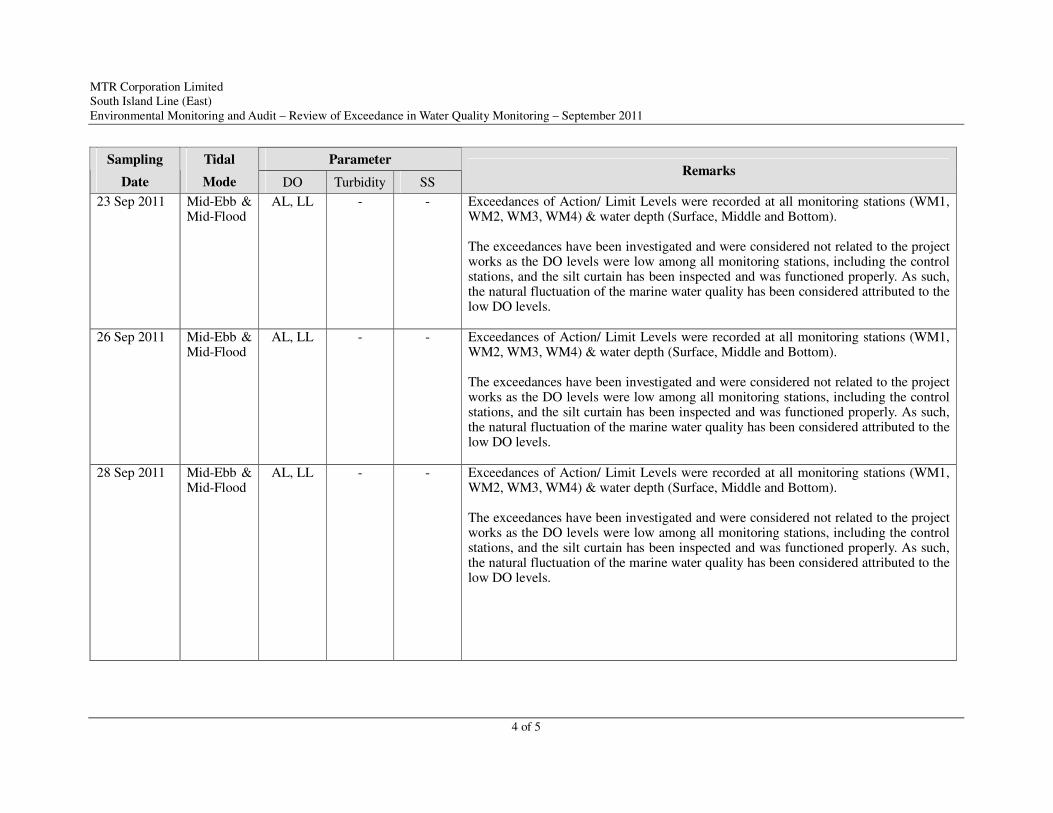
MTR Corporation Limited
South Island Line (East)
Environmental Monitoring and Audit – Review of Exceedance in Water Quality Monitoring – September 2011
4 of 5
Parameter Sampling
Date
Tidal
Mode DO Turbidity SS Remarks
23 Sep 2011 Mid-Ebb &
Mid-Flood
AL, LL - - Exceedances of Action/ Limit Levels were recorded at all monitoring stations (WM1,
WM2, WM3, WM4) & water depth (Surface, Middle and Bottom).
The exceedances have been investigated and were considered not related to the project
works as the DO levels were low among all monitoring stations, including the control
stations, and the silt curtain has been inspected and was functioned properly. As such,
the natural fluctuation of the marine water quality has been considered attributed to the
low DO levels.
26 Sep 2011 Mid-Ebb &
Mid-Flood
AL, LL - - Exceedances of Action/ Limit Levels were recorded at all monitoring stations (WM1,
WM2, WM3, WM4) & water depth (Surface, Middle and Bottom).
The exceedances have been investigated and were considered not related to the project
works as the DO levels were low among all monitoring stations, including the control
stations, and the silt curtain has been inspected and was functioned properly. As such,
the natural fluctuation of the marine water quality has been considered attributed to the
low DO levels.
28 Sep 2011 Mid-Ebb &
Mid-Flood
AL, LL - - Exceedances of Action/ Limit Levels were recorded at all monitoring stations (WM1,
WM2, WM3, WM4) & water depth (Surface, Middle and Bottom).
The exceedances have been investigated and were considered not related to the project
works as the DO levels were low among all monitoring stations, including the control
stations, and the silt curtain has been inspected and was functioned properly. As such,
the natural fluctuation of the marine water quality has been considered attributed to the
low DO levels.
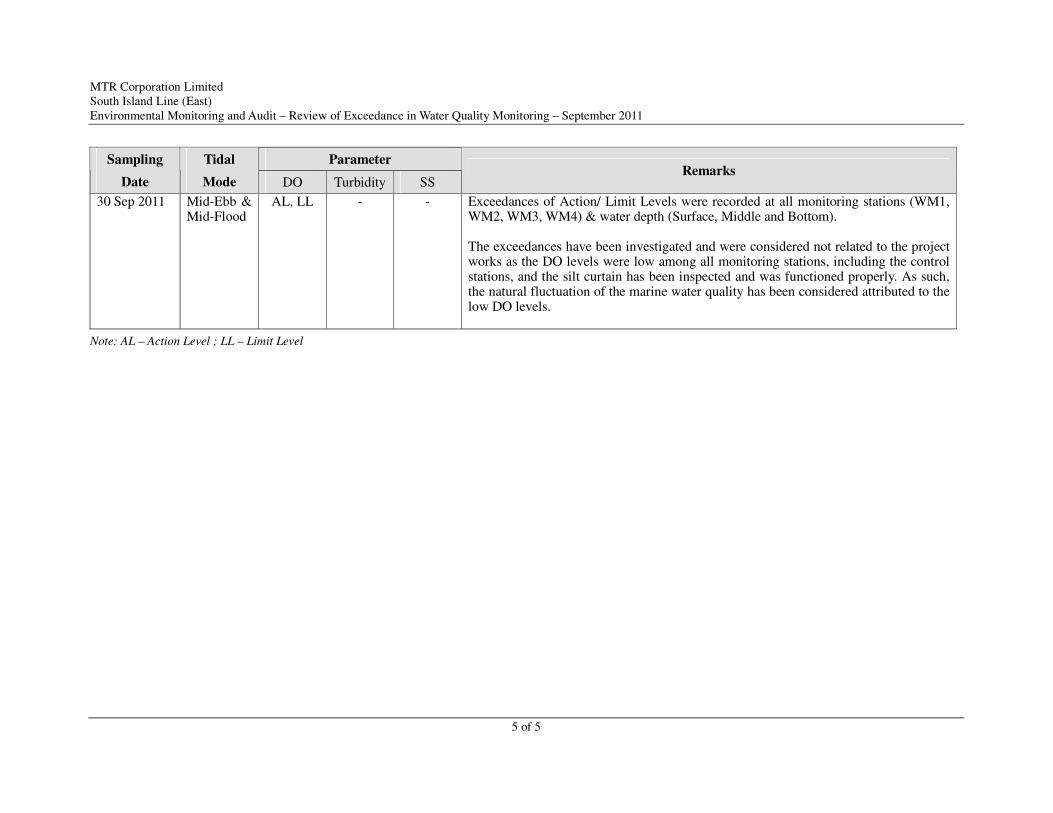
MTR Corporation Limited
South Island Line (East)
Environmental Monitoring and Audit – Review of Exceedance in Water Quality Monitoring – September 2011
5 of 5
Parameter Sampling
Date
Tidal
Mode DO Turbidity SS Remarks
30 Sep 2011 Mid-Ebb &
Mid-Flood
AL, LL - - Exceedances of Action/ Limit Levels were recorded at all monitoring stations (WM1,
WM2, WM3, WM4) & water depth (Surface, Middle and Bottom).
The exceedances have been investigated and were considered not related to the project
works as the DO levels were low among all monitoring stations, including the control
stations, and the silt curtain has been inspected and was functioned properly. As such,
the natural fluctuation of the marine water quality has been considered attributed to the
low DO levels.
Note: AL – Action Level ; LL – Limit Level