executive review -...
TRANSCRIPT

EXECUTIVE REVIEW

54 EXXARO Integrated Report 2016
EXECUTIVE REVIEW
Executive committee
Riaan Koppeschaar
Finance director
Mxolisi Mgojo
Chief executive officer
Wim DiedericksExecutive head: business development
Vanisha Balgobind
Executive head: human resources
Johan MeyerExecutive head: projects and technology
We have been entrusted and mandated by the board to execute Exxaro’s approved strategy. To elaborate on how we achieved this in 2016, we have structured this discussion around our material issues and the indicators used to track our performance.
EXXARO Integrated Report 2016 55
Gro
up
pro
file
Exe
cutive
reviewO
utlo
ok
Bo
ard review
Min
eral reso
urces
and
reserves
An
nexu
res
Mongezi VetiExecutive head: sustainability
Carina WesselsGroup company secretary and legal
We include the relevant board-approved risks to describe how we have responded to threats and opportunities that may affect the performance of our business in creating (or destroying) stakeholder value.
Mzila MthenjaneExecutive head: stakeholder affairs
Dr Nombasa TsengwaExecutive head: coal operations

56 EXXARO Integrated Report 2016
EXECUTIVE REVIEW (CONTINUED)
Mzila Mthenjane (47)Executive head: stakeholder affairs
BSc (eng) (mining), senior management development programme (GIMT)
Experience: Mzila is a mining engineer with over 20 years’ experience in mining and investment banking. This includes seven years in deep-level gold mining at AngloGold Ashanti and Gold Fields in senior mine management and corporate development roles, respectively; and six years in investment banking at RMB and Deutsche Bank. His knowledge of business sustainability was honed over six years as executive: business sustainability at Royal Bafokeng Holdings and Royal Bafokeng Platinum. He assumed his current role in 2013.
Dr Nombasa Tsengwa (52)Executive head: coal operations
PhD (agronomy) (Maryland, US), executive development programme (Insead)
Experience: Nombasa has over 15 years of executive management and board experience in the public and private sector. In 2003 she joined Kumba Resources as general manager: safety, health, and environment. In 2007 she was appointed executive general manager: safety and sustainable development. In 2010, she became directly involved in the coal operations, as general manager of tied mines, and general manager of Mpumalanga operations. After acting in her current role for one year, she was appointed in a permanent capacity from May 2016.
Mongezi Veti (53)Executive head: sustainability
National higher diplomas in metalliferous mining and coal mining (Technikon Witwatersrand), MBL (Unisa), advanced management programme (Wharton), mine overseer’s certificate and mine manager’s certificate of competency for fiery mines
Experience: In the early 1980s, Mongezi worked for AngloGold at Western Deep Levels and joined Sasol Mining in 1994. In 2002, he became mine manager at Arnot, and was appointed an area general manager in Exxaro soon after the merger, before assuming his current role in 2015.
Carina Wessels (39)Group company secretary and legal
LLB advanced labour law (cum laude) (Pretoria), LLM (labour law) (Unisa), management development programme (cum laude) (GIBS), FCIS (CSSA), LLM (extractive industry law in Africa) (cum laude) (Pretoria)
Experience: Carina is an admitted advocate of the High Court of South Africa and a fellow and past president of Chartered Secretaries Southern Africa. She is also a past president of the Corporate Secretaries International Association and remains on that executive committee. She spent nine years with De Beers in various operational and head office positions, including human resources, business improvement and corporate secretariat, as well as a period with Investec as corporate secretariat legal adviser. She assumed her current role in 2011, with executive accountability for legal from January 2017.
Executive
Mxolisi Mgojo (56)Chief executive officer from 1 April 2016
Refer board review on page 35
Riaan Koppeschaar (46)Finance director from 1 July 2016
Refer board review on page 35
Wim Diedericks (49)Executive head: business development
BEng (mining) (Pretoria), executive development programme (Darden)
Experience: Wim started his career as an Iscor bursar (1986 to 1990) and was appointed an engineer-in-training at Thabazimbi mine in 1992. He was also employed at Durnacol, Tshikondeni, SIOC, Rosh Pinah and Kumba Resources head office. Since Exxaro’s formation, he has held senior leadership positions at KZN Sands, Grootegeluk, Mpumalanga Coal commercial region and corporate office. He assumed his current role on 1 April 2015.
Vanisha Balgobind (44)Executive head: human resources
BA (hons) (industrial psychology), MA (ind psych), management development programme (GIBS)
Experience: Vanisha is a registered industrial psychologist with 18 years’ experience in the mining industry. She was appointed as an HR assistant at Mondi Kraft in Richards Bay in 1996 and joined Iscor Mining in 1997 as an HR trainee. She served at Kumba Resources as an HR consultant and talent management consultant between 2001 and 2006. At Exxaro, she headed talent management and staffing for five years, was manager for corporate projects and HR optimisation for two years, and then group manager for talent and learning before assuming her current position.
Johan Meyer (48)Executive head: projects and technology
BEng (metallurgy) (Pretoria), MBA (Stellenbosch) and advanced management programme (Insead)
Experience: Johan started his career at Iscor Pretoria Steel Works in 1987. From 1997 to 2005, he was part of the heavy minerals management team in designing, commissioning and implementing the KZN Sands business. He spent two years as research and development manager for Kumba Resources before his appointment as Zincor manager in 2009. Following the successful closure of Zincor, he was general manager: technology prior to assuming his current role on 1 April 2015.
EXXARO Integrated Report 2016 57
Gro
up
pro
file
Exe
cutive
reviewO
utlo
ok
Bo
ard review
Min
eral reso
urces
and
reserves
An
nexu
res
Snapshot of 2016 – market recovery but uncertainty remainsMacro environment
Recovery in seaborne coal and iron ore price supporting restructuring initiatives Share price recovered to a high of R89,50 at year end from a low of R44,04 in December 2015 Significant changes in global political and economic landscape – Brexit referendum, US interest rates and European elections
RSA real GDP growth for 2016 at 0,4% from 1,26% in 2015 Ongoing policy uncertainty on black economic empowerment in the domestic mining sector
Highlights
2016 2015 % change
Second year of zero fatalities ›› Fatalities = zero›› LTIFR = 0,09
›› Fatalities = zero›› LTIFR = 0,17
47%
Strategy delivering improved operational performance – production and cost
›› Export volumes at 7,9Mt›› Core NOP at R4,9 billion
›› Export volumes at 6,2Mt›› Core NOP at R3,4 billion
27%46%
Improved market conditions evidenced in equity portfolio
›› Income contribution from equity-accounted investments of R2,4 billion
›› Loss from equity-accounted investments of R1,1 billion
>100%
Returning cash to shareholders
›› HEPS of 1 302 cents per share›› Final dividend of 410 cents per share
›› HEPS of 456 cents per share›› Final dividend of 85 cents per share
185%382%
Lowlights Losing people through voluntary separation and other termination initiatives in 2015 and 2016, after closing Tshikondeni, Inyanda, AlloyStream, Arnot, Exxaro improvement project and our remaining offshore offices
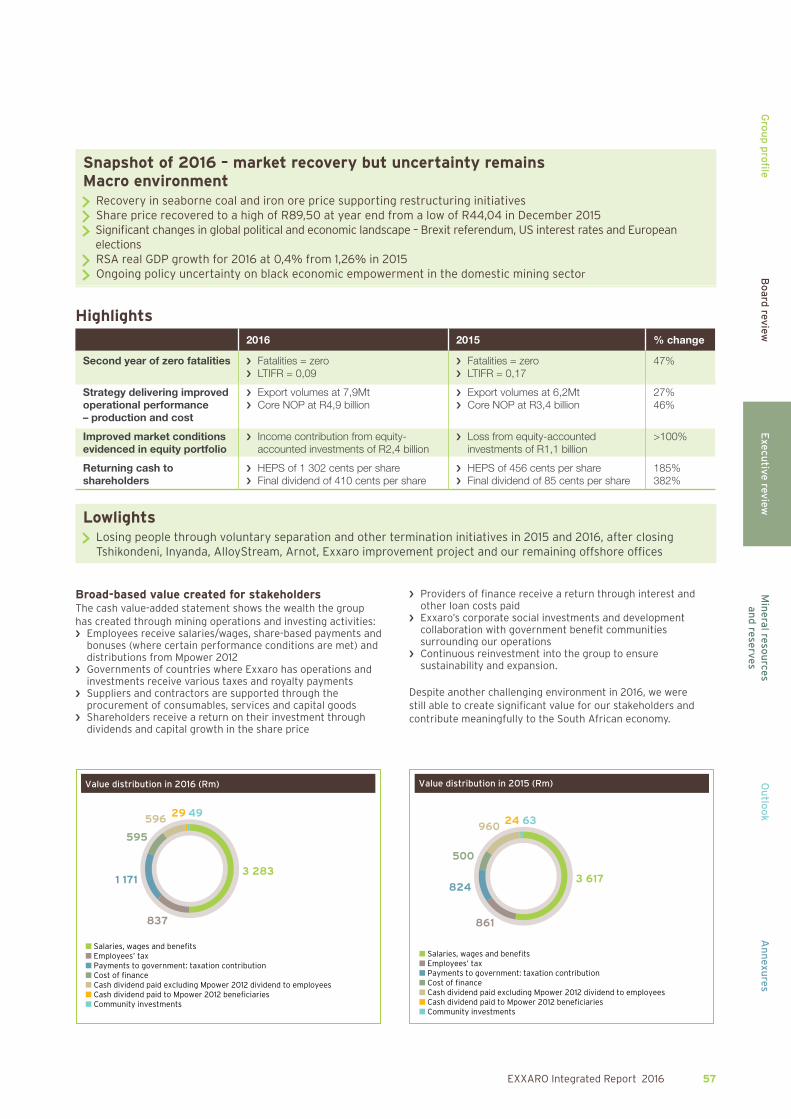
Broad-based value created for stakeholdersThe cash value-added statement shows the wealth the group has created through mining operations and investing activities: ›› Employees receive salaries/wages, share-based payments and
bonuses (where certain performance conditions are met) and distributions from Mpower 2012
›› Governments of countries where Exxaro has operations and investments receive various taxes and royalty payments
›› Suppliers and contractors are supported through the procurement of consumables, services and capital goods
›› Shareholders receive a return on their investment through dividends and capital growth in the share price
›› Providers of finance receive a return through interest and other loan costs paid
›› Exxaro’s corporate social investments and development collaboration with government benefit communities surrounding our operations
›› Continuous reinvestment into the group to ensure sustainability and expansion.
Despite another challenging environment in 2016, we were still able to create significant value for our stakeholders and contribute meaningfully to the South African economy.
Value distribution in 2016 (Rm)
3 283
837
1 171
595
59629 49
■ Salaries, wages and benefits■ Employees’ tax■ Payments to government: taxation contribution■ Cost of finance■ Cash dividend paid excluding Mpower 2012 dividend to employees■ Cash dividend paid to Mpower 2012 beneficiaries■ Community investments
Value distribution in 2015 (Rm)
3 617
861
824
500
96024 63
■ Salaries, wages and benefits■ Employees’ tax■ Payments to government: taxation contribution■ Cost of finance■ Cash dividend paid excluding Mpower 2012 dividend to employees■ Cash dividend paid to Mpower 2012 beneficiaries■ Community investments
58 EXXARO Integrated Report 2016
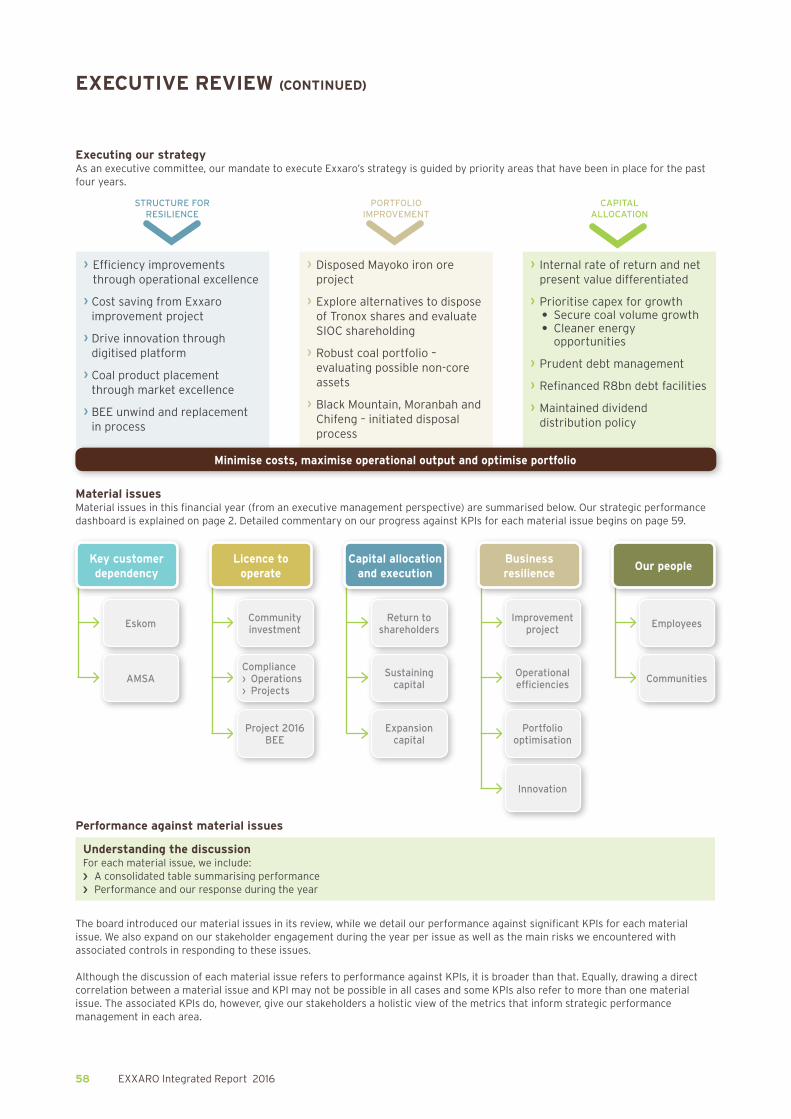
Executing our strategyAs an executive committee, our mandate to execute Exxaro’s strategy is guided by priority areas that have been in place for the past four years.
STRUCTURE FOR RESILIENCE
PORTFOLIO IMPROVEMENT
CAPITAL ALLOCATION
› Efficiency improvements through operational excellence
› Cost saving from Exxaro improvement project
› Drive innovation through digitised platform
› Coal product placement through market excellence
› BEE unwind and replacement in process
› Disposed Mayoko iron ore project
› Explore alternatives to dispose of Tronox shares and evaluate SIOC shareholding
› Robust coal portfolio – evaluating possible non-core assets
› Black Mountain, Moranbah and Chifeng – initiated disposal process
› Internal rate of return and net present value differentiated
› Prioritise capex for growth• Secure coal volume growth• Cleaner energy
opportunities
› Prudent debt management
› Refinanced R8bn debt facilities
› Maintained dividend distribution policy
Minimise costs, maximise operational output and optimise portfolio
Material issuesMaterial issues in this financial year (from an executive management perspective) are summarised below. Our strategic performance dashboard is explained on page 2. Detailed commentary on our progress against KPIs for each material issue begins on page 59.
Improvement project
Operational efficiencies
Portfolio optimisation
Innovation
Business resilience
Key customer dependency
Eskom
AMSA
Community investment
Compliance› Operations› Projects
Project 2016 BEE
Licence to operate
Return to shareholders
Sustaining capital
Expansion capital
Capital allocation and execution
Employees
Communities
Our people
Performance against material issues
Understanding the discussion For each material issue, we include:›› A consolidated table summarising performance ›› Performance and our response during the year
The board introduced our material issues in its review, while we detail our performance against significant KPIs for each material issue. We also expand on our stakeholder engagement during the year per issue as well as the main risks we encountered with associated controls in responding to these issues.
Although the discussion of each material issue refers to performance against KPIs, it is broader than that. Equally, drawing a direct correlation between a material issue and KPI may not be possible in all cases and some KPIs also refer to more than one material issue. The associated KPIs do, however, give our stakeholders a holistic view of the metrics that inform strategic performance management in each area.
EXECUTIVE REVIEW (CONTINUED)
EXXARO Integrated Report 2016 59
Gro
up
pro
file
Exe
cutive
reviewO
utlo
ok
Bo
ard review
Min
eral reso
urces
and
reserves
An
nexu
res
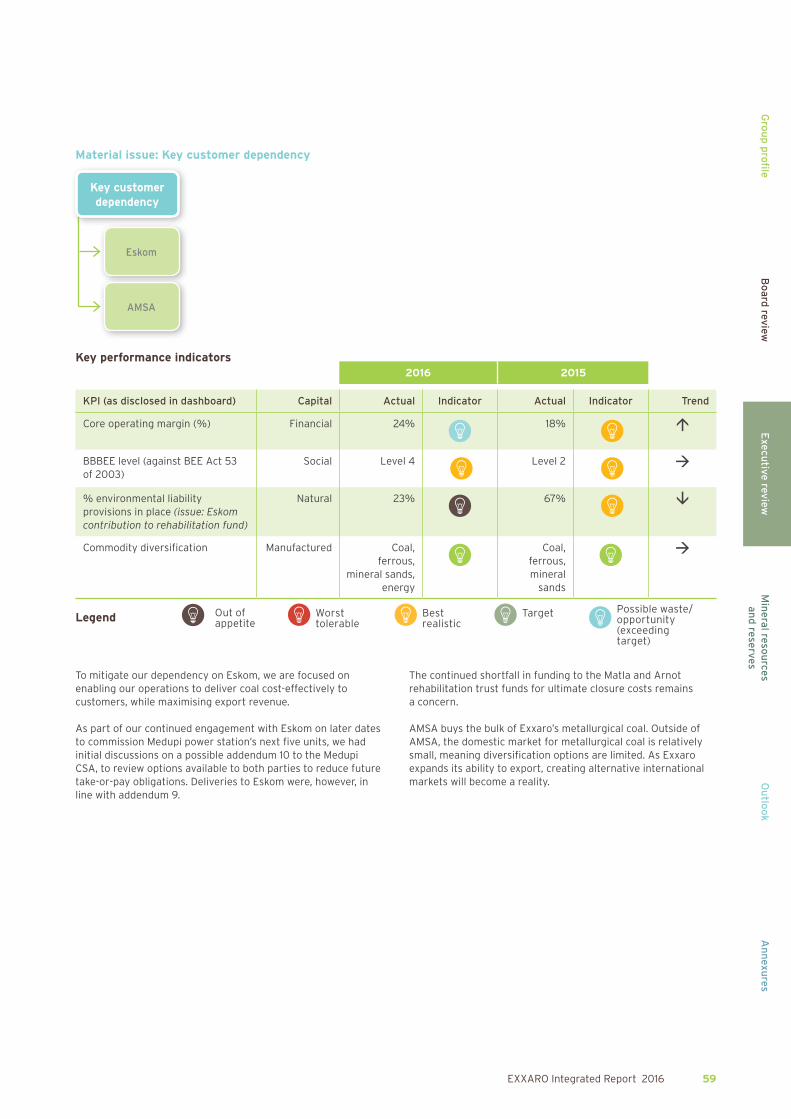
Material issue: Key customer dependency
Key customer dependency
Eskom
AMSA
Key performance indicators2016 2015
KPI (as disclosed in dashboard) Capital Actual Indicator Actual Indicator Trend
Core operating margin (%) Financial 24% 18%
BBBEE level (against BEE Act 53 of 2003)
Social Level 4
Level 2
% environmental liability provisions in place (issue: Eskom contribution to rehabilitation fund)
Natural 23% 67%
Commodity diversification Manufactured Coal, ferrous,
mineral sands, energy
Coal, ferrous, mineral
sands
To mitigate our dependency on Eskom, we are focused on enabling our operations to deliver coal cost-effectively to customers, while maximising export revenue.
As part of our continued engagement with Eskom on later dates to commission Medupi power station’s next five units, we had initial discussions on a possible addendum 10 to the Medupi CSA, to review options available to both parties to reduce future take-or-pay obligations. Deliveries to Eskom were, however, in line with addendum 9.
The continued shortfall in funding to the Matla and Arnot rehabilitation trust funds for ultimate closure costs remains a concern.
AMSA buys the bulk of Exxaro’s metallurgical coal. Outside of AMSA, the domestic market for metallurgical coal is relatively small, meaning diversification options are limited. As Exxaro expands its ability to export, creating alternative international markets will become a reality.
Possible waste/ opportunity (exceeding target)
Target Best realistic Worst
tolerable Out of appetiteLegend

60 EXXARO Integrated Report 2016
Controlling the risk
Despite fragile economic activity in the first half of 2016 and high levels of political and economic uncertainty, global economic fundamentals in the second half remained positive. Rising commodity prices helped commodity-producing economies such as Brazil, Russia and South Africa to return to positive gross domestic product (GDP) growth territory.
Following years of weakness, coal markets improved somewhat in the second half of the review period. Globally, weather disruptions, production cuts, above average seasonal demand and supply reforms (most notably the 276 operating days/annum policy implemented by the Chinese government) caused thermal and hard coking coal prices to surge significantly. The API4 coal export index price averaged US$75 per tonne for 2H16 (1H16: US$53).
Customer relationships in the export marketThree events have drastically changed Exxaro’s export product mix from that of previous years:
›› Acquiring the assets of Total Coal South Africa (now Exxaro Coal Central or ECC) in 2015 has nearly doubled Exxaro’s export volumes and most of the additional tonnages were of RB3 quality or lower
›› Our decision to stop supply of power station coal from Leeuwpan to Majuba power station has added a material volume of Eskom-type coal to exports
›› Finally, more power station coal was added to the portfolio by Eskom’s decision to terminate the Mafube supply agreement at the end of 2015.
The new product portfolio has required Exxaro to develop the Indian market aggressively and we are currently selling over 60% of our export product in this market.
We are trying to balance the strategic objective of being as close as possible to the end consumer with the various performance and credit risk profiles of our new markets and customers. As such, our choice of strategic partners in different sales channels is proving very important. Exxaro is therefore maintaining very healthy relationships with both end consumers and trading companies to ensure effective channels to market.
2016 export sales destinations (%)
6513
11
11
■ India ■ Europe
■ Africa ■ Asia
2016 export product mix (%)
18
31
49
2
■ Power station ■ RB1
■ RB3 ■ Other
EXECUTIVE REVIEW (CONTINUED)

EXXARO Integrated Report 2016 61
Gro
up
pro
file
Exe
cutive
reviewO
utlo
ok
Bo
ard review
Min
eral reso
urces
and
reserves
An
nexu
res
Controlling the risk (continued)
Customer relationships in the domestic market›› The Exxaro/AMSA relationship has weathered many
challenges over the years, making both parties fundamentally aware of each other’s business drivers. In addition, a negative event for either party has far-reaching consequences for the other as AMSA consumes around 1,2Mtpa of semi-soft coking coal to produce metallurgical and market coke
›› While relationships in the cement industry are valuable, these will be tested in coming months given the oversupply of cement domestically that results in fierce competition among cement producers. The boiler subsegment is a more opportunistic market, requiring much more interaction and maintenance in terms of customer relationship management. Exxaro has done considerable market development work in the Western Cape in 2016 to position it proactively in the market for future production from the expanded Grootegeluk (GG10) plant.
2016 volumes (%)
49
1
68
18
■ AMSA ■ Domestic steam
■ Reductants + metals (other) ■ Eskom
■ Exports
2016 updates›› Exxaro continues to operate Matla, while engaging with Eskom
operationally and through mediation to obtain the funds that the mine needs for its capital projects
›› Closure activities for Arnot mine continue. Exxaro has also engaged Eskom in arbitration to ensure the utility meets its closure obligations
›› Medupi – ongoing offtake according to addendum 9 ›› Leeuwpan – Eskom’s inability to decide on coal supply forced
Exxaro to cancel the Majuba coal-supply agreement and find alternative markets for this coal
›› Completion of ECC transaction – to optimise ECC, we have implemented our operating philosophy and the Exxaro operational excellence methodology by:›• Adding a fifth 4-seam section at Forzando South which
contributed 200kt to 2016 production ›• Optimising the resource-to-market value chain through
plant and product-mix adjustments, taking the acquired export entitlement into account
›• Rolling out cost-saving initiatives across all operations ›• Exploring available adjacent reserves to extend the current
life of mine ›• Exploring the Eskom market as a potential customer ›• Continually reviewing the capital expenditure plan and only
approving critical capital expenditure until the actions above have been finalised.
As part of the DMR’s conditions for approving the transfer of ECC mineral rights to Exxaro, we are required to include additional BEE participation in the shareholding of ECC assets. This has been combined with the broader empowerment ownership project currently under way at group level.
We remain confident about the long-term strategic value of acquiring the ECC assets, especially the export entitlement.
Material issue: Licence to operate
Community investment
Compliance› Operations› Projects
Project 2016 BEE
Licence to operate

62 EXXARO Integrated Report 2016
Key performance indicators
2016 2015
KPI (as disclosed in dashboard) Capital Actual Indicator Actual Indicator Trend
Ownership at group level – mining charter
Social 52%45,2%#
52%
Project delivery measure for local economic development projects per social and labour plan (cost variance from plan) – mining charter
Social (17%)(abovebudget)
not reported to board
Reportable cases of environmental incidents
Natural 5 x level 20 x level 3
18 x level 20 x level 3
Valid mining rights – in place – mine works plan (MWP), environmental management plan (EMP) and SLP
Natural 98% 97%
Enforceable mining rights – based on conditions (in place)
Natural 75% 98%
Environmental authorisations in place (validity) (integrated water use licence (IWUL), environmental impact assessment (EIA) and waste)
Natural 95% >90%
Environmental authorisations (compliance to conditions)
Natural 90% <90%
Carbon footprint (scope 1 and 2) (reduction per annum)
Natural 4,2% 4,3%
Water intensity (improvement from target)
Natural 13% not reported to board
Water intensity (kℓ/TTM) Natural 0,2 0,33
a principle of zero harm and continually seek ways to minimise our impact on the environment. For example, we relocated the Belfast beneficiation plant from its optimal site to minimise any impact on a sensitive wetland area. We also focus more on continuous rehabilitation so that the environment can be restored as soon as possible after mining has been completed in a specific area.
Operational complianceExxaro’s current active operations have all the authorisations required to operate under a valid mining right. All mining rights in turn need a valid and approved MWP and approved SLP. Under the new National Environmental Management Act (NEMA), environmental authorisations are also required for a valid mining right. The only exceptions are:›› Tshikondeni – no longer operational, but has an old-order
mining right that has been converted and granted, but not executed
›› Strathrae – no longer operational; also has an old-order mining right that has been converted and granted, but not executed.
EXECUTIVE REVIEW (CONTINUED)
The regulatory universe for mining is extremely stringent and spans the environmental, social and governance domains. For Exxaro, our licence to operate is vital for a sustainable business – without the required licences, permits or authorisations in the social and environmental domains, we are not able to operate at all. These domains are governed by the mining regulator – the Department of Mineral Resources as well as the Department of Environmental Affairs and thirdly, the Department of Water and Sanitation. In addition, the amended BEE codes introduce another layer of compliance from a second regulator – the Department of Trade and Industry. At the same time, as a black-owned entity, Exxaro strives to remain a flagship BEE company in South Africa and we are actively involved in the Chamber of Mines, where we contribute to shaping the regulatory universe in which mining operates.
An important component of our sustainability as a company is our ability to comply with every stipulation, provision or directive in our various environmental licences. As an industry, mining has a negative impact on the environment, and is regulated by strict rehabilitation and closure laws. We follow
Possible waste/ opportunity (exceeding target)
Target Best realistic Worst
tolerable Out of appetiteLegend
# As at 31 December 2016.

EXXARO Integrated Report 2016 63
Gro
up
pro
file
Exe
cutive
reviewO
utlo
ok
Bo
ard review
Min
eral reso
urces
and
reserves
An
nexu
res
All documentation and requests for execution for Strathrae and Tshikondeni were timeously submitted, but a decision taken not to execute as these mines are in closure. There is ongoing engagement with the DMR on the status of these rights.
Compliance and licensing for projectsAs part of the project lifecycle planning process, Exxaro continually ensures that all requisite rights, licences and authorisations are in place prior to construction and commissioning.
The only exceptions occur when a stakeholder appeals a specific right, licence or authorisation granted by the regulatory authorities to Exxaro. The Belfast project has been subject to numerous appeals by external stakeholders on awarding the integrated water use licence (IWUL) and rezoning of the mining area (from farming use) by local authorities. Exxaro has had to seek legal judgments in responding to these appeals so that our projects can continue as legitimate operations that comply with all statutory requirements and obligations.
Mineral tenure complianceExxaro aims to have every mining right valid and to comply with all conditions for each licence and right granted. We define the validity of a mining right by having its three pillars in place: the MWP, environmental management programme (EMP), and SLPs.
Our analysis shows our mining rights are 98% valid, with the variance largely due to the rights of Strathrae and Tshikondeni not being executed. As such, they do not have valid MWPs and SLPs in place.
Every right, licence and permit granted has detailed compliance stipulations and we are focused on improving our compliance to all stipulations.
We define the enforceability of our mining rights by section 93 and 47 directives issued, as well as any section 102 to amend a MWP, environment authorisation or SLP. In addition, compliance includes submitting reports to the DMR describing future mining activities.
We gave ourselves a conservative enforceability score of 75%, as we are currently integrating ECC’s monitoring and compliance systems with Exxaro’s compliance matrix. Given our conservative approach, we expect the enforceability score to improve to above 95%.
Environmental complianceExxaro complies fully with all authorisations and licensing requirements for its current operations. These authorisations typically include:›› IWUL›› Waste management licences ›› Air emission limits ›› Environmental impact assessments ›› Records of decisions›› Environmental authorisations (EAs).
Each of these has specific conditions to which mining operations have to adhere at all times.
We measure environmental authorisations on two levels: IWULs granted, and environmental impact assessments approved. Our analysis shows that our environmental authorisations are within tolerable levels (95%), with the 5% shortfall being due to delays in finalising appeals lodged against the Thabametsi and Belfast projects.
A compliance score of 90% to environmental authorisation conditions was provided by an internal audit. The implementation of a new integrated monitoring and compliance system will help us improve the score in 2017. As part of this process, detailed checklists per site are being drafted to drive improved compliance to conditions.
Environmental issuesDelays and appeals against IWULs granted by the Department of Water and Sanitation have become a risk for new projects and part of their critical paths. To mitigate these long lead times in securing the necessary permits and licences, we are engaging early with the respective regulators, and proactively with every interested and affected stakeholder group.
Our greenhouse gas (GHG) emissions are currently not an immediate risk to our licence to operate. However, related legislative developments such as GHG reporting regulations, carbon tax, carbon budgets and carbon offset systems will introduce additional compliance requirements.
Given our participation in the global benchmark CDP since 2009, Exxaro’s carbon-emission reporting systems are mature. We are now focused on developing mitigation and adaptation plans for all operations.
Exxaro has not met its internal carbon reduction target for 2016. Based on the prior year’s use, the target is a 5% reduction from those emissions. This target will be reviewed in 2017. The table and graph that follow compare greenhouse gas emissions since 2013.
Greenhouse gas emissions
(kt CO2e) 2016 2015 2014 2013
Scope 1 271,7 235,2 229,8 236,0
Scope 2* 500,9 521,9 557,6 525,0
Total scope 1 and 2 772,6 757,1 787,4 761,0
Year-on-year change (%) 2,04 (3,8) 3,5 (48,0)
Scope 3** 71 651 73 847 74 768 69 737
Year-on-year change (%) (2,17) (1,2) 7,2 (1,3)
* Scope 2: Electricity-based emissions are derived from the grid emission factor for South Africa (0,94t CO2e/MWh).
** Scope 3: Reported emissions are based on emissions from the use of product sold by Exxaro plus transmission and distribution losses from the South African grid derived from Eskom’s emissions factor for electricity sold (1,03t CO
2e/MWh) and the grid emission factor for South Africa
(0,94t CO2e/MWh). Reported emissions represent over 96% of Exxaro’s scope 3 emissions.

64 EXXARO Integrated Report 2016
Greenhouse gas emissions – scope 1 and 2 (kt CO2e)
■ Scope 1 ■ Scope 3■ Scope 2
2013 2014 2015 2016
23
0
23
5
23
6
52
5 55
8
52
2
71 65173 847 74 768
69 737
27
1
50
1
We base our accounting and reporting for GHG emissions on the Greenhouse Gas Protocol and have elected to use the operating control accounting approach for emissions.
Given rising stakeholder activism against coal as a source of energy, Exxaro has responded to shareholder enquiries on our strategy to reduce emissions, transition to renewable energy and adapt to the so-called 2ºC climate environment (limiting the increase in global temperature to below pre-industrial levels).
With the current and expected outlook for South Africa’s electricity requirements, we believe coal remains a relevant source of affordable electricity generation for the economy and Exxaro is well positioned to supply this energy source to Eskom. We do, however, regard this as a medium to longer-term risk and it is part of our diversification imperative.
South Africa is a water-scarce country and Exxaro recognises that water-reduction initiatives are crucial to sustainable operations, particularly under prevailing drought conditions. Our prime focus is optimising the use of recycled water and
developing innovative passive water-treatment systems for operations. We are updating our water strategy to align more closely with our sustainability strategy, the country’s water situation and our growth strategy. Approval of the updated group water strategy by the executive team is expected in the second quarter of 2017.
In terms of water performance for the group, water withdrawals decreased slightly (4%) in 2016.
Water withdrawal performance – 2016 versus 2015 (megalitres)
8 4
66
8 1
44
34
7
5
(4%
)
(5%
)
2015 Coal Corporate centre 2016
Coal – Arnot, Grootegeluk, reductants, Matla, Leeuwpan, NBC, Inyanda, Tshikondeni, Durnacol and HlobaneCorporate centre – head office, R&D, AlloyStream and FerroAlloys
The reduction in water withdrawals primarily reflects halted operations at some mines, particularly Arnot (shown below). Although Tshikondeni and Inyanda are also closed mines, the slight increase in water withdrawals reflects rehabilitation activities at those operations. Grootegeluk has been implementing measures to optimise water reuse and recycling in its operations. A pit-water management study was undertaken last year and a strategy developed for maximising recycled water and reducing water intake from Mokolo Dam. Although Grootegeluk is still implementing its strategy, a 5% reduction in water withdrawals was realised in the reporting period.
EXECUTIVE REVIEW (CONTINUED)
Water withdrawal at coal operations 2016 versus 2015 (megalitres)
2015 Grootegeluk Matla Tshikondeni Arnot Inyanda Leeuwpan North Block Complex
Others 2016
8 372 280
177 29 19115 69 3 31
8 025
(51%)9%(37%)
7%13%18%
(36%)(5%)

EXXARO Integrated Report 2016 65
Gro
up
pro
file
Exe
cutive
reviewO
utlo
ok
Bo
ard review
Min
eral reso
urces
and
reserves
An
nexu
res
In addition, Grootegeluk has been at the forefront of using advanced technology in mining aimed at recovering water from slimes dams while putting safety first (see case study below).
Group water intensity has, however, increased slightly in 2016 from 2015 (see graph). Although improvements are evident in many operations, further efficiency improvements are still possible. For example, water use in our beneficiation plants has been high for the past two years. Through our internal water efficiency audits, several issues have been highlighted that need to be addressed and these will be included in our business unit water and infrastructure management strategies in 2017. These inefficiencies resulted in our water-intensity reduction targets for 2016 not being met. The current target is based on prior-year use and industry benchmarks and aims for a 5% reduction in water intensity from the previous year.
Water intensities – 2013 to 2016
37,3
215
37,6
184
41,0
204
37,0
217
2013 2014 20162015■ Production (Mt) ■ Intensity (ℓ/t)
Case study: Grootegeluk cyclic operated coal slurry pond facility
Given the end of life for existing slurry deposition dams, Grootegeluk commissioned a R385 million cyclic operated coal slimes ponds facility.
This is an innovative solution and the first of its kind globally. It comprises four ponds, each with a capacity of 365 000m3 (total 1 460 000m3), two return water dams of 68 000m3 each, a pump station, substation and slurry-delivery line. The biggest differentiator is the large-scale installation of a sophisticated barrier and drainage system, along with the reclamation of coal fines as a continuous operation (ongoing), making this an industry first.
The cyclic operated manner of the ponds ensures that sufficient deposition space is always available. The operational cycle starts with filling, then drying the product, and finally product recovery. This cycle allows a balance between filling time, total drying and product recovery time for continuous operation of the facility, thus providing unlimited capacity.
The design of the evaporative drying of coal fines is based on modern and ongoing research on the subject and science of evaporative drying, driven by stringent compliance standards imposed by the authorities. These ponds are also energy-efficient, reducing our carbon footprint in line with the group’s commitment.
To minimise environmental impacts, the cyclic ponds have drainage below the liner, to relieve pressure and act as a leakage detection layer, and on top of the liner to assist with drainage.
Since the facility became operational, it has allowed water recovery of about 100 000m3 per month, reducing withdrawal from water resources. This frees up much-needed water in the catchment, particularly under current country-wide drought conditions.

66 EXXARO Integrated Report 2016
Investing in communitiesExxaro sees itself as the tenant of its host communities, not the landlord, and a successful relationship with communities is therefore key to our business success and growth. We go beyond compliance and invest in areas such as environmental conservation and health and welfare through our corporate social investment (CSI) programmes.
Our aim is to create economic diversification to limit dependency on the mine while building resilient and self-sufficient communities in the long term by implementing local development initiatives to improve social infrastructure and education as well as promoting employment and local procurement.
Between 2006 and 2016, our focus on education and skills development accounted for 51% of our socio-economic expenditure.
EXECUTIVE REVIEW (CONTINUED)
Total community development spend – 2006 - 2016 (%)
37
1413
12
6
54
4 32
■ Education ■ Skills development
■ Infrastructure ■ Enterprise and supplier development
■ Other
■ Health and welfare ■ Agriculture
■ Sports and recreation ■ Governance
■ Environment
Socio-economic development investment per focus area – 2016 - R49 million (%)
43
18
12
9
74
4 2 1
■ Education ■ Skills development
■ Sports and recreation ■ Governance
■ Enterprise and supplier development
■ Agriculture ■ Environment
■ Health and welfare
■ Infrastructure
BEE amended codes of good practice The amended codes of good practice with more stringent targets have been promulgated. Exxaro has analysed its anticipated performance against the new codes and is putting measures in place to improve on elements where we are not performing well at present. Under current economic conditions, we expect that the target of the ownership element under net value will not be met. We are also focused on meeting new compliance requirements for enterprise and supplier development.
We missed the skills development target as the amended codes have removed all mandatory skills training. We will work towards reaching the targets as soon as possible.
A challenge in the amended codes is the target set for people with disabilities at 2% of the workforce. We are currently 40% below this target and actively driving disability awareness campaigns to identify employees with verifiable disabilities who have not declared these. In advertising careers, we emphasise the fact that a disability is not a barrier (limited to no external recruitment, in response to the business resilience material issue, has affected our progress against this target).
EXXARO Integrated Report 2016 67
Gro
up
pro
file
Exe
cutive
reviewO
utlo
ok
Bo
ard review
Min
eral reso
urces
and
reserves
An
nexu
res
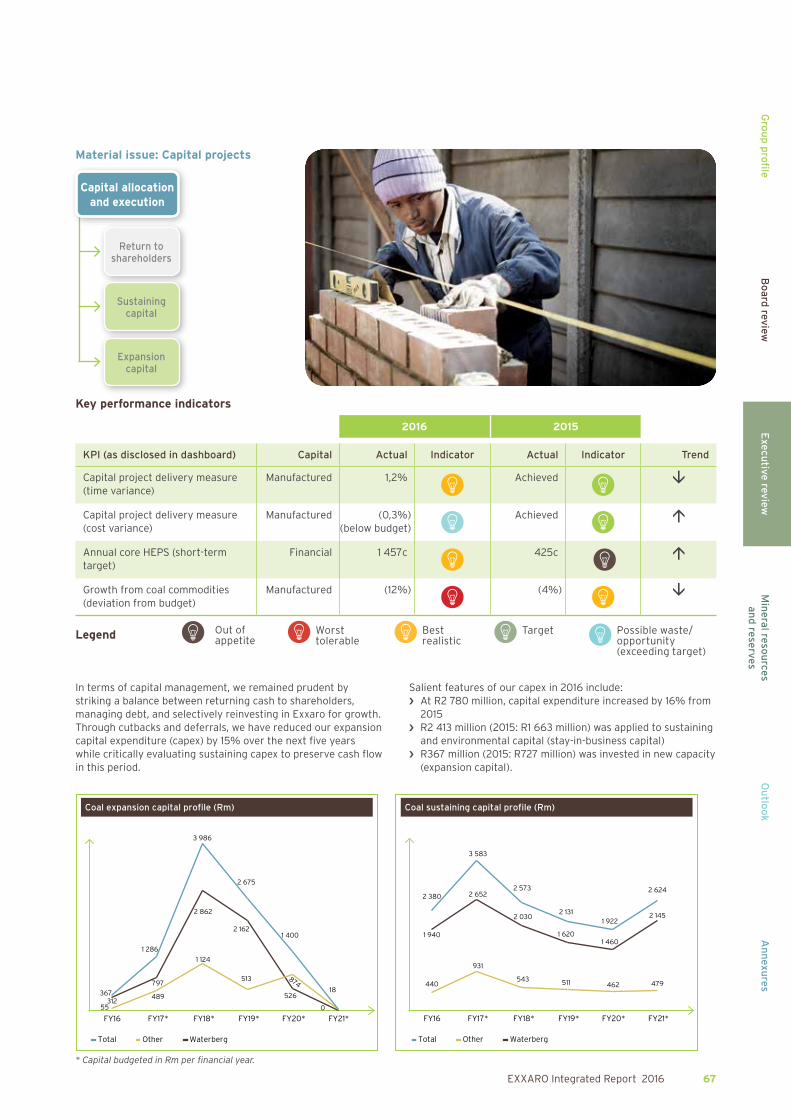
Material issue: Capital projects
Return to shareholders
Sustaining capital
Expansion capital
Capital allocation and execution
Key performance indicators
2016 2015
KPI (as disclosed in dashboard) Capital Actual Indicator Actual Indicator Trend
Capital project delivery measure (time variance)
Manufactured 1,2% Achieved
Capital project delivery measure (cost variance)
Manufactured (0,3%)(below budget)
Achieved
Annual core HEPS (short-term target)
Financial 1 457c 425c
Growth from coal commodities (deviation from budget)
Manufactured (12%) (4%)
In terms of capital management, we remained prudent by striking a balance between returning cash to shareholders, managing debt, and selectively reinvesting in Exxaro for growth. Through cutbacks and deferrals, we have reduced our expansion capital expenditure (capex) by 15% over the next five years while critically evaluating sustaining capex to preserve cash flow in this period.
Salient features of our capex in 2016 include:›› At R2 780 million, capital expenditure increased by 16% from
2015 ›› R2 413 million (2015: R1 663 million) was applied to sustaining
and environmental capital (stay-in-business capital) ›› R367 million (2015: R727 million) was invested in new capacity
(expansion capital).
Coal expansion capital profile (Rm)
31255
367
1 286
797
489
3 986
2 162
513
2 862
1 124
2 675
874
526
1 400
0
18
Total
FY21*FY20*FY19*FY18*FY17*FY16
Other Waterberg
1 940
440
2 380
3 583
2 652
931
2 573
511
1 620
2 030
543
2 131
462
1 922
1 460
2 624
2 145
479
FY21*FY20*FY19*FY18*FY17*FY16
Total Other Waterberg
Coal sustaining capital profile (Rm)
* Capital budgeted in Rm per financial year.
Possible waste/ opportunity (exceeding target)
Target Best realistic Worst
tolerable Out of appetiteLegend

68 EXXARO Integrated Report 2016
Capital allocation Expansion capitalIn 2016, we applied a rigorous optimisation process to reduce capital expenditure on certain large projects in their final study phases:›› Thabametsi phase 1›› Belfast›› Leeuwpan life extension project.
We realised a start-up capital saving of R1,4 billion (11%) from a combined base estimate of R13 billion, with further potential savings of 15% still under investigation for possible inclusion.
Sustaining capitalBy prudently allocating sustaining capital, we ensure the future profitability of our assets. At the same time, we understand the importance of allocating sufficient capital now to ensure business as usual. We have therefore concentrated on optimising our sustaining capital spend.
EXECUTIVE REVIEW (CONTINUED)
In 2016, we reviewed and reduced start-up capital for the Grootegeluk multi-product rail load-out station in line with our strategy of optimising large projects in their final study phases. The optimisation process on sustaining capital will continue in 2017.
Executing capital projectsAs part of the Exxaro improvement project, we revised our operating model for developing and implementing capital projects. We adopted a hybrid model with internal teams and external resources for project management functions to improve the efficiency of execution.
Capital projects follow due governance as per Exxaro’s delegation of authority on capital expenditure. Project steering committees monitor delivery against time, budget and desired performance parameters. Projects undergo a rigorous assurance process, including technical and financial reviews, as well as external audits to ensure governance standards are met.
Project summary
Project and life-of-mine (LOM) Product Capex
Status: 31 December 2016Outlook: 2017 to 2021
Mpumalanga BelfastLOM: 16 years 2,7Mtpa of thermal coal R3,2
billion
›› Rezoning appeal delaying construction›› Construction expected to start 3Q 2017›› First production expected 4Q 2019
Mafube Nooitgedacht (JV with Anglo American)LOM: 12 years
3,1Mtpa of thermal coal R1,9 billion
›› Implementation phase›› Investment decision approved 4Q 2016›› Construction under way with expected
completion 2Q 2018
Leeuwpan life extension LOM: 7 years
2,7Mtpa of thermal coal R0,5 billion
›› Implementation phase – construction expected to start 3Q 2017
›› Completion and handover expected 2Q 2018
Matla expansion LOM: 26 years*
Infrastructure to support LOM production
R3,4 billion
›› Matla mine 1 relocation – implementation subject to Eskom notice to proceed, completion expected 4Q 2019
›› Matla shortwall replacement – bankable feasibility study under way, completion expected 1Q 2020
›› Matla interseam – bankable feasibility study phase with completion expected 1Q 2019
›› Matla ventilation shaft – prefeasibility study under way, completion expected 1Q 2020
All projects await Eskom funding approval
Limpopo Grootegeluk 6 phase 2LOM: 30 years*
2,7Mtpa semi-soft coking coal
R4,8 billion
›› Investment decision 1Q 2017›› Construction expected to start 3Q 2017,
first production 4Q FY20
Grootegeluk discard inpit backfill phase 2LOM: 30 years*
Infrastructure to support upper discard handling system
R0,6 billion
›› Construction under way, with project completion and handover expected 4Q 2017
Grootegeluk rapid load-out stationLOM: 30 years*
Infrastructure to replace old D8 load-out station and enable GG10/GG6 phase 2 product to be railed
R1,3 billion
›› Construction under way›› First production 1Q 2019
Thabametsi independent power producer (IPP) phase 1 LOM: 30 years*
3,9Mtpa thermal coal ramping up to supply 600MW Thabametsi IPP power station (notice to proceed granted)
R2,8 billion
›› Implementation of phase 1 (selected as preferred bidder 4Q 2016)
›› Construction expected to start 2Q 2017 with first production FY20
›› Notice to proceed for full construction expected 4Q 2017 from Department of Energy
* Life-of-mine exceeds expiry of mining right.
EXXARO Integrated Report 2016 69
Gro
up
pro
file
Exe
cutive
reviewO
utlo
ok
Bo
ard review
Min
eral reso
urces
and
reserves
An
nexu
res
Growth projectsLeeuwpan life-of-mine optimisation project With implementation approved in September 2016, detail design is being reviewed and finalised. Construction will begin once the environmental management plan report and required approvals for the R50 road relocation have been obtained. These approvals are expected in the first quarter of 2017.
Belfast project The project’s rezoning application was approved in July 2016, but appealed in August 2016. The High Court has ruled that the district municipality has jurisdiction to decide on rezoning. The target date for all licences to be authorised remains June 2017, after which construction activities are scheduled to start.
Mafube life extension project The shareholders’ investment decision to implement this R1,9bn project was made, with final approval given by Exxaro in November 2016. The project has all the required licences and procurement agreements on surface rights for the 17 Nooitgedacht farms have been finalised. Construction has started, with completion expected in mid-2018.
Thabametsi mineIn October 2016, the project received preferred-bidder status and the team working towards financial closure. The financial close on the related Thabametsi IPP power station is expected in the second half of 2017. The environmental authorisation for this power station has been appealed, and Exxaro is monitoring the progress of this legal procedure.
Grootegeluk phase 2Detail design is progressing on schedule and should be complete by end-March 2017. An updated bankable feasibility study was presented to the Exxaro investment review committee and the board in 2017, along with updated information on Transnet Freight Rail negotiations. This was approved.
Sustaining projectsGrootegeluk discard in-pit project The upper-system backfill phase 2 is proceeding against plan and on budget. All construction will be completed in 2017, after which commissioning will begin.
Grootegeluk new rail load-out stationDetail design for the rail siding (rail loop area) is complete. After the early-works construction contract was awarded in November 2016, site clearance has started.
Eskom-funded Matla life-of-mine projectsFour interrelated projects are in different study phases:›› Mine 1 relocation awaits final Eskom funding approval and
government approval, which are expected in the second quarter of 2017
›› Bankable feasibility study for the shortwall replacement project will be presented to Eskom in March 2017
›› The north-west access project is under review at Eskom’s request and will be re-presented to the utility in June 2017
›› The ventilation shaft project is in concept level and will be presented to Eskom in March 2017.
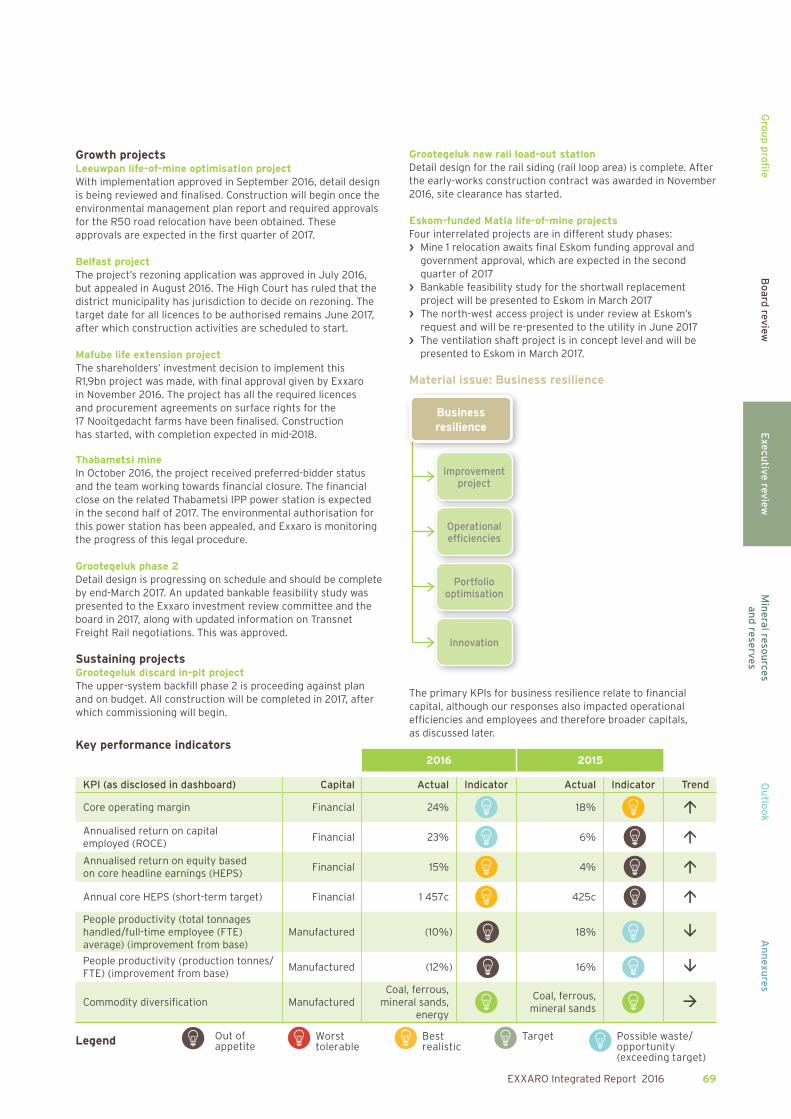
Material issue: Business resilience
Improvement project
Operational efficiencies
Portfolio optimisation
Innovation
Business resilience
The primary KPIs for business resilience relate to financial capital, although our responses also impacted operational efficiencies and employees and therefore broader capitals, as discussed later.
Key performance indicators2016 2015
KPI (as disclosed in dashboard) Capital Actual Indicator Actual Indicator Trend
Core operating margin Financial 24% 18%
Annualised return on capital employed (ROCE)
Financial 23% 6%
Annualised return on equity based on core headline earnings (HEPS)
Financial 15% 4%
Annual core HEPS (short-term target) Financial 1 457c 425c
People productivity (total tonnages handled/full-time employee (FTE) average) (improvement from base)
Manufactured (10%)
18%
People productivity (production tonnes/FTE) (improvement from base)
Manufactured (12%)
16%
Commodity diversification ManufacturedCoal, ferrous,
mineral sands, energy
Coal, ferrous, mineral sands
Possible waste/ opportunity (exceeding target)
Target Best realistic Worst
tolerable Out of appetiteLegend

70 EXXARO Integrated Report 2016
EXECUTIVE REVIEW (CONTINUED)
Operating performanceExxaro reached an unprecedented milestone on 31 December 2016 after two consecutive calendar years without a fatality. By 31 December 2016, we had operated for a record 30 consecutive months without a fatality, and improved our LTIFR by 47% to 0,09 (2015: 0,17).
The group delivered a very strong performance for 2016. Consolidated group revenue increased by 14% to R20 897 million, while group net operating profit rose 64% to R5 200 million (2015: R3 173 million) mainly due to higher coal sales prices and the 15% depreciation of the rand against the US dollar. Other factors contributing to increased net operating profit included:›› Higher contributions from our coal operations (page 10)›› Non-recurring 2015 impairments of R1 749 million for goodwill
and property, plant and equipment ›› R670 million gain on disposal of the Mayoko iron ore project
and related subsidiaries, with subsequent cost savings in our ferrous segment.
RevenueNet operating profit/(loss)
2016 2015 2016 2015
Coal 20 673 18 093 5 166 2 574– Tied1 3 483 3 835 226 195– Commercial2 17 190 14 258 4 940 2 379
Ferrous 170 173 566 (306)– Iron ore3 613 (292)– Alloys4 170 173 (75) 10– Other 28 (24)
Other5 54 64 (532) 905
Total 20 897 18 330 5 200 3 1731 Mines managed on behalf of and supplying their entire production to Eskom in terms of contractual agreements.
2 Net operating profit for 2015 includes pre-tax impairment of the goodwill recognised on the acquisition of ECC of R1 524 million and the reductants operation property, plant and equipment of R225 million.
3 Net operating profit for 2016 includes R670 million pre-tax gain on the disposal of the Mayoko iron ore project and related subsidiaries.
4 Net operating loss for 2016 include the FerroAlloys property, plant and equipment pre-tax impairment of R100 million.
5 Net operating loss for 2016 includes R445 million fair value adjustment of contingent consideration which relates to the ECC acquisition.
Following the Exxaro improvement project, we achieved sustainable cost savings of R235 million in the review period.
Earnings, including our equity-accounted investments in associates and joint ventures, totalled R5 679 million (2015: R296 million) or 1 600 cents per share (2015: 83 cents per share).
Equity-accounted income/(loss)
Dividends received
2016 2015 2016 2015 SIOC1 2 416 104 673Tronox (384) (1 503) 298 668Mafube 238 253 450Black Mountain 100 64Cennergi 3 (53)RBCT2 (4)SDCT 2
Total 2 373 (1 137) 748 1 341
Income from equity-accounted investments increased substantially to end 2016 at R2 373 million (2015: loss of R1 137 million). This was mainly due to an improved performance from SIOC (up R2 312 million) on a recovery in iron ore export selling prices, and lower losses from our investment in Tronox (decrease in losses of R1 119 million). Our energy joint venture, Cennergi, recorded equity-accounted income of R3 million for 2016 (2015: loss of R53 million) after its two wind-farm projects, Amakhala Emoyeni and Tsitsikamma Community wind farm, were brought into commercial operation in the third quarter and started earning revenue from electricity supplied to the national grid.
›› Cash flow from operations rose to R5 549 million (2015: R4 526 million), sufficient to cover capital expenditure of R2 780 million (page 10), dividends of R625 million, net financing charges of R459 million and tax of R547 million.
Summarised group statement of cash flows (Rm)
2016Rm
2015Rm
Cash flows from operating activities 3 918 3 011 Cash generated by operations 5 549 4 526 Interest paid (595) (500)Interest received 136 54 Tax paid (547) (85)Dividends paid (625) (984)Cash flows from investing activities (2 198) (5 130)Property, plant and equipment to maintain operations (2 413) (1 663)Property, plant and equipment to expand operations (367) (727)Increase in investment in intangible assets (34)Proceeds from disposal of property, plant and equipment 35 198 Increase in investments in other non-current assets (160) (106)Increase in loans to related parties (400)Proceeds from disposal of operation 47 70 Proceeds from disposal of joint venture 200 Increase in investment in associate (233)Increase in investment in joint venture (55) (374)Income from investments in associates and joint ventures 748 1 341 Acquisition of subsidiaries (3 436)Dividend income from financial assets 1 Cash flows from financing activities 1 483 2 000 Interest-bearing borrowings raised 7 565 4 320 Interest-bearing borrowings repaid (6 066) (2 320)Shares acquired in market to settle share-based payments (16)
Net increase/(decrease) in cash and cash equivalents 3 203 (119)

EXXARO Integrated Report 2016 71
Gro
up
pro
file
Exe
cutive
reviewO
utlo
ok
Bo
ard review
Min
eral reso
urces
and
reserves
An
nexu
res
Prudent net debt position (R million)
3 012 (5 549)
459
547
625
2 780 166 (748)
30 1 322
Dec 2015
Cash generated
Net financing
costs
Tax Divdends paid
Capex Investing activities
Dividends received
Other Dec 2016
Net debt at 31 December 2016 was R1 322 million, compared to R3 012 million at 31 December 2015. This equates to a net debt:equity ratio of 3,8% (2015: 8,8%). Our capital structure remains robust and we successfully refinanced our R8 billion term loan facility at attractive terms, despite Standard & Poor’s downgrading our domestic credit rating to zaBB+/zaB.
Headline earnings were 185% higher at R4 621 million (2015: R1 623 million) or 1 302 cents per share (2015: 457 cents per share).
Exxaro improvement projectThe 2016 improvement project focused on optimising support services across the business and reviewing our business model. From initial estimates of almost 600 retrenchments, we were able to contain that to under 100 and maintain relationships with affected and relevant stakeholders.
Operational efficienciesIn 2016, we continued our drive for operational excellence throughout the coal business. This process is focused on continually improving the business in a structured programme that focuses on:›› Increasing mine throughput ›› Decreasing total cost ›› Improving overall efficiencies.
As a result, our coal business has decreased the average unit cash cost annually and kept unavoidable increases below the targeted inflation line.
31 December 2015 versus 31 December 2016 unit cash cost movement (%)
(22,9)
(0,9)
0,6
8,0
(13,6)
(5,9)
ECC NBC Matla
Inflation PPI at 6,7 %
GG Mafube 50% LPN
* The Grootegeluk increase for 2016 reflects the focus on in-pit coal liberation to facilitate the ramp-up of the business unit for 2017.
In the latter part of 2016, we initiated our drive towards digitisation and innovation by developing roadmaps for each business unit. These roadmaps will be completed in the current year, aimed at harnessing disruptive technologies and their subsequent improvement opportunities.
Portfolio optimisationIn 2016, our portfolio optimisation philosophy considered long-term commodity forecasts, as well as strategic and financial rationales and mega trends that affect the current portfolio. To achieve our objectives:›› We divested from the Inyanda coal mine›› In focusing more attention on our planned mega projects,
we divested from the Kranspan, Vaalbult and Arnot South prospecting rights
›› We closed the AlloyStream technology project›› We sold the Mayoko iron ore project in the Republic of Congo.
We made further progress in our portfolio optimisation by:›› Advancing the feasibility studies of our Belfast project›› The Thabametsi phase I project was approved for
implementation after we negotiated offtake agreements, as well as the successful bid by the Thabametsi IPP (independent power producer)
›› We have optimised Leeuwpan through a life-of-mine extension project which is now being implemented
›› In our energy portfolio, Cennergi has begun commercial operations for its two wind projects which are now supplying to the national grid
›› Aligning our mine plans to maintain a healthy balance between the export product market and local supply to mitigate against commodity cycles and dependency on the power station coal market.
In our pursuit of creating more value and product diversification, we have considered downstream processing on reductants and market coke products. With feasibility studies on our market coke project completed, implementation depends on changes in current market conditions. Looking forward, we will continue to evaluate and optimise our current portfolio, while focusing on robust new opportunities within our approved commodity strategy.

72 EXXARO Integrated Report 2016
SIOC shareholding: We will keep monitoring the global outlook, particularly iron ore commodity prices, and will be considering the future of this investment in the context of Anglo American plc’s intention to dispose of its controlling interest in KIO.
Tronox continued its dividend declaration in 2016, but at a rate of US$0,25 per share for the first quarter, and US$0,045 per share for the rest of the year. Exxaro’s board has determined that it will explore available alternatives to sell its Tronox shares in a thoughtful, efficient and staged process to focus on its core activities.
InnovationInnovation is imperative in a competitive, global industry facing multiple challenges. The successful mining companies of the future will be characterised by their flexibility in anticipating and meeting demand cost effectively, safely and profitably. Exxaro is pursuing innovation both in mining and beyond to drive diversification and growth.
As part of our drive for innovation and renewal, in 2016, we began a process to assist the organisation to review and possibly change the way it sees the future. Through an intensive process of understanding how fast and in which direction the world is changing, it became apparent that the future could lead to Exxaro creating fundamentally new businesses, beyond the space of mining.
In this context, the fields of energy, agriculture and water were identified as new areas for Exxaro to investigate and potentially monetise opportunities by creating new initiatives and businesses. The company is also exploring opportunities that support rapid growth in this future world, specifically business mechanisms aligned to exponential and innovative business models in the three broad potential sector themes.
The objective of the business-of-tomorrow programme in Exxaro is twofold: meet growth targets, and make a meaningful impact on both South African and African societies and economies. At a global level, the recurring nexus of energy-agriculture-water is continuously recognised as a key global societal, economic and environmental challenge of the future that needs to be urgently addressed.
All three sectors and their nexus support Exxaro’s commercial and social impact objectives. All have an affinity to our current business and capabilities, particularly energy and water which are both key components of mining operations:›› The energy and mining sectors are interdependent – the
mining sector supplies coal, oil, uranium and biomass to power producers for electricity generation; and the mining sector requires energy to operate mines
›› Water is a challenge for mining operations and after mine life; particularly acid mine drainage which contaminates soil and water supplies. The flow of acid mine drainage into South Africa’s surface and groundwater systems is degrading the quality of these systems, poisoning crops, endangering human health, and damaging wildlife, eco-systems and infrastructure
›› Mining and agriculture can overlap in several ways, including the use of mining land for agricultural purposes, mining communities’ involvement in agricultural activities and using mining output in agricultural products such as fertiliser.
Existing Exxaro capabilities, assets and business needs can be leveraged as starting points. By entering into opportunities in the energy, water and agricultural sectors, Exxaro will not only address core business challenges and optimise the use of its existing assets, it will also provide an opportunity for the group to fulfil certain elements of its social mandate and provide sustainable development for communities in which it operates.
Controlling the risksTo ensure we remain resilient for the foreseeable future, we need to address the cost competitiveness of our products and consider how best (for aspects we control) to respond to commodity price volatility.
Coal (also refer dependency on Eskom page 59) In the fourth quarter of 2016, the international coal price surged as China reduced production after the 276-day cap on production, with prices more than doubling from January 2016 index levels. We also recorded good international demand. Export volumes rose from 6,18Mt to 7,86Mt, mainly due to additional volumes from ECC but offset by the sale of Inyanda. Exxaro realised an average export price of US$50 per tonne in both 2016 and 2015.
Trading conditions in the domestic market improved in the second half as some producers found the export market more attractive given strong international thermal coal prices towards year-end. We recorded strong demand for our products in the domestic power-generation, steam coal, metals and reductants segments.
Total coal production (excluding buy-ins) was 160kt lower than 2015, mainly due to the sale of Inyanda and closure of Arnot. This was offset by 12 months of ECC production compared to four months in 2015. Sales increased by 300kt (1%).
All coal business units (except Grootegeluk) achieved significant cost savings, below inflation year on year. Higher costs at Grootegeluk reflect lower offtake from Eskom and lower addendum 9 tonnages.
Coal cash cost (Rm indexed)
100
,0
5,8 6
,4
98
,6
(1,3
)
(1,8
)
(10
,5)
2015 Inflation Variablevolume
Variable cost
Fixed cost Arnot/Inyanda
2016
EXECUTIVE REVIEW (CONTINUED)

EXXARO Integrated Report 2016 73
Gro
up
pro
file
Exe
cutive
reviewO
utlo
ok
Bo
ard review
Min
eral reso
urces
and
reserves
An
nexu
res
Grootegeluk cash cost (Rm indexed)
100
,0
6,2
103
,9
(1,8
)
(0,4
)
(0,1)
2015 Inflation Variablevolume
Variable cost
Fixed cost 2016
Metallurgical coalGrootegeluk production rose 129kt (7%) but off a lower base as semi-soft coking coal production was cut back in 2015 to produce power station coal, given low stocks in the second half of that year. Sales decreased by 43kt (3%) on lower offtake from local customers.
Thermal coalPower station coal production from our tied mines was 1 360kt (15%) lower than 2015, after Eskom terminated the contract with Arnot at the end of 2015.
Power station coal production from our commercial mines was down 396kt (2%). Volumes from Grootegeluk declined 894kt (4%) on production cut-backs due to Eskom’s full stockpiles in the first half and lower offtake from the utility. North Block Complex production was down 186kt (7%) due to industrial action and relocation of a plant for safety reasons. This was offset by higher production at Mafube of 625kt (100%).
Domestic power station coal sales from our commercial mines was 2 078kt (9%) lower as Leeuwpan’s coal is no longer being delivered to Eskom and lower demand under addendum 9 to the Medupi coal-supply agreement.
Export power station coal sales rose 1 034kt (142%) after Eskom contracts ceased at Leeuwpan and Mafube, and coal was redirected to the export market.
Steam coal production was 1 467kt (23%) higher after including ECC (2 539kt) for the full year and higher production at North Block Complex of 173kt (100%) as the Eerstelingsfontein reserve was mined for the full year. This was partly offset by no production at Inyanda (2015: 1 035kt). Grootegeluk production was down 127kt (8%), mainly due to full stockpiles.
Domestic steam sales increased by 2 122kt (82%) mainly from Leeuwpan after the Eskom agreement ceased and product was redirected to the domestic market (1 335kt). Higher sales also
reflect the inclusion of ECC sales of 402kt for the full year and increased demand at North Block Complex and Grootegeluk, partly offset by lower Inyanda sales of 111kt. Steam coal export sales were 642kt (12%) higher, mainly from ECC and offset by the Inyanda closure.
Coal core revenue, net operating profit and operating margin (Rm)
2015 2016
■ Revenue ■ NOP
18 093
4 296
20 673
4 918
24% margin
24% margin
Total coal production (Mt)
2012 2013 2014 2015 2016 2017* 2018*
■ Commercial ■ Tied ■ Buy-ins
27,8 27,9 28,5
33,7 34,9
41,2
8,58,1
39,2
0,6
9,3 7,9
1,2
-2%
12,0
0,9
12,0
0,3
13,3
* Based on latest internal forecast.
Ferrous Net operating profit swung to R566 million in 2016 from a R306 million loss in 2015. This mainly reflects a R670 million gain on disposing of the Mayoko iron ore project and related subsidiaries, offset by a R100 million pre-tax impairment of the ferrosilicon plant at FerroAlloys. The decision to impair the ferrosilicon plant was based on lower demand from major customers as well as our current view on securing new contracts in future.
The increase in equity-accounted income from SIOC reflects the increase in export iron ore prices in 2016. No dividends were received from SIOC in 2016 (2015: R673 million).
74 EXXARO Integrated Report 2016
Titanium dioxide (TiO2) and alkali chemicals
Equity-accounted losses from the Tronox investment decreased from R1 503 million in 2015 to R384 million for 2016.
This was mainly due to the tax benefits of organisational restructuring in the latter part of the year, lower restructuring costs as well as net realisable value adjustments on inventory which were released through profit or loss. Exxaro received total dividends of R298 million from Tronox in 2016 (2015: R668 million).
In February 2017, Tronox entered into a definitive agreement to acquire the TiO
2 business of Cristal (also known as The National
Titanium Dioxide Company Limited) for US$1 673 million cash and shares, representing a 24% shareholding in the enlarged company. As Tronox’s largest shareholder, Exxaro intends to vote its shares in favour of the proposed transaction.
EXECUTIVE REVIEW (CONTINUED)
Our board has determined that it will explore available alternatives to sell Tronox shares in a thoughtful, efficient and staged process over time to focus on Exxaro’s core activities.
Material issue: Our people
Employees
Communities
Our people
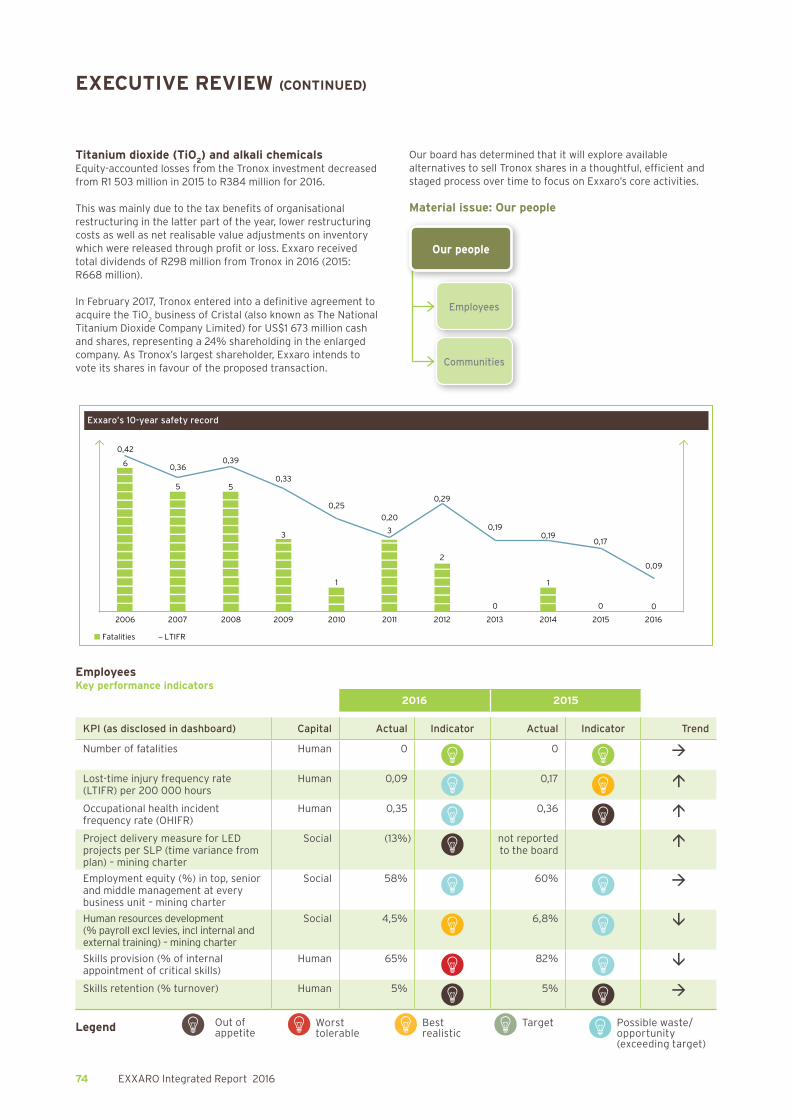
Exxaro’s 10-year safety record
0,42
6 0,36
5
0,39
50,33
3
0,25
1
0,20
0,29
2
0
0,19
1
0,17
0 0
2006 2007 2008 2009 2010 2011 2012 2013 2014 2015 2016
3
■ Fatalities LTIFR
0,19
0,09
EmployeesKey performance indicators
2016 2015
KPI (as disclosed in dashboard) Capital Actual Indicator Actual Indicator Trend
Number of fatalities Human 0 0
Lost-time injury frequency rate (LTIFR) per 200 000 hours
Human 0,09 0,17
Occupational health incident frequency rate (OHIFR)
Human 0,35 0,36
Project delivery measure for LED projects per SLP (time variance from plan) – mining charter
Social (13%) not reported to the board
Employment equity (%) in top, senior and middle management at every business unit – mining charter
Social 58% 60%
Human resources development (% payroll excl levies, incl internal and external training) – mining charter
Social 4,5% 6,8%
Skills provision (% of internal appointment of critical skills)
Human 65% 82%
Skills retention (% turnover) Human 5% 5%
Possible waste/ opportunity (exceeding target)
Target Best realistic Worst
tolerable Out of appetiteLegend
EXXARO Integrated Report 2016 75
Gro
up
pro
file
Exe
cutive
reviewO
utlo
ok
Bo
ard review
Min
eral reso
urces
and
reserves
An
nexu
res
SafetyThe safety of our people is fundamental to our business, and we will not rest until we consistently achieve our safety goals through collective responsibility, commitment and ongoing focus. As part of this focus, all operational business units have international health and safety accreditation (OHSAS 18001).
We have made steady progress over the past 10 years (see graph on page 74), proving that our target of zero harm is attainable.
By December 2016, Exxaro had recorded another outstanding performance by operating for over 30 months without a mining-related fatality. This is proof that our target of zero fatalities is attainable and no death is acceptable.
As noted by the SRC committee, a material achievement in 2016 was our lowest LTIFR of 0,09. This is a 47% improvement on the LTIFR reported for 2015 and significantly below the peak of 0,42 in 2006 (79% improvement). In the same 10-year period, fatalities have decreased from six in 2006 to zero in 2015 and 2016.
We recorded 16 LTIs against an aspiration of zero harm. The most common incidents were leg and ankle injuries followed by hand injuries. The highest number of LTIs were recorded at Matla, Grootegeluk and Arnot.
We have focused programmes to empower safety, health and environmental representatives with the knowledge to identify risks better and contribute more effectively to reducing safety risks in the workplace.
In 2016, five section 54 directives were issued by the DMR at Arnot, Grootegeluk and Matla for identified non-compliance. One section 54 directive was issued by the DMR for Grootegeluk. We have maintained a positive trend since 2010 in reducing directives, reflecting the benefit of an internal section 55 inspectorate programme at all business units, authorising appointed employees to stop unsafe activities and, in time, prevent accidents.
In engaging with employees on safety, we focused on visible felt leadership (VFL), hazard identification, and response training and leadership empowerment in the workplace. The early benefits of more stringent safety practices are evident in fewer section 54 directives (safety stoppages) issued by the DMR.
HealthFourteen occupational diseases cases were accepted and 52 cases reported in 2016 (excluding ECC), bringing occupational health incident frequency rate (OHIFR) to 0,35 against target of 0,34.
Given the importance of the health and wellness of our employees and contractors, we introduced the occupational health incident frequency rate (OHIFR) two years ago and we are driving awareness to improve the health of all our people.
A key focus in future will be lifestyle diseases, which are proving a significant health risk for Exxaro.
Labour stabilityLabour stability is one of the mining industry’s key challenges. Despite the often-volatile nature of our industry, we are maintaining a stable labour climate across Exxaro, always aiming for crucial interactions with organised labour that are constructive and indicative of improving relationships. These positive union relationships are sustained through functioning engagement structures and constructive processes to resolve issues. Apart from engaging with our labour stakeholders, we also continuously engage with our entire workforce.
Key indicators for labour stability reflect that we were not exposed to any unprotected work stoppages in 2016 and our external dispute-resolution referral rate improved by 33%.
The advent of multiple unions as opposed to traditional mining unions has changed the collective-bargaining environment significantly over recent years. Managing inter-union rivalry within these forums is a key success factor in maintaining labour stability. As a company, we have successfully adopted a pluralist approach to union recognition, and through appropriate governance, we have enjoyed labour stability.
Employment equityOur efforts to transform our organisation remain vigorous. Since Exxaro’s inception 10 years ago, developing skills levels across the business has been the cornerstone of successfully implementing our employment equity plans.

76 EXXARO Integrated Report 2016
We submitted our statutory annual reports for the last reporting cycle. Although we have achieved our targets at the senior and middle management levels, our challenge remains with junior management and people with disabilities.
Exxaro’s women-in-mining focus is a key enabler for women to enter careers in our industry. Women currently comprise 20% of the workforce, and we focus on attracting women through our talent pipelines. While this is a challenge, women now constitute 28% of young professionals-in-training, 34% of our full-time bursars in engineering and mining at universities, as well as 27% in learnership programmes across the group.
CommunitiesWe have seen a growing trend of community-based protests affecting our employees directly through a physical inability to get to work but also often manifesting through interactions with labour as an expectation that mining companies must fill the void caused by a lack of service delivery. As a mining company, balancing the strategic imperative for higher employee productivity with increasing demands from unions and communities for fair wages and benefits can place strain on labour stability.
We began implementing a revised approach to enterprise and supplier development in 2016, focused on establishing entrepreneurs who will be able to create employment and opportunities for themselves and their wider network in the communities.
Organisational restructuringIn consultation with our labour stakeholders, we concluded a number of section 189 closure processes (retrenchments) across the group in 2016, including Exxaro Coal Central, Arnot and, more recently, the Exxaro improvement project (EIP) that focused on support services across the business.
Although these processes are challenging, our relationships with all stakeholders was a key factor in their successful outcome. Understanding the emotional impact of organisational restructuring, we provided dedicated employee assistance services throughout all section 189 processes. We have in all instances redeployed as many affected employees as possible.
Skills development Given the importance of skills in our industry, we endeavour to invest an appropriate amount of total salaries and wages each year in developing our people.
Training
184
■ Training spend (Rm) ■ Percentage of payroll (%)
2015 2016
178
5,46
In 2016, we spent R178 million on training, or 5,4% of payroll (2015: R184 million or 6,0%):›› R90 million was for job-related operational and technical
training at business units, including operator training and mobile equipment licences. This amounts to 148 500 training sessions using our e-learning platform, classroom and practical on-the-job training to satisfy mainly core training needs directly linked to operations, as well as the requirements of the Mine Health and Safety Act (MHSA). This includes training contractors as required by the MHSA, as well as section 101 of the Mineral and Petroleum Resources Development Act (MPRDA)
›› R84 million was spent on talent pipelines comprising bursaries, internships, learnerships and skills programmes based on our need for core and key skills. Viewed from the perspective of outcomes, we look at key areas across the skills value chain to determine which actions will ensure the right skills are available at the right time. R46 million of this amount is spent on artisans/miners per year
›› R3,7 million was on developing targeted employees in management development programmes, leadership development, postgraduate studies and support-function development.
Talent managementTo meet our current and future skills requirements, we invest in our existing employees, future employees, and in the communities that provide our labour. At present, 99% of Exxaro’s labour is sourced in South Africa and, at any operation, over 70% is sourced from host communities. Our education, bursar and skills development initiatives are geared to empower local communities to compete for positions in the company.
Graduate programmeOur three-year professionals-in-training programme blends academic theory with the work environment. Each graduate has a mentor who supervises exposure to various operational, leadership and management training on the job. Mentors also assist with fulfilling registration requirements for relevant governing bodies and professional associations. In 2016, there were 51 professionals-in-training (2015: 64) throughout Exxaro in a R18,3 million programme. Of these interns, 40% are women and 64% are black, and over 90% were placed throughout the group.
Bursary programmeThere are currently 61 bursars studying at South African institutions at a cost of R6,6 million per annum. Over two-thirds are black South Africans and 36% are women.
As part of the Exxaro people development initiative, we granted eight bursaries in 2016 to school leavers interested in technical disciplines such as engineering (metallurgical, chemical, mechanical, electrical, industrial, mining or civil), mine surveying and geology. Candidates must be grade 12 students from Exxaro communities who want to study for a technical degree or diploma.
EXECUTIVE REVIEW (CONTINUED)