table of contents - exxaro.com · exxaro 2015 consolidated mineral resources and ore reserves...
TRANSCRIPT

Exxaro 2015 consolidated mineral resources and ore reserves report aro 2015 consolidated mineral resources and ore reserves report
0
2015 CONSOLIDATED MINERAL RESOURCES AND ORE RESERVES REPORT (CMRR)

Exxaro 2015 consolidated mineral resources and ore reserves report
1
TABLE OF CONTENTS TABLE OF CONTENTS ......................................................................................................................... 1 TABLE OF FIGURES ............................................................................................................................. 2 LIST OF TABLES .................................................................................................................................. 3 1 FOREWORD ................................................................................................................................ 4 2 INTRODUCTION .......................................................................................................................... 5 3 TENURE ..................................................................................................................................... 12 4 GOVERNANCE .......................................................................................................................... 15 5 COMPETENT PERSONS .......................................................................................................... 16 6 RISK, LIABILITY AND ASSURANCE ....................................................................................... 17 7 GROUP SUMMARY OF RESOURCE AND RESERVE ESTIMATES ....................................... 18 8 ATTRIBUTABLE RESOURCES ................................................................................................ 42 9 ESTIMATION METHODOLOGY SUMMARY ............................................................................ 43
9.1 Mineral resources ............................................................................................................. 43 9.2 Ore reserves .................................................................................................................... 44
10 ANCILLARY RESOURCE AND RESERVE INFORMATION BY OPERATION ........................ 47 10.1 Arnot coal mine ................................................................................................................ 47 10.2 Belfast project .................................................................................................................. 49 10.3 Grootegeluk coal mine ..................................................................................................... 53 10.4 Thabametsi project ........................................................................................................... 56 10.5 Dorstfontein complex ....................................................................................................... 60 10.6 Forzando .......................................................................................................................... 64 10.7 Matla coal mine ................................................................................................................ 67 10.8 Leeuwpan coal mine ........................................................................................................ 70 10.9 North Block Complex ....................................................................................................... 75 10.10 Eloff project ...................................................................................................................... 77 10.11 Tumelo ............................................................................................................................. 80 10.12 Zonderwater project ......................................................................................................... 82 10.13 Mayoko Iron Ore project ................................................................................................... 84
11 EXPLORATION ......................................................................................................................... 88 12 ENDORSEMENT ....................................................................................................................... 90

Exxaro 2015 consolidated mineral resources and ore reserves report
2
Table of figures Figure 1: Exxaro attributable coal resources and reserves .................................................................... 7 Figure 2: Distribution of Exxaro attributable measured and indicated coal resources ............................ 8 Figure 3: Advanced technology at Grootegeluk mine, in-pit crusher (left) and cyclic ponds (right) ........ 8 Figure 4: Exxaro mining and prospecting rights in the Waterberg .......................................................... 9 Figure 5: Locality map for Exxaro resources and reserves .................................................................. 11 Figure 6: Locality map for ECC mining and prospecting rights ............................................................ 14 Figure 7: Arnot mine ............................................................................................................................. 47 Figure 8: Typical north-south (B-Bˈ) section through Arnot geological model (10x vertical exaggeration) ........................................................................................................................................ 48 Figure 9: Belfast project ........................................................................................................................ 50 Figure 10: West-east cross section through the 2012 geological model (10x vertical exaggeration) ... 51 Figure 11: Grootegeluk mine ................................................................................................................ 53 Figure 12: Typical west-east section through Grootegeluk geological model ...................................... 56 Figure 13: Thabametsi project .............................................................................................................. 57 Figure 14: Cross section through 2015 Thabametsi geological model (10 x vertical exaggeration) .... 59 Figure 15: Dorstfontein complex ........................................................................................................... 61 Figure 16: NW-SE section through DCMW (10x vertical exaggeration) ............................................... 63 Figure 17: Forzando complex ............................................................................................................... 64 Figure 18: Matla Mine ........................................................................................................................... 68 Figure 19: Typical north-south section through Matla geological model (10x vertical exaggeration) ... 69 Figure 20: Leeuwpan coal mine ........................................................................................................... 71 Figure 21: Typical cross section through Leeuwpan geological model (Moabsvelden) ....................... 73 Figure 22: NBC locality map with mine and project areas .................................................................... 75 Figure 23: Eloff project ......................................................................................................................... 78 Figure 24: Seam sequence and splitting at Eloff .................................................................................. 79 Figure 25: Typical north-south cross section through Eloff (10x vertical exaggeration) ....................... 80 Figure 26: Tumelo locality map ............................................................................................................ 81 Figure 27: Zonderwater project ............................................................................................................ 82 Figure 28: Typical north-south section through Zonderwater project ................................................... 84 Figure 29: Location of the Mayoko iron ore deposit ............................................................................. 85 Figure 30: Schematic representation of Mayoko ore deposit ............................................................... 86

Exxaro 2015 consolidated mineral resources and ore reserves report
3
List of tables Table 1: Exxaro reporting structure ...................................................................................................... 15 Table 2: Coal resources reported for 2015 .......................................................................................... 19 Table 3: Coal resource qualities 2015 ................................................................................................. 22 Table 4: Coal reserves reported for 2015 ............................................................................................ 25 Table 5: Coal reserve qualities 2015 .................................................................................................... 28 Table 6: Mineral sands resources reported for 2015 ........................................................................... 30 Table 7: Mineral sands reserves reported for 2015 ............................................................................. 33 Table 8: Base metals resources reported for 2015 ............................................................................. 35 Table 9: Base metals reserves reported for 2015 ............................................................................... 37 Table 10: Base metals reserves reported for 2014 ............................................................................. 38 Table 11: Iron ore resources reported for 2015 ................................................................................... 40 Table 12: Attributable resource and reserve tonnages ......................................................................... 42 Table 13: Resource estimation history for Thabametsi project ............................................................ 58 Table 14: Drillhole density at Leeuwpan ............................................................................................... 72 Table 15: Leeuwpan modifying factors – 2015 versus 2014 ................................................................ 74 Table 16: Resource classification criteria for Mayoko project .............................................................. 87 Table 17: Summary of exploration expenditure for coal ....................................................................... 89 Table 18: Shareholding of reported coal resources and reserves ....................................................... 92 Table 19: 2015 competent persons’ register ....................................................................................... 95 Table 20: Unreviewed coal production figures ..................................................................................... 98

Exxaro 2015 consolidated mineral resources and ore reserves report
4
1 FOREWORD
Exxaro Resources continuously strives to enhance the level of estimation and reporting of mineral
resources and reserves. The group is committed to the principles of transparency, materiality and
competency in reporting its mineral resources and ore reserves.
The information in this report is aligned with JSE Listings Requirements (section 12) and
encapsulates information on reporting governance, competence, tenure, risk, liabilities and assurance
as well as auxiliary descriptions of applicable projects, operations and exploration activities.
Mineral resources and ore reserves were estimated by competent persons on an operational or
project basis and in accordance with the South African Code for Reporting of Exploration Results,
Mineral Resources and Mineral Reserves, 2007 edition, amended July 2009 (the SAMREC Code) for
African properties, except for Vedanta’s property, and the Australasian Code for Reporting of
Exploration Results, Mineral Resources and Ore Reserves, 2012 edition (the JORC Code) for
Australian and Vedanta’s properties. Additionally, for coal resources and reserves under Exxaro
Resources’ management control, estimation is in line with the South African National Standard: South
African guide to the systematic evaluation of coal resources and coal reserves (SANS 10320:2004).
Resource and reserve estimates are quoted in full, irrespective of Exxaro shareholding.
Exxaro reports mineral estimates that are directly under its management control and includes
estimates for entities in which we hold a 25% interest or more. Supplementary descriptions are
provided for projects and operations directly under Exxaro’s management control. For projects and
operations included in the Exxaro mineral resource and ore reserve statement but in which Exxaro
does not have management control, the reader is referred to that company’s website, shown below,
for supplemental information. This approach ensures maximum compliance to the principles of
materiality and transparency. Exxaro does not report on Kumba Iron Ore (19,98% Exxaro ownership),
in line with the Exxaro directive above.
Mafube coal operation and Moranbah South project:
http://www.angloamerican.com/investors/annual-reporting
Tronox mineral sands operations and projects:
https://www.sec.gov/Archives/edgar/data/1530804/000114036116054747/form10k.htm
Vedanta Resources plc base metal projects and operations:
http://www.vedantaresources.com/media/177388/22883_vedanta_ar2015_final.pdf
Kumba Iron Ore mineral resources and ore reserves:
http://www.angloamericankumba.com/investors/annual-reporting.aspx

Exxaro 2015 consolidated mineral resources and ore reserves report
5
2 INTRODUCTION The mineral resources and ore reserves underpinning Exxaro’s current operations and growth
projects are summarised in the tables on pages 18 to 42. Mineral resources and ore reserves are
reported as those remaining on 31 December 2015 and compared with the corresponding estimates
as reported on 31 December 2014. Significant changes in the resource or reserve figures are
explained by footnotes to each table. Annual production figures for operations under Exxaro
management control, including a two-year forecast and comparison with the previous two financial
years, is included in Appendix A, Table 20.
The content of this report, including the integrated Exxaro mineral resource and reserve statement, is
compiled from detailed independent reports and statements, aligned with the JSE (section 12)
Listings Requirements, received from responsible competent persons at the various operations and
projects. The individual reports are available on request from the group company secretary. In
addition, each operation or project maintains an individual competent person’s report that
encapsulates the systematic and detailed estimation process conducted by or supervised by that
person. These reports are aligned with the checklist and guideline of the reporting and assessment
criteria table of the SAMREC Code and are scrutinised and updated annually.
Mineral resources are reported including resources that have been converted to ore reserves and at a
100% Exxaro ownership, irrespective of the individual operation or project’s attributable shareholding
(detailed where appropriate in this report). An exception is our reporting for Gamsberg and Black
Mountain, as figures from Vedanta Resources plc represent resources excluding those mineral
resources converted to reserves, and reported on 31 March 2015. The reported estimates are not an
inventory of all mineral occurrences identified, but a reasonable estimate of those, which under
assumed and justifiable technical, environmental, legal and economic conditions, may be
economically extractable at present (ore reserves) and eventually in future (mineral resources).
Resource estimations are based on the latest available geological models, which incorporate all new
validated geological information and, if applicable, revised seam, resource definitions and resource
classifications. The geological models are compiled as a rule between May and September of the
reporting year to align with the subsequent reserve estimation process. For the Exxaro operations and
projects, Exxaro uses a systematic review process that measures the level of maturity of the
exploration work done, the extent of the geological potential, the mineability, security of tenure and
associated geological risks/opportunities to establish an eventual extraction outline (EEO). The outline
reflects the boundary within which occurrences are considered to have reasonable and realistic
prospects for eventual economic extraction (RRPEEE). Exxaro continuously examines various
aspects of the mineral resource estimation process; in 2016, we will continue to confer specifically on
concepts put forward by the yet-to-be-ratified SAMREC (2016) and SANS (2015) rewrites.

Exxaro 2015 consolidated mineral resources and ore reserves report
6
The location, quantity, quality and continuity of grade/quality and geology within the EEO are known
to varying degrees of confidence and continuously tested through exploration activities such as
geophysical surveys, drilling and bulk sampling. Mineral resources are classified into inferred,
indicated or measured categories based on the degree of geological confidence. Distribution of points
of observation (drilling positions, trenches, etc), quality assurance and quality control in sample
collection, evaluation of structural complexities and, in the case of operations, reconciliation results,
are considered in classifying resources. A formal, annually compiled and signed-off exploration
strategy outlines activities planned to investigate areas of low confidence and/or geological or
structural complexities to ensure resources of a high level of geological confidence are considered for
mine planning.
Ore reserves have the same meaning as mineral reserves, as defined in the applicable reporting
codes. Ore reserves are estimated using relevant modifying factors at the time of reporting (mining,
metallurgical, economic, marketing, legal environmental, social and regulatory requirements).
Modifying factors are reviewed before and after reserve estimation by the persons responsible for
ensuring all factors are timeously and appropriately considered. Signed-off reserve fact packs that
record losses, recoveries/yields, cost, commodity prices, exchange rates and other required factors
applied are documented in each independent competent person’s reports. Reported ore reserves are
derived from indicated and measured mineral resources only, ie those modified or converted into
proved or probable ore reserves, ie run-of-mine, which in turn have been scheduled for processing.
Exxaro is keenly aware of the importance of its mineral assets, both for the short-term profitability of
its operations and the sustainability of the company in future. The optimisation of mineral assets
beyond what is generally referred to as mineral resource management is being driven as a priority.
Changes in the resources market, increased awareness of protecting the natural environment and
changing legislation and statutory requirements demand a change in the utilisation strategy and
execution of mining operations. Exxaro therefore continuously assesses the various life-of-mine
strategic plans to consider the best way of addressing these challenges.
Mineral resources and ore reserves quoted fall within existing Exxaro mine or prospecting rights.
Rights are of sufficient duration (or convey a legal right to convert or renew for sufficient duration) to
enable all reserves to be mined in accordance with current production schedules. The only exceptions
are the Grootegeluk (executed March 2011 for thirty years) and Matla (executed March 2015 for ten
years) operations where adequate ore reserves exist for life-of-mines extending well beyond the
period for which they were granted. The processes and calculations associated with estimate have
been audited by internal competent persons and are audited by external consultants when deemed
essential for transparency. In the case of mines or projects in which Exxaro does not hold the
controlling interest, figures have been compiled by competent persons from those companies and
have not been audited by Exxaro.

Exxaro 2015 consolidated mineral resources and ore reserves report
7
Exxaro’s profit margin was affected by the protracted decline in global commodity prices in 2015. The
decline in both the coal price and demand exerted pressure on every operation and project’s
economic viability considerations and subsequent definition of the reserve base. Two operations,
Tshikondeni and Inyanda, are in mine closure. A third operation, Arnot, is re-evaluating its operating
model after the non-renewal of the Eskom coal-supply agreement (CSA).
Figure 1: Exxaro attributable coal resources and reserves In response to these challenges, the company has embarked on several cost-savings initiatives to
preserve cash. The emphasis is on operational excellence and a strategic focus to realise key
projects. Greenfields exploration activities are compliance driven and project resource drilling is
conducted to conclude study phases. Exxaro’s project focus has allowed us to evaluate the strategic
fit of project areas in the portfolio. As a result, section 11 applications were submitted for the Arnot
South, Kranspan (mineral resources not reported) and Waterberg South projects to transfer these
rights according to specific agreements.
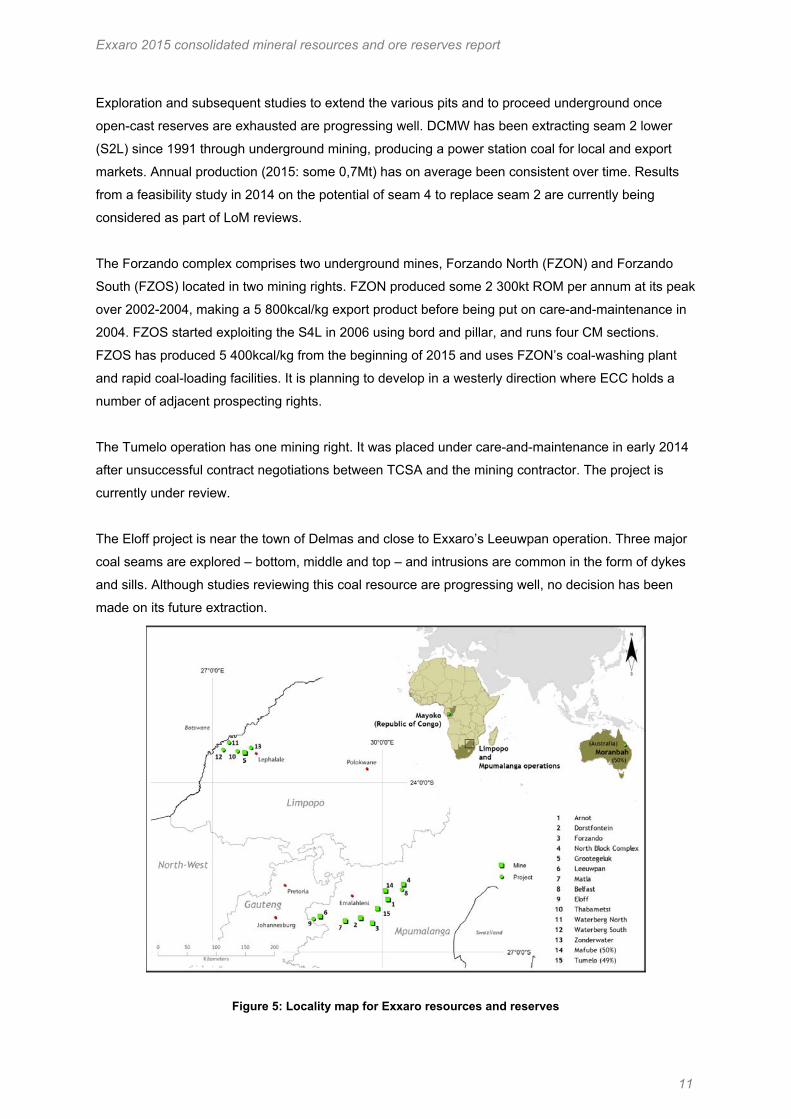
Exxaro has a world-class coal resource portfolio comprising fully owned operations and projects and a
number of jointly owned operations and projects in South Africa and Australia (Figure 5). The fully
owned coal operations and projects in South Africa are located in both the large and highly
prospective Waterberg coalfield in Limpopo and the more mature Highveld and Witbank coalfields in
Mpumalanga.
Estimated to contain 40-50% of South Africa’s remaining coal resources, the Waterberg can truly be
viewed as the future of South African coal mining. Exxaro holds an estimated 5,3bn tonnes of

Exxaro 2015 consolidated mineral resources and ore reserves report
8
measured (~3,6bn tonnes) and indicated (~1,7bn tonnes) coal resources in the Waterberg within
Grootegeluk mine and the adjacent project of Thabametsi. An additional 6bn tonnes of inferred
resources are located in these properties and the surrounding exploration projects of Waterberg North
and South, and Zonderwater.
The primary focus of Exxaro’s value creation revolves around the world-class open-pit mine and
beneficiation complex of Grootegeluk, near the town of Lephalale. Grootegeluk mine secures thermal
coal reserves for both the Matimba and newly commissioned Medupi Eskom power stations, but also
produces semi-soft coking and metallurgical coal through eight beneficiation plants (total annual
production of 23,6Mt). The Grootegeluk complex is continuously evolving, illustrated by adding
hauling trucks, commissioning an in-pit mobile crusher system linked via a conveyor belt system to
supplement run-of-mine feed to the beneficiation complex, and the commissioning and ramp-up of the
GG7 and GG8 beneficiation plants during the reporting year. Grootegeluk mine also commissioned a
first-of-its-kind cyclic-operated coal slimes pond facility. The ponds will be used to store coal fines until
the moisture content is sufficiently low to remine and blend with the sales product. In addition, due to
Figure 2: Distribution of Exxaro attributable measured and indicated coal resources
Figure 3: Advanced technology at Grootegeluk mine, in-pit crusher (left) and cyclic ponds (right)

Exxaro 2015 consolidated mineral resources and ore reserves report
9
delayed offtake by Medupi power station, a strategy was developed to use some of the accessible
power station coal to produce metallurgical coal. The result of this strategy, an additional temporary
plant GG10, will be constructed and commissioned in 2016. All studies at the adjacent Thabametsi
project to support phase 1, an open-pit mining operation in the northern part of the project area that
will produce power station coal for an on-site independent power producer (IPP), have been
concluded and ore reserves are reported for the first time.
Exxaro is currently evaluating the strategic alignment of the premier coal-exploration projects of
Waterberg North, Waterberg South and Zonderwater in its mineral asset portfolio. Studies at
Zonderwater are advanced and Exxaro aims to apply for a mining right in 2016.
A number of Exxaro-owned open-pit and underground operations and projects are in Mpumalanga.
The Matla and Arnot operations are dedicated coal suppliers to Eskom. North Block Complex (NBC)
and Leeuwpan produce power station coal for Eskom but also serve the export market and a number
of local consumers with a range of coal products.
Matla is in the Kriel district of Mpumalanga and a dedicated coal producer for Eskom’s Matla power
station. During the period, activity at Mine 1 was stopped due to pillar instability but the potential
impact was mitigated by moving mining sections and increasing production. Two feasibility studies
were concluded to determine access to future reserves by establishing an incline and decline above
and below current workings and introducing additional continuous mining (CM) sections for when the
shortwall ground is depleted. Both projects form part of the life-of-mine plan (LoMP) and await capital
improvement approvals from Eskom.
Arnot mine, a +40-year operation, is 43km east of Middelburg in Mpumalanga and was contracted to
supply coal to the nearby Eskom Arnot power station until 31 December 2015. The expiry of the coal-
Figure 4: Exxaro mining and prospecting rights in the Waterberg

Exxaro 2015 consolidated mineral resources and ore reserves report
10
supply agreement (CSA) with Eskom, which is based on specific cost configurations, creates
uncertainty on Arnot’s future operating model. Exxaro however reviewed the operation and has,
based on reasonable internal cost assumptions, identified specific resource areas that will realise
current economic viability and which were converted to ore reserves. The reported reserve estimates
are classified in the probable reserve category because of current market uncertainty. Exxaro is
currently reviewing various scenarios, including different cost assumptions and market options, and it
is therefore pertinent to caution on possible material reserve changes that might emerge from this
review in 2016.
At Leeuwpan mine, the OI feasibility study – a critical element of the mine’s LoM optimisation project –
is nearing conclusion. Reviews of specific processing parameters and reduced capital requirements
are currently under way. The project area contributes to around 50% of the operation’s ore reserves
and is a material part of its life-of-mine (LoM). Executive management’s ruling on the project is
expected in the first half of 2016.
Exxaro acquired Total Coal South Africa (TCSA) after a successful bidding process and rebranded
the operation, with its associated mineral assets, as Exxaro Coal Central (ECC). The acquisition has
increased Exxaro’s attributable coal resources significantly, for jointly owned operations and projects.
Exxaro now owns 74% of a number of mining rights held by ECC under the operations of Forzando
(FZO) and Dorstfontein (DCM) and associated/adjacent prospecting rights as well as a 49% interest
of the mining right of Tumelo. ECC also holds a 51% interest in the Eloff prospecting right, near the
town of Delmas and close to Exxaro’s Leeuwpan operation.
A number of concerns about important resource and reserve estimation methodologies and reporting
code compliance were identified during the due diligence for the TCSA mineral assets. This required
a complete review and subsequent update of the geological models of Dorstfontein, Forzando and
Eloff. The 2015 coal resource estimates are based on these updated models. The impact on
operations because of the lower Exxaro long-term price forecast as well as potential impact of
updated geological models on current mine plans are still being assessed and the reserve estimates
reported this year are based on TCSA mine plans of 2013 and 2014. The individual ore reserve
estimates reported reflect the current five-year business plans of DCM East, DCM West and FZO
South, and we believe it pertinent to caution on possible material reserve changes that might emerge
from these studies in 2016.
The Dorstfontein complex comprises an eastern, primarily open-cut operation (Dorstfontein East –
DCME) and a western underground operation, Dorstfontein West (DCMW). The Rietkuil Vhakoni
prospecting right, for which a section 102 was timeously submitted to incorporate into the Dorstfontein
complex mining right, is viewed as a potential extension of this operation. DCME started operating in
2011 and produced around 3,5Mt of power station coal for the local and export market in 2015.
Exxaro 2015 consolidated mineral resources and ore reserves report
11
Exploration and subsequent studies to extend the various pits and to proceed underground once
open-cast reserves are exhausted are progressing well. DCMW has been extracting seam 2 lower
(S2L) since 1991 through underground mining, producing a power station coal for local and export
markets. Annual production (2015: some 0,7Mt) has on average been consistent over time. Results
from a feasibility study in 2014 on the potential of seam 4 to replace seam 2 are currently being
considered as part of LoM reviews.
The Forzando complex comprises two underground mines, Forzando North (FZON) and Forzando
South (FZOS) located in two mining rights. FZON produced some 2 300kt ROM per annum at its peak
over 2002-2004, making a 5 800kcal/kg export product before being put on care-and-maintenance in
2004. FZOS started exploiting the S4L in 2006 using bord and pillar, and runs four CM sections.
FZOS has produced 5 400kcal/kg from the beginning of 2015 and uses FZON’s coal-washing plant
and rapid coal-loading facilities. It is planning to develop in a westerly direction where ECC holds a
number of adjacent prospecting rights.
The Tumelo operation has one mining right. It was placed under care-and-maintenance in early 2014
after unsuccessful contract negotiations between TCSA and the mining contractor. The project is
currently under review.
The Eloff project is near the town of Delmas and close to Exxaro’s Leeuwpan operation. Three major
coal seams are explored – bottom, middle and top – and intrusions are common in the form of dykes
and sills. Although studies reviewing this coal resource are progressing well, no decision has been
made on its future extraction.
Figure 5: Locality map for Exxaro resources and reserves

Exxaro 2015 consolidated mineral resources and ore reserves report
12
The Mayoko iron ore project is currently at the concept phase level of study. All activities on the
subsequent prefeasibility phase have been put on hold and the project is on care-and-maintenance
until conclusion of the mining convention.
3 TENURE
Mineral resources and reserves quoted for Exxaro-managed assets fall within existing Exxaro mine or
prospecting rights. Rights are of sufficient duration (or convey a legal right to convert or renew for
sufficient duration) to enable all reserves to be mined in accordance with current production
schedules. The only exceptions are the Grootegeluk (executed March 2011 for thirty years) and Matla
(executed March 2015 for ten years) operations where adequate reserves exist for life-of-mines
extending well beyond the period for which they were granted.
The status of prospecting and mining rights indicating the right type, name, reference number, status
and ownership (% attributable to Exxaro) is presented in Appendix A, Table 18.
The converted mining right for Arnot mine is executed. The right was timeously submitted for
registration but referred back to correct historical property-naming conventions. The corrections were
made and the right was resubmitted for registration. The converted mining right of Matla mine was
executed in March 2015, after being timeously submitted for registration.
The converted mining right and adjacent new mining right at Leeuwpan mine have both been
executed. Approval of a ministerial consent (section 102) submitted to amalgamate the two rights is
pending. All environmental approvals for the strategic Leeuwpan OI reserve were submitted timeously
and Exxaro has a reasonable expectation that approvals will not be withheld. Exxaro owns the OI
reserve surface rights for areas north of the R50 road and negotiations for the surface rights south of
the R50 road (remainder of the OI reserve area) have been concluded and contractually agreed,
subject to specific conditions.
NBC includes the mining areas of Glisa (converted mining right), Strathrae (converted mining right)
and Eerstelingsfontein, an executed new mining right. Environmental approvals for Eerstelingsfontein
have been granted and approval for renewal of the mining right, timeously submitted in March 2013,
is pending. In addition, a renewal for a prospecting right and an application for a new mining right for
the Glisa South project area, immediately adjacent to Glisa, was timeously submitted in November
2013. An appeal is currently being addressed through the regional mining development and
environment committee.
The Belfast mining right was registered in March 2015. Exxaro applied for an extension to the start of
mining activities based on the pending resolution of an appeal on the integrated water use licence
(IWUL). The extension was granted by the Department of Mineral Resources (DMR)

Exxaro 2015 consolidated mineral resources and ore reserves report
13
An application for a ministerial consent (section 11) for New Clydesdale Colliery (NCC), submitted in
April 2014 to cede the mining right, was approved.
The Inyanda mining right was executed in November 2006. An administrative error highlighted during
closure resulted in submitting an application for re-execution of the Inyanda right. All supporting
documentation was accepted by the DMR and actions are expected to be concluded in the first
quarter of 2016.
A prospecting right renewal was timeously submitted for Thabametsi, a project adjacent to
Grootegeluk. In addition, a new mining right application was submitted in April 2012. Exxaro has
reasonable expectation that the mining right will be granted in the first half of 2016. Approvals to
renew prospecting rights for the Waterberg North and South project areas are pending. A section 11
was submitted for the Waterberg South project, aligned with a specific commercial agreement.
The Moranbah South project area in Australia includes two mineral development licences (MDLs) and
two exploration permits for coal (EPCs). Both mineral development licences expired between July and
September 2013, but renewals for MDL 277 and MDL 377 were timeously submitted in January 2013
and March 2013 respectively. Exxaro has a reasonable expectation that approvals for both licences
will not be withheld. EPC 548 expires in February 2017 and EPC 602 in December 2018. Exploration
activities comply with all licence requirements.
Republic of the Congo (RoC): Mayoko – Lekoumou exploitation permit. The permit (permis
d’exploitation) for iron ore was granted by decree no 2013-403 on 9 August 2013 to DMC Iron Congo
South Africa (DMC) for 25 years, transferred to Exxaro Mayoko SA, and will be renewable in line with
the provisions of the mining code of the RoC. The Mayoko mining exploitation convention was
concluded between the RoC government and Exxaro Mayoko SA on 29 January 2014. This
convention is still subject to certain conditions precedent, such as concluding all agreements on
access to rail and port infrastructure. The Ngongo exploration permit to the north of the Lekoumou
exploitation permit was granted by decree no 2014-164 on 24 April 2014 for an initial period of three
years to DMC.
Far-north Ngoubou Ngoubou exploration permit: this permit (permis de recherche) for iron ore was
granted by decree no 2012-1200 for an initial period of three years on 3 December 2012 to AKI Ltd, in
which DMC holds 95%. The associated convention was granted to AKI Exploration six months prior to
granting the permit. The permit lapsed on 2 December 2015 and was not renewed.
Exxaro acquired Total Coal South Africa (TCSA) after a successful bidding process and rebranded
the operations, with its associated assets, as Exxaro Coal Central (ECC). ECC holds a 74% interest in
a number of mining rights held by Forzando and Dorstfontein coal mines and adjacent or associated

Exxaro 2015 consolidated mineral resources and ore reserves report
14
prospecting rights. ECC also holds a 49% interest in the mining right held by Tumelo coal mines and a
51% interest in the Eloff prospecting rights.
The Dorstfontein complex comprises three mining rights. The mining rights of Dorstfontein West
(123MR – executed June 2012), Dorstfontein West and Vlakfontein (119MR – executed June 2012)
and Dorstfontein East (51MR – executed June 2006) were granted for 30 years. A section 102
application for the inclusion of the Rietkuil Vhakoni (1916PR) prospecting right into the Dorstfontein
West mining right was timeously submitted.
The Forzando complex consists of two mining rights, Forzando South (380MR) and Forzando North
(381MR), both executed in June 2013 for 16 years. The renewal applications of the Kalabasfontein
prospecting rights (1035PR and 1170PR) were approved and executed in June 2015 and a section
102 for the inclusion into the Forzando West (1066PR) prospecting right into the Forzando South
mining right was timeously submitted. ECC has reasonable expectation that the approval will not be
withheld. The application for renewal of the prospecting right of Legdaar (1846PR) was submitted in
early 2015 and approval is pending.
Figure 6: Locality map for ECC mining and prospecting rights

Exxaro 2015 consolidated mineral resources and ore reserves report
15
4 GOVERNANCE
The Exxaro annual estimation and reporting process is managed through the Exxaro geosciences
policy and associated mineral resource and reserve reporting, and mineral resource estimation
procedures. Both policy and procedures are aligned with the guidelines of the SAMREC Code and, for
South African coal reporting, SANS (SANS 10320:2004).
The policy and procedures dictate technical requirements for estimation and reporting, and include
guidelines on methodologies, processes and deliverables. Procedures are also implemented for the
geophysical, rock engineering, geotechnical, structural geology, tenure management, hydro-
geological and mine-planning disciplines that prescribe methodologies and minimum standards for
compliance.
Table 1: Exxaro reporting structure
Exxaro reporting governance framework
Regulatory Governance Deliverables Assurance
JSE Listings Requirements (section 12) SAMREC Code (2009) table 1 SANS (SANS 10320:2004) JORC Code (2012)
Geosciences policy Geosciences, mineral asset management and exploration strategy Exxaro mineral resource and reserve reporting procedure Exxaro mineral resource estimation procedure Exxaro mineral reserve estimation procedure
Annual resource and reserve estimation schedule Mineral resource and reserve fact packs Annual operation/project mineral resource and reserve report Consolidated Exxaro mineral resource and reserve report and statement (CMRR)
Annual review and update of policy and procedures Competent person’s critical skills register update and review Annual individual mineral resource and reserve report review and lead competent person sign-off Applicable competent person and technical team sign-off Internal and external review/audit process

Exxaro 2015 consolidated mineral resources and ore reserves report
16
5 COMPETENT PERSONS
Exxaro applies three levels of ‘competency’ to estimating mineral resources and ore reserves,
namely: x Competent person (as defined in the SAMREC and JORC codes) at each operation who officially takes
responsibility for estimating and reporting mineral resources and/or ore reserves at operational level
x Technical specialists who contribute in any way to estimating mineral resources and/or ore reserves and
are named and sign-off on each operation’s mineral resource and ore reserve statement. Technical
specialists could include geologists, mining engineers, geohydrologists, geotechnicians, financial
experts, economists, etc.
x Person/s designated to take corporate responsibility for the mineral resource and ore reserve estimates
presented in the consolidated report. This definition clearly differentiates the competent person on an
operational level from the person(s) who takes overall corporate responsibility for the mineral resource
and ore reserve estimates presented in this report.
Exxaro’s mineral resources and ore reserves have been estimated or supervised by the competent
persons listed in appendix A, Table 19 on an operational basis in accordance with the SAMREC Code
for South African properties and the JORC Code for Australian properties. All competent persons
have sufficient relevant experience in the style of mineralisation, type of deposit and/or mining
method(s) under consideration and/or being mined and for the activity they have taken responsibility
for, to qualify as ‘competent persons’ as defined in the applicable codes at the time of reporting. The
appointed competent persons have signed off their respective estimates in the original mineral
resource and reserve statements for the various operations, and consent to the inclusion of the
information in this report in the form and context in which it appears in the consolidated mineral
resource and reserve report. Technical specialists who contributed to estimating the operation’s
mineral resources and ore reserves are included in the original documentation, where their
contributions are specified and their signatures appear.
Exxaro lead competent persons are appointed by the Exxaro management team. The Exxaro lead
mineral resource competent person is Henk Lingenfelder, a member of the Geological Society of
South Africa (GSSA) and registered (400038/11) with the South African Council for Natural Scientific
Professions. He has a BSc (hons) in geology and 20 years of experience as an exploration and
mining geologist in coal, iron ore and industrial minerals.
The Exxaro lead mineral reserve competent person is Chris Ballot, a mining engineer registered
(20060040) with the Engineering Council of South Africa. He is a mining engineer with 19 years of
experience in iron ore, mineral sands and coal in various technical and management roles.

Exxaro 2015 consolidated mineral resources and ore reserves report
17
6 RISK, LIABILITY AND ASSURANCE
Assurance is implemented on a three-tier system, aligned with the guidelines of the Exxaro mineral
resource and reserve reporting procedure and summarised as follows:
Tier 1
Resource and reserve estimation is undertaken as per Exxaro’s governance framework. Sign-offs are
required at each stage and the process is concluded during a formal sign-off session by a panel
comprising Exxaro lead resource and reserve persons, competent persons, domain experts and
technical specialists. Technical assurance is managed against dedicated checklists.
Tier 2 Internal reviews scheduled on a three-year cycle. The intent is to verify compliance with Exxaro’s
governance framework while ensuring accountability and consequence management.
Tier 3 External audits scheduled on a three-year cycle and entailing a full review of the resource and reserve
estimation process, from drillhole logging to reserve evaluation.
In 2015, tier 1 assurance was undertaken for Arnot, Matla, Leeuwpan, Thabametsi project, Belfast
pand the TCSA acquired mineral assets of Dorstfontein, Forzando and Eloff. The resource fact packs
for these operations/projects indicated that an update or review of the resource estimate was
required, either due to additional information being available or on recommendations from external
audits. On tier 2, reviews of Grootegeluk, Matla and Leeuwpan mineral resources and reserves that
support the applicable business plans were undertaken. Recommendations are documented and
tracked.
For the Belfast project, recommendations received from the external audit by Mineral Corporation in
2014 were considered and an updated resource estimate was generated based on Exxaro drillholes
only. The results indicated that the tonnage and qualities difference between the two models is
insignificant (<5% across all seams) although there would be a profound impact on the resource
classification due to Exxaro drillholes being drilled on a 500m x 500m grid. Noting the insignificant
difference as well as the fact that the historical drillholes included in the model had been reviewed and
validated, the decision was taken to proceed with the current geological model. However, the tier 1
assurance process indicated the need to realign in terms of resource classification and this minor
update is reflected in Table 2.
An external resource and reserve audit by Ukwazi Group was undertaken for Thabametsi project and
results reflected a high standard of resource and reserve estimation.
Exxaro 2015 consolidated mineral resources and ore reserves report
18
7 GROUP SUMMARY OF RESOURCE AND RESERVE ESTIMATES
This document indicates Exxaro’s mineral resources and ore reserves remaining as at 31 December
2015. Mineral resource and ore reserve figures are not an inventory of all mineral occurrences drilled
or sampled, but a realistic record of those, which under assumed and justifiable technical and
economic conditions, may be economically extractable currently and in future.
Mineral resources and ore reserves are reported inclusive of mineral resources that have been
converted to ore reserves and at 100%, irrespective of the percentage attributable to Exxaro. An
exception is reporting for Gamsberg and Black Mountain, because figures received from Vedanta plc
(JORC Code) represent mineral resources excluding ore reserves and reported on 31 March 2015.
Detailed explanations for year-on-year movements are provided in Chapter 10: Ancillary resource and
reserve information by operation.
Highlights Emerging issues x Commissioning and ramp-up of GG7 and GG8
beneficiation plants as well as the first-of-its-kind cyclic-
operated coal slimes ponds facility at Grootegeluk mine
x First-time reporting of ore reserves for Thabametsi project
phase 1 (IPP) and mineral resources for Zonderwater
project in Waterberg coalfields
x Start of mining operations at Eerstelingsfontein, NBC
x Acquiring Total Coal South Africa (TCSA), now ECC
properties
x Pending capital improvement approvals from Eskom for the
Matla life-of-mine plan (LoMP) concluded feasibility studies
x Evaluation of reasonable and realistic prospects for
eventual economic extraction (RRPEEE) aligned with new
expected SAMREC and SANS publications
x Closure of Inyanda and Tshikondeni mine operations
x Review of Arnot operating model
Lows Priorities x Ceasing mining activities at mine 1 Matla as a result of
pillar instability
x Expiry of the Eskom coal-supply agreement creates
uncertainty on Arnot’s future operating model
x Expected executive management ruling on OI project at
Leeuwpan mine
x Review ECC’s LoMP
x Approval of Thabametsi mining right
x Conclusion of Belfast project environmental appeals

Exxaro 2015 consolidated mineral resources and ore reserves report
19
Table 2: Coal resources reported for 2015
Commodity Operation 1 % attrib
to Exxaro
Resource category
2015 2014 % change Tonnes
(Mt) Grade 2 Tonnes (Mt) Grade 2
Coal Mpumalanga
Arnot mine 3 (UG/OC) (captive market)
100 Measured 138,5 Raw coal 126,1 Raw coal Indicated 64,3 Raw coal 45,7 Raw coal
Inferred 21,3 Raw coal 78,5 Raw coal TOTAL 224,1 Raw coal 250,3 Raw coal -10 Resources inside Life of mine plan 26,2 66,3
Coal Mpumalanga
Matla mine (>18MJ/kg, 26% DAV) (UG)
100 Measured 466,9 Raw coal 383,5 Raw coal Indicated 201,1 Raw coal 254,6 Raw coal
Inferred 159,3 Raw coal 176,6 Raw coal TOTAL 827,3 Raw coal 814,8 Raw coal 2
Coal Mpumalanga
Matla mine (Low CV 15-18MJ/kg, <30% Ash) (UG)
100 Measured 48,9 Raw coal 51,1 Raw coal Indicated 54,3 Raw coal 52,5 Raw coal
Inferred 82,0 Raw coal 89,3 Raw coal TOTAL 185,2 Raw coal 192,9 Raw coal -4
Coal Mpumalanga
Matla mine Total (UG) (captive market) 100
Measured 516 Raw coal 435 Raw coal Indicated 255 Raw coal 307 Raw coal
Inferred 241 Raw coal 266 Raw coal TOTAL 1 012 Raw coal 1 008 Raw coal 0,5 Resources inside Life of mine plan 495 532
Coal Mpumalanga
Inyanda mine 4 (OC) 100
Measured Resources Depleted
1,20 Raw Coal Indicated
Inferred TOTAL 1,20 Raw coal -100 Resources inside Life of mine plan 1,20
Coal Mpumalanga
Leeuwpan mine (OC) 100
Measured 146,7 Raw coal 144,5 Raw coal Indicated
Inferred 3,7 Raw coal TOTAL 150,3 Raw coal 144,5 Raw coal 4 Resources inside Life of mine plan 120,3 120,3
Coal Mpumalanga
Mafube mine 5 (OC) 50
Measured 163,7 Raw coal 168,0 Raw coal Indicated 13,0 Raw coal 13,0 Raw coal
Inferred 2,1 Raw coal 2,1 Raw coal TOTAL 178,8 Raw coal 183,1 Raw coal -2 Resources inside Life of mine plan 127,6 124,4
Coal Mpumalanga
NBC mine 6
(North Block Complex) (OC)
100 Measured 23,4 Raw coal 27,0 Raw coal Indicated
Inferred TOTAL 23,4 Raw coal 27,0 Raw coal -13 Resources inside Life of mine plan 9,8 15,3
Coal Mpumalanga
Glisa South project 7 (OC) (prospecting)
100 Measured 20,0 Raw coal 20,0 Raw coal Indicated 47,1 Raw coal 47,1 Raw coal
Inferred 9,4 Raw coal 9,4 Raw coal TOTAL 76,5 Raw coal 76,5 Raw coal -
Coal Mpumalanga
Belfast project 8 (OC) 100
Measured 81,1 Raw coal 83,2 Raw coal Indicated 22,4 Raw coal 24,2 Raw coal
Inferred 34,4 Raw coal 25,9 Raw coal TOTAL 137,8 Raw coal 133,3 Raw coal 3 Resources inside Life of mine plan 60,1 60,1
Coal Mpumalanga
ECC Dorstfontein complex 9 (OC/UG)
74 Measured 93,9 Raw coal
Not reported
Indicated 47,0 Raw coal Inferred 192,0 Raw coal
TOTAL 332,9 Raw coal Resources inside Life of mine plan 49,3

Exxaro 2015 consolidated mineral resources and ore reserves report
20
Commodity Operation 1 % attrib
to Exxaro
Resource category
2015 2014 % change Tonnes
(Mt) Grade 2 Tonnes (Mt) Grade 2
Coal Mpumalanga
ECC Rietkuil Vhakoni 10 (prospecting right)
74 Measured 36,0 Raw coal
Not reported
Indicated 24,4 Raw coal
Inferred 61,0 Raw coal
TOTAL 121,3 Raw coal
Coal Mpumalanga
ECC Forzando mines11 74
Measured 57,4 Raw coal (FZON and FZOS) Indicated 38,0 Raw coal Not reported
(UG) Inferred 25,5 Raw coal TOTAL 120,9 Raw coal Resources inside life-of-mine plan 22,0
Coal Mpumalanga
ECC Forzando projects 12 74
Measured 21,5 Raw coal Indicated 32,3 Raw coal Not reported
Inferred 15,4 Raw coal TOTAL 69,3 Raw coal
Coal Mpumalanga
ECC Schurvekop 1063PR 13 49
Measured 31,2 Raw coal Indicated 8,7 Raw coal Not reported
Inferred 0,5 Raw coal TOTAL 40,4 Raw coal
Coal Mpumalanga
ECC Tumelo mine (UG) 49
Measured 6,0 Raw coal Indicated Not reported
Inferred TOTAL 6,0 Raw coal
Coal Mpumalanga
ECC Eloff project (prospecting) 51
Measured 9,7 Raw coal Indicated 239,3 Raw coal Not reported
Inferred 226,5 Raw coal TOTAL 475,5 Raw coal
Coal Limpopo
Grootegeluk mine 14
(OC) 100 Measured 3 298 Raw coal 3 443 Raw coal Indicated 983 Raw coal 1 017 Raw coal
Inferred 247 Raw coal 259 Raw coal TOTAL 4 528 Raw coal 4 719 Raw coal -4 Resources inside life-of-mine plan 3 367 3 511
Coal Limpopo
Thabametsi project 15 (OC) (prospecting)
100 Measured 270 Raw coal Indicated 749 Raw coal 2 579 Raw coal
Inferred 2 916 Raw coal 2 249 Raw coal TOTAL 3 935 Raw coal 4 828 Raw coal -18
Coal Limpopo
Waterberg North project (OC) (prospecting)
100 Measured Indicated
Inferred 2 253 Raw coal 2 253 Raw coal TOTAL 2 253 Raw coal 2 253 Raw coal -
Coal Limpopo
Waterberg South project (OC) (prospecting)
100 Measured Indicated
Inferred 895 Raw coal 895 Raw coal TOTAL 895 Raw coal 895 Raw coal -
Coal Limpopo
Zonderwater project (prospecting) 100
Measured
Not reported Indicated 22,7 Raw coal
Inferred 51,2 Raw coal
TOTAL 73,9 Raw coal
Coal Limpopo
Tshikondeni mine 16 (UG/OC) (captive market)
100 Measured 3,7 Raw coal 3,7 Raw coal Indicated 25,1 Raw coal 25,1 Raw coal
Inferred TOTAL 28.8 Raw coal 28,8 Raw coal -
Coal Australia
Moranbah South project 17 (UG) (prospecting)
50 Measured 481,9 Raw coal 481,9 Raw coal Indicated 222,5 Raw coal 222,5 Raw coal
Inferred 28,0 Raw coal 28,0 Raw coal TOTAL 732,4 Raw coal 732,4 Raw coal -

Exxaro 2015 consolidated mineral resources and ore reserves report
21
Footnotes for Table 2: x Rounding figures may cause computational discrepancies x All changes more than 10% are explained x Figures are reported at 100% irrespective of percentage attributable to Exxaro and refer to 2015 only x Tonnages are quoted in metric tonnes and million tonnes is abbreviated as Mt x Coal resources are quoted on a mineable tonnage in-situ (MTIS) and air-dried basis x Coal resources are quoted inclusive of coal resources that have been modified to coal reserves unless otherwise stated x Resources inside life-of-mine plan refer to total mineable tonnes in-situ (MTIS) resources within LoMP layout 1 Operation refers to operating mine or significant project. Mining method: OC – open-cut, UG – underground 2 Coal qualities are reported in Table 3 and quoted on MTIS and air-dried basis 3 Change and movement in categories is the result of an update of the geological model and refinement of the classification methodology. The change of resources inside life-of-mine reflects the change in ore reserves 4 The mine is currently in closure and all resources and reserves have been depleted 5 Estimates are as received from Anglo American Thermal Coal and were not audited by Exxaro 6 NBC includes the resource areas of Glisa, Strathrae and Eerstelingsfontein. The decrease is primarily the result of mining depletion (-4,7Mt) and a change in modelling methodology at the Eerstelingsfontein operation (+0,9Mt) 7 The project is adjacent to the Glisa (NBC) resource area and is considered an extension of the current operation, pending the conclusion of feasibility studies. A new mining right application was timeously submitted in November 2013 8 Movement is a result of refined classification methodology 9 Based on mining rights 119MR, 123MR and 53MR. The complex comprises the East (opencast/underground) and West (underground) operations. Resources inside life-of-mine plan refer to resources in the five-year business plan 10 A section 102 application to include 1916PR into Dorstfontein 119MR was submitted in July 2015 11 Consists of Forzando South (FZOS) where mining is currently taking place and Forzando North (FZON) which is under care-and-maintenance. Resources inside life-of-mine plan refer to resources in the five-year business plan 12 Various prospecting rights, of which a number are considered for the Forzando mine extension. A section 102 application to include Forzando West (1066PR) in the Forzando South mining right has been submitted and approval is pending 13 The Schurvekop 1063PR is majority owned by Mmakau Mining 14 The decrease in resources is predominantly a result of mining depletion (-46,1Mt) and a change in estimation methodology (-144Mt) 15 Changes reflect an updated geological model (2013 versus 2010) and classification methodology (SANS 10320:2004 guidelines for multi-seam deposits was used to remain conservative) 16 Tshikondeni, in the process of mine closure, was a dedicated metallurgical coal supplier for Arcelor Mittal. The remaining coal resources reported are located in Makanja (some 25Mt) as well as the Mutale west and Perdeskoen areas (3,7Mt) 17 Estimates are received from Anglo American Metallurgical Coal Proprietary Limited and not audited by Exxaro

Exxaro 2015 consolidated mineral resources and ore reserves report
22
Table 3: Coal resource qualities 2015
Operation Seam/layer/ formation
Measured resource Indicated resource Inferred resource
Tonnes (Mt)
CV MJ/kg %VM %Ash %S Tonnes
(Mt) CV
MJ/kg %VM %Ash %S Tonnes (Mt)
CV MJ/kg %VM %Ash %S
Arnot mine Seam 2 136,1 23,6 23,9 21,9 1,0 63,4 23,7 23,6 21,6 0,9 20,7 23,9 23,8 20,8 0,9
Seam1 2,4 24,8 29,6 21,1 1,0 0,9 24,5 29,6 21,5 0,9 0,6 22,1 28,4 27,3 0,6
Matla mine Seam 2 171,9 23,8 24,2 20,1 0,9 101,8 23,0 23,8 21,5 0,3 101,6 21,9 22,8 24,7 1,4
Seam 4 295,0 19,8 22,1 30,3 1,1 99,3 20,1 22,4 28,5 1,0 57,7 19,9 22,2 29,3 0,9
Low CV seam 2 3,7 18,2 20,0 33,6 0,9 18,1 17,1 18,8 34,3 0,3 39,0 17,9 19,2 31,2 0,7
Low CV seam 4 45,2 17,0 19,8 38,0 1,0 36,2 17,0 19,4 36,7 0,2 43,0 17,6 19,3 35,2 0,9
Leeuwpan mine 1 TC 77,0 15,8 20,6 38,5 1,1 1,28 13,8 12,71 38,1 1,23
BC 69,6 22,0 17,5 22,5 0,7 2,4 24,9 13,1 28,2 1,0
Mafube mine Seam 4 11,0 19,2 20,9 32,1 0,9 3,5 17,5 19,2 36,0 0,7 0,9 16,9 19,3 38,7 0,4
Seam 2 118,8 23,0 23,1 22,4 1,0 6,6 22,8 23,7 23,1 1,0
Seam 1 33,9 20,3 22,5 30,8 0,9 2,9 19,9 22,1 32,0 0,9 1,2 22,4 25,5 24,3 0,9
NBC mine Glisa: total seams 19,8 20,1 21,8 29,6 0,9
Strathrae East: seam 2 0,5 25,9 22,3 16,4 0,8
Eerstelingsfontein: seam 2 3,1 24,7 22,9 19,0 0,8
Glisa South project Seam 2 20,0 19,0 20,3
Belfast project Seam 4 1,1 19,9 24,6 33,1 1,5 2,8 13,1 19,0 49,0 1,2 6,1 17,4 21,7 38,3 1,2
Seam 3 5,1 21,9 23,4 27,3 1,0 2,8 21,9 23,2 27,0 1,3 3,4 21,8 23,7 27,2 2,5
Seam 2 74,8 25,0 23,3 17,9 1,1 16,8 23,0 21,6 23,2 1,0 24,8 20,4 20,2 30,0 0,8
Grootegeluk mine
Volksrust formation 2 431 12,7 19,4 54,4 1,0 783 13,5 19,2 53,7 1,0 162 13,6 19,5 53,4 1,3
Vryheid formation 867 23,0 21,8 27,8 1,9 201 31,6 30,9 35,9 12,8 85 22,4 20,8 30,7 1,4

Exxaro 2015 consolidated mineral resources and ore reserves report
23
Operation Seam/layer/ formation
Measured resource Indicated resource Inferred resource Tonnes
(Mt) CV
MJ/kg %VM %Ash %S Tonnes (Mt)
CV MJ/kg %VM %Ash %S Tonnes
(Mt) CV
MJ/kg %VM %Ash %S
Thabametsi T1 123 12,5 20,0 54,6 1,1 255 11,9 19,7 56,2 1,0 1 135 11,5 19,4 57,1 1,1
project 2 T2 122 11,7 19,3 54,8 1,0 404 11,2 19,0 55,9 1,0 1 396 11,2 19,0 55,7 1,1
Waterberg North Volksrust formation 1 468 10,8 19,0 56,8 0,9
project Vryheid formation 785 18,1 21,7 36,2 1,8
Waterberg South Volksrust formation 354 14,1 23,2 44,9 1,1
project Vryheid formation 541 17,1 21,6 36,1 2,1
Zonderwater project
Zone 3 (Vryheid formation) 22,7 24,3 22,3 20,8 2,2 51,2 23,9 22,3 21,6 2,3
Dorstfontein complex Total seams 93,9 20,8 20,7 31,2 1,18 47,0 20,7 20,5 31,5 1,13 192,0 20,3 19,9 33,3 1,14
Rietkuil Vhakoni Total seams 36,0 19,6 21,3 34,9 1,20 24,4 19,4 20,5 35,9 1,23 61,0 18,2 19,3 38,4 1,11
Forzando mines Seam 4 49,9 22,5 24,8 26,2 1,17 33,4 22,2 23,7 27,7 1,25 11,7 22,2 22,4 28,4 1,19
Seam 2 7,5 22,8 24,9 24,8 1,48 4,6 22,1 23,4 27,3 1,40 13,8 20,2 21,1 32,5 1,24
Forzando projects Seam 4 21,3 21,5 23,5 29,6 1,08 32,3 21,2 22,3 30,1 1,22 15,4 21,3 20,7 30,6 1,09
Seam 2 0,2 17,2 14,6 42,7 1,07 0,0 21,2 16,2 32,2 0,92
Schurvekop 1063PR Seam 4 21,5 19,2 21,8 34,0 1,03 2,7 19,0 21,3 34,3 0,87 0,5 19,0 20,4 34,5 0,82
Seam 2 9,6 21,8 22,9 27,4 1,56 6,1 21,1 22,3 29,3 1,63
Tumelo mine All seams 6,0 23,4 25,3 24,9 1,3
Eloff project All seams 9,7 19,6 21,6 31,2 1,2 239,3 19,30 20,56 30,52 0,90 227 19,1 19,8 31,2 0,9
Moranbah South project
Goonyella middle seam (GM) 481,9 26,7 18,5 23,7 0,6 222,5 27,3 17,9 21,7 0,6 28,0 28,5 17,0 18,9 0,5

Exxaro 2015 consolidated mineral resources and ore reserves report
24
Footnotes for Table 3: x VM - volatile matter, S - sulphur, CV - calorific value x Rounding figures may cause computational discrepancies x Coal qualities are quoted on a mineable tonnage in-situ (MTIS) and air-dried basis x Tonnages are quoted in metric tonnes and million tonnes is abbreviated as Mt 1 TC- top coal, BC- bottom coal 2 Based on Thabametsi bench configuration as defined in the phase 1 feasibility study

Exxaro 2015 consolidated mineral resources and ore reserves report
25
Table 4: Coal reserves reported for 2015
Commodity Operation 1 %
attrib to
Exxaro
Reserve category
2015 2014 Run-of-mine
(ROM) change
(%)
Life-of-mine plan
(LoMP) (years)
ROM (Mt) Saleable product (Mt) ROM (Mt) Saleable product (Mt)
Coal Mpumalanga
Arnot mine 2 (OC/UG) (captive market)
100
Export Thermal Metallurgical Export Thermal Metallurgical Proved 17,1 17,1
Probable 17,9 17,0 37,1 37,1
TOTAL 17,9 17,0 54,2 54,2 -67 8
Inferred resources in LoMP 0,8
Coal Mpumalanga
Matla mine 3 (UG) (captive market)
100 Proved 188,3 187,4 140,9 140,2
Probable 68,7 68,3 84,4 84,0
TOTAL 257,0 255,7 225,3 224,2 14 10+
Inferred resources in LoMP 46,9 67,7
Coal Mpumalanga
Inyanda mine 4 (OC) 100
Reserves depleted
A-grade export steam coal Proved 0,20 0,14
Probable 0,97 0,59
TOTAL 1,17 0,73
Coal Mpumalanga
Leeuwpan mine 5 (OC)
100
Export Thermal Metallurgical Export Thermal Metallurgical Proved 18,7 0,6 7,2 4,1 27,8 1,2 11,4 4,1
Probable 80,5 1,6 10,1 27,8 81,3 1,6 7,4 27,9
TOTAL 99,2 2,2 17,3 31,9 109,1 2,8 18,8 32,0 -9 14
Coal Mpumalanga
Mafube mine 6 (OC) 50
Proved 2,5 1,4 0,4 5,8 2,9 1,4
Probable 119,4 51,7 22,4 113,0 48,4 21,1
TOTAL 121,9 53,1 22,8 118,7 51,3 22,5 3 18
Inferred resources in LoMP 0,9 0,2 0,4 0,9

Exxaro 2015 consolidated mineral resources and ore reserves report
26
Commodity Operation 1 %
attrib to
Exxaro
Reserve category
2015 2014 Run-of-mine
(ROM) change
(%)
Life-of-mine plan
(LoMP) (years)
ROM (Mt) Saleable product (Mt) ROM (Mt) Saleable product (Mt)
Coal Mpumalanga
NBC mine 7
(North Block Complex) (OC)
100
Export Thermal Metallurgical Export Thermal Metallurgical
Proved 9,2 7,3 11,5 9,2
Probable
TOTAL 9,2 7,3 11,5 9,2 -20 2
Coal Mpumalanga
Belfast project (UG/OC) 100
Proved 45,7 35,3 8,1 45,7 35,3 8,1
Probable
TOTAL 45,7 35,3 8,1 45,7 35,3 8,1 - 17
Inferred resources in LoMP 0,5 0,5
Coal Mpumalanga
ECC Dorstfontein complex 8
(UG/OC) 74
Proved 12,2 7,2 Not reported
Probable 8,1 4,3
TOTAL 20,3 11,5 5
Inferred resources in LoMP 3,6 2,0
Coal Mpumalanga
ECC Forzando mines 9 (UG) 74
Proved 7,0 5,8 Not reported
Probable 4,5 3,7
TOTAL 11,5 9,5 5
Inferred resources in LoMP 0,3 0,2
Coal Limpopo
Grootegeluk mine (OC)
100
Coking Thermal Metallurgical Coking Thermal Metallurgical Proved 2 679 120 1 138 78 2 724 95 1 243 90
Probable 537 33 219 11 537 23 248 11
TOTAL 3 216 153 1 356 89 3 261 118 1 491 101 -1 30+
Inferred resources in LoMP 67 69
Coal Limpopo
Thabametsi project 10 100
Coking Thermal Metallurgical
Not reported
Proved 109 107
Probable 21 20
TOTAL 130 127 30+

Exxaro 2015 consolidated mineral resources and ore reserves report
27
Footnotes for Table 4: x Rounding figures may cause computational discrepancies x Figures are reported at 100% irrespective of percentage attributable to Exxaro and refer to 2015 only x Tonnages are quoted in metric tonnes and million tonnes is abbreviated as Mt x Inferred resources in life-of-mine plan (LoMP) refer to inferred resources considered for the life of mine plan x Coal reserves are quoted on a run-of-mine (ROM) reserve tonnage basis which represents tonnages delivered to the plant
at an applicable moisture and quality x Saleable reserve tonnage represents the product tonnes of coal available for sale on an applicable moisture basis x All changes more than 10% (significant) are explained 1 Operation refers to operating mine or significant project. Mining method: OC – open-cut, UG – underground 2 The Arnot coal-supply agreement (CSA) with Eskom expired on 31 December 2015. A review of the life-of-mine plan based on Exxaro’s reasonable cost assumptions was conducted to identify commercially viable ore reserves. Due to current uncertainty about the CSA, only these reserves have been included and in the probable category 3 The increase reflects additional drilling with layout and mining method changes in the LoMP 4 Mine currently in closure, all resources and reserves have been depleted 5 The movement in Reserves is a result of mining depletion (-7,3Mt) and disposal of ODS and ODN reserves (-2,6Mt). Boundary pillar was left between ODS and ODN to address safety concerns. Reserve OI area has been downgraded to Probable as a result of the pending Feasibility study 6 New area added to reserve after environmental authorisation granted. Estimates are received from Anglo American Thermal Coal and were not audited by Exxaro 7 Change primarily the result of mining (-4,4Mt) and reflects the change in the resource base 8 Estimates reflect current five-year business plan of Dorstfontein complex and it is therefore pertinent to caution on possible material reserve changes in 2016 from current LoM studies 9 Estimates reported reflect current five-year business plan of Forzando complex and it is therefore pertinent to caution on possible material reserve changes in 2016 from current LoM studies 10 Reserves reported for the first time based on the conclusion of phase 1 feasibility study. The 30-year LoM is based on phase 1 independent power producer (IPP) mining-pit configuration

Exxaro 2015 consolidated mineral resources and ore reserves report
28
Table 5: Coal reserve qualities 2015
Operation Seam/layer Thermal saleable (proved + probable) Metallurgical saleable (proved + probable) Coking saleable (proved + probable)
Tonnes (Mt)
CV MJ/kg %VM %Ash %S Tonnes
(Mt) CV
MJ/kg %VM %Ash %S Tonnes (Mt)
CV MJ/kg %VM %Ash %S
Arnot mine
Seam 2 17,0 23,3 26,3 25,2 1,1 Seam 1
Matla mine
Seam 4 95,0 22,5 22,6 20,4 1,0 Seam 2 162,0 18,5 20,9 31,4 0,9
Leeuwpan mine 1
TC 14,9 23,0 21,5 25,3 0,5 8,8 24,6 19,3 15,4 1,3 BC 2,3 22,1 20,1 28,2 0,4 25,2 25,1 23,6 15,4 0,6
Mafube mine
Middlings 22,8 22,5 22,7 22,8 0,5 Export 53,1 26,5 26,3 13,2 0,5
NBC
Glisa: Total seams 7,3 22,3 22,1 24,0 1,0 Eerstelingsfontein: seam 2 1,9 26,0 21,8 16,7 0,9
Belfast project
Thermal 8,1 21,9 22,4 26,6 1,8 Export 35,3 26,9 24,1 13,7 0,5
Dorstfontein complex 2
Dorstfontein W (ROM) 10,4 21,3 21,5 28,3 0,9 Dorstfontein E (ROM) 8,6 17,4 18,3 41,9 1,4
Forzando mines 2
Seam 2L (ROM) 0,6 20,1 21,7 27,7 1,8 Seam 4L (ROM) 11,0 18,3 22,1 24,9 1,0
Grootegeluk mine
Volksrust formation 854 20,5 26,2 34,1 0,9 153 29,1 35,2 10,3 1,1
Vryheid formation 502 23,0 22,2 27,9 2,0 89 28,1 23,9 14,3 0,6 Thabametsi project 3
T1 64 12,7 20,0 53,9 1,1
T2 63 11,3 19,0 55,7 1,0

Exxaro 2015 consolidated mineral resources and ore reserves report
29
Footnotes for Table 5: x VM - volatile matter, S - sulphur, CV - calorific value x Rounding figures may cause computational discrepancies x Saleable product tonnages are quoted in metric tonnes and million tonnes is abbreviated as Mt x Saleable reserve tonnage represents the product tonnes of coal available for sale on an applicable moisture and air-dried
quality basis 1 TC – top coal, BC – bottom coal 2 Qualities reported relate to ROM, product qualities are currently being modelled and aligned to Exxaro policies and standards 3 Based on Thabametsi bench configuration as defined in phase 1 feasibility study

Exxaro 2015 consolidated mineral resources and ore reserves report
30
Table 6: Mineral sands resources reported for 2015
Commodity Operation 1 % attrib to Exxaro
Resource category
2015 2014 % change Tonnes
(Mt) Grade Tonnes (Mt) Grade
%Ilmenite %Ilmenite
Mineral sands KwaZulu-Natal
Hillendale Mine + Braeburn + Braeburn Extension 2 (OC)
58,55 Measured 12,2 2,9 12,2 2,9 Indicated Inferred
TOTAL 12,2 2,9 12,2 2,9 -
Mineral sands KwaZulu-Natal
Fairbreeze A+B+C+C Ext +D 3 (OC)
58,55 Measured 156,1 4,29 156,1 4,29 Indicated 55,7 2,56 55,7 2,56 Inferred 9,0 1,92 9,0 1,92
TOTAL 220,9 3,76 220,9 3,76 -
Mineral sands KwaZulu-Natal
Block P (OC) (mining right)
58,55 Measured Indicated 40,6 3,1 40,6 3,1 Inferred
TOTAL 40,6 3,1 40,6 3,1 -
Mineral sands KwaZulu-Natal
Port Durnford project (OC) (prospecting)
58,55 Measured 142,5 3,04 142,5 3,04 Indicated 340,1 2,75 340,1 2,75 Inferred 466,0 2,52 466,0 2,52
TOTAL 948,6 2,68 948,6 2,68 -
Mineral sands Limpopo
Gravelotte sand (OC) (mining right)
100 Measured Indicated 74,9 9,9 74,9 9,9 Inferred
TOTAL 74,9 9,9 74,9 9,9 -
Mineral sands Limpopo
Gravelotte rock (OC) (mining right)
100 Measured Indicated 9,7 23,1 9,7 23,1 Inferred 113,9 18,2 113,9 18,2
TOTAL 123,6 18,6 123,6 18,6 - %Ilmenite %Zircon %Ilmenite %Zircon
Mineral sands Western Cape
Namakwa Sands mine 4 (OC) 58,55
Measured 625,0 2,88 0,65 404,8 3,05 0,72 Indicated 319,0 2,25 0,58 350,5 2,59 0,69 Inferred 63,0 2,46 0,64 119,7 2,19 0,55
TOTAL 1007,0 2,66 0,63 874,9 2,75 0,69 15,1

Exxaro 2015 consolidated mineral resources and ore reserves report
31
Commodity Operation 1 % attrib to Exxaro
Resource category
2015 2014 % change Tonnes
(Mt) Grade Tonnes (Mt) Grade
%THM %THM
Mineral sands Australia
Cooljarloo mine 5 (OC) 43,98
Measured 252,0 1,8 303,9 1,8 Indicated 233,0 1,7 235,8 1,6 Inferred
TOTAL 485,0 1,8 539,7 1,8 -10,1
Mineral sands Australia
Cooljarloo west project 6 (OC) (prospecting)
43,98 Measured Indicated 177,0 1,8 104,5 2,0 Inferred
TOTAL 177,0 1,8 104,5 2,0 69,3
Mineral sands Australia
Cooljarloo north west project (OC) (prospecting)
43,98 Measured Indicated Inferred 141,6 2,1 141,6 2,1
TOTAL 141,6 2,1 141,6 2,1 -
Mineral sands Australia
Jurien project (OC) (mining right)
43,98 Measured Indicated 25,6 6,0 25,6 6,0 Inferred
TOTAL 25,6 6,0 25,6 6,0 -
Mineral sands Australia
Dongara project (OC) (prospecting)
43,98 Measured 105,9 4,0 105,9 4,0 Indicated 12,8 4,5 12,8 4,5 Inferred 37,8 2,7 37,8 2,7
TOTAL 156,4 3,7 156,4 3,7 -
Exxaro 2015 consolidated mineral resources and ore reserves report
32
Footnotes for Table 6 x %THM – percent total heavy minerals x Mineral resources are quoted inclusive of mineral resources that have been modified to mineral reserves unless otherwise
stated x Rounding figures may cause computational discrepancies x Tonnages are quoted in metric tonnes and million tonnes is abbreviated as Mt x Figures are reported at 100% irrespective of percentage attributable to other shareholders x Estimates as received from Tronox at 31 December 2015 and not audited by Exxaro (excluding Gravelotte sand and
Gravelotte rock estimates which are prepared by Exxaro) x All changes more than 10% (significant) are explained 1 Operation refers to operating mine or significant project. Mining method: OC – open-cut, UG – underground 2 Mine is under closure 3 Cold commissioning began in December 2015 with full production expected by June 2016 4 Increase reflects addition of satellite deposits of Houtkraal, Rietfontein and Graauwduinen 5 Decrease in resource tonnes is mainly the result of mining depletion (-47Mt) and geological model adjustments (-8Mt), for a net change of -55Mt 6 Increase at Cooljarloo west project is due to new drilling and revising models, resulting in a net increase of 72Mt
Exxaro 2015 consolidated mineral resources and ore reserves report
33
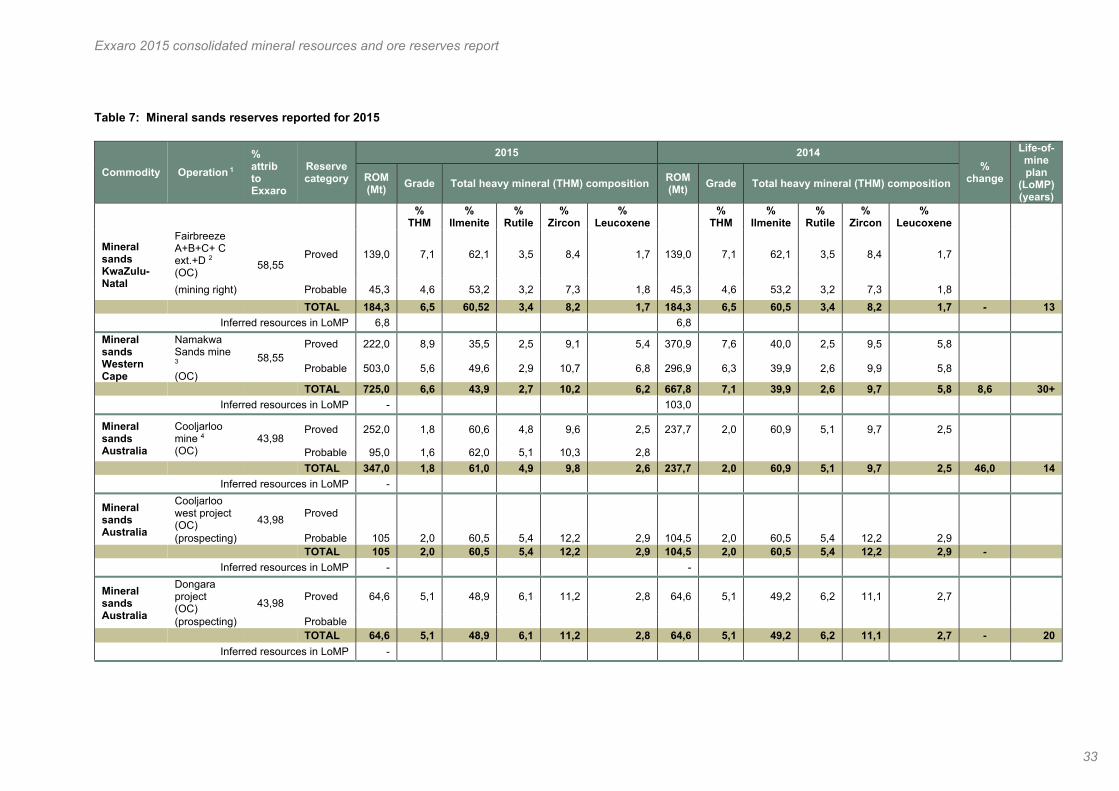
Table 7: Mineral sands reserves reported for 2015
Commodity Operation 1 % attrib to Exxaro
Reserve category
2015 2014 %
change
Life-of-mine plan
(LoMP) (years)
ROM (Mt) Grade Total heavy mineral (THM) composition ROM
(Mt) Grade Total heavy mineral (THM) composition
% THM
% Ilmenite
% Rutile
% Zircon
% Leucoxene %
THM %
Ilmenite %
Rutile %
Zircon %
Leucoxene
Mineral sands KwaZulu-Natal
Fairbreeze A+B+C+ C ext.+D 2 (OC)
58,55 Proved 139,0 7,1 62,1 3,5 8,4 1,7 139,0 7,1 62,1 3,5 8,4 1,7
(mining right) Probable 45,3 4,6 53,2 3,2 7,3 1,8 45,3 4,6 53,2 3,2 7,3 1,8 TOTAL 184,3 6,5 60,52 3,4 8,2 1,7 184,3 6,5 60,5 3,4 8,2 1,7 - 13 Inferred resources in LoMP 6,8 6,8 Mineral sands Western Cape
Namakwa Sands mine 3 (OC)
58,55 Proved 222,0 8,9 35,5 2,5 9,1 5,4 370,9 7,6 40,0 2,5 9,5 5,8
Probable 503,0 5,6 49,6 2,9 10,7 6,8 296,9 6,3 39,9 2,6 9,9 5,8
TOTAL 725,0 6,6 43,9 2,7 10,2 6,2 667,8 7,1 39,9 2,6 9,7 5,8 8,6 30+ Inferred resources in LoMP - 103,0
Mineral sands Australia
Cooljarloo mine 4 (OC)
43,98 Proved 252,0 1,8 60,6 4,8 9,6 2,5 237,7 2,0 60,9 5,1 9,7 2,5
Probable 95,0 1,6 62,0 5,1 10,3 2,8 TOTAL 347,0 1,8 61,0 4,9 9,8 2,6 237,7 2,0 60,9 5,1 9,7 2,5 46,0 14 Inferred resources in LoMP -
Mineral sands Australia
Cooljarloo west project (OC) 43,98 Proved
(prospecting) Probable 105 2,0 60,5 5,4 12,2 2,9 104,5 2,0 60,5 5,4 12,2 2,9 TOTAL 105 2,0 60,5 5,4 12,2 2,9 104,5 2,0 60,5 5,4 12,2 2,9 - Inferred resources in LoMP - -
Mineral sands Australia
Dongara project (OC) 43,98 Proved 64,6 5,1 48,9 6,1 11,2 2,8 64,6 5,1 49,2 6,2 11,1 2,7
(prospecting) Probable TOTAL 64,6 5,1 48,9 6,1 11,2 2,8 64,6 5,1 49,2 6,2 11,1 2,7 - 20 Inferred resources in LoMP -

Exxaro 2015 consolidated mineral resources and ore reserves report
34
Footnotes for Table 7 x %THM – percent total heavy minerals x Rounding figures may cause computational discrepancies x Figures are reported at 100% irrespective of percentage attributable to other shareholders x Tonnages are quoted in metric tonnes and million tonnes is abbreviated as Mt x Reserves are quoted on a run-of-mine (ROM) reserve tonnage basis which represents tonnages delivered to the plant at an
applicable moisture and quality x Inferred resources in life-of-mine plan (LoMP) refer to inferred resources considered for the life of mine plan x Estimates as received from Tronox at 31 December 2015 and not audited by Exxaro x All changes more than 10% (significant) are explained 1 Operation refers to operating mine or significant project. Mining method: OC – open-cut, UG – underground
2 Cold commissioning began in December 2015 with full production expected by June 2016 3 Increase in reserves reflects the addition of satellite areas (+24Mt) and geological model updates and adjustments (+56Mt), offset by mining depletion (-22Mt) for a net increase of 56Mt. Decrease in proved reserves is mainly due to mining depletion and downgrade of the East OFSM reserve after conclusion of feasibility studies 4 Mining depletion and sterilisation (-44Mt) was offset by conversion of resources to reserves (+95Mt) and revision of pit shell using latest drilling data with new economic figures (+61Mt), resulting in a net increase of 110Mt

Exxaro 2015 consolidated mineral resources and ore reserves report
35
Table 8: Base metals resources reported for 2015
Commodity Operation 1 % attrib to Exxaro
Resource category
2015 2014 %
change Tonnes (Mt)
Grade Tonnes (Mt)
Grade
%Zn %Pb %Cu Ag g/t %Zn %Pb %Cu Ag g/t
Base metals Northern Cape
Black Mountain Mining
26
Measured 3,6 3,0 3,0 0,4 34,3 4,1 3,1 3,0 0,4 33,8
Deeps mine (UG) Indicated 9,3 2,4 2,3 0,5 29,8 10,1 2,4 2,3 0,5 29,3
(zinc, lead, copper and silver) Inferred
TOTAL 12,9 2,6 2,5 0,5 30,6 14,2 2,6 2,5 0,5 30,6 -9
Base metals Northern Cape
Swartberg mine (UG) (zinc, lead, copper and silver)
26 Measured Indicated 31,5 0,5 2,4 0,5 25,1 18,8 0,6 2,9 0,5 29,6 Inferred 15,5 0,6 3,1 0,5 32,6 24,4 0,5 2,6 0,5 35,6
TOTAL 47,0 0,5 2,7 0,5 33,0 43,2 0,5 2,7 0,5 33,0 9
%Zn %Pb %Mn %S %Zn %Pb %Mn %S
Base metals Northern Cape
Gamsberg North mine 2
26 Measured 42,3 6,5 0,6 0,7 20,2 80,8 6,8 0,6 0,7 21,2
(OC) (zinc) Indicated 65,0 5,6 0,5 0,6 18,8 73,8 5,6 0,5 0,6 18,7 Inferred 27,4 5,4 0,5 0,6 18,1 27,4 5,4 0,5 0,6 17,7
TOTAL 134,7 6,1 0,5 0,6 19,6 182,0 6,1 0,5 0,6 19,6 -26
%Zn %Zn
Base metals Northern Cape
Gamsberg East 26
Measured (project) (zinc) Indicated Inferred 32,3 9,8 32,3 9,8
TOTAL 32,3 9,8 32,3 9,8 -

Exxaro 2015 consolidated mineral resources and ore reserves report
36
Footnotes for Table 8: x % Zn – percent zinc, % Cu – percent copper, % Pb – percent lead, Ag g/t – grams per tonne silver, % Mn – percent
manganese, % S – percent sulphur x Rounding figures may cause computational discrepancies x Figures are reported at 100% irrespective of percentage attributable to Exxaro x Tonnages are quoted in metric tonnes and million tonnes is abbreviated as Mt x Estimates as received from Vedanta Resources plc at 31 March 2015 and not audited by Exxaro x Resources quoted on a mineable tonnes insitu (MTIS) basis and in addition to those converted to ore reserves x All changes more than 10% (significant) are explained 1 Operation refers to operating mine or significant project. Mining method: OC – open-cut, UG – underground
2 2014 resources were reported inclusive of reserves and 2015 resources are reported in addition to reserves (exclusive)

Exxaro 2015 consolidated mineral resources and ore reserves report
37
Table 9: Base metals reserves reported for 2015
Commodity
Operation 1
% attrib to Exxaro
Reserve category
2015
% change
Life-of-mine plan
(LoMP) (years)
ROM (Mt)
Grade Contained metal
%Zn %Pb %Cu Ag g/t zinc
metal (x1 000t)
lead metal
(x1 000t)
copper metal
(x1 000t)
silver metal
(x1 000t)
Base metals (zinc, lead, copper, silver)
Black Mountain Mining Deeps 2
(UG)
26
Proved 3,0 2,9 3,7 0,3 39,3 88,8 112,4 9,7 0,12
Probable 6,9 2,5 2,4 0,6 29,9 169,3 166,6 43,2 0,21
TOTAL 9,9 2,6 2,8 0,5 33,0 258,1 279,0 52,9 0,32 -15 6
Inferred resources in LoMP -
Base metals (zinc, lead, copper, silver)
Swartberg 3 (UG) 26
Proved
Probable 2,0 0,5 2,4 0,5 20,9 11,0 49,3 10,8 0,04
TOTAL 2,0 0,5 2,5 0,6 22,2 11,0 49,3 10,8 0,04 -27 6
Inferred resources in LoMP -
%Zn %Pb %Mn %S
Base metals (zinc, lead, manganese, sulphur)
Gamsberg 4 (OC) 26
Proved 39,1 6,9 0,5 0,8 21,6
Probable 9,5 5,5 0,5 0,7 16,6
TOTAL 48,6 6,6 0,5 0,8 20,6 - 16
Inferred resources in LoMP 1,8
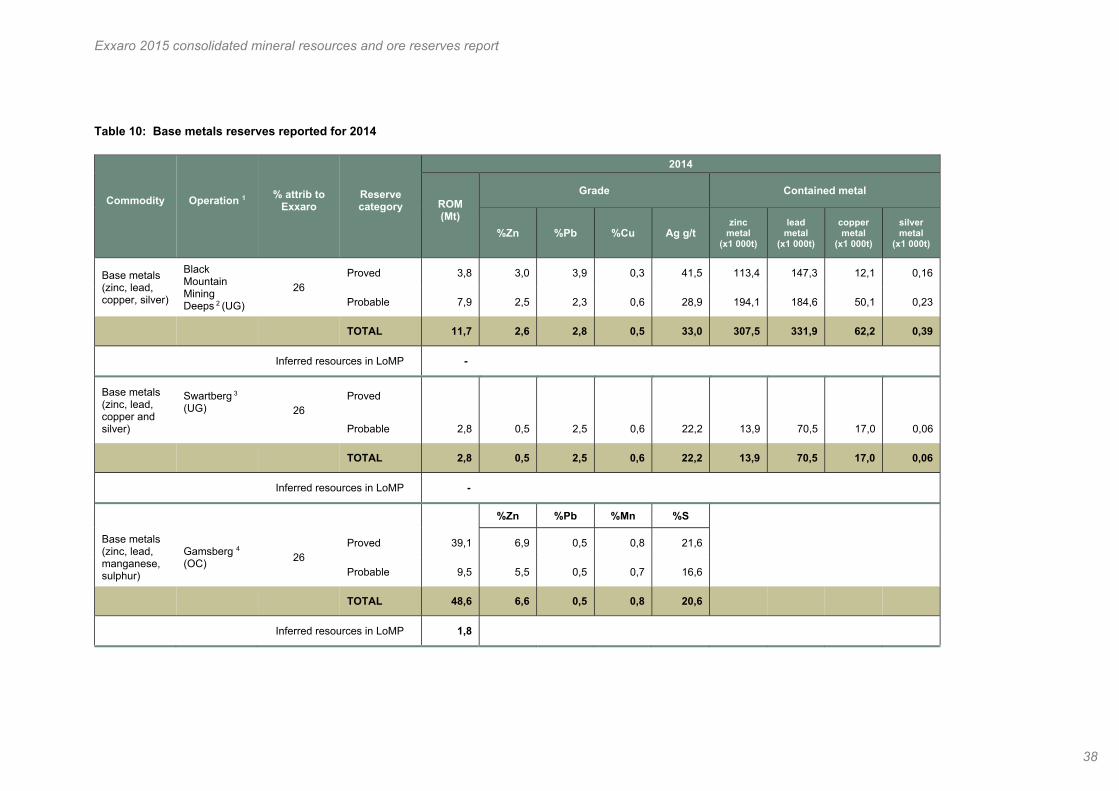
Exxaro 2015 consolidated mineral resources and ore reserves report
38
Table 10: Base metals reserves reported for 2014
Commodity
Operation 1
% attrib to Exxaro
Reserve category
2014
ROM (Mt)
Grade Contained metal
%Zn %Pb %Cu Ag g/t zinc
metal (x1 000t)
lead metal
(x1 000t)
copper metal
(x1 000t)
silver metal
(x1 000t)
Base metals (zinc, lead, copper, silver)
Black Mountain Mining Deeps 2 (UG)
26 Proved 3,8 3,0 3,9 0,3 41,5 113,4 147,3 12,1 0,16
Probable 7,9 2,5 2,3 0,6 28,9 194,1 184,6 50,1 0,23
TOTAL 11,7 2,6 2,8 0,5 33,0 307,5 331,9 62,2 0,39
Inferred resources in LoMP -
Base metals (zinc, lead, copper and silver)
Swartberg 3
(UG) 26 Proved
Probable 2,8 0,5 2,5 0,6 22,2 13,9 70,5 17,0 0,06
TOTAL 2,8 0,5 2,5 0,6 22,2 13,9 70,5 17,0 0,06
Inferred resources in LoMP -
%Zn %Pb %Mn %S
Base metals (zinc, lead, manganese, sulphur)
Gamsberg 4 (OC) 26
Proved 39,1 6,9 0,5 0,8 21,6
Probable 9,5 5,5 0,5 0,7 16,6
TOTAL 48,6 6,6 0,5 0,8 20,6
Inferred resources in LoMP 1,8

Exxaro 2015 consolidated mineral resources and ore reserves report
39
Footnotes for Tables 9 and 10: x % Zn – percent zinc, % Cu – percent copper, % Pb – percent lead, Ag g/t – grams per tonne silver, % Mn – percent
manganese, % S – percent sulphur, NA – not applicable x Rounding figures may cause computational discrepancies x Figures are reported at 100% irrespective of percentage attributable to Exxaro and refer to March 2015 only x Tonnages are quoted in metric tonnes and million tonnes is abbreviated as Mt x Reserves are quoted on a run-of-mine (ROM) reserve tonnage basis which represents tonnages delivered to the plant at an
applicable moisture and quality x Inferred resources in life-of-mine plan (LoMP) refer to inferred resources considered for the life-of-mine plan x Estimates as received from Vedanta Resources plc at 31 March 2015 and not audited by Exxaro x All changes more than 10% (significant) are explained 1 Operation refers to operating mine or significant project. Mining method: OC - open-cut, UG – underground
2 Change in reserve tonnages mainly due to production (-1,35Mt), conversions (+0,25Mt), economic assumptions (-0,31Mt), transfers (+0,09Mt) and reconciliation adjustments (+ 0,06Mt) 3 Change in reserve tonnages are mainly the result of production (-0,25Mt), conversions (-0,05Mt), economic assumptions (+0,15Mt), new information (+0,06Mt), transfers (-0,65Mt) and reconciliation adjustments (-0,01Mt) 4 Reserves are declared after concluding a feasibility study

Exxaro 2015 consolidated mineral resources and ore reserves report
40
Table 11: Iron ore resources reported for 2015
Commodity Operation 1 % attrib to Exxaro
Material type 2
2015 2014
Measured (Mt)
Indicated (Mt)
Inferred (Mt)
Total (Mt)
Grade
Fe % Measured
(Mt) Indicated
(Mt) Inferred
(Mt) Total (Mt)
Grade
Fe % %
change
Iron ore Republic of the Congo (RoC)
Mayoko mine (OC) 100
Transported ore 41 34 0 74 46,1 41 34 0 74 46,1
Capping 0 10 0 10 56,1 0 10 0 10 56,1 Enriched BIF 0 28 52 80 43,6 0 28 52 80 43,6 Transitional BIF 0 20 44 63 35,1 0 20 44 63 35,1
Fresh BIF 0 86 482 568 33,4 0 86 482 568 33,4 TOTAL 41 177 577 795 36,0 41 177 577 795 36,0 -

Exxaro 2015 consolidated mineral resources and ore reserves report
41
Footnotes for Table 11: x Fe % refers to in-situ Fe content, %Fe – percent iron x Rounding figures may cause computational discrepancies x Tonnages are quoted in metric tonnes and million tonnes is abbreviated as Mt. Resources quoted on a mineable tonnes in-
situ (MTIS) basis. A 20% Fe cut off was applied x Figures are reported at 100% irrespective of percentage attributable to Exxaro and refer to 2015 only x All changes more than 10% (significant) are explained 1 Operation refers to operating mine or significant project. Mining method: OC – open-cut, UG – underground
2 Transported ore consists of primarily hematite clasts in a clay matrix. Capping is hard consolidated ore formed by in-situ supergene enrichment of agglomerated hematite and goethite clasts. Enriched banded iron formation (BIF) is weathered ferruginous quartzites (BIF), enriched through leaching of quartz and oxidation of magnetite to hematite. Similar to enriched BIF, transitional BIF represents an equal to higher magnetite to hematite ratio. Fresh BIF is ferruginous quartzites (BIF) and magnetite ore with limited mineralogical changes

Exxaro 2015 consolidated mineral resources and ore reserves report aro 2015 consolidated mineral resources and ore reserves report
42
8 ATTRIBUTABLE RESOURCES
Exxaro includes all estimates directly under its management control and estimates of entities in which
Exxaro holds an equal or larger than 25% interest. Mineral resources and ore reserves are reported at
100%, irrespective of the percentage attributable to Exxaro.
The percentage attributable tonnage can be deducted from the attributable ownership stated in the
summarised mineral resources and ore reserves tables. The summarised tonnages are shown in
Table 12.
Table 12: Attributable resource and reserve tonnages
Commodity Resource category
2015 2014 % change Reserve
category
2015 2014 % change
MTIS (Mt) MTIS (Mt) ROM (Mt) ROM (Mt)
Coal Measured 1 4 997 4 607 8 Proven 3 066 2 970 3
Indicated 2 2 519 4 163 -39 Probable 794 797
Inferred 3 7 020 6 050 16
TOTAL 14 536 14 821 -2 TOTAL 3 860 3 768 2
Iron ore Measured 41 41 Proven
Indicated 177 177 Probable No reserves declared
Inferred 577 577
TOTAL 795 795 TOTAL Mineral sands Measured 705 599 18 Proven 351 432 -19
Indicated 724 712 2 Probable 409 246 66
Inferred 528 541 -2
TOTAL 1 937 1 852 5 TOTAL 760 677 12 Base metals Measured 11,9 22,1 -46 Proven 11,0 11,1 -2
Indicated 27,5 26,7 3 Probable 4,8 5,3 -9
Inferred 19,5 21,9 -11
TOTAL 59,0 70,6 -16 TOTAL 15,7 16,4 -4
Footnotes for Table 12: x MTIS refers to mineable tonnes in-situ and ROM to run-of-mine reserves x Tonnages are quoted in metric tonnes and million tonnes is abbreviated as Mt 1 The increase in attributable measured resources is largely due to the acquisition of TCSA mineral assets (+178Mt) and conversion of resources at Thabametsi project (+270Mt) 2 Change primarily reflects the conservative classification methodology applied at Thabametsi project (-1 830Mt). This change was marginally offset by the first-time reporting of coal resources at Zonderwater project 3 Increase reflects the acquisition of TCSA mineral assets (+333Mt), updated classification of resources at Thabametsi project (+650Mt) and first-time reporting of resources at Zonderwater project (+51Mt)

Exxaro 2015 consolidated mineral resources and ore reserves report
43
9 ESTIMATION METHODOLOGY SUMMARY
9.1 MINERAL RESOURCES The resource estimation process for mineral resources under Exxaro’s control is governed by the
group’s resource estimation procedure and aligned to the SAMREC Code and SANS 10320:2004
standard. The data used for resource estimation is managed by separate commodity-specific
procedures through which core recovery and logging, sampling, quality assurance and quality control,
relative density determination and wireline logging standards are enforced.
For coal resources, relative density (air-dried) is determined by accredited laboratories using the
Archimedes method in all instances except for Grootegeluk mine and the Thabametsi project, where
relative density is determined using a field application of the Archimedes method. A comparative
study between the field and laboratory methods was undertaken in 2015, and results indicated there
is no significant difference between the two.
ITEM DESCRIPTION TIMELINE
Resource fact pack
Lists new information since last estimation, together with a reconciliation between predicted MTIS and actual MTIS. Recommendations from internal/external audits are included.
February
Technical data validation
Technical validation of data to be used for resource estimation, including collar validation, gaps and overlaps checks, data distribution, etc.
March
Data analysis Entails a review and analysis of the geological integrity and continuity of data in a spatial and geostatistical sense. Includes domaining and structural interpretations.
April
Data modelling
Geovia Minex is used for coal modelling and the Minex growth algorithm is the preferred interpolation technique. ESRI ArcGIS is used for modelling structural features. Sable Data Warehouse (SDWh) or Minex is used for coal compositing and, in both instances, representative substitute values are used for unsampled non-coal material. The geological model and structural interpretation is presented by the resource CP, aided by the relevant technical specialists, to a panel comprising Exxaro lead CP and domain experts for sign-off and approval. Concept-level geological models, where applicable, are compiled for alternative interpretations and these risks evaluated during sign-off. Feasibility-level and LOM-level geological models are based on reviewed and signed-off interpretations.
June
Resource classification
Resource classification is undertaken as per Exxaro estimation procedure and aligned with SANS 10320:2004. Anomalous drillhole data and structurally complex areas are accounted for and resource classification is used to control the adequacy of drillhole data. Separate confidence zones are determined for structural features based on a matrix approach. The effect of extrapolation is controlled by resource classification in which classification domains are not extrapolated beyond half the average drillhole spacing for the classification category. Only points of observation with applicable quality data are used for classification.
August
Estimation and reporting
Resource reporting uses approved cut-offs and geological loss domains followed by completing all necessary reports and audit trails. Exxaro currently uses a systematic review process that measures the level of maturity of exploration work done, the extent of geological potential and security of tenure and associated geological risks to establish an eventual extraction outline (EEO).
October
Review and consolidation
Individual reports are reviewed and corrections effected if necessary. Reports are endorsed by management and used to compile the consolidated mineral resource and ore reserves report.
December

Exxaro 2015 consolidated mineral resources and ore reserves report
44
A formal, annually-compiled and signed-off exploration strategy outlines planned activities to
investigate areas of low confidence and/or geology or structural complexities to ensure resources with
a high level of geological confidence are considered for mine planning. Exploration plans are available
as supplementary information to the annual competent person’s report (CPR).
The resource estimation process is summarised below and applies to all coal operations and projects
under Exxaro’s management control. The resource competent person (CP) is actively involved
throughout the process and no data is included/excluded without consent from the CP.
9.2 ORE RESERVES Ore reserves have the same meaning as mineral reserves as defined in the applicable reporting
codes. Ore reserves are estimated using the relevant modifying factors at the time of reporting
(mining, metallurgical, economic, marketing, legal environmental, social and regulatory requirements).
Modifying factors are signed-off before and after reserve estimation by the persons responsible for
ensuring that all factors are timeously and appropriately considered. Comprehensive modifying factor
sign-off and reserve fact packs that record losses, recoveries/yields and other factors applied are
documented in each independent CP’s report.
Exxaro is keenly aware of the importance of its mineral assets, both for the short-term profitability of
its operations and the sustainability of the company. The optimisation of mineral assets beyond what
is generally referred to as mineral resource management is being driven as a priority. Changes in the
resources market, increased awareness of protecting the natural environment and changing
legislation and statutory requirements demand a change in the utilisation strategy and execution of
mining operations. Exxaro continuously assesses the various life-of-mine (LoM) strategic plans to
consider the best way of addressing these challenges.
For reserve estimates to be compliant with the life-of-mine policy, the following supporting inputs are
required for all reserve estimates: survey, rock engineering, infrastructure and an environmental as
well as reserve estimation scoping report.
The following outputs are generated after successfully completing the procedure: validation and
verification report, mining block model, exploitation strategy report, mining schedule and equipment
strategy report, and reserve estimation report.
At the start of the estimation process, the applicable reserve CP must compile, for every operation, a
reserve fact pack report outlining the standards and norms of that operation as well as all relevant
planning standards. Also considered are all standards and norms and planning parameters, the
geological model, infrastructure and environmental plans together with the structural plan,
geotechnical review report, and others. The market strategy, supply contracts and planned volumes

Exxaro 2015 consolidated mineral resources and ore reserves report
45
drive the schedule. All operations standards must be signed off by the applicable mine management
and reserve CP.
A similar procedure is followed for projects, with the project steering committee fulfilling the role of
mine management.
Reserve estimation may be conducted either as required, eg for a project stage evaluation, or as part
of the annual mineral resource and ore reserve estimation process. The data conversion, validation
and verification report are the first outputs of this procedure.
On receipt of the geological model, the validation procedure is run, and the model is converted into a
mining model, after which a report is compiled with possible geological model anomalies, and a
comparison of volumes in the geological model and mining model to confirm data conversion has
been carried out correctly. This information is signed off as acceptable by the resource CP and
manager: strategic mine planning and design.
The following components are included in the LoMP and reserve estimation: exploitation strategy,
operational methodology and pit shell.
The exploitation strategy needs to broadly demonstrate the pit/mining economics, in terms of resource
boundaries, legal and other, ie servitudes. For example, when converting the resource to reserve,
explain the economics, in terms of stripping ratio, underground versus open-pit, etc. Lastly, the
extraction sequence of mining different areas in terms of access, economics or other criteria deemed
most appropriate.
Operational methodology takes cognisance of: x Material flow explains the flow of material over time, ie open-pit – ex-pit, distances horizontal and
vertical; underground – geographical expansion versus stoping; and deep pit – push-back strategy,
minimum and maximum stripping curves
x Equipment explains the size and type of equipment for the design, including the life of equipment, major
interventions and/or major changes (ie open-pit to underground) over the life of the resource
x Waste dumps (size and position), rehabilitation (main issues and interventions) together with legal and
other – indicates licences obtained and required
x Pit shell is the final delineation or envelope of the resource that will be converted to a reserve. The
LoMP pit shell is the foundation of the business case and, as such, is based on the most accurate
information available at that time
x Measured and indicated resources are used as basis for conversion. The first five years of the LoMP
must be covered by at least 80% measured.
Resource volumes/tonnages are converted to reserve tonnages by applying the following mining
modifying factors:

Exxaro 2015 consolidated mineral resources and ore reserves report
46
x Mining efficiency losses – as per average cut thickness. This factor is applied to account for net losses
of reserves due to mining equipment selection and mining method. The efficiency factor also accounts
for the thickness of the selected ROM and waste horizons relative to selected mining equipment
x Layout losses account for the loss of reserves due to actual mining activities not reaching the defined
reserve boundary or due to the geometry of the reserve block
x ROM extraction accounts for losses incurred using the selected mining method
x Contamination accounts for waste or inter-burden material unintentionally added to the mining horizon
as a result of mining operations and equipment used
x Free moisture accounts for the change in the reserve tonnage due to the addition of moisture from
bench-mining operations.
The reserve classification methodology for mineral reserves under Exxaro’s control is governed by the
Exxaro reserve estimation procedure and aligned to the SAMREC Code and SANS 10320:2004
standard. In most instances, measured resources are converted to proved reserves and indicated
resources are converted to probable reserves. If an operation or project has additional constraints,
however, ie a supply agreement that has not been finalised or a sales/marketing strategy that limits
the profitability of the mine, the measured resources can be downgraded to probable reserves. In
situations where this has been applied, it is clearly stated in the footnotes for the reserves tables.
Where inferred resources were considered for life-of-mine plans, the amount (Mt) and effect is always
clearly stated. When inferred resources are included in the life-of-mine plan, these tonnages are
never scheduled in the first five years of mine life. The rationale for considering inferred resources’
inclusion is explained and actions to address this issue are stated. Exxaro does not allow more than
15% of inferred resources to be considered for life-of-mine plans. Any inclusion of inferred resources
must be explained and modifying factors and assumptions that were applied to the indicated and
measured resources to determine the ore reserves must be equally applied to the inferred resources.
However, inferred resources are not converted to mineral reserves and are not stated as part of the
mineral reserve. The amount of inferred resources considered for the reported life-of-mine plan is
included in the reserve statement.

Exxaro 2015 consolidated mineral resources and ore reserves report
47
10 ANCILLARY RESOURCE AND RESERVE INFORMATION BY OPERATION
Supplementary descriptions are provided for projects and operations directly under Exxaro’s
management control. For projects and operations included in the Exxaro mineral resource and ore
reserve statement but in which Exxaro does not have management control, the reader is referred to
that company’s website for supplementary information (refer to foreword).
10.1 ARNOT COAL MINE Overview Arnot mine is 43km east of Middelburg in Mpumalanga, South Africa, and was contracted to supply
coal to the nearby Eskom Arnot power station until 31 December 2015. This was achieved by
extracting no 2 seam lower (S2L) from two underground shafts, namely no 8 and no 10 shafts, using
mechanised mining equipment (bord-and-pillar extraction) while Mooifontein open-cast used
conventional truck-and-shovel, roll-over mining method to extract S2L and no 1 seam (S1).
Figure 7: Arnot mine History
Arnot mine has been producing thermal coal for over 40 years, using various mining methods,
predominantly bord-and-pillar (currently mechanical), open-casting and shortwalling between 1995
and 2005.

Exxaro 2015 consolidated mineral resources and ore reserves report
48
Arnot had a 40-year coal-supply agreement (CSA) with Eskom, supplying the adjacent Arnot power
station, which ended on 31 December 2015. There are, however, still significant areas that can be
exploited as thermal coal, based on reasonable economic assumptions. Studies are under way to
determine the future exploitation of the existing mineral resources.
Geology
The S1 and S2 are the only coal seams of economic interest in the Arnot mining right area, and these
correlate with the typical Witbank coalfield seams. The pre-Karoo basement topography consists of
both felsites and diabase intrusives associated with the Transvaal supergroup and Bushveld igneous
complex respectively. The Vryheid formation is conformably deposited on top of the reworked glacio-
fluvial tillite of the Dwyka group.
Resource evaluation The long-term geological model was updated in Minex geological modelling software and entailed the
inclusion of 160 new drillholes and exclusion of 431 historical drillholes due to geological and survey
discrepancies. Some 2 458 drillholes were used for resource estimation, using the Minex growth
algorithm. Coal-quality compositing was conducted in Minex on a weighted average basis and signed-
off substitute values were used for unsampled in-seam material. The 2015 updated resource
classification was based on SANS 10320:2004 guidelines together with consideration of the mine’s
risk and opportunity domain analysis (RODA) model, the results of which yielded an increase in
measured and indicated resources and decrease in inferred resources.
Figure 8: Typical north-south (B-Bˈ) section through Arnot geological model (10x vertical exaggeration) Criteria for estimating mineable tonnes in-situ (MTIS) include visually determined coal thickness and
quality continuity, a 1,8m thickness cut-off for underground resources, a 1,0m thickness cut-off for
open-castable resources and a maximum ash content of 35% across the resource. A 10% geological
loss was applied.

Exxaro 2015 consolidated mineral resources and ore reserves report
49
Changes and movements between various categories of the resources are attributed to the
following:
Mining depletion: ROM tonnes extracted from 1 January 2015 to 31 December 2015. The depletion
was calculated using the 2015 resource model by creating new strings for areas between 2014 and
2015 mined-out masks, accounting for a 2,3Mt decrease. All underground pillars are discounted in
this regard as there are no immediate plans for pillar extraction.
Model refinement: A decrease of 21,62Mt was attained through refined data validation and modelling
techniques, including S2L correlation and redefinitions. A more stringent approach in resource
classification was applied to better comply with the SANS code and Exxaro policy. In addition, the
deselection of 415 drillholes due to digital terrain model (DTM) variation contributed to the decrease in
the mineral resource.
New information: A total gain of ~1,3 Mt was the result of new drillhole information (160 new
drillholes).
Reserve evaluation From an ore reserve perspective, there has been a significant change due to the expiry of the CSA
with Eskom. There are, however, several areas that are still economically viable, based on reasonable
Exxaro economic/cost assumptions. The Mooifontein open-cast feasibility study, L9 prefeasibility
study and Schoonoord prefeasibility study are impacted by the expiry of the CSA and will be reviewed
in 2016.
Reserve evaluation is undertaken at the mine using X-pac software and aligned with the 2015 Arnot
LoMP (based on 2014 geological model) as provided by Exxaro mining processes, corporate office.
During the reserve estimation process, each of the scheduled polygons is assigned all the parameters
required for running the mine’s X-pac model, ie seam thickness, relative densities, raw qualities and
washability tables, where available and applicable. For the 2015 X-pac model, scheduling was done
on 2015 budget tonnes provided by mine management.
As a result of the CSA expiring, the entire reserve base was re-evaluated and only coal that could be
extracted economically (based on reasonable assumptions) has been reported as reserves. Due to
uncertainty about the CSA, all reserves are reported in the probable reserve category. The primary
decrease in reserves is therefore due to the expiry of the Eskom CSA.
10.2 BELFAST PROJECT Overview
The Belfast project aims to commission an open-cast coal mine in Mpumalanga, South Africa. The
mine aims to produce A-grade steam coal for the export market, as well as middlings products of
thermal coal for local consumption. The project area, some 10km south-west of the town of Belfast, is
accessed via the N4 national road.

Exxaro 2015 consolidated mineral resources and ore reserves report
50
In 2015, a study was undertaken to evaluate the effect of using only drillholes drilled by Exxaro versus
using all available (historical) drillhole data. For the study, a model that used only data derived from
Exxaro-drilled drillholes was compared to a model that included all available drillhole data. The
investigation concluded that the quality of historical information was of a standard that would not
affect resource and reserve estimations and all validated drillholes could therefore be used with
confidence for current and future modelling.
History
From 1967 to 1983, 78 drillholes were drilled. Of these, 43% were drilled by the Fuel Research
Institute of South Africa (FRI) and Trans-Natal Steenkoolkorporasie Beperk (TNS). Eyesizwe Mining
Ltd conducted some drilling between 2001 and 2003 and Exxaro Resources’ current drilling campaign
started in 2008. To date, 153 drillholes have been drilled on the farms Zoekop 426JS, Leeuwbank
427JS and Blyvooruitzicht 383JT.
Geology
The project area is in the Witbank coalfield and consists of four regionally correlated seams and a
local seam. In some areas, seam 4 (S4) is weathered away. The seams are generally divided by an
upward coarsening cycle of basal carbonaceous mudstone, carbonaceous siltstone, fine-grained
sandstone and medium to coarse-grained sandstone. The parting between seam 3 (S3) and seam 2
(S2) consists of two sedimentary cycles. The top cycle is a 2-3m upward fining cycle, followed by a 4-
6m upwards coarsening cycle. The strata in which the coal seam occurs consist predominantly of fine,
medium and coarse-grained sandstone with subordinate mudstone, shale, siltstone and
carbonaceous shale.
Figure 9: Belfast project

Exxaro 2015 consolidated mineral resources and ore reserves report
51
Resource evaluation Evaluation of the Belfast project began in 2007 and several resource estimates have been generated
to date. Initial studies focused on data integrity and a complete database validation of the then GBIS
database, sourced from Eyesizwe, was completed in 2007 before a geological model comprising
Eyesizwe-only drillholes was compiled in 2008. Subsequent geological models, all compiled in Minex
geological modelling software and using the Minex growth algorithm, entailed updates with validated
Exxaro drillholes and model refinements based on technical integrity. Coal quality compositing is
undertaken in Minex on a weighted average basis. Resource classification is based on SANS
10320:2004 guidelines, initially applied using Minex distance-gridding functionality and later changed
to hand-drawn polygons to maintain geological continuity. An overview of the estimation history is as
follows: x BF_010107_010208_CS: Concept study model based on validated historical data sourced from
Eyesizwe. The data cut-off date was 1 January 2007 and the model was signed-off on 1 February 2008
x BF_010608_010908_PFS_ALT1: An interim model based on the updated concept study model with all
Exxaro drillholes available as at 1 June 2008. The model was signed-off on 1 September 2008
x BF_010209_010809_PFS: The final prefeasibility-level model included all validated Exxaro and
historical drillholes. Resource classification was based on Minex distance gridding and was
discontinuous (‘spotted-dog effect’)
x BF_010209_010212_BFS: The prefeasibility-level model was updated in 2012 to address minor
technical issues in the independent modelling of washability variables. This model was used for the
feasibility study and was audited in 2014 by Mineral Corporation. The updated resource classification
polygons were considered acceptable by Mineral Corporation
x BF_010209_011015_CS: A concept study model based on Exxaro drillholes only for comparison
against the feasibility study model. There was an insignificant difference between the two models, with
tonnages and coal qualities being within 5% in most instances. This model estimated marginally higher
product yields (<5%) and, to remain conservative, the decision was taken to use the feasibility study
model as completed in 2012.
Figure 10: West-east cross section through the 2012 geological model (10x vertical exaggeration)

Exxaro 2015 consolidated mineral resources and ore reserves report
52
Resource estimation figures were updated in 2015 due to refined estimation methodology and
misalignment between resource and reserve estimates. Reasons for the movements are as follows:
Economic assumptions: A 5% geological loss factor was applied to the resource and at a minimum
thickness of 1m. The net result of this change is a ~7,3Mt decrease in estimated resource tonnes.
Methodology change: Historically, the classification of resources was conducted strictly according to
Minex distance gridding. This approach was changed in 2012 to better reflect the underlying
continuity, while adhering to the SANS code. The change resulted in a ~12,5Mt increase in estimated
resource tonnes.
Model refinement: The 2012 model update resulted in a ~0,7Mt decrease in estimated resource
tonnes.
Reserve evaluation The 2012 geological model was used for the Belfast bankable feasibility study, together with a
geotechnical report dated 2012 (Belfast feasibility study: geotechnical investigation). The geological
data was used as supplied and no compositing was necessary in terms of plying. The data was
aggregated and averaged from the smaller geological grid sizes of 25m x 25m to the mining blocks
that are orientated to the mining direction and 45m x 45m in size.
The reserve model is a replica of the resource model, but with added modifying factors. The level of
investigation for the Belfast reserve is a completed and approved feasibility study.
The modifying factors used are: x Mining method: A modified benching with doze-over strip mining method is used
x Geotechnical: For highwall stability, soft material is mined at least one strip ahead of hard and coal-
mining activities
x Geohydrological: The pit floor was taken into consideration to minimise water handling in the pit face
x Mining limits: The following mining limits were applied to the resource model:
o Economic cut-off
o Farm boundary cut-off – only farms bought for phase 1 of the project were considered
o Tenure and licence approvals
o Seam thickness – only seams with a thickness of more than 1m were considered
o Environmentally sensitive areas such as waterways and wetlands.
x A factor of 5% was applied to ROM as a mining loss. The quality of coal was considered not to be
affected by the mining loss
x A contamination factor of 0,1m of floor (footwall) was added onto the ROM and qualities duly adjusted.
The assumption was for a CV of 0MJ/kg and ash of 100%
x The plant is designed to make a primary export product as well as a secondary local thermal product. A
slimes loss of 6% and plant efficiency factor of 94,5% were applied to calculate the resultant product.
It is expected that total reserves will be depleted within 17 years, whereas the allowable period as
prescribed by the mining right is 30 years. It should be noted that there are resources that fall outside
the reserve due to various factors which could increase LoM. An amount of 0,5Mt inferred resources
was considered for the LoMP but not converted to reserves. Proved reserves are derived from the

Exxaro 2015 consolidated mineral resources and ore reserves report
53
measured resource category. Northern-located measured and indicated resources have not been
converted to reserves due to outstanding surface-purchasing agreements.
10.3 GROOTEGELUK COAL MINE Overview
Grootegeluk is Exxaro’s flagship mine, 18km west of Onverwacht and 22km west of Lephalale. It is a
surface coal-mining operation on the shallow open-castable portion of the Waterberg coalfield.
The past year has been characterised by a major operational adjustment in response to increased
production to supply Medupi power station. Mining operations obtained new equipment, accompanied
by a major focus on sweating/fully utilising current assets to ensure the required additional ROM
volumes were achieved. This was complemented by the full commissioning of two beneficiation plants
to process the required power-station product and a larger capacity waste discard system. Although
there were challenges initially, current full product stockpiles on Grootegeluk and Eskom beds
illustrate how the operation has adapted to producing at high tempos.
History
The Waterberg coalfield was discovered in March 1920 during water-drilling operations on the farm
Grootegeluk 459LQ, Limpopo. The discovery was followed by a reconnaissance study of the area by
two geologists, Dr AL du Toit and HF Frommurze. A few short drillholes were drilled and Trevor & Du
Toit (1922) summarised the results, which at the time, amounted to a discovery of scientific interest.
The results of a later in-depth study by the Geological Survey and Fuel Research Institute indicated
vast resources of metallurgical and non-metallurgical coal.
Figure 11: Grootegeluk mine

Exxaro 2015 consolidated mineral resources and ore reserves report
54
Iscor (now Exxaro) later acquired property rights to six farms in the Waterberg coalfield, on which 120
holes were drilled. Over a number of years, Iscor obtained bulk samples of coal for coking tests from a
prospecting shaft on the farm Grootegeluk. Additional coking samples were obtained from large-
diameter drillholes (254mm core).
In May 1973, Iscor started an intensive exploration programme on the six farms originally purchased
for a final quantity and quality assessment of the resource on these properties. In 1975, a trial box-cut
was established to obtain a bulk sample for beneficiation tests. The outcome of feasibility studies led
to Grootegeluk mine being commissioned in 1980 (originally designed to supply semi-soft coking coal
as a reduction agent in Iscor’s steel-production process).
An agreement was later reached with Eskom to provide coal to a power station with 4 200MW
generation capacity. Based on the projected life of this power station (Matimba), a pit layout
containing 40 years of saleable thermal coal was designed. In addition to producing power station
coal, the mine also produced semi-soft coking coal through a double-stage beneficiation plant, known
as GG1.
As the ramp-up of Matimba power station progressed, another beneficiation plant, GG2, was
commissioned to augment thermal coal supply to the power station. GG2 is a single-stage
beneficiation plant running at an average separation density of 1,95g/cc.
To cope with the full demand of Matimba power station, after it started generating electricity at design
capacity, another beneficiation plant, GG3 (crushing and screening only), was brought on line.
As the market for medium to low-phosphorous coal evolved, another beneficiation plant, GG4/5, was
commissioned to produce metallurgical coal for direct reduction and other smaller market applications,
like the cement and tobacco industries.
In 2013, two additional plants (GG7 and GG8) were erected to supplement what was already the
largest coal beneficiation complex in the world to produce coal needed by the Medupi power station.
GG7 and GG8 are similar in operation to GG3 and GG2, respectively.
The current pit layout was designed to cater for the remaining Matimba power-station contract as well
as for the 4 770MW Medupi power station which started construction in 2007. This new layout was
approved in 2012 and came into effect in that year. The remaining reserves reported here are
therefore based on the 2012 pit layout.
Geology
Grootegeluk mine is in the Waterberg coalfield which has an east-west striking length of some 88km,
complemented by a north-south width of around 40km, that lies in the Republic of South Africa, and

Exxaro 2015 consolidated mineral resources and ore reserves report
55
extends westward into Botswana. The coalfield is underlain by the Waterberg group and is fault-
bounded along the southern and northern margins by the Eenzaamheid and Zoetfontein faults,
respectively.
The upper part of the coal deposit, the Volksrust formation (some 60m thick), comprises intercalated
mudstone or carbonaceous shale and bright coal layers. It displays a well-developed repetition of
coal-shale assemblages that can be divided into seven discrete sedimentary cycles or zones (zone 11
– zone 5). The terms ‘zone’ and ‘sample’ are used in the Waterberg coalfield instead of ‘seam’ and
‘ply’ due to the site-specific intercalated nature of the coal and shale. The Volksrust formation is
classified as a thick interbedded seam deposit type according to the South African guide to the
systematic evaluation of coal resources and coal reserves (SANS 10320: 2004).
The Vryheid formation (roughly 55m thick) forms the lower part of the coal deposit and comprises
carbonaceous shale and sandstone with interbedded dull coal seams varying in thickness from 1,5m
to 9m. Due to its nature, the Vryheid formation is classified as a multiple seam deposit type according
to the South African guide to the systematic evaluation of coal resources and coal reserves (SANS
10320: 2004). There are five coal zones in the Vryheid formation, predominantly dull coal, with some
bright coal developed at the base of zones 2, 3 and 4. Due to lateral facies changes and variations in
the depositional environment, these zones are characterised by a large variation in thickness and
quality. It appears that these zones depreciate in a westerly direction as observed within the mining
rights area due to lateral facies changes.
Resource evaluation Resource evaluation at Grootegeluk is an extensive process and entails coal analysis and
beneficiation simulation in Sable database software and geological modelling in Minex, using the
Minex growth algorithm. Separate coal and shale (stratigraphically identified) samples are taken and
these need to be composited first into combined coal/shale samples and subsequently into benches.
The washability tables present proximate analyses from fractional densities of 1,35g/cm3 to 2,2g/cm3
and coal product simulation is undertaken in Sable and modelled in Minex. Approximately 611
drillholes were used resource estimation, of which 444 contained coal-washability analyses.
Resource classification is largely based on SANS 10320:2004 guidelines for thick interbedded coal
and incorporates geostatistical studies that justify a 500m x 500m drill spacing for measured
resources. A 0,5m thickness cut-off and reconciliation-based bench-specific geological losses are
applied to convert GTIS to MTIS. Refining the estimation methodology resulted in a minor decrease of
~144Mt, with mining depletion accounting for a ~46Mt decrease.

Exxaro 2015 consolidated mineral resources and ore reserves report
56
Figure 12: Typical west-east section through Grootegeluk geological model
Reserve evaluation X-pac mine scheduling software is used to derive remaining saleable reserves from ROM reserves
contained in the approved pit layout. After converting the geological model’s grids to the appropriate
format, the floor, roof and thickness data as well as quality data for each bench is imported into the X-
pac model. With this model, validations are performed to evaluate the data for possible mistakes,
such as incremental yields for each bench rising with increases in relative float densities. The
resource category areas are also loaded into the X-pac model for reserve categorising purposes. In-
situ indicated resources are converted to probable in-situ mineable reserves and in-situ measured
resources are converted to proved in-situ mineable reserves. The reserve model is on the LoM level
of investigation.
10.4 THABAMETSI PROJECT Overview The Thabametsi project aims to commission an open-cast coal mine in Limpopo, South Africa. The
project area is 22km west of the town of Lephalale and adjacent to Exxaro’s Grootegeluk mine.
The project area is divided into a northern open-cast portion, and a southern underground area. The
northern portion aims to produce power station coal for an on-site independent power producer (IPP).
This portion (phase 1) of the project has reached feasibility stage in its project life cycle and studies
on the southern project area are ongoing.
History
Drilling on the Thabametsi project area began in 1979 during a regional exploration of the Waterberg
conducted by Iscor. This regional investigation was prompted by positive results on adjacent farms,
where Grootegeluk mine began production in 1980. As part of this regional exploration, one drillhole
was drilled on all farms of interest. On farms where results were promising, follow-up drilling was

Exxaro 2015 consolidated mineral resources and ore reserves report
57
conducted in 1980/81. During this time, eight drillholes were drilled on four of the five Thabametsi
farms: McCabesvley, Jackalsvley, Zaagput and Vaalpensloop.
In 1988, two drillholes were drilled on the remaining farm, van der Waltspan, to complete the regional
exploration of the Thabametsi project area. All regional exploration during this time, except the
drillholes on van der Waltspan, was conducted through rotary core diamond drilling using an NQ-sized
(47,5mm) core barrel. The drillholes on van der Waltspan used a T6-146 (123mm) sized core barrel.
In 2008, exploration activities began in earnest on the project area. Since the start of the latest drilling
programme, 61 drillholes have been drilled on Thabametsi at a cost of R49,7 million. All drillholes
completed on the project site since 2008 were made using a T6-146 sized core barrel to produce a
123mm diameter core.
Geology
The geology is similar to Grootegeluk’s geology but increased weathering and deteriorating coal
qualities necessitated a different bench configuration. A cross section through the geological model is
presented in Figure 14.
Resource evaluation Resource estimation and data-compositing methods are aligned to the methodology applied at
Grootegeluk and described above. In recent years, five models have been built for the Thabametsi
project area. The model versions and their purpose are summarised in Table 13. Each model is
named according to the abbreviated operation or project name, data cut-off date, model completion
date and level of study. Resource classification is, throughout the Volksrust and Vryheid formations,
based on SANS 10320:2004 guidelines for multi-seam deposits. This approach is recognised as more
Figure 13: Thabametsi project

Exxaro 2015 consolidated mineral resources and ore reserves report
58
conservative than also applying guidelines for thick interbedded type deposits as well as the
classification methodology applied at the adjacent Grootegeluk mine. It was chosen to remain
conservative at feasibility study level and it is envisaged that the classification methodology will be
reviewed once a geostatistical study into optimum drillhole spacing is finalised in 2016. Some 112
drillholes were used for resource estimation, all of which contain coal-washability data. A thickness
cut-off of 1m and 5% geological losses were used for the estimation of MTIS.
Table 13: Resource estimation history for Thabametsi project
The 2010 geological model was used for resource statements until 2015 and this has resulted in a
change in estimated resources. These changes are explained below.
Detailed explanations for resource movements are as follows:
Economic assumptions: There have been two changes in economic assumptions. Bench 7B, which
was included as part of the resource in the 2014 report, is now excluded. It is currently envisaged that
the Thabametsi project area will be mined open-cast for the top benches (Volksrust) and underground
for the bottom benches (9, 11 and 13). This will make mining 7B uneconomical due to low qualities.
The exclusion of bench 7B results in a ~105,6Mt decrease in the reported resource. The second
MODEL VERSION SHORT NAME
DESCRIPTION
GG_010210_LT 2010 GG
The 2010 Grootegeluk model (Minex) which also covered
Thabametsi. It was based on data until February 2010 as used for
all previous Thabametsi resource statements, except where
otherwise stated.
GG_010213_010713_L
T GG2013
The 2013 Grootegeluk model (Minex) also covered the
Thabametsi area and was based on data until 1 February 2013
and was signed off in July 2013. This is a long-term (LT) model
for Grootegeluk, meaning it is an update of a model scenario
used for LoM planning. This model was audited by Golder
Associates and deemed fit for purpose.
TBM_010213_110214_
PFS_ALT1 TBM2014
The model was undertaken to consider the big bench (T1, T2)
mining scenario for the prefeasibility study. It was based on data
until 1 February 2013 and was signed off on 11 February 2014.
TBM_010213_300914_
CS
TBM2014
sample block
model
The model was undertaken as a block model (Surpac) to evaluate
vertical variation within the big bench. This model was at concept
study as it provided the maximum possible detail to allow options
(such as bench configuration) to be evaluated, ie a sample model.
TBM_010215_300315_
BFS TBM2015
Once the bench configuration was decided, it was modelled at
bankable feasibility study level using all available data in Minex
software. The data cut-off is 1 February 2015 and sign-off was
end of March 2015. This model was audited by Ukwazi Mining
Solutions and was deemed to be of a high standard.

Exxaro 2015 consolidated mineral resources and ore reserves report
59
change is the inclusion of bench 13 as it was excluded in figures reported in 2015. Following further
evaluation, it was concluded that there is a reasonable and realistic prospect of eventual economic
extraction. The addition of bench 13 results in a 96,3Mt increase in reported resources. The net effect
of the change in economic assumptions is an overall decrease in reported resources of ~9,3Mt.
New information: 28 new drillholes since constructing the 2010 model resulted in an increase of
some 225Mt.
Model refinement: Unlike the 2010 model, the 2015 model is unfaulted. The change in approach was
due to low confidence in the position and existence of interpreted faults. The effect of the model
refinement is an increase of around 75Mt (1,55%). The structural interpretation is considered for
reserve evaluation in two-dimensional format.
Methodology: A 5% geological-loss factor and 0,5m thickness cut-off was applied to the total
resource to cater for the effect of weathering and faulting, resulting in a decrease of ~207Mt.
Transfer: There was a decrease of some 976Mt as a result of the conservative classification
methodology. This resulted in resources previously classified as inferred being downgraded to
reconnaissance.
Figure 14: Cross section through 2015 Thabametsi geological model (10 x vertical exaggeration)
Reserve estimation For phase 1 feasibility study, the X-pac mine scheduling software is used to derive remaining saleable
reserves from ROM reserves contained within the approved pit layout. After converting the geological
model’s grids to the appropriate format; the floor, roof and thickness data as well as the quality data
for each bench is imported into the X-pac model. With this model, validations are performed to
evaluate the data for possible mistakes, such as incremental yields for each bench are rising with
increases in relative float densities. The resource category areas are also loaded into the X-pac
model for reserve categorising. In-situ indicated resources are converted to probable in-situ mineable
reserves and in-situ measured resources converted to proved in-situ mineable reserves. The reserve
model is on a bankable feasibility project level of investigation.

Exxaro 2015 consolidated mineral resources and ore reserves report
60
10.5 DORSTFONTEIN COMPLEX Overview Dorstfontein complex, illustrated below, lies just north of the town of Kriel, in Mpumalanga, South
Africa. The complex comprises the underground Dorstfontein West (DCMW) operation and the open-
cast Dorstfontein East (DCME) mine. Dorstfontein complex is on the farms Welstand 55IS, Rietkuil
57IS, Fentonia 54IS, Dorstfontein 71IS, Vlakfontein 72IS and Boschkrans 53IS and occupies an area
of 8 733ha.
DCMW has been in operation since 1997, exploiting the S2L by underground means. The mine runs
three CM sections and one drill and blast section. Historically, while resource estimation has always
been done in-house, reserve estimation has occasionally been outsourced to external consultants.
Even though resources were robust in 2015, the mine’s reserve estimation stood at 18 months LOM
at the beginning of 2014. It is in this context that a feasibility study was previously done on the S4L
seam, at DCMW, as a replacement for S2L.
DCME started operating in 2011 and has since run continuously as a truck-and-shovel operation.
Seams exploited are S4, both S4U and S4L, and S2, both S2U and S2L, predominantly. However,
where thicker than 1,0m, S5, S3 and S1 are also mined. Most mining in 2015 took place from two
well-developed open-cast areas in the north-eastern corner of the mining right. As is the case with
DCMW, DCME resources are estimated in-house while, historically, reserve estimation was
outsourced to consultants. The strategy is to exploit open-castable coal first and go underground once
open-cast reserves are exhausted.
Exploration work in 2015 concentrated on gap filling and defining, more closely, areas of basement
slopes, where the S2 would thin and dip towards the basement, at DCMW. At DCME, exploration
drilling has focused on a previously unexplored extension, north-west of pit 1.
Except for the feasibility study done before 2014 on the S4 seam at DCMW, no further studies were
done in 2015 other than updating resource and reserve estimates to comply with Exxaro policy and
procedures.
History
Exploration history
Since the mid-1950s, the Dorstfontein complex has been evaluated through various exploration
phases guided by a number of different companies. Exploration tools comprised diamond core or
percussion drilling with appropriate coal-analysis techniques and geophysical surveys, the latter
aimed at identifying positions of dolerite intrusions. To date, 1 590 drillholes have been drilled,
covering the 7 822ha complex. This translates to a drillhole density of over 11 drillholes per 100ha.
Ground and aerial magnetic surveys were undertaken between 1995 and 1997, supplemented by
airborne surveys in 2007 to cover the remaining properties.

Exxaro 2015 consolidated mineral resources and ore reserves report
61
Figure 15: Dorstfontein complex
Mining history
DCMW is currently mining the S2L, on the southern portion of the farm Dorstfontein 71IS, for export
and inland metallurgical markets. First coal was in 1997, by Anglovaal (Pty) Ltd. DCMW produced
around 900kt ROM per annum at its peak. Current production is over 500kt per annum. In 2015 the
mine produced over 650kt ROM. Coal is beneficiated in a heavy medium coal-washing plant for
various sizes of product. A small amount of ‘nuts’ and ‘peas’, sold to the inland market’s ferrochrome
and charring plants, is produced.
DCME is the only open-cast mine in the ECC portfolio. First coal was in 2011, by TCSA. Where S2
and S4 are thicker than 1,0m, the S5, S3 and S1 are also mined. The mine produces a 5 400kcal/kg
export product with mining operations outsourced to Mutual Construction Company (MCC). DCME
reached a production milestone in 2014 when the mine achieved over 3 200kt ROM.
Geology
Dorstfontein complex is on the northern margin of the Highveld coalfield between the towns of
eMalahleni (Witbank) in the north and Bethal in the south. The Highveld coalfield extends from Nigel
and Greylingstad in the west to Davel in the east, with its eastern boundary formed by a straight line
joining Hendrina, Davel and Morgenzon. Dorstfontein complex is on the Smithfield Ridge, the
boundary between the Highveld and Witbank coalfields. Basement rocks in the area comprise pre-
Karoo rocks, ie Transvaal supergroup, the Waterberg group, and intrusives of the Bushveld igneous
complex. These are overlain uncomformably by diamictites and associated glaciogenic sediments of
the Dwyka group of the Karoo supergroup. Dwyka rocks are overlain by sediments of the Vryheid
formation of the Ecca group. The coal measures of the Highveld-Witbank coalfields are hosted in the

Exxaro 2015 consolidated mineral resources and ore reserves report
62
Ecca group, which comprises several formations: Pietermaritzburg, Vryheid and Volksrust. All coal
seams in the area are hosted in the Vryheid formation which ranges in thickness from 80m to 300m.
Five major coal seams are present in the area, named from the base upwards: x No 1 seam (S1)
x No 2 seam (S2 subdivided into S2L and S2U)
x No 3 seam (S3)
x No 4 seam (S4 subdivided into S4L and S4U)
x No 5 seam (S5).
Numerous Jurassic dolerites (dykes and sills) intruded the Vryheid formation at various stratigraphic
levels in the area. These intrusions tend to negatively influence stratigraphy and coal qualities in
places. The distribution of the lower coal seams is strongly influenced by basement topography while
the distribution of the upper seams is controlled by present-day topography. Most affected by
basement topography are S1 and S2. Seams often thin and sometimes pinch out over and against
palaeo-highs. Strata (including coal) are often faulted, although displacements are rarely more than
1m. Faulting is not tectonically controlled, but the result of differential compaction during burial and
lithification. Younger seams, such as S4 and S5, are less affected by basement topography than they
are by present-day topography.
Structural displacements, resulting from intrusions of dolerite sills through seams, often complicate the
mining of seams. In the Dorstfontein area, strata of the Permian Vryheid formation – comprising
sandstone, mudstone, carbonaceous rocks and coal itself – are exposed on surface. Locally these
rocks are interrupted by the surface expression of the northwest-southeast striking Smithfield Ridge,
which consists of a variety of volcanic rocks of the Transvaal supergroup, as well as intrusives of the
Bushveld igneous complex. Seams of economic interest in the Dorstfontein complex are S2L and
S4L, although S2U and S4U are also exploited in the DCME open-cast operation.
Resource evaluation Some 2 800 drillholes were used for resource evaluation and drillhole distribution is relatively constant
across the mining right areas, with higher concentrations noted in the two active mining right areas of
DCMW and DCME. Lower drillhole concentrations are noticeable in the only prospecting right area as
well as in the Vlakfontein mining right. The nature of the dolerite intrusions is such that current
drillhole density is inadequate for accurate modelling of the dolerite, leading to a geological loss being
applied in areas of concern, based on the reasonable probability of geological loss not recognised
through quality directly from drillhole information.
Although historical drillhole data was included in the model, a conservative approach has been taken
when using this data. Drillholes that do not correlate with surrounding drillholes were excluded rather
than recorrelating these in the interest of confidence. The decrease in the number of drillholes through

Exxaro 2015 consolidated mineral resources and ore reserves report
63
this process resulted in a lower concentration of drillholes used, mostly in the Vlakfontein prospecting
right, which is subsequently reflected in the reported mineral resource classification.
For drillholes used in the model, all raw data was composited in Sable Data Warehouse, on a per-
seam basis. Wash data was composited on a per-seam basis within Minex, weighted by relative
density and yield. Resource modelling and estimation was undertaken in Geovia Minex, using the
Minex growth algorithm and based on validated drillhole data until August 2015. The geological model
was created independent of structure as no faults have been identified in the complex, except for
zones where the sill transgresses seams and displaces them in a ‘pseudo-fault’ manner. Geological-
loss domains have been grouped, by percentage geological loss per seam, into those affected by the
proximity to a basement high and possible seam thinning or weathering (50% loss), dolerite (20%
loss) and the base geological loss (10% loss). A thickness cut-off of 1m was applied and maximum
ash content was limited to 50%. Extrapolation was restricted to 2 000m where, in most cases, this
extrapolation has been omitted through drillhole spacing as well as limiting boundaries and resource
classification. In terms of resource classification, SANS 10320:2004 guidelines were adopted and
based on coal-washability points of observation. Classification domains were downgraded based on
uncertainty surrounding the effect of dolerite, basement highs and anomalous drillhole data.
Reserve evaluation The identified mining blocks were reserved from the 2015 updated geological model and technical
factors, on an in-situ basis, such as seam thicknesses, densities, tonnages, quality and washability
characteristics were estimated per block. Some mining blocks at the periphery of the mineable
resource, as laid out by technical services, had to be excluded on the basis of the seam thickness
being too low. Results were adjusted for geological confidence, mining contamination, extraction
factors and mining efficiency. The resulting calculated ROM tonnes per block and associated coal
qualities were used as the basis of the mining schedule.
Due to time constraints resulting from the finalisation of the purchase of TCSA, the estimates reported
reflect the current five-year business plan of the Dorstfontein complex. It is therefore pertinent to
Figure 16: NW-SE section through DCMW (10x vertical exaggeration)

Exxaro 2015 consolidated mineral resources and ore reserves report
64
caution on possible material ore reserve changes in 2016 from current exploitation Studies and
developing life-of-mine plans. These studies are currently conducted in Exxaro to ensure alignment of
ECC operations with Exxaro policies.
10.6 FORZANDO Overview
The Forzando complex, illustrated below, is in Mpumalanga province, 10km north of Bethal, 55km
south-east of Witbank and 140km east of Johannesburg. The complex comprises two underground
mines, Forzando North (FZON) and Forzando South (FZOS). Forzando complex covers 12 113ha
over the farms Weltevreden 193IS, Koppie 228IS, Bankpan 225IS, Geluk 226IS, Halfgewonnen
190IS, Uitgedacht 229IS, Kalabasfontein 232IS, Schurvekop 227IS, Legdaar 78IS, Rensburgshoop
74IS and Kafferstad 79IS. Currently, only FZOS is in operation with FZON under care-and-
maintenance.
FZON started operating in 1995, exploiting mainly S4L and a small amount of S2L in a downthrown
block.
FZOS is currently exploiting the S4L using bord-and-pillar mining. The mine runs four CM sections,
and a plan to open the 5th section in 2016 is being investigated. FZOS started operating in 2006.
Exploration work in 2015 focused on increasing the level of confidence, understanding the lateral
continuity of the seam being exploited and understanding the general geological structure. Most
drillholes were drilled to below the Vryheid formation, to better understand the pre-Karoo depositional
environment and obtain more information on dolerite structures prevalent in the area.
Figure 17: Forzando complex

Exxaro 2015 consolidated mineral resources and ore reserves report
65
History
Exploration history
The Forzando complex has been prospected by a number of mining groups in the past. Anglo
American Corporation was the first to conduct exploration programmes between 1966 and 1969.
Other companies that explored the complex include General Mining, Gold Fields and Anglovaal.
Further exploration work was undertaken by TCSA from 2000. A total of 2 480 drillholes have been
drilled to date, translating to a density of over 11 drillholes per 100ha.
Several geophysical surveys were undertaken from 1992 to 2002, including a high-resolution total
field and vertical gradient airborne magnetic survey (1992), an aerial survey to acquire data for
construction of a digital terrain model (2009) and a Dighem electromagnetic and magnetic airborne
geophysical survey over the Schurvekop property (2012).
Mining history
Mineral rights were first acquired in the 1980s by Anglovaal Minerals. First coal at FZON was in 1995
by Anglovaal Minerals. FZON exploited mainly S4L and a small amount of S2L. The mine was a
flagship operation for TCSA until 2004. It produced roughly 2 300kt ROM per annum at its peak
between 2002 and 2004. FZON produced a 5 800kcal/kg export product with mining operations
outsourced to G&B contractors. The mine operated with three production CM sections. Surface
infrastructure includes a coal-washing plant linked to the main Richards Bay Coal Terminal (RBCT)
via a privately owned railway loop and a rapid coal-loading facility.
FZOS mine has been operating since 2006, exploiting the S4L. After FZON was placed under care-
and-maintenance, FZOS became the flagship ECC underground mine, operating four production CM
sections, achieving around 170kt of ROM per month. FZOS used to produce a 5 800kcal/kg export
product. The product was changed to 5 400kcal/kg at the beginning of 2015 to capitalise on the
significant yield differential of 10% between the two products. The mine uses the coal-washing plant
and rapid coal-loading facilities at FZON.
Geology
The Forzando complex – comprising Forzando North and Forzando South mines and contiguous
prospecting right areas – is in the north-eastern corner of the Highveld coalfield, separated from the
Witbank coalfield by the pre-Karoo Smithfield Ridge. Basement rocks comprise Rooiberg felsites and
granites of the Bushveld Lebowa suite. These felsites and granites are often palaeo-weathered to a
depth of several metres. Diabase has been recorded in the western end of the complex. Because of
the proximity of the Forzando complex to the edge of the basin, only an abbreviated Karoo sequence
is present. This package comprises the Dwyka, characterised by tillites, diamictites and varvites, and
Vryheid formation, consisting of an arenaceous sequence of sandstones and conglomerates with
subordinate siltstones and coal seams.

Exxaro 2015 consolidated mineral resources and ore reserves report
66
Diverse paleo-environments including transgressive shorelines, lacustrine, fluvial and deltaic, have
been recognised. The entire suite of five seams exists with the thickest and most ubiquitous being the
S2, S4 and S5 seams. S1 is restricted to palaeo lows while S3 only occurs on the western side of the
adjacent Forzando West (FZOW) prospecting right. Seam splitting is a common feature. Local
Forzando nomenclature recognises the following seams from the base upwards: S1, S1 lower, S2, S2
leader, S3, S4 and S5.
Most exploited is S4, whose internal composition is remarkably consistent. The S2, which presents
challenges of rapid seam-width variability, was also mined at Forzando North. Remaining seams are
either too thin, laterally inconsistent, poor quality or impractical to mine. During the late Jurassic era,
dolerite intrusions, in the form of dykes and sills, displaced the coal seams with devolatilisation or
burning of some areas of coal.
Resource evaluation Drillhole distribution (some 1 750 in total) is relatively constant across the mining right areas, with
higher concentrations noted in the mining right areas of FZON and prospecting right of Schurvekop,
and lower drillhole concentrations in the prospecting right areas of Legdaar and Kalabasfontein.
Historical drillholes were used for resource evaluation provided there was correlation with the
surveyed DTM and surrounding drillholes. For drillholes used in the model, all raw and wash data was
composited in Sable Data Warehouse, on a per-seam basis.
Resource modelling and estimation was undertaken in Geovia Minex, using the Minex growth
algorithm, and based on validated data until December 2014. Geological losses were applied based
on reconciliation information and resource classification was undertaken using coal-washability points
of observation and aligned to SANS 10320:2004. A 1,0m thickness cut-off and 50% maximum ash
content was applied.
Reserve evaluation The 2015 reserves have been determined using the following coal seams and assumptions:
x S2L from Forzando North
x S4L from Forzando South (only the five-year mine schedule).
Inferred resources have been included in the scheduled blocks from 2019. Additional drilling is
planned to upgrade these areas into classifiable resources and subsequent reserves.
Forzando North has been on care-and-maintenance since March 2014.
Due to time constraints in finalising the purchase of TCSA, the estimates reported reflect the current
five-year business plan of the Forzando complex. It is therefore pertinent to caution on possible

Exxaro 2015 consolidated mineral resources and ore reserves report
67
material reserve changes in 2016 from current exploitation studies and developing LOM plans. These
studies are being conducted by Exxaro to ensure alignment of the ECC operations with Exxaro
policies.
10.7 MATLA COAL MINE Overview
Matla is in the Kriel district of Mpumalanga, some 20km west of Kriel, 50km south-west of eMalahleni
(Witbank) and 30km south of Ogies. Matla is an underground operation with three mines – mine 1,
mine 2 and mine 3 – all supplying coal directly to Eskom’s Matla power station via conveyor belt. At
the current extraction rate, Matla is projected to be in production until at least 2033, although the
mining right is due to lapse in 2025. Exxaro has a reasonable expectation that the renewal of the
mining right will be approved.
The lowlight of 2015 was the suspension of the mine 1 shaft due to pillar instability. This resulted in
the production target not being achieved and overall qualities being slightly lower than the required
customer specifications: heat values of 17,85MJ/kg against a minimum specification of 19,50MJ/kg.
Given the pillar instability issues at mine 1, the strategy for the year was to increase production from
the two other shafts to ensure the required quality specification. One of the sections was moved from
mine 1 to mine 2 to make up for production tonnes and qualities for mine 1.
Two feasibility studies were completed in 2015, the north-west (NW) access project and shortwall
replacement project. The objective of these projects is to establish access to future reserves that are
at a sub-optimal distance from current infrastructure. The NW project entails establishing an incline
and decline to access reserves above and below current workings.
The shortwall replacement project entails bringing in additional continuous miner (CM) sections to
make up for production when the shortwall ground is finally depleted. All projects form part of the
exploitation strategy as per the life-of-mine plan (LoMP).
The percentage of inferred resources inside the LoMP has decreased from ~30% in 2014 to ~18% in
2015 and is expected to decrease further in 2016 after significant drilling and the annual resource and
reserve estimation update for Matla. The inferred resources do not fall within the five-year business
plan for the mine and the risk is actively managed by an extensive drilling programme, as illustrated in
Table 17.

Exxaro 2015 consolidated mineral resources and ore reserves report
68
History
The construction of Matla began in 1976 and the mine came into full production in 1983, supplying all
its bulk production to the nearby Eskom-owned Matla power station. Over the years, the mine has
drilled around 2 000 (excluding water) drillholes to quantify the volume and quality of coal in the mine
area, and to determine the lateral continuity of coal seams. In addition to drilling, an aeromagnetic
survey across the mine area was conducted to investigate the presence and behaviour of igneous
intrusions and other structures.
Various hydrogeological studies have been undertaken to understand the groundwater regime and
continuous monitoring of groundwater is in place. The emphasis is on monitoring the impact of mining
on the groundwater resource, both from a quantity and quality point of view.
Matla currently exploits seam 4L (S4L) and seam 2 (S2). In the past, it also exploited seam 5 (S5).
Geology Matla is in the Highveld coalfield, immediately south of the Witbank coalfield. The coalfield is host to
up to five coal seams contained within the middle Ecca group sediments of the Karoo supergroup.
The stratigraphic sequence in the mine area includes five coal seams that can be correlated with
seams found in the Witbank coalfield. The principal economic seams currently exploited are S2 and
S4L, with mining of S5 terminated in 1998 due to high levels of contamination and the subsequent
increase in abrasivity. Coal seams in the area are generally flat and continuous, with subsequent
igneous activity resulting in displacements and devolatisation of coal seams at places.
Figure 18: Matla Mine

Exxaro 2015 consolidated mineral resources and ore reserves report
69
Resource evaluation Geological modelling was undertaken using Geovia Minex to create a full-seam and select-seam
model using the Minex growth algorithm. A DTM signed off by the mine surveyor was used to create
the topography for Matla.
A total of 1 956 available drillholes were exported from the Geobank database, of which 309 were
drilled in 2015. After validating the geological database of Matla, including statistical analyses to
identify and address anomalous data, 25m x 25m grids for the roofs, floors, thicknesses and qualities
of the full S5, S4L and S2 as well as the select S4L and S2, were modelled. The data was composited
per seam in Minex on a weighted average basis.
Resource classification is based on SANS 10320:2004 and undertaken separately for S4L and S2
due to certain drillholes not being drilled through to S2 from S4L. Criteria for MTIS included a 1,8m
thickness cut-off for S4 and S2, 1,0m thickness cut-off for S5, minimum dry ash free volatiles content
of 26%, and a minimum air-dried CV content of 18MJ/kg.
For 2015, there was an increase of some 22Mt due to new information from additional drilling as well
as refining the mined-out polygon. A further 15,5Mt increase is attributed to model refinement,
including revised seam correlations. A decrease of around 16Mt is due to mining depletion in 2015.
Figure 19: Typical north-south section through Matla geological model (10x vertical exaggeration)
Reserve evaluation The reserve model is based on the 2015 updated geological model. A select mining horizon is defined
by inspecting all drillholes, resulting in the compilation of a reserve model within the Minex software.
This select horizon is defined in conjunction with the rock-engineering department, which is also
involved in the reserve estimation process, especially in project areas. Detailed rock engineering
studies, logging, sampling and testing of rock material are conducted continuously.
Three criteria are used to determine the practical safe mining height with the best-possible coal
qualities: x Mining equipment maximum and minimum production height
x The best-possible coal qualities in the equipment height

Exxaro 2015 consolidated mineral resources and ore reserves report
70
x A selection that will result in a competent roof beam to protect the workforce and equipment.
Environmental and hydrogeological conditions are considered during the reserve estimation process.
Areas underlying wetlands and other eco-sensitive areas are excluded and a high safety factor is
factored underneath rivers where environmental approvals have been obtained. The updated
hydrological model for Matla is used to predict the impact on water resources due to mining. The
model is updated with monitoring data continuously collected in the mine right area.
The ore reserve is estimated using the mining scheduling programme X-pac and supported by
CADopia. There was a total increase of 32Mt in the reserve, primarily due to an update in the mineral
resource (22Mt), modifications to the mining layout and mined-out polygons (18Mt) and mining (-8Mt).
The accuracy and confidence of the predicted ore reserves and qualities are considered fairly high,
with predictions and actuals in terms of both qualities and quantities mined out being close.
10.8 LEEUWPAN COAL MINE Overview
Leeuwpan coal mine is 10km south-east of the town of Delmas, 80km east of Johannesburg and
70km south-east of Pretoria in Mpumalanga. It lies alongside the R50 secondary road and is serviced
by a rail track that includes a rapid load-out station. The mine is equipped with rapid load-out facilities
and this is the preferred means of coal offtake. Leeuwpan mined 6,57Mt ROM in 2015 and sold
3,68Mt of product.
The focus for 2015 was to conclude the OI feasibility study for Leeuwpan. This study will have a
significant impact on Leeuwpan’s LoM if it is not approved and executed. The final study will be
completed and presented to Exxaro management for approval in June 2016, with planned
construction of the OI box cut to begin in 2017.
On an operational level, the mine continues to drive innovation by addressing the entire value chain of
resources and reserves. The top five operational excellence projects for 2016 aim to increase the
throughput and economic extraction of coal at Leeuwpan: x Project 1 – increase reserve flexibility
x Project 2 – increase operator availability
x Project 3 – increase truck availability
x Project 4 – increase DMS plant throughput
x Project 5 – reduce production cost.

Exxaro 2015 consolidated mineral resources and ore reserves report
71
Figure 20: Leeuwpan coal mine
History
Iscor bought the Leeuwpan coal reserve from Southern Sphere in 1988. Kumba’s exploration started
in 1990, which led to opening a box-cut for mining in 1992. Mineral rights to Leeuwpan were originally
owned by Kumba Coal Pty Ltd, a 100% owned subsidiary of Kumba Resources Limited. After
unbundling Kumba Resources in 2006, the mineral rights were ceded to Exxaro Resources.
Exploration continued year on year over the whole project area, systematically increasing geological
confidence and defining coal reserve blocks in more detail. The majority of resources at Leeuwpan
are currently at 100m x 100m drill-spacing, depending on infrastructure and wetland restrictions.
Areas with high geological variability have a smaller drilling grid size to increase the confidence level
of the various resources.
Geology
Two coal seams have been identified at Leeuwpan: upper coal seam (TC) and bottom seam (BC). BC
correlates with seam 2 of the Witbank coalfield and TC with seams 4 and 5.
Factors controlling geological and grade continuity are mainly surface weathering, significant variation
in seam thickness due an undulating tillite floor and devolatilisation and weathering due to dolerite
intrusions (sills and dykes). These geological risks have been managed by extensive drilling
campaigns in recent years, where the drilling grid was reduced to 100m spacing on average, and
down to 50m spacing as required in some areas. This information has been used to update the
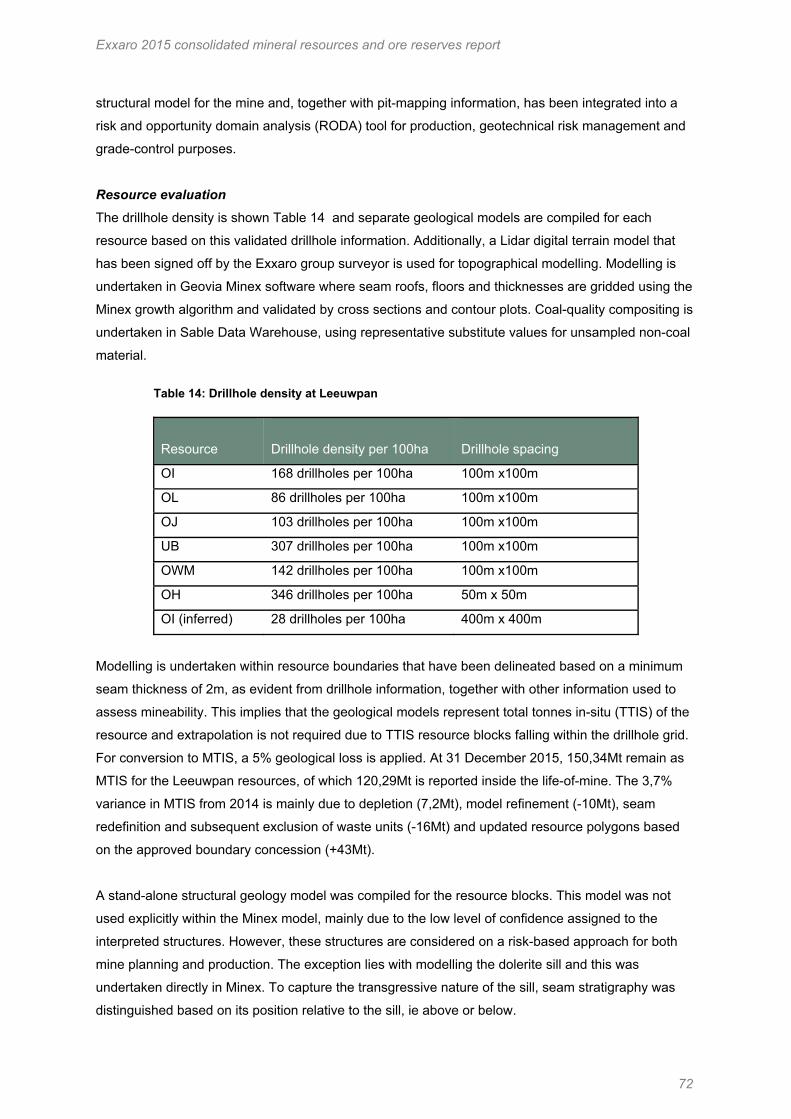
Exxaro 2015 consolidated mineral resources and ore reserves report
72
structural model for the mine and, together with pit-mapping information, has been integrated into a
risk and opportunity domain analysis (RODA) tool for production, geotechnical risk management and
grade-control purposes.
Resource evaluation The drillhole density is shown Table 14 and separate geological models are compiled for each
resource based on this validated drillhole information. Additionally, a Lidar digital terrain model that
has been signed off by the Exxaro group surveyor is used for topographical modelling. Modelling is
undertaken in Geovia Minex software where seam roofs, floors and thicknesses are gridded using the
Minex growth algorithm and validated by cross sections and contour plots. Coal-quality compositing is
undertaken in Sable Data Warehouse, using representative substitute values for unsampled non-coal
material.
Table 14: Drillhole density at Leeuwpan
Resource
Drillhole density per 100ha
Drillhole spacing
OI 168 drillholes per 100ha 100m x100m
OL 86 drillholes per 100ha 100m x100m
OJ 103 drillholes per 100ha 100m x100m
UB 307 drillholes per 100ha 100m x100m
OWM 142 drillholes per 100ha 100m x100m
OH 346 drillholes per 100ha 50m x 50m
OI (inferred) 28 drillholes per 100ha 400m x 400m
Modelling is undertaken within resource boundaries that have been delineated based on a minimum
seam thickness of 2m, as evident from drillhole information, together with other information used to
assess mineability. This implies that the geological models represent total tonnes in-situ (TTIS) of the
resource and extrapolation is not required due to TTIS resource blocks falling within the drillhole grid.
For conversion to MTIS, a 5% geological loss is applied. At 31 December 2015, 150,34Mt remain as
MTIS for the Leeuwpan resources, of which 120,29Mt is reported inside the life-of-mine. The 3,7%
variance in MTIS from 2014 is mainly due to depletion (7,2Mt), model refinement (-10Mt), seam
redefinition and subsequent exclusion of waste units (-16Mt) and updated resource polygons based
on the approved boundary concession (+43Mt).
A stand-alone structural geology model was compiled for the resource blocks. This model was not
used explicitly within the Minex model, mainly due to the low level of confidence assigned to the
interpreted structures. However, these structures are considered on a risk-based approach for both
mine planning and production. The exception lies with modelling the dolerite sill and this was
undertaken directly in Minex. To capture the transgressive nature of the sill, seam stratigraphy was
distinguished based on its position relative to the sill, ie above or below.
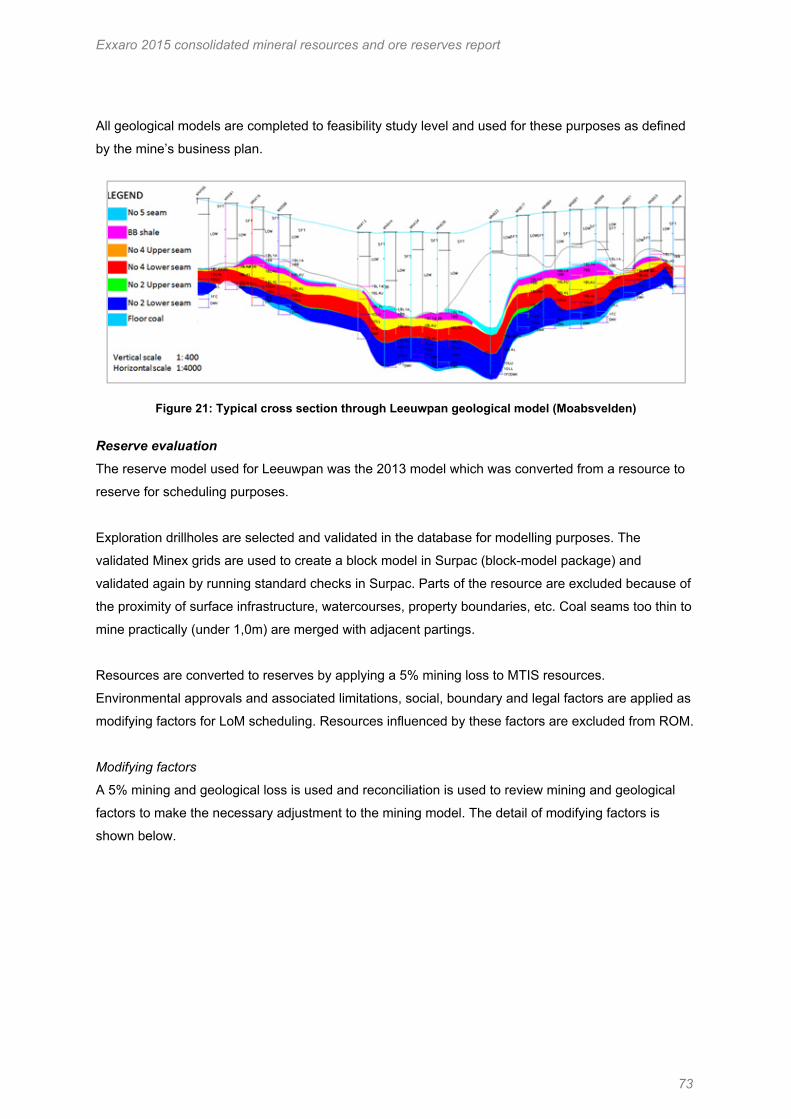
Exxaro 2015 consolidated mineral resources and ore reserves report
73
All geological models are completed to feasibility study level and used for these purposes as defined
by the mine’s business plan.
Figure 21: Typical cross section through Leeuwpan geological model (Moabsvelden)
Reserve evaluation The reserve model used for Leeuwpan was the 2013 model which was converted from a resource to
reserve for scheduling purposes.
Exploration drillholes are selected and validated in the database for modelling purposes. The
validated Minex grids are used to create a block model in Surpac (block-model package) and
validated again by running standard checks in Surpac. Parts of the resource are excluded because of
the proximity of surface infrastructure, watercourses, property boundaries, etc. Coal seams too thin to
mine practically (under 1,0m) are merged with adjacent partings.
Resources are converted to reserves by applying a 5% mining loss to MTIS resources.
Environmental approvals and associated limitations, social, boundary and legal factors are applied as
modifying factors for LoM scheduling. Resources influenced by these factors are excluded from ROM.
Modifying factors
A 5% mining and geological loss is used and reconciliation is used to review mining and geological
factors to make the necessary adjustment to the mining model. The detail of modifying factors is
shown below.

Exxaro 2015 consolidated mineral resources and ore reserves report
74
Table 15: Leeuwpan modifying factors – 2015 versus 2014 Modifying factors (averaged)
2015 2014 Block model parameters Resources Geological losses (%) 5% 5%
Reserves Mining recovery efficiency (%) 10% (C&S) 10% (C&S)
Mining loss (%) 5% 5%
Saleable reserves
Practical plant yield
85% (DMS) & 77% (jig)
Plant efficiency : 88% DMS
& 78% jig
85% (DMS) & 77% (jig)
Plant efficiency: 98%
DMS & 75% jig
Forward-looking exchange rate (R/US$) R10,94 R9,98
Planned averaged slope angles 45° 45°
Other
Averaged grade cut-off (%) if applicable 2m 2m
Environmental OJ OK, OJ
Legal OWM, OJ, ODS OWM, OJ, ODS
Reserves OJ, UB and OL are classified as probable reserves pending environmental approvals. This
represents 23,95Mt of Leeuwpan’s reserves.
Reserve OI (56,54Mt) has been classified as a probable reserve after concluding technical studies
and pending approval of the EMP (environmental management plan) amendment to support open-
cast mining.
Reserve OL (14,45Mt) has been classified as a probable reserve as a result of pending approval of
the EMP amendment to support open-cast mining.
For reserve OB (3,06Mt), a study of current market conditions revealed that these reserves have
various market constraints and therefore it is has been included as a probable reserve.
Some 50% of reserve OJ (6,44Mt) is either within a 500m blasting radius to the adjacent Thaba
Chueu Mining mine or in an environmentally sensitive area and was excluded from reserves. The
remainder is included in the LoM.
The LoM at Leeuwpan is 14 years to 2029, compared to the mining right expiry date of 2040.

Exxaro 2015 consolidated mineral resources and ore reserves report
75
10.9 NORTH BLOCK COMPLEX Overview
NBC comprises Glisa (converted mining right), Strathrae (converted mining right), Eerstelingsfontein
(executed new mining right) and Glisa South (prospecting, submitted new mining right) resource
areas.
The primary operation is the Glisa mine, a multi-seam open-cast mining operation 5km west of Belfast
in the Highveld region of Mpumalanga.
A study at the Glisa South project, adjacent to Glisa mine, is at prefeasibility stage, and its mining
right application was accepted in June 2012. Given its proximity to Glisa, the resources are expected
to be a natural extension of the Glisa reserve base.
The mining method at Glisa and Eerstelingsfontein is normal strip mining. At Glisa there are two pits
(Blesbok and block A), and there is one pit at Eerstelingsfontein. NBC supplies thermal coal to three
Eskom power stations: Arnot, Tutuka and Komati. Mining activities at Eerstelingsfontein started in
February 2015, and its contribution allowed NBC to re-enter other sectors of the domestic market after
a hiatus of four years with a B-grade peas product.
NBC produced 3,84Mt of ROM (3,36Mt from Glisa and 0,48Mt from Eerstelingsfontein), and 2,84Mt of
product (2,80Mt Eskom and 39t peas). The bulk of NBC’s ROM (60%) was put through two dry
crushing and screening plants, from which the bulk of product (78%) was produced. It was at these
plants where different seams were raw blended to meet product specifications. The balance of ROM
Figure 22: NBC locality map with mine and project areas

Exxaro 2015 consolidated mineral resources and ore reserves report
76
was put through a single-stage dense medium separation plant and, during the period under review, it
processed 1,51Mt of ROM and produced 0,61Mt of product at a yield of 41%.
As surveyed on 31 December 2015, NBC had ROM stockpiles of 329kt that needed to be
beneficiated. Product stockpiles were 156kt.
History
NBC has a long mining history. Historical records suggest that mining at Glisa started in the early
1900s to supply coal to Paul Kruger’s railways. The mine is still operational, albeit nearing its end,
which suggests a long hiatus at some point between the early days and now. In recent history, until
2006, the mine was an underground operation, focused on exploiting a ‘select’ portion of seam 2 (S2),
which was accordingly referred to as S2S. Open-cast mining started after 2006, exploiting the full
complement of the Witbank coalfield seams, and reclaiming S2S left in underground pillars.
Eerstelingsfontein was in project phase until October 2014, when the IWUL was reinstated. Mining
activities started in earnest, with first production in March 2015. In Strathrae, mining activities ceased
in 2010, and the emphasis since then has been on rehabilitation activities.
Geology
NBC (Glisa) mine resource area is close to the eastern edge of the Witbank coalfield, in the northern
part of the Main Karoo basin. All Witbank coalfield seams, ie S1, S2, S3, S4 and S5, occur in the
Glisa area, with S2, S3 and S4 seams being of economic importance. The stratigraphy consists
predominantly of the different coal seams separated by fine and medium to coarse-grained
sandstone, with subordinate mudstone, shale, sandstone and carbonaceous shale.
The Eerstelingsfontein block to the south-east of Glisa comprises gently sloping topography. The coal
resource at Eerstelingsfontein is contained in a single seam, S2. This seam occurs as an erosional
remnant on high ground at shallow depths, suitable for open-cast mining. The thickness of the coal
seam ranges from 0,46m to 3,10m, with an average thickness of 2,29m. The coal seam is overlain by
medium to fine-grained sandstone with shaly bands. On top of the whole succession is the
overburden material made of sandy soil and regolith. The average total depth to coal is relatively
shallow at ~10,7m and the maximum depth to top of coal in the area is around 17,8m. In 2015, mining
activities began at Eerstelingsfontein, a positive development given deteriorating coal qualities at
Glisa mine.
Resource evaluation Resource evaluation is undertaken as per the Exxaro resource estimation procedure and based on 88
diamond drillholes, drilled between 2008 and 2013 and spaced some 350m apart. Coal quality
compositing is undertaken in Geovia Minex on a weighted average basis and maximum extrapolation
is set to 175m. A 0,5m thickness cut-off and 5% geological loss is applied to convert GTIS to MTIS.

Exxaro 2015 consolidated mineral resources and ore reserves report
77
Reserve evaluation The reserve model was generated using X-Pac mine scheduling software, which considers in-situ coal
resources as generated from the resource model. For Glisa, where portions of seam 2 select were
mined underground, tonnage already mined is subtracted from in-situ coal resources. The reserve
model estimate is based on the approved pit layout, which forms the basis of the scheduling. After
factoring all technical modifying factors, the reserve model generates an estimate of ROM and
resultant saleable product and qualities.
The modifying factors applied are based on known mining and coal-processing methods. The
resource and reserve discount factors have been confirmed as realistic by actual reconciliation. The
mining method at Glisa and Eerstelingsfontein collieries is surface strip mining, which involves the
selective extraction of overburden, interburden and the coal seam(s). Run-of-mine coal is beneficiated
via a combination of a dense medium processing plant and two dry crushing and screening plants.
The saleable product is sold domestically, primarily to Eskom.
The modifying factors used are: x Reserves of Glisa block C and Strathrae were excluded
x A portion of Glisa block A was excluded due to an excessive strip ratio
x Mining limits:
o Saleable product quality cut-off of 21,86MJ/kg was applied
o Farm boundary cut-off – 9m mining right boundary cut-off was considered
o Tenure and licence approvals
o Seam thickness – only seams thicker than 0,5m were considered
o Environmentally sensitive areas such as waterways and wetlands (Eerstelingsfontein).
x A factor of 10% was applied to ROM as a mining loss. The quality of coal was considered not to be
affected by the mining loss
x A contamination factor of 5% was added to ROM and qualities duly adjusted. The assumption was for a
CV of 0MJ/kg and ash of 100%
x The DMS plant yield of 85% and a crush and screen practical plant yield of 99% were applied.
It is expected that total reserves will be depleted within two years. The classification of coal reserves
is informed by classification of coal resources. All NBC’s reported coal reserves are in the proved
category.
10.10 ELOFF PROJECT Overview
Eloff project forms part of the ECC complex, and lies 75km east of Johannesburg and 18km south-
west of Delmas by road. It comprises two prospecting rights (PRs), 273PR and 274PR held by Eloff
Mining Company (EMC) and covering 8 635ha.

Exxaro 2015 consolidated mineral resources and ore reserves report
78
Figure 23: Eloff project History
EMC acquired prospecting rights from Southern Sphere Holdings in 1984, along with drilling
information from 1977 to 1984 consisting of 344 drillholes. In 1988, 54 drillholes were purchased from
Coronade. In 1999, Anglovaal sold its stake of the Eloff prospecting rights to TCSA, now ECC. In
2004, BHP Billiton sold shares to TCSA and Siyanda Resources, leading to the current shareholding: x 51% ECC
x 29% Siyanda Resources
x 20% South32.
Between 2007 and 2015, EMC drilled 376 drillholes and acquired 36 drillhole logs from Universal Coal
in 2009 which are adjacent to Eloff.
Geology
Eloff lies in the Delmas coalfield, which in turn lies west of the Witbank coalfield, north of the Highveld
coalfield and along the northern edge of the Main Karoo sedimentary basin. The basement rocks
consist of granite of Archaen age, quartzite of the Witwatersrand supergroup, lavas of the
Ventersdorp supergroup, dolomites and cherts from the Transvaal supergroup, and shale and
sandstone of the Pretoria group. In some areas, diabase and andesite are defined. Glaciated relief
that formed during the permo-carboniferous erosion, comprising elongated low ridges and shallow
valleys, influenced depositional patterns and peat accumulation. Sediments of glacial origin like tillites,
diamictites and varvites, characterise the Dwyka group. Deposited above the Dwyka group is the
Vryheid formation which comprises a predominately arenaceous sequence of sandstones and
conglomerates with subordinate siltstones, shale and coal seams.
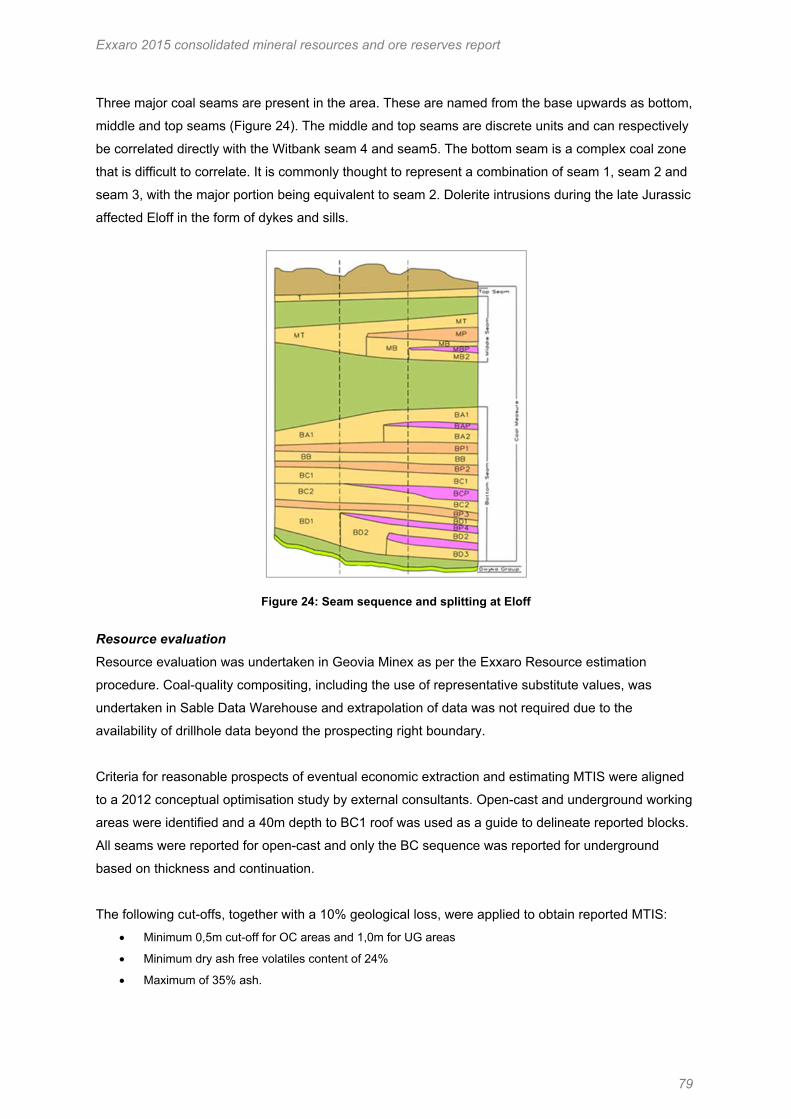
Exxaro 2015 consolidated mineral resources and ore reserves report
79
Three major coal seams are present in the area. These are named from the base upwards as bottom,
middle and top seams (Figure 24). The middle and top seams are discrete units and can respectively
be correlated directly with the Witbank seam 4 and seam5. The bottom seam is a complex coal zone
that is difficult to correlate. It is commonly thought to represent a combination of seam 1, seam 2 and
seam 3, with the major portion being equivalent to seam 2. Dolerite intrusions during the late Jurassic
affected Eloff in the form of dykes and sills.
Figure 24: Seam sequence and splitting at Eloff
Resource evaluation Resource evaluation was undertaken in Geovia Minex as per the Exxaro Resource estimation
procedure. Coal-quality compositing, including the use of representative substitute values, was
undertaken in Sable Data Warehouse and extrapolation of data was not required due to the
availability of drillhole data beyond the prospecting right boundary.
Criteria for reasonable prospects of eventual economic extraction and estimating MTIS were aligned
to a 2012 conceptual optimisation study by external consultants. Open-cast and underground working
areas were identified and a 40m depth to BC1 roof was used as a guide to delineate reported blocks.
All seams were reported for open-cast and only the BC sequence was reported for underground
based on thickness and continuation.
The following cut-offs, together with a 10% geological loss, were applied to obtain reported MTIS: x Minimum 0,5m cut-off for OC areas and 1,0m for UG areas
x Minimum dry ash free volatiles content of 24%
x Maximum of 35% ash.

Exxaro 2015 consolidated mineral resources and ore reserves report
80
Figure 25: Typical north-south cross section through Eloff (10x vertical exaggeration)
10.11 TUMELO Exxaro’s attributable interest in Tumelo is 49%. Exxaro is expected to retain management control over
the mine and hence this ancillary section is provided.
Overview
Tumelo mine is in Mpumalanga, 15km north-west of the town of Hendrina and 5km south-east of
Hendrina power station. The Hendrina-Middelburg road passes 6km east of the property. An all-
weather dirt road linking the town of Hendrina and Hendrina power station runs 500m to the west of
the property while the Wonderfontein-Broodsnyersplaas railway line is 2km west with the closest
siding being Pullenshope, 3,5km from the property. Tumelo’s mining right (116MR) covers an area of
461,9ha over the farm Boschmanskop 154IS and was acquired by Total Exploration South Africa in
October 2000. The Boschmaskop project (as Tumelo was known then) would be further explored
through diamond drilling by Total Coal South Africa (TCSA). A 2002 feasibility study confirmed the
presence of economic coal reserves. The Boschmanskop project would later become known as
Tumelo when a mining right was applied for in 2006 in the name of Tumelo coal mines. First coal was
recorded in 2009 with Tumelo exploiting S2 by means of bord-and-pillar. Mining was outsourced to
SBS Mining (Pty) Ltd, a mining contractor. Using one continuous miner, the mine produced some
700kt ROM at its peak. Initially, ROM coal was custom-washed for an export product at the Shanduka
(Glencore)-owned Koornfontein mine washing plant, but would later be carted to Total Coal’s
Forzando North and washed for a 5 800kcal/kg export product.
Tumelo mine was placed under care-and-maintenance at the end of January 2014 after contract
renewal terms could not be agreed between Total Coal and the mining contractor. Following the
purchase of TCSA assets by Exxaro in August 2015, the current Tumelo coal mine shareholding is
51% Mmakau Mining and 49% Exxaro Coal Central Proprietary Limited.

Exxaro 2015 consolidated mineral resources and ore reserves report
81
Figure 26: Tumelo locality map
History
A total of 132 drillholes have been drilled over the 462,9ha area, resulting in a theoretical drillhole
density of 23,5/100ha. Early exploration operators were Senekal Mine and Hanover Mining from
which Total Exploration South Africa acquired the surface and mineral rights before transferring these
to TCSA.
Geology
Tumelo lies north of the Smithfield Ridge on the north-eastern edge of the Springs–Witbank coalfield.
The area is part of the Karoo basin whose stratigraphy is similar to that of Dorstfontein and Forzando
with subtle location-induced differences.
Resource evaluation The Tumelo geology model, unlike those of Dorstfontein and Forzando, has not yet been aligned to
the Exxaro resource estimation procedure. The geology model is a Stratmodel (Minescape)-built
version and is yet to be converted to Minex. Given incomplete wash fractions and missing values from
old and third-party acquired drillholes, eg those drilled in 1990-91, there is a need to redrill some
drillholes in areas where mining has not yet taken place.
A geological loss of 10% was applied and resource cut-offs are: minimum 1,5m seam thickness,
maximum ash content of 30% (S2) and 35% (S4), minimum CV of 22MJ/kg (S2) and 18MJ/kg (S4)
and minimum volatiles content of 16% (S2) and 20% (S4).
Exxaro 2015 consolidated mineral resources and ore reserves report
82
10.12 ZONDERWATER PROJECT Overview
Exxaro has a prospecting right over the farms Zonderwater and Van Wykspan, near the town of
Lephalale in Limpopo. The right was successfully renewed for three years to 2016.
Figure 27: Zonderwater project History
Five drillholes were identified as being drilled on the farm Zonderwater prior to 1972. Following this,
two diamond-cored drillholes were completed in the 1980s as part of the regional Waterberg
exploration by Iscor. In 2003 and 2004, Kumba Resources completed drilling additional holes on the
project area. Three of these were on the farm Van Wykspan, while one was on the farm Zonderwater.
This drilling was conducted under an old-order prospecting right and investigations on the
Zonderwater project continued in earnest over 2010 and 2011, when 19 drillholes were completed on
the project site. These were for resource evaluation and were drilled from surface using either
percussion drilling or a combination of percussion and rotary core drilling to produce 123mm cores for
sampling.
In 2011, Exxaro applied for extension and conversion of the old-order prospecting right for the
Zonderwater project area. This was granted in 2013, and executed in 2014.
Exxaro 2015 consolidated mineral resources and ore reserves report
83
In 2013, Exxaro undertook drilling in the north-western portion of the Zonderwater farm as part of
routine coal exploration. The location was chosen based on historical exploration results which
suggested coal-seam floor elevation differences varied least between drillholes in this area while coal
qualities were high. Drilling in this area was carried out on a 500m x 500m grid with the aim of using
coal-quality sampling and downhole geophysics to bring the area up to an indicated resource level of
confidence.
Geology
The major coal-bearing horizons of the Karoo supergroup are the Volksrust and Vryheid formations in
the Ecca group. The Ecca group is underlain by the Dwyka group, a glaciofluvial deposit ranging from
gravel to mudstone. The Dwyka group, in turn, is underlain by the Waterberg group, characterised by
coarse sandstone and conglomerates and sitting unconformably on the basement which is Bushveld
complex in the south-eastern part of the Ellisras basin. Overlying the Ecca are the Beaufort and
Stormberg groups. Volksrust formation coals are classified as thick interbedded deposit type while
Vryheid formation coals are classified as multiple-seam type.
The total thickness of the coal measures is some 120m. The general dip of the strata is 2° to 4° to the
south-east across the Waterberg coalfield.
The upper coal or Volksrust formation is represented by interbedded carbonaceous shales and coal.
The vitrinite content in the coal plies towards the top of the Volksrust formation, with a semi-soft
coking coal yield. The rest of the Volksrust formation yields varying grades of thermal coal.
The Vryheid formation is locally made up of five distinct coal seams, composed of predominantly dull
coal interbedded with minor carbonaceous mudstone and shale. These coal seams are named from
bottom upwards as zone 1 through zone 4, with zone 4 further subdivided into zone 4 seam at the top
and zone 4A which is interbedded coal and shale towards the base.
Resource evaluation Resource evaluation was undertaken using Geovia Minex software and the methodology applied was
similar to that used at Grootegeluk mine and Thabametsi project. A total of 60 drillholes were used for
resource evaluation, 45 of which are located in the Zonderwater and Van Wykspan farms. Resource
classification is aligned to SANS 10320:2004 guidelines for multi-seam deposits, and a 2m minimum
and 6m maximum thickness cut-offs with 5% geological losses were applied for estimating MTIS.
Estimation was constrained to zone 3 which exhibited the highest coal qualities while underground
mining limitations were recognised in applying the maximum thickness cut-off of 6m.

Exxaro 2015 consolidated mineral resources and ore reserves report
84
Figure 28: Typical north-south section through Zonderwater project
10.13 MAYOKO IRON ORE PROJECT Overview
The Mayoko iron ore project is a near-term development opportunity in an emerging iron ore province
in central West Africa with an existing underutilised heavy-haulage mineral railway passing within 2km
of the main prospect. The project is currently in a conceptual phase of study.
The project is 3km from Mayoko Centre in the north-east Niari department of Republic of the Congo
(RoC), some 300km by road from the city of Dolisie and a further 150km from the port city of Pointe
Noire. The area is in a forest ecosystem comprising dense rainforest vegetation, occurring over an
undulating landscape incised by a number of streams and rivers. The deposit itself, as reported, is
situated in two small mountains, Mount Lekoumou and Mount Mipoundi.
History
Early exploration between 1929 and 1954 comprised regional and some local mapping. Iron ore
mineralisation was discovered during this time.
Between 1960 and 1961, Compagnie Miniére de l’Ogooué (COMILOG) had three drillholes completed
(numbers 4, 5 and 6) to depths of 40m and estimated a resource of 6Mt to 7Mt of iron ore with a tenor
of 50% to 60% Fe.
In February 1970, under a UN-sponsored programme, a delegation of Romanian specialists visited
the Mount Lekoumou deposit and collected a sample weighing several kilograms of the ferruginous
crust excavated from a small shaft. Mineralogical, granulometric and chemical tests on this sample
revealed elevated tenors in iron and in phosphorus. Under the UN-sponsored programme, chemical
analyses of samples from over 40 drillholes were carried out by ICES in 1974 and 1975.

Exxaro 2015 consolidated mineral resources and ore reserves report
85
In December 2007, the project was acquired by DMC, with investigation continuing to date.
No mining has yet been conducted.
Geology
The first description of the geology of the project area was given in the ICES Geomin of Romania
(ICES) report dated 1975, which outlines four main types of iron ore mineralisation at Mont
Lékoumou, Mont Mipoundi and Lékoumou South: x Primary iron formation (fresh BIF) mineralisation comprising fresh ferruginous quartzites (magnetite-
quartzites) encountered in drilling
x Weathered ferruginous quartzites (enriched BIF)
x Iron oxide cap rock (chapeau de fer or ‘hat of iron’, supergene hematite, in situ)
x Detrital, iron oxide-rich material produced from weathering and erosion of iron formations.
The geology has generally been confirmed by the 2011 and subsequent drilling programmes. The
ferruginous quartzites, also called BIF, were observed to be interbedded with mafic schist
(amphibolite).
Exxaro nomenclature and descriptions for the different ore types include:
Figure 29: Location of the Mayoko iron ore deposit
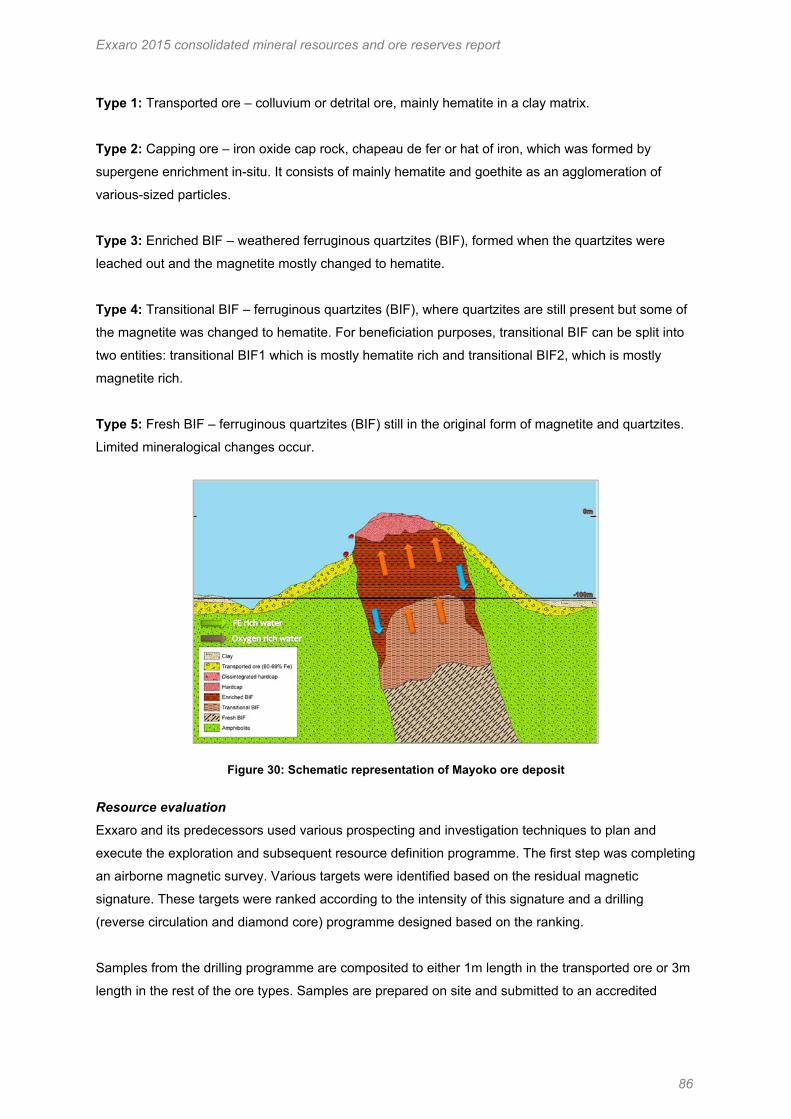
Exxaro 2015 consolidated mineral resources and ore reserves report
86
Type 1: Transported ore – colluvium or detrital ore, mainly hematite in a clay matrix.
Type 2: Capping ore – iron oxide cap rock, chapeau de fer or hat of iron, which was formed by
supergene enrichment in-situ. It consists of mainly hematite and goethite as an agglomeration of
various-sized particles.
Type 3: Enriched BIF – weathered ferruginous quartzites (BIF), formed when the quartzites were
leached out and the magnetite mostly changed to hematite.
Type 4: Transitional BIF – ferruginous quartzites (BIF), where quartzites are still present but some of
the magnetite was changed to hematite. For beneficiation purposes, transitional BIF can be split into
two entities: transitional BIF1 which is mostly hematite rich and transitional BIF2, which is mostly
magnetite rich.
Type 5: Fresh BIF – ferruginous quartzites (BIF) still in the original form of magnetite and quartzites.
Limited mineralogical changes occur.
Figure 30: Schematic representation of Mayoko ore deposit
Resource evaluation Exxaro and its predecessors used various prospecting and investigation techniques to plan and
execute the exploration and subsequent resource definition programme. The first step was completing
an airborne magnetic survey. Various targets were identified based on the residual magnetic
signature. These targets were ranked according to the intensity of this signature and a drilling
(reverse circulation and diamond core) programme designed based on the ranking.
Samples from the drilling programme are composited to either 1m length in the transported ore or 3m
length in the rest of the ore types. Samples are prepared on site and submitted to an accredited

Exxaro 2015 consolidated mineral resources and ore reserves report
87
laboratory (Bureau Veritas Mineral Laboratories (previously Ultra Trace) in Cunningvale, Perth,
Australia (accreditation number 15833) for x-ray fluorescence and loss-on-ignition testing.
Blind certified standards and field duplicates are used as quality assurance quality control (QAQC)
measures. Field duplicates are submitted as even multiples of 10 (0, 20, 40, etc) and standards are
submitted as odd multiples of 10 (10, 30, 50, etc). Results from QAQC samples are checked after
batch results are received.
Two different methods of density determination are done on Mayoko, depending on the competency
of the material. For core drilling, a piece of core some 200mm in length is marked and weighed. The
sample is then dipped in hot wax to cover the core so that moisture cannot enter. The wax-covered
core is weighed again in air, and then in water.
For incompetent material such as transported ore, two methods were used. Method 1 uses water
displacement, where a reverse-circulation chip or core sample of known weight is submitted into a
known quantity of water. The displacement of water is recorded and the density calculated. Method 2
is more an in-situ measurement of the material, where a hole of 500x500x500mm is dug into the in-
situ material. The material removed from this hole is weighed. The hole is covered in a plastic bag and
water is added, noting the quantity required to fill the hole to the brim. The density is then calculated.
After all data has been verified and checked, resource modelling is done in Surpac in three
dimensions, using interactive interpreted sections. Interpretations are not extrapolated further than
half the closest drillhole spacing on that specific section, and 15m below the last mineralised
intersection.
Ordinary Kriging is used as a grade-interpolation method after a full variography study has been
completed.
The classification criteria for Mayoko are based on: x Drillhole spacing
x Variography range of the Fe variable
x Availability of QAQC data.
Table 16: Resource classification criteria for Mayoko project
Method
Inferred
Indicated
Measured
Drillhole spacing More than 200m by 50m 100m or 200m by 100m or 50m
100m by 50m
Variography range Double variogram range for Fe
Variogram range for Fe Two-thirds of variogram range for Fe
QAQC data Available or not Available Available

Exxaro 2015 consolidated mineral resources and ore reserves report
88
The reasonable prospect for eventual economic extraction (RPEEE), on which the resource statement
is reported, is based on conceptual long-term economic factors and, based on this study, all modelled
resources are considered as having a reasonable prospect for eventual economic extraction.
11 EXPLORATION
Exploration conducted in the coal business in existing operations consisted of drilling (diamond core
and reverse circulation) with limited surface geophysical surveys, and downhole geophysical logging.
Exploration was mainly conducted on current mining right areas and two prospecting areas included
in the mineral resource and ore reserve statement. Drilling was carried out for production purposes, to
improve geological confidence, and to enhance future geological modelling and estimation. These
drillholes are depicted in the relevant locality maps in Chapter 10 Ancillary resource and reserve
information by operation. A limited amount of geotechnical drilling was conducted to improve mine-
planning parameters.
No exploration was conducted on areas not included in the mineral resource statement.

Exxaro 2015 consolidated mineral resources and ore reserves report
89
Table 17: Summary of exploration expenditure for coal
Project or mining operation
2014 actual 2015 actual 2016 planning* Drillholes Cost (Rm) Drillholes Cost (Rm) Drillholes Cost (Rm)
Number Total Number Drilling Analyses & other Total Number Total
Grootegeluk coal mine 9 14,0 12 2,2 10,1 12,3 9 19,6
Arnot coal mine 229 12,6 160 9,9 0,6 10,5 - -
Matla coal mine 189 17,0 180 12,5 3,5 16,0 151 14,0
NBC coal mine None - None - - - - -
Leeuwpan coal mine 65 6,70 None - - - - -
Thabametsi exploration 15 6,0 None - - - 5 3,5
Dorstfontein coal mines 68 4,3 43 3,4 0,4 3,8 24 3,7
Forzando coal mines 35 2,6 49 4,4 1,0 5,4 28 6,0
Eloff exploration None - 26 1,0 1,1 2,1 - -
Zonderwater exploration 17 19,9 8 3,7 4,3 8,0 - -
Total 627 83,1 478 37,1 21,0 58,1 217 46,8
Mining right areas 595 57,2 470 33,4 16,7 50,1 212 43,3
Prospecting right areas 32 25,9 34 4,7 5,4 10,1 5 3,5
*Non-committed

Exxaro 2015 consolidated mineral resources and ore reserves report
90
12 ENDORSEMENT
The Exxaro lead competent persons are appointed by the Exxaro executive management team.
The Exxaro lead mineral resource competent person is Henk Lingenfelder, a member of the
Geological Society of South Africa and registered (400038/11) with the South African Council for
Natural Scientific Professions. He has a BSc (hons) in geology and 20 years of experience as an
exploration and mining geologist in coal, iron ore and industrial minerals, of which six are specific to
coal and iron ore estimation.
The person in Exxaro designated to take corporate responsibility for mineral resources, Henk
Lingenfelder, the undersigned, has reviewed and endorsed the reported estimates.
JH Lingenfelder
BSc geology (hons)
Pr Sci Nat (400038/11)
Group manager geoscience
Roger Dyason Road
Pretoria West
0183
The Exxaro lead ore reserve competent person is Chris Ballot, a mining engineer registered
(20060040) with the Engineering Council of South Africa. He has 19 years of experience in iron ore,
mineral sands and coal in various technical and management roles.
The person in Exxaro designated to take corporate responsibility for ore reserves, C Ballot, the
undersigned, has reviewed and endorsed the reported estimates.
CC Ballot
BEng mining
ECSA 20060040
Manager mining processes
Roger Dyason Road
Pretoria West
0183

Exxaro 2015 consolidated mineral resources and ore reserves report
91
The address for South African Council for Natural Scientific Professions:
Private bag x540
Silverton
0127
Gauteng
South Africa
The address for Engineering Council of South Africa:
Private bag x691
Bruma
2026
Gauteng
South Africa

Exxaro 2015 consolidated mineral resources and ore reserves report
92
APPENDIX A
Table 18: Shareholding of reported coal resources and reserves
Commodity Complex Name of right Type Status % attrib to Exxaro
Remainder attrib to
Coal
Arnot Arnot (UG & OC) Arnot (325 MR) mining right executed 100%
Matla Matla (UG) Matla (327 MR) mining right executed 100%
Inyanda Inyanda (OC) Inyanda (34 MR) mining right executed 100%
Leeuwpan Leeuwpan (OC) Leeuwpan (157 MR) mining right executed 100%
Leeuwpan Ext (171 MR) mining right registered 100%
Mafube Mafube (OC) Mafube (172 MR) mining right executed 50% Anglo American Coal
Pty Ltd
Nooitgedacht (10026 MR) mining right registered 50% Anglo American Coal Pty Ltd
North Block Complex (NBC)
Glisa (OC) Glisa (326 MR) mining right executed 100%
Strathrae (OC) Strathrae (328 MR) mining right granted 100%
Eerstelingsfontein (OC) Eerstelingsfontein (10068 MR) mining right renewal submitted 100%
Paardeplaats (OC)
Glisa South/ Paardeplaats (190 PR) prospecting right renewal submitted
- MR application submitted
100%
Glisa South Ptn 13 / Paardeplaats (1734 PR) prospecting right
renewal submitted - MR application
submitted 100%
Paardeplaats (10090 MR) mining right new application 100%
Belfast (OC) Belfast (431 MR) mining right registered 100%
Grootegeluk Grootegeluk (OC) Grootegeluk (46 MR) mining right registered 100%
Waterberg prospecting
Thabametsi (UG & OC)
Grootegeluk West (10766 PR) prospecting right renewal submitted
- MR application submitted
Thabametsi (10013 MR) mining right new application 100%
Zonderwater (UG) Zonderwater (1106 PR) prospecting right registered 100%
Waterberg North (OC)
Pentoville (10719 PR) prospecting right renewal submitted 100%
Dartmore (10720 PR) prospecting right renewal submitted 100%
Carolina (10718 PR) prospecting right renewal submitted 100%
Waterberg South (OC) Swelpan (10721 PR) prospecting right renewal submitted 100%

Exxaro 2015 consolidated mineral resources and ore reserves report
93
Commodity Complex Name of right Type Status % attrib to Exxaro
Remainder attrib to
Coal
Tshikondeni Tshikondeni (UG & OC)
Tshikondeni (54 MR) mining right granted 100%
Goni (34 MR) mining right registered 100%
Australian Region Moranbah South (UG & OC)
MDL 277 and 377 mining licence submitted 50% Anglo American Coal Pty Ltd
EPC 584 and 602 exploration licence executed 50% Anglo American Coal Pty Ltd
Exxaro Central Complex (ECC)
Dorstfontein (OC & UG)
Dorstfontein West + Vlakfontein (119 MRC) mining right registered 74% Mmakau Mining Pty
Ltd
Dorstfontein West (123 MRC) mining right registered 74% Mmakau Mining Pty Ltd
Dorstfontein East (51 MR) mining right registered 74% Mmakau Mining Pty Ltd
Rietkuil Vhakoni (1916 PR) prospecting right executed 74% Mmakau Mining Pty Ltd
Forzando (OC & UG)
Forzando South (380 MR) mining right executed 74% Mmakau Coal Pty Ltd
Forzando North (381 MR) mining right executed 74% Mmakau Coal Pty Ltd
Forzando West (1066 PR) prospecting right executed 74% Mmakau Coal Pty Ltd
Legdaar (1846 PR) prospecting right renewal submitted 74% Mmakau Mining Pty Ltd
Kalabasfontein (1035 PR) prospecting right executed 74% Mmakau Coal Pty Ltd
Kalabasfontein (1170 PR) prospecting right executed 74% Mmakau Coal Pty Ltd
Schurvekop Ptn 24 (4627 PR) prospecting right granted 74% Mmakau Coal Pty Ltd
Schurvekop (1063 PR) Mmakau Coal prospecting right executed 49% Mmakau Mining Pty
Ltd
ECC Brakfontein (624 PR) prospecting right executed 100%
Eloff Eloff South (274 PR) prospecting right executed 51% South 32 & Canyon
Springs
Eloff North (273 PR) prospecting right executed 51% South 32 & Canyon Springs
Tumelo (OC & UG) Boschmanskop (116 MR) mining right renewal submitted 49% Mmakau Mining Pty Ltd
Mpumalanga Prospecting
Arnot South Arnot South (360 PR) prospecting right renewal submitted 100%
Kranspan Kranspan (102 PR) prospecting right renewal submitted 100%
Iron ore Republic of the Congo Mayoko (OC) Lekoumou exploitation right mining licence granted 100%
Ngongo exploration licence granted 100%
Mineral sands
Hillendale Mine + Braeburn + Braeburn Extension, Block P
converted right executed 58,55% Tronox
Fairbreeze A+B+C+C Ext +D converted right executed 58,55% Tronox

Exxaro 2015 consolidated mineral resources and ore reserves report
94
Commodity Complex Name of right Type Status % attrib to Exxaro
Remainder attrib to
Mineral sands
Port Durnford project converted right executed 58,55% Tronox
Gravelotte sand and rock converted right executed 100,00%
Namakwa Sands mine converted right executed 58,55% Tronox
Namakwa satellite deposits (Houtkraal & Rietfontein)
Prospecting right MR application submitted 58,55% Tronox
Tiwest: Cooljarloo, Jurien mining licence executed 43,98% Tronox
Cooljarloo West project, Cooljarloo North-west project,
Dongara
exploration licence executed 43,98% Tronox
Base metals
Deeps & Swartberg (zinc, lead, copper
and silver) converted right executed 26% Vedanta Resources
plc
Gamsberg North and Gamsberg East
prospecting (zinc) converted right executed 26% Vedanta Resources
plc
PR – Prospecting rights MR – Mining rights

Exxaro 2015 consolidated mineral resources and ore reserves report
95
Table 19: 2015 competent persons’ register
Operation/ project
Mineral resources Ore reserves
Name Relevant
experience (yrs)
Job title Registration Name Relevant
experience (yrs)
Job title Registration
Lead CP, Exxaro JH Lingenfelder 21 Manager geosciences SACNASP (400038/11)
C Ballot 19 Manager mining processes
ECSA (20060040)
Arnot mine MV Sambo 8 Resident geologist, Arnot SACNASP (400369/12)
N Van Der Merwe 9 Planning & optimisation manager
ECSA (201110033)
Belfast project FJP Schutte 33 Principal geologist, coal, HQ, Exxaro
SACNASP (400007/92)
PDM Lourens 11 Principle mining engineer
SAIMM (702550)
Glisa South project
FJP Schutte 33 Principal geologist, coal, HQ, Exxaro
SACNASP (400007/92)
Grootegeluk coal mine
CW van Heerden 13 Resident geologist, Grootegeluk SACNASP (400069/04)
R Van Staden 14 Manager mining operations
ECSA (20050123)
Inyanda coal J Maseko 10 Senior geologist, Inyanda GSSA (966522) J Maseko 10 Senior geologist, Inyanda
GSSA (966522)
Leeuwpan coal mine
M Steenkamp 5 Resident geologist, Leeuwpan SACNASP (400173/13)
H Motsotsoana 8 Senior Engineer, Leeuwpan
ECSA (201110036)
Mayoko W van der Schyff 25 Principal geologist, iron ore SACNASP (400176/05)
Matla TF Moabi 10 Senior geologist SACNASP (400067/08)
B Young 20 Planning & optimisation manager
PLATO, PMS (0182)
NBC G Gcayi 8 Resident geologist, NBC SACNASP (400299/11)
E Croeser 8 Manager mining ECSA (201110024)
Thabametsi project
FJP Schutte 33 Principal geologist, coal, HQ, Exxaro
SACNASP (400007/92)
C Ballot 19 Manager mining processes
ECSA (20060040)
Dorstfontein, Forzando, Eloff,
Tumelo
G Ndebele 8 Manager geology, ECC SACNASP (400107/10)
I Mouton 25 Manager Mining, ECC ECSA (200890050)
Waterberg North project
FJP Schutte 33 Principal geologist, coal, HQ, Exxaro
SACNASP (400007/92)
Waterberg South project
FJP Schutte 33 Principal geologist, coal, HQ, Exxaro
SACNASP (400007/92)

Exxaro 2015 consolidated mineral resources and ore reserves report
96
Operation/ project
Mineral resources Ore reserves
Name Relevant
experience (yrs)
Job title Registration Name Relevant
experience (yrs)
Job title Registration
Mafube (Nooitgedacht &
Wildfontein)
D Xaba 16 Geology manager, Anglo Coal SACNASP (400019/05)
D Xaba 16 Geology manager, Anglo Coal
SACNASP (400019/05)
Mafube mine (Springboklaagte)
D Xaba 16 Geology manager, Anglo Coal SACNASP (400019/05)
D Xaba 16 Geology manager, Anglo Coal
SACNASP (400019/05)
Moranbah South, Australia
AJ Laws 20 Specialist resource geologist, Anglo American Coal
AusIMM (209913)
Hillendale mine, Extension
D Sibiya 20 Geologist, Tronox SACNASP (400294/06)
H Kruger 15 Mine manager, Tronox ECSA (C20100270)
Fairbreeze A+B+C+C Ext
D Sibiya 20 Geologist, Tronox SACNASP (400294/06)
H Kruger 15 Mine manager, Tronox ECSA (C20100270)
Block P & Block extension
D Sibiya 20 Geologist, Tronox SACNASP (400294/06)
Port Dunford D Sibiya 20 Geologist, Tronox SACNASP (400294/06)
Fairbreeze D D Sibiya 20 Geologist, Tronox SACNASP (400294/06)
H Kruger 15 Mine manager, Tronox ECSA (C20100270)
Namakwa Sands C Van Vuuren 13 Geologist, Tronox SACNASP (400111/96)
C Philander 13 Manager, Tronox SACNASP (400181/15)
Gravelotte sand W van der Schyff 25 Principal geologist, iron ore SACNASP (400176/05)
Gravelotte rock W van der Schyff 25 Principal geologist, iron ore SACNASP (400176/05)
Cooljarloo, Australia
P Stevenson 30 Manager resource development, Tronox
AusIMM (107759) P Stevenson 30 Manager resource development, Tronox
AusIMM (107759)
Jurien, Australia P Stevenson 30 Manager resource development, Tronox
AusIMM (107759) P Stevenson 30 Manager resource development, Tronox
AusIMM (107759)
Dongara, Australia
P Stevenson 30 Manager resource development, Tronox
AusIMM (107759) P Stevenson 30 Manager resource development, Tronox
AusIMM (107759)
Black Mountain S Jenniker 16 Mineral resources manager, Vedanta
SACNASP (400129/08)
S Jenniker 16 Mineral resources manager, Vedanta
SACNASP (400129/08)

Exxaro 2015 consolidated mineral resources and ore reserves report
97
Operation/ project
Mineral resources Ore reserves
Name Relevant
experience (yrs)
Job title Registration Name Relevant
experience (yrs)
Job title Registration
Gamsberg S Jenniker 16 Mineral resources manager, Vedanta
SACNASP (400129/08)
S Jenniker 16 Mineral resources manager, Vedanta
SACNASP (400129/08)
*All competent persons are Exxaro employees except where otherwise stated.

Exxaro 2015 consolidated mineral resources and ore reserves report
98
Table 20: Unreviewed coal production figures
Operation Financial year 2013 2014 2015 2016 2017
Thermal coal (kt)
Grootegeluk 15 904 16 719 21 637 23 227 26 390
Matla 10 133 10 374 7 859 8 591 9 072
Leeuwpan 3 804 4 107 3 786 3 833 4 264
North Block Complex 2 668 2 602 2 870 2 961 2 994
Arnot 1 633 1 440 1 401
Exxaro Coal Central 1 1 365 4 107 3 994
Inyanda 1 992 1 633 1 035
New Clydesdale Colliery 419
Total thermal coal production 36 553 36 875 39 953 42 719 46 714
Metallurgical coal (kt)
Grootegeluk 1 908 2 120 1 856 2 295 2 221
Tshikondeni 343 154
Total metallurgical coal production 2 251 2 274 1 856 2 295 2 221
Total coal production 38 804 39 149 41 809 45 014 48 935 x Rounding figures may cause computational discrepancies x Tonnages are quoted in metric tonnes and thousand tonnes (kilotonnes) is abbreviated as kt 1 Exxaro Coal Central is included for 4 months

Exxaro 2015 consolidated mineral resources and ore reserves report
99