evaluation of urban polder drainage system performance …
TRANSCRIPT

1
EVALUATION OF URBAN POLDER DRAINAGE SYSTEM
PERFORMANCE IN JAKARTA
CASE STUDY KELAPA GADING AREA
By
Kalmah 1)
,
F.X. Suryadi 2)
Bart Schultz 3)
Abstract
Kelapa Gading area is located in the plains of North Jakarta about 6 km from the
coastline of Jakarta Bay. Kelapa Gading area covers 1288 ha it consists of three large
compartments and next to that the Kodamar Unit separated system from Kelapa
Gading excess water of the area is discharged to Sunter river and Pertukangan River.
The area is regularly flooded, especially during the wet season. Kelapa Gading area is
in particular facing flood problem since Jakarta __
the capital city of Indonesia __
became the primary growth machine of the nation. Among others, this has resulted in
suburbanization in Jakarta’s neighbouring regions.
Land subsidence, which occurs due to huge groundwater extraction, and climate
change are also contributing to flooding problem due to hydrologic changes that alter
the magnitude and frequency of peak flows and sea level rise.
Four main objectives are the basis for this research. First is describing the existing
urban drainage and flood protection systems in Kelapa Gading area and other satellite
cities (JABODETABEK). Second is analysing the possible impacts of land
subsidence and sea level rise on inundated area. Next are some measures that would
have to be taken into consideration in order to reduce the flooded area and provide
adequate urban drainage and flood protection especially when the impacts of land
subsidence and sea level rise are taken into account. The structural measures were
studied by considering hydrologic and hydraulic conditions and by carrying out
hydrodynamic modelling (DUFLOW) as tools for decision support which may
evaluate options in developing urban drainage and flood protection scenarios for
Kelapa Gading area based on a design rainfall with a chance of occurrence of 4% per
year or the return period of 25 years. Scenarios on the improvement of the macro
urban drainage system and the selected river basin were developed as follows:
Scenario 1. The existing urban drainage was considered as one system with the
sedimentation in the urban canal system. This represents the existing condition
and has been used as the basic case;
Scenario 2. Similar with the first scenario 1 but the designed urban canal
profiles are used;
Scenario 3. Each compartment is considered as a single polder;
1) Staff of Directorate of Programming, Directorate General of Water Resource Development,
Ministry of Public Works, Indonesia; 2) Senior Lecturer Land and Water Development, UNESCO-IHE Delft, the Netherlands; 3) Professor of Land and Water Development, UNESCO-IHE Delft, the Netherlands.

2
Scenario 4. To analyse the effect of land subsidence and sea level rise. In this
case 1.25 m of land subsidence and 0.15 m of sea level rise will be considered
for the 25 years time interval;
The results indicate that due to lower topographic conditions in adjacent area caused
by land subsidence and sea level rise, a combine system consisting of gravity drainage
and pumping are primed to meet the future conditions of drainage system and flood
protection in the future in Kelapa Gading area. Therefore an urban polder with its
properties is proposed to be constructed.
Keywords: GIS modelling, DUFLOW hydraulic modelling, polder system, urban drainage,
flood protection

3
1. INTRODUCTION
Kelapa Gading polder located in North Jakarta as shown in Figure 1 with the
catchments of ±13 km2 with the total primary and secondary drainage length of ±40
km. Number of population in Kelapa Gading are about 108,000 people and population
density are 8.3 people/km2. Kelapa Gading district is consisted of three sub districts
which are North Kelapa Gading, West Kelapa Gading and Pegangsaan Dua. The
highest population density is in Pegangsaan 2 sub-district reached 13.2 people/km2
and the lowest is in West Kelapa Gading sub-district which reached 4.3people/km2.
Kelapa Gading area is located in northern part of Jakarta and Jakarta area lies between
0 to 8 m above the mean sea level (MSL) and most of the areas are flat. The land
slope is about 0 – 2 0/00. Kelapa Gading has an average land elevation of 2.2m+MSL.
Kelapa Gading is located in a warm and humid zone. The peak rainfall happens in
February with the average monthly rainfall of 400 mm and dry season is in September
with average monthly rainfall of 22 mm. Average daily temperature is ranging from
250 to 36
0 C.
The area covers about 14.50 km2, the land use in Kelapa Gading district in 2007 is
divided into: 89 % for housing, 3 % for industry, 5 % for office and warehouse, 2 %
for garden and 1 % for others.
Over the last two years Kelapa Gading area has undergone rapid development
especially west and east part. This development has lead to reduction of water
infiltration ability in this area.
Figure 1. The area of Kelapa Gading
(Public Works Department of Daerah Khusus Ibukota Jakarta, 2009)
Kelapa
gading

4
2. PROBLEM DEFINITION
Land subsidence is not a new phenomenon for Jakarta, the capital city of Indonesia. It
has been reported for many years that several places in Jakarta are subsiding at
different rates (Murdohardono & Tirtomihardjo, 1993; Murdohardono & Sudarsono,
1998; Rajiyowiryono, 1999). The impact of land subsidence in Jakarta could be seen
in several forms, such as cracking of permanent constructions and roads, changes in
river canal and drain flow systems, wider expansion of flooding areas, malfunction of
drainage system, increased inland sea water intrusion and increased tidal flooding
coverage (Abidin et.al, 2009).
For Kelapa Gading area was estimated that the land subsidence is between 3 to 6 cm
per year (Abidin, 2001). By considering the rate of land subsidence of 5 cm/year and
within 25 years the land subsidence will be about 1.25 m and this estimation will be
used in the model simulations. Next to that the sea level rise of 0.15 m will also be
considered for the next 25 years.
The resulted land subsidence will also then affect the urban development plan and
process. Figure 2 illustrates the possible relation between land subsidence and urban
development in Jakarta.
Figure 2. Urban development and land subsidence relation in Jakarta
(Abidin et al., 2009)

5
In Kelapa Gading area, there is already flood protection system dividing the area into
four different compartments as shown in Figure 3:
1. Kodamar Compartment with catchment area of Tabah Raya market, the navy
housing complex up to the Western Boulevard of Kelapa Gading;
2. Sunter Timur 1B Compartment with catchment area of the central part of Kelapa
Gading which consist of Boulevard Raya and Pelepah Raya Street, Western
Boulevard and Gading Kirana Area;
3. Don Bosco Compartment with the catchment area from Gading Kusuma until
Eastern Boulevard which covers Walikota complex, Nirwana Street and its
surroundings;
4. Pegangsaan Compartment with catchment area of northern part of Pegangsaan
which are eastern Boulevard street until Kali Bendung Betik (Walikota
Complex, Kelapa Hibryda complex until Waduk Pasar Mandiri).
Flooding in Kelapa Gading comes from inside and outside of the area. Flooding from
inside is due to insufficient capacity of the urban drainage system and from outside is
due to outside water level (river and sea water level).
Figure 3. Compartments in Kelapa Gading
(Public Works Department of Daerah Khusus Ibukota Jakarta, 2009)
In 1962, Kelapa Gading area was first developed by PT Summarecon Tbk. Until now,
there are nine different developers active in this area. For a long time there has been
conflict of interest between developers to dry their own areas and this condition has
caused the drainage system in Kelapa Gading are not connected and dis-integrated to
each other. Some of the sewage systems which stand alone and not connected to the
main drainage system because of its location and crossing another developer’s service
area. Solid waste and water plant occupied the drainage system as the result of lack of
maintenance in the drainage system and this condition has led the system in failure to
protect the area from flooding during rainy season.

6
3. Research objectives
Main research objective :
The main research objective is to define the best solution for drainage and flood
protection in Kelapa Gading area by using a hydraulic modelling.
Specific research objectives are:
To analyze existing urban drainage and flood protection systems in Kelapa
Gading;
To investigate the suitability of polder system development to improve the
urban drainage and flood protection systems;
To develop some scenarios in order to improve the hydraulic performance of the
urban drainage system in Kelapa Gading;
To analyse the possible impacts of land subsidence and climate change on the
urban drainage and flood protection system.
4. METHODOLOGY
4.1 General
There are some steps to achieve the objectives which are the literature review, data
acquisition, data analysis, modelling, evaluation and recommendation. The correlation
each of this of steps is described in Figure 4.
Figure 4. Methodology of the research
Data acquisition
Modelling
Evaluation
Data Analysis
Recomendation
Lit
eratu
re
Rev
iew
7
5 ANALYSIS AND MODELLING
5.1 The comparison between Kodamar with other compartments
In this study a comparison has been made between Kodamar Compartment and the
rest of Kelapa Gading areas which covers service area, percentage of retention area
and pumping capacity and the result is presented in Table 1.
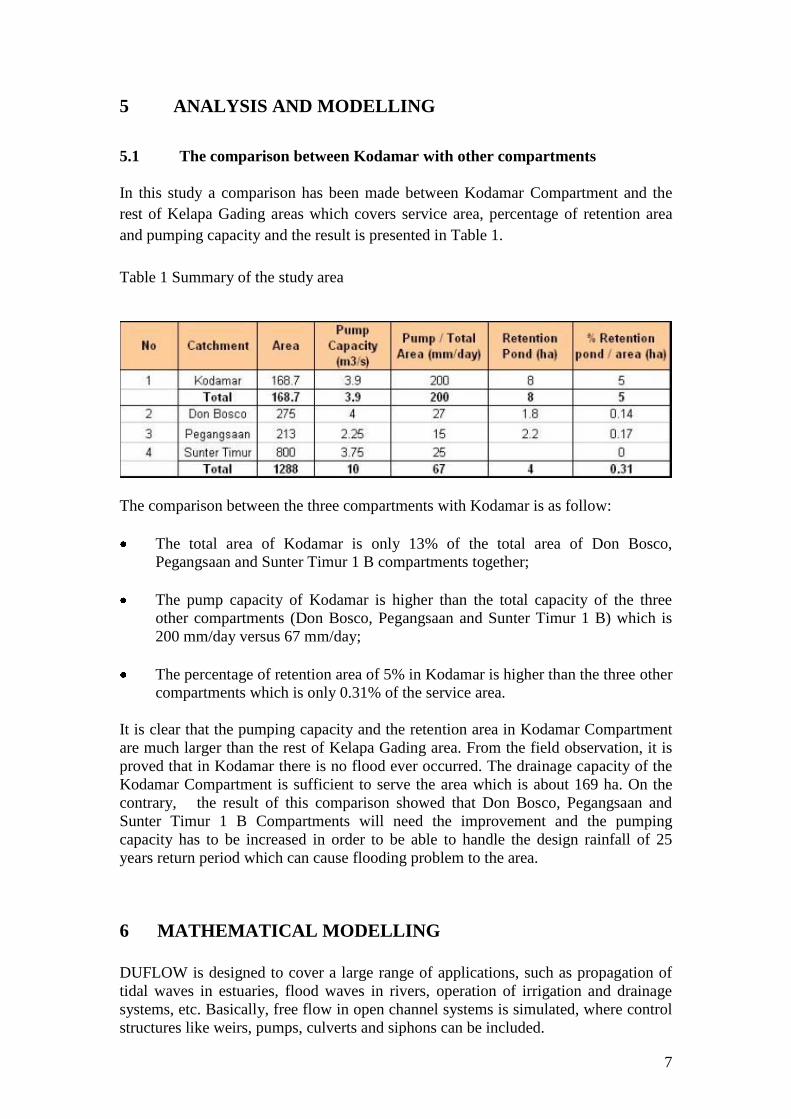
Table 1 Summary of the study area
The comparison between the three compartments with Kodamar is as follow:
The total area of Kodamar is only 13% of the total area of Don Bosco,
Pegangsaan and Sunter Timur 1 B compartments together;
The pump capacity of Kodamar is higher than the total capacity of the three
other compartments (Don Bosco, Pegangsaan and Sunter Timur 1 B) which is
200 mm/day versus 67 mm/day;
The percentage of retention area of 5% in Kodamar is higher than the three other
compartments which is only 0.31% of the service area.
It is clear that the pumping capacity and the retention area in Kodamar Compartment
are much larger than the rest of Kelapa Gading area. From the field observation, it is
proved that in Kodamar there is no flood ever occurred. The drainage capacity of the
Kodamar Compartment is sufficient to serve the area which is about 169 ha. On the
contrary, the result of this comparison showed that Don Bosco, Pegangsaan and
Sunter Timur 1 B Compartments will need the improvement and the pumping
capacity has to be increased in order to be able to handle the design rainfall of 25
years return period which can cause flooding problem to the area.
6 MATHEMATICAL MODELLING
DUFLOW is designed to cover a large range of applications, such as propagation of
tidal waves in estuaries, flood waves in rivers, operation of irrigation and drainage
systems, etc. Basically, free flow in open channel systems is simulated, where control
structures like weirs, pumps, culverts and siphons can be included.

8
As in many water management problems, the runoff from catchments areas is
important; a simple precipitation-runoff relation is part of the model set-up in
DUFLOW. With the DMS-component RAM the precipitation-runoff processes can be
described in detail. The results of a RAM calculation can be used as input for a
DUFLOW-calculation.
In DUFLOW a model, representing a specific application, can be put together from a
range of elements. Types of elements which are available are open channel sections
(both river and canal sections), and control sections or structures such as weirs,
culverts, siphons and pumps.
For instance a drainage system consists of a network of (small) canals; water may be
locally transported through pumps and siphons and in the network the discharges and
levels may be controlled by means of weirs or other control structures.
6.1. Model Schematization
In this research several scenarios will be studied and compared. These scenarios cover
the present and proposed development in the future for Kelapa Gading area.
6.2. Development scenarios
The existing condition of Kelapa Gading drainage system is schematized and
modelled as in Figure 5. There are three outlets on the Northern part of the system to
Kali Bendung Betik and all of them are already controlled by the gates. The same
condition is also applied to the Western and Southern part of the system to Sunter
River. There are no control gates in the eastern part of the outlets to Pertukangan
River.
Figure 5. DUFLOW model schematization included the locations of Section 34,
Section 64 and Section 76
9
Based on the problem definition, analysis of the existing conditions, in this study, four
scenarios will be studied:
Scenario 1: where the existing urban drainage system was considered as one system
with the sedimentation in the urban canal system;
Scenario 2: similar with the first scenario but the designed urban canal profiles are
used;
Scenario 3: each compartment is considered as a single polder;
Scenario 4: to study the effect of sea level rise and land subsidence by taking into
account 25 years interval from now;
In this study, the boundary conditions of the model consist of:
River discharge is used for upstream boundary conditions;
Tidal water level are used as downstream boundary conditions;
Design rainfall to the area with 25 years return period.
6.2.1. Scenario 1: Present condition with pumps and Kelapa Gading area is
considered as one integrated system.
This scenario described the existing performance condition of Kelapa Gading flood
protection system. In scenario 1, the pump will be set to work when water level is
1.75 m+MSL and to stop when the water level is 1.25 m+MSL. The existing gates in
the system will be in close condition. The system was simulated and based on design
condition and one day rainfall of 232 mm/day with 25 year return period.
The result of the model development will be as follow:
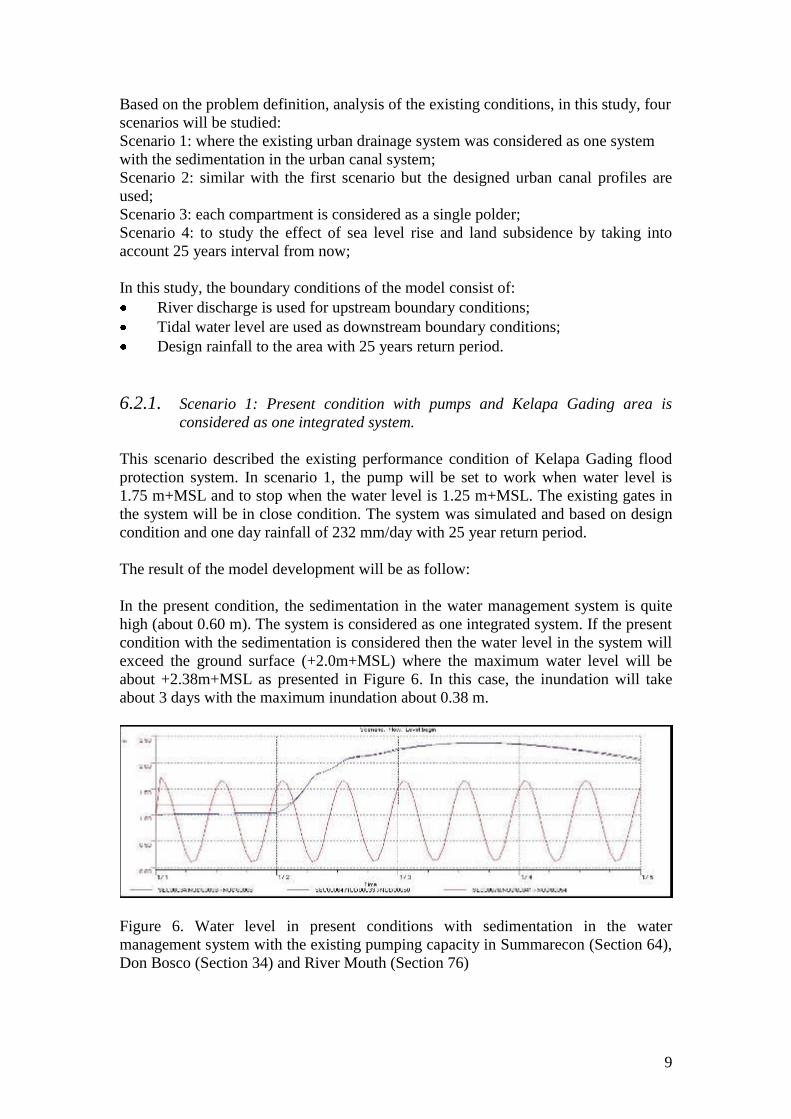
In the present condition, the sedimentation in the water management system is quite
high (about 0.60 m). The system is considered as one integrated system. If the present
condition with the sedimentation is considered then the water level in the system will
exceed the ground surface (+2.0m+MSL) where the maximum water level will be
about +2.38m+MSL as presented in Figure 6. In this case, the inundation will take
about 3 days with the maximum inundation about 0.38 m.
Figure 6. Water level in present conditions with sedimentation in the water
management system with the existing pumping capacity in Summarecon (Section 64),
Don Bosco (Section 34) and River Mouth (Section 76)

10
6.2.2. Scenario 2a: Design condition with pumps and Kelapa Gading area is
considered as one integrated system.
In Scenario 2a, the system will also be considered as integrated as in Scenario 1 and it
will be modelled based on design condition where no sedimentation in the system and
the rainfall intensity of 232 mm/day with 25 years return period.
On scenario 2a, the pump will be set to work when water level is 1.75m+MSL and it
will be stop when the water level is 1.25m+MSL. The existing gates in the system
will be in close condition.
The result of model simulation is presented in Figure 7 where the highest water level
in the system is 2.10m+MSL. It means the water will also overflow to the surrounding
areas where the ground elevation, with 10cm+MSL inundation. The inundation will
take about two days. It is clear that in this situation, the drainage system capacity
(canals, retention basins and pumping capacity) is not sufficient to protect the area
from the flooding.
Figure 7. Water levels with design condition with the existing pumping capacity in
Summarecon (Section 64), Don Bosco (Section 34) and River Mouth (Section 76)
By comparing between Scenario 1 and Scenario2, the following conclusions can be
taken:
The pumping capacity in the system is not sufficient in order to protect the area
from the flooding due to the design rainfall (232 mm/day);
The effect of sedimentation in the system is significant where the water level
will be about 0.38 m higher then in the design condition. It means that if the
maintenance of the system is properly done, the inundation will be much lower
and shorter.

11
6.2.3. Scenario 2b: Design condition with improved pumping capacity and Kelapa
Gading area is considered as one integrated system.
Based on Scenario 2a, the next Scenario 2b is to increase the pumping capacity in the
system. In this case the capacity is increased by factor 2 and the retention areas are
kept the same, because it is not possible to have a free extra space for the retention
areas in Kelapa Gading. The starting and stopping water level were kept the same as
in Scenario 1 (start to pump when the water level is +1.75m+MSL and stop to pump
when the water level reaches +1.25m+MSL). The result of the model simulation is
showed in Figure 8 where the water level will be around +1.75m+MSL. It means that
the inundation of the area can be avoided.
Figure 8. Water levels with increasing pumping capacity by 100% in Summarecon
(Section 64), Don Bosco (Section 34) and River Mouth (Section 76)
In Figure 9 it is shown the pumping discharge at the unit Don Bosco. From this figure,
it is clear that the pumping station will work about one day continuously.
Figure 9. Pumping station Don Bosco (Pump0007)
6.2.4. Scenario 3: Design condition with existing pumping capacity for Don Bosco
(3) Compartment where Kelapa Gading area is considered as several
independent sub-systems.
In this Scenario 3, the condition with disconnected system was modelled where there
is no possibility for the drainage water from the pumping station flows back to the
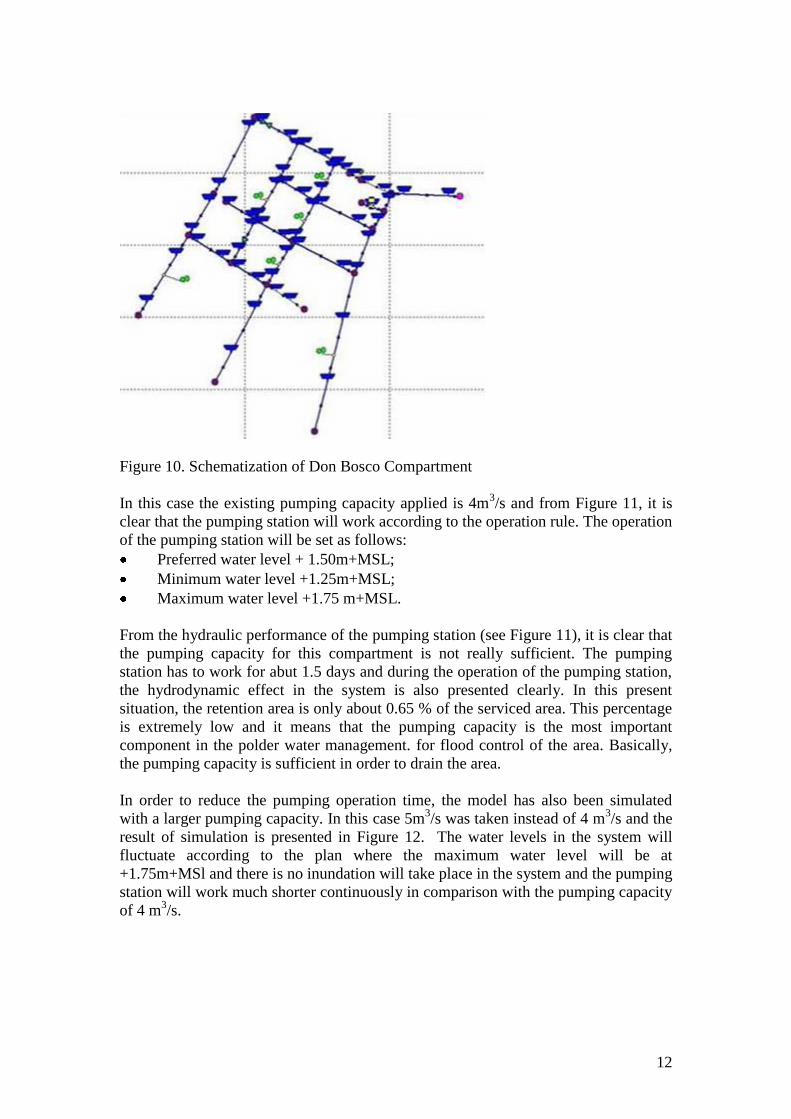
system. The schematization of the model of Don Bosco Compartment is presented in
Figure 10 and the result of the simulation is presented in Figure 11.and Figure 12.
12
Figure 10. Schematization of Don Bosco Compartment
In this case the existing pumping capacity applied is 4m3/s and from Figure 11, it is
clear that the pumping station will work according to the operation rule. The operation
of the pumping station will be set as follows:
Preferred water level + 1.50m+MSL;
Minimum water level +1.25m+MSL;
Maximum water level +1.75 m+MSL.
From the hydraulic performance of the pumping station (see Figure 11), it is clear that
the pumping capacity for this compartment is not really sufficient. The pumping
station has to work for abut 1.5 days and during the operation of the pumping station,
the hydrodynamic effect in the system is also presented clearly. In this present
situation, the retention area is only about 0.65 % of the serviced area. This percentage
is extremely low and it means that the pumping capacity is the most important
component in the polder water management. for flood control of the area. Basically,
the pumping capacity is sufficient in order to drain the area.
In order to reduce the pumping operation time, the model has also been simulated
with a larger pumping capacity. In this case 5m3/s was taken instead of 4 m
3/s and the
result of simulation is presented in Figure 12. The water levels in the system will
fluctuate according to the plan where the maximum water level will be at
+1.75m+MSl and there is no inundation will take place in the system and the pumping
station will work much shorter continuously in comparison with the pumping capacity
of 4 m3/s.

13
Figure 11. Water levels and pumping discharge at Don Bosco (3) Compartment
Figure 12. Water levels and pumping discharge at Don Bosco (3) Compartment with
the pumping capacity of 5m3/s
In the present conditions, the system is open connected to the outlet at the river.
There are advantages and disadvantages of this system with open and disconnect
system. The advantage of this system is in case there is low water at the out let; it
means that drainage water can flow through two different ways, i.e. pumping station
and the drainage canal (by gravity).
But, the disadvantage of this system is in case the water level at the outlet is high
because of the high discharge from the upstream part of the catchments area, then
drainage water which is pumped out may flow back again to the system. It means that
the problem will not be solved at all.
Based on this result, it is suggested to construct a control structure (sliding gate) in
order to control the drainage water in a proper way. In case gravity drainage is
possible, the sliding gate can be opened and if the downstream water level at the
outlet is too high, the gate must be closed in order to avoid back flow to the system.
Next to that, the control structure can also be used for water quality control in the
system where if necessary, when the quality is poor, the gate can be opened during
low tide and flushing can be carried out.
In this case several simulations have been carried out in order to find the relationship
between the percentages of open water area with the water level in the polder in order

14
to avoid inundation in the polder. For Don Bosco Compartment it is done by taking
the pumping capacity of 3 m3/s. With this pumping capacity and present retention
area, inundation will occur for the 25 years return period run off. In this case different
percentage of the open water area were selected and the pumping capacity was kept 3
m3/s. The result is presented in Figure 13 and it is shown that with 8 % of open water
area the inundation can be avoided where the ground surface elevation is at +2
m+MSL. In fact an optimal combination can be found between pumping capacity and
the percentage of open water area for the system.
0
0.5
1
1.5
2
2.5
3
0.00 1.00 2.00 3.00 4.00 5.00 6.00 7.00 8.00 9.00
wa
ter
leve
l (m
+M
SL
)
percentage of open water area (%)
Figure 13. Percentage open water area versus water level in Don Bosco Compartment
with the pumping capacity of 3 m3/s
6.2.5. Scenario 4a: Design condition with improved pumping capacity and Kelapa
Gading area considered as one integrated system and by considering the
effect of land subsidence and sea level rise
In this Scenario 4a, the land subsidence of 1.25 m (for 25 years time) and sea level
rise 0.15 m are considered. It is clear that gravity by drainage is not possible anymore
where the outer water level is higher than the polder water level.
The result of simulation is shown in Figure 14 that the water level in the polder is
about +0.90m+MSL and the ground elevation are +0.75m+MSL due to land
subsidence. It means that flooding will occur if no measure is taken. In order to
overcome the flooding, scenario 4b is developed. The crest level of the ring dikes
should be constructed at +2.50 m+MSL in order to protect the area from the
overtopping from outside water level (tides).

15
Figure 14. Water levels in Kelapa Gading influenced by land subsidence and sea level
rise with the existing pumping capacity
6.2.6. Scenario 4b: Design condition with improved pumping capacity and Kelapa
Gading area considered as one integrated system and by considering the
effect of land subsidence and sea level rise
In this Scenario 4b the future condition of 25 years from now was modelled as in
Scenario 4a. The only different is the pumping capacity is increased by 2.5 times. This
higher pumping capacity will be needed in order to keep the water level in the polder
lower than the ground surface (+0.75 m+MSL). In this case, the crest level of the ring
dikes should also be at +2.50 m+MSL in order to avoid the overtopping of the outside
water level to the polder. The result of the simulation is presented in Figure 15.
Figure 15. Water levels in Kelapa Gading influenced by land subsidence and sea level
rise with increased pump capacity
It is shown that the water level in the polder will be about 0.70m+MSL and there is no
inundation in the system. In order to handle the effect of land subsidence and sea level
rise the following measures have to be done:
Increase the dike system to protect the area for outer water level;
Increase the pumping capacity of the system.
In all the simulations, the water level in the polder system is almost horizontal, there
is a very small water level gradient in the system. Besides that, due to the size of the
area, dynamic routing in the system can also be neglected.

16
7. CONCLUSIONS AND RECOMMENDATIONS
Based on the modelling analysis and evaluation, the following conclusions can be
listed:
In general, the percentage of the open water area is too small in order to store
the drainage water during rainy season;
The pumping capacity of the three compartments in Kelapa Gading (Sunter
Timur 1B, Pegangsaan, Don Bosco) are too small compared to Kodamar
Compartment;
The system in Kelapa Gading should be operated as one integrated system
where runoff will be better spread in the whole system in comparison with the
individual system per compartment;
In some places, water control structures have to be constructed in order to avoid
that water from the pumping station will flow back to the system; These water
control structures can also be used for water quality control measure in the
normal rainy conditions i.e. Don Bosco as disconnected sample, where flushing
of the water in the system which can be obtained when the water level in the
river (outlet) is lower than in the system;
The effect of the sedimentation in the water management system to the flood
problems is significant and by doing a proper regular maintenance of the
system, significant reducing of the flood in the area can be obtained;
For the future conditions where land subsidence is still continuing with the rate
about 5 cm/year and also sea level rise, drainage by gravity will not be possible
anymore. It means that a polder system with fully control system has to be
applied.
Based on this study result, the following recommendations can be listed:
To increase the percentage of the open water area, a combination between living
and store water can be considered as a proper measure for Kelapa Gading area;
In case there is no more free open space available to be used as retention area,
the principle of using the land zoning with different levels can be considered to
Kelapa Gading area. It means that in this case the green area and park can be re-
designed where the elevation will be lowest in comparison with other part of the
area in Kelapa Gading. It means that under a heavy rainfall, these green areas
and parks can be used as temporary storages and inundated;
The pumping capacity in Kelapa Gading must be increase in order to pump the
excess water resulted from high precipitation and to be able to meet the future
scenario of land subsidence and sea level rise;
With the polder system, a drainage system should be checked carefully that
drainage water will not flow back to the system. For this purpose some control
structures (sliding gates or flap gates) have to be installed in the correct places;
By considering the aspect of operation, flap gates (automated operation) are
recommended to be used instead of sliding gates where operators will be needed
in order to operate the control structures properly;
17
REFERENCES
Alphen, J. V., & Beek, E. V. (2006). From flood defence to flood management -
Prerequisites for sustainable flood management. Paper presented at the 3rd
International
Air, P. S. D. (2006). Pengembangan Polder Berbasis partisipasi Masyarakat. Western
Java, Departemen Pekerjaan Umum: 350.
Air, P. S. D. (2006). Pengembangan system polder dikawasan metropolitan sebagai
bagian dari pengelolaan sistem tata air. West Java, Departemen Pekerjaan Umum.
Adyabadam, A., Joleha, J., Ke, S., Le, T.H., Maino, V., and Zhao, W., 2009. Flood
Mitigation of Nyando River using DUFLOW Modelling, Civil Engineering
Dimension Volume 11 No. 1/March.
Buttler D. and J. Davies, 2004, Urban Drainage Second Edition.
Caljouw M., J.M Peter and Pratiwo, Papers international 1st conference on urban
history, (2004), flooding in Jakarta, Jakarta Leiden.
Chocat,B., Krebs, P., Marsalek, J.,Rauch,W., & Schilling,W., 2001. Urban Drainage
Redefined: From Stormwater Removal to Integrated Management. Water Science
& Technology vol. 43 No. 5 pp. 61-68.
Cook, H.F., Ghaffari, A., and Lee, H.C., 2000. Integrating climate, soil and crop
information : a land suitability study using GIS, in 4th
International Conference on
Integrating GIS and Environmental Modelling (GIS/EM4) : Problems, Prospects
and Research Needs. 2-8 September 2000, Canada.
De Vriend, H. J. (2006). Flood management research need. Paper presented at the 3rd
International Symposium on Flood Defence, Nijmegen, and The Netherlands.
Douben, N., & Ratnayake, M. W. (2006). Characteristic data on river floods and
flooding; facts and figures. Paper presented at the 3rd International Symposium on
Flood Defence, Nijmegen, and The Netherlands.
De Jong, T. (2008), Water, networks and crossings, Lecture Notes, TU Delft, the
Netherlands.
Jarraud, M. (2006). State of the art in policy development and implementation - From
flood management to Integrated Flood Management. Paper presented at the 3rd
International Symposium on Flood Defence, Nijmegen, and The Netherlands.
Jakarta, D. P. U. P. D. K. I. (2007). Data Ketinggian permukaan air pintu pintu air,
peilschaal, waduk dan pompa posko pengendalian banjir
Jakarta, D. P. U. P. D. K. I. (2007). Pedoman siaga banjir
JICA (2007). Report of Institutional project for flood management in Jabodetabek

18
Karsa, P. M. W. (2005). Penyusunan dan Penetapan SOP Pompa dan Waduk di
Propinsi DKI Jakarta. Jakarta, Dinas Pekerjaan Umum Pemerintah Propinsi
Daerah Khusus Ibukota Jakarta.
Kalogirou, S., 2002. Expert systems and GIS : an application of land suitability
evaluation, Elsevier Sciences Ltd., United Kingdom.
Papers international symposium volume I, (1982), Polders of the World: Polder
Projects Land and Water Management Aspects, The Netherlands.
Reference Manual of Duflow VERSION 3.5 April 2002, Stowa / MX
Systems.Symposium on Flood Defence, Nijmegen, and The Netherlands.
Schultz B., 2006, Flood Management under Rapid Urbanisation and Industrialization
in Flood-Prone Areas: A Need for Serious Consideration, Irrigation and Drainage.
55: