evaluation of the german strategy for adaption to climate ... · 16/2015 climate change ....
TRANSCRIPT
16/2015 CLIMATE CHANGE
Evaluation of the German Strategy for Adaption to Climate Change (DAS) – Reporting and Closing Indicator Gaps

CLIMATE CHANGE 16/2015
Environmental Research of the Federal Ministry for the Environment, Nature Conservation, Building and Nuclear Safety
Project No. (FKZ) 3711 41 106 Report No. (UBA-FB) 002105/E
Evaluation of the German Strategy for Adaption to Climate Change (DAS) – Reporting and Closing Indicator Gaps
by
Konstanze Schönthaler, Stefan von Andrian-Werburg Bosch & Partner GmbH, Munich, Germany
On behalf of the Federal Environment Agency (Germany)
Imprint
Publisher: Umweltbundesamt Wörlitzer Platz 1 06844 Dessau-Roßlau Tel: +49 340-2103-0 Fax: +49 340-2103-2285 [email protected] Internet: www.umweltbundesamt.de
/umweltbundesamt.de /umweltbundesamt
Study performed by: Bosch & Partner GmbH Pettenkoferstr. 24 80336 München, Germany
Study completed in: March 2015
Edited by: Section I 1.6 KomPass – Climate Impacts and Adaption in Germany Dr. Petra van Rüth
Publication as pdf: http://www.umweltbundesamt.de/publikationen/evaluation-of-the-german-strategy-for-adaption-to
ISSN 1862-4359
Dessau-Roßlau, September 2015
The Project underlying this report was supported with funding from the Federal Ministry for the Environment, Nature Conservation, Building and Nuclear safety under project number FKZ 3711 41 106. The responsibility for the content of this publication lies with the author(s).

Development of the DAS Indicator System and Preparation of the Monitoring Report
4
Abstract:
On 17th December 2008 the German Federal Cabinet adopted the German Strategy for Adaptation to Climate Change (DAS). This Strategy highlights areas likely to be affected by climate change or which already show evidence of impacts, as well as basic options for a possible approach and the requirements for action in various sectors. 2015 will see the publication of an initial progress report regarding the implementation and further development of the DAS. The progress report is to contain an indicator-based Monitoring Report which describes all consequences of climatic change referred to in the named DAS sectors, the measures being implemented as well as any past and current developments. The report is intended to address political decision-makers at the same time as serving interested members of the public.
The Indicator System underlying the Monitoring Report and the overall report itself were created and agreed politically in an inter-departmental process with the participation of numerous experts from the competent sectors of agencies at Federal and Länder level and from scientific and private institutions. This painstaking theme-specific process took nearly six years. In future the monitoring report is to be updated quadrennially.
The Indicator System comprises 102 indicators; the Monitoring Report runs to some 256 pages. High standards were set and a documentation system was constructed to support the process of updating the indicator documentation, the data sources and the reporting process itself. This documentation system was designed in a way to ensure the complete repeatability of calculations.
Development of the DAS Indicator System and Preparation of the Monitoring Report
5
Table of contents
List of figures ............................................................................................................................ 7
List of tables ............................................................................................................................. 8
List of abbreviations .................................................................................................................. 9
Summary ................................................................................................................................ 15
1 Introduction .................................................................................................................... 24
1.1 Project purpose ................................................................................................. 24
1.2 Project outcomes ............................................................................................... 26
1.2.1 List of indicators ............................................................................................ 27
1.2.2 Indicator and data fact sheets ........................................................................ 33
1.2.3 Background papers ........................................................................................ 35
1.2.4 Monitoring Report.......................................................................................... 36
1.2.5 Bibliography ................................................................................................. 38
1.2.6 User Manual .................................................................................................. 38
1.2.7 Contacts File ................................................................................................. 39
2 Working Methods and Project Progress ............................................................................. 40
2.1 Initial situation and challenges ........................................................................... 40
2.2 Work Phases ..................................................................................................... 42
2.2.1 Delimiting themes ......................................................................................... 44
2.2.2 Prioritisation of subject fields ......................................................................... 47
2.2.3 Development of indication ideas and elaboration of indicators ......................... 50
2.2.4 Documentation of indicators and data sources................................................. 54
2.2.5 Preparation of Monitoring Report .................................................................... 55
2.3 Cooperation and technical participation .............................................................. 56
2.3.1 Integration of sectoral experts ........................................................................ 57
2.3.2 Elements of participation ............................................................................... 58
2.3.3 Project steering ............................................................................................. 62
3 Technical and political coordination of the indicators and the Monitoring Report ................. 63
3.1 Technical coordination ....................................................................................... 63
3.1.1 Political coordination of the DAS Indicators ..................................................... 63
3.1.2 Technical agreement of the Monitoring Report ................................................. 69
3.2 Political consultation ......................................................................................... 69
3.2.1 Political coordination of the DAS indicators ..................................................... 69
3.2.2 Political agreement of the Monitoring Report ................................................... 78
Development of the DAS Indicator System and Preparation of the Monitoring Report
6
4 Gaps in data ................................................................................................................... 81
5 Organisation of the reporting process ............................................................................... 84
6 Reflections on the process as a whole ............................................................................... 86
7 Appendices .................................................................................................................... 89

Development of the DAS Indicator System and Preparation of the Monitoring Report
7
List of figures
Fig. 1: Impact and response category in the DAS Indicator System ...... 28
Fig. 2: Layouted introduction to the action field “Agriculture” ............. 37
Fig. 3: Layouted presentation of indicator RO-R-5 .............................. 38
Fig. 4: Steps in elaborating the DAS Indicator System and the Monitoring Report ................................................................. 43
Fig. 5: Chronological sequence of work phases ................................. 44
Fig. 6: The action field “Woodland and forestry” as an example of the procedure for creating the indication fields ............................. 46
Fig. 7: Workflow of political coordination of DAS indicators ................ 70
Fig. 8: Workflow of political agreement of the Monitoring Report ........ 79
Development of the DAS Indicator System and Preparation of the Monitoring Report
8
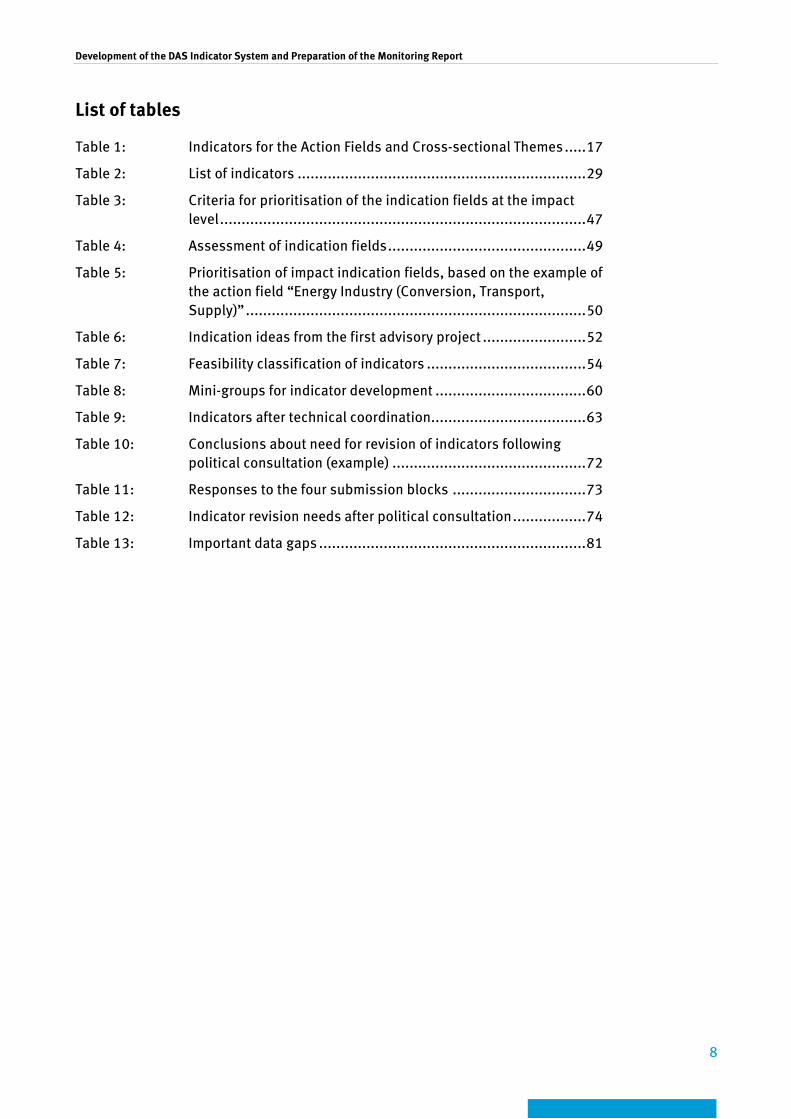
List of tables
Table 1: Indicators for the Action Fields and Cross-sectional Themes ..... 17
Table 2: List of indicators ................................................................... 29
Table 3: Criteria for prioritisation of the indication fields at the impact level ..................................................................................... 47
Table 4: Assessment of indication fields .............................................. 49
Table 5: Prioritisation of impact indication fields, based on the example of the action field “Energy Industry (Conversion, Transport, Supply)” ............................................................................... 50
Table 6: Indication ideas from the first advisory project ........................ 52
Table 7: Feasibility classification of indicators ..................................... 54
Table 8: Mini-groups for indicator development ................................... 60
Table 9: Indicators after technical coordination .................................... 63
Table 10: Conclusions about need for revision of indicators following political consultation (example) ............................................. 72
Table 11: Responses to the four submission blocks ............................... 73
Table 12: Indicator revision needs after political consultation ................. 74
Table 13: Important data gaps .............................................................. 81
Development of the DAS Indicator System and Preparation of the Monitoring Report
9
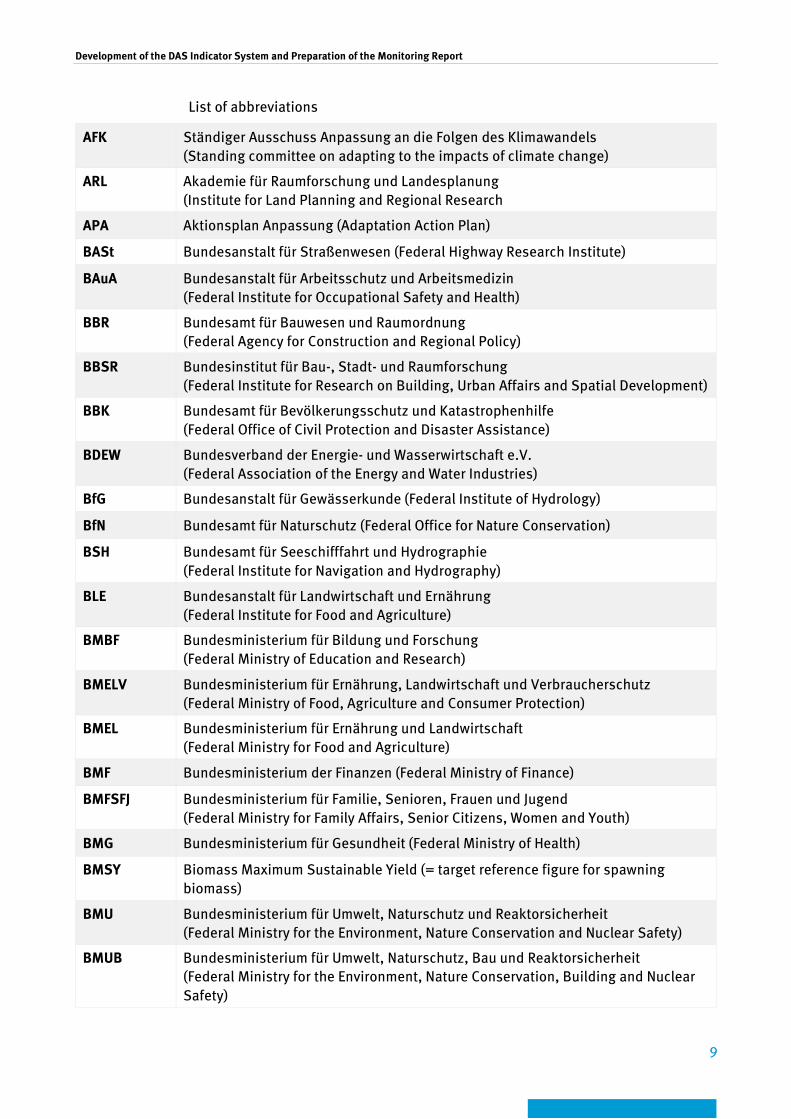
List of abbreviations
AFK Ständiger Ausschuss Anpassung an die Folgen des Klimawandels (Standing committee on adapting to the impacts of climate change)
ARL Akademie für Raumforschung und Landesplanung (Institute for Land Planning and Regional Research
APA Aktionsplan Anpassung (Adaptation Action Plan)
BASt Bundesanstalt für Straßenwesen (Federal Highway Research Institute)
BAuA Bundesanstalt für Arbeitsschutz und Arbeitsmedizin (Federal Institute for Occupational Safety and Health)
BBR Bundesamt für Bauwesen und Raumordnung (Federal Agency for Construction and Regional Policy)
BBSR Bundesinstitut für Bau-, Stadt- und Raumforschung (Federal Institute for Research on Building, Urban Affairs and Spatial Development)
BBK Bundesamt für Bevölkerungsschutz und Katastrophenhilfe (Federal Office of Civil Protection and Disaster Assistance)
BDEW Bundesverband der Energie- und Wasserwirtschaft e.V. (Federal Association of the Energy and Water Industries)
BfG Bundesanstalt für Gewässerkunde (Federal Institute of Hydrology)
BfN Bundesamt für Naturschutz (Federal Office for Nature Conservation)
BSH Bundesamt für Seeschifffahrt und Hydrographie (Federal Institute for Navigation and Hydrography)
BLE Bundesanstalt für Landwirtschaft und Ernährung (Federal Institute for Food and Agriculture)
BMBF Bundesministerium für Bildung und Forschung (Federal Ministry of Education and Research)
BMELV Bundesministerium für Ernährung, Landwirtschaft und Verbraucherschutz (Federal Ministry of Food, Agriculture and Consumer Protection)
BMEL Bundesministerium für Ernährung und Landwirtschaft (Federal Ministry for Food and Agriculture)
BMF Bundesministerium der Finanzen (Federal Ministry of Finance)
BMFSFJ Bundesministerium für Familie, Senioren, Frauen und Jugend (Federal Ministry for Family Affairs, Senior Citizens, Women and Youth)
BMG Bundesministerium für Gesundheit (Federal Ministry of Health)
BMSY Biomass Maximum Sustainable Yield (= target reference figure for spawning biomass)
BMU Bundesministerium für Umwelt, Naturschutz und Reaktorsicherheit (Federal Ministry for the Environment, Nature Conservation and Nuclear Safety)
BMUB Bundesministerium für Umwelt, Naturschutz, Bau und Reaktorsicherheit (Federal Ministry for the Environment, Nature Conservation, Building and Nuclear Safety)
Development of the DAS Indicator System and Preparation of the Monitoring Report
10
BMVBS Bundesministerium für Verkehr, Bau und Stadtentwicklung (Federal Ministry of Transport, Building and Urban Development)
BMVg Bundesministerium der Verteidigung (Federal Ministry of Defence)
BMVI Bundesministerium für Verkehr und digitale Infrastruktur (Federal Ministry of Transport and Digital Infrastructure)
BMWi Bundesministerium für Wirtschaft und Technologie (Federal Ministry of Economics and Technology), since Dec. 2013: Bundesministerium für Wirtschaft und Energie (Federal Ministry of Economics and Energy)
BNetzA Bundesnetzagentur (Federal Network Agency)
BOVA Ständiger Ausschuss “Vorsorgender Bodenschutz“ der Bund/Länder Arbeitsgemeinschaft Bodenschutz (Standing committee on “Precautionary Soil Protection” of the Joint Soil Commission of the Federal States)
BSU Behörde für Stadtentwicklung und Umwelt Hamburg (Hamburg Institute for Hygiene and Environment)
BVR Bundesverband der Deutschen Volksbanken und Raiffeisenbanken e. V. (National Association of German Cooperative Banks)
BWI Bundeswaldinventur (Federal Forest Inventory)
CSC Climate Service Center
DAS Deutsche Anpassungsstrategie (German Adaptation Strategy)
DFV Deutscher Feuerwehrverband (German Fire Brigades Association)
DIHK Deutscher Industrie- und Handelskammertag (Association of German Chambers of Industry and Commerce)
DSGV Deutscher Sparkassen- und Giroverband (German Savings Banks and Giro Association)
DSV Deutscher Skiverband (German Ski Association)
DTV Deutscher Tourismusverband e.V. (German Tourism Association)
DWD Deutscher Wetterdienst (German Weather Service)
EEA European Environment Agency
EU European Union
FAWF RP Forschungsanstalt für Waldökologie und Forstwirtschaft Rheinland-Pfalz (Research Institute for Forest Ecology and Forestry, Rhineland-Palatinate)
FKZ Funding number
FLI Friedrich-Loeffler-Institut
R+D Research and development
FUR Forschungsgemeinschaft Urlaub und Reisen e.V. (Holiday and Travel Research Association)
GDV Gesamtverband der Deutschen Versicherungswirtschaft e.V. (German Insurance Industry Association)
Development of the DAS Indicator System and Preparation of the Monitoring Report
11
HLPUG Hessisches Landesprüfungs- und Untersuchungsamt im Gesundheitswesen im Regierungspräsidium Gießen (Hesse State Testing and Inspection Agency for the Health Sector, Regional Government Gießen)
HLUG Hessisches Landesamt für Umwelt und Geologie (Hesse State Agency for Geology and the Environment)
HMAFG Hessisches Ministerium für Arbeit, Familie und Gesundheit (Hesse Ministry for Labour, Family and Health)
HNE Hochschule für nachhaltige Entwicklung Eberswalde (Eberswalde University for Sustainable Development)
ICES Internationaler Rat für Meeresforschung (International Council for the Exploration of the Sea)
IGB Leibniz-Institut für Gewässerökologie und Binnenfischerei (Leibniz Institute of Freshwater Ecology and Inland Fisheries)
IHK Industrie- und Handelskammer (Chamber of Trade and Commerce)
IMA Interministerielle Arbeitsgruppe Anpassungsstrategie der Bundesregierung (Inter-ministerial Working Group on the Federal Government’s Adaptation Strategy)
ISO International Standards Organization
JKI Julius-Kühn-Institut
KABS e.V. Kommunale Aktionsgemeinschaft zur Bekämpfung der Schnakenplage e.V. (Local Authorities Joint Campaign for Combating Mosquito Plagues)
KfW Kreditanstalt für Wiederaufbau (national development bank)
KLIWAS Auswirkungen des Klimawandels auf Wasserstraßen und Schifffahrt (Impacts of climate change on waterways and shipping)
LAGB Landesamt für Geologie und Bergwesen Sachsen (Saxony State Agency for Geology and Mining)
LBEG Landesamt für Bergbau, Energie und Geologie Niedersachsen (Lower Saxony Agency for Mining, Energy and Geology)
LfU Bayerisches Landesamt für Umwelt (Bavarian State Environmental Agency)
LGL Bayerisches Landesamt für Gesundheit und Lebensmittelsicherheit (Bavarian State Agency for Health and Food Safety)
LHW Landesbetrieb für Hochwasserschutz und Wasserwirtschaft Sachsen- Anhalt (Saxony-Anhalt Flood Control and Water Management Agency)
LIKI Länderinitiative Kernindikatoren (Länder Initiative Core Indicators)
LMU Ludwig-Maximilian-Universität München (Ludwig Maximilian University, Munich)
LUBW Landesanstalt für Umwelt, Messungen und Naturschutz Baden-Württemberg (Baden-Württemberg State Agency for the Environment, Measurements and Nature Conservation)
LUWG Landesamt für Umwelt, Wasserwirtschaft und Gewerbeaufsicht Rheinland-Pfalz (Rhineland-Palatinate State Agency for the Environment, Water Management and Trade Inspection)
Development of the DAS Indicator System and Preparation of the Monitoring Report
12
LWF Bayerische Landesanstalt für Wald und Forstwirtschaft (Bavarian State Institute for Forests and Silviculture)
MLUV Ministerium für Landwirtschaft, Umwelt und Verbraucherschutz Mecklenburg-Vorpommern (Mecklenburg/West Pomerania Ministry of the Environment, Agriculture and Consumer Protection)
MSC Marine Stewardship Council
MUFV Ministerium für Umwelt, Forsten und Verbraucherschutz Rheinland-Pfalz (Rhineland-Palatinate Ministry of the Environment, Forestry and Consumer Protection)
MUGV Ministerium für Umwelt, Gesundheit und Verbraucherschutz des Landes Brandenburg (Brandenburg Ministry of the Environment, Health and Consumer Protection)
NBS National Biodiversity Strategy
NHS National Sustainability Strategy
NLWKN Niedersächsischer Landesbetrieb für Wasserwirtschaft, Küsten- und Naturschutz (Lower Saxony Water Management, Coastal Defence and Nature Conservation Agency)
NW-FVA Nordwestdeutsche Forstliche Versuchsanstalt (Northwest German Forestry Research Institute)
PAG Projektbegleitende Arbeitsgruppe (Project support working group)
PID Stiftung Deutscher Polleninformationsdienst e.V. (German Pollen Information Service Foundation)
PIK Potsdam Institut für Klimafolgenforschung (Potsdam Institute for Climate Impact Research)
RKI Robert Koch Institute
RWTH Rheinisch-Westfälische Technische Hochschule Aachen (RWTH Aachen University)
SBI Sustainable Business Institute
StBA Statistisches Bundesamt (Federal Statistical Office)
TAC Total Allowable Catch
TI Thünen Institute
THW Bundesanstalt Technisches Hilfswerk (Federal Agency for Technical Relief)
TLWJF Thüringer Landesanstalt für Wald, Jagd und Fischerei (Thuringia State Agency for Forestry, Hunting and Fishing)
UBA Umweltbundesamt (Federal Environment Agency)
UNFCCC United Nations Framework Convention on Climate Change
VDS Verband Deutscher Seilbahnen e.V. (German Cable Railways Association)
ZAMF Zentrum für Agrarmeteorologische Forschung e.V. (Agri-Meteorological Research Centre)
Development of the DAS Indicator System and Preparation of the Monitoring Report
13
ZALF Leibniz-Zentrum für Agrarlandschaftsforschung (Leibniz Centre for Agricultural Landscapes and Land Use Research)
Development of the DAS Indicator System and Preparation of the Monitoring Report
14
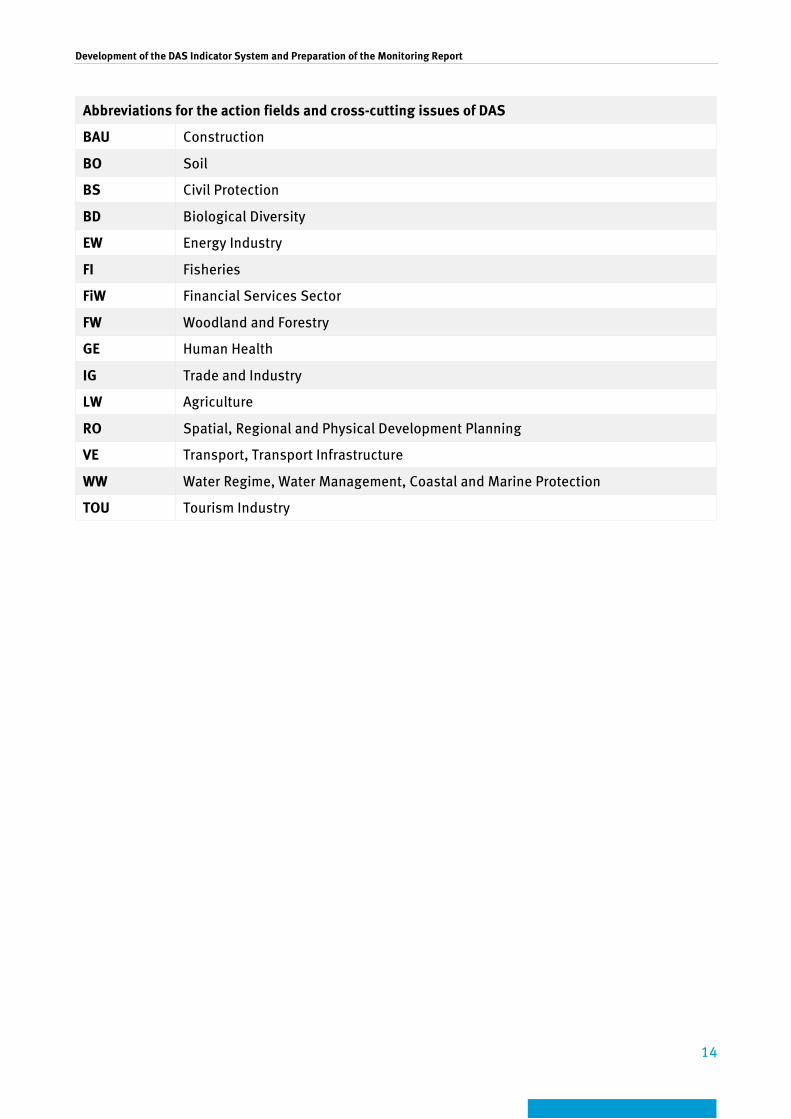
Abbreviations for the action fields and cross-cutting issues of DAS
BAU Construction
BO Soil
BS Civil Protection
BD Biological Diversity
EW Energy Industry
FI Fisheries
FiW Financial Services Sector
FW Woodland and Forestry
GE Human Health
IG Trade and Industry
LW Agriculture
RO Spatial, Regional and Physical Development Planning
VE Transport, Transport Infrastructure
WW Water Regime, Water Management, Coastal and Marine Protection
TOU Tourism Industry
Development of the DAS Indicator System and Preparation of the Monitoring Report
15
Summary
DAS Background
Even if we succeed in achieving the EU target of reducing global warming to no more than 2°C, it will be absolutely essential to adapt to changing climatic conditions. The greenhouse gases currently present in the atmosphere will influence the climate in coming decades making it impossible to halt all the changes. Any efforts made to adapt to climate change must not mean, however, that measures to be taken in order to reduce the output of greenhouse gases can be neglected. It is important to remember that on their own, neither adaptation nor mitigation can prevent the grave impacts resulting from climate change. In fact, they complement each other meaningfully, thus helping to alleviate the risks of climate change.
On 17th December 2008 the German Federal Cabinet adopted the German Strategy for Adaptation to Climate Change (DAS). This Strategy highlights areas likely to be affected by climate change or which already show evidence of impacts, as well as basic options for a possible approach and the requirements for action in various sectors. The DAS strategy provides a strategic framework for adapting to climate change, which is intended to provide stimuli for action in all sections of society. Changes brought about by climate change must be considered systematically in all relevant planning processes und development strategies. The goal is to strengthen the adaptability of natural and social systems in order to enable them to cope in a future shaped by climate change. For many States (Länder) in the Federal Republic, the national strategy acted as a driver for working out adaptation strategies at Länder level or for incorporating aspects of adaptation in their climate protection strategies.
Nearly all sectors of society, economy, environment and ecosystem services will be affected by climate change in future, if they are not already partly affected today. The DAS was therefore designed as an inter-departmental strategy by the Federal Government addressing a wide range of action fields. To this end, it outlines the potential consequences of climate change and adaptation measures as well as basic options for action. Overall, the DAS comprises 13 Action Fields (Human health, Construction, Water regime, water management, coastal and marine protection, Soil, Biological diversity, Agriculture, Woodland and forestry, Fisheries, Energy industry (conversion, transport and supply), Financial services industry, Transport, transport infrastructure, Trade and industry, Tourism industry) and two Cross-sectional Issues (Spatial, regional and physical development planning, Civil protection).
In order to support the ongoing development of the statements made in the DAS strategy, the Federal Government has initiated an inter-departmental discussion and coordination process. In August 2011 this process culminated in the adoption of the Action Plan for the German Climate Change Adaptation Strategy (APA I). The APA I is underpinned by the objectives and options for action, defining specific activities as detailed in the DAS and linking APA I with other national strategy processes.
DAS Progress Report
In 2015 the first Progress Report on the Implementation of the DAS Strategy will be published. The Progress Report is intended to contain the following constituents:
▸ the updating of APA I thus generating APA II will systematically propose targeted measures – both potential and aspirational – for all DAS Action Fields;
▸ an evaluation report describing the state of APA I implementation;
Development of the DAS Indicator System and Preparation of the Monitoring Report
16
▸ a Monitoring Report describing, on the basis of indicators, climate impacts and adaptation in individual sectors, with a view to both past developments and the current situation;
▸ a nationwide vulnerability analysis identifying any particularly vulnerable areas in Germany that will require a concentration of adaptation activities in the future. This analysis is carried out within an inter-departmental Vulnerability Network.
The indicator-based Monitoring Report has a key function within the framework of the progress report. By means of indicators, as well as data resources harmonised at a nationwide level, it provides information on the impacts of climate change in Germany, required for the adaptation process, both for the German public and for international bodies and organisations and is to be updated at regular intervals. It was the goal of the DAS Indicator Project to develop an inter-departmental DAS Indicator System, to prepare an initial indicator-based Monitoring Report and to design an organisational structure for regular updates of the Indicator Project described below.
DAS Indicator Project
In the course of three consecutive projects (hereinafter ‘Indicator Project’), the DAS Indicator System and Monitoring Report were prepared by Bosch & Partner GmbH on behalf of the UBA (Federal Environment Agency). The work was started in December 2008, i.e. immediately after publication of the DAS. It was completed by the end of November 2014. At that point in time, the Indicator System had been agreed both politically and technically, the Monitoring Report had undergone inter-departmental harmonisation and was available in layout form.
Outcomes
These are the core outcomes of the Indicator Project:
▸ the DAS Indicator System in the shape of a theme-oriented tabular list; ▸ the collection of indicator and data fact sheets; ▸ the background papers for the development of indicators relating to the individual Action
Fields and Cross-sectional Themes; ▸ the layout version of the indicator-based Monitoring Report; ▸ a bibliography; ▸ a User Manual for consolidating the indicator-based reporting process; ▸ a contacts file for everyone who participated in the Indicator Project by contributing to the
development and/or formulation of the indicators or any of the report texts.
DAS Indicator System
The DAS Indicators were formulated in the course of a six-year development and agreement process in consultation with representatives from different departments at Federal and Länder level and with non-governmental technical experts. With reference to the 15 action fields and cross-sectional issuesof the DAS strategy, the indicators provide an overview of areas affected by impacts of climate change and of any adaptation processes already initiated in the areas in question.
In total, the DAS Indicator System comprises 102 indicators, 55 of which describe the impacts of climate change (Impact Indicators), 42 adaptation measures or activities and conditions affecting the adaptation process (Response Indicators). Five indicators are designed as overarching indicators; they represent overarching activities on behalf of the Federal Government, which are intended to support the process of adapting to climate change.
Development of the DAS Indicator System and Preparation of the Monitoring Report
17
The following criteria ultimately determined whether an indicator was suitable for incorporation in the DAS Indicator System:
▸ the indicator has to be closely associated with climate change issues and adaptation: the development of so-called ‘Impact Indicators’ must be at least partly affected by impacts of climate change or they must be expected to be affected in future (climate change consequences); the ‘Response Indicators’ describe activities which support the adaptation process; where applicable, they can also describe developments which counteract this process;
▸ there must be data available for formulating the indicators: crucially, the indicator must provide certainty that the data will remain available for some time in the foreseeable future; that they can be procured at reasonable cost und effort and that they permit evaluation at a nationwide level.
The volume of the Indicator System is confined by two major constraints:
▸ All action fields and cross-sectional issuesof the DAS strategy must be covered in the Indicator System. The essential thematic priorities of climate change consequences and adaptation activities within individual action fields and cross-sectional issues should be described for each indicator, as far as this is feasible on the basis of available data.
▸ It is not the purpose of the nationwide DAS Indicator System to replace any sectoral and/or theme-specific reporting systems. The number of indicators is to remain restricted to ensure that the broad thematic overview is not lost in detailed descriptions.
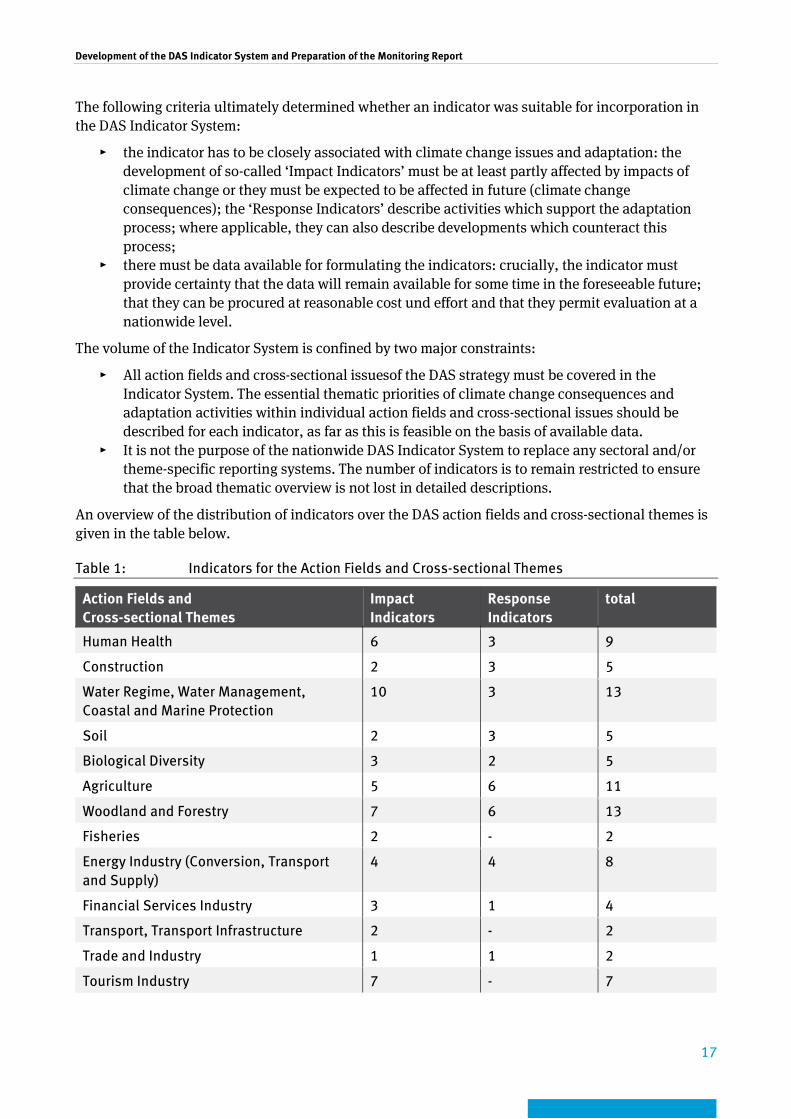
An overview of the distribution of indicators over the DAS action fields and cross-sectional themes is given in the table below.
Table 1: Indicators for the Action Fields and Cross-sectional Themes
Action Fields and Cross-sectional Themes
Impact Indicators
Response Indicators
total
Human Health 6 3 9
Construction 2 3 5
Water Regime, Water Management, Coastal and Marine Protection
10 3 13
Soil 2 3 5
Biological Diversity 3 2 5
Agriculture 5 6 11
Woodland and Forestry 7 6 13
Fisheries 2 - 2
Energy Industry (Conversion, Transport and Supply)
4 4 8
Financial Services Industry 3 1 4
Transport, Transport Infrastructure 2 - 2
Trade and Industry 1 1 2
Tourism Industry 7 - 7

Development of the DAS Indicator System and Preparation of the Monitoring Report
18
Action Fields and Cross-sectional Themes
Impact Indicators
Response Indicators
total
Spatial, Regional and Physical Development Planning
- 6 6
Civil Protection 1 4 5
Total 55 42 97
Overarching indicator 5 102
Documentation System: Fact Sheets
A documentation system consisting of indicator fact sheets and data fact sheets was created for the purpose of documenting the indicators and data sources. In the first place, the fact sheets served as a working brief for the technical development of the indicators, but ultimately also for the political harmonisation of the DAS Indicator System.
An indicator fact sheet and a corresponding data fact sheet were prepared for each DAS indicator.
The indicator fact sheets justify why an indicator was chosen; they place it in the correct category of the Indicator System, they lay down precise calculation requirements and they refer to the data sources underpinning the calculation. Furthermore these fact sheets discuss the weaknesses of the indicators with regard to the interpretability, availability and comprehensibility of data at the same time as determining the areas of responsibility (remits) for updating. The indicator fact sheets are “stable” documents. They will require updating only in those cases where the calculation requirements underlying data sources have to be adjusted in the light of new insights, arguments or strength/weakness analyses.
Graphs are generated in the data fact sheets; they are used to illustrate the indicators in the Monitoring Report. Furthermore, the data fact sheets in the form of Excel files contain not only data sets which are required for calculating or illustrating the indicators but also the relevant metadata for these data sets. The indicator values are calculated in data fact sheets on the basis of data sets, with the aid of mathematical formulae. This is of particular importance in cases where several data sets have to be taken into account when calculating the indicator values. It is important to note that not all data fact sheets serve to document the data sets at the level of raw data. To a certain extent, data sets can serve purely as pointers towards the sources of complex data processed previously. In cases where indicators are underpinned by complex (e.g. model-based) calculations which cannot be represented by means of Excel software, the data fact sheets serve only to collate these previously processed data for the purpose of illustrating the indicator.
The indicator and data fact sheets ensure the complete repeatability of indicators and their calculation. In terms of updating the Monitoring Report, these fact sheets facilitate and give structure to the process of report updating.
Background Papers
Indicators were developed in a lengthy process in which ideas for indicators were progressively narrowed down. In the course of this process, it occurred from time to time that draft indicators had to be eliminated – either because they were not underpinned by data required for calculating the indicators or the data was inadequate or the technical content was not linked sufficiently closely to climate change. In order to ensure a transparent and, as far as possible, comprehensive documentation of discussions on the indicators and any ‘dead ends’, background papers were created for each DAS action field and cross-sectional issue, and these background papers were

Development of the DAS Indicator System and Preparation of the Monitoring Report
19
updated progressively in the course of developing the indicators. The background papers serve to avoid the duplication of research into and discussions about indicator potential in case the Indicator System undergoes some form of redesign in the future. The background papers also contain pointers which flag up the areas in which it is expected that new data sources or methodologies may become available, which might facilitate the development of additional indicators in the future.
Monitoring Report
The ultimate goal for working out the indicators was to generate an indicator-based Monitoring Report for the process of adaptation to climate change in Germany. On the one hand, this report is to provide an overview of the extent to which Germany is affected by the consequences of climate change, and on the other, to provide insights into the adaptation measures which are being implemented. The report is not intended to replace detailed reports by individual government departments. In fact, its function is to act as a kind of “curtain raiser” or a nationwide overview of key impacts and activities.
The report was given the structure of a “monitoring report” which describes both the past and the current situation. Among other things, this involves a clear differentiation from the work of the Vulnerability Network which is primarily directed towards the future.
In future this report is to be updated at four-yearly intervals. Target groups are defined as political decision-makers and any members of the public who may be interested and/or affected. This also means that this is not a scientific report intended to discuss individual subject areas in depth. Nevertheless, the report meets high expectations in terms of technical content and factual differentiation.
The technically and politically agreed initial Monitoring Report runs to 256 pages and is divided into an introductory part explaining the report’s objectives and the DAS Indicator System and illustration of climate trends in Germany (both average and extreme climate changes), while another part illustrates the indicators of climate change consequences and proposed adaptation as well as overarching indicators; and finally, an appendix containing a list of contributors, bibliography and references for illustrations.
The indicator-based part of the report constitutes its main section. This part first introduces – on one double page – each DAS action field and cross-sectional theme, followed by the presentation of the indicators on further double pages. In exceptional cases where there is a very close thematic relationship between indicators, it is possible that two indicators may be covered jointly on one double page in order to avoid duplication of text-based explanations.
User Manual
The DAS Indicator System has been designed as an updatable system which can evolve in line with advances in knowledge and know-how in respect of adaptation to climate change. If indicators prove to be less relevant in future, they are to be deleted from the system, whereas others may be incorporated, if there is a change in the relevance of themes; or new data sources become available. Likewise, the indicator-based Monitoring Report is to be updated regularly. In order to support the process of updating and to make sure that the quality standards set for maintaining the structure of the DAS Indicator System and for generating the Monitoring Report are upheld, a “Manual for strengthening indicator-based reporting for the implementation of Germany’s strategy for adaptation to climate change (DAS)” (in short “User Manual”) was produced which numbers just under 80 pages. This User Manual describes and provides guidelines for the following aspects:
▸ all work phases required in the updating process;

Development of the DAS Indicator System and Preparation of the Monitoring Report
20
▸ standards for the documentation of indicators and data sources to be applied to fact sheets and updating the background papers;
▸ for the structure of the Monitoring Report and for illustrating the indicators and formulating the texts;
▸ details on trend estimation and trend assessment and any relevant illustrations in the Monitoring Report;
▸ division of competencies among the contributors to the process of updating the report.
The organisation model laid down in the User Manual requires that the general outline of the updating process is organised centrally. This means that any work connected with updating is carried out mostly by a central coordinating office which calls up the technical contributions from various departments. This model is fundamentally based on the organisation model for reporting on the National Sustainable Development Strategy (NHS), in which the Federal Statistical Office (StBA) takes on the key tasks for coordinating the updating of indicators and reporting.
Bibliography, List of Contact Details
Since the start of the Indicator Project, extensive expert knowledge has informed discussions about indicators. This emanated in part from conversations among experts but also from the literature. All documents read or cited in connection with the project were summarised in a Bibliography.
Apart from the more “tangible” end products resulting from work within the framework of the Indicator Project, i.e. the Indicator System, the Monitoring Report and the User Manual, the pool of experts assembled in the course of the project must also rate as a valuable outcome. An extensive technical consultation process was carried out for the purpose of discussing and developing the individual indicators and generating the Monitoring Report. In the end, this led to contributions from nearly 450 individuals from Federal Government agencies and from State Government agencies, from federations, associations, tertiary education and business corporations. Some of these will also remain key contacts for future updates of the DAS Indicator System and the Monitoring Report. All individuals participating in the technical development and agreement processes have been entered into a list of contact details in order to facilitate contacting them in future.
Participation
Owing to the broad range of areas affected by climatic impacts and the requirement to apply and agree adaptation measures as far as possible encompassing all sectors, it was necessary to involve all government departments in the development of the Indicator System. The DAS Indicator System is to reflect the current state of discussions on effects and measures and on relevant indicators within individual departments. The system should not contain any indicators which are not acceptable to experts in competent government departments, or indicators which are at variance with concepts relating to the future organisation and configuration of data collection (and evaluation) or reporting.
Against this background, the contractor (Bosch & Partner GmbH) undertook the role of structuring and moderating the process of developing an indicator system by bringing together the competencies and high levels of knowledge existing in individual sectors and departments.
Technical experts and political decision-makers were involved throughout the project in various ways:
▸ via a Subgroup Accompanying the Project (SCP) set up to support the Indicator Project; ▸ by means of experts meeting in mini-groups to discuss individual DAS action fields and cross-
sectional issues;

Development of the DAS Indicator System and Preparation of the Monitoring Report
21
▸ by experts meeting for bilateral discussions; ▸ by means of two workshops in which experts participated; ▸ by the political bodies set up for DAS, i.e. the Federal Interministerial Working Group on
Adaptation Strategy (IMA: Interministerielle Arbeitsgruppe Anpassungsstrategie der Bundesregierung) and the Länder Standing Committee for Adaptation to the Consequences of Climate Change (AFK: Ständige Ausschuss Anpassung an die Folgen des Klimawandels).
The technical groundwork carried out in various institutions was acknowledged in the background papers by naming all contributors to relevant action fields. Likewise, the experts who made specific contributions to individual indicators and to generating the indicator fact sheets were mentioned as authors in the relevant indicator fact sheets. Furthermore, all contributors at a technical level were listed in the appendix to the Monitoring Report. The last-named list also contains the names of some of the institutions and individuals who were involved in the political harmonisation process.
Work Phases
The DAS Indicator System and the Monitoring Report were produced in the course of the following work phases:
1. A systematic approach to narrowing down the “Adaptation” theme
The project started with structuring efforts intended to clarify what actually was to be indicated. The essential Impacts and Responses presently under discussion were collated and grouped step by step into “sub-themes” and “indication fields” for all action fields and cross-sectional issues of the DAS. The input for this systematic classification came from an assessment of the DAS, searches in relevant literature and discussions among experts. This work produced a well-structured general overview of ‘indicanda’ (objects to be indicated) that were considered suitable on principle within individual action fields.
2. Prioritising the (sub-)themes to be covered
In view of the wealth of indicanda, it proved necessary to incorporate a selection process within the structure. At the level of indication fields, this selection was based on criteria. The process included the identification of themes that were considered of particular importance for indication and reporting. Further research into the indicators and data sources already under discussion was then focused strictly on these indication fields.
In some DAS action fields and cross-sectional issues criteria-based prioritisation was carried out within mini-group sessions, in others it was determined by means of several bilateral talks with experts.
3. Drafting indicator ideas and und specifying the indicators
Ideas for indicators were then formulated by scrutinising potential data sources for the prioritised indication fields. The indicator ideas were documented extensively. On this basis, further discussions were held among experts in order to clarify the following points:
▸ whether the indicator ideas promise a high enough indication value with regard to the subject of climate change and adaptation;
▸ whether the use of extant data sources is realistic and which restrictions might have to be expected;
▸ how to fine-tune proposals further, also with regard to data sources available, down to the proposal of tangible technical indicators.
Development of the DAS Indicator System and Preparation of the Monitoring Report
22
Indicator fact sheets were created with regard to those technical indicator proposals which were fine-tuned in discussions. The indicator fact sheets were then processed in technical exchanges with the experts. They were also used as a basis for the final technical agreement of indicators.
4. Political agreement of the DAS indicators
The DAS indicators were agreed among government departments at federal as well as Länder level. The inter-departmental agreements were negotiated via the IMA and the negotiations with the Länder were carried out via the AFK. This process extended over two phases: initially, the indicator sets for the individual action fields and cross-sectional issues were agreed in four consecutive steps. It was of particular relevance for the agreement process to decide whether the most important themes and action areas were illustrated sufficiently within the relevant DAS action field and cross-sectional issue, whether the thematic priorities were clearly defined and also whether the indicators were politically relevant. The revised version of the entire set of indicators was finally submitted to the IMA.
The following documents were submitted for agreement:
▸ an introduction to the explanation of the objectives for the DAS indicators, the documents submitted and the standard commenting procedure;
▸ the background papers for each action field as well as the indicator fact sheets for the indicators pertaining to the relevant action field and cross-sectional issue;
▸ a commentary sheet for each action field and cross-sectional issue.
In total, it took approx. 20 months to achieve political agreement on the DAS indicators.
The comments contained in the commentary sheets received were compiled in one document each per DAS action field and cross-sectional issue and were responded to individually. Following this exchange of communications, revisions were carried out. As a result, ten indicators had to be deleted from the Indicator System and one additional indicator was incorporated. The revised Indicator System consisting of 103 indicators was submitted to the IMA for final approval. At this stage, the individual departments verified whether their comments had been implemented appropriately. The approved set ended up containing 102 indicators, because the indicator incorporated after the first approval phase was subsequently deleted.
5. Preparing the Monitoring Report
The Monitoring Report was prepared on the basis of the Indicator System in its technically and politically agreed form. Prior to writing the text, the final layout was determined in line with the requirements for the UBA’s Corporate Design. The amount of text to accompany the illustration of the indicators was determined by the layout. The explanatory text for the indicators was formulated with a close focus on target groups by a team of just two individuals on behalf of the contractor. This team had the requisite background knowledge of how the indicators were developed. The resulting, virtually homogeneous text was then reviewed by technical experts and some minor amendments were made.
6. Political agreement of the Monitoring Report
The procedure for the political agreement of the Monitoring Report was basically the same as for the political agreement of the Indicator System. For the political agreement process, the Monitoring Report was submitted in its layout form. The individual Länder were not involved in this process. A
Development of the DAS Indicator System and Preparation of the Monitoring Report
23
significant number of Federal Ministries1 (BMBF, BMEL, BMF, BMFSFJ, BMG, BMI, BMUB, BMVI, BMVg, BMWi), some of which were represented at the highest department level, submitted text commentaries / agreements.
All the comments received were collated in a master file and responded to individually. Any amendments to the text were incorporated – sometimes in consultation with the commentators. Overall, the feedback on the Monitoring Report was very positive and constructive. Any amendments were essentially of a minor editorial nature. Major text amendments were made only with regard to very few illustrations of indicators. From a technical point of view, this resulted in a further enhancement of the illustrations.
The final outcome is the print-ready Monitoring Report published in April 2015.
1 The text contains the current names of ministries valid at the time of preparation/agreement.
Development of the DAS Indicator System and Preparation of the Monitoring Report
24
1 Introduction 1.1 Project purpose The climate is already changing and will continue to change in the future. Emissions of greenhouse gases due to human activities are considered to be responsible for a large proportion of the observed and forecast changes. Measures to reduce these emissions are aimed at limiting further global warming. Despite the efforts to mitigate climate change, however, worldwide greenhouse gas emissions are continuing to rise as a result of population growth and economic growth. The greenhouse gases already in the atmosphere and further emissions will influence the climate for decades to come. It will not be possible to stop all the changes.
Climate change makes itself felt not only in long-term climate changes such as a gradual rise in average temperatures, but also in greater climatic fluctuations and more frequent extreme weather events, e.g. storms, droughts or heat-waves. Adaptation to climate change means coping with these impacts and taking active adaptation measures to reduce their adverse effects and make the most of new opportunities. Germany too is affected by the impacts of climate change, albeit to a lesser extent than numerous more exposed regions of the world. To this end the federal and regional authorities are pursuing an active, forward-looking adaptation policy.
On 17 December 2008 the German Federal Cabinet adopted the German Strategy for Adaptation to Climate Change (DAS). This provides a framework for adapting to the impacts of climate change in Germany, and forms the starting point for all political efforts to adapt to climate change. The strategy primarily represents the contribution of the Federal Government and thus provides guidance for other actors. It lays the foundations for a medium-term process which, in conjunction with the federal states (Länder) and other social groups, is intended to progressively identify the risks of climate change, ascertain action needs, define appropriate objectives and develop and implement potential adaptation measures.
Since the impacts of climate change will affect nearly all sectors of society and the economy and also the environment and ecosystem services – and are to some extent already doing so – the DAS as a Federal Government strategy has been designed to cover a broad spectrum of issues on an inter-ministerial basis. It addresses 13 action fields and two cross-sectional issues, outlining possible impacts of climate change, adaptation measures and basic action options:
DAS Action fields: 1. Human health 2. Construction 3. Water regime, water management, coastal and marine protection 4. Soil 5. Biological diversity 6. Agriculture 7. Woodland and forestry 8. Fisheries 9. Energy industry (conversion, transport and supply) 10. Financial services sector 11. Transport, transport infrastructure 12. Trade and industry 13. Tourism industry
Cross-sectional issues: 14. Spatial, regional and physical development planning 15. Civil protection

Development of the DAS Indicator System and Preparation of the Monitoring Report
25
In 2011 the Adaptation Action Plan (APA I) was drawn up to give more concrete shape to the DAS. In APA I the German Government created an important milestone in the medium-term process of developing the DAS. The preparation of the APA was lead managed by the BMU2 (now the BMUB), which also lead manages the entire adaptation process. The APA takes account of the technical expertise of the ministries and consists primarily in a summary of current ministerial activities.
2015 will see the publication of the first Progress Report on the Implementation of the DAS, containing the following contributions.
▸ an update of APA I to APA II, which will systematically propose targeted measures – both potential and aspirational – for all the various action fields of DAS;
▸ an evaluation report describing the state of APA I implementation; ▸ a Monitoring Report describing climate impacts and adaptation in individual sectors on the
basis of indicators, in the light of both past developments and the current situation; ▸ a nationwide vulnerability analysis identifying any particularly vulnerable areas in Germany
that will need to be a focus of adaptation activities in the future. This analysis will be performed within an inter-departmental vulnerability network.
The progress report is also being produced in anticipation of expected future requirements for EU member states to report on measures to adapt to climate change. Furthermore, the parties to the UNFCCC are called upon, in the context of their national reports, to submit voluntary reports to the Climate Secretariat about adaptation measures they have implemented.
The indicator-based Monitoring Report has a key function within the framework of the progress report. The task of the Monitoring Report is to provide, on the basis of nationally harmonised basic data and indicators, information on the impacts of climate change in Germany and on the adaptation process. In this way it is intended to create the necessary preconditions for continuous high-quality reporting to the German public and to international bodies and organisations. The knowledge available in government departments about climate change impacts and adaptation measures, and also about existing basic data for describing these factors, is to be used in the preparation of the reports and be systematically collated in a clearly organised structure.
The requirements for the DAS indicators underlying the Monitoring Report were as follows:
▸ the indicator has to be closely associated with climate change issues and adaptation: the development of “Impact Indicators” must be at least partly affected by impacts of climate change or they must be expected to be affected in future (climate change consequences); the “Response Indicators” describe activities which support the adaptation process; where applicable, they can also describe developments which counteract this process;
▸ there must be data available for formulating the indicators: the indicator must provide certainty that the data will remain available for some time in the foreseeable future; that they can be procured at reasonable cost and effort and that they permit evaluation at a nationwide level. The data must permit regular updating of the Monitoring Report.
Work on building up the DAS Indicator System started immediately after the publication of the DAS in December 2008 and finished at the end of 2014 with the completion of the first Monitoring Report. To this end the Federal Environment Agency (UBA) commissioned the following three projects, each of which builds on its predecessor (referred to below as “indicator projects”) from Bosch & Partner GmbH:
2 The text uses the names of ministries as they were at the time of preparation/agreement

Development of the DAS Indicator System and Preparation of the Monitoring Report
26
▸ December 2008 to March 2010 – advisory project “Erstellung eines Indikatorenkonzepts für die Deutsche Anpassungsstrategie” [“Creation of an indicator concept for the German adaptation strategy”] (FKZ 364 01 006, Schönthaler et al. 20103): clarification of general requirements for the indicator system, systematic evaluation of the DAS on the basis of the targets formulated therein and the cause-and-effect relationships referred to, development of a structure for delimiting the subject matter of the indicator system, compilation of indicator ideas and consultation with experts, establishment of a documentation system for indicators and data sources, elaboration of initial indicators, development of a structure for presenting the indicators in the Monitoring Report;
▸ June 2010 to August 2011 – R+D project “Indikatoren für die Deutsche Anpassungsstrategie – Hauptstudie ” [“Indicators for the German Adaptation Strategy – Main Study”] (FKZ 3709 41 125, Schönthaler et al. 20114): revision of the indicators already proposed in the advisory project and development of further indicators, methodological approaches to cross-cutting indicators, creation of basic principles for assessing the developments described with the aid of indicators (trend estimation), preparation of first model chapter for the Monitoring Report (for the DAS action fields “Woodland and forestry”, “Energy industry”, “Financial services sector” and “Civil protection”),
▸ September 2011 to November 2014 – R+D project “Evaluierung der DAS – Berichterstattung und Schließung von Indikatorenlücken” [“Evaluation of DAS – Reporting and closing of indicator gaps”] (FKZ 3711 41 106): closing remaining indicator gaps, developing cross-cutting indicators, technical and political agreement on DAS Indicator System, preparation of and technical and political agreement on first indicator-based Monitoring Report, development of a model for organisation of regular updating with the participation of the ministries.
1.2 Project outcomes The core outcomes of the Indicator Project are as follows:
▸ the DAS Indicator System in the shape of a theme-oriented tabular list; ▸ the collection of indicator and data fact sheets documenting the indicators and data sources, ▸ the background papers for the development of indicators relating to the individual action
fields and cross-sectional themes; ▸ the layout version of the indicator-based Monitoring Report; ▸ a bibliography;
3 Schönthaler K., von Andrian-Werburg S., Wulfert K. 2010: Establishment of an Indicator Concept for the German Strategy
on Adaptation to Climate Change. UBA (ed.) Climate Change 07/2010, Dessau-Roßlau, 140 p. 4 Schönthaler K., von Andrian-Werburg S., Nickel D. 2011: Entwicklung eines Indikatorensystems für die Deutsche
Anpassungsstrategie an den Klimawandel (Development of an indicator system for the German strategy for adaptation to climate change). UBA (ed.) Climate Change 22/2011, Dessau-Roßlau, 224 p. plus appendices.
Development of the DAS Indicator System and Preparation of the Monitoring Report
27
▸ a User Manual for consolidating the indicator-based reporting process (updating the Monitoring Report);
▸ a contacts file covering everyone who participated in the Indicator Project by contributing to the development and/or formulation of the indicators or any of the report texts.
The documents connected with these outcomes are appended to the final report, except for the data fact sheets and the contacts file, since these documents contain internal facts and figures that are not for publication. The list of indicators can be found in Section 1.2.1.
1.2.1 List of indicators
For the purposes of the DAS Indicator System, indicators are parameters that can be presented in an indicator-based Monitoring Report as a single, readily compiled and easily grasped diagram in a time series (cf. Fig. 3). The indicators may be:
▸ simple data records that can be taken over directly from the data supplier (on occasion these data records may also be subject to more complex methods of sampling, insertion of missing values or other statistical methods),
▸ a synopsis of several datasets, which may originate from different data sources, but which all refer to the same or a very similar indicandum, i.e. a situation whose development is to be described with the aid of indicators. This means they can be discussed and interpreted in close contextual connection (in some cases it may be necessary to plot the data series in the diagram against two different vertical axes),
▸ indicators that are the result of complex calculations involving the interaction of several datasets.
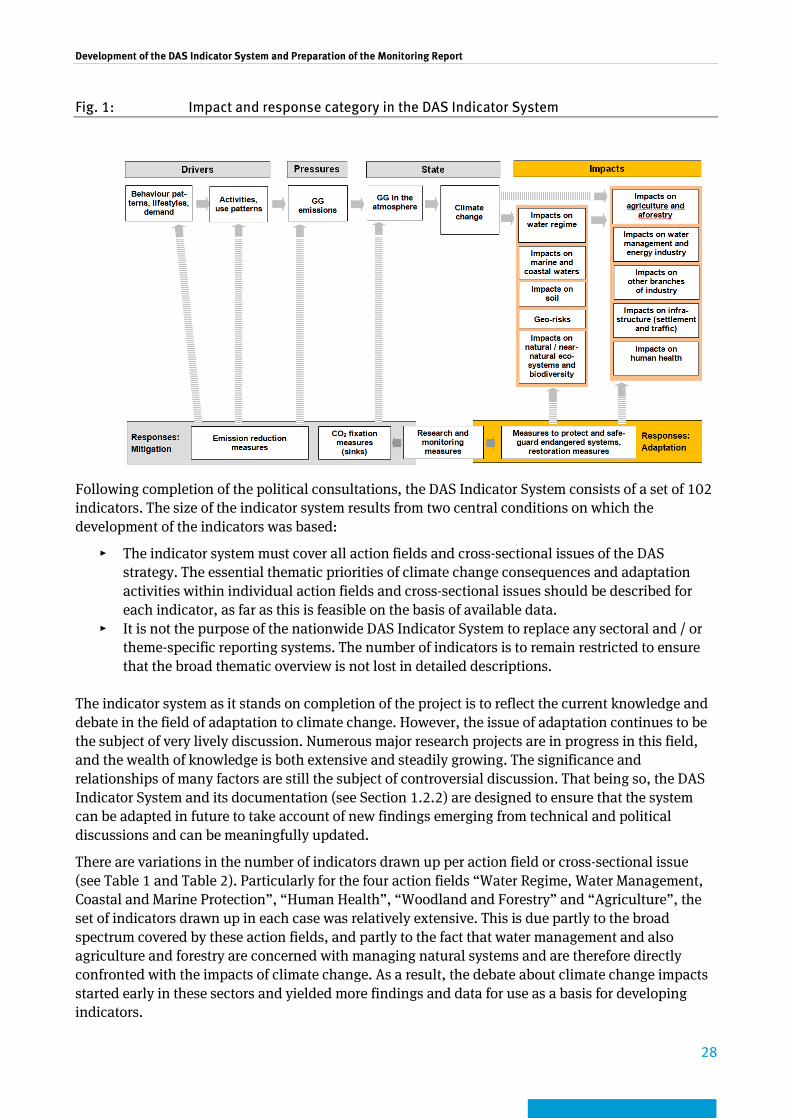
The indicator system consists of “impact indicators”, “response indicators” and “cross-cutting indicators”. The impact and response categories originate from the DPSIR approach (Driving Forces, Pressure, State, Impact, Response) of the European Environmental Agency (EEA 19995), which is widely used to structure indicator systems. Interpretations of the borderlines between the categories frequently differ – depending on the starting point. The cause-and-effect model shown in Fig. 1 was used to structure the field of climate change and specify the focus of the DAS indicators. The impact category summarises the impacts of climate change (direct and indirect consequences). The response category lists activities that support the adaptation process. In a broader interpretation the DAS Indicator System also considers developments that may run contrary to the adaptation process. The description of the actual climate changes (cf. State) does not form part of the indicator system. To this end the Monitoring Report (see Section 1.2.4) includes a separate chapter describing the changes in mean climate and extremes. However, these descriptions are explicitly not based on indicators.
“Cross-cutting indicators” describe activities undertaken by the federal authorities to support the adaptation process. The cross-cutting indicators are intended to broaden the view from a highly sectoral approach focusing on the individual action fields and cross-sectional issues to a more integrative consideration of the adaptation process that cuts across action fields. These indicators do not explicitly claim to facilitate a structural evaluation of the political instruments. On the basis of selected examples, they merely provide an insight into basic action options open to the federal authorities.
5 EEA - European Environment Agency 1999: Environmental indicators - Typology and overview. Technical report No 25.
Copenhagen.
Development of the DAS Indicator System and Preparation of the Monitoring Report
28
Fig. 1: Impact and response category in the DAS Indicator System
Following completion of the political consultations, the DAS Indicator System consists of a set of 102 indicators. The size of the indicator system results from two central conditions on which the development of the indicators was based:
▸ The indicator system must cover all action fields and cross-sectional issues of the DAS strategy. The essential thematic priorities of climate change consequences and adaptation activities within individual action fields and cross-sectional issues should be described for each indicator, as far as this is feasible on the basis of available data.
▸ It is not the purpose of the nationwide DAS Indicator System to replace any sectoral and / or theme-specific reporting systems. The number of indicators is to remain restricted to ensure that the broad thematic overview is not lost in detailed descriptions.
The indicator system as it stands on completion of the project is to reflect the current knowledge and debate in the field of adaptation to climate change. However, the issue of adaptation continues to be the subject of very lively discussion. Numerous major research projects are in progress in this field, and the wealth of knowledge is both extensive and steadily growing. The significance and relationships of many factors are still the subject of controversial discussion. That being so, the DAS Indicator System and its documentation (see Section 1.2.2) are designed to ensure that the system can be adapted in future to take account of new findings emerging from technical and political discussions and can be meaningfully updated.
There are variations in the number of indicators drawn up per action field or cross-sectional issue (see Table 1 and Table 2). Particularly for the four action fields “Water Regime, Water Management, Coastal and Marine Protection”, “Human Health”, “Woodland and Forestry” and “Agriculture”, the set of indicators drawn up in each case was relatively extensive. This is due partly to the broad spectrum covered by these action fields, and partly to the fact that water management and also agriculture and forestry are concerned with managing natural systems and are therefore directly confronted with the impacts of climate change. As a result, the debate about climate change impacts started early in these sectors and yielded more findings and data for use as a basis for developing indicators.
Development of the DAS Indicator System and Preparation of the Monitoring Report
29
Although – depending on data availability – the numbers of impact and response indicators in the DAS Indicator System are not always identical, the ratio is more or less balanced in the set as a whole. During the political consultation process, response indicators in particular were eliminated from the set (see Section 3.2.1). In the future development of the set, special attention must be paid to ensuring that the balance between impact and response indicators is maintained or even shifted in favour of response indicators.
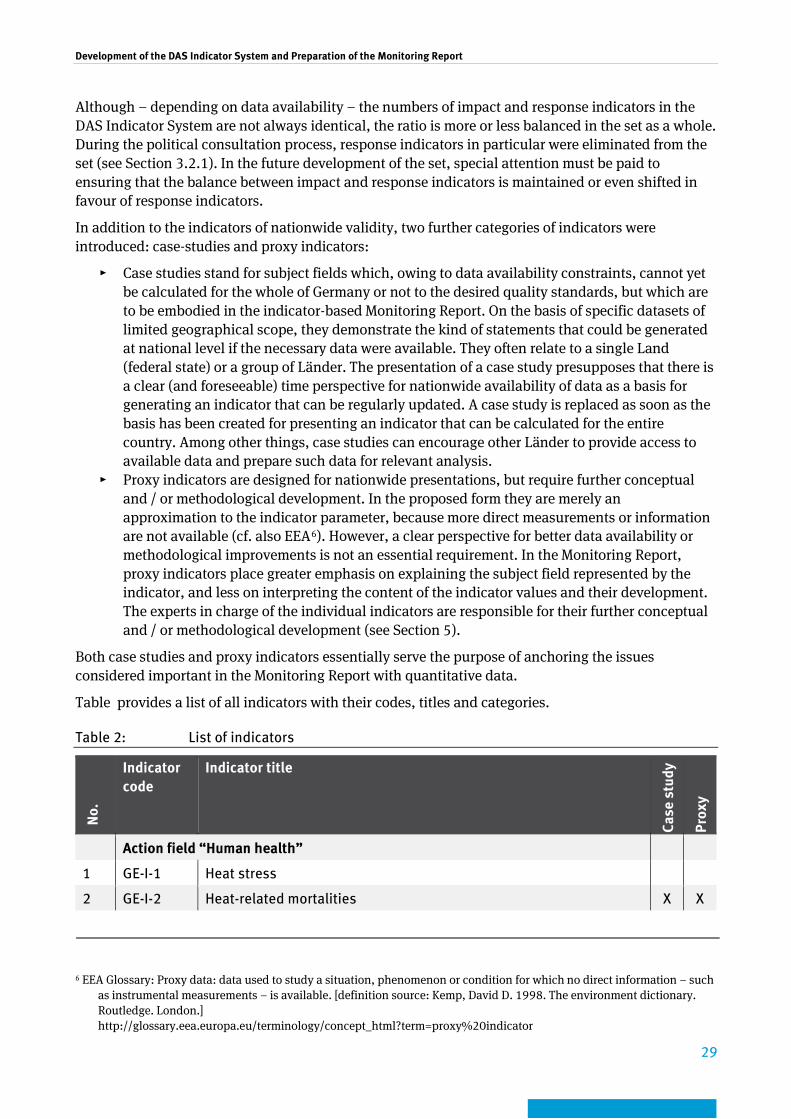
In addition to the indicators of nationwide validity, two further categories of indicators were introduced: case-studies and proxy indicators:
▸ Case studies stand for subject fields which, owing to data availability constraints, cannot yet be calculated for the whole of Germany or not to the desired quality standards, but which are to be embodied in the indicator-based Monitoring Report. On the basis of specific datasets of limited geographical scope, they demonstrate the kind of statements that could be generated at national level if the necessary data were available. They often relate to a single Land (federal state) or a group of Länder. The presentation of a case study presupposes that there is a clear (and foreseeable) time perspective for nationwide availability of data as a basis for generating an indicator that can be regularly updated. A case study is replaced as soon as the basis has been created for presenting an indicator that can be calculated for the entire country. Among other things, case studies can encourage other Länder to provide access to available data and prepare such data for relevant analysis.
▸ Proxy indicators are designed for nationwide presentations, but require further conceptual and / or methodological development. In the proposed form they are merely an approximation to the indicator parameter, because more direct measurements or information are not available (cf. also EEA6). However, a clear perspective for better data availability or methodological improvements is not an essential requirement. In the Monitoring Report, proxy indicators place greater emphasis on explaining the subject field represented by the indicator, and less on interpreting the content of the indicator values and their development. The experts in charge of the individual indicators are responsible for their further conceptual and / or methodological development (see Section 5).
Both case studies and proxy indicators essentially serve the purpose of anchoring the issues considered important in the Monitoring Report with quantitative data.
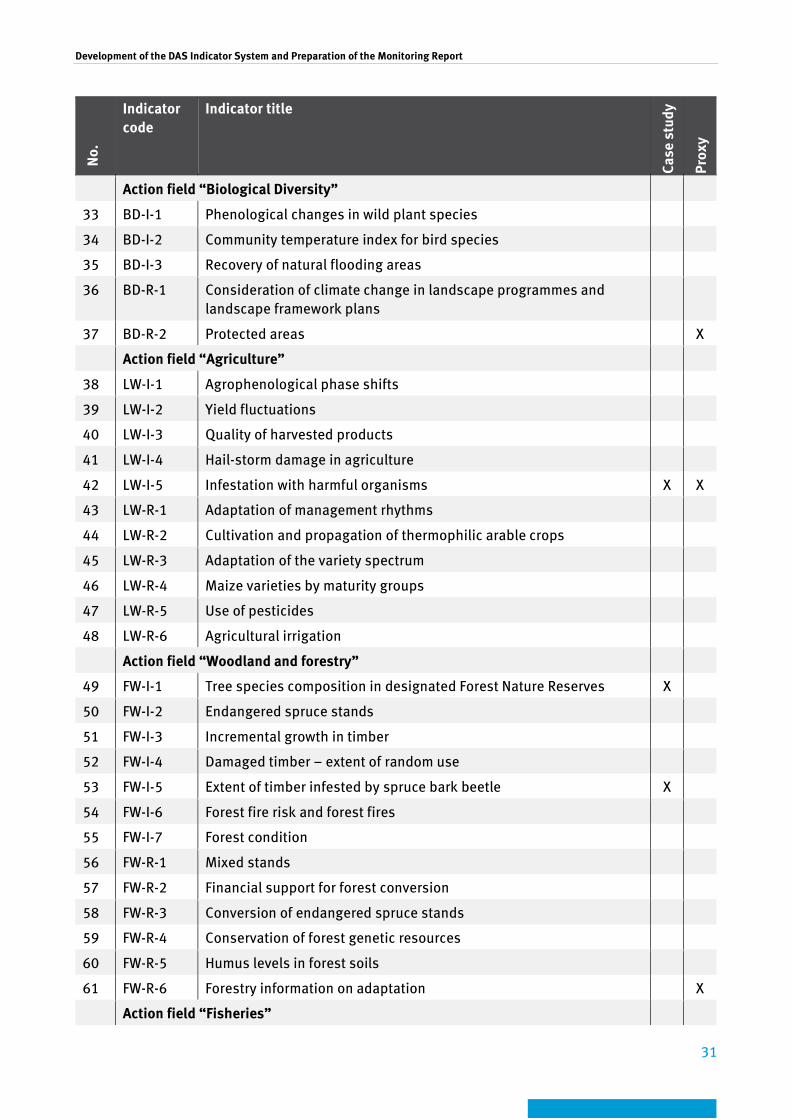
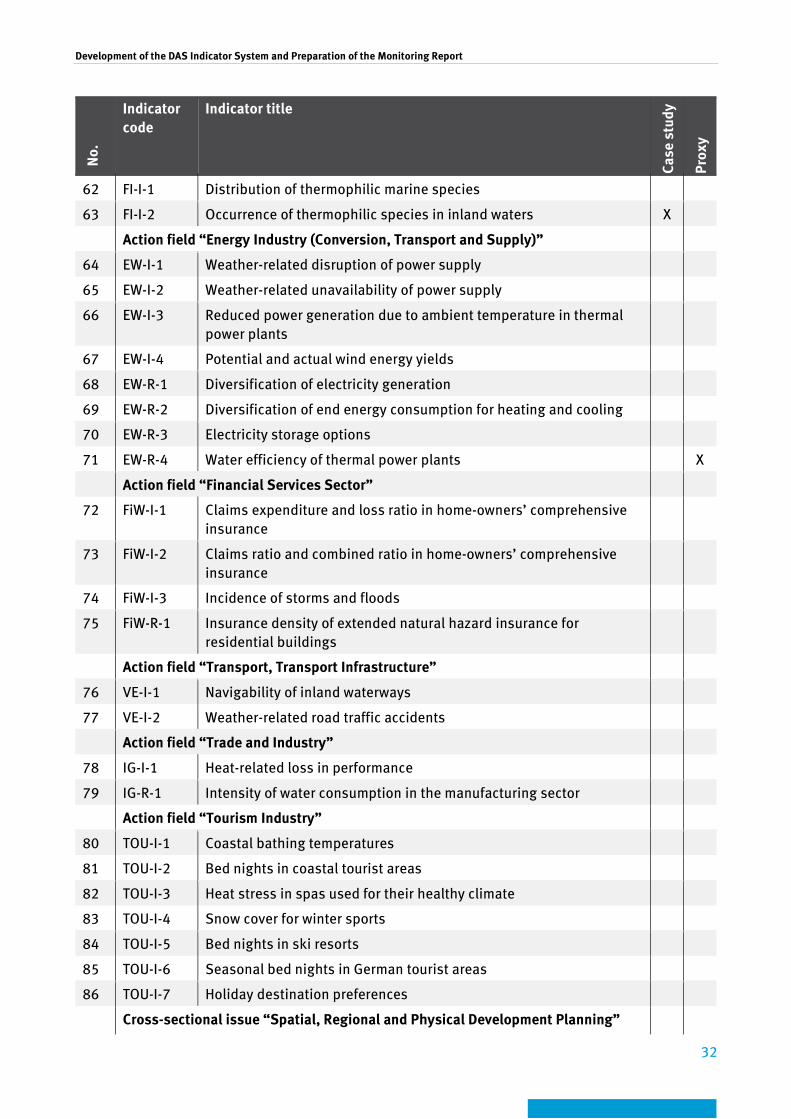
Table provides a list of all indicators with their codes, titles and categories.
Table 2: List of indicators
No.
Indicator code
Indicator title
Case
stu
dy
Prox
y
Action field “Human health”
1 GE-I-1 Heat stress
2 GE-I-2 Heat-related mortalities X X
6 EEA Glossary: Proxy data: data used to study a situation, phenomenon or condition for which no direct information – such
as instrumental measurements – is available. [definition source: Kemp, David D. 1998. The environment dictionary. Routledge. London.] http://glossary.eea.europa.eu/terminology/concept_html?term=proxy%20indicator

Development of the DAS Indicator System and Preparation of the Monitoring Report
30
No.
Indicator code
Indicator title
Case
stu
dy
Prox
y
3 GE-I-3 Ragweed-pollen related stress
4 GE-I-4 Risks from oak processionary moth infestation
5 GE-I-5 Pathogen carriers X
6 GE-I-6 Contamination by cyanobacteria of bathing waters X
7 GE-R-1 Heat warning service
8 GE-R-2 Success of heat warning system X
9 GE-R-3 Information on pollen Action field “Construction”
10 BAU-I-1 Heat stress in urban environments
11 BAU-I-2 Summer-related heat-island effect X
12 BAU-R-1 Recreation areas X
13 BAU-R-2 Specific energy consumption for space heating by private households
14 BAU-R-3 Funding for building and refurbishment adapted to climate change Action field “Water Regime, Water Management, Coastal and Marine Protection”
15 WW-I-1 Quantitative groundwater condition
16 WW-I-2 Mean discharge
17 WW-I-3 Flooding
18 WW-I-4 Low water
19 WW-I-5 Water temperature of standing waters X
20 WW-I-6 Duration of stagnation period in standing waters X
21 WW-I-7 Start of spring algal blooms in standing waters X
22 WW-I-8 Marine water temperature
23 WW-I-9 Sea level
24 WW-I-10 Intensity of storm surges
25 WW-R-1 Water use index
26 WW-R-2 Structure of water bodies
27 WW-R-3 Investment in coastal protection
Action field “Soil”
28 BO-I-1 Soil moisture levels in farmland soil
29 BO-I-2 Rainfall erosivity X
30 BO-R-1 Humus content of arable land X
31 BO-R-2 Permanent grassland
32 BO-R-3 Organic soil areas X
Development of the DAS Indicator System and Preparation of the Monitoring Report
31
No.
Indicator code
Indicator title
Case
stu
dy
Prox
y
Action field “Biological Diversity”
33 BD-I-1 Phenological changes in wild plant species
34 BD-I-2 Community temperature index for bird species
35 BD-I-3 Recovery of natural flooding areas
36 BD-R-1 Consideration of climate change in landscape programmes and landscape framework plans
37 BD-R-2 Protected areas X
Action field “Agriculture”
38 LW-I-1 Agrophenological phase shifts
39 LW-I-2 Yield fluctuations
40 LW-I-3 Quality of harvested products
41 LW-I-4 Hail-storm damage in agriculture
42 LW-I-5 Infestation with harmful organisms X X
43 LW-R-1 Adaptation of management rhythms
44 LW-R-2 Cultivation and propagation of thermophilic arable crops
45 LW-R-3 Adaptation of the variety spectrum
46 LW-R-4 Maize varieties by maturity groups
47 LW-R-5 Use of pesticides
48 LW-R-6 Agricultural irrigation
Action field “Woodland and forestry”
49 FW-I-1 Tree species composition in designated Forest Nature Reserves X
50 FW-I-2 Endangered spruce stands
51 FW-I-3 Incremental growth in timber
52 FW-I-4 Damaged timber – extent of random use
53 FW-I-5 Extent of timber infested by spruce bark beetle X
54 FW-I-6 Forest fire risk and forest fires
55 FW-I-7 Forest condition
56 FW-R-1 Mixed stands
57 FW-R-2 Financial support for forest conversion
58 FW-R-3 Conversion of endangered spruce stands
59 FW-R-4 Conservation of forest genetic resources
60 FW-R-5 Humus levels in forest soils
61 FW-R-6 Forestry information on adaptation X Action field “Fisheries”
Development of the DAS Indicator System and Preparation of the Monitoring Report
32
No.
Indicator code
Indicator title
Case
stu
dy
Prox
y
62 FI-I-1 Distribution of thermophilic marine species
63 FI-I-2 Occurrence of thermophilic species in inland waters X
Action field “Energy Industry (Conversion, Transport and Supply)”
64 EW-I-1 Weather-related disruption of power supply
65 EW-I-2 Weather-related unavailability of power supply
66 EW-I-3 Reduced power generation due to ambient temperature in thermal power plants
67 EW-I-4 Potential and actual wind energy yields
68 EW-R-1 Diversification of electricity generation
69 EW-R-2 Diversification of end energy consumption for heating and cooling
70 EW-R-3 Electricity storage options
71 EW-R-4 Water efficiency of thermal power plants X Action field “Financial Services Sector”
72 FiW-I-1 Claims expenditure and loss ratio in home-owners’ comprehensive insurance
73 FiW-I-2 Claims ratio and combined ratio in home-owners’ comprehensive insurance
74 FiW-I-3 Incidence of storms and floods
75 FiW-R-1 Insurance density of extended natural hazard insurance for residential buildings
Action field “Transport, Transport Infrastructure”
76 VE-I-1 Navigability of inland waterways
77 VE-I-2 Weather-related road traffic accidents
Action field “Trade and Industry”
78 IG-I-1 Heat-related loss in performance
79 IG-R-1 Intensity of water consumption in the manufacturing sector
Action field “Tourism Industry”
80 TOU-I-1 Coastal bathing temperatures
81 TOU-I-2 Bed nights in coastal tourist areas
82 TOU-I-3 Heat stress in spas used for their healthy climate
83 TOU-I-4 Snow cover for winter sports
84 TOU-I-5 Bed nights in ski resorts
85 TOU-I-6 Seasonal bed nights in German tourist areas
86 TOU-I-7 Holiday destination preferences Cross-sectional issue “Spatial, Regional and Physical Development Planning”
Development of the DAS Indicator System and Preparation of the Monitoring Report
33
No.
Indicator code
Indicator title
Case
stu
dy
Prox
y
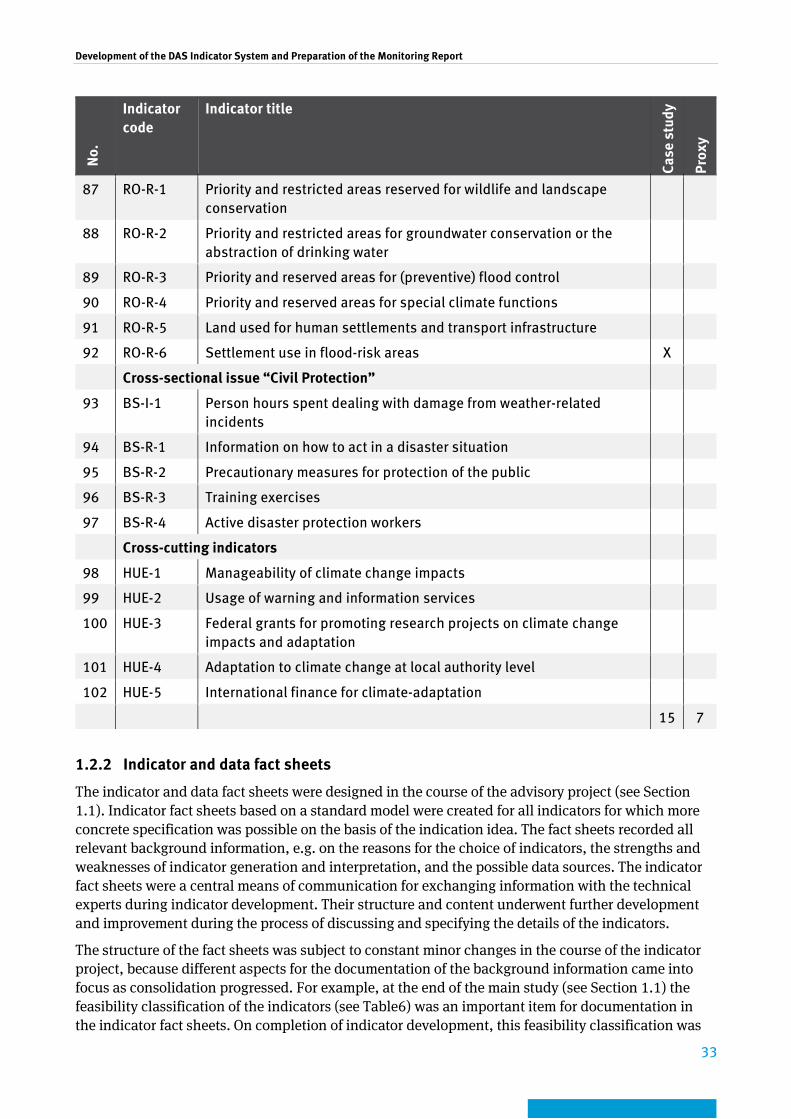
87 RO-R-1 Priority and restricted areas reserved for wildlife and landscape conservation
88 RO-R-2 Priority and restricted areas for groundwater conservation or the abstraction of drinking water
89 RO-R-3 Priority and reserved areas for (preventive) flood control
90 RO-R-4 Priority and reserved areas for special climate functions
91 RO-R-5 Land used for human settlements and transport infrastructure
92 RO-R-6 Settlement use in flood-risk areas X Cross-sectional issue “Civil Protection”
93 BS-I-1 Person hours spent dealing with damage from weather-related incidents
94 BS-R-1 Information on how to act in a disaster situation
95 BS-R-2 Precautionary measures for protection of the public
96 BS-R-3 Training exercises
97 BS-R-4 Active disaster protection workers
Cross-cutting indicators
98 HUE-1 Manageability of climate change impacts
99 HUE-2 Usage of warning and information services
100 HUE-3 Federal grants for promoting research projects on climate change impacts and adaptation
101 HUE-4 Adaptation to climate change at local authority level
102 HUE-5 International finance for climate-adaptation
15 7
1.2.2 Indicator and data fact sheets
The indicator and data fact sheets were designed in the course of the advisory project (see Section 1.1). Indicator fact sheets based on a standard model were created for all indicators for which more concrete specification was possible on the basis of the indication idea. The fact sheets recorded all relevant background information, e.g. on the reasons for the choice of indicators, the strengths and weaknesses of indicator generation and interpretation, and the possible data sources. The indicator fact sheets were a central means of communication for exchanging information with the technical experts during indicator development. Their structure and content underwent further development and improvement during the process of discussing and specifying the details of the indicators.
The structure of the fact sheets was subject to constant minor changes in the course of the indicator project, because different aspects for the documentation of the background information came into focus as consolidation progressed. For example, at the end of the main study (see Section 1.1) the feasibility classification of the indicators (see Table6) was an important item for documentation in the indicator fact sheets. On completion of indicator development, this feasibility classification was

Development of the DAS Indicator System and Preparation of the Monitoring Report
34
replaced by a section on “Implementation – Tasks and responsibilities”, containing an estimate of the work involved in updating the time series and information on data costs and competent authorities. The proxy indicator category, which was only introduced after feedback from the political consultation process, also called for modifications to the indicator fact sheets in the form of a separate justification and a description of the perspectives and requirements for the future development of the indicator.
In their current final version, the indicator fact sheets aim to:
▸ give the indicator a unique title, ▸ provide a detailed explanation of the choice of indicator, ▸ explain the systematic position of the indicator in the indicator system, ▸ ensure the reproducibility of the calculation (this requires the unique (mathematical)
definition of the calculation requirements and details of the data sources to be used), ▸ provide a clear picture of the strengths and weaknesses of the indicator (where do issues exist
with regard to interpretation, data availability or comprehensibility etc., and what specific opportunities does the indicator offer?),
▸ clarify concepts, ▸ determine responsibility for updating.
The indicator fact sheets are “stable” documents. They will require updating only in those cases where the calculation requirements underlying data sources have to be adjusted in the light of new insights, arguments or strength/weakness analyses.
The indicator fact sheets are set out in Annex 2 to this report. The documents are created in Word format. Details of the structure of the indicator fact sheets and the description of the individual fields are set out in the User Manual (see Section 1.2.6), which is appended to this report as Annex 4.
A data fact sheet was created for every indicator fact sheet. Graphs are generated in the data fact sheets; they are used to illustrate the indicators in the Monitoring Report. The data fact sheets also include all datasets needed for calculating or presenting the indicators and thus also serve as evidence of the feasibility of making the indicator operational. The data fact sheets are Excel documents, so that the datasets they contain can be used to calculate the indicator values with the aid of mathematical formulae. However, the data fact sheets do not always contain the the raw data on which the calculations are based. In cases where indicators are underpinned by complex (e.g. model-based) calculations which cannot be handled by the Excel software, the data fact sheets serve only to collate these previously processed data for the purpose of illustrating the indicator. The data fact sheets also contain all relevant metadata on the datasets (including source, contact persons, update intervals, spatial resolution etc.).
As easily edited and managed individual documents, the data fact sheets can be exchanged between data suppliers and the persons responsible for preparing the Monitoring Report. The data fact sheets were also created very early in the indicator discussion process, especially since the graphic representation of the indicators generated directly from the data fact sheets also forms part of the indicator fact sheet. Unlike the indicator fact sheets, the data fact sheets have to be updated in the course of updating the Monitoring Report, as it is there that the latest data are kept. Moreover, the detailed results of the trend estimation are documented in the data fact sheets. The trend estimation is a central element in analysing the time series to obtain the individual indicators, and it is performed using the same method for all indicators. The trend estimation procedure is described in detail in the User Manual (see Section 1.2.6, Annex 4), to ensure that methodological continuity is guaranteed for report updates.
Development of the DAS Indicator System and Preparation of the Monitoring Report
35
Details of the structure and content of the data fact sheets are set out in the User Manual (see Section 1.2.6) (see Annex 4). The data fact sheets themselves are merely intended for internal use when updating the Monitoring Report. To some extent they include data with limited user privileges, and cannot therefore be published.
The indicator fact sheets and data fact sheets ensure complete reproducibility of indicators and their calculation. In terms of updating the Monitoring Report, these fact sheets facilitate and give structure to the process of report updating. Great care is needed with the ongoing maintenance of these background documents in the update process, in order to maintain the quality and reliability of the documentation.
1.2.3 Background papers
The discussion about possible DAS indicators developed from indication ideas and their specification or rejection in a gradual narrowing-down process (see Section 2.2.3). In the course of this process, it was found from time to time that draft indicators were leading nowhere and had to be eliminated – either because they were not underpinned by data required for calculating the indicators, or the data was inadequate or the technical content was not linked sufficiently closely to climate change. In view of the large numbers of people involved in the process of indicator development, and also in the context of technical and political consultation, the situation repeatedly arose that in the light of the indicator system presented for consultation there were calls to examine certain additional indication ideas which had already been discussed by that time and rejected on the basis of closer examination. This made it necessary to describe all “dead ends” explored and set down the reasons why it ultimately proved impossible to implement such indication ideas.
To document the indicator discussion process, “background papers” were prepared for each DAS action field and each cross-sectional issue. They contain the following information:
▸ choice of indicators with a list of all indicators allocated to the action field, ▸ participation details, stating all persons and institutions who played a part in the discussions
and the concrete development of the indicators in the relevant action field or cross-sectional issue, plus information on the work group meetings or telephone conferences (see also Section 2.3.1);
▸ overview of the “indication fields” that were developed for thematic structuring of the action fields and cross-sectional issues (see Section 2.2.1), and the indicators that could be assigned to them; this table shows clearly the sub-themes for which it was not possible to develop indicators;
▸ explanations on indication ideas and indicators relating to the action field or cross-sectional issue; this shows, differently for the impact and response indicators, which individual indication ideas and data sources had to be discussed and examined, and – where appropriate – the reasons why they had to be rejected. The background papers also draw attention to basic possibilities for the future development of the indicator system and to projects or initiatives currently in progress that could yield specific findings or contributions for the future development of indicators;
▸ pointers to interfaces between the action field in view and other DAS action fields or cross-sectional themes.
The background papers are indispensable elements of transparent documentation of the extensive discussion process. Particularly for people joining the discussion at a fairly late stage in indicator development, they provide a valuable guide to investigations that have already taken place and to gaps that exist in the indicator system for whatever reason.
Development of the DAS Indicator System and Preparation of the Monitoring Report
36
The information used as a basis for preparing the background papers already existed in systematic form in the final report on the main study and in the relevant publication (Schönthaler et al. 20117). In the third R+D project it was then prepared in the form of separate documents and repeatedly updated in the further course of the project. Supplemented by a model text on a selected indicator (to illustrate the ultimate presentation of the indicators in the Monitoring Report), the background papers became the subject of technical and political consultation alongside the indicator and data fact sheets. Suggested amendments from the consultation process were also included in these papers. Future updating of the background papers is part of the ongoing maintenance of the background documentation to the DAS Indicator System.
The background papers for all DAS action fields and cross-sectional issues are collected in Annex 1 to this report. The model texts for a selected indicator at the end of each background paper are no longer included in this final version, as these ultimately found their way into the Monitoring Report.
1.2.4 Monitoring Report
The central intention of the indicator project was to produce an indicator-based report on adaptation to climate change in Germany. On the one hand, this report is to provide an overview of the extent to which Germany is affected by the consequences of climate change, and on the other, to provide insights into the adaptation measures which are being implemented. The report is certainly not intended to replace detailed reports by individual government departments. In fact, its function is to act as a kind of “curtain raiser” for a nationwide overview of key impacts and activities.
The aim of focusing the work of the indicator project on the Monitoring Report as its final product was stressed to all participants at a very early stage in the project.
In line with the concept of the indicators, the report was given the structure of a “Monitoring Report” describing both the past and the current situation. This involves a clear differentiation from the work of the Vulnerability Network, which is primarily directed towards the future.
The report is designed as a progress report. In future this report is to be updated at four-yearly intervals. Its target groups are defined as political decision-makers and any members of the public who may be interested and/or affected. This also means that it is not a scientific report intended to discuss individual subject areas in depth. Nevertheless, the report has to meet high expectations in terms of technical content and factual differentiation. This is particularly true in view of the fact that there is hardly an impact and action area that is not influenced by numerous other factors in addition to the climate.
The first technically and politically agreed Monitoring Report has 256 pages and consists of the following parts:
▸ Introduction: Explanatory notes on the objectives of the report and on the DAS Indicator System (including an overview of the indicators) and trend estimation (6 pages);
▸ Climate development in Germany: non indicator-based report section on mean climate development and changes in extremes (underpinned by graphics) – this part was prepared by the German Weather Service (DWD) (9 pages);
▸ Indicators on climate change impacts and adaptation: indicator-based report section with impact and response indicators for all DAS action fields and cross-sectional issues, and with the cross-cutting indicators (218 pages);
▸ Appendix with a list of participants who made specific contributions to the elaboration of the indicators, and in some cases also to the texts in the Monitoring Report, a bibliography with a
7 See footnote 4 on page 26
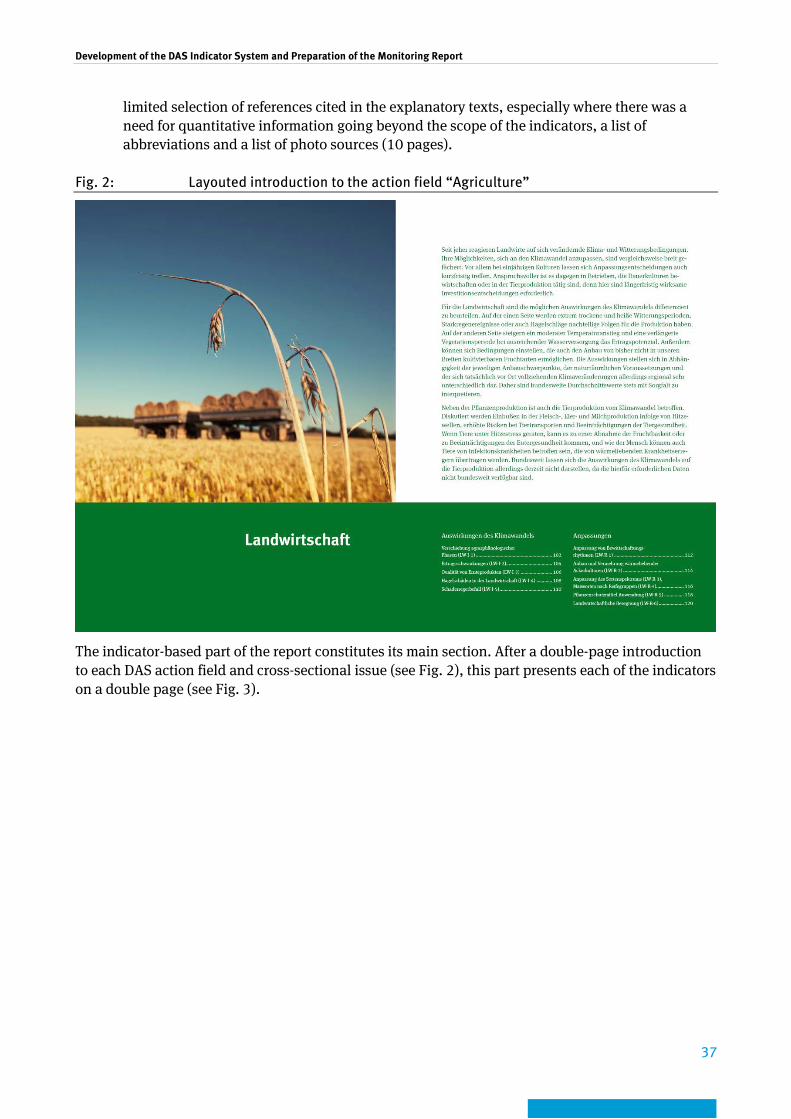
Development of the DAS Indicator System and Preparation of the Monitoring Report
37
limited selection of references cited in the explanatory texts, especially where there was a need for quantitative information going beyond the scope of the indicators, a list of abbreviations and a list of photo sources (10 pages).
Fig. 2: Layouted introduction to the action field “Agriculture”
The indicator-based part of the report constitutes its main section. After a double-page introduction to each DAS action field and cross-sectional issue (see Fig. 2), this part presents each of the indicators on a double page (see Fig. 3).
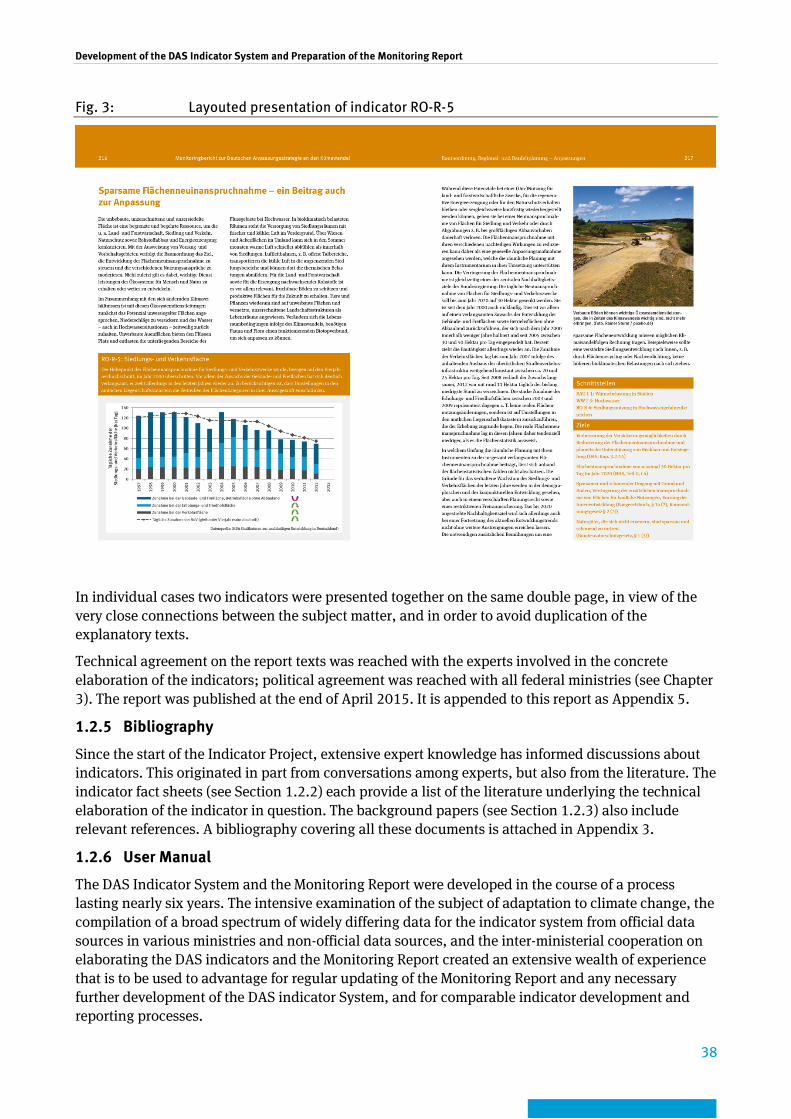
Development of the DAS Indicator System and Preparation of the Monitoring Report
38
Fig. 3: Layouted presentation of indicator RO-R-5
In individual cases two indicators were presented together on the same double page, in view of the very close connections between the subject matter, and in order to avoid duplication of the explanatory texts.
Technical agreement on the report texts was reached with the experts involved in the concrete elaboration of the indicators; political agreement was reached with all federal ministries (see Chapter 3). The report was published at the end of April 2015. It is appended to this report as Appendix 5.
1.2.5 Bibliography
Since the start of the Indicator Project, extensive expert knowledge has informed discussions about indicators. This originated in part from conversations among experts, but also from the literature. The indicator fact sheets (see Section 1.2.2) each provide a list of the literature underlying the technical elaboration of the indicator in question. The background papers (see Section 1.2.3) also include relevant references. A bibliography covering all these documents is attached in Appendix 3.
1.2.6 User Manual
The DAS Indicator System and the Monitoring Report were developed in the course of a process lasting nearly six years. The intensive examination of the subject of adaptation to climate change, the compilation of a broad spectrum of widely differing data for the indicator system from official data sources in various ministries and non-official data sources, and the inter-ministerial cooperation on elaborating the DAS indicators and the Monitoring Report created an extensive wealth of experience that is to be used to advantage for regular updating of the Monitoring Report and any necessary further development of the DAS indicator System, and for comparable indicator development and reporting processes.
Development of the DAS Indicator System and Preparation of the Monitoring Report
39
In future, the standards developed with reference to the DAS Indicator System and the Monitoring Report are also to maintain the consistency of the DAS Indicator System, ensure the transparency of all information and the integration of the relevant sectoral experts, and facilitate the future routine update process through clear and detailed documentation of all background documents and necessary workflows.
To this end a manual comprising nearly 80 pages was compiled (“Handbuch zur Verstetigung der indikatorbasierten Berichterstattung zur Umsetzung der Deutschen Anpassungsstrategie an den Klimawandel (DAS)”, known for short as the User Manual. The User Manual describes and defines:
▸ all relevant work steps for updating the DAS Indicator System and the Monitoring Report, ▸ the standards for the documentation of indicators and data sources to be applied to fact
sheets (see Section 1.2.2) and updating the background papers (cf. Section 1.2.3); ▸ the structure of the Monitoring Report and the rules for showing the indicators and
formulating the texts; ▸ details on trend estimation and trend assessment and how they are presented in the
Monitoring Report; ▸ the division of labour between the contributors to the process of updating the report.
The User Manual – as indicated in the last of the above points – also contains an organisation model governing the division of labour for the task of updating both the DAS Indicator System and the Monitoring Report. This shows that the organisation of the updating process is essentially centralised, which means that all work connected with updating is performed on a largely centralised basis by an inter-ministerial “coordination unit”. This unit will be located in the Federal Environment Agency (UBA). It will steer cooperation between the ministries on the updating process and coordinate their contributions. As in the development phase, the ministries are also to play an active part in the updating process, to ensure that the DAS Indicator System and the Monitoring Report continue to be a joint “product” of the ministries. To this end the individual data and information suppliers retain “ownership” of “their” indicators and are basically responsible for updating them.
The complete User Manual can be found in Appendix 4 to this report.
1.2.7 Contacts File
Apart from the more “tangible” end products resulting from work within the framework of the indicator project, i.e. the DAS Indicator System, the Monitoring Report and the User Manual, the pool of experts assembled in the course of the project must also rate as a valuable outcome.
An extensive technical consultation process was carried out for the purpose of discussing and developing the individual indicators and generating the Monitoring Report. In the end, this led to contributions from more than 450 individuals from federal and state government agencies, and from federations, associations, higher education institutions and business corporations. In this participation the focus was expressly not on scientific institutions. Particularly in view of the need to tap data sources available in the long term, priority was given to integrating associations and official bodies. Data surveys conducted in the context of research projects are not usually designed for regular updating.
Consultation for some action fields took place in small groups. For other action fields, numerous bilateral discussions were held in view of the broad spectrum of topics to be covered within the action field. The aim of all discussions was to integrate the existing expert knowledge and the interim results of work with similar objectives by administrative bodies and scientific institutions in the development of indicators, and to produce texts for the Monitoring Report that adequately reflected the current knowledge and situation.
Development of the DAS Indicator System and Preparation of the Monitoring Report
40
The contacts established in the course of the project also formed the source for recruiting the pool of experts in charge of the indicators who, as part of the Monitoring Report update process, are responsible for regularly updating the DAS indicators assigned to them and, where appropriate, further developing the relevant methods (cf. description of the organisation model in the User Manual, see Appendix 4).
The disclosure of the experts involved in the development process proved extremely helpful in the technical and political consultations, as it was always clear what expertise had already been taken into account and in what areas additional participation might be necessary or useful. Additions suggested by participating individuals and institutions were noted by the project contractors and led to further improvements in the quality of the work.
When publishing the project outcomes, great importance was attached to ensuring external visibility of the broad participation in the process of developing the indicators and the Monitoring Report, and thereby emphasising that it was an inter-ministerial product based on extensive technical expertise.
2 Working Methods and Project Progress 2.1 Initial situation and challenges Work on building up the DAS Indicator System and a reporting system for the DAS began immediately after the adoption of the DAS in December 2008. This meant it was very closely connected with the strategy document. In other words, the central project goal consisted in looking for possible indicators that could be used to represent the climate impacts and adaptation measures described in the DAS.
The development of the indicators faced several challenges. These resulted partly from the discussion and work process preceding the publication of the DAS, but were also connected in part with the project context that emerged in the adaptation sector in parallel with the indicator project. The specific points involved are as follows:
▸ The DAS, i.e. the actual strategy document, is a political document that does not claim to be a scientifically based paper that is consistent in all points. The goals set out in the DAS aim at very different levels of steering and measures. To some extent they are general, overarching goals enshrining an overall call for a reduction in vulnerability, an increase in adaptation capacity and mainstreaming of adaptation in the various policy areas. In some places, however, they address very specific individual measures, though such detail is not found throughout all action fields. Neither is it always evident or discernible why certain sub-topics within the action fields were emphasised, while others were disregarded. This heterogeneous situation is due partly to the fact that in 2008 the discussion about adaptation was still very new, and partly to the political consultation processes. => The DAS Indicator System is subject to conflicting requirements: on the one hand, that it refer to the strategy document, and on the other, that it consist of scientifically founded indicators that are sustainable over a long period. In view of the above-mentioned characteristics of the strategy document, the principal themes to be indicated could not be deduced direct from the document.
▸ Technical experts on the individual action fields were brought in to develop the DAS. As
input, they prepared basic papers which suggested focal themes for the strategy document. In some cases, however, the experts did not find their recommendations reflected in the focal themes and formulations of the DAS. For this reason they tended to take a critical view of the
Development of the DAS Indicator System and Preparation of the Monitoring Report
41
DAS process, because they feared that their recommendations would not be followed in this case either.
=> Extensive technical expertise was indispensable for the development of the indicators, and a large number of institutions had to be encouraged to supply their data. It was necessary to overcome the critical attitude of several participants in the DAS creation process in order to pave the way for their participation in the development of the DAS Indicator System. ▸ In parallel with the indicator project, other major processes were started which were also to
result in central components for the progress report on the implementation of the DAS. As well as the process of updating APA I to APA II, work started on building up the “Vulnerability” network, which involves a large number of public authorities. The staff working on the adaptation issue in the (governmental and non-governmental) institutions were therefore confronted with a large number of inquiries about assistance in the context of adaptation that sometimes exceeded the means at their disposal. A not infrequent problem – especially during the last phase of the indicator project, when work on the vulnerability network was also stepped up – was misunderstandings about the assignment of inquiries to the individual projects and their objectives. In the end this resulted in the “Indicator Report” being renamed the “Monitoring Report”, to ensure clearer delimitation between this and the future-oriented work in the Vulnerability network.
=> In some cases the parallel work on the different projects led to misunderstandings, or at any rate to a greater need for explanation to clarify the specific focus of the individual projects and ensure clear delimitation of the work assignments. ▸ The use of indicators for informing politicians and the public is to some extent the subject of
controversy, because indicators lead to simplifications that are not always regarded as appropriate from a technical or scientific point of view. Another point criticised in connection with these simplifications was the fact that the influences of climate change on the developments presented using the indicators are not incontrovertibly proven in every case and, above all, cannot be quantified.
=> To arrive at an indicator system at all on the basis of present knowledge, it was necessary to work out compromises that met the requirements not only for correct presentation of the cause-and-effect connections, but also for simplifying the great complexity in a manner appropriate to the target groups. It was necessary to generate acceptance for these compromises within the project. ▸ The broad spectrum of themes covered by the DAS requires the involvement of numerous
ministries to make use of data and expert knowledge for the development of the DAS Indicator System and the Monitoring Report. This requirement is in line with the basic principle of mainstreaming enshrined in the DAS, according to which adaptation concerns are rigorously integrated in the policies of the individual ministries and appropriate adaptation measures are designed and implemented on the ministry’s responsibility. However, when the various ministries transfer data and supply technical information, they usually demand the right to interpret such information. There is however a lack of extensive experience and tried-and-tested routines for agreeing and merging ministerial interests in an inter-ministerial (monitoring) report.
=> The establishment of the DAS Indicator System had to rely on the readiness of several ministries to cooperate and supply data. The project contractor had to play an important mediating role between the ministries in the interpretation of the data at technical level.

Development of the DAS Indicator System and Preparation of the Monitoring Report
42
2.2 Work Phases The procedure for creating the DAS Indicator System and the Monitoring Report comprised the steps shown in Fig. 4.
The indicators for the individual action fields and cross-sectional issues of the DAS were developed and elaborated using essentially the same model procedure, though the work was not always carried out with the same intensity on all action fields in parallel. Time spent waiting for data and dealing with comments had a major influence on the course of the project as a whole.
A different procedure was adopted for work on the DAS action field “Biological Diversity”. HNE Eberswald had carried out preliminary work as part of the advisory project (December 2008 to March 2010, see Section 1.1). As for the other action fields, research was conducted with a view to narrowing down the themes covered by the action field, plus some structuring into indication fields and individual thematic aspects (see Section 2.2.1). Initial indication ideas were outlined, but not much progress had been made with the actual development of indicators by the end of the advisory project – partly because of data problems. The action field “Biological Diversity” was deliberately excluded from the subsequent main study (June 2010 onwards), as a separate project for dealing with this was being prepared by the Federal Office for Nature Conservation (BfN). Contrary to plans, however, this was not started until mid-2011 under the title “System of indicators for showing the direct and indirect impacts of climate change on biological diversity” (FKZ 3511 82 0400).
It was agreed between the UBA and BfN that the work commissioned by the BfN on elaborating the DAS indicators would be integrated in the methodology of the DAS indicator project. This agreement related both to the basic conceptual design of the indicators and to their documentation. The documentation necessary for this purpose was made available to the BfN and its subcontractors. Information was exchanged between the project support working groups of the two projects and at bilateral level between the project contractors. In December 2013 five indicators were delivered to the DAS indicator project. The final outcome involved differences in the form of the indicator documentation in the fact sheets; a different format was chosen for the data fact sheets.
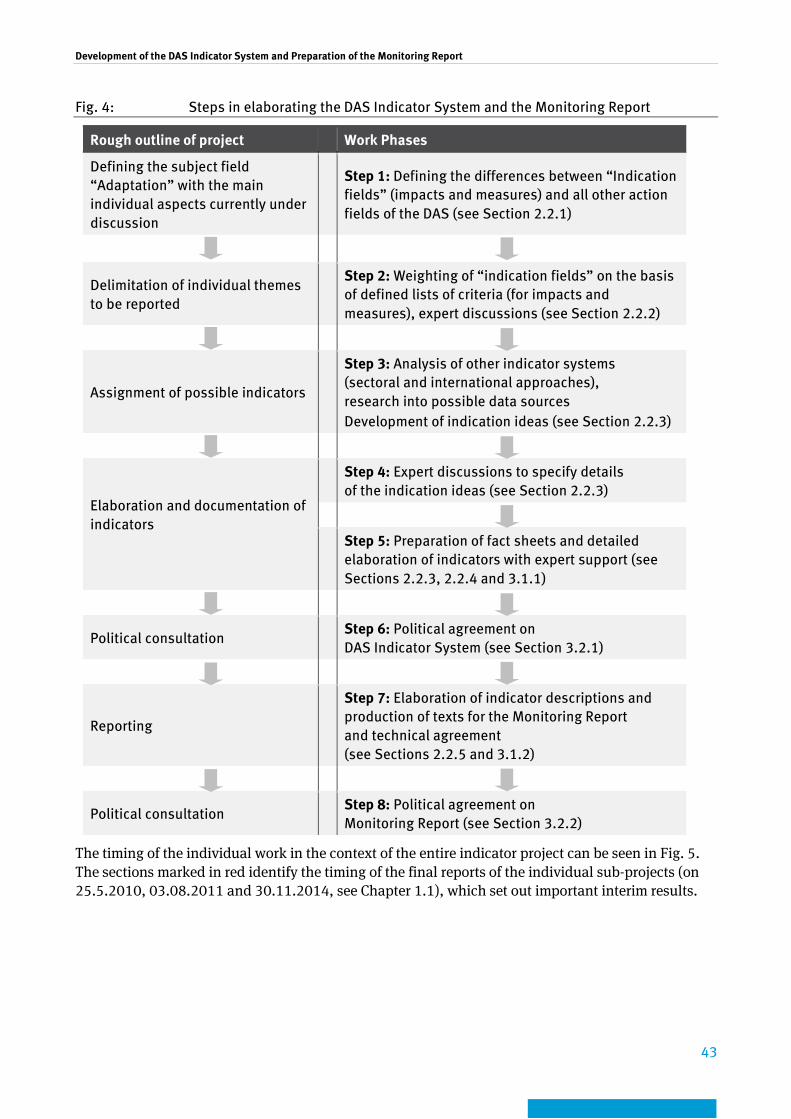
Development of the DAS Indicator System and Preparation of the Monitoring Report
43
Fig. 4: Steps in elaborating the DAS Indicator System and the Monitoring Report
Rough outline of project Work Phases
Defining the subject field “Adaptation” with the main individual aspects currently under discussion
Step 1: Defining the differences between “Indication fields” (impacts and measures) and all other action fields of the DAS (see Section 2.2.1)
Delimitation of individual themes to be reported
Step 2: Weighting of “indication fields” on the basis of defined lists of criteria (for impacts and measures), expert discussions (see Section 2.2.2)
Assignment of possible indicators
Step 3: Analysis of other indicator systems (sectoral and international approaches), research into possible data sources Development of indication ideas (see Section 2.2.3)
Elaboration and documentation of indicators
Step 4: Expert discussions to specify details of the indication ideas (see Section 2.2.3)
Step 5: Preparation of fact sheets and detailed elaboration of indicators with expert support (see Sections 2.2.3, 2.2.4 and 3.1.1)
Political consultation Step 6: Political agreement on DAS Indicator System (see Section 3.2.1)
Reporting
Step 7: Elaboration of indicator descriptions and production of texts for the Monitoring Report and technical agreement (see Sections 2.2.5 and 3.1.2)
Political consultation Step 8: Political agreement on Monitoring Report (see Section 3.2.2)
The timing of the individual work in the context of the entire indicator project can be seen in Fig. 5. The sections marked in red identify the timing of the final reports of the individual sub-projects (on 25.5.2010, 03.08.2011 and 30.11.2014, see Chapter 1.1), which set out important interim results.

Development of the DAS Indicator System and Preparation of the Monitoring Report
44
Fig. 5: Chronological sequence of work phases
2009 1st Quarter
Del
imit
atio
n of
indi
cati
on
fiel
ds
2nd Quarter
Prio
riti
sati
on o
f in
dica
tor f
ield
s
Dev
elop
men
t of
indi
cati
on id
eas
3rd Quarter
4th Quarter
2010 1st Quarter
2nd Quarter
Report I
3rd Quarter
4th Quarter
2011 1st Quarter
2nd Quarter
3rd Quarter
Report II
4th Quarter Pr
epar
atio
n of
indi
cato
r and
dat
a fa
ct s
heet
s
2012 1st Quarter
Elab
orat
ion
of in
dica
tors
2nd Quarter
3rd Quarter
Polit
ical
agr
eem
ent o
n
DA
S In
dica
tor S
yste
m
4th Quarter
agre
emen
t on
Rep
ort
2013 1st Quarter Pr
epar
atio
n of
M
onio
ring
Rep
ort
2nd Quarter
3rd Quarter
4th Quarter
2014 1st Quarter
2nd Quarter
Polit
ical
M
onito
ring
3rd Quarter
4th Quarter
Report III
2.2.1 Delimiting themes
Adaptation to climate change is a relatively new subject field, in which the development of new scientific findings is a highly dynamic process. In view of the fact that nearly all areas of society and industry and the environment are widely affected by the impacts of climate change, this is an extremely diverse subject field. If an indicator system is to be created for such a broad subject field, a structured and logical focus and definitions are essential to ensure a manageable system. The principal question for this first work phase was therefore: “What is in fact to be indicated?”
Since the DAS Indicator System is intended to make a contribution to reporting on progress with the implementation of the DAS (see Section 1.1), it must be based as closely as possible on the wording
Development of the DAS Indicator System and Preparation of the Monitoring Report
45
of the DAS, i.e. on the climate change impacts described there and the measures that are described in the document as already under implementation or recommended for implementation.
In its central Chapter 3 (“The consequences of climate change – What can we do?”), the DAS is broken down into in its 13 action fields and the two cross-sectional issues. Within the individual action fields there is no systematic separation of the description of climate change impacts and the description of action options. The work therefore started with a systematic analysis of the DAS in terms of the cause-and-effect relationships mentioned in it (climate impacts) and the objectives or measures or action options, in order to arrive at a clear picture of the points of reference for the indicator system.
An overview of the results of the analysis revealed clearly that the impacts and measures mentioned in the DAS did not completely reflect the spectrum of the individual topics covered in the expert discussions (see Section 2.1). Moreover, connections between the impacts mentioned in the DAS and the measures are not always clearly identifiable. Numerous pointers to possible actions are of a highly overarching nature and and do not suggest any measures that can be clearly formulated and implemented, while others are on a very small scale and show no sign of an overarching strategic line. Against this background it was decided to base the structuring of the DAS Indicator System on a search of the literature on climate impacts and adaptation measures, and to use this to derive a system of themes for all action fields and cross-sectional issues. In this process, a list was compiled of the main impacts and adaptation measures (responses) currently under discussion (“Sub-points”, see Fig. 6).
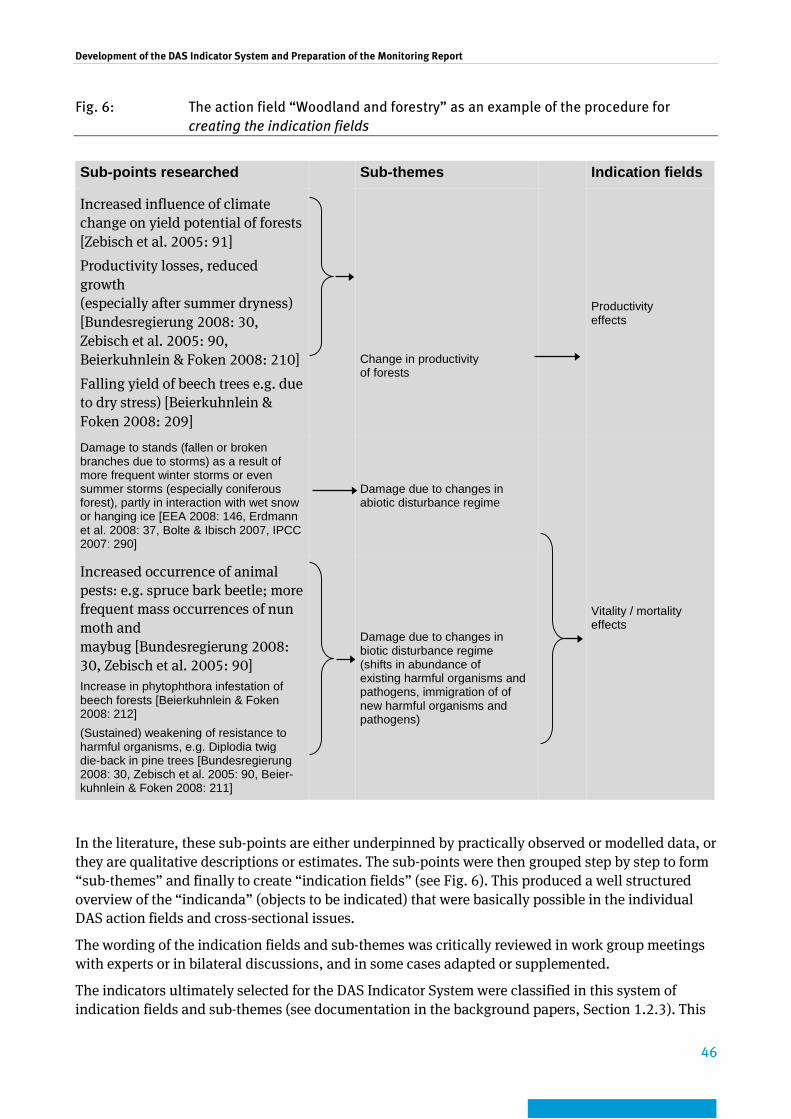
Development of the DAS Indicator System and Preparation of the Monitoring Report
46
Fig. 6: The action field “Woodland and forestry” as an example of the procedure for creating the indication fields
Sub-points researched Sub-themes Indication fields
Increased influence of climate change on yield potential of forests [Zebisch et al. 2005: 91]
Productivity losses, reduced growth (especially after summer dryness) [Bundesregierung 2008: 30, Zebisch et al. 2005: 90, Beierkuhnlein & Foken 2008: 210]
Falling yield of beech trees e.g. due to dry stress) [Beierkuhnlein & Foken 2008: 209]
Change in productivity of forests
Productivity effects
Damage to stands (fallen or broken branches due to storms) as a result of more frequent winter storms or even summer storms (especially coniferous forest), partly in interaction with wet snow or hanging ice [EEA 2008: 146, Erdmann et al. 2008: 37, Bolte & Ibisch 2007, IPCC 2007: 290]
Damage due to changes in abiotic disturbance regime
Vitality / mortality effects
Increased occurrence of animal pests: e.g. spruce bark beetle; more frequent mass occurrences of nun moth and maybug [Bundesregierung 2008: 30, Zebisch et al. 2005: 90] Increase in phytophthora infestation of beech forests [Beierkuhnlein & Foken 2008: 212] (Sustained) weakening of resistance to harmful organisms, e.g. Diplodia twig die-back in pine trees [Bundesregierung 2008: 30, Zebisch et al. 2005: 90, Beier-kuhnlein & Foken 2008: 211]
Damage due to changes in biotic disturbance regime (shifts in abundance of existing harmful organisms and pathogens, immigration of of new harmful organisms and pathogens)
In the literature, these sub-points are either underpinned by practically observed or modelled data, or they are qualitative descriptions or estimates. The sub-points were then grouped step by step to form “sub-themes” and finally to create “indication fields” (see Fig. 6). This produced a well structured overview of the “indicanda” (objects to be indicated) that were basically possible in the individual DAS action fields and cross-sectional issues.
The wording of the indication fields and sub-themes was critically reviewed in work group meetings with experts or in bilateral discussions, and in some cases adapted or supplemented.
The indicators ultimately selected for the DAS Indicator System were classified in this system of indication fields and sub-themes (see documentation in the background papers, Section 1.2.3). This

Development of the DAS Indicator System and Preparation of the Monitoring Report
47
made it clear where gaps existed in the indicator system that either arose during deliberate thematic focus work within the wide-ranging subject field of adaptation (see Section 2.2.2) or were due to data supply problems.
2.2.2 Prioritisation of subject fields
In view of the wealth of possible “indicanda” emerging from the structuring process (a total of more than 200 impact and response indication fields were described), it proved necessary to follow up the listing of the indication fields with a selection or prioritisation process in order to identify focal themes for indicator development in a reproducible fashion.
This prioritisation initially concentrated on the impact level and was performed by the project contractor on the basis of criteria at the level of the indication fields. The criteria listed and explained in Table 3 were the decisive factors in the prioritisation process.
Table 3: Criteria for prioritisation of the indication fields at the impact level
Criterion Sub-criterion Explanation
Discussion / Relevance [5]
The indication field is mentioned in the DAS. [3]
By definition, the indicator system relates primarily to the DAS and is intended to describe progress with the implementation of the DAS. This means that special attention must also be devoted to the climate change impacts addressed in the DAS. The criterion requires the assignment of DAS formulations to the relevant indication field.
The indication field is regularly mentioned in the literature with reference to Germany and Central Europe. [1]
The indicator system is to be closely connected to the current discussion about the impacts of climate change. Even if the methods and intensity of the literature searches do not permit any quantitative estimate of the intensity with which the individual impacts are addressed in the literature, the searches of synoptic literature in particular do give an impression of which impacts are discussed regularly and which less frequently.
Established indicators already exist for the indication field. [1]
The DAS Indicator System should as far as possible have extensive interfaces with other indicator systems or developments. Thus the possibility of indicators being “taken over” into the DAS system enhances the importance of an indication field and underlines its thematic relevance. There is therefore a need to investigate the “takeover options”.
Data situation [4] There are regular data surveys (at least on individual sub-themes). [3]
Even if it was not possible to obtain a full overview of data availability at the early stage of the project during which prioritisation took place, at least a first rough estimate was to be made of the data situation.
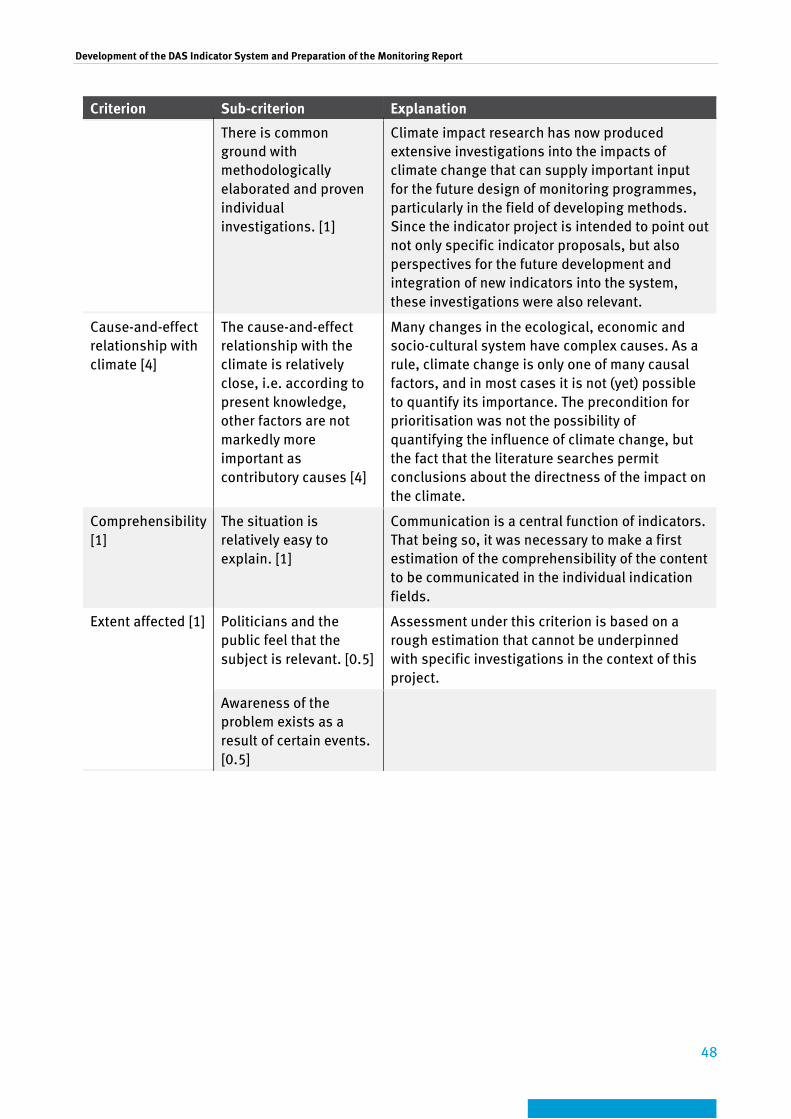
Development of the DAS Indicator System and Preparation of the Monitoring Report
48
Criterion Sub-criterion Explanation
There is common ground with methodologically elaborated and proven individual investigations. [1]
Climate impact research has now produced extensive investigations into the impacts of climate change that can supply important input for the future design of monitoring programmes, particularly in the field of developing methods. Since the indicator project is intended to point out not only specific indicator proposals, but also perspectives for the future development and integration of new indicators into the system, these investigations were also relevant.
Cause-and-effect relationship with climate [4]
The cause-and-effect relationship with the climate is relatively close, i.e. according to present knowledge, other factors are not markedly more important as contributory causes [4]
Many changes in the ecological, economic and socio-cultural system have complex causes. As a rule, climate change is only one of many causal factors, and in most cases it is not (yet) possible to quantify its importance. The precondition for prioritisation was not the possibility of quantifying the influence of climate change, but the fact that the literature searches permit conclusions about the directness of the impact on the climate.
Comprehensibility [1]
The situation is relatively easy to explain. [1]
Communication is a central function of indicators. That being so, it was necessary to make a first estimation of the comprehensibility of the content to be communicated in the individual indication fields.
Extent affected [1] Politicians and the public feel that the subject is relevant. [0.5]
Assessment under this criterion is based on a rough estimation that cannot be underpinned with specific investigations in the context of this project.
Awareness of the problem exists as a result of certain events. [0.5]
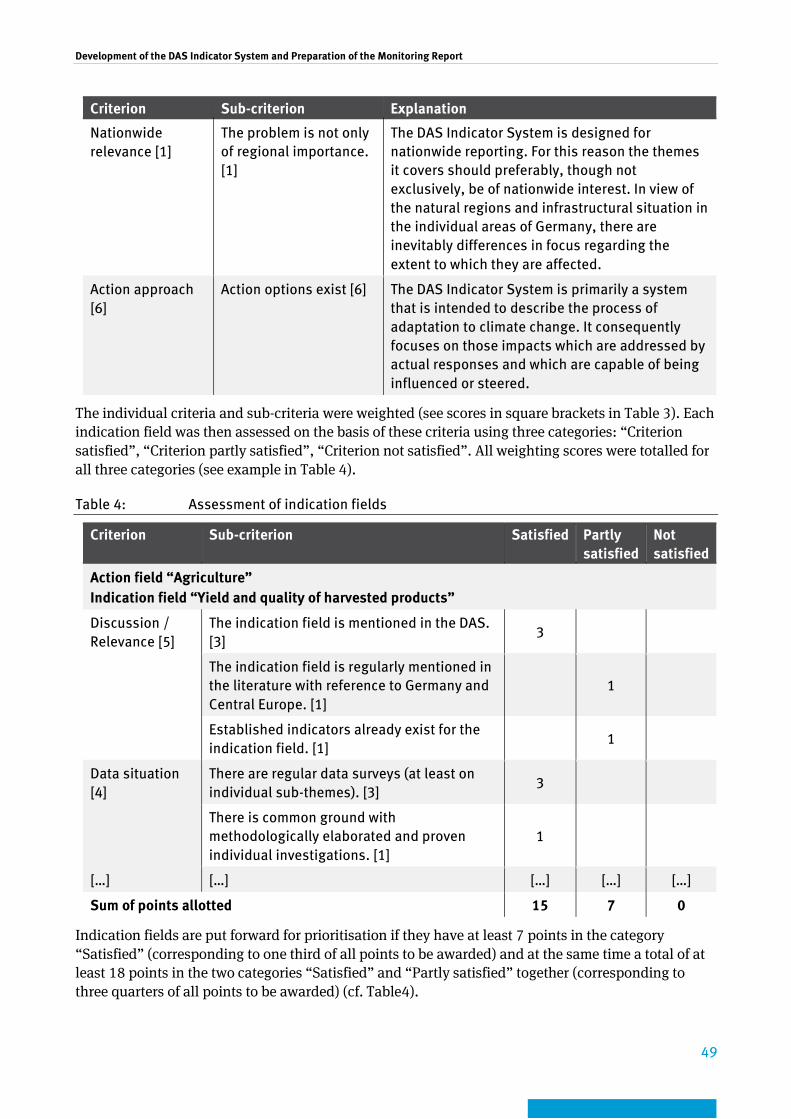
Development of the DAS Indicator System and Preparation of the Monitoring Report
49
Criterion Sub-criterion Explanation
Nationwide relevance [1]
The problem is not only of regional importance. [1]
The DAS Indicator System is designed for nationwide reporting. For this reason the themes it covers should preferably, though not exclusively, be of nationwide interest. In view of the natural regions and infrastructural situation in the individual areas of Germany, there are inevitably differences in focus regarding the extent to which they are affected.
Action approach [6]
Action options exist [6] The DAS Indicator System is primarily a system that is intended to describe the process of adaptation to climate change. It consequently focuses on those impacts which are addressed by actual responses and which are capable of being influenced or steered.
The individual criteria and sub-criteria were weighted (see scores in square brackets in Table 3). Each indication field was then assessed on the basis of these criteria using three categories: “Criterion satisfied”, “Criterion partly satisfied”, “Criterion not satisfied”. All weighting scores were totalled for all three categories (see example in Table 4).
Table 4: Assessment of indication fields
Criterion Sub-criterion Satisfied Partly satisfied
Not satisfied
Action field “Agriculture” Indication field “Yield and quality of harvested products”
Discussion / Relevance [5]
The indication field is mentioned in the DAS. [3]
3
The indication field is regularly mentioned in the literature with reference to Germany and Central Europe. [1]
1
Established indicators already exist for the indication field. [1]
1
Data situation [4]
There are regular data surveys (at least on individual sub-themes). [3]
3
There is common ground with methodologically elaborated and proven individual investigations. [1]
1
[…] […] […] […] […]
Sum of points allotted 15 7 0
Indication fields are put forward for prioritisation if they have at least 7 points in the category “Satisfied” (corresponding to one third of all points to be awarded) and at the same time a total of at least 18 points in the two categories “Satisfied” and “Partly satisfied” together (corresponding to three quarters of all points to be awarded) (cf. Table4).

Development of the DAS Indicator System and Preparation of the Monitoring Report
50
At the response level it did not seem logical to prioritise the indication fields. Here the great challenge of indicator development consisted in identifying measures and activities that were already being implemented and for which data existed (for describing the implementation process or its outcome).
An expert assessment was untertaken at a workshop held at the UBA in Berlin in June 2009 (see Section 2.3.2) to check the reliability of the criteria-based prioritisation of the impact indication fields. Work group meetings on the individual action fields also discussed the question of meaningful prioritisation (see Section 2.3.2). The results of prioritisation under the individual processes were summarised as shown by the example in Table4. There were only few cases of discrepancies between the two assessment methods.
Table 5: Prioritisation of impact indication fields, based on the example of the action field “Energy industry (conversion, transport, supply)”
Criteria-driven assessment
Expert assessment
Indication fields Sa
tisf
ied
Part
ly
sati
sfie
d
Not
sa
tisf
ied
Very
im
port
ant
Impo
rtan
t
Not
ver
y im
port
ant
Energy requirement 6 14.5 1.6 5 2 2
Energy infrastructure 21 1 0 7 1 0
Energy conversion 17 5 0 6 3 1
Availability of primary energy sources 10 3.5 8.5 1 4 3
Energy supply 20 2 0 6 2 0
Influence on competitiveness 7 7 8 1 5 2
Indication fields earmarked for further processing (indicator research and development)
Proposed by workshop for further processing
Indication fields excluded from further processing (indicator research and development)
Proposed by workshop for exclusion from further processing
Proposed assessment: * at least 7 weighting points (approx. 1/3) in category “Satisfied” * at least 18 weighting points (approx. 3/4) in the categories “Satisfied” and “Partly satisfied”
Each participant was allowed to award one point for each indication field. All points awarded by the participants were totalled.
For further methodological details of the prioritisation process using criteria and expert discussions, and the resulting individual assessments, see the remarks in Schönthaler et al. (2010)8. The results of prioritisation can be seen from the background papers (see Appendix 1).
2.2.3 Development of indication ideas and elaboration of indicators
The next step for the prioritised impact indication fields and the relevant response measures was to develop first indication ideas from other indicator systems by investigating possible data sources, sifting through in-depth literature and considering indicators already in existence. These were
8 See footnote 3 on page 26
Development of the DAS Indicator System and Preparation of the Monitoring Report
51
summarised in tabular form, documenting the origin of the indication idea, the possible data source, the possible interpretations and limits, and details of the literature sources consulted.
On the basis of these indication ideas, expert discussions were then held in the form of work group meetings or at bilateral level to develop the ideas into concrete indicators. The extensive preliminary technical work and its structural documentation made a considerable contribution to motivating the experts to take part in the further development of these indication ideas. The aim of all discussions was to integrate the existing expert knowledge and the interim results of work with similar objectives by administrative bodies and scientific institutions in the development of indicators, and to clarify
▸ whether the indicator ideas promised sufficiently good indication performance with regard to the subject of climate change and adaptation;
▸ whether the use of existing data sources was realistic and what restrictions might have to be expected;
▸ how, and with the cooperation of what institutions and contact persons, the proposals could be specified in greater detail to arrive at concrete indicators.
In these discussions there was a basic need for clarification with regard to the response indicators in particular. As there are not very many measures to date that are specifically and exclusively aimed at adaptation to climate change, the question arises as to what measures the response indicators are to address. In the work group discussions (see Section 2.3.1) and PAG (see Section 2.3.2) consensus was reached that one could work on the basis of the following definition of adaptation measures:
▸ Measures that have been or will be taken (autonomously or not autonomously) or are strongly motivated by adaptation targets (e.g. cultivation of thermophilic agricultural crops),
▸ Measures that were originally taken for other reasons, but are capable of supporting the adaptation process (e.g. forest conversion),
▸ Measures that promote basic structural developments and are a step in the right direction as far as adaptation is concerned (e.g. spreading risks in the energy supply sector).
The condition was also laid down that only measures pursuing the overarching goal of sustainable development could be included in the indicator system. In view of this requirement, for example, it was decided not to develop an indicator for production of artificial snow on ski slopes in the DAS action field “Tourism industry”.
Numerous indication ideas developed in this project phase (and documented at the end of the advisory project) were developed into concrete proposals for indicators in the further course of the project. However, several had to be rejected because the information on their connection with climate change proved to be inadequate and / or invalid, or because no suitable data source could be identified. Table7 lists examples of indication ideas (for the impact and response levels) in the action fields and cross-sectional issuesof the DAS (with the exception of the action field “Biological diversity”) that were discussed during the development process but rejected after further discussions for the reasons stated above.
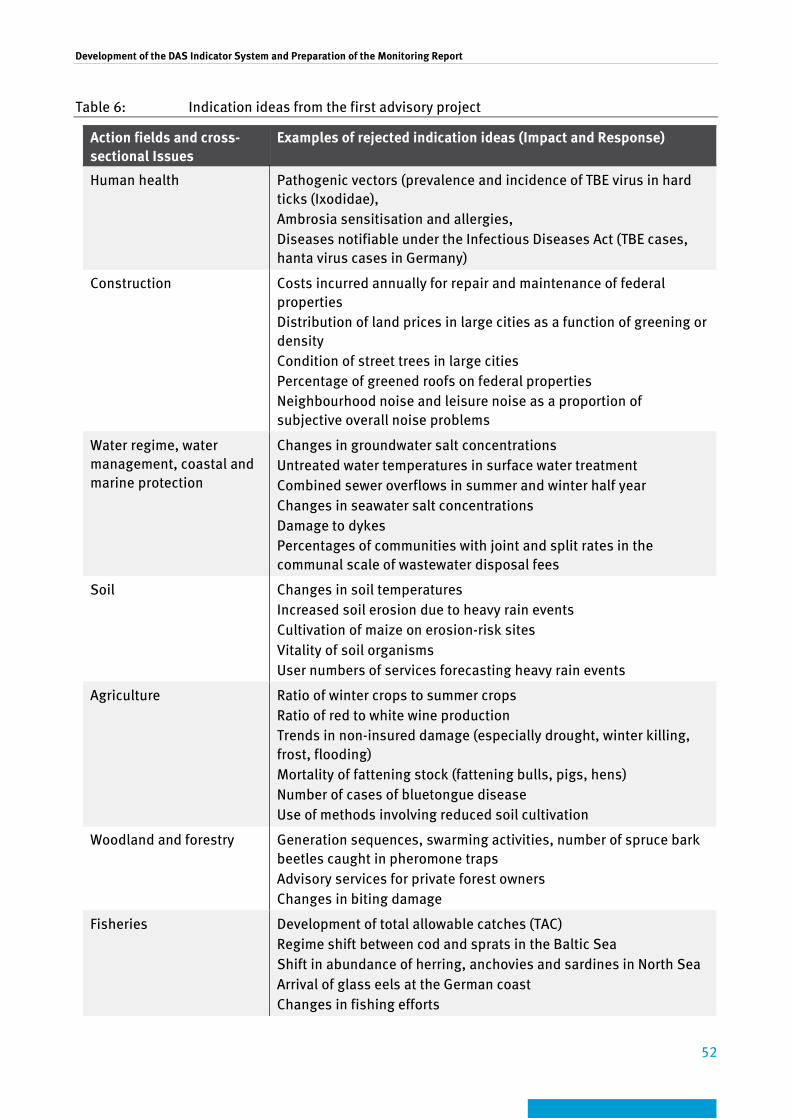
Development of the DAS Indicator System and Preparation of the Monitoring Report
52
Table 6: Indication ideas from the first advisory project
Action fields and cross-sectional Issues
Examples of rejected indication ideas (Impact and Response)
Human health Pathogenic vectors (prevalence and incidence of TBE virus in hard ticks (Ixodidae), Ambrosia sensitisation and allergies, Diseases notifiable under the Infectious Diseases Act (TBE cases, hanta virus cases in Germany)
Construction Costs incurred annually for repair and maintenance of federal properties Distribution of land prices in large cities as a function of greening or density Condition of street trees in large cities Percentage of greened roofs on federal properties Neighbourhood noise and leisure noise as a proportion of subjective overall noise problems
Water regime, water management, coastal and marine protection
Changes in groundwater salt concentrations Untreated water temperatures in surface water treatment Combined sewer overflows in summer and winter half year Changes in seawater salt concentrations Damage to dykes Percentages of communities with joint and split rates in the communal scale of wastewater disposal fees
Soil Changes in soil temperatures Increased soil erosion due to heavy rain events Cultivation of maize on erosion-risk sites Vitality of soil organisms User numbers of services forecasting heavy rain events
Agriculture
Ratio of winter crops to summer crops Ratio of red to white wine production Trends in non-insured damage (especially drought, winter killing, frost, flooding) Mortality of fattening stock (fattening bulls, pigs, hens) Number of cases of bluetongue disease Use of methods involving reduced soil cultivation
Woodland and forestry Generation sequences, swarming activities, number of spruce bark beetles caught in pheromone traps Advisory services for private forest owners Changes in biting damage
Fisheries Development of total allowable catches (TAC) Regime shift between cod and sprats in the Baltic Sea Shift in abundance of herring, anchovies and sardines in North Sea Arrival of glass eels at the German coast Changes in fishing efforts
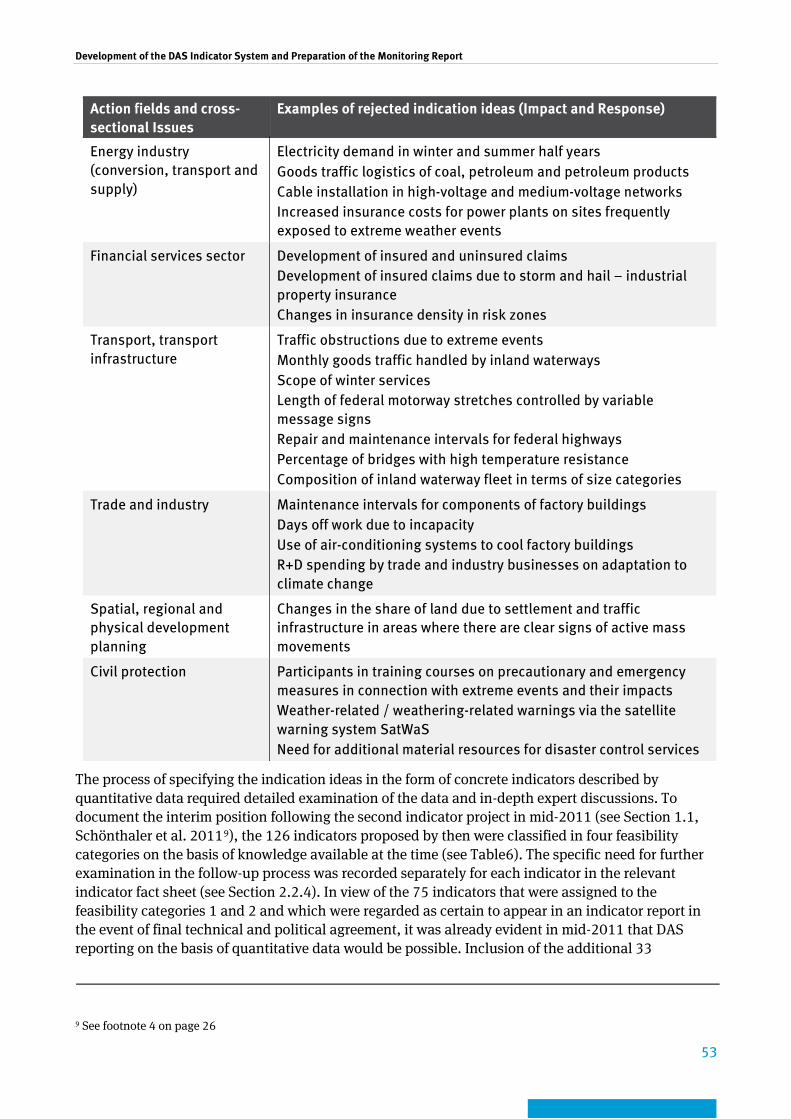
Development of the DAS Indicator System and Preparation of the Monitoring Report
53
Action fields and cross-sectional Issues
Examples of rejected indication ideas (Impact and Response)
Energy industry (conversion, transport and supply)
Electricity demand in winter and summer half years Goods traffic logistics of coal, petroleum and petroleum products Cable installation in high-voltage and medium-voltage networks Increased insurance costs for power plants on sites frequently exposed to extreme weather events
Financial services sector Development of insured and uninsured claims Development of insured claims due to storm and hail – industrial property insurance Changes in insurance density in risk zones
Transport, transport infrastructure
Traffic obstructions due to extreme events Monthly goods traffic handled by inland waterways Scope of winter services Length of federal motorway stretches controlled by variable message signs Repair and maintenance intervals for federal highways Percentage of bridges with high temperature resistance Composition of inland waterway fleet in terms of size categories
Trade and industry Maintenance intervals for components of factory buildings Days off work due to incapacity Use of air-conditioning systems to cool factory buildings R+D spending by trade and industry businesses on adaptation to climate change
Spatial, regional and physical development planning
Changes in the share of land due to settlement and traffic infrastructure in areas where there are clear signs of active mass movements
Civil protection Participants in training courses on precautionary and emergency measures in connection with extreme events and their impacts Weather-related / weathering-related warnings via the satellite warning system SatWaS Need for additional material resources for disaster control services
The process of specifying the indication ideas in the form of concrete indicators described by quantitative data required detailed examination of the data and in-depth expert discussions. To document the interim position following the second indicator project in mid-2011 (see Section 1.1, Schönthaler et al. 20119), the 126 indicators proposed by then were classified in four feasibility categories on the basis of knowledge available at the time (see Table6). The specific need for further examination in the follow-up process was recorded separately for each indicator in the relevant indicator fact sheet (see Section 2.2.4). In view of the 75 indicators that were assigned to the feasibility categories 1 and 2 and which were regarded as certain to appear in an indicator report in the event of final technical and political agreement, it was already evident in mid-2011 that DAS reporting on the basis of quantitative data would be possible. Inclusion of the additional 33
9 See footnote 4 on page 26
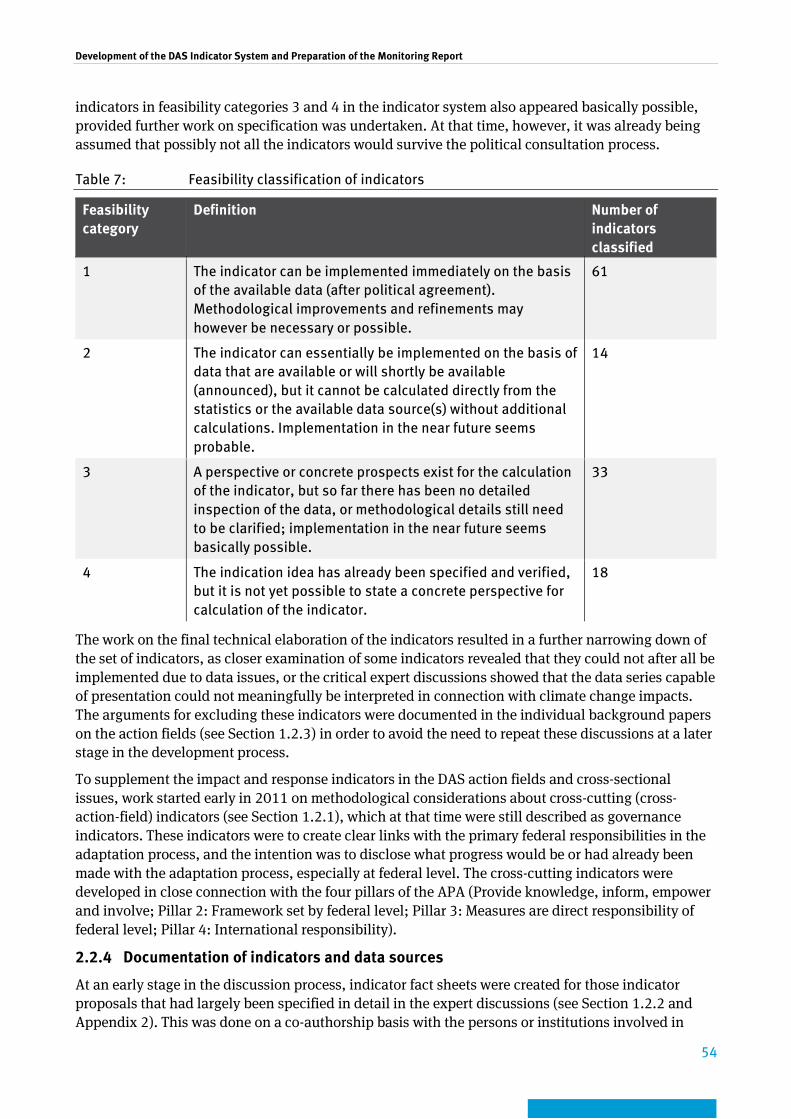
Development of the DAS Indicator System and Preparation of the Monitoring Report
54
indicators in feasibility categories 3 and 4 in the indicator system also appeared basically possible, provided further work on specification was undertaken. At that time, however, it was already being assumed that possibly not all the indicators would survive the political consultation process.
Table 7: Feasibility classification of indicators
Feasibility category
Definition Number of indicators classified
1 The indicator can be implemented immediately on the basis of the available data (after political agreement). Methodological improvements and refinements may however be necessary or possible.
61
2 The indicator can essentially be implemented on the basis of data that are available or will shortly be available (announced), but it cannot be calculated directly from the statistics or the available data source(s) without additional calculations. Implementation in the near future seems probable.
14
3 A perspective or concrete prospects exist for the calculation of the indicator, but so far there has been no detailed inspection of the data, or methodological details still need to be clarified; implementation in the near future seems basically possible.
33
4 The indication idea has already been specified and verified, but it is not yet possible to state a concrete perspective for calculation of the indicator.
18
The work on the final technical elaboration of the indicators resulted in a further narrowing down of the set of indicators, as closer examination of some indicators revealed that they could not after all be implemented due to data issues, or the critical expert discussions showed that the data series capable of presentation could not meaningfully be interpreted in connection with climate change impacts. The arguments for excluding these indicators were documented in the individual background papers on the action fields (see Section 1.2.3) in order to avoid the need to repeat these discussions at a later stage in the development process.
To supplement the impact and response indicators in the DAS action fields and cross-sectional issues, work started early in 2011 on methodological considerations about cross-cutting (cross-action-field) indicators (see Section 1.2.1), which at that time were still described as governance indicators. These indicators were to create clear links with the primary federal responsibilities in the adaptation process, and the intention was to disclose what progress would be or had already been made with the adaptation process, especially at federal level. The cross-cutting indicators were developed in close connection with the four pillars of the APA (Provide knowledge, inform, empower and involve; Pillar 2: Framework set by federal level; Pillar 3: Measures are direct responsibility of federal level; Pillar 4: International responsibility).
2.2.4 Documentation of indicators and data sources
At an early stage in the discussion process, indicator fact sheets were created for those indicator proposals that had largely been specified in detail in the expert discussions (see Section 1.2.2 and Appendix 2). This was done on a co-authorship basis with the persons or institutions involved in

Development of the DAS Indicator System and Preparation of the Monitoring Report
55
elaborating the indicators. In parallel with this, the data found for calculating the indicators were filed in data fact sheets (see Section 1.2.2). The fact sheets formed the central basis for all further discussions about specifying and improving the indicators. They were therefore updated several times during the process.
The indicator fact sheets give separate descriptions of the individual components of which an indicator may consist, together with rules for calculation. The same applies to so-called “indicator supplements”. For some indicators it is possible to describe supplementary aspects on the same theme with additional datasets, though these are not reflected in the diagram-based representations of the indicators in the Monitoring Report. These “indicator supplements” provide background information for drafting the explanatory texts on the individual indicators in the Monitoring Report.
The indicator fact sheets also draw attention to possible further improvements to the indicators. Thus the indicator fact sheets are not only important for unambiguous definition of the calculation rules and documentation of the data source(s) with a view to updating the Monitoring Reports, but also record possible or necessary methodological improvements and the existing points of attack for such improvements.
The background papers (see Section 1.2.3) were also prepared in parallel with the creation of the fact sheets and continuously updated for the individual action fields and cross-sectional issues during the process of developing the indicator system, in order to document the findings of the discussions about indication ideas that were not suitable for further development as indicators.
Together with the background papers, the indicator fact sheets formed the basis for the political consultations on the DAS Indicator System (see Section 3.2).
2.2.5 Preparation of Monitoring Report
On the basis of the technically and politically agreed indicator system (see Chapter 3), work started on drafting the explanatory texts on the indicators for the indicator-based main part of the Monitoring Report.
A first draft of the structure and classification of the Monitoring Report was prepared at an early stage in the process. Input was provided by a critical inspection of other indicator-based reports. Moreover, as early as the beginning of 2010 a first draft layout was created of a model version for a selected indicator. This example always formed part of the introductory presentations on the project goals, e.g. at the work group meetings on the development of indicators for the individual action fields and cross-sectional issues, to ensure that all participants were focused on the central end product of the work.
Prior to writing the text, the final layout was determined in line with the UBA’s corporate design requirements. This also defined the length of the text that was to be produced.
The indicator-based parts of the Monitoring Report are highly standardised. Each indicator is given a two-page spread in the report, to ensure that all indicators receive equal weight and and to provide readers with a rapid overview (see Fig. 3). The explanatory texts set out to
▸ explain the facts justifying the indicators described, ▸ supply further information on the sub-theme illustrated by the indicator, above and beyond
the indicator itself, ▸ explain and, if possible, assess the status and / or development of the indicator, ▸ create links with target formulations in the DAS or other strategy documents.
In the absence of quantitative targets in the DAS that could be used as a basis for assessment, a trend calculation was performed using a standardised statistical method (see Section 1.2.6, Appendix 4) to
Development of the DAS Indicator System and Preparation of the Monitoring Report
56
support the discussion and assessment of the indicators. The trend estimation process is essentially heavily based on the procedure developed for trend calculations on the LIKI indicators (Martone 201310). The results of the trend calculation were integrated in the indicator graphics with the aid of trend symbols.
The explanatory texts on the indicators in the Monitoring Report have a different focus from the texts in the indicator fact sheets. For this reason it was not possible to generate them from these texts. What is important for the Monitoring Report is not so much the technical details, but an easily understood general description of the subject field that the indicator is intended to transport. The reasons for indicator selection set out in the indicator fact sheets nevertheless provided input for the production of the explanatory texts. Conversely, however, the expert discussions on the time series shown in the Monitoring Report for the indicators and trend calculations, and also the political consultations on the Monitoring Report, resulted in a need for individual retroactive changes to the descriptions in the indicator fact sheets.
It proved useful for all explanatory texts to be formulated with a close focus on target groups by a team of just two individuals from the project contractor. This team had the requisite background knowledge on how the indicators were developed. The resulting, almost homogeneous text was then reviewed by technical experts and some minor amendments were made.
Further details on the individual elements of the presentation in the Monitoring Report and their implementation can be found in the User Manual (see Section 1.2.6 and Appendix 4).
2.3 Cooperation and technical participation Owing to the broad range of areas affected by climatic impacts and the requirement to apply and agree adaptation measures as far as possible encompassing all sectors, it was necessary to involve all government departments in the preparation and hence the development of the DAS Indicator System and the Monitoring Report. The overarching goal of mainstreaming enshrined in the DAS, i.e. the need to consider the requirements of adaptation to climate change in all relevant decisions in the individual sectoral policies, called for – and still calls for – the active participation of all government departments in the work of producing and updating the DAS Indicator System and the Monitoring Report. As joint “products” of all departments, both the DAS Indicator System and the Monitoring Report underwent a technical and political inter-ministerial consultation process.
The integration of government departments at the technical level, which essentially took place via the highest departments in the hierarchy, was to reflect the current state of discussion and knowledge about climate change impacts and adaptation measures within the individual departments in the DAS Indicator System and the Monitoring Report as well as possible, and to ensure that the information provided in the documents had the backing of the experts in the relevant departments and was in line with their ideas about the future organisation and design of the data capture (and evaluation) process and the reporting process.
Against this background the project contractor, Bosch & Partner GmbH, assumed a structuring, input-providing and moderating role within the context of the indicator project with the aim of bringing together the competencies and knowledge in the individual sectors and departments concerned, and at the same time creating a structured synopsis and synthesis of the findings and activities in the field of adaptation. To do this it was necessary to explore the sub-themes in the 15
10 Martone O. 2013: Die Methode der Trendanalyse. In: Umweltökonomische Gesamtrechnungen der Länder: 77-88.
Development of the DAS Indicator System and Preparation of the Monitoring Report
57
action fields and cross-sectional issues sufficiently profoundly to permit technical discussions with the experts on an equal footing.
2.3.1 Integration of sectoral experts
Almost six years of project work have seen the formation of a very large circle of nearly 450 persons from governmental and non-governmental bodies who have made major or minor contributions to the creation of the DAS Indicator System and the Monitoring Report. This pool of sectoral experts has grown with time. An important part was played here not only by people already involved who suggested or recommended the inclusion of other colleagues, but also by chance events. The precondition for the functioning of this “snowball system” was consistently transparent documentation of participants in the work on the individual action fields and cross-sectional issues. The contacts file was constantly updated during the entire project period (see Section 1.2.7).
Many of the participants accompanied the process of indicator development and reporting throughout the entire project. In view of the length of the project, however, there were also changes in the persons responsible in the participating institutions. This meant that new colleagues had to be familiarised with the goals of the project, the instruments for handling it and the procedures involved.
This contributory work on the indicator project demanded additional engagement on the part of all governmental and non-governmental participants alongside their already considerable (official) duties. This called for special motivation to take part. The preconditions for this were:
a) limitation and transparency of the contributory work requested, b) trust in proper use of this input, c) prospects of an increase in own technical knowledge, d) recognition and transparent documentation of participation, e) attractiveness of end product.
Item a): In every phase of the project, the requests to the experts were clearly targeted on the basis of well organised and structured documents. Only the tables with the first indication ideas used in the first work group meetings in the advisory project (see Section 2.2.3) were rather more extensive. For these, however, there were deliberately no requests for written comments or input; instead the tables formed the basis for the expert discussions and were prepared and updated exclusively by the indicator project contractor. From the start, further work on concrete indicator development was based on the indicator fact sheets, which were compact and well structured in standardised form for all action fields and indicators. The participants quickly familiarised themselves with these documents, and updates and improvements were always made in the same documents on a targeted basis. By the end of the process the fact sheets were firmly established and proven tools that were repeatedly shared between the participants in the development and editorial process.
Item b): High quality of all technical material was the primary aim of the indicator project contractor. To ensure this and be able to discuss with the experts on an equal footing, the project participants worked very hard to familiarise themselves with the individual subject fields. The experts always welcomed this with great appreciation. This made it possible to give the experts the good feeling that the facts and figures supplied would receive proper professional handling.
Item c): By this means, experts who were involved in the discussion process through work group meetings or telephone conferences (see Section 2.3.2) were able to exchange technical information with colleagues in other institutions, and in some cases other government departments. These discussions enabled the experts to pursue technical content on an in-depth basis and exchange views on their positions. The experts involved in the discussions about the indicators had access not only to

Development of the DAS Indicator System and Preparation of the Monitoring Report
58
the indicator fact sheets of their own action field, but also to those of the other DAS action fields and cross-sectional issues. In several cases the technical experts performed specific analyses of their data for generation of the DAS indicators and made new findings of their own (e.g. in the case of indicators GE-I-2 “Heat-related mortalities”, FW-I-2 “Endangered spruce stands”, FI-I-1 “Distribution of thermophilic marine species” or TOU-I-4 “Snow cover for winter sports”). In many cases the cooperation with the project contractor, which was in particular geared to the clear documentation and transparent justification of the indicators, was explicitly described as very fruitful. In one case (Indicator FW-I-1 “Tree species composition in designated Forest Nature Reserves”) it actually proved possible to use the indicator project to initiate a new data survey by the Natural Forests project group that was geared to generating the indicator and will in future be repeated every five years. The data were also rated scientifically interesting by the Natural Forests project group.
Item d): In all cases the indicator project contractor cultivated respectful and appreciative dealings with the technical experts involved in the project. In nearly all cases this resulted in very considerate and friendly cooperation, which was very much to the benefit of the project. The technical groundwork carried out in various institutions was acknowledged in the background papers by naming all contributors to relevant action fields. The experts who made specific contributions to individual indicators and to generating the indicator fact sheets were likewise mentioned as authors in the relevant indicator fact sheets. In many cases they were named as experts in charge of the individual indicators for updating the Monitoring Report.
Item e): For many experts the prospect of the end product of their work – the Monitoring Report – was a motivating factor in their contributions. Here the model indicator produced as a prototype at a very early stage in the project (early 2010) (see Section 2.2.5), which approximated very closely to the final layout, was extremely helpful. Moreover, work started at the beginning of 2011 on preparing parts of the Monitoring Report. This specifically involved elaborating numerous indicators on the action fields “Woodland and forestry”, “Energy industry”, “Financial services sector” and “Civil protection” (cf. Fig. 5).
Although the strategies mentioned above created a very good basis for the extensive involvement of experts, in some cases great perseverance and repeated inquiries were needed to obtain the desired expert contributions. To some extent the experts’ initial reluctance to cooperate was due to the fact that there was dissatisfaction about the process for preparing the DAS itself, and the participants in that process did not find their contributions reflected in the final version of the strategy. As a rule, however, this resistance was overcome in the indicator project.
The situation proved unfavourable in cases where experts had played an active part in development and documentation in the expectation that the indicator would be included in the indicator set, but these indicators were then excluded from the set in the course of the consultations. The reasons given for exclusion were not always convincing from a technical point of view (see Section 3.1.1). All indicators that were excluded in the political consultation process and thus ceased to be part of the DAS Indicator System are appended to this final report in Appendix 2. It is possible that interest in the relevant content may arise again some time in the future.
The great success of the participation process as a whole is reflected in the fact that the list of participants in the Appendix to the Monitoring Report was explicitly requested. This can be seen as a sign that the participants were glad to identify with the end product.
2.3.2 Elements of participation
Technical experts and political decision-makers were involved throughout the project in various ways:

Development of the DAS Indicator System and Preparation of the Monitoring Report
59
▸ through the Federal Government’s inter-ministerial working group on Adaptation Strategy (IMA Anpassungsstrategie) and the Standing Committee of the Länder on Adaptation to the Consequences of Climate Change (AFK);
▸ through the Project Support Working Group (PAG); ▸ by means of experts meeting in mini-groups to discuss individual DAS action fields and cross-
sectional themes; ▸ by experts meeting for bilateral discussions; ▸ by means of workshops with broad participation by experts.
Official bodies:
The inter-ministerial working group on Adaptation Strategy (IMA) brings together representatives of the federal ministries under the chairmanship of the BMUB to exchange information about the activities for developing and implementing the DAS and to take decisions. A first full presentation of the DAS indicator project and the progress made up to that point was given by the project contractor at the IMA meeting in November 2011. At the subsequent meetings the UBA and the BMU / BMUB regularly reported on the progress of the work and coordinated the indicator development process with the IMA Adaptation Strategy. Political coordination of the DAS indicators and the Monitoring Report also took place through the IMA Adaptation Strategy (see Section 3.2).
The AFK is the interstate body in which the ministries responsible for the adaptation process exchange information about the relevant activities in the individual Länder. It is the task of the Länder ministry representatives not only to take this information back to their own ministry, but also to transport it to the other ministries in their Land. The DAS indicator project was presented by the project contractor in April 2010 at the AFK ad hoc working group on “Climate impact monitoring”. The AFK coordinated the political consultations about the indicators at Länder level. After that, the Länder were no longer involved in political coordination of the Monitoring Report.
A Project Support Working Group (PAG) was set up at the start of the advisory project. It was made up of Länder representatives and representatives of the various ministries. The PAG members provided feedback on the progress of the project and to some extent facilitated project support contacts with staff from their institutions. The composition of the group remained virtually identical throughout the entire project. A total of six meetings were held: in March 2009, October 2009, March 2010, November 2010, May 2011 and July 2012. No further meetings of the PAG were held after that, since the basic features of the project as a whole were clear by that time, and the issues arising in connection with indicator development had become so specific that they could only be discussed with the relevant technical experts.
Mini-groups:
Since exchange of information between the experts appeared important for the development of the indicators on the action fields, mini-groups with representatives of various governmental and non-governmental institutions were formed in the first year of the project. With few exception, the mini-groups were formed by members of the PAG, who suggested colleagues who might take part and in some cases approached them themselves.
In the course of the project the mini-groups sometimes came to several meetings, and after that they took part in telephone conferences. In some cases the composition of these groups changed during the project, as additional topics were identified that called for specific expert knowledge. In many cases cooperation between the members of the mini-groups was stepped up as a result of bilateral discussions between the group meetings.
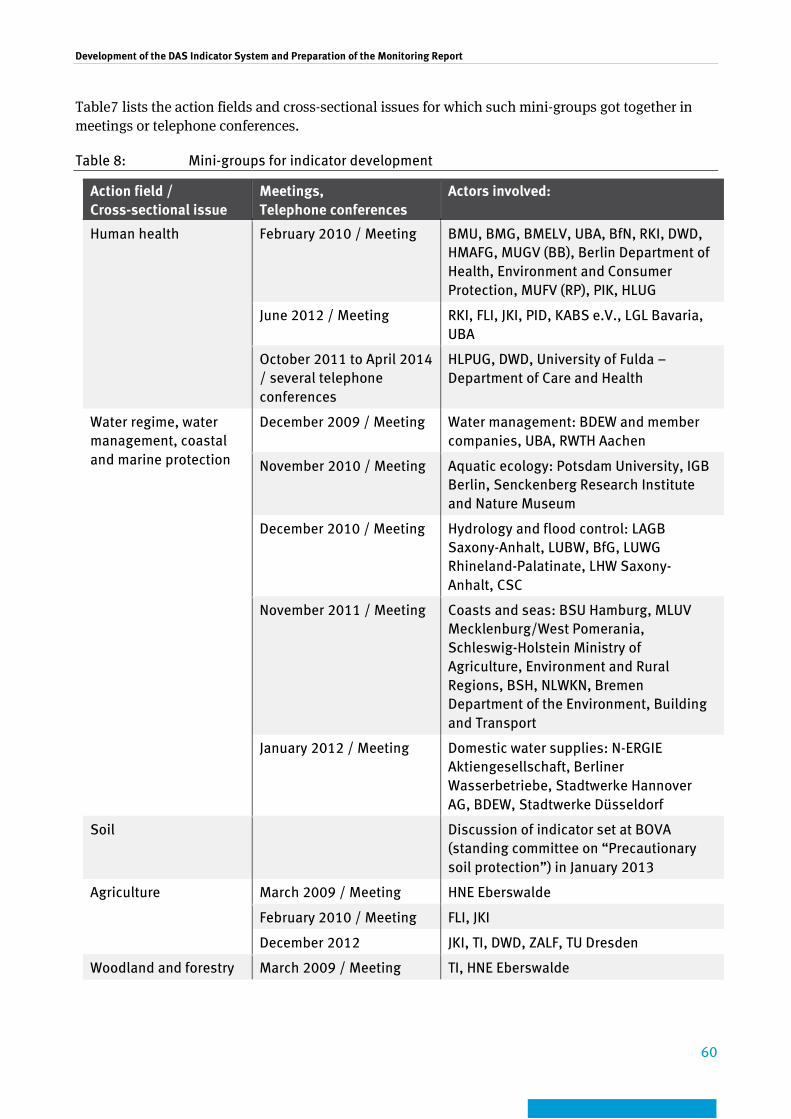
Development of the DAS Indicator System and Preparation of the Monitoring Report
60
Table7 lists the action fields and cross-sectional issues for which such mini-groups got together in meetings or telephone conferences.
Table 8: Mini-groups for indicator development
Action field / Cross-sectional issue
Meetings, Telephone conferences
Actors involved:
Human health February 2010 / Meeting BMU, BMG, BMELV, UBA, BfN, RKI, DWD, HMAFG, MUGV (BB), Berlin Department of Health, Environment and Consumer Protection, MUFV (RP), PIK, HLUG
June 2012 / Meeting RKI, FLI, JKI, PID, KABS e.V., LGL Bavaria, UBA
October 2011 to April 2014 / several telephone conferences
HLPUG, DWD, University of Fulda – Department of Care and Health
Water regime, water management, coastal and marine protection
December 2009 / Meeting Water management: BDEW and member companies, UBA, RWTH Aachen
November 2010 / Meeting Aquatic ecology: Potsdam University, IGB Berlin, Senckenberg Research Institute and Nature Museum
December 2010 / Meeting Hydrology and flood control: LAGB Saxony-Anhalt, LUBW, BfG, LUWG Rhineland-Palatinate, LHW Saxony-Anhalt, CSC
November 2011 / Meeting Coasts and seas: BSU Hamburg, MLUV Mecklenburg/West Pomerania, Schleswig-Holstein Ministry of Agriculture, Environment and Rural Regions, BSH, NLWKN, Bremen Department of the Environment, Building and Transport
January 2012 / Meeting Domestic water supplies: N-ERGIE Aktiengesellschaft, Berliner Wasserbetriebe, Stadtwerke Hannover AG, BDEW, Stadtwerke Düsseldorf
Soil Discussion of indicator set at BOVA (standing committee on “Precautionary soil protection”) in January 2013
Agriculture March 2009 / Meeting HNE Eberswalde
February 2010 / Meeting FLI, JKI
December 2012 JKI, TI, DWD, ZALF, TU Dresden
Woodland and forestry March 2009 / Meeting TI, HNE Eberswalde
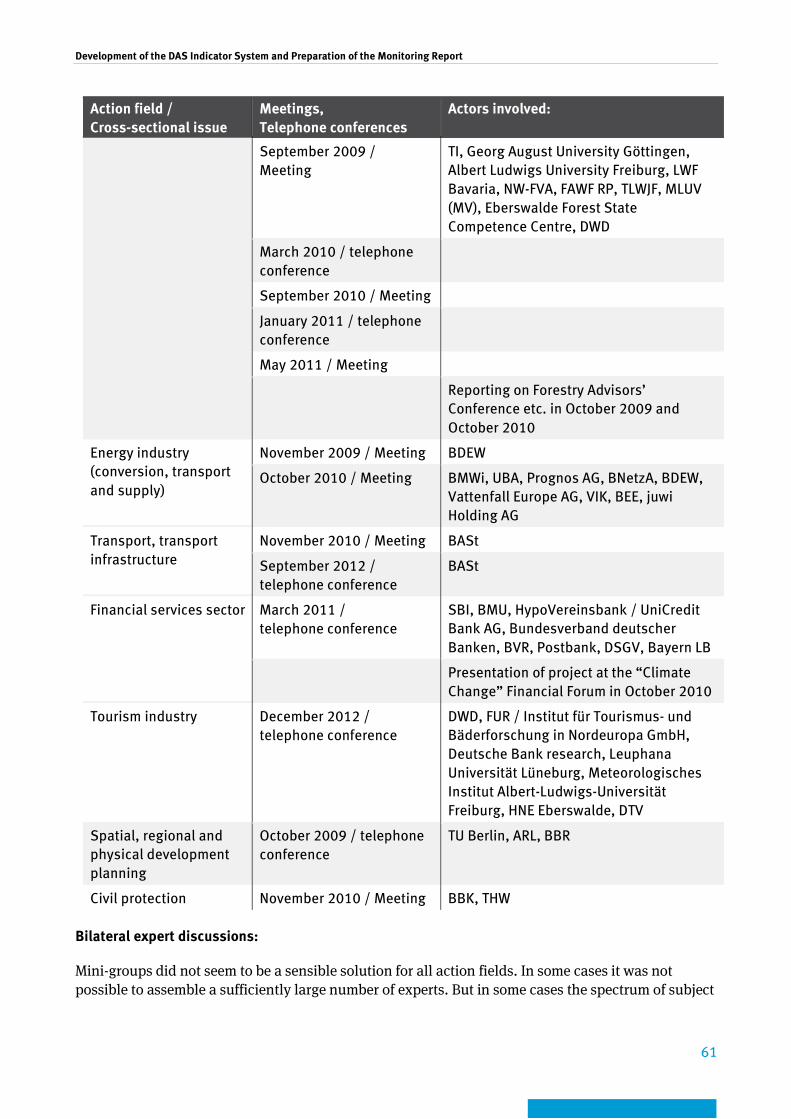
Development of the DAS Indicator System and Preparation of the Monitoring Report
61
Action field / Cross-sectional issue
Meetings, Telephone conferences
Actors involved:
September 2009 / Meeting
TI, Georg August University Göttingen, Albert Ludwigs University Freiburg, LWF Bavaria, NW-FVA, FAWF RP, TLWJF, MLUV (MV), Eberswalde Forest State Competence Centre, DWD
March 2010 / telephone conference
September 2010 / Meeting
January 2011 / telephone conference
May 2011 / Meeting
Reporting on Forestry Advisors’ Conference etc. in October 2009 and October 2010
Energy industry (conversion, transport and supply)
November 2009 / Meeting BDEW
October 2010 / Meeting BMWi, UBA, Prognos AG, BNetzA, BDEW, Vattenfall Europe AG, VIK, BEE, juwi Holding AG
Transport, transport infrastructure
November 2010 / Meeting BASt
September 2012 / telephone conference
BASt
Financial services sector March 2011 / telephone conference
SBI, BMU, HypoVereinsbank / UniCredit Bank AG, Bundesverband deutscher Banken, BVR, Postbank, DSGV, Bayern LB
Presentation of project at the “Climate Change” Financial Forum in October 2010
Tourism industry December 2012 / telephone conference
DWD, FUR / Institut für Tourismus- und Bäderforschung in Nordeuropa GmbH, Deutsche Bank research, Leuphana Universität Lüneburg, Meteorologisches Institut Albert-Ludwigs-Universität Freiburg, HNE Eberswalde, DTV
Spatial, regional and physical development planning
October 2009 / telephone conference
TU Berlin, ARL, BBR
Civil protection November 2010 / Meeting BBK, THW
Bilateral expert discussions:
Mini-groups did not seem to be a sensible solution for all action fields. In some cases it was not possible to assemble a sufficiently large number of experts. But in some cases the spectrum of subject

Development of the DAS Indicator System and Preparation of the Monitoring Report
62
matter to be addressed within the action fields was so broad that very specific discussions were needed. Here mini-groups would in any case have broken down into bilateral expert discussions.
In the course of the indicator project, large numbers of bilateral discussions were held with experts on the individual action fields and themes. The specific contributions by the experts consisted in discussing indication ideas, supplying data, calculating indicators and playing an active part in the preparation and correction of indicator and data fact sheets.
Workshops:
To ensure the technical reliability of the procedure for the indicator development and interim results in a fairly large group, two expert workshops were held during the indicator project. The first workshop at the UBA in Berlin in June 2009 marked the beginning of the broad involvement of experts in the process of indicator development. The workshop was attended by more than 40 experts from a wide range of disciplines. They primarily discussed the key themes for indicator development and made specific contributions to prioritisation of the indication fields (see Section 2.2.2). In mid-July 2011 the second workshop was held at the UBA in Dessau, with nearly 50 individuals taking part from federal and Länder authorities, associations and scientific institutions. They assessed the indicator system developed thus far on the basis of criteria such as comprehensibility and relevance.
A critical review of the two workshops reveals that especially the first workshop on prioritisation of the indication fields provided substantial input for the subsequent work. The second workshop primarily served to inform the participants. It did not provide much inspiration for further work. This was probably due to the fact that by this time the discussion about the indicators had already reached a highly technical level and the workshop participants were only able to make detailed judgements for their own restricted field of work.
2.3.3 Project steering
The broad spectrum of themes and the resulting extensive involvement called for firm project steering and clear orientation of the work to the common goal.
In view of the extremely broad spectrum of topics on the one hand, but also because of the sometimes highly specific technical discussions, dealing with the individual themes regularly called for a certain time for familiarisation. From the point of view of project steering and processing it therefore seemed efficient from time to time to set a clear focus for processing and temporarily suspend the work on other action fields and cross-sectional issues. Lengthy breaks in the work on certain themes also occurred as a result of the need for technical and political coordination, and time had to be allowed for such interruptions.
A well structured and carefully managed filing system proved extremely useful for keeping track of suspended work, especially in the case of email contacts (messages received and sent), not least for reminding people about requests for input or contributions already promised by participants. Furthermore, the precise documentation of all background information on the indicators and data sources supported the direct resumption of work after a break.
The project contractors used a very small team for the work on the project. Only in the first phase of the project up to mid-2010 was processing of the action fields “Soil” and “Biological diversity” assigned to HNE Eberswalde. After that, responsibility for the action field “Biological diversity” was handed over to the BfN (see Section 2.2). From mid-2010 onwards, work on the action field “Water regime, water management, coastal and marine protection“ was in the hands of Ecologic-Institut / Berlin, but was also jointly steered by Bosch & Partner GmbH to ensure that this action field also complied with the standards established for all action fields. At Bosch & Partner GmbH only two, or from time to time three, persons worked on the project. Responsibility for dealing with the action
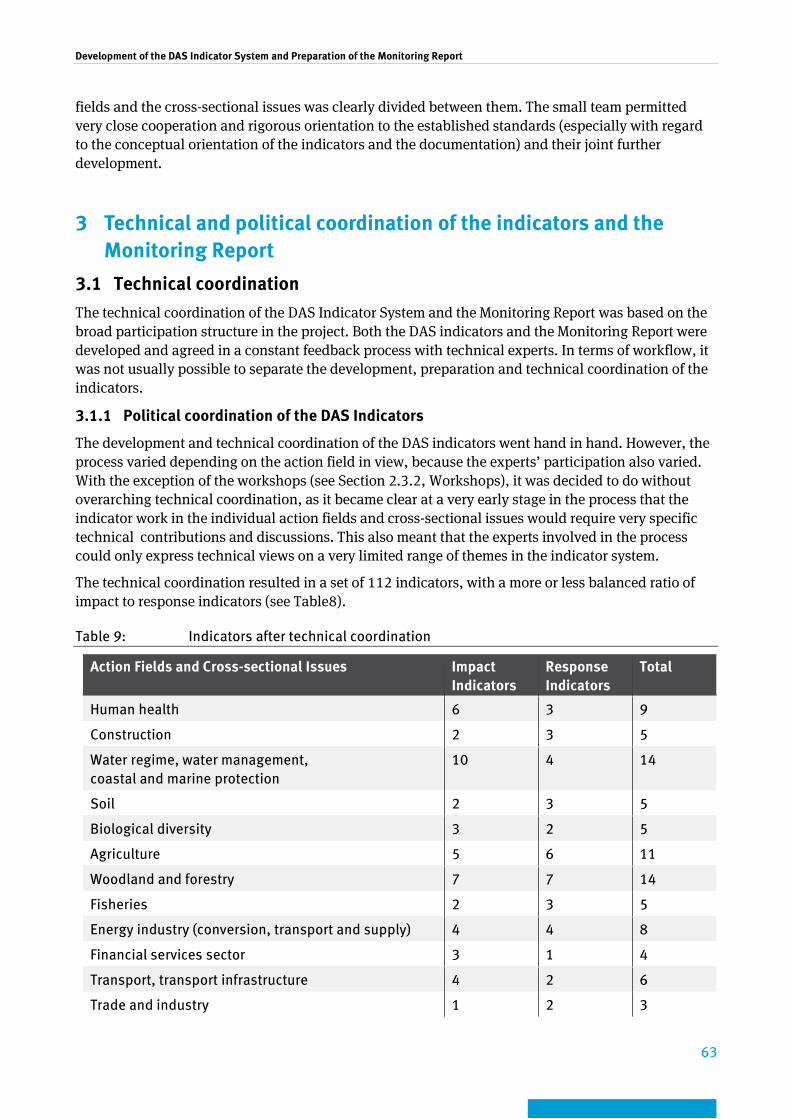
Development of the DAS Indicator System and Preparation of the Monitoring Report
63
fields and the cross-sectional issues was clearly divided between them. The small team permitted very close cooperation and rigorous orientation to the established standards (especially with regard to the conceptual orientation of the indicators and the documentation) and their joint further development.
3 Technical and political coordination of the indicators and the Monitoring Report
3.1 Technical coordination The technical coordination of the DAS Indicator System and the Monitoring Report was based on the broad participation structure in the project. Both the DAS indicators and the Monitoring Report were developed and agreed in a constant feedback process with technical experts. In terms of workflow, it was not usually possible to separate the development, preparation and technical coordination of the indicators.
3.1.1 Political coordination of the DAS Indicators
The development and technical coordination of the DAS indicators went hand in hand. However, the process varied depending on the action field in view, because the experts’ participation also varied. With the exception of the workshops (see Section 2.3.2, Workshops), it was decided to do without overarching technical coordination, as it became clear at a very early stage in the process that the indicator work in the individual action fields and cross-sectional issues would require very specific technical contributions and discussions. This also meant that the experts involved in the process could only express technical views on a very limited range of themes in the indicator system.
The technical coordination resulted in a set of 112 indicators, with a more or less balanced ratio of impact to response indicators (see Table8).
Table 9: Indicators after technical coordination
Action Fields and Cross-sectional Issues Impact Indicators
Response Indicators
Total
Human health 6 3 9
Construction 2 3 5
Water regime, water management, coastal and marine protection
10 4 14
Soil 2 3 5
Biological diversity 3 2 5
Agriculture 5 6 11
Woodland and forestry 7 7 14
Fisheries 2 3 5
Energy industry (conversion, transport and supply) 4 4 8
Financial services sector 3 1 4
Transport, transport infrastructure 4 2 6
Trade and industry 1 2 3
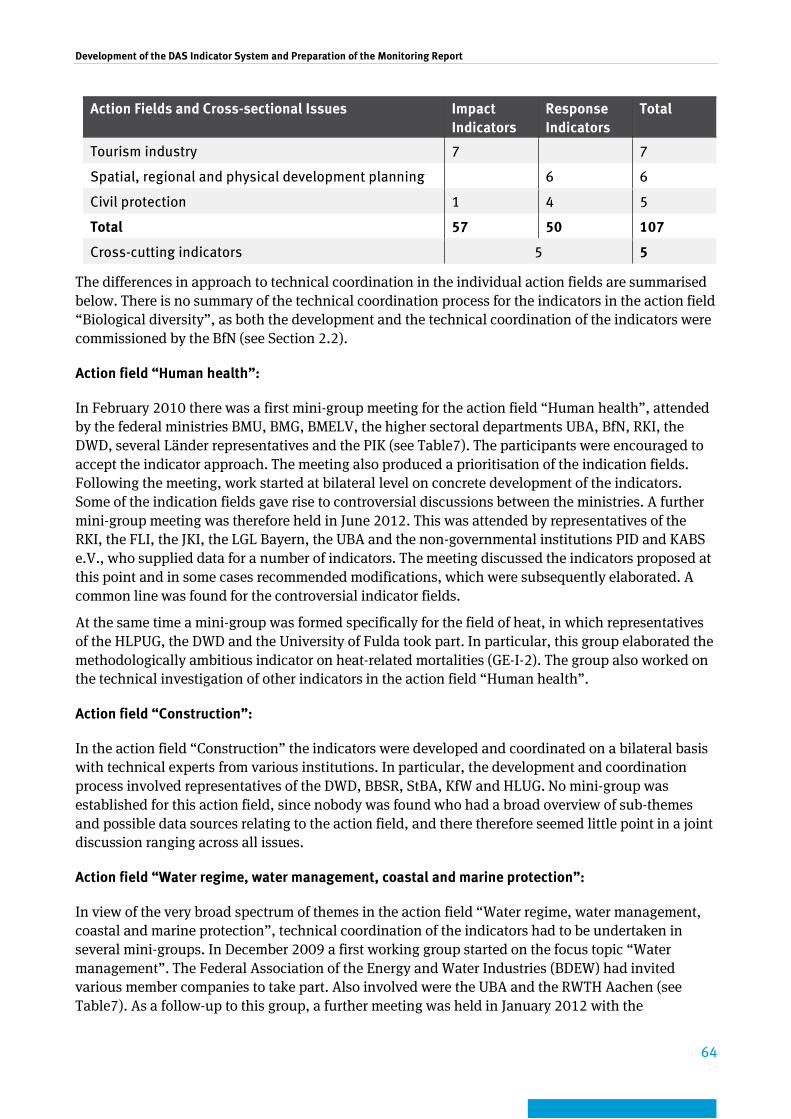
Development of the DAS Indicator System and Preparation of the Monitoring Report
64
Action Fields and Cross-sectional Issues Impact Indicators
Response Indicators
Total
Tourism industry 7 7
Spatial, regional and physical development planning 6 6
Civil protection 1 4 5
Total 57 50 107
Cross-cutting indicators 5 5
The differences in approach to technical coordination in the individual action fields are summarised below. There is no summary of the technical coordination process for the indicators in the action field “Biological diversity”, as both the development and the technical coordination of the indicators were commissioned by the BfN (see Section 2.2).
Action field “Human health”:
In February 2010 there was a first mini-group meeting for the action field “Human health”, attended by the federal ministries BMU, BMG, BMELV, the higher sectoral departments UBA, BfN, RKI, the DWD, several Länder representatives and the PIK (see Table7). The participants were encouraged to accept the indicator approach. The meeting also produced a prioritisation of the indication fields. Following the meeting, work started at bilateral level on concrete development of the indicators. Some of the indication fields gave rise to controversial discussions between the ministries. A further mini-group meeting was therefore held in June 2012. This was attended by representatives of the RKI, the FLI, the JKI, the LGL Bayern, the UBA and the non-governmental institutions PID and KABS e.V., who supplied data for a number of indicators. The meeting discussed the indicators proposed at this point and in some cases recommended modifications, which were subsequently elaborated. A common line was found for the controversial indicator fields.
At the same time a mini-group was formed specifically for the field of heat, in which representatives of the HLPUG, the DWD and the University of Fulda took part. In particular, this group elaborated the methodologically ambitious indicator on heat-related mortalities (GE-I-2). The group also worked on the technical investigation of other indicators in the action field “Human health”.
Action field “Construction”:
In the action field “Construction” the indicators were developed and coordinated on a bilateral basis with technical experts from various institutions. In particular, the development and coordination process involved representatives of the DWD, BBSR, StBA, KfW and HLUG. No mini-group was established for this action field, since nobody was found who had a broad overview of sub-themes and possible data sources relating to the action field, and there therefore seemed little point in a joint discussion ranging across all issues.
Action field “Water regime, water management, coastal and marine protection”:
In view of the very broad spectrum of themes in the action field “Water regime, water management, coastal and marine protection”, technical coordination of the indicators had to be undertaken in several mini-groups. In December 2009 a first working group started on the focus topic “Water management”. The Federal Association of the Energy and Water Industries (BDEW) had invited various member companies to take part. Also involved were the UBA and the RWTH Aachen (see Table7). As a follow-up to this group, a further meeting was held in January 2012 with the

Development of the DAS Indicator System and Preparation of the Monitoring Report
65
participation of the BDEW, N-ERGIE Aktiengesellschaft, Berliner Wasserbetriebe, Stadtwerke Hannover AG and Stadtwerke Düsseldorf.
In November 2010 a mini-group meeting was held on the focus topic “Aquatic ecology” involving the University of Potsdam, IGB Berlin and the Senckenberg Research Institute Frankfurt, and in December 2010 a mini-group meeting on the focus topic “Hydrology and flood control” with the LAGB Saxony-Anhalt, LUBW, BfG, LUWG Rhineland-Palatinate, LHW Saxony-Anhalt and the CSC. In November 2012 a mini-meeting group was held on “Coastal and marine protection”, with representatives of BSH Hamburg, MLUV Mecklenburg/West Pomerania, the Schleswig-Holstein Ministry of Agriculture, Environment and Rural Regions (now the Ministry for Energy Transition, Agriculture, Environment and Rural Regions), BSH, NLWKN and the Bremen Department of the Environment, Building and Transport. Between the meetings, concrete elaboration of the indicators was pursued by the Ecologic-Institut in bilateral consultation with the experts.
Action field “Soil”:
The initial work on the action field “Soil”, for which the HNE Eberwalde (Institute for Landscape Use and Nature Conservation) was responsible, had a strong focus on the key research and work areas of the HNE and thus on the state of Brandenburg and the data situation prevailing there. More extensive inclusion of expert opinions was sought in 14 discussions with experts from various soil research establishments who were consulted by the HNE about the effect of climate change impacts on soil properties and functions. Following this preliminary work, further development of the indicators in the action field “Soil” was taken over by Bosch & Partner GmbH and strongly geared to the prioritised indication fields and nationwide data availability. The indicators were developed in bilateral cooperation with experts from the DWD ZAMF, the Technical Institute for Agricultural Climate Action and the UBA. At the end of January 2013 the indicator set for the action field “Soil” was submitted to BOVA (Standing committee on “Precautionary soil protection” of the Joint Soil Commission of the Federal States) for final technical coordination. The Länder ministries responsible for soil protection are represented on this committee. They submitted technical comments which were considered and processed before the documents went forward to the political coordination process. As a result of these comments, an additional indicator (case study) on soil erosion (BO-I-2) was included in the indicator set to ensure that this important topic was integrated in the Monitoring Report.
Action field “Agriculture”
Various mini-group meetings were held on the action field “Agriculture”. The involvement of technical experts began in March 2009 with a small expert discussion at HNE Eberswalde to delimit the indication fields. In February 2010 two expert discussions with representatives of the FLI on livestock management and representatives of the JKI on crop growing made further revisions to the indication fields and specified the indicator potential in greater detail. In December 2012, after data searches and the elaboration of initial indicator proposals, a further mini-group meeting was held at the JKI in Braunschweig with representatives of the JKI, the Technical Institute for Rural Districts, the DWD ZAMF, the ZALF and the Technical University of TU Dresden (see Table7). The meeting discussed the proposed indicators. Modifications were suggested in individual cases, and after the meeting these were implemented and agreed at bilateral level.
Action field “Woodland and forestry”:
A first small group of experts on the action field “Woodland and forestry” met in March 2009 and included representatives of the Institute of Forest Ecosystems and HNE Eberswalde. It undertook a first critical consideration of the indication fields. It was followed by the formation of a mini-group

Development of the DAS Indicator System and Preparation of the Monitoring Report
66
chaired by the Institute of Forest Ecosystems, which provided advice on indicator development and support in the form of practical papers throughout the entire duration of the project. The first meeting of this mini-group was held in Göttingen in September 2009 (for participants, see Table7). This meeting made further modifications to the indication fields and their prioritisation. Further meetings and phone conferences were held in 2010 and 2011. In the intervals between meetings the indicators were elaborated in bilateral cooperation. In addition to the members of the mini-group, this also involved the JKI, BLE and the BMELV / BMEL. Before the indicators were submitted for political coordination, the DAS mini-group on “Woodland and forestry” was given a further opportunity to comment on the entire set of indicators.
From October 2009 onwards, the regular meetings of the Joint Federal and Länder Forestry Advisors’ Conference were also kept informed about the development of indicators in the action field “Woodland and forestry”. Its representatives commented on the indicator set and made suggestions. The close participation at Länder level and the early technical involvement of the BMELV / BMEL (Division 535 Sustainable Forest Management, Timber Market) created a very good basis for political acceptance of the indicators as well.
Action field “Fisheries”:
Work on the action field “Fisheries” did not start until fairly late in the project. One reason for this was the fact that the BfN had announced an indicator on “Sustainable fisheries” (marine fisheries) to supplement the NBS indicator set and recommended including this in the DAS indicator set. However, this did not materialise by the end of the indicator project. To make it possible to propose DAS indicators nonetheless, various indication ideas relating to the prioritised indication fields were discussed with the relevant Technical Institutes for Baltic Sea Fisheries and for Marine Fisheries from 2010 onwards, and finally four indicators were developed in bilateral cooperation with the two TIs and the MSC Secretariat. The mini-group originally envisaged, consisting of the BfN and the relevant TIs for Baltic Sea Fisheries and Marine Fisheries, did not come about. Three of these four indicators were then deleted from the DAS Indicator System again during the political consultation process (see Section 3.2.1).
In the case of inland fisheries, the indication options were first discussed with the TI for Fisheries Ecology. However, as the natural geographical situation, historical developments and climatic factors in the Länder display great variations, and since legislative competence for inland fisheries rests with the Länder, the development of the industry and its administrative structures differ greatly from one Land to another. The Länder do not have any obligations to report to the federal authorities, and consequently there is no central database at federal level. The Institute for Inland Fisheries regularly prepares the annual report on German Inland Fisheries, which brings together data from the fisheries authorities of the Länder, the state fisheries institutions, the BMEL, the BLE and the StBA. A bilateral exchange with the Institute for Inland Fisheries made it clear why there is currently no point in developing indicators in the response sector in particular. A case study for the impact level was developed jointly with the Baden-Württemberg Fisheries Research Establishment at the LAZBW.
Action field “Energy industry (conversion, transport and supply)”:
The indication fields and sub-themes were first agreed in a bilateral discussion with a professor at the University of Rottenburg, who had specific references in the field of climate change impacts and was a member of the PAG. In November 2009 a two-day workshop was held with representatives of the BDEW in Berlin to discuss indication ideas for the action field “Energy industry (conversion, transport and supply)” (see Table7). In the course of this workshop, indication ideas were prioritised for further processing. In October 2010, with organisational assistance from the BMWi, a meeting
Development of the DAS Indicator System and Preparation of the Monitoring Report
67
with representatives of the ministry, associations, (energy supply) companies, the Federal Network Agency (BNetzA) and the UBA was held to discuss and agree the indication ideas and especially the prioritisation of further work on the indicators. On the basis of the results of this meeting, the ideas were developed in bilateral discussions in the further course of the project and elaborated in the form of concrete indicator proposals.
Action field “Financial services sector”:
Work on the action field “Financial services sector” began in mid-2009 and started with a discussion lasting several hours with an expert from Münchener Rückversicherungs-Gesellschaft (in October 2009) and an expert from the German Insurance Industry Association (Gesamtverband der Deutschen Versicherungswirtschaft (GDV)) (in February 2010). The indicators in the insurance field were drawn up on the basis of the GDV data and in technical consultation with the association, as very specific technical information was needed to understand the terms and definitions and the interpretation of the data.
Development of the indicators with the banking sector proved difficult. During the period October 2010 to January 2011 the project contractor conducted a written survey of the major financial services providers (excluding insurance companies) in Germany. The aim of the survey was to obtain, as a first step, a picture of the priorities that the financial services providers currently attached to the field of adaptation to climate change in the context of their business activities and the basic approaches they saw for the development of (quantifiable) indicators for the DAS Monitoring Report. The responses to the questionnaire were then evaluated and sent to the participants for comment. In March 2011 the conclusions and further practical steps were discussed and agreed in a telephone conference with seven representatives of banks, the BMU and the Sustainable Business Institute, which had also supported the survey. The discussions ultimately resulted in the realisation that there were currently no concrete approaches to an indicator-based embodiment of climate change impacts for the banking industry and responses by the banking sector. The details of the investigations and reasons were recorded in the background paper (see Appendix 1).
Action field “Transport, transport infrastructure”:
The development of indication ideas and the discussion of possible data sources for the action field “Transport, transport infrastructure” initially took place mainly on a bilateral basis with representatives of the data source institutions and the relevant sectoral authorities. After extensive preliminary work, various indication ideas for the field of road transport were first discussed with representatives of the Federal Statistical Office (BASt) at a joint meeting in November 2010 (see Table7). This agreed on the relevant indicators for further development. The practical elaboration of the indicators was then undertaken in bilateral consultations with the relevant experts from the BASt. Owing to changes in responsibility within the BASt, the documents were also presented in an additional telephone conference in September 2012, and agreement was reached on the further procedure for the indicators on road transport.
Discussion and coordination of the indication ideas and indicators for the field of shipping took place in bilateral contacts and meetings. These consultations also involved representatives of the BfG’s KLIWAS project. Moreover, the options for describing the low-water issues affecting inland waterway shipping were discussed at the mini-group meeting on hydrology and flood control in the context of the action field “Water regime, water management, coastal and marine protection”.
Discussion of possible data sources for the field of rail transport were held at bilateral level with representatives of the Federal Railway Office (EBA) and Deutsche Bahn AG, but did not lead to the development of relevant indicators.
Development of the DAS Indicator System and Preparation of the Monitoring Report
68
Action field “Trade and industry”:
Discussions and consultations on the indication fields for the action field “Trade and industry” initially took place on a bilateral level with adelphi research Berlin and the Munich and Upper Bavaria Chamber of Industry and Commerce. On the basis of the indication fields discussed, the development of indicators and the discussion of data sources then proceeded entirely at bilateral level. The technical development and coordination process involved representatives of the BAuA, DIN and the ISO Central Secretariat in particular. The involvement of the DIHK was impeded by a change of responsibility and did not take place to the extent originally envisaged.
Action field “Tourism industry”:
The technical development and consultation process for the indicators in the action field “Tourism industry” was initially based on bilateral contacts with technical experts from DWD and StBA and from the Holiday and Travel Research Association (FUR), the German Cable Railways Association (VDS) and the German Ski Association (DSV). Practical participation by the experts consisted in discussing indication ideas, clarifying data sources, supplying data, calculating indicators and coordinating indicator documentation. This process also included consideration of the research projects which had been in progress for several years on the impacts of climate change on individual tourism regions, but which had not yet yielded any datasets or indicators for the federal level.
On the basis of the five indicator proposals elaborated in bilateral cooperation, a mini-group phone conference was held in December 2012 with representatives of DWD, FUR and the Institute for Tourism and Bathing Resort Research in Northern Europe, Deutsche Bank research, Leuphana Universität Lüneburg, the Meteorological Institute of the Albert Ludwigs University of Freiburg, HNE Eberswalde and the German Tourism Association to discuss not only the individual indicators, but also the indicator set as a whole (see Table7). The results of the phone conference were implemented in the further development of the indicators and the inclusion of new indicators for the coastal region.
Cross-sectional issue “Spatial, regional and physical development planning”:
In October 2009, at the start of the indicator development and coordination process for the cross-sectional issue “Spatial, regional and physical development planning”, the action options for spatial, regional and physical development planning in the context of adaptation to climate change and the relevant indication options were discussed in a phone conference with representatives of the BBSR, the Technical University of Berlin (Institute of Landscape Architecture and Environmental Planning, Landscape Planning Department) and the ARL (see Table7). On the basis of the results of this phone conference, indicators were then elaborated in bilateral cooperation, with the participation of the BBSR, DWD, LfU, HLUG and LBEG.
Cross-sectional issue “Civil protection”:
The work on the cross-sectional issue “Civil protection” was initially based on bilateral contacts with technical experts from the BBK and THW. On the basis of the indication ideas developed during the preliminary work, a mini-group meeting was held in November 2010 to continue discussing and developing these ideas with representatives of the BBK and THW. On the basis of the results of the meeting, the indicators were subsequently elaborated in bilateral cooperation with the BBK, THW and DFV. The various assistance organisations and other actors in the civil protection sector (e.g. fire brigades) were involved in the project work in the field of indicator development and data searches.
Development of the DAS Indicator System and Preparation of the Monitoring Report
69
3.1.2 Technical agreement of the Monitoring Report
Once the indicator sets for the action fields had passed at least the first stage of political consultation in the ministries, work started on drafting the Monitoring Report (see also Sections 1.2.4 and 2.2.5). The draft explanatory texts on the individual indicators were produced by the project contractor and agreed with the technical experts who had been involved in developing the relevant indicators and/or had played a direct practical part in their development. Since the content of the explanatory texts on the indicators – in line with the concept of the report – occasionally extended beyond the scope of the indicators described, it was sometimes necessary to involve a broader circle of experts in the discussion of the texts. Where possible, the mini-groups were used for technical feedback on the texts (see Section 2.3.2).
The elaboration and technical coordination of the texts was a continuous process, which proceeded in parallel for some of the action fields.
3.2 Political consultation The aim of the political consultations on the DAS indicator set and the Monitoring Report was to coordinate this system with the sectoral policies of the ministries and thereby gain political acceptance for both products. The close cooperation with the higher-level departments prior to the political consultations had essentially created a good basis for securing political agreement from the ministries to the technical results. In some cases the political consultations led to further individual suggestions for technical modifications.
The political consultation process took place in two steps. First the indicator system was agreed, then the Monitoring Report, which was based on the politically coordinated indicators. The process of political coordination began in August 2012 and was completed in November 2014, i.e. shortly before the end of the indicator project.
Both the federal and Länder ministries were involved in the political consultations. Although central responsibility for the DAS rests with the federal level and the DAS Indicator System is the central reporting instrument for reporting by the federal level, the Länder were also given the opportunity of stating their views on the indicator set and thus on the thematic focus, and drawing attention where necessary to potential conflicts that might arise in coordination with Länder policies. This was a matter of special relevance because the Länder have extensive responsibilities in several of the fields dealt with in the DAS. The subsequent political coordination of the Monitoring Report itself was handled exclusively in contact with the federal ministries through the inter-ministerial committee on Adaptation Strategy (IMA Anpassungsstrategie).
3.2.1 Political coordination of the DAS indicators
The DAS Indicators were agreed among government departments at both federal and Länder level. The inter-departmental agreements were negotiated via the IMA and the negotiations with the Länder were carried out via the AFK (see Section 2.3.2). This process extended over two phases: initially, agreement was reached on the indicator sets for the individual action fields. Finally, the revised version of the entire set of indicators was submitted to the IMA (see Fig. 7). The Länder were only involved in the first stage of consultation.
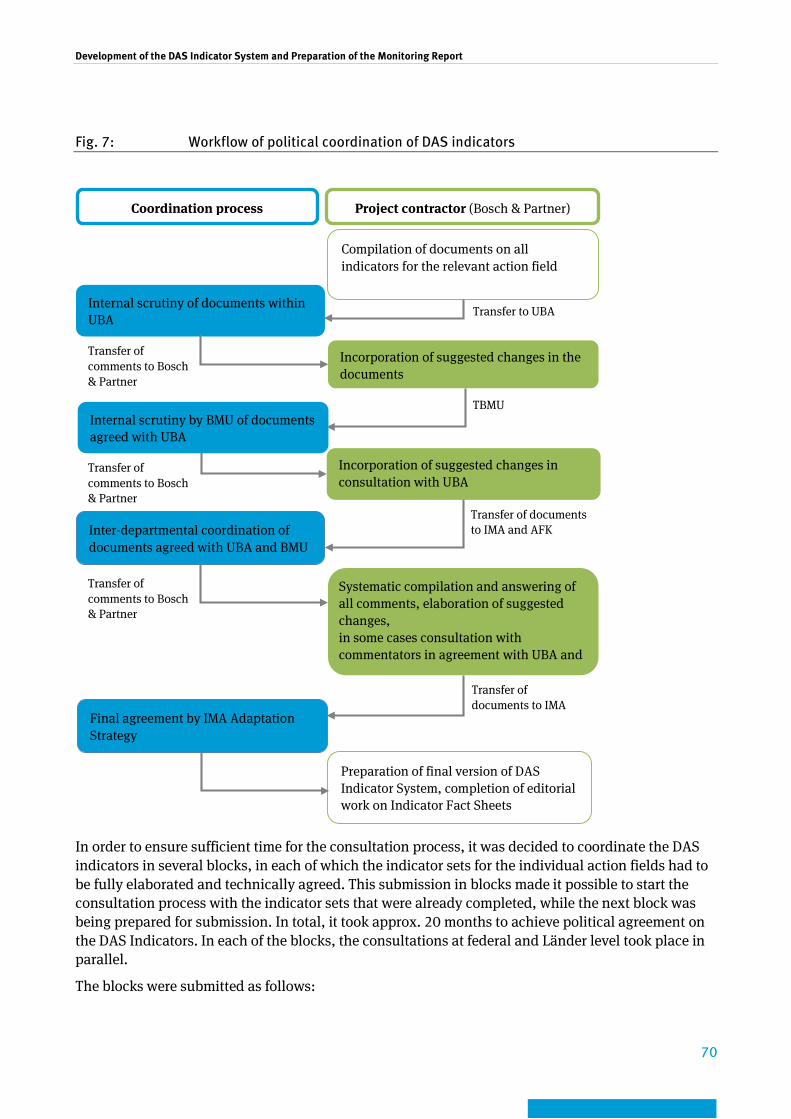
Development of the DAS Indicator System and Preparation of the Monitoring Report
70
Fig. 7: Workflow of political coordination of DAS indicators
In order to ensure sufficient time for the consultation process, it was decided to coordinate the DAS indicators in several blocks, in each of which the indicator sets for the individual action fields had to be fully elaborated and technically agreed. This submission in blocks made it possible to start the consultation process with the indicator sets that were already completed, while the next block was being prepared for submission. In total, it took approx. 20 months to achieve political agreement on the DAS Indicators. In each of the blocks, the consultations at federal and Länder level took place in parallel.
The blocks were submitted as follows:
Compilation of documents on all indicators for the relevant action field
Internal scrutiny of documents within UBA
Transfer to UBA
Incorporation of suggested changes in the documents
Internal scrutiny by BMU of documents agreed with UBA
TBMU
Incorporation of suggested changes in consultation with UBA
Inter-departmental coordination of documents agreed with UBA and BMU
Transfer of documents to IMA and AFK
Systematic compilation and answering of all comments, elaboration of suggested changes, in some cases consultation with commentators in agreement with UBA and
Transfer of comments to Bosch & Partner
Transfer of comments to Bosch & Partner
Transfer of comments to Bosch & Partner
Coordination process Project contractor (Bosch & Partner)
Preparation of final version of DAS Indicator System, completion of editorial work on Indicator Fact Sheets
Final agreement by IMA Adaptation Strategy
Transfer of documents to IMA
Development of the DAS Indicator System and Preparation of the Monitoring Report
71
▸ Block 1 – August 2012: Action fields “Construction”, “Woodland and forestry”, “Financial services sector”, “Civil protection”;
▸ Block 2 – February 2013: Action fields “Soil”, “Water regime, water management, coastal and marine protection”, “Energy industry (conversion, transport and supply)”, “Agriculture”, “Transport, transport infrastructure”, “Trade and industry”;
▸ Block 3 – July 2013: Action fields “Human health”, “Fisheries”, “Tourism industry”, “Spatial, regional and physical development planning”;
▸ Block 4 – January 2014: Action field “Biological diversity” and the “Overarching indicators”.
The questions to be answered in the political consultation process were as follows:
▸ Do the indicators adequately describe the main issues and action options within the relevant action fields?
▸ Are the focal themes correctly chosen? ▸ Are the proposed indicators relevant from a political point of view?
The documents submitted comprised:
▸ an introduction explaining the objectives of the DAS Indicators, the documents submitted and the standard commenting procedure;
▸ the background papers (see Section 1.2.3) for each action field as well as the indicator fact sheets for the indicators pertaining to the relevant action field;
▸ a commentary sheet for each action field.
In view of the large number of people involved, comments in the background papers and indicator fact sheets themselves were not permitted, in order to simplify compilation of the various comments. The documents were therefore made available in a non-editable PDF format, but with numbered lines. Comments had to be entered in the comment sheets by reference to the line numbers. The comment sheets comprised the following parts:
▸ A) Comments on background paper: The overarching questions for commenting on the background paper were: Do the indicators adequately describe the main issues and action options within the relevant action fields? Are the focal themes correctly chosen? Detailed comments on specific wording in the background paper were possible by reference to the line numbers.
▸ B) Comments on the indicator set for the action field as a whole: In a table provided in this part the commentators were asked to rate the political relevance of the individual indicators in the categories “high”, “medium” and “low”. There was also a field for free comments.
▸ C) Comments on the individual indicators: Here the participants were asked for differentiated comments on the descriptions in the individual fact sheets. The comments were to be entered in pre-structured tables by reference to the chapter/section number and the line numbers of the fact sheets.
The federal ministries and the Länder (in each case with their central responsible ministry) were asked to combine all comments received in a single comment sheet, i.e. to send back only one document. Most of them complied with this request.
This feedback in the form of comment sheets considerably simplified the systematic compilation of all comments received and the task of processing them in a clearly organised format. A summary sheet was prepared for each action field to provide an overview of all comment sheets received. All tables included an extra column for the project contractor to enter remarks on each individual
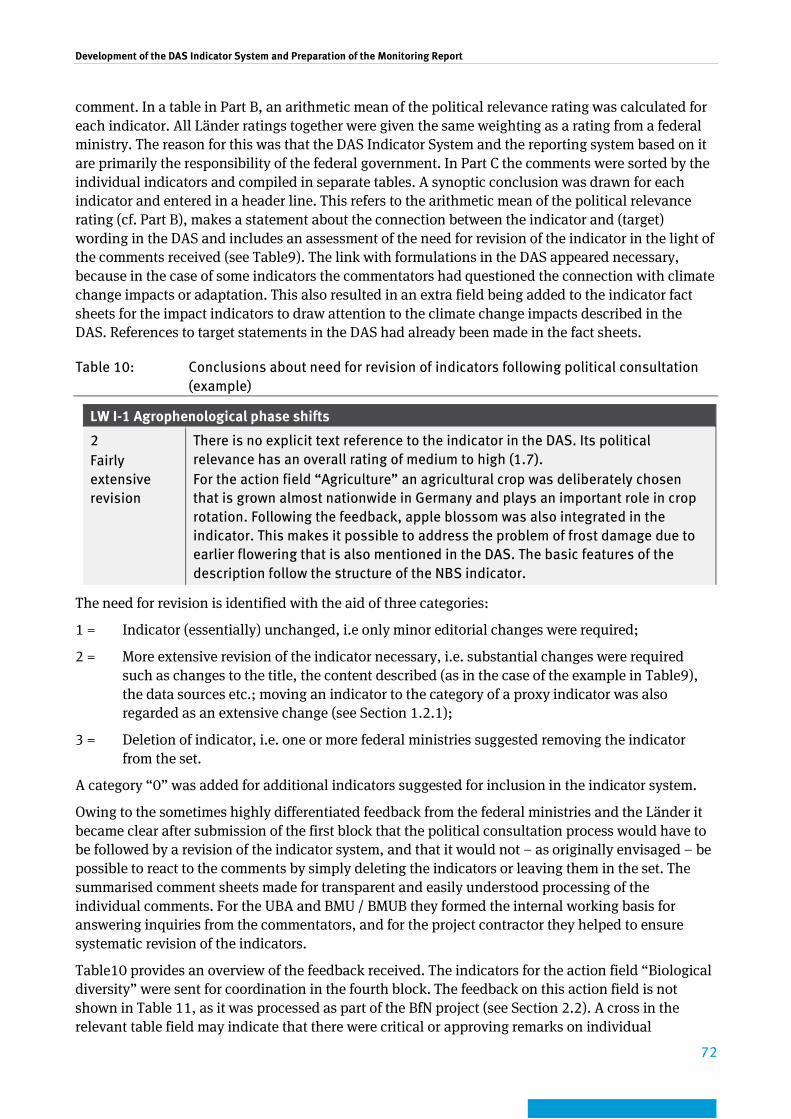
Development of the DAS Indicator System and Preparation of the Monitoring Report
72
comment. In a table in Part B, an arithmetic mean of the political relevance rating was calculated for each indicator. All Länder ratings together were given the same weighting as a rating from a federal ministry. The reason for this was that the DAS Indicator System and the reporting system based on it are primarily the responsibility of the federal government. In Part C the comments were sorted by the individual indicators and compiled in separate tables. A synoptic conclusion was drawn for each indicator and entered in a header line. This refers to the arithmetic mean of the political relevance rating (cf. Part B), makes a statement about the connection between the indicator and (target) wording in the DAS and includes an assessment of the need for revision of the indicator in the light of the comments received (see Table9). The link with formulations in the DAS appeared necessary, because in the case of some indicators the commentators had questioned the connection with climate change impacts or adaptation. This also resulted in an extra field being added to the indicator fact sheets for the impact indicators to draw attention to the climate change impacts described in the DAS. References to target statements in the DAS had already been made in the fact sheets.
Table 10: Conclusions about need for revision of indicators following political consultation (example)
LW I-1 Agrophenological phase shifts
2 Fairly extensive revision
There is no explicit text reference to the indicator in the DAS. Its political relevance has an overall rating of medium to high (1.7). For the action field “Agriculture” an agricultural crop was deliberately chosen that is grown almost nationwide in Germany and plays an important role in crop rotation. Following the feedback, apple blossom was also integrated in the indicator. This makes it possible to address the problem of frost damage due to earlier flowering that is also mentioned in the DAS. The basic features of the description follow the structure of the NBS indicator.
The need for revision is identified with the aid of three categories:
1 = Indicator (essentially) unchanged, i.e only minor editorial changes were required;
2 = More extensive revision of the indicator necessary, i.e. substantial changes were required such as changes to the title, the content described (as in the case of the example in Table9), the data sources etc.; moving an indicator to the category of a proxy indicator was also regarded as an extensive change (see Section 1.2.1);
3 = Deletion of indicator, i.e. one or more federal ministries suggested removing the indicator from the set.
A category “0” was added for additional indicators suggested for inclusion in the indicator system.
Owing to the sometimes highly differentiated feedback from the federal ministries and the Länder it became clear after submission of the first block that the political consultation process would have to be followed by a revision of the indicator system, and that it would not – as originally envisaged – be possible to react to the comments by simply deleting the indicators or leaving them in the set. The summarised comment sheets made for transparent and easily understood processing of the individual comments. For the UBA and BMU / BMUB they formed the internal working basis for answering inquiries from the commentators, and for the project contractor they helped to ensure systematic revision of the indicators.
Table10 provides an overview of the feedback received. The indicators for the action field “Biological diversity” were sent for coordination in the fourth block. The feedback on this action field is not shown in Table 11, as it was processed as part of the BfN project (see Section 2.2). A cross in the relevant table field may indicate that there were critical or approving remarks on individual
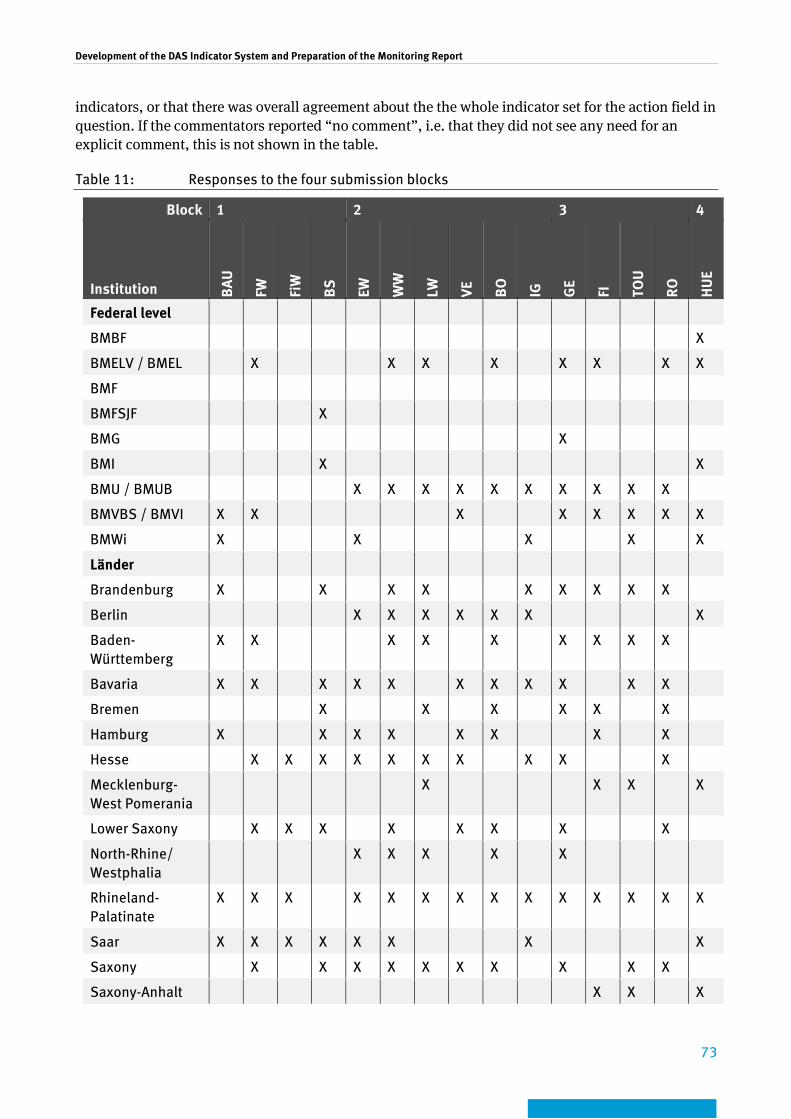
Development of the DAS Indicator System and Preparation of the Monitoring Report
73
indicators, or that there was overall agreement about the the whole indicator set for the action field in question. If the commentators reported “no comment”, i.e. that they did not see any need for an explicit comment, this is not shown in the table.
Table 11: Responses to the four submission blocks
Block 1 2 3 4
Institution BAU
FW
FiW
BS
EW
WW
LW
VE
BO
IG
GE
FI
TOU
RO
HU
E
Federal level
BMBF X
BMELV / BMEL X X X X X X X X
BMF
BMFSJF X
BMG X
BMI X X
BMU / BMUB X X X X X X X X X X
BMVBS / BMVI X X X X X X X X
BMWi X X X X X
Länder
Brandenburg X X X X X X X X X
Berlin X X X X X X X
Baden-Württemberg
X X X X X X X X X
Bavaria X X X X X X X X X X X
Bremen X X X X X X
Hamburg X X X X X X X X
Hesse X X X X X X X X X X
Mecklenburg-West Pomerania
X X X X
Lower Saxony X X X X X X X X
North-Rhine/ Westphalia
X X X X X
Rhineland-Palatinate
X X X X X X X X X X X X X X
Saar X X X X X X X X
Saxony X X X X X X X X X X
Saxony-Anhalt X X X
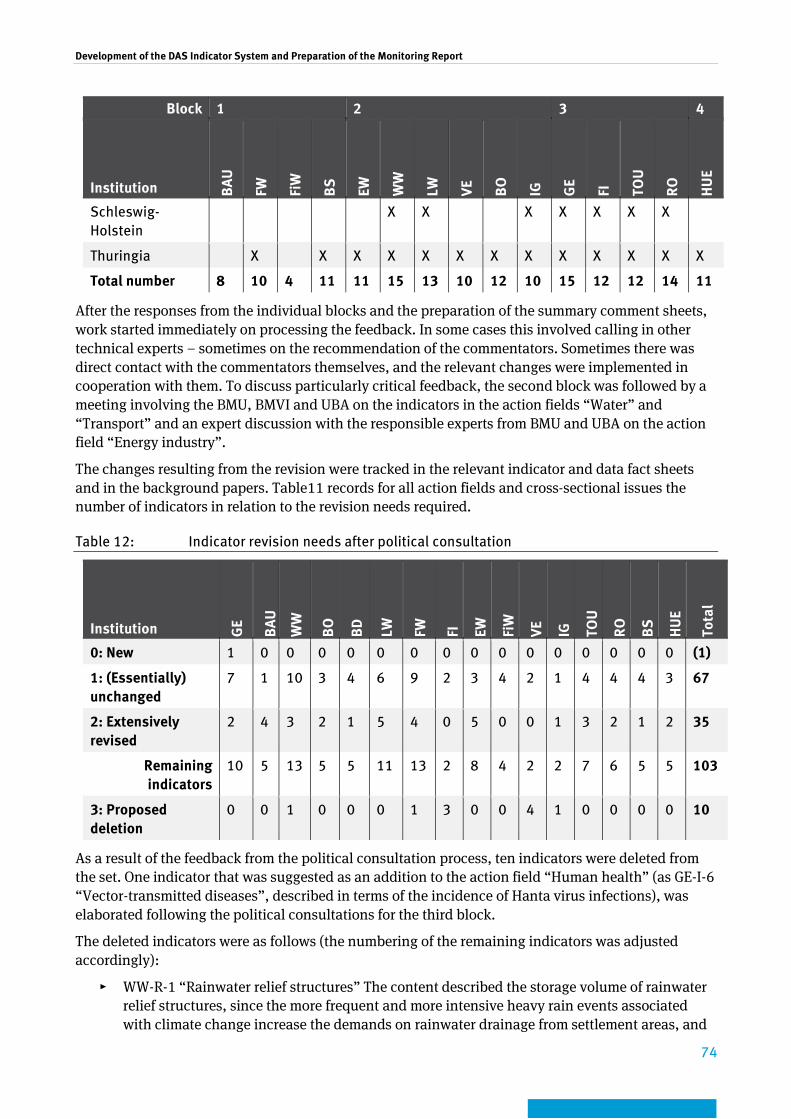
Development of the DAS Indicator System and Preparation of the Monitoring Report
74
Block 1 2 3 4
Institution BAU
FW
FiW
BS
EW
WW
LW
VE
BO
IG
GE
FI
TOU
RO
HU
E
Schleswig-Holstein
X X X X X X X
Thuringia X X X X X X X X X X X X X
Total number 8 10 4 11 11 15 13 10 12 10 15 12 12 14 11
After the responses from the individual blocks and the preparation of the summary comment sheets, work started immediately on processing the feedback. In some cases this involved calling in other technical experts – sometimes on the recommendation of the commentators. Sometimes there was direct contact with the commentators themselves, and the relevant changes were implemented in cooperation with them. To discuss particularly critical feedback, the second block was followed by a meeting involving the BMU, BMVI and UBA on the indicators in the action fields “Water” and “Transport” and an expert discussion with the responsible experts from BMU and UBA on the action field “Energy industry”.
The changes resulting from the revision were tracked in the relevant indicator and data fact sheets and in the background papers. Table11 records for all action fields and cross-sectional issues the number of indicators in relation to the revision needs required.
Table 12: Indicator revision needs after political consultation
Institution GE
BAU
WW
BO
BD
LW
FW
FI
EW
FiW
VE
IG
TOU
RO
BS
HU
E
Tota
l
0: New 1 0 0 0 0 0 0 0 0 0 0 0 0 0 0 0 (1)
1: (Essentially) unchanged
7 1 10 3 4 6 9 2 3 4 2 1 4 4 4 3 67
2: Extensively revised
2 4 3 2 1 5 4 0 5 0 0 1 3 2 1 2 35
Remaining indicators
10 5 13 5 5 11 13 2 8 4 2 2 7 6 5 5 103
3: Proposed deletion
0 0 1 0 0 0 1 3 0 0 4 1 0 0 0 0 10
As a result of the feedback from the political consultation process, ten indicators were deleted from the set. One indicator that was suggested as an addition to the action field “Human health” (as GE-I-6 “Vector-transmitted diseases”, described in terms of the incidence of Hanta virus infections), was elaborated following the political consultations for the third block.
The deleted indicators were as follows (the numbering of the remaining indicators was adjusted accordingly):
▸ WW-R-1 “Rainwater relief structures” The content described the storage volume of rainwater relief structures, since the more frequent and more intensive heavy rain events associated with climate change increase the demands on rainwater drainage from settlement areas, and
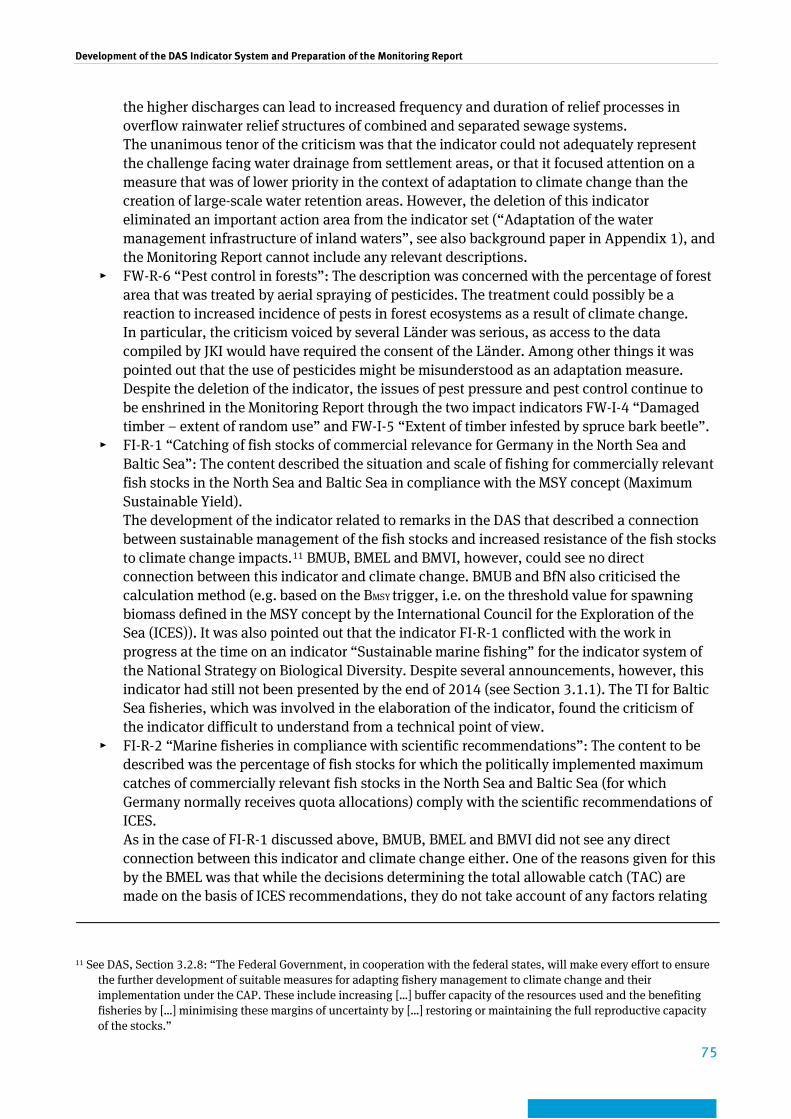
Development of the DAS Indicator System and Preparation of the Monitoring Report
75
the higher discharges can lead to increased frequency and duration of relief processes in overflow rainwater relief structures of combined and separated sewage systems. The unanimous tenor of the criticism was that the indicator could not adequately represent the challenge facing water drainage from settlement areas, or that it focused attention on a measure that was of lower priority in the context of adaptation to climate change than the creation of large-scale water retention areas. However, the deletion of this indicator eliminated an important action area from the indicator set (“Adaptation of the water management infrastructure of inland waters”, see also background paper in Appendix 1), and the Monitoring Report cannot include any relevant descriptions.
▸ FW-R-6 “Pest control in forests”: The description was concerned with the percentage of forest area that was treated by aerial spraying of pesticides. The treatment could possibly be a reaction to increased incidence of pests in forest ecosystems as a result of climate change. In particular, the criticism voiced by several Länder was serious, as access to the data compiled by JKI would have required the consent of the Länder. Among other things it was pointed out that the use of pesticides might be misunderstood as an adaptation measure. Despite the deletion of the indicator, the issues of pest pressure and pest control continue to be enshrined in the Monitoring Report through the two impact indicators FW-I-4 “Damaged timber – extent of random use” and FW-I-5 “Extent of timber infested by spruce bark beetle”.
▸ FI-R-1 “Catching of fish stocks of commercial relevance for Germany in the North Sea and Baltic Sea”: The content described the situation and scale of fishing for commercially relevant fish stocks in the North Sea and Baltic Sea in compliance with the MSY concept (Maximum Sustainable Yield). The development of the indicator related to remarks in the DAS that described a connection between sustainable management of the fish stocks and increased resistance of the fish stocks to climate change impacts.11 BMUB, BMEL and BMVI, however, could see no direct connection between this indicator and climate change. BMUB and BfN also criticised the calculation method (e.g. based on the BMSY trigger, i.e. on the threshold value for spawning biomass defined in the MSY concept by the International Council for the Exploration of the Sea (ICES)). It was also pointed out that the indicator FI-R-1 conflicted with the work in progress at the time on an indicator “Sustainable marine fishing” for the indicator system of the National Strategy on Biological Diversity. Despite several announcements, however, this indicator had still not been presented by the end of 2014 (see Section 3.1.1). The TI for Baltic Sea fisheries, which was involved in the elaboration of the indicator, found the criticism of the indicator difficult to understand from a technical point of view.
▸ FI-R-2 “Marine fisheries in compliance with scientific recommendations”: The content to be described was the percentage of fish stocks for which the politically implemented maximum catches of commercially relevant fish stocks in the North Sea and Baltic Sea (for which Germany normally receives quota allocations) comply with the scientific recommendations of ICES. As in the case of FI-R-1 discussed above, BMUB, BMEL and BMVI did not see any direct connection between this indicator and climate change either. One of the reasons given for this by the BMEL was that while the decisions determining the total allowable catch (TAC) are made on the basis of ICES recommendations, they do not take account of any factors relating
11 See DAS, Section 3.2.8: “The Federal Government, in cooperation with the federal states, will make every effort to ensure
the further development of suitable measures for adapting fishery management to climate change and their implementation under the CAP. These include increasing […] buffer capacity of the resources used and the benefiting fisheries by […] minimising these margins of uncertainty by […] restoring or maintaining the full reproductive capacity of the stocks.”
Development of the DAS Indicator System and Preparation of the Monitoring Report
76
specifically to climate change. However, this objection does not take into account the fact that according to the objectives of the DAS Indicator System the response indicators can also relate to measures or activities that are not primarily motivated by adaptation to climate change, but may have a favourable influence on the adaptation process (in this case the resilience of the commercially used fish stocks).
▸ FI-R-3 “Certification of fish”: The content to be described was firstly the number of certified fisheries in Germany, and of fisheries under assessment and supply chain companies that work in compliance with the traceability criteria of the MSC, and secondly the catch weight of MSC-certified fisheries (German quota) as a percentage of the catch weight of the German fishing fleet. Improved consumer information and eco-certification are explicitly mentioned in the DAS as alternative elements for steering fisheries operations. In this case as well the BMUB, BMEL and BMVI nevertheless criticised the lack of a direct connection with climate change. The BMUB also drew attention to a number of points of criticism relating to the MSC label. A revision of the MSC label would appear to be necessary from a nature conservation point of view. With regard to MSC certification, it also had to be assumed that certification was influenced by a wide range of factors, especially economic aspects unconnected with climate change.
▸ VE-I-2 “Goods traffic handled by inland waterways”: The content to be described was the negative variation of real goods traffic handled per quarter compared with the goods traffic expected on the basis of the economic trend (a clear shortfall of 5%). The DAS explicitly draws attention to the possible consequences of extreme low-water and high-water periods for the reliability and safety of inland waterway shipping and the resulting problems for industries dependent on bulk goods. A statistical method was used to eliminate the economic trend from the StBA data in the calculation of the indicator. The calculation method also largely eliminated the influence of seasonal fluctuations on the indicator value in the course of the year. The BMVI requested deletion of the indicator, whereas other commentators rated the indicator as being of great political relevance. In view of the calculation on which the indicator is based, it is difficult to understand the criticism voiced by the BMVI that the substantial seasonal effects made it impossible to adjust the goods traffic figure to eliminate economic effects. The deletion of the indicator means that a quantitative description of the economic consequences for goods traffic on inland waterways is no longer possible in the Monitoring Report.
▸ VE-I-4 “Condition of roads”: The content to be described was the average depth of tyre ruts in the inner lane (truck lane) of federal motorways, and the length of the first inner lane (truck lane) of federal motorways with a tyre rut depth of 10 to 20 millimetres or the length of the inner lane (truck lane) of federal motorways with a tyre rut depth of more than 20 millimetres as a percentage of total motorway length. This indicator also refers directly to wording in the DAS.12 However, the BMVI rejected the indicator as well on the grounds that other factors had a much greater influence on the formation of wheel ruts than climatic changes. As a result of its deletion, the Monitoring Report no longer contains information on the possible impacts of climate change on the condition of the roads.
12 See DAS, Section 3.2.11: “Prolonged heat also damages the highway infrastructure. High surface temperatures on asphalt
soften the road surface, resulting in tyre ruts and long-term damage.”
Development of the DAS Indicator System and Preparation of the Monitoring Report
77
▸ VE-R-1 “Cargo capacity of inland waterway freight vessels”: The content to be described was the average cargo capacity of existing and newly commissioned freight vessels of the German inland waterway fleet. The technical background to the indicator was the idea that a growing number of larger vessels with greater cargo capacity means a trend towards types of vessels that will increasingly have problems exploiting their full capacity in the event of more frequent low water levels. In view of this trend, for example, the Central Commission for Rhine Navigation speaks of increasing vulnerability of the inland waterway fleet during periods of low water (ZKR 2009: 44)13. The BMVI requested the deletion of this indicator on the grounds that there was no need for action in this field at present. The need for response to climate change impacts in the field of waterways and shipping was closely examined as part of the KLIWAS project. The outcome was that there was no need yet for any action with regard to the fleet structure, as on the basis of the KLIWAS results there would be no significant change in the low-water situation on the Rhine up to about 2050, and inland waterway vessels with greater cargo capacity were more economic at times of normal water levels. The deletion means that the indicator set no longer has an indicator on the response side in the field of inland waterway shipping that could be used to discuss possible measures in this field.
▸ VE-R-2 “Gritting on federal highways”: The content to be described was the weight of grit applied to federal motorways and highways by the winter services. The BMVI’s criticism, which ultimately resulted in the deletion of the indicator, was aimed in particular at the failure to take account of the different regional situations with regard to gritting and the changing techniques for using de-icing salt. However, regional differentiation is not the task of the federal indicator system. One argument against the BMVI’s criticism that gritting varies greatly from region to region in view of inadequate techniques for assessing the situation and the resulting subjectivity of the working methods chosen, is that the Road Condition and Weather Information System (Straßenzustands- und Wetterinformationssystem – SWIS) was jointly developed and established by the highways administration and the DWD to support the highway and motorway maintenance authorities. This instrument provides an aid to decisions by the winter services and makes for greater objectivity in gritting operations. Owing to the deletion of the indicator there are no remarks on the response side of the Monitoring Report in the field of road traffic.
▸ IG-R-2 “Business Continuity Management”: The starting point for the indicator is ISO Standard 22301:2012 “Business Continuity Management Systems – Requirements”. The indicator would have to be designed as a proxy indicator based on the number of copies of ISO 22301:2012 sold in Germany, as there are no systematic data on use of the standard in Germany. To date no certification practice that could serve as a basis for a data survey has been established in Germany. The aim of the indicator was to describe business continuity management as an important organisational measure for preparing for operational problems of all kinds, e.g. in the fields of supply and distribution, labour mobility and operating facilities, which might occur more frequently in future as a result of extreme events. The BMWi and others considered the information value of this proxy indicator was inadequate. The deletion of the indicator means that the topic of organisational and structural
13 ZKR – Zentralkommission für die Rheinschifffahrt 2009: Europäische Binnenschifffahrt – Marktbeobachtung 2/2008.
Strasbourg, 58 p.
Development of the DAS Indicator System and Preparation of the Monitoring Report
78
measures that companies can take in response to climate change is not included in the Monitoring Report.
Especially in the action fields “Fisheries” and “Transport, transport infrastructure”, the deletions resulted in a much smaller indicator set with the consequence that there are no longer any response indicators, i.e. measures cannot be addressed in the Monitoring Report. The information value of these action fields is therefore limited. As a result of the deletions, the indicator set now consists of 55 impact indicators (57%) and 42 response indicators (43%). Before the political consultation process, the ratio of impact to response indicators was more balanced, at 57 (53%) to 50 indicators (47%).
Not all the deletions were logical from a technical point of view. In some cases one gets the impression that the method of calculating the indicators has not been fully understood despite the detailed documentation in the indicator fact sheets. In other cases the request for deletion was based on an interpretation of the DAS indicators that differed from the objectives of the indicator project. For example, it was stated at the start of the project that for the development of the impact indicators that it could not, on the basis of available knowledge, be a condition for an indicator proposal that the influence of climate change could be quantified in the cause-and-effect complex (see Section 2.1). As far as the response indicators were concerned, it was stated that they could also describe measures which were not designed and implemented for the primary purpose of adaptation, but which supported or created a favourable framework of conditions for the adaptation process. However, some indicators were rejected in the political consultation process on the grounds that they did not describe adaptation measures.
Since the DAS Indicator System was developed by close reference to the DAS strategy document, specific wording on climate change impacts and possible adaptation measures was in some cases a deciding factor in the elaboration of indicators (see Section 2.2.1). In the political consultations about the rejection of some of the indicators, however, these formulations were called into question (see also the above explanation on deletion of indicators). This was surprising, because the DAS itself was a document that had passed through the ministerial consultation process. One reason for this divergent assessment might be that since the publication of the DAS in 2008, new technical knowledge has emerged that justifies assessments differing from the formulations in the DAS. However, it may also be that political positions have changed in the meantime.
The revised indicator system consisting of 103 indicators was submitted to the Inter-ministerial Committee on Adaptation Strategy for approval at the end of May 2014, together with a synoptic table with brief explanations on the extensively revised indicators and the rejected indicators (see categories 2 and 3 in Table11). At this stage, the individual departments verified whether their comments had been implemented appropriately. In individual cases there was a subsequent need for additional justification. In response to the reaction of another department, it was decided to delete the additional indicator on “Vector-transmitted diseases” which had been included in the action field “Human health” at the request of another department following the first round of departmental consultations. The political consultations on the indicators were finally completed at the beginning of July. The final set now comprises 102 indicators (see Table ).
3.2.2 Political agreement of the Monitoring Report
The procedure for the political agreement of the Monitoring Report was basically the same as for the political agreement of the Indicator System (see Fig. 8). However, the Monitoring Report was only made available in the consultation process as a complete document, to give all participants the chance of reading and commenting on the report as a whole. The individual Länder were now no longer involved in the political consultation process (see Section 3.2).
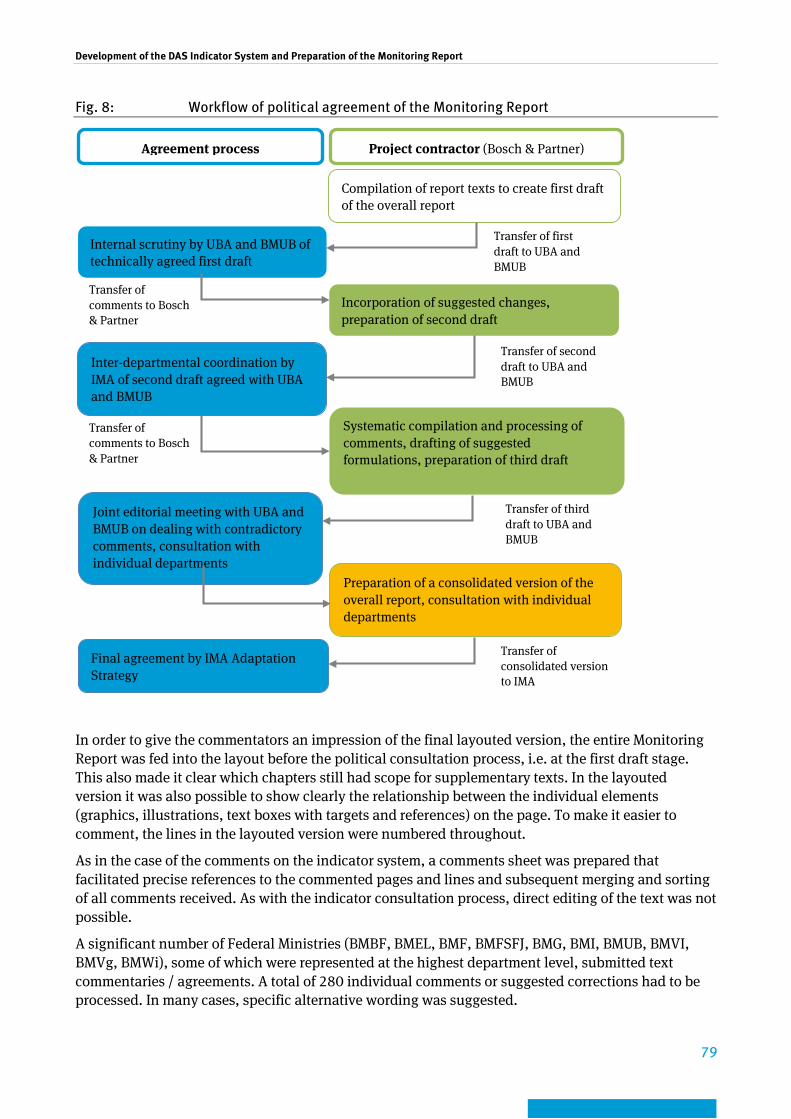
Development of the DAS Indicator System and Preparation of the Monitoring Report
79
Fig. 8: Workflow of political agreement of the Monitoring Report
In order to give the commentators an impression of the final layouted version, the entire Monitoring Report was fed into the layout before the political consultation process, i.e. at the first draft stage. This also made it clear which chapters still had scope for supplementary texts. In the layouted version it was also possible to show clearly the relationship between the individual elements (graphics, illustrations, text boxes with targets and references) on the page. To make it easier to comment, the lines in the layouted version were numbered throughout.
As in the case of the comments on the indicator system, a comments sheet was prepared that facilitated precise references to the commented pages and lines and subsequent merging and sorting of all comments received. As with the indicator consultation process, direct editing of the text was not possible.
A significant number of Federal Ministries (BMBF, BMEL, BMF, BMFSFJ, BMG, BMI, BMUB, BMVI, BMVg, BMWi), some of which were represented at the highest department level, submitted text commentaries / agreements. A total of 280 individual comments or suggested corrections had to be processed. In many cases, specific alternative wording was suggested.
Compilation of report texts to create first draft of the overall report
Internal scrutiny by UBA and BMUB of technically agreed first draft
Systematic compilation and processing of comments, drafting of suggested formulations, preparation of third draft
Transfer of comments to Bosch & Partner
Transfer of comments to Bosch & Partner
Agreement process Project contractor (Bosch & Partner)
Transfer of consolidated version to IMA
Preparation of a consolidated version of the overall report, consultation with individual departments
Joint editorial meeting with UBA and BMUB on dealing with contradictory comments, consultation with individual departments
Inter-departmental coordination by IMA of second draft agreed with UBA and BMUB
Final agreement by IMA Adaptation Strategy
Transfer of first draft to UBA and BMUB
Incorporation of suggested changes, preparation of second draft
Transfer of second draft to UBA and BMUB
Transfer of third draft to UBA and BMUB
Development of the DAS Indicator System and Preparation of the Monitoring Report
80
All comments received were collected in a single file and sorted in line with the text of the Monitoring Report. The project contractor entered differentiated answers to the comments in an additional column and indicated the need for further discussion. Before the final editorial meeting the BMUB and the UBA a consensus was reached with the commentators on alternative formulations for a number of controversial text passages.
Since the comments process for the Monitoring Report also involved individuals who had not previously taken part in the indicator project, there were again a small number of cases in which DAS indicators were basically called into question during the consultation process for the Monitoring Report. Essentially the criticism arose from the same misunderstandings about the framework conditions for the indicator development as during the political coordination of the indicators: In the case of impact indicators the influence of climate change does not have to be quantifiable, and response indicators can also address measures that are not primarily motivated by climate change. However, at this point in time no further changes in the indicator set were thrown open for discussion. Only explanations were sent to the commentators in reply. The two-stage procedure – first agreement on the indicators, then on the Monitoring Report – basically made the political consultation process manageable.
Overall, the feedback on the Monitoring Report was very positive and constructive. Any amendments were essentially of a minor editorial nature. Major text amendments were made only with regard to very few indicator descriptions. From a technical point of view, this resulted in a further enhancement of the descriptions.
In the case of four indicators in the forestry sector, data updates were undertaken as planned even after the first round of political agreement on the texts. In the case of three indicators the results of the Third Federal Forest Inventory (BWI³) of 2012 were to be integrated in the time series published in October 2014. The analyses of the BWI³ overlapped with the preparation of the texts for the DAS Monitoring Report, but needed to be included, as the BWI only provides data every ten years. In another case, the indicator FW-I-1 “Tree species composition in designated Forest Nature Reserves”, the analysed data from the data surveys on the Forest Nature Reserves that were initiated specially for the DAS Monitoring Report were not available until October 2014.

Development of the DAS Indicator System and Preparation of the Monitoring Report
81
4 Gaps in data As a result of the intensive data searches and extensive participation, the DAS indicator set covers a broad spectrum of issues. With 102 indicators it is relatively large for an indicator system. In view of this, the question of additional indicators and systematic closing of gaps in the data is not one that arises immediately. Nevertheless, a comparison of the indicators with the impact and response fields, as made in the background papers, points to gaps in content. The most important gaps are summarised in Table12. Indication fields that were prioritised for indicator development and for which indicators were developed, but subsequently deleted in the political consultation process (see Section 3.2.1), are not identified as gaps.
Moreover, the categorisation of the indicators also draws attention to gaps in the indicator system (see Section 1.2.1). For example, the categories “Case study” and “Proxy indicator” imply a direct call for further development of these indicators to permit nationwide information in the case of the 15 case studies, and accurate information with regard to the indication target in the case of the 7 proxy indicators (see Table ).
The background papers deal extensively with important gaps, further development needs and current initiatives (see Appendix 1). The degree of detail in these remarks goes beyond the information compiled in Table12 and is to some extent difficult to summarise. The specific needs for further development of case studies and proxy indicators are explained in detail in the indicator fact sheets.
No information is provided about the action field “Biological diversity”. This description is the task of the final report of the BfN project “System of indicators for showing the direct and indirect impacts of climate change on biological diversity” (FKZ 3511 82 0400).
Table 13: Important data gaps
Action field Level Gaps in data
Human health Impacts There is a basic lack of readily available nationwide data for describing the concrete impacts of climate change on human health (diseases and fatalities). This applies not only to heat, but also to allergies and infectious diseases.
Responses Apart from the information and warning systems, there are to date no measures in the health sector that specifically focus on climate change effects, so strictly speaking one cannot speak of a data gap.
Construction Impact The network of DWD measuring stations is basically intended to represent an unaffected open-country climate. This means that only a very few measuring stations are suitable for representing the development of heat stress situations in large cities over a long period. The relevant data situation is currently fragmentary and could deteriorate further as a result of the further closures of long-standing measuring stations on urban sites that are under discussion. The planned establishment of a DWD urban climate measuring network could in the long term counteract this trend.
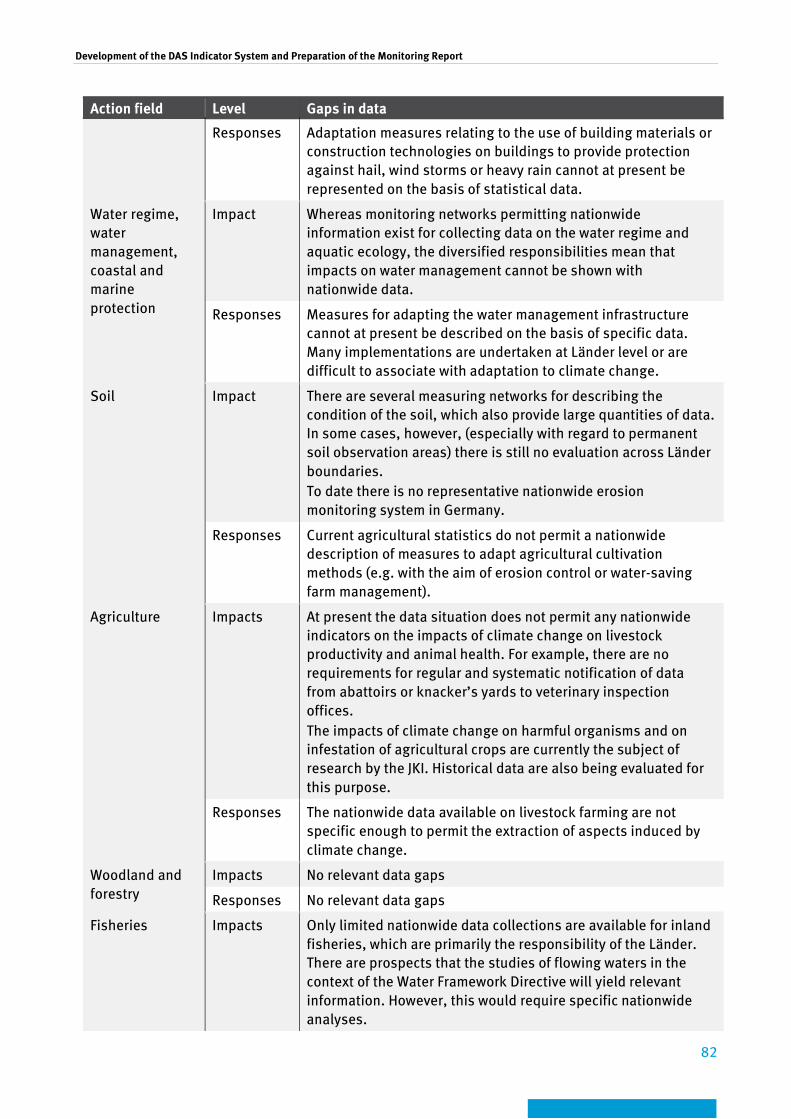
Development of the DAS Indicator System and Preparation of the Monitoring Report
82
Action field Level Gaps in data
Responses Adaptation measures relating to the use of building materials or construction technologies on buildings to provide protection against hail, wind storms or heavy rain cannot at present be represented on the basis of statistical data.
Water regime, water management, coastal and marine protection
Impact Whereas monitoring networks permitting nationwide information exist for collecting data on the water regime and aquatic ecology, the diversified responsibilities mean that impacts on water management cannot be shown with nationwide data.
Responses Measures for adapting the water management infrastructure cannot at present be described on the basis of specific data. Many implementations are undertaken at Länder level or are difficult to associate with adaptation to climate change.
Soil Impact There are several measuring networks for describing the condition of the soil, which also provide large quantities of data. In some cases, however, (especially with regard to permanent soil observation areas) there is still no evaluation across Länder boundaries. To date there is no representative nationwide erosion monitoring system in Germany.
Responses Current agricultural statistics do not permit a nationwide description of measures to adapt agricultural cultivation methods (e.g. with the aim of erosion control or water-saving farm management).
Agriculture Impacts At present the data situation does not permit any nationwide indicators on the impacts of climate change on livestock productivity and animal health. For example, there are no requirements for regular and systematic notification of data from abattoirs or knacker’s yards to veterinary inspection offices. The impacts of climate change on harmful organisms and on infestation of agricultural crops are currently the subject of research by the JKI. Historical data are also being evaluated for this purpose.
Responses The nationwide data available on livestock farming are not specific enough to permit the extraction of aspects induced by climate change.
Woodland and forestry
Impacts No relevant data gaps
Responses No relevant data gaps
Fisheries Impacts Only limited nationwide data collections are available for inland fisheries, which are primarily the responsibility of the Länder. There are prospects that the studies of flowing waters in the context of the Water Framework Directive will yield relevant information. However, this would require specific nationwide analyses.

Development of the DAS Indicator System and Preparation of the Monitoring Report
83
Action field Level Gaps in data
Responses Since the impacts of climate change on inland fisheries have hitherto played only a minor role, adaptation measures also provide no concrete and differentiated pointers and information underpinned by data, so one cannot speak of a data gap in the strict sense.
Energy industry (conversion, transport and supply)
Impact Basically there are are no public nationwide data for showing concrete impacts of climate change on heat and power generation or the structure of energy demand (e.g.volatility, frequency and duration of peak loads).
Responses Data sources on the existence and use of different options for making the energy supply system more flexible (e.g. demand-side management) do not yet exist on the scale necessary for presentation.
Financial services sector
Impacts In the banking sector there are neither systematic analyses of loan defaults and write-offs nor widely used methods of risk management that meet the specific requirements of climate-induced risks. No data are therefore available at present on the impacts of climate change on banks and financial service providers.
Responses There are to date no measures in the banking sector that specifically focus on climate change effects, so strictly speaking one cannot speak of a data gap.
Transport, transport infrastructure
Impact Basically there is a nationwide lack of readily available data for showing the concrete impacts of climate change on the flow of road and rail traffic and on transport infrastructures in general.
Responses Apart from the adaptation of a number of technical rules, there are to date no adaptation measures that specifically focus on climate change effects, so strictly speaking one cannot speak of a data gap.
Trade and industry
Impact To date there is a lack of data sources for nationwide presentation of the concrete impacts of climate change on operating or production facilities. The nationwide data available on trade and industry are not specific enough to permit the extraction of aspects induced by climate change.
Responses There is a basic lack of readily available nationwide data for presenting aspects relevant to adaptation, e.g. the inclusion of adaptation in business strategies, general preparation for physical business risks or the implementation of specific protective measures. Information on such aspects could for example be provided by regular surveys.
Tourism industry Impact Whereas data exist for showing impacts on the natural conditions that different destinations have to offer and on tourist demand, there is still a lack of nationwide data on possible physical impacts on tourist infrastructures, e.g. as a result of extreme events.

Development of the DAS Indicator System and Preparation of the Monitoring Report
84
Action field Level Gaps in data
Responses More comprehensive strategic approaches, e.g. developing alternative and differentiated offerings, optimising the range of services, improving services through networks and cooperation etc., are specific to destinations and providers and cannot be presented using indicators based on statistical data. Information on such aspects could for example be provided by regular surveys.
Spatial, regional and physical development planning
Impact No direct impacts are to be expected for this cross-sectional issue, so no indicators are needed for the impact side. There are thus no data gaps.
Responses To date there are no defined areas in which climate-change risks are particularly marked or which are particularly vulnerable, and which could be used as a basis for a climate risk based assessment of settlement existence or development.
Civil protection Impact There are no readily available nationwide data sources on climate-related and weather-related mission loads and frequency covering all organisations operating in the field of civil protection. There is no nationwide information about impacts on the functioning of KRITIS or on facilities of organisations in the field of civil protection.
Responses Adaptation measures in the civil protection sector mostly relate to organisational aspects that are basically impossible to present meaningfully on the basis of statistical data, so one cannot speak of a data gap in the strict sense.
5 Organisation of the reporting process In future the Monitoring Report is to be updated every four years. In order to ensure regular updating, structural and organisational conditions were created in the course of the indicator project and the central workflows necessary for such updating were defined. All relevant recommendations and rules, which also contribute to long-term quality assurance of the reporting process, are set out in the User Manual (see Appendix 4 and Section 1.2.6).
The recommendations and rules are essentially based on the established structures in the indicator project. Key points here are:
▸ active integration of the departments in the development of the indicators, and transfer of responsibility for updating to the departments,
▸ the coordinating and steering role of the BMUB in the adaptation process, ▸ the role of the Inter-ministerial Committee on Adaptation Strategy (IMA Anpassungsstrategie)
as a mediator in all government departments relevant to the adaptation process.
The following basic principles were decisive for the development of the organisation model:
▸ The process as a whole is designed to be as lean and effective as possible. ▸ The departments play an active role in the reporting process. The individual data and
information suppliers retain “ownership” of “their” indicators and are basically responsible for updating them.
Development of the DAS Indicator System and Preparation of the Monitoring Report
85
▸ The allocation of tasks is clearly defined, thereby avoiding duplication of work. ▸ The reporting procedure ensures that the report reflects the technical and political concerns
of the individual departments.
After discussing various organisation models, the Inter-ministerial Committee decided that the updating process should essentially be organised on a central basis. This means that any work connected with updating is carried out mostly by a central coordinating unit which calls up the technical contributions from various departments. This model is fundamentally based on the organisation model for reporting on the National Sustainable Development Strategy (NHS), in which the Federal Statistical Office (StBA) takes on the key tasks for coordinating the updating of indicators and reporting.
The organisation model involves the following bodies and functions:
▸ The coordination unit controls the overall process, ensures the integration of current technical knowledge from the relevant departments, prepares all documents for technical and political agreement with the departments and the Länder (including ongoing development and updating of the background documents in accordance with Sections 1.2.2 and 1.2.3 and drafting of report texts), investigates the need for revising the indicator system, and monitors its consistency (for the individual DAS action fields and cross-sectional issues) if indicators are eliminated from or added to the set. The coordination unit also handles the task of estimating trends for all updated indicators or sees to having this done by third parties. Moreover, the coordination unit is responsible for timetable tracking and overall editing of the Monitoring Report. According to the decision by the Inter-ministerial Committee, the coordination unit will be located in the DAS Office in the KomPass department of the UBA.
▸ The experts in charge of the indicators deal with the regular updating and, where necessary, further methodological development of the DAS indicators assigned to them and inform the coordination unit of any changes needed. Such indicator experts can only be public-sector staff, though on occasion they may cooperate with non-governmental institutions that supply data (e.g. associations). In certain circumstances the coordination unit may also take on the task of expert follow-up for indicators.
▸ The central contact persons in the ministries coordinate all work on those indicators for which the relevant ministries have been made responsible. Thus they are also the central point of contact for the coordination unit in matters relating to overall technical and political coordination of all indicators and report texts assigned to a ministry. The coordination unit also agrees suggestions for changes in the indicator system with the central contact persons. The central contact persons are located in the ministries. The ministry designated as responsible for an indicator ensures any necessary involvement of other departments that have a technical or political interest in the indicator.
▸ Lead management at political level supports the coordination unit in the political consultation process. Since lead management of the entire process of implementing and developing the DAS is based in the Federal Environment Ministry, lead management of report updating also rests with the BMUB. The lead management essentially functions as a clearing house and comes into action if it is not possible to reach a political consensus within the responsibility of the central contact persons for the DAS action fields. It is responsible for bringing about acceptance of the Monitoring Report, both at inter-ministerial and inter-state level. The lead management also steers the final political coordination of the overall report.
Further details of tasks and workflows are described in the User Manual (see Appendix 4).
Development of the DAS Indicator System and Preparation of the Monitoring Report
86
6 Reflections on the process as a whole In the following section, the project contractor reflects on the process of developing the DAS Indicator System and preparing the Monitoring Report.
Duration of process:
The development of the DAS Indicator System and the preparation of the Monitoring Report took nearly six years to complete. The work was nevertheless generally very tightly organised and made continuous progress. The factors influencing the duration of the work and consultation progress included the following:
▸ The DAS Indicator System covers an unusually broad spectrum of themes. This made it necessary to ensure extensive technical participation. The participation structure had to be established along with the project. The successive addition of further participants repeatedly made it necessary to familiarise the new colleagues with the aims of the project, the instruments to be used and the workflows involved. It was sometimes necessary to undertake a critical review of completed processes and results, take account of new or additional findings and update where appropriate. No models for designing the process were available from indicator development projects of similar complexity.
▸ The start of the indicator project coincided with the publication of the DAS. At the time, adaptation was still a comparatively new issue. It therefore called for fundamental work on structuring the project, which initially consisted in extensive sorting, and especially prioritisation, of the subject matter (see Section 2.2.2). The fact that the technical discussions focused on selected indicator fields at this early stage ultimately formed the basis for rigorous and target-oriented indicator development.
▸ As far as inter-departmental cooperation was concerned, there were few routine procedures on which to base the process, especially as regards the political consultations. All in all, the process of political coordination of the DAS Indicator System and the Monitoring Report took more than two years.
Nature of technical participation:
The very extensive technical involvement of nearly 450 individuals from governmental and non-governmental establishments was crucial to the success of the project. Without the active contributions and personal commitment of the participants it would not have been possible to create such a comprehensive indicator system covering such a wide range of subject fields. The conditions for constructive cooperation between the project contractor and the technical experts have already been described in Chapter 2.3.1. The following factors in particular played a decisive role in the successful involvement of the experts:
▸ efficient mini-groups or direct bilateral contacts with rigorous thematic focus of technical discussions (instead of large workshops), sound technical preparations for all meetings and telephone conversations,
▸ painstaking, continuous and transparent documentation of the state of discussion at all times (especially the description of weaknesses in the indicator fact sheets and the “dead ends” in indicator development in the background papers),
▸ responsible technical handling of all data and other material provided, ▸ early focus on the Monitoring Report as the final result (how complicated can things get?), ▸ perseverance of efforts to motivate sceptics.
Development of the DAS Indicator System and Preparation of the Monitoring Report
87
On the whole, the progress and results of the technical participation were very highly rated.
Political consultation process:
The political consultation process was essentially well structured and targeted. However, it proved to be an obstacle that the role of the IMA members was not always clear or was not always exercised in the expected manner. Specifically, the information from the Inter-ministerial Committee on Adaptation Strategy was not always passed on adequately by the IMA members to their own departments. This led to a need for further explanation in the course of the political consultation process.
The comment sheet procedure used for coordinating the indicator system and the first Monitoring Report kept the processing of comments practicable despite the large number and wide variety of comments. The differentiated answers to the individual commentaries created transparency in dealing with the comments and requests for alterations. Even though some of the commentators felt the procedure was complicated because they could not make their comments directly in the text, this procedure is recommended for updates to the report as well.
In some cases it proved difficult to reach agreement on topics that were the subject of controversial discussion between the departments, but for which a consensus or at least a compromise had to be reached for the joint inter-departmental reporting process. In particular, the project contractor found it unsatisfactory and a point of criticism that in a number of topics that were the subject of technically and politically controversial discussion there was no direct and open comparison of positions, making full and proper discussion impossible. Even within departments there was sometimes controversy about estimates and evaluations between the technical and ministerial levels. Where such failure to thoroughly discuss controversies between or even within departments ultimately led to the deletion of indicators from the indicator system, this in turn gave rise to dissatisfaction among the technical experts who had played an active and committed part in the development and documentation of the indicators.
The Federal Environment Ministry (BMUB) is responsible for lead management of the adaptation process, and the indicator project was financed from BMUB resources. As a consequence, the BMUB also reserved the right to make a preliminary check on papers intended for the inter-ministerial consultation process to see that they were consistent with the ministry’s own official opinion. At the same time the indicator project was fundamentally different from other projects financed from the ministry’s resources in that it involved drawing up proposals for an inter-ministerial process and ensuring extensive involvement of experts from other departments in their practical processing. This technical involvement of other departments in the development of the indicators and the preparation of the Monitoring Report occasionally gave rise to situations where proposals were at variance with the official opinion of the BMUB. Conflicts sometimes arose if the results of intensive technical contributions (especially at the highest technical department level) needed subsequent modification to bring them into line with the official opinion of the BMUB. In the interests of developing and improving the process for inter-departmental consultation it would be useful to consider how to bring about a more open and objective exchange of views.
Assessment of final result:
The final result exceeded the initial expectations. Expectations before the project started were that the total number of indicators would be much smaller. At the same it was assumed there would be a larger proportion of indicators that had already been reported in other contexts (including indicator systems) and could be incorporated in the DAS Indicator System. However, the DAS Indicator System
Development of the DAS Indicator System and Preparation of the Monitoring Report
88
now contains a large number of completely new indicators that use novel data sources and describe situations that have not previously been presented in such a compact form.
On the basis of this indicator system with its unusually wide range of subject fields it was possible to create a very comprehensive Monitoring Report containing a wealth of information. In the first version now available it is rather like an “adaptation compendium”, providing an easily understood overview of the development and state of progress in the relevant fields of adaptation.
The extensive list of participants in the appendix to the Monitoring Report, and the express desire of several commentators to be included in this list, bear witness to a high degree of identification with the final result.
Even during the development of the DAS Indicator System and the Monitoring Report, the need for subsequent updating was rigorously borne in mind, and the structural conditions for this were created in the form of the indicator and data fact sheets and the list of contacts. The documentation system proved its worth in the data updates performed in early 2014 for the indicators, which had by then been politically agreed: It made it possible to quickly locate the “right” data sources, contact the “right” persons and use the “right” formulae for generating the latest indicator value. An organisation model was also developed, regulating in detailed and unambiguous form the shared and inter-ministerial cooperation in the updating process. All necessary steps are described in a clearly organised User Manual. The updating process can thus be described regarded as largely guaranteed.
In other words, the DAS Indicator System can become established as a comprehensive system designed for continuity, alongside the NHS and NBS indicators at federal level.
Development of the DAS Indicator System and Preparation of the Monitoring Report
89
7 Appendices
Appendix 1: Background papers on the action fields and cross-cutting issues of DAS
Appendix 2: Indicator fact sheets
Appendix 3: Bibliography
Appendix 4: User Manual
Appendix 5: Monitoring Report
All appendices are only available in german language.