evaluation of protein and fiber from distillers grains
TRANSCRIPT
University of Nebraska - LincolnDigitalCommons@University of Nebraska - Lincoln
Theses and Dissertations in Animal Science Animal Science Department
5-2017
EVALUATION OF PROTEIN AND FIBERFROM DISTILLERS GRAINS PLUSSOLUBLES IN FINISHING BEEF CATTLEDIETSZachary E. CarlsonUniversity of Nebraska-Lincoln, [email protected]
Follow this and additional works at: https://digitalcommons.unl.edu/animalscidiss
Part of the Other Animal Sciences Commons
This Article is brought to you for free and open access by the Animal Science Department at DigitalCommons@University of Nebraska - Lincoln. It hasbeen accepted for inclusion in Theses and Dissertations in Animal Science by an authorized administrator of DigitalCommons@University of Nebraska- Lincoln.
Carlson, Zachary E., "EVALUATION OF PROTEIN AND FIBER FROM DISTILLERS GRAINS PLUS SOLUBLES INFINISHING BEEF CATTLE DIETS" (2017). Theses and Dissertations in Animal Science. 137.https://digitalcommons.unl.edu/animalscidiss/137
EVALUATION OF PROTEIN AND FIBER FROM DISTILLERS GRAINS PLUS
SOLUBLES IN FINISHING BEEF CATTLE DIETS
by
Zachary E. Carlson
A THESIS
Presented to the Faculty of
The Graduate College at the University of Nebraska
In Partial Fulfillment of Requirements
For the Degree of Master of Science
Major: Animal Science
Under the Supervision of Professors Jim C. MacDonald and Matt K. Luebbe
Lincoln, Nebraska
May, 2017
EVALUATION OF PROTEIN AND FIBER FROM DISTILLERS GRAINS PLUS
SOLUBLES IN FINISHING BEEF CATTLE DIETS
Zachary E. Carlson, M.S.
University of Nebraska, 2017
Advisors: Jim C. MacDonald and Matt K. Luebbe
Four studies were conducted to evaluate the components of distillers grains plus
solubles in finishing beef cattle diets. Experiment 1 evaluated the effects of five
composites of feedstuffs formulated to be similar in nutrient composition to DDGS on
finishing performance of cattle. Experiment 2 evaluated isolating the protein from
distillers grains using a feedstuff from the wet milling ethanol industry to determine the
impacts of protein on the feeding value of WDGS in finishing performance of cattle.
Experiments 3 and 4 evaluated the effects of protein from distillers grains with the diets
used in Exp. 2 on site of digestion, ruminal VFA concentration and pH. In Exp. 1,
replicating distillers grains plus solubles with proportions of high-protein distiller grains,
corn bran, and condensed distillers solubles did not result in similar performance as cattle
fed distillers grains plus solubles. Cattle consuming the CaO treated corn stover and
byproducts were less efficient than cattle fed the composite with corn bran. Replacing
high-protein distillers grains from the composite diet with condensed distillers solubles
and corn bran resulted in greater DMI and tended to improve feed efficiency. In Exp. 2,
protein made up a large portion of the calculated feeding value of the distillers grains plus
solubles. In Exp. 3 and 4, DM and NDF total tract digestibility were greater for protein of
distillers grains than for distillers grains plus solubles. Excess protein, from distillers

grains plus solubles, above the animals requirement does serve as an energy source to
beef cattle on finishing diets.
Key Words: distillers grains plus solubles, finishing, protein, treated corn stover

ACKNOWLEDGMENTS
I want to thank my mentors (Jim MacDonald, Matt Luebbe, and Galen Erickson)
for pushing me to learn and giving me the opportunity to do so. Through your amazing
teachings, I have grown and cannot thank you enough for what you have done for me.
I want to thank all of my friends (all ruminant nutrition graduate students),
without them I would not have been able to succeed. Their help and support was much
needed, something I won’t forget.
I want to give thanks to my undergraduate mentors (Kendall Swanson and Joel
Caton) for providing me research opportunities, answering all of my questions, and
believing in me. I would not be in graduate school if not for these two men.
A special thanks to my parents, who have always supported and believed in me. I
am blessed to have such a wonderful family. I would not be who I am today if not for
their love and support.
I especially want to thank my wife, Molly, for being the selfless women she is.
She gave up everything to come with me to Lincoln and support my career decisions.
You put up with me through some stressful times and always was there for support. I
cannot express in words how grateful I am to have you in my life.

i
TABLE OF CONTENTS
TABLE OF CONTENTS ..................................................................................................... i
TABLES ............................................................................................................................ iii
FIGRUES ........................................................................................................................... iv
CHAPTER I. LITERATURE REVIEW ..............................................................................1
Introduction ..........................................................................................................................1
Ethanol Production...............................................................................................................2
Dry-Grind Processing .................................................................................................................. 2
Wet Milling ................................................................................................................................. 3
Partial Fractionation .............................................................................................................7
Back-end Fractionation................................................................................................................ 9
Advancements in Technology for Dry-Grind Process .......................................................10
AFEX ......................................................................................................................................... 11
Controlled pH Liquid Hot-Water .............................................................................................. 13
Protein Separation ..................................................................................................................... 14
Protein as an Energy Source ..............................................................................................15
Condensed Corn Distillers Solubles ..................................................................................19
Sulfur..................................................................................................................................23
Fiber in High Concentrate Diets ........................................................................................26
Using Neutral Detergent Fiber to Evaluate Forage Quality ...................................................... 27
Using Dry Matter to Evaluate Forage Quality ........................................................................... 30
Corn Residue ......................................................................................................................34
Chemical Treatment .................................................................................................................. 35
Pelleting ..................................................................................................................................... 39
Conclusion .........................................................................................................................40
Literature Cited ..................................................................................................................42

ii
CHAPTER II. MODIFYING DIFFERENT COMPONENTS OF DISTILLERS GRAINS
AND THE IMPACT ON FEEDLOT PERFORMANCE ..................................................51
ABSTRACT .......................................................................................................................52
INTRODUCTION .............................................................................................................54
MATERIALS AND METHODS .......................................................................................55
RESULTS AND DISCUSSION ........................................................................................62
IMPLICATIONS ...............................................................................................................69
LITERATURE CITED ......................................................................................................70
CHAPTER III. EVALUATION OF PROTEIN IN DISTILLERS GRAINS ON
NUTRIENT DIGESTIBILITY, RUMEN FERMENTATION CHARACTERISTICS,
GROWTH PERFORMANCE, AND CARCASS CHARACTERISTICS IN BEEF
CATTLE FINISHING DIETS ...........................................................................................79
ABSTRACT .......................................................................................................................80
INTRODUCTION .............................................................................................................82
MATERIALS AND METHODS .......................................................................................83
Experiment 1 ..................................................................................................................83
Experiment 2 ..................................................................................................................87
Experiment 3 ............................................................................................................................. 91
RESULTS AND DISCUSSION ........................................................................................94
Experiment 1 ..................................................................................................................94
Experiment 2 and 3 .................................................................................................................. 100
IMPLICATIONS .............................................................................................................106
LITERATURE CITED ....................................................................................................108

iii
TABLES
Table 2.1. Dietary treatments containing modified components of distillers grains fed to
steers ..................................................................................................................................74
Table 2.2. Composition of dietary treatments containing modified components of
distillers grains fed to steers ...............................................................................................75
Table 2.3. Nutrient analysis for ingredients containing modified components of distillers
grains fed to steers .............................................................................................................76
Table 2.4. Effects of modifying different components of distillers grains on animal
performance and carcass characteristics ............................................................................77
Table 2.5. Effects of modifying different components of distillers grains on animal
performance and carcass characteristics ............................................................................78
Table 3.1. Composition of dietary treatments containing protein components of distiller
grains fed to steers (Exp. 1) .............................................................................................112
Table 3.2. Composition of dietary treatments containing protein components of distiller
grains fed to steers (Exp. 2 and 3)....................................................................................113
Table 3.3. Linear and quadratic effect of distillers grains on finishing performance and
carcass characteristics (Exp. 1) ........................................................................................114
Table 3.4. Linear and quadratic effect of isolated protein from distillers grains on
finishing performance and carcass characteristics (Exp. 1) .............................................115
Table 3.5. Effect of excess rumen ungradable protein from distillers grains on finishing
performance and carcass characteristics (Exp. 1) ............................................................116
Table 3.6. Effects of excess rumen ungradable protein from distillers grains in finishing
steers diets on intake and total tract digestibility (Exp. 2) ...............................................117
Table 3.7. Effects of excess rumen ungradable protein from distillers grains in finishing
steers diets on ruminal and post-ruminal digestibility (Exp. 2) .......................................118
Table 3.8. Effects of excess rumen undegradable protein from distillers grains in
finishing steers diets on ruminal volatile fatty acid concentration (Exp. 3) ....................119
iv
FIGRUES
Figure 3.1. Ruminal pH of cattle fed 4 different dietary treatments was monitored over 6
periods. .............................................................................................................................120
Figure 3.2. Ruminal propionate of cattle fed 4 different dietary treatments was monitored
over 6 periods. ..................................................................................................................121
Figure 3.3. Ruminal butyrate of cattle fed 4 different dietary treatments was monitored
over 6 periods. ..................................................................................................................122
Figure 3.4. Ruminal total VFA of cattle fed 4 different dietary treatments was monitored
over 6 periods. ..................................................................................................................123
1
CHAPTER I. LITERATURE REVIEW
Introduction
In the last decade, ethanol production has increased significantly, which directly
correlates to greater distillers grains plus solubles (DGS) production. For every liter of
ethanol produced from the dry-grind process, 0.84 kg of DGS is produced (Kim et al.,
2010). Increased ethanol production has led to increased demand for corn and utlimately
higher corn prices (Watson, 2015). Corn is the primary ingredient in finishing diets,
supplying the majority of the energy for ruminant animals (Galyean and Gleghorn, 2001;
Vasconcelos and Galyean, 2007). As a result of high corn prices, replacing corn with
ethanol byproducts can be economically favorable while still providing energy. Distillers
grains included at or below 20% of diet DM are utilized to meet the protein requirements,
with greater inclusion levels serving as an energy source. Excess protein used as energy
is deaminated in the liver, producing ketone bodies to be used as energy, and urea is
excreted (Klopfenstein et al., 2008).
Ethanol plants are always striving to improve efficiency and profitability, which
has led to the development of new technologies, especially within the dry-grind
processing industry. These technologies improve efficiency have focused on producing
more from the same kernel of corn. In the dry-grind process, corn is ground and corn
starch is hydrolyzed to sugar and sugar fermented to produce ethanol. The unfermented
components included mostly fiber, protein, fat, minerals (Kim et al., 2010). Currently, the
germ component of DGS can be further processed to seperate corn oil (Depenbusch et al.,
2008). The fiber component may be subjected to cellulosic fermentation yielding
additional ethanol and a DGS lower in NDF. The remaining NDF has been reported to be

2
less digestible and lower in energy relative to fiber from traditional DGS (Lundy et al.,
2015). Following cellulosic fermentation, protein can be separated and removed from
DGS. Distillers grains plus solubles contains approximately 31% CP (DM basis) and
serves as an excellent source of protein (Buckner et al., 2011; Klopfenstein et al., 2008).
Depending on the amount of protein removed, the role of DGS as a protein source could
change. The combinations of further processing of germ, fiber, and protein may have a
significant impact on the use of DGS in ruminant diets in the future.
Ethanol Production
Ethanol can be produced by dry-grind processing, wet milling, or dry milling.
Each process yields unique byproducts, therefore it is important to understand each
processes’ techniques in order to better understand the characteristics of the byproducts.
Dry-Grind Processing
The traditional dry-grind process starts with grinding whole corn and transferring
the fine ground corn into a slurry tank to be mixed with process water and thermostable α
– amylases to produce a solution called slurry. The thermostable α – amylases gelatinize
the corn slurry in a jet cooker, a process called liquefaction. The result is mash which is
diluted with thin stillage, acquired by previous batches, prior to fermentation. The corn
mash enters the saccharification tank, which hydrolyzes dextrin into glucose by
glucoamylase enzyme. The liquid, rich in glucose, is transferred to a fermentation column
to be fermented into ethanol by yeast, then distilled and dehydrated into fuel grade
ethanol. The remaining product after fermentation is called heavy stillage. This is
centrifuged to separate the solids from the liquids. During centrifugation, a large portion
of oil is emulsified and ash, for the most part, is soluble so more ends up in the liquid

3
fraction also known as thin stillage. The solids are distillers wet grains, which contains
the highest portion of protein (Liu, 2011). The liquid is evaporated to produce condensed
distillers solubles (CDS) and later is combined with distillers wet grains to form wet
distillers grains plus solubles (WDGS) which can be dried to produce modified distillers
grains plus solubles (MDGS) or dried distillers grains plus solubles (DDGS; Kim et al.,
2008b). Nutrient composition of DGS can change based on the amount of thin stillage
added to the mash. Protein, oil, and ash contents are much greater in whole stillage than
corn, as a result of starch removal, these components can be 3-fold that of corn (Liu,
2011).
Wet Milling
The main purpose of the wet milling industry is to isolate and recover starch to
produce high fructose corn syrup, glucose, and ethanol (Rausch and Belyea, 2006). Only
#1 and #2 grade corn can be used because most products produced are for human food
consumption (Stock et al., 2000). First, corn grain is sifted through screens to remove
broken kernels, chaff, pieces of cobs, and any foreign material (U.S. Grain Council,
2012). Then corn is steeped in weak sulfurous dioxide solution for 40-48 h to soften the
kernels and cause leaching of solubles from the germ, a process known as degerming.
The corn and weak sulfurous acid solution are combined to form steepwater (4-8%
solids), which is concentrated by evaporation into heavy steepwater (35-40% solids;
Rausch and Belyea, 2006). The corn kernels are ground through a system of
hydrocyclones, pressed, and dried to remove the germ fraction from the slurry. The germ
is dried and oil is extracted from the germ to produce corn oil. Fiber, which contains
pericarp and cell-wall fiber components, is separated by pumping the slurry through a

4
screen, leaving starch and protein within the slurry. The slurry is centrifuged, removing
the protein fraction because it is weighs less than starch. The protein fraction is called
gluten, which is then concentrated using gluten thickener, centrifuged and dewatered by
vacuum belt filtration and then dried to form corn gluten meal (Rausch and Belyea, 2006;
U.S. Grain Council, 2012). The remaining slurry is primarily composed of starch, which
is purified to remove residual protein and utilized to produce ethanol with a similar
procedure as dry-grind processing ethanol plants (Rausch and Belyea, 2006). The starch
may be dried and marketed as-is or used to make corn syrups and sweetners. Some
milling plants convert starch to dextrose, which is then fermented to produce ethanol and
a byproduct feed called distillers solubles (Stock et al., 2000).
The byproducts from wet milling include steep liquor, corn germ meal, corn
gluten feed, corn gluten meal, and distillers solubles. Steep liquor (40-50% DM) can be
fed to animals as a liquid protein feed containing 25% CP or added to other byproducts,
such as corn gluten feed. Corn germ meal (90% DM) is what remains after oil extraction
of the corn germ. It contains 26% CP, 2% fat, and 4% NDF (Rausch and Belyea, 2006).
Corn gluten feed is the bran and fibrous portions of the corn kernel that is sold wet or dry.
It contains approximately 14-24% CP, 3.5% fat, and 35-48% NDF; however the
composition of CGF is variable based on the amount of steep liquor added to the bran
(Rausch and Belyea, 2006; Stock, 2000). Thus, CGF does not have a consistent nutrient
profile and differs among wet milling plants (Stock, 2000). Corn gluten meal contains
65% CP, 2.5% fat, and 11% NDF and is high in escape protein. The primary use of CGM
is in pet food and poultry industries, with very little being added to CGF (Stock, 2000).
Distillers solubles from wet milling corn processing comes from the fermentation of

5
starch, like the dry-grind process, and contains 22% CP, 12% fat, and very little fiber
(Rausch and Belyea, 2006; U.S. Grain Council, 2012). However, unlike CDS from dry
grind facilities, wet milling distillers solubles contains less fat (Stock et al., 2000).
Many feedlots utilize CGF from the wet milling industry in finishing diets. Stock
et al. (2000) summarized several studies performed at the University of Nebraska
evaluating CGF in finishing beef cattle diets. Two different wet CGF were evaluated; one
containing wet bran and steep (combination of steep liquor and distillers solubles)
(WCGF-A) and was 40-42% DM with 15-18% CP (DM basis). The second WCGF
contained dry bran, steep (combination of steep liquor and distillers solubles) and germ
meal (WCGF-B) and was 60% DM with 20-25% CP (DM basis). When WCGF-A was
fed at levels from 20 to 60% (DM basis), the net energy value was estimated to be 1%
more than that of corn. When WCGF-B was included at the same inclusion levels, the net
energy value was estimated to be 15% more than that of corn. The greater energy value
for WCGF-B is attributed to greater DM and CP values and lower NDF values due to
more steep and less bran added to WCGF-B. Therefore, it is critical for producers to
understand the nutrient content of CGF and understand that they are not all nutritionally
equal.
Dry Milling
Dry milling corn processing accounts for only a small fraction of total ethanol
produced in the U.S. The process utilizes physical separation of the germ, endosperm,
and bran. First, corn is screened to remove foreign material, crop residue, fines, and
broken kernels and washed with water to achieve a moisture content of 20-22%, which
causes differential swelling and increased resiliency of the germ (Stock et al., 2000).
6
Germ and bran are separated from the endosperm by an abrading system similar to the
degermination in wet milling. However, total separation of corn components from the
endosperm is incomplete, leaving residual germ and bran attached to endosperm. These
components are removed through aspiration, screening, and other milling techniques.
Bran is removed from the germ via aspiration, isolating the germ for oil extraction (Stock
et al., 2000). Germ from dry milling contains less oil (26%, DM basis) compared to germ
from wet milling (35-40%, DM basis; Rausch and Belyea, 2006). The endosperm is
sorted by size to yield large, medium, and fine grits, meals, or flours for breakfast cereals.
Livestock feed byproducts include bran, broken corn kernels, deoiled germ, and
inseparable components of germ, bran, and endosperm. These materials are combined,
dried, and marketed as hominy feed. It contains approximately 57% starch, 11% CP, 25%
NDF, and 5% fat (DM basis; Larson et al., 1993; Stock et al., 2000).
Larson et al. (1993) conducted three feeding trials to establish the nutritive value
of hominy feed in finishing diets. As hominy feed replaced dry-rolled corn (DRC; 0, 15,
30, 45, 100%, respectively), DM digestibility decreased. However, starch digestibility
and NDF digestibility increased as hominy feed inclusion increased. Heifers fed hominy
feed with or without fat added at 0, 13.3 (0.67% added fat), 26.7 (1.33% added fat), and
40% (2.0% added fat) of diet DM. There was no interaction with hominy feed inclusion
and fat addition. Heifers fed 13.3 or 26.7% hominy feed or hominy feed plus fat
consumed more than heifers consuming 0 or 40% diets. Average daily gain and feed
efficiency were not different. When hominy feed replaced DRC at 0, 13.3, 26.7, and 40%
(DM basis) and fed to steers, DMI was greatest for steers consuming 40% hominy feed.
Even though hominy feed contains 20% less starch than corn, it was calculated to be 87%

7
the energy of corn. Hominy feed can replace corn up to 40% in finishing diets and
provide adequate performance.
Partial Fractionation
Partial fractionation is the process of physically separating the 3 main components
of a corn kernel; endosperm, germ, and bran before the cooking process. This allows the
germ (12% of the kernel), which is not fermentable, to avoid fermentation and be further
processed to yield corn oil. Partial fractionation creates a bran stream containing high
levels of cellulose, hemicellulose, and lignin which can be combusted for energy use,
fermented into cellulosic ethanol, or marketed as a feedstuff (Cereal Process
Technologies, 2012). In traditional dry milling ethanol production, the entire corn kernel
was subjected to fermentation. Distillers grains plus solubles derived from partial
fractionation contains less fat and phosphorous but has increased concentration of
protein. Front-end fractionation separates the components before fermentation with the
goal of increasing ethanol yields, lowering production of by-products that require drying,
reducing frequency of cleaning the system to remove oil, and using less energy (U.S.
Grains Council, 2012). However, front-end fractionation could not become profitable and
has ceased to exist in most current production facilities.
Few studies have reported feeding byproducts from front-end fractionation.
Godsey et al. (2010) fed a corn byproduct from the front-end fractionation of endosperm
and germ called E-corn, which contains low levels of fat (5.3%) and heat-treated starch.
The hypothesis was E-corn will perform similar to dry-rolled corn (DRC) in a finishing
diet because previous work showed similar feeding values between E-corn and DRC.
Increasing E-corn up to 60% of the diet (DM basis) had greater DMI but no effect on

8
average daily gain (ADG). Feed efficiency improved for 20 and 60% E-corn inclusion.
Marbling, 12th rib fat, and calculated yield grade decreased with inclusion of E-corn,
suggesting that E-corn had a lower energy value than DRC. Overall, E-corn can replace
conventional dry-rolled corn at 20% of diet (DM basis) and provide similar performance
with a slight reduction in carcass quality.
Depenbusch et al. (2008) compared traditional DGS to front-end fractionated
DGS utilizing 610 yearling heifers on steam-flaked corn based finishing diets. Traditional
DGS (26% CP, 12% crude fat, 26% NDF) was included in the diet at 12.9% DM and
partial fractionated DGS (43% CP, 4% crude fat, 23% NDF) was included at 13.5% DM.
Performance data showed no difference between traditional DGS and partial fractionated
DGS on final BW, ADG, or G:F. Dry matter intake was lower for heifers consuming
partial fractionated DGS compared to traditional DGS. Kelzer et al., (2011) individually
fed 48 steers DRC control, 35% conventional DDGS or 35% high-protein distillers grains
(HPDG; 5.1% fat and 39% CP) finishing diets. Kelzer et al. (2011), similar to
Depenbusch et al. (2008), found reduced intakes for steers consuming HPDG compared
to corn but no difference with DDGS. These data suggest that feeding partial fractionated
DGS will result in similar performance to traditional DGS. Partial fractionated DGS
contained 46% less phosphorus than traditional DGS, which could decrease phosphorus
excreted. Producers could feed partial fractionated DGS to help waste removal challenges
by allowing manure application to occur more frequently allowing more nitrogen
application on the same section of land without the over application of phosphorus.
9
Back-end Fractionation
The main process for removing corn oil is back-end fractionation. Corn oil is
extracted from thin stillage via centrifugation following fermentation and distillation
before drying occurs (CEPA, 2011). Thin stillage contains approximately 30% of the oil
available in the corn, of which most can be recovered by centrifugation (U.S. Grains
Council, 2012). An additional washing technique removes another 30% of the corn oil
from wet cake. The two techniques combined extract 60 to 70 percent of the corn oil
available (CEPA, 2011).
Jolly et at. (2013) compared back-end fractionated DGS in finishing cattle diets.
Treatments were : 1) low-fat CCDS (6.0%) at 27% inclusion, 2) normal-fat CCDS
(21.1%) at 27% inclusion, 3) low-fat (9.2%) modified distillers grains plus solubles
(MDGS) at 40% inclusion, 4) normal-fat (11.8%) MDGS at 40% inclusion in a 1:1 blend
of DRC and high-moisture corn (HMC) diets. There were no differences in performance
or carcass characteristics between low-fat and normal-fat CCDS and MDGS. This
suggests cattle fed low-fat CCDS or MDGS will perform similar to normal-fat CCDS or
MDGS. Jolly et al. (2014) also compared low-fat (7.9%) and normal-fat (12.4%) WDGS
in finishing cattle diets. Treatments consisted of low-fat and normal-fat WDGS at
inclusions of 35, 50, and 65% in a 1:1 blend of DRC and HMC diets. There was no
difference in final BW, DMI, ADG, and G:F between low-fat and normal-fat. Likewise,
carcass characteristics were not different for oil-extracted compared to normal-fat
WDGS.
Bremer et al. (2015) analyzed low-fat (7.2%) MDGS and normal-fat (12%)
MDGS at 15 and 30% inclusion in a 1:1 blend of DRC and HMC finishing diets. No

10
differences were observed between low-fat and normal-fat MDGS for final BW, DMI,
ADG, and carcass characteristics. However, normal-fat MDGS at 30% inclusion had a
3.4% improvement in G:F compared to low-fat MDGS.
Advancements in Technology for Dry-Grind Process
In 2004, 7.3 million metric tons of DGS were produced while in 2014, 39 million
metric tons were produced (RFA, 2016). The influx in supply led to decreased prices for
byproducts and corn (Dale, 2008). In efforts to increase profitability of corn byproducts,
the dry-grind industry developed several different pretreatment processes that recycle
DGS by utilizing the unfermented sugars remaining after starch fermentation, primarily
from fiber. Several different pretreatments options exist including ammonia fiber
expansion (AFEX) and liquid hot water (LHW), coupled with the enzymatic hydrolysis
which converts polymeric sugars into monomeric (hexose and pentose) sugars utilized by
specific microbes (Kim et al., 2008b). Both pretreatment techniques increased the
hydrolysis rate of DDGS over non-pretreated material with a result of 90% cellulose to
glucose conversion within 24 hours of hydrolysis (Kim et al., 2008b). Virtually all
bacteria utilize hexose (i.e. glucose) first and when glucose is limiting the pentose sugars
are broken down (Ezeji and Blaschek, 2008). After pretreatment, hydrolysis, and
fermentation, the product is called “enhanced DDGS or eDDGS” (Kim et al., 2008b).
The nutrient composition of eDDGS varies relative to DDGS with 41.2% and 28.3%
crude protein, respectively, 2.88% and 6.52% NDF/ADF, respectively (Perkis et al.,
2008). The final result produces more ethanol and leaves behind a byproduct rich in
protein (Dale, 2008).
11
Separating amino acids via protease treatment from DGS will also add value back
to the ethanol market for existing ethanol plants. The amino acids derived can be
separated and isolated for chemical precursors (Brehmer et al., 2008). Another profit
center for ethanol plants is developing advancements in the conventional dry-grind
process to obtain higher-valued byproducts. The lack of diversity of marketable
byproducts, relative to the wet milling process, makes the dry-grind process more
vulnerable to marketing issues (Rausch and Belyea, 2006). This dilemma motivated dry-
grinding facilities to develop methods of separating the germ and fiber from corn before
fermentation. As a result, quick germ, quick germ quick fiber, and enzymatic dry-grind
were developed. These techniques incorporate wet milling technologies to separate and
recover the germ, pericarp fiber, and endosperm fiber. Recovery of germ allows
extraction of corn oil, for higher-value uses. Recovery of pericarp increases fermentor
capacity and provides an enhanced DGS product for nonruminant livestock. Similar to
separation of amino acids, enzymatic dry-grinding uses protease and amylase during the
incubation step allowing endosperm fiber to be separated (Rausch and Belyea, 2006).
AFEX
Ammonia fiber expansion is a pretreatment technology process that facilitates
enzymatic hydrolysis before fermentation. There are many pretreatment processes that
exist for enzymatic hydrolysis. Ammonia fiber expansion (or explosion) is not a novel
development. For many years AFEX has been used to improve digestibility of crop
residues (Dale, 1983). The AFEX process can utilize wet distillers grains or corn stover
to produce ethanol in what is called a 2nd generation technology. Corn stover is the
residual plant material left after corn grain harvest and a common source of
12
lignocellulose (Brehmer et al., 2008). As stated previously, current ethanol production
occurs with fermentation of only the starch portion of corn. Pretreatment of cellulosic
components gives the ethanol industry another option. Without pretreatment, the densely-
packed crystalline cellulose is resistant to enzymatic hydrolysis and overall fermentation
of cellulose (Brehmer et al., 2008). The processes begins by supplying ammonia under
pressure (0.65 – 3.5 MPa) and moderate temperatures (70-150oC) for a short residence
time (5-15 min), which allows the ammonia sufficient time to react with the components
of WDG. The pressure is rapidly released causing the biomass structure to break apart
causing lignin solubilization, hemicellulose hydrolysis, cellulose decrystallization, and
increased surface area for an almost complete enzymatic conversion of cellulose and
hemicellulose to fermentable sugars (Teymouri et al., 2005). Utilizing WDG instead of
DDGS has major effects on hydrolysis, causing reduced yields of sugars and overall
ethanol production (Kim et al., 2008b). The reduction in sugar yields can be caused by
various factors including inefficient mixing of the slurry due to high viscosity, buildup of
glucose and cellobiose that inhibit cellulase activity. During hydrolysis and fermentation,
AFEX pretreated WDG hydrolyzes at least 70 – 80% of glucans to glucose. Glucan
content of DGS is approximately 18 – 20% which is divided between cellulose (2/3) and
residual starch (1/3). The overall results comparing DDGS and WDG shows that ethanol
yields per bushel of corn may be increased by 7 – 10% with WDG (Kim et al., 2010).
The livestock feed product eDDGS, generated from WDG pretreated by AFEX,
contained 50.8% crude protein (CP), 7.2% crude fat, 0.5% NDF/ADF, and 6.0 ash (DM
basis; Kim et al., 2008b). This varies dramatically from traditional DDGS according to

13
Spiehs et al. (2002) which has 30.2% CP, 10.9% crude fat, 8.8% CF, and 5.8% ash.
Overall, AFEX can increase ethanol production by 12% (Brehmer et al., 2008).
Controlled pH Liquid Hot-Water
Similar to AFEX, LHW pretreats hemicellulose allowing easier hydrolysis and
dissolution of hemicellulose providing more rapid saccharification of insoluble cellulose
by cellulase enzymes and improved subsequent enzymatic hydrolysis efficiency (Mosier
et al., 2005). The process starts with corn fiber (40% DM) from a Vetter press
(VetterTec®) mixing with stillage creating slurry. The protein and lactic acid in stillage
buffer the slurry to pH 4.0. Maintaining a pH above 4.0 limits hydrolysis of
polysaccharides. Limiting hydrolysis of polysaccharides to monosaccharides is critical
because monosaccharide degradation produces furfural and 5-hydroxymethylfurfural,
which inhibit the ability of bacteria or yeast to ferment sugars to ethanol (Mosier, 2005).
The slurry is heated to 160ᴼC for an average retention time of 20 minutes and then cooled
to 100ᴼC. The pretreated slurry is then centrifuged leaving a solid cake (26% DM) and a
clear liquid. The result is nearly all the residual starch is solubilized along with 50% of
corn fiber dissolved into fermentable sugars (Mosier et al., 2005). Previous research from
Kim et al. (2008b) reported the composition of eDDGS from LHW pretreatment of WDG
were 94.4% DM, 41.2% CP, 14.7% crude fat, 2.9% NDF/ADF, and 5.3% ash (DM
basis). The DDGS used in that study contained 89.6% DM, 28.3% CP, 14.5% crude fat,
6.5% NDF/ADF, and 4.8% ash. Differences in composition of feed corn, processing
methods, fermentation efficiency, and extents of process liquid recycle cause the
variability in the composition of DDGS (Kim et al., 2008b).

14
Protein Separation
The removal of protein/amino acids from DGS may impact feedlots use of the
corn byproduct. Therefore, it is important to understand the process of amino acid
removal and the effects it has on the overall finished product. Polypeptides are broken-
down to a few bonds and even to free amino acids by removal and separation via protease
enzymes breaking peptide bonds, a mechanism called peptide cleavage or protease
digestion (Brehmer, 2008). This process works in conjunction with AFEX and utilizes the
solid stream after pretreatment. As a result, the protein content of DDGS still remains
high (52.9%) because the fiber portion was reduced which increased the concentration of
the remaining components (Brehmer et al., 2008). It is not clear how much protein can be
separated. The end product, free amino acids, would be used as precursors for chemical
compounds.
If some protein is removed from DGS, its role in ruminant diets, depending on the
amount removed, may change. One protein component not often discussed is protein
contributions from residual yeast. Han and Liu (2010) sampled DDGS from 3 different
plants and reported that yeast contributed 20% of the total protein, with the remaining
80% from corn. Liu (2011) found in the literature at least four methods for estimating
yeast contribution towards DGS. However, little research is available on yeast cells from
DGS and their contributions to the overall protein quality of DGS. Protein quality and
amino acid composition of a feedstuff are important for ruminant and nonruminant
animals alike. Both animals require specific amino acids for maintenance and growth.
Nonruminant animals depend completely on feed to provide the protein they require.
Ruminant animals are unique because they have a microbial population within the rumen.
15
The microbes utilize some of the amino acids from feed to aid in their own maintenance,
growth, and other cellular functions. Some of those microbial cells pass into the
abomasum and small intestine, where ruminants can digest and absorb the microbial
cells. Therefore, ruminants have 2 sources of protein, feed and microbial cells.
Protein as an Energy Source
When DGS is included and provides MP greater than requirements of the animal,
protein in DGS can be utilized as an energy source. The primary protein in DDGS is zein
protein (Klopfenstein et al., 2008). Approximately 63% of the protein from DGS is
rumen undegradable protein, which contributes to metabolizable protein (MP) and
supplies energy, when supplied in excess, to the ruminant animal (Castillo-Lopez et al.,
2013). Firkins et al. (1985) performed one of the first finishing trials with WDG as an
energy source, feeding 0, 25, and 50% of diet DM. When WDG was included, ADG
improved. Cattle consuming 50% WDG gained 1.20 kg/d while corn-control cattle
gained 1.08 kg/d. There was no difference in DMI for treatments; however, feed
conversion tended to improve with inclusion of WDG in the diet. The authors attributed
increased efficiency of WDG as a result of lower likelihood of subacute acidosis and
increased fiber digestibility of byproduct diets. Trenkle (1997) also observed a tendency
for increased ADG, no difference in DMI, and improved feed efficiency when replacing
20% of corn with WDG. Replacing 40% of the diet DM with WDG decreased feed intake
by 10% without affecting ADG, resulting in improved feed efficiency.
Larson et al. (1993) examined WDG in combination with thin stillage, as a source
of protein and energy, in efforts to reduce the use of fossil fuels and drying cost
associated with DDGS. Concerns of transporting moisture and occurrence of spoilage

16
limited the amount of WDGS use at the time. The two byproducts were fed in the same
ratio (1.68:1 ratio of WDG:thin stillage) as produced by the alcohol plants. In two
finishing studies, calf-fed and yearling, cattle fed 5.2, 12.6, or 40% wet distillers
byproduct had reduced DMI and improved ADG compared to the corn control. Calf-feds
were 2, 6, and 14% more efficient and yearlings were 5, 10, and 20% more efficient,
respectively, compared to cattle fed DRC based diets. These data are supported by
findings from Ham et al. (1994) that reported improved ADG, not significant but a
numerical reduction in DMI, and improved feed efficiency for cattle consuming 40%
WDG byproduct compared to corn. Protein content from wet distillers byproducts was
lower than estimated (21.9% CP for WDG byproducts), so lower DMI and protein
content yielded less metabolizable protein (MP) for the intermediate byproduct (5.2 and
12.6%) diets than the corn-control but still above NRC (1985) requirements. The
improvement in ADG was not as a result of CP or MP but from increased energy
utilization of the WDG byproducts. The authors attributed this effect to several factors:
byproducts contained 3 times more corn oil, addition of residual ethanol to the diet, and
increased fiber consumption paired with lower starch availability, similar to Firkins et al.
(1985).
More recently, Watson et al. (2014) included WDGS at 0, 10, 20, 30, 40, and 50%
inclusion in a 50:50 blend of HMC:DRC-based finishing diets. They reported a quadratic
increase in carcass-adjusted final BW as WDGS increased in the diet. A quadratic
response was reported for DMI. As inclusion of WDGS increased from 0 to 20%, DMI
increased, and as inclusion went from 30 to 50% of the diet, DMI decreased. A similar
quadratic response was observed for ADG, as WDGS increased from 0 to 40% gain
17
increased from 1.66 kg/d to 1.96 kg/d, respectively, and at 50% inclusion of WDGS,
ADG decreased. Watson et al. (2014) data agree with Trenkle (1997) and Larson et al.
(1993) as discussed previously. Feed efficiency decreased as inclusion of WDGS
increased with 40% WDGS having the greatest G:F.
Trenkle (2008) replaced 0, 20, 40, and 60% of DRC with WDGS in finishing
diets. Unlike previous studies (Firkins et al., 1985; Larson et al., 1993; Ham et al., 1994;
Vander Pol et al., 2006; and Watson et al., 2014), they observed no difference between 0,
20, and 40% inclusion of WDGS for final BW, ADG, DMI, and G:F when fed to steers
and heifers. Vander Pol et al. (2009) observed the same response with no difference in
final BW, DMI, ADG, and G:F when heifers were fed 0, 20, and 40% WDGS. Few
studies have evaluated WDGS at inclusions above 50%; Farlin et al. (1981) had one of
the first studies on feeding WDGS as a protein and energy source. They replaced 21.25,
42.50, and 63.75% (DM basis) of corn with WDGS. At 63.75% inclusion of WDGS,
cattle had an 11.2% reduction in DMI, similar ADG, and a 10% improvement in G:F
relative to the corn-control. Trenkle (2008) reported decreased final BW, DMI, ADG, and
poorer G:F when cattle consumed 60% WDGS compared to 0, 20, and 40% WDGS.
Feeding values based on performance results, calculated using the feed efficiency
of DGS diet relative to the control diet, and divided by WDGS inclusion, provides an
energy estimate of DGS. Larson et al. (1993) suggested that the increased corn oil in
DGS accounted for part of the increase in energy relative to corn. Klopfenstein et al.
(2008) suggested that RUP and corn oil can only account for 20% increase above corn.
Watson et al. (2014) reported feeding values highest at (178%) 10% inclusion of WDGS
and declined as inclusion of WDGS increased to 50% WDGS (121%). Conroy et al.

18
(2016) evaluated the individual components of DGS on growing cattle performance. All
diets included 50% hay and with 40% DRC as the control diet. When 40% MDGS
replaced 40% DRC, cattle had greater ADG and G:F. The calculated feeding value of
MDGS was approximately 118% the value of corn. The isolated protein from MDGS
(20% CGM, DM basis) had a calculated feeding value of 134% the value of corn.
Oglesbee et al. (2016) observed a similar response when individual components of DGS
were fed in finishing diets. Similar to previously discussed studies, the authors reported
an improvement in ADG and G:F when 20 or 40% WDGS replaced DRC. The calculated
feeding value of WDGS at 40% was 130% the value of corn. When 17.5% CGM was
added with 14% corn bran and 3% solvent extracted meal to replicate the protein and
fiber of DGS, the feeding value was 121% the value of corn. These data suggest that
protein within DGS is a significant portion of the feeding value of the DGS overall.
The effect of corn processing, specifically DRC, HMC, or SFC, can alter cattle
performance when feeding DGS. Vander Pol et al. (2008) compared processing methods
of corn (whole corn, finely-ground corn, DRC, 1:1 blend of DRC:HMC, HMC, or SFC)
in finishing diets containing 30% WDGS (DM basis). The authors reported lower ADG
for fine-ground corn and SFC relative to the other processing methods. Average daily
gain tended to be greater for cattle fed DRC compared to HMC. All processing methods,
except whole corn, had reduced DMI. Cattle consuming HMC were more efficient than
cattle fed fine-ground corn, SFC, and whole corn. However, at 30% inclusion of WDGS,
cattle fed DRC, DRC:HMC, and HMC had no difference in G:F. There was a tendency
for cattle fed DRC to have poorer G:F relative to cattle fed HMC. When WDGS replaced
0, 15, 27.5, and 40% (DM basis) of DRC, HMC, or SFC-based finishing diets, an

19
interaction of processing by WDGS level was observed for ADG and G:F (Corrigan et
al., 2009). Steers fed WDGS in DRC rations had improved final BW and ADG. In HMC
and SFC diets, as WDGS inclusion increased, final BW and ADG improved. Cattle fed
DRC and HMC improved G:F as WDGS inclusion increased. There were no differences
in animal performance as WDGS inclusion increased in SFC diets. In agreement with
Vander Pol et al. (2008), DMI decreased for all corn processing methods. Watson et al.
(2014) also reported a quadratic decrease in DMI as WDGS concentration increased
when feeding a 1:1 blend of DRC:HMC.
Condensed Corn Distillers Solubles
Condensed distillers solubles (CDS), sometimes referenced as syrup, is a liquid
product from dry-grind ethanol production. In dry-grind processing, after the alcohol has
been distillated and removed, what remains is known as whole stillage. In order to reduce
energy costs from drying, whole stillage is centrifuged producing wet grains and thin
stillage. Wet grains become the primary component in distiller grains. Thin stillage (5%
DM) is condensed through evaporation to form CDS (30% DM; Lardy, 2007; NASEM,
2016). The two fractions are combined to produce dry, modified, or wet distillers grains
plus solubles. Wet grains is greater in CP and fiber components, but CDS is greater in fat
and minerals (Rausch and Belyea, 2006). Condensed distillers solubles contain
approximately 25% CP, the RUP is estimated to be approximately 25 to 30% (% CP),
20% fat, 1.57% P, 0.92% S, and 2.3% NDF (NASEM, 2016). When more of the CDS
fraction is added back to the wet grains fraction, then fat, phosphorus, potassium, and
sulfur concentrations are increased compared to DG without CDS. In plants producing
WDGS, 20% (DM basis) is the average inclusion of CDS added to the wet grains
20
(Corrigan et al., 2007). Cao et al. (2009) evaluated ratios of DG:CDS at 100:0, 87:13,
73:27, and 60:40 on nutrient digestibility in TMR diets fed to Holstein cows. Distillers
byproduct was included in the TMR at 8% DM. Keeping in mind that the experimental
diets were formulated for dairy cows, reporting differences between 8% of the diet may
be difficult to interpret. However, the authors reported ruminally degradable DM
increased as the ratio of CDS increased. A greater CDS:DG ratio can provide more
protein available for rumen degradation without inhibiting animal performance. Cao et al.
(2009) reported the immediately soluble DM and CP fractions increased as CDS
inclusion increased. Rate of DM and CP degradation were not different among CDS
treatments. Increasing the CDS fraction increased rumen degradability as the result of a
greater soluble DM and CP fractions. Corrigan et al. (2009) observed a similar response
with greater ruminal, postruminal, and total tract DM digestibilities when CDS, as a
proportion of DDG, increased. Godsey et al. (2009) reported no differences in cattle
performance feeding ratios of WDG:CDS at 100:0, 85:15, and 70:30 at 20 and 40%
WDGS DM inclusions in finishing diets. In finishing diets, a greater CDS:DG ratio will
increase the rumen degradation of the diet with little impact on animal performance.
Trenkle (2003) observed a decrease in DMI as CDS (as an ingredient) inclusion
increased from 0 to 8% (DM basis) in DRC-based finishing diets. There were no
differences in ADG, G:F, or carcass characteristics among treatments. Trenkle and Pingel
(2004) replaced corn grain and supplemental urea with CDS at 0, 4, 8, 12% (DM basis) in
DRC-based finishing diets. They reported no differences in performance or carcass
characteristics with inclusion of CDS. Pesta et al. (2015) observed reduced DMI as CDS
inclusion increased from 0 to 36% in a blend of DRC/HMC-based finishing rations.
21
Average daily gain increased and G:F improved when CDS supplementation increased.
Calculated dietary inclusion of CDS for maximal ADG was 20.8 and greatest G:F at
32.5% (DM basis). Hot carcass weight improved with inclusion of CDS with the greatest
HCW observed at 18% inclusion (DM basis). Oglesbee et al. (2016) conducted a
finishing trial evaluating the different components of WDGS. When 8% CDS was added
to several diets containing different components of DGS, the authors observed greater
DMI, ADG, and final BW with CDS addition. These data suggest feeding up to 8% CDS
may effectively reduce dietary inclusion of corn and improve performance. The authors
suggested that greater levels of CDS inclusion may be acceptable. As Harris et al. (2014)
replaced SFC with CDS in finishing diets and observed a decrease in DMI. Average daily
gain increased and G:F improved and was greatest for both traits at 27% CDS inclusion.
Pesta et al. (2015) evaluated feeding CDS at 0, 7, 14, 21% of diet with 20% MDGS or
20% Synergy (a combination of wet corn gluten feed and MDGS) in finishing diets. A
tendency for diet x CDS inclusion interaction was observed for ADG. Cattle fed MDGS
had improved ADG with the greatest gain for 14% CDS inclusion (DM basis). There
were no differences in ADG were observed when feeding Synergy. Feed efficiency
improved with increasing CDS inclusion, regardless of byproduct type. In MDGS diets,
HCW increased but Synergy had no effect on HCW. Dry matter intake, regardless of diet,
was greatest at 14% CDS and lowest at 21% CDS (DM basis). The authors hypothesized
that the depression in DMI and ADG for 21% CDS (DM basis) may be due to high
dietary fat (8.8% DM basis) within those diets. The dietary fat supplied from CDS used
in this experiment was 18.5% (DM basis). Lardy (2007) suggests that CDS fat content
ranges from 9 to 15%. The variability of nutrients in CDS depends upon the ethanol

22
plants’ methods for extraction of fat. Segers et al. (2015) evaluated the effect of fat
concentration from CDS in growing diets. Condensed distillers solubles was fed at 0, 10,
19, and 27% with dry-corn gluten feed to provide 45% byproduct from each diet.
Compared to DRC-based growing diet, cattle consuming 10% CDS had lower ADG.
Increasing CDS had no effect on ADG, DMI, or G:F. Results from a digestion trial using
the same diets reported improved DM digestibility as CDS inclusion increased. Fat
digestibility increased as inclusion of CDS increased with the greatest digestibility at
19% CDS (DM basis). Corrigan et al. (2009) reported greater ether extract intake and
digestibility with DDG containing 22.1% CDS (DM basis). Increased ether extract intake
did not affect total tract DM, OM, and NDF digestibility. Greater inclusion of dietary fat,
mainly from CDS, did not impact fiber digestibility (Segers et al., 2015). Previous work
has reported dietary fat reduced ruminal fiber digestion and limit intake (Kowalczyk et
al., 1977; Zinn, 1989; Zinn, 1994; Zinn et al., 2000). Henderson (1973) reported long-
chain fatty acids may inhibit some rumen microbes, especially cellulolytic bacteria.
Inhibiting primary fiber digesting bacteria could cause more fiber to escape the rumen
without degradation. Gilbery et al. (2006) reported increased ruminal OM, NDF, ADF,
microbial CP synthesis, and true ruminal CP digestibility with increased CDS
supplementation in low-quality forage diets. Therefore, it is possible that fat from DGS
may behave differently in the rumen relative to other unsaturated fat supplements and not
inhibit fiber digestion in the rumen with inclusions up to 15% (DM basis). Results from
Segers et al. (2015) and Gilbery et al. (2006) suggest that CDS supplementation in
growing or high forage diets does not negatively affect fiber digestion. CDS
supplementation did not perform as well as corn in growing diets (Segers et al., 2015).
23
When priced competitively to corn, CDS can replace corn and be utilized as an energy
source.
Sulfur
During the saccharification process of dry-grind ethanol production, sulfuric acid
is used to lower the pH of the slurry to 4.5 to provide the proper environment for
conversion of starch to glucose (Kwiatkowski et al., 2006). Additionally, sulfuric acid
may be used during cleaning between batches (Vannes et al., 2009). These processes add
S to the already 3-fold concentrated DGS relative to corn. The recommended level of
dietary S is less than 0.3%, with an upper limit of 0.4% (NRC, 1996). Other than DGS,
several other sources of S or sulfate with potential toxicological effects include molasses,
elemental S, drinking water, and gypsum or ammonium sulfate. The potential hazard
associated with feeding S above the tolerated level is inducing polioencephalomalacia
(PEM), a neurologic disorder that causes necrosis of the cerebral cortex (Gould, 1998).
Rumen available S is converted to H2S by rumen microbes. Nichols et al. (2011)
observed cattle consuming a wet corn gluten feed (87.5% DM basis) based finishing diet
containing 0.46% S had significantly lower H2S production compared to diets containing
similar amounts of S but less wet corn gluten feed (0.0, 37.5, or 44.0%; DM basis). Not
all dietary S is available to rumen microbes, particularly S-containing amino acids
contained in the rumen undegradable protein (RUP) portion of DGS (NASEM, 2016).
According to Church (1988), eructated gases enter the trachea at pressures approximating
those occurring in the esophagus during the expulsive phase of eructation and penetrate
deeply into the lungs. Inhalation of eructated H2S causes systemic sulfide absorption
causing softening of the gray matter in the brain. Clinical signs of S-induced PEM

24
include blindness, incoordination, and recumbency with seizures. There are other causes
associated with PEM, such as thiamine deficiency, acute lead poisoning, and water
deprivation-sodium ion toxicosis (Gould, 1998).
Vanness et al. (2009) compiled data from 4,143 cattle on finishing diets including
byproducts and found cattle consuming diets with 0.46% S or below, provided adequate
levels of roughage (approximately 6 – 7.5%), had 0.14% risk of S-induced PEM. When
diets exceeded 0.56% the occurrence increased considerably to 6%. Other than S-induced
PEM, feedlots may notice performance issues when feeding high dietary S. Sarturi et al.
(2013) observed reduced DMI in feedlot cattle fed 0.30% of total dietary S compared to
0.20% DM. Uwituze et al. (2011 and 2011b) reported an 11% and 8.9% decrease in DMI
from DRC and SFC, respectively, finishing diets containing 30% dry DGS high in S
(0.65%) compared to matching diets at a lower S (0.42%) level. Spears et al. (2011) fed
varying levels of dietary S (0, 0.15, or 0.30% of DM) by supplementing NH4SO4 in
ground corn-based (85% of DM) finishing diets and observed a decrease in DMI for
cattle consuming a finishing ration with 0.31 or 0.46% compared to 0% supplemental S.
However, in growing diets containing 86% corn silage, Spears et al. (2011) fed
concentrations of supplemental S at 0.12, 0.30, and 0.46% and found no difference in
DMI. Unfortunately, there were no ruminal parameters measured by Spears et al. (2011)
to indicate if H2S gas production was altered by growing diets and was the reason for
similar performance between treatments. Increasing forage in finishing diets may be able
mitigate negative effects of greater concentrations of S without impacting performance.
Inorganic sources of S (i.e. NH4SO4) may not be appropriate to compare against a blend
of organic and inorganic S from DGS. Uwituze et al. (2011, 2011b), Spears et al. (2011),

25
and Sarturi et al. (2013) reported decreased ADG, by approximately 0.20 kg, for diets
with greater dietary S (0.30, 0.65, and 0.46% of DM, respectively) with limited effect on
feed efficiency. Cattle fed diets greater in dietary S had lesser HCW (Uwituze et al.,
2011; Spears et al., 2011; Sarturi et al., 2013) and lesser 12th rib fat (Spears et al., 2011;
Sarturi et al., 2013).
A deeper look into the rumen environment by Sarturi et al. (2013) showed a
tendency for steers fed finishing diet with 0.55% S to have greater concentration of H2S
in ruminal gas cap compared to steers consuming 0.40% S. Likewise, steers consuming
wet DGS had 72% greater H2S concentration in ruminal gas cap than steers fed dry DGS,
which denotes a negative correlation between ADG and H2S production as S
concentration increases in the diet. Ruminal pH increased in steers fed 0.65% S finishing
diets, which may be attributed to decreased VFA concentration and greater ruminal
ammonia concentrations (Uwituze et al., 2011). Sarturi et al. (2013) reported decreased
propionate production for cattle fed 0.30% dietary S, compared to 0.20%, and only slight
changes in ruminal pH. Overall, when feeding DGS, it is important to know the S
concentration and understand that wet DGS appears to be more easily converted into H2S
and have significant impacts on performance of feedlot cattle.
High levels of S in distillers grains can cause PEM and other metabolic issues.
Not all S in distillers grains is treated equally when it comes to hydrogen sulfide
production. Sarturi et al. (2013b) studied the effects of organic and inorganic sources of
S. Corn gluten meal served as an organic source and ammonium sulfite was fed as
inorganic source of S. Wet distillers grains plus solubles was considered a combination of
organic and inorganic source of S. In this metabolism trial, S content tended to reduce

26
intake only when inorganic S was fed. Rumen available S was measured via IVDMD
analytical procedure to measure ruminal reduction to sulfide. Both inorganic S and
WDGS resulted in greater levels of rumen available S compared to organic sources.
Organic S is less available in the rumen because the majority of S is from S containing
amino acids, which either escape degradation or are incorporated into rumen
microorganisms. Ruminal H2S gas was collected from the ruminal gas cap, inorganic and
WDGS had greater ruminal H2S gas production compared to organic sources even though
an organic S source and WDGS were fed at similar dietary levels of S. The regression
equation between ruminal hydrogen sulfide gas concentration and total S intake only
explained 29% of the ruminal H2S variation. While adjusted ruminal protein S and rumen
available S accounted for 58 and 65%, respectively, of ruminal H2S production, these
results demonstrate that source of S is more useful than total S in determining H2S
production.
Fiber in High Concentrate Diets
Digestion is defined as the process of physically and chemically breaking down
nutrients into substances that can be absorbed. Ruminant animals are able to digest fiber
by utilizing a symbiotic relationship with microorganisms. Fiber digestion occurs almost
exclusively in the rumen because mammals lack the digestive enzymes to break fiber
polymers. Therefore, maximizing ruminal fiber digestion is most energetically efficient
because the rumen is the site of fiber digestion (Moore et al., 1990). Optimal
concentration and type of roughage in concentrate diets are related to many factors such
as availability, price, and interaction with other ingredients in the diet (Hales et al., 2014).
In recent years, there has been an increase in the use of alternative roughage sources due
27
to reduced hay availability and abundance of crop residues. Changing roughage sources
can affect various factors in fiber digestion such as extent of digestion, rate of passage,
and rate of digestibility. It is important to examine these characteristics of different
roughage types before substituting them in concentrate diets.
Roughage plays an important role in high-concentrate diets to help maintain
rumen function and prevent ruminal acidosis. Roughage is typically the most expensive
ingredient when priced on an energy basis. Forages are difficult ingredient to handle
when mixing rations due to its bulky nature. All these factors are important
considerations when selecting roughage source and level. According to a survey from
Galyean and Gleghorn (2001), consulting nutritionists reported that finishing diets
contained 4.5 to 13.5% (DM basis) roughage, with the main sources being alfalfa hay and
corn silage. In finishing diets, cattle consume feed to a chemostatic intake. Gut fill rarely
limits intake of finishing diets, so when greater levels of roughage are included, the
animal typically consumes more feed to maintain similar energy intake. Compensation
from increased DMI occurs only until the level of roughage is high enough to impose
limitations via gut fill (Galyean and Defoor, 2003).
Using Neutral Detergent Fiber to Evaluate Forage Quality
Neutral detergent fiber is a measurement of cellulose, hemicellulose, and lignin
that can be used to evaluate forage quality (Jung and Allen, 1995). Past studies (Theurer
et al. 1999; Shain et al. 1999; Defoor et al. 2002) summarized by Galyean and Defoor
(2003) have evaluated the effects of substituting roughage type based on NDF
concentration and concluded that the substitution of low-quality for high-quality
roughage is possible without negatively affecting DMI, ADG, or G:F. The effects of

28
exchanging roughage on NDF concentration for digestibility characteristics needs further
examination. A meta-analysis by Galyean and Defoor (2003) compiled 11 trials to
evaluate roughage source and level on DMI by feedlot cattle. The authors reported that
DMI, as a % of BW, increased as level of roughage increased. However, the correlation
was relatively low (r2 = 0.699) between DMI and roughage level. Using the values
provided within the trial or values from the NRC (1996) NDF, eNDF, and NEg were
calculated and used for the regression of DMI. Dietary NEg supplied by roughage
resulted in small differences in DMI and can be explained by small changes in NEg
provided among the data points in the database. High correlations for NDF and eNDF (r2
= 0.92 and r2 = 0.931, respectively) demonstrate that the effects of roughage level on
DMI are associated with NDF supplied by roughage in feedlot diets. The greater variation
by eNDF were slightly higher than that of NDF suggesting eNDF is a better tool for
evaluating roughage source and level. The authors explain that NDF is a more practical
choice for feedlots to use when considering different roughage sources. The relationship
between NDF from roughage and DMI in finishing diets can be partially explained by
lower risk of acidosis. Greater NDF intake per unit of grain might increase or stabilize
ruminal pH by lower proportions of fermentable substrate in each bite, as well as
stimulate more chewing and saliva secretion. It is unlikely that the inherent buffering
capacity of roughages, included at low levels, in finishing diets has much effect on
ruminal pH. Another contribution towards more stable ruminal pH might be increased
passage rate of the feed. If increasing NDF from roughage increased the passage rate of
grains, less fermentation of those grains would occur within the rumen, resulting in a
lower acid load and increased DMI (Galyean and Defoor, 2003).
29
Defoor et al. (2002) determined the effects of dietary NDF supply from roughages
on NEg intake by comparing alfalfa hay, sudan hay, cottonseed hulls, and wheat straw
(40, 66, 86, and 80% NDF) in three 4 × 4 Latin squares at 5%, 10%, and 15% of dietary
DM. Net energy for gain intake tended to be greater for cottonseed hulls (45.55/kg of
BW0.75) compared to alfalfa and sudan hay (35.74 and 40.66/kg of BW0.75) with no
difference between cottonseed hulls and wheat straw. Therefore, roughages with greater
NDF concentrations provide more energy at similar DM inclusions. Defoor et al. (2002)
also examined three different methods of dietary roughage exchange in a 90%
concentrate steam-flaked corn based diet. Cottonseed hulls and sudan silage were
compared to alfalfa at 12.5% of dietary DM, equal NDF level, and equal NDF level with
particles less than 2.36 mm considered to supply minimal NDF to the diet. NEg intakes
were greater for cottonseed hulls and sudan silage at equal dietary DM inclusion in
comparison to alfalfa. This indicates that cottonseed hulls and sudan silage, which are
higher in NDF, are required at lesser concentrations in the diet for similar responses to
alfalfa. No difference was observed for NEg intake between cottonseed hulls and alfalfa
at equal NDF levels, so the exchange of alfalfa for cottonseed hulls can be made at equal
NDF inclusion. Feeding sudan silage showed no difference in NEg intake compared to
alfalfa at equal NDF inclusion excluding particles 2.36 mm or smaller, which indicates
that sudan silage is needed at a lower level of NDF for substitution.
A similar study by Quinn et al. (2011) found no difference with in vitro
digestibility between alfalfa and coastal bermudagrass at equivalent NDF concentrations,
suggesting that at equal NDF concentrations, different roughage sources will not affect
digestibility between roughage types. Poore et al. (1991) reported the opposite effect
30
when including chopped wheat straw and chopped alfalfa hay at equal NDF
concentrations of the diet on lactating Holstein cows. Organic matter digestibility was
greater for alfalfa than wheat straw (67.2 vs. 63.5%) and NDF digestibility followed a
similar pattern (43.5 vs 31.2%). The difference between the experiments is that Poore et
al. (1991) matched the NDF concentration of the diet and not of the individual forages.
This suggests that NDF composition is different between the overall diet and roughage
type in terms of digestibility. Hales et al. (2014) found similar results, reporting that dry
matter and organic matter digestibility was reduced for alfalfa hay as inclusion increased
within the diet demonstrating that increasing the NDF concentration of the diet will
negatively impact digestibility.
Using Dry Matter Inclusion to Evaluate Forage Quality
Another method of exchanging different roughage types is DM concentration.
Galyean and Defoor (2003) also compiled previous work (Kreikemeier et al. 1990 and
Bartle et al. 1994) evaluating roughage inclusion based on DM concentration. Animal
performance was significantly different for high-quality compared to low-quality
roughages. However, fiber digestibility was not accounted for in these studies.
Moore et al. (1990) compared the effects of partial exchange of alfalfa hay,
cottonseed hulls, and wheat straw (DM basis) on digestibility in a 65% concentrate
steam-flaked milo diet. The control diet included alfalfa hay at 35% DM, and cottonseed
hulls or wheat straw replaced half of alfalfa hay in the remaining two diets. Dry matter
intake was greater for cottonseed hulls compared to alfalfa hay (6.9 and 5.9 kg/d,
respectively), and cottonseed hulls had significantly lower DM (74.9%) and NDF
(43.9%) digestibility compared to alfalfa hay (80.3 and 56.4% for DM and NDF
31
digestibility, respectively) and wheat straw (79.4 and 51.6% for DM and NDF
digestibility, respectively). Cell solubles digestibility was similar between all three
roughage types. In the second experiment by Moore et al. (1990), in situ digestibility of
DM and NDF were evaluated on the same diets. Digestibility of cottonseed hulls and
wheat straw (41.3 and 53.8%, respectively) tended to be lower than alfalfa hay (80.1%).
Likewise, cottonseed hulls and wheat straw had tendencies for reduced NDF digestibility
(22.4 and 40.4%) compared to alfalfa hay (61.7%). Despite reduced digestibility, the
combination of wheat straw and alfalfa increased DM and NDF digestibility for alfalfa.
Increased digestibility for alfalfa is explained as an effect from longer rumen retention
time. Total tract digestion of DM and NDF decreased for cottonseed hulls, which agrees
with previous work of Moore et al. (1990). The complete or partial substitution, on a DM
basis, of alfalfa for cottonseed hulls reduces DM and NDF digestibility.
Moore et al. (1990) reported rumination of wheat straw was greater (14 min/h)
compared to the alfalfa hay and cottonseed hulls (10 and 11 min/h). This agrees with
Mertens et al. (1997), who summarized several studies that found similar results for oat
straw, which required more time for rumination compared to alfalfa (Sudweeks et al.,
1979 and Freer et al., 1962). Shain et al. (1999) further analyzed rumination and
compared particle size (small or large) of alfalfa hay to wheat straw and corncobs.
Rumination time was longer for large particle size wheat straw compared to both alfalfa
hay diets. Also, steers spent more time ruminating small particle size wheat straw
compared to small particle size alfalfa hay and corncobs. Since all diets were formulated
for equal NDF, these results suggest that lower quality roughages increase rumination.
According to Cole et al. (1976) altering rumination time causes differences in particle

32
size and ultimately changes rate of passage. In contrast to this statement, Moore et al.
(1990) reported no difference in liquid turnover between wheat straw, alfalfa hay, or
cottonseed hulls with different rumination times. Increased rumination did not impact rate
of passage. Ruminal pH did not differ between alfalfa hay, cottonseed hulls, and wheat
straw (6.0, 6.4, and 6.4, respectively) which supports Weiss and Shockey (1991) who
found no difference in ruminal pH between orchardgrass and alfalfa silage.
Ruminal pH was not affected by low-quality roughages at low inclusion levels
and should not be a concern when determining roughage source for concentrate diets.
Wheat straw and oat straw had noticeable increases in rumination. Theoretically,
increasing rumination would trigger a cascade of events including: increased saliva
production, reduced particle size, and increased supply of bicarbonate to the rumen and
as a result would increase pH, but this was not the case with Moore et al. (1990).
In agreement with the results by Moore et al. (1990), Poore et al. (1991) reported
no difference in ruminal passage rate when feeding chopped alfalfa hay or chopped wheat
straw, at a particle size of 5 cm, as a proportion of roughage NDF. Liquid passage rate of
alfalfa hay was similar to wheat straw. These results agree with Shain et al. (1999), who
reported no difference in ruminal passage rate between an all-concentrate diet, alfalfa or
wheat straw with small (2.54 cm) particle size, alfalfa or wheat straw with large (12.4
cm) particle size, and corncobs. Alternatively, Hoffman et al. (1998) determined alfalfa
silage had a faster rate of passage (4.86%/h) than perennial ryegrass silage (4.05%/h), and
dry matter intake was reduced for perennial ryegrass silage. The authors suggested that in
high forage diets the rate of passage and feed intake have a direct relationship in which
slower passage rates restrict feed intake. Mertens et al. (1980) reported shorter lag time

33
for alfalfa (0.86 h) compared to coastal bermudagrass (3.05 h). Therefore, alfalfa spent
less time in the rumen thereby allowing less time for cellulolytic and other classes of
bacteria to break down the β- 1,4 or β- 1,6 bonds of the fiber constituents. It can be
concluded when a roughage has increased rate of passage and decreased retention time,
digestibility will decrease.
One area of research that most authors agreed upon was the effect of starch on the
passage rate of roughages. Most of the papers suggest that starch has limited or no effect
on passage rate of the roughage. Eng et al. (1964) agree with this reasoning and state the
average rate of passage for roughages is dependent on the amount consumed and remains
independent of grain passage rate.
Moore et al. (1990) found rate of digestion, at 96 h of fermentation, was not
significantly different between wheat straw, alfalfa hay, and cottonseed hulls, but the
combination of alfalfa with wheat straw displayed tendencies to have a faster rate of
digestibility. In contrast to these findings, Mertens et al. (1980) found decreased rate of
digestion for alfalfa and fescue (6.70 and 6.58%/h, respectively) compared to
orchardgrass. Kinser et al. (1988) reported rate of digestion was significantly reduced
when rice hulls replaced corncobs in pelleted diets fed to rams. Rice hulls had more
grams per day of DM, OM, and NDF flow through the duodenum. Providing evidence
that rice hulls are less digestible and are of lower forage value in comparison to corncobs.
Ruminal pH was similar for cattle fed both rice hulls and corncobs (5.60 and 5.61)
agreeing with Moore et al. (1990) and Weiss and Shockey (1991). Total VFA production
was slightly greater for rice hulls (107.3 mM) compared to corncobs (101.5 mM) but not
statistically significant. Poore et al. (1991) also reported VFA production with acetate,
34
propionate, butyrate, and valerate concentrations greater for alfalfa, but the
acetate:propionate ratio was reduced for wheat straw. Shain et al (1999) also reported
decreased VFA production for wheat straw. However, acetate:propionate ratio increased
numerically for wheat straw diets. This may be due to increased rumination causing more
salivation, which creates a dilution affect and increases the pH of the rumen. This
increase in pH provides a more favorable environment for the production of acetate over
propionate (Sudweeks, 1977; Latham, 1974).
Corn Residue
The increased demand for fuel ethanol led to rising corn price in the past ten
years. The response to high corn prices caused more land to be converted from forage
production to corn production. It is estimated that from 2006 to 2011, 0.526 million ha of
range and pastureland were converted to corn and soybean production from Minnesota,
Iowa, North Dakota, South Dakota, and Nebraska (Wright and Wimberly, 2013). With
less traditional forage available, alternative forages, such as corn stover, were more easily
available and became more common as a forage source with higher corn prices. Corn
stover consists of stalk, leaf, cob, and husk components of the corn plant after grain
harvest. For every kilogram of corn grain produced, approximately 0.8 kg of
aboveground residue can be harvested (Watson et al., 2015). According to USDA-NASS
(2016), corn grain production in 2015 was estimated to be 3.45 trillion kg yielding 2.76
trillion kg of corn stover available. Other factors that influence corn stover availability
include uses in the ethanol industry for cellulosic fermentation, livestock grazing, and
proximity to feedlots (Watson et al., 2015).

35
Chemical Treatment
Corn stover is usually considered low-quality forage because the plant has
reached physiological maturity resulting in low protein content and digestibility
(Klopfenstein et al., 1987). At maturity, the corn plant has developed cross-linkages of
lignin within the cell wall (Jung and Allen, 1995). Enzymes that breakdown cell wall
carbohydrates have limited access to hemicellulose and cellulose due to the lignin cross
linkages (Jung and Deetz, 1993). Chemical treatment of corn stover using alkali
compounds, sodium, calcium, or ammonium hydroxide, breaks cross linkages between
hemicellulose, lignin, and cellulose, as well as disruption of H bonding between cellulose
molecules (Klopfenstein et al., 1972; Fahey et al., 1993). These reactions make
hemicellulose and cellulose more available for rumen microbial degradation
(Klopfenstein, 1978). The improvement in degradation of hemicellulose and cellulose by
rumen microorganism improves rate and extent of digestion (Klopfenstein et al., 1987).
Several chemicals have been screened in laboratory experiments to treat corn stover. Four
primary chemicals used include: sodium hydroxide, ammonium hydroxide, calcium
hydroxide, and potassium hydroxide (Klopfenstein, 1978). The practical application of
these treatments is impeded by technical, economical, and environmental concerns (Shi et
al., 2016).
There have been many studies evaluating the effects of treating forages with alkali
compounds. The treatment of forages with NaOH has been practiced for many decades
and has reported to improve the feeding value of forages (SundstØl et al., 1988).
Klopfenstein et al. (1972) examined treating corn stover with NaOH at 0, 3, or 5%, and
adding water to bring moisture to 50%, then ensiling the residue. Treatments were fed to

36
lambs in a metabolism trial. Treatment of corn stover at 3 and 5% NaOH increased true
organic matter digestibility compared to untreated corn stovers with no difference
between 3 and 5% NaOH. In Vitro DMD was increased for 3% NaOH treated corn stover
compared to untreated corn stover. Five percent NaOH treatment caused a further
increase in DMD over 3% NaOH treatment. There were no differences for VFA profiles,
rumen ammonia concentrations, and rumen pH between treatments. It should be noted
that the authors shared concerns about the level of Na added to the diet by chemical
treatment and should be considered when formulating rations. Fahey et al. (1993)
summarized 24 studies with NaOH treatment on crop residues. An average improvement
of 22% was calculated for DMI and a 30% increase in DM digestibility with NaOH-
treated crop residues. Lately, the use of NaOH has decreased due to environmental
concerns of Na leaching into the soil and excessive Na intake of the animal (Shi, 2016).
Therefore, more attention has been on using weaker bases, such as ammonia and
Ca(OH)2, to treated forages.
The mode of action for ammoniation is similar to that of NaOH. However,
improvement in the digestibility of roughages treated with ammoniation tends to be lesser
compared to NaOH (Fahey et al., 1993). Males (1987) observed an average improvement
in IVDMD of 16% with NaOH treatment compared to NH3-treated straw. Two
advantages to NH3-treated forages, over NaOH treatment, is added N and reduced Na
added to the forage (Males, 1987). There is two methods to applying NH3 to forages. The
most common method is dry application and the other method being wet application
(Males, 1987). Saenger et al. (1982) performed a feeding and metabolism trial utilizing
corn stover treated with anhydrous ammonia (NH3) at 3% and 2% DM, respectively.

37
Corn stover bales were treated with NH3 by covering all bales with plastic and applying
NH3 into the sealed enclosure. Bales remained covered for three weeks and were
uncovered one week prior to initiation of trial. Ammoniation increased the crude protein
content of corn stover by approximately 7.2 %, which is due to N retention by the corn
stover. Cattle consuming treated corn stover had greater DMI than cattle fed non-treated
corn stover in both trials. Morris and Mowat (1980) also observed greater intakes of corn
stover with ammoniation compared to non-treated corn stover. Fahey et al. (1993)
summarized 21 studies using NH3-treated crop residues and reported an average increase
in DMI of 22%. Saenger et al. (1982) observed a 10% increase in DM digestibility for
treated corn stover compared to non-treated corn stover. Likewise, Fahey et al. (1993)
summarized 32 studies and reported an average increase of 15% in DM digestibility of
NH3-treated crop residues. Oji et al. (1977) found similar results when corn stover was
treated with 3 or 5% NH3 fed to lambs in a metabolism trial. Ammoniated corn stover
was reconstituted with 30% moisture and ensiled for at least 30 days. Lambs fed either 3
or 5% NH3 treated corn stover improved DMI compared to non-treated corn stover with
no difference between NH3 concentration. Likewise, DM digestibility was improved with
treatment of corn stover with no difference between 3 or 5% NH3.
Previously, Ca(OH)2 was believed to be ineffective at improving digestibility
(Fahey et al., 1993). However, recent studies have reported the effectiveness of CaO
treatment on the digestibility of corn stover (Chapple et al., 2014; Duckworth et al., 2014;
Shreck et al., 2015; Shi et al., 2016). Compared with NaOH and ammonia, Ca(OH)2 may
be less expensive and safer to handle (Shi, 2016). Duckworth et al. (2014) evaluated the
effects of CaO-treated corn stover fed with 40% MDGS (DM basis) on growth

38
performance, carcass characteristics, and ruminal metabolism in finishing diets. Treating
corn stover with 5% CaO (DM basis) and hydrating to 50% DM, included at 20% (DM
basis) of the diet, improved DM digestibility but decreased DMI and ADG compared to
untreated corn stover. Chapple et al. (2015) fed the same amount of MDGS and corn
stover, except that their control contained 5% untreated corn stover. Since control diets
were different between the two studies, direct comparison is difficult. Chapple et al.
(2015) reported increased apparent NDF and ADF digestibility for treated corn stover.
Cattle consuming CaO treated corn stover had decreased DMI and similar ADG
compared to untreated corn stover. In addition, Chapple et al. (2015) hydrated all treated
corn stover to 50% DM and treated with 5% CaO, 4% CaO plus 1% NaOH, and 3% CaO
plus 2% NaOH. There were no differences in digestibility of corn stover between the
combinations of CaO and NaOH. Shreck et al. (2015) evaluated CaO treated corn stover
in diets containing 40% WDGS on finishing performance and carcass characteristics.
Corn stover was treated at 5% (DM basis) with CaO, hydrated to 50% DM, and included
in the diet at 20% (DM basis). Cattle consuming treated corn stover had greater ADG,
G:F, and final BW compared to untreated corn stover. Shreck et al. (2015) performed a
metabolism study with similar diets only corn stover was include at 25% (DM basis) of
the diet. Greater DM, OM, and NDF digestibilities were observed for treated corn stover
compared to untreated corn stover. Shi et al. (2015) examined various levels of CaO
treatment (3, 5, and 7% of dry-corn stover) and various moisture levels (40, 50, and 60%)
on digestibility parameters. Treated corn stover improved digestibility compared to
untreated corn stover. Corn stover treated with 7% CaO at 60% moisture had the greatest
DM, OM, and NDF digestibilities. However, there was no difference between 7% and

39
5% CaO at 60% moisture. Using 5% CaO treatment, or a combination of CaO and
NaOH, will sufficiently improve digestibility. Overall, improved NDF digestibility
suggests that CaO treatment of corn stover is effective at solubilizing some
carbohydrates.
Pelleting
Another modification to improve the utilization of corn stover is pelleting. The
primary advantage of pelleting is that a product is produced which can be easily stored
and transported. Typically, corn stover will be treated (i.e. alkali treatment) before the
pelleting process. The major disadvantage for pelleting is the cost of collection and
transportation of bulky residues prior to treatment and pelleting (Klopfenstein, 1978).
Several companies have created pelleted feeds by combining corn stover with DGS or
other corn byproducts. Incorporation of these byproducts improves the nutritional
composition of the corn stover pellet. Several studies have examined the contributions of
these pelleted products in beef cattle diets. Clark et al. (2013) evaluated a pelleted corn
stover product, included at 15% (DM basis), as a roughage in finishing diets. The pellet
contained 33% corn stover, 33% DDG, and 33% undescribed commodities. It was not
reported whether the corn stover was chemically treated. Compared to the corn control,
cattle consuming the corn stover pellet had lower ADG, DMI, HCW, 12th rib back fat,
and yield grade. Digestive disturbances, such as acidosis and bloat, became an occurring
issue and was believed to be caused by lower amounts of effective fiber from the pellet. It
is possible that the poor performance observed in this study was partially due to
reoccurring digestive disturbances. Sewell et al. (2009) analyzed several forages,
including corn stover, wheat straw, switchgrass, and corn fiber:wheat chaff combinations,

40
treated with 5% (DM basis) CaO and 35% water and pelleted with DDGS. The pelleted
product was 75% residue and 25% DDGS (DM basis) and replaced corn in the diet. Like
previously discussed, DM, NDF, and ADF digestibility were improved when wheat straw
and corn stover were chemically treated and pelleted compared to unprocessed forages.
When treated wheat straw pellets were included at 50% (DM basis) of the diet, cattle had
improved ADG and G:F compared to conventional wheat straw. When treated wheat
straw pellets replaced corn, cattle had similar ADG but greater DMI. Therefore,
chemically treating and pelleting crop residues improves diet digestibilities compared to
conventional crop residues. Pelleting corn stover makes storage and transportation of low
quality forages easier and more economical. Data suggest pelleted crop residues may
serve as a partial corn replacement for finishing diets.
Conclusion
Based on the literature cited in this review it is clear that ethanol byproducts (i.e.
distillers grains) are widely utilized protein source for beef cattle feeding operations. As
demand for ethanol continues, ethanol plants will continue to develop methods of
fractionating the components of corn. More components will be removed resulting in an
altered distillers grains. Knowing the techniques and methods of ethanol production from
dry-grind, wet milling, and dry milling facilities will provide better insight into the
potential byproducts produced. At times of high corn price, utilizing distiller grains or
condensed distillers solubles to provide protein and energy can prove to be economical
without compromising performance. When feeding ethanol byproducts understanding the
concentration of rumen available S (i.e. inorganic sources) will prove helpful in avoiding
S toxicity issues. Processing corn stover by alkali treatment and pelleting has proven to

41
improve the digestibility and utilization of low quality forages in finishing diets.
Therefore, the objectives for this thesis include: 1) determine the effect of replacing corn
bran, from the dry milling industry, which contains more protein, from a DGS composite
diet with CaO treated corn stover on feedlot performance and carcass traits; 2) evaluate
the effect of exchanging protein from a DGS composite with corn bran and CDS on
feedlot performance and carcass traits; 3) evaluate protein from DGS on feedlot
performance, carcass traits, nutrient digestibility, ruminal VFA concentration, and
ruminal pH.

42
Literature Cited
Bartle, S.J., Preston, R.L., and M.F. Miller. 1994. Dietary energy source and density:
effects of roughage source, roughage equivalent, tallow level, and steer type on feedlot
performance and carcass characteristics. J. Anim. Sci. 72:1943-1953.
Brehmer, B., B. Bals, J. Sanders, and B. E. Dale. 2008. Improving the corn-ethanol
industry: Studying protein separation techniques to obtains higher value-added product
options for distillers grains. Biotech. Bioeng. 101: 49-61.
Bremer, V. R., A. J. Liska, G. E. Erickson, K. G Cassman, K. J. Hanford, and T. J.
Klopfenstein. 2011. Impact of distillers grains moisture and inclusion on greenhouse gas
emissions in the corn-ethanol-livestock life cycle. Neb. Beef Cattle Rep. 42-43.
Bremer, V. R., K. J. Hanford, G. E. Erickson, and T. J. Klopfenstein. 2011b. Meta-
analysis of feeding calf-feds or yearlings wet distillers grains with different corn
processing types. Neb. Beef Cattle Rep. 40-41.
Bremer M. L., C. J. Bittner, D. B. Burken, G. E. Erickson, J. C. MacDonald. 2015.
Response to increasing concentrations of de-oiled modified distillers grains plus solubles
in beef feedlot diets. Neb. Beef Cattle Rep. 74-76.
Buckner, C. D., M. F. Wilken, J. R. Benton, S. J. Vanness, V. R. Bremer, T. J.
Klopfenstein, P. J. Kononoff, and G. E. Erickson. 2011. Nutrient variability for distillers
grains plus solubles and dry matter determination of ethanol by-products. The Prof.
Anim. Scientist. 27: 57-64.
Cao, Z. J., J. L. Anderson, and K. F. Kalscheur. 2009. Ruminal degradation and intestinal
digestibility of dried or wet distillers grains with increasing concentrations of condensed
distillers solubles. J. Anim. Sci. 87:3013-3019.
CEPA. 2011. California-Modified GREET Pathway for the Production of Biodiesel from
Corn Oil at Dry Mill Ethanol Plants. California Environmental Protection Agency.
Cereal Process Technologies, LLC. 2012. http://www.cerealprocess.com/media/
Chapple, W. P., M. J. Cecava, D. B. Faulkner, and T. L. Felix. 2015. Effects of feeding
processed corn stover and distillers grains on growth performance and metabolism of
beef cattle. J. Anim. Sci. 93:4002-4011.
Church, D. C. 1988. The ruminant animal. Digestive physiology and nutrition. pp. ix-564.
Clark, C. A., P. J. Gunn, and D. L. Maxwell. 2013. Utilization of pelleted corn
stover/DDG feed as primary of roughage and protein in beef feedlot rations. Iowa State
Research Farm Progress Rep. Paper 2093.
Cole, N. A., R. R. Johnson, and F. N. Owens. 1976. Influence of roughage level on the
site and extent of digestion of whole shelled corn by beef steers. J. Anim. Sci. 43:483–
489.
43
Conroy, B. B., C. J. Bittner, J. C. MacDonald, M. K. Luebbe, and G. E. Erickson. 2016.
Effects of feeding isolated nutrient components in MDGS on growing cattle performance.
Neb. Beef Cattle Rep. 29-30.
Corrigan, M. E., G. E. Erickson, T. J. Klopfenstein, M. K. Luebbe, K. J. Vander Pol, N.
F. Meyer, C. D. Buckner, S. J. Vanness, and K. J. Hanford. 2009. Effect of corn
processing method and corn wet distillers grains plus solubles inclusion level in finishing
steers. J. Anim. Sci. 87:3351-3362.
Corrigan, M. E., G. E. Erickson, T. J. Klopfenstein, K. J. Vander Pol, M. A. Greenquist,
M. K. Luebbe, K. Karges, M. L. Gibson. 2007. Effect of distillers grains composition and
level on steers consuming high-quality forage. Neb. Beef Cattle Rep. 17-18.
Dale, B. E. 1983. Biomass refining: Protein and ethanol from alfalfa. Ind. Eng. Chem.
Prod. Res. Dev. 22:466-472.
Dale, B. E. 2008. Distillers grains: On the pathway to cellulose conversation.
Bioresource. Tech. 99:5155-5156.
Defoor, P. J., M. L. Galyean, G. B. Salyer, G. A. Nunnery, and C. H. Parsons. 2002.
Effects of roughage source and concentration on intake and performance by finishing
heifers. J. Anim. Sci. 80:1395–1404.
Depenbusch, B. E., E. R. Loe, M. J. Quinn, M. E. Corrigan, M. L. Gibson, K. K. Karges,
J. S. Drouillard. 2008. Corn distillers grains with solubles derived from traditional or
partial fractionation process: Growth performance and carcass characterstics of finishing
feedlot heifers. J. Anim. Sci. 86:2338-2343.
Duckworth, M. J., A. S. Schroeder, PAS, D.W. Shike, D. B. Faulkner, and T. L. Felix,
PAS. 2014. Effects of feeding calcium oxide on growth performance, carcass
characteristics, and ruminal metabolism of cattle. The Prof. Anim. Sci. 30:551-560.
Eng, K. S., M. E. Riewe, J. H. Craig, and J. C. Smith. 1964. Rate of passage of
concentrate and roughage through the digestive tract of sheep. J. Anim. Sci. 23:1129.
Ezeji, T., H. P. Blaschek. 2008. Fermentation of dried distillers grains and solubles
(DDGS) hydrolysates to solvents and value-added products by solventogenic clostridria.
Bioresource Tech. 99:5232-5242.
Fahey, G. C., L. D. Bourquin, E. C. Titgemeyer, and D. G. Atwell. 1993. Post harvest
treatment of fibrous feedstuffs to improve their nutritive value. P. 715-766 in Forage Cell
Wall Structure and Digestibility. H. G. Jung, D. R. Buxton, R. D. Hatfield, and J. Ralph,
ed. ASA-CSSA-SSSA, Madison, WI.
Farlin, S. D. 1981Wet distillers grains for finishing cattle. Anim. Nut. And Health. 36:35-
36.
Firkins, J. L., L. L. Berger, and G. C. Fahey, Jr. 1985. Evaluation of wet and dry distillers
grains and wet and dry corn gluten feeds for ruminants. J. Anim. Sci. 60:847-860.

44
Freer, M. R., C. Campling, and C. C. Balch. 1962. Factors affecting voluntary intake of
foods by cows. 4. The behavior and reticular motility of cows receiving diets of hay, oat
straw, and oat straw with urea. Br. J. Nutr. 16:279.
Galyean, M. L., and P. J. Defoor. 2003. Effects of roughage source and level on intake by
feedlot cattle. J. Anim. Sci. 81:E8-E16.
Galyean, M. L., and J. F. Gleghorn. 2001. Summary of the 2000 Texas Tech University
consulting nutritionist survey. Burnett Center Internet Progress Rep. 12.
Gilbery, T. C., G. P. Lardy, S. A. Soto-Nacarro, M. L. Bauer, and J. S. Caton. 2006.
Effects of corn condensed distillers solubles supplementation on ruminal fermentation,
digestion, and in situ disappearance in steers consuming low-quality hay. J. Anim. Sci.
84:1468-1480.
Godsey, C. M., M. K. Luebbe, J. R. Benton, G. E. Erickson, and T. J. Klopfenstein. 2009.
Effect of the grains-to-solubles ratio in diets containing wet distillers grains ± solubles
fed to finishing steers. Neb. Beef Cattle Rep. 59-61.
Godsey, C. M., M. K. Luebbe, J. R. Benton, G. E. Erickson, T. J. Klopfenstein, C.
Ibanez, P. Guiroy, M. Greenquist, J. Kazin. 2010. Evaluation of feedlot and carcass
performance of steers fed different levels of E-corn, a potential new feed product from
ethanol plants. Neb. Beef Cattle Rep. 69-71.
Gould, D. H. 1998. Polioencephalomalacia. J. Anim. Sci. 76:309-314.
Hales, K. E., T. M. Brown-Brandl, and H. C. Freetly. 2014. Effects of decreased dietary
roughage concentration on energy metabolism and nutrient balance in finishing beef
cattle. J. Anim. Sci. 92:264-271.
Ham, G. A., R. A. Stock, T. J. Klopfenstein, E. M. Larson, D. H. Shain, and R. P.
Huffman. 1994. Wet corn distillers byproducts compared with dried corn distillers grains
with solubles as a source of protein and energy for ruminants. J. Anim. Sci. 72:3246-
3257.
Han, J. and K. Liu. 2010. Changes in composition and amino acid profile during dry
grind ethanol processing from corn and estimation of yeast contribution toward DDGS
proteins. J. Agric. Food Chem. 58:3430-3437.
Harris, M. E., G. E. Erickson, K. H. Jenkin, and M. K. Luebbe. 2014. Evaluating corn
condensed distillers solubles concentration in steam-flaked corn finishing diets on cattle
performance and carcass characteristics. Neb. Beef Cattle Rep. 86-87.
Hatch, C. F., T. W. Perry, M. T. Mohler, and W. M. Beeson. 1972. Effect of added fat
with graded levels of calcium to urea-containing rations for beef cattle. J. Anim. Sci.
34:483-491.
Henderson. C., 1973. The effects of fatty acids on pure cultures of rumen bacteria. J.
Agric. Sci. 81:107-112.
ICM Incorporated. 2016. www.icminc.com/drymill.zspx.
45
Jolly, M. L., B. L. Nuttelman, D. B. Burken, C. J. Schneider, T. J. Klopfenstein, G. E.
Erickson. 2013. Effects of modified distillers grain plus solubles and condensed distillers
solubles with and without oil extraction on finishing performance. Neb. Beef Cattle Rep.
64-65.
Jolly, M. L., B. L. Nuttelman, D. Burken, C. J. Schneider, T. J. Klopfenstein, G. E.
Erickson. 2014. Effects of increasing inclusions of wet distillers grains plus solubles
with and without oil extraction on finishing performance. Neb. Beef Cattle Rep. 81-82.
Jung, H. G. and D. A. Deetz. 1993. Cell wall lignification and degradability. In: H. G.
Jung, D. R. Buxton, R. D. Hatfield, and J. Ralph, editors, Forage cell wall structure and
digestibility. ASA-CSSA-SSSA, Madison, WI. P. 315-346.
Jung, H.G. and M.S. Allen. 1995. Characteristics of plant cell walls affecting intake and
digestibility of forages by ruminants. J. Anim. Sci. 73:2774-2790.
Kelzer, J. M., J. M. Popowski, S. Bird, R. B. Cox, G. I. Crawford, and A. DiCostanzo.
2011. Effects of including low fat, high protein dried distillers grains in finishing diets on
feedlot performance and carcass characteristics of beef steers. Univ. of Minn. Beef Rep.
Kim Y., N. S. Mosier, M. R. Ladisch. 2008. Process simulation of modified dry grind
ethanol plant with recycle of pretreated and enzymatically hydrolyzed distillers grains.
Bioresource Tech. 99:5177-5192.
Kim, Y., R. Hendrickson, N. S. Mosier, M. R. Ladisch, B. Bals, V. Balan, B. E. Dale.
2008b. Enzyme hydrolysis and ethanol fermentation of liquid hot water and AFEX
pretreated distillers grains at high-solids loadings. Bioresource Tech. 99:5206-5215.
Kim, Y. R. Hendrickson, N. S. Mosier, M. R. Ladisch, B. Bals, V. Balan, B. E. Dale, B.
S. Dien, and M. A. Cotta. 2010. Effect of compositional variability of distiller’s grains on
cellulosic ethanol production. Bioresource Tech. 101:5385-5393.
Kinser, A. R., G. C. Fahey, Jr., and L. L. Berger. 1988. Low-quality roughages in high -
concentrate pelleted diets for sheep: digestion and metabolism characteristics as affected
by corncob and (or) rice hull additions. J. Anim. Sci. 66:501-512.
Klopfenstein, T. J., V. E. Krause, M. J. Jones, and W. Woods. 1972. Chemical treatment
of low quality roughages. J. Anim. Sci. 35:418-422.
Klopfenstein, T. 1978. Chemical treatment of crop residues. J. Anim. Sci. 46:841–848.
Klopfenstein, T. J., L. Roth, S. Fernandez Rivera, and M. Lewis. 1987. Corn stovers in
beef production systems. J. Anim. Sci. 65:1139-1148.
Klopfenstein, T. J., G. E. Erickson, and V. R. Bremer. 2008. Board-invited review: use of
distillers by-products in the beef cattle feeding industry. J. Anim. Sci. 86:1223-1231.
Kowalczyk, J., E. R. Ørskov, J. J. Robinson, and C. S. Stewart. 1977. Effect of fat
supplementation on voluntary food intake and rumen metabolism in sheep. Br. J. Nutr.
37:251-257.

46
Kreikemeier, K. K., D. L. Harmon, R. T. Brandt, Jr, T. G. Nagaraja, and R. C. Cochran.
1990. Steam-rolled wheat diets for finishing cattle: effects of dietary roughage and feed
intake on finishing steer performance and ruminal metabolism. J. Anim. Sci. 68:2130-
2141.
Kwiatkowski, J. R., A. J. McAloon, F. Tayler, D. B. Johnston. 2005. Modeling the
process and costs of fuel ethanol production by the corn dry-grind process. Industrial
Crops and Products. 23:288-296.
Lardy, G. 2007. Feeding coproducts of the ethanol industry to beef cattle. Ext. Bull. No.
AS-1242. North Dakota State University, Fargo.
Larson, E. M., R. A. Stock, T. J. Klopfenstein, M. H. Sindt, and R. P. Huffman. 1993.
Feeding value of wet distillers byproducts for finishing ruminants. J. Anim. Sci. 71:2228-
2236.
Latham, M. J., J. D. Sutton, and M. E. Sharpe. 1974. Fermentation and microorganisms
in rumen and content of fat in the milk of cows given low roughage rations. J. Dairy Sci.
57:803−810.
Liu, K., 2011. Chemical composition of distillers grains, a review. J. Agric. Food Chem.
59:1508-1526.
Lundy, E. L., D. D. Loy, and S. L. Hansen. 2015. Influence of distillers grains resulting
from a cellulosic ethanol process utilizing corn kernel fiber on nutrient digestibility of
lambs and steer feedlot performance. J. Anim. Sci. 93:2265-2274.
Males, J. R. 1987. Optimizing the utilization of cereal crop residues for beef cattle. J.
Anim. Sci. 65:1124-1130.
Mertens, D.R. and J.R. Loften. 1980. The effect of starch on forage fiber digestion
kinetics in vitro. J. Dairy Sci. 63:1437-1446.
Mosier. N. S., R. Hendrickson, M. Brewer, N. Ho, M. Sedlak, R. Dreshel, G. Welch, B.
S. Dien, A. Aden, and M. R. Ladisch. 2005. Industrial scale-up of pH-controlled liquid
hot water pretreatment of corn fiber for fuel ethanol production. App. Biochem. And
Biotech. 125:77-96.
Moore, J. A., M. H. Poore, and R. S. Swingle. 1990. Influence of roughage source on
kinetics of digestion and passage, and on calculated extents of ruminal digestion in beef
steers fed 65% concentrate diets. J. Anim. Sci. 68:3412–3420.
Morris, P. J., and D. N. Mowat. 1980. Nutritive value of ground and/or ammoniated corn
stover. Can. J. Anim. Sci. 60:327-336.
Oglesbee, R. A., C. J. Bittner, F. H. Hilscher, G. E. Erickson, J. C. MacDonald, and M.
K. Luebbe. 2016. Evaluation of distillers grains components singly or in combination in a
calf fed feedlot study. Neb. Beef Cattle Rep. 124-127.
47
Nichols, C. A., K. M. Rolfe, C. D. Buckner, G. E. Erickson, T. J. Klopfenstein. 2011.
Effect of source and level of sulfur on rumen metabolism and finishing performance.
Neb. Beef Cattle Rep. 60-61.
National Research Council. 1996. Nutrient Requirements of Beef Cattle. 7th ed. Natl.
Acad. Press, Washington, DC.
Oji, U. I., D. N. Mowat and J. E. Winch. 1977. Alkali treatments of corn stover to
increase nutritive value. J. Anim. Sci. 44:798.
Perkis, D., W. Tyner, and R. Dale. 2008. Economic analysis of a modified dry grind
ethanol process with recycle of pretreated and enzymatically hydrolyzed distillers grains.
Bioresource Tech 99:5243-5249.
Pesta, A. C., Nuttelman, B. L., A. L. Shreck, W. A. Griffin, T. J. Klopfenstein, and G. E.
Erickson. 2015. Finishing performance of feedlot cattle fed condensed distillers solubles.
J. Anim. Sci. 93:4350-4357.
Poore, M. H., J. A. Moore, T. P. Eck, and R. S. Swingle. 1991. Influence of passage
model, sampling site, and marker dosing time on passage of rare earth-labeled grain
through Holstein cows. J. Anim. Sci. 69:2646-2654.
Quinn, M.J., May, M.L., DiLorenzo, N., Ponce, C.H., Smith, D.R., Parr, S.L., Galyean,
M.L., 2011. Effects of roughage source and distillers grain concentration on beef cattle
finishing performance, carcass characteristics, and in vitro fermentation. J. Anim Sci.
89:2631-2642.
Rausch, K. D., and R. L. Belyea. 2006. The furture of co-products from corn processing.
App. Biochem. and Biotechnol. 128:47-86.
RFA, 2016
Saenger, P. F., R. P. Lemenager, and K. S. Hendrix. 1982. Anhydrous ammonia treatment
of corn stover and its effects on digestibility, intake, and performance of beef cattle. J.
Anim. Sci. 54:8461.
Sarturi, J. O., G. E. Erickson, T. J. Klopfenstein, J. T. Vasconcelos, W. A. Griffin, K. M.
Rolfe, J. R. Benton, and V. R. Bremer. 2013. Effect of sulfur content in wet or dry
distillers grains fed at several inclusion on cattle growth performance, ruminal parameters
and hydrogen sulfide. J. Anim. Sci. 91:4849-4860.
Sarturi, J. O., G. E. Erickson, T. J. Klopfenstein, K. M. Rolfe, C. D. Buckner, and M. K.
Luebbe. 2013b. Impact of source of sulfur on ruminal hydrogen sulfide and logic for the
ruminal available sulfur for reduction concept. J. Anim. Sci. 91: 3352-3359.
Segers, J. R., T. L. Felix, A. R. Green, G. N. Maia, B. C. Ramirez, and D. W. Shike.
2015. Effect of dietary fat concentration from condensed corn distillers solubles, during
the growing phase, on beef cattle performance, carcass traits, digestibility, and ruminal
metabolism. J. Anim. Sci. 93

48
Shain, D.H., Stock, R.A., Klopfenstein, T.J., Herold, D.W., 1999. The effect of forage
source and particle size on finishing yearling steer performance and ruminal metabolism.
J. Anim. Sci. 77, 1082-1092.
Shi, H. T., Z. J. Cao, Y. J. Wang, S. L. Lig, H. J. Yang, Y. L. Bi, and P. H. Doane. 2016.
Effects of calcium oxide treatment at varying moisture concentrations on the chemical
composition, in situ degradability, in vitro digestibility and gas production kinetics of
anaerobically stored corn stover. J. Anim. Physiol. Anim. Nutr. 100:748-757.
Shreck, A. L., B. L. Nuttelman, J. L. Harding, W. A. Griffin, G. E. Erickson, T. J.
Klopfenstein, and M. J. Cecava. 2015. Digestibility and performance of steers fed low-
quality crop residues treated with calcium oxide to partially replace corn in distillers
grains finishing diets. J. Anim. Sci. 93:661-671.
Spears, J. W., K. E. Lloyd, and R. S. Fry. 2011. Tolerance of cattle to increased dietary
sulfur and effect of dietary cation-anion balance. J. Anim. Sci. 89:2502-2509.
Spiehs, M. J., M. H. Whitney, and G. C. Shurson. 2002. Nutrient database for distiller’s
dried grains with solubles produced from new ethanol plants in Minnesota and South
Dakota. J. Anim. Sci. 80:2639-2645.
Stock, R. A., J. M. Lewis, T. J. Klopfenstein, and C. T. Milton. 2000. Review of new
information on the use of wet and dry milling feed by-products in feedlot diets. J. Anim.
Sci. 77:1-12.
Sudweeks, E. M. 1977. Chewing time, rumen fermentation and their relationship in steers
as affected by diet composition. J. Anim. Sci. 44:694−701.
Sudweeks, E. M., S. E. Law, E. O. Ely, M. E. McCullough, and L. R. Sisk. 1979.
Development and application of a roughage value index for formulating dairy rations.
Georgia Agric. Exp. Stn. Res. Bull. 238, Univ. Georgia, Athens.
SundstØl, F. 1988. Straw and other fibrous by-products. Livestock Prod. Sci. 19:137-158.
Teymouri, F., L. Laureano-Perez, H. Alizadeh, B. E. Dale. 2005. Optimization of the
ammonia fiber explosion (AFEX) treatment parameters for enzymatic hydrolysis of corn
stover. Bioresource Tech 96:2014-2018.
Theurer, C. B., R. S. Swingle, R. C. Wanderley, R. M. Kattnig, A. Urias, and G.
Ghenniwa. 1999. Sorghum grain flake density and source of roughage in feedlot cattle
diets. J. Anim. Sci. 77:1066-1073.
Trenkle, A. H., 1997. Evaluation of wet distillers grains in finishing diets for yearling
steers. Beef Research Rep. Iowa State Univ., Ames. AS637:93-96.
Trenkle, A. H., 2003. Relative feeding value of wet corn distillers solubles as a feed for
finishing cattle. AS Leaflet R1772 in 2002 Beef Research Report. Iowa State University.
Trenkle, A. H., 2004. Effects of replacing corn grain and urea with condensed corn
distillers solubles on performance and carcass value of finishing steers. AS Leaflet R1884
in Animal Industry Report. Iowa State University.
49
Trenkle, A. H., 2008. Performance of finishing steers fed low, moderate and high levels
of wet distillers grains. Iowa State Univ. Anim. Indus. Rep. AS 654.
U.S. Grain Council. 2012.
www.ethanolrfa.org/wp-content/uploads/2015/22/2012_DDGS_Handbook.pdf
USDA National Agricultural Statistics Service (USDA-NASS). 2016. Corn, grain acres
harvested. https://www.nass.usda.gov/Statistics_by_Subject/result.php?D5445FF2-7FB3-
390B-A54E-
2B99CA1BA37B§or=CROPS&group=FIELD%20CROPS&comm=CORN.
(Accessed 13 October 2016.)
Uwituze, S., G. L. Parsons, C. J. Schneider, K. K. Karges, M. L. Gibson, L. C. Hollis, J.
J. Higgins, and J. S. Drouillard. 2011. Evaluation of sulfur content of dried distillers
grains with solubles in finishing diets based on steam-flaked corn or dry-rolled corn. J.
Anim. Sci. 89:2582-2591.
Uwituze, S., G. L. Parsons, K. K. Karges, M. L. Gibson, L. C. Hollis, J. J. Higgins, and J.
S. Drouillard. 2011b. Effects of distillers grains with high sulfur concentrations on
ruminal fermentation and digestibility of finishing diets. J. Anim. Sci. 89:2817-2828.
Vander Pol, K. J., G. E. Erickson, T. J. Klopfenstein, M. A. Greenquist, and T. Robb.
2006. Effect of dietary inclusion of wet distillers grains on feedlot performance of
finishing cattle and energy value relative to corn. Neb. Beef Cattle Rep. 51-53.
Vander Pol, K. J., M. K. Luebbe, G. I. Crawford, G. E. Erickson, and T. J. Klopfenstein.
2009. Performance and digestibility characteristics of finishing diets containing distillers
grains, composites of corn processing coproducts, or supplemental corn oil. J. Anim. Sci.
87:639-652.
Vanness, S. J., T. J. Klopfenstein, G. E. Erickson, K. K. Karges. 2009. Sulfur in distillers
grains. Neb. Beef Cattle Rep. 79-80.
Watson, A. K., K. J. Vander Pol, T. J. Huls, M. K. Luebbe, G. E. Erickson, T. J.
Klopfenstein, and M. A. Greenquist. 2014. Effect of dietary inclusion of wet or modified
distillers grains plus solubles on performance of finishing cattle. The Prof. Anim. Sci.
30:585-596.
Watson, A. K., J. C. MacDonald, G. E. Erickson, P. J. Kononoff, and T. J. Klopfenstein.
2015. FORAGES AND PASTURES SYPOSIUM: Optimizing the use of fibrous residues
in beef and dairy diets. J. Anim. Sci. 93:2616-2625.
Weiss, W. P. and W. L. Shockey. 1991. Value of orchardgrass and alfalfa silages fed with
varying amounts of concentrates to dairy cows. J. Dairy. Sci. 74:1933-1943.
Wright, C. K., and M. C. Wimberly. 2013. Recent land use change in the western Corn
Bel threatens grasslands and wetlands. Proc. Natl Acad. Sci. USA 110:4134-4139.
Zinn, R. A. 1989. Influence of level and source of dietary fat on its comparative feeding
value in finishing diets for feedlot steers: metabolism. J. Anim. Sci. 67:1038-1049.

50
Zinn, R. A., 1994. Effects of excessive supplemental fat on feedlot cattle growth
performance and digestive function. The Prof. Anim. Sci. 10:66-72.
Zinn. R. A., S. K. Gulati, A. Plascencia, and J. Salinas. 2000. Influence of ruminal
biohydrogenation on the feeding value of fat in finishing diets for feedlot cattle. J. Anim.
Sci. 78:1738-1746.

51
CHAPTER II. MODIFYING DIFFERENT COMPONENTS OF DISTILLERS
GRAINS AND THE IMPACT ON FEEDLOT PERFORMANCE
Z. E. Carlson*, C. J. Bittner*, D. B. Burken*, F. H. Hilscher*, G. E. Erickson*, and J. C.
MacDonald*1
*Department of Animal Science, University of Nebraska, Lincoln, NE 68583-0908
1Corresponding Author: [email protected]

52
ABSTRACT
Crossbred yearling steers (n = 448; initial BW 368 kg; SD=13) were utilized in a
generalized randomized block design to determine the effect of altering distillers grains
plus solubles (DGS) composition on performance and carcass characteristics. Treatments
were: 1) negative control (CON) with 50% dry-rolled corn; 2) positive control (DDGS)
dried DGS replaced corn at 50% of diet; 3) pelleted corn stover (PEL-STV) treated with
calcium oxide, containing 18.75% solubles (CDS), 12.5% treated corn stover, and
18.75% high-protein dried distillers grains plus solubles (HPDG), pelleted; 4) non-
pelleted corn stover (STV), treated with calcium oxide, containing treated corn stover,
CDS, and HPDG at same DM inclusion as PEL-STV; 5) component DGS(COMP)
including 18.75% CDS, 12.5% corn bran, isolated from the dry-milling ethanol process,
and 18.75% HPDG; 6) component medium protein (COMP-MED) contained 24.4%
CDS, 16.2% corn bran, and 9.4% HPDG; and 7) component low protein (COMP-LOW)
had 30% CDS and 20% corn bran (DM basis). Performance and carcass characteristics
were analyzed using the MIXED procedures of SAS with pen as the experimental unit.
Block was a fixed effect and contrasts were developed to determine effects of exchanging
components in DGS. Dry matter intake and ADG were greater for DDGS compared to
CON (P < 0.01). Combining corn bran, CDS, and HPDG together in similar proportions
to DDGS reduced G:F by 9.0% (P < 0.01) compared to DDGS. There was a quadratic
increase in DMI as protein was removed between COMP, COMP-MED, and COMP-
LOW (P < 0.04). Steers fed DDGS had heavier HCW (P < 0.01) and increased 12th rib
fat thickness (P < 0.02) compared to COMP. As protein decreased between COMP,
COMP-MED, and COMP-LOW fat thickness decreased linearly (P = 0.02). Replacing

53
corn bran with a treated corn stover mixture further reduced feed efficiency (P < 0.04).
Pelleted corn stover decreased DMI (P < 0.02) with no affect on ADG or G:F (P ≥ 0.37).
When the treated corn stover mixture replaced corn bran, 12th rib fat thickness decreased
(P < 0.02). Replacing the fiber from DDGS with the treated corn stover mixture supplied
less energy. As the portion of CDS and corn bran in the composite DGS increased,
performance remained similar. Combining individual ingredients of corn bran, HPDG,
and CDS did not mimic the fiber, protein, and fat fractions of DDGS.
Key Words: beef cattle, corn stover, distillers grains plus solubles
54
INTRODUCTION
The composition of distillers grains plus solubles (DGS) changes as nutrient components
are removed during ethanol production. The removal of oil from DGS has been reported
to lower the energy value of DGS by 3.5% when DGS was included in the diet at 30%
(DM basis; Bremer et al., 2015). Fermentation of corn bran via secondary fermentation
systems will lower the concentration of fiber in DGS. Separation of protein may reduce
the protein concentration of DGS and alter use in feedlot diets. Partially fractionated DGS
containing less fiber and more protein compared to traditional DGS has been reported to
perform similarly to traditional DGS in finishing diets (Depenbusch et al., 2008; Kelzer
et al., 2011). Lundy et al. (2015) reported poorer feed efficiency for WDGS from
secondary cellulosic ethanol fermentation compared to traditional wet distillers grains
plus solubles (WDGS). Bremer et al. (2008) described methods of protein separation
available to ethanol plants to enhance their value-added products. Ethanol plants ability
to isolate components of DGS will continue to increase, which means understanding
protein, fiber, fat, and the interactions of those components from DGS in beef cattle diets
will allow for prediction of performance as nutrients change in the future.
Corn stover has become more available with higher corn prices (Watson, 2015).
New techniques to commercially process corn stover, in combination with DGS, are
available. Pelleted DGS and CaO treated corn stover when included in finishing diets
cattle performed similarly to corn at 20% inclusion (DM basis; Gramkow et al., 2016).
Little research has examined replacing fiber from DGS removed by secondary
fermentation with treated corn stover or utilizing condensed distillers solubles (CDS) and
corn bran for the protein component of DGS. The objectives of this study were to

55
determine the effect of replacing corn bran from the dry-milling industry, which contains
more protein than bran from the wet-milling industry, in DDGS with CaO treated corn
stover and to evaluate the effect of exchanging protein in DDGS with corn bran and CDS
on feedlot performance and carcass traits.
MATERIALS AND METHODS
All animal care and management procedures were approved by the University of
Nebraska – Lincoln Institutional Animal Care and Use Committee.
Crossbred yearling steers (n = 448; initial BW 368 kg; SD=13) were utilized in a
generalized randomized block design at the University of Nebraska-Lincoln Eastern
Nebraska Research and Extension Center feedlot (Mead, NE). Initial receiving and
processing of the calves into the feedlot included vaccination for protection against
bovine rhinotracheitis virus and bovine viral diarrhea types 1 and 2 viruses (Bovi-Shield
Gold One Shot; Zoetis, Florham Park, NJ); control against gastrointestinal roundworms,
lungworms, eye worms, grubs, sucking lice, and mange mites (Dectomax injectable;
Zoetis); and prevention of Haemophilus somnus (Somubac; Zoetis). Cattle were given a
booster vaccination 14 d after initial vaccination for protection against bovine
rhinotracheitis virus and bovine viral diarrhea types 1 and 2 viruses (Bovi-Shield Gold 5;
Zoetis) and prevention of Haemophilus somnus (Ultrabac-7; Zoetis). Steers grazed corn
stalks After backgrounding, steers were limit-fed (2% of BW) a diet consisting of 50%
Sweet Bran® (Cargill Wet Milling, Blair, NE), and 50% alfalfa hay (DM basis) for 5 d
before weighing to equalize gut fill (Watson et al., 2013). Steers were weighed 2
consecutive days (d 0 and 1) using a hydraulic squeeze chute with load cells mounted on
the chute (Silencer, Moly Manufacturing Inc., Lorraine, KS: scale readability ± 0.90 kg)
56
to establish initial BW. Steers were implanted with 36 mg of zeranol (Ralgro, Merck
Animal Health, De Soto, KS) during the initial weighing (d 1) process. Steers were
blocked by BW into three blocks on d 0, stratified by BW within block, and assigned
randomly to 56 pens.
Pens were assigned randomly to one of seven dietary treatments (Table 2.1) with
eight replications per treatment and eight steers per pen. The light and heavy BW blocks
contained 2 replications each and the middle block contained 4 replications. Steers were
re-implanted with 200 mg of trenbolone acetate and 20 mg of estradiol (Revalor-200,
Merck Animal Health) with the middle block (4 replications) on d 36 and light and heavy
blocks (4 replications) on d 38.
Cattle were fed ad libitum with feed bunks evaluated daily at approximately 0630
h for refusals and managed so that trace amounts of feed were left in the bunk at time of
feeding. Feed was delivered with a truck mounted mixer and delivery unit (Roto-Mix
model 274, Roto-Mix, Dodge City, KS; scale readability ±0.91 kg) each morning at 0800
h. Steers were adapted to finishing diets over a 19-d period through a series of 4 diets
containing 40, 30, 20, and 10% alfalfa hay (DM basis) for 4, 5, 5, and 5 d, respectively,
with HMC, DRC or byproducts replacing alfalfa hay, respectively. In step-up diets 2, 3,
4, and finisher high-moisture corn (HMC) and dry-rolled corn (DRC) replaced 4, 4, 4,
1.5% and 6, 6, 6, 3% of alfalfa hay in the CON diet, respectively. In step-up diets 2, 3, 4,
and finisher HMC and DDGS replaced 4, 4, 4, 1.5% and 6, 6, 6, 3% of alfalfa hay in the
DDGS diet, respectively. In step-up diets 2, 3, 4, and finisher HMC and a combination of
CDS, and CaO treated corn stover with CDS and HPDG (pelleted and non-pelleted)
replaced 4, 4, 4, 1.5% and 6, 6, 6, 3% of alfalfa hay in the STV and PEL-STV diets,
57
respectively. In step-up diets 2, 3, 4, and finisher HMC and a combination of CDS, corn
bran, and HPDG replaced 4, 4, 4, 1.5% and 6, 6, 6, 3% of alfalfa hay in the COMP diet,
respectively. In step-up diets 2, 3, 4, and finisher HMC and a combination of CDS, and
corn bran replaced a portion of alfalfa hay in COMP-MED and COMP-LOW,
respectively. The composite DGS diet (COMP) was formulated to replicate the protein,
fiber, and fat from DGS utilizing isolated components of corn from the dry-milling
ethanol industry (Table 2.1). Corn bran (ICM Biofuels; St. Joseph, MO; 65.3% DM,
24.1% CP, 56.3% NDF, and 5.5% fat; DM basis) was utilized as the fiber portion. High-
protein dried distillers grains plus solubles (ICM Biofuels; 92.3% DM, 37.7% CP, 40.3%
NDF, and 8.4% fat; DM basis) was utilized as a protein source. A portion of the protein
and fat was replicated with the inclusion of CDS (ICM Biofuels; 35.5% DM, 34.8% CP,
7.4% NDF, and 6.7% EE; DM basis).
Diets were formulated to meet or exceed MP requirements using the NRC (1996).
Nutrient composition for all experimental diets are listed in Table 2.2. All finishing diets
contained 31.5% high-moisture corn, 5.5% alfalfa hay, 4.0% corn silage, 5.0% liquid
molasses, 4.0% dry meal supplement formulated with 30 g / ton of monensin (Rumensin,
Elanco Animal Health, Greenfield, IN) and 90 mg / steer of tylosin (Tylan, Elanco
Animal Health) daily. Supplements were formulated and mixed at the on-site feed mill.
The supplement for CON contained urea at 1.36% (DM basis) to meet the RDP
requirement and 1.43% limestone (DM basis) to meet and / or exceed the Ca requirement
(NRC, 1996). The supplement for DDGS, COMP, COMP-MED, and COMP-LOW
contained 1.98% limestone (DM basis) to meet and/or exceed the Ca requirement
(NASEM, 2016). The supplement for STV and PEL-STV contained 0.49% limestone
58
(DM basis) since those treatments contained CaO (71% Ca based on molecular weight)
treated corn stover. Supplements were mixed weekly in a stationary ribbon mixer (model
S-5 Mixer; H.C. Davis Sons Manufacturing Co., Inc., Bonner Springs, KS).
Both corn stover ingredients, pelleted and non-pelleted, were harvested from the
same field and processed by Pellet Technology, USA (Gretna, NE). The corn stover was
reduced to a small particle size (297-1,680 μm). Then CDS was added to hydrate the
corn stover to 50% DM. As CDS was added, CaO was also simultaneously added (5% of
forage DM). After CaO treatment, the mixture was sent through an extruder (66-121°C)
to increase the rate of the chemical reaction. Following the extrusion process, HPDG was
added. At this point the non-pelleted corn stover mixture was completed and the pelleted
corn stover was pelleted (Zeeck, 2013). The final product was composed of
approximately 31% treated corn stover, 19% CDS, 48% HPDG, and 1.6% CaO. The
pelleted corn stover in the current experiment is similar to the product used in previous
studies evaluating the alkaline treatment and pelleting of corn stover with CDS and dried
DGS (Welchons et al, 2016; Gramkow et al, 2016). Gramkow et al. (2016b) examined an
alternative alkaline treatment process on corn stover. The alternative method utilized
CDS instead of water to hydrate the corn stover before CaO treatment. When compared
to traditional alkaline treatment hydrated with water, hydrating corn stover with CDS
resulted in improved total-tract DM and OM digestibilities when included in growing
diets fed to steers. As described above, the same alternative CaO treatment of corn stover
hydrated with CDS examined with Gramkow et al. (2016) was used for in the current
study. High-moisture corn, DRC, alfalfa hay, and corn silage were harvested from fields

59
at the Eastern Nebraska Research and Extension Center (Mead, NE) and processed at the
research feedlot.
Orts were removed from the bunk when refusals were present, and dried in a 60°C
forced-air oven (model LBB2-21-1, Despatch, Minneapolis, MN) for 48 h to determine
DM content (AAOC, 1965; method 935.29). Individual feed ingredients were dried in
60°C forced air ovens (model LBB2-21-1, Despatch, Minneapolis, MN) for 48 h (AAOC,
1965; method 935.29) weekly to ensure accurate DM’s were used when mixing dietary
treatments. Individual feed ingredients were sampled weekly, composited by month,
freeze dried, and ground through a 1-mm screen using a Wiley mill (number 4; Thomas
Scientific, Swedesboro, NJ). Feed samples were analyzed for OM, CP, NDF, ADF, and
lignin to calculate nutrient composition of dietary treatments (Table 2.3). Ash was
evaluated by placing samples in a muffle furnace for 6 h at 600°C (AOAC, 1999; method
4.1.10). Crude protein and S were determined using a combustion type N and S analyzer
(TruSpec N Determinator and TruSpec Sulfur Add-On Module, Leco Corporation, St.
Joseph, MI; AOAC, 1999; method 990.03). Neutral detergent fiber content was
determined using the procedure described by Van Soest et al. (1991) with modifications
described by Buckner et al. (2010). The modification applied to DDGS, HPDG, CDS,
pelleted and non-pelleted corn stover, and corn bran was a biphasic lipid extraction
(Bremer et al., 2010) prior to NDF analysis (Buckner et al., 2013). Acid detergent fiber
and lignin content were determined using the procedure described by Van Soest et al.
(1963). Ether extract was determined by a biphasic lipid extraction procedure described
by Bremer (2010). Samples were heated in a 1:1 mixture of hexane and diethyl ether for
9 h, dilute HCl was added, and samples were centrifuged to separate the lipid layer from

60
other liquid. The lipid layer was pipetted off, heated to drive off remaining solvent, and
weighed.
Cattle were shipped according to projections made utilizing pen weights on d 113
and predicted ADG to reach a final BW of 658 kg, at which all cattle were assumed to
have 1.27 cm or more of fat thickness at the 12th rib. On day 149, steers in the heavy
block (2 replications) were fed 50% of the previous days feed call and shipped
approximately 10 h after feeding. On day 156, steers in the light and middle blocks (6
replications) were fed 50% of the previous days feed call and shipped approximately 10 h
after feeding. Steers were harvested at Greater Omaha Packing Co. (Omaha, NE). Upon
day of harvest, HCW was collected. After a 48-h chill, LM area, 12th rib fat, and USDA
marbling scores were collected. Final BW was calculated by dividing HCW by a
common dressing percentage (63%). Feeding values were calculated using the following
equation: [((compared treatments G:F – CON G:F) / CON G:F) / compared treatments
inclusion rate*100 + 100].
Performance data (BW, DMI, ADG, G:F) and carcass data (HCW, 12th rib back
fat, marbling, quality grade, yield grade) were analyzed using the MIXED procedures of
SAS (SAS Institute, Inc., Cary, N.C.) with dead or chronic steers removed from analysis.
One steer from COMP, one steer from COMP-MED, and three steers from COMP-LOW
diets were removed from the experiment due to diagnosis of sulfur induced
polioencephalomalacia (S-PEM) by the Nebraska Veterinary Diagnostic laboratory. Pen
was the experimental unit and block was treated as a fixed effect. Linear and quadratic
contrasts were developed for steers fed COMP, COMP-MED, COMP-LOW to determine
the impacts of replacing protein from DGS with CDS and corn bran. Additionally,

61
pairwise comparisons were pre-planned to determine the following effects: 1) replacing
corn with commodity DGS as an internal validation (CON vs DDGS); 2) replacing
DDGS with a composite DGS (DDGS vs. COMP) to test if combining 18.75% HPDG,
12.50% corn bran from the dry-milling process, and 18.75% CDS could replicate the
components of DDGS; 3) replacing corn bran from the composite DGS with a treated
corn stover byproduct mixture (COMP vs. STV) to test if the CaO treated corn stover can
replace the fiber removed from DDGS by secondary fermentation processes; 4) pelleting
the treated corn stover byproduct mixture (PEL-STV vs. STV) to test the effect of
pelleting CaO treated corn stover that replaced the fiber portion of DDGS. Treatment
differences were considered significant when P ≤ 0.05 with tendencies between P > 0.05
and P ≤ 0.10.
Dietary treatments were modified on d 35 due to S-PEM. The cause of S-PEM
was due to high sulfur content of CDS. The maximum tolerable concentration of dietary
sulfur in diets containing more than 85% concentrate is 0.30% (NASEM, 2016). Before d
35, all diets except CON exceeded 0.30% dietary sulfur with BRN-LOW having the
greatest dietary sulfur with 0.72%. Condensed distillers solubles and DDGS were
reduced by 11.25% and replaced with DRC. Increasing the NDF content, primarily from
forages, of the diet reduces the risk of S-PEM and decreases the amount of ruminal H2S
produced (Nichols et al., 2013; Morine et al., 2014a, b). We replaced 5% (DM basis) of
HMC with grass hay. The high sulfur CDS was replaced and reintroduced throughout a 6
day step-up period, and experimental treatments resumed on d 41. The cause of high
sulfur in the CDS and DDGS was a result of high sulfur in the water used in the dry grind
process at the ethanol plant that supplied both CDS and DDGS. Sulfur from DGS is a
62
combination of organic (origin from corn) and inorganic (origin from chemicals during
the dry grinding process). Sarturi et al. (2013) studied the effects of organic and inorganic
sulfur sources on rumen availability. The authors reported that organic S sources were
100% ruminally available and S from WDGS had greater degradation in the rumen
resulting in greater ruminal H2S gas production compared to organic sources. Therefore,
the source of high S concentration causing S-induced PEM was CDS and DDGS.
RESULTS AND DISCUSSION
CON vs. DDGS
Performance and carcass data are provided in Table 2.4. Steers fed DDGS instead
of CON (i.e. replacing 50% dry-rolled corn with DDGS) had increased carcass adjusted
final BW (655 vs. 631 kg for DDGS and CON, respectively; P < 0.01), increased DMI
(12.9 vs. 11.9 kg/d, respectively; P < 0.01) and increased ADG (1.89 vs. 1.74 kg/d,
respectively; P < 0.01) and no difference (P = 0.80) for G:F. Previous research has
reported that replacing up to 40% (DM basis) of DDGS in the diet resulted in greater
DMI, ADG, and improved G:F (Buckner et al., 2007; Klopfenstein et al., 2008). The
feeding value of DDGS has been documented to be approximately 112% the value of
corn (Bremer et al., 2011). The 12% improvement in feeding value of DGS has been
attributed to the fat and RUP of DGS (Larson et al., 1993). Improvements in cattle
performance have been attributed to the greater feeding value of DDGS (Buckner et al.,
2007; Bremer et al., 2011). In the current trial, the feeding value of DDGS was 101% the
value of corn. Feed efficiency was not different for CON and DDGS (0.145 vs. 0.144,
respectively; P = 0.80). While feeding DGS has been reported to improve G:F, studies in
which DGS was included at 50% or greater in the diet, have reported poorer G:F response
63
compared to lower inclusions of DGS (Vander Pol et al. 2006; Depenbusch et al., 2009;
Nuttelman et al., 2011). Klopfenstein et al. (2008) summarized five trials comparing 10,
20, 30, and 40% DDGS inclusion (DM basis) to a corn control. There was a cubic
response observed for G:F with the optimal inclusion of DDGS being 10%. Feed
efficiency continued to decline from 20 to 40% DDGS with 40% DDGS having a similar
G:F as the corn control. Depenbusch et al., (2009) evaluated DDGS at 15, 30, 45, 60, or
75% (DM basis) fed to heifers in finishing diets. Dry matter intake, ADG, and final BW
responded quadratically to increasing levels of DDGS and were optimized at 15% DGS.
Feed efficiency linearly decreased as inclusion of DDGS increased. In the current study,
no difference in G:F for CON and DDGS may be due to the high inclusion of DDGS. The
inclusion of 50% DDGS (DM basis) in the diet was selected so that individual feed
ingredients (i.e. corn bran, CDS, and HPDG) could be included at large enough inclusion
rates so that treatment differences could be detected when comparing smaller components
of DDGS. Hot carcass weight was 15 kg more for steers fed DDGS (P < 0.01) compared
to CON. Increased HCW with DDGS inclusion has been reported in previous
publications (Benson et al., 2005; Buckner et al., 2007). However, several publications
reporting poor growth performance at 50% or greater DDGS inclusion reported lower
HCW (Gunn et al., 2009; Depenbusch et al., 2009). There were no differences (P = 0.34)
for LM area between CON and DDGS. Steers fed DDGS had increased 12th rib fat (1.61
vs. 1.43 cm2, respectively; P < 0.01) compared to CON. Marbling was not different
between DDGS and CON (P = 0.25).
DDGS vs. COMP

64
Performance and carcass data are provided in Table 2.4. Replacing DDGS (91.1%
DM, 34.4% CP, 35.9% NDF, 8.7% fat, and 0.40% S; DM basis) with similar proportions
of CDS, corn bran, and HPDG (COMP; 57.2% DM, 33.2% CP, 32.0% NDF, 7.2% fat,
and 0.57% S; DM basis) decreased final BW (655 vs. 623 kg, respectively; P < 0.01) and
decreased DMI (12.9 vs. 12.4 kg/d, respectively; P = 0.05). Average daily gain was
greater for cattle fed DDGS (1.89 vs. 1.69 kg/d; P < 0.01) compared to COMP,
respectively. Steers fed DDGS had improved G:F compared to COMP (0.145 vs. 0.132,
respectively; P < 0.01). The COMP diet had a calculated feeding value of 83% relative to
corn, which was lower than the feeding value of DDGS (101%). Hot carcass weights
were heavier for cattle fed DDGS compared to COMP (413 vs. 393 kg, respectively; P <
0.01). There were no differences (P = 0.83) in LM area between DDGS and COMP.
There was increased 12th rib fat (1.61 vs. 1.53 cm2; P = 0.02) for DDGS compared to
COMP, respectively. There were no differences (P = 0.82) in marbling between DDGS
and COMP. Previous research examined an ethanol byproduct, Dakota Bran (Poet
Nutrition, Sioux Falls, SD), which is a blend of corn bran and CDS (53% DM, 14.7% CP,
32.0% NDF, 10.9% fat, and 0.82% S; DM basis; Buckner et al. 2011b). Authors replaced
equal parts of DRC and HMC in the finishing diet with 15, 30, or 45% Dakota Bran. As
inclusion of Dakota Bran increased, ADG and G:F improved linearly (P < 0.01). Steers
consuming 30% Dakota Bran or DDGS had similar growth performance and carcass
characteristics. These results show that Dakota Bran, a product low in protein and high in
fiber, can provide similar energy as DDGS. In the current study, combining 37.5% CDS,
25% corn bran, and 37.5% HPDG, as proportions of DDGS, did not result in similar
performance to DDGS. One explanation for poorer performance of cattle fed COMP

65
could be that one or more of the individual ingredients (i.e. HPDG, CDS, and/or corn
bran) did not contain a similar nutrient composition as the component (i.e. protein, fat,
and/or fiber) in DDGS. The individual ingredients in COMP may not have been included
in the correct proportions to replicate the components in DDGS.
COMP vs. STV
Performance and carcass data are provided in Table 2.4. The composition of the
byproducts in COMP (57.2% DM, 33.2% CP, 32.0% NDF, and 7.1% fat; DM basis) and
STV (68.0% DM, 25.4% CP, 44.3% NDF, and 5.4% fat; DM basis; Table 2.3) indicate
that replacing corn bran with treated corn stover reduced CP and fat concentration while
providing more NDF. There were no differences (P = 0.88) in final BW between COMP
and STV. Exchanging corn bran for non-pelleted treated corn stover increased DMI (12.4
vs. 13.3 kg/d, respectively; P < 0.01) with no difference in ADG (1.69 vs. 1.70 kg/d,
respectively; P = 0.91), resulting in steers fed STV being 4.5% less efficient in
comparison to steers fed COMP (0.126 vs. 0.132, respectively; P = 0.04). When corn
bran was replaced by treated corn stover the feeding value decreased 9%. In the current
study, there was no difference (P ≥ 0.79) in HCW and LM area between COMP and
STV. When treated corn stover replaced corn bran, 12th rib fat decreased (1.37 vs. 1.53
cm2, respectively; P < 0.02). Marbling was not different (P = 0.82) for COMP and STV.
These data suggest that replacing corn bran with CaO treated corn stover and byproduct
mixture provides less energy to the diet as a result of lower fat and CP concentrations but
similar growth performance as a result of increased intake and poorer G:F.
PEL-STV vs. STV

66
Performance and carcass data are provided in Table 2.4. The composition of the
byproducts in STV was 68.0% DM, 25.4% CP, 44.3% NDF, and 5.4% fat (DM basis;
Table 2.3). The composition of the byproducts in PEL-STV was 73.9% DM, 24.8% CP,
42.5% NDF, and 5.0% fat (DM basis). There were no differences (P = 0.35) for final BW
between PEL-STV and STV. Pelleting the treated corn stover, CDS, and HPDG
decreased DMI, with steers fed PEL-STV consuming 12.8 kg/d in comparison to 13.3
kg/d for steers fed STV (P = 0.03). Previous authors reported greater DMI for cattle
consuming pelleted feeds compared to non-pelleted feeds (Peterson et al., 2015). Greater
DMI has been attributed to faster passage rate as a result of lower total tract digestibility
(Coleman et al., 1978; Le Liboux et al., 1999) and smaller particle size of pelleted feeds
(Blaxter et al., 1956; Weir et al. 1959; Moore et al., 1964). Gramkow et al. (2016)
evaluated a similar CaO treated corn stover pelleted with DGS as the current experiment.
Digestibility of the pelleted corn stover was not different compared to MDGS. However,
DMI increased as inclusion of pelleted stover increased in the diet. Cattle in the current
trial had lower DMI when 38.75% (DM basis) of the diet was pelleted feed. Both STV
and PEL-STV would have similar particle sizes prior to pelleting. Pelleted corn stover in
the PEL-STV treatment was exposed to higher heat and pressure from pelleting compared
to STV. Heat and pressure generated during pellet production further breaks down the
treated corn stover (Zeeck, 2013). There were no differences between PEL-STV and STV
for ADG (1.65 vs. 1.70 kg/d, respectively; P = 0.37) and G:F (0.127 vs. 0.126,
respectively; P = 0.63). The pelleted treated corn stover may have provided more energy
than the non-pelleted treated corn stover, which allowed the animal to consume less DM
and perform similar to the non-pelleted treated corn stover. There were no differences (P

67
≥ 0.35) in HCW, LM area, and 12th rib fat between PEL-STV and STV. Marbling had a
tendency to decrease for steers fed PEL-STV compared to STV (482 vs. 511,
respectively;; P = 0.07). Pelleting decreased animal intake without affecting growth
performance or carcass characteristics.
Linear and Quadratic Responses for Protein
In order to diversify marketable products and add value to DGS, ethanol plants
have developed technologies to further fractionate corn. The fiber component is subjected
to cellulosic fermentation yielding additional ethanol and a DGS lower in NDF content.
The remaining NDF has been reported to be less digestible and lower in energy relative
to fiber from traditional DGS (Lundy et al., 2015). Following cellulosic fermentation,
protein can be separated via protease enzymes and sold in alternative markets (Brehmer
et al., 2008). Both COMP-MED and COMP-LOW were formulated to replace the protein
from DGS by removing HPDG and increasing the concentrations of CDS and corn bran.
The proportion of CDS to corn bran remained the same as in COMP but their
concentrations were greater as HPDG was removed. These two diets may have nutrient
compositions similar to future ethanol corn byproducts. There were no differences (P =
0.19) for final BW between COMP (57.2% DM, 33.2% CP, 32.0% NDF, 7.2% fat, and
0.57% S; DM basis), COMP-MED (46.7% DM, 31.9% CP, 29.4% NDF, and 6.7% fat;
DM basis), and COMP-LOW (36.1% DM, 30.5% CP, 26.9% NDF, and 6.2% fat; DM
basis; Table 2.5). As HPDG was replaced with CDS and corn bran between COMP,
COMP-MED, and COMP-LOW, DMI quadratically increased (P = 0.04) with COMP-
MED increasing and COMP-LOW decreasing, compared to COMP. Pesta et al. (2015)
observed a linear decrease in DMI as CDS concentration increased from 0 to 36%. One
68
reason for decreased DMI with greater concentrations of CDS is high S (Sarturi et al.,
2013b), and dietary S of 0.44% S in COMP-LOW in this study may have been enough to
cause decreased DMI. One steer from COMP-MED and three steers from COMP-LOW
were diagnosed with PEM, suggesting that the byproducts did contain high levels of S.
Limiting DMI due to S concentration does not explain why DMI increased from COMP
to COMP-MED. There were no significant differences (P = 0.16) in ADG due to
changing portion of protein. Replacing proportions of protein tended (P = 0.10) to
improve G:F linearly. Pesta et al. (2015) reported as CDS inclusion increased from 0 to
36%, G:F improved quadratically. The authors calculated that the maximum G:F
response occurred at 32.5% CDS resulting in cattle being 12% more efficient than those
fed 0%. The authors note that G:F plateaus at the greatest inclusion of CDS, which means
that even greater inclusions than tested may be feasible. Limiting factors of inclusions
greater than 36% CDS include handling properties of the diet (decreasing DM content
and winter storage capabilities) and addition of dietary fat and/or S. Replacing HPDG
with proportions of CDS and corn bran resulted in greater feeding values (83 vs. 89 and
90% relative to corn for COMP vs. COM-MED and COMP-LOW, respectively). There
were no differences (P = 0.19) for HCW between COMP, COMP-MED, and COMP-
LOW. Removing protein tended to increase LM area quadratically (P = 0.08) and linearly
decrease 12th rib fat (P = 0.02). There were no differences (P = 0.28) for marbling.
Displacing half the protein with CDS and corn bran (at equal proportions to COMP)
caused increased DMI and tended to increase LM area. When protein was completely
displaced by a combination of CDS and corn bran, DMI, ADG, and G:F were similar to
COMP.
69
IMPLICATIONS
Replacing the fiber from DDGS with a treated corn stover mixture supplied less
energy. As the portion of CDS and fiber (corn bran) from the composite DGS increased,
finishing performance was similar. If protein in DGS is removed, CDS and corn bran
may be able to displace the protein without sacrificing animal performance. Combining
individual ingredients of corn bran, HPDG, and CDS at various inclusion levels did not
mimic the fiber, protein, and fat fractions of DDGS suggesting some component(s) was
missing.
70
LITERATURE CITED
AAOC. 1965. Official Methods of Analysis. 10th ed. AAOC, Washington, DC.
AOAC. 1999. Official method of analysis. 16th ed. AOAC Int., Arlington, VA.
Benson, C. S., C. L. Wright, K. E. Tjardes, R. E. Nicolai, and B. D. Rops. 2005. Effects
of feeding varying concentrations of dry distiller’s grains with solubles to finishing steers
on feedlot performance, nutrient management and odorant emissions. BEEF 2005-13.
Pages 59 – 67 in South Dakota Beef Report. ADAES, Brookings.
Blaxter, K. L., N. McC. Graham, and F. W. Wainman. 1956. Some observations on the
digestibility of food by sheep, and on related problems. Br. J. Nutr. 10:69-91.
Brehmer, B., B. Bals, J. Sanders, and B. E. Dale. 2008. Improving the corn-ethanol
industry: Studying protein separation techniques to obtains higher value-added product
options for distillers grains. Biotech. Bioeng. 101: 49-61.
Bremer, V. R. 2010. Distillers grains with solubles for feedlot cattle—Finishing
performance, lipid metabolism, and ethanol greenhouse gas balance. Ph.D. dissertation,
Univ. of Nebraska-Lincoln. Lincoln.
Bremer, V. R., A. J. Liska, G. E. Erickson, K. G Cassman, K. J. Hanford, and T. J.
Klopfenstein. 2011. Impact of distillers grains moisture and inclusion on greenhouse gas
emissions in the corn-ethanol-livestock life cycle. Neb. Beef Cattle Rep. 42-43.
Bremer, M. L., C. J. Bittner, D. B. Burken, G. E. Erickson, J. C. MacDonald. 2015.
Response to increasing concentrations of de-oiled modified distillers grains plus solubles
in beef feedlot diets. Neb. Beef Cattle Rep. 74-76.
Buckner, C. D., T. L. Mader, G. E. Erickson, S. L. Colgan, K. K. Karges, M L. Gibson.
2007. Optimum levels of dry distillers grains with solubles for finishing beef steers.
Nebraska Beef Cattle Report: MP90:36.
Buckner, C. D. 2010. Ethanol byproduct feeds: nutrient composition and variability,
determining accurate fiber content, storing with low-quality forages, and fiber utilization
in finishing diets. PhD Diss. University of Nebraska-Lincoln.
Buckner, C. D., M. F. Wilken, J. R. Benton, S. J. Vanness, V. R. Bremer, T. J.
Klopfenstein, P. J. Kononoff, and G. E. Erickson. 2011. Nutrient variability for distillers
grains plus solubles and dry matter determination of ethanol by-products. The Prof.
Anim. Sci. 27:57-64.
Buckner, C. D., B. R. Bremer, T. J. Klopfenstein, G. E. Erickson, K. J. Vander Pol, K. K.
Karges, and M. L. Gibson. 2011b. Evaluation of a prefermentation-fractionated by-
product corn grain dry milling ethanol process in growing and finishing cattle diets. The
Prof. Anim. Sci. 27:295-301.

71
Buckner, C. D., T. J. Klopfenstein, and G. E. Erickson. 2013. Evaluation of modifications
to the neutral-detergent-fiber analysis procedure for corn and distillers grains plus
solubles. Prof. Anim. Sci. 29:252-259.
Coleman, S. W., O. Neri-Flores, R. J. Allen, Jr., and J. E. Moore. 1978. Effect of
pelleting and of forage maturity on quality of two sub-tropical forage grasses. J. Anim.
Sci. 46:1103-1112.
Depenbusch, B. E., C. M. Coleman, J. J. Higgins, and J. S. Drouillard. 2009. Effects of
increasing levels of dried corn distillers grains with soluble on growth performance,
carcass characteristics, and meat quality of yearling heifers. J. Anim. Sci. 87:2653-2663.
Depenbusch, B. E., E. R. Loe, M. J. Quinn, M. E. Corrigan, M. L. Gibson, K. K. Karges,
J. S. Drouillard. 2008. Corn distillers grains with solubles derived from traditional or
partial fractionation process: Growth performance and carcass characterstics of finishing
feedlot heifers. J. Anim. Sci. 86:2338-2343.
Gramkow, J. L., C. J. Bittner, M. L. Jolly-Breithaupt, D. B. Burken, G. E. Erickson, and
J. C. MacDonald. 2016. Effects of processing treated corn stover and distillers’ grains on
performance and total tract digestion of finishing cattle. J. Anim. Sci. 94:3933-3946.
Gramkow, J. L., C. J. Bittner, M. L. Jolly, D. B. Burken, G. E. Erickson, and J. C.
MacDonald. 2016b. Effects of processing treated corn stover and distillers grains on
total-tract digestion and performance of growing cattle. Prof. Anim. Sci. 32:183-191.
Gunn, P. J., A. D. Weaver, R. P. Lemenager, D. E. Gerrard, M. C. Claeys, and S. L.
Lake. 2009. Effects of dietary fat and crude protein on feedlot performance, carcass
characteristics, and meat quality in finishing steers fed differing levels of dried distillers
grains with solubles. J. Anim. Sci. 87:2882-2890.
Jolly, M. L., B. L. Nuttelman, D. B. Burken, C. J. Schneider, T. J. Klopfenstein, G. E.
Erickson. 2013. Effects of modified distillers grains plus solubles and condensed
distillers solubles with and without oil extraction on finishing performance. Neb. Beef
Cattle Rep. 64-65.
Kelzer, J. M., J. M. Popowski, S. Bird, R. B. Cox, G. I. Crawford, and A. DiCostanzo.
(2011). Effects of including low fat, high protein dried distillers grains in finishing diets
on feedlot performance and carcass characteristics of beef steers. Univ. of Minn. Beef
Rep.
Klopfenstein, T. J., G. E. Erickson, and V. R. Bremer. 2008. Board-invited review: use of
distillers by-products in the beef cattle feeding industry. J. Anim. Sci. 86:1223-1231.
Larson, E. M., R. A. Stock, T. J. Klopfenstein, M. H. Sindt, and R. P. Huffman. 1993.
Feeding value of wet distillers byproducts for finishing ruminants. J. Anim. Sci. 71:2228-
2236.

72
Le Liboux, S. and J. L. Peyraud. 1999. Effect of forage particle size and feeding
frequency on fermentation patterns and sites and extent of digestion in dairy cows fed
mixed diets. Animal Feed Science and Technology 76: 297-319.
Lundy, E. L., D. D. Loy, and S. L. Hansen. 2015. Influence of distillers grains resulting
from a cellulosic ethanol process utilizing corn kernel fiber on nutrient digestibility of
lambs and steer feedlot performance. J. Anim. Sci. 93:2265-2274.
Moore, L. A. 1964. Symposium on forage utilization: nutritive value of forage as affected
by physical form. Part I. General principles involved with ruminants and effect of feeding
pelleted for wafered forage to dairy cattle. J. Anim. Sci. 23:203-238.
Morine, S. J., M. E. Drewnoski, and S. L. Hansen. 2014a. Determining the influence of
dietary roughage concentration and source on ruminal parameters related to sulfur
toxicity. J. Anim. Sci. 92:4068-4076.
Morine, S. J., M. E. Drewnoski, and S. L. Hansen. 2014b. Increasing dietary NDF
concentration decreases ruminal hydrogen sulfide concentrations in steers fed high-sulfur
diets based on ethanol co-products. J. Anim. Sci. 92:3035-3041.
Nichols, C. A., V. R. Bremer, A. K. Watson, C. D. Buckner, J. L. Harding, G. E.
Erickson, and D. R. Smith. 2013. The effect of sulfur and use of ruminal available sulfur
as a model to predict incidence of polioencephalomalacia in feedlot cattle. Bovine Pract.
47:47-53.
Nuttelman, B. L., W. A. Griffin, J. R. Benton, G. E. Erickson, T. J. Klopfenstein. 2011.
Comparing dry, wet, or modified distillers grains plus solubles on feedlot cattle
performance. Neb. Beef Cattle Rep. 50-52.
NRC. 1996. Nutrient Requirements of Beef Cattle. Natl. Aca. Press, Washington, DC.
National Academies of Sciences, Engineering, and Medicine. 2016. Nutrient
Requirements of Beef Cattle. 8th revised ed. Washington, DC. Natl. Aca. Press.
Peterson, S. J., A. L. Shreck, B. L. Nuttelman, C. J. Schneider, D. B. Burken, C. N.
Macken, W. A. Griffin, J. L. Harding, G. E. Erickson, T. J. Klopfenstein, and J. C.
MacDonald. 2015. Effects of alkaline treatment and pelleting of crop residues on
performance of growing calves. Prof. Anim. Sci. 31:552-558.
Pesta, A. C., B. L. Nuttelman, A. L. Shreck, W. A. Griffin, T. J. Klopfenstein, and G. E.
Erickson. 2015. Finishing performance of feedlot cattle fed condensed distillers solubles.
J. Anim. Sci. 93:4350-4357.
Sarturi, J. O., G. E. Erickson, T. J. Klopfenstein, K. M. Rolfe, C. D. Buckner, and M. K.
Luebbe. 2013. Impact of source of sulfur on ruminal hydrogen sulfide and logic for the
ruminal available sulfur for reduction concept. J. Anim. Sci. 91: 3352-3359.
Sarturi, J. O., G. E. Erickson, T. J. Klopfenstein, J. T. Vasconcelos, W. A. Griffin, K. M.
Rolfe, J. R. Benton, and V. R. Bremer. 2013b. Effect of sulfur content in wet or dry
73
distillers grains fed at several inclusions on cattle growth performance, ruminal
parameters and hydrogen sulfide. J. Anim. Sci. 91:4849-4860.
Stock, R., R. Klopfenstein, D. Brink, S. Lowry, D. Rock, and S. Abrams. 1983. Impact of
weighing procedures and variation on protein degradation rate on measure performance
of growing lambs and cattle. J. Anim. Sci. 57:1276-1285.
Watson, A. K., B. L. Nuttelman, T. J. Klopfenstein, L. W. Lomas, and G. E. Erickson.
2013. Impacts of a limit-feeding procedure on variation and accuracy of cattle weights. J.
Anim. Sci. 91:5507-5517.
Weir, W. C., J. H. Meyer, W. N. Garett, G. P. Lofgreen, and N. R. Ittner. 1959. Pelleted
rations compared to similar rations fed chopped or ground for steers and lambs. J. Anim.
Sci. 18:805-814.
Welchons, C. A., C. J. Bittner, D. B. Burken, J. C. MacDonald, and G. E. Erickson. 2016.
Effect of pelleted byproducts on performance when fed to growing cattle. Neb. Beef
Cattle Rep. 36-37.
Van Soest, P.J. 1963. Use of Detergents in the Analysis of Fibrous Feeds. II. A Rapid
Method for the Determination of Fiber and Lignin. Journal of A.O.A.C. 46:830.
Van Soest, P. J., J. B. Robertson, and B. A. Lewis. 1991. Methods of dietary fiber, neutral
detergent fiber, and non-starch polysaccharides in relation to animal nutrition. J. Dairy
Sci. 74:35-83.
Vander Pol, K. J., G. E. Erickson, T. J. Klopfenstein, M. A. Greenquist, and T. Robb.
2006. Effect of dietary inclusion of wet distillers grains on feedlot performance of
finishing cattle and energy value relative to corn. Neb. Beef Cattle Rep. 51-53.
Watson, A. K., J. C. MacDonald, G. E. Erickson, P. J. Kononoff, and T. J. Klopfenstein.
2015. FORAGES AND PASTURES SYPOSIUM: Optimizing the use of fibrous residues
in beef and dairy diets. J. Anim. Sci. 93:2616-2625.
Zeeck, J. R. 2013. Process using agriculture residue biomass for producing feed pellets.
Pellet Technology, Inc, assignee. US Patent 8,551,549. Date issued: 8 October.

74
Table 2.1. Dietary treatments containing modified components of distillers grains fed to steers1.
Treatment
Item CON3 DDGS PEL-
STV6
STV COMP COMP-
MED
COMP-
LOW
Ingredient, % DM2
HMC 31.50 31.50 31.50 31.50 31.50 31.50 31.50
DRC 50.00
DDGS 50.00
CDS 11.25 11.25 18.75 24.40 30.00
Treated Corn
Stover4,5
38.75 38.75
Corn Bran7 12.50 16.20 20.00
HPDG 18.75 9.40
Alfalfa hay 5.50 5.50 5.50 5.50 5.50 5.50 5.50
Corn Silage 4.00 4.00 4.00 4.00 4.00 4.00 4.00
Liquid Molasses 5.00 5.00 5.00 5.00 5.00 5.00 5.00
Supplement8
Fine ground corn 0.725 1.534 3.022 3.022 1.534 1.534 1.534
Limestone 1.430 1.976 0.488 0.488 1.976 1.976 1.976
Salt 0.300 0.300 0.300 0.300 0.300 0.300 0.300
Urea 1.355 - - - - - -
Tallow 0.100 0.100 0.100 0.100 0.100 0.100 0.100
Beef trace mineral9 0.050 0.050 0.050 0.050 0.050 0.050 0.050 Vitamins A, D, and E10 0.015 0.015 0.015 0.015 0.015 0.015 0.015
Rumensin 9011 0.0165 0.0165 0.0165 0.0165 0.0165 0.0165 0.0165
Tylan 4012 0.0087 0.0087 0.0087 0.0087 0.0087 0.0087 0.0087 1All values presented on a DM basis. 2HMC = high-moisture corn; DRC = dry-rolled corn; DDGS = dried distillers grain plus solubles; CDS =
condensed distillers solubles; HPDG = high protein dried distillers grains plus solubles. 3Supplemented with urea at 1.36% of diet to meet the DIP requirement. 4Corn stover treated with CaO by Pellet Technology USA, LLC, Gretna, NE. 5Treated corn stover at 12.50%, 7.50% condensed distillers solubles, and 18.75% high-protein dried distillers
grains plus solubles processed by Pellet Technology USA, LLC, Gretna, NE. 6Treated corn stover, condensed distillers solubles, and high-protein dried distillers grains pelleted by Pellet
Technology USA, LLC, Grenta, NE. 7Corn bran is isolated from dry-milling process and is not purified bran (contains more protein). 8Supplement formulated to be fed at 4% dietary DM. 9Premix contained 10%Mg, 6% Zn as ZnO, 4.5% Fe as FeSO4, 2% Mn as MnO, 0.5% Cu as CuSO4, 0.3% I
as Ca(IO3)2(H2O), and 0.05% Co as CoCO3. 10Premix contained 1,500 IU vitamin A, 3,000 IU vitamin D, and 3.7 IU vitamin E per g. 11Formulated to provide 375 mg∙steer∙d-1 monensin (Rumensin; Elanco Animal Health, Greenfield, IN). 12Forumated to provide 90 mg∙steer∙d-1 tylosin (Tylan; Elanco Animal Health). 13DM basis.

75
Table 2.2. Composition of dietary treatments containing modified components of distillers
grains fed to steers1.
Treatment
Item CON3 DDGS PEL-
STV6
STV COMP COMP-
MED
COMP-
LOW
Dietary
Composition13
DM 81.7 82.2 73.4 70.4 65.3 60.0 54.7
OM 94.4 92.3 90.7 90.7 91.2 90.6 89.9
CP 15.5 22.7 18.2 18.5 22.1 21.5 20.8
NDF 12.2 25.8 29.1 30.0 23.8 22.5 21.3
ADF 6.7 14.8 17.3 18.0 11.2 10.4 9.6
Lignin 1.5 3.0 3.0 3.3 1.9 1.8 1.7
Fat 3.66 6.10 4.32 4.50 5.33 5.14 4.95
Ca 0.78 0.97 0.55 0.58 1.01 1.02 1.03
P 0.26 0.60 0.71 0.72 0.69 0.78 0.87
K 0.74 1.17 1.42 1.43 1.32 1.47 1.61
S 0.16 0.31 0.41 0.41 0.40 0.42 0.44 1All values presented on a DM basis. 2HMC = high-moisture corn; DRC = dry-rolled corn; DDGS = dried distillers grain plus
solubles; CDS = condensed distillers solubles; HPDG = high protein dried distillers grains plus
solubles. 3Supplemented with urea at 1.36% of diet to meet the DIP requirement. 4Corn stover treated with CaO by Pellet Technology USA, LLC, Gretna, NE. 5Treated corn stover at 12.50%, 7.50% condensed distillers solubles, and 18.75% high-protein
dried distillers grains plus solubles processed by Pellet Technology USA, LLC, Gretna, NE. 6Treated corn stover, condensed distillers solubles, and high-protein dried distillers grains
pelleted by Pellet Technology USA, LLC, Grenta, NE. 7Corn bran is isolated from dry-milling process and is not purified bran (contains more
protein). 8Supplement formulated to be fed at 4% dietary DM. 9Premix contained 10%Mg, 6% Zn as ZnO, 4.5% Fe as FeSO4, 2% Mn as MnO, 0.5% Cu as
CuSO4, 0.3% I as Ca(IO3)2(H2O), and 0.05% Co as CoCO3. 10Premix contained 1,500 IU vitamin A, 3,000 IU vitamin D, and 3.7 IU vitamin E per g. 11Formulated to provide 375 mg∙steer∙d-1 monensin (Rumensin; Elanco Animal Health,
Greenfield, IN). 12Forumated to provide 90 mg∙steer∙d-1 tylosin (Tylan; Elanco Animal Health). 13DM basis.

76
Table 2.3. Nutrient analysis for ingredients containing modified components of
distillers grains fed to steers.
Ingredient
% DM
basis
HMC1 DRC1 DDGS1 Pelleted
Treated
Corn
Stover2,3,4
Treated
Corn
Stover2,3
Corn
Bran5
HPDG1 CDS1
DM 71.4 89.9 91.1 85.1 77.4 37.0 92.3 35.5
OM 98.2 98.4 95.0 87.1 87.1 97.6 97.2 85.3
CP 11.1 11.1 34.4 21.8 19.1 24.1 37.7 34.8
NDF 9.8 8.7 35.9 52.7 55.1 56.3 40.3 7.4
ADF 2.8 4.1 20.2 31.7 33.5 20.2 18.6 2.8
Lignin 0.8 1.2 4.3 5.4 6.0 2.8 2.8 0.8
Fat 4.3 3.9 8.7 4.5 5.0 5.5 8.4 7.0
Ca 0.04 0.03 0.04 1.36 1.61 0.09 0.05 0.09
P 0.31 0.26 0.94 0.55 0.65 0.39 0.50 2.23
K 0.42 0.38 1.19 1.03 1.36 0.35 0.50 2.94
S 0.10 0.10 0.40 0.40 0.42 0.25 0.42 0.92 1HMC = high-moisture corn; DRC = dry-rolled corn; DDGS = dried distillers grains
plus solubles; CDS = condensed distillers solubles; HPDG = high protein dried
distillers grains plus solubles. 2Corn stover treated with CaO by Pellet Technology USA, LLC, Gretna, NE. 3Treated corn stover at 12.50%, 7.50% condensed distillers solubles, and 18.75% high-
protein dried distillers grains plus solubles processed by Pellet Technology USA, LLC,
Gretna, NE. 4Treated corn stover, condensed distillers solubles, and high-protein dried distillers
grains pelleted by Pellet Technology USA, LLC, Grenta, NE. 5Corn bran is isolated from dry-milling process and is not purified bran (contains more
protein).

77
0
Table 2.4. Effects of modifying different components of distillers grains on animal performance and carcass
characteristics.
Treatment1 P - value
Item CON DDGS PEL-
STV
STV COMP SEM CON
vs.
DDGS
DDGS
vs.
COMP
COMP
vs.
STV
STV
vs
PEL-
STV
Initial BW, kg 367 368 368 368 367 1 0.65 0.65 0.52 0.74
Final BW, kg2 631 655 617 625 623 6 <0.01 <0.01 0.88 0.35
DMI, kg/d 11.9 12.9 12.8 13.3 12.4 0.2 <0.01 0.05 <0.01 0.03
ADG, kg3 1.74 1.89 1.65 1.70 1.69 0.04 <0.01 <0.01 0.91 0.37
G:F3 0.144 0.145 0.127 0.126 0.132 0.002 0.80 <0.01 0.04 0.63
Feeding Value4 100 101 76 74 83 - - - - -
HCW, kg 398 413 389 394 393 4 <0.01 <0.01 0.88 0.35
LM area, cm2 85.3 83.8 84.8 83.9 83.5 1.1 0.34 0.83 0.79 0.56
12th rib fat, cm 1.43 1.61 1.35 1.37 1.53 0.05 0.01 0.02 0.02 0.73
Marbling5 529 511 482 511 514 11 0.25 0.82 0.82 0.07 1CON = 50% dry-rolled corn; DDGS = 50% dried distillers grains plus solubles; PEL-STV = pelleted 7.50% condensed
distillers solubles, 12.5% treated corn stover, 18.75% high-protein dried distillers grains plus solubles, with an additional
11.25% condensed distillers solubles added at mixing; STV = 7.5% solubles, 12.5% treated corn stover, 18.75% high-
protein dried distillers grains plus solubles, with an additional 11.25% condensed distillers solubles added at mixing;
COMP = 18.75% solubles, 12.5% corn bran, and 18.75% high-protein dried distillers grains plus solubles. 2Calculated from HCW/common dress (63%). 3Calculated from carcass weight, adjusted to 63% common dressing percent. 4Feeding Value Calculation: [((compared treatments G:F – CON G:F) / CON G:F) / compared treatments inclusion
rate*100+100] 5Marbling score: 400 = Small00.

78
1
2
Table 2.5. Effects of modifying different components of distillers grains on animal performance and carcass
characteristics.
Treatment1 P - value
Item CON DDGS COMP COMP-
MED
COMP-
LOW
SEM CON
vs.
DDGS
DDGS
vs.
COMP
Lin2 Quad3
Initial BW, kg 367 368 367 367 369 1 0.65 0.65 0.11 0.43
Final BW, kg4 631 655 623 635 629 6 <0.01 <0.01 0.48 0.19
DMI, kg/d 11.9 12.9 12.4 12.8 12.3 0.2 <0.01 0.05 0.66 0.04
ADG, kg5 1.74 1.89 1.69 1.77 1.72 0.04 <0.01 <0.01 0.58 0.16
G:F5 0.144 0.145 0.132 0.136 0.137 0.002 0.80 <0.01 0.10 0.51
Feeding Value6 100 101 83 89 90 - - - - -
HCW, kg 398 413 393 400 396 4 <0.01 <0.01 0.48 0.19
LM area, cm2 85.3 83.8 83.5 87.1 86.1 1.1 0.34 0.83 0.10 0.08
12th rib fat, cm 1.43 1.61 1.53 1.43 1.38 0.05 0.01 0.02 0.02 0.67
Marbling7 529 511 514 512 497 11 0.25 0.82 0.28 0.67 1CON = 50% dry-rolled corn; DDGS = 50% dried distillers grains plus solubles; COMP = 18.75% solubles, 12.5% corn
bran, and 18.75% high-protein dried distillers grains plus solubles; COMP-MED = 24.4% solubles, 16.2% corn bran, and
9.4% high-protein dried distillers grains plus solubles; COMP-LOW = 30% solubles and 20% corn bran. 2Lin. = P-value for the linear response of protein with COMP, COMP-MED, COMP-LOW. 3Quad. = P-value for the quadratic response of protein with COMP, COMP-MED, COMP-LOW. 4Calculated from HCW/common dress (63%). 5Calculated from carcass weight, adjusted to 63% common dressing percent. 6Feeding Value Calculation: [((compared treatments G:F – CON G:F) / CON G:F) / compared treatments inclusion
rate*100+100] 7Marbling score: 400 = Small00.
79
CHAPTER III. EVALUATION OF PROTEIN IN DISTILLERS GRAINS ON
NUTRIENT DIGESTIBILITY, RUMEN FERMENTATION
CHARACTERISTICS, GROWTH PERFORMANCE, AND CARCASS
CHARACTERISTICS IN BEEF CATTLE FINISHING DIETS
Z. E. Carlson*, J. L. Gramkow, H. C. Hamilton, M. L. Jolly-Breithaupt, G. E. Erickson*,
J. C. MacDonald*, M. K. Luebbe*1
*Department of Animal Science, University of Nebraska, Lincoln, NE 68583-0908
1 Corresponding Author: [email protected]

80
ABSTRACT
Three studies evaluated the relative contribution of excess rumen undegradable protein
(RUP) from distillers grains plus solubles (DGS) on growth performance, carcass traits,
nutrient digestibility, ruminal VFA concentrations and pH. In Exp. 1, crossbred steers (n
= 324; initial BW = 291; SD = 24 kg) were utilized in a randomized block design to
determine the relative contributions of protein on the feeding value of DGS. Protein in
wet DGS (WDGS) was simulated using corn gluten meal (CGM; 8.75 and 17.5%
inclusion, LOW-CGM and HIGH-CGM, respectively; DM basis) to provide similar RUP
as 20 (20DGS) and 40% WDGS (40DGS; DM basis), respectively. In addition to CGM,
10% (DM basis) condensed distillers solubles (CD) was added to HIGH-CGM (CGM-
CDS) to compare to 40DGS diet. All treatments were compared to a dry-rolled corn
control (CON). In Exp. 2, six duodenally fistulated steers were utilized in an unbalanced
6 × 6 row-column design with six periods and four treatments (CON, 40DGS, HIGH-
CGM, CGM-CDS) to evaluate site of nutrient digestion. In Exp. 3, six ruminally
fistulated steers were utilized in an unbalanced 6 × 6 row-column design with six periods
and four treatments (CON, 40DGS, HIGH-CGM, CGM-CDS) to evaluate bacterial
purine:N, ruminal VFA concentration, and ruminal pH. Both Exp. 2 and 3 used modified
DGS. In Exp. 1, a quadratic increase (P = 0.04) in ADG was observed as CGM increased
from 0% (1.65 kg) to 17.5% (1.73 kg). A linear increase (P < 0.01) in G:F was observed
as CGM increased from 0% (0.161) to 17.5% (0.169). Isolating the protein portion of
20% WDGS by feeding 8.75% CGM decreased (P < 0.01) G:F compared to 20% WDGS.
Similarly, protein from 40% WDGS replaced by 17.5% CGM increased (P < 0.01) DMI
and decreased (P < 0.01) G:F compared to 40% WDGS. Relative to the control diet,
81
20DGS, 40DGS, LOW-CGM, HIGH-CGM, and CGM-CDS had 134, 125, 110, 129, and
121% the feeding value of corn, respectively. In Exp. 2, total tract digestibilities of DM
and OM were less (P ≤ 0.03) for steers fed 40DGS compared to CON, HIGH-CGM, and
CGM-CDS (OM digestibilities of 72.9, 84.7, 80.5, and 84.3%, respectively; SEM =
3.1%). Total tract NDF digestibility was not different (P = 0.64) among treatments.
Excess protein used as an energy source from DGS accounts for the majority of the
feeding value response observed when feeding DGS.
Key Words: distillers grains plus solubles, finishing, protein
82
INTRODUCTION
As advances in technology continue in the ethanol industry, isolating and
separating components of distillers grains plus solubles (DGS) is becoming more
prevalent. These changes may influence the use of DGS in feedlot diets. Currently,
ethanol plants are able to separate a portion of the protein from DGS for use in alternative
markets. Previous research has examined the fiber, protein, and fat of DGS. Lodge et al.
(1997) evaluated composites of DGS using wet corn gluten feed, condensed distillers
solubles (CDS), corn gluten meal (CGM), and tallow formulated to be similar in nutrient
profiles as wet DGS (WDGS). The feeding value of the composite DGS and WDGS, both
included at 40% of the diet (DM basis), were 124% and 131% relative to corn
(Klopfenstein et al., 2008). The feeding value of only protein or only fat from DGS were
both 118% relative to corn. Oglesbee et al. (2016) combined 17.5% CGM, 14% corn
bran, and 3% solvent extracted germ meal (DM basis) to replicate the protein and fiber
portions of DGS. The feeding value, calculated from performance data, for WDGS, fiber
component, and protein component were 130%, 83%, and 121%, respectively, relative to
corn. Conroy et al. (2016) isolated protein, fiber, and CDS from DGS. The feeding values
for WDGS, protein, fiber, and CDS were 136%, 118%, 96%, and 82%, respectively,
relative to corn. All authors concluded that protein and fat from DGS are the majority of
the feeding value of DGS. Limited research has examined isolating only the protein
portion of DGS. Further investigation on the relative contributions of the protein fraction
from DGS is required to determine feeding value of protein from DGS.
The objectives of these experiments were to: isolate and evaluate the protein from
DGS on animal performance and carcass characteristics in finishing diets (Exp 1);
83
evaluate protein from DGS on site and extent of nutrient digestibility (Exp 2); and
evaluate protein from DGS effect on ruminal VFA concentration and pH (Exp 3).
MATERIALS AND METHODS
All procedures involving animal care and management were approved by the
University of Nebraska’s Institutional Animal Care and Use Committee.
Experiment 1
Crossbred calf-fed steers [n = 324; 291 kg (SD = 24) initial BW] were utilized in
a generalized randomized block design at the University of Nebraska Panhandle Research
and Extension Center feedlot (Scottsbluff, NE). Before the start of the experiment, steers
were received, given an identification tag, and vaccinated with an infectious bovine
rhinotracheitis, parainfluenza-3, bovine viral diarrhea virus, bovine respiratory syncytial
virus modified live virus vaccine (Bovi-Shield Gold 5 Way; Pfizer Animal Health, New
York City, NY), vaccinated with a Clostridium chauvoei, C. septicum, C. novyi, C.
sordelli, C. perfringens types C and D bacterin toxoid (Vision 7 Somnus with spur;
Merck Animal Health, De Soto, KS), and treated with Ivomec (Ivomec; Merial, Duluth,
GA) for internal and external parasite control. Steers were limit-fed (2% of BW) a diet
consisting of 15% straw, 25% alfalfa hay, 35% corn silage, and 25% WDGS (DM basis)
for five d prior to weighing to equalize gut fill (Watson et al., 2013). Steers were
individually weighed using a hydraulic squeeze chute with load cells mounted on the
chute (Silencer, Moly Manufacturing Inc., Lorraine, KS: scale readability ± 0.45 kg) for
two consecutive days (d 0 and 1) to establish initial BW (Stock et al., 1983). Steers were
blocked by BW into two blocks (light and heavy) and stratified by BW within block, and
assigned randomly to 36 pens.

84
Pens were assigned randomly to one of six dietary treatments with six replications
per treatment and 9 steers per pen. Dietary treatments are provided in Table 3.1. In the
experimental diets, the protein portion of WDGS was mimicked by CGM (74.2% CP,
7.0% NDF, 3.5% fat) to provide similar protein as 20 and 40% WDGS. Corn gluten meal
is produced from the wet milling processing of corn grain. Corn gluten meal is high in
protein, approximately 68% CP (NASEM, 2016). Previous work has estimated that the
percentage of rumen undegradable protein (RUP) from CGM ranges from 46-86% (% of
CP; Zinn et al., 1981; Stern et al., 1983; Titgemeyer et al., 1989). The most current RUP
estimate is 69% of CP (NASEM, 2016). Therefore, the protein component of distillers
grains could be examined without the addition of other components (i.e. fiber and fat).
Diets were formulated to provide 360 mg/steer of Monensin (Rumensin, Elanco Animal
Health) and 90 mg/steer of Tylosin (Tylan, Elanco Animal Health) daily via micro-
machine.
Steers were implanted on d 1 with 16 mg of estradiol and 80 mg of trenbolone
acetate (Component TE-IS, Elanco Animal Health) and re-implanted with 24 mg of
estradiol and 120 mg of trenbolone acetate (Component TE-S, Elanco Animal Health) on
d 90. Steers were individually weighed once at the end of the experiment, and a 4%
pencil shrink was applied for calculation of final live BW. Carcass-adjusted performance
was calculated using HCW adjusted to a common dressing percent of 63%.
Feed bunks were assessed at approximately 0600 h and managed for trace (≤0.2
kg/steer) amounts of feed remaining in the bunk each morning at time of feeding. Feed
was delivered with a truck mounted mixer and delivery unit (Roto-Mix model 274, Roto-
Mix, Dodge City, KS; scale readability ± 0.91 kg) each morning at 0800 h. Steers were
adapted to finishing diets over a 21-d period with a series of 4 diets containing 20, 15, 10,

85
and 5% of both alfalfa hay and wheat straw for 3, 4, 7, and 7 d, respectively, with DRC
replacing alfalfa hay and wheat straw. Concentration of wet distillers grains with solubles
(20 and 40%; WDGS; Bridgeport Ethanol LLC, Bridgeport, NE; 31.1% CP, 29.8% NDF,
7.4% fat), corn silage (15%), and liquid supplement (6%) were included at the same
concentration in the adaptation diets as the finishing diets (DM basis; Table 3.1). Corn
gluten meal (ADM Corn Processing, Columbus, NE; 81.4% DM, 74.2% CP, 7.0% NDF,
3.5% fat) was included in the DRC-based diets at 8.75 or 17.50% (DM basis),
respectively, replacing corn. The CGM used in Exp 1 was delivered as needed from
November 2014 until May 2015 and was stockpiled in a concrete bunker silo through the
remainder of the experiment. The CDS (Bridgeport Ethanol LLC, Bridgeport, NE; 19.3%
CP) used in Exp 1 was stored in liquid bulk tanks. The liquid supplement for CON
contained 1.34% Ca to meet the NRC (1996) requirements and 1.3% urea (DM basis) to
meet or exceed rumen degradable protein requirements (NRC, 1996). The liquid
supplement for 20DGS, 40DGS, LOW-CGM, HIGH-CGM, and CGM-CDS contained
1.4% limestone (71% Ca by atomic weight) to meet the NRC (1996) requirements.
Ingredient and diet samples were collected weekly and dried in a 60°C forced-air oven
for 48 h to determine DM of the samples (AOAC International, 1997; Method 930.15).
Composited ingredient samples were sent to a commercial laboratory (Servi-Tech
Laboratories, Hastings, NE) and analyzed for CP (AOAC International, 2000; Method
990.03), NDF (ANKOM, 2006), ether extract (AOAC International, 2006; Method
2003.6), Ca, P, S (Mills and Jones, 1996), and total starch (AOAC International, 2000;
Method 996.11) content. Dry-rolled corn was processed at the research feedlot using a
roller mill.

86
Cattle were shipped according to projections made utilizing interim BW and ADG
to target a final BW of 635 kg. Steers were harvested at a commercial abattoir (Cargill
Meat Solutions, Fort Morgan, CO) on d 182 (heavy block) and d 193 (light block). All
carcass data were collected by Diamond T Livestock Services (Yuma, CO). Hot carcass
weight and liver scores were recorded on day of harvest. After a 48-h chill, LM area,
marbling score, and 12th-rib fat were recorded. Yield grade was calculated from the
following formula: 2.50 + (6.35 x 12th rib fat thickness, cm) + (0.2 x 2.5 [KPH]) +
(0.0017 x HCW, kg) - (2.06 x LM area, cm2) from USDA (1997). Final BW was carcass-
adjusted using HCW and a common dressing percent (63%) to calculate ADG and G:F.
Hot carcass weights were used to reduce errors associated with gut-fill differences among
dietary treatments (Meyer et al., 1960; Watson et al., 2013). Feeding value was calculated
from the following formula: [((compared treatments G:F – CON G:F) / CON G:F) /
compared treatments inclusion rate*100 + 100]. Dietary NEm and NEg values were
calculated for each treatment based on intake and performance of cattle. These data were
analyzed as dietary NE for each pen, similar to performance data using equations from
the NRC (1996) as described by Vasconcelos and Galyean (2008).
Performance and carcass characteristics were analyzed using the MIXED
procedure of SAS (SAS Institute, Inc., Cary, N.C.) with pen as the experimental unit. The
model included block and dietary treatment as a fixed effects. Liver abscesses were
analyzed as a binomial response using the GLIMMIX procedure of SAS (SAS Institute,
Inc., Cary, N.C.) with animal as the experimental unit. The model included block and
dietary treatment. Dead or chronic steers were removed from analysis. Five steers were
removed from the experiment due to injury or respiratory issues. Two steers were
87
removed from the experiment from CON due to chronic illness. One steer was removed
from the experiment from HIGH-CGM treatment due to a broken leg. One steer was
removed from CGM-CDS due to ruptured internal organs. Linear and quadratic contrasts
were developed to compare DGS concentration (20 vs. 40) and protein concentration.
Pairwise comparisons were pre-planned to determine the addition of CDS (HIGH-CGM
vs. CGM-CDS) and feeding value of protein from DGS (20DGS vs. LOW-CGM; 40DGS
vs. HIGH-CGM). Treatment differences were considered significant when P ≤ 0.05 with
tendencies between P > 0.05 and P ≤ 0.10. Treatment comparisons were made using pair-
wise comparisons when the F-test statistic was significant.
Experiment 2
Six duodenally fistulated crossbred steers (380 kg initial BW; SE = 50) were
utilized in an unbalanced 6 × 6 row-column design, with six periods and four treatments,
at the University of Nebraska Metabolism Lab (Lincoln, NE). Each period consisted of
21-d with 16-d adaptation followed by a 5-d collection period. Dietary treatments were
similar to Exp. 1 (Table 3.2). Modified distillers grains plus solubles (MDGS; Flint Hills
Resources, Fairmont, NE; 34.1% CP, 38.5% NDF, 10.8% fat) was utilized in Exp 2 and
Exp 3. Diets were offered once daily at 0800 allowing for ad libitum intake. Feed refusals
were collected from d 16 to 20, weighed, and subsampled to determine nutrient intake.
Steers were individually housed in 2.1 x 3.7 m pens equipped with slatted floors and
given ad litbitum access to water. All diets contained 5% dry meal supplement that
provided 375 mg/steer daily of monensin (Rumensin; Elanco Animal Health, Greenfield,
IN) and 90 mg/steer daily of tylosin (Tylan; Elanco Animal Health). Supplements were
mixed weekly in a mobile ribbon mixer (model L-1000A Food Mixer; Leland Detroit

88
Manufacturing Co., Fort Worth, TX) and stored in 37-L barrels. The barrels were stored
at room temperature (20°C). Diets were mixed weekly in a stationary ribbon mixer
(model S-5 Mixer; H.C. Davis Sons Manufacturing Co., Inc., Bonner Springs, KS) and
stored in 200-L barrels. The barrels were stored in a cooler held at 4°C to ensure diet
quality was maintained.
Fecal output was estimated by top dressing titanium dioxide (TiO2; 10 g/d) at time
of feeding (0800) throughout the period. Fecal and duodenal samples were collected from
d 17 to 21 at 0800, 1200, 1600 h. A single 250-mL fecal aliquot and two 250-mL
duodenal aliquots were retained from each collection. Fecal samples were composited by
day (wet weight basis) within steer, lyophilized (Virtis Freezemobile 25ES; Life
Scientific, Inc., St. Louis, MO), and ground through a 1-mm screen using a Wiley mill
(number 4; Thomas Scientific, Swedesboro, NJ). The lyophilized and ground daily
composites were then composited on a dry weight basis by steer within collection period.
Fecal samples were analyzed for TiO2 concentration as described by Myers et al. (2004).
Concentration of TiO2 was then used to calculate fecal DM output using the following
equation (Cochran and Galyean, 1994): g marker dosed per d/concentration of marker in
feces.
One 250mL duodenal sample was stored at 4°C. The second 250mL duodenal
sample was lypholized (Virtis Freezemobile 25ES; Life Scientific, Inc.) and ground
through a 1-mm screen using a Wiley mill (number 4; Thomas Scientific). The steer x h
sample was then composited on an equal dry weight basis by collection period. Duodenal
samples were analyzed for TiO2 concentration as described by Myers et al. (2004).
Concentration of TiO2 was then used to calculate OM flow using the following equation

89
(Cochran and Galyean, 1994): g marker dosed per d/concentration of marker in duodenal
sample.
Individual feed ingredients were dried in 60°C forced-air oven (model LBB2-21-
1; Despatch Industries) for 48 h (AAOC, 1965; method 935.29) weekly to ensure that
accurate DM were used when mixing dietary treatments. Samples of individual
ingredients were taken prior to mixing diets, composited by period, lyophilized (Virtis
Freezemobile 25ES; Life Scientific, Inc.), and ground through a 1-mm screen using a
Wiley mill (number 4; Thomas Scientific). Feed samples were analyzed for OM, CP,
NDF, fat, and starch to calculate nutrient composition of dietary treatments (Table 3.2).
Duodenal and fecal samples were analyzed for DM, OM, NDF, and starch. Laboratory
DM was determined after drying in a 100°C forced-air oven for 24 h (AOAC, 1990;
methods 930.15). Ash and OM were determined by placing samples in a muffle furnace
for 6 h at 600°C (AOAC, 1999; method 4.1.10). Crude protein was determined by using a
combustion chamber (TruSpec N Determinator; Leco Corporation, St. Joseph, MI;
AOAC, 1999; method 990.03). Neutral detergent fiber analysis was conducted using the
procedure described by Van Soest et al. (1991) with modifications to the analysis of corn
and byproducts described by Buckner et al. (2013). The modifications applied to corn
prior to NDF analysis consisted of grinding corn through a 0.5-mm screen fitted on a
Tecator Cyclotec Mill (ThermoFisher Scientific, Eden Prairie, MN). Additionally, 2
doses (0.5 mL/dose) of α-amylase (catalog number FAA; ANKOM Technology,
Macedon, NY) were added during the hour boil in NDF solution. The modification
applied to the byproducts was a biphasic lipid extraction (Bremer et al., 2010) prior to
NDF analysis (Buckner et al., 2013). Ether extract was determined by a biphasic lipid
90
extraction procedure described by Bremer (2010). Briefly, samples were heated in a 1:1
mixture of hexane and diethyl ether for 9 h, dilute HCl was added, and samples were
centrifuged to separate the lipid layer from other liquid. Lipid layer was pipetted off,
heated to drive off remaining solvent, and weighed. Starch content was determined using
spectrophotometry (Spectra Max 250 Spectrometer, Molecular Devices, Sunnyvale, CA)
after converting starch to glucose using an enzyme kit (Megazyme International Ireland
Ltd., Wicklow, Ireland; method 996.11; AOAC, 2003).
Nutrient composition of dietary treatments and feces were used to calculate total
tract digestibility of DM, OM, NDF, and starch. Total tract digestibility was calculated
using the following equation (Cochran and Galyean, 1994): [(kg of nutrient fed − kg of
nutrient refused – kg of nutrient in feces)/(kg of nutrient fed − kg of nutrient refused)] ×
100. Steers from Exp. 2 were only duodenally fistulated. Experiment 3 was conducted to
provide a purine:nitrogen ratio in order to account for microbial nutrient contributions.
True ruminal digestibility was calculated as the difference between the amount of nutrient
ingested and the amount present at the duodenal cannula after correcting for microbial
nutrient contributions.
Throughout the experiment, challenges resulted from issues with either duodenal
cannulae or animal health. After the fourth period, 4 animals had been removed over the
course of the trial. Overall, eight experimental observations were removed from the initial
6 periods. A seventh and eighth period were added to provide additional
replications/treatment. As a result of complications with animals, nutrient digestibility
data were analyzed as a Row x Column design with 4 dietary treatments (CON, 40DGS,
HIGH-CGM, and CGM-CDS) and 8 periods using the MIXED procedures of SAS (SAS
91
Inst. Inc., Cary, NC). Steer within period was the experimental unit. Steer was included in
the random statement. The model included treatment and period as independent fixed
effects. Treatment differences were considered significant when P ≤ 0.10 with tendencies
between P > 0.10 and P ≤ 0.15.
Experiment 3
Six ruminally fistulated crossbred steers (350 kg initial BW; SD = 43) were
utilized in an unbalanced 6 × 6 row-column design, with six periods and four treatments,
at the University of Nebraska Metabolism Lab (Lincoln, NE). Each period consisted of
14-d with 11-d adaptation followed by collections from d 12 to 14. Exp. 3 was performed
in order to measure ruminal pH, ruminal VFA concentrations, and correct for microbial
cell flow into the duodenum in Exp 2. Corrections for microbial cells required isolating
bacterial cells from rumen contents and analyzing purine:nitrogen. Dietary treatments
were the same as Exp. 2 (Table 3.2). Experiment 3 was performed after Exp. 2. Diets
were offered once daily at 0800 at ad libitum intake. Feed refusals were collected from d
11 to 13, weighed, and subsampled to determine nutrient intake. Steers were housed
similar to Exp 2. Feed and supplement were mixed and stored similar to Exp 2.
Supplement in Exp 3 included the same ingredients as Exp 2.
A suction strainer technique was used to collect rumen fluid samples
(approximately 50 mL) at 0900, 1300, and 1700 h on d 12 and 0700 (1 h pre-feeding),
1100, 1500, and 1900 h on d 13 of each collection period. All 7 time points were
combined to provide a 12 h measurement of VFA concentration. During each sampling,
the suction probe was moved around the rumen to make sure a representative sample of
rumen fluid was collected. Rumen fluid samples were immediately frozen after collection
92
and remained frozen until VFA concentration was measured. At the time of analysis,
rumen fluid samples were thawed in a cooler (4°C) to ensure no additional fermentation
occurred. After thawing samples were prepared according to Erwin et al. (1961) and
analyzed for VFA concentration using a Trace 1300 gas chromatograph (Thermo Fisher
Scientific, Inc., Omaha, NE) fitted with a Zebron capillary column (Phenomenex Inc.,
Torrance, CA; catalog number 7HM-G009-22). The column was 30 m in length with an
inside diameter of 0.32 mm and a film thickness of 1 μm. Crotonic acid (catalog number
107- 93-7; Sigma-Aldrich, St. Louis, MO) was used as an internal standard for all
samples. Each sample collected was analyzed twice for VFA concentration to ensure an
accurate value was obtained. Total run time on the gas chromatograph was 9.75 min.
During analysis, the inlet and flame ionization detector temperatures were held at 280°C.
Oven temperature started at 160°C and increased 8°C per minute until it reached 200°C.
Helium (catalog number SGSPPULW800P; Matheson Tri-Gas, Lincoln, NE) was used as
the carrier gas. Column carrier flow was set at 2.4 mL/min. Flow rates of compressed air
(catalog number SGSPPULW700; Matheson Tri-Gas) and hydrogen (catalog number
SGSPPULW500P; Matheson Tri-Gas) were set at 350 and 30 mL/min, respectively.
Wireless pH loggers (Dascor, Inc., Escondido, CA) were placed in the rumen on d
7, prior to feeding, and recorded pH measurements every minute until d 14 of each
collection period. Only pH measurements from d 10 to 13 were used to estimate rumen
pH. Probes were attached to a weight to ensure the electrode remained in the ventral sac
of the rumen. All probes were calibrated prior to being placed in the rumen each
collection period by submersing them in pH 4 and 7 standard solutions. Ruminal pH

93
measurements from each period were adjusted using the beginning and ending calibration
values. All pH data were exported onto a computer where data were sorted.
Samples of whole rumen (2 kg) contents were taken from the ventral portion of
the rumen on d 14, blended (model NJ600WM 30 NINJA; Intertek, London, UK) into a
homogenous mixture, strained through 4 layers of cheesecloth, and centrifuged to isolate
bacterial cells (Leupp et al., 2009). Whole rumen contents were flash frozen using liquid
nitrogen for isolation of bacterial cells. Samples were blended on high speed for 1 min
and strained through 4 layers of cheesecloth. Liquid was then placed in 250-mL
centrifuge bottles and centrifuged at 500 × g for 20 min at 4°C to remove feed particles
and protozoa. Supernatant was removed and centrifuged again at 500 ×g for 20 min at
4°C. Bacteria were separated from free supernatant by centrifuging at 30,000 × g for 20
min at 4°C and were subsequently frozen at −4°C and lyophilized. Duodenal contents
from Exp. 2 and ruminal bacterial isolates from Exp. 3 were analyzed for purine
concentration to determine microbial flow using a modified Zinn and Owens (1986)
procedure with a more dilute HClO4 to hydrolyze material containing purines (as
described by Crawford et al., 2008). Purine concentration was determined on a
spectrophotometer (Spectra Max 250 Spectrometer, Molecular Devices) at 260 nm.
Throughout the experiment, challenges resulted from issues with animal health.
After the first period, one animal was removed. After the fifth period, one animal was
removed. As a result, one observation from CON and 40DGS and two observations from
CGM-CDS were not analyzed. Data for VFA concentration and average ruminal pH were
analyzed as a repeated measure using the MIXED procedure of SAS. Time within day
was the repeated measure. The model included day, time, treatment, and all resultant

94
interactions, in addition to period as an independent fixed effect. Data for all other
ruminal pH traits were analyzed using the MIXED procedure of SAS. The model
included treatment and period as an independent fixed effect. Six covariance structures
were tested (unstructured, variance components, Cholesky, autoregressive, Toeplitz, and
compound symmetry), and the structure that resulted in the lowest Bayesian information
criterion (compound symmetry) was determined the best fit (Littell et al., 1998).
Treatment differences were considered significant when P ≤ 0.10 with tendencies
between P > 0.10 and P ≤ 0.15.
RESULTS AND DISCUSSION
Experiment 1
Linear and Quadratic Responses for CON, 20DGS, and 40DGS
There was a tendency for a linear increase for final BW (600 vs. 613 kg for CON
vs. 40DGS, respectively; P = 0.06) due to WDGS inclusion (Table 3.3). As WDGS
inclusion increased from 0 to 40%, DMI decreased linearly (10.3 vs. 9.7 kg for CON vs.
40DGS, respectively; P < 0.01) with a tendency for a linear increase in ADG (1.65 vs.
1.71 kg for CON vs. 40DGS, respectively; P = 0.06). Increasing WDGS inclusion
linearly improved G:F (0.161 vs. 0.176 for CON vs. 40DGS, respectively; P < 0.01).
These results support previous data with varying levels of WDGS (Firkins et al., 1985;
Ham et al., 1994; Watson et al., 2014; Oglesbee et al., 2016). Cattle fed 20DGS and
40DGS had a feeding value of 134% and 125% relative to corn, respectively. This is
comparable to the meta-analysis by Klopfenstein et at. (2008), which reported feeding
value of 40% WDGS was 131% compared to corn. As WDGS inclusion increased, HCW
tended (P = 0.06) to increase. All other carcass traits were not impacted (P ≥ 0.21) by
95
WDGS inclusion. There was no difference (P > 0.19) in liver abscess scores among
CON, 20DGS, and 40DGS.
Linear and Quadratic Responses for Protein
The protein portion of WDGS was mimicked by CGM at concentrations equal to
the protein contained in 20 and 40% WDGS. Increasing protein concentrations
quadratically increased (P = 0.04) final BW (Table 3.4). Cattle fed HIGH-CGM were 16
kg heavier compared to CON. There were no differences (P ≥ 0.13) in DMI between
CON, LOW-CGM and HIGH-CGM. Gain increased quadratically (P = 0.04) as CGM
increased. Cattle fed 17.5% CGM (protein concentration equal to 40% WDGS) gained
1.73 kg/d compared to CON which gained 1.65 kg/d. As protein increased in the diet,
G:F increased linearly (0.161 vs. 0.169 for CON vs. HIGH-CGM, respectively; P <
0.01). There was a quadratic increase (P = 0.04) for HCW with steers fed HIGH-CGM
having the greatest HCW at 388 kg compared to CON and LOW-CGM. There were no
differences (P = 0.12) in dressing percent as protein increased. There tended to be a
quadratic increase (P < 0.10) in LM area with HIGH-CGM having the largest LM area,
CON intermediate, and LOW-CGM with the smallest. There were no differences (P ≥
0.22) in calculated yield grade and 12th rib fat among CON, LOW-CGM, and HIGH-
CGM. Marbling tended to increase linearly (P = 0.10) as protein concentration increased.
There were no differences (P = 0.19) for liver abscesses between CON, LOW-CGM, and
HIGH-CGM.
Several studies have fed cattle concentrations of DGS to exceed the cattle’s’ MP
requirement and reported greater energy per kg of DM for distillers grains or DGS than
corn it replaced (Farlin et al., 1981; Firkens et al., 1985; Larson et al., 1993; Ham et al.,

96
1994; Trenkle et al., 1997). In the current experiment, all diets were formulated to meet
or exceed metabolizable protein requirements (NRC, 1996). Based on animal
performance and nutrient analysis, MP balance was calculated using equations from NRC
(1996). Cattle consuming CON, 20DGS, and LOW-CGM had an MP balance of -9, 118,
and 208 g/kg SBW0.75, respectively. Likewise, cattle consuming 40DGS, HIGH-CGM,
and CGM-CDS had 301, 477, and 443 g/kg SBW0.75, respectively. Therefore,
improvements in animal performance over corn is a result from excess protein, primarily
RUP, being utilized more efficiently than the corn it replaced. These results indicate an
energy response for CGM, not a protein response.
HIGH-CGM vs. CGM-CDS
The addition of 10% CDS (CGM-CDS) decreased final BW (602 vs. 616 kg,
respectively; P = 0.04) compared to HIGH-CGM (Table 3.4). Conroy et al. (2016)
observed a similar response when 10% CDS was added with 14% CGM in a corn-based
diet. In that study, compared to 10% CDS only, the addition of 14% CGM increased DMI
but ADG and G:F were not different. In this experiment, DMI tended to be lower (P =
0.08) for cattle fed CGM-CDS compared to HIGH-CGM. Average daily gain decreased
for CGM-CDS, with steers gaining 1.66 kg/d in comparison to 1.73 kg/d for steers fed
HIGH-CGM (P = 0.08). In a similar experiment by Oglesbee et al. (2016), the addition of
8% CDS to a distillers grains fiber composite diet resulted in improved DMI and ADG.
The authors reported no difference (P = 0.32) in G:F between HIGH-CGM and CGM-
CDS. Olgesbee et al. (2016) observed no effect of CDS on G:F. Conroy et al. (2016)
observed poorer G:F when 10% of corn was replaced with CDS. Supplementing CDS
decreased ADG and DMI at a similar rate, which did not change G:F. Condensed

97
distillers solubles has variable impacts on performance when combined with DGS
composite diets. Belyea et al. (1998) examined the variability in distillers solubles from
one wet milling ethanol plant. The authors found that metabolizable energy of CDS (2400
kcal/kg) was lower than corn (3400 kcal/kg). Although the CDS from their experiment
was derived from the wet milling industry similar sources of variation could be observed
from dry milling plants. Potential variability between ethanol plants may help explain the
differences observed between the current trial and Olgesbee et al., (2016) and Conroy et
al. (2016). Compared with HIGH-CGM, feeding CGM-CDS decreased HCW (379 vs.
388 kg, respectively; P = 0.04), Conroy et al. (2016) observed a numerical decrease of 8
kg with the inclusion of 10% CDS. The addition of 10% CDS tended to decrease dressing
percent (63.0% vs. 63.5%, respectively; P = 0.06) compared to HIGH-CGM. There were
no differences (P ≥ 0.21) in LM area and calculated yield grade between HIGH-CGM
and CGM-CDS. There was a decrease in 12th rib fat (1.16 vs. 1.29 cm, respectively; P =
0.05) for CGM-CDS compared to HIGH-CGM. There were no differences (P ≥ 0.19) in
marbling score and liver abscesses between both HIGH-CGM and CGM-CDS. The result
of poorer ADG lead HCW, dressing percent, and 12th rib fat to decrease compared to
HIGH-CGM. However, recent data with the addition of lower inclusion levels of CDS
(approximately 10%) in DGS-based diets appears to have variable impact on
performance and carcass characteristics (Oglesbee et al., 2016; Conroy et al., 2016).
Further research may need to be performed studying the interactions of CDS with DGS
composite diets.
20DGS vs. LOW-CGM

98
Isolating the protein portion of 20% WDGS by feeding 8.75% CGM (LOW-
CGM) decreased final BW (596 vs. 608 kg, respectively; P = 0.05) compared to 20DGS
(Table 3.5). There were no differences (P = 0.16) in DMI between 20DGS and LOW-
CGM. Steers fed LOW-CGM tended to have decreased ADG (1.63 vs. 1.69 kg,
respectively; P = 0.09) compared to 20DGS. This resulted in steers fed LOW-CGM being
5.8% less efficient than steers consuming 20DGS (0.162 vs. 0.172, respectively; P <
0.01). Lodge et al. (1997) fed 10.5% CGM to steers as part of a DGS composite
treatment. When CGM was removed from the diet, the feeding value of the DGS
composite without CGM decreased from 124 to 118%, respectively. This suggests that
protein in the DGS composite contributed a majority of the feeding value observed for
the DGS composite. In the current experiment, the feeding value for protein was less than
that of WDGS (110 vs. 134% for LOW-CGM vs. 20DGS, respectively) relative to corn.
Lower inclusion rates of protein (i.e. LOW-CGM) do not provide excess MP which can
be used as energy. Therefore, within lower inclusion rates of DGS, protein will contribute
less towards the feeding values compared to greater inclusion rates of DGS. There was a
tendency for decreased HCW (P = 0.09) for LOW-CGM compared to 20DGS. All
carcass traits and liver abscess scores were not different (P ≥ 0.17) between 20DGS and
LOW-CGM.
40DGS vs. HIGH-CGM
When comparing 40% WDGS to HIGH-CGM, there were no differences (P =
0.65) in final BW; however, steers fed HIGH-CGM consumed 0.5 kg/d more than
40DGS (10.2 vs. 9.7 kg, respectively; P < 0.01; Table 3.5). There were no differences (P
= 0.61) for ADG between 40DGS and HIGH-CGM. This translated into steers

99
consuming 40DGS having improved G:F values compared to HIGH-CGM (0.176 vs.
0.169, respectively; P < 0.01). Lodge et al. (1997) compared a distillers composite
treatment containing 12.2% CGM to 40% DDGS in finishing lamb diets. There was no
difference in lamb finishing performance between a distillers composite diet with 12.2%
CGM and 40% DDGS. Unlike the LOW-CGM vs. 20DGS comparison, the feeding value
of protein was greater than WDGS (129 vs. 125% for HIGH-CGM vs. 40DGS,
respectively). The MP requirements of the animals for both 40DGS and HIGH-CGM
were met according to NRC (1996). Improved feeding values for protein were a result of
excess RUP being digested. deaminated and used by the animal for energy. Therefore,
similar feeding values for 40DGS and HIGH-CGM demonstrated feeding greater levels
of protein meet the protein requirements of the animal and supplied additional energy.
Oglesbee et al. (2016) reported the feeding value of a diet with 17.5% CGM was 121%,
which was lower than WDGS at 130% the value of corn. The addition of CGM to the
composite DGS diet increased the feeding value by 30%, which was the animals’
response to additional energy being provided by excess RUP from CGM. In this
experiment there were no differences (P ≥ 0.26) for carcass traits or liver abscess scores
between 40DGS and HIGH-CGM.
Displacing a portion of corn grain with other feed ingredients, such as CGM or
CDS, was considered when designing the experimental treatments. The inclusion of 26-
50.9% (DM basis) corn grain in calf-fed diets leads to improved feed efficiency
compared to inclusions greater than 50.9% corn (Watson et al., 2016). In the current
experiment the CGM diets replaced only 8.75 and 17.5% of corn compared to the WDGS
diets which replaced 20 and 40%. This did not affect the comparison between 20DGS
100
and LOW-CGM (59.00 vs. 70.25% DRC, respectively). This may have affected G:F
between the HIGH-CGM and 40DGS (61.50 vs. 39.00% DRC, respectively) comparison
since 40DGS had considerably less corn grain in the diet. This means that part of the G:F
response observed by HIGH-CGM may have come from lower inclusion of corn and not
entirely from excess RUP.
Experiment 2 and 3
Nutrient intake and digestibility data are presented in Table 3.6 for Exp 2. Dry
matter intake was greater (P = 0.08) for 40DGS compared to HIGH-CGM and CON, but
not different than CGM-CDS. Greater DMI for DGS based diets compared to corn has
been well documented in previous research (Klopfenstein et al., 2008). Corrigan et al.
(2009), observed an increase of 1.5 kg for OM intake (OMI) when steers consumed 40%
WDGS (DM basis) compared to corn. In this study, OMI was numerically greater (P =
0.17) for 40DGS compared to CON (7.4 vs. 6.6 kg; respectively) suggesting cattle on
40DGS had intakes that previous data support (Klopfenstein et al., 2008). Neutral
detergent fiber intake was greater (P < 0.01) for 40DGS than all other treatments. The
40DGS diet had approximately twice the NDF content of CON, HIGH-CGM, and CGM-
CDS (26.1 vs. 14.8, 13.6, and 13.2% NDF; respectively). Corrigan et al. (2009) and
Vander Pol et al. (2009) both reported similar results, NDF intake for cattle consuming
40% WDGS was greater than corn diets. In the current study, starch intake was greatest
(P < 0.01) for CON and HIGH-CGM with CGM-CDS greater than 40DGS. Previous
work has reported starch intake to be lowered with increased levels of DGS (Corrigan et
al., 2009, Luebbe et al., 2012, and Vander Pol et al., 2009). Replacing 10% of DRC with

101
CDS reduced the starch content in the diet by 12.7% and subsequently lowered starch
intake by 8.6%.
Fecal DM, OM, NDF, and starch output were greater (P < 0.08) for 40DGS
compared to other treatments. This can be explained by OMI being numerically greater
for 40DGS and total tract digestibility for OM and starch being lower for steers fed
40DGS. Flow of feed OM, bacterial OM, total OM, NDF, and starch into the duodenum
were not different (P ≥ 0.52; Table 3.7) among treatments. Although cattle fed 40DGS
had numerically greater feed OM, likely due to the greater DMI of cattle consuming
40DGS compared to CON, HIGH-CGM, and CGM-CDS.
There was no difference (P = 0.16) in total tract DM digestibility between
treatments, but 40DGS was numerically lower than all other treatments. A similar
relationship was observed for total tract OM digestibility, which tended to be lower (P <
0.14) for 40DGS compared other treatments (Table 3.6). A similar response was
observed for Corrigan et al. (2009), who reported lower total tract OM digestibility for
40% WDGS compared corn-based diets. Total tract OM digestibility for DGS in the
current study is similar to Corrigan et al. (2009) and Luebbe et al. (2012; 76.0% vs. 79.3
and 78.6%, respectively). Klopfenstein et al. (2008) reported that DGS improves ADG
and G:F compared to corn, while having lower digestibility than corn. Hamilton et al.
(2016) suggest that diets containing DGS have additional digestible energy supplied by
DGS that is not accounted for when evaluating only digestible OM. The relationship of
digestible OM and digestible energy from Hamilton et al. (2016) supports the results
from the current studies with lower OM digestibility for cattle fed 40DGS than cattle fed
CON (Exp 2) and cattle fed 40DGS had better (P < 0.01) G:F and tended (P = 0.06) to

102
have improved ADG compared to cattle fed CON (Exp 1). Therefore, less of the OM was
digested in the DGS diet but the DGS diet supplied more energy that the animal could use
for growth. There was no difference in total tract NDF digestibility (P = 0.53) among
treatments. Steers consuming 40DGS and CGM-CDS had numerically greater total tract
NDF digestibility compared to CON and HIGH-CGM (59.3 and 55.9 vs. 47.9 and 48.0%,
respectively). Total tract starch digestibility was lower (P < 0.01) for 40DGS compared
to other treatments. Distillers grains plus solubles contains less starch as a result of starch
fermentation for ethanol production. The small amount of starch available in DGS may
be difficult to access and have lower digestibility by the animal, as well as microbes,
because the ethanol plant already exposed the starch to yeast and other microbes during
ethanol production. Ham et al. (1994) observed an improvement in total tract starch
digestion when wet distillers grains was paired with thin stillage. Other than DM, thin
stillage and CDS should have similar nutrient profiles. In the current study, the addition
of CDS (32.4% CP, 4.7% NDF, and 6.7% fat) to HIGH-CGM did not negatively affect
starch digestion. Vander Pol et al. (2009) suggests that supplemental corn oil impedes
starch digestibility relative to fat supplied by CDS or WDGS. In the current study,
additional oil from CDS was likely separated off by centrifugation. According to Jolly et
al. (2013), 50% of ethanol plants were removing additional corn oil from CDS in 2012. In
this study, the concentration of fat (6.7% DM basis) from CDS may not have been
enough to limit total tract starch digestion.
Ruminal and post ruminal apparent and true OM, NDF, and apparent and true
starch digestibility were not different (P > 0.18) among treatments (Table 3.7; Exp 2).
Ruminal NDF digestibility was numerically greater (P = 0.35) for 40DGS compared to

103
CON, HIGH-CGM, and CGM-CDS (65.9 vs. 44.6, 51.1, and 49.2 %; respectively). Both
Vander Pol et al. (2009) and Luebbe et al. (2012) observed numerical improvements for
ruminal NDF digestibility for inclusions of 40-45% WDGS compared to DRC (14.8 and
16.5 percent unit increase, respectively). Luebbe et al. (2012) suggest greater ruminal
NDF digestibility may be the result of a dilution effect. As DGS replaces corn in the diet,
the amount of starch decreases, which may promote an increase in ruminal NDF
digestion. Corrigan et al. (2009) reported greater 22-h in situ NDF digestibility when
samples (i.e. DRC, WDGS, corn bran) were incubated in steers fed 40% WDGS
compared to corn-based diets. Therefore, as DGS concertation increases, the rumen
environment appears to be more favorable and promotes greater NDF digestibility.
Postruminal OM digestibility was numerically (P = 0.18) lower for 40DGS compared to
CON, HIGH-CGM, and CGM-CDS (47.7 vs. 61.3, 64.0, and 69.4%; respectively). We
measured a bacterial purine:N ratio of 0.1 from our rumen samples. We believe that this
ratio is not accurate because it overestimated bacterial OM flow from the duodenum.
Overestimated bacterial OM flow resulted in relatively high microbial efficiency
estimates. Based on findings from Cooper et al. (2002), we decided to adjust the data
using an assumed purine:N ratio of 0.3. Microbial CP flow through the duodenum was
not different (P = 0.88) among treatments. Microbial efficiency was calculated using g of
microbial CP divided by g of fermentable OM in the rumen. There was no difference (P
= 0.72) in microbial efficiency among treatments.
Dry matter intakes for Exp 3 were similar to Exp 2 (Table 3.8) with cattle
consuming 40DGS (P = 0.06) having the greatest DMI. Unlike Exp 2 where cattle fed
CON had the lowest DMI, in Exp 3 cattle fed CGM-CDS tended to have the lowest DMI.

104
Hour within day was evaluated for average ruminal pH and a treatment × h interaction (P
< 0.01; Figure 3.1) was observed. At time of feeding (0800) and for 2 h after, cattle
consuming the CON treatment had a greater pH (P = 0.01) than HIGH-CGM and CGM-
CDS. Cattle fed 40DGS had lower ruminal pH (P = 0.01) than cattle fed CON treatment
from 0900 to 1100. At 1100, cattle fed CON treatment had the greatest ruminal pH (P <
0.04), 40DGS was greater than HIGH-CGM, and CGM-CDS was intermediate between
CON and 40DGS. At 4 and 5 h post-feeding, cattle fed CON, 40DGS, and CGM-CDS
treatments had no difference (P > 0.07) in ruminal pH, whereas cattle fed HIGH-CGM
maintained a lower ruminal pH (P < 0.05). From 1400 to 1600, cattle consuming CON,
40DGS, and CGM-CDS were not different (P > 0.07); however, cattle consuming HIGH-
CGM had a lower ruminal pH (P < 0.04). Ruminal pH was not different (P > 0.05)
between treatments from 1700 to 0200. Cattle consuming CON, 40DGS, and HIGH-
CGM had no difference (P > 0.06) in rumen pH from 0300 to 0700, whereas cattle on the
CGM-CDS treatment maintained a lower pH (P < 0.05).
The addition of CGM to the diet appears to have an impact on ruminal pH. The
ruminal pH response cannot be explained by DMI. Cattle consuming HIGH-CGM had
similar DMI as cattle fed CON and cattle fed CGM-CDS consumed less DM than cattle
fed HIGH-CGM and CON. Therefore, factor(s) other than DMI were likely the cause of
lower ruminal pH for both CGM treatments. Time below pH 5.6 was not different among
treatments however, area below pH 5.6 was greater for CGM diets. These results suggest
all cattle were exposed to subacute acidosis for a similar amount of time but CGM fed
cattle were subjected to a lower pH at time of subacute acidosis compared to CON and
40DGS fed cattle.
105
Acetate molar proportion was not different (P = 0.18) between treatments.
Propionate molar proportion had a treatment × h interaction (Figure 3.2; P = 0.09). From
1 h to 11 h post-feeding, propionate molar proportion remained greatest (P < 0.09) for
HIGH-CGM compared to all other treatments. Butyrate molar proportion had a treatment
× h interaction (Figure 3.3; P = 0.03). From 1 to 11 h post-feeding, butyrate molar
proportion remained lowest (P < 0.08) for HIGH-CGM compared to all other treatments.
Acetate:Propionate ratio was lower (P = 0.08) for HIGH-CGM compared to the other
treatments. Total VFA concentration had a treatment × h interaction (Figure 3.4; P =
0.10). At 1300, CON and HIGH-CGM were the greatest (P = 0.10) total VFA
concentration with 40DGS and CGM-CDS were the lowest VFA concentrations. At
1500, CON had the greatest (P = 0.05) total VFA concentration, 40DGS had the lowest,
and HIGH-CGM and CGM-CDS were intermediate. At 1700, HIGH-CGM had the
greatest (P = 0.03) total VFA concentration, 40DGS and CGM-CDS had the lowest, and
CON was intermediate. The time points for peak total VFA concentration for HIGH-
CGM agree with the pH data. The pH for HIGH-CGM was lowest from 4 to 8 h post-
feeding and the total VFA concentration was greatest for HIGH-CGM 8 h post-feeding.
Effects of HIGH-CGM on ruminal pH may be correlated with total VFA concentration.
Russell (1998) reported approximately 25% of the change in A:P ratios are associated
with lower ruminal pH. Cattle fed CGM had lower average ruminal pH and tended to
have lower minimum ruminal pH than cattle fed CON and 40DGS. As described
previously, lactic acid from CGM may have promoted rumen bacteria to produce
propionate however, Exp. 3 only measured VFA concentration so it is difficult to explain
why HIGH-CGM had greater propionate concentrations than the other treatments. This

106
helps explain the lower average ruminal pH for cattle fed HIGH-CGM. Since the protein
content of CGM was greater than that of DGS, less CGM was required to match the CP
of DGS in the diet. As a result, there was more starch and less NDF in both HIGH-CGM
and CGM-CDS compared to 40DGS. When the primary energy source that the rumen
microbial population uses changes from NDF to starch, the A:P ratio generally decreases
(Grant, 1997; Coe et al., 1999; Sayer, 2004). The difference in NDF and starch intake for
HIGH-CGM, compared to 40DGS, helps explain the increase in propionate
concentration. Ham et al. (1994) reported lower propionate concentration and a greater
A:P ratio for 40% wet distillers grains with 15% thin stillage compared to 15% thin
stillage only in corn-based diets. With the exception of fat content and DM, CDS can
have similar nutritive properties to thin stillage. The similarities of CDS and thin stillage
may help explain the lower propionate and greater A:P ratio when CDS was added to
HIGH-CGM. With these combinations of factors, it is difficult to specify why ruminal
pH dropped for steers fed CGM diets. The trend line for total VFA concentration for each
treatment was tested for linear and quadratic relationships. The total VFA concentration
trend line for HIGH-CGM was quadratic (P = 0.03) and linear (P = 0.05) for CGM-CDS.
IMPLICATIONS
These studies provide further evidence that as DGS concentration increases in the
diet, cattle have greater finishing performance even though digestibility of DGS is lower
compared to corn. Similarly, isolating protein from DGS by utilizing CGM resulted in
similar finishing performance. Protein from DGS did not contribute towards the lower
digestibility of DGS. Providing excess RUP from DGS contributes greatly to the
performance of DGS. The average feeding value for CGM at inclusion rates equal to the

107
protein in WDGS at 20 and 40% was 122. Wet DGS had an average feeding value of 128
at 20 and 40% inclusion rates. These results reaffirm that protein accounts for the
majority of the feeding value response in DGS.

108
LITERATURE CITED
ANKOM. 2006. Ankom Technology Method 6. Neutral Detergent Fiber in Feeds by
Filter Bag Technique. ANKOM Tech., Macedon, NY.
AOAC. 1990. Official methods of analysis. 15th ed. Assoc. Off. Anal. Chem., Arlington,
VA.
AOAC. 1997. Official methods of analysis. 16th ed. AOAC Int., Arlington, VA.
AOAC International. 2000. AOAC Official Method 990.03. Protein (Crude) in Animal
Feed. Combustion Method. Official Methods of Analysis of AOAC International. 17th ed.
Dr. William Horwitz, ed. AOAC Int., Gaithersburg, MD.
AOAC. 2003. Official methods of analysis of AOAC International. 17th ed. P. Cunniff,
ed. AOAC int., Gaithersburg, MD.
AOAC International. 2006. AOAC Official Method 2003.6. Crude Fat in Feeds, Cereal
Grains, and Forages (Modified for Extraction with Petroleum Ether). Official Methods of
Analysis of AOAC International. AOAC Int., Gaithersburg, MD.
Belyea, R., S. Eckhoff, M. Wallig, and M. Tumbleson. 1998. Variability in the nutritional
quality of distillers solubles. Bioresource Technology 66:207-212.
Bremer, V. R. 2010. Distillers grains with solubles for feedlot cattle—Finishing
performance, lipid metabolism, and ethanol greenhouse gas balance. Ph.D. dissertation,
Univ. of Nebraska-Lincoln. Lincoln.
Buckner, C. D. 2010. Ethanol byproduct feeds: nutrient composition and variability,
determining accurate fiber content, storing with low-quality forages, and fiber utilization
in finishing diets. PhD Diss. University of Nebraska-Lincoln.
Buckner, C. D., T. J. Klopfenstein, and G. E. Erickson. 2013. Evaluation of modifications
to the neutral-detergent-fiber analysis procedure for corn and distillers grains plus
solubles. Prof. Anim. Sci. 29:252–259.
Chamberlain, D. G., P. C. Thomas, and F. J. Anderson. 1983. Volatile fatty acid
proportions and lactic acid metabolism in the rumen in sheep and cattle receiving silage
diets. J. Agric. Sci. 101:47-58.
Cochran, R. C., and M. L. Galyean 1994. Measurement of in vivo Forage Digestion by
Ruminants. In: G. C. Fahey, editor, Forage Quality, Evaluation, and Utilization, ASA,
CSSA, SSSA, Madison, WI. p. 613-643. doi:10.2134/1994.foragequality.c15
Coe, M. L., T. G. Nagaraja, Y. D. Sun, N. Wallace, E. G. Towne, K. K. Kemp, and J. P.
Hutcheson. 1999. Effect of virginiamycin on ruminal fermentation in cattle during
adaptation to a high concentrate diet and during an induced acidosis. J. Anim. Sci.
77:2259–2268.
Conroy, B. B., M. K. Luebbe, G. E. Erickson, J. C. MacDonald, and J. A. Hansen. 2016.
Impact of feeding distillers grains or isolated components in distillers grains on feedlot
performance and carcass traits. Neb. Beef Cattle Rep. 122-123.
109
Cooper, R. J., C. T. Milton, T. J. Klopfenstein, T. L. Scott, C. B. Wilson, and R. A. Mass.
2002. Effect of corn processing on starch digestion and bacterial crude protein flow in
finishing cattle. J. Anim. Sci. 80: 797-804.
Corrigan, M. E., G. E. Erickson, T. J. Klopfenstein, M. K. Luebbe, K. J. Vander Pol, N.
F. Meyer, C. D. Buckner, S. J. Vanness, and K. J. Hanford. 2009. Effect of corn
processing method and corn wet distillers grains plus solubles inclusion level in finishing
steers. J. Anim. Sci. 87:3351-3362.
Crawford, G. I., C. D. Keeler, J. J. Wagner, C. R. Krehbiel, G. E. Erickson, M. B.
Crombie, and G. A. Nunnery. 2008. Effects of calcium magnesium carbonate and
roughage level on feedlot performance, ruminal metabolism, and site and extent of
digestion in steers fed high-grain diets. J. Anim. Sci. 86:2998–3013.
Erwin, E. S., D. J. Marco, and E. M. Emery. 1961. Volatile fatty acid analysis of blood
and rumen fluid by gas chromatography. J. Dairy Sci. 44:1768–1771.
Farlin, S. D. 1981Wet distillers grains for finishing cattle. Anim. Nut. And Health. 36:35-
36.
Felix, T. L., T. A. Murphy, and S. C. Loerch. 2012. Effects of dietary inclusion and
NaOH treatment of dried distillers grains with solubles on ruminal metabolism of feedlot
cattle. J. Anim. Sci. 90:4951-4961. doi:10.2527/jas2011-4736.
Firkins, J. L., L. L. Berger, and G. C. Fahey, Jr. 1985. Evaluation of wet and dry distillers
grains and wet and dry corn gluten feeds for ruminants. J. Anim. Sci. 60:847-860.
Grant, R. J. 1997. Interactions among forages and nonforage fiber sources. J. Dairy Sci.
80:1438–1446.
Ham, G. A., R. A. Stock, T. J. Klopfenstein, E. M. Larson, D. H. Shain, and R. P.
Huffman. 1994. Wet corn distillers byproducts compared with dried corn distillers grains
with solubles as a source of protein and energy for ruminants. J. Anim. Sci. 72:3246-
3257.
Hamilton, H. C., J. L. Gramkow, J. C. MacDonald, G. E. Erickson, A. K. Watson, and T.
J. Klopfenstein. 2016. Relationship between dietary total digestible nutrients and
digestible organic matter in beef cattle finishing and growing diets with or without
distillers grains. Neb. Beef Cattle Rep. 76-78.
Jolly, M. L., B. L. Nuttelman, D. B. Burken, C. J. Schneider, T. J. Klopfenstein, G. E.
Erickson. 2013. Effects of modified distillers grains plus solubles and condensed
distillers solubles with and without oil extraction on finishing performance. Neb. Beef
Cattle Rep. 64-65.
Klopfenstein, T. J., G. E. Erickson, and V. R. Bremer. 2008. Board-invited review: use of
distillers by-products in the beef cattle feeding industry. J. Anim. Sci. 86:1223-1231.
Larson, E. M., R. A. Stock, T. J. Klopfenstein, M. H. Sindt, and R. P. Huffman. 1993.
Feeding value of wet distillers byproducts for finishing ruminants. J. Anim. Sci. 71:2228-
2236.

110
Leupp, J. L., G. P. Lardy, K. K. Karges, M. L. Gibson, and J. S. Caton. 2009. Effects of
increasing level of corn distillers dried grains with solubles on intake, digestion, and
ruminal fermentation in steers fed seventy percent concentrate diets. J. Anim. Sci.
87:2906–2912.
Littell, R. C., P. R. Henry, and C. B. Ammerman. 1998. Statistical analysis of repeated
measures data using SAS procedures.. Journal of animal science 76:1216-1231.
doi:10.2527/1998.7641216x
Lodge, S. L., R. A. Stock, T. J. Klopfenstein, D. H. Shain, and D. W. Herold. 1997.
Evaluation of wet distillers composite for finishing ruminants. J. Anim. Sci. 75:44-50.
Meyer, J. H., G. P. Lofgreen, and W. N. Garrett.1960. A proposed method for removing
sources of error in beef cattle feeding experiments. J. Anim. Sci. 19:1123–1131.
Mills, H. A., and J. B. Jones Jr. 1996. Table 5–2 in Wet acid digestion procedure using
nitric acid and 30% hydrogen peroxide. Page122 in Plant Analysis Handbook II.
Micromacro Publ. Inc., Athens, GA.
Meyer, J. H., G. P. Lofgreen, and W. N. Garrett. 1960. A proposed method for removing
sources of error in beef cattle feeding experiments. J. Anim. Sci. 19:1123-1131.
Myers, W. D., P. A. Ludden, V. Nayigihugu, and B. W. Hess. 2004. Technical note: A
procedure for the preparation and quantitative analysis of samples for titanium dioxide. J.
Anim. Sci. 82:179–183.
NRC. 1996. Nutrient Requirements of Beef Cattle. Natl. Aca. Press, Washington, DC.
National Academies of Sciences, Engineering, and Medicine. 2016. Nutrient
Requirements of Beef Cattle. 8th revised ed. Washington, DC. Natl. Aca. Press.
Oglesbee, R. A., C. J. Bittner, F. H. Hilscher, G. E. Erickson, J. C. MacDonald, and M.
K. Luebbe. 2016. Evaluation of distillers grains components singly or in combination in a
calf fed feedlot study. Neb. Beef Cattle Rep. 124-127.
Russell, J. B. 1998. The importance of pH in the regulation of ruminal acetate to
propionate ratio and methane production in vitro. J. Dairy Sci. 81:3222–3230.
Sayer, K. M. 2004. Effects of corn bran and steep inclusion in finishing diets on cattle
performance, nutrient mass balance, and diet digestibility. MS Thesis. Univ. Nebraska,
Lincoln.
Singh, N. and S. R. Eckhoff. 1996. Wet milling of corn-a review of laboratory-scale and
pilot plant-scale procedures. Cereal Chem. 73(6):659-667.
Stern, M. D., L. M. Rode, R. W. Prange, R. H. Stauffacher, and L. D. Satter. 1983.
Ruminal protein degradation of corn gluten meal in lactating dairy cattle fitted with t-type
cannulae. J. Anim. Sci. 56:194.
Stock, R., R. Klopfenstein, D. Brink, S. Lowry, D. Rock, and S. Abrams. 1983. Impact of
weighing procedures and variation on protein degradation rate on measure performance
of growing lambs and cattle. J. Anim. Sci. 57:1276-1285.

111
Van Soest, P. J., J. B. Robertson, and B. A. Lewis. 1991. Methods of dietary fiber, neutral
detergent fiber, and non-starch polysaccharides in relation to animal nutrition. J. Dairy
Sci. 74:35-83.
Titgemeyer, E. C., N. R. Merchen, and L. L. Berger. 1989. Evaluation of soybean meal,
corn gluten meal, blood meal and fish meal as sources of nitrogen and amino acids
disappearing from the small intestine of steers. J. Anim. Sci. 67:262-275.
Trenkle, A. H., 1997. Evaluation of wet distillers grains in finishing diets for yearling
steers. Beef Research Rep. Iowa State Univ., Ames. AS637:93-96.
USDA. 1997. Official United States standards for grades of carcass beef. Agric.
Marketing Serv., USDA, Washington, DC.
Vander Pol, K. J., M. K. Luebbe, G. I. Crawford, G. E. Erickson, and T. J. Klopfenstein.
2009. Performance and digestibility characteristics of finishing diets containing distillers
grains, composites of corn processing coproducts, or supplemental corn oil. J. Anim. Sci.
87:639-652.
Vasconcelos, J. T., and M. L. Galyean. 2008. Technical note: Do dietary net energy
values calculated from performance data offer increased sensitivity for detecting
treatment differences? J. Anim. Sci. 86:2756–2760.
Watson, A. K., B. L. Nuttelman, T. J. Klopfenstein, L. W. Lomas, and G. E. Erickson.
2013. Impacts of a limit-feeding procedure on variation and accuracy of cattle weights. J.
Anim. Sci. 91:5507-5517.
Watson, A. K., K. J. Vander Pol, T. J. Huls, M. K. Luebbe, G. E. Erickson, T. J.
Klopfenstein, and M. A. Greenquist. 2014. Effect of dietary inclusion of wet or modified
distillers grains plus solubles on performance of finishing cattle. The Prof. Anim. Sci.
30:585-596.
Watson, A. K., M. K. Luebbe, and G. E. Erickson. 2016. Evaluation of varying corn grain
(and byproduct) inclusion in beef cattle finishing diets. Neb. Beef Cattle. Rep. 89-90.
Wu, Y. V. 2001. Emulsifying activity and emulsion stability of corn gluten meal. J. Sci.
Food Agric. 91:1223-1227. DOI: 10.1002/jsfa.934
Zinn, R. A., L. S. Bull, and R. W. Hemken. 1981. Degradation of supplemental proteins
in the rumen. J. Anim. Sci. 52:857.
Zinn, R. A., and F. N. Owens. 1986. A rapid procedure for purine measurement and its
use for estimating net ruminal protein synthesis. Can. J. Anim. Sci. 66:157–166.

112
Table 3.1. Composition of dietary treatments containing protein components of distiller grains fed to steers1 (Exp. 1).
Treatment
Item CON 20DGS 40DGS LOW-CGM HIGH-CGM CGM-CDS
Ingredient, % DM2
DRC 75.50 59.00 39.00 70.25 61.50 51.50
WDGS 20.00 40.00
Corn Silage 15.00 15.00 15.00 15.00 15.00 15.00
CGM 8.75 17.50 17.50
CDS 10.00
SBM 3.50
Supplement3,4
Limestone 1.340 1.400 1.400 1.400 1.400 1.400
Urea 1.300 - - - - -
Salt 0.300 0.300 0.300 0.300 0.300 0.300
KCl 0.200 - - - - -
Dietary Composition
DM 71.5 61.1 50.8 71.1 70.8 64.3
CP 13.9 13.0 17.3 14.3 20.0 21.0
NDF 14.8 18.9 23.0 14.6 14.4 13.5
Fat 2.8 3.7 4.6 2.9 2.9 2.6
Ca 0.51 0.53 0.54 0.52 0.52 0.52
P 0.28 0.37 0.49 0.28 0.30 0.45
K 0.71 0.71 0.88 0.53 0.52 0.82
S 0.11 0.20 0.31 0.16 0.22 0.32 1All values presented on a DM basis. 2DRC = dry-rolled corn; WDGS = wet distillers grains plus solubles; CGM = corn gluten meal; CDS = condensed
distillers solubles; SBM = soybean meal. 3Supplement formulated to be fed at 6% of dietary DM. 4Supplement formulated to provide a dietary DM inclusion of 30 mg/kg Zn, 50 mg/kg Fe, 10 mg/kg Cu, 20 mg/kg Mn,
0.1 mg/kg Co, 0.5 mg/kg I, 0.1 mg/kg Se, 1.0 IU/g vitamin A, 0.125 IU/g vitamin D, 0.0015 UI/g vitamin E, 360
mg∙steer∙d-1 monensin (Elanco Animal Health, Greenfield, IN), and 90 mg∙steer∙d-1 tylosin (Elanco Animal Health).
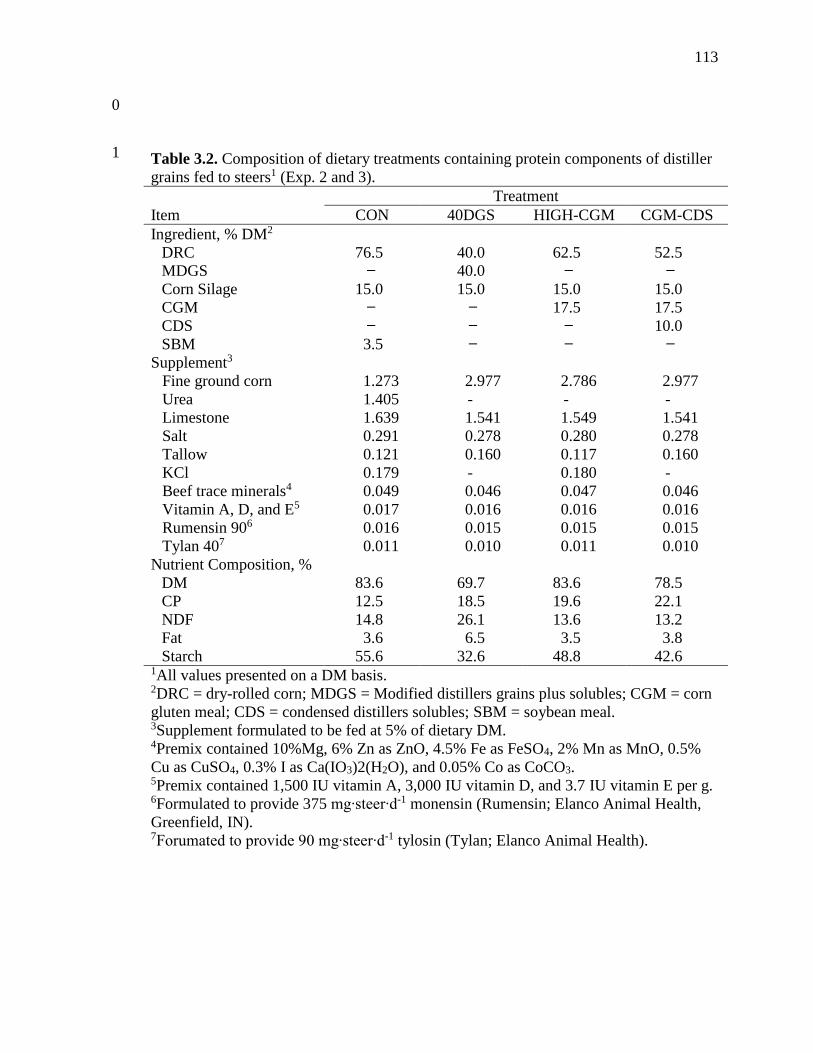
113
0
1 Table 3.2. Composition of dietary treatments containing protein components of distiller
grains fed to steers1 (Exp. 2 and 3).
Treatment
Item CON 40DGS HIGH-CGM CGM-CDS
Ingredient, % DM2
DRC 76.5 40.0 62.5 52.5
MDGS 40.0
Corn Silage 15.0 15.0 15.0 15.0
CGM 17.5 17.5
CDS 10.0
SBM 3.5
Supplement3
Fine ground corn 1.273 2.977 2.786 2.977
Urea 1.405 - - -
Limestone 1.639 1.541 1.549 1.541
Salt 0.291 0.278 0.280 0.278
Tallow 0.121 0.160 0.117 0.160
KCl 0.179 - 0.180 -
Beef trace minerals4 0.049 0.046 0.047 0.046
Vitamin A, D, and E5 0.017 0.016 0.016 0.016
Rumensin 906 0.016 0.015 0.015 0.015
Tylan 407 0.011 0.010 0.011 0.010
Nutrient Composition, %
DM 83.6 69.7 83.6 78.5
CP 12.5 18.5 19.6 22.1
NDF 14.8 26.1 13.6 13.2
Fat 3.6 6.5 3.5 3.8
Starch 55.6 32.6 48.8 42.6 1All values presented on a DM basis. 2DRC = dry-rolled corn; MDGS = Modified distillers grains plus solubles; CGM = corn
gluten meal; CDS = condensed distillers solubles; SBM = soybean meal. 3Supplement formulated to be fed at 5% of dietary DM. 4Premix contained 10%Mg, 6% Zn as ZnO, 4.5% Fe as FeSO4, 2% Mn as MnO, 0.5%
Cu as CuSO4, 0.3% I as Ca(IO3)2(H2O), and 0.05% Co as CoCO3. 5Premix contained 1,500 IU vitamin A, 3,000 IU vitamin D, and 3.7 IU vitamin E per g. 6Formulated to provide 375 mg∙steer∙d-1 monensin (Rumensin; Elanco Animal Health,
Greenfield, IN). 7Forumated to provide 90 mg∙steer∙d-1 tylosin (Tylan; Elanco Animal Health).

114
Table 3.3. Linear and quadratic effect of distillers grains on finishing performance and carcass characteristics (Exp. 1).
Treatment1 P - value
Item CON 20DGS 40DGS SEM DGS Lin.2 DGS
Quad.3
Initial BW, kg 291 292 292 0.5 0.23 0.95
Final BW, kg4 600 608 613 4 0.06 0.86
DMI, kg/d 10.3 9.8 9.7 0.1 <0.01 0.21
ADG, kg4 1.65 1.69 1.71 0.02 0.06 0.83
G:F4 0.161 0.172 0.176 0.002 <0.01 0.12
Feeding Value5 - 134 125 - - -
NEm6 1.89 1.99 2.02 0.01 <0.01 0.06
NEg6 1.24 1.33 1.37 0.01 <0.01 0.07
HCW, kg 378 383 386 3 0.06 0.87
Dressing, % 63.5 63.3 63.6 0.2 0.64 0.21
LM area, cm2 87.2 87.4 89.0 1.1 0.26 0.62
Calculated YG7 2.93 2.96 2.95 0.09 0.91 0.85
12th-rib fat, cm 1.21 1.21 1.24 0.04 0.58 0.81
Marbling8 422 428 429 9 0.60 0.85
Liver abscess, % 21.2 18.5 14.8 0.5 0.41 0.89 1CON = 75.5% DRC; 20DGS = 20% wet distillers grains plus solubles; 40DGS = 40% wet distillers grains plus solubles. 2Lin. = P-value for the linear response of wet distillers grains inclusion for CON, 20DGS, 40DGS. 3Quad. = P-value for the quadratic response of wet distillers grain inclusion for CON, 20DGS, 40DGS. 4Calculated from carcass weight, adjusted to 63% common dressing percent. 5Feeding Value Calculation: [((compared treatments G:F – CON G:F) / CON G:F) / compared treatments inclusion
rate*100+100] 6Dietary NE equations from the NRC (1996) as described by Vasconcelos and Galyean (2008).
7Yield Grade Calculation: 2.50 + (6.35 x 12th rib fat thickness, cm) + (0.2 x 2.5 [KPH]) + (0.0017 x HCW, kg) - (2.06 x LM
area, cm2) from USDA (1997) 8Marbling score: 400 = Small00.

115
Table 3.4. Linear and quadratic effect of isolated protein from distillers grains on finishing performance and carcass
characteristics (Exp. 1).
Treatment1 P - value
Item CON LOW-
CGM
HIGH-
CGM
CGM-CDS SEM Protein
Lin.2
Protein
Quad.3
HIGH-
CGM vs.
CGM-CDS
Initial BW, kg 291 291 292 291 0.5 0.58 0.41 0.11
Final BW, kg4 600 596 616 602 4 0.02 0.04 0.04
DMI, kg/d 10.3 10.0 10.2 10.0 0.1 0.85 0.13 0.08
ADG, kg4 1.65 1.63 1.73 1.66 0.02 0.02 0.04 0.04
G:F4 0.161 0.162 0.169 0.166 0.002 <0.01 0.19 0.32
Feeding Value5 - 110 129 121 - - - -
NEm6 1.89 1.91 1.95 1.94 0.01 <0.01 0.59 0.85
NEg6 1.24 1.26 1.30 1.30 0.01 <0.01 0.69 1.00
HCW, kg 378 376 388 379 3 0.02 0.04 0.04
Dressing, % 63.5 63.1 63.5 63.0 0.2 0.95 0.12 0.06
LM area, cm2 87.2 85.8 89.1 87.1 1.1 0.24 0.10 0.21
Calculated YG7 2.93 3.04 3.00 2.85 0.09 0.61 0.50 0.24
12th-rib fat, cm 1.21 1.27 1.29 1.16 0.04 0.22 0.75 0.05
Marbling8 422 433 443 426 9 0.10 0.94 0.19
Liver abscess, % 21.2 9.3 11.3 11.8 0.5 0.19 0.27 0.94 1CON = 75.5% DRC; LOW-CGM = 8.75% corn gluten meal to mimic the protein portion of 20DGS; HIGH-CGM = 17.5%
corn gluten meal to mimic the protein portion of 40DGS; CGM-CDS = 17.5% corn gluten meal and 10% solubles. 2Lin. = P-value for the linear response of corn gluten meal for CON, LOW-CGM, HIGH-CGM. 3Quad. = P-value for the quadratic response of corn gluten meal for CON, LOW-CGM, HIGH-CGM. 4Calculated from carcass weight, adjusted to 63% common dressing percent. 5Feeding Value Calculation: [((compared treatments G:F – CON G:F) / CON G:F) / compared treatments inclusion
rate*100+100] 6Dietary NE equations from the NRC (1996) as described by Vasconcelos and Galyean (2008).
7Yield Grade Calculation: 2.50 + (6.35 x 12th rib fat thickness, cm) + (0.2 x 2.5 [KPH]) + (0.0017 x HCW, kg) - (2.06 x LM
area, cm2) from USDA (1997) 8Marbling score: 400 = Small00.

116
Table 3.5. Effect of excess rumen ungradable protein from distillers grains on finishing performance and carcass characteristics
(Exp. 1).
Treatment1 P - value
Item CON 20DGS 40DGS LOW-
CGM
HIGH-
CGM
SEM 20DGS vs.
LOW-CGM2
40DGS vs.
HIGH-CGM2
Initial BW, kg 291 292 292 291 292 0.5 0.32 0.51
Final BW, kg3 600 608 613 596 616 4 0.09 0.65
DMI, kg/d 10.3 9.8 9.7 10.0 10.2 0.1 0.16 <0.01
ADG, kg3 1.65 1.69 1.71 1.63 1.73 0.02 0.08 0.61
G:F3 0.161 0.172 0.176 0.162 0.169 0.002 <0.01 0.01
Feeding Value4 - 134 125 110 129 - - -
NEm5 1.89 1.99 2.02 1.91 1.95 0.01 <0.01 <0.01
NEg5 1.24 1.33 1.37 1.26 1.30 0.01 <0.01 <0.01
HCW, kg 378 383 386 376 388 3 0.09 0.66
Dressing, % 63.5 63.3 63.6 63.1 63.5 0.2 0.64 0.69
LM area, cm2 87.2 87.4 89.0 85.8 89.1 1.1 0.32 0.95
Calculated YG6 2.93 2.96 2.95 3.04 3.00 0.09 0.53 0.69
12th-rib fat, cm 1.21 1.21 1.24 1.27 1.29 0.04 0.41 0.49
Marbling7 422 428 429 433 443 9 0.65 0.26
Liver abscess, % 21.2 18.5 14.8 9.3 11.3 0.5 0.17 0.60 1CON = 75.5% DRC; 20DGS = 20% wet distillers grains plus solubles; 40DGS = 40% wet distillers grains plus solubles; LOW-
CGM = 8.75% corn gluten meal to mimic the protein portion of 20DGS; HIGH-CGM = 17.5% corn gluten meal to mimic the
protein portion of 40DGS. 2Comparison of the protein portion of WDGS, mimicked by corn gluten meal, and WDGS. 3Calculated from carcass weight, adjusted to 63% common dressing percent. 4Feeding Value Calculation: [((compared treatments G:F – CON G:F) / CON G:F) / compared treatments inclusion rate*100+100] 5Dietary NE equations from the NRC (1996) as described by Vasconcelos and Galyean (2008).
6Yield Grade Calculation: 2.50 + (6.35 x 12th rib fat thickness, cm) + (0.2 x 2.5 [KPH]) + (0.0017 x HCW, kg) - (2.06 x LM area,
cm2) from USDA (1997) 7Marbling score: 400 = Small00.
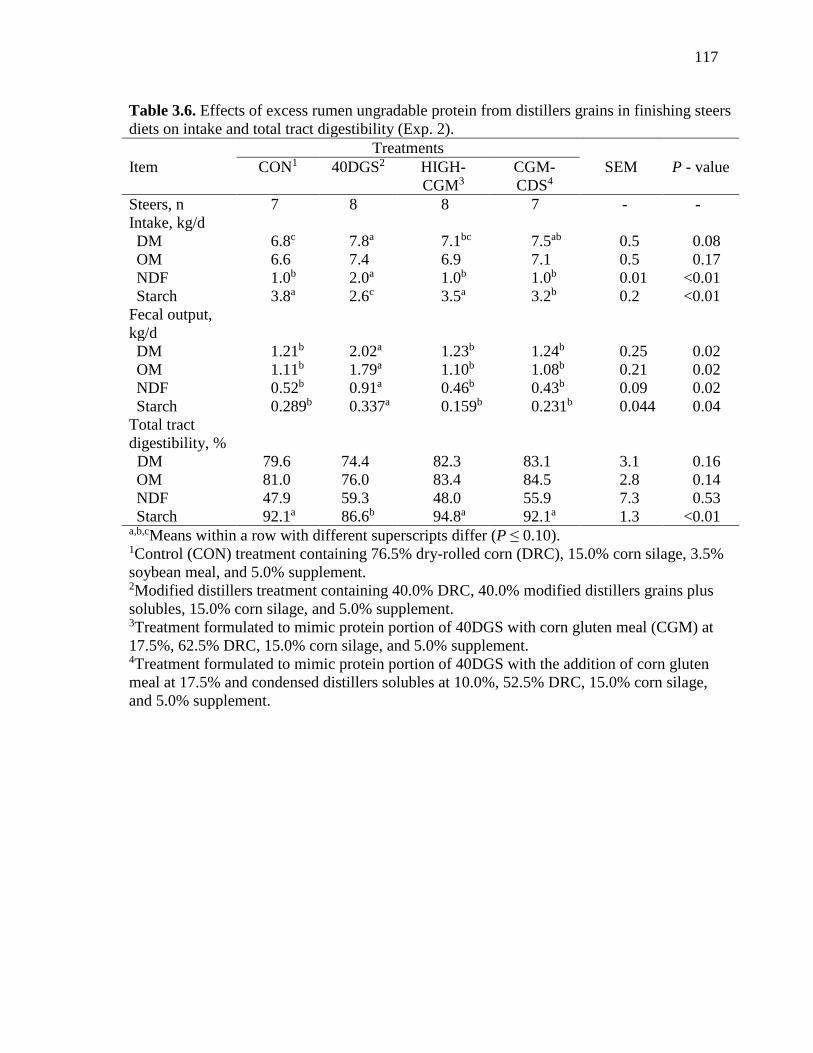
117
Table 3.6. Effects of excess rumen ungradable protein from distillers grains in finishing steers
diets on intake and total tract digestibility (Exp. 2).
Treatments
Item CON1 40DGS2 HIGH-
CGM3
CGM-
CDS4
SEM P - value
Steers, n 7 8 8 7 - -
Intake, kg/d
DM 6.8c 7.8a 7.1bc 7.5ab 0.5 0.08
OM 6.6 7.4 6.9 7.1 0.5 0.17
NDF 1.0b 2.0a 1.0b 1.0b 0.01 <0.01
Starch 3.8a 2.6c 3.5a 3.2b 0.2 <0.01
Fecal output,
kg/d
DM 1.21b 2.02a 1.23b 1.24b 0.25 0.02
OM 1.11b 1.79a 1.10b 1.08b 0.21 0.02
NDF 0.52b 0.91a 0.46b 0.43b 0.09 0.02
Starch 0.289b 0.337a 0.159b 0.231b 0.044 0.04
Total tract
digestibility, %
DM 79.6 74.4 82.3 83.1 3.1 0.16
OM 81.0 76.0 83.4 84.5 2.8 0.14
NDF 47.9 59.3 48.0 55.9 7.3 0.53
Starch 92.1a 86.6b 94.8a 92.1a 1.3 <0.01 a,b,cMeans within a row with different superscripts differ (P ≤ 0.10). 1Control (CON) treatment containing 76.5% dry-rolled corn (DRC), 15.0% corn silage, 3.5%
soybean meal, and 5.0% supplement. 2Modified distillers treatment containing 40.0% DRC, 40.0% modified distillers grains plus
solubles, 15.0% corn silage, and 5.0% supplement. 3Treatment formulated to mimic protein portion of 40DGS with corn gluten meal (CGM) at
17.5%, 62.5% DRC, 15.0% corn silage, and 5.0% supplement. 4Treatment formulated to mimic protein portion of 40DGS with the addition of corn gluten
meal at 17.5% and condensed distillers solubles at 10.0%, 52.5% DRC, 15.0% corn silage,
and 5.0% supplement.

118
Table 3.7. Effects of excess rumen ungradable protein from distillers grains in finishing steers
diets on ruminal and post-ruminal digestibility (Exp. 2).
Treatment
Item CON1 40DGS2 HIGH-
CGM3
CGM-
CDS4
SEM P - value
Steers, n 4 4 6 5 - -
DMI, kg/d 6.8c 7.8a 7.1bc 7.5ab 0.5 0.08
Ruminal digestibility, %
Apparent OM5 44.2 49.9 50.9 50.4 5.5 0.81
True OM5,6 54.7 59.7 58.4 58.1 4.9 0.90
NDF 44.6 65.9 51.1 49.2 7.1 0.35
Apparent Starch5 70.7 68.7 75.6 75.5 6.2 0.36
True Starch5,6 71.2 69.3 76.0 76.2 6.2 0.35
Duodenal flow, kg/d
Bacterial OM6 0.68 0.64 0.68 0.65 0.14 0.98
Feed OM 2.60 2.75 2.42 2.62 0.45 0.94
Total OM 3.25 3.44 2.85 3.09 0.57 0.89
NDF 0.52 0.61 0.43 0.48 0.09 0.52
Starch 0.89 0.68 0.94 0.97 0.18 0.72
Postruminal digestibility, % entering
OM 61.3 47.7 64.0 69.4 6.2 0.18
Starch 73.8 83.5 73.3 72.0 6.2 0.59
Microbial CP flow, kg/d 0.32 0.27 0.24 0.25 0.08 0.88
Microbial Efficiency7 21 16 18 17 3 0.77 a,b,cMeans within a row with different superscripts differ (P < 0.10). 1Control (CON) treatment containing 76.5% dry-rolled corn (DRC), 15.0% corn silage, 3.5%
soybean meal, and 5.0% supplement. 2Modified distillers treatment containing 40.0% DRC, 40.0% modified distillers grains plus
solubles, 15.0% corn silage, and 5.0% supplement. 3Treatment formulated to mimic protein portion of 40DGS with corn gluten meal (CGM) at
17.5%, 62.5% DRC, 15.0% corn silage, and 5.0% supplement. 4Treatment formulated to mimic protein portion of 40DGS with the addition of corn gluten meal at
17.5% and condensed distillers solubles at 10.0%, 52.5% DRC, 15.0% corn silage, and 5.0%
supplement. 5Calculation of apparent vs. true used data from Exp 3 to account for bacterial cells flowing into
the duodenum. 6Caculated using assumed purine:N ratio of 0.3 from Cooper et al. (2002). 7Microbial Efficiency, g of Microbial CP/g of OM fermented in the rumen.

119
2
Table 3.8. Effects of excess rumen undegradable protein from distillers grains in finishing steers diets on ruminal volatile fatty acid
concentration (Exp. 3).
Treatment P-value5
Item CON1 40DGS2 HIGH-
CGM3
CGM-CDS4 SEM F-Test Int.
Steers, n 8 7 8 7
DMI, kg/d 10.1ab 11.5a 9.8ab 9.0b 0.6 0.06 -
Ruminal VFA
Acetate, mol/100 mol 50.5 48.7 45.3 48.6 1.7 0.18 0.41
Propionate, mol/100 mol 33.2b 35.6b 42.6a 34.5b 2.3 0.03 0.09
Butyrate, mol/100 mol 12.4 11.6 7.8 11.4 1.7 0.22 0.03
Acetate:propionate 1.7a 1.4a 1.1b 1.5a 0.2 0.08 0.21
Total, mM 107.1 89.9 105.0 96.3 5.9 0.16 0.10 a,bMeans within a row with different superscripts differ (P < 0.10). c,dMeans within a row with different superscripts tened to differ (P > 0.10 and P ≤ 0.15). 1Control (CON) treatment containing 76.5% dry-rolled corn (DRC), 15.0% corn silage, 3.5% soybean meal, and 5.0% supplement. 2Modified distillers treatment containing 40.0% DRC, 40.0% modified distillers grains plus solubles, 15.0% corn silage, and 5.0% supplement. 3Treatment formulated to mimic protein portion of 40DGS with corn gluten meal (CGM) at 17.5%, 62.5% DRC, 15.0% corn silage, and 5.0%
supplement. 4Treatment formulated to mimic protein portion of 40DGS with the addition of corn gluten meal at 17.5% and condensed distillers solubles at
10.0%, 52.5% DRC, 15.0% corn silage, and 5.0% supplement. 5F-test = overall F-test representing variation due to treatment, Int. = interaction of treatment × hour

120
Figure 3.1. Ruminal pH of cattle fed 4 different dietary treatments was monitored over 6 periods. The
control (CON) treatment contained 76.50% dry-rolled corn (DRC), 15.00% corn silage, 3.50% soybean
meal, 3.55% supplement, and 1.45% urea. The 40DGS treatment contained 40.00% DRC, 40.00% modified
distillers grains plus solubles, 15.00% corn silage, and 5.00% supplement. The HIGH-CGM treatment
contained 62.50% DRC, 17.50% corn gluten meal (CGM), 15.00% corn silage, and 5.00% supplement. The
CGM-CDS treatment replaced 10% of DRC from the HIGH-CGM diet with condensed distillers solubles.
There was an hour × treatment interaction (P < 0.01). Treatment differences (P < 0.05) within time points
are marked with a letter (a, b, c, d, e, f, g, h, i, and j) to signify statistical differences between treatments
within that time point. Time points marked with an “a” indicate that the CON treatment had the greatest pH
and HIGH-CGM and CGM-CDS had the lowest. The 40DGS treatment was intermediate. Time points
marked with a “b” indicate that the CON treatment had the greatest pH and HIGH-CGM and CGM-CDS
treatments were the lowest. The 40DGS treatment had a greater pH than the HIGH-CGM and CGM-CDS
treatments. Time points marked with a “c” indicate that the CON treatment had the greatest pH and the
remaining 3 treatments are the same. Time points marked with a “d” indicate that the CON had the greatest
pH and the HIGH-CGM treatment had the lowest. The 40DGS treatment had a greater pH than the HIGH-
CGM, and the CGM-CDS treatment was intermediate between CON and 40DGS. Time points marked with
an “e” indicate that the CON and CGM-CDS treatments had the greatest pH and the HIGH-CGM treatment
had the lowest. The 40DGS treatment was intermediate. Time points marked with an “f” indicate that
40DGS and CGM-CDS treatments had the greatest pH and the HIGH-CGM treatment had the lowest. The
CON treatment was intermediate. Time points marked with a “g” indicate that the HIGH-CGM treatment
had the greatest pH and the CGM-CDS treatment had the lowest. The CON and 40DGS treatments were
intermediate. Time points marked with an “h” indicate that the 40DGS treatment had the greatest pH and
the CGM-CDS treatment had the lowest. Time points marked with an “i” indicate that the CON treatment
had the greatest pH and that the CGM-CDS treatment had the lowest. Time points marked with a “j”
indicate that CON, 40DGS, and HIGH-CGM treatment had a greater pH than the CGM-CDS treatment.
ab
c
d
e
i
h
j
j j
f gg
g
5.2
5.4
5.6
5.8
6
6.2
6.4
0800 1100 1400 1700 2000 2300 0200 0500
pH
Time, h
CON 40MDG HIGH-CGM CGM-CDS

121
Figure 3.2. Ruminal propionate of cattle fed 4 different dietary treatments was monitored
over 6 periods. The control (CON) treatment contained 76.50% dry-rolled corn (DRC),
15.00% corn silage, 3.50% soybean meal, 3.55% supplement, and 1.45% urea. The
40DGS treatment contained 40.00% DRC, 40.00% modified distillers grains plus
solubles, 15.00% corn silage, and 5.00% supplement. The HIGH-CGM treatment
contained 62.50% DRC, 17.50% corn gluten meal (CGM), 15.00% corn silage, and
5.00% supplement. The CGM-CDS treatment replaced 10% of DRC from the HIGH-
CGM diet with condensed distillers solubles. There was an hour × treatment interaction
(P < 0.10). Treatment differences (P < 0.10) within time points are marked with a letter
(a, b, and c) to signify statistical differences between treatments within that time point.
Time points marked with an “a” indicate that the HIGH-CGM treatment had the greatest
propionate concentration and 40DGS and CGM-CDS had the lowest. The CON treatment
was intermediate. Time points marked with a “b” indicate that the HIGH-CGM treatment
had the greatest propionate concentration and CON had the lowest. The 40DGS and
CGM-CDS treatments were intermediate. Time points marked with a “c” indicate that the
HIGH-CGM treatment had the greatest propionate concentration and the remaining three
treatments were lower in propionate concentration. Each treatments’ trend line by time
was tested for linear and quadratic relationships and none were found.
ab
c
b
d d
25
27
29
31
33
35
37
39
41
43
45
47
49
51
0700 0900 1100 1300 1500 1700 1900
Pro
pio
nate
, m
ola
r %
Time, h
CON 40MDG HIGH-CGM CGM-CDS

122
Figure 3.3. Ruminal butyrate of cattle fed 4 different dietary treatments was monitored over 6
periods. The control (CON) treatment contained 76.50% dry-rolled corn (DRC), 15.00% corn
silage, 3.50% soybean meal, 3.55% supplement, and 1.45% urea. The 40DGS treatment
contained 40.00% DRC, 40.00% modified distillers grains plus solubles, 15.00% corn silage, and
5.00% supplement. The HIGH-CGM treatment contained 62.50% DRC, 17.50% corn gluten meal
(CGM), 15.00% corn silage, and 5.00% supplement. The CGM-CDS treatment replaced 10% of
DRC from the HIGH-CGM diet with condensed distillers solubles. There was an hour ×
treatment interaction (P < 0.10). Treatment differences (P < 0.10) within time points are marked
with a letter (a, b, c, and d) to signify statistical differences between treatments within that time
point. Time points marked with an “a” indicate that the CON and CGM-CDS treatments had the
greatest butyrate concentration and HIGH-CGM had the lowest. The 40DGS treatment was
intermediate. Time points marked with a “b” indicate that the CON treatment had the greatest
butyrate concentration and HIGH-CGM had the lowest. The 40DGS and CGM-CDS treatments
were intermediate. Time points marked with a “c” indicate that the CGM-CDS treatment had the
greatest butyrate concentration and HIGH-CGM had the lowest. The CON and 40DGS treatments
were intermediate. Time points marked with a “d” indicate that the CON and 40DGS treatments
had the greatest butyrate concentration and HIGH-CGM had the lowest. The CGM-CDS
treatment was intermediate. Each treatments’ trend line by time was tested for linear and
quadratic relationships and none were found.
a
b
c
d
e f
5
6
7
8
9
10
11
12
13
14
15
16
17
0700 0900 1100 1300 1500 1700 1900
Bu
tyra
te,
mola
r %
Time, h
CON 40MDG HIGH-CGM CGM-CDS

123
Figure 3.4. Ruminal total VFA of cattle fed 4 different dietary treatments was monitored
over 6 periods. The control (CON) treatment contained 76.50% dry-rolled corn (DRC),
15.00% corn silage, 3.50% soybean meal, 3.55% supplement, and 1.45% urea. The
40DGS treatment contained 40.00% DRC, 40.00% modified distillers grains plus
solubles, 15.00% corn silage, and 5.00% supplement. The HIGH-CGM treatment
contained 62.50% DRC, 17.50% corn gluten meal (CGM), 15.00% corn silage, and
5.00% supplement. The CGM-CDS treatment replaced 10% of DRC from the HIGH-
CGM diet with condensed distillers solubles. There was an hour × treatment interaction
(P < 0.10). Treatment differences (P < 0.10) within time points are marked with a letter
(a, b, and c) to signify statistical differences between treatments within that time point.
Time points marked with an “a” indicate that the HIGH-CGM and CON treatments had
the greatest total VFA concentration and 40DGS and CGM-CDS had the lowest. Time
points marked with a “b” indicate that the CON treatment had the greatest total VFA
concentration and 40DGS had the lowest. The HIGH-CGM and CGM-CDS treatments
were intermediate. Time points marked with a “c” indicate that the HIGH-CGM
treatment had the greatest total VFA concentration and the 40DGS and CGM-CDS
treatments had the lowest. The CON treatment was intermediate. Each treatments’ trend
line by time was tested for linear and quadratic relationships. The CGM-CDS treatment’s
trend line is linear (P = 0.05). The HIGH-CGM treatment’s trend line is quadratic (P =
0.03).
a b
c
75
85
95
105
115
125
135
145
0700 0900 1100 1300 1500 1700 1900
Tota
l V
FA
, m
M
Time, h
CON 40MDG HIGH-CGM CGM-CDS