evaluation of heavy metal contamination of soil and …
TRANSCRIPT

NWOKEMODO, EBELE CHINENYE B.Sc. (Hons) (PG/M.Sc/O5/39478)
PG/M. Sc/09/51723
EVALUATION OF HEAVY METAL CONTAMINATION OF SOIL AND WATER BY ABANDONED MINE-PITS AND WASTE ROCKS FROM LEAD-ZINC MINING AT
ENYIGBA
GEOLOGY
A THESIS SUBMITTED TO THE DEPARTMENT OF GEOLOGY, FACULTY OF
PHYSICAL SCIENCES, UNIVERSITY OF NIGERIA, NSUKKA
Webmaster
Digitally Signed by Webmaster’s Name
DN : CN = Webmaster’s name O= University of Nigeria, Nsukka
OU = Innovation Centre
NOVEMBER, 2009
EVALUATION OF HEAVY METAL CONTAMINATION OF SOIL AND WATER BY ABANDONED MINE-PITS AND
WASTE ROCKS FROM LEAD-ZINC MINING AT ENYIGBA
BY
NWOKEMODO, EBELE CHINENYE B.Sc. (Hons) (PG/M.Sc/O5/39478)
THESIS SUBMITTED TO THE DEPARTMENT OF GEOLOGY FACULTY OF PHYSICAL SCIENCES
UNIVERSITY OF NIGERIA NSUKKA
IN PARTIAL FULFILMENT OF THE REQUIREMENTS FOR THE MASTER OF SCIENCE DEGREE
IN ECONOMIC GEOLOGY/GEOCHEMISTRY
NOVEMBER, 2009.
CERTIFICATION

We certify that this research project was carried out by Nwokemodo, Ebele Chinenye in
the Department of Geology, University of Nigeria, Nsukka.
------------------------------- ---------------------
Prof. C. O. Okogbue Date
(Supervisor)
------------------------------- --------------------
Dr. L. Mama Date
(Head of Department)
i.

DEDICATION
This work is dedicated to Dr. and Dr. (Mrs) C. I. Oguonu whose ceaseless moral and
financial support helped me in concluding this work.
Also, to all the students and colleagues in Geology who have shared their fears for the
rapid environmental impact of pollution on planet Earth.
ii.

ACKNOWLEDGEMENT
I humbly acknowledge with all sincerity my indefatigable supervisor, Prof. C. O.
Okogbue who never seized to monitor this work critically from its inception to its
successful completion. I highly appreciate his immense guide to my write-ups and
compilations.
The encouragement from Mr. and Mrs. Ugochukwu is also acknowledged as well as their
ceaseless prayers for me.
I will not fail to thank Mr. Amobi for his immense guide and support which really
assisted me in writing this project.
My gratitude also goes to my Director, Dr. H. D. Ibrahim for his understanding and
support throughout the course of this work. I also appreciate the encouragement and
support of Mr. K. O. Billiaminu, Dr. M. O. Omojola, Mr. B. A. Aluko and Engr.
Aduagba. I am also profoundly grateful to Mrs Esther Barrow, who painstakingly typed
this work.
Above all, I thank God Almighty for His infinite mercies, love and compassion towards
me, especially in the darkest moment of my life.
iii.

TABLE OF CONTENTS
Title Page Certification i Dedication ii Acknowledgements iii Table of Contents iv List of Tables vi List of Figures vii List of Plates viii Abstract ix CHAPTER 1: INTRODUCTION 1.1 Preamble 1.2 Statement of the Problem 1.3 Area of Study 1.4 Location and Accessibility 1.5 Geomorphology and Soil Type 1.6 Surface and Groundwater Resources 1.7 Objectives of the Study 1.8 Literature Review CHAPTER 2: GEOLOGIC SETTING 2.1 Tectonic and Stratigraphic Setting 2.2. The Asu River Group 2.3 The Abakaliki Shale 2.4 Mineralization of the Study Area CHAPTER 3: METHOD OF INVESTIGATION 3.1 Field Mapping and Sample Collection 3.2 Laboratory Analyses of Samples CHAPTER 4: RESULTS OF THE INVESTIGATION 4.1 Hydro-Chemical Results 4.1.1 Microbial Contaminants 4.1.2 Heavy Metal Contaminants 4.2 Geo-Chemical Results 4.2.1 Soil Samples 4.2.2 Mine-pit Samples 4.2.3 Mine-Waste Rocks
iv.

CHAPTER 5: IMPLICATIONS OF RESULTS AND ENVIRONMENTAL/HEALTH CONCERNS 5.1 Implications of the Hydro-Chemical Results 5.2 Implications of the Soil Geo-Chemical Results 5.3 Environmental/Health Concerns 5.3.1 Extraction Wastes 5.3.2 Mine Pits 5.3.3 Human Exposure CHAPTER 6: CONCLUSIONS AND RECOMMENDATIONS 6.1 Conclusions 6.2 Recommendations References
v.

LIST OF TABLES
1. WHO Regulatory limits of heavy metals on soils
2. WHO Guidelines for drinking water quality
3. Cretaceous sequence in southern Nigeria
4. List of microbial contaminants isolated from water samples
5. Heavy metal constituents in water samples
6. Chemical composition of soil samples
7. Chemical composition of mine pit sediments
8. Chemical composition of Ameri waste rock composite
9. Chemical composition of Enyigba waste rock composite
10. Chemical characteristics of mine water sample
11. Chemical constituents of soil samples from farmlands
12. Chemical characteristics of water samples from abandoned mine-pits
vi.

LIST OF FIGURES
Figure 1: Study area in relation to the Benue Trough
Inset (Nigeria showing the location of Benue Trough)
Figure 2: Geological map of the study area
Figure 3: Accessibility map of the study area showing lead-zinc mines
Figure 4: Map showing locations where soil samples were collected
Figure 5: Map showing locations where water samples were collected
vii.

LIST OF PLATES
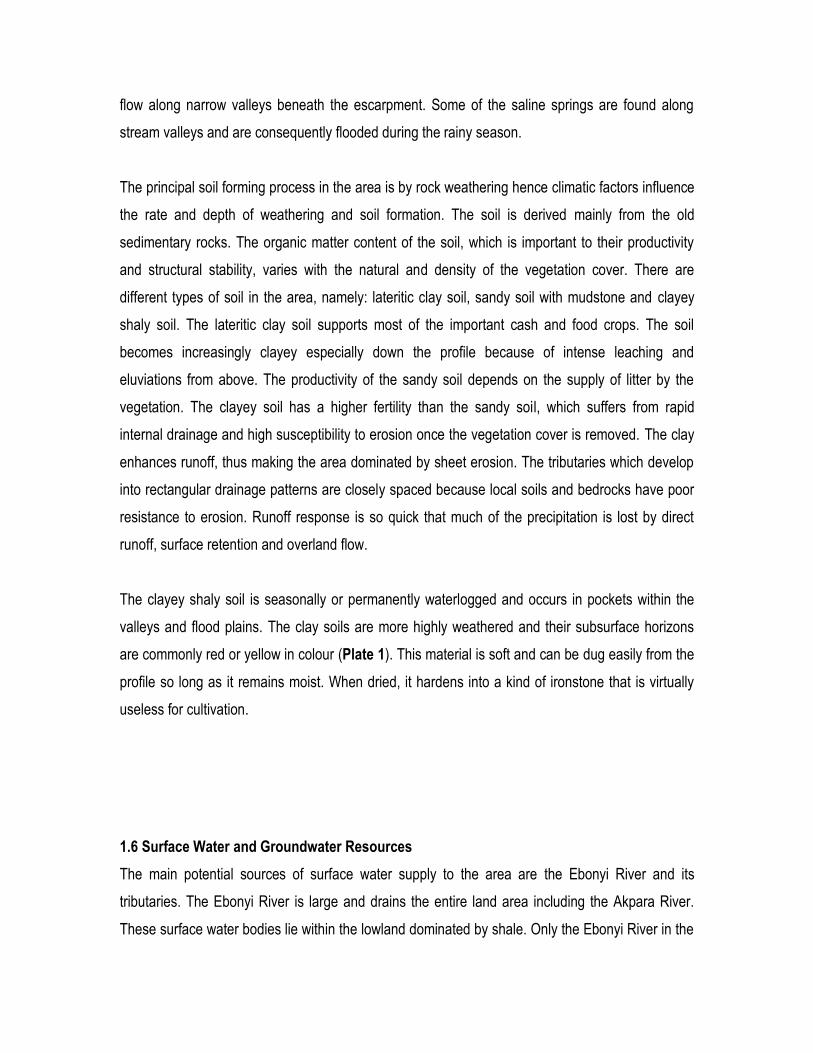
Plate 1: Highly weathered clay soil showing yellow colour
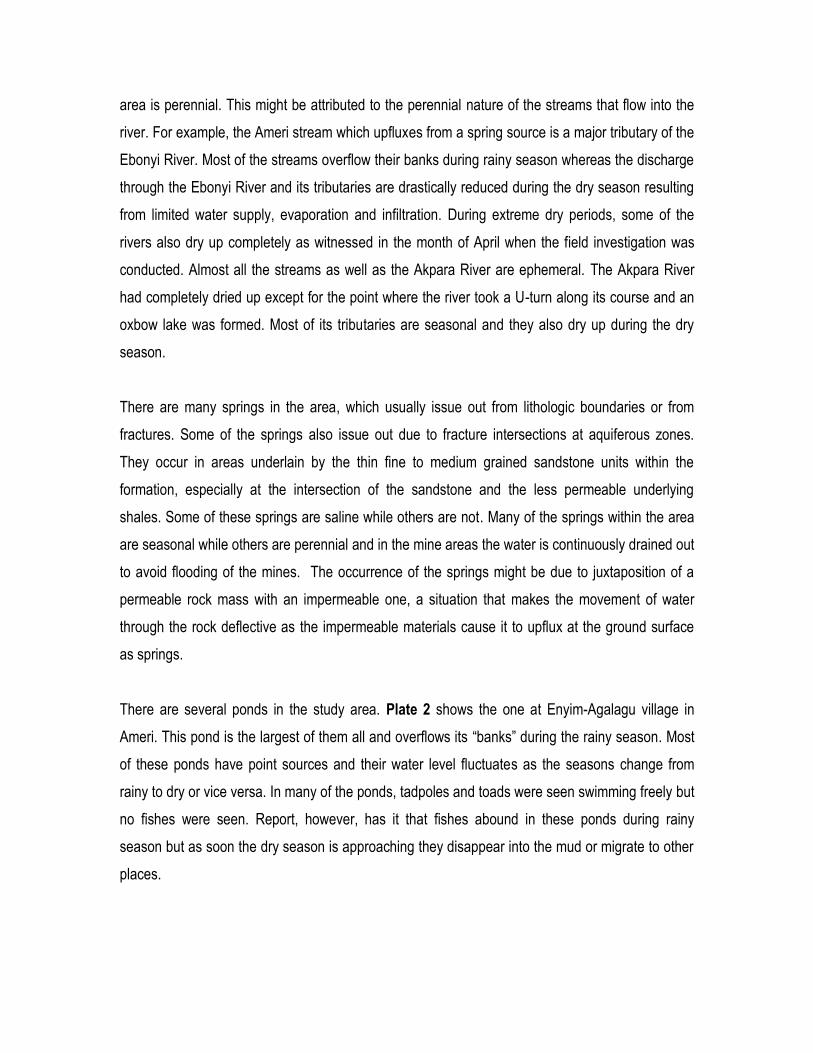
Plate 2: The largest pond within the study area
Plate 3: Shale outcrop exposed at „Okpuru Nkume‟
Plate 4: Overburden soil layers and underlying shale units exposed in a mine pit
Plate 5: Collection of sample at Akpara River
Plate 6: Mine waste rock piles at mine sites
Plate 7: Acid Mine Drainage on mine waste rocks
Plate 8: Mine water being pumped out of mine-pit into farmlands
Plate 9: Accumulation salt crystals within the mine area
Plate 10: Iron-deficient sweet potato plants
Plate 11: Unaffected sweet potato plants
Plate 12: Heaps of withered sweet potato plants
Plate 13: Mine sites as erosion sites during rainy season
Plate 14: A 30ft mine-pit filled with water after mine operation
Plate 15: Children engaged in mining activities at the mine site
viii.

Abstract
The extraction and processing of lead-zinc ore deposits involve large amounts of waste materials.
These mining wastes contain heavy metals which are potentially toxic to human life and the
environment. Heavy metals such as Cd, Cu, Ni, and Zn are all potential soil contaminants and
excess accumulation of these metals in soil is toxic to human and other animals. Potentially
contaminated soil may occur at areas in or around mining waste rock piles.
This study assessed the environmental effects of lead-zinc mining at Enyigba to document the
present state of the environment in areas affected by the mining operations. The study examined
the extent to which heavy metals from abandoned mine pits and mine waste rocks have polluted
the soil as well as the ground water and surface water. The occurrence of heavy metals in the
soils, streams, lakes, rivers, hand dug wells and boreholes within Enyigba and the environs was
investigated to determine the level of contamination in the area. Samples were collected from
several points to capture the variability of heavy metals in various locations. The analysis focused
on twelve (12) metals (Pb, Zn, Cu, Cd, Ag, As, Ni, Mo, Sb, Hg, Se, and Te).
The heavy metals concentrations in soil were measured at surface and near surface depth and
were found to be highest in the soil around the mine areas. The soil sample collected from a
farmland close to the waste rock dumps at Ameri had concentrations of lead and arsenic up to the
values of 1.9% and 0.8% respectively. The probable source of these metals is dust and small
particles of mine waste rock spread locally at the mines. Cadmium, zinc, copper, and nickel were
detected in some other soil samples collected close to the mines, the highest concentration of each
of the metals being present in the clay–rich soils. The concentrations of these metals were found
to be below dangerous thresholds for plants and animals although contamination of soil with heavy
metals such as lead, arsenic or cadmium is considered a serious environmental concern as these
elements can persist in soil for a long time with chances of increased concentration.
Statistically, insignificant concentrations (below WHO regulatory standard for drinking water) of
zinc, silver and selenium were also noted in few water samples tested in the study area.
ix.

CHAPTER ONE
1.0 INTRODUCTION
1.1 Preamble
Heavy metals occur naturally in the environment, but may also be introduced as a result of land
use activities. Mining industry throughout history has seriously caused immense environmental
pollution in industrialized and developing countries. According to the Environmental Data Report of
the United Nations Environmental Programme (UNEP, 1993), there is an increasing awareness
that the health of populations is at risk from pollution hazards. Mining generates 2.7 billion tons of
waste, in part hazardous, an amount which far exceeds the world‟s total accumulated municipal
garbage. Mining activities are responsible for an increase in certain heavy metals in soils,
sediments and groundwater reserves occurring within the influence sphere of the mine (Aucamp,
2003).
According to Brandy, et.al., (1999), the soil is a multi-component system consisting of solid, liquid
and gaseous phases as well as living organisms. Soil is dynamic and sensitive to almost every
aspect of its surroundings and represents a chemical system where mineral transformation occurs
continuously. Thus, when environmental changes occur, such as mining activity, the soil responds.
Any such change produces a gradual alteration of soil characteristics until a new balance is
reached. Naturally occurring as well as anthropogenically introduced concentrations of metals in
near-surface soil can vary significantly due to different physical and chemical processes operating
within soils geographic regions. Amongst the range of contaminants that may be found in soils,
potentially toxic elements or heavy metals are of particular interest for a number of reasons.
Firstly, they show a tendency, under normal circumstances, to accumulate in soils and have a long
persistence time because of the interactions with particular soil components. It is thus possible
that environmental change may lead to conditions, which could result in dramatic releases of
stored metals, the so-called „chemical time-bomb‟ effect. Secondly, they are ubiquitous in soils and
arise from both natural and anthropogenic sources, with pathways including inheritance from the
parent rocks, application of wastes, as well as local and long-range atmospheric and fluvial
deposition of emissions from industry and mining. Also, many of the heavy metals are essential at
low concentrations for plant, animal and human health but at higher concentrations, they can be
toxic.
Toxic metals are being released to the environment in increasing amounts and they are daily
ingested by humans, either through the air or through food, water and soil. Unfortunately heavy
metals are not subject to chemical degradation. Once the elements become part of this cycle, they
may accumulate in animal and human body tissue to toxic levels. Exposure to heavy metals is
normally chronic (exposure over a long period of time), due to food chain transfer. Acute
(immediate) poisoning from heavy metals is rare through ingestion or dermal contact, but possible.
This situation is especially critical for fish and other wildlife and humans at the top of the food
chain. The most common problem causing metals are mercury, cadmium, lead, nickel, copper,
zinc, chromium, manganese, arsenic, molybdenum, selenium, and boron. There are screening
levels or regulatory limits for metal concentration in soils set to protect wildlife. Also, standards
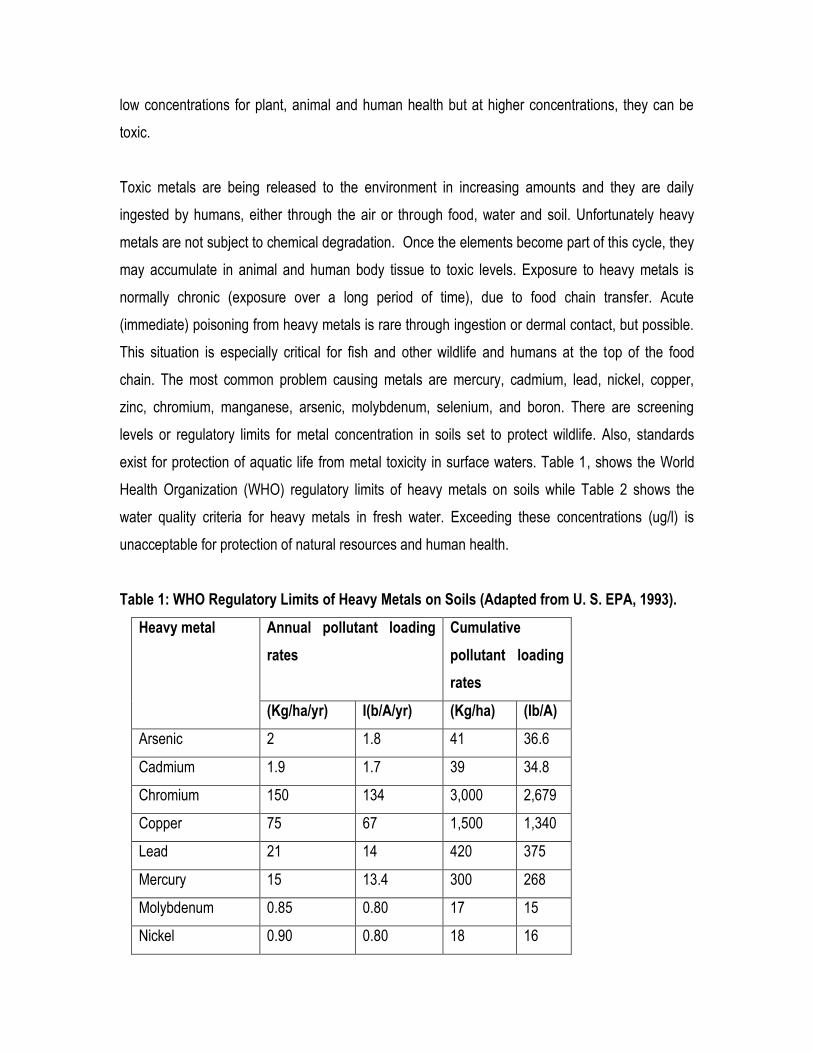
exist for protection of aquatic life from metal toxicity in surface waters. Table 1, shows the World
Health Organization (WHO) regulatory limits of heavy metals on soils while Table 2 shows the
water quality criteria for heavy metals in fresh water. Exceeding these concentrations (ug/l) is
unacceptable for protection of natural resources and human health.
Table 1: WHO Regulatory Limits of Heavy Metals on Soils (Adapted from U. S. EPA, 1993).
Heavy metal Annual pollutant loading
rates
Cumulative
pollutant loading
rates
(Kg/ha/yr) I(b/A/yr) (Kg/ha) (Ib/A)
Arsenic 2 1.8 41 36.6
Cadmium 1.9 1.7 39 34.8
Chromium 150 134 3,000 2,679
Copper 75 67 1,500 1,340
Lead 21 14 420 375
Mercury 15 13.4 300 268
Molybdenum 0.85 0.80 17 15
Nickel 0.90 0.80 18 16
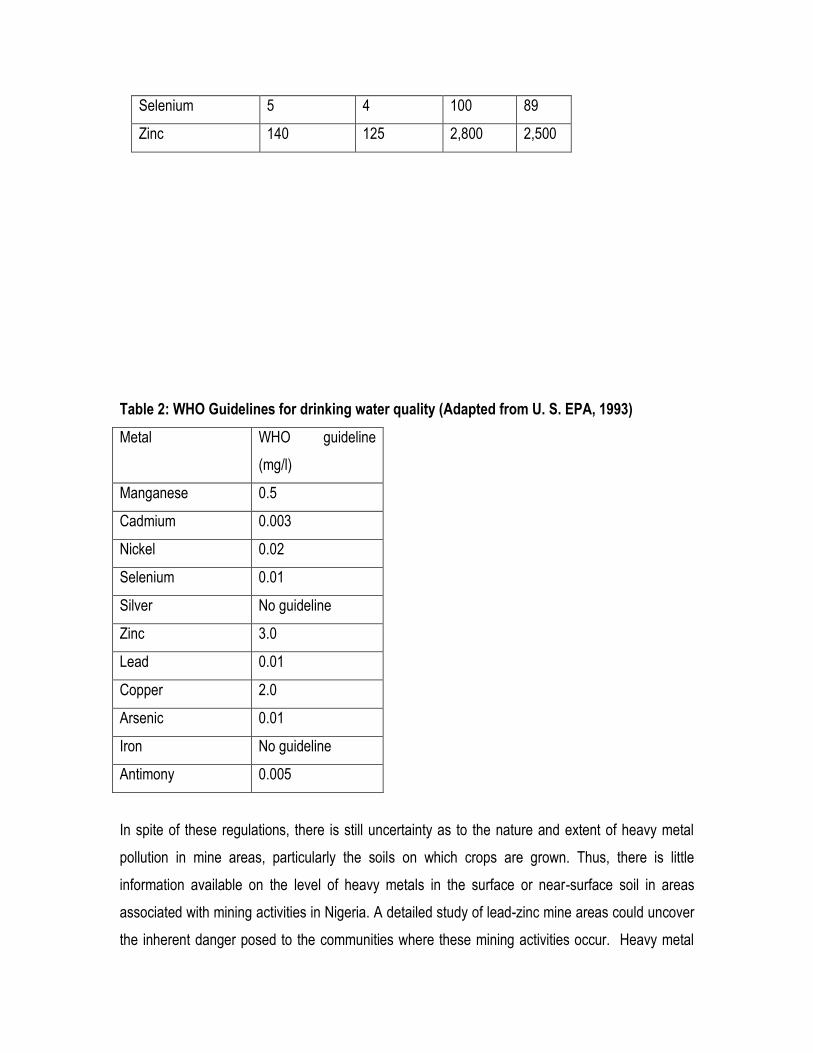
Selenium 5 4 100 89
Zinc 140 125 2,800 2,500
Table 2: WHO Guidelines for drinking water quality (Adapted from U. S. EPA, 1993)
Metal WHO guideline
(mg/l)
Manganese 0.5
Cadmium 0.003
Nickel 0.02
Selenium 0.01
Silver No guideline
Zinc 3.0
Lead 0.01
Copper 2.0
Arsenic 0.01
Iron No guideline
Antimony 0.005
In spite of these regulations, there is still uncertainty as to the nature and extent of heavy metal
pollution in mine areas, particularly the soils on which crops are grown. Thus, there is little
information available on the level of heavy metals in the surface or near-surface soil in areas
associated with mining activities in Nigeria. A detailed study of lead-zinc mine areas could uncover
the inherent danger posed to the communities where these mining activities occur. Heavy metal

pollution could constitute serious environmental and health hazards in such communities within our
country. This study focuses on the lead-zinc mining activities in Enyigba, southeastern Nigeria and
their effect on the environment with emphasis on heavy metal concentration. The importance of the
study lies on the fact that although the degradation of soil quality by pollution may be localized, the
environmental impacts are usually quite large. It is believed that contamination of the soil can pose
a significant threat to human health and aquatic life.
1.2 Statement of the Problem
The environmental consequences of open-pit mining are several. As ore deposits consist of
relatively small percentages of economically valuable minerals, their extraction and processing
involves large amounts of waste materials. The extraction process entails the removal of large
amounts of materials which become waste products. These materials are both the overburden that
covers the deposits and wastes from the ore that are produced in the extraction and separation of
the ore. The lead/zinc mining at Enyigba was by the old open-pit mining technique which meant
that once the mine became uneconomic, it was abandoned with little or no attempt to rehabilitate
the land. Thus, there was total destruction of the vegetation of mined areas, and considerable
reshaping of the natural topography. These activities left several heaps of abandoned lead-zinc
mine waste rocks at various mine sites in Enyigba. Also, mining activity brought to the surface
large quantities of minerals that are unstable in the weathering environment. The mine itself
disrupts the landscape, and the increased surface area of the broken and crushed rocks from
mining and extraction set the stage for erosion and leaching of metals to the environment.
Recently, the Ebonyi State Government in collaboration with UNIDO carried out analyses of saline
water in ponds, lakes and springs within the state. It was discovered that most of the brine
occurrences in the area are contaminated with heavy metals particularly, lead (Pb). The Ishiagu
brine was noted to have the highest concentration of Pb.
1.3 History of Lead/Zinc Mining in the Study Area
The Abakaliki lead-zinc deposits are the largest and richest deposits in the country. They include
those at Enyigba and Ameka-Ameri to the south of Abakaliki town, Mkpume Akwatakwa, Mkpume
Akwaokuko and Lefin to the north-east of the town. The Enyigba, Ameri-Ameka deposits which are
the best known deposits were first mined in 1925. These deposits have constituted an important
source of lead-zinc since the 1940‟s. During the 1920‟s, a British Mining Company mined the Ameri
and Enyigba deposits by open cast and underground mining respectively, although it is known that
long before the coming of the British to Nigeria, the natives worked the Abakaliki lodes near the
surface. Further down in depth, galena became an object of search for use as a cosmetic. The
natives of the area used hand-picked, finely ground cubic galena as a cosmetic (Bogue, 1952).
They also used lead smelted from galena as fishing net weights. The deposits were also exploited
by a German Mining Company before the Nigerian civil war. The company employed open cast
mining and the galena and sphalerite were beneficiated at the site by differential floatation using
xanthate collector. However, mining ceased at the onset of the civil war and the natives shifted
their interest on salt production from the brine pools associated with the lead-zinc deposits. In
recent years, however, mining has continued intermittently and many firms have renewed interests
in operations within the area. This has resulted to abandoned open pits and several heaps of lead-
zinc mine waste rocks, which have considerably reshaped the natural topography of the area.
1.4 Location and Accessibility
The study area in relation to the Benue Trough is indicated in fig.1, while fig. 2 shows the
geological map of the study area. The area is bounded by Latitude 6o 10/ N - 6o 13/ N and
Longitude 8o 07/ E - 8o 10/ E and covers a surface area of 33.06km2. It falls within the lower region
of the Benue Trough. Deposits of galena (PbS) and sphalerite (ZnS) occur as veins and lodes in
the oldest exposed sequence (the Asu River Group) of the Abakaliki Basin within which are the
villages of Enyigba, Amagu, Alibaluhu and Ameri in Ikwo LGA are located. The villages are about
14 kilometers south of Abakaliki , the capital city of Ebonyi State, in the southeastern part of
Nigeria. The routes in the area consist mainly of footpaths and narrow road networks. Fig. 3 is the
accessibility map of the study area showing lead-zinc mines.
1.5 Geomorphology and Soil Type
The most prominent topographical features in the study area are ridges and flat lands which are
underlain by the shales of Asu River Group. These ridges and flat lands host the lead–zinc veins
and form watersheds from which many springs and streams are generated. The streams generally
flow along narrow valleys beneath the escarpment. Some of the saline springs are found along
stream valleys and are consequently flooded during the rainy season.
The principal soil forming process in the area is by rock weathering hence climatic factors influence
the rate and depth of weathering and soil formation. The soil is derived mainly from the old
sedimentary rocks. The organic matter content of the soil, which is important to their productivity
and structural stability, varies with the natural and density of the vegetation cover. There are
different types of soil in the area, namely: lateritic clay soil, sandy soil with mudstone and clayey
shaly soil. The lateritic clay soil supports most of the important cash and food crops. The soil
becomes increasingly clayey especially down the profile because of intense leaching and
eluviations from above. The productivity of the sandy soil depends on the supply of litter by the
vegetation. The clayey soil has a higher fertility than the sandy soil, which suffers from rapid
internal drainage and high susceptibility to erosion once the vegetation cover is removed. The clay
enhances runoff, thus making the area dominated by sheet erosion. The tributaries which develop
into rectangular drainage patterns are closely spaced because local soils and bedrocks have poor
resistance to erosion. Runoff response is so quick that much of the precipitation is lost by direct
runoff, surface retention and overland flow.
The clayey shaly soil is seasonally or permanently waterlogged and occurs in pockets within the
valleys and flood plains. The clay soils are more highly weathered and their subsurface horizons
are commonly red or yellow in colour (Plate 1). This material is soft and can be dug easily from the
profile so long as it remains moist. When dried, it hardens into a kind of ironstone that is virtually
useless for cultivation.
1.6 Surface Water and Groundwater Resources
The main potential sources of surface water supply to the area are the Ebonyi River and its
tributaries. The Ebonyi River is large and drains the entire land area including the Akpara River.
These surface water bodies lie within the lowland dominated by shale. Only the Ebonyi River in the
area is perennial. This might be attributed to the perennial nature of the streams that flow into the
river. For example, the Ameri stream which upfluxes from a spring source is a major tributary of the
Ebonyi River. Most of the streams overflow their banks during rainy season whereas the discharge
through the Ebonyi River and its tributaries are drastically reduced during the dry season resulting
from limited water supply, evaporation and infiltration. During extreme dry periods, some of the
rivers also dry up completely as witnessed in the month of April when the field investigation was
conducted. Almost all the streams as well as the Akpara River are ephemeral. The Akpara River
had completely dried up except for the point where the river took a U-turn along its course and an
oxbow lake was formed. Most of its tributaries are seasonal and they also dry up during the dry
season.
There are many springs in the area, which usually issue out from lithologic boundaries or from
fractures. Some of the springs also issue out due to fracture intersections at aquiferous zones.
They occur in areas underlain by the thin fine to medium grained sandstone units within the
formation, especially at the intersection of the sandstone and the less permeable underlying
shales. Some of these springs are saline while others are not. Many of the springs within the area
are seasonal while others are perennial and in the mine areas the water is continuously drained out
to avoid flooding of the mines. The occurrence of the springs might be due to juxtaposition of a
permeable rock mass with an impermeable one, a situation that makes the movement of water
through the rock deflective as the impermeable materials cause it to upflux at the ground surface
as springs.
There are several ponds in the study area. Plate 2 shows the one at Enyim-Agalagu village in
Ameri. This pond is the largest of them all and overflows its “banks” during the rainy season. Most
of these ponds have point sources and their water level fluctuates as the seasons change from
rainy to dry or vice versa. In many of the ponds, tadpoles and toads were seen swimming freely but
no fishes were seen. Report, however, has it that fishes abound in these ponds during rainy
season but as soon the dry season is approaching they disappear into the mud or migrate to other
places.

The general geology of the area controls the occurrence and flow of groundwater. Evaluation of the
groundwater resources within the area was not carried out due to lack of drilling data. During the
field investigation, most of the boreholes had been completed and hydro-geologic data could not
be obtained. A total of eight (8) boreholes were visited but water samples were collected from only
five (5) because some of the boreholes had completely dried up. Three hand dug wells owned by
individuals were encountered within the area and their water level elevations were estimated.
Water samples were collected from two hand dug wells for hydro-chemical analyses and the
depths of the wells were given as 35ft and 40ft respectively. These wells form additional source of
water for the rural communities beside the ponds available in the area since the boreholes are
situated several kilometers away from some of the inhabitants of the area.
1.7: Objectives of the Study
The primary objective of the study was to determine if there are statistically significant differences
between the metal concentrations in surface and near-surface soils as well as surface water and
groundwater in areas affected by mining and in areas not affected by mining. To achieve this aim,
it was necessary to investigate the distribution of the heavy metal concentrations in the lead-zinc
mine waste rocks as well as the soils and waters affected by abandoned waste rocks and mine-
pits. Using the data, it was possible to:
Assess the degree of heavy metal pollution of soils, surface water and groundwater;
Determine the potential environmental effects associated with mining other lead-zinc
deposits in similar physiographic and geologic settings.
Provide information about the natural background concentrations in control sampled
areas.
1.8 Literature Review
The Geological Survey of Nigeria (GSN) was amongst the first group to carry out study on the
geology of the southeastern Nigeria, which included parts of the study area. The lead-zinc
mineralization belt in the area has been studied by a number of workers. Farrington (1952)
surveyed the lead-zinc belt, which is associated with lower Cretaceous folding and igneous
activities in southern Nigeria. Gravity surveys by Cratchley (1965) along the belt of occurrence of
the brines reported that the brine springs are most frequently found near the axes of anticlines in

fractured and mineralized areas. Orajaka (1972) was among the early workers to investigate the
salt water resources of the then East Central State of Nigeria. He noted that Enyigba–Ameri salt
mine has salinity more than Okposi and Uburu salt lakes. Nwachukwu (1972) investigated the
tectonic evolution of the southeastern portion of the Benue Trough where he noted that lead-zinc
mineralization dominates the Albian shale and has fewer occurrences in the Turonian shale.
Nwachukwu (1975) reported on the temperatures of formation of the vein minerals in the southern
portion of the Benue Trough, with particular mention of the tests in Okposi and Uburu veins.
Ezepue (1979) presented the major and trace element content of lead-zinc mineralization at
Ishiagu with emphasis on the temperatures of formation. Ezepue (1984) studied the geologic
setting of the lead-zinc deposits of Ishiagu in relation to tectonic fissures which influenced the loci
of mineralization. He noted that there are close associations between mineralized veins, igneous
intrusion and upfluxing points of saline groundwater. The mineralogy and textures of lead-zinc-
copper areas of Enyigba lode were investigated by Orazulike (1994).
Several works have also been carried out on the contents of a range of heavy metals on Nigerian
soils. Recently, some geologists have studied near-surface soils for agricultural or farming
purposes to better understand natural ecosystems while others focused on the heavy metal
content of soils in urban areas associated with industrial activities. Ihenyen et al., (2003)
conducted a study of heavy metal levels in soils and vegetables from Warri district of southern
Nigeria. The result of the assay metals in the home-gown vegetables did not show glaring
differences from those obtained in the natural background level estimates. Also, Abimbola et al.,
(2003) studied heavy metal content of soils and sediments in five selected industrial estates in
southwestern Nigeria. Comparing values for selected heavy metals (Pb, Zn, Cu, and Cd) recorded
for the five locations with average global background values for these metals they observed that a
marked elevation of the metals was evident. The sources of these heavy metals were linked to the
discharged wastes and effluents from the industrial concerns located in the area. In studying the
secondary geochemical dispersion of trace elements in soil in the Nasarawa pegmatite fields,
Akintola et al. (2003), compared trace elements in relatively newly formed pegmatite eluvial soils
and unbiased soil samples taken over the whole area to note the effects of the secondary surface
processes on the redistribution of the trace elements in the soils. The relatively higher
concentrations and correlations of the trace elements in the newly formed eluvial soils over the

pegmatites showed the effects of surface processes in redistributing the trace elements. In all
these studies, soil samples were taken from selected soil horizons not related to mining activities.
Only few studies have related heavy metals to mining activities and one of such studies is Ogezi
et.al (1985), which assessed the environmental effects of trace elements associated with
geological and human factors in parts of Plateau state, Nigeria.
CHAPTER TWO
2.0 GEOLOGIC SETTING
2.1 Tectonic and Stratigraphic Setting
Tectonic evolution of the Benue Trough has been attributed to stresses developed during the
continental separation of South America from Africa and the opening of Atlantic Ocean during early
Cretaceous (Grant, 1971; Burke and Whiteman, 1973; Olade, 1975; Benkhelil, 1982). The
Cretaceous Benue Trough is an 800km long, 130 to 150km wide rift structure developed as a result
of the Lower Cretaceous continental rifting and the opening of the Atlantic Ocean at the site of
triple RRR junction (Grant, 1971; Burke et al., 1970). According to Benkhelil, 1982, 1987, 1989,
the Trough was a segment of the triple junction which extends inland along the oceanic fracture
systems of the Chain and Charcot systems with several pull-apart basins formed along an en-

echelon sinistral wrench faults. The basin was described as the failed arm of a rift system
developed by progressive mantle plume activities accompanied by sedimentation (Olade, 1976).
The several depositional cycles which resulted in the deposition of diverse sedimentary rocks of
varied compositions and ages were documented by Kogbe (1981). The oldest rock in the Trough is
the Aptian mafic volcanoclastic, which is interlayered with marine shales, limestone and sandstone
of the Albian Asu River Group.
2.2 The Asu River Group
The Asu River Group overlies unconformably the Lower Paleozoic basement and hosts the lead-
zinc veins and associated fluorite and barite in the Benue Trough. It is an extensive geologic
formation in the southern Nigeria Sedimentary Basin with thickness of about 1500m. Simpson
(1954) described the Asu River Group as consisting largely of olive brown sandy shales, fine-
grained micaceous sandstone and mudstone. The formation is overlain unconformably by the Eze-
Aku Shale of Turonian Age. This is conformably secceeded by the Awgu shale of Coniacian-
Santonian Age, which is in turn overlain by the Owelli sandstone of Campanian-Maastrichtian Age
(Table 3). The extensive Turonian-Coniacian marine transgression deposited the Eze-Aku shale
and the Awgu shale. Subsidence during the Turonian initiated a new marine transgression,
resulting in the deposition of the Eze-Aku shale with significant sandstone and limestone facies.
According to Nwachukwu (1975), the thickness of the two formations – Eze-Aku shale and Awgu
shale are about 610m and 915m respectively. The Eze-Aku shale and Awgu shale are
lithologically similar and consist of shales, limestones and sandstones. The formations are overlain
by regoliths and ferruginised sandstones in many places.
Table 3: Cretaceous Sequence in Southern Nigeria (Kogbe, 1976)
Western Nigeria Eastern Nigeria
Paleocene
Abeokuta Formation
Nsukka Formation Danian
Maestrichtian Ajali Formation
Campanian-Maestrichtian Mamu Formation
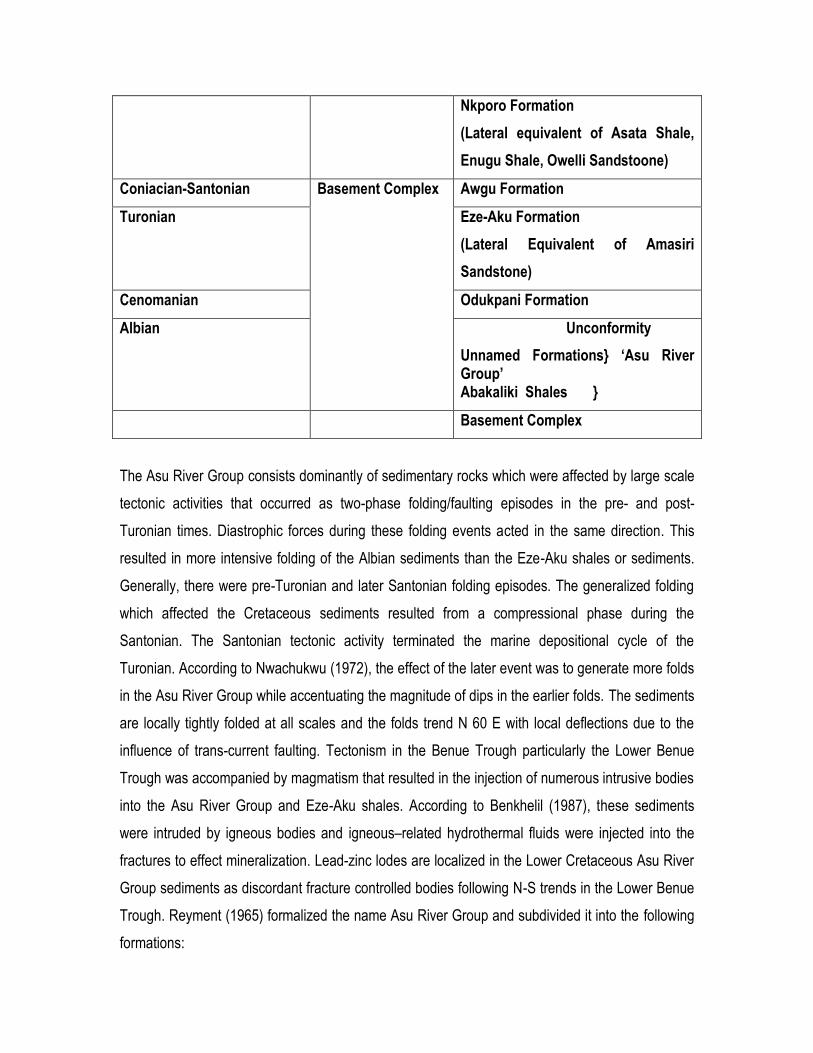
Nkporo Formation
(Lateral equivalent of Asata Shale,
Enugu Shale, Owelli Sandstoone)
Coniacian-Santonian Basement Complex Awgu Formation
Turonian Eze-Aku Formation
(Lateral Equivalent of Amasiri
Sandstone)
Cenomanian Odukpani Formation
Albian Unconformity
Unnamed Formations} ‘Asu River Group’ Abakaliki Shales }
Basement Complex
The Asu River Group consists dominantly of sedimentary rocks which were affected by large scale
tectonic activities that occurred as two-phase folding/faulting episodes in the pre- and post-
Turonian times. Diastrophic forces during these folding events acted in the same direction. This
resulted in more intensive folding of the Albian sediments than the Eze-Aku shales or sediments.
Generally, there were pre-Turonian and later Santonian folding episodes. The generalized folding
which affected the Cretaceous sediments resulted from a compressional phase during the
Santonian. The Santonian tectonic activity terminated the marine depositional cycle of the
Turonian. According to Nwachukwu (1972), the effect of the later event was to generate more folds
in the Asu River Group while accentuating the magnitude of dips in the earlier folds. The sediments
are locally tightly folded at all scales and the folds trend N 60 E with local deflections due to the
influence of trans-current faulting. Tectonism in the Benue Trough particularly the Lower Benue
Trough was accompanied by magmatism that resulted in the injection of numerous intrusive bodies
into the Asu River Group and Eze-Aku shales. According to Benkhelil (1987), these sediments
were intruded by igneous bodies and igneous–related hydrothermal fluids were injected into the
fractures to effect mineralization. Lead-zinc lodes are localized in the Lower Cretaceous Asu River
Group sediments as discordant fracture controlled bodies following N-S trends in the Lower Benue
Trough. Reyment (1965) formalized the name Asu River Group and subdivided it into the following
formations:

Unnamed Formation
Abakaliki Shale
Unnamed Formation
2.3 The Abakaliki Shale
The study area lies within the Abakaliki Shale which consists mainly of rather poorly bedded shale,
occasionally sandy, with lenses of sandstone and mudstone. The sediments, which are associated
with lead-zinc mineralization, are folded and the fold axes stretch NE-SW. Paleontologically, they
are characterized by species of Mortoniceras and Elobiceras (Reyment, 1965). The shales are
fine-grained, dark-grey, fissile, compacted, highly folded, fractured and faulted. The Santonian and
late Cretaceous tectonic episodes resulted in the folding and fracturing of rocks of this area.
Exposures of the shale occur in ditches and drains but there are no sizeable natural outcrops
within the study area. However, an outcrop of the shale is exposed at „Okpuru Nkume‟ in Adam
village (Plate 3). The dark-grey compacted fissile shale exposed in one of the mine pits serve as a
good example of this rock unit, which is largely plastic when wet and gritty when dry. It is folded,
faulted and fractured. The overburden soil layers and underlying shale units exposed in a mine-pit
are shown on Plate 4 and represented thus:
Topmost zone: topsoil/humus soil
Upper zone: lateritic clay, which is violet or pink in colour;
Middle zone: weathered grey shale;
Lower zone: highly-compacted dark shales.
2.4 Mineralization of the Study Area
The lead-zinc ore is found in the Albian carbonaceous shale – the Abakaliki shale of the Asu River
Group. The mineralization is structurally controlled and localized in fissures, fault zones and gently
dipping veins. The veins are steeply dipping and have been proven to over 150m depth. They vary
in width from less than a meter to 20m and in length from 30m to 120m. The dorminant ores in the
area are observed from the fissures which contain lodes of sphalerite (ZnS), and /or galena (PbS)
in association with smaller quantities of copper.

Galena is lead-grey in colour and occurs in veins and lenses. According to Orazulike (1994), the
three types recognized on the basis of crystal form are namely: fibrous, granular, and cubic galena.
Fibrous galena is often found close to fault zones and the gneissic texture is as a result of shear
strain associated with movement on the fault. In hand specimen, galena in granular form consists
of a mass of tiny granules. Cubic galena is the most form in the Enyigba veins. It typically occurs
away from the fault zones. Sphalerite is opaque, dark brown in colour and is usually in intimate
association with galena. Crystals are large and tabular with some faces measuring up to 8cm
across. It is second in abundance within the deposit.
Gangue minerals include siderite (FeCo3), pyrite (FeS2), marcasite, quartz and barites with other
secondary minerals such as sulphates, carbonates and oxides. Marcasite is a ubiquitous gangue
mineral though much less in abundance than siderite and quartz. Chalcopyrite is a minor mineral
component, occurring generally in association with siderite and galena. It is massive and
structure-less in hand specimen. Siderite is massive and has beige colour when fresh. On
exposure to air, it is tarnished to dark brown colour. The crystal faces are poorly formed suggesting
deposition at relatively high temperatures. Siderite is found in the main veins, minor fractures and
vein-lets. In addition to galena and sphalerite, barite deposits in the trough as well as saline
groundwater are of economic importance.

CHAPTER THREE
3.0 METHOD OF INVESTIGATION
3. 1 Field Mapping and Collection of Samples
The investigations were carried out in three stages. The first stage involved literature review and
reconnaissance studies using the existing geologic and physiographic information and maps such
as Abakaliki SW topographic map, Sheet 303 of scale 1:50,000 and Nigerian Geological Map
Series, Ogoja Province, sheet 73 of scale 1:50,000 to identify the rock formations and their
stratigraphic and structural relationships. This helped in locating some of the known saline water
bodies and other surface water bodies in the area. A reconnaissance survey was conducted on the
first day, April 4, 2008, to get a generalized idea about the terrain as well as the communication
facilities available in the area. Rapid traverses were conducted within the area chosen for the
research work. The soil layers and shale units exposed in one of the mine pits were studied to get
a preliminary overview of the petrographical and structural features noticeable in the mine pits. The
geomorphic forms of the area as well as the weathering pattern of the rock type encountered were
also studied.
On day two, April 5, all the required materials for the fieldwork were purchased and the map grid
for the study area was produced using the topographic map. On the third day, the literature review
and reconnaissance studies were followed by detailed surface and subsurface geologic and hydro-
geologic studies and collection of samples from lead-zinc mine waste rocks, surface waters and
groundwater as well as surface and near surface soil samples within the study area. Since both soil

and water samples were desired, grid pattern of sample collection within the cells was employed.
This made it possible for a better representative sampling.
Soil samples were collected from four communities within the study area. These included: Amagu,
Enyigba, Alibaluhu and Ameri. These are mainly agricultural land areas with localized mine pits
and heaps of waste rocks. The samples were collected from mine pits, erosion sites (valley sides),
road cuts, streams and river banks. This implied that the samples were generally taken at various
depths ranging from 0.5m (1ft) to 4.6m (15ft). In areas with hard dry soils, the samples were taken
by digging a hole with pickaxe as shown on plate 5 at the Akpara River bank. The samples were
placed in small polyethylene bags and numbered. Brief notes were taken to indicate soil type e.g.
clay, laterites, shale etc. and structural features were also noted. The numbering system used was
based on the sampling pattern. A total of 29 soil samples were collected from different sample
points. The samples comprised 17 soil samples, 6 mine-pit sediments collected at 5ft intervals, four
4 mine waste rock samples from different mine sites and 2 soil samples from a farmland close to
the Ameri mines.
Water samples were collected from lakes, streams, rivers, hand dug wells and boreholes. The
samples were collected in properly labeled 2 litre plastic cans, filled and tightly corked. Before
filling the cans, each was rinsed thrice with the water from source before collection. A total of 19
water samples were collected. The samples include 7 groundwater samples consisting of 2 hand
dug wells and 5 borehole samples. Others include 5 water samples from lakes, 1 sample from
stream, 1 sample from River, 3 samples collected from saline water pumped from mine-pits, 1
sample from abandoned mine-pit, and 1 sample from a pond near the abandoned mine-pit.
Arrangement was made with the management of Ebonyi State Rural Water Supply and Sanitation
for the transportation of the samples to a private laboratory in Enugu for storage before distribution
to various laboratories.
Fig. 4 shows the locations where soil samples were collected while fig. 5 shows locations where
water samples were collected. Each sampling point was given Geographical Information System
(GIS) coordinates using a global positioning system (GPS). A small portable GPS receiver (Garmin
extrex equipment) was used for this exercise. The fieldwork lasted for a period of two weeks.
However, since the field investigation was undertaken during the last stage of the dry season, a
verification visit was also undertaken during the rainy season (June) to access the situation at the
mine sites. The last research stage involved the analyses of both water and soil samples in the
laboratory and collation of data.
3.2: Laboratory Analyses of Samples
The hydro-chemical studies of the 31 water samples collected from springs, lakes, streams, rivers,
hand dug wells, boreholes as well as saline water from mine pits involved the determination of
microbial load and heavy metal constituents. These included:
13 samples analyzed at the Department of Pharmaceutics, University of Nigeria, Nsukka
using the multiple tube method and the plate count (viable count) to determine the
microbial load of the samples as well as direct reading engineering method using Hach
DR/2010 Spectrophotometer to determine heavy metal constituents;
13 samples analyzed at Central Research Laboratory, University of Uyo, using Atomic
Absorption Spectrophotometer (AAS) Solaar to determine the heavy metals present in the
samples; and
5 samples analyzed at Sheda Science and Technology Complex, SHESTCO, Abuja using
computer controlled Atomic Absorption Spectrophotometer (AAS) 969 Solaar to determine
the composition of mine water samples as well as water samples collected from
abandoned mine-pits.
The concentrations and distribution of 12 heavy metals: lead (Pb), zinc (Zn), copper (Cu), cadmium
(Cd), antimony (Sb), silver (Ag), selenium (Se), nickel (Ni), molybdenum (Mo), indium (In), arsenic
(As), and tellurium (Te) were investigated in groundwater and surface water samples. The different
levels of the heavy metals in these samples were compared with the values obtained from
unbiased water samples taken from areas unaffected by mining. The pH and other constituents of
mine water and water samples from the abandoned mine pits were also determined. The
bacteriological water analyses were carried out using the multiple tube method and the plate count
to estimate the numbers of bacteria present, and to find out what sort of bacteria they are so as to

predict their source. In the multiple tube method, a measured sub-sample was diluted with sterile
growth medium and then decanted into each tube. The remaining 10ml was then diluted again and
the process repeated. The tubes were then incubated at a pre-set temperature for a specified time
and at the end of the process, the number of tubes with growth in was counted for each dilution.
The plate count relied on bacteria growing a colony on nutrient medium so that the colony
becomes visible to the naked eye and the number of colonies on a plate was counted. To ensure
that appropriate number of colonies was generated, several dilutions were cultured. Statistical
tables were then used to derive the concentration of organisms in the original sample.
The analyses of the soil samples to determine the composition of heavy metals were carried out at
the National Metallurgical Development Centre (NMDC) Jos, Plateau State. A total of twenty-
seven (27) soil and waste rock samples were analyzed for heavy metal constituents which include:
lead (Pb), zinc (Zn), copper (Cu), cadmium (Cd), antimony (Sb), silver (Ag), selenium (Se), nickel
(Ni), molybdenum (Mo), indium (In), arsenic (As), and tellurium (Te). The dissolved geo-chemical
constituents of soil samples were analyzed in the laboratory using Atomic Energy Dispersive X-Ray
Fluorescence Spectrophotometer (AED-XRFS), MiniPAL4 Model (C) 2005. The samples were
ground into powder in a tungsten-carbide mill and the grinding time was 30-60 seconds. The
pulverized samples (weighing 20g each) were dried in an oven at 105 oC for at least one hour and
allowed to cool. The samples were then mixed with a binder in the ratio of 5g sample to 1g
cellulose flakes binder and palletized at a pressure of 10-15 tons/inch in a palletizing machine. The
palletized samples were stored in a dessicator for analysis.
The machine was switched on and allowed to warm up for 7 hours. The trace element standards of
all the samples were prepared by using the progressively increasing weights of their oxides. In this
process, the high energy content of an X-ray beam caused a sample to generate X-rays
characteristics of the atoms in the sample. The appropriate programs for various elements of
interest were employed to analyze the sample materials for their presence or absence. Elements
present in the samples were identified from the energies of their characteristic radiation and the
concentrations were evaluated from intensity measurements. The results of the analysis were
reported in percentage (%) for minor and major concentrations of elements and presented in a

tabular form. The different levels of the heavy metals in these samples were compared with the
values obtained from unbiased soil samples taken from areas unaffected by mining.
CHAPTER FOUR
4.0 RESULTS OF THE INVESTIGATION

4.1 Hydro-Chemical Results
4.1.1: Microbial Contaminants
The results of the bacteriological analysis showed that most of the water sources were infested
with bacteria. Contaminants that were detected in surface water and groundwater samples are
presented on Table 4.
Table 4: Microbial Contaminants Isolated from Water samples (viable count).
SAMPLE SOURCE BIO-LOAD ISOLATES (Bacterial Pathogens)
AE 01 Borehole 19.27 x10 Klebsiella spp, Shigella spp, Bacillus subtilis
AE 02 Lake 91.67 x 10 Serretia marcescenes, Shigella spp
AE 03 Stream 75.83 x 10 Sarcina, Staphylacoccus spp., Bacillus subtilis
AL 04 Hand dug well 2.0 x 10 Bacillus subtilis, Klebsiella spp, Escherichia coli, Aspergillus spp
EN 05 Borehole 13.33 x 10 Yersinia enterolitica, Salmonela spp.
EN 06 Borehole 49.17 x10 Staphylococcus spp., Clostridium xerosis, Mucor
EN 07 Lake 26.67 x 10 Staphylococcus aureus, Bacillus subtilis
EN 08 Lake 66.67 x 10 Salmonella spp, Bacillus subtilis, Clostribium xerosis
EN 09 Borehole 41.66 x 10 Bacillus subtilis, Pseudomonas aeruginosa, Escherichia coli
EN 010 Lake 58.33 x 10 Escherichia coli, shigella spp, Bacillus subtilis, Morganella morgenii
AA 011 Hand dug well 7.5 x 10 Bacillus subtilis, staphylococcus spp, Clostridium xerosis
EN 012 Lake 58.33 x 10 Shigella spp, Escherichia coli, Morganella morgenii, Aspergillus spp.
EN 013 River 58.33 x 10 Bacillus subtilis, Clostridium renale
Pollution and contamination of both surface water and groundwater has been known as a major
problem in the area. Infectious diseases caused by pathogenic bacteria, protozoa and helminthes
are the most common and widespread health risk associated with drinking contaminated water in
these area. This has resulted to the prevalence of water borne diseases such as guinea worm,
cholera, diarrhea etc. as a result of the use of surface water for all purposes including drinking
water. Most water pollutants are carried by surface runoff into streams, lakes and rivers. The most
likely source of the pathogens in surface water bodies is human or animal waste. The greatest risk
from microbes in water is associated with consumption of water that is contaminated with human
and animal excreta. In addition to feacally borne pathogens, other microbial hazards (e.g. guinea
worm (dracunlus medinensis), toxic cyanobacteria and legionella have been common in the area.
Legionella bacteria are ubiquitous in the environment and can proliferate at the higher
temperatures experienced at times when the ponds begin to dry up. Waterborne bacterial
pathogen such as Legionella can grow in water and soil.
For the inhabitants of these area who get water from streams, lakes and rivers, populations of
certain microorganisms detected on the water samples can present a health hazard even for non-
drinking purposes such as fishing, irrigation, swimming and domestic uses. These conditions may
also impact wildlife which uses the water for drinking or as a habitat. Pathogens can produce
water-borne diseases in either human or animal hosts.
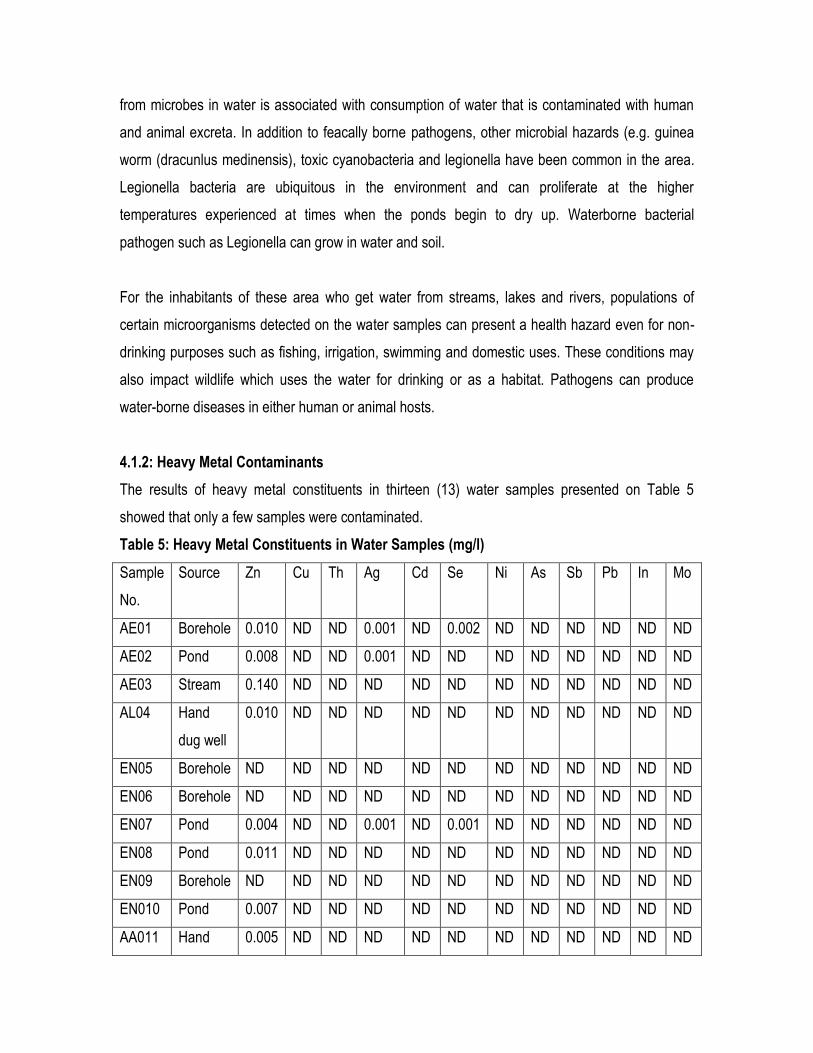
4.1.2: Heavy Metal Contaminants
The results of heavy metal constituents in thirteen (13) water samples presented on Table 5
showed that only a few samples were contaminated.
Table 5: Heavy Metal Constituents in Water Samples (mg/l)
Sample
No.
Source Zn Cu Th Ag Cd Se Ni As Sb Pb In Mo
AE01 Borehole 0.010 ND ND 0.001 ND 0.002 ND ND ND ND ND ND
AE02 Pond 0.008 ND ND 0.001 ND ND ND ND ND ND ND ND
AE03 Stream 0.140 ND ND ND ND ND ND ND ND ND ND ND
AL04 Hand
dug well
0.010 ND ND ND ND ND ND ND ND ND ND ND
EN05 Borehole ND ND ND ND ND ND ND ND ND ND ND ND
EN06 Borehole ND ND ND ND ND ND ND ND ND ND ND ND
EN07 Pond 0.004 ND ND 0.001 ND 0.001 ND ND ND ND ND ND
EN08 Pond 0.011 ND ND ND ND ND ND ND ND ND ND ND
EN09 Borehole ND ND ND ND ND ND ND ND ND ND ND ND
EN010 Pond 0.007 ND ND ND ND ND ND ND ND ND ND ND
AA011 Hand 0.005 ND ND ND ND ND ND ND ND ND ND ND

dug well
EN012 Pond ND ND ND ND ND ND ND ND ND ND ND ND
EN013 Ebonyi
River
0.018 ND ND 0.001 ND ND ND ND ND ND ND ND
ND= Not Detected
The samples used as control were collected from different point sources as well as varying
distances from the mining sites. These samples include AA 011, EN 06, AL 04, and EN 010. The
analysis revealed that most of the water samples contained low levels of zinc. However, a few
water samples from ponds and boreholes contain insignificant levels of zinc, selenium and silver,
especially samples AE 01 and AE 02. Most of these heavy metals were found at low
concentrations, which do not exceed the WHO drinking water standards. Samples AE 01 and AE
02 are 100m apart and situated about 300m and 400m away from Ameri mine site. These samples
contain the highest number of heavy metals such as zinc, silver and selenium. The stream water
situated about 200m away from the same lead-zinc mine site contained the highest concentrations
of dissolved zinc. Other metals such as aluminum, chromium, copper, iron, manganese, mercury
and nickel were not detected. The contaminated water sources are not considered toxic to most
aquatic life. However, the levels for these metals in water may increase if drastic measures are not
taken to prevent their release from mine sites into the environment.
4.2: Geo-Chemical Results
4.2.1: Soil Samples
The results of the laboratory analyses of soil samples collected from various locations at different
distances from the mining sites or waste rock dump sites are presented on Table 6.
Table 6: Chemical Composition of Soil Samples, parameters ( in %)
S.n Sample AL2 O3 SiO2 SO3 K2O CaO Cr2O3 MnO Fe2O3 NiO CuO ZnO As2O3 SeO2 MoO3 Ag2O CdO In2O3 Sb2O3 PbO TeO2 Total Wt.%
1. AA 01a 16.01 60.03 ND 1.83 0.22 0.05 0.37 14.74 0.01 0.06 0.03 ND ND ND ND ND ND ND ND ND 93.35
2. AA 01 b 18.00 61.80 ND 2.03 0.20 0.05 0.27 15.11 0.01 0.06 0.03 ND ND ND ND ND ND ND ND ND 97.56
3. AA 01 c 15.98 62.85 ND 1.84 0.20 0.05 0.23 13.50 0.01 0.06 0.02 ND ND ND ND ND ND ND ND ND 94.74
4. AA 02 a 13.21 64.30 0.20 1.34 0.34 0.06 0.14 16.14 0.01 0.06 0.02 ND ND ND ND ND ND ND 0.7 ND 95.89
5. AA 02 b 17.00 42.00 ND 2.20 0.40 0.09 0.22 35.50 0.01 0.06 0.03 ND ND ND ND ND ND ND ND ND 97.51
6. AA 02 c 16.67 39.00 ND 2.10 0.43 0.11 0.17 38.58 ND 0.07 0.03 ND ND ND ND ND ND ND ND ND 97.16
7. AA 02 d 14.87 30.86 ND 1.60 0.25 0.13 0.14 50.13 ND 0.06 0.02 ND ND ND ND ND ND ND ND ND 98.06
8. AEA03 a 14.00 31.80 0.11 2.02 33.20 0.05 0.33 13.30 0.01 0.07 0.01 ND ND 0.02 ND ND ND ND ND ND 94.92
9. AA 03b 17.30 37.52 ND 2.54 14.70 0.07 0.66 20.31 0.01 0.07 0.02 ND ND ND ND ND ND ND ND ND 93.20
10. EN 04 17.00 40.30 ND 1.97 0.35 0.09 0.11 34.19 ND 0.06 0.02 ND ND ND ND ND ND ND ND ND 94.09
11. EN 05 18.97 49.10 ND 1.89 0.30 0.09 0.14 26.84 ND 0.08 0.02 ND ND ND ND ND ND ND ND ND 97.43

12. EN 06 15.34 40.11 ND 1.48 0.18 0.11 0.05 36.96 ND 0.07 0.02 ND ND ND ND ND ND ND ND ND 94.32
13. EN 07 12.00 38.62 ND 1.10 0.30 0.11 0.11 43.26 0.01 0.06 0.02 ND ND ND ND ND ND ND ND ND 95.59
14. EN 08 13.86 39.00 ND 1.30 0.34 0.12 0.19 42.90 ND 0.07 0.02 ND ND ND ND ND ND ND 0.24 ND 97.94
15. EN 09 14.85 55.23 ND 1.53 0.25 0.08 0.07 23.46 ND 0.07 0.02 ND ND ND ND ND ND ND ND ND 95.56
16. AE 010a 16.87 45.98 4.80 4.17 0.82 0.06 0.98 16.70 0.01 0.05 4.11 ND ND ND ND ND ND ND 2.51 ND 97.06
17. AE 010 b 18.12 53.20 2.20 4.09 1.33 0.06 0.87 15.75 0.01 0.06 0.93 ND ND ND ND ND ND ND 0.20 ND 96.82
18. AE 010 c 12.00 66.80 0.23 1.59 0.40 0.04 0.14 11.50 0.01 0.06 0.14 ND ND ND ND ND ND ND 0.07 ND 92.98
19. AE 011 a 18.00 56.98 ND 4.50 0.48 0.05 0.44 12.32 0.01 0.05 0.51 ND ND ND ND ND ND ND 0.25 ND 93.59
20. AE 011 b 15.02 49.70 1.40 3.46 1.06 0.06 1.93 24.85 ND 0.06 0.58 ND ND ND ND ND ND ND ND ND 98.12
21. AE 011c 11.00 49.60 8.60 2.20 1.00 0.08 1.07 18.60 0.01 0.06 5.15 ND ND ND ND ND ND ND 1.68 ND 99.05
22. AE 011 d 12.00 56.10 1.30 3.25 0.90 0.05 0.04 18.48 ND 0.07 0.17 0.001 ND ND ND ND ND 0.23 1.05 ND 93.64
23. AE 011 e 22.01 50.30 ND 3.51 0.46 0.07 0.06 17.15 ND 0.06 0.22 0.001 ND ND ND ND ND 0.01 0.94 ND 94.79
24. AE 012 12.00 29.00 ND 0.70 0.19 0.13 0.09 56.46 ND 0.07 0.02 ND ND ND ND ND ND ND ND ND 98.66
25. EN 013 16.00 64.40 ND 2.20 0.58 0.06 0.11 14.00 0.01 0.06 0.02 ND ND ND ND ND ND ND 0.12 ND 97.56
26. EN 014a 21.67 50.98 ND 4.56 ND 0.07 0.22 16.89 0.01 0.06 0.04 ND ND ND ND ND ND 0.30 ND ND 94.80
27. EN 014 b 11.00 23.00 ND 1.50 0.26 0.13 0.55 49.48 ND 0.10 3.12 ND ND ND ND ND ND ND 9.56 ND 98.70
ND = Not Detected
NB: = LOI and other trace elements not included in this result.
Out of the seventeen (17) soil samples which were analyzed, four (4) were used as control
samples. These samples include AA 02d, EN 07, AE 012 and EN 013. The results show that all
along the river and stream banks, concentrations of zinc are quite low averaging 0.02% while lead
was not detected in most samples except in samples AA 02a (0.7%), EN 08 (0.24%) and EN 013
(0.12%). Nickel (0.01%) is present in almost all the samples while molybdenum was detected in
only one sample (AA 03a) with the value of 0.02%. The soil samples (AE 010c and AE 011e),
which were collected from a farmland close to the waste rock dumps at Ameri have the highest
concentrations of lead and arsenic, which are present at 1.9% and 0.8% respectively. For lead and
zinc, there is a clear pattern with the highest levels detected close to the waste rock dumps and
zero lead in other soil samples, especially the control samples. The zero lead could be attributed to
the fact that lead is less-mobile being mainly bound in silicates. It would also appear that waste
rocks are not being transported with the rivers or streams.
4.2.2: Mine-Pit Samples
There were six different samples collected at 5ft depth intervals within a mine pit. The results of the
analyses of these samples are presented on Table 7.
Table 7: Chemical Composition of Mine–pit Sediments (values in %)
Depth
(pit)
PbO ZnO CuO Fe2O3 CdO NiO Ag2O CaO MnO SO3 As2O3 Sb2O Cr2 O3 K2O
Zero ft 0.87 0.14 0.06 11.50 - 0.01 - 0.40 0.04 0.23 - - 0.04 1.59

5ft 0.94 0.22 0.06 17.15 ND ND ND 0.46 0.06 ND 0.001 0.01 0.07 3.51
10ft 1.05 0.17 0.07 18.48 ND ND ND 0.90 0.04 1.30 0.001 0.23 0.05 3.25
15ft 1.68 5.15 0.06 18.60 ND 0.01 ND 1.00 1.07 8.60 ND ND 0.08 2.20
20ft ND 0.58 0.06 24.85 ND ND - 1.06 1.93 1.40 ND ND 0.06 3.46
25ft 0.25
0.57 0.05 12.32 ND 0.01 - 0.48 0.44 ND ND ND 0.05 4.50
In almost all cases, the lead and zinc concentrations increase with depth towards the shale deposit
hosting the lead-zinc ores, which occurred between 20-25 ft. Although there are large variations
from one depth to another in samples taken from the same mine pit, the increasing order of high
lead and zinc concentrations in the middle, and upper (most recent ) sediments respectively,
indicate that significant amounts of lead and zinc have accumulated in the soil. Also, the iron and
manganese level decreases towards the upper soil layer.
4.2.3: Mine Waste Rocks
The results of the analyses of the waste rocks samples collected from different mine sites at Ameri
and Enyigba are presented on Tables 8 and 9. Each concentration value is an average of three
close determinations.
Table 8: Chemical Composition of Ameri waste Rock Composites
Sample
No.
PbO ZnO CuO Fe203 NiO Ag2O CaO K20 MnO SO3 CdO Cr2O3 Sb2O3
AE010a 2.51 4.11 0.05 16..70 0.01 ND 0.82 4.17 0.98 4.80 ND 0.06 ND
AE010b 0.20 0.93 0.06 15.75 0.01 ND 1.33 4.09 0.87 2.20 ND 0.06 ND
The results show lead concentration of 2.51%, zinc concentration of 4.11% as well as high sulphur
oxide content. The copper concentration in the waste rock is 0.05-0.06% while nickel concentration
is 0.01%.
Table 9: Chemical Composition of Enyigba waste rock composite
Sample PbO ZnO CuO Fe2O3 Co NiO Ag2O CaO K2O MnO So3 CdO Cr2o3 Sb2O3

ENO14
a
ND 0.04 0.06 16.89 - 0.01 ND ND 4.56 0.22 ND ND 0.07 0.30
ENO14
b
9.56 3.12 0.10 49.46 - ND ND 0.26 1.50 0.55 ND ND 0.13 ND
There were two different types of waste rocks which were distinct in terms of colour. The lead
concentration in sample B (dark coloured) showed high concentration of lead (9.56%) and zinc
(3.12%) as well as high iron (Fe) content. Lead was not detected in sample A (brown coloured) and
zinc concentration was also low. However, nickel and antimony were detected in the brown
coloured sample at 0.01% and 0.30% respectively.
CHAPTER FIVE
5.0 IMPLICATIONS OF THE RESULTS AND ENVIRONMENTAL/HEALTH
CONCERNS IN ENYIGBA
5.1 Implications of the Hydro-Chemical Results
The results of the analysis carried out showed that diseases related to contamination of water are
likely to constitute a major burden on human health in the area. In the past, epidemics of water-
borne diseases have killed many people in the area. Indeed a great majority of evident water–
related health problems in the area are the result of microbial (bacteriological and other biological)

contamination. One of the pathogenic organisms detected in many water samples is Escherichia, a
species of E. coli bacteria, which is responsible for human illnesses and death. For example,
water-borne diseases such as cholera, dysentery and typhoid are prevalent in the area as many
people including children were said to have lost their lives as a result of these diseases. The old
and very young are most vulnerable to the ravages of these diseases. The epidemics have been
largely eliminated in some communities by provision of borehole. Unfortunately, this is not the
case in other communities where there is no borehole, and every year several people, particularly,
children are exposed to these diseases.
On the other hand, results showed that heavy metal contamination of surface and groundwater
resources as a result of lead-zinc mining activities in the area is presently insignificant. The metal
concentrations in most of these waters are not toxic to aquatic life and do not exceed the maximum
levels allowed for safe drinking water. Thus, these waters are not yet potential hazards to wildlife
and residents. Nevertheless, an appreciable number of serious health concerns may occur as a
result of the heavy metal contamination of water. The lead –zinc mining activities are widely spread
in human settlements within the area and mine waste rocks are not properly disposed but are
rather abandoned on the upper layer of the soil. Since these mining units are concentrated within
the community settlements, they constitute a significant source of pollution. Through surface
runoff, this can lead to significant pollution of surface water and through soil contamination,
groundwater and crops will be adversely affected. A number of heavy metals associated with the
lead-zinc mining can reach water sources as a consequence of rainwater infiltration.
5.2 Implications of the Soil Geochemical Results
One of the major environmental impacts of lead/zinc mining is the rapid weathering of soil within
the area. This is as a result of dewatering of the mines which has led to lowering of the water table.
Heavy-metal concentrations in soil samples were found to be variable throughout the soil sample
locations. The results indicated that the concentrations were dependent on varying distances from
the source (mine). Some of the highest heavy metal levels in the soil were found at the vicinity of
the mine stretching to distances up to about half a kilometer from the mine sites. Within this
distance, high concentrations of lead, zinc and arsenic were detected. The source of these metals
is probably the dust and small particles of the metals generated as women labourers physically
separate the lead-zinc metals from host rock using hammers. Another source is the leaching of the
metals from dumps of mine waste rocks, which showed high concentrations of heavy metals such
as lead, zinc, copper, nickel and antimony. These heavy metals degrade the soils and render them
incapable of providing habitat for soil organisms, to grow plants that are safe to eat, or to safely
recharge surface water and groundwater.
5.3 Environmental/Health Concerns
The environmental/health concerns arising from the mining activities include the generation of
extraction wastes (waste rocks and mine water), mine pits, and human exposure to inhalation of
dust from contaminated mine tailings, ingestion of contaminated groundwater, ingestion of home-
grown produce by nearby residents and direct ingestion of contaminated surface soils by children.
5.3.1 Extraction Wastes
Large volumes of overburden and waste rocks constitute the extraction wastes that are disposed
off as waste dumps within the mining areas. Also disposed off as waste, is water pumped out of
the mines to keep the mine dry as mining progresses.
Mine Waste Rocks
The waste rock piles (plate 6) constitute heaps of mine waste which do not only reshape the
topography of the area but contain large quantities of minerals that are unstable in the weathering
environment. The waste rock piles are sources of acid mine drainage due to exposure of the
sulphide minerals to air and water. During exposure, oxidation of metal sulphides (often pyrites,
FeS2) within the mine waste rocks generates acid water. This acid water continues to be produced
as long as rain falls on the waste rocks, whether the mine is still operating or not. The acids (weak
carbonic and sulphuric acids) accelerate attacks on many minerals contained in the waste rock,
including clays and colloidal organic matter which in turn adsorb hydrogen ions and continue the
formation of more acids. The acids in turn continue to leach other metals such as copper, zinc,

cadmium, nickel, arsenic, lead and mercury, from the waste rocks. High concentrations of these
metals dissolved by the acids are carried in solution. As the acid solution flows away from the
mine, the pH changes affecting the chemistry of the solution such that different metals begin to
precipitate out of solution. The highly acidic discharges which drain into the waterways lead to the
pollution of the streams and rivers by acidification thus producing drastic pH shifts of the aquatic
environment. When the discharges are on soils as opposed to waterways, they acidify the soil
resulting to stunted growth in crops and plants and causing poor yield in terms of agriculture.
According to Gray (1997), acid mine drainage affects the geo-environment, and especially aquatic
systems in various ways. Soil systems are affected by increased acidity, with a corresponding
lowering of soil pH. Plate 7 shows acid mine drainage on the abandoned waste rock piles in one
of the mine sites. The acid water seeping from the mine waste rocks is contaminated by heavy
metals.
Mine Water
Mine water constitutes the water which is pumped out of the mine to keep the mine dry and allow
the miners access to the ore body for extraction. The source of water in the mine is by groundwater
seepage through fractures within the shale deposits. In most of the mines, the water is saline and
it is disposed off as waste into farmlands (plate 8). The quantity and chemical composition of the
mine water generated at the mines vary from one site to another. The chemical characteristics of
mine water from three selected mine pits are presented in Table 10.
Table 10: Composition of mine water from selected lead-zinc mines in Ameri
Parameter Concentration (mg/l)
Mine 1 Mine 2 Mine 3
pH 6.30 5.90 6.70
Salinity 5.60 5.40 5.80
Total
Hardness
22.40 21.60 23.20
Chlorides 8.62 7.96 9.28
Carbonate 1.20 1.09 1.31
Sulphate 634 596 672

Manganese 7.20 6.50 7.90
Lead BD BD BD
Arsenic 0.62 0.66 0.58
Calcium 68..30 67.40 69.20
Magnesium 240 234 246
Cadmium BD BD BD
Iron 3.48 3.62 3.34
Nickel 0.10 0.10 0.10
Sodium 6.20 6.01 6.40
Potassium 5.42 5.18 5.66
Note: Each concentration value is a mean of three close determinations.
B.D: Below detection limit of the technique used.
The table shows that the saline water carries significant quantities of soluble salts which are
primarily chlorides and sulphates of calcium, magnesium, sodium and potassium. These saline
waters eventually develop into salt accumulations as a result of precipitation and evaporation.
Some of the precipitated salts eventually get washed down by rainwater while some remain on the
upper soil layers. The overall effect of this salt accumulation is a drastic change of the pH of the
soil from acidic to alkaline, a situation that ultimately affects crops depending on the type of crop
cultivated on the soil. Plate 9 shows accumulation of salt crystals on soil within the study area, a
situation that has resulted in the destruction of farmlands.
Such destruction is exemplified by a sweet potato farm located at Ameri. The sweet potato farm
was a disposal site for mine water from several mines. Sweet potato thrives at pH 4.5-5.5 and
requires a considerable amount of iron and manganese, which are abundantly available only at low
pH values. This acid-loving plant therefore becomes deficient in iron when the soil pH is increased
(usually above pH 5.5). Soil samples were collected from the farm as well as from controlled sites
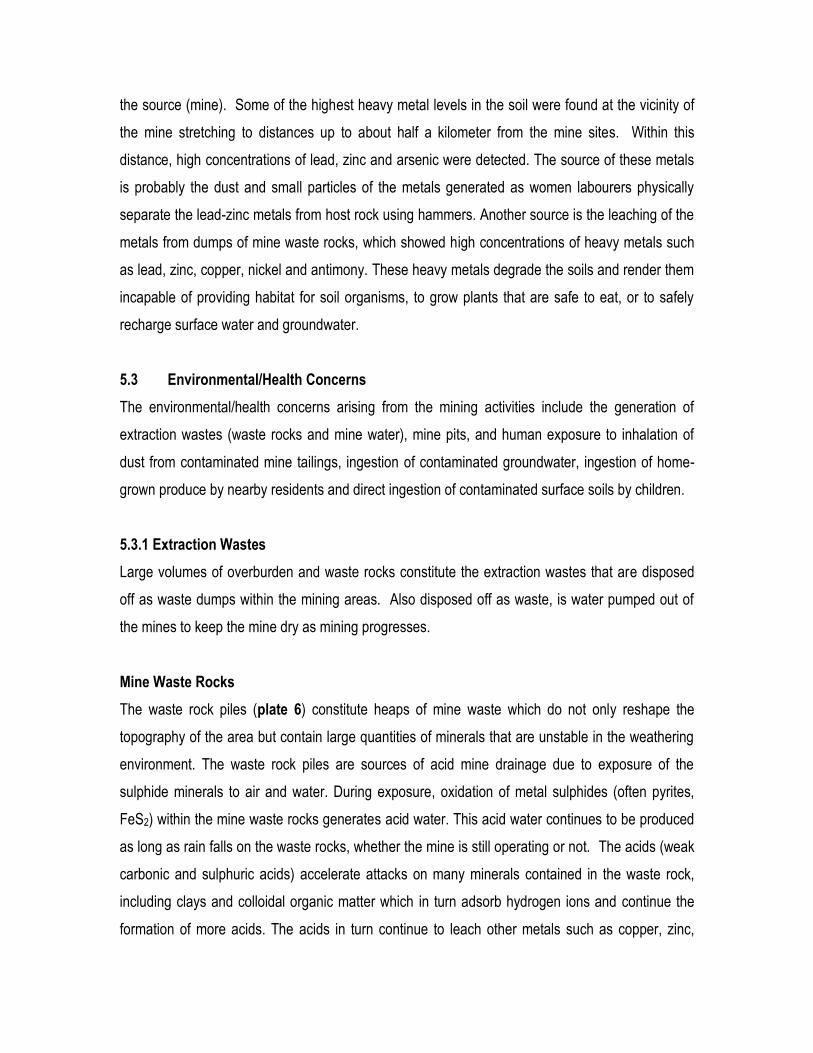
and analyzed in the laboratory. Table 11 shows the results of the analysis.
Table 11: Chemical constituents of soils collected from farmland compared with control
samples.
Sample
No.
Soil
pH
Al2O3 SiO2 SO3 K2O CaO Cr2O3 MnO Fe2O3 NiO CuO ZnO As2O3 Sb2O3 PbO Total
Wt.
%
AE
010c
8.92 12.00 66.80 0.23 1.59 0.40 0.04 0.14 11.50 0.01 0.06 0.14 ND ND 0.07 92.98
AE
011e
8.20 22.01 50.30 ND 3.51 0.46 0.07 0.06 17.15 ND 0.06 0.22 0.01 0.01 0.94 94.79
AA 02d 5.8 14.87 30.86 ND 1.60 0.25 0.13 0.14 50.13 ND 0.06 0.03 ND ND ND 97.16
EN 07 6.0 12.00 38.62 ND 1.10 0.30 0.11 0.11 43.28 0.01 0.06 0.02 ND ND ND 95.59
AE 012 5.1 12.00 29.00 ND 0.70 0.19 0.13 0.19 56.46 ND 0.07 0.02 ND ND ND 98.66
Samples AE 010c and AE 011e were collected from the farm while samples AA 02d, EN 07 and
AE 012 were collected from non-disposal sites and were used as control. Iron (Fe) and
manganese (Mn) are two major micronutrients needed for the growth of sweet potato. At low pH
values, the solubility of these micronutrients is relatively high and as the pH increases, their
solubility and availability to plants decrease. From the result in the table, these micronutrients are
most soluble and available under acid (low pH) conditions. Iron and manganese that are freely
available in acid soils are sparingly available in the alkaline soils, leading to deficiencies of these
elements in plants. According to Brandy et.,al. (1999), if the pH and the percentage base
saturation are not low enough, acid-loving plants will show chlorosis (yellowing of the leaves) and
other symptoms indicative of iron deficiency. Symptoms of nutrient deficiency, especially on fresh
leaves of the sweet potato plants were very evident (chlorotic foliage) as shown on Plate 10. The
introduction of saline water into the farmland had increased the salinity of the soil with a
corresponding increase on soil pH and has made these elements to become less available in the
soil thereby causing the deficiencies of the nutrient elements in the plants. The saline water shown
on Table 10 contains sufficient concentration of the chloride and sulphate salts to interfere with the
growth of many plants. Plate 11 shows unaffected sweet potato plants, which were further away
from the mine sites. The verification visit to the mines two months later (in June), showed that the
nutrient-deficient sweet potato plants had completely withered (Plate 12). Some of the heaps were
dug to examine the potato roots and the result was brown rotten potatoes which could not survive
the effects of saline water.
5.3.2 Mine Pits

In addition to wastes generated during active mining operations, the pits created by the miners at
the end of the mining operation become filled with water (Plate 13). This remains so as there is no
longer a need for dewatering. Plate 14 shows a 30ft mine pit which was completely filled with water
after the mines were abandoned. Water sample (AE 014) was collected from the abandoned mine
pit, while sample AE 015 was taken from a pond (not mine pit) very close to the mine. The samples
were analysed using computer-controlled atomic spectrophotometer (AAS) 969 Solar. The
chemical characteristics of these water samples are presented in Table 12.
Table 12: Chemical Composition of Water Samples from Abandoned Mine Pit
PARAMETER CONCENTRATION
AE014 AE015
pH 4.09 6.88
Salinity, g/l 1.40 0.60
Total hardness, mg/l 14.7 82.3
Chlorides, mg/l 5.67 0.567
Carbonate, mg/l B.D 48.7
Sulphate, mg/l 525 26.7
Manganese, mg/l 6.80 BD
Lead, mg/l BD BD
Arsenic, mg/l 3.65 1.96
Calcium, mg/l 52.4 11.8
Magnesium, mg/l 160 152
Cadmium, mg/l BD BD
Iron, mg/l 0.820 1.60
Nickel, mg/l 0.368 0.350
Sodium, mg/L 4.20 5.30
Potassium, mg/L 3.17 4.23
Note: Each concentration value is a mean of three close determinations.
B.D: Below detection limit of the technique used.
The results show that the average concentration of calcium, sodium, magnesium, sulphate,
potassium, and chloride ions was higher in water samples from the mine pit when compared to the

concentration of these salts in the pond water further away from the mine. The water from the mine
pool gave pH of 4.09 indicating that the water has become acidic. This acidity could lead to the
mobilization of metals and other constituents in the remaining ore body exposed by mining at the
base of the pits. This is evident by the concentration of arsenic, nickel and manganese in the mine
pit water. When this water comes in contact with surface run-off, contamination of surface water
becomes inevitable. The heavy metal contaminants developed from the mines and which become
dissolved or suspended in the run-off can change the water chemistry and affect ecosystems of
water bodies such as ponds, streams, rivers, and lakes. Surface water used as potable water
supply as it is in certain communities within the study area, puts the health status of the inhabitants
in jeopardy.
Contamination of soil also occurs from discharges, leachate and seepage from these mine pits.
The soils become enriched with certain substances found in the waste materials, particularly heavy
metals such as nickel, copper, zinc and arsenic. The contaminated soil eventually also acts as a
source of pollution to groundwater and surface water.
5.3.3: Human Exposure
The contaminants of concern with respect to human exposure to the mine wastes include
arsenic, cadmium, and lead. The exposure pathways for these metals in humans include:
inhalation of mine tailings dust, ingestion of contaminated groundwater, ingestion of home-
grown produce by nearby residents and direct ingestion of contaminated surface soils by
children.
The primary source of air contamination at the mine sites is dust from the dry surfaces of the waste
rock during mining. The ingestion of heavy metal contaminated groundwater as well as farm
produce grown on contaminated soils constitutes serious human health risk. Of great concern is
the exposure of children who are engaged in the lead-zinc mining activities (Plate 15).
Unfortunately, both the children and their parents are ignorant of the consequences of their
exposure to lead and other heavy metals. Most women who work at the mines bring their children
and infants to play around the mine area, making them vulnerable to toxic metal poisoning,
especially lead. Some of these children are babies under the age of one who are left to crawl on
bare ground and consumption of contaminated soil is a likely exposure for these very young
children. Lead is largely unavailable for plants, but may be harmful to children who consume Pb-
rich soils. Exposure to lead poses a serious threat to these children whose neurological systems
are still developing. Botkin and Keller (1997) established that the developing brain and intelligent
quotient (IQ) of children are especially vulnerable to toxic metals, especially lead. More recently, it
has been suggested that lead pollution especially in mining areas can also cause social problems.
In one study, children with above average lead concentrations in their bones were found to be
more likely to have attention deficit disorder or delinquency problems and to exhibit aggressive
behaviour than were children with lower lead concentrations (Needleman, et.al., 1996). According
to him, children with above-average concentration of lead in their bones are associated with an
increased risk for aggressive behaviour, and delinquency, which may be difficult to manage. Such
children eventually have difficulties in learning at school and exhibit behavioural problems. On the
basis of this finding, some part of the crime rate and aggressive behaviour of children in mining
areas may be attributed to environmental pollution as well as to socioeconomic conditions (Keller,
2005).
CHAPTER SIX
6.0 CONCLUSIONS AND RECOMMENDATIONS 6.1: Conclusions The following conclusions are drawn from this study:

The dominant soil-forming process in the study area is by shale weathering and the area is
mostly covered with clay soil and silt. With respect to soil type and organic content, clay-
rich soils generally have a higher retention capacity than soils with little or no clay (e.g.
soils composed primarily of sand). According to Keller (2005), soils, particularly those with
clay particles, can act to selectively attract, absorb, or bind toxins and other materials that
otherwise would contaminate the environment. Since the study area generally has clay-
rich soils, heavy metals leached into the soil will have high adsorption.
Soil pH greatly affects numerous soil chemical reactions and processes and it is extremely
important in determining the mobility of an element in the weathering environment.
Through the introduction of saline water, the natural soil pH buffering system of the soil is
depleted and the salinisation of soils increases. An increase in soluble metals occurs with
a corresponding increase in metal mobility. Certain metallic elements such as arsenic (As)
would have a higher retention capacity in the soil, while others will become less mobile e.g.
Fe, Mn and Zn.
Lead-zinc ore deposits at Enyigba are sulphide-rich and literature review shows that one of
its gangue minerals is pyrite. The mine waste rock piles abandoned at the mine sites have
shown that acidic leachate is produced from oxidation of the sulphides and other minerals
present in the waste rocks. The acidic leachate produced in the mine waste rocks is rich in
heavy metals which can affect the underlying soils of the area as they infiltrate through the
soil medium. The presence of arsenic (As) and antimony (Sb) concentrations in the waste
rocks and soils suggest that As and Sb are priority pollutants from mining activities within
the area.
During operation of the mines, sub-surface areas were kept dry by pumping out
groundwater that was constantly seeping in. After mining stopped, the mine-pits flooded
and overflowed. The seepage from these mine pits is acidic and contains hazardous
substances. Once such waters with high concentration of sulphuric acid and dissolved
metals migrate away from the mining area, they can pollute surface and groundwater
resources. If the acid-rich water runs into a natural stream or lake, significant ecological
damage may result because the acid water is extremely toxic to plants and animals in
aquatic environment.
The quantities of heavy metals detected in ground and surface waters within the study
area were quite below the WHO regulatory limits. If effective measures are not taken to
prevent pollution, the water quality may gradually deteriorate to the point of putting the
health of people, livestock and aquatic plants and animals in the area at serious risk. It is
evident that the abandoned mine-pits and waste rocks are gradually affecting the quality of
surface waters and/or groundwater through the production of acidic leachate.
Lead (Pb) is one of the most common toxic metals in the environment. It was detected in
waste rocks and soil samples within the mine areas. Lead toxicity is particularly a problem
for young children who are exposed to lead concentrations in the mines as they are more
susceptible to lead poisoning than the adults.
The lead-zinc mining activities in Enyigba are polluting the surrounding environment by
increasing the acidity, salinisation and heavy metal content of soils, sediments and surface
and groundwater bodies. The greatest threat posed by mining in Enyigba is the
uncontrolled release of acid mine drainage from abandoned waste rocks and mine-pits.
6.2 Recommendations
Based on the findings of the study, the following recommendations are made:
As the soil in the study area has not been degraded, it is important that the lead-
zinc mine wastes rocks overlying the soils be disposed in an environmental
friendly manner to prevent further contamination of the soils and the aquatic
environment. The waste rock piles should be used to cover the mine pits and
grass should be planted on the surface of the covered mine pits as well as in the
exposed alluvial soils to inhibit wind and water erosion.

For any serious mining to be carried out in Ameri, there must be a second project
which would involved processing of brine for salt production. In this way, adequate
measures would have been taken to ensure that the soil pH does not increase
thereby preventing the soil from heavy metal contamination.
The primary water pollution problem facing the inhabitants of the area is the lack of
clean drinking water that is free of disease-causing organisms or substances.
Effort should be made to improve access to safe drinking-water by provision of
boreholes within the communities and to achieve a drinking-water quality as safe
as practicable.
The use of children in the mines must be seriously discouraged to avoid long-term
effects in the future. It has been recently established that the occurrence of lead
poisoning or toxicity has cultural, political and sociological implications.
Consumption of soil by children and crops grown on soils with high metal
concentrations are the dominant pathways contributing to health risk.
There is need to carry out research on blood lead levels in children who have
worked in the mines because recent data indicate that there may be toxicological
effects of lead at lower levels of exposure than previously anticipated.
There is need for regular and periodic monitoring of soil surface and groundwater
quality in order to ensure that the standards of heavy metal constitutes as set by
WHO are not exceeded.
REFERENCES
Abimbola, A. F., Olatunji, A. S., and Odewande, A. A., 2003. Heavy metals contents of soils and
sediments in
five selected industrial estates in southwestern Nigeria. NMGS Conference paper, Itakpe.
Book of Abstract, pp. 36.
Akintola, O. F., Adekeye, J. D. I., and Akande, S. O. “Secondary geochemical dispersion of trace
elements in
soils in the Nasarawa pegmatite fields. NMGS Conference paper, Itakpe. Book of
Abstractl, pp. 37-38.
Aucamp, P. 2003. Trace-element pollution of soils by abandoned gold-mine tailings near
Potchefstroom,
South Africa. Bulletin 130 of Council of Geoscience.
Benkhelil, J., 1982. Benue Trough and Benue Chain. Geol. Mag., 119, pp. 155-168.
Benkhelil, J., 1987. Cretaceous deformation, magmatism and metamorphism in the lower Benue
Trough,
Nigeria. Geol. Jour., 22, pp. 467-493.
Benkhelil, J., 1989. The origin and evolution of the Cretaceous Benue Trough, Nigeria. Jour.
African Earth Sci.,
8, pp. 251-282.
Botkin, D. B. and Keller. E. A. 1997. Environmental Sciences: Earth as a living planet.. 2nd ed.
„Environmental
Health and Toxicology‟ pp. 286-306.
Boque, R. G. and Reynolds, R. R. 1952. Preliminary report on the lead-zinc deposits of Abakaliki
District,
Nigeria.
Brandy, C. N. and Weil, R. R. 1999. The nature and properties of soils (12th ed.) Prentice Hall, Inc.,
USA.
Burke, K. C. and Whiteman, A. J., 1973. Uplift, rifting and the breakup of Africa. In implications of
Continental
Drift to Earth Sciences (eds. Tarling, D. H. and Runcorn, S. K.). Academic Press, London,
pp. 735-755.
Burke, K. C., Dessauvagje, T. F. J. and Whiteman, A. J., 1970. Geological history of the Benue
Valley and
adjacent areas. In T. F. J. Dessauvagje and A. J. Whiteman (eds). Conf. African Geology,
University of
Ibadan, pp. 187-205.
Cratchley, C. R., and Jones, J. P., 1965. An interpretation of the geology and gravity anomalies of
the Benue
Valley, Nigeria. Overseas Geol. Surv., Geophys. Paper, 1, pp. 1-26.
Ezepue, M. C. 1979. Lead-zinc mineralization at Ishiagu, eastern Nigeria and the mineralogy and
geochemistry of dyke rocks from the Marangudzi, Ring Complex, Rhodesia. Ph. D. Thesis
presented to the Department of Geology, Faculty of Science, Manchester University, pp.
48-60.
Ezepue, M. C. 1984. The geologic setting of lead-zinc deposits at Ishiagu, southeastern, Nigeria.
Jour. African
Earth Sci., 2, pp. 87-101.
Farrington, J. C. 1952. A preliminary description of the Nigerian lead-zinc field. Bulletin Soc. Eco.
Geology.
Vol. 47, No. 6 pp. 583-608.
Grant, N. K. 1971. The South Atlantic, Benue Trough and Gulf of Guinea Cretaceous triple
junction. Geol. Soc.
Am. Bull. Vol. 82, pp.2295-2298.
Gray, N. F. 1997. Environmental impact and remediation of acid mine drainage: a management
problem.
Environmental Geology, 30, pp.62-71.
Ihenyen, A. E., and Aghimien, A. E., 2003. Study of trace heavy metal levels in soils and
vegetables from
Warri District, Southern Nigeria. NMGS Conf. paper, Itakpe. Book of Abstract, pp. 33.
Keller, E. A. 2005. Introduction to Environmental Geology. (3rd ed). Pearson Prentice Hall, New
Jersey, USA.
Kogbe, C. A. 1981. Major transgressive episodes in the Benue Valley of Nigeria. Earth Evolution
Sci., Vol. 2
pp.133-134.
Needleman, H. L., Riess, J. A., Tobin, M. J., Biesecker, G. E. and Greenhouse, J. B. 1996. Bone
lead levels
and delinquent behaviour. Journal of the American Medical Association, Vol.275, pp 363-
369.
Nwachukwu, S. O. 1972. The tectonic evolution of the southern portion of the Benue Trough,
Nigeria. Geol.
Mag. Vol. 109, pp. 411-419.
Nwachukwu, S. O. 1975. Temperatures of formation of vein minerals in the southern portion of
Benue Trough.
Jour. Min. Geol. Vol. 11, pp. 45-55.
Ogezi, A. E., Adiukwu-Brown, M. E., Alarm, M., 1985. Environmental and economic effects of trace
elements
associated with geological and human factors in parts of Plateau state, Nigeria. 21st
Annual Conference
of the Nigerian Mining Geosciences Society, Jos. Book of Abstract, pp.50.
Olade, M. A. 1975. Evolution of Nigeria‟s Benue Trough (Aulacogene) : A tectonic model. Geol.
Mag. 112,
pp. 575-581.
Olade, M. A. 1976. On the genesis of Pb-Zn deposits in Nigeria‟s Benue rift (Aulacogen) : A re-
interpretation.
Jour. Min. Geol. 13, pp. 20-27.
Olade, M. A. and Morton, R. O. 1985. Origin of lead-Zinc mineralization in the southern Benue
Trough ,
Nigeria. Fluid Inclusion and trace-elements studies. Mineral Deposits Vol. 20. pp. 76-80.
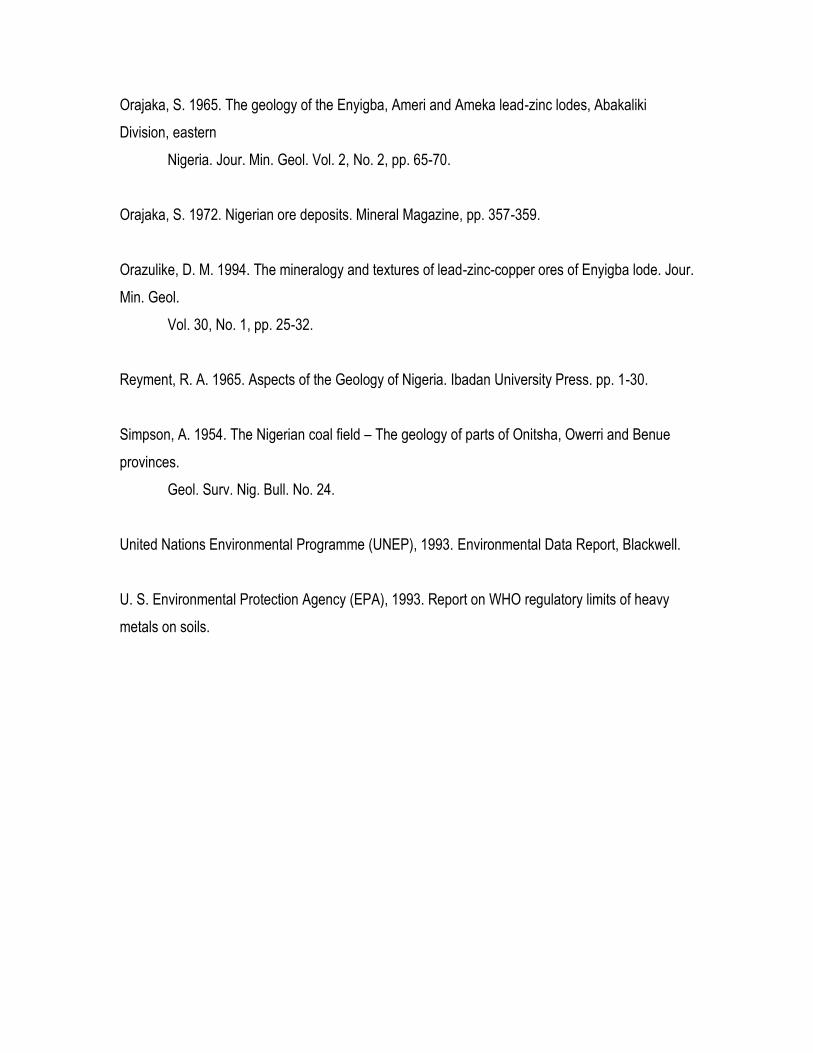
Orajaka, S. 1965. The geology of the Enyigba, Ameri and Ameka lead-zinc lodes, Abakaliki
Division, eastern
Nigeria. Jour. Min. Geol. Vol. 2, No. 2, pp. 65-70.
Orajaka, S. 1972. Nigerian ore deposits. Mineral Magazine, pp. 357-359.
Orazulike, D. M. 1994. The mineralogy and textures of lead-zinc-copper ores of Enyigba lode. Jour.
Min. Geol.
Vol. 30, No. 1, pp. 25-32.
Reyment, R. A. 1965. Aspects of the Geology of Nigeria. Ibadan University Press. pp. 1-30.
Simpson, A. 1954. The Nigerian coal field – The geology of parts of Onitsha, Owerri and Benue
provinces.
Geol. Surv. Nig. Bull. No. 24.
United Nations Environmental Programme (UNEP), 1993. Environmental Data Report, Blackwell.
U. S. Environmental Protection Agency (EPA), 1993. Report on WHO regulatory limits of heavy
metals on soils.

Plate 1: Highly weathered clay showing yellow colour

Plate 2: The largest pond within the study area
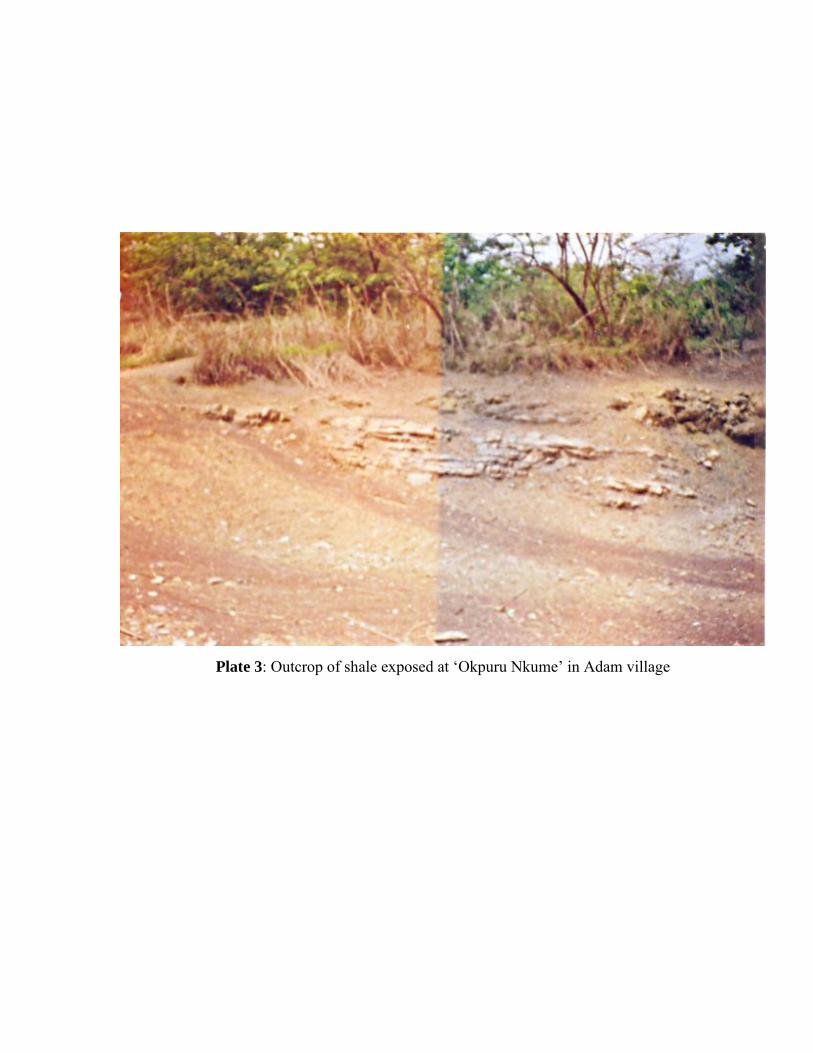
Plate 3: Outcrop of shale exposed at ‘Okpuru Nkume’ in Adam village

Plate 4: Overburden soil layers and underlying shale units exposed in a mine pit

Plate 5: Collection of soil sample at Akpara River bank
Plate 6: Mine waste rock piles in a mine site
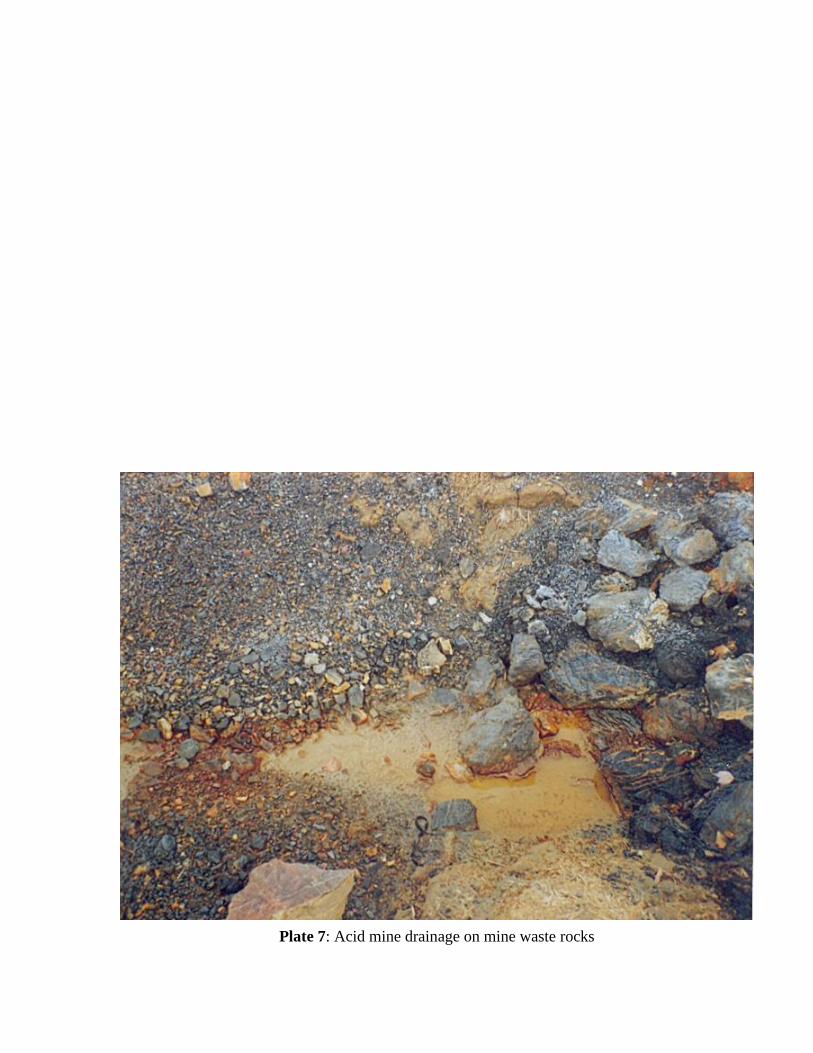
Plate 7: Acid mine drainage on mine waste rocks

Plate 8: Mine water being pumped into farmlands


Plate 9: Accumulation of salt crystals on soil
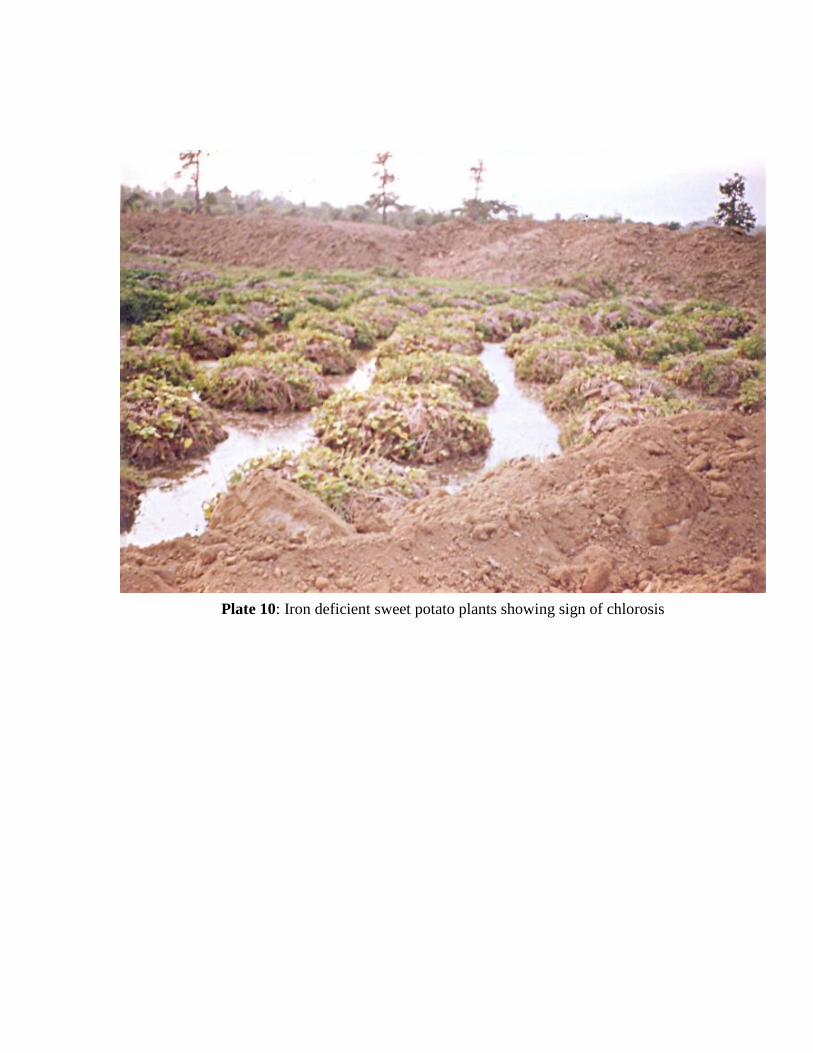
Plate 10: Iron deficient sweet potato plants showing sign of chlorosis
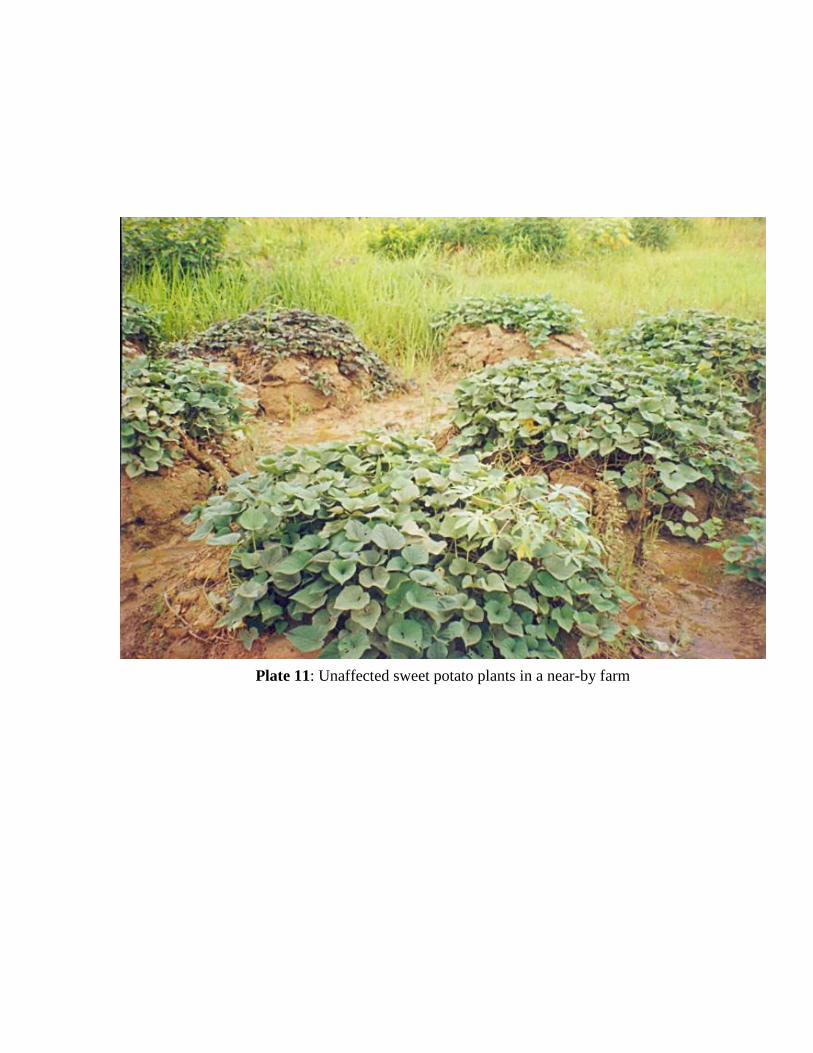
Plate 11: Unaffected sweet potato plants in a near-by farm

Plate 12: Heaps of withered sweet potato farm

Plate 13: Mine sites as erosion sites during rainy season
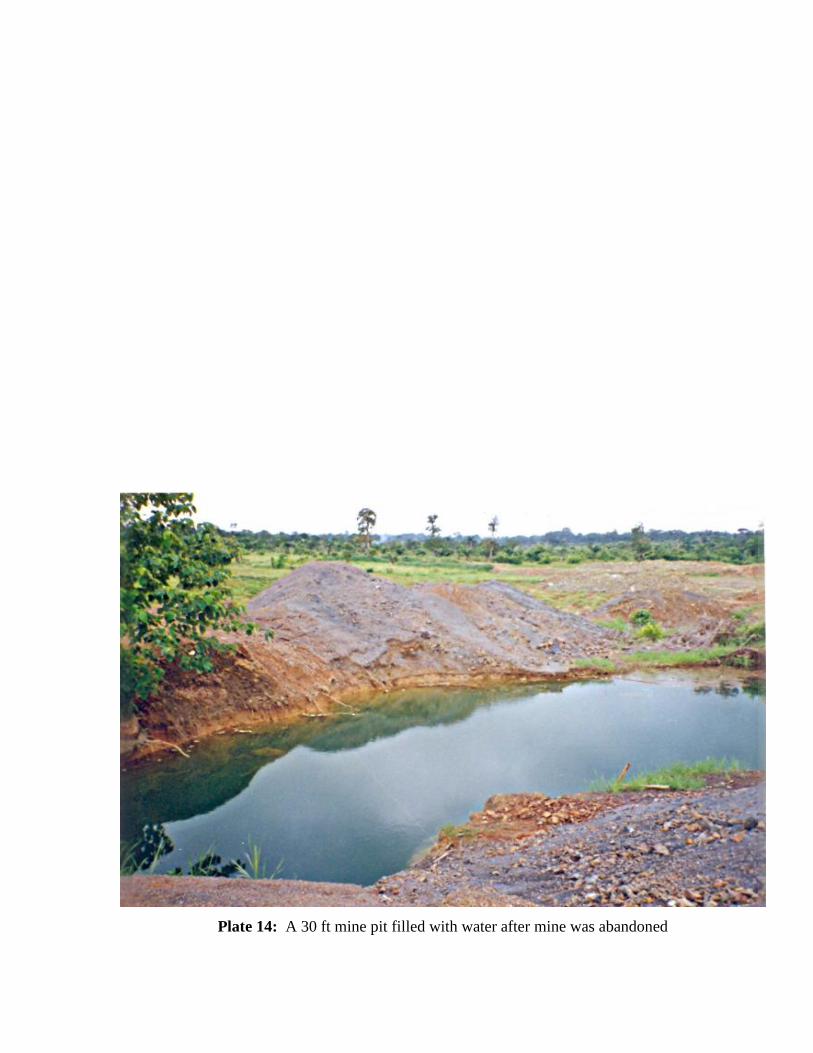
Plate 14: A 30 ft mine pit filled with water after mine was abandoned

