evaluation of heavy metal contamination in surface soil...
TRANSCRIPT

International Journal of ChemTech ResearchCODEN( USA): IJCRGG ISSN : 0974-4290Vol.4, No.3, pp 1229-1240, July-Sept 2012
Evaluation of Heavy Metal Contamination inSurface Soil around Industrial Area,
Tamil Nadu, India
B. Dheeba*, P. Sampathkumar
Department of Chemistry and Biosciences, Srinivasa Ramanujan Centre, SASTRAUniversity, Kumbakonam – 612001 INDIA.
*Corres.author: [email protected] and [email protected] : +91 - 94432 81398
Abstract: Impact of anthropogenic activities of man and his environment as a result of the growing rate ofindustrialisation in Tamilnadu, India is of a great concern. The objective of this research was to evaluate thephysical properties and heavy metal concentration of soil in different industrial areas. Soil samples werecollected from seven industries like welding, cement, steel, printing, textile, paint and tannery which releasesheavy metals to environment. Electrical Conductivity (EC), pH, Cation Exchange Capacity (CEC), OrganicMatter (OM), Organic Carbon (OC) and heavy metals viz. Cu, Mn, Cr, Pb, Zn and Fe were analysed. Excepttannery and steel industry all samples have alkaline pH. The maximum EC 6.41 dSm-1 was noticed in the soilsample collected from textile industry. The results showed that very high level of OC and OM were found in thesoil contaminated by printing industry. The soil samples contaminated with cement and printing industriespollutants showed high CEC 26.4 and 38.7 m.eq /100g of soil. Different metals were found to be in higher levelin different areas. High level of copper 28.9 ppm is noticed in sample collected from Tannery. The manganeselevel in increasing order is Textile < Cement < Steel < Painting < Tannery < Welding. The maximum level ofiron 46.6 ppm and zinc 13.6 ppm is noticed in sample collected near welding industry. The soil sample oftannery industry showed high level of chromium 32.5 ppm and lead 15.7 ppm. However, comparing theseconcentrations with those obtained from locations of industrial activity, relatively high levels of heavy metalswere recorded, with different industries. Considering all the heavy metals obtained at the study area, Zn, Pb andCr dominated in all the investigated zones of high industrial impact. This is attributed to the indiscriminatedisposal of industrial waste as well as anthropogenic point source contamination. The extremely high contentsof the heavy metals generally recorded at the study area are terribly alarming in terms of environmentalpollution. Therefore, the inhabitants (mostly children) and the numerous workers, who reside and work at suchpolluted environment, are at serious risk of heavy metal toxicity and awareness needs to be created as such.
Key words: soil pollution, industries, pH, CEC, EC, heavy metals.

B.Dheeba et al /Int.J.ChemTech Res.2012,4(3) 1230
Introduction
A substantial and unfortunate fact about industrialization and industrial production is generation and release oftoxic waste products. Although these wastes can be treated, reused and recycled still thousands of chemicals arereleased and find their way into the environment. Unfortunately, the inadequate information regarding wastetoxicity and post-disposal behaviour, poor planning, improper disposal and poor management of disposal sitesstimulates serious contamination problems at industrial and hazardous waste disposal sites. An example isseveral available reports about the genotoxicity of soils contaminated with chemicals originated from industrialsources [1]. Heavy metals are among these chemicals and constitute a main group of soil pollutants that theircontamination in environment affects all ecosystem components [2]. Although heavy metals are present asnatural components of soils, toxic contamination may frequently occurs at industrial and mining sites.[3] Heavymetals such as Cu, Zn, Mn and Fe are essential for plant growth, many of them do not have any significant rolein the plant physiology. The uptake of these heavy metals by plants is an avenue of their entry into the humanfood chain with harmful effects on health [4] Although the nutrient content of wastes makes them attractive asfertilizers, when untreated wastes are used in crop production, consumers risk to contact diseases like choleraand hepatitis, or to undergo heavy metal contamination [5].Soil samples are differed in their properties and in content of Cd, Co, Mn, Ni, and pH depending in climate soilorigin composition and human activities. In recent years, heavy metals in the soil have received attention asenvironmental contaminants because of their extended persistence, and toxicity to many organisms includingplants.[6] There are several problems dealing with heavy metals contaminated soils which effect human healthand environmental quality. The anthropogenic sources of the heavy metals, in soils are either primary sources,i.e. the heavy metals are added to the soil as an outcome of working the soil, such as fertilization or secondarysources where heavy metals are added to the soil as a consequence of a nearby activity, such as smelting oraerosal deposition.[7]. Even today, the most commonly used methods for heavy-metal pollution are still eitherthe extremely costly process of removal and burial or simply isolation of the polluted land. Contaminated sitesoften support some plant species, which are able to accumulate or tolerate high concentrations of metals such asPb and Zn [8]. A small number of species are capable of growing on soils containing high levels of metals, andalso accumulate these pollutants in high concentrations in the parts above ground. These plants are known ashyper accumulators [9] The present study aims to assess physical properties heavy metal contamination in soilsof the industrial area and to study their possible sources and potential health effects on human life, which canfurther enable medical investigations to be targeted.
Materials and Methods
Study Area: Soil samples were collected from sites chosen for their industrial activities at surface level (0–10cm in depth) and from 0 to 500m at 100m interval. Sampling was conducted at seven locations (Textile –Thirupur, Cement- Ariyalur, Steel - Salem, Printing - Sivakasi, Tannery - Dindigul, Welding - Karur) inTamilnadu. The study was conducted with the help of soil science department of Tamil Nadu AgriculturalUniversity, Coimbatore.
Heavy metal analysis: The collected soil samples were air-dried and sieved into coarse and fine fractions.Well-mixed samples of 2 g each were taken in 250 ml glass beakers and digested with 8 mL of aqua regia on asand bath for 2 hours. After evaporation to near dryness, the samples were dissolved with 10 mL of 2% nitricacid, filtered and then diluted to 50 mL with distilled water. Heavy metal concentrations of each fraction wasanalysed by Atomic Absorption Spectrophotometry using Model Spectra 200. [10,11].
Physical parameters: EC of the soil samples were determined from saturation extract by conductivity meter.Measurement of pH, Organic Matter and Organic Carbon of soil samples were done (soil and water ratio 1:25)by using the procedures outlined by Jackson [12] Walkley and Black [13]. Cation Exchange Capacity wasdetermined by the method of Thomas [14]. All chemicals were supplied from Merck (Germany) withappropriate purity grade, “for analysis” and de-ionized water was used through the experiments.

B.Dheeba et al /Int.J.ChemTech Res.2012,4(3) 1231
Results and Discussion
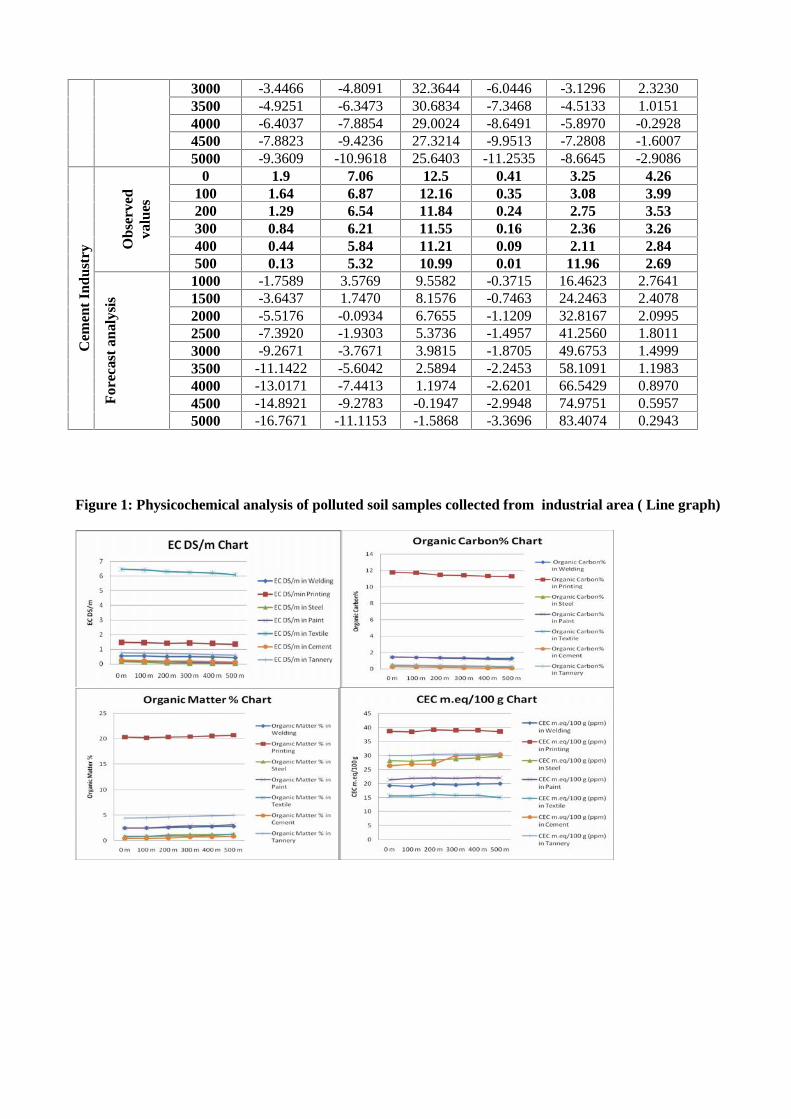
Physicochemical properties of soilThe soil samples were analyzed for various physicochemical properties and the data were furnished in
Table 1 and Fig 1. The values given in table from 500 to 5000m are based on forecast analysis from the actualdata belongs to 0 to 500m. The soils contaminated by steel and tannery industry effluent showed acidic soilreaction. ( 6.18 & 5.84 collected from Salem and Dindigul). Genrally during stripping process ( removing rustand scales) nitric, sulphuric and hydrochloric acids are used in electroplating industry. [15] This might be thereason for acidic pH of these soils. On the other hand, alkaline soil reaction was noticed in soils contaminatedby cement, textile and paint industry effluents and the values are 8.94, 8.92 & 8.52 respectively. This might beattributed to the addition of alkali metals like Na and earth metals like Ca & Mg in the discharge from theseindustries. Similar results have been reported[[16]. Soil pH is important because it influences the availabilityand plant uptake of micronutrients including heavy metals [17].The results obtained showed various EC valuesfor different samples. The highest EC value was noticed in textile industry soil (6.41dSm-1) which might be dueto higher salt concentration of effluents [15]. Other samples showed EC values in the range of 0.5 – 1.48 dSm-1
The salt rich dye effluents and sludge disposal on sampling sites are the possible reasons for highest soluble saltcontent in soil. Very high percentage of organic carbon (11.77%) and organic matter (20.29 %) was present inprinting industry soil due to the addition of high soluble organic matter trough sewage material [18] . Thelowest CEC was found in textile industry soil and (15.6m.eq/100g soil) and highest ( 38.7 m.eq/100g soil) insoil collected from printing industry. The CEC parameter particularly measures the ability of soils to allow foreasy exchange of cations between its surface and solution. The relatively low levels of silt, clay, OM and CECindicate the high permeability, hence leachability of heavy metals in the soil and suggest that it might beamenable to remediation by soil washing [19,20].
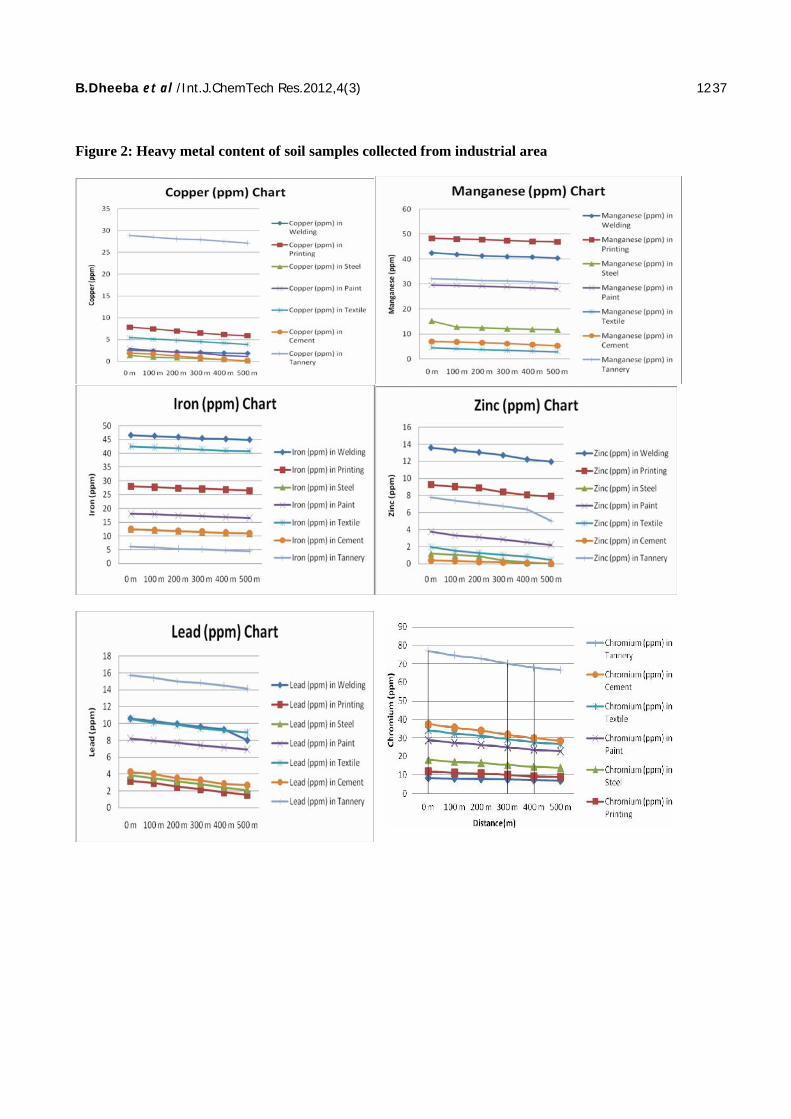
Total heavy metal content The levels of the metals in the soil at various sampling points are presented in Table 2, Fig 2.Chromiumlevels around the study area ranged from 3.25 – 32.5 ppm, and is considerably higher in the sample collectednear tannery. The normal range of Cr in soils is 100 mg/kg. Cr exists in two possible oxidation states in soils:the trivalent Cr (III) and hexavalent Cr (VI). Hexavalent Cr (VI) being mobile and extremely toxic is moreharmful than trivalent Cr (III). As the surrounding rocks are predominantly granite, where chromiumconcentration is always below 40 mg/kg. It is not possible to derive such high levels of Cr from rocks.Therefore, the source of Cr appears to be anthropogenic from some industries producing steel, textiles in thearea [21]. Very high Cr levels in soil, i.e. up to 1,220 mg/kg were found in some industrial areas of India.Chromium is an essential trace element required for the metabolism of lipids and proteins and to maintain anormal glucose tolerance factor. High doses of chromium cause liver and kidney damage and chromate dust isreported to be carcinogenic.The levels of copper and zinc in soil normally reflect the concentrations in the parent rocks. Like copper inigneous basaltic rocks (90 mg/kg) and soils from calcareous rocks normally have the higher levels of zinc.Copper is retained in soils through exchange and specific adsorption mechanisms. Zinc is readily adsorbed byclay minerals, carbonates. High concentrations of Zn and Cu was found to present in Welding (13.6 ppm) andTannery (28.9ppm) respectively. Also high doses of Copper and Zinc are said to be toxic and carcinogenic.Overdoses of copper may also lead to neurological complications, hypertension, liver and kidney dysfunctions.Higher contamination of zinc causes hematological disorders [23,24]. The results indicates that the soil collectedaround tannery shows high level of lead( 15.7 ppm. The presence of lead reduces the enzymatic activity of thebiota, and in consequence, incompletely decomposed organic material accumulates in the soil [7]. Lead is theleast mobile element among toxic metals, which is attributed to binding of the metal to organic matter [25,26].The organic matter finally binds the lead in complexes and removes it from water by absorbing into the soil.[27,28] Lead had long been recognized as an industrial hazard. Pb impedes the synthesis of hemoglobin andaccumulates within the red cells as well as the bones to give rise to anemia, headache and dizziness.Low level of iron was present (6.17 ppm) in tannery soil and high level (46.6) was noticed in welding industry .Regarding manganese 4.56 ppm manganese was recorded in textile industry soil and 48.3 ppm in printingindustry soil. This may be due to the usage of these metals in those industries. Precautionary measures should betaken in industrial area while discharging the waste materials.

B.Dheeba et al /Int.J.ChemTech Res.2012,4(3) 1232
Table 1: Comparison of observed and predicted values for physico-chemical properties of soil samplescollected from various industrial areas
Industries DISTANCE(m) pH EC
DS/m
ORGANICCORBAN%
ORGANICMATTER%
CECm.eq/100g of soil
0 7.9 0.56 1.44 2.47 19.3100 7.8 0.56 1.4 2.49 19200 7.7 0.51 1.38 2.56 19.8300 7.6 0.51 1.35 2.63 19.5400 7.5 0.48 1.31 2.74 19.9
Obs
erve
d va
lues
500 7.3 0.44 1.3 2.79 201000 6.7320 0.3199 1.1829 3.0781 20.70221500 6.1312 0.1930 1.0685 3.3775 21.41112000 5.5228 0.0645 0.9559 3.6729 22.1197
2500 4.9156 -0.0638 0.8435 3.9669 22.82403000 4.3086 -0.1919 0.7311 4.2612 23.52693500 3.7014 -0.3201 0.6186 4.5555 24.22964000 3.0943 -0.4482 0.5062 4.8499 24.93244500 2.4871 -0.5763 0.3937 5.1442 25.6352
Wel
ding
Ind
ustr
y
For
ecas
t an
alys
is
5000 1.8800 -0.7045 0.2813 5.4385 26.33800 7 1.48 11.77 20.29 38.7100 7 1.45 11.71 20.2 38.5200 6.8 1.41 11.45 20.33 39.2300 6.8 1.43 11.4 20.41 39400 6.6 1.4 11.32 20.56 39
Obs
erve
d va
lues
500 6.5 1.35 11.28 20.68 38.61000 5.9535 1.2481 10.9453 20.9016 38.59381500 5.3859 1.1344 10.6568 21.1529 38.34192000 4.8195 1.0174 10.3696 21.4040 38.06462500 4.2551 0.9010 10.0816 21.6511 37.79583000 3.6909 0.7849 9.7939 21.8984 37.52663500 3.1266 0.6687 9.5064 22.1460 37.25644000 2.5623 0.5526 9.2189 22.3935 36.98624500 1.9980 0.4364 8.9314 22.6410 36.7161
Pri
ntin
g I
ndus
try
For
ecas
t an
alys
is
5000 1.4337 0.3202 8.6438 22.8885 36.44610 5.8 0.77 0.49 4.4 30100 5.8 0.75 0.47 4.46 30200 6 0.72 0.43 4.6 30.5300 6.2 0.69 0.36 4.71 30.6400 6.2 0.65 0.33 4.84 30.6
Obs
erve
dva
lues
500 6.4 0.61 0.3 4.96 30.71000 7.0395 0.4663 0.1199 5.4299 31.29251500 7.6736 0.3165 -0.0535 5.9025 31.78382000 8.3139 0.1665 -0.2249 6.3745 32.27802500 8.9570 0.0167 -0.3970 6.8463 32.77903000 9.6000 -0.1331 -0.5692 7.3182 33.27933500 10.2429 -0.2829 -0.7414 7.7901 33.77904000 10.8857 -0.4327 -0.9136 8.2620 34.27884500 11.5286 -0.5825 -1.0858 8.7338 34.7786
Tan
nery
Ind
ustr
y
For
ecas
t an
alys
is
5000 12.1714 -0.7323 -1.2580 9.2057 35.2784

0 8.2 0.17 0.49 0.84 28.2100 8 0.12 0.47 0.86 28200 7.7 0.07 0.34 1.11 28.4300 7.7 0.05 0.31 1.19 28.8400 7.5 0.04 0.29 1.2 29.2
Obs
erve
dva
lues
500 7.5 0.05 0.21 1.25 29.91000 6.8166 -0.0712 0.0532 1.5185 30.38741500 6.1964 -0.1714 -0.0861 1.7217 30.89292000 5.5827 -0.2702 -0.2279 1.9212 31.41182500 4.9678 -0.3702 -0.3705 2.1240 31.92323000 4.3534 -0.4701 -0.5128 2.3266 32.43513500 3.7391 -0.5699 -0.6550 2.5288 32.94754000 3.1249 -0.6697 -0.7973 2.7311 33.45974500 2.5106 -0.7695 -0.9395 2.9335 33.9718
Stee
l In
dust
ry
For
ecas
t an
alys
is
5000 1.8963 -0.8693 -1.0818 3.1358 34.48400 8.5 0.25 1.44 2.47 21.4100 8.3 0.2 1.42 2.49 21.9200 8.1 0.17 1.31 2.72 22300 8 0.13 1.28 2.89 21.9400 7.8 0.11 1.18 2.93 22.7
Obs
erve
d va
lues
5007.2 0.08 1.1 3.12 22.6
1000 6.0719 -0.0411 0.8487 3.5743 22.45451500 4.8006 -0.1555 0.5871 4.0156 22.68732000 3.4941 -0.2702 0.3246 4.4633 22.93362500 2.1935 -3848 0.0637 4.9117 23.17603000 0.8941 -0.4995 -0.1971 5.3599 23.41733500 -0.4059 -0.6141 -0.4580 5.8081 23.65904000 -1.7060 -0.7288 -0.7188 6.2562 23.9007
4500 -3.0060 -0.8435 -0.9797 6.7044 24.1423
Pai
nt I
ndus
try
For
ecas
t an
alys
is
5000 -4.3060 -0.9581 -1.2406 7.1526 24.38400 8.9 6.46 0.46 0.79 15.6100 8.9 6.41 0.44 0.87 15.6200 8.7 6.31 0.42 0.89 16.1300 8.6 6.25 0.37 0.92 15.8400 8.6 6.21 0.33 0.99 15.8
Obs
erve
d va
lues
500 7.6 6.1 0.29 1.29 15
1000 6.5603 5.9294 0.2039 1.4772 14.56071500 5.2521 5.7378 0.1032 1.7877 13.80002000 3.8715 5.5418 0.0035 2.1161 12.99152500 2.4990 5.3471 -0.0951 2.4395 12.19283000 1.1285 5.1524 -0.1939 2.7625 11.39483500 -0.2430 4.9576 -0.2929 3.0860 10.59564000 -1.6146 4.7628 -0.3918 3.4095 9.7965
4500 -2.9860 4.5680 -0.4907 3.7329 8.9976
Tex
tile
Ind
ustr
y
For
ecas
t an
alys
is
5000 -4.3574 4.3732 -0.5896 4.0563 8.19860 8.9 0.26 0.26 0.45 26.4100 8.7 0.21 0.24 0.47 26.9200 8.7 0.2 0.21 0.49 26.9300 8.5 0.18 0.13 0.7 30400 8.4 0.16 0.11 0.74 30
Cem
ent
Indu
stry
Obs
erve
dva
lues
500 8 0.12 0.1 0.83 30.4

Table 2: Comparison of observed and predicted values for heavy metals of soil samples collected fromvarious industrial areas
Industries DISTANCE
Copper(ppm)
Manganese (ppm)
Iron(ppm)
Zinc(ppm)
Chromium (ppm)
Lead(ppm)
0 2.59 42.5 46.6 13.6 8.44 10.6100 2.45 41.9 46.32 13.31 8.03 10.28200 2.2 41.36 45.92 13.06 7.81 9.95300 2.11 41.03 45.47 12.72 7.49 9.61400 1.96 40.88 45.19 12.24 7.12 9.27O
bser
ved
valu
es
500 1.87 40.43 44.91 11.96 6.97 8
1000 1.1445 38.6180 43.2869 10.4236 5.6595 6.22831500 0.4525 36.8859 41.7115 8.8570 4.3867 4.16472000 -0.2373 35.1344 40.1461 7.3035 3.1294 2.04062500 -0.9284 33.3778 38.5778 5.7539 1.8727 -0.06903000 -1.6192 31.6227 37.0090 4.2035 0.6154 -2.17743500 -2.3099 29.8679 35.4405 2.6528 -0.6418 -4.28724000 -3.0006 28.1130 33.8720 1.1023 -1.8991 -6.39694500 -3.6913 26.3580 32.3035 -0.4482 -3.1563 -8.5065
Wel
ding
In
dust
ry
For
ecas
t an
alys
is
5000-4.3820 24.6030 30.7350 -1.9988 -4.4135 -10.6161
0 7.84 48.3 28 9.25 3.56 3.18100 7.44 48.02 27.75 9.03 3.12 2.94200 6.96 47.87 27.31 8.87 2.87 2.51300 6.52 47.41 27.1 8.4 2.54 2.2400 6.13 47.12 26.84 8.06 2.1 1.88O
bser
ved
valu
es
500 5.92 46.94 26.51 7.91 1.91 1.561000 3.9187 45.4967 25.1638 6.5839 0.4992 0.19801500 2.0045 44.0782 23.8276 5.2753 -0.8945 -1.15972000 0.1063 42.6759 22.4847 3.9891 -2.2734 -2.51492500 -1.7958 41.2724 21.1417 2.7033 -3.6494 -3.86913000 -3.6983 39.8677 19.7994 1.4161 -5.0259 -5.22313500 -5.6004 38.4631 18.4571 0.1289 -6.4026 -6.57724000 -7.5025 37.0585 17.1147 -1.1582 -7.7791 -7.93134500 -9.4047 35.6540 15.7724 -2.4454 -9.1557 -9.2854
Tan
nery
Ind
ustr
y
For
ecas
t an
alys
is
5000 -11.3068 34.2494 14.4300 -3.7325 -10.5323 -10.63940 28.9 32.1 6.17 7.79 39.5 15.7
100 28.53 31.88 5.84 7.41 39.12 15.41200 28.09 31.42 5.43 7.1 38.94 15.01300 27.91 31.19 5.12 6.75 38.51 14.84400 27.53 30.89 4.83 6.36 38.16 14.51O
bser
ved
valu
es
500 27.12 30.51 4.55 5 37.94 14.16
1000 7.2108 0.0163 -0.0404 1.1372 34.1103
1500 6.3276 -0.0920 -0.1681 1.4438 37.46752000 5.4244 -0.2022 -0.2920 1.7448 40.69622500 4.5246 -0.3121 -0.4164 2.0456 43.94343000 3.6249 -0.4218 -0.5410 2.3471 47.20253500 2.7249 -0.5317 -0.6656 2.6487 50.46054000 1.8249 -0.6415 -0.7901 2.9502 53.71784500 0.9249 -0.7513 -0.9147 3.2517 56.9753
For
ecas
t an
alys
is
5000 0.0249 -0.8611 -1.0393 3.5532 60.2329

1000 25.4280 28.9349 2.9620 2.7174 36.8594 13.22141500 23.7135 27.3503 1.4129 0.1039 35.8110 12.27532000 21.9879 25.7573 -0.1349 -2.5857 34.7774 11.32272500 20.2644 24.1644 -1.6847 -5.2608 33.7486 10.37673000 18.5417 22.5720 -3.2343 -7.9340 32.7184 9.4309
3500 16.8188 20.9796 -4.7836 -10.6088 31.6880 8.48474000 15.0960 19.3873 -6.3330 -13.2836 30.6577 7.53854500 13.3731 17.7949 -7.8825 -15.9582 29.6274 6.5924F
orec
ast
anal
ysis
5000 11.6503 16.2025 -9.4319 -18.6328 28.5971 5.64630 1.38 15.3 12.5 1.19 6.24 3.88
100 1 12.89 12.2 1.01 6.02 3.51200 0.84 12.54 11.83 0.86 5.81 3.13300 0.66 12.13 11.41 0.41 5.51 2.86400 0.43 11.91 11.19 0.19 5.16 2.44O
bser
ved
valu
es
500 0.16 11.74 10.94 0.04 4.92 2.121000 -0.9428 9.0985 10.0528 -0.6836 4.1997 1.23941500 -2.0594 6.8795 9.2630 -1.3468 3.4891 0.38822000 -3.1832 4.6425 8.4746 -1.9971 2.7822 -0.46572500 -4.3056 2.3921 7.6861 -2.6465 2.0808 -1.31323000 -5.4275 0.1457 6.8973 -3.2971 1.3789 -2.16053500 -6.5496 -2.1000 6.1086 -3.9479 0.6765 -3.00844000 -7.6718 -4.3463 5.3198 -4.5985 -0.0257 -3.85624500 -8.7939 -6.5927 4.5310 -5.2492 -0.7279 -4.7039
Tan
nery
indu
stry
For
ecas
t an
alys
is
5000 -9.9161 -8.8390 3.7423 -5.8998 -1.4302 -5.55170 2.95 29.6 18.1 3.75 10.44 8.22
100 2.51 29.47 17.86 3.32 10.11 8200 2.1 29.17 17.51 3.1 9.88 7.72300 1.89 28.84 17.18 2.84 9.41 7.41400 1.36 28.41 16.94 2.53 9.13 7.16O
bser
ved
valu
es
500 1.11 27.99 16.54 2.21 8.94 6.91600 0.7007 27.7737 16.3037 1.9678 8.6149 6.6867700 0.3571 27.3734 15.9771 1.7042 8.3148 6.4195800 -0.0003 27.0090 15.6853 1.4146 8.0270 6.1832900 -0.3840 26.6575 15.3877 1.1379 7.7864 5.95441000 -0.7155 26.3305 15.0804 0.8740 7.5035 5.71671500 -2.5300 24.5888 13.6013 -0.4792 6.1115 4.53152000 -4.3361 22.8478 12.1150 -1.8358 4.7359 3.35092500 -6.1398 21.1110 10.6287 -3.1902 3.3583 2.17033000 -7.9433 19.3737 9.1424 -4.5446 1.9796 0.98923500 -9.7469 17.6361 7.6561 -5.8992 0.6011 -0.19184000 -11.5504 15.8986 6.1698 -7.2538 -0.7773 -1.37274500 -13.3540 14.1611 4.6835 -8.6083 -2.1558 -2.5537
Pai
nt I
ndus
try
For
ecas
t an
alys
is
5000 -15.1576 12.4236 3.1973 -9.9629 -3.5343 -3.73470 5.45 4.56 42.5 1.97 5.46 10.5
100 5.12 4.12 42.12 1.51 5.11 10.11200 4.84 3.81 41.87 1.27 4.83 9.82300 4.51 3.47 41.41 1.02 4.33 9.41400 4.27 3.18 41.03 0.84 4.1 9.17Obs
erve
d
Obs
erve
dva
lues
500 3.94 2.93 40.84 0.43 3.88 8.941000 2.4623 1.3439 39.1017 -0.8487 2.4138 7.56101500 0.9885 -0.1961 37.4047 -2.1364 1.0176 6.24442000 -0.4893 -1.7325 35.7259 -3.4398 -0.3624 4.9388
Tex
tile
indu
stry
For
ecas
tan
alys
is
2500 -1.9680 -3.2709 34.0456 -4.7426 -1.7456 3.6311
3000 -3.4466 -4.8091 32.3644 -6.0446 -3.1296 2.32303500 -4.9251 -6.3473 30.6834 -7.3468 -4.5133 1.01514000 -6.4037 -7.8854 29.0024 -8.6491 -5.8970 -0.29284500 -7.8823 -9.4236 27.3214 -9.9513 -7.2808 -1.60075000 -9.3609 -10.9618 25.6403 -11.2535 -8.6645 -2.9086
0 1.9 7.06 12.5 0.41 3.25 4.26100 1.64 6.87 12.16 0.35 3.08 3.99200 1.29 6.54 11.84 0.24 2.75 3.53300 0.84 6.21 11.55 0.16 2.36 3.26400 0.44 5.84 11.21 0.09 2.11 2.84O
bser
ved
valu
es
500 0.13 5.32 10.99 0.01 11.96 2.691000 -1.7589 3.5769 9.5582 -0.3715 16.4623 2.76411500 -3.6437 1.7470 8.1576 -0.7463 24.2463 2.40782000 -5.5176 -0.0934 6.7655 -1.1209 32.8167 2.09952500 -7.3920 -1.9303 5.3736 -1.4957 41.2560 1.80113000 -9.2671 -3.7671 3.9815 -1.8705 49.6753 1.49993500 -11.1422 -5.6042 2.5894 -2.2453 58.1091 1.19834000 -13.0171 -7.4413 1.1974 -2.6201 66.5429 0.89704500 -14.8921 -9.2783 -0.1947 -2.9948 74.9751 0.5957
Cem
ent
Indu
stry
For
ecas
t an
alys
is
5000 -16.7671 -11.1153 -1.5868 -3.3696 83.4074 0.2943
Figure 1: Physicochemical analysis of polluted soil samples collected from industrial area ( Line graph)
B.Dheeba et al /Int.J.ChemTech Res.2012,4(3) 1237
Figure 2: Heavy metal content of soil samples collected from industrial area

B.Dheeba et al /Int.J.ChemTech Res.2012,4(3) 1238
Figure 3: Comparison of laboratory measured pH in the test data set with their predicted values basedon trend line analysis of soil collected from welding industry
Trend line (linear) Trend line (Lograthimic)
Trend Line (Polynomial)

B.Dheeba et al /Int.J.ChemTech Res.2012,4(3) 1239
Figure 4: Comparison of laboratory measured chromium in the test data set with their predicted valuesbased on trend line analysis of soil collected from printing industry Trend line (polynomial) Trend line (exponential)
References
1. Watanabe, T. and T. Hirayama, 2001.Genotoxicity of soil. J. Health Sci., 47: 433-438.
2. White, P.A. and L.D. Claxton, 2004. Mutagensin contaminated soil:a review. MutationResearch- Reviews in Mutation Research, 567:227-345.
3. Shaw, A.J., 1990. (Ed.), Heavy Metal Tolerancein Plants: Evolutionary Aspects. CRC Press,Boca Raton, FL.
4. Ihekoronye, A. I and Ngoddy P. O. (1985).Integrated Food Science and Technology for theTropics. Macmillan Publishers. Pp. 75 – 77
5. Drechsel, P., C. Quansah and F. Penning deVries. 1999. Stimulation of urban and peri-urbanagriculture in West Africa - Characteristics,challenges, and need for action. In: O.B. Smith(ed.) Urban agriculture in West Africa.IDRC/CTA, Ottawa, Wageningen, page 19-40.

B.Dheeba et al /Int.J.ChemTech Res.2012,4(3) 1240
6. Hashem, A.R. and Al-Obaid, A.M. 1996. Effectof Cadmium on the Growth of Aspergillus flavusand Ulocladium chalmydosporum. Internat. J.Exper. Bot, 59 (1/2):171- 175.
7. Ferguson, J.E. 1990. The Heavy Element,Chemistry,Newyork, Pergamon press.
8. Kumar, P.B.A.N., Dushenkov, V., Motto, H.,Raskin, I., 1995. Phytoextraction: the use ofplants to remove heavy metals from soils.Environmental Science and Technology 29,1232–1238.
9. Brooks, R.R., Lee, J., Reeves, R.D., JaGre, T.,1977. Detection of nickeliferous rocks byanalysis of herbarium specimens of indicatorplants. Journal of Geochemical Exploration 7,49–58.
10. Ming Chen and Ma, Lena Q, Soil Sci Soc Am J.,2001, 65, 491–499.
11. Lark B S, Mahajan R K and Walia T P S, IndianJ Environ Health., 2002, 44, 164–167.
12. Jackson, M.L, 1973. Soil chemical analysis.Prentice – Hall of Indid Pvt. Ltd. New Delhi.
13. Walkley, A and C.A. Black, 1934, An estimationof digitrareff method for determining soilorganic matter and proposed modification of thechromic acid titration method. Soil science,37:29-38.
14. Thomas, G.W. 1982. Exchangeable cations. In:A.L. Page (ed.) Methods of soil analysis, Part 2Chemical and microbiological properties, 2ndedition. Agronomy 9: 159-165.
15. Manivasakam, N., 1987. Industrial Effluents,origin, Characteristics, Effects, Analysis &Treatment. Sakthi Publications, Kovaiputhur,Coimbatore. Pp42.
16. Srinivasachari, M., M. Dhakshinamoorthy 7 G.Arunachalam, 2000. Accumulation andavailability of Zn,Cu,mn& Fe in soils pollutedwith waste water. Madras Agric.J., 87:237-240.
17. Kirkham, M. B., (2006). Cadmium in plants onpollutedsoils: Effects of soil factors, hyperaccumulation and amendments. Geoderma 137(1-2), 19-32 .
18. Somasundaram, J., 2001, Evaluation of sewagesludge coir pith pellets on fodder crops and
biotransfer of heavy metals. PhD thesis.Tamilnadu Agricultural University, Coimbatore.
19. Ehsan, S.; Prasher, S. O.; Marshall, W. D.,(2006). A washing procedure to mobilize mixedcontaminants from soil: II.Heavy metals. J.Environ. Qual., 35 (6), 2084-2091.
20. Atafar, Z.; Mesdaghinia, A.R.; Nouri, J.;Homaee, M.; Yunesian,M.; Ahmadimoghaddam,M.; Mahvi, A. H., (2010). Effect of fertilizerapplication on soil heavy metal concentration.Environ. Monitor. Assess., 160 (1-4), 83-89
21. Casas JM, Rosas H, Sole M, Lao C (2003)Heavy metals and metalloids in sediments fromthe Liobreget basin, Spain.Environ Geology44:325–332.
22. Ansari AA, Singh IB, Tobschall HJ (1999)Status of anthropogenically induced metalpollution in the Kanpur-unnao industrial regionof the Ganga plain, India. Environ Geology38(1):25–33.
23. Larocque ACL, Rasmussen PE (1998) Anoverview of trace metals in the environment:mobilization to remediation. Environ Geology33:85–91.
24. Rao MS, Gopalkrishnan R, Venkatesh BR(2001) Medical geology – An emerging field inenvironmental science. National Symposium onRole of Earth Sciences. Integrated and RelatedSocietal issues. GSI Spl Pub No 65(II):213–222.
25. Govil PK, Rao TG, Krishna AK (1998). Arseniccontamination in Patancheru industrial area,Medak District. Andhra Pradesh. J EnvironGeochem 1:5–9.
26. Nagaraju A, Karimulla S (2002) Accumulationof elements in plants and soils in and aroundNellore mica belt, Andhra Pradesh, India-abiogeochemical study. Environ Geology 41:852–860.
27. Govil PK, Reddy GLN, Krishna AK (2001)Contamination of soil due to heavy metals inPatancheru industrial development area, AndhraPradesh, India. Environ Geology 41:461–469.
28.Vazquez FG, Sharma VK, Perez-Cruz L (2002)Concentrations of elements and metals insediments of the southeastern Gulf of Mexico.Environ Geology 42:41–46.
*****