evaluation of hardrock tunneling data from hard rock projects · 2012-02-07 · 2.2.2 tunnel boring...
TRANSCRIPT


Institutionen för Geovetenskap Box 460
405 30 Göteborg
Evaluation of hard rock tunnelling data: a compilation of geological parameters
Jonas Olsson
Master thesis in Geology and Petrology Mineralogy and Petrology, 160p Instructor: Sid Patel, Jimmy Stigh Examiner: Lennart Björklund Date: 2007 12
Evaluation of hard rock tunnelling data: a compilation of geological parameters Jonas Olsson, Göteborg University, Department of Earth Sciences, Geology, Box 460, SE-405 30 Göteborg
ABSTRACT In tunnel construction, follow-ups and knowledge feedback for tunnel project is of large interest. For this a number of companies with support from the European Union have gone together and formed the project Tunconstruct. It is a four year research project which aims to investigate and develop the future in tunnel construction. The goal with this master thesis was to study the Tunconstruct reference database (UCIS), and to suggest changes usable for drill and blast tunnels and not only for tunnels constructing using Tunnel Boring Machine are given. Collected data from the different projects were also added to the UCIS data base. The data collected generated other questions. Was there a connection between geology/grouting and geology/overbreak? By collecting data from the different projects and tabulate these, the parameters that were available and which were of importance were sorted out. The data collected were later compared to UCIS and a suggestion to what was to be added and what to change for the database to be able to handle drill and blast tunnels. Parameters added to UCIS were grouting, overbreak, rock reinforcement data, and customize drifting data. In the case study between geology/grouting and geology/overbreak it turned out to be harder to find correlations. The statistical evaluation of the tunnels showed that the collected data was too deficient to give any reliable results and only weak connections between geology/grouting and geology/overbreak were to be found. The reason could be bad resolution and hard to correlate the length measurements for the data accounted for. Keywords: Tunnel construction, drill and blast, tunnelling data, grouting, overbreak, hard rock ISSN 1400-3821 B528 2008
i
Evaluation of hard rock tunnelling data: a compilation of geological parameters Jonas Olsson, Göteborg University, Department of Earth Sciences, Geology, Box 460, SE-405 30 Göteborg SAMMANFATTNING I tunnelbyggnation är det av intresse att kunna göra uppföljning samt kunskapsåterföring på genomförda projekt. För detta har ett flertal företag med stöd av Europeiska Unionen gått samman och bildat Tunconstruct, ett fyraårigt forskningsprojekt med uppgift att undersöka och utveckla framtidens tunnelbyggande. Målet med examensarbetet var att studera Tunconstructs referensdatabas (UCIS) och att ge förslag på ändringar för att den skulle bli användbar även för sprängda tunnlar och inte bara för borrade tunnlar. Dessutom var syftet att komplettera UCIS med den insamlade data från de tunnlar som undersöktes. All insamlad data gav upphov till ytterligare frågeställningar. Fanns det något samband mellan geologi/injektering och geologi/överutfall? Genom att samla in all data tillgänglig från de olika projekten och sammanställa dessa framkom en bild av vilka data parametrar som fanns tillgängliga samt vilka som var relevanta. Detta jämfördes sedan med vad som fanns i UCIS och förslag gavs på vilka parametrar som behövdes läggas till och vad som behövde anpassas i databasen för att kunna hantera sprängda tunnlar. Parametrar som behövdes läggas till i UCIS var injektering, överutfall, bergförstärknings data samt anpassa drivningsdata. I jämförelsestudien mellan geologi/injektering och geologi/överutfall visade det sig vara svårare att hitta något samband. Den statistiska undersökningen av tunnlarna visade att insamlad data hade för många brister för att undersökningarna skulle ge några tillförlitliga resultat. Vid statistiska körningar av insamlade data gick det bara att se svaga samband mellan geologi/injektering och geologi/överutfall. Anledning till detta kan vara alltför dålig upplösning och svårt att korrelera längdmätningarna för respektive datamängd. Nyckelord: Tunnel construction, drill and blast, tunnelling data, grouting, overbreak, hard rock ISSN 1400-3821 B528 2008
ii

TABLE OF CONTENTS
ABSTRACT I
SAMMANFATTNING II
TABLE OF APPENDIX IV
1 INTRODUCTION 1
1.1 Background 1
1.2 Purpose and performance 1
1.3 Disposition and limitation of work 2
2 BACKGROUND 2
2.1 Ground investigation 2
2.2 Excavation 2 2.2.1 Drill and blast 3 2.2.2 Tunnel boring machine 3
2.3 Rock tunnel support systems 4
2.4 Methods of calculating rock quality 5
2.5 Survey of systems and methods available today for data registration and analysis 7 2.5.1 Software 7 2.5.2 Databases using Tunconstruct, UCIS as initial point 7
2.6 Geology of Sweden 8
3 METHOD AND RESULTS 9
3.1 Compilation of data for a number of rock tunnels 9 3.1.1 Löttingetunneln 10 3.1.2 Trollhättetunnel 14 3.1.3 Arlandabanan 18
3.2 Statistics 22 3.2.1 Histogram 22 3.2.2 Mean value, Standard deviation and Variance 22 3.2.3 Regression analysis 23
4 DISCUSSION 24
4.1 Analysis of data from case studies 24 4.1.1 Löttinge 25
iii

4.1.2 Trollhättetunnel 27 4.1.3 Arlanda 29
4.2 Establish relationships 32 4.2.1 Geology/grouting 32 4.2.2 Geology/overbreak 32
4.3 Important parameters in the Q-equation 33
4.4 Evaluation of database structure for use in tunnels driven in hard rock 34 4.4.1 General comments on the UCIS database structure 34 4.4.2 Additional data fields needed in UCIS 35
5 CONCLUSION 37
6 ACKNOWLEDGMENT 38
7 REFERENCES 38
TABLE OF APPENDIX Appendix A. Data from Löttinge Appendix B. Data from Trollhättetunnel Appendix C. Data from Arlanda
iv
1 INTRODUCTION
1.1 Background
This master thesis was written at the Department of Geology, Göteborg University in collaboration with NCC Construction.
TunConstruct is a four year multi-disciplinary research project that aims to develop the edge technology in underground construction. The project has 41 partners from 11 European countries and they are all some of Europe´s best recognized names in the underground engineering industry. The project is financed by the European Commission and its 41 partners. The European Commission provides 54% of its 26 million Euro budget. For coordination of the project stands The Graz University of Technology in Austria.
Within the TunConstruct research project, NCC construction participates in building up the Underground Construction Information System database (UCIS). The database was created to store data from different tunnel projects. The idea is to improve tunnel construction processes using an integrated platform for process optimization and shorten the time from innovation to practice. The aim of the web-based data system is to illustrate relevant and reliable information throughout the lifetime of an underground facility, also to work as monitoring instrument during the construction and visualisation of geological data.
The UCIS so far is a database best applicable to European ground conditions. In Europe the most common way to build tunnels is to use a tunnel boring machine (TBM). In Sweden and the rest of the Nordic countries, drill and blast (D&B) is used in larger extent. This is probably because of differences in geology. South of the Halland Ridge the bedrock is mainly comprised of sedimentary rocks which are harder to build in using D&B. While in Sweden most of the rock is crystalline basement were TBM from the beginning was harder to use. This is now more a matter of culture and TBM can be used in soft rock as well in hard rock. That makes it necessary to compare D&B with TBM in order to try to propose changes to the UCIS structure for it to apply to Nordic geologic conditions and practice.
1.2 Purpose and performance
The work started with comprehensive literature studies in database structure, different tunnel construction methods and how the data should be edited into the database. Also two field trips were included. The Löttinge tunnel in Stockholm, Sweden and Gothard base tunnel in Switzerland were studied to get an impression of the different tunnel construction methods.
1
1.3 Disposition and limitation of work
This thesis is limited to differences between D&B project data and data stored in UCIS. Also the preferences which are key features for databases regarding geology were studied. The report covers the two major methods for tunnel construction, TBM and D&B. It describes and evaluates the different types of methods. For the database the focus is on D&B, and suggesting changes that need to be entered in UCIS, to be utilizable for D&B tunnels. As stated above the idea was from the beginning to compare D&B with TBM and Road Header (RH). But due to lack of data from both TBM- and RH this project had to be changed into a project where only D&B data was studied and give suggestions on what needed to be added for a D&B project in the Tunconstruct database. The second idea was to follow up on all the data collected from the D&B projects, to try and make correlations between;
o Geology and grouting o Geology and overbreak o Geology and rock support o Geology and drifting parameters
2 BACKGROUND Constructing tunnels have always challenged engineers, from the early basic drill and blast tunnels to modern TBM tunnels that are more like a gigantic tunnel factory. When constructing tunnels you always follow some basic steps; a) Ground investigation, b) Excavation and c) Support and maintenance.
2.1 Ground investigation
When starting a tunnel project, ground investigation is the first stage of the process. A thorough ground investigation could be the difference between success and disaster. Missing fracture zones and areas of weaker rock could cost lots of time and money during the construction. Methods of doing ground investigations include; seismic geophysics, rock testing, core drilling and mapping the area where the tunnel passes through, this to get a good visualisation of what to expect during construction (Waltham. 2002).
2.2 Excavation
Tunnel excavation can be done in three different ways; a) Drill and Blast, b) Tunnel Boring Machine and c) Road Header. In this report only the two first will be covered,
2

because road header projects are not that common within Sweden. The City tunnel consortium did use it when constructing the City tunnel in Malmö, but the data from that project could not be accessed until after the project was completed.
2.2.1 Drill and blast
Drill and Blast is the oldest technique used in tunnel construction and has been refined over time, it started for real when dynamite was invented. Gunpowder first used was very unsafe and hard to control and led to numerous accidents in the beginning. D&B is used in shorter tunnels where the use of TBM would not be economical or where the geology is too complicated, as for mixed face or squeezing ground. The way of constructing tunnels can be broken down in to stages. First inject grouting as a screen, drill for explosives, blast out a section or a gable in the tunnel, removing the spoil and line the tunnel. This is also referred to as cycle time and will be discussed later in this report. When constructing larger tunnels it is common to divide the tunnel in two sections, upper and lower. That means first excavating the upper bench and then continue with the lower bench of the tunnel (Waltham. 2002).
2.2.2 Tunnel boring machine
Tunnel construction with TBM started as early as in the 1850´s. The machine was quite simple, a large rotating shield with drag bits on. The construction was weak and only made it 10 ft into the rock before braking down (Hapgood. 2004). In the mid 1950´s an engineer came up with the idea of putting rotating disks as cutters on the shield. That made it possible to bore everything from sand to hard rock. This was the big boom in underground tunnel engineering which led to many spectacular tunnel projects. The TBM is like a large train, shown in figure 2.1, with a shield in the front and cutters that dig its way into the tunnel wall. The material that is being dug out is then transported backwards on the train and mixed with water to something called slurry. This is to keep it from giving off the finer particles. The slurry is loaded on to a tunnel train or conveyor belt and transported out of the tunnel. There are sometimes problems getting the right mix of the slurry. If it is to dry it starts to dust and if it is to wet it will not stay on the conveyer belt that transports the slurry backwards on the TBM. The best is if the consistence is like toothpaste. The tunnel can then be left unlined, lined or cased with precast concrete sections that are mounted on to the walls as the TBM moves forward. The TBM is mounted on travelling rail and prevented from moving backwards by large hydraulic jacks holding the TBM in place. When drilling under high pressure, either because of the ground water level or because the ground is too soft and will fail, it is sometimes necessary to use an Earth Pressure Balance Machine, (EPBM) to put the rig under pressure. By putting a large collar behind the rotating shield and pressurize, water will stop from leaking and ground from collapsing. TBM can be used in all types of ground material from soft soil to hard rock. The configuration of the TBM changes depending on what ground conditions that are to be expected. What type of cutters, if there need to be an overpressure in front, lined or
3

unlined tunnel are all examples of different applications and modifications that need to be made to the TBM before putting it to use. This is why most TMB´s are custom made for a specific tunnel (Bougard 1984).
Figure 2.1 Tunnel boring machine (Kawasaki Precision Machinery Ltd 2007)
2.3 Rock tunnel support systems
There are different support systems when building tunnels, passive support, active support, shotcrete and rockbolts or dowels are all types of support. Passive support is steel ribbed precast concrete segments that are used as liner on the inside of the tunnel, often used in TBM tunnels where the TBM places the segment. Active support is shotcret and rockbolts together forming a self supporting arch within the rock mass, often used to support rock mass over tunnel openings. It works better then passive support for all types of ground conditions except weak soils. Rockbolts or dowels are used as support in jointed rocks to secure lose bolts or reinforce the material where the stress level makes the excavation area collapse if not supported. Rockbolts are steel rods that either has an expansion shell in the end or is fixed with grouting. It can be tensioned or non-tensioned and used where urgent support is needed. Dowels are cables or rebars that are fixed in shotcrete and more of a long term support. Dowels are not pre-tensioned but it uses the rock mass natural tension to tighten it. Rock grouting in tunnels is a way to prevent groundwater from leaking into tunnels. Groundwater transports through joints in the rock mass and by filling these with grout, the rock mass is made impermeable. It is important to prevent groundwater level lowering since it affects wells and can also cause subsidence of structures situated above the underground opening. Grouting can be performed either before or after excavation. Pre-grouting is injected as a screen in front of the face, see Figure 2.2. If this procedure turned out to be unsuccessful, the tunnel is post-grouted in order to seal off the residual inflow (Waltham. 2002).
4

Figure 2.2 Pre-grouting of a rock tunnel
2.4 Methods of calculating rock quality
The degree of fracturing is estimated with RQD, which is defined as the percentage obtained by dividing the summed lengths of all core pieces equal or greater than 100 mm by the total core length (Edelbro 2003). The rock quality expressed as RQD is presented in Table 2.1.
Table 2.1 Rock quality according to the RQD-method
RQD Rock Quality 90 – 100 Very good 75 – 90 Good 50 – 75 Fair 25 – 50 Poor 0 – 25 Very poor
The RQD-value is a parameter in another rock classification, called the Q-method The Q-method considers the number of joint sets (Jn), joint roughness (Jr), joint alteration (Ja), the water conditions (Jw), and the Stress Reduction Factor( SRF), (Edelbro 2003). The rock mass quality is calculated from the formula:
SRFJ
JJ
JRQDQ w
a
r
n
⋅⋅=
The rock quality expressed as the Q-method is presented in Table 2.2.
Table 2.2 Rock quality according to the Q-method
Q Rock Quality 40 – 100 Very good 10 – 40 Good 4 – 10 Fair 1 – 4 Poor
0.1 – 1 Very poor Rock mass rating (RMR) is another way to define the rock mass quality using case histories from tunnels, chambers, mines, slopes and rock caverns. The following six parameters are used to classify a rock mass using the RMR system (Edelbro 2003).
5

1. Unaxial compressive strength of intact rock material 2. Rock quality designation (RQD) 3. Joint or discontinuity spacing 4. Joint condition 5. Groundwater conditions 6. Joint orientation
Each of the six parameters is assigned a value corresponding to the characteristics of the bedrock. These values are derived from field surveys. The sum of the six parameters is the "RMR value", which lies between 0 and 100 (Waltham, 2002). The rock quality expressed as the RMR-method is presented in Table 2.3.
Table 2.3 Rock quality according to the RMR
RMR Rock Quality 80 – 100 Very good 60 – 80 Good 40 – 60 Fair 20 – 40 Poor
<20 Very poor Bieniawski (1976) was the first author who made correlation based on his case studies between the RMR- system and the Q-system (Edelbro 2003). According to RMR = 9.0 ln Q + 44. Other correlations have been done over time RMR = 5.9 ln Q + 43, Rutledge, 1978 RMR = 5.4 ln Q + 55.2, Moreno 1980 These correlation coefficients are not reliable according to Goel el al., (1995). He evaluated these approaches on the basis of 115 case stories and since the two systems do not use the same parameters they cannot be set as equivalent, although they are widely used in tunnel construction projects.
Geologic Strength Index (GSI) was introduced by Hoek et al., (1995) as an input to the generalized rock failure criterion in poorer rock masses. RMR and the Q-system were not suitable when the minimum value went below 18. Instead GSI was introduced and ranges from 10 for extremely poor rock to 100 for intact rock. The formula is given in the equation below.
44log9 +⎥⎦
⎤⎢⎣
⎡⎟⎟⎠
⎞⎜⎜⎝
⎛⎟⎟⎠
⎞⎜⎜⎝
⎛=
a
r
n JJ
JRQDGSI
6

2.5 Survey of systems and methods available today for data registration and analysis
2.5.1 Software
The range of software for data registration in tunnel projects is limited. The TBM´s all have integrated systems that log all activity from drill speed, amount of grouting to advance rate. That makes it rather easy to evaluate and create databases from the data that the TBM logs. Data from D&B is usually based on manual data registration but drill rigs usually have some registration of data. There are programs such as SISO and Tunnel manager from Atlas Copco that is capable of logging drill parameters. SISO is an integrated management tool for construction site supervision. It is designed to specifically meet the needs in civil engineering projects. The tool is best suitable for line projects such as tunnels and bridge projects. SISO is built up by different modules; project/site management, TBM, geology, graphic layout, damages, contractors, monitoring, cost and schedule controlling. (www.sisonet.com 2007-05-24) Atlas Copco´s Tunnel Manager is comparable to SISO but with its focus on the drill parameters. The only problem is that it can only be used on Atlas Copco machines. One advantage is that you can connect the orientation laser in the tunnel to the program which makes drill data very accurate to distance.
2.5.2 Databases using Tunconstruct, UCIS as initial point
There are different types of databases in tunnel construction; a) construction database b) reference database c) failure knowledge database. Construction databases are connected to the construction process using live logging from the TBM that is stored directly into the database. The manufacturer of the TBM often has their own software/database for storing the data. This makes it rather hard comparing the different data because it is stored in different types and configurations. UCIS is a reference database, with compilation of data from different projects from companies within the European Union. In order to make the UCIS generally usable, input of all available tunnel-drifting parameters must be possible to enter into the database. The database is constructed as a relational database management system (RDBMS) and plus some additional components for visualisation. The data storage of UCIS is provided by Microsoft SQL server. SQL server provides interface to access and manipulate data via Structure Query Language (SQL), a data manipulation language developed for relational databases. Data from all Tunconstruct subprojects are to be stored in UCIS and accessed by different applications of the partners involved where WEKA is one of them. WEKA stands for Waikato Environment for Knowledge Analysis and is a collection of machine learning algorithms for data mining tasks. The algorithms can either be applied directly to a dataset or called from your own Java code. In this case it is used to call the Java code and compare data
7

sets. This makes it possible to compare different projects by accessing the stored data in UCIS with different tools that are under development by Tunconstruct.
2.6 Geology of Sweden
The Baltic shield comprises a large exposure of the Precambrian crust in northern Europe, with Arcean units in the north-east part, and with gradually younger Proterozoic terrain towards south west. During early Paleoproterozoic time the Arcean crust went through several episodes with rifting and extension that ended with the accretion of the 1.9-1.85 Ga. old Svecofennium arc complex that formed the Svecofennial province. Along the western edge of the province the Trans Scandinavian Igneous Belt (TIB), 1.85-1.65 Ga is situated. The south west Scandinavian province, 1.75-0.9 Ga. is situated furthest to the west and affected by the Sveconorwegian orogensis and this is why the south west province is sometimes referred to as the Sveconorwegian province. The south western province is affected by four tectonic zones, Mylonite Zone (MZ), Protogin zone (PZ) Törnqvist zone (TQZ) and Göta Älv Zone (GÄZ), shown in figure 2.3. The Mylonite Zone is the border between the Eastern and Western segment (Lindström et. al., 2000). The latest orogenisis to hit Scandinavia was the one forming the Caledonides. It started 490 million years ago and was the result of Laurentia colliding with Baltica forming the Caledonides as a result.
8

Figure 2.3 Map over the Swedish bedrock, TQZ ( Törnqvists zone), GÄZ (Göta Älv zone), MZ ( Mylonite zone), PZ ( Protogin zone)
3 METHOD AND RESULTS The results are divided into two sections, the first covering the analyses of relationships between geology and construction parameters. The second on what parameters that needs to be added to the Tunconstruct database.
3.1 Compilation of data for a number of rock tunnels
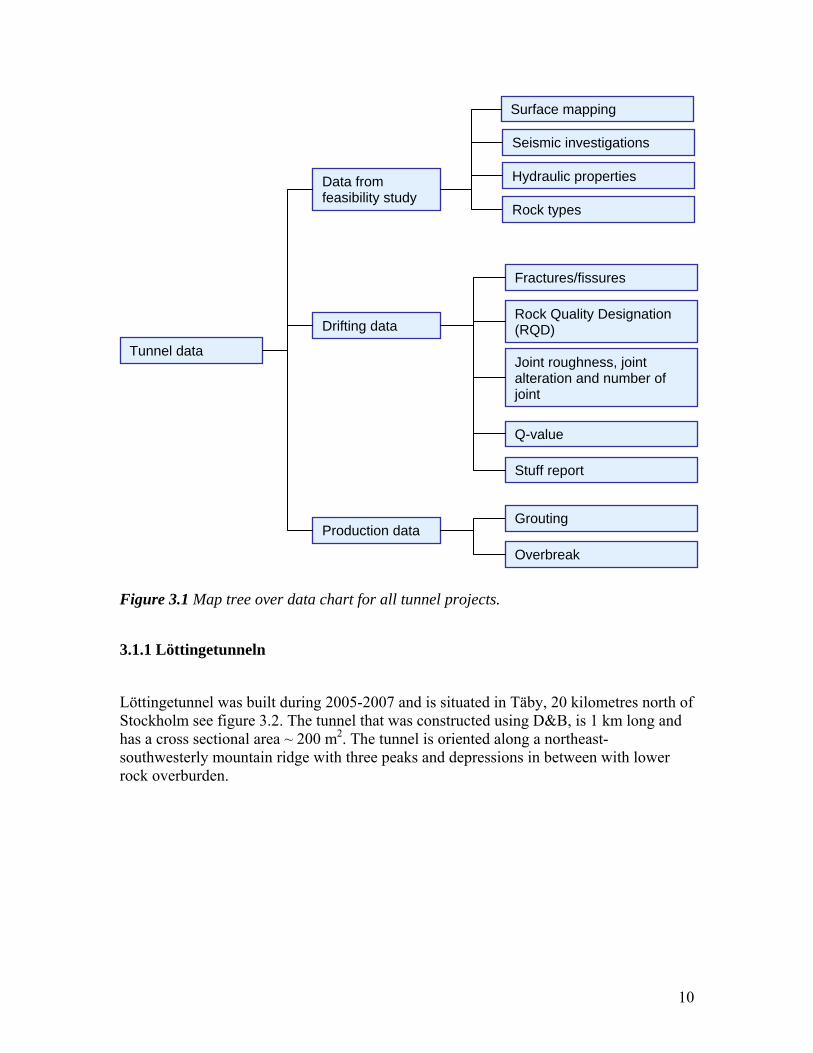
The data from the each of the three tunnel projects are described using the following map tree. This map tree is used as a reference for what data is available in a D&B project.
9
Tunnel data
Data from feasibility study
Drifting data
Production data
Surface mapping
Seismic investigations
Hydraulic properties
Fractures/fissures
Overbreak
Rock types
Rock Quality Designation (RQD)
Joint roughness, joint alteration and number of joint
Q-value
Stuff report
Grouting
Figure 3.1 Map tree over data chart for all tunnel projects.
3.1.1 Löttingetunneln
Löttingetunnel was built during 2005-2007 and is situated in Täby, 20 kilometres north of Stockholm see figure 3.2. The tunnel that was constructed using D&B, is 1 km long and has a cross sectional area ~ 200 m2. The tunnel is oriented along a northeast-southwesterly mountain ridge with three peaks and depressions in between with lower rock overburden.
10

Figure 3.2 6 Bedrock map over Löttinge
3.1.1.1 Geological background The rock mass in the area is mostly granodiorite with inclusions of pegmatite and younger granites. The granodiorite is part of the early orogenic deep rock, 1890-1870 Ma while the younger granites with pegmatites is post orogenic granites, 1820-1750 Ma (Lindström et. al., 2000). The rock mass in Löttinge is strong and massive with few fracture zones. The fractures in the tunnel increase from west to east and are in the eastern part horizontal orientated. Investigations in the area included eight core holes, BIPS-logging of the core holes, surface mapping, seismic refraction and hydraulic properties BIPS-logging is using a camera to take pictures of the hole and then analyzing the joint orientation of the rock mass.(NCC 2007, project documentation).
3.1.1.2 Data from Löttingetunnel
Data from feasibility study - Surface mapping
o Geologic mapping of the area using SGU Serie Ae, Stockholm NO, skala 1:50 000, 1964 and drawing of the tunnel Plane, profile och normal section.
- Seismic investigations
o Three seismic refraction profiles over the tunnel have been done with 5m spread and shot range that varies from 14- 25 m. The rock quality is over all good with velocity of propagation >5000 m/s. No low velocity zone has been registered.
11

- Hydraulic properties o Hydraulic properties of the rock mass in the tunnel were investigated by
water loss in core holes to get and approximation of the fracture frequency.
- Rock types
o The rock mass is dominated by granodiorite with inclusions of younger granite, pegmatite and amphibolites.
Drifting data - Fractures/fissures
o Fracture orientation plotted in a rose diagram see figure 3.3 o Fissure fillings in the area is mainly calcite, occasional fissures with
chlorite and clay fillings can be found
Figure 3.3 Rose diagram for Löttinge tunnel.
- Rock Quality Designation (RQD) presented in table 3.2 Table 3.1 RQD presented in % of total tunnel length. RQD-value tunnel
Proportion in % of tunnel length
90-100 65 (660m) 75-90 26 (268m) 50-75 8 (81m) 25-50 0 0-25 0
12

- The joint roughness, joint alteration and number of joint sets presented in table 3.2 as mean values.
Table 3.2 Mean value of Jn, Jr and Ja Joint roughness (Jr) ( x ) 3,2 Joint alteration (Ja) ( x ) 2,6
Number of joint sets (Jn) ( x ) 3,5
- Q-value from the project is presented as a histogram, figure 3.5.
Variable Observations Minimum Maximum Mean Std. deviation Q 64 3,421 95,000 32,833 23,983
Histogram Q
0
0,1
0,2
0,3
0,4
0,5
0,6
0 20 40 60 80 100 120
Q
Rel
ativ
e fr
eque
ncy
%
Figure 3.5 Histogram over Q-values from the Löttinge project
Table 3.3 Q presented in % of total tunnel length Q-value tunnel
Proportion in % of tunnel length
>100 0 40-100 46 (482m) 10-40 50 (515m)* 4-10 4 (42m)** 1-4 0
*depression, **tunnel face
- Production report o Weekly reports on advance rate, ~15 m per week.
13

Production data
- Grouting
Table 3.4 Data table over grouting at Löttinge Number of grouting screens
Mean distance between sections [m]
Total amount of grout [l]
Total number of holes in the screen
Grout per meters of drill hole [l/m]
67 20 m 368141 l 2002 st 9,4 l/m
3.1.2 Trollhättetunnel
Trollhättetunnel is a 3.8 km single tube double track railway tunnel situated in Trollhättan 50 km north of Göteborg, see figure 3.6. It was built from 2003-2005 using conventional Drill and Blast. It has a cross sectional area ~ 120 m2. The tunnel passes through two ridges with a large depression in the centre at Björndalen, see figure 3.6. The depression is overbuilt with a concrete tunnel to connect the two rock tunnels 3.1.2.1 Geological background The rock mass is built up of two major rock types, a week foliated granite from Båberg in the north to Björndalen with large megacrysts and gneiss with dominantly granodioritic composition in the south of the tunnel. Dykes of granite, granodiorite, pegmatite and aplite can occur, as well as discs or lenses of mafic rocks. Analysis of the core-drillings has shown some occurrence of pegmatite. These have not been observed on the rock surface. The weak foliation of the granite decreases from north to south and the direction of the foliation are easterly striking and diping towards the west. Investigations in the area included eight core holes, BIPS-logging of the core holes, surface mapping, seismic refraction and hydraulic properties (NCC 2007, project documentation).
14

Figure 3.6 Bedrock map over Trollhättetunnel (Lundqvist 1997) 3.1.2.2 Data from Trollhättetunnel Data from feasibility study
- Surface mapping o Geologic mapping of the area using SGU Serie Ae, Trollhättan , skala
1:50 000, 1964 and drawing of the tunnel Plane, profile och normal section.
- Seismic investigations o Six seismic refraction profiles over the tunnel have been done with 1 -5m
spread and shot range that varies from 14- 25 m. The rock quality is over all good with velocity of propagation >5000 m/s. Two low velocity zones has been registered one close to Björndalen, chainage 400/850 and one further to the south, chainage 402/400.
- Rock types o The tunnel is built up of two rock types, granite with large megacrysts
from Båberg to Björndalen and gneiss with foremost granodioritic composition in the south of the tunnel. Dykes of granite, granodiorite, pegmatite and aplite can occur, as well as discs or lenses of mafic rock.
Drifting data
- Fissure fillings o Fissure filling is either chlorite or clay. In the contact between greenstone
and gneiss, the rock can be totally or partly converted into clay. - Fracture orientation
15

The most common fracture orientations in the tunnel is as plotted in the rose diagram, figure 3.7.
Figure 3.7 Rose diagram for Trollhättetunnel
- Rock Quality Designation (RQD)
Table 3.5 RQD presented in % of total tunnel length RQD-value tunnel
Proportion in % of tunnel length
90-100 65 (1024m) 75-90 29 (465m) 50-75 5 (85m) 25-50 0 0-25 0
- The joint roughness, joint alteration and number of joint sets presented in table
3.6 as histogram.
Table 3.6 Mean value of Jn, Jr and Ja Number of joint sets (Jn) ( x ) 3,5 Joint roughness (Jr) ( x ) 3,2 Joint alteration (Ja) ( x ) 1,2
- Q-value from the project is presented in table 3.5 and as a histogram, figure 3.8
Variable Observations Minimum Maximum Mean Std. deviation Q 331 0,667 40,000 17,337 9,610
16

Histogram (Q)
0
0,1
0,2
0,3
0,4
0,5
0,6
0,7
0 5 10 15 20 25 30 35 40 45 50
Q
Rel
ativ
e fr
eque
ncy
Figure 3.8 Histogram over Q-values from the Trollhättetunnel
Table 3.7 Q presented in % of total tunnel length Q-value tunnel
Proportion in % of tunnel length
>100 32 (335m) 40-100 44 (465m) 10-40 20 (215m) 4-10 1 (18m) 1-4 2 (25m) 0,1- 1 1 (20m)
- Stuff report
o Weekly reports on advance rate, ~9 m per week.
Production data
- Grouting o Data from the grouting of Trollhättetunnel is not complete and therefore a
table with total use is not presented. The data that have been collected will be used in the relationship study.
17

3.1.3 Arlandabanan
3.1.3.1 Geological background Arlanda tunnel is part of the fast track rail link Arlandabanan that was built to connect Arlanda airport with central Stockholm see figure 3.9. The tunnel is 8,6 km, has a cross-sectional area of ~ 100 m2 and was constructed between 1996 and 1997 (Dalmalm, 2004). The rock mass in the Arlanda tunnel is built up of two main geological rock types, see figure 3.9. Granodiorite north and south and a zone in the middle built up of mica schists and mica gneiss. The mica zone is strongly fractured along a vertical stratification with foliation planes (N40oØ/70oV) partly affected by clay mineralogy. Between the foliation planes the rock mass is massive and is characterized as gneissic. The granodiorite in the Arlanda area is influenced by horizontal fracturing and is not as strong and massive as normal. In the area large horizontal stresses have been measured to between 2- 10 MPa. This could be a possible reason for either the generation of horizontal fractures, or tensile open state. Investigations in the area included eight core holes, BIPS-logging of the core holes, surface mapping, seismic refraction and hydraulic properties (NCC 2007, project documentation).
Figure 3.9 Map over Arlandabanan
3.1.3.2 Data from Arlandabanan Data from feasibility study
- Surface mapping
18
o Geologic mapping of the area using SGU Serie Ae, Stockholm NO, skala 1:50 000, 1964 and drawing of the tunnel Plane, profile och normal section.
- Seismic investigations o Seismic refraction
- Hydraulic properties o Hydraulic properties of the rock mass in the tunnel were investigated by
water loss in core holes - Rock types
o The rock mass is dominated by granodiorite with inclusions of younger granite, pegmatite and amphibolites.
- Fracture zones o Homogeneous area low on fracture zones
- Fissure fillings o Fissures in the area is mainly calcite, occasional fissures with chlorite and
clay fillings can be found Drifting data
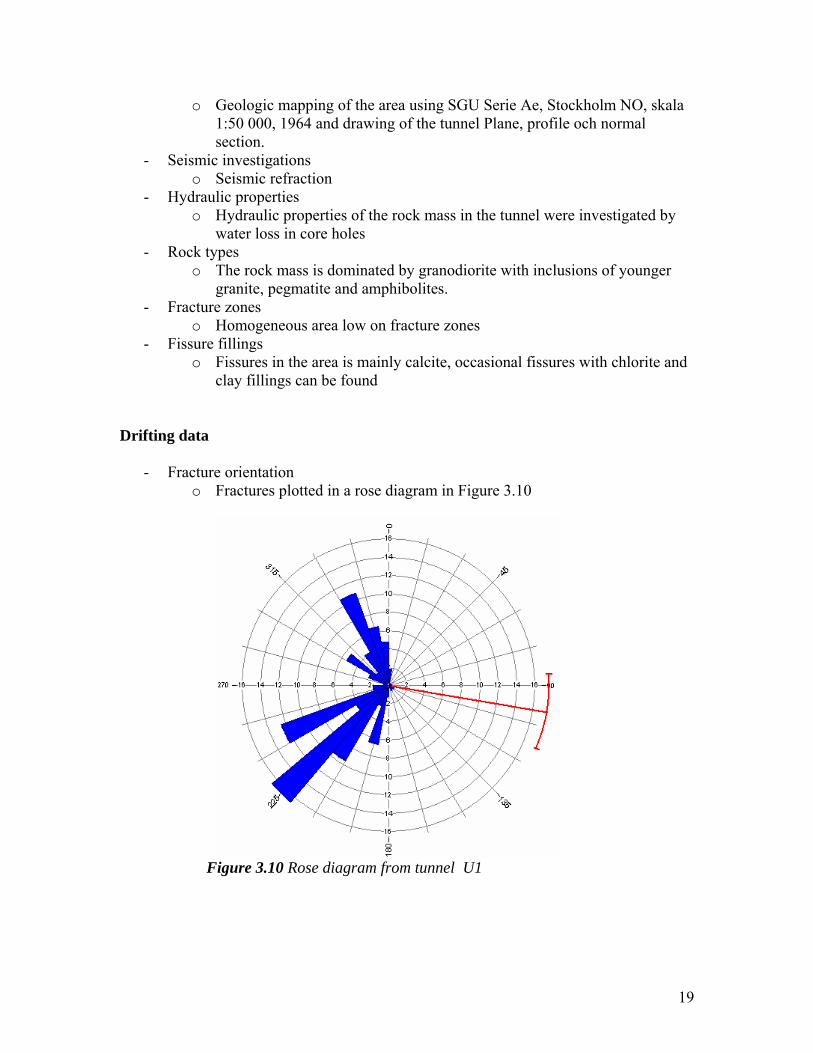
- Fracture orientation
o Fractures plotted in a rose diagram in Figure 3.10
Figure 3.10 Rose diagram from tunnel U1
19

- Rock Quality Designation (RQD)
Rock Quality RQD
Meter of tunnel
Length % of
tunnel Very poor
0-25 0
Poor 25-50 356 8,524904Fair 50-75 1 210 28,9751
Good 75-90 2 090 50,04789Very good
90-100 520 12,45211
4176 100Table 3.8 RQD presented in % of total tunnel length U1
- The joint roughness, joint alteration and number of joint sets presented in table 3.9 as histogram
Table 3.9 Mean value of Jn, Jr and Ja in tunnel U1 Number of joint sets (Jn) ( x ) 3,5 Joint roughness (Jr) ( x ) 3,2 Joint alteration (Ja) ( x ) 1,2
- Q-value
o Q-value data plotted as a histogram, figure 3.11.
Variable Observations Minimum Maximum Mean Std.
deviation Q 232 1,333 40,000 9,003 7,595
20

Histogram (Q)
0
0,1
0,2
0,3
0,4
0,5
0,6
0 20 40 60 80 100
Q
Rel
ativ
e fr
eque
ncy
%
120
Figure 3.11 Histogram over Q-values from Arlanda tunnel U1
Table 3.10 Q presented in % of total tunnel U1 length Q-value tunnel
Proportion in % of tunnel length
>100 0 (0m) 40-100 0 (0m) 10-40 26 (1077m) 4-10 45 (1917m) 1-4 28 (1182m) 0,1- 1 -
- Stuff report o Data is missing
Production data
- Grouting
Table 3.11 Data table over grouting in tunnel U1 at Arlanda Number of grouting screens
Mean distance between sections [m]
Total amount of grout [l]
Total number of holes in the screen
Grout per meters of drill hole [l/m]
289 15 m 1 517 443 l 4 950 st 15 l/m
21
3.2 Statistics
When analysing large amounts of data it is hard to see patterns and similarities between different data sets without using statistical tools. This chapter covers the statistical topics that have been used in this report such as histogram, mean value, standard deviation, variance, probability distribution, and confidence interval.
3.2.1 Histogram
When a large number of results are available, the data can sometimes be hard to evaluate in a regular diagram. To better appreciate the data, constructing a frequency diagram, also called histogram can be useful. This is accomplished by dividing the x axis into intervals of appropriate size and constructing a rectangle over the ith interval with the area proportional to ni, the number (frequency) of observations in that interval (Hunter and Hunter 1978).
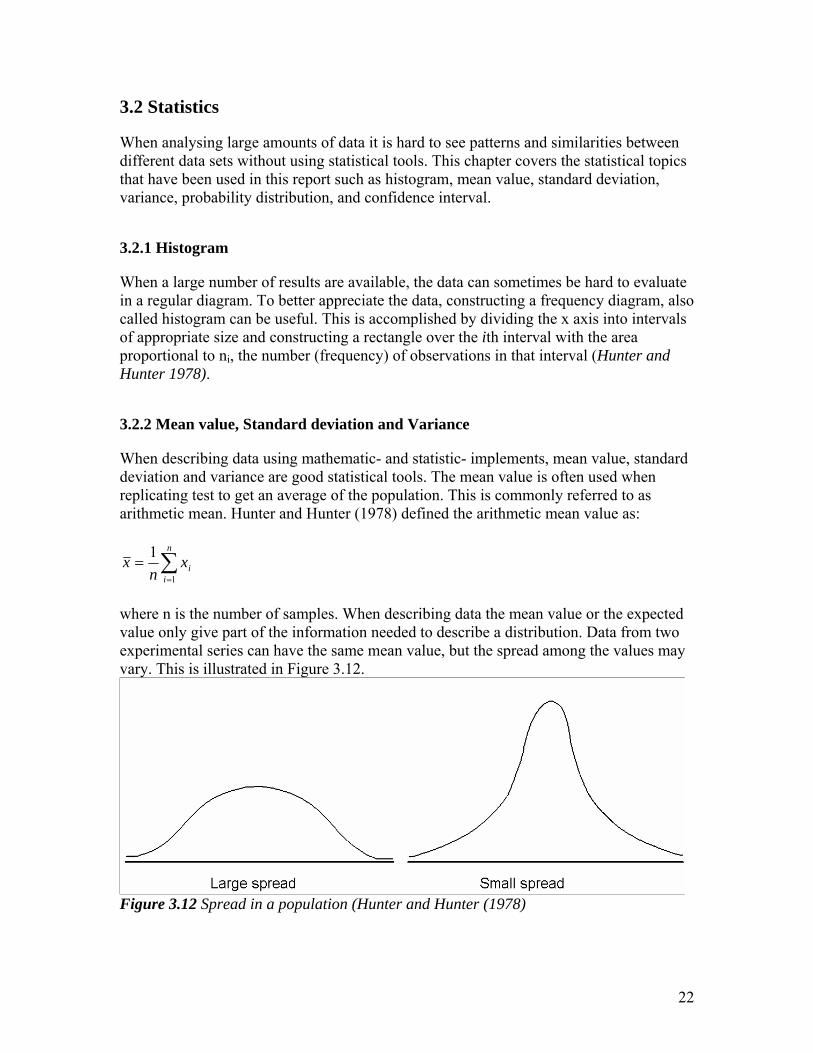
3.2.2 Mean value, Standard deviation and Variance
When describing data using mathematic- and statistic- implements, mean value, standard deviation and variance are good statistical tools. The mean value is often used when replicating test to get an average of the population. This is commonly referred to as arithmetic mean. Hunter and Hunter (1978) defined the arithmetic mean value as:
∑=
=n
iix
nx
1
1
where n is the number of samples. When describing data the mean value or the expected value only give part of the information needed to describe a distribution. Data from two experimental series can have the same mean value, but the spread among the values may vary. This is illustrated in Figure 3.12.
Figure 3.12 Spread in a population (Hunter and Hunter (1978)
22

To describe a distribution also variance and standard deviation is needed to get the spread of the samples. The variance according to Davis (2002):
∑=
−−
=n
ii xx
ns
1
22 )(1
1
and the standard deviation as:
∑=
−−
==n
ii xx
nss
1
22 )(1
1
A small standard deviation indicates a tight spread around the centre value. In opposite, a large standard deviation indicates a wide spread.
3.2.3 Regression analysis
In statistics, regression analysis examines the relationship between responsible variables and the independent variables. In this report simple linear regression using the standard formula below has been used to see how two sets of data fits to each other. Simple linear regression assuming that data can be adapted to a straight line the equation for regression is: y = a + bx + c Where a is the restriction, b is the slope and c is the error term. The x and y terms are the data quantities from the population in question, a and b are the unknown constants that is to be estimated from the data. To derive the a and b values least square method can be used. It is done by minimizing the sum of square error for the given data set. When plotting regression data R2 value is a measurement on how well the data fit each other. The value R2 is a fraction between 0.0 and 1.0, and has no unit. An R2 value of 0.0 means that knowing x does not help you predict y. There is no linear relationship between x and y, and the best-fit line is a horizontal line going through the mean of all y values. When R2 equals 1.0, all points lie exactly on a straight line with no spread. That means knowing x lets you predict y perfectly.
23

4 DISCUSSION Data collected at a normal D&B project, are rock type, section length, rock quality (Q), RQD, grouting, jointing for example. In TBM projects such parameters as torque, rotation speed and cutter head power consumption are the typical parameters registered. As mentioned earlier the data is from three different projects that have been evaluated. The data of most interest in the study will be presented for each project below. In appendix 1 all the data collected from the different projects are available. This discussion can be divided in two parts. Case studies on three of NCCs tunnels and trying to correlate geology with overbreak, and grouting. Evaluation of the Tunconstruct database (UCIS) and to propose changes to be applicable to hard rock geology, especially for D&B tunnels.
4.1 Analysis of data from case studies
For all the projects the main idea has been to find relationships between geology/grouting and geology/overbreak. From the beginning geology/advance rate and geology/rock support where to be part of the study but due to lack of data this was not possible. Advance rate parameters in a D&B projects compared with TBM are different. In TBM projects time is a factor that is easy to measure. The TBM itself keeps track of time, how much it have advanced under a certain time. How long the stops has been and often a logbook over what caused the stops. In D&B projects that are covered in this report the cyclical time is not so well documented, stops are not accounted for and not what caused the stops either. When the time factor is poor, relationship between geology/advance rate is almost impossible to find. In this report none of the projects have any good time relations that can be used to run any analysis on what relationship geology has with advance rate. When comparing rock support with geology the three projects are less suited. Rock support in these projects are all based on what Q classification the rock mass gets when mapping the tunnel. Meaning that from the feasibility study the rock mass quality is divided into classes, where for every rock mass class a given Q-value results in a rock mass support class. One way to be able to establish relationship between geology and rock support is to use another rock classification system e.g. the New Austrian Tunnel Method, NATM. NATM requires more comprehensive geotechnical data and the rock support is more based on a number of factors then merely on the one single parameter as in the Q-system. The data from all the projects were compared using regression, where the R2 value is a measurement on how well the figures converge with each other. The geological parameters that have been used are Jn and RQD. They are parameters in the Q-equation that have the largest effects of the outcome of the Q value. This is
24

discussed later in chapter 4.3. The relationships are presented in chapter 4.2 and the data is presented as graphs for each project.
4.1.1 Löttinge
The Löttinge project is the most recent one and includes the most data. The parameters are also more correlatable to length compared to the other two projects. At Löttinge the best R2 values were found for RQD (figure 4.1) and Jn (figure 4.2) by grouting with 0.151 respectively 0.149. These correlations are quite poor and do not indicate a strong connection between the geologic parameters and grouting although the weak connection indicates that for higher RQD less amount of grout is needed. In figure 4.2 it indicates that with higher Jn more grout is needed.
Regression of RQD by Grouting per meter drill hole[l/m] (R²=0,151)
6065
707580
859095
100
105110
0 5 10 15 20 25
Grouting per meter drill hole[l/m]
RQ
D
Active Model
Conf. interval (Mean 95%) Conf. interval (Obs. 95%)
Figure 4.1 Plot with grouting per meter drill hole against RQD in a regression diagram
25

Regression of Jn by Grouting per meter drill hole[l/m] (R²=0,149)
1,5
2
2,5
3
3,5
4
4,5
5
5,5
0 5 10 15 20 25
Grouting per meter drill hole[l/m]
Jn
Active Model
Conf. interval (Mean 95%) Conf. interval (Obs. 95%)
Figure 4.2 Plot with grouting per meter drill hole against Jn in a regression diagram When plotting RQD and Jn against overbreak the fitting of data in the regression diagram is none or neglectable, with R2 =0.002 for RQD (figure 4.3) and Jn =0.009 (figure 4.4) the values are too scattered to give any indication of the data being connected.
Regression of Jn by Overbreak % (R²=0,002)
1,5
2 2,5
3 3,5
4 4,5
5 5,5
5 10 15 20 25 30 35
Overbreak %
Jn
Active Model
Conf. interval (Mean 95%) Conf. interval (Obs. 95%)
Figure 4.3 Regression diagram presenting Jn plotted by overbreak
26

Regression ofl RQD by Overbreak % (R²=0,009)
60
70
80
90
100
110
120
5 10 15 20 25 30 35
Overbreak %
RQD
Active Model
Conf. interval (Mean 95%) Conf. interval (Obs. 95%)
Figure 4.4 Regression diagram presenting RQD plotted by overbreak
4.1.2 Trollhättetunnel
From the Trollhättetunnel project the data have been hard to acquire because follow up on the geology in the project have not been done and data have not been stored in one place. Some of the data is missing or not digitalized. The grouting data is therefore hard to draw any conclusions from because only about 15 percent of the data is available. The diagrams 4.5 and 4.6 have too few data points to draw any conclusions.
27

Regression of RQD by Grouting per meter drill hole [l/m] (R²=0,155)
50
60
70
80
90
100
110
120
2 4 6 8 10 12 14
Grouting per meter drill hole[l/m]
RQ
D
Active Model
Conf. interval (Mean 95%) Conf. interval (Obs. 95%)
Figure 4.5 Plot with grouting per meter drill hole against RQD in a regression diagram
Regression of Jn by Grouting per meter drill hole[l/m] (R²=0,011)
-1
0
1
2
3
4
5
6
7
8
9
2 4 6 8 10 12 14
Grouting per meter drill hole[l/m]
Jn
Active Model
Conf. interval (Mean 95%) Conf. interval (Obs. 95%)
Figure 4.6 Plot with grouting per meter drill hole against Jn in a regression diagram The regression analysis for overbreak does not give any indications of the data having a linear relationship. With R2 of 0.002 for both RQD and Jn, figure 4.7 and 4.8 the data is too scattered to indicate any correlation.
28

Regression of RQD by Overbreak (R²=0,002)
60
70
80
90
100
110
120
5 10 15 20 25
Overbreak
RQD
Active Model
Conf. interval (Mean 95%) Conf. interval (Obs. 95%)
Figure 4.7 Regression diagram presenting RQD plotted by overbreak
Regression of Jn by Overbreak (R²=0,002)
0
1
2
3
4
5
6
7
8
9
10
5 10 15 20 25
Overbreak
Jn
Active Model
Conf. interval (Mean 95%) Conf. interval (Obs. 95%)
Figure 4.8 Regression diagram presenting RQD plotted by overbreak
4.1.3 Arlanda
The largest set of data was collected at Arlanda. The problem was to correlate the length of the geological mapping with both the grouting screens and the length of the overbreak
29

sections. The geological mapping of the rock mass depends on the length of section available at that time when the grouting was performed. When working with the data it needs to be interpolated so the length of both the geologic mapping and the grouting is the same. Dividing the data after rock type were also done to try and see if this would give any better results using regression analysis. This turned out to show no different results and the diagrams 4.9, 4.10, 4.11 and 4.12 all show the whole set of data without dividing it after rock type.
Regression of RQD by Grouting per meter drill hole[l/m] (R²=0,000)
40
50
60
70
80
90
100
110
0 10 20 30 40
Grouting per meter drill hole[l/m]
RQ
50
D
Active Model
Conf. interval (Mean 95%) Conf. interval (Obs. 95%)
Figure 4.9 Plot with grouting per meter drill hole against RQD in a regression diagram
Regression of Jn by Grouting per meter drill hole[l/m] (R²=0,003)
1
2
3
4
5
6
7
8
9
10
0 10 20 30 40 5
Grouting per meter drill hole[l/m]
Jn
0
Active Model
Conf. interval (Mean 95%) Conf. interval (Obs. 95%)
Figure 4.10 Plot with grouting per meter drill hole against Jn in a regression diagram
30

Regression of Jn by Overbreak % (R²=0,005)
2
3
4
5
6
7
8
9
10
0 10 20 30 40 50 60 70
Overbreak %
Jn
Active Model
Conf. interval (Mean 95%) Conf. interval (Obs. 95%)
Figure 4.11 Regression diagram presenting Jn plotted by overbreak
Regression of RQD by Overbreak % (R²=0,109)
0
20
40
60
80
100
120
0 10 20 30 40 50 60
Overbreak %
RQD
Active Model
Conf. interval (Mean 95%) Conf. interval (Obs. 95%)
Figure 4.12 Regression diagram presenting RQD plotted by overbreak
31

4.2 Establish relationships
When trying to establish relationships between the geology and different parameters the results have not turned as clear as initially. Logically, between geology/overbreak and geology/grouting there should be correlations but when applying statistical analyses there seem to be weak or no correlation, se table 4.1 for all R2 values. The data will be discussed for below. Tunnel RQD/grouting Jn/Grouting RQD/Overbreak Jn/OverbreakLöttinge 0,151 0,149 0,002 0,009 Trollhättetunnel 0,155 0,011 0,002 0,002 Arlanda 0,000 0,003 0,005 0,109 Table 4.1 R2 values for all tunnels.
4.2.1 Geology/grouting
When comparing RQD and Jn with grouting many parameters such as grout hole pattern, grout sequence, grout pressure, flow and volume effected the outcome of the study. In this comparing study that’s been made no obvious correlation was found between geology/grouting. However at Löttinge weak correlations between RQD/grouting and Jn/grouting were found. Indicating that with stronger rock mass less grout is needed. Reasons that it was only at Löttinge these correlations were found could depend on the parameters mentioned above or the fact that there is hard to find statistical correlation between the geological parameters and grouting. Things that could affect the result are; the length reference of the tunnel is not the same for the geological mapping as for the grouting. The parameter Jn that has been used for the statistical analysis does not distinguish between if a joint is open, filled or tight. When grouting a section there may be only one set of joint that has been mapped, but if that joint is open it can be filled with more grout then what should be indicated in the geologic mapping. Recent researches on joints show that water discharge is commonly located to only a few separate joints (Gustafson, 2007). Also the risk of hydraulic fracturing by grouting over pressure needs to be taken into consideration. The phenomenon occurs when the rock mass is deforming due to high pressure. An indication of hydraulic fracturing is an over-proportionally increase of grout take, or water take, if the pressure exceeds a critical value. In hard rock this is not that common whereas soft rock tends to be more sensitive for over pressure.
4.2.2 Geology/overbreak
The analysis of RQD/overbreak and Jn/overbreak gives results that indicate in very poor correlation. Only figure 4.12, RQD/overbreak give indication of a connection where high RQD shows little overbreak. The reason for this weak correlation could be the amount of explosives used was not enough or too much. Too little explosives results in underbreak that has to be removed, giving a false image on how much the overbreak would be. Too much explosives results in a larger overbreak giving a false image of the rock mass. It could also depend on the size of the tunnel which is illustrated in figure 4.13.
32

Problems with tunnel profile size in jointed or strongly foliated rock masses could affect the relationships between geology/overbreak. The small tunnel is located in a single block, indicating intact rock conditions. For the large tunnel profile the rock mass is closely jointed and because the individual rock pieces are small in relation to the overall size of the tunnel it can be evaluated the same as the small tunnel. The midsize tunnel is likely to have problems with overbreak because the joints/foliation are discontinuous resulting in larger overbreaks. However it can be assumed that for the major part of the tunnel lengths in this study the joint pattern would have been similar.
Figure 4.13 Different tunnel profiles in the same kind of rock mass (Edelbro 2003).
4.3 Important parameters in the Q-equation
In the statistical analyses of data, Jn and RQD were used as the main contributing geological parameter. The reasons for that was that in the Q-equation it is the RQD and Jn that have the largest effect on the equation. Another reason is that in theory Jn should have the closest geological connection to overbreak. Because depending on the joints and its orientation the overbreak should be directly affected. The Q-equation is built up from RQD, the number of joint sets (Jn), joint roughness (Jr), joint alteration (Ja), the water conditions (Jw), and the Stress Reduction Factor (SRF), according to the formula:
SRFJ
JJ
JRQDQ w
a
r
n
⋅⋅=
In table 4.1 the relations between the parameters are given. Table 4.1 typical minima and maxima over the Q index. RQD/Jn Jr/Ja Jw/SRF Q index Min 10/20 0.5/0.4 0.05/2 ≈0.001 Max 100/0.5 4/0.75 1/0.5 >2000
33

Given the min Q-value = 0.5 * 1,25 * 0.025 and the max Q-value = 200 * 5.3333 * 2. This tells us that for small values the ratios between the parameters are not that important but for larger RQD/Jn the resulting Q-value changes radically. From the project data the RQD is often closer to 100. This is because all of the projects is situated in bedrock with strong little fracture rock. The joint numbers in the projects are often between 4 and 10, giving high values of the RQD/Jn and that is hardly affected by Jr/Ja and Jw/SRF.
4.4 Evaluation of database structure for use in tunnels driven in hard rock
4.4.1 General comments on the UCIS database structure
The database is under construction and the current version is only a beta version where field and expert rules need to be added to make it more complete. The database so far mainly applicable on TBM tunnels and needs to be modified for D&B. Figure 4.14 illustrates what parameters that are in UCIS and what needs to be added based on results presented.
34

Tunnel data
Data from feasibility study
Drifting data
Production data
Surface mapping
Seismic investigations
Hydraulic properties
Fractures/fissures
Rock support
Rock types
Rock Quality Designation (RQD)
Joint roughness, joint alteration and number of joint
Q-value
Stuff report
Grouting
Advance rate
Cycle time
Overbreak
Figure 4.14 Data available in the three projects, where box is data that is not in UCIS and boxes like is data that is already in UCIS.
4.4.2 Additional data fields needed in UCIS
- Grouting data When grouting a tunnel a large number of factors such as grout hole pattern, grout sequence, grout pressure, flow and volume are of importance, although not all are registered during construction projects. The data from grouting in tunnel projects is either processed using a data logger or registered in a protocol for each section. The data can be after-treated in for example excel to obtain the relationship that is inquired (Dalmalm, 2004). In the projects that have been studied grouting data have been stored from the following
35

parameters; grout pressure, amount of grout (liter and in grams), number of drill holes, and distance between the sections. From this data you calculate the parameter; amount of grout per meter drill hole. From that parameter relation RQD/grouting and Jn/grouting can be evaluated.
- Overbreak Overbreak is a problem in D&B tunnels where the amount of overbreak is a measurement on how the joints/foliation is affecting the tunnel construction. It can also give indications on how the blasting has been performed. To much overbreak results in more rock waste that needs to be transported out of the tunnel and deposited. Overbreak is measured after the tunnels have been blasted, and is the amount of rock in percent as area that have over excavated the given profile of the tunnel. This is done by using a laser, see figure 4.14 In the three different tunnels all overbreak data have been stored as AutoCad files where the given profile and the profile for the overbreak is plotted in a section profile.
Figure 4.14. Exaggerated figure showing overbreak as the filled area around the shown profile.
- Drifting data Drifting data is all drift related information gathered during excavation, such as advance rate, cycle time and mapping data. Advance rate is the speed of progress in the tunnel measured as meter of new tunnel driven per unit of time. In D&B excavation time is often measured in cycles.
The advance rate is continuous until the TBM reaches the limit of extension and the maximum of the thrust arms is reached, then the excavation is stopped. The rear of the TBM is supported and the front of the machine is moved forward as the thrust arms are retracted. The time it takes from arms fully retracted until back to fully retract again is the cycle time for the TBM (Bickel et. al. 1996).
Cycle time is also measured for D&B tunnels and the steps are illustrated in figure 4.15. From the projects that have been studied no cycle time was
36

available. At Löttinge weekly reports on advance rate was available but to inaccurate to be usable as parameter when comparing with geology. For it to be useful the time parameter needs to be in days, most preferably in cycle time. Otherwise it is hard to relate it to geology.
Injection Drilling Blasting Lining Excavation
Figure 4.15 Principal drawing of cycle time for D&B
Mapping data is all the geological parameters that can be viewed in appendix 1. Mapping in underground constructions, where drill and blast is used as a method is done by hand. One person classifies and put together drawings of rock type, structures, number of joint sets, water bearing joints, joint orientations and joint minerals. Also leakage, and drip mapping after lining are referred to as mapping data. In UCIS there are some mapping data referred to as geological data. What needs to be added is the Q-system, its parameters and cycle time.
- Rock support data In tunnel construction rock support is determined by classifying the rock mass. This is done when mapping the tunnel. As described earlier rock support consists of; shotcrete, cement, rock bolts or dowels. When gathering data from tunnel projects the data collected from rock support is; length of bolts, bolt spacing, extra bolts and rock reinforcement class also thickness of shotcrete can be specified but is most common by included in the rock reinforcement class. Rock reinforcement in the projects mentioned are based on what Q-value is determined for the tunnel. In rock mass classification it is common to set, for example three classes, where for each class thickness of shotcrete, distance between bolts and length of bolts are decided.
5 CONCLUSION The UCIS database is mainly based on TBM tunnels, but the UCIS should be applicable for both TBM and D&B. Many of the data parameters are available in UCIS but needs to be modified to fit the D&B projects. The following parameters are missing or needs to be modified to work in UCIS
• Grouting (Grouting per meter of drill hole) • Overbreak (% overbreak) • Rock support data (Rock support class, shotcrete, dowels and rock bolts)
37
• Mapping data ( Q-system, and cycle time. Advance rate is already accounted for in UCIS but needs to be modified to cycle time in order to work for D&B projects)
There are some changes that could be made in a D&B project to make it easier to compare with TBM projects, for example machine data from the drill rig and grouting equipment. This would easily improve the parameters. The results from the case study, were trying to establish relationship between geology and under ground construction parameter. This was not that successful. The data from Löttinge gave weak indications on a correlation between RQD/grouting and Jn/grouting. Indicating that for stronger less fractured rock less amount of grout was needed. All the rest of the analyses where regression was used as a tool did not to give any or weak relationships between geology/overbreak and geology/grouting The conclusion is that the relationship between geology/overbreak is dependent on how much explosives that are used, how closely the rock is jointed/foliated and the size of the tunnel profile. In the comparisons between geology/grouting the conclusion is that the relationship is dependent on grout hole pattern, grout sequence, grout pressure, flow and volume. Also the parameter Jn that has been used for the statistical analysis do not distinguish between if a joint is open, filled or tight.
6 Acknowledgment I am very grateful to my supervisor Sid Patel, NCC, Prof. Jimmy Stigh, and Dr. Lars-Olof Dahlström, NCC, who have guided me through the process and helped me whenever I needed. I would also like to thank Mattias Roslin, NCC for guiding me at Löttinge tunnel and Monika Kontturi, NCC for the interesting and usable visit to Liljeholmen. Great thanks Helge Ahlberg for help with providing data from the different projects. Finally, I would like to thank the staff at NCC Teknik in Göteborg for interesting and rewarding discussions, for their generosity, and for their great breakfast.
7 REFERENCES Hapgood, Fred. 2004. “The Underground Cutting Edge: The innovators who made digging tunnels high-tech”. Invention & Technology v.20, n.2, pp. 42-49.
38

Kawasaki Precision Machinery Ltd. http://www.khi.co.jp/kpm/products/indust_use/boki/tunnel_e.html 2007-06-05. Bougard, I. F.1984. “Different Underground Tunnelling Methods”. Advances in Tunnelling and Subsurface Use, Vol. 4, Nr. 4, pp. 289-315. Waltham, Tony. 2002. “Foundations of engineering geology” 110 pp. Edelbro C. 2003. “Rock Mass Strength – A Review”. Department of Civil and Mining Engineering Division of Rock Mechanics. ISSN: 1402 – 1536. Lindström. M., Lundqvist. J., Lundqvist. T., 2000. ”Sveriges geologi från urtid till nutid”, 530 pp. Dalmalm T., 2004. ”Choice of Grouting Method for Jointed Hard Rock based on Sealing Time Predictions”. KTH Civil and Architectural Engineering, PHD 1006, ISSN 1650-9501. John O. Bickel, Thomas R. Kuesel, Elwyn H. King, 1996. “Tunnel Engineering Handbook”, 528 pp. John C. Davis, 2002. “Statistics and Data Analysis in Geology”, 656 pp. William G. Hunter, J. Stuart Hunter, 1978 “Statistics for Experiments” An Introduction to Design, Data Analysis, and Model Building, 672 pp. Gustafson, G., (2007) Hydraulic properties in hard rock. (In prep Chalmers University of Technology. NCC AB, (2007), Project documentations, Trollhättan, Arlanda and Löttinge (In Swedish). Lundqvist., I., 1997: rock map Vänersborg SO. 104 pp. Goel, R. K., Jethwa, J. L. and Paithankar A.G. (1995). “Correlation between Barton´s Q and Bieniawski´s RMR an new approach, Technical note, Int J. Jock Mech Min., 33., 1 (2) pp. 179-181 Hoek, E. and Brown, E.T. (1988) “The Hoek-Brown failure criterion” – a 1988 update. In: Proc 15th Can Rock Mech Symp. University of Toronto pp. 31-38 Moreno Tallon E., “Application de las classificaciones geomechnicas a los tuneles de parjares. II Cursode Sostenimientos Activosen Galeriasy Tunnels”. , Foundation Gomez-Parto, Madrid (1980).
39
40
Rutledge, J.C., Preston, R.L., (1978). “Experience with engineering classifications of rock for the prediction of tunnel support”. In: Proceedings of the International Tunneling Symposium, Tokyo. p. A-3-1: 7. Recommended reading Bieniawski, Z. T. 1976. “Engineering classification in rock engineering”. Proceedings of the Symposium on Exploation for Rock Engineering, Johannesburg, 97-106. Norwegian soil and rock engineering association. 1998. “Norwegian TBM tunnelling” publication No. 11, 1998. Tarkoy, Peter J. 1995. “Comparing TBMs with drill+bast excavation, Tunnels and Tunnelling” Tunnels and Tunnelling, October 1995. Byram, James E. and Tarkoy, Peter J. 1991.”The advantages of tunnel boring: a qualitative/ quantitative comparison of D&B and TBM excavation”. Hong Kong Engineering, January 1991. Liu, Ya Ching and Shen, Chao-shi. 2006. “A Methodology for evaluating and classification of rock mass quality on tunnel engineering”. Tunnelling and Underground Space Technology 22, 2007, 377-387. Alm, Per-Gunnar and Bjelm, Leif. “The use of a geological model in a cavern construction in limestone”. Geotechnology, Lund University, http://lib.hpu.edu.cn/comp_meeting/ 3/PAPERS/UW/UW0909.PDF. Brewer. T., Daly. S., Åhäll., K-I., 1998. ”Contrasting magmatic arcs in the Palaeoproterozoic of the south-western Baltic Shield”. Precambrian Research. 92, 297-315.

Appendix A. Data from Löttinge From To Rock
type RQD Jn Jr Ja Jw SFR Q Total
amount injection (l)
Numberof
holes
Liter grout for each
hole (l/hole)
Amount of grout/ meter tunnel (l/m)
Grouting/ meter
drillhole [l/m]
Area overbrake
overbrake %
3190 3205 Gnejsgranit 90,00 3,00 3,00 2,00 1,00 1,00 45,00 6827,00 35,00 195,06 341,35 9,75 14,00 10,21 3205 3215 Gnejsgranit 95,00 3,00 4,00 2,00 1,00 1,00 63,33 2167,00 26,00 83,35 98,50 4,17 15,00 10,94 3215 3240 Gnejsgranit 95,00 3,00 4,00 2,00 1,00 1,00 63,33 2458,00 20,00 122,90 111,73 6,15 15,40 11,23 3240 3250 Gnejsgranit 95,00 3,00 4,00 2,00 1,00 1,00 63,33 2715,00 30,00 90,50 246,82 4,53 44,70 32,59 3250 3260 Gnejsgranit 95,00 4,00 4,00 2,00 1,00 1,00 47,50 7005,00 26,00 269,42 350,25 13,47 16,40 11,96 3260 3265 Gnejsgranit 95,00 3,00 4,00 2,00 1,00 1,00 63,33 2605,00 26,00 100,19 130,25 5,01 18,50 13,49 3265 3300 Gnejsgranit 100,00 3,00 4,00 2,00 1,00 1,00 66,67 2391,00 26,00 91,96 119,55 4,60 19,70 14,36 3300 3325 Gnejsgranit 100,00 3,00 4,00 2,00 1,00 1,00 66,67 2783,00 26,00 107,04 139,15 5,35 19,00 13,85 3325 3340 Gnejsgranit 85,00 3,33 3,17 2,00 1,00 1,00 40,38 3425,00 26,00 131,73 171,25 6,59 20,70 15,09 3340 3350 Gnejsgranit 95,00 3,00 4,00 2,00 1,00 1,00 63,33 2428,00 26,00 93,38 134,89 4,67 24,60 17,93 3350 3353 Gnejsgranit 95,00 3,00 4,00 2,00 1,00 1,00 63,33 2940,00 26,00 113,08 147,00 5,65 17,80 12,98 3353 3385 Gnejsgranit 95,00 3,00 4,00 2,00 1,00 1,00 63,33 1778,00 27,00 65,85 59,27 3,29 22,80 16,62 3385 3425 Gnejsgranit 90,00 3,00 4,00 2,00 1,00 1,00 60,00 2559,00 26,00 98,42 134,68 4,92 20,30 14,80 3425 3465 Gnejsgranit 95,00 3,00 4,00 2,00 1,00 1,00 63,33 3230,00 26,00 124,23 161,50 6,21 21,30 15,53 3465 3485 Gnejsgranit 80,00 3,00 4,00 2,00 1,00 1,00 53,33 3106,00 26,00 119,46 155,30 5,97 20,50 14,94 3485 3545 Gnejsgranit 95,00 2,00 4,00 2,00 1,00 1,00 95,00 3185,00 26,00 122,50 159,25 6,13 13,80 10,06 3545 3550 Gnejsgranit 85,00 2,67 3,00 1,33 1,00 2,50 28,69 2666,00 26,00 102,54 148,11 5,13 22,30 16,26 3550 3565 Gnejsgranit 90,00 2,00 3,00 1,00 1,00 2,50 54,00 2923,00 26,00 112,42 132,86 5,62 15,30 11,15 3565 3600 Gnejsgranit 90,00 2,00 3,00 1,00 1,00 2,50 54,00 3546,00 26,00 136,38 186,63 6,82 18,30 13,34 3600 3655 Gnejsgranit 95,00 3,00 3,00 1,00 1,00 2,50 38,00 4349,00 26,00 167,27 217,45 8,36 15,30 11,15 3655 3695 Gnejsgranit 90,00 3,00 3,00 1,00 1,00 2,50 36,00 4049,00 27,00 149,96 213,11 7,50 16,60 12,10 3695 3722 Gnejs 90,00 3,00 3,00 1,00 1,00 2,50 36,00 10317,00 26,00 396,81 332,81 19,84 16,00 11,66 3722 3729 Gnejs 83,33 3,33 3,00 1,33 1,00 2,50 22,50 8669,00 26,00 333,42 433,45 16,67 17,00 12,39 3729 3742 Gnejs 83,33 4,00 3,00 1,67 1,00 2,50 15,00 3220,00 26,00 123,85 201,25 6,19 17,00 12,39
1

From To Rock type
RQD Jn Jr Ja Jw SFR Q Total amount
injection (l)
Numberof
holes
Liter grout for each
hole (l/hole)
Amount of grout/ meter tunnel (l/m)
Grouting/ meter
drillhole [l/m]
Area overbrake
overbrake %
3742 3752 Gnejs 71,67 5,00 2,00 3,33 1,00 1,00 8,60 6374,00 26,00 245,15 303,52 12,26 15,40 11,23 3752 3760 Gnejs 80,00 4,33 2,33 2,67 1,00 1,00 16,15 6877,00 26,00 264,50 343,85 13,23 14,90 10,86 3760 3785 Gnejsgranit 75,00 5,00 2,00 3,00 1,00 1,00 10,00 9241,00 36,00 256,69 462,05 12,83 16,00 11,66 3785 3805 Gnejsgranit 85,00 4,00 2,00 2,00 1,00 1,00 21,25 2792,00 26,00 107,38 139,60 5,37 23,20 16,91 3805 3812 Gnejsgranit 83,33 4,00 2,67 2,67 1,00 1,00 20,83 6671,00 26,00 256,58 370,61 12,83 18,80 13,71 3812 3834 gnejs 83,33 3,33 3,00 2,67 1,00 1,50 18,75 3133,00 26,00 120,50 156,65 6,03 23,70 17,28 3834 3849 Gnejsgranit 81,67 4,00 3,00 2,33 1,00 1,50 17,50 2135,00 26,00 82,12 106,75 4,11 14,90 10,86 3849 3855 Gnejsgranit 75,00 3,67 3,00 2,67 1,00 2,00 11,51 4321,00 26,00 166,19 216,05 8,31 23,70 17,28 3855 3860 Gnejsgranit 73,33 4,00 3,00 3,00 1,00 2,83 6,47 10885,00 26,00 418,65 518,33 20,93 19,90 14,51 3860 3865 Gnejsgranit 71,67 4,00 3,00 3,33 1,00 2,83 5,69 7967,00 26,00 306,42 398,35 15,32 24,00 17,50 3865 3874 Gnejsgranit 71,67 4,33 3,00 3,33 1,00 3,67 4,06 5425,00 26,00 208,65 285,53 10,43 13,90 10,13 3874 3890 Gnejsgranit 78,33 3,67 3,00 3,33 1,00 1,00 19,23 8024,00 26,00 308,62 422,32 15,43 17,00 12,39 3890 3915 Gnejsgranit 78,33 3,67 3,00 2,67 1,00 2,00 12,02 7387,00 26,00 284,12 369,35 14,21 16,30 11,88 3915 3940 Gnejsgranit 75,00 3,67 3,33 2,67 1,00 2,50 10,23 7198,00 28,00 257,07 359,90 12,85 18,60 13,56 3940 3950 Gnejsgranit 85,00 3,00 4,00 2,00 1,00 2,50 22,67 5440,00 26,00 209,23 247,27 10,46 17,40 12,68 3950 3960 Gnejsgranit 85,00 4,00 3,00 2,00 1,00 2,50 12,75 5122,00 26,00 197,00 256,10 9,85 16,30 11,88 3960 3983 Gnejsgranit 95,00 3,00 3,00 2,00 1,00 2,50 19,00 4763,00 26,00 183,19 238,15 9,16 19,00 13,85 3983 4005 Gnejsgranit 90,00 3,00 3,00 2,00 1,00 2,50 18,00 7032,00 26,00 270,46 370,11 13,52 14,30 10,43 4005 4015 Gnejsgranit 90,00 3,00 3,00 4,00 1,00 2,50 9,00 4461,00 26,00 171,58 223,05 8,58 18,30 13,34 4015 4020 Gnejsgranit 76,67 4,00 3,00 6,00 1,00 2,50 3,83 4709,00 26,00 181,12 235,45 9,06 13,80 10,06 4020 4022 Gnejsgranit 76,67 3,67 3,00 7,33 1,00 2,50 3,42 3668,00 26,00 141,08 183,40 7,05 18,20 13,27 4022 4025 Gnejsgranit 83,33 3,33 3,00 5,00 1,00 2,50 6,00 3243,00 26,00 124,73 162,15 6,24 17,70 12,90 4025 4032 Gnejsgranit 90,00 3,00 3,00 3,00 1,00 2,50 12,00 2476,00 26,00 95,23 123,80 4,76 21,10 15,38 4032 4040 Gnejsgranit 90,00 3,00 3,00 2,00 1,00 2,50 18,00 4498,00 26,00 173,00 249,89 8,65 16,70 12,17 4040 4050 Gnejsgranit 91,67 2,67 3,00 2,00 1,00 2,00 25,78 6741,00 26,00 259,27 337,05 12,96 14,10 10,28 4050 4065 Gnejsgranit 95,00 2,00 3,00 2,00 1,00 1,00 71,25 10807,00 65,00 166,26 491,23 8,31 16,20 11,81
2

From To Rock type
RQD Jn Jr Ja Jw SFR Q Total amount
injection (l)
Numberof
holes
Liter grout for each
hole (l/hole)
Amount of grout/ meter tunnel (l/m)
Grouting/ meter
drillhole [l/m]
Area overbrake
overbrake %
4065 4085 Gnejsgranit 90,00 3,00 4,00 2,00 1,00 1,00 60,00 1826,00 6,00 304,33 182,60 15,22 20,90 15,24 4085 4098 Gnejsgranit 90,00 2,67 3,00 1,67 1,00 1,00 60,75 6570,00 35,00 187,71 547,50 9,39 17,60 12,83 4098 4102 Gnejsgranit 90,00 2,33 3,00 1,33 1,00 1,00 86,79 5940,00 35,00 169,71 297,00 8,49 13,00 9,48 4102 4112 Gnejsgranit 76,67 3,33 3,00 5,00 1,00 1,00 13,80 6648,00 35,00 189,94 332,40 9,50 16,00 11,66 4112 4125 Gnejsgranit 73,33 4,00 3,00 5,33 1,00 1,00 10,31 6597,00 31,00 212,81 329,85 10,64 16,40 11,96 4125 4140 Gnejsgranit 73,33 4,00 3,00 5,33 1,00 1,00 10,31 8507,00 47,00 181,00 425,35 9,05 19,50 14,22 4140 4145 Gnejsgranit 71,67 4,00 3,00 5,33 1,00 1,00 10,08 9104,00 44,00 206,91 433,52 10,35 19,00 13,85 4145 4152 Gnejsgranit 80,00 4,00 3,00 5,33 1,00 1,00 11,25 3916,00 26,00 150,62 186,48 7,53 19,50 14,22 4152 4155 Gnejsgranit 85,00 4,00 3,00 2,00 1,00 1,00 31,88 4755,00 26,00 182,88 237,75 9,14 16,10 11,74 4155 4175 Gnejsgranit 85,00 4,00 3,00 2,00 1,00 1,00 31,88 9882,00 35,00 282,34 494,10 14,12 17,60 12,83 4175 4195 Gnejsgranit 90,00 4,00 3,00 2,00 1,00 1,00 33,75 13952,00 36,00 387,56 697,60 19,38 15,60 11,37 4195 4205 Gnejsgranit 90,00 4,00 3,00 2,00 1,00 1,00 33,75 12131,00 65,00 186,63 638,47 9,33 21,80 15,89
3

Appendix B. Data from Trollhättetunnel From To Rock
type Color RQD Jn Jr Ja Jw SRF Q Total
amount injection (l)
Number of
holes
Liter grout for each
hole (l/hole)
Amount of grout/ meter tunnel
(l/m)
Grouting/ meter
drillhole [l/m]
overbrake %
990 1040 Gnejs Röd-svart 100 3 2 1 1 2,5 20 6604 25 264,16 132,08 12,57904762 20,971080 1120 Gnejs Svart-röd 90 3 2 1 1 2,5 18 3786 25 151,44 94,65 7,211428571 15,821170 1204 Gnejs Svart-röd 100 2 2 1 1 2,5 30 4313 25 172,52 126,8529412 8,215238095 13,851260 1300 Gnejs Svart-röd 100 3 2 1 1 2,5 27 25 0 0 0 10,71300 1320 Granit Svart-röd 100 3 2 2 1 2,5 10 25 0 0 0 15,161320 1345 Gnejs Röd-svart 90 4 2 1 1 2,5 13,5 25 0 0 0 12,931345 1365 Granit Svart-röd 100 3 3 1 1 2,5 40 25 0 0 0 18,141365 1390 Granit Svart-röd 100 2 2 1 1 2,5 40 25 0 0 0 12,741390 1420 Gnejs Svart-röd 100 3 2 1 1 2,5 20 25 0 0 0 11,951440 1480 Granit Svart-röd 80 6 2 2 1 2,5 4 25 0 0 0 13,031530 1560 Gnejs Svart-röd 100 3 3 1 1 2,5 33 25 0 0 0 141560 1600 Gnejs Röd-svart 100 3 2 1 1 2,5 20 25 0 0 0 12,81665 1740 Gnejs Röd-svart 95 3 2 1 1 2,5 19 25 0 0 0 9,41740 1770 Gnejs Röd-svart 100 2 2 1 1 2,5 30 25 0 0 0 13,982000 2030 Gnejs Svart-röd 100 2 2 1 1 2,5 30 25 0 0 0 15,432030 2080 Granit Röd-svart 80 4 2 1 1 2,5 12 25 0 0 0 122080 2130 Granit Röd-svart 100 4 2 1 1 2,5 20 25 0 0 0 14,232130 2175 Granit Röd 100 4 2 1 1 2,5 15 25 0 0 0 13,582175 2220 Granit Röd-svart 100 4 2 1 1 2,5 15 25 0 0 0 18,872220 2260 Granit Röd-svart 100 6 3 1 1 2,5 20 25 0 0 0 17,152290 2320 Granit Röd-svart 100 4 2 2 1 2,5 7,5 25 0 0 0 16,642320 2350 Granit Röd-svart 80 9 2 2 1 2,5 3 25 0 0 0 14,162420 2435 Granit Röd 75 3 2 4 1 2,5 4 25 0 0 0 12,412480 2500 Granit Röd 95 3 2 1 1 2,5 19 25 0 0 0 14,4
4

From To Rock type
Color RQD Jn Jr Ja Jw SRF Q Total amount
injection (l)
Number of
holes
Liter grout for each
hole (l/hole)
Amount of grout/ meter tunnel
(l/m)
Grouting/ meter
drillhole [l/m]
overbrake %
2505 2535 Granit Röd 100 2 2 1 1 2,5 30 25 0 0 0 15,72
2535 2540 Granit Röd till rödgrå 95 3 2 1 1 2,5 19 25 0 0 0 19,32
2580 2630 Granit svart-röd 100 3 2 1 1 2,5 20 25 0 0 0 17,632655 2665 Granit Röd 95 3 2 1 1 2,5 19 25 0 0 0 20,152665 2685 Granit Röd 95 4 2 1 1 2,5 14,3 25 0 0 0 19,182685 2700 Granit Svart-röd 93 6 2 1 1 2,5 9,3 25 0 0 0 13,332700 2715 Granit Grå-röd 90 6 2 3 1 2,5 3 25 0 0 0 15,22715 2725 Granit Röd-grå 100 3 2 1 1 2,5 20 25 0 0 0 13,622725 2760 Granit Röd-grå 90 6 2 1 1 2,5 9 1744 25 69,76 49,82857143 3,321904762 15,452760 2790 Granit röd-grå 85 3 2 1 1 2,5 17 5993 25 239,72 199,7666667 11,4152381 172790 2820 Granit röd-grå 90 3 2 1 1 2,5 18 2612 25 104,48 87,06666667 4,975238095 11,482820 2845 Granit rödgrå 95 3 2 1 0,67 2,5 13 4118 25 164,72 164,72 7,843809524 12,632845 2870 Granit rödgrå 90 6 2 1 1 2,5 9 6518 25 260,72 260,72 12,4152381 14,652870 2900 Granit röd-grå 95 3 2 1 1 2,5 19 5852 25 234,08 195,0666667 11,14666667 11,553105 3120 Gnejs svartröd 90 6 2 1 1 2,5 9 2226 25 89,04 148,4 4,24 13,71
3120 3165 Gnejs
Svart/mörk till svart-röd 95 6 2 1 1 2,5 10 6672 25 266,88 148,2666667 12,70857143 15,78
3220 3250 Gnejs Svart-röd 60 4 2 1 1 2,5 9 2623 25 104,92 87,43333333 4,996190476 15,63250 3270 Gnejs Röd-svart 85 3 2 1 1 2,5 23 25 0 0 0 19,983270 3300 Granit Röd 90 2 2 1 1 2,5 36 25 0 0 0 11,93415 3460 Gnejs Svart-röd 90 4 3 1 1 2,5 27 25 0 0 0 18,713490 3510 Gnejs Svart-röd 60 9 2 6 1 2,5 1 25 0 0 0 14,23565 3595 Gnejs Röd-svart 80 6 2 1 1 2,5 8 25 0 0 0 12,963595 3615 Gnejs Svart-röd 70 6 2 1 1 2,5 7 25 0 0 0 18,863615 3635 Gnejs Svart 80 4 2 1 1 2,5 16 25 0 0 0 12,73635 3680 Granit Röd 80 9 2 1 1 2,5 5 25 0 0 0 15,653850 3925 Gnejs Svart-röd 95 3 2 1 1 2,5 19 25 0 0 0 12,41
5

Appendix C. Data from Arlanda
Från Till Ba RQD Jn Jr Ja Jw SRF Q Total amount injection
(l)
Number of
holes
Grouting/ meter
drillhole [l/m]
Amount of grout/ meter tunnel (l/m)
Area overbrake
36875 36880 GLG 85 4 1,5 1 0,67 2,5 8,54 - - - - 36880 37000 GLG 85 6 2 1 1 2,5 11,33 - - - - 37039 37065 GRD 90 6 1,5 1 1 2,5 9,00 - - - - 37065 37071 GRD 85 4 2 2 1 2,5 8,50 - - - - 37071 37077 GRD 80 4 2 2 1 2,5 8,00 - - - - 37077 37102 GRD 80 4 2 2 1 2,5 8,00 - - - - 37102 37107 GRD 80 6 1,5 1,5 1 2,5 5,33 3682,51 20,00 9,21 368,25 37112 37144 GRD 80 6 1,5 1 1 2,5 8,00 755,16 18,00 2,10 94,39 37144 37158 GRD 80 6 1,5 1,5 1 2,5 5,33 2975,78 22,00 6,76 212,56 21,5437158 37163 GRD 90 6 2 1 1 2,5 12,00 702,24 22,00 1,60 63,84 15,4437285 37290 GRD 80 6 2 1 1 2,5 10,67 - - - - 0,0037290 37295 GRD 90 6 2 1 1 2,5 12,00 - - - - 0,0037295 37300 GRD 90 6 2 1 1 2,5 12,00 2284,30 21,00 5,44 28,00 26,0237317 37322 GRD 80 6 2 1,5 1 2,5 7,11 3976,68 20,00 9,94 568,10 13,0737322 37328 GRD 85 6 1,5 1,5 1 2,5 5,67 6680,72 22,00 15,18 334,04 9,2737328 37333 GRD 90 6 1,5 1,5 1 2,5 6,00 4642,15 22,00 10,55 244,32 14,0537333 37338 GRD 80 6 1,5 1,5 1 2,5 5,33 4671,75 21,00 11,12 291,98 15,1837338 37350 GRD 80 6 2 2 1 2,5 5,33 4700,45 21,00 11,19 361,57 13,7237350 37355 GRD 80 6 2 2 1 2,5 5,33 5134,53 18,00 14,26 302,03 12,9937355 37360 GRD 90 6 1,5 1,5 1 2,5 6,00 3260,99 20,00 8,15 191,82 9,3837360 37366 GRD 90 6 2 2 1 2,5 6,00 3393,72 20,00 8,48 188,54 15,1537366 37387 GRD 80 6 1,5 1 1 2,5 8,00 2227,80 20,00 5,57 171,37 35,8837387 37419 GRD 80 6 1,5 1,5 1 2,5 5,33 1964,13 19,00 5,17 115,54 14,5637419 37424 GRD 90 4 1,5 1,5 1 2,5 9,00 782,96 17,00 2,30 52,20 15,9937424 37430 GRD 70 6 1,5 2 1 2,5 3,50 1804,48 22,00 4,10 90,22 17,56
6

Från Till Ba RQD Jn Jr Ja Jw SRF Q Total amount injection
(l)
Number of
holes
Grouting/ meter
drillhole [l/m]
Amount of grout/ meter tunnel (l/m)
Area overbrake
37430 37435 GRD 80 6 1,5 2 1 2,5 4,00 382,96 18,00 1,06 25,53 11,3237435 37440 GLS 80 6 1,5 1,5 1 2,5 5,33 453,81 19,00 1,19 30,25 8,4737440 37445 GRD 80 6 1,5 1,5 1 2,5 5,33 4348,88 20,00 10,87 289,93 11,5037445 37450 GRD 85 6 1,5 1,5 1 2,5 5,67 7528,25 24,00 15,68 376,41 18,4037450 37456 GRD 80 6 1,5 2 1 2,5 4,00 12191,03 19,00 32,08 1741,58 23,5137456 37461 GRD 80 9 2 2 1 2,5 3,56 5116,59 22,00 11,63 284,26 15,3737461 37466 GLS 70 6 1,5 2 1 2,5 3,50 1767,71 20,00 4,42 353,54 38,5837466 37472 GLG 70 6 1,5 2 1 2,5 3,50 1690,58 14,00 6,04 169,06 43,1437472 37477 GLG 70 6 1,5 2 1 2,5 3,50 2750,67 22,00 6,25 161,80 14,8937477 37482 GLG 70 6 1,5 1,5 1 2,5 4,67 2252,91 22,00 5,12 112,65 13,8037482 37520 GRD 80 6 1,5 1,5 1 2,5 5,33 2163,23 20,00 5,41 - 0,0037520 37525 GRD 80 6 1,5 1 1 2,5 8,00 - - - - 0,0037882 37870 GRD 40 6 2 4 1 2,5 1,33 - - - - 24,0937887 37882 GRD 40 9 1,5 2 1 2,5 1,33 - - - - 21,5737895 37887 GRD 50 6 2 2 1 2,5 3,33 - - - - 19,9737899 37895 GRD 70 6 2 2 1 2,5 4,67 - - - - 24,2737904 37899 GRD 70 6 2 2 1 2,5 4,67 - - - - 15,5937913 37904 GRD 75 6 2 2 1 2,5 5,00 - - - - 23,0037918 37913 GRD 70 6 2 1 1 2,5 9,33 6980,27 18,00 19,39 410,60 15,9537923 37919 GRD 70 6 2 1 1 2,5 9,33 2604,48 18,00 7,23 153,20 15,9137927 37923 GRD 90 6 2 1 1 2,5 12,00 2669,96 19,00 7,03 205,38 15,9537932 37927 GRD 90 4 1,5 1 1 2,5 13,50 2076,23 18,00 5,77 138,42 21,7937938 37932 GRD 90 6 1,5 1 1 2,5 9,00 1237,67 18,00 3,44 68,76 20,0037942 37938 GRD 95 4 1,5 1 1 2,5 14,25 3441,26 19,00 9,06 245,80 15,2238240 38245 GLS 80 4 1,5 1,5 1 2,5 8,00 1519,28 18,00 4,22 108,52 24,6038245 38257 GLS 80 4 1,5 1 1 2,5 12,00 3019,73 18,00 8,39 94,37 24,8938257 38263 GLS 70 4 1 1 1 2,5 7,00 1217,94 18,00 3,38 87,00 25,00
7

Från Till Ba RQD Jn Jr Ja Jw SRF Q Total amount injection
(l)
Number of
holes
Grouting/ meter
drillhole [l/m]
Amount of grout/ meter tunnel (l/m)
Area overbrake
38263 38267 GLS 80 6 1,5 1 1 2,5 8,00 2150,67 18,00 5,97 134,42 15,2238267 38270 GLS 80 6 1,5 1 0,6 2,5 4,80 1532,74 18,00 4,26 85,15 14,8638270 38277 GLS 80 6 1,5 1 1 2,5 8,00 2822,42 17,00 8,30 217,11 14,1338277 38281 GLS 70 6 1,5 2 1 2,5 3,50 5098,65 18,00 14,16 339,91 21,6138281 38285 GLG 70 6 1,5 2 1 2,5 3,50 1458,30 20,00 3,65 91,14 17,4538285 38290 GLS 70 6 1,5 2 1 2,5 3,50 6949,78 18,00 19,30 408,81 13,1438290 38294 GLG 60 6 2 1,5 1 2,5 5,33 8200,00 13,00 31,54 630,77 18,9138294 38298 GLS 70 6 2 1,5 1 2,5 6,22 1260,09 13,00 4,85 84,01 10,2638298 38303 GLS 60 6 2 1,5 1 2,5 5,33 7222,42 29,00 12,45 656,58 25,7338303 38309 GLS 80 6 2 1,5 1 2,5 7,11 - - - - 17,5238309 38314 GLS 80 6 2 1,5 1 2,5 7,11 - - - - 0,0038314 38319 GLG 80 6 1,5 2 1 2,5 4,00 - - - - 21,3238318 38323 GLG 80 6 1,5 1,5 1 2,5 5,33 - - - - 26,5738323 38348 GLG 80 9 1,5 1,5 1 2,5 3,56 - - - - 19,9738348 38352 GLG 85 6 1,5 1,5 1 2,5 5,67 - - - - 19,7838352 38357 GLG 80 4 1,5 1 1 2,5 12,00 - - - - 21,1338357 38370 GLG 80 4 1,5 1 1 2,5 12,00 - - - - 16,2138370 38397 KvGneis 85 4 2 1 1 2,5 17,00 - - - - 34,4638397 38402 GLG 90 4 2 1 1 2,5 18,00 - - - - 21,8638402 38407 GLG 90 4 2 1 1 2,5 18,00 - - - - 15,2938407 38421 GLG 90 6 1,5 1 1 2,5 9,00 - - - - 14,5338421 38426 GLG 90 6 2 1 1 2,5 12,00 - - - - 15,3338426 38450 GLG 85 6 1,5 1 1 2,5 8,50 4115,70 21,00 9,80 293,98 12,9238450 38517 GLG 80 6 2 1 1 2,5 10,67 3599,10 22,00 8,18 239,94 17,2338517 38522 GLS 70 6 1,5 1 1 2,5 7,00 965,02 21,00 2,30 53,61 37,1638522 38527 GLS 70 6 1,5 1 1 2,5 7,00 - - - - 19,3138527 38531 GLG 70 6 1,5 1 1 2,5 7,00 5409,87 23,00 11,76 540,99 11,50
8

Från Till Ba RQD Jn Jr Ja Jw SRF Q Total amount injection
(l)
Number of
holes
Grouting/ meter
drillhole [l/m]
Amount of grout/ meter tunnel (l/m)
Area overbrake
38531 38536 GLG 60 4 2 1 1 2,5 12,00 6353,36 21,00 15,13 276,23 26,1338536 38541 GLG 60 9 1,5 1 1 2,5 4,00 6922,87 22,00 15,73 532,53 15,9138541 38546 GLS 60 9 2 1 1 2,5 5,33 4487,00 22,00 10,20 263,94 16,0638546 38572 GLS 50 6 2 1 1 2,5 6,67 4597,31 18,00 12,77 255,41 14,8938572 38575 GLG 80 4 1,5 1 1 2,5 12,00 2623,32 9,00 14,57 145,74 58,8738575 38606 GLG 70 6 1,5 1 1 2,5 7,00 2131,84 11,00 9,69 133,24 18,8738606 38611 GLS 70 9 1,5 1 1 2,5 4,67 3777,58 18,00 10,49 269,83 18,7238611 38617 GLS 70 9 1,5 1 1 2,5 4,67 6678,03 17,00 19,64 445,20 15,3338617 38622 GLS 70 9 1,5 1 1 2,5 4,67 9910,31 18,00 27,53 660,69 15,0438626 38688 GRD 60 6 1,5 1 1 2,5 6,00 3043,95 11,00 13,84 169,11 24,6438688 38693 GLG 70 4 1,5 1 1 2,5 10,50 6534,53 12,00 27,23 544,54 20,0838695 38799 GLS 60 6 1,5 1 1 2,5 6,00 7451,12 12,00 31,05 496,74 28,3638798 38800 GLS 70 4 1,5 1 1 2,5 10,50 1600,00 14,00 5,71 100,00 26,5038800 38812 GLS 70 6 1,5 1 1 2,5 7,00 6963,23 14,00 24,87 535,63 27,4538812 38840 GLS 70 9 1,5 1 1 2,5 4,67 1752,47 15,00 5,84 146,04 30,4838840 38845 GLG 80 6 1,5 1 1 2,5 8,00 3002,69 18,00 8,34 142,99 16,2438845 38850 GLG 75 4 1,5 1 1 2,5 11,25 2563,23 18,00 7,12 1281,61 11,1738850 38855 GLG 70 4 1,5 1 1 2,5 10,50 3504,93 14,00 12,52 152,39 0,0038855 38860 GLS 70 9 1,5 1 1 2,5 4,67 3504,93 14,00 12,52 175,25 13,0338860 38865 GLS 70 6 1,5 1 1 2,5 7,00 1726,46 14,00 6,17 345,29 10,7338865 38870 GLS 75 6 1,5 1,5 1 2,5 5,00 1687,00 13,00 6,49 153,36 9,2738870 38875 GLS 70 6 1,5 1 1 2,5 7,00 4333,63 14,00 15,48 228,09 15,7038875 38880 GLS 70 6 1,5 1 1 2,5 7,00 5820,63 15,00 19,40 447,74 9,8938880 38885 GLS 80 4 1,5 1 1 2,5 12,00 1183,86 14,00 4,23 69,64 8,1838885 38890 GLS 80 4 1,5 1 1 2,5 12,00 1556,95 18,00 4,32 155,70 9,5638890 38895 GLS 70 4 1,5 1 1 2,5 10,50 1629,60 13,00 6,27 - 13,9138895 38900 GLG 80 4 1,5 1 1 2,5 12,00 - - - - 0,00
9

Från Till Ba RQD Jn Jr Ja Jw SRF Q Total amount injection
(l)
Number of
holes
Grouting/ meter
drillhole [l/m]
Amount of grout/ meter tunnel (l/m)
Area overbrake
38911 38900 GLS 75 4 1,5 1 1 2,5 11,25 1530,00 11,00 6,95 102,00 25,7038900 38905 GLG 75 6 1,5 1,5 1 2,5 5,00 1824,00 11,00 8,29 152,00 25,2638924 38911 GLS 75 4 1,5 1,5 1 2,5 7,50 2519,00 8,00 15,74 1259,50 23,0338937 38991 GLG 80 4 1,5 1 1 2,5 12,00 3658,00 12,00 15,24 281,38 26,1338991 39006 GLS 80 4 1,5 1 1 2,5 12,00 3179,00 12,00 13,25 227,07 28,1139016 39011 GLS 80 6 1,5 1 1 2,5 8,00 1328,00 11,00 6,04 102,15 25,2239019 39016 PEG 80 6 1,5 1 1 2,5 8,00 3141,00 13,00 12,08 209,40 21,5439025 39019 GLS 80 6 1,5 1,5 1 2,5 5,33 2426,00 12,00 10,11 134,78 23,6939030 39025 PEG 50 6 1,5 1 1 2,5 5,00 2800,00 12,00 11,67 233,33 33,7639034 39030 PEG 70 6 1,5 1,5 1 2,5 4,67 3130,00 12,00 13,04 195,63 24,9739039 39034 GLS 80 6 1,5 1 1 2,5 8,00 2840,00 12,00 11,83 258,18 20,3339044 39049 GLS 70 6 1,5 1 1 2,5 7,00 2322,00 13,00 8,93 165,86 17,3739060 39054 GLS 70 9 1,5 1 1 2,5 4,67 1400,00 13,00 5,38 107,69 24,2739064 39094 GLS 70 9 1,5 1,5 1 2,5 3,11 2610,00 11,00 11,86 174,00 20,2639103 39099 GLS 60 6 1,5 2 1 2,5 3,00 4829,00 13,00 18,57 344,93 19,9739108 39103 GLS 60 6 1,5 1 1 2,5 6,00 2574,00 12,00 10,73 160,88 22,1239112 39108 GLS 70 6 1,5 1,5 1 2,5 4,67 1881,00 13,00 7,23 134,36 26,1739117 39112 GLS 70 6 1,5 1,5 1 2,5 4,67 1849,00 13,00 7,11 132,07 22,2339122 39117 GLS 70 6 1,5 1 1 2,5 7,00 3343,00 13,00 12,86 222,87 27,3439127 39122 GLS 60 6 1,5 1 1 2,5 6,00 2874,00 14,00 10,26 221,08 23,6539132 39127 GLS 60 6 1,5 1 1 2,5 6,00 2121,00 14,00 7,58 141,40 22,8939137 39132 GLS 60 6 1,5 1 1 2,5 6,00 2887,00 15,00 9,62 222,08 21,7239142 39238 GLG 80 6 1,5 1 1 2,5 8,00 2801,00 13,00 10,77 164,76 18,6239247 39278 GRD 50 6 1,5 1 1 2,5 5,00 3637,00 15,00 12,12 259,79 23,1439285 39297 GLS 50 4 2 1 1 2,5 10,00 3798,00 15,00 12,66 271,29 30,6639312 39336 GLS 40 4 1,5 1,5 1 2,5 4,00 5313,00 16,00 16,60 354,20 28,4739351 39341 GLS 70 6 2 1 1 2,5 9,33 3819,00 14,00 13,64 293,77 32,08
10
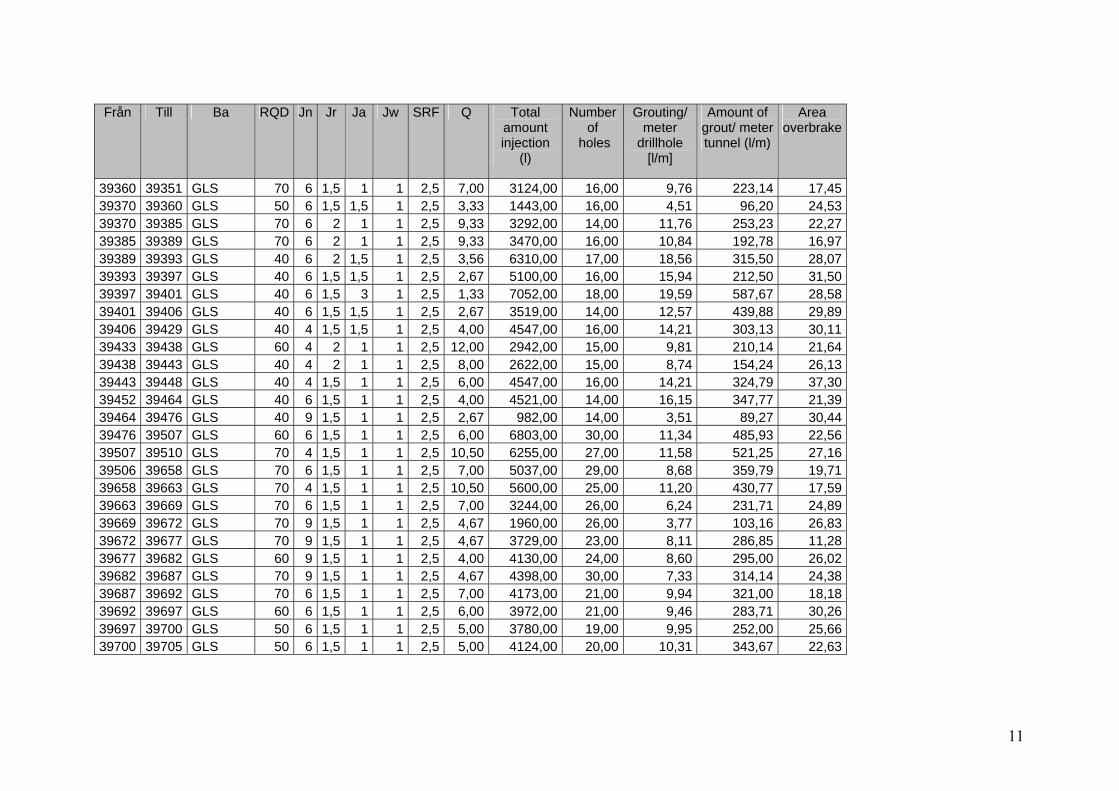
Från Till Ba RQD Jn Jr Ja Jw SRF Q Total amount injection
(l)
Number of
holes
Grouting/ meter
drillhole [l/m]
Amount of grout/ meter tunnel (l/m)
Area overbrake
39360 39351 GLS 70 6 1,5 1 1 2,5 7,00 3124,00 16,00 9,76 223,14 17,4539370 39360 GLS 50 6 1,5 1,5 1 2,5 3,33 1443,00 16,00 4,51 96,20 24,5339370 39385 GLS 70 6 2 1 1 2,5 9,33 3292,00 14,00 11,76 253,23 22,2739385 39389 GLS 70 6 2 1 1 2,5 9,33 3470,00 16,00 10,84 192,78 16,9739389 39393 GLS 40 6 2 1,5 1 2,5 3,56 6310,00 17,00 18,56 315,50 28,0739393 39397 GLS 40 6 1,5 1,5 1 2,5 2,67 5100,00 16,00 15,94 212,50 31,5039397 39401 GLS 40 6 1,5 3 1 2,5 1,33 7052,00 18,00 19,59 587,67 28,5839401 39406 GLS 40 6 1,5 1,5 1 2,5 2,67 3519,00 14,00 12,57 439,88 29,8939406 39429 GLS 40 4 1,5 1,5 1 2,5 4,00 4547,00 16,00 14,21 303,13 30,1139433 39438 GLS 60 4 2 1 1 2,5 12,00 2942,00 15,00 9,81 210,14 21,6439438 39443 GLS 40 4 2 1 1 2,5 8,00 2622,00 15,00 8,74 154,24 26,1339443 39448 GLS 40 4 1,5 1 1 2,5 6,00 4547,00 16,00 14,21 324,79 37,3039452 39464 GLS 40 6 1,5 1 1 2,5 4,00 4521,00 14,00 16,15 347,77 21,3939464 39476 GLS 40 9 1,5 1 1 2,5 2,67 982,00 14,00 3,51 89,27 30,4439476 39507 GLS 60 6 1,5 1 1 2,5 6,00 6803,00 30,00 11,34 485,93 22,5639507 39510 GLS 70 4 1,5 1 1 2,5 10,50 6255,00 27,00 11,58 521,25 27,1639506 39658 GLS 70 6 1,5 1 1 2,5 7,00 5037,00 29,00 8,68 359,79 19,7139658 39663 GLS 70 4 1,5 1 1 2,5 10,50 5600,00 25,00 11,20 430,77 17,5939663 39669 GLS 70 6 1,5 1 1 2,5 7,00 3244,00 26,00 6,24 231,71 24,8939669 39672 GLS 70 9 1,5 1 1 2,5 4,67 1960,00 26,00 3,77 103,16 26,8339672 39677 GLS 70 9 1,5 1 1 2,5 4,67 3729,00 23,00 8,11 286,85 11,2839677 39682 GLS 60 9 1,5 1 1 2,5 4,00 4130,00 24,00 8,60 295,00 26,0239682 39687 GLS 70 9 1,5 1 1 2,5 4,67 4398,00 30,00 7,33 314,14 24,3839687 39692 GLS 70 6 1,5 1 1 2,5 7,00 4173,00 21,00 9,94 321,00 18,1839692 39697 GLS 60 6 1,5 1 1 2,5 6,00 3972,00 21,00 9,46 283,71 30,2639697 39700 GLS 50 6 1,5 1 1 2,5 5,00 3780,00 19,00 9,95 252,00 25,6639700 39705 GLS 50 6 1,5 1 1 2,5 5,00 4124,00 20,00 10,31 343,67 22,63
11

Från Till Ba RQD Jn Jr Ja Jw SRF Q Total amount injection
(l)
Number of
holes
Grouting/ meter
drillhole [l/m]
Amount of grout/ meter tunnel (l/m)
Area overbrake
39705 39710 GLS 60 6 1,5 1 1 2,5 6,00 2891,00 20,00 7,23 192,73 13,5439710 39715 GLS 60 6 1,5 1 1 2,5 6,00 6334,00 22,00 14,40 452,43 16,1039715 39719 GLS 50 6 1,5 1 1 2,5 5,00 3765,00 19,00 9,91 251,00 9,1639719 39742 GLS 50 6 1,5 1 1 2,5 5,00 3743,00 18,00 10,40 267,36 28,6239742 39762 GLS 50 9 1,5 1 1 2,5 3,33 5048,00 20,00 12,62 360,57 21,3239762 39767 GLS 70 6 1,5 1,5 1 2,5 4,67 5138,00 18,00 14,27 395,23 32,0839767 39772 GLS 70 4 1,5 1,5 1 2,5 7,00 3950,00 17,00 11,62 263,33 13,6939772 39777 GLG 60 9 1,5 1,5 1 2,5 2,67 3409,00 17,00 10,03 340,90 18,6539777 39780 GLS 65 9 1,5 1 1 2,5 4,33 3916,00 21,00 9,32 150,62 20,4439780 39785 GLS 70 9 1,5 1,5 1 2,5 3,11 8341,00 20,00 20,85 320,81 14,4239785 39797 GLS 60 9 1,5 1,5 1 2,5 2,67 5008,00 21,00 11,92 357,71 15,1539797 39801 GLS 75 6 1,5 1,5 1 2,5 5,00 3582,00 18,00 9,95 255,86 12,9939801 39811 GLS 80 6 1,5 1 1 2,5 8,00 3986,00 24,00 8,30 249,13 17,7039811 39872 GLS/GLG 75 9 1,5 1,5 1 2,5 3,33 2205,00 19,00 5,80 169,62 18,6539872 39876 GRD 100 6 1,5 1,5 1 2,5 6,67 3449,00 20,00 8,62 - 13,8339885 39880 GRD 100 6 2 1 1 2,5 13,33 6504,04 24,00 13,55 433,60 15,6639900 39885 GRD 100 9 2 1,5 1 2,5 5,93 6644,84 22,00 15,10 442,99 14,2739911 39906 GRD 100 6 2 1 1 2,5 13,33 5695,07 22,00 12,94 379,67 14,6039927 39911 GRD 100 4 2 1 1 2,5 20,00 2373,09 22,00 5,39 169,51 15,5939931 39927 GRD 100 3 2 1 1 2,5 26,67 1041,26 22,00 2,37 69,42 20,5939938 39985 GRD 100 6 2 1 1 2,5 13,33 3342,60 22,00 7,60 477,51 11,8339994 39989 GRD 90 4 1,5 2 1 2,5 6,75 3591,93 18,00 9,98 448,99 15,6239999 39994 GRD 90 6 1,5 2 1 2,5 4,50 3860,99 22,00 8,77 257,40 14,8940004 39999 GRD 90 6 1,5 2 1 2,5 4,50 1423,32 22,00 3,23 88,96 12,4840009 40004 GRD 90 9 2 2 1 2,5 4,00 3572,20 22,00 8,12 238,15 15,4040020 40009 GRD 90 9 2 2 1 2,5 4,00 7635,87 22,00 17,35 509,06 22,3440035 40020 GRD 90 6 2 1,5 1 2,5 8,00 5600,00 22,00 12,73 400,00 9,60
12

Från Till Ba RQD Jn Jr Ja Jw SRF Q Total amount injection
(l)
Number of
holes
Grouting/ meter
drillhole [l/m]
Amount of grout/ meter tunnel (l/m)
Area overbrake
40047 40035 GLG 80 6 2 1,5 1 2,5 7,11 7902,24 34,00 11,62 493,89 21,4340051 40047 GRD 90 9 2 1 1 2,5 8,00 3521,08 21,00 8,38 440,13 15,9540055 40051 GRD 90 9 2 1 1 2,5 8,00 5670,85 15,00 18,90 630,09 4,2340193 40189 GRD 40 6 1,5 2 1 2,5 2,00 7396,41 21,00 17,61 462,28 0,0040196 40193 GRD 40 6 1,5 2 1 2,5 2,00 12352,47 22,00 28,07 882,32 0,0040199 40196 GRD 40 6 1,5 2 1 2,5 2,00 10813,45 22,00 24,58 636,09 0,0040203 40199 GRD 70 6 1,5 2 1 2,5 3,50 15918,39 22,00 36,18 994,90 0,0040206 40203 GRD 70 6 1,5 2 1 2,5 3,50 13183,86 22,00 29,96 941,70 0,0040209 40206 GRD 60 9 1,5 2 1 2,5 2,00 17399,10 22,00 39,54 1338,39 0,0040215 40209 GRD 60 6 1,5 2 1 2,5 3,00 15161,43 20,00 37,90 3790,36 5,8840220 40215 GRD 70 6 1,5 2 1 2,5 3,50 12865,47 20,00 32,16 2144,25 7,3440225 40220 GRD 70 4 1,5 2 1 2,5 5,25 14972,20 22,00 34,03 1663,58 20,7040230 40225 GRD 60 4 1,5 2 1 2,5 4,50 15318,39 22,00 34,81 1392,58 16,6840233 40248 GRD 50 6 1,5 2 1 2,5 2,50 14582,96 22,00 33,14 1620,33 11,3240260 40314 GRD 80 6 1,5 2 1 2,5 4,00 15772,20 22,00 35,85 1433,84 10,8040331 40326 GRD 80 6 1,5 1 1 2,5 8,00 19230,49 22,00 43,71 1131,21 11,4640341 40331 GRD 80 6 1,5 1,5 1 2,5 5,33 12827,80 22,00 29,15 712,66 13,3240346 40351 GRD 80 6 1,5 2 1 2,5 4,00 15696,86 26,00 30,19 981,05 16,1040361 40356 GRD 70 9 1,5 2 0,8 2,5 1,87 21409,87 26,00 41,17 1338,12 11,1340366 40361 GRD 70 6 1,5 2 1 2,5 3,50 17363,23 26,00 33,39 1240,23 15,9140373 40366 GRD 70 6 1,5 2 1 2,5 3,50 18989,24 26,00 36,52 1186,83 16,4640378 40373 GRD 70 6 1,5 2 1 2,5 3,50 9377,58 26,00 18,03 625,17 10,0740383 40378 GRD 80 6 1,5 1,5 1 2,5 5,33 15433,18 26,00 29,68 857,40 18,6240388 40435 GRD 90 6 1,5 1,5 1 2,5 6,00 12570,40 26,00 24,17 966,95 27,3440445 40470 GRD 90 6 1,5 1 1 2,5 9,00 14865,47 26,00 28,59 929,09 15,3340479 40475 GRD 80 6 2 2 1 2,5 5,33 15026,01 26,00 28,90 1001,73 17,5940484 40479 GRD 40 9 1,5 2 1 2,5 1,33 11487,00 26,00 22,09 547,00 16,13
13

Från Till Ba RQD Jn Jr Ja Jw SRF Q Total amount injection
(l)
Number of
holes
Grouting/ meter
drillhole [l/m]
Amount of grout/ meter tunnel (l/m)
Area overbrake
40489 40484 GRD 40 9 1,5 2 1 2,5 1,33 10467,26 26,00 20,13 872,27 18,1840496 40489 GRD 50 9 1,5 1,5 1 2,5 2,22 8539,91 29,00 14,72 569,33 18,3640501 40496 GRD 60 6 2 1,5 1 2,5 5,33 14798,21 29,00 25,51 924,89 18,8340511 40501 GRD 70 6 2 2 1 2,5 4,67 13029,60 26,00 25,06 868,64 14,6740518 40523 GRD 70 6 2 1,5 1 2,5 6,22 12434,08 26,00 23,91 777,13 19,3140534 40528 GRD 70 4 2 1,5 1 2,5 9,33 12278,92 26,00 23,61 818,59 17,3740539 40534 GRD 70 4 2 1,5 1 2,5 9,33 16660,09 41,00 20,32 1110,67 13,6940545 40539 GRD 80 6 1,5 1,5 1 2,5 5,33 14765,02 22,00 33,56 984,33 29,5740549 40562 GRD 80 6 2 1,5 1 2,5 7,11 10653,81 22,00 24,21 710,25 22,3440572 40591 GRD 70 6 2 1,5 1 2,5 6,22 10195,52 23,00 22,16 679,70 15,1540601 40596 GRD 70 4 2 1,5 1 2,5 9,33 6026,91 22,00 13,70 430,49 15,3740604 40601 GRD 80 6 1,5 1,5 1 2,5 5,33 8762,33 22,00 19,91 461,18 13,6140609 40609 GRD 40 6 1,5 1,5 1 2,5 2,67 10225,11 22,00 23,24 852,09 14,8640616 40609 GRD 85 6 1,5 1 1 2,5 8,50 11913,00 22,00 27,08 916,38 11,9740622 40622 GRD 40 6 1,5 1,5 1 2,5 2,67 8356,05 22,00 18,99 557,07 13,5840632 40627 GRD 60 4 1,5 1 1 2,5 9,00 9408,97 22,00 21,38 627,26 11,1040637 40647 GRD 70 6 1,5 1,5 1 2,5 4,67 9121,08 22,00 20,73 - 33,3640656 40691 GRD 80 4 1,5 1,5 1 2,5 8,00 406,28 2,00 10,16 27,09 0,0040701 40696 GRD 65 4 2 3 1 2,5 4,33 7495,07 22,00 17,03 468,44 16,5740706 40701 GRD 90 3 2 1,5 1 2,5 16,00 6928,25 22,00 15,75 494,88 15,1840711 40736 GRD 100 4 2 1 1 2,5 20,00 10520,18 22,00 23,91 701,35 13,5840746 40741 GRD 100 3 3 1 1 2,5 40,00 10293,27 22,00 23,39 - 20,4840756 40746 GRD 90 3 3 1 1 2,5 36,00 59,19 2,00 1,48 5,92 0,0040761 40756 GRD 100 3 3 1 1 2,5 40,00 156,95 1,00 7,85 7,47 12,9240766 40761 GRD 100 3 2 1,5 1 2,5 17,78 11384,75 22,00 25,87 758,98 18,5440771 40766 GRD 100 3 2 1 1 2,5 26,67 10075,34 22,00 22,90 719,67 7,3740781 40786 GRD 100 3 3 1 1 2,5 40,00 11127,35 22,00 25,29 654,55 16,21
14

Från Till Ba RQD Jn Jr Ja Jw SRF Q Total amount injection
(l)
Number of
holes
Grouting/ meter
drillhole [l/m]
Amount of grout/ meter tunnel (l/m)
Area overbrake
40791 40791 GRD 100 3 3 1,5 1 2,5 26,67 6991,93 22,00 15,89 499,42 14,8940806 40801 GRD 100 3 3 1 1 2,5 40,00 7653,81 22,00 17,40 510,25 17,5940816 40806 GRD 100 4 2 1 1 2,5 20,00 17955,16 22,00 40,81 1496,26 16,7240826 40816 GRD 95 4 2 1 1 2,5 19,00 8114,80 22,00 18,44 540,99 9,8240831 40826 GRD 95 4 2 1 1 2,5 19,00 17406,28 22,00 39,56 1160,42 27,4140836 40846 GRD 95 3 2 1 1 2,5 25,33 15760,00 - - - 0,0040855 40914 GRD 100 3 3 1 1 2,5 40,00 - - - - 0,0040924 40919 GRD 95 4 2,5 1 1 2,5 23,75 - - - - 0,0040934 40969 GRD 90 4 2,5 1 1 2,5 22,50 - - - - 0,0040989 40993 GRD 100 3 2,5 1 1 2,5 33,33 - - - - 0,0041003 40998 GRD 100 3 1,5 1 1 2,5 20,00 4008,97 20,00 10,02 250,56 0,0041012 41003 GRD 100 3 1,5 1 1 2,5 20,00 6808,97 22,00 15,47 523,77 18,2141015 41012 GRD 95 3 1,5 1 1 2,5 19,00 6947,09 25,00 13,89 408,65 24,1341020 41015 GRD 95 3 1,5 1 1 2,5 19,00 4729,15 27,00 8,76 363,78 23,8741065 41070 GRD 100 3 2 1 1 2,5 26,67 14933,63 23,00 32,46 1244,47 19,6041070 41076 GRD 95 3 1,5 1 1 2,5 19,00 - 41,00 - - 0,0041076 41080 GRD 95 3 1,5 1,5 1 2,5 12,67 5859,19 24,00 12,21 450,71 27,6741080 41090 GRD 100 3 2 1 1 2,5 26,67 8640,36 26,00 16,62 617,17 17,6741090 41094 GRD 100 3 1,5 1 1 2,5 20,00 6659,19 22,00 15,13 416,20 20,0841094 41095 GRD 65 6 2 2 1 2,5 4,33 5403,59 22,00 12,28 337,72 22,6341101 41112 GRD 80 6 3 1 1 2,5 16,00 - - - - 0,0041112 41117 GRD 70 4 3 1 1 2,5 21,00 - - - - 0,0041117 41130 GRD 80 4 3 1 1 2,5 24,00 - - - - 0,0041130 41146 GRD 90 6 3 1,5 1 2,5 12,00 - - - - 0,0041146 41150 GRD 95 4 3 1 1 2,5 28,50 2038,57 21,00 4,85 127,41 21,2441150 41161 GRD 95 4 2 1 1 2,5 19,00 12227,80 21,00 29,11 873,41 15,8041161 41166 GRD 95 3 3 1,5 1 2,5 25,33 11755,16 22,00 26,72 783,68 12,12
15

Från Till Ba RQD Jn Jr Ja Jw SRF Q Total amount injection
(l)
Number of
holes
Grouting/ meter
drillhole [l/m]
Amount of grout/ meter tunnel (l/m)
Area overbrake
41166 41222 GRD 85 3 3 1,5 1 2,5 22,67 10148,88 22,00 23,07 676,59 19,5641222 41231 GRD 100 3 2 1,5 1 2,5 17,78 13627,80 22,00 30,97 973,41 15,7341230 41237 GRD 100 3 2 1,5 1 2,5 17,78 9268,16 22,00 21,06 662,01 18,1841237 41242 GRD 100 3 2 1,5 1 2,5 17,78 8200,00 22,00 18,64 546,67 8,3641242 41247 GRD 100 3 3 1 1 2,5 40,00 3590,13 22,00 8,16 239,34 14,0541247 41274 GRD 90 4 3 1 1 2,5 27,00 5961,43 22,00 13,55 397,43 12,9641274 41341 GRD 95 3 3 2 1 2,5 19,00 1594,62 22,00 3,62 106,31 10,5541341 41346 GRD 100 4 3 1,5 1 2,5 20,00 6535,43 22,00 14,85 408,46 11,0241346 41351 GRD 85 4 2 2 1 2,5 8,50 7978,48 22,00 18,13 569,89 16,5341351 41355 GRD 85 4 2 2 1 2,5 8,50 6881,61 22,00 15,64 458,77 12,7041355 41365 GRD 85 4 2 1 1 2,5 17,00 8459,19 22,00 19,23 367,79 11,9041365 41402 GRD 85 4 2 1,5 1 2,5 11,33 8250,00 22,00 18,75 687,50 9,6041402 41443 GRD 85 4 1,5 3 1 2,5 4,25 13217,94 22,00 30,04 826,12 12,5241677 41672 GRD 80 9 1,5 1,5 1 2,5 3,56 10019,73 22,00 22,77 589,40 11,1741682 41677 GRD 70 6 1,5 1,5 1 2,5 4,67 4609,87 22,00 10,48 - 0,0041687 41682 GRD 85 4 1,5 1,5 1 2,5 8,50 - - - - 0,0041692 41687 GRD 80 6 1,5 1,5 1 2,5 5,33 2210,76 22,00 5,02 138,17 11,5341696 41692 GRD 90 6 1,5 1,5 1 2,5 6,00 5238,57 22,00 11,91 327,41 11,6841702 41696 GRD 60 4 1,5 2 1 2,5 4,50 3443,05 22,00 7,83 229,54 19,9341707 41702 GRD 90 4 1,5 2 1 2,5 6,75 1672,65 22,00 3,80 111,51 19,0241712 41707 GRD 90 4 1,5 1,5 1 2,5 9,00 12672,65 22,00 28,80 792,04 14,6041717 41738 GRD 90 6 1,5 2 1 2,5 4,50 2386,55 22,00 5,42 216,96 16,24
16