evaluating the statistics courses in terms of the
TRANSCRIPT

Copyright © 2021 by Author/s and Licensed by Modestum. This is an open access article distributed under the Creative Commons Attribution License which permits unrestricted use, distribution, and reproduction in any medium, provided the original work is properly cited.
International Electronic Journal of Mathematics Education 2021, 16(2), em0627 e-ISSN: 1306-3030 https://www.iejme.com Research Article OPEN ACCESS
Evaluating the Statistics Courses in Terms of the Statistical Literacy: Didactic Pathways of Pre-Service Mathematics Teachers
Bulent Guven 1 , Adnan Baki 1 , Neslihan Uzun 2* , Zeynep Medine Ozmen 1 , Zeynep Arslan 1
1 Trabzon University, TURKEY 2 Recep Tayyip Erdogan University, TURKEY *Corresponding Author: [email protected]
Citation: Guven B, Baki A, Uzun N, Ozmen ZM, Arslan Z. (2021). Evaluating the Statistics Courses in Terms of the Statistical Literacy: Didactic Pathways of Pre-Service Mathematics Teachers. International Electronic Journal of Mathematics Education, 16(2), em0627. https://doi.org/10.29333/iejme/9769
ARTICLE INFO ABSTRACT
Received: 29 Apr. 2020
Accepted: 1 Dec. 2020
This study intends to determine the statistical literacy levels of pre-service mathematics teachers and to evaluate the contribution of the statistics courses in the elementary mathematics education curriculum to statistical literacy. A mixed methods research design was adopted. The study group consisted of 202 pre-service mathematics teachers enrolled in the Statistics and Probability course. In the data collection process, a pre-test and post-test was administered to determine the pre-service teachers’ statistical literacy before and after the statistical course, and classroom observations were performed to identify the contribution of the statistics course to statistical literacy. The Rasch model was used for validity-reliability analyses, and one-way ANOVA tests were used to analyze the quantitative data. Content analysis was utilized in the analysis of qualitative data, which revealed that statistical literacy levels of pre-service teachers are generally low, generally influencing the competence of pre-service teachers. The pre-service teachers failed in the sample selection component in the pre-test and data interpretation in the post-test, while they were more successful with table and graphs in the pre-test and sample selection in the post-test. The comparative analysis of revealed statistically significant differences in favor of U4 in the pre-test, but in favor of U1 in the post-test. It was concluded that practices included in the statistics lessons could be effective on these differences.
Keywords: statistical literacy, pre-service elementary mathematics teachers, statistics lesson practices
INTRODUCTION
As data has become increasingly important in our daily life it is essential to have basic skills such as making effective data-driven decisions and situation-based inferences. Thus, it is also critical to display literacy skills. Furthermore, many research carried out in statistics education pointed to the need for raising statistically literate individuals. Gal (2002) defined statistical literacy as thinking critically and inferring from the data. Similarly, Wallman (1993) drew attention critical evaluation and effective decisions making regarding everyday situations. That is, statistics, a common field for different disciplines, and statistical literacy is now more important, and the need to train statistically literate individuals is often emphasized. For example, Franklin et.al. (2007) asserted that adults, regardless of their education level, should be statistically equipped and literate. Similarly, students are expected to develop statistical literacy through statistics courses. Many suggestions are made for effective teaching of statistics (Franklin et al., 2007). GAISE report (Franklin et al., 2007) stressed that statistics instructions should be designed toward building statistical literacy, developing reasoning skills, and teaching the use of real-life data. GAISE College Report (2016) also underlined that statistics instructions should incorporate active learning and conceptual understanding. According to Rumsey (2002), the goal of the statistics instructions is to help students develop statistical literacy and teach them how to manage the statistical processes, which are all related to coping with authentic data.
Statistics teachers need to use statistics knowledge in both their teaching practices and their professional lives. For instance, they should use it to evaluate the effectiveness of teaching methods and to compare students’ achievement. They should also modify the learning environment according to statistical results. That is, teachers should be effective consumers of the data, re-designing their statistics also instruction and taking professional decisions. To this end, teachers need to have adequate statistical literacy skills and content knowledge for statistics teaching. These two requirements show that statistics courses are indispensable for teacher trainee programs. Ben-Zvi and Makar (2016) state that “many statistics courses at the university level still teach the same progression of content and emphasize the same development of skills and procedures” (p. 3). However, statistical literacy and thinking levels of students can be improved with well-planned teaching practices or activities (Budgett & Pfannkuch, 2010; Callingham & Watson, 2017; Gundlach, Richards, Nelson, & Levesque-Bristol, 2015; Tishkovskaya & Lancaster, 2012).
2 / 15 Guven et al. / INT ELECT J MATH ED, 16(2), em0627
Therefore, the statistical literacy levels of pre-service mathematics teachers and teaching practices in statistics courses should be determined to develop the pedagogical content knowledge of pre-service teachers. The related literature has generally focused on defining the content of the statistical literacy (Stein, 2000; Wallman, 1993), adopting a framework (Gal, 2002; Watson, 1997, 2006; Watson & Callingham, 2003), and determining the statistical literacy levels of students (Garfield & delMas, 2010; Kaplan & Thorpe, 2010; Koparan, 2012; Ozmen, 2015; Watson & Callingham, 2003, 2004). At this point, the present study assesses the statistical literacy of both teacher educators and pre-service mathematics teachers, with the intention of filling a gap in the literature.
THEORETICAL FRAMEWORK
The Statistical Literacy
Statistical literacy has recently been recognized as an important learning outcome of in statistics courses (delMas, 2002; Garfield & Ben-Zvi, 2008; Garfield, delMars, & Zieffler, 2010). However, no consensus has been reached about the definition of this term (Ben-Zvi & Garfield, 2004; English, 2013; Schield, 2017; Whetstone, 2014) because the statistical literacy concept is still evolving (Sabag, Garfield, & Zieffler, 2018). Indeed, statistical literacy is defined in many ways. Some researchers describe statistical literacy as “understanding and using” the language of statistics (Aliaga et al., 2005; Garfield & delMas, 2010; Garfield, delMas, & Chance, 2002; Lehohla, 2002). Others define statistical literacy relating it to the use of higher order skills (e.g., critically evaluating information and interpreting data according to context) (Gal, 2002; Wallman, 1993; Watson, 2011). In GAISE College Report (Aliaga et al., 2005), statistical literacy is defined as “to know what statistical terms and symbols mean, to understand the basic language or fundamental ideas of statistics, to be able to interpret statistical graphs.” To sum up, statistical literacy can be defined as the ability to interpret table and graphs, to infer from data, to make effective decisions, to critically evaluate information, to grasp the fundamental language of statistics, to adopt the terminology of statistics, and to interpret the relevant context.
To understand and develop statistical literacy, numerous statistical literacy models were developed (Gal, 2002; Ozmen, 2015; Watson, 1997, 2006). Watson (1997) introduced a 3-tiered statistical literacy model. Gal (2002) designed a statistical literacy model for adults. Watson (2006) designed one for statistics education at schools. Watson (1997, 2006) developed a hierarchical model that prioritizes statistical knowledge and skills. Gal (2002), on the other hand, pointed out that people's statistical literacy involves both a knowledge component and a dispositional component. Wild and Pfannkuch (1999) drew attention to the statistical process starting with the determination of the statistical problem and sample selection and continuing with the analysis, representation and interpretation of data. Moreover, the statistical process is stated as an important component for statistical literacy in studies (Newton, Dietiker, & Horvath, 2011; Ozmen, 2015; Watson, 2006; Watson, Fitzallen, Fielding-Wells, & Madden, 2018), highlighting the importance of statistical processes and stages for statistical literacy. As statistics cannot be independent of research, it is also important to follow a statistical process in statistics courses.
The Statistical Process
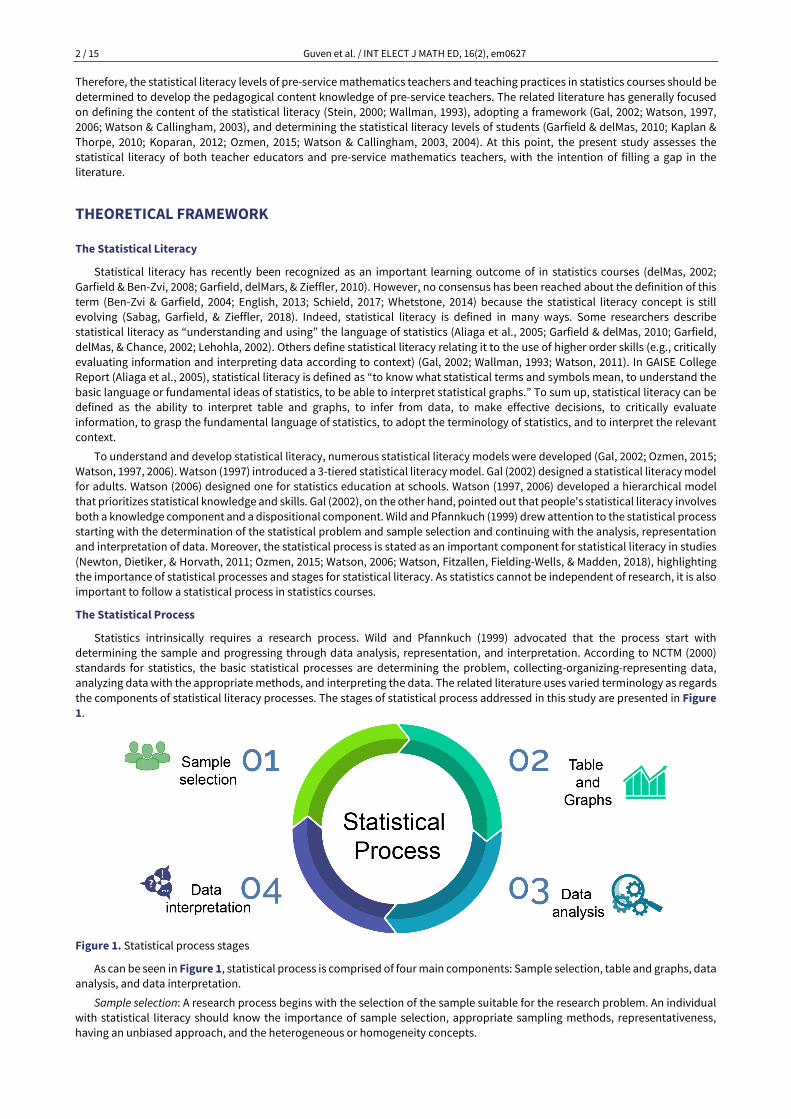
Statistics intrinsically requires a research process. Wild and Pfannkuch (1999) advocated that the process start with determining the sample and progressing through data analysis, representation, and interpretation. According to NCTM (2000) standards for statistics, the basic statistical processes are determining the problem, collecting-organizing-representing data, analyzing data with the appropriate methods, and interpreting the data. The related literature uses varied terminology as regards the components of statistical literacy processes. The stages of statistical process addressed in this study are presented in Figure 1.
Figure 1. Statistical process stages
As can be seen in Figure 1, statistical process is comprised of four main components: Sample selection, table and graphs, data analysis, and data interpretation.
Sample selection: A research process begins with the selection of the sample suitable for the research problem. An individual with statistical literacy should know the importance of sample selection, appropriate sampling methods, representativeness, having an unbiased approach, and the heterogeneous or homogeneity concepts.

Guven et al. / INT ELECT J MATH ED, 16(2), em0627 3 / 15
Table and Graphs: Interpretations, evaluations, and inferences over table and graphs are considered critical to statistical literacy (Gal, 2002; Ozmen, 2015; Watson, 2006). It is important to realize the relationships between the data interpret these relationships, make inferences about the situations that are not explicit in the data, and read directly from the data representations in table and graphs. In addition, skills such as determining and drawing the appropriate graph type and summarizing the data with appropriate representations come to the fore.
Data analysis: In this component, choosing the suitable data analysis methods and summarizing the data effectively are important.
Data interpretation: A statistical research process requires making interpretation, evaluation, and inference based on the data obtained. These skills, which are accepted as crucial for statistical literacy (Gal, 2002; Ozmen, 2015; Watson, 1997; Watson & Callingham, 2004), require approaching the data with a different perspective and exhibiting a critical thinking approach to the situations encountered.
A number of studies demonstrate that competence in statistical process is an important aspect of statistical literacy (Newton et al., 2011; Ozmen, 2015; Watson, 2006; Watson et al., 2018). They follow the steps of determining the problem, selecting the sample, and collecting, analyzing, representing, and interpreting the data. Rumsey (2002) also underlined the importance of the statistical process and advocated that developing scientific research skills should be one of the goals of statistics education. Students should be able to make sense of data, evaluate and interpret it critically, take effective and right decisions related to daily situations, which suggest the content of statistics course (Chick & Pierce, 2012; Gal, 2002). The role of teachers in equipping students with these skills is inevitable. Watsons (2006) claimed that “teachers are the next big frontier in bringing statistical literacy to all students to prepare them to leave school and enter society” (p. 271). Also many studies point out teachers should be aware of these skills and need to improve their teaching practices and themselves to design their learning environment through statistical literacy (Gattuso & Ottaviani, 2011; Hall, 2011; Martignon, 2011). However, Wun (2010) states that “a teacher cannot teach something that she does not know how to”; here the question is whether teachers’ gaining statistical literacy skills is worth investigating (as cited in Jairaman, Zamri, & Rahim, 2018, p. 1). On the other hand, it is stated that teachers consider themselves as incompetent in teaching statistics (Batanero, Burrill, & Reading, 2011; Gattuso & Ottaviani, 2011; Wessels, 2011). Also, studies conducted with teachers confirm teachers’ difficulties regarding statistical subjects and concepts (Batanero et al., 2011; Gattuso & Ottaviani, 2011). These concerns also raise many questions about the effectiveness of the introductory statistics courses and statistics education at universities, which calls for assessing the statistical literacy focus in introductory statistics courses in the elementary mathematics education curriculum. Also, it is seen important to determine the statistical literacy level of the pre-service mathematics teachers, for they will potentially train statistically literate students.
Aim of the Study
The present study intends to determine the statistical literacy levels of pre-service teachers and to evaluate the contribution of the introductory statistics courses to their statistical literacy levels. To this end, the statistical literacy levels of pre-service mathematics teachers in the sample group are measured. The following research questions guide this study:
1. How does statistical literacy of pre-service teachers studying at different universities differ?
2. How do statistics courses at different universities contribute to statistical literacy of pre-service teachers?
METHOD
The aim of the present study is to examine the statistical literacy levels of the pre-service teachers attending the introductory statistics courses at the Elementary Mathematics Education Department from four universities. For this purpose, an explanatory mixed-methods research design (Creswell & Clark, 2011) was adopted in the current study. A qualitative study is complementary to a quantitative study, expanding on the results of the quantitative study (Cresswell & Plano-Clark, 2018).
Participants
The study group consists of 202 pre-service teachers enrolled in the Statistics and Probability course in four different state universities with the following number of participants from each: U1=76; U2=37; U3=32; U4=57. In the selection of the universities, all public universities in Turkey that enrolled students in the elementary mathematic teaching program in the 2013-2014 academic semester were ranked on the basis of university admission scores. Then, the universities were separated into four categories. One representative university was selected from each category. To minimize the differences between scores, the score closest to the average of the category was preferred. This procedure kept the differentiation of University Entrance exam scores of the participants under control and helped make comparisons within and among categories. The universities were coded as U1 (selected from the second category), U2 (selected from the third category), U3 (selected from the first category), and U4 (selected from the fourth category).
Data Collection
The data were collected by means of the statistical literacy pre-test and post-test, observations, and field notes taken in the learning environments. The statistical literacy tests were developed by the researchers to determine the statistical literacy levels of pre-service mathematics teachers before and after the statistics course. The tests are composed of items prepared in line with the statistical literacy model’s four main components (sample selection, table and graphs, data analysis, and data interpretation),
4 / 15 Guven et al. / INT ELECT J MATH ED, 16(2), em0627
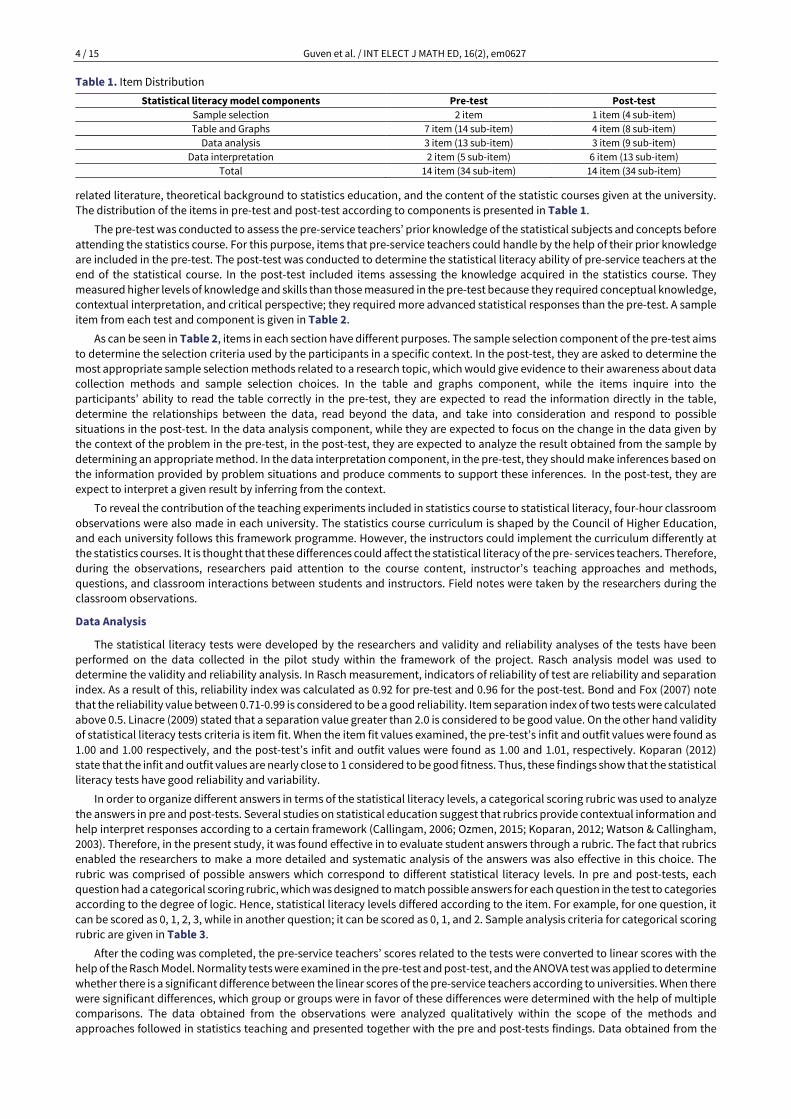
related literature, theoretical background to statistics education, and the content of the statistic courses given at the university. The distribution of the items in pre-test and post-test according to components is presented in Table 1.
The pre-test was conducted to assess the pre-service teachers’ prior knowledge of the statistical subjects and concepts before attending the statistics course. For this purpose, items that pre-service teachers could handle by the help of their prior knowledge are included in the pre-test. The post-test was conducted to determine the statistical literacy ability of pre-service teachers at the end of the statistical course. In the post-test included items assessing the knowledge acquired in the statistics course. They measured higher levels of knowledge and skills than those measured in the pre-test because they required conceptual knowledge, contextual interpretation, and critical perspective; they required more advanced statistical responses than the pre-test. A sample item from each test and component is given in Table 2.
As can be seen in Table 2, items in each section have different purposes. The sample selection component of the pre-test aims to determine the selection criteria used by the participants in a specific context. In the post-test, they are asked to determine the most appropriate sample selection methods related to a research topic, which would give evidence to their awareness about data collection methods and sample selection choices. In the table and graphs component, while the items inquire into the participants’ ability to read the table correctly in the pre-test, they are expected to read the information directly in the table, determine the relationships between the data, read beyond the data, and take into consideration and respond to possible situations in the post-test. In the data analysis component, while they are expected to focus on the change in the data given by the context of the problem in the pre-test, in the post-test, they are expected to analyze the result obtained from the sample by determining an appropriate method. In the data interpretation component, in the pre-test, they should make inferences based on the information provided by problem situations and produce comments to support these inferences. In the post-test, they are expect to interpret a given result by inferring from the context.
To reveal the contribution of the teaching experiments included in statistics course to statistical literacy, four-hour classroom observations were also made in each university. The statistics course curriculum is shaped by the Council of Higher Education, and each university follows this framework programme. However, the instructors could implement the curriculum differently at the statistics courses. It is thought that these differences could affect the statistical literacy of the pre- services teachers. Therefore, during the observations, researchers paid attention to the course content, instructor’s teaching approaches and methods, questions, and classroom interactions between students and instructors. Field notes were taken by the researchers during the classroom observations.
Data Analysis
The statistical literacy tests were developed by the researchers and validity and reliability analyses of the tests have been performed on the data collected in the pilot study within the framework of the project. Rasch analysis model was used to determine the validity and reliability analysis. In Rasch measurement, indicators of reliability of test are reliability and separation index. As a result of this, reliability index was calculated as 0.92 for pre-test and 0.96 for the post-test. Bond and Fox (2007) note that the reliability value between 0.71-0.99 is considered to be a good reliability. Item separation index of two tests were calculated above 0.5. Linacre (2009) stated that a separation value greater than 2.0 is considered to be good value. On the other hand validity of statistical literacy tests criteria is item fit. When the item fit values examined, the pre-test’s infit and outfit values were found as 1.00 and 1.00 respectively, and the post-test’s infit and outfit values were found as 1.00 and 1.01, respectively. Koparan (2012) state that the infit and outfit values are nearly close to 1 considered to be good fitness. Thus, these findings show that the statistical literacy tests have good reliability and variability.
In order to organize different answers in terms of the statistical literacy levels, a categorical scoring rubric was used to analyze the answers in pre and post-tests. Several studies on statistical education suggest that rubrics provide contextual information and help interpret responses according to a certain framework (Callingam, 2006; Ozmen, 2015; Koparan, 2012; Watson & Callingham, 2003). Therefore, in the present study, it was found effective in to evaluate student answers through a rubric. The fact that rubrics enabled the researchers to make a more detailed and systematic analysis of the answers was also effective in this choice. The rubric was comprised of possible answers which correspond to different statistical literacy levels. In pre and post-tests, each question had a categorical scoring rubric, which was designed to match possible answers for each question in the test to categories according to the degree of logic. Hence, statistical literacy levels differed according to the item. For example, for one question, it can be scored as 0, 1, 2, 3, while in another question; it can be scored as 0, 1, and 2. Sample analysis criteria for categorical scoring rubric are given in Table 3.
After the coding was completed, the pre-service teachers’ scores related to the tests were converted to linear scores with the help of the Rasch Model. Normality tests were examined in the pre-test and post-test, and the ANOVA test was applied to determine whether there is a significant difference between the linear scores of the pre-service teachers according to universities. When there were significant differences, which group or groups were in favor of these differences were determined with the help of multiple comparisons. The data obtained from the observations were analyzed qualitatively within the scope of the methods and approaches followed in statistics teaching and presented together with the pre and post-tests findings. Data obtained from the
Table 1. Item Distribution Statistical literacy model components Pre-test Post-test
Sample selection 2 item 1 item (4 sub-item) Table and Graphs 7 item (14 sub-item) 4 item (8 sub-item)
Data analysis 3 item (13 sub-item) 3 item (9 sub-item) Data interpretation 2 item (5 sub-item) 6 item (13 sub-item)
Total 14 item (34 sub-item) 14 item (34 sub-item)

Guven et al. / INT ELECT J MATH ED, 16(2), em0627 5 / 15
Table 2. Sample Items for Pre-Test and Post-test Component Pre-test Post-test Sample Selection
In our country, city traffic is an important problem. A researcher wants to carry out a study about the time spent in daily traffic in Turkey. Therefore, the researcher asks randomly chosen 1000 Istanbul residents the time they spend in the traffic. Researchers determine the time spent in traffic through the information collected by this question. What do you think about the sampling strategy of the researcher?
The public opinion needs to be sought on nuclear power plant projects in Turkey. For this, research will be conducted, and a section of the public will be asked about their views on nuclear power plants. Below are the opinions of four researchers about the 500-participant sample to be selected. Please evaluate these views in terms of the appropriateness of sample selection and indicate which method you support. A1. “Istanbul is a big city where people with different cultures, businesses, and nationalities live together. We should ask randomly selected people from Istanbul.”
Table and Graphs
Select the appropriate expression(s) corresponding to the percentage circled in the tables below.
a) 60% of male university students study in the field of business
administration. b) 60% of university students in business administration are
male students. c) 60% of university students are male students studying in the
field of business administration. d) 60% of male business administration professionals are
university students e) More than one of the statements above (…….) Please write
down each one of them f) None
According to the table given, please mark the appropriate answer from the following statements.(Y=Yes, N=No, U= Unknown)
A. 54 % of adult female are high school graduates. ( ) Y ( ) N ( )U B. 54 % of adult high school graduates are female. ( )Y ( )N ( )U C. An adult female is more likely to be a high school graduate
than a college graduate. ( ) Y ( )N ( )U D. In adults, high school graduates are more likely to be female
than male. ( )Y ( )N ( )U E. A male’s probability of a high school graduate is twice that
female’s probability of becoming high school graduate. ( )Y ( )N ( )U
Data Analysis A carpenter cuts the board for the kitchen cabinet in diverse sizes. The boards were cut in sizes according to where they will be used. The average length of the boards is 1.2 meters. The standard deviation is 0.2 meters, and the interquartile range is 0.4 meters. If the carpenter calculated the length of the boards in cm, how would the average and standard deviation of the board length change?
A company official claims that their car tires travel at least 55 thousand km on city roads. Ten tires are chosen randomly on cars bought from this firm. It is found that cars with these ten tires could travel 49, 55, 40, 42, 44, 47, 52, 44, 58, and 45 thousand km. Would you prefer to buy car tires from this firm? Why/why not?
Data Interpretation
Daljinder Kaur gave birth to her first child at the age of 72 and is known to be the oldest mother in the world. Considering that the average age of giving birth to the first child worldwide is 22 years old, how could the distribution, average, median and span of this statistic be affected by the addition of Daljinder Kaur to this distribution?
In a study, it is aimed to explain the relationship between the glucose and cholesterol values of the blood. For this reason, glucose and cholesterol values of 10 people are recorded. As a result of the analysis, the correlation value is calculated as 0.88. How would you interpret this result obtained by the researcher?
Table 3. Analysis Sample for Categorical Scoring Rubric Question Scoring Rubric and Sample Participant Responses Pre-test
After a common mathematics exam, having the same questions, it was seen that two classes have an equal average score. How would you compare the two classes in terms of math achievement? To evaluate the achievement of the two classes, do you need any information about the exam scores? Explain.
2: States that “It is not possible to say something certainly” and adds “There is a need for information about other measures.” 1: States that “It is not possible to say something certainly” but without a reason. 0: States that “They have an equal achievement level” or gives no answer.
Post-test
A company official claims that their car tires travel at least 55 thousand km on city roads. Ten tires are chosen randomly on cars bought from this firm. It is found that cars with these ten tires could travel 49, 55, 40, 42, 44, 47, 52, 44, 58, and 45 thousand km. Would you prefer to buy car tires from this firm? Why/why not?
5: Suggests determining it based on inferential statistics process (confidence interval, hypothesis testing, etc.) 4: States that “We should determine confidence interval or test this hypothesis” without any procedural process. 3: Considers more than one measures of central tendency or central dispersion. Gives an appropriate explanation. Considers only one dimension but also states the limitations of the relevant measures. 2: Considers only one measure (calculating the measures) and explains reasons. 1: Refers to consistent disclosure in accordance with personal opinions or experiences, handling a criterion but not making sufficient explanations. 0: Gives no or an irrelevant answer such as “I prefer to buy”, or “I don’t prefer to buy.”

6 / 15 Guven et al. / INT ELECT J MATH ED, 16(2), em0627
observations were analyzed through the aspects which were thought to affect the differences between universities related the statistical literacy levels of pre-service teachers. Indeed, they were analyzed through the aspects of teaching approach, conceptual understanding, context, types of questions, teaching of concepts, and critical questions that were thought to influence the differentiation of pre-service teachers’ statistical literacy levels.
RESULTS
Before the comparison of the pre-test and post-test results, descriptive statistics were reported. Table 4 presents the distribution of descriptive statistics of the pre and post-test according to universities.
As depicted in Table 4, pre-service teachers’ pre-test score means are higher than the post-test score means. This situation might first suggest that pre-service teacher’s statistical literacy decreases slightly. However, linear measures taken by pre and post-test range between -1.5 and +1 linear in all universities. In addition, the post-test was more difficult than the pre-test because it included the basic statistical subjects such as mean, mode, median, which had been previously learned, and more advanced topics such as correlation-regression, hypothesis test, and normal distribution. For this reason, differences between pre and post-test means should not be interpreted as a decrease in statistical literacy. According to Rasch measurement, the pre-test and post-test means around 0 show that pre-service teachers’ statistical literacy is at a medium level in each test.
A comparison of the university means showed that, in the pre-test, pre-service teachers in U4 had the highest score with a 0.39 linear score, who were followed by U1 teachers with 0.02 linear score, U2 with -0.18 linear score, and U3 with -0.19 linear score. On the other hand, in the post-test, pre-service teachers in U1 had the highest score with a -0.06 linear score, who were followed by U4 and U3 teachers with -0.55 linear score, and U2 with -0.67 linear score. While U4 seems to be the most successful university in the pre-test, it did not show the same success in the post-test. U1 scored the highest in the post-test.
To investigate whether the differences seen in the pre-test among universities are statistically significant or not, one-way ANOVA test was conducted. The results of the analysis are given in Table 5.
According to Table 5, the results of the analysis indicate that the differences between the pre-test linear scores of 4 universities are statistically significant (F3.198=26.217; p<.05). Since the result was significant, post-hoc test was performed. The post-hoc test showed that there is a significant difference in favor of U4 (𝑋𝑋�𝑈𝑈4 = 0,39). This means that, the literacy levels of pre-service teachers at U4 regarding basic statistical issues differ significantly from other universities. However, there is no significant difference between U2 and U3.
In order to determine whether the differences are seen in the post-tests among universities are statistically significant One-way ANOVA test was conducted. The results of the analysis are given in Table 6.
As can be seen in Table 6, the differences between the post-test linear scores of four universities are statistically significant (F3.198=26.217; p=.000<.05). Since the results were significant, a post hoc test was run. The post hoc test showed that results pertaining to U1 (𝑋𝑋�𝑈𝑈1 = −0.06) were significantly different. That is, the literacy levels of pre-service teachers at U1 regarding basic statistical concepts differed significantly from other universities. However, no significant difference existed between U2 and U3. From these findings, it is seen that the higher results of U4 in the pre-test shifted to U1 in the post-test.
Table 4. Descriptive Statistics of the Pre-Test and Post-Test
University Pre- test Post-test Mean sd Max. Min. Mean sd Max. Min.
U1 0.02 0.42 1.08 -1.54 -0.06 041 0.74 -1.41 U2 -0.18 0.34 0.47 -0.94 -0.67 0.47 0.29 -1.53 U3 -0.19 0.31 0.72 -0.94 -0.55 0.53 0.60 -1.31 U4 0.39 0.31 0.90 -0.59 -0.55 0.35 0.04 -1.53
Total 0.01 0.41 0.93 -1.46 -0.50 0.52 0.72 -1.81
Table 5. One-way ANOVA Results for Pre-Test Group N 𝐗𝐗� sd Sum of Squares df Mean Square F Sig. Post Hoc
U1 76 0.02 0.42 Between Groups 10.392 3 3.464
26.217 .000
U1-U2, U1-U3, U1-U4, U2-U4, U3-U4
U2 37 -0.18 0.34 Within Groups 26.160 198 .132 U3 32 -0.19 0.31
Total 36.551 201 U4 57 0.39 0.31
*The expressions in bold indicate which group is significantly differ
Table 6. One-way ANOVA Results for Post-Test Group N 𝐗𝐗� sd Sum of Squares df Mean Square F Sig. Post Hoc
U1 76 -0.06 0.41 Between Groups 25.958 3 8.653
57.902 .000
U1-U2, U1-U3, U1-U4, U2-U4, U3-U4
U2 37 -0.67 0.47 Within Groups 29.589 198 .149 U3 32 -0.55 0.53
Total 55.547 201 U4 57 -0.55 0.35

Guven et al. / INT ELECT J MATH ED, 16(2), em0627 7 / 15
To determine whether the differences in the sample selection component in the pre and post-test among universities are statistically significant, a One-way ANOVA test was conducted. The results of the analysis are given in Table 7.
The results of the analysis indicate that there is no statistical difference between universities (F3.198=.959; p>.05) as regards the sample selection component in pre-test. In other words, the universities have similar statistical literacy levels in terms of the sample selection component in the pre-test. On the other hand, when the scores received by pre-service teachers from the post-test are compared, it was found that the difference between the groups in terms of the sample selection component is statistically significant (F3.198=7.116; p<.05). The post hoc test revealed a significant difference between U1 (𝑋𝑋�𝑈𝑈1 = 0.62) and U2(𝑋𝑋�𝑈𝑈2 = −0.64), and between U4 (𝑋𝑋�𝑈𝑈4 = −0.03) and U2 (𝑋𝑋�𝑈𝑈2 = −0.64).
To determine whether the differences in the table and graphs component seen in the pre and post-tests are statistically significant, a One-way ANOVA test was conducted. The results of the analysis are given in Table 8.
According to Table 8, the differences between the groups in terms of the table and graphs component are also statistically significant in pre-test (F3.198=10.006; p<.05). Therefore, a post hoc test was run. This showed that there is a significant difference between U1 (𝑋𝑋�𝑈𝑈1 = 0.11) and U2 (𝑋𝑋�𝑈𝑈2 = −0.18), and between U4, and U2 and U3. More specifically the literacy levels of pre-service teachers at U4 regarding basic statistical concepts differ significantly from U2 and U3. However, there is no significant difference between U2 and U3. On the other hand, the post-test scores demonstrate a statistically significant difference between the groups in terms of the table and graphs component (F3,198=7,116; p=,000<,05). The post hoc test showed that U1 differed significantly than U2 and U3, and there is a significant difference between U4 (𝑋𝑋�𝑈𝑈1 = 0.36) and U2 (𝑋𝑋�𝑈𝑈2 = −0.71). These findings show that the results in favor of U4 in the pre-test have changed in favor of U1 in the post-test related to table and graphs component.
To determine whether the differences in data analysis component seen in the pre and post-test are statistically significant, a One-way ANOVA test was conducted. The results of the analysis are given in Table 9.
As can be seen in Table 9, the differences between the groups as regards the data analysis component are also statistically significant in pre-test (F3.198=21.075; p<.05). Since the results were significant, a post hoc test was run. The post hoc test showed the literacy levels of pre-service teachers at U4 regarding basic statistical concepts differed significantly from other universities. On the other hand, when the post-test scores are compared, the differences between the groups in terms of the data analysis component also proved statistically significant (F3.198=49.854; p<.05). The post hoc test showed that U1 was significantly different than all other universities, and there was a significant difference between U4 (𝑋𝑋�𝑈𝑈4 = −0.61) and U2 (𝑋𝑋�𝑈𝑈2 = −1.21). Also in this component, there is a significant difference between U2 and U3 in favor of U3. These findings indicate that the results in favor of
Table 7. One-Way ANOVA Results Related to Sample Selection Component Group N 𝐗𝐗� sd Sum of Squares df Mean Square F Sig. Post Hoc
Pre-test
U1 76 0.62 1.74 Between Groups 10.359 3 3.453
.959 .413 - U2 37 -0.64 1.49 Within Groups 71.649 198 3.599 U3 32 0.06 1.04
Total 723.008 201 U4 57 -0.03 1.63
Post-test
U1 76 0.38 1.62 Between Groups 40.639 3 13.546
7.116 .000 U1-U2, U2-U4
U2 37 -0.25 1.38 Within Groups 376.910 198 1.904 U3 32 0.13 0.96
Total 417.549 201 U4 57 0.14 1.52
Table 8. One-Way ANOVA Results Related to Table and Graphs Component Group N 𝐗𝐗� sd Sum of Squares df Mean Square F Sig. Post Hoc
Pre-test
U1 76 0.11 0.56 Between Groups 7.062 3 2.354
10.006 .000 U1-U2, U2-U4, U3-U4
U2 37 -0.18 0.55 Within Groups 46.583 198 .235 U3 32 -0.11 0.62
Total 53.645 201 U4 57 0.29 0.40
Post-test
U1 76 0.36 0.82 Between Groups 25.224 3 8.408
8.779 .000 U1-U2, U1-U3, U2-U4
U2 37 -0.71 1.08 Within Groups 189.631 198 .958 U3 32 -0.28 1.19
Total 214.855 201 U4 57 0.49 0.65
Table 9. One-Way ANOVA Results Related to Data Analysis Component Group N 𝐗𝐗� sd Sum of Squares df Mean Square F Sig. Post Hoc
Pre-test
U1 76 0.00 0.94 Between Groups 43.234 3 14.411
21.075 .000 U1-U4, U2-U4, U3-U4
U2 37 -0.27 0.86 Within Groups 135.395 198 .684 U3 32 -0.40 0.75
Total 178.629 201 U4 57 0.68 0.75
Post-test
U1 76 -0.18 0.65 Between Groups 84.921 3 28.307 49.854 .000
U1-U2, U1-U3, U1-U4, U2-U3, U2-U4, U3-U4
U2 37 -1.21 1.25 Within Groups 112.423 198 .568 U3 32 -0.77 1.15
Total 197.344 201 U4 57 -0.61 0.48

8 / 15 Guven et al. / INT ELECT J MATH ED, 16(2), em0627
U4 in the pre-test changed in favor of U1 in the post-test as to the data analysis component. It also appeared that the statistics courses had positively affected statistical literacy levels of pre-service teachers in U3.
To investigate whether the differences between the pre and post-test regarding the data interpretation component are statistically significant or not, one-way ANOVA test was conducted. The results of the analysis are given in Table 10.
The results of the analysis indicate that the differences between the groups in terms of the data interpretation component are statistically significant in pre-test (F3.198= 6.561; p<.05). Since the results were significant, a post hoc test was run. The post hoc test showed the literacy levels of pre-service teachers at U4 regarding data interpretation differed significantly from other universities (𝑋𝑋�𝑈𝑈4 = 0.27). On the other hand, when the post-test scores were compared, it was found that the difference between the groups was also statistically significant (F3198=35.937; p<.05). The post hoc test showed that U1 (𝑋𝑋�𝑈𝑈1 = −0.31) was significantly different than other universities. This is means that the statistic course had a significantly positive effect on the statistical literacy levels of pre-service teachers regarding data interpretation in U1. Moreover, it is seen that the higher results that belonged to U4 in the pre-test shifted to U1 in the post-test as to data interpretation.
An overall analysis of the results of pre-test and post-test demonstrates that pre-service teachers at U4 have higher statistical literacy regarding basic statistical concepts, followed by U1 in the pre-test. However, pre-service teachers at U4 do not display this success in the post-test applied after the statistics course. Pre-service teachers’ performance at U1 is statistically significant different from all groups. In the pre-test, no difference exists between U2 and U3. This situation continues in the post-test. The fact that the averages of pre-test and post-test scores are close supports this situation. As regards components, U4 displayed statistically higher values, whereas in the post-test, pre-service teachers in the U1 were significantly different in all the components of statistical literacy from other groups. Although U4 had higher statistical literacy regarding the components in the pre-test, they could not maintain their place in the post-test. After the statistics course, pre-service teachers at U1 showed a significantly higher average than the other groups in the post-test. No difference emerged in the post-test between U2 and U3 in terms of the components except the data analysis component of statistical literacy. This means that the statistical course has positively affected pre-service teachers’ literacy regarding data analysis.
Performing pre and post-tests before and after the statistic course and making no intervention with pre-service teachers during courses support the idea that teaching activities in statistic courses affect the emergence of the differences between universities. In this study, observation of statistics courses were conducted at four universities to reveal causes of this differentiation. Based on the field notes, statistics courses taught in four universities are summarized below:
Statistics courses at U1 are geared towards students’ learning. At the beginning of the course, the instructor checks the preliminary knowledge of pre-service teachers on statistical concepts, and after a short review, he/she proceeds with the course. He/she usually gives real-life examples when teaching new concepts. For example, while explaining the importance of the sample-population relationship and sample selection, the instructor made the following statement in the class:
Remember what we said: Imagine that our mother is making a soup, the soup pot represents a population, but no mother will drink the entire pot to taste the soup. She just tastes a spoon of it. But remember what I said there; if you fill that spoon only from the surface of the soup, you still cannot make the right decision about the taste of food. So what should we do? Firstly, we should mix the pot thoroughly, and then we should take a spoon that represents it better. Why am I saying this? Because all of you could choose a sample. But the important thing is to choose the most representative sample….
In this example, the instructor explains what the sample is, the importance of the representativeness of the sample, and possible mistakes regarding sample selection through daily life. Drawing an analogy, he/she consolidates the pre-service teachers’ conceptual understanding of the subject. In addition to teaching the concepts effectively, the instructor gives pre-service teachers a terminology responsibility. In this practice, when a concept is introduced for the first time, each pre-service teacher comes ready for the course having done research about the concept assigned to him/her and presents the concept to his/her friends before the instructor does. Meanwhile, the instructor asks interrogative and thought-provoking questions to the pre-service teacher and the whole class to make them understand the concept. Then, the related concept is fully explained by instructor. The following dialogue illustrates this practice:
Inst.: Explain to your friends what you have understood. What is a parameter?
PT: The numerically measurable feature of the main mass is the parameter of that population.
Inst.: Aren’t the population and main mass the same thing? Your friend says: It is the measurable feature of the population. Can you measure the average of the population? Then, is the average a parameter?
PT: Yes.
Inst.: It is a parameter. Can you measure the standard deviation?
Table 10. One-Way ANOVA Results Related to Data Interpretation Component Group N 𝐗𝐗� sd Sum of Squares df Mean Square F Sig. Post Hoc
Pre-test
U1 76 -0.21 0.92 Between Groups 16.685 3 5.562
6.561 .000 Ü1-Ü4, Ü2-Ü4, Ü3-Ü4
U2 37 0.01 1.16 Within Groups 166.980 197 .848 U3 32 -0.04 0.62
Total 183.664 200 U4 57 0.27 0.91
Post-test
U1 76 -0.31 0.67 Between Groups 47.070 3 15.690
35.937 .000 Ü1-Ü2, Ü1-Ü3, Ü1-Ü4
U2 37 -0.83 0.65 Within Groups 86.445 198 .437 U3 32 -1.09 0.68
Total 133.514 201 U4 57 -1.58 0.91
Guven et al. / INT ELECT J MATH ED, 16(2), em0627 9 / 15
PT: Yes.
Inst.: This is also a parameter the minute that you calculate it. Are there any other parameters?
PT: This is the only value. The feature of the population does not change.
Inst.: Good. Do you know why the population’s parameter does not change? Do we not take everyone into account when calculating the average of the population?
(Inst.: Instructor, PT: Pre-service Teacher)
Instead of explicitly teaching the concept, the instructor asks questions to the pre-service teachers to help them develop meanings about the concept based on their deductions. In addition, while the instructor emphasizes different parameters, he/she also points out that the calculated parameter value will not change unless the population changes after receiving the answer of the pre-service teacher. At the U1 courses, the instructor contextualizes the problem situations and guides the pre-service teachers to discover meaning based on their deductions from the context. For example, while explaining the subject of chi-square tests, the instructor brings a dice to class and asks the candidates to take out a coin.
Let’s test the coin. I have a coin and a dice, guys. Everyone throws a coin and a dice. Writes down the results. These are the observed frequencies, yes, let’s throw the coin and continue. Observed frequencies are O1, O2,… Ok and the predicted values corresponding to these; E1, E2,… And there is Ek. Now, the Chi-Square test measures the goodness of fit. In other words, the statistic that determines the goodness between the observed and predicted values is called chi-square compatibility statistics. Now we will test whether the coin and dice are loaded (whether it has the goodness of fit with the theoretical distribution).
He/she introduces the subject in this way and relates the context to the subject. Similarly, subject-related and contextualized problem situations are presented by the pre-service teachers during the course. It was generally observed that pre-service teachers make a transition towards conceptual knowledge through the practices they have experienced and in-class practices are shaped by real-life situations in U1 University. In brief, the instructor adopts a constructivist and student-centered approach. After the instructor designs a problem situation that he/she can associate with the subject, he/she exploits the topic in a way to ask related thought-provoking questions and collect real-life data from pre-service teachers, helping them interpret the obtained results in relation with the context. The fact that the instructor at U1 adopts a student-centered approach during the statistics course and uses instructional techniques helping students gain first-hand conceptual experience might have been effective in increasing their statistical literacy levels in the post-tests.
The instructor at U2 generally adopts a teacher-centered approach. The instructor refers to real-life situations in his/her examples. For example, when explaining the uniform distribution, he/she says, “let’s write an example from the field of engineering” and cites a problem situation as follows:
In a production department, the mounting of a product distributes uniformly, taking 30-37 seconds. What is the probability that the mounting time of a random product is a) between 32-36 sec., b) more than 35 sec.?
This is a typical exercise facilitating comprehension of the subject uniform distribution after it was introduced. However, although the problem is presented within a context, the context does not seem to be associated with the subject. Also, their understanding of the subject is tried to be enhanced by daily life examples at the beginning. The instructor also tries to include different types of problems related to the subject in the courses. For example, after the problem is solved in the form of an exercise on the exponential distribution, the instructor asks a different question:
Suppose that the waiting period at the office of student affairs has an exponential distribution and 15 procedures are performed per hour. Calculate the mean, variance, and median for the waiting period.
In this problem, the average and variance can be calculated directly with the formulas given for exponential distribution. However, the instructor also asked them to find a different measurement in this problem. There is no formula for how to find the median directly, so students need to think about how to find the median. It is also important that they refer to their knowledge on distributions, probability, and median. In this sense, the problem deviates from a concrete exercise as it requires different perspectives and conceptual understanding of the median. The pre-service teachers cannot solve the problem because it is difficult and has a different structure. Although the instructor includes operational or rule-oriented questions in his lessons, he is not limited to as, to a lesser extent, he also prefers interpretive questions. However, the interpretive questions based on the critical approach were not the predominantly used teaching technique, which could have decreased their successes in the test.
At the U2 courses, subjects are taught directly, but thought-provoking questions may also be asked. Usually, such questions are used to draw links with different subjects or enable students’ understanding of the steps followed. For example, after the hypothesis testing, steps are explained in the course. The instructor writes the following example on the board to facilitate understanding and solves it directly. While doing so, he/she implements the steps of the hypothesis testing process for the solution. The instructor not only announces the obtained result is rejection or acceptance, but he/she discusses what this result means.
Whether the average age of the users of a children’s library is 12 is wanted to be tested. The ages of 16 random children coming to this library are as follows: 10, 7, 8, 8, 15, 14, 12, 11, 10, 10, 10, 7, 13, 13, 5, 7. Test the claim at a significance level of 0.05.
This is a typical problem related to hypothesis testing. Similar problems with different subject contexts are used in the U2 courses. However, in such problems, it is difficult to relate to the experiences of pre-service teachers or find an interesting subject, the data of which can be obtained directly from the class environment. That is, real-life data and relevant contexts are missing in statistical literacy courses.
At U3, similar to U2, the traditional approach prevails in courses. In a large part of the course, the instructor provides a verbal explanation of definitions and concepts and has the problem-solving steps written as instructions. In the rest, the instructor

10 / 15 Guven et al. / INT ELECT J MATH ED, 16(2), em0627
actually solves the problems to reinforce learning. The instructor generally revises the previous course quickly at the beginning of the course and explains the new subject. On sample selection, he/she speaks as follows:
A sample means that there will always be a population. What we call population is a sample. For example, I’m curious about something of these 3rd-grade mathematics teachers at this University. I’m just curious about you, okay? You are the population, and then I’ll be working with you. But generally, researches do not proceed like this. A current research does not only wonder something about you, it wonders about the general things, and then you become a sample. For example, pre-service teachers from the Western Black Sea can be a population, okay?
The instructor tries to explain the concepts of sample and population through examples from real-life situations. However, the information on both concepts is given discretely, and the concepts are explained rather superficially. This situation may be stemming from concerns of the instructor such as having to finish the subjects and timing.
Communication at U3 is generally one-way, from the instructor to the students, and a teacher-centered approach prevails. The steps to be followed in the problem solving are instructed, and the things to avoid are given as the rules, while the students take notes. That is, an operational, and rule and formula-oriented approach is adopted rather than enhancement of conceptual understanding. Put differently, instead of promoting conceptual understanding and thinking for problem-solving, pre-service teachers think only operationally by following the instructions step by step. Therefore, pre-service teachers are likely to have problems using important statistical literacy skills such as critical approach and interpretation. Not surprisingly, pre-service teachers in this group failed in the statistical literacy, especially in the items requiring interpretation and critical thinking skills. Thus, it can be concluded that, following a rule and formula oriented teaching for the most part of the course can hinder conceptual understanding.
At U4, a teacher-centered process, in which pre-service teachers also participate in teaching and take an active role in the class environment, is followed in the statistics courses. The instructor builds up on prior knowledge during the lectures and starts the subject with a general representative example. However, in these examples, the data is prepared in advance, and no authentic problems are created by receiving the data directly from the class environment. This makes it difficult to interpret the obtained results. Nevertheless, although the formulas are given directly in the course, in some cases, pre-service teachers are made to think about the mathematical bases of the formulas.
The instructor asks questions to the pre-service teachers and tries to encourage their participation in the course. However, it seems that these questions generally facilitate the completion of problem solving steps. For example, after a data set consisting of 40 items is written on the board, the students are asked to classify this data, calculate the measures of central tendency, interpret skewness, calculate standard deviation, create histograms, and determine the value corresponding to 40% of the data through the classified data. The course starts with this question, and pre-service teachers are provided with a brief revision of the previous weeks’ input in the entire course. Pre-service teachers can classify the data, calculate measures of central tendency and standard deviation, and interpret skewness in groups. However, they do not perform well in the question, in which they are required to find the value representing 40% of the data. Then, the instructor guides them through the solution by asking guiding questions as follows:
Inst.: We distribute the data in such a way that... what is there right in the middle?
PT: Median
Inst.: Now, determine a point that it is over 40% of the data. What was the median?
PT: The value corresponding to 50%.
Inst.: So what does this 40% mean then?
PT: It must be on the right of the median.
Inst.: So it leaves 60% of data before the 40%. So we interpret the median formula for 60%.
It is observed that practices such as interpreting table and graphs, using visual representation, drawing attention to the relationships between concepts, giving examples from daily life are generally included in statistical literacy U4 courses. However, in the examples used during the courses, ready-made data is presented, and no problem is created from the data of the class environment. This makes it difficult to interpret the obtained. Nevertheless, although the formulas are often given directly in the course, pre-service teachers are sometimes made to think about the mathematical bases of the formulas. The instructor also refers to data representations while explaining some concepts. He/she briefly explains the concept through these representations and asks questions to pre-service teachers. However, these questions are not conducive to guided discovery (e.g., establishing relationships between data, seeing the boundedness, interpreting inaccurate situations, making deductions beyond the data). The teaching methods and approaches adopted in statistics courses at four universities are summarized in Table 11.
When the statistics courses given at these universities are examined, it is seen that a student-centered approach is adopted at U1. The courses are mainly taught through pre-service teachers’ own experiences. In addition, learning environments are designed in such a way that pre-service teachers are involved a series of processes such as collecting data, analyzing it, and interpreting the results within the context. At U2 and U3, a teacher-centered approach is followed by the instructors. Generally, the definitions and concepts are explained verbally, and the procedures regarding solving the problem situations are written on the board by these instructors. At U4, a teacher-centered approach has been adopted in statistics courses, but a process engaging the pre-service teachers is also followed. At U4, the instructor asks questions about the subject to the pre-service teachers during the course in an attempt to increase their participation in the course.
Statistics courses are based on conceptual understanding in U1 and U4. For example, at U1, conceptual understanding is prioritized, and various intra and extra-curricular learning activities are implemented to ensure students’ conceptual

Guven et al. / INT ELECT J MATH ED, 16(2), em0627 11 / 15
understanding. At U4, students are involved in learning activities supporting conceptual understanding such as use of representations, inter-conceptual association, and connection to daily life. On the other hand, U2 and U3 attach importance to operational understanding, wherein concepts are directly explained and the procedural steps are explicitly written for example solutions.
In these universities, the context is generally used as a means. Although the context is included in problem situations, it is not associated with the subject. At U1, it is observed that context is included in both teaching concepts and problem situations. In other words, context is the ultimate goal of the teaching practices here. Particularly, the problem situations associated with the context are brought to the class, and the pre-service teachers are encouraged to establish a relationship between the subject and the context and to see what the results mean within the context.
It is observed that real life research questions are included in statistics courses at U1. In this way, pre-service teachers can profoundly experience statistical processes such as collecting data, analyzing them, and making deductions over the obtained results. The instructor tries to include a variety of problems in the courses at U2. Still, some problem situations presented can be solved directly with the rule and definition knowledge. At U3, after giving definitions and concepts related to the subject, problems are cited to reinforce the input. At U4, routine problem situations related to subjects and concepts are included.
In terms of teaching the concepts, it is seen that they are explained directly by instructors at U2 and U3. At U4, the instructor cites examples including daily life situations to facilitate understanding of concepts but avoids example situations that may cause misconception. This might account for why pre-service teachers failed to cope with boundedness and to provide advanced answers that require a different perspective in the post-test. On the other hand, student-centered practices are included in concept teaching at U1. Here, the pre-service teacher first explains the concept to his/her class-mates, and the instructor asks interrogative and thought-provoking questions to the pre-service teacher and the class to make them understand the concept. Then, the related concept is finally explained by the instructor shortly. A learning environment where pre-service teachers actively participate in the course seems to be created in this way.
When the quality of the questions addressed to pre-service teachers in statistics courses is analyzed, it is seen that critical questions that will get pre-service teachers to think are not frequent, and generally interrogative questions regarding the steps of the procedure are raised. The courses include limited practices for statistical literacy (e.g., referring to examples from daily life, presenting problems within a context, adopting statistical terminology). However, learning activities for developing statistical literacy such as the use of representation, inter-conceptual associations, and daily life relations are included in the courses at U4. Thus, the statistical literacy practices performed in statistics lessons may lead the pre-service teachers at U4 to perform differently from pre-service teachers at U2 and U3 in the post-test. However, the success differences are not at the same level as in U1. In the post-test, pre-service teachers from U1 displayed a statistically significant difference in almost all components from the other universities’ pre-service teachers. The different practices aiming at a wider range of statistical literacy in U1 has probably been effective in these differences. Therefore, it can be concluded that adopting a student-centered approach and including deduction-based and interrogative learning activities such as critical approach, questioning, addressing the boundedness, and discussing possible error situations in courses have an important effect on the statistical literacy of pre-service teachers.
DISCUSSION AND CONCLUSION
The present study aimed to determine the statistical literacy level of the pre-service teachers and to evaluate the contribution of the introductory statistics courses to their statistical literacy levels. The results revealed differences between the pre and post-test mean scores of the universities. While U4 had the highest linear score average (0.39), U3 had the lowest (-0.19). U1 (0.02) and U2 (-0.18) followed U4. To test whether these differences are statistically significant, ANOVA test was performed. ANOVA results showed that there is a statistically significant difference between the universities in terms of the pre-test scores. U1 and U4 had significantly higher mean scores than U2 and U3. Also, U4 produced significantly higher average scores than U1. The national university exam score required by U4, i.e. pre-service teachers’ having better success ranking in this nation-wide exam, could be a factor influencing this result. These students could be successful at pre-test questions, which call for analytical approach and reasoning. The higher university exam scores they achieved might hint that they already had the required knowledge and skills of the pre-test. After all, it is a variable effective on the demonstration of the statistical literacy skills (Ozmen, 2015). Moreover, pre-test questions are based on basic knowledge and interpretation skills related to measures of central tendency, table and graphs, which could also be an advantage to U4 pre-service teachers possibly having a stronger background. As critical evaluation and interpretation skills are important for the development of the statistical literacy (Gal, 2002; Ozmen, 2015; Watson, 1997), U4 students having higher success rates might have used greater thinking and interpretation skills.
Table 11. Learning and Teaching Approaches Adopted in Four Universities U1 U2 U3 U4
Teaching Approach Student-Centered Teacher-Centered Teacher-Centered Teacher and Student-Centered Promoting Conceptual Understanding X - - X
Context As a Goal As a Means As a Means As a Means
Using Different Types of Questions Real-Life Oriented, Exploratory Application Oriented Exercise Oriented Routine Problems Oriented
Teaching of concepts Engagement Directly Directly Precedent Asking critical questions X - - x
** This table includes commonly observed situations

12 / 15 Guven et al. / INT ELECT J MATH ED, 16(2), em0627
As to the post test scores, U1 (-0.06) had the highest and U2 (-0.67) has the lowest average linear score. U4 and U3 (-0.55) had the same average linear score and followed U1. To determine whether this difference was statistically significant, ANOVA test was performed. The results showed that there is a statistically significant difference between universities. U1 and U4 had statistically significant higher average scores than U2 and U3. Also, there is a statistically significant difference between U1 and U4. Unlike the pre-test results, U1 displayed higher results. While U4 was significantly different from U1 for the pre-test scores, this was reversed at the post-test. The teaching and learning process followed by the instructors at statistics courses could have an impact on this differentiation. Thus, training individuals up to the expected levels of statistical literacy and thinking and making necessary arrangements to this end are considered important for statistics teaching (Hybšová & Leppink, 2015; Whetstone, 2014). Moreover, the practices in statistics courses are important in the emergence of statistical literacy (Hybšová & Leppink, 2015; Ozmen & Baki, 2017). Therefore, it would be critical to design teaching experiences through conceptual understanding rather than procedural understanding highlighting rules and procedures (Ben-Zvi & Garfield, 2004), and to integrate context in our statistics teaching, not only using it as a means but also integrating it as an important goal.
Four-hour class observations were conducted in statistics courses in all four universities to determine the emphasis placed on statistical literacy. According to the results of the observations, U1 employs a more practice-based approach to teaching statistical processes, context, and reasoning aspects. Indeed, it was observed that problem situations were generated, data was collected from the classroom environment and analyzed, analysis results were interpreted, and critical questions were asked in this institution. Besides, in other universities, subjects are generally taught within a context, which is referred to as a means, and the results obtained are also interpreted with the relevant context.
The approaches followed by the instructors varied. Especially, instructors at U2 and U3 follow a traditional teaching approach in their statistics lessons. They rarely ask critical thinking questions to students, and the questions mostly call for following procedural steps. A context is used only in problem situations. On the other hand, in U1 classes, students are active constructing responses to various questions in the learning environment, and contexts are addressed in different situations. Moreover, U1 is different in that it allocates place to diverse aspects of statistical literacy such as obtaining real-life data and determining problem situations based on these real-life data, discussing the obtained results, and asking questions that also require interpretation. The related literature also underscores that adopting different instructional practices contributes to statistical literacy. Hybšová and Leppink (2015) pointed out that, if statistics educators aim at developing statistical literacy, they should make some changes in their instruction. Ozmen and Baki (2017) also stressed that statistics instructors should incorporate in their course content different practices and they should increase the emphasis they place on developing statistical literacy. Whetstone (2014) highlighted that instructors should not only revise their statistics course content but they should also adopt different teaching methods in pursuit of conceptual understanding. Ozmen (2015) drew attention to the importance of training statistically literate students and including different components of statistical literacy in statistics course content. Similarly, Reston (2005) stated that the more emphasis is placed on statistical literacy at statistics courses, the higher the statistical literacy levels of students.
The findings of the study showed that statistical literacy levels of pre-service teachers are generally low, with especially post-test scores being lower than the pre-test. It can be attributed to some test questions that not only include statistical subjects but also require answers that need thinking on the context, evaluating critically, and considering limitations. Some questions are simply built on critical thinking and interpretations rather than procedural steps or basic knowledge. This might seem to be a limitation at first, but for statistical literacy, being equipped with the context, reasoning (i.e. critical thinking, considering probable errors or misconceptions, etc.), and having mastery of the statistical process (i.e. collecting data, data analysis, representation, and interpretation) are as important as knowing the basic knowledge or procedural steps (Groth, 2007; Ozmen, 2015). It was also found that pre-service teachers could not display statistical literacy behavior when making interpretations and inferring from the context. In other words, they failed to attain one of the ultimate goals of the statistics courses; they did not gain research skills (Rumsey, 2002). This raises concerns about the students’ potential to adopt and experience statistical process, which is considered integral to statistical education (Franklin et. al, 2005; Groth, 2013; Newton et al., 2011; Ozmen, 2015). Furthermore, Oliver-Souza, Lopes, and Fitzallen (2020) emphasized that statistical inquiry provides a rich learning experience, in which students can develop statistical literacy skills. Thus, it is suggested that the current statistics course content be designed to include statistical process stages and enable students to experience and adopt this process.
The present study found that the success of the pre-service teachers differed according to several components. Pre-service teachers performed better dealing with the questions related to sample selection, and their success increased from pre-test to post-test. However, while answering the pre-test questions related to sample, they usually considered purposive sample selection, focusing only on one dimension in their samples. Also, in the post-test, they failed to provide statistically elaborate answers and consider limitations or bias in their samples when, in fact, they were expected to consider different dimensions on their samples, give place to limitations in their responses, and support their answers with terms such as randomness and representation of the population. In brief, the statistics courses seemed to advance some responses. For example, as for the table and graphs component, pre-service teachers effectively answered the questions requiring reading the data at the pre-test. On the other hand, they failed to answer the questions requiring reading between and beyond the data. This failure remained in the post-test. They had started to read between the data, yet no drastic increase took place in the expected level. For the data analysis component, students were more successful at questions not including a context. They could determine their data set and answer the questions with the help of this set. However, they were unsuccessful at associating the context and problem situations in contextual questions. This failure could simply arise from their inadequate conceptual knowledge. Participants’ performance improved in context questions in the post-test. This is indicative of that pre-service teachers tried to improve on statistical language and context knowledge from pre-test to post-test. However, the overall low rate of success in the post-test indicates that this is still limited and participants had difficulties in performing the analysis steps or rationalizing their answers. Watson (2006) also asserted that the context has an important role in clarifying the problem situation and pointed out that students are more successful when

Guven et al. / INT ELECT J MATH ED, 16(2), em0627 13 / 15
they can associate a context to statistical concepts in problem situations. Therefore, engaging students in practices that integrate contextual and statistical knowledge would contribute to the statistical literacy of individuals (Gal, 2002; Pfannkuch & Wild, 2004; Watson & Callingham, 2003). As regards the data interpretation component, pre-service teachers were again successful with questions including a context in the pre-test, while they failed to answer this kind of question in the post-test. This component, which requires more advanced skills such as critical thinking and considering limitations, have always been challenging to pre-service teachers, but probably because the post-test especially gave greater emphasis to these aspects, the participants demonstrated lower performance in this component. For example, they interpreted the correlation analysis result of 0.88, pertaining to the glucose and cholesterol value of ten people, as only a positive and strong relationship. They examined the question only considering the 0.88 value, the size of the correlation coefficient. They ignored the fact that the sample size is too small to make this kind of interpretation or the limitation about the significance of the correlation coefficient. Therefore, their answers were assigned to the lower categorical score.
The present study aimed to determine the statistical literacy levels of pre-service mathematics teachers in terms of the statistical literacy components and the effectiveness of statistics courses in the development of their statistical literacy skills. According to the findings of the study, the statistical literacy skills of pre-service teachers are not adequate. The possible reasons behind this result were discussed. First, the assessment of statistical literacy of pre-service teachers was not only directed at statistical subjects at the basic level but also at the advanced level. Second, the statistics courses the participants took earlier in their undergraduate curriculum might account for it. At this point, regardless of the grade level, the importance of statistics courses became remarkable in making students or future teachers statistically literate. In fact, enhancing instructional practices and experiences in education faculties would be crucial in training statistically literate individuals. Fortunately, the Council of Higher Education (2018) in Turkey incorporated “Probability and Statistics Teaching” into the curriculum of master’s studies in teacher education. As of the 2020-2021 academic year spring term, this course will be taught as a compulsory course, which would hopefully serve the development of statistically literate pre-service teachers and their future students. At this point, instructors have an important role in designing the course content through recommendations and feedback about statistics education. It is suggested that further research be conducted focusing on the teaching experiment, activities, and instructional perception of pre-service teachers regarding the statistical subjects at the level of elementary education.
Author contributions: All authors have sufficiently contributed to the study, and agreed with the results and conclusions. Funding: This work was produced from a part of the BAP01 project with code SBA-2016-5670 supported by Karadeniz Technical University in Turkey. Declaration of interest: No conflict of interest is declared by authors.
REFERENCES
Aliaga, M., Cobb, G., Cuff, C., Carolyn, C., Garfield, J., Gould, R., … Witmer, J. (2005). Guidelines for assessment and instruction in statistics education: College report. Alexandria, VA: American Statistical Association. Retrieved from https://www.amstat.org/asa/files/pdfs/GAISE/2005GaiseCollege_Ful l.pdf
Batanero, C., Burrill, G., & Reading, C. (2011). Overview: Challenges for teaching statistics in school mathematics and preparing mathematics teachers. In C. Batanero, G. Burrill, & C. Reading (Eds.), Teaching statistics in school mathematics-Challenges for teaching and teacher education (pp. 407-418). New ICMI Study Series, vol 14. Dordrecht: Springer.
Ben-Zvi, D., & Garfield, J. (2004). Statistical literacy, reasoning, and thinking: Goals, definitions, and challenges. In D. Ben-Zvi, & J. Garfield (Eds.), The challenge of developing statistical literacy, reasoning and thinking (pp. 3-15). Dordrecht, The Netherlands: Kluwer Academic Publishers. https://doi.org/10.1007/1-4020-2278-6
Bond, T. G., & Fox, C. M. (2007). Applying the Rasch Model: Fundamental Measurement in the Human Sciences (2nd ed.). Mahwah, NJ: LEA.
Budgett, S., & Pfannkuch, M. (2010). Assessing students’ statistical literacy. In P. Bidgood, N. Hunt, & F. Jolliffe (Eds.), Assessment methods in statistical education: An international perspective (pp. 103-121). Chichester, UK: Wiley. https://doi.org/10.1002/9780470710470.ch9
Callingham, R. (2006). Assessing statistical literacy: A question of interpretation [Paper presentation]. The Seventh Congress of International Conference on Teaching Statistics (ICOTS-7), Bahia, Brazil.
Callingham, R., & Watson, J. M. (2017). The development of statistical literacy at school. Statistics Education Research Journal, 16(1), 181-201. Retrieved from http://iase-web.org/Publications.php?p=SERJ
Chick, H. L., & Pierce, R. (2012). Teaching for statistical literacy: Utilizing affordances in real-world data. International Journal of Science and Mathematics Education, 10(2), 339-362. https://doi.org/10.1007/s10763-011-9303-2
Council of Higher Education (2018). Faculty of education undergraduate curriculum. Retrieved on 18 November 2019 from https://www.yok.gov.tr/kurumsal/idari-birimler/egitim-ogretim-dairesi/yeni-ogretmen-yetistirme-lisans-programlari
Creswell, J. W., & Plano-Clark, V. (2018). Designing and conducting mixed methods research (3rd ed.). Thousand Oaks, CA: SAGE
Creswell, J. W., & Clark, V. (2011). Designing and conducting mixed methods research (2nd ed.). Thousand Oaks, CA: SAGE.
Franklin, C., Kader, G., Mewborn, D., Moreno, J., Peck, R., Perry, M., & Schaeffer, R. (2007). Guidelines for assessment and instruction in statistics education (GAISE) report: A pre-K-12 curriculum framework. American Statistical Association. Alexandria, VA. Retrieved from http://www.amstat.org/Education/gaise/GAISEPreK-12_Full.pdf

14 / 15 Guven et al. / INT ELECT J MATH ED, 16(2), em0627
GAISE College Report ASA Revision Committee (2016). Guidelines for assessment and instruction in statistics education college report. Alexandria, VA: The American Statistical Association. Retrieved from http://www.amstat.org/education/gaise
Gal, I. (2002). Adults’ statistical literacy: meanings, components, responsibilities. International Statistical Review, 70(1), 1-25. https://doi.org/10.2307/1403713
Garfield, J., & delMas, R. (2010). A web site that provides resources for assessing students’ statistical literacy, reasoning and thinking. Teaching Statistics, 32(1), 2-7. https://doi.org/10.1111/j.1467-9639.2009.00373.x
Garfield, J., delMas, R., & Chance, B. (2002). The Assessment Resource Tools for Improving Statistical Thinking (ARTIST) Project. NSF CCLI grant ASA- 0206571. Retrieved from https://apps3.cehd.umn.edu/artist/index.html
Garfield, J., delMas, R., & Zieffler, A. (2010). Assessing important learning outcomes in introductory tertiary statistics courses. In P. Bidgood, N. Hunt, & F. Jolliffe (Eds.), Assessment methods in statistical education (pp. 75-86). Chichester, UK: John Wiley & Sons, Ltd. https://doi.org/10.1002/9780470710470.ch7
Gattuso, L., Ottaviani, M. G. (2011). Complementing mathematical thinking and statistical thinking in school mathematics. In: Batanero C., Burrill G., Reading C. (Eds.), Teaching statistics in school mathematics-Challenges for teaching and teacher education (pp. 121-132). New ICMI Study Series, vol 14. Dordrecht: Springer. https://doi.org/10.1007/978-94-007-1131-0_15
Groth, R. E. (2007). Toward a conceptualization of statistical knowledge for teaching. Journal for Research in Mathematics Education, 38(5), 427-437. https://doi.org/10.2307/30034960
Groth, R. E. (2013). Characterizing key developmental understandings and pedagogically powerful ideas within a statistical knowledge for teaching framework. Mathematical Thinking and Learning, 15(2), 121-145. https://doi.org/10.1080/10986065.2013.770718
Gundlach, E., Richards, K. A. R., Nelson, D., & Levesque-Bristol, C. (2015). A comparison of student attitudes, statistical reasoning, performance, and perceptions for web-augmented traditional, fully online, and flipped sections of a statistical literacy class. Journal of Statistics Education, 23(1), 1-33. https://doi.org/10.1080/10691898.2015.11889723
Hall, J. (2011). Engaging teachers and students with real data: Benefits and challenges. In C. Batanero, G. Burrill, & C. Reading (Eds.) Teaching statistics in school mathematics-Challenges for teaching and teacher education (pp. 335-346). New ICMI Study Series, vol 14. Dordrecht: Springer. https://doi.org/10.1007/978-94-007-1131-0_32
Hybšová, A., & Leppink, J. (2015). The subject of statistics in natural science curricula: A case study. Journal on Efficiency and Responsibility in Education and Science, 8(1), 8-14. https://doi.org/10.7160/eriesj.2015.080102
Jairaman, K., Zamri, S. N. A. B. S., & Rahim, S. S. B. A. (2018). A pre-service mathematics teacher’s subject matter knowledge of the mode: A case study. MOJES: Malaysian Online Journal of Educational Sciences, 4(3), 1-11. Retrived from https://mojes.um.edu.my/article/view/12652/8143
Kaplan, J. J., & Thorpe, J. (2010). Post-secondary and adult statistical literacy: Assessing beyond the classroom. In C. Reading (Ed.), Data and context in statistics education: towards an evidence-based society. Proceedings of the Eighth International Conference on Teaching Statistics. Voorburg, The Netherlands: International Statistical Institute. Retrieved from https://iase-web.org/documents/papers/icots8/ICOTS8_5E3_KAPLAN.pdf
Koparan, T. (2012). Proje tabanlı öğrenme yaklaşımının öğrencilerin istatistik okuryazarlığı seviyelerine ve istatistiğe yönelik tutumlarına etkisi [The effect of project based learning approach on the statistical literacy levels and attitude towards statistics of student] (Unpublished doctoral dissertation). Karadeniz Technical University, Trabzon.
Linacre, J. M. (2009). A user’s guide to FACETS Rasch-model computer programs, program manual 3.65.0. Chicago, IL: Winsteps.com.
Martignon, L. (2011). Future teachers training in statistics: The situation in Germany. In C. Batanero, G. Burrill, & C. Reading (Eds.), Teaching statistics in school mathematics-Challenges for teaching and teacher education (pp. 9-13). New ICMI Study Series, vol 14. Dordrecht: Springer. https://doi.org/10.1007/978-94-007-1131-0_6
National Council of Teachers of Mathematics. (2000). Principles and standards for school mathematics. Reston, VA: Auhor.
Newton J., Dietiker L., & Horvath A. (2011). Statistics education in the United States: Statistical reasoning and the statistical process. In C. Batanero, G. Burrill, & C. Reading (Eds.), Teaching statistics in school mathematics-Challenges for teaching and teacher education (pp. 33-40). New ICMI Study Series, vol 14. Dordrecht: Springer. https://doi.org/10.1007/978-94-007-1131-0_2
Oliveira-Souza, L. D., Lopes, C. E., & Fitzallen, N. (2020). Creative insubordination in statistics teaching: Possibilities to go beyond statistical literacy. Statistics Education Research Journal, 19(1), 73-91. Retrived from http://iase-web.org/Publications.php?p=SERJ
Ozmen, Z. (2015). Farklı lisans programlarında okuyan öğrencilerin istatistik okuryazarlığının incelenmesi [Examination of the statistical literacy levels of students from different undergraduate programs] (Unpublished doctoral dissertation). Karadeniz Technical University, Trabzon.
Ozmen, Z. M., & Baki, A. (2017). Evaluating the practices of instructors teaching statistics courses from different undergraduate programs in terms of statistical literacy. Education & Science, 42(191), 323-349. https://doi.org/10.15390/EB.2017.6984
Pfannkuch, M., & Wild, C. (2004). Towards an understanding of statistical thinking. In D. Ben-Zvi, & J. Garfield (Eds.), The challenge of developing statistical literacy, reasoning and thinking (pp. 17-46). Dordrecht: Springer.. https://doi.org/10.1007/1-4020-2278-6_2
Guven et al. / INT ELECT J MATH ED, 16(2), em0627 15 / 15
Reston, E. D. (2005). Assessing statistical literacy in graduate level statistics education [Paper presentation]. The 55. Session of the International Statistical Institute, Sydney, Australia. Retrieved December 23, 2011, from http://iase-web.org/documents/papers/isi55/Reston.pdf
Rumsey, D. J. (2002). Statistical literacy as a goal for introductory statistics courses. Journal of Statistics Education, 10(3). https://doi.org/10.1080/10691898.2002.11910678
Sabbag, A., Garfield, J., & Zieffler, A. (2018). Assessing statistical literacy and statistical reasoning. Statistics Education Research Journal, 17(2), 141-160. Retrived from http://iase-web.org/Publications.php?p=SERJ
Schield, M. (2017). GAISE 2016 promotes statistical literacy. Statistics Education Research Journal, 16(1), 50-54. Retrived from http://iase-web.org/Publications.php?p=SERJ
Stein, S. G. (2000). Equipped for the future content standards: What adults need to know and be able to do in the 21st century. National Institute for Literacy.
Tishkovskaya, S., & Lancaster, G. A. (2012). Statistical education in the 21st century: A review of challenges, teaching innovations and strategies for reform. Journal of Statistics Education, 20(2). https://doi.org/10.1080/10691898.2012.11889641
Wallman, K. K. (1993). Enhancing statistical literacy: enriching our society. Journal of the American Statistical Association, 88(421), 1-8. https://doi.org/10.1080/01621459.1993.10594283
Watson, J. M. (1997). Assessing statistical thinking using the media. In I. Gal & J. B. Garfield (Eds.), The assessment challenge in statistics education (pp. 107-122). Amsterdam, the Netherlands: IOS Press. Retrieved from https://iase-web.org/documents/book1/chapter09.pdf
Watson, J. M. (2006). Statistical literacy at school: Growth and goals. Mahwah, NJ: Lawrence Erlbaum.
Watson, J. M., & Callingham, R. (2003). Statistical literacy: A complex hierarchical construct. Statistics Education Research Journal, 2(2), 3-46. Retrived from http://iase-web.org/Publications.php?p=SERJ
Watson, J., & Callingham, R. (2004). Statistical literacy: From idiosyncratic to critical thinking. In G. Burrill & M. Camden (Eds.), Curricular development in statistics education: International Association for Statistical Education Roundtable (pp. 116-137). Lund: IASE.
Watson, J., Fitzallen, N., Fielding-Wells, J., & Madden, S. (2018). The practice of statistics. In D. Ben-Zvi, K. Makar, & J. Garfield (Eds.), International handbook of research in statistics education (pp. 105-137). Springer International Handbooks of Education. Cham: Springer. https://doi.org/10.1007/978-3-319-66195-7_4
Wessels, H. (2011). Statistics in the South African school curriculum. In C. Batanero, G. Burrill, & C. Reading (Eds.), Teaching statistics in school mathematics-Challenges for teaching and teacher education (pp. 21-25). New ICMI Study Series, vol 14. Dordrecht: Springer.
Whetstone, D. H. (2014). Investigating the discrepancies between student perceptions and faculty expectations of graduate-level statistics preparation (Unpublished master’s thesis). James Madison University, Virginia.
Wild, C. J., & Pfannkuch, M. (1999). Statistical thinking in empirical enquiry. International Statistical Review, 67(3), 223-265. https://doi.org/10.1111/j.1751-5823.1999.tb00442.x