evaluating the potential of the conservation reserve
TRANSCRIPT

Evaluating the Potential of the
Conservation Reserve Program to O
Impacts of Climate Change on the
Lesser Prairie
(Tympanuchus pallidicinctus
A Conservation Effects Assessment Project
Charlie Rewa, USDA Natural Resources Conservation Service
Skip Hyberg, USDA Farm Service Agency
1Playa Lakes Joint Venture
Evaluating the Potential of the
onservation Reserve Program to Offset Projected
Impacts of Climate Change on the
Lesser Prairie-Chicken
Tympanuchus pallidicinctus)
A Conservation Effects Assessment Project
Submitted to:
Rewa, USDA Natural Resources Conservation Service
Skip Hyberg, USDA Farm Service Agency
Submitted by:
Megan McLachlan, MSc1,
Anne Bartuszevige, Ph.D1,
and Duane Pool, Ph.D2
Playa Lakes Joint Venture, 2The Nature Conservancy
2575 Park Lane, Suite 110
Lafayette, CO 80026
March 31, 2011
ffset Projected


i
TABLE OF CONTENTS
INTRODUCTION .............................................................................................................. 1
Playa Lakes Joint Venture .............................................................................................. 1
The Nature Conservancy................................................................................................. 2
Lesser Prairie-Chicken (Tympanuchus pallidicinctus) ................................................... 3
Wildlife and climate change ........................................................................................... 4
Bioclimatic vegetation modeling .................................................................................... 5
Justification ..................................................................................................................... 6
Goals and objectives ....................................................................................................... 7
Acronyms ........................................................................................................................ 7
METHODS ......................................................................................................................... 8
Study area........................................................................................................................ 8
Data analysis ................................................................................................................... 9
Step 1: Model current and future habitat types and vegetative carbon levels ............ 9
Step 2: Estimate current LEPC carrying capacities .................................................. 11
Step 3: Determine potential future declines in LEPC carrying capacities ................ 15
Step 4: Assess ability of CRP to offset potential declines ........................................ 16
RESULTS ......................................................................................................................... 17
Projected temperature and precipitation changes ......................................................... 17
Projected vegetation change under future climate conditions ...................................... 20
Current LEPC carrying capacities ................................................................................ 25
Potential declines in LEPC carrying capacities ............................................................ 26
Ability of CRP of offset declines in LEPC carrying capacities .................................... 26
DISCUSSION ................................................................................................................... 29
Projected vegetation changes in the PLJV region......................................................... 29
Projected impacts of climate change on the LEPC ....................................................... 29
Can CRP offset impacts of climate change on the LEPC? ........................................... 30
Implications for other priority birds .............................................................................. 31
RECOMMENDATIONS .................................................................................................. 32
ASSUMPTIONS AND LIMITATIONS .......................................................................... 33
Climate and vegetation models ..................................................................................... 33
Population goals and carrying capacity estimates ........................................................ 34
Density data .................................................................................................................. 34
Trend data ..................................................................................................................... 35
Landcover data .............................................................................................................. 35
ACKNOWLEDGMENTS ................................................................................................ 36
SUGGESTED CITATION ............................................................................................... 36
LITERATURE CITED ..................................................................................................... 37
APPENDIX A – Hierarchical All Bird Systems (HABS) ................................................ 41
APPENDIX B – Priority Birds Species of the Shortgrass and Central Mixed-grass Prairie
Bird Conservation Regions (BCRs18 and 19) .................................................................. 44

ii
LIST OF TABLES
Table 1. Average biomass and carbon content for live and standing dead vegetation
collected in 1994, 1998, and 1999 in three grassland communities and grazing types
(Derner et al. 2006). The two shortgrass prairie study sites were located in northeast
Colorado, the mixed-grass site was located in central Kansas near Hays, and the tallgrass
site was located in eastern Kansas near Manhattan. ........................................................... 6
Table 2. List of acronyms used in this report and their definitions. ................................... 7
Table 3. Projected 2060 temperature and precipitation values and departure from current
temperature and precipitation in the PLJV region and in the current Lesser Prairie-
Chicken range. The temperature values are the monthly averages averaged over a year
(i.e. annual monthly average low/average/high temperature). .......................................... 17
Table 4. Estimated mean above-ground vegetation carbon levels (g C/m2) from the MC1
dynamic vegetation model (by time period and grassland community) compared to
above-ground vegetation carbon levels measured from field clippings from the 1990’s.
Field data are average carbon values for live and standing dead above-ground biomass
collected in two grassland communities and grazing types by Derner et al. 2006. The
shortgrass prairie study sites were located in northeast Colorado and northern Texas
panhandle and the mixed-grass site was located in central Kansas near Hays. Carbon
values from the MC1 model for the 2000 time period are approximately half of the
carbon values from field data. ........................................................................................... 21
Table 5. Projected change in above-ground carbon (as g C/m2
and percent loss/gain) from
2000 to 2060 in the PLJV region and in the current Lesser Prairie-Chicken range.
Statistics are based on pixel counts and values; pixel size is approximately 76km2 (18,780
acres). ................................................................................................................................ 21
Table 6. Amount and distribution of cropland and CRP in the study area (a 10-mile buffer
of the Lesser Prairie-Chicken current range) by BCR and state. CRP includes only
enrollments in grass-type Conservation Practices such as CP1, CP2, CP10, etc. See
Methods for an explanation of Large Blocks. ................................................................... 24
Table 7. Current Lesser Prairie-Chicken carrying capacities and population goals by BCR
and state, including the portion of carrying capacity and population goal attributed to
CRP. .................................................................................................................................. 25
Table 8. A range of potential declines in Lesser Prairie-Chicken (LEPC) carrying
capacity that could result from impacts of climate change, translated into the number of
birds that would no longer be supported by the landscape. For example, a 5% decline in
carrying capacity means the landscape can support 2,480 fewer LEPCs. ........................ 26
iii
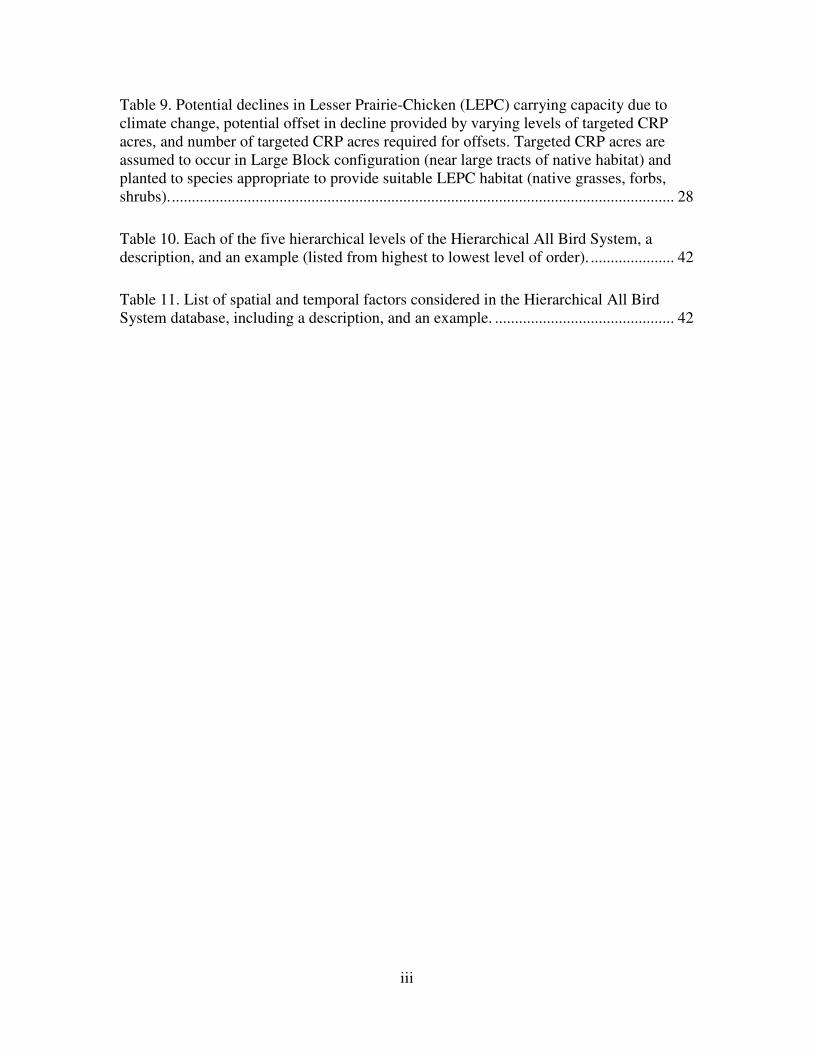
Table 9. Potential declines in Lesser Prairie-Chicken (LEPC) carrying capacity due to
climate change, potential offset in decline provided by varying levels of targeted CRP
acres, and number of targeted CRP acres required for offsets. Targeted CRP acres are
assumed to occur in Large Block configuration (near large tracts of native habitat) and
planted to species appropriate to provide suitable LEPC habitat (native grasses, forbs,
shrubs). .............................................................................................................................. 28
Table 10. Each of the five hierarchical levels of the Hierarchical All Bird System, a
description, and an example (listed from highest to lowest level of order). ..................... 42
Table 11. List of spatial and temporal factors considered in the Hierarchical All Bird
System database, including a description, and an example. ............................................. 42

iv
LIST OF FIGURES
Figure 1. The shortgrass prairie and central mixed-grass prairie Bird Conservation
Regions (BCRs 18 and 19) and the boundaries of the Playa Lakes Joint Venture and
Rainwater Basin Joint Venture. .......................................................................................... 1
Figure 2. Historical and current range of Lesser Prairie-Chicken. ..................................... 3
Figure 3. Seamless landcover for the shortgrass and central mixed-grass prairie Bird
Conservation Regions (BCRs 18 & 19, respectively). ..................................................... 13
Figure 4. Illustration of the process used to identify large-blocks of suitable Lesser
Prairie-Chicken habitat, BCR19 portion of Kansas: a) Lesser Prairie-Chicken range (dark
blue) and 10-mile buffer (light blue) and BCR19 boundary (red), b) buffered range within
BCR19 portion of Kansas only, c) landcover layer with 10-mile buffer on which large-
block model is applied, and d) large-block acres as identified by model. ........................ 14
Figure 5. Projected change in average annual temperature (degrees Celsius and
Fahrenheit) from 2000 to 2060 in the Playa Lakes Joint Venture region and current
Lesser Prairie-Chicken range. ........................................................................................... 18
Figure 6. Projected change in annual precipitation (mm) from 2000 to 2060 in the Playa
Lakes Joint Venture region and current Lesser Prairie-Chicken range. ........................... 19
Figure 7. Projected change in vegetative carbon (g C/m2) from 2000 to 2060 in the Playa
Lakes Joint Venture region and current Lesser Prairie-Chicken range. ........................... 22
Figure 8. Maps show the spatial distribution of estimated above-ground vegetation carbon
in 2000 versus 2060, based on the MC1 dynamic vegetation model. The chart shows the
percent area of the PLJV by estimated carbon levels for both years (fit is a 5th
order
polynomial trend line). ...................................................................................................... 23
Figure 9. Map produced by a Decision Support Tool showing the rank (Tier 1 = highest
priority (red), Tier 2 = medium priority (dark pink), Tier 3 = low priority (light pink)) of
crop fields near existing large blocks of suitable Lesser Prairie-Chicken habitat. ........... 32
Figure 10. An example of how fire frequency can impact results of the MC1 carbon
output (presented by Brendan Rogers at the 2011 MC1 User’s Conference). The graphic
shows the differences in ecosystem carbon levels (kg C/m2) output by the MC1 model
using three different fire scenarios (no fire, suppressed fire, and full fire) under three
climate change models. This analysis used the Hadley model. ........................................ 34

1
INTRODUCTION
In 2003, a multi-agency effort initiated the Conservation Effects Assessment Project
(CEAP) to quantify environmental benefits of U.S. Department of Agriculture (USDA)
conservation programs such as the Conservation Reserve Program (CRP), Wetlands
Reserve Program (WRP), and Environmental Quality Incentives Program (EQIP). This
project is part of the Wildlife Component of CEAP which was created to quantify effects
of conservation programs and practices on fish and wildlife in agricultural landscapes.
The Playa Lakes Joint Venture (PLJV), in collaboration with The Nature Conservancy
(TNC), designed this CEAP project to assess the ability of the CRP to offset potential
negative impacts of climate change on the Lesser Prairie-Chicken (LEPC; Tympanuchus
pallidicinctus), a bird species of high conservation concern. This project uses state-of-
the-art climate change and dynamic vegetation models to project climate-induced
changes in vegetation communities in the PLJV region over the next 60 years, estimate
potential impacts on the LEPC, and examine the ability of future CRP enrollment
scenarios to offset such impacts. This assessment follows two previous CEAP
assessments by the PLJV which examined the effects of CRP on priority birds in the
short- and central mixed-grass prairie (BCRs 18 & 19, respectively).
Playa Lakes Joint Venture
The PLJV is a non-profit partnership of
federal and state wildlife agencies,
conservation groups, private industry, and
landowners dedicated to conserving bird
habitat in the Southern Great Plains. We
provide science-based guidance and
decision-support tools for all-bird
conservation throughout the region, as
well as outreach, coordination and
financial support to our partners and local
groups to conduct on-the-ground habitat
work. The PLJV works in the Southern
Great Plains which includes eastern
Colorado and New Mexico, western
Nebraska, Kansas, and Oklahoma, and
the Texas Panhandle (Figure 1; about 160
million acres). The region largely
encompasses the shortgrass and central
mixed-grass prairie Bird Conservation
Regions (BCR18 and 19, respectively;
Figure 1). The PLJV also works
cooperatively with Rainwater Basin Joint
Venture (RWBJV) which spans the
northern portion of BCR19.
Figure 1. The shortgrass prairie and central mixed-grass
prairie Bird Conservation Regions (BCRs 18 and 19)
and the boundaries of the Playa Lakes Joint Venture
and Rainwater Basin Joint Venture.

2
The PLJV is uniquely qualified and equipped to conduct regional bird analyses such as
evaluating the effects of habitat change or conversion on bird population goals,
developing spatially explicit models that locate suitable/critical bird habitat, and spatially
targeting on-the-ground conservation efforts to maximize benefits to birds. The PLJV has
compiled resources, developed tools, and established working partnerships that serve to
further all-bird conservation in and around the JV. Chief examples are:
• Species for Management Action (SMA) database – This tool compiles and
stores conservation status information from multiple sources (including
federal, regional, and state-based sources such as U.S. Fish and Wildlife
Service (USFWS) and Partners in Flight (PIF)) for all species breeding,
wintering, or migrating in BCRs 18 and 19. This tool allows user to
identify/classify species according to conservation information.
• A Review of Distribution, Habitat Use, and Population Density Data for the
Hierarchical All Bird (HABS) Database (Dobbs 2007) – This document is an
exhaustive literature review (updated frequently) that serves as a one-stop
resource guide for demographic and ecological information on bird species
occurring in BCRs18 and 19. This document provides data for the
Hierarchical All Bird System (HABS) database, including bird density and
use-day data specific to geographic location, season of the year, habitat, and
its condition.
• Hierarchical All Bird System (HABS) database – HABS is a tool developed to
calculate a landscape’s capacity to achieve population objectives for priority
species, both currently (i.e., based on current habitat availability), and in the
future (i.e., based on alternative scenarios of future habitat availability based
on conservation and management work). HABS allows its user to determine
how much conservation work needs to be done for individual species as well
as predict the potential impacts of habitat change or conversion on bird
population goals.
The Nature Conservancy
The Nature Conservancy, founded in 1951 is the leading conservation organization
working around the world to protect ecologically important lands and waters for nature
and people. The Conservancy has protected more than 119 million acres of land and
5,000 miles of rivers worldwide and operates more than 100 marine conservation projects
globally. More than 1 million members working in all 50 states and more than 30
countries to protect habitats from grasslands to coral reefs makes the Conservancy an
integral partner in conservation planning and partnerships. The Conservancy is working
to address threats to conservation involving climate change, fire, fresh water, forests,
invasive species, and marine ecosystems. The Conservancy employs more than 700
scientists to help implement Conservation-By-Design, a science-based approach to
pursue non-confrontational, pragmatic solutions to conservation challenges.
Developing mechanisms to integrate conservation delivery with the best available science
has been the focus of the Conservancy’s planning process. The Conservancy supports
both a Migratory Bird Program and a Global Climate Change Initiative which has been
identified as one of the organization’s North American Priorities. This project pulls

3
together priorities within the Conservancy’s organizational structure and its expertise to
address the interactions of complex systems of biology and climatology and the impacts
to migratory birds. Climate change has the potential to impact all species of migratory
birds at one or several points in the life cycle. It is important that we study these birds so
that we can understand where they are most sensitive to risks in changing habitats and
migration timing. When we understand the risks to species, we can incorporate these
risks in to the conservation-by-design process and emphasize the resources needed to
enhance the resilience of affected species.
The Conservancy has state programs with responsibility and expert resources to help
preserve habitats that are vital to the LEPC. Planning for species under changing climate
conditions will allow Conservancy programs to target scarce resources to maximize
potential benefits to species under compounding uncertainties.
Lesser Prairie-Chicken (Tympanuchus pallidicinctus) The LEPC, a resident grouse species endemic to the Southern Great Plains, is a species of
high conservation concern. It is currently considered a Watch List Species according to
Partners in Flight, a species of Highest Continental Concern according to the American
Bird Conservancy, a State Threatened species in Colorado, and is currently a candidate
for listing under the federal Endangered Species Act. It is also petitioned in Kansas to be
listed as a state threatened species.
Lesser Prairie-Chickens were once found
abundantly throughout the short- and
central mixed-grass prairie regions in
Colorado, Kansas, New Mexico,
Oklahoma and Texas. Since European-
American settlement, their population
range has shrunk to 10% of its original
extent (Figure 2; currently about 16
million acres) and population numbers
have also declined by >90%. The decline
is due to habitat degradation,
fragmentation and loss due to agriculture
and energy development.
Lesser Prairie-Chickens currently are
patchily distributed in southern portions
of BCRs 18 and 19 in Colorado, Kansas,
Oklahoma, New Mexico, and Texas
(Figure 2). They are most abundant in the
southwestern portion of Kansas (Price et
al. 1995). Habitat use varies across their
range, but generally consists of dwarf
shrub-mixed grass vegetation types
associated with sandy soils, which may be
Figure 2. Historical and current range of Lesser Prairie-
Chicken and the Playa Lakes Joint Venture boundary.
4
interspersed with shortgrass or mixed- grass prairie (Taylor and Guthery 1980; see Hagan
2005). Habitat is comprised primarily of sandsage prairie in Kansas (Andrews and
Righter 1992, Giesen 1994, Busby and Zimmerman 2001) and Colorado, and primarily
shinnery oak prairie in Oklahoma, Texas (Riley et al. 1992, Jackson and DeArment 1963;
see Hagan 2005) and New Mexico.
This species also uses CRP in some areas (Davis et al. 2008) as well as cropland
(Crawford and Bolen 1976). Field studies conducted in the Colorado and Kansas portions
of the LEPC range have documented LEPCs leking, nesting, and roosting in grassland
provided by the CRP (Fields 2004, Davis et al. 2008). In Colorado, leks were found in
CRP fields with stunted ‘sod-like’ grass cover, providing the sparse and low-stature
vegetation associated with leks (Davis et al. 2008). In Kansas, LEPC nests were found
predominately in CRP with mid to tall native warm season grasses (Field 2004).
Biologists think that native CRP located within 2-miles of native grassland has the most
potential to serve as suitable nesting habitat (Davis et al. 2008). Conversely, in the Texas,
New Mexico, and Oklahoma portions of the LEPC range, it appears that CRP may not be
providing suitable LEPC habitat. In these states, CRP fields are predominately
characterized by weeping lovegrass (Eragrostis curvula) and non-native bluestem species
(Bothriochloa spp).
Wildlife and climate change
Systems within the Southern Great Plains have evolved to cope with a dynamic climate
of drought and wet periods, as have the grassland birds of the region including the LEPC.
Key factors influencing abundance, distribution, and vital rates of grassland bird species
are changes in food resources (insects, seeds), patch size, and vegetative structure (height
of herbaceous layer, presence, height and structure of shrubs or trees) (Rotenberry and
Wiens 1980, Kantrud and Kologiski 1982, Peterjohn 2003, Chapman et al. 2004). These
factors in turn are influenced by weather and disturbance events such as wildfire.
Population trends and distribution of individual species have been linked to moisture and
temperature conditions (Kantrud and Kologiski 1982, Niemuth et al. 2008).
Incorporating predicted climate change into bird and habitat conservation planning is
vital for long-term success. In 2008, the PLJV commissioned a climate change specialist
at the World Wildlife Fund to synthesize information on both past and predicted climate
shifts in the PLJV region (Matthews 2008). According to the report, the PLJV region has
been experiencing regional anthropogenic-driven climate shifts over at least the last 30
years, with drier summers, wetter springs in the north, drier springs in the south, and
more frequent extreme weather events throughout, including both floods and extended
drought (Matthews 2008). These trends are predicted to continue into the future with the
largest decreases in precipitation in the south and southwest portions of the PLJV region
and greatest increases in precipitation in the northeast portion (IPCC 2007 in Matthews
2008).
However, there is limited research indicating how individual bird species may respond to
these predicted climate shifts. Only one study has examined potential responses of Great
Plains species to climate change (Peterson 2003), predicting that species will respond
5
differently but generally will expand north. We suggest that near-term (60 years) changes
in climate or disturbance events will likely reduce the ability of habitats to provide
resources necessary to sustain bird populations, or result in outright loss of certain
habitats. For example, shifts from diverse herbaceous landscapes to invasive or C3-
dominated landscapes will likely reduce brood survival; such an outcome has been
projected for Greater Sage-Grouse (Centrocercus urophasianus) (Montana Sage-grouse
Working Group 2004). Moreover, insectivores may face phenological mismatch between
their breeding phenology and that of their prey because of insect vulnerability to changes
in thermal regimes (Parmesan 2006).
These issues are important because direct loss of habitat, interim loss of habitat or habitat
quality, or extreme climatic events may lead to the extirpation of birds and, possibly,
other taxa. Species currently exhibiting population declines or receding occupied ranges,
such as the LEPC, may be most vulnerable. However, not all species will be negatively
affected by such changes. As shifts in habitat conditions occur, the new habitat will favor
some species over the previous residents. Quantifying the direct effects of climate change
on habitat and species therefore must include models predicting changes in the
underlying factors of vegetation type and structure.
Bioclimatic vegetation modeling
Climate change modeling can predict changes in vegetation that may impact wildlife,
such as the LEPC, by predicting changes in levels of above-ground carbon (C), the
primary component of plant material. Higher measures of above-ground carbon (or
vegetation carbon) imply higher amounts of above-ground biomass (i.e., denser/taller
vegetation and litter build-up). For example, Derner et al. (2006) measured mean above-
ground carbon levels for three prairie communities by analyzing above-ground live and
standing dead biomass (leaf and stem tissue) in both grazed and ungrazed areas (Table 1).
As seen in Table 1, carbon content of above-ground vegetation increased as biomass
increased from shortgrass to tallgrass communities and mean carbon content accounted
for approximately 40% of the total biomass in each grassland community (Table 1).
The MC1 dynamic vegetation model (Bachelet et al. 2001a) projects the amount of
above-ground carbon in a plant community given a certain set of processes (e.g.,
disturbance, such as fire; variation in precipitation; temperature extremes). By changing
the magnitude of a process (e.g., more frequent fire events; more extreme precipitation
events), differences in above-ground carbon values can be projected. These changes in
above-ground carbon values are related to changes in plant community structure (e.g.,
community dominated by grasses or shrubs) and productivity (e.g., height of grass).
Changes in plant community or productivity can have beneficial or detrimental impacts
for bird species that have historically used the area for breeding, brood rearing, migrating
and wintering habitat.

6
Table 1. Mean biomass and carbon content for live and standing dead vegetation collected in 1994, 1998,
and 1999 in three grassland communities and two grazing level (Derner et al. 2006). The shortgrass prairie
study sites were located in northeast Colorado, the mixed-grass site was located in central Kansas near
Hays, and the tallgrass site was located in eastern Kansas near Manhattan.
Grassland
Community Grazing Level
Mean
Above-ground
Biomass
(g/m2)1
Mean
Carbon Content in
Above-ground
Biomass
(g C/m2)2
Shortgrass Grazed 90 35
Ungrazed 118 49
Mixed-grass Grazed 121 50
Ungrazed 208 89
Tallgrass Grazed 113 264
Ungrazed 190 441 1 Biomass was measured for herbaceous species collected in July 1994.
2 Carbon content of the biomass was determined by multiplying biomass by C concentrations levels that
were determined through evaluation of plant samples collected in July 1998 in shortgrass and tallgrass sites
and in September 1999 in mixed-grass sites.
Justification
There is mounting concern among a variety of stakeholders regarding the continued
decline of the LEPC, including the potential implications of listing the LEPC as a federal
threatened or endangered species. In addition to traditional threats to its long-term
survival, climate change appears to be yet another source of habitat degradation via
potential changes in vegetation structure and composition. Stakeholders are looking for
ways to conserve the LEPC in its agricultural-dominated landscape.
Two previous CEAP assessments, conducted by the PLJV, indicated that the CRP is
functioning as a LEPC conservation tool in two ways: (1) by providing suitable grassland
habitat, when CRP fields are planted to ecologically appropriate native species, and (2)
by forming large blocks of suitable habitat out of otherwise fragmented patches of
habitat. According to the spatial habitat analysis, land enrolled in the CRP has increased
the carrying capacity of the landscape for the LEPC by as much as 30% in the shortgrass
portion of its current range (BCR18; McLachlan and Carter 2009) and by nearly 10% in
the central mixed-grass region of its range (BCR19; McLachlan and Rustay 2007),
illustrating the high value of the CRP as an effective conservation tool for the LEPC.
However, these previous analyses were based on assessing the current landscape without
regard for potential vegetation changes due to climate change. In the Southern Great
Plains, climate change scenarios predict that average temperatures will increase while
precipitation will decrease in the southern portions of the range and increase in the
northern portions. Changes in temperature and precipitation regimes are predicted to
affect vegetation composition. Changes in vegetation could have significant effects on

7
grassland birds, including the LEPC, which may have to immigrate to new areas with
suitable habitat in order to survive.
Goals and objectives
The goal of this CEAP project was to assess the potential for the CRP to offset some of
the projected impacts of climate-induced vegetation change with regard to LEPC
conservation. We had three objectives for this project. Our first objective was to predict
changes in vegetation in BCRs 18 and 19 (including the LEPC current range) over the
next 60 years based on near term projections from climate modeling. Our second
objective was to estimate and compare the LEPC carrying capacity of the current
landscape and predicted future landscape, based on those projected changes. The final
objective was to gauge the potential of CRP to offset these predicted changes,
considering a range of future CRP enrollment scenarios.
Acronyms
This report uses acronyms listed and defined in table 2.
Table 2. List of acronyms used in this report and their definitions.
Acronym Definition
AOGCM Atmosphere-Ocean General Circulation Model
AR4 4th
Assessment Report from the IPCC
BCR Bird Conservation Region
BCR18 Shortgrass Prairie Bird Conservation Region
BCR19 Central Mixed-grass Prairie Bird Conservation Region
FSA Farm Service Agency
IPCC Intergovernmental Panel on Climate Change
LEPC Lesser Prairie-Chicken
MC1 Dynamic Vegetation Model
NRCS Natural Resources Conservation Service
PLJV Playa Lakes Joint Venture
USDA United States Department of Agriculture
WCRP World Climate Research Programme
8
METHODS
Study area
We conducted climate change and dynamic vegetation modeling throughout the PLJV
region including the current LEPC range and spanning most of BCRs 18 and 19 (Figure
1). The PLJV region includes portions of six states including Nebraska, Colorado,
Kansas, Oklahoma, New Mexico, and Texas.
For analyses specific to the LEPC (such as estimating carrying capacities) the study area
was defined by a 10-mile buffer of the current LEPC range. The current range is located
in the southern regions of the shortgrass and central mixed-grass prairie BCRs (BCR18
and BCR19), spanning approximately 37.9 million acres across portions of Colorado,
Kansas, Oklahoma, New Mexico, and Texas (Figure 2). We included a 10-mile buffer of
the LEPC range in the study for two reasons. First, the spatial modeling used to identify
suitable LEPC habitat (i.e., Large Blocks as explained below) requires a minimum
window of analysis to adequately measure habitat configuration, approximately a 10-mile
radius from any given point on the landscape. Second, the LEPC current range boundary
was delineated free-hand by members of the Lesser Prairie-Chicken Interstate Working
Group and there is assumed error in the boundary, possibly excluding occupied habitat.
BCR18 is located in the western portion of the Southern Great Plains of North America,
encompassing portions of seven states including Nebraska, Wyoming, Colorado, Kansas,
Oklahoma, New Mexico, and Texas (Figure 1). BCR18 spans over 95 million acres of
gently sloping terrain comprised of a variety of habitats, both naturally occurring (e.g.,
prairie, wetlands, streams) and man-made (e.g., cropland, urban areas, reservoirs). The
shortgrass prairie is dominated by blue grama (Bouteloua gracilis) and buffalo grass
(Buchloe dactyloides) interspersed with small amounts of tallgrass species in the east
(e.g., little bluestem (Schizachyrium scoparium), Indian grass (Sorghastrum nutans)).
Common shrub species occurring in BCR18 are sand sagebrush (Artemisia filifolia) and
sand shinnery oak (Quercus havardii rydb.). Woodland habitat ranges from scattered
cottonwood trees (Populus spp.), small clustered plantings of Siberian elm (Ulmus
pumila) and Russian olive (Elaeagnus angustifolia), to large expanses of honey mesquite
(Prosopis glandulosa) and eastern red-cedar (Juniperus virginiana). Historically
dominated by grassland and shrubland habitat, BCR18 now has as much cropland
(comprising about 43% of its total landcover) as it does native grassland and shrubland
combined. Major crop types are wheat, sorghum, corn (primarily in the north), soybeans,
sunflowers, and alfalfa. Over 6 million acres of cropland in BCR18 (about 15%) are
currently enrolled in the CRP.
BCR19 is located in the eastern portion of the Southern Great Plains of North America,
encompassing portions of four states including Kansas, Nebraska, Oklahoma, and Texas
(Figure 1). BCR19 spans over 97 million acres of gently sloping terrain comprised of a
variety of habitats, both naturally occurring (e.g., prairie, wetlands, streams) and man-
made (e.g., cropland, urban areas, reservoirs). Mixed-grass prairie vegetation is an
integration of the shortgrass species to the west (e.g., blue grama (Bouteloua gracilis),
buffalo grass (Buchloe dactyloides)) and the tallgrass species to the east (e.g., little
9
bluestem (Schizachyrium scoparium, Indian grass (Sorghastrum nutans)). Common shrub
species occurring in BRC19 are sand sagebrush (Artemisia filifolia) and sand shinnery
oak (Quercus havardii rydb.) Woodland habitat ranges from scattered cottonwood trees
(Populus spp.), to small clustered plantings of Siberian elm (Ulmus pumila), Russian
olive (Elaeagnus angustifolia), and eastern red-cedar (Juniperus virginiana), to large
expanses of honey mesquite (Prosopis glandulosa), juniper (Juniperus spp.), and eastern
red-cedar. Historically dominated by mixed-grass prairie, BCR19 is now dominated by
cropland (comprising nearly 54% of its total landcover). Major crops are corn (primarily
in the north), soybeans, wheat, sorghum, sunflowers, and alfalfa. Approximately 2.8
million acres of the cropland in BCR19 (about 8%) is currently enrolled in CRP.
Data analysis
Data analysis consisted of four major steps: 1) use climate and dynamic vegetation
modeling to project historical and future habitat types and above-ground vegetation
carbon levels, 2) estimate the LEPC carrying capacities of the current landscape based on
spatial landcover data, 3) determine potential changes in LEPC carrying capacity due to
predicted climate-induced vegetation changes, and 4) assess the potential of CRP to
offset LEPC carrying capacity declines based on a range of possible future CRP
enrollment scenarios. Each of these main steps is described below.
Step 1: Model historical and future habitat types and vegetative carbon levels
We modeled historic and future vegetation conditions in the PLJV region and the current
LEPC range based on estimated above-ground carbon levels. The historical baseline year
was considered 2000 (based on a range of data from 1989-2009) and the future was
considered the year 2060 (based on data from 2050 – 2070). Historical and future above-
ground carbon levels were estimated via climate change modeling based on the
Atmosphere-Ocean General Circulation Models (AOGCM) and dynamic vegetation
modeling using the MC1 model (Bachelet et al. 2001a), as described below.
Climate change model: We obtained Atmosphere-Ocean General Circulation
Models (AOGCM) projections of historical and future climate from the World
Climate Research Programme (WCRP). The output from these models are results
of experiments conducted by international climate modeling groups who
participated in the third phase of the Climate Model Intercomparison Project
(Meehl et al. 2007) and used in the 4th
Assessment Report (AR4) on climate
change by the Intergovernmental Panel on Climate Change (IPCC). We evaluated
the AOGCMs by comparing how well each model is able to represent the natural
climate variability for the late 20th
century (1950–2000) across the study area. The
historical runs from each AOGCM were evaluated and it was determined that the
Hadley Model simulated the major influences to the Southern Great Plains better
than the available alternatives (Pers. Comm. Ron Neilson - Oregon State
University/ USDA Forest Service). Projections of future precipitation trends from
AOGCMs are variable and model-dependent. To address the problem, we
evaluated (Räisänen and Palmer 2001, Räisänen and Ruokolainen 2006) habitat
change using a range of outputs, the ten years previous and post evaluation date
(2050 – 2070), then applied a majority filter.

10
For direct climate comparisons, we used the minimum, mean and maximum
temperature and precipitation values from the downscaled General Circulation
Model (GCM) (downloaded from The Nature Conservancy’s Climate Analysis
Tool, climatewizard.org). The downscaling was performed by the US Forest
Service, Forestry Sciences Laboratory, Corvallis, Oregon whose contributing
members include Ron Neilson, Jim Lenihan, Ray Drapek, Dominique Bachelet,
and Chris Daley. The data were processed in a manner to retain the relatively fine
grid patterns consistent with those observable in historical datasets. Difference
anomalies were used for temperature data and ratio anomalies were used for
precipitation. Anomalies were calculated relative to the monthly average value for
the years 1961 to 1990 (for example: January values were compared with the
average historical January value). Anomalies were calculated using modeled data
for both historical and for future climate values. In this way the anomalies showed
how the climate changed for the model relative to its own climatology.
The anomalies were then interpolated to a 1/2 degree spatial resolution. The
interpolated anomalies were then either multiplied with or added to the mean
ground-measured historical climate. The mean historical climate is a 12 month
average climate for the years 1961-1990 (average January value + average
February value +…/12), this range includes an entire short term climate cycle of
drought and flood. Anomalies were applied to the appropriate month, such that a
January anomaly was applied to the mean historical January, etc. We proposed to
use an ensemble of emission scenarios under high (A2), mid-range (A1B), and
lower (B1) CO2 emission pathways (Nakićenović and Swart 2000) from the IPCC
Special Report. Current reports indicate the earth’s emissions trajectory is more
consistent with the A2 scenario. All comparisons and modeled data were therefore
derived using the higher A2 scenario rather than assuming an international treaty
will be reached to mitigate carbon to the lower A1B or B1 emissions pathway
scenarios.
Dynamic vegetation model (MC1): MC1 is a dynamic vegetation model that
simulates vegetation types (e.g., temperature grassland, shrubland, broadleaf
forest) and ecosystem processes. MC1 is routinely implemented (Bachelet et al.
2000, Daly et al. 2000, Bachelet et al. 2001b) on spatial data grids of varying
resolution (i.e., grid cell sizes ranging from 900 m2 to 2500 km
2); the cell size
used for this analysis was 76km2 (18,870 acres per pixels). The model reads
climate data at a monthly time step and calls interacting modules that simulate
biogeography, biogeochemistry, and fire disturbance. The biomass component of
the model allows derivation of an index of homogeneity of cover and an index of
vertical structure. Its fire model includes allometric relations used to estimate the
amount of fine versus coarse fuels that can be used to describe vegetation’s
vertical structure. The model also simulates the growth of shrubs (small trees) that
compete with grasses for water and nutrients but can be killed by fire.

11
Running the MC1 model under historic and future climate scenarios can provide a
comparison of habitat types and conditions via estimated changes in above-
ground vegetation carbon levels (Räisänen and Palmer 2001, Räisänen and
Ruokolainen 2006). For this study, Neilson et al. (unpublished) supplied the MC1
model output for both historical and future climate conditions, using the A2
emission scenario. They documented changes in: 1) carbon pools associated with
vegetation, allowing quantification of the impacts of woody invasion of
grasslands, 2) wildfire occurrence and impacts that will estimate carbon losses
and gains and the changes in the recovery potential of habitat characteristics
if/when the fire regime changes, and 3) vegetation types that can affect habitat
suitability for wildlife and other ecosystem services such as carbon sequestration
and water availability. For this analysis, we focused on the estimated changes in
habitat type and above-ground carbon levels to approximate changes in the
amount and quality of habitat available to the LEPC over the next 60 years.
Estimated change in habitat type (as determined by crossing critical ecological
thresholds) was calculated by counting the number of years in which an event
occurred out of 21 years. The most frequently occurring habitat value was used
for the future habitat. For purposes of comparison through time, we selected 21-
year periods (1989-2009 and 2050–2070) from the model run. We then
determined the number of periods of each outcome within each period when the
future runs differ from the historic habitat values.
Estimated above-ground vegetation carbon levels were calculated as the mean
carbon value over each time period (1989-2009 and 2050–2070). To validate the
model output, we compared the MC1 vegetation carbon estimates for the year
2000 to field measures of carbon content in above-ground biomass collected in
shortgrass and mixed-grass prairie sites in the mid and late 1990’s (See Table 1;
Derner et al. 2006).
Step 2: Estimate current LEPC carrying capacities
The second step was to estimate the current LEPC carrying capacity (i.e., the ability of
the habitats within the study area to support LEPCs expressed in number of birds). To
estimate the current carrying capacity we used the PLJV spatial landcover layer in
concert with the PLJV HABS database (a brief description of HABS is provided in the
Introduction and a detailed description is provided in Appendix A). The spatial landcover
data provided distribution data for major vegetation communities (e.g., mixed-grass
prairie) in the study area. Spatial modeling was applied to the landcover to identify Large
Blocks of habitat suitable for the LEPC. The HABS database was used to: 1) track the
amount and distribution of habitats in the landcover (including Large Blocks), 2) store
LEPC densities associated with each of those habitats, and 3) estimate LEPC carrying
capacities for each BCR-state area within the LEPC range. Carrying capacity estimates
were calculated separately for each state portion of each BCR because bird-to-habitat
densities as well as bird population goals are most appropriately related at this spatial
scale. For example, the Kansas portion of BCR 18 and the Kansas portion of BCR19 are
analyzed individually. Below we describe the landcover layer, the spatial modeling used

12
to identify Large Blocks of habitat, and how LEPC carrying capacity estimates are
calculated in HABS.
Landcover (vegetation communities): The spatial landcover data used in our analysis
is a seamless landcover layer, developed by the PLJV, which spans nearly all of
BCRs 18 and 19 (Figure 3). The seamless landcover is classified into a system of
habitat Associations and Conditions that are used to determine the amount and types
of habitat available to birds. Associations are major vegetation communities generally
considered to be mappable at a landscape scale (e.g., shortgrass prairie). Conditions
are recognized as having distinctive characteristics important to birds but are not
always mappable with current GIS data (e.g., few shrubs/high grass).
The PLJV landcover incorporates the FSA’s Common Land Unit (CLU) layer which
delineates CRP and crop fields (current as of October 2009). Because of the
numerous Conservation Practices (CPs), we partitioned CRP into one Association
with six Conditions according to CP: grass, trees in upland, trees in riparian, wetland,
playas/non-floodplain wetland, and other CRP practice. Although there are CPs
distinguishing between native grass plantings (CP2) and a CP designating non-native
grass plantings (CP1), these were not used in the Condition classes because there is
uncertainty regarding the definition of a native planting. Through interviewing CRP
professionals and researchers, we determined that native plantings (CP2) did not
necessarily indicate species native to the area but rather to North America. For
example, shortgrass or tallgrass species planted in the shortgrass prairie may be
considered a CP2 but they are not truly native to the area. In addition, there is also a
practice designating existing/established grass (CP10) which does not indicate native
or non-native planting, creating more uncertainty. So we applied assumed proportions
of native to non-native plantings specific to each state in the PLJV based on opinions
of CRP professionals and researchers. In Kansas, we assumed all CRP grass plantings
were native. In Colorado, New Mexico, Oklahoma, and Texas we assumed 10% were
native and 90% non-native. We also updated the landcover layer with the crop field
boundaries delineated in the CLU layer as it was the most current data available.
Detailed information on the landcover layer including its development and list of
Associations and Conditions are documented in “Habitat Assessment Procedures
Technical Companion Document to the PLJV Implementation Planning Guide”
(Playa Lakes Joint Venture 2007). Details regarding the development, uses, and
limitations of the PLJV landcover layer are available in Habitat assessment
procedures: Technical companion document to the PLJV Implementation Planning
Guide (Playa Lakes Joint Venture 2007).

13
Figure 3. Seamless landcover for the shortgrass and central mixed-grass prairie Bird Conservation Regions
(BCRs 18 & 19, respectively).
14
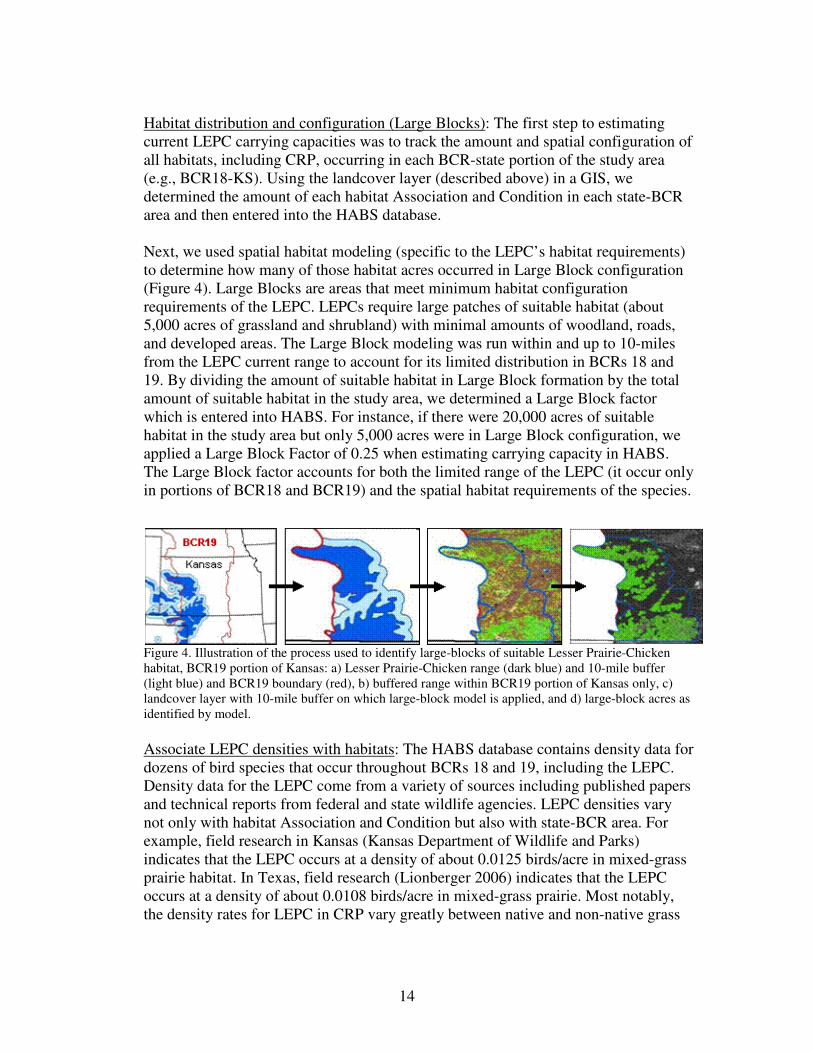
Habitat distribution and configuration (Large Blocks): The first step to estimating
current LEPC carrying capacities was to track the amount and spatial configuration of
all habitats, including CRP, occurring in each BCR-state portion of the study area
(e.g., BCR18-KS). Using the landcover layer (described above) in a GIS, we
determined the amount of each habitat Association and Condition in each state-BCR
area and then entered into the HABS database.
Next, we used spatial habitat modeling (specific to the LEPC’s habitat requirements)
to determine how many of those habitat acres occurred in Large Block configuration
(Figure 4). Large Blocks are areas that meet minimum habitat configuration
requirements of the LEPC. LEPCs require large patches of suitable habitat (about
5,000 acres of grassland and shrubland) with minimal amounts of woodland, roads,
and developed areas. The Large Block modeling was run within and up to 10-miles
from the LEPC current range to account for its limited distribution in BCRs 18 and
19. By dividing the amount of suitable habitat in Large Block formation by the total
amount of suitable habitat in the study area, we determined a Large Block factor
which is entered into HABS. For instance, if there were 20,000 acres of suitable
habitat in the study area but only 5,000 acres were in Large Block configuration, we
applied a Large Block Factor of 0.25 when estimating carrying capacity in HABS.
The Large Block factor accounts for both the limited range of the LEPC (it occur only
in portions of BCR18 and BCR19) and the spatial habitat requirements of the species.
Figure 4. Illustration of the process used to identify large-blocks of suitable Lesser Prairie-Chicken
habitat, BCR19 portion of Kansas: a) Lesser Prairie-Chicken range (dark blue) and 10-mile buffer
(light blue) and BCR19 boundary (red), b) buffered range within BCR19 portion of Kansas only, c)
landcover layer with 10-mile buffer on which large-block model is applied, and d) large-block acres as
identified by model.
Associate LEPC densities with habitats: The HABS database contains density data for
dozens of bird species that occur throughout BCRs 18 and 19, including the LEPC.
Density data for the LEPC come from a variety of sources including published papers
and technical reports from federal and state wildlife agencies. LEPC densities vary
not only with habitat Association and Condition but also with state-BCR area. For
example, field research in Kansas (Kansas Department of Wildlife and Parks)
indicates that the LEPC occurs at a density of about 0.0125 birds/acre in mixed-grass
prairie habitat. In Texas, field research (Lionberger 2006) indicates that the LEPC
occurs at a density of about 0.0108 birds/acre in mixed-grass prairie. Most notably,
the density rates for LEPC in CRP vary greatly between native and non-native grass

15
plantings. According to professional opinions of local LEPC biologists, LEPCs occur
in non-native CRP at 25% of the density at which they occur in native CRP.
Estimate LEPC carrying capacity for BCR-state areas: In HABS, the carrying
capacity for a species is calculated for each habitat Association and Condition within
a state-BCR area. For example, a carrying capacity is determined for shortgrass
prairie with low grass and few shrubs in the Colorado portion of BCR 18. The
calculation is determined by multiplying the number of habitat acres by the habitat-
specific bird density and then by any appropriate factors (Large Block, Range,
Suitability; see Appendix A for descriptions) as follow:
Carrying Capacity = Habitat Acres * Bird Density * Large Block Factor * Range
Factor * Suitability Factor
In this analysis, the carrying capacities for the LEPC were calculated by multiplying
habitat acres by LEPC densities and Large Block factors. LEPC densities vary by
habitat Association and Condition as well as by state-BCR area. Large Block factors,
also specific to each state-BCR area, account for the limited range of the LEPC
because the spatial model used to delineate Large Blocks was only run within and 10-
miles from the current range of the LEPC; therefore; a Range factor was not applied.
A Suitability factor was not necessary (see Appendix A for an explanation of
Suitability factor).
Next, the habitat-based carrying capacities were summed within each state-BCR area
to provide a regional estimate of LEPC carrying capacity. By estimating carrying
capacity at the state-BCR level they can then be compared to BCR-based population
goals for individual bird species (see Appendix A for an explanation on determining
species’ population goals). This puts the carrying capacity in context of a
conservation goal allowing a biologist to gauge how much conservation effort is
needed and where.
Step 3: Determine potential future declines in LEPC carrying capacities
Declines in LEPC carrying capacity due to climate-induced vegetation changes could not
be calculated using the HABS database as was intended at the onset of this project. The
reason is due to an inability to relate changes in LEPC densities with projected changes in
vegetation productivity. Published LEPC densities are related to broad vegetation
communities, such as mixed-grass prairie or sandsage shrubland. Conversely, our
projected climate-induced vegetation changes largely indicate changes within vegetation
communities, such as mixed-grass prairie transitioning from high to low productivity
(i.e., changes in vegetation structure from decreased productivity) – not transitioning
from mixed-grass prairie to shortgrass prairie.
Based on the results of our climate change and dynamic vegetation modeling, we predict
a decline in LEPC carrying capacity will occur over the next 60 years; however, we
cannot quantify the decline. To adjust our analysis for this limitation, we instead
calculated the amount of LEPC carrying capacity that could be provided by targeting

16
CRP acres, in varying amounts, specifically for LEPC conservation (see Step 4). These
future carrying capacities were considered offsets of potential decline caused by climate
change.
Step 4: Assess ability of CRP to offset potential declines
The final step was to assess the ability of CRP to offset the potential declines in LEPC
carrying capacity. To do this we examined a range of future CRP enrollment scenarios
assuming that some portion of future CRP enrollments would be ‘targeted’ for LEPC
conservation – meaning the CRP fields would occur in Large Block configuration (near
large patches of native habitat) and plantings would be appropriate for the LEPC (a mix
of native grasses, forbs, and possibly shrubs). This analysis assumes that the CRP would
still exist in 2060.
To gauge how much CRP could feasibly be targeted for the LEPC, we used the current
CRP enrollment rates (the portion of cropland currently enrolled in the CRP), assuming
that current CRP enrollment rates would reflect future enrollment rates. For each BCR-
state area, we calculated the CRP enrollment rate within the LEPC range portion of that
BCR-state area. Hereafter, we refer to these CRP acres as ‘local CRP’.
We determined that targeting 75% of local CRP acres would safely represent the
uppermost limit of how much CRP can feasibly be placed in Large Block configuration
considering both the limits of placing CRP near native habitat (there are only so many
opportunities in the landscape) and the problem with concentrating CRP to the exclusion
of active cropland. The true limit is likely closer to 50%, based on results CRP
enrollment data from Kansas (see Results).
We then used the HABS database (which contains BCR-state specific LEPC density data
for CRP planted to native species) to calculate how much LEPC carrying capacity could
be provided by targeting 10%, 20%, 30%, 40%, 50%, and 75% of local CRP acres. These
future carrying capacities were considered offsets of potential declines caused by climate
change. We did not calculate the carrying capacity for targeting <10% of local CRP acres
because all BCR-state areas had at least 1% of their CRP incidentally targeted for LEPC,
with most having >5% incidentally targeted; thus, the analysis would show little to no
change in carrying capacity. Additionally, if a BCR-state area (e.g., BCR19-KS)
currently exceeds the percent of targeted CRP (10%, 20%....75%), it was not reduced but
maintained. For example, Kansas currently has >50% of its local CRP, in both BCRs,
incidentally targeted for LEPC. This is a result of planting native species in CRP, unlike
the other states, and incidentally enrolling acres near large tracts of native habitat. When
we examined the effects of targeting 10% of local CRP acres for LEPC, we did not
reduce Kansas’s targeted CRP but maintained it at current levels.

17
RESULTS
Projected temperature and precipitation changes
Annual average temperatures are predicted to increase in the PLJV region and within the
current LEPC range (Table 3). Temperatures in the PLJV region will increase
approximately 2.6 – 3.1 degrees Celsius above the historical (year 2000) average
temperatures (Table 3). The maximum temperature increase will occur in the largest
portion of the LEPC range in Colorado, Kansas, Oklahoma and the northeast Panhandle
of Texas (Figure 5). This area of the LEPC range also includes the largest number of
chickens.
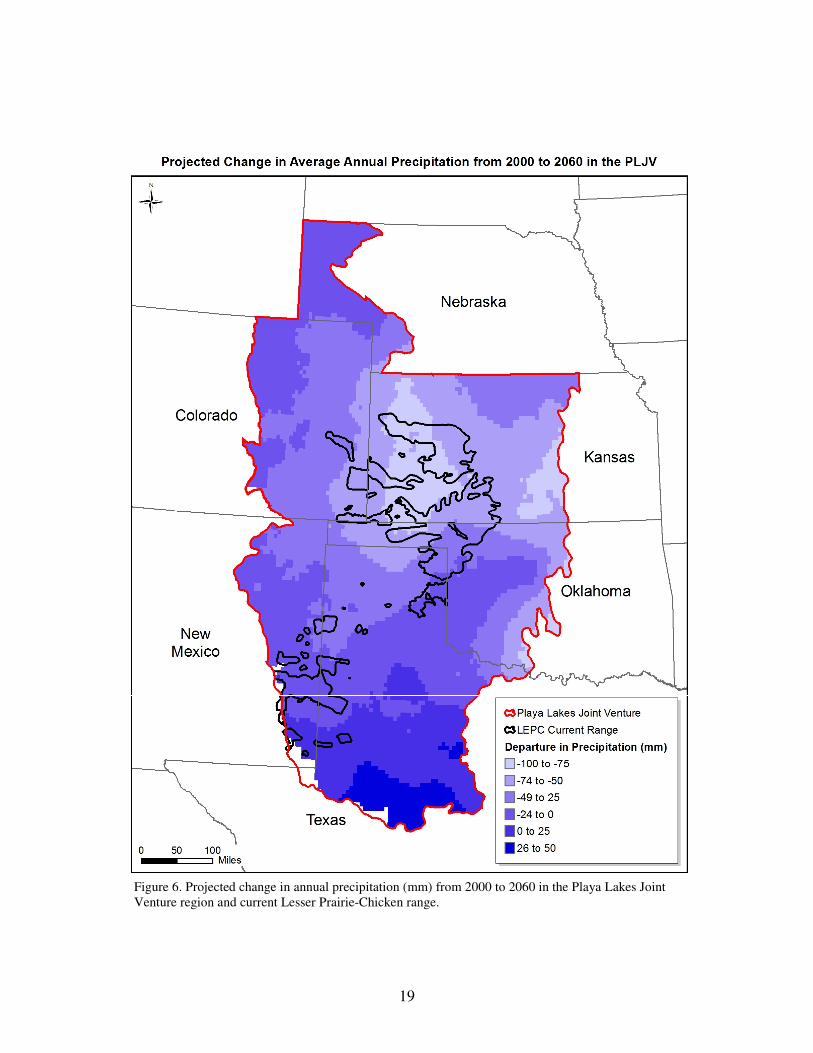
Precipitation is predicted to decrease in the PLJV region and within the current LEPC
range (Table 3). Precipitation in the PLJV region will decrease by approximately 32
mm/yr (Table 3) compared to historical (year 2000) precipitation amounts. The maximum
precipitation decrease also will occur in the largest portion of the LEPC range in
Colorado, Kansas, Oklahoma, and the northeast Panhandle of Texas (Figure 6).
Table 3. Projected 2060 temperature and precipitation values and departure from historical (year 2000)
temperature and precipitation in the PLJV region and in the current Lesser Prairie-Chicken range. The
temperature values are the monthly averages averaged over a year (i.e. annual monthly average
low/average/high temperature).
PLJV Region LEPC Range
2060
Average
Departure
from
historical
2060
Average
Departure
from
historical
Temperature (°C)
Low 7.6 2.6 7.7 2.8
Average 15.8 2.9 16.0 3.2
High 23.8 3.1 24.2 3.5
Precipitation
(mm/yr)
492.4 -32.2 468.3 -49.8

18
Figure 5. Projected change in average annual temperature (degrees Celsius and Fahrenheit) from 2000 to
2060 in the Playa Lakes Joint Venture region and current Lesser Prairie-Chicken range.
19
Figure 6. Projected change in annual precipitation (mm) from 2000 to 2060 in the Playa Lakes Joint
Venture region and current Lesser Prairie-Chicken range.

20
Projected vegetation change under future climate conditions
The MC1 model was used to simulate both vegetation type (herbaceous versus woody
plants) and above-ground vegetation carbon stocks; however, comparison of the
vegetation type output from the model to known vegetation types in the study area
revealed that the MC1model grossly under-represented shrubland habitats in grassland
ecosystems. Because of this limitation the bioclimatic vegetation model was not capable
of projecting changes between grassland and shrubland types except in a very small area
in the western portion of the PLJV region and outside the current LEPC range. Future
calibration of MC1, given sufficient training data, may provide more reliable output
variables that can be translated into grass-shrub habitat suitability criteria relevant to
birds and potentially other terrestrial wildlife. This is an obvious limitation regarding our
analysis of LEPC habitat given the close relationship between the species and shrubland
communities such as sandsage and shinnery-oak. Therefore, in order to assess predicted
changes in habitat available to the LEPC, we restrict our conclusions to the
interpretation of the above-ground vegetation carbon outputs as a proxy to herbaceous
grassland biomass (forgoing any predictions on habitat type).
The historic (year 2000) above-ground carbon estimates from the MC1 model were
substantially lower than the 1990 field measures of carbon content in shortgrass and
mixed-grass communities as published in Derner et.al 2006 (Table 4). This discrepancy
in carbon values is due to the fire schedule used in the fire model of MC1 (see
Assumptions and Limitations for more details). Fire frequency was not suppressed in the
model, allowing for a fire frequency which is much greater than actual fire frequency
observed in the PLJV (a region where fire is heavily suppressed), thus, causing decreased
above-ground carbon. That said, the relationship between the MC1 carbon outputs and
field carbon measures is constant – projected carbon levels are about half those of
measured field carbon levels (Table 4). Therefore, we maintain that the trajectory and
gradient of the MC1 carbon output are reliable indicators of changes in plant biomass,
although the magnitude is not reflective of the amount of biomass.
The MC1 vegetation model projected that above-ground vegetation carbon will decline
throughout much of the PLJV region and the LEPC range over the next 60 years (Table
5, Figure 7). The mean carbon level for the PLV region decreased 13% (-2.7g/m2).
Within the current range of the LEPC, carbon loss was greater, with a reduction of 18% (-
4.8 g C/m2). Overall, 84% of the PLJV region and 99% of the LEPC range are projected
to have reduced above-ground carbon by 2060 (Table 5).
The maps in Figure 8 illustrate the spatial distribution of historic and future estimated
above-ground carbon levels, showing predicted geographic shifts over the next 60 years.
The MC1 model predicted an eastward shift in vegetation carbon levels such that carbon
levels historically occurring in the shortgrass prairie BCR shift east into the mixed-grass
prairie BCR in 60 years. Likewise, new lower carbon levels are projected for much of
eastern Colorado, including the western reach of the current LEPC range.

21
Table 4. Estimated mean above-ground vegetation carbon levels (g C/m2) from the MC1 dynamic
vegetation model (by time period and grassland community) compared to above-ground vegetation carbon
levels measured from field clippings from the 1990’s. Field data are average carbon values for live and
standing dead above-ground biomass collected in two grassland communities and grazing types by Derner
et al. 2006. The shortgrass prairie study sites were located in northeast Colorado and the mixed-grass sites
were located in central Kansas near Hays. Carbon values from the MC1 model for the 2000 time period are
approximately half of the carbon values from field data.
Grassland
Community Year
Carbon Estimates from MC1
(g C/m2)
Mean Carbon
Content from
Grazed and
Ungrazed Sites
(g C/m2)1
Mean SD Mean +/- 1 SD
(rounded)
Shortgrass
(BCR18)
2000 21.5 3.3 18 - 25 35 – 49
2060 17.8 3.4 14 - 21 n/a
Mixed-grass
(BCR19)
2000 29.2 5.6 24 -35 50 - 89
2060 26.5 4.6 22 - 31 n/a
1 Biomass was measured for herbaceous species collected in July 1994. Carbon content of the biomass was
determined by multiplying biomass by C concentrations levels that were determined through evaluation of
plant samples collect in July 1998 in shortgrass and in September 1999 in mixed-grass sites.
Table 5. Projected change in above-ground carbon (as g C/m
2 and percent loss/gain) from 2000 to 2060 in
the PLJV region and in the current Lesser Prairie-Chicken range. Statistics are based on pixel counts and
values; pixel size is approximately 76km2 (18,780 acres).
Area
n
(pixels )
Change in Above-ground Carbon
(g C/m2)
Portion of
Area Losing
Carbon Min. Mean Max. sd
PLJV region (~160 million acres)
8450 +3.1
(+14%)
-2.7
(-13%)
-14.7
(-38%)
2.7
(11%)
84%
LEPC Range (~16 million acres)
848 +1.0
(+7%)
-4.8
(-18%)
-9.7
(-34%)
2.3
(9%)
99%

22
Figure 7. Projected change in vegetative carbon (g C/m
2) from 2000 to 2060 in the Playa Lakes Joint
Venture region and current Lesser Prairie-Chicken range.

23
Figure 8. Maps show the spatial distribution of estimated above-ground vegetation carbon in 2000 versus 2060,
based on the MC1 dynamic vegetation model. The chart shows the percent area of the PLJV by estimated carbon
levels for both years (fit is a 5th
order polynomial trend line).

24
CRP in the LEPC range
The 10-mile buffer of the current LEPC range spans approximately 37.9 million acres
across five states with the largest portions of the study area occurring in Kansas and
Oklahoma (Figure 2; Table 6). Over 36% (13.8 million acres) of this study area is
comprised of cropland and an additional 10% (3.9 million acres) is comprised of CRP
enrolled in a grass-type Conservation Practice (i.e., CP1, CP2, CP10, etc – practices
potentially suitable for the LEPC).
CRP enrollment rates (i.e., the percent of cropland enrolled in CRP) varies by state and
BCR within the study area, ranging from 16% in BCR19-KS to 33% in BCR18-TX
(Table 6). Across the study area, about 22% (3.9 million acres) of cropland is enrolled in
the CRP.
The amount of CRP in Large Block formation also varies by state and BCR, ranging from
1% in BCR19-TX to 54% in BCR19-KS (see Methods for explanation of Large Blocks).
All states within the LEPC range have <15% of their CRP in Large Block formation with
the exception of Kansas which has >50% in both of its BCRs. This disparity occurs
because nearly all CRP grass in Kansas is planted to native species considered suitable
habitat for the LEPC. Therefore, the parameters of the Large Block spatial model are set
to include CRP as a suitable habitat only in Kansas, resulting in many more CRP acres in
Large Block formation in Kansas. Across the entire study area, about 23% (925,527
acres) of CRP is currently in Large Block formation (Table 6).
Table 6. Amount and distribution of cropland and CRP in the study area (a 10-mile buffer of the Lesser
Prairie-Chicken current range) by BCR and state. CRP includes only enrollments in grass-type
Conservation Practices such as CP1, CP2, CP10, etc. See Methods for an explanation of Large Blocks.
Portion of LEPC Range
Cropland (acres)
Percent of Cropland in CRP CRP (acres)
CRP in Large Blocks (acres)
Percent of CRP in Large Blocks
BCR18
CO 1,129,177 30% 477,071 45,280 9%
KS 4,064,830 16% 756,511 392,861 52%
OK 479,266 30% 204,591 12,925 6%
NM 860,085 31% 379,356 28,033 7%
TX 2,317,524 33% 1,125,366 20,999 2%
BCR19
KS 4,158,371 15% 726,516 393,029 54%
OK 574,878 26% 205,688 31,406 15%
TX 262,615 28% 102,329 995 1%
TOTAL 13,846,746 22% 3,977,428 925,527 23%
25
Current LEPC carrying capacities
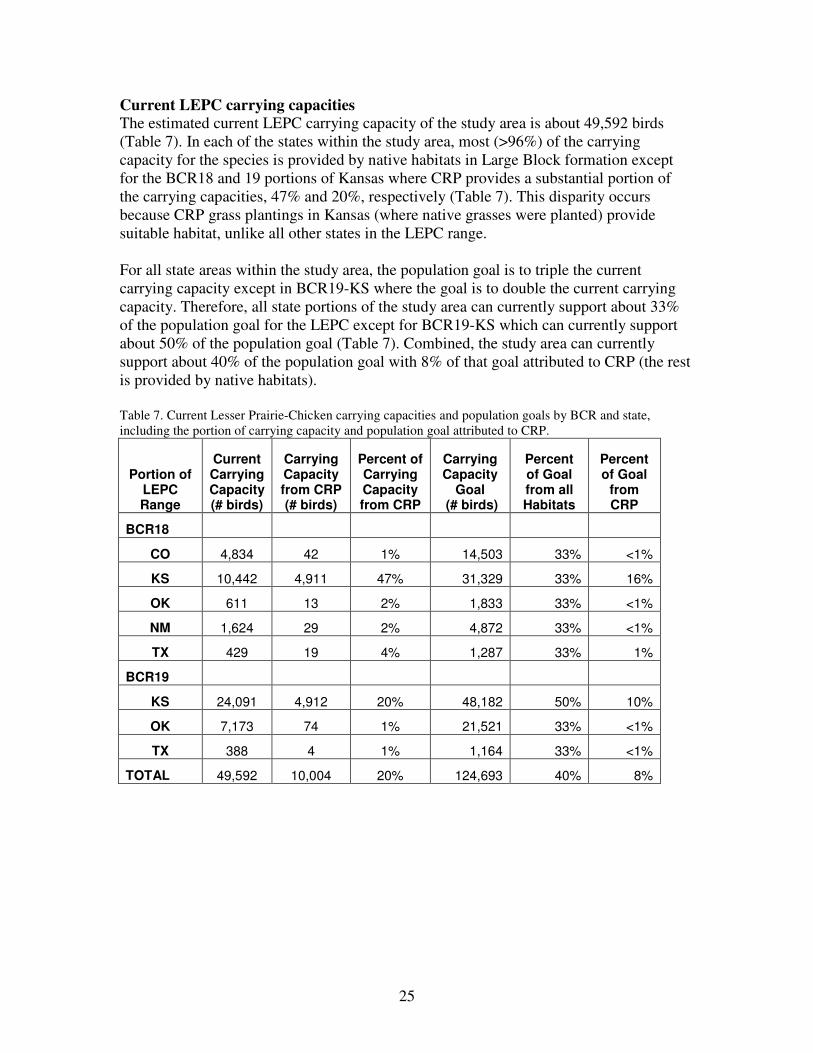
The estimated current LEPC carrying capacity of the study area is about 49,592 birds
(Table 7). In each of the states within the study area, most (>96%) of the carrying
capacity for the species is provided by native habitats in Large Block formation except
for the BCR18 and 19 portions of Kansas where CRP provides a substantial portion of
the carrying capacities, 47% and 20%, respectively (Table 7). This disparity occurs
because CRP grass plantings in Kansas (where native grasses were planted) provide
suitable habitat, unlike all other states in the LEPC range.
For all state areas within the study area, the population goal is to triple the current
carrying capacity except in BCR19-KS where the goal is to double the current carrying
capacity. Therefore, all state portions of the study area can currently support about 33%
of the population goal for the LEPC except for BCR19-KS which can currently support
about 50% of the population goal (Table 7). Combined, the study area can currently
support about 40% of the population goal with 8% of that goal attributed to CRP (the rest
is provided by native habitats).
Table 7. Current Lesser Prairie-Chicken carrying capacities and population goals by BCR and state,
including the portion of carrying capacity and population goal attributed to CRP.
Portion of LEPC Range
Current Carrying Capacity (# birds)
Carrying Capacity from CRP (# birds)
Percent of Carrying Capacity from CRP
Carrying Capacity
Goal (# birds)
Percent of Goal from all Habitats
Percent of Goal
from CRP
BCR18
CO 4,834 42 1% 14,503 33% <1%
KS 10,442 4,911 47% 31,329 33% 16%
OK 611 13 2% 1,833 33% <1%
NM 1,624 29 2% 4,872 33% <1%
TX 429 19 4% 1,287 33% 1%
BCR19
KS 24,091 4,912 20% 48,182 50% 10%
OK 7,173 74 1% 21,521 33% <1%
TX 388 4 1% 1,164 33% <1%
TOTAL 49,592 10,004 20% 124,693 40% 8%

26
Potential declines in LEPC carrying capacities
We were unable to quantify projected changes in LEPC carrying capacity caused by
climate change (see Methods for explanation). However, our results indicate a decrease in
vegetation productivity across the LEPC range; therefore we predict a future decline in
the landscape’s capacity to support the LEPC. Below we provide a range of possible
declines in LEPC carrying capacity based on the current estimated capacity to give the
reader an understanding of potential magnitude of decline.
With a current carrying capacity of 49,592 birds (Table 8), for every 1% decline in
capacity (applied equally across the study area), the landscape loses the ability to support
496 LEPCs. A 5% decline in carrying capacity means the landscape can support 2,480
fewer LEPCs. With a 10% decline in carrying capacity the landscape can support 4,959
fewer LEPCs. And with a 15% decline in carrying capacity the landscape can support
7,439 fewer LEPCs.
Table 8. A range of potential declines in Lesser Prairie-Chicken (LEPC) carrying capacity that could result
from impacts of climate change, translated into the number of birds that would no longer be supported by
the landscape. For example, a 5% decline in carrying capacity means the landscape can support 2,480 fewer
LEPCs.
Portion of LEPC Range
Current Carrying Capacity (# birds)
Potential Declines in Current LEPC Carrying Capacity (# birds)
1% 2% 5% 10% 15%
BCR18
CO 4,834 -48 -97 -242 -483 -725
KS 10,442 -104 -209 -522 -1,044 -1,566
OK 611 -6 -12 -31 -61 -92
NM 1,624 -16 -32 -81 -162 -244
TX 429 -4 -9 -21 -43 -64
BCR19
KS 24,091 -241 -482 -1,205 -2,409 -3,614
OK 7,173 -72 -143 -359 -717 -1,076
TX 388 -4 -8 -19 -39 -58
TOTAL 49,592 -496 -992 -2,480 -4,959 -7,439
Ability of CRP of offset declines in LEPC carrying capacities
If future CRP acres were targeted for the LEPC (in Large Block formation and planted to
native grassland species), targeting as little as 10% of the current local CRP acres could
offset a 1-2% decline in LEPC carrying capacity (about 811 birds; Table 7). This scenario
means that all BCR-state portions of the LEPC range, except for Kansas, would have
10% of their current CRP acres targeted for the LEPC. Since Kansas currently has over
50% of its CRP already targeted (in Large Block formation and planted to native
27
species), all targeted CRP acres in Kansas would be maintained, not reduced to 10%. In
BCR19-OK, where 15% of the CRP acres are currently in Large Block formation, only a
small fraction is planted to native species; therefore, we reduced the amount of targeted
CRP to 10% and assumed all these acres would be planted to native species. Taking into
account the 785,890 CRP acres currently targeted in Kansas, 249,440 acres of additional
targeted acres would be needed across the rest of the LEPC range to achieve this offset –
a total of 1,035,300 total targeted CRP acres (26% of all current CRP acres; Table 9).
There are currently 3,977,428 acres of CRP in the study area and 13,846,746 acres of
cropland (Table 6).
For every 10% increase in targeted CRP acres, a 1-2% decline in LEPC carrying capacity
(about 992 birds) could be offset. For instance, targeting 20% of local CRP acres could
offset a 3-4% decline in LEPC carrying capacity (about 1,803 birds). This scenario later
would require about 498,880 acres of CRP to be targeted throughout all states in the
LEPC range except Kansas (where 785,890 acres are currently targeted) – a total of
1,284,770 acres of targeted CRP.
Our estimates of potential offsets in decline of LEPC carrying capacity caused by
targeted CRP acres only include the direct impact of CRP as ‘new’ habitat; it does not
incorporate any increases in LEPC carrying capacity that occur as new CRP acres turn
previously fragmented native habitat patches into Large Blocks. In such cases, the
landscape’s LEPC carrying capacity would increase further because the once fragmented
native habitat patches would now become suitable LEPC habitat. Therefore, potential
offsets in decline could be greater in some areas depending on the opportunity to create
new Large Blocks via targeting CRP acres.

28
Table 9. Potential declines in Lesser Prairie-Chicken (LEPC) carrying capacity due to climate change,
potential offset in decline provided by varying levels of targeted CRP acres, and number of targeted CRP
acres required for offsets. Targeted CRP acres are assumed to occur in Large Block configuration (near
large tracts of native habitat) and planted to species appropriate to provide suitable LEPC habitat (native
grasses, forbs, shrubs).
Potential Decline in
LEPC Carrying
Capacity (%)
Min. Targeted CRP Acres Required to
Offset Decline (% of Local
CRP Acres)a,b
Potential Offset in Carrying Capacity (# birds)
Currently Targeted
CRP (acres)
c
Additional Targeted
CRP Required for
Offset (acres)
Total Targeted
CRP Required for
Offset (acres)
1-2% 10% 811 785,890 249,440 1,035,330
3-4% 20% 1,803 785,890 498,880 1,284,770
5-6% 30% 2,795 785,890 748,320 1,534,211
7-8% 40% 3,787 785,890 997,760 1,783,651
9-10% 50% 4,779 785,890 1,247,201 2,033,091
20% 75% 11,338 785,890 2,197,181 2,983,071 a 'Local' refers to the amount of CRP that currently exists in the LEPC range
b Future CRP acres assumed to be targeted (in Large Block formation and planted with native plant species)
c Current CRP acres in Large Block formation in Kansas are assumed to be currently targeted. Other states
contain no targeted CRP acres because of dominance of non-native plantings.

29
DISCUSSION
Projected vegetation changes in the PLJV region
This analysis projected a trend of decreasing moisture, increasing temperatures, and
decreasing above-ground vegetation carbon throughout the PLJV and LEPC current
range over the next 60 years (Figures 5-8). These projected reductions in above-ground
vegetation carbon indicate reductions in plant biomass (Derner et al. 2006), and thus,
changes in the grassland habitat available to the LEPC. The predicted geographic shifts in
vegetation carbon (Figure 8) suggest that in 60 years grasslands occurring in the mixed-
grass prairie BCR will have productivity/biomass levels reflective of those currently
occurring in the shortgrass prairie BCR. We suggest that in 60 years grassland habitats in
the LEPC current range will be less productive, possibly of shorter stature and less dense
cover – ultimately, providing less suitable habitat for this species of high conservation
concern.
Although we predicted changes in plant biomass, we were not able to predict changes in
plant composition, expressed either as species or functional groups (C3 versus C4 plants).
There is uncertainty about how future rises in CO2 may interact with the historical
relationships among rangeland plants, temperature, and precipitation making it difficult to
predict how plant species, groups, or communities may shift in abundance or range
(Matthews 2008, Morgan et al. 2008). We could only infer changes in biomass as
changes in vegetation structure (i.e., height, density, litter). We were also not able to
predict changes between grass and shrub species because of a limitation in the MC1
model which was unable to approximate current known distribution of shrubland habitat
such as sandsage and shinnery-oak. However, we believe that calibration of the MC1
model could remedy this issue so we intend to run a re-calibrated model in the future.
We used the dynamic vegetation model to project vegetation changes over the next 60
years. This timeframe was selected as being appropriate for biological planning in the
PLJV and a point far enough in the future to detect vegetation changes. While the model
results did not provide evidence of wholesale shifts in vegetation communities, changes
in vegetation biomass were projected. This information will be used by PLJV and its
partners to make decisions about habitat conservation over the near term.
Projected impacts of climate change on the LEPC
Our results heed a cautionary and pressing message that the LEPC may be facing
significant challenges to long-term survival due to climate-related vegetation changes
over the next 60 years. Although we were not able to project a quantified impact of
climate change on the LEPC (i.e., calculate change in carrying capacity), we infer from
the results of our climate change and dynamic vegetation modeling that the LEPC will
likely be negatively impacted by climate change. Our climate change modeling predicted
increases in temperature and decreases in precipitation across most of the PLJV region,
with some of the greatest changes occurring within the current LEPC range (Figures
5&6). Likewise, the dynamic vegetation modeling predicted declines in grassland
biomass across the study area, with some of the greatest changes occurring within the
LEPC range (Figure 7-9).
30
If grassland biomass declines in the LEPC range, then LEPC carrying capacity should
also decrease. The LEPC requires grassland habitat with relatively high vertical structure
and plant density, both herbaceous and woody, for nesting and wintering habitat. Field
research has shown that nest site selection and nest success are associated with greater
vertical structure and vegetation density as compared to surrounding rangeland (Davis et
al. 2008). When grass height and density is limited, LEPCs rely more on shrub vegetation
for cover, especially in winter (Davis et al. 2008).
Can CRP offset impacts of climate change on the LEPC?
Field research has shown that CRP can provide suitable habitat for the LEPC if planted to
appropriate species, managed for suitable vegetation structure, and located near occupied
native habitat (see Introduction). Two previous CEAP assessments by the PLJV
(McLachlan and Rustay 2007, McLachlan and Carter 2009) quantified the current benefit
of CRP to LEPC, showing that the degree of benefit varied by state and BCR, with CRP
in Kansas providing the most benefit (CRP in Kansas is planted to native species unlike
other states in the LEPC range; McLachlan and Rustay 2007, McLachlan and Carter
2009). The purpose of this study was to determine how much benefit CRP could provide
the LEPC in view of predicted future climate-induced habitat changes. To do this, we
assessed how effective targeting CRP could be at offsetting potential impacts of climate
change on LEPC. Our results indicated that targeting as little as 30% of current CRP
acres in LEPC range could offset a 5-6% decline in LEPC carrying capacity (about 2,800
birds). Targeting half of current CRP acres within LEPC range could offset a 10%
climate change-induced decline in LEPC carrying capacity (nearly 5,000 birds; Table 9).
These CRP-targeting scenarios would not require additional acres to be allocated into the
CRP nor would they require increases in county caps because they are based on targeting
portions of what currently exists on the landscape (most counties within the LEPC
current range have reached or are near the set cap of 25% of a county’s cropland). This
approach helped keep the potential CRP-targeting scenarios realistic, in terms of acres
available for targeting and expectations for future CRP enrollment rates. Although we
analyzed the potential offset of targeting 75% of current CRP acres in the LEPC range,
we feel that targeting 50% is a more feasible goal for several reasons. First, there are a
finite number of places to spatially target CRP such that it creates or expands a Large
Block of habitat that includes native vegetation. Second, landowners with cropland near
Large Blocks cannot be expected to enroll all their cropland in the program. Using
Kansas’ CRP enrollment rate and spatial distribution as a guide, we estimated that about
50% of cropland surrounding Large Blocks of native habitat can be expected to be
enrolled in the CRP. This presumed threshold may be increased if incentives for
enrollment were offered (such as increased rental rates or incentive payments). Lastly, we
recognize that the CRP has multiple objectives, of which wildlife habitat conservation is
only one. There must be sufficient CRP acres aimed at achieving soil and water quality
objectives as well, which likely require field enrollment in areas not considered suitable
for LEPC conservation.

31
Implications for other priority birds
Although this assessment is focused on conservation of the LEPC, the results have strong
implications for other species of conservation concern that occur within LEPC range as
well as the PLJV region. The LEPC is considered an umbrella species so projected
effects on the LEPC suggest effects on other species sharing LEPC range and its habitats.
For example, Grasshopper Sparrow (Ammodramus savannarum) is a conservation
priority species that occurs within the LEPC range, breeds in mixed-grass prairie, and
requires large tracts of grassland. The area requirement is much smaller for Grasshopper
Sparrow (20-30 ac in Nebraska; Helzer 1996, Helzer and Jelinski 1999) relative to the
LEPC and also to the average size of a CRP field in BCR18 and 19 (about 125 ac for
grass and wildlife habitat plantings). Grasshopper Sparrows prefer grass of intermediate
height, moderately deep litter, and sparse woody vegetation (Dechant et al. 2002).
Decreases in grassland biomass (i.e., shorter/sparser vegetation) could result in lower
quality grassland habitat for the Grasshopper Sparrow. However, like the LEPC,
Grasshopper Sparrows use CRP as breeding habitat so targeting CRP for the LEPC could
also benefit Grasshopper Sparrows and other species that share similar habitat
requirements.
Currently, there are over 30 priority bird species that breed in BCR18 and 19 and they
use a wide variety of grassland and shrubland habitats (see Appendix B). This variety in
habitat requirements suggests that climate-induced vegetation changes over the next 60
years could have a range of impacts on priority birds species including variation in
direction (i.e., positive or negative impacts) and magnitude (i.e., degree of impact). In
general, we predict that negative impacts can be expected for those species that require
taller and denser grassland vegetation structure because of the predicted decrease in
grassland biomass. However, these impacts may not necessarily result in the form of
decreased population size, but may result in geographic shifts in populations. Our
dynamic vegetation modeling indicates an eastward expansion of lower stature grasslands
– relative to current grassland condition. Bird species’ ranges may shift geographically to
coincide with these projected shifts in vegetation, meaning receding ranges for some
species (possibly those that require higher grassland biomass) and expanding ranges for
other species (possibly those that require lower grassland biomass).

32
RECOMMENDATIONS
Based on our findings in this CEAP
assessment and two previous CEAP
assessments (McLachlan and Rustay 2007,
McLachlan and Carter 2009), we
recommend that the CRP (as administered
within the LEPC range) be adapted to
include a LEPC conservation component
(possibly a Conservation Priority Area
(CPA)) under which a portion of each
county’s cap is targeted, both spatially and
ecologically, to conserve the LEPC.
Specifically, we suggest that 30% to 50% of
each county’s cap be allocated for LEPC
conservation.
Reaching this goal would likely occur over
several years, as existing CRP contracts
expire and new applications are submitted;
however, the more quickly CRP acres are
targeted, the more effective we can be in
preventing or offsetting any losses in LEPC
(caused by climate change or other ongoing
threats such as habitat fragmentation caused
by human development). We also
recommend that financial incentives (such as a signing incentive payment (SIP) or
Practice Incentive Payment (PIP)) be offered to increase landowner interest in
enrollment. Additionally, we suggest that existing CRP acres be transitioned into grazing
lands through the Environmental Quality Incentive Program (EQIP) or other programs to
create more permanent habitat for the LEPC.
If CRP acres were targeted for LEPC conservation, it is imperative that they are spatially
targeted for the species in order to expand or create requisite large blocks of habitat.
We recommend development of a spatially explicit Decision Support Tool (DST) that
would identify target areas for enrollment. The DST should evaluate CRP fields, crop
fields, and the habitat requirements of the LEPC (including its spatial habitat
requirements) against the landscape using a Geographic Information System (GIS).
The illustration in Figure 9 shows how a DST can rank crop fields into tiers of potential
benefit to the LEPC considering adjacency to large blocks of native habitat, existing CRP
fields, and major roads (no tolerance). When CRP and crop fields are ranked according to
potential benefit to birds, it allows strategic enrollment and re-enrollment of fields,
creating more and higher quality habitat. To maximize the number of high ranking fields
enrolled in CRP, we suggest targeted solicitation of landowners for enrollment and
increased financial incentives to landowners of high ranking fields. Landowners of high
Figure 9. Map produced by a Decision Support
Tool showing the rank (Tier 1 = highest priority
(red), Tier 2 = medium priority (dark pink), Tier 3
= low priority (light pink)) of crop fields near
existing large blocks of suitable Lesser Prairie-
Chicken habitat.
33
ranking fields may receive a SIP, PIP, or higher soil rental rates. The DST and resulting
target area should be re-evaluated every few years as the landscape changes (i.e., target
areas may need to be re-drawn).
ASSUMPTIONS AND LIMITATIONS
Climate and vegetation models
Results from the climate and dynamic vegetation models (MC1 model) are only as good
as the data used. Although climate data has gone through extensive testing and vetting by
the international scientific community, it represents a projection into the future based on
current knowledge which has associated error because no one can definitively determine
what the future will be.
The field-collected vegetation carbon data used to validate the MC1 carbon output
(Derner et al. 2006) was collected at two sites in the PLJV region. The carbon values in
these prairies may not be representative of prairies throughout the PLJV region. In
addition, the carbon data used from Derner et al. (2006) were presented without error
bars; therefore, our data ranges are conservative. For example, we used the mean value
for shortgrass grazed as the low value and un-grazed for the high value. We understand
that there is a distribution of values around each mean and suggest future research use
this range of values to better capture the range of values to represent each community.
The MC1 model run was performed using a full fire schedule without suppression which
caused the above-ground vegetation carbon levels to be lower than expected
(approximately half) compared to field-collected carbon measures in the study area where
fire is heavily suppressed. Fire suppression can greatly impact the above ground carbon
levels in the MC1 model as shown below (Figure 10; unpublished Rogers 2011). That
said, the relationship between the MC1 carbon outputs and field carbon measures is
constant – projected carbon levels are about half those of measured field carbon levels
(Table 4). Therefore, we maintain that the trajectory and gradient of the MC1 carbon
output are reliable indicators of changes in plant biomass, although the magnitude is not
reflective of the amount of biomass. In future runs of the MC1 model, we would alter the
fire schedule to better reflect observed fire frequency in the PLJV region.
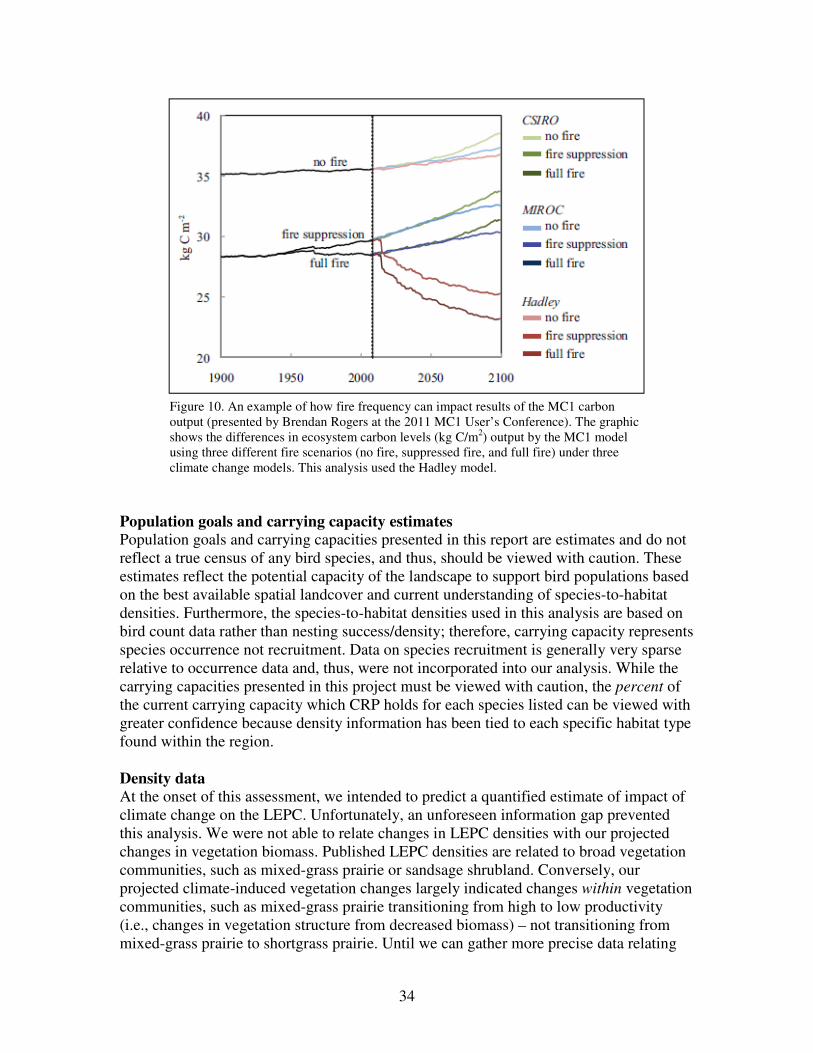
34
Population goals and carrying capacity estimates
Population goals and carrying capacities presented in this report are estimates and do not
reflect a true census of any bird species, and thus, should be viewed with caution. These
estimates reflect the potential capacity of the landscape to support bird populations based
on the best available spatial landcover and current understanding of species-to-habitat
densities. Furthermore, the species-to-habitat densities used in this analysis are based on
bird count data rather than nesting success/density; therefore, carrying capacity represents
species occurrence not recruitment. Data on species recruitment is generally very sparse
relative to occurrence data and, thus, were not incorporated into our analysis. While the
carrying capacities presented in this project must be viewed with caution, the percent of
the current carrying capacity which CRP holds for each species listed can be viewed with
greater confidence because density information has been tied to each specific habitat type
found within the region.
Density data
At the onset of this assessment, we intended to predict a quantified estimate of impact of
climate change on the LEPC. Unfortunately, an unforeseen information gap prevented
this analysis. We were not able to relate changes in LEPC densities with our projected
changes in vegetation biomass. Published LEPC densities are related to broad vegetation
communities, such as mixed-grass prairie or sandsage shrubland. Conversely, our
projected climate-induced vegetation changes largely indicated changes within vegetation
communities, such as mixed-grass prairie transitioning from high to low productivity
(i.e., changes in vegetation structure from decreased biomass) – not transitioning from
mixed-grass prairie to shortgrass prairie. Until we can gather more precise data relating
Figure 10. An example of how fire frequency can impact results of the MC1 carbon
output (presented by Brendan Rogers at the 2011 MC1 User’s Conference). The graphic
shows the differences in ecosystem carbon levels (kg C/m2) output by the MC1 model
using three different fire scenarios (no fire, suppressed fire, and full fire) under three
climate change models. This analysis used the Hadley model.

35
LEPC density to vegetation condition data (as opposed to community level data),
including shrubland conditions, we are unable to quantify predicted effects of climate
change on the LEPC.
Density data were gathered through an exhaustive literature search; however, because this
analysis considers several habitats simultaneously (and so required several habitat-
specific density estimates for a single species) it was sometimes necessary to apply
density estimates from multiple sources to a single species. This lack of consistency
among density estimates, resulting from various methods authors used in calculating
density, can cause discrepancy when comparing habitats. A strong effort was made to
identify outliers in the density data to reduce such problems. Furthermore, density data
are almost exclusively available for the breeding season so this analysis is limited to
those species occurring in BCR18 during the breeding season and its results (i.e., carrying
capacity) applied only to the breeding season.
Trend data
Population goals were derived, in part, from species trend data from the U.S. Geological
Survey (USGS) Breeding Bird Survey (BBS). The BBS is a long-term (30+ years)
national bird survey from which trend data are calculated for individual species (Sauer et
al. 2006). See <http://www.mbr-pwrc.usgs.gov/bbs/trend/tf06.html> for an explanation of
the methods used to calculate trends and limitations of BBS data. Using BBS trends to
determine population goals may result in goals that are greater than the ability of the
current landscape to deliver. This could happen for several reasons: 1) habitat acreages
have changed over the last thirty years because of habitat change or conversion, 2)
current GIS landcover data do not accurately reflect the true landscape, or 3) factors
outside of the breeding range may be affecting trend. For those species where a trend-
based population goal required more than doubling the estimated current carrying
capacity, the population goal was capped at doubling.
Landcover data
Carrying capacities presented in this report are based on habitat acres as depicted in a
regional landcover developed by PLJV. The landcover is a combination of multiple state-
based and regional coverages reclassified to single classification system to create a
continuous landcover across state boundaries. All spatial landcover layers have inherent
error so the habitat acres used in estimating carrying capacity can only be considered
estimates themselves. Currently, there is no accuracy assessment for the landcover layer;
however, accuracy levels of the source data used in creating it are available in Playa
Lakes Joint Venture (2007).
Not all habitat Conditions are spatially explicit (i.e., not mapped) so acres for these
Conditions were derived from statistics (e.g., the National Agricultural Statistics Service
provided statistics of crop type acres) or assumed based on expert opinion (e.g., 25% of
the mixed grass prairie has ‘many shrubs’ and ‘high grass’). The Range Factors applied
to acres of habitat Associations and Conditions are based on estimated species’ range
boundaries which have some inherent error as ranges can be dynamic (i.e., change over
time, with weather). The Suitability Factor is based on literature or expert opinion. The

36
Large Block Factors are based on calculations from spatial models that were developed
with criteria based from scientific literature and expert opinion (e.g., Lesser Prairie-
Chicken Interstate Working Group).
ACKNOWLEDGMENTS
Special thanks are given to Ron Neilson, Jim Lenihan, Ray Drapek, Dominique Bachelet,
and Chris Daley at the US Forest Service at the Forestry Sciences Laboratory, Corvallis,
Oregon for graciously sharing their climate data and vegetation models and for providing
advice. Thanks to Dave Melhman of The Nature Conservancy and Mike Carter of the
PLJV for their cooperation in building this working partnership. Lastly, thanks to Charlie
Rewa of the NRCS for supporting this research.
SUGGESTED CITATION McLachlan, M., A. Bartuszevige, and D. Pool. 2010. Evaluating the potential of the
Conservation Reserve Program to offset projected impacts of climate change on the
Lesser Prairie-Chicken (Tympanuchus pallidicinctus): a conservation effects assessment
project. Playa Lakes Joint Venture, Lafayette, CO, USA.

37
LITERATURE CITED
Andrews, R., and R. Righter. 1992. Colorado birds: a reference to their distribution and
habitat. Denver Museum of Natural History, Denver, Colorado, USA.
Bachelet, D., J.M. Lenihan, C. Daly, and R.P. Neilson. 2000. Interactions between fire,
grazing and climate change at Wind Cave National Park, SD. Ecological Modeling
134:229–244.
Bachelet, D., J.M. Lenihan, C. Daly, R.P. Neilson, D.S. Ojima, and W.J. Parton. 2001a.
MC1: a dynamic vegetation model for estimating the distribution of vegetation and
associated carbon, nutrients, and water—technical documentation. Version 1.0. Gen.
Tech. Rep. PNW-GTR-508. Portland, OR: U.S. Department of Agriculture, Forest
Service, Pacific Northwest Research Station. 95 p.
Bachelet, D., R.P. Neilson, J.M. Lenihan, and R.J. Drapek. 2001b. Climate change effects
on vegetation distribution and carbon budget in the U.S. Ecosystems 4:164–185.
Busby, W.H. and J.L. Zimmerman. 2001. Kansas Breeding Bird Atlas. University Press
of Kansas, Lawrence, Kansas, USA.
Chapman, R.N., D.M. Engle, R.E. Masters, D.M. Leslie, Jr. 2004. Grassland vegetation
and bird communities in the southern Great Plains of North America. Agriculture,
Ecosystems and Environment 104:577–585.
Crawford, J.A., and E.G. Bolen. 1976. Effects of land use on Lesser Prairie Chickens in
Texas. Journal of Wildlife Management 40:96–104.
Daly, C., D.L. Bachelet, J.M. Lenihan, R.P. Neilson, W.J. Parton, and D.S. Ojima. 2000.
Dynamic simulation of tree-grass interactions for global change studies. Ecological
Applications 10:449–469.
Davis, D. M., R. E. Horton, E. A. Odell, R. D. Rodgers and, H. A. Whitlaw. 2008. Lesser
Prairie- Chicken Conservation Initiative. Lesser Prairie Chicken Interstate Working
Group. Unpublished Report. Colorado Division of Wildlife, Fort Collins, CO. USA.
Dechant, J.A., M.L. Sondreal, D.H. Johnson, L.D. Igl, C.M. Goldade, M.P. Nenneman,
and B.R. Euliss. 2002. Effects of management practices on grassland birds:
Grasshopper Sparrow. Northern Prairie Wildlife Research Center, Jamestown, North
Dakota, USA.
Derner, J.D., T.W. Boutton, D.D. Briske. 2006. Grazing and ecosystem carbon storage in
the North American Great Plains. Plant and Soil 280:77-99.
38
Dobbs, R.C. 2007. A review of distribution, habitat use, and population density data in
the Hierarchical All Bird Strategy (HABS) Database. Playa Lakes Joint Venture,
Lafayette, Colorado, USA.
Fields, T.L. 2004. Breeding season habitat use of Conservation Reserve Program (CRP)
land by Lesser Prairie-Chickens in west central Kansas. M.S. Thesis. Colorado State
University, Fort Collins, Colorado, USA.
Giesen, K.M. 1994. Movements and nesting habitat of Lesser Prairie-Chicken hens in
Colorado. Southwest Naturalist 39: 96-98.
Hagan, C.A. 2005. Lesser Prairie-Chicken (Tympanuchus pallidicinctus). In The Birds of
North America Online (A. Poole, Ed.). Cornell Laboratory of Ornithology, Ithaca,
NY; Retrieved from The Birds of North American Online database.
Helzer, C.J. 1996. The effects of wet meadow fragmentation on grassland birds. M.S.
thesis. University of Nebraska, Lincoln, Nebraska, USA.
Helzer, C.J. and D.E. Jelinski. 1999. The relative importance of patch area and perimeter-
area ratio to grassland breeding birds. Ecological Applications 9:1448-1458.
Jackson, A.S. and R. DeArment. 1963. The Lesser Prairie Chicken in the Texas
Panhandle. Journal of Wildlife Management 27: 733–737.
Kantrud, H.A. and Kologiski, R.L. 1982. Effects of soils and grazing on breeding birds of
uncultivated upland grasslands of the Northern Great Plains. U.S. Fish and Wildlife
Service Wildlife Research Report 15. 33 p.
Lionberger, J. 2006. Lesser Prairie-Chicken: federal aid and wildlife restoration progress
report. Texas Parks and Wildlife, Austin, TX, USA.
Matthews, J. H. 2008. Anthropogenic Climate Change in the Playa Lakes Joint Venture
Region: Understanding Impacts, Discerning Trends, and Developing Responses.
World Wildlife Fund, Corvallis, OR, USA.
McLachlan, M. and C. Rustay. 2007. Effects of the Conservation Reserve Program on
Priority Mixed-grass Prairie Birds: A Conservation Effects Assessment Project. Playa
Lakes Joint Venture, Lafayette, CO, USA.
McLachlan, M. and M. Carter. 2009. Effects of the Conservation Reserve Program on
Priority Shortgrass Prairie Birds: A Conservation Effects Assessment Project. Playa
Lakes Joint Venture, Lafayette, CO, USA.
Meehl, G.A., C. Covey, T. Delworth, M. Latif, B. McAvaney, J.F.B. Mitchell, R.J.
Stouffer, and K.E. Taylor. 2007. The WCRP CMIP3 multimodel dataset: a new era in

39
climate change research. Bulletin of the American Meteorological Society 88:1383–
1394.
Montana Sage-grouse Work Group. 2004. Management plan and conservation strategies
for sage-grouse in Montana. Montana Fish, Wildlife and Parks, Helena.131 pp.
Morgan, J. A., J. D. Derner, D. G. Milchunas, and E. Pendall. 2008. Management
Implications of Global Change for Great Plains Rangelands. Rangelands 30:18-22.
Nakićenović, N. and R. Swart. 2000. Emissions Scenarios Special Report of the
Intergovernmental Panel on Climate Change. Cambridge University Press,
Cambridge, UK.
Niemuth, N.D, J.W. Solberg, and T.L. Shaffer. 2008. Influence of moisture on density
and distribution of grassland birds in the North Dakota. Condor 110:211–222.
Parmesan, C. 2006. Evolutionary and ecological responses to recent climate change.
Annual Review of Ecology and Evolution 37:637–669.
Peterjohn, B.G. 2003. Agricultural landscapes: can they support healthy bird populations
as well as farm products? Auk 120:14–19.
Playa Lakes Joint Venture. 2007. Habitat assessment procedures technical companion
document to the PLJV Implementation Planning Guide. Playa Lakes Joint Venture,
Lafayette, Colorado, USA.
Price, J., S. Droege, and A. Price. 1995. The summer atlas of North American birds.
Academic Press, San Diego, California, USA.
Räisänen, J., and T.N. Palmer. 2001. A probability and decision-model analysis of a
multimodel ensemble of climate change simulations. Journal of Climate 14:3212-
3226.
Räisänen, J., and L. Ruokolainen. 2006. Probabilistic forecasts of near-term climate
change based on a resampling ensemble technique. Tellus 58A:461–472.
Riley, T.Z., C.A. Davis, M. Ortiz, and M.J. Wisdom. 1992. Vegetative characteristics of
successful and unsuccessful nests of Lesser Prairie Chickens. Journal of Wildlife
Management 56: 383–387.
Rotenberry, J.T., and J.A. Wiens. 1980. Habitat structure, patchiness, and avian
communities in North American steppe vegetation: a multivariate analysis. Ecology
61:1228-1250.

40
Sauer, J.R., J.E. Hines, and J. Fallon. 2006. The North American Breeding Bird Survey,
Results and Analysis 1966 - 2006. Version 6.2.2006. USGS Patuxent Wildlife
Research Center, Laurel, MD, USA.
Taylor, M.A. and F.S. Guthery. 1980. Status, ecology, and management of the Lesser
Prairie Chicken. U.S. Dep. Agric. Forest Service Gen. Tech. Rep. RM-77, Rocky
Mountain Forest and Range Experimental Station, Fort Collins, Colorado, USA.
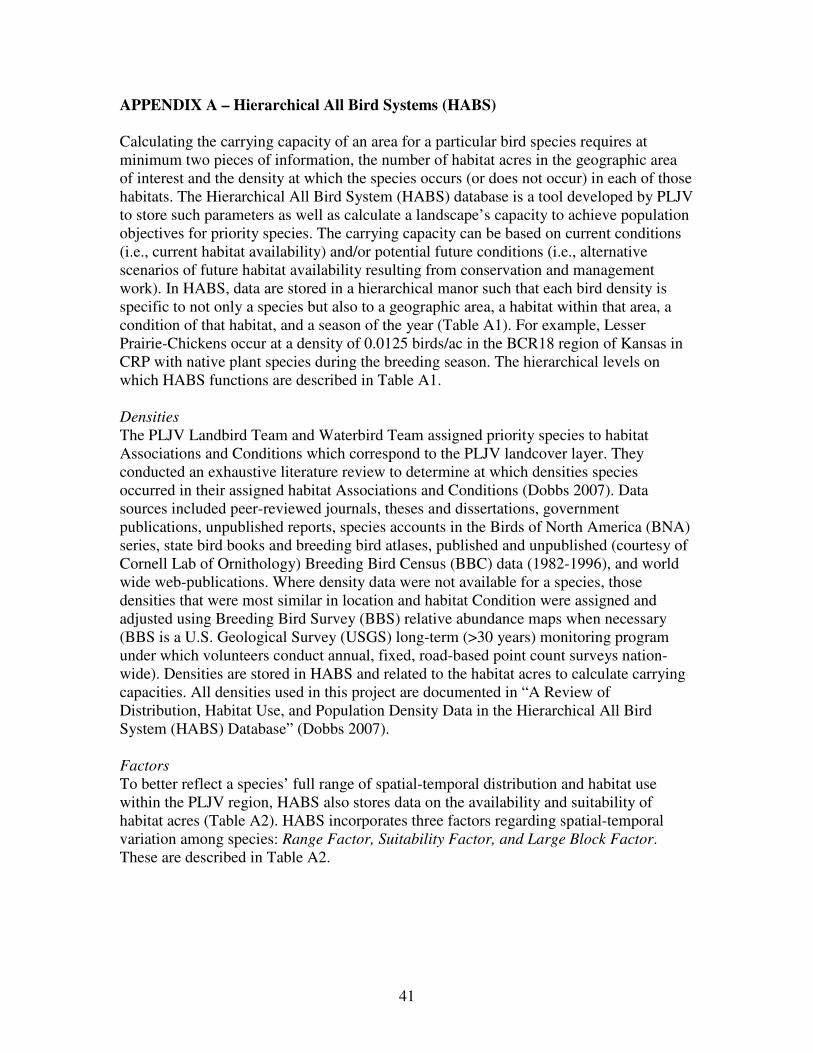
41
APPENDIX A – Hierarchical All Bird Systems (HABS)
Calculating the carrying capacity of an area for a particular bird species requires at
minimum two pieces of information, the number of habitat acres in the geographic area
of interest and the density at which the species occurs (or does not occur) in each of those
habitats. The Hierarchical All Bird System (HABS) database is a tool developed by PLJV
to store such parameters as well as calculate a landscape’s capacity to achieve population
objectives for priority species. The carrying capacity can be based on current conditions
(i.e., current habitat availability) and/or potential future conditions (i.e., alternative
scenarios of future habitat availability resulting from conservation and management
work). In HABS, data are stored in a hierarchical manor such that each bird density is
specific to not only a species but also to a geographic area, a habitat within that area, a
condition of that habitat, and a season of the year (Table A1). For example, Lesser
Prairie-Chickens occur at a density of 0.0125 birds/ac in the BCR18 region of Kansas in
CRP with native plant species during the breeding season. The hierarchical levels on
which HABS functions are described in Table A1.
Densities
The PLJV Landbird Team and Waterbird Team assigned priority species to habitat
Associations and Conditions which correspond to the PLJV landcover layer. They
conducted an exhaustive literature review to determine at which densities species
occurred in their assigned habitat Associations and Conditions (Dobbs 2007). Data
sources included peer-reviewed journals, theses and dissertations, government
publications, unpublished reports, species accounts in the Birds of North America (BNA)
series, state bird books and breeding bird atlases, published and unpublished (courtesy of
Cornell Lab of Ornithology) Breeding Bird Census (BBC) data (1982-1996), and world
wide web-publications. Where density data were not available for a species, those
densities that were most similar in location and habitat Condition were assigned and
adjusted using Breeding Bird Survey (BBS) relative abundance maps when necessary
(BBS is a U.S. Geological Survey (USGS) long-term (>30 years) monitoring program
under which volunteers conduct annual, fixed, road-based point count surveys nation-
wide). Densities are stored in HABS and related to the habitat acres to calculate carrying
capacities. All densities used in this project are documented in “A Review of
Distribution, Habitat Use, and Population Density Data in the Hierarchical All Bird
System (HABS) Database” (Dobbs 2007).
Factors
To better reflect a species’ full range of spatial-temporal distribution and habitat use
within the PLJV region, HABS also stores data on the availability and suitability of
habitat acres (Table A2). HABS incorporates three factors regarding spatial-temporal
variation among species: Range Factor, Suitability Factor, and Large Block Factor.
These are described in Table A2.

42
Table 10. Each of the five hierarchical levels of the Hierarchical All Bird System, a description, and an
example (listed from highest to lowest level of order).
Hierarchical
Level
Description Example
Area where a Bird Conservation Region (BCR)
intersects a state
BCR18 portion of Kansas
Association a mappable habitat CRP
Condition management condition or a more specific,
potentially un-mappable, habitat
Native grasses
Season/Period breeding, wintering, migratory Breeding
Species priority bird species Lesser Prairie-Chicken
Table 11. List of spatial and temporal factors considered in the Hierarchical All Bird System database,
including a description, and an example.
Factor Type Description Example
Range
Factor
Proportion of total acres of an
Association or Condition (see Table 3)
that are within a species range.
In BCR18-NM, there are 9.4
million acres of shortgrass
prairie but only 5.6 million
acres are within Mountain
Plover range.
Range Factor = 0.60.
Suitability
Factor
Proportion of total acres of an
Association or Condition that are
suitable for species use during the
specified Season/Period (see Table 3).
In BCR18-TX, there are 2.9
million acres of wheat;
however, because of early
Spring harvest, this habitat
Condition is no longer suitable
to Grasshopper Sparrows during
their breeding season.
Suitability Factor = 0.
Large Block
Factor
Proportion of acres of an Association
or Condition that are in large block
configuration. Criteria for large blocks
are determined in a spatial model
developed for each Species and Area
(see Table 3).
In BCR18-CO there are 1.9
million acres of sand sage but
only about 273,000 acres are in
large block configuration.
Large Block Factor = 0.15.

43
Population Goals
The PLJV Landbird Team developed population goals for all priority species in BCR18
and 19. They followed the recommendation of Partners in Flight (PIF) which aims to
return bird population numbers back to the same levels as 30 years ago. They determined
population goals using two factors, estimated current carrying capacity and BBS
population trend (specific to each BCR). They calculated population goals as follows. If
the species’ population trend is > 0 (a growing population), the population goal equaled
the estimated current carrying capacity (a goal of maintaining the population). If the
species’ trend is < 0 (a declining population), we applied the following formula to
determine a population goal:
Current Estimated Carrying Capacity
(1-Absolute Value [Trend]) 29
.
To ensure robust data were used, BBS trend data were limited to those trends where the
P-value was < 0.1 and the number of routes within the BCR on which the bird was
detected was ≥ 14. If these criteria were not met, then a survey-wide (national) trend was
used instead of the BCR-based trend. For some species, there was no appropriate trend, in
which case population goals were developed through expert opinion. For example, Lesser
Prairie-Chicken population goals were determined by members of the Lesser Prairie-
Chicken Interstate Working Group. Trends used for each priority species are stored in
HABS.

44
APPENDIX B – Priority Birds Species of the Shortgrass and Central Mixed-grass
Prairie Bird Conservation Regions (BCRs18 and 19)
Table B1. List of priority bird species that breed in the shortgrass prairie Bird Conservation Region
(BCR18), including common name, scientific name, and description. Species are limited to those which use
CRP and/or cropland habitats.
Common Name Scientific Name Description
Cassin’s Sparrow Aimophila cassinii migratory landbird
Grasshopper Sparrow Ammodramus savannarum migratory landbird
Lark Bunting Calamospiza melanocorys migratory landbird
Lesser Prairie-Chicken Tympanuchus pallidicinctus resident upland game-bird
Mountain Plover Charadrius montanus migratory shorebird
Ring-necked Pheasant Phasianus colchicus resident upland game-bird
Swainson’s Hawk Buteo swainsoni migratory raptor
Table B2. List of priority bird species that breed in the central mixed-grass prairie Bird Conservation
Region (BCR19), including common name, scientific name, and description. Species are limited to those
which use CRP and/or cropland habitats.
Common Name Scientific Name Description
Cassin’s Sparrow Aimophila cassinii migratory landbird
Dickcissel Spiza americana migratory landbird
Eastern Meadowlark Sturnella magna resident landbird
Grasshopper Sparrow Ammodramus savannarum migratory landbird
Greater Prairie-Chicken Tympanuchus cupido resident upland game-bird
Lark Bunting Calamospiza melanocorys migratory landbird
Lesser Prairie-Chicken Tympanuchus pallidicinctus resident upland game-bird
Northern Bobwhite Colinus virginianus resident upland game-bird
Ring-necked Pheasant Phasianus colchicus resident upland game-bird
Swainson’s Hawk Buteo swainsoni migratory raptor
Upland Sandpiper Bartramia longicauda migratory shorebird
Western Kingbird Tyrannus verticalis migratory landbird