european economy. economic paper 179. financial...
TRANSCRIPT

EUROPEAN COMMISSIONDIRECTORATE-GENERAL FOR ECONOMIC
AND FINANCIAL AFFAIRS
ECONOMIC PAPERS
http://europa.eu.int/comm/economy_finance
N° 179 - November 2002
Financial Market Integration, CorporateFinancing and Economic Growth*Final Report (22 November 2002)
byMariassunta Giannetti, Luigi Guiso, Tullio Jappelli,
Mario Padula and Marco Pagano

Economic Papers are written by the Staff of the Directorate-General forEconomic and Financial Affairs, or by experts working in association withthem. The "Papers" are intended to increase awareness of the technical workbeing done by the staff and to seek comments and suggestions for furtheranalyses. Views expressed represent exclusively the positions of the authorand do not necessarily correspond to those of the European Commission.Comments and enquiries should be addressed to the:
European CommissionDirectorate-General for Economic and Financial AffairsPublicationsBU1 - -1/180B - 1049 Brussels, Belgium
* We thank Leonardo Otranto and Mauro Staiano for providing research assistance,Michael Halling for help in extracting the firm-level data, and CEPR for supplyingadministrative support.
ECFIN/597/02-EN This paper only exists in English.
©European Communities, 2002
Financial Market Integration, Corporate Financingand Economic Growth
Executive Summary ..............................................................................................................21. Overview of the study.........................................................................................................42. A critical assessment of existing literature...............................................................................7
2.1. Measuring financial development ............................................................................................92.2. Financial integration and financial development .......................................................................12
2.2.1. Effect of integration on national financial markets ................................................................122.2.2 Effect of integration on the access to foreign financial markets...............................................142.2.3 The limits to financial integration........................................................................................15
2.3. Empirical studies on the finance-growth nexus .........................................................................172.3.1. Cross-country studies........................................................................................................172.3.2. Industry-level studies ........................................................................................................202.3.3. Firm-level studies.............................................................................................................23
3. Estimating the relation between finance and growth ...............................................................254. Industry-level data and results ...................................................................................29
4.1 Data..................................................................................................................................294.1.1 External dependence ...........................................................................................................294.1.2 Financial development ........................................................................................................304.1.3 Value added, output, and number of firms.............................................................................314.1.4. Institutional variables and other instruments.........................................................................32
4.2 Regression results................................................................................................................34
5. Assessing the impact of financial integration on growth ...........................................................405.1. Raising financial development in the EU.................................................................................425.2. Improving the institutional determinants of financial development in the EU..................................44
6. Firm-level data and results ................................................................................................466.1. Data .............................................................................................................................466.2. Estimation results ...........................................................................................................48
7. Summary and conclusions .................................................................................................507.1. Summary of the results .......................................................................................................507.2. Limitations of the analysis and implications for EU financial integration ......................................51
References ........................................................................................................................53TOC
2
Executive Summary
This study provides a thorough assessment of the likely effects of financial market integrationon the ability of European countries to grow faster and on how the possible benefits will bedistributed among the Community countries and industries. The study achieves severalconclusions strongly supportive of the idea that promoting financial market integration is animportant step in promoting economic growth in Europe. The main findings of the study canbe summarized as follows:
� European countries still differ considerably in the degree of financial development, evenafter a decade where progress has been made on the front of the integration of nationalfinancial markets.
� Domestic financial backwardness constrains manufacturing industry growth below itspotential, and affects corporate investment and entrepreneurship. Thus, promotingfinancial market integration should enhance economic growth among European countries.
� The effect of financial development on economic growth has not weakened in the early1990s, when some financial integration occurred, suggesting that financial developmentcan still have relevant effects on economic growth.
� Simulations suggest that the potential benefits of financial integration – interpreted asfirms’ access to a financial market similar to the U.S. standards (or of the most developedEU economies) – can have potentially large effects on the EU countries’ growth. Theimpact of financial integration on the growth of value added in the EU manufacturingindustry as a whole is estimated at between 0.75 to 0.94 percentage points per year. Ofcourse, the effect would be smaller if financial market integration were associated to alower level of financial development than that of the U.S.
� The overall impact of financial market integration hides considerable diversity in countryand sector growth, reflecting both the degree of financial backwardness (more backwardcountries gain more) and sector specialisation (countries that specialise in financiallydependent sectors gain more).
� In our simulations, the growth effect of financial integration is 1 percent per year or morefor Belgium, Denmark, Finland, Germany, Greece, Ireland, Italy, Portugal and Spain. Inother countries, growth increases by less than 1 percent per year. This second groupincludes Austria and France (whose projected growth rate increases by somewhat lessthan 1 percentage point) and the Netherlands, Sweden and the UK, who do not gain much,being already the most developed financially in the Community. The two groups differ
3
mainly because of their initial level of financial development, which is considerablyhigher in the second group of countries.
� The overall effect on economic growth depends on which institutional determinant offinancial development is varied to achieve full financial market integration. The studyconsiders three variables that are both important determinants of financial developmentand at the same time are under policy control: the degree of creditor’s protection, theseverity of accounting standards and the rule of law. Unsurprisingly, the largest benefitsaccrue when all determinants are assumed to improve simultaneously. But convergence inaccounting standards to the highest level in Europe is shown to be alone sufficient to raisegrowth substantially.
� The study shows that the effect of financial development on manufacturing firms’ growthdiffers markedly also according to firm size, the development of domestic financialmarkets being mainly a constraint on the growth of relatively small and mediumenterprises (SMEs). This is consistent with the idea that larger firms can overcome localfinancial market imperfections by raising funds where they are more abundant andavailable. If financial market integration among European countries helps develop localfinancial markets or widens the geographical limits within which SMEs can raise funds, itwill prompt a disproportionate growth of SMEs. Then countries whose industrial structureis more tilted towards small firms (such as Austria, Belgium, Greece, Italy, Spain andSweden) stand to gain more from domestic financial development. However, an importantqualifier to this argument is that the local financial markets serving SMEs are also thoseless likely to be permeable to the competitive pressures arising from financial integration.
� Financial market integration may have both winners and losers. In countries that are lessfinancially developed, the financial sector stands to lose market shares and profits. Thismay result in a powerful constituency lobbying against financial integration, or at leastslowing down its progress. At the same time, the industrial sectors of these countries havean incentive to promote financial integration because integration gives them anopportunity to expand. So the overall balance of opinion in these countries will depend onwhether the pro-integration pressure of industry will win over the anti-integrationresistance of local finance. In financially developed countries, the situation is likely bereversed. The financial sector will gain from integration, while industry will not gainmuch and may even lose from the increased competitiveness of foreign manufacturingproducers, which will be able to access to hitherto inaccessible sources of financing.Therefore, in these countries finance is likely to be in favour of integration while industrymay be less favourable or even opposed to it.

4
1. Overview of the study
This report provides estimates of the relationship between financial market development
and corporate growth and assesses the impact of financial market integration on this
relationship with reference to European Union (EU) countries.
The report starts out in Section 2 by reviewing critically the approaches and the
empirical strategies so far used to study the impact of financial market efficiency and
development on corporate financing, investment and growth. Many studies have analyzed the
relationship between finance and growth, forming a relatively consolidated but still expanding
literature. We build on this literature to discuss three issues that are central to our empirical
strategy: (i) the measures of financial development, (ii) the relationship between financial
integration and financial development, and (iii) the econometric methods used to analyze the
finance-growth nexus.
In Section 3 of the report we lay out the methodology that we implement to estimate the
impact of financial development on the manufacturing sector growth in the EU. The approach,
first proposed by Rajan and Zingales (1998), exploits cross-country variation between real as
well as financial variables and relies on the intuitive idea that financial efficiency is more
relevant for firms that depend heavily on external finance. Although these authors applied it to
industry-level data, the approach can be applied also to firm-level data to obtain additional
insights on the nature of the link between financial and real variables and the likely
beneficiaries of financial market integration. In the report, we apply it to both types of data.
In Section 4 we estimate the relation between financial development and growth using
an international industry-level panel. The data set combines industry-level information on
sector growth, investment, number of firms, firm size and access to finance with country-level
indicators of financial development and institutional variables. The sample covers a longer
time interval and larger set of countries than that used by Rajan and Zingales. The regression
results obtained using this panel support the hypothesis that financial development promotes
growth, particularly in industries that are more financially dependent on external finance.
Indicators of financial development are significantly correlated with the growth rate of
manufacturing output and value added, and with firm creation. These estimates are an
intermediate step to assess the effects of financial development and integration in the EU.

5
In Section 5 we use these estimates to simulate possible “scenarios” of the growth
impact of financial market integration in the EU. To illustrate the impact of financial
integration on manufacturing sector growth, in Section 5.1 we simulate the impact of raising
the level of financial development in each EU country to the U.S. level of financial
development. We consider the latter to be a valid benchmark, being a highly developed and
continent-wide financial market, not dissimilar from what an integrated European financial
market would presumably look like once the integration process is completed. Indicators of
financial development place the US slightly above the most financially developed European
countries, and its size is comparable to that of the EU.
Financial development is correlated with several underlying regulatory variables (such
as indicators of investor protection, rule of law, etc), which are under the control of national
legislators and EU directives. For policy purposes, analyzing changes in these regulatory
variables may be a more interesting exercise than analyzing integration of the financial
systems themselves. Since assuming that EU countries will raise its regulatory and legal
standards to the U.S. standards appears unrealistic, in this case we examine a scenario where
EU countries raise their standards to the highest current EU standard. The resulting impact on
manufacturing performance of the various countries and sectors is presented in Section 5.2.
In Section 6 we apply the methodology described in Section 3 to a panel of companies
incorporated in EU, Central and Eastern European countries. This allows us to test the
robustness of the results obtained in Section 4 with industry-level data, as well as to
investigate if the finance-growth relationship is particularly strong for small and medium
enterprises (SMEs), as the theory would suggest. Firm-level estimates turn out to be quite
consistent with the industry-level estimates reported in Section 4. This is an impressive result,
considering that the two data sets differ deeply in terms of aggregation level, country
coverage and time interval. The micro estimates also highlight that the growth of SMEs is
more sensitive to financial development than the growth of large enterprises. This needs not
imply, however, that EU financial integration will benefit particularly SMEs, since many such
firms may remain beyond the reach of foreign banks and of securities markets.
Section 7 summarizes our findings and their implications for the process of European
financial market integration. We comment on the likely losers and gainers from this process,
and on the consequent emergence of interest groups in favor and against the integration
process. This concluding section also provides some important notes of caution about the
6
interpretation of the results. The main cautionary note is that our estimates refer only to
manufacturing industries, not to the whole economy. This implies that the estimated impact
on the overall economic growth rate cannot be immediately gauged from our estimates. To do
so, one should take into account that manufacturing is only a portion of the EU economy, and
that financial development may also affect other sectors, especially industries within the
service sector. In particular, and quite obviously, financial development is likely to affect
directly the financial and professional service sector. Our analysis cannot take this effect into
account because our data source – the UNIDO database – does not include data on these
industries. The output of banks, insurance companies, and of security, law and accounting
firms is hard to quantify in ways comparable to that of manufacturing industries, especially in
an internationally comparable fashion. We provide some suggestions on the qualitative
corrections to be made to our estimates when attempting to translate them in terms of impact
on the economy-wide growth rate.
7
2. A critical assessment of existing literature
Financial development can affect growth via three channels (Pagano, 1993): (i) it can
raise the fraction of savings funneled to investment, reducing the costs of financial
intermediation; (ii) it may improve the allocation of resources across investment projects, thus
increasing the social marginal productivity of capital; and (iii) it can influence households’
saving rate.
While in the first two cases the effect is generally positive, in the third its sign is
ambiguous: financial development may also reduce saving, and thereby growth. As capital
markets develop, households gain better insurance against endowment shocks and better
diversification of rate-of-return risk, consumer credit becomes more readily and cheaply
available, and the wedge between lending and borrowing rates shrinks. In this case the effect
on saving and growth is ambiguous.1 However, especially in economies open to capital flows,
domestic investment is to some extent decoupled from domestic savings, so that financial
development is unlikely to affect the growth rate via changes in the saving rate – the third
channel mentioned above. It is much more likely to do so either via the first and second
channel, that is, by reducing the cost of financial intermediation or by improving the
allocation of capital across projects.
Financial development can enhance growth by reducing the cost of financial
intermediation in two ways. First, to the extent that it is associated with the entry or creation
of new intermediaries, financial development can increase the degree of competition in
financial markets and thereby curtail monopoly rents. The interest rate margin charged by
banks will tend to be compressed below the level that incumbents would have chosen
otherwise, and the availability of credit will correspondingly tend to increase. Second, more
developed financial systems can reduce the cost of financial intermediation because they can
deal better with the problems of asymmetric information that are pervasive in financial
markets. For instance, financial systems may vary in their ability to prevent borrowers from
using loans to their own private benefit instead of investing in productive assets, or in their
ability to control the risks taken by the borrowers. Close bank relationships or efficient
1 These considerations suggest that “financial development” is too generic a term and that in order to
assess its effects on growth one needs to be specific on the particular financial market concerned. Inthis study we are concerned mainly with the effects of financial development on firms.
8
information production by large investors may mitigate such opportunistic behavior by
borrowers, and thereby allow intermediaries to require a lower return and/or increase funding.
Financial development can also contribute to growth by allocating capital more
efficiently across alternative investment projects. First, by facilitating the trading, hedging
and pooling of risks a more developed financial sector allows investors to fund highly
profitable, but risky investment opportunities that would otherwise be forgone. Second, to the
extent that more sophisticated intermediaries are more effective in distinguishing good and
bad projects, funds are allocated to more profitable projects, and the productivity of the
economy will increase.
An important issue is whether financial development has mainly “level effects” – that
is, allows countries to raise long run per capita output – or rather it affects steady state growth.
In principle both outcomes are possible, depending on the nature of the growth process. In
endogenous growth models, financial development and financial reform would allow
countries to grow permanently faster. In more traditional models with exogenously-driven
technological progress, financial development – by allowing more investment and capital
accumulation – would grant a transitory (but possibly prolonged) increase in the economy’s
growth rate, and a permanent increase in per-capita GDP.
For all these reasons, the current consensus view among economists is that financial
development spurs investment and growth, although opinions differ considerably about the
quantitative importance of this relationship. Indeed, a large and growing literature has
documented a robust correlation between finance and growth: countries with more developed
financial markets grow faster. To go beyond this mere correlation, first noticed by Goldsmith
(1969), one needs to establish if there is a causal relationship running from financial
development to growth. Therefore, any empirical analysis must control carefully for the
potential reverse causation from growth to financial development. To this purpose,
researchers have used econometric techniques and identification strategies of increasing
sophistication. Nowadays, the weight of the evidence is overwhelmingly in favor of the view
that financial development is capable of spurring economic growth. Events that affect the
degree of financial development of a country or a group of countries, such as financial
integration, may therefore be important for their subsequent economic performance.
In order to analyze the effects of financial integration on economic growth, it is useful
to start by reviewing critically the existing literature, which provides guidance to the
9
empirical analysis on several fronts. First, it illustrates how to measure financial development.
Second, it highlights how standard measures of financial development are likely to be affected
by the process of financial integration itself. Thirdly, it identifies the likely effects of
integration on financial development, and thereby on growth, economic specialization and
investment decisions. Finally, existing studies propose various solutions to the simultaneity
problems that researchers face when trying to pin down the causal relationship between
finance and growth. For the purpose of this report, it is quite important to understand merits
and shortcomings of these solutions.
2.1. Measuring financial development
The first problem that researchers face when analyzing empirically the effects of
financial development and financial integration on economic performance is how to measure
financial development.
One of the main roles of the financial system is to transfer funds from agents with a
surplus of resources to agents with a deficit of resources. If we define the development of a
financial system by its efficiency in performing this task, we could measure it by estimating
how well funds are transferred. In this respect, a good indicator would be the ease with which
investors in need of external funds can access them and the premium they have to pay for
these funds. In practice, both avenues are quite difficult. We observe easily if individuals or
firms borrow, but seldom if they are shut off from the credit market. And even if we observe
if individuals borrow, we seldom have information on the rate at which they borrow, let alone
the rate at which they would have borrowed in the absence of any friction.
For these reasons, the studies of the effects of financial development (e.g., King and
Levine 1993, Jayaratne and Strahan 1996, Rajan and Zingales 1998) have used alternative
measures based on readily available data.2 In this respect, most of the measures of financial
development currently used are a compromise between theoretical rigor and data availability.
Data constraints are particularly severe in cross-country studies, because measures that are
close to what theory suggests are hard to obtain and compare for many countries.
In practice, two types of indicators are normally used to capture a phenomenon as
complex as financial development:
10
� the size of financial markets where potential investors can raise external funds;
� the efficiency with which funds are intermediated, which affects the cost of funds and the
quality of the investment opportunities that are financed.
All of the indicators of financial development used in the cross-country literature belong
to one of these two broad categories and refer either to markets or to financial intermediaries.3
We examine them in turn.
A coarse indicator of the size of financial intermediation is the ratio of the liquid
liabilities of the financial system to GDP, where liquid liabilities are defined as currency plus
demand and interest-bearing liabilities of banks and non-bank financial intermediaries. One
shortcoming of this indicator is that it includes the liabilities of the central bank, which is
unlikely to convey funds to private borrowers. Better measures of the quantity of funds that
financial intermediaries convey to firms are the bank credit and the private credit provided by
deposit money banks and other institutions, both scaled with GDP. The latter is preferable
when banks also lend to governments.
The most commonly used measures of the size of a country’s financial market are the
stock market capitalization (i.e. the value of listed shares) and the bond market capitalization
(the value of outstanding debt securities issued by private domestic entities) divided by GDP.
More recent studies include information on the size of primary equity and bond markets.
The size of a country’s financial market proxies directly for the supply of funds to
firms: the larger the supply of funds, the more numerous are the investment projects that can
be funded and the higher the growth rate of the economy. As noted before, the relation
between finance and growth does not depend only on the amount of investment opportunities
that can be funded. Investment projects are heterogeneous and problems of asymmetric
information are of key importance in financial markets. Large amounts of funds will be
wasted if they are channeled to fund unprofitable projects.
Unfortunately, it is difficult to measure directly how well the financial system allocates
funds across firms, because the econometrician does not observe how much information
intermediaries produce to screen the most profitable projects and to monitor the firms they
invest in. However, the availability of abundant external funding to firms can be regarded also
as an indirect proxy for how efficiently funds are channeled to firms, since investors would
2 In exceptional periods of financial crises, one can use the number of bank failures as a proxy for
individual access to funds (Bernanke, 1983).3 See the Demirguc-Kunt and Levine (2001).

11
hardly entrust a large portion of their wealth to financial intermediaries if the latter were
inefficient in selecting and monitoring the projects to be funded. In other words, there is a
presumption that larger financial systems are more efficient in choosing the most profitable
investment opportunities and in giving the right incentives to managers and entrepreneurs.
In addition, size measures can be complemented with some efficiency measures to
proxy for financial development. For instance, one can measure the cost at which the financial
system of a country intermediates and provides funds to firms: a higher cost of intermediation
may imply a higher interest rate for a given amount of funds and in equilibrium this limits the
investment of the firms that depend on bank debt. The two most commonly used measures of
the efficiency of commercial banks are: a) the net interest margin, which equals a bank’s net
interest revenue as a share of total assets, and b) the share of overhead costs in the bank’s total
assets. Also the market structure of the banking system may affect the cost of funds, because
it determines the strength of bank competition. Therefore, measures of the concentration of
commercial banks, foreign banks’ penetration, and public versus private ownership of
commercial banks may be useful and have indeed been used in the literature.
Similar measures of efficiency have been defined with reference to financial markets.
Relatively high stock market capitalization may be coupled with low levels of activity which
increase the risk premium firms have to pay, because investors want to be compensated for
the lack of liquidity of the assets they hold. To measure stock market liquidity, researchers
have generally used the value of total stock market trading, scaled by GDP. A more direct
measure of efficiency is the stock market turnover, defined as the ratio of the value of total
shares traded to market capitalization. Lack of data has prevented researchers from calculating
analogous indicators for bond markets.
Besides measuring liquidity risk, measures of stock market activity are also correlated
with the information produced about the stock market, because higher turnover generally
implies that more market participants produce information about the prospects of listed
companies and trade on the basis of such information.
As we discuss in Section 4.1.2 in this study we will mainly rely on size- and activity-
based measures of financial development, because available measures of efficiency have
ambiguous effects on growth. For instance, the concentration of the banking industry – which
has been proposed as a measure of efficiency and is readily available – has this feature. A
highly concentrated commercial banking industry may limit competition and thus the overall

12
efficient supply of funds to investors. On the other hand, a highly fragmented market might
result in undercapitalized banks and in their inability to exploit economies of scale, which
may result in a higher cost of loans and/or lower compensation of deposits, both leading to
lower investment. A further reason for relying on size-based measures of financial
development is that this facilitates comparison with previous empirical studies.
2.2. Financial integration and financial development
How should financial integration be expected to affect the indicators of financial
development just discussed? In this section we argue that financial integration should increase
the supply of finance in the less financially developed countries of the integrating area, and
that this process should – to a first approximation – be reflected in an expansion of the
national financial system of these countries. Therefore, in the process of financial integration
the size of national financial systems should increase (relative to domestic GDP) in the
countries starting with less developed financial markets.
This point requires two important qualifications. First, in some instances financial
integration may enable domestic users to “by-pass” the financial markets of the laggard
countries. Domestic firms or households may simply gain greater access to foreign financial
markets or intermediaries, so that the additional financing would not show up in measures of
domestic financial development. Second, the process of financial integration may stop short
of fully equalizing the degree of financial development within the integrating area, because
institutional or informational barriers may prevent equal access to financial markets
throughout the area. We discuss these two qualifications and their implications for our
empirical analysis.
2.2.1. Effect of integration on national financial markets
Financial integration is likely to spur the efficiency of the financial intermediaries and
markets of less financially developed countries. To the extent that this greater efficiency

13
stimulates the demand for funds and for financial services, this should also translate into an
increased size of domestic financial markets.
The main channel through which this effect should operate is the increased
competition with more sophisticated and cheaper foreign intermediaries, associated with
financial integration. Competitive pressure from these intermediaries should reduce the cost
of financial services to the firms and households of countries with less developed financial
systems, and thus expand the quantity of the local financial markets.
In some cases, the additional supply of financial services may be provided by foreign
intermediaries entering the local market by acquiring local banks or merging with them.
Direct penetration by foreign banks and cross-border acquisitions of intermediaries are likely
to erode the local banks’ rents. If the mergers fostered by this process bring banks closer to
their efficient scale, the process should also be associated with reductions in the cost of
intermediation.4 The increase in competition, possibly coupled with cost cutting, should
translate into better credit conditions, and hence stimulate investment and economic growth.
A second reason why financial integration may be associated with local financial
development is that the process of integration generally requires improvements in national
regulation (accounting standards, securities law, bank supervision, corporate governance) to
bring it in line with best-practice regulation in the integrating area. The tendency towards a
“level playing field” in regulation is an essential pre-requisite of an integrated market, and it
is reasonable to expect this convergence in regulatory standards to result in an improvement
in the regulatory standards of less developed financial markets. This improvement may help
promote their development, by reducing adverse selection and agency costs as well as the
distortions induced by inadequate regulation.
On both accounts, therefore, one would expect financial integration to bring about an
increase in the less financially developed markets in the indicators considered in Section 2.1,
such as domestic stock market capitalization and bank lending relative to GDP. Although this
prediction guides our simulation exercise concerning the effects of financial integration, it
requires some qualifications, to which we turn now.
4 See Focarelli, Panetta and Salleo (2002) on the effects of bank mergers in Italy.
14
2.2.2 Effect of integration on the access to foreign financial markets
It is quite possible that, as financial integration proceeds, the most financially developed
countries will share the services provided by their financial system with the other integrating
countries. The economies of scale and the external economies involved in financial
intermediation can be a powerful fuel for the expansion of the established intermediaries and
markets of the more developed markets.
The banks of more developed countries can provide cross-border loans to the firms of
less advanced countries. In this case, the additional provision of credit will not show up in the
private domestic credit of the latter countries. Similarly, the financial services provided by
foreign intermediaries will not show up in the domestic supply of such services in the
countries with less developed financial markets. Therefore, size-based measures of local
financial development may underestimate the effect of financial integration on the
accessibility of credit and financial services in such countries.
A similar argument applies to equity markets. As these become more integrated, firms
of less financially developed countries can access more easily major financial centers by
listing their shares on foreign stock exchanges. They may want to do so for a variety of
reasons: overcoming equity rationing in the domestic market, reducing their cost of capital by
accessing a more liquid market, signaling their quality by accepting the scrutiny of more
informed investors or the rules of a better corporate governance system (Pagano, Röell, Randl
and Zechner, 2001; Pagano, Röell and Zechner, 2002). Whatever the reasons, by listing their
shares abroad, the firms of less financially developed countries add to the stock market
capitalization and turnover of those markets, rather than those of their domestic exchanges, as
documented by Claessens, Klingebiel and Schmukler (2002). Therefore, the increase in
domestic stock market capitalization may underestimate the impact of financial integration on
access to equity markets by firms located in less financially developed countries.
In fact, while integration may expand the financial sector primarily in the already
financially developed countries of the area, it may even decrease the availability of funding to
their non-financial firms, which will now compete with foreign firms for such funds.
However, this crowding-out effect is likely to be outweighed by the increased efficiency of
financial centers associated with their expanded activity. If so, financial integration would
increase the availability of funds and financial service efficiency in all integrating countries.
15
The upshot of this discussion is that as financial integration proceeds, the size of the
financial market of a given country as a measure of its degree of financial development loses
significance. Distance and thus geographical segmentation tends to become less important in
financially integrated markets. Indeed, in a fully integrated market, what matters is the total
size of the financial market of the integrating area: firms of a given country may have equal
access to financial services as those of all other countries even if their domestic financial
sector (scaled by GDP) differs from that in other countries.
For this reason, we should not expect that in a fully integrated European capital market
all countries will have the same credit-GDP ratio and the same stock market capitalization-
GDP ratio. Actually, given the scale and external economies in the financial service industry,
this outcome is unlikely: the financial industry will tend to concentrate in a limited number of
countries or even cities, as illustrated by U.S. financial history. But we expect the supply of
finance for the integrating area as a whole to expand significantly. And thus, in an integrated
market all firms, regardless of country, will still have access to the same funding
opportunities, some of which possibly offered by foreign intermediaries. But their situation
will be equivalent to one where they could access an equally broad and developed domestic
financial market.
2.2.3 The limits to financial integration
As stated in Section 2.2.1, homogenizing financial regulation is a prerequisite for the
creation of an integrated market. Most EU directives are precisely aimed at fulfilling this
prerequisite. However, even if all regulatory barriers (including those due to taxes) were
eliminated in financial markets, some deeper-seated differences in the rules of different
jurisdictions may still prevent full financial integration. And the persistence of informational
barriers in local financial markets may have the same effect.
Even if all regulatory barriers (including those due to taxes) were eliminated in financial
markets, it may be difficult to homogenize the basic rules of national legal systems that form
the infrastructure of financial markets (such as corporate law) and, even more so, the concrete
functioning of these legal systems. However, these basic rules and their application by the
judiciary can be important for the performance of financial markets and intermediaries. For
instance, the enforcement of law in a geographic area and the ability of lenders to recover
16
unpaid loans via judicial procedures are likely to be important determinants of the extent to
which that area will enjoy the benefits of credit market integration. If judicial enforcement of
creditor rights is poor, foreign banks will be in no better position than local lenders in
extending credit to domestic borrowers. This conclusion is supported by evidence in Jappelli,
Pagano and Bianco (2001) and Fabbri and Padula (2001) who exploit variability across Italian
provinces in judicial inefficiency to estimate the effects of local courts efficiency on the
performance of local credit markets.
Informational barriers may also limit the effects of financial integration. For small
borrowers the level of local financial development is more important than the availability of
financial services at the country level. Stein (2002) and Berger and Udell (2002) argue that
small business lending, which concerns very opaque borrowers, involves the production of
soft information that cannot be easily collected by loan officers that are located faraway and
do not interact with the local community. Moreover, this information is difficult to transmit to
outsiders. Therefore, banks that specialize in this segment of the credit market tend to remain
small and local. This implies that for small borrowers financial integration would be less
relevant than for large ones.
The hypothesis that small borrowers are particularly affected by local financial
conditions is supported by the recent findings of Guiso, Sapienza and Zingales (2002), who
apply an innovative method to estimate the effects of local financial development using Italian
regional data. They first construct a new indicator of financial development by estimating the
probability that, other things equal, a borrower is shut off from the credit market. By using
regional fixed effects as a proxy of local financial development, they show that differences in
local financial development affect the probability that an individual starts his own business,
firms’ entry decisions and firms’ growth.
However, the idea that small borrowers are particularly affected by local financial
conditions and thus less likely to benefit from financial integration may become less relevant
in the future. Technical progress in the banking industry is likely to reduce the importance of
proximity in lending relationships in EU countries, just as they appear to have done in the
U.S. Indeed, Petersen and Rajan (2002) show that in the U.S. the distance between small
firms and their lenders increased over time, supposedly because improvements in information
technology allow to gather better and cheaper information on potential borrowers and lenders.
17
To the extent that these technological changes will spread through the EU countries, future
financial integration might benefits also small borrowers.
2.3. Empirical studies on the finance-growth nexus
To map out our empirical strategy, we review how previous studies estimated the sign
and magnitude of the effects of financial development on growth, with special focus on the
main contributions of the literature and especially on their estimation techniques. Previous
studies relied on three types of data: country-level, industry-level or firm-level data.
2.3.1. Cross-country studies
As mentioned, identifying a causal link between financial development and growth in
the data poses considerable challenges. However, the economic profession has done a lot of
progress since 1969 when Goldsmith concluded that “a rough parallelism can be observed
between economic and financial development if periods of several decades are considered” (p.
48), using cross-sectional data on 35 countries. To go beyond the mere correlation,
researchers have used econometric techniques and identification strategies that allow to
control for the possible feedback effects of economic growth on financial development, that
is, for the fact that higher growth tends to call forth an increased supply of financial services.
To try to tackle this problem, King and Levine (1993a, 1993b) study the relation
between financial development at the beginning of their sample period and subsequent growth
in a cross-section of 80 countries. They use different indicators of long-run economic
performance: besides the growth rate of GDP per capita, they also try to identify the channels
through which financial development influences economic growth by looking at capital
accumulation, proxied by the growth rate of physical capital per capita and the ratio of
investment to GDP, and at a measure of economic efficiency, obtained from estimated Solow
residuals. The main finding of this study is that all the indicators of future economic
performance are positively associated with the predetermined component of financial
development, as measured by the size of financial sector at the beginning of the estimation
interval. Their results are qualitatively unchanged also after controlling for other determinants
of growth, such as the initial level of GDP per capita and indicators of political stability.
18
Levine and Zervos (1998) explore further the relation between finance and growth by
looking at the relative importance of banks and securities markets. Interestingly, indicators of
the size of the stock market seem to have no impact on subsequent growth, while stock market
liquidity and banking system development are as much as important.
Unfortunately, the use of predetermined variables to measure financial development
only partly overcomes endogeneity problems. As Rajan and Zingales (2002) notice, an
omitted common variable, such as the household saving rate, could still drive both long-run
growth and the initial level of financial development, generating a spurious correlation
between them in the data. Moreover, temporal precedence does not necessarily imply
causality: the econometrician may find in the data that financial development predicts future
growth only because financial markets anticipate future growth opportunities. For instance,
stock market valuations may reflect changes in future growth opportunities and banks may
lend more in anticipation of high growth in the sales of their customers. If so, financial
development may only be a leading indicator of future growth.
The main difficulty in overcoming the reverse causality problem when using aggregate
data is to find instruments that can be considered truly exogenous, i.e. variables that affect
financial development but are uncorrelated with economic performance. For instance, King
and Levine (1993b) show that their estimates are robust to the use of the level of secondary
school enrollment as an instrument for financial development. Unfortunately, it is impossible
to exclude that secondary school enrollment is itself correlated with the same omitted
variables that influence financial development and growth.
La Porta et al. (1998) document that the size of a country’s financial market is related to
the origin of its legal system, arguably because common-law countries seem to offer better
investor protection than civil-law countries. The legal origin of a country can be considered
exogenous to economic growth, because English, French and German legal systems were
created centuries ago and then spread mainly through occupation and colonialism. Hence
Beck, Levine and Loayza (2000a, 2000b) use the legal origin of the financial system to extract
the exogenous part of financial development. Using this technique, they again find that the
size of the financial sector has a positive and robust correlation both with per-capita GDP
growth and with total factor productivity growth. In contrast, it seems to have an ambiguous
effect on the growth of physical capital and private savings. The results are confirmed also
when they exploit the time-series variability in financial development and economic growth,
19
as opposed to the cross-sectional variation alone, using country-level fixed effects to control
for unobserved heterogeneity. Beck, Levine and Loayza (2000b) use a wider range of
instruments and show that also an indicator of accounting standards and the level of contract
enforcement are important instruments of financial development.
The conclusions of these studies on aggregate cross-country data are tied together by
Demirguc-Kunt and Levine (2001), who examine how indicators of financial market
efficiency and size correlate with long-run growth. According to their estimates, both the
development of financial markets and that of intermediaries correlate with long-run growth,
when they are instrumented by indicators of the quality of the legal system, such as measures
of investor rights’ protection and of the quality of enforcement. There is no definite evidence,
however, on the relative importance of bank versus security markets: only aggregate measures
of financial development appear to matter.
Other strong empirical evidence on the nexus between finance and growth comes from
Jayaratne and Strahan (1996), who rely on data on U.S. states. They exploit the effects of
intrastate branch deregulation – and the attendant increase in competition – that occurred at
different dates in the various states. The study shows that states that removed restrictions in
branching grew more than the others. Since bank lending did not grow, the authors attribute
this effect to increased bank efficiency. This study provides quasi-experimental evidence on
the causality nexus between finance and growth, because quite clearly deregulation did not
occur in anticipation of future business cycle expansions.
The evidence by Jayaratne and Strahan (1996) also helps deflect the concern that the
correlation between finance and growth documented by cross-country studies arises from the
inclusion of developing countries, but might not be relevant for OECD economies, whose
capital markets are more uniformly broad and sophisticated. A problem in assessing the
relation between finance and growth for OECD countries alone is that the estimates lose
power due to the paucity of observations and the implied lack of degrees of freedom.
However, the US states are comparable to the OECD economies in terms of pro-capita wealth
level, and Jayaratne and Strahan’s estimates show that financial development still matters for
economic growth. This parallels the findings of Pelgrim and Schich (2002), who find that
financial development and investment are cointegrated in OECD countries, that is, their long
run movements are similar. Unfortunately, this study does not control for endogeneity
problems, in contrast to Beck, Levine and Loayza (2000a and 2000b), and therefore the

20
documented correlation between financial development and investment does not necessarily
imply causality, for the reason already explained.
In a recent paper, Edison, Levine, Ricci and Slok (2002) examine the relation between
international financial integration, financial development and growth. They find that
international financial integration is completely irrelevant for growth, once one controls for
the level of domestic financial development. This suggests that, in spite of the cautionary
arguments in Section 2.2.2, so far financial integration mattered for growth only to the extent
that it affected domestic financial development. This is true both for more and less financial
developed countries, and is robust to the use of different econometric techniques and to
different proxies of financial integration, such as indicators of the existence of capital controls
and the magnitude of capital inflows and outflows. In contrast, the coefficient of the measures
of financial development consistently maintains its expected sign. To put it another way, the
fact that measures of national financial development still matter for national growth, signals
that the actual degree of financial integration is far from complete.
2.3.2. Industry-level studies
A more recent strand of empirical studies used industry-level data to make further
progress on the issue of causality and at the same time shed light on the channels through
which financial development affects economic growth. Theory suggests that financial markets
and institutions can help firms overcome or at least attenuate the adverse selection or moral
hazard problems in their relationship with investors. Thus, financial market development
should benefit disproportionately firms or industries that are highly dependent on external
finance. The testable prediction of this approach is that these firms and industries should grow
faster in countries where financial markets are relatively more developed.
This approach has been proposed and implemented on industry-level data for a large
sample of countries in the 1980s by Rajan and Zingales (1998). They construct their test by
first identifying each industry’s need for external finance from firm-level data for the U.S.,
under the assumption that financial development is highest in that country. Then they interact
this industry-level “external dependence” variable with a country-level proxy for the degree
of financial development (so as to obtain a variable that measures the extent to which
21
financial development constrains the growth of each industry in each country) and use this
variable in a regression for industry-level growth.
Since the test exploits the interaction between the country financial development and the
relative financial dependence of its industries, Rajan and Zingales control for fixed country
and industry effects. This is an important step forward because many variables potentially
affecting growth are typically left out in cross-country studies, creating potential biases in the
estimated relationship between financial development and growth.
This method also filters out the potential feedback from future growth onto financial
development. If the relation between financial development and growth is positive only
because financial markets anticipate future growth, sectors that differ in “external
dependence” should be affected in the same way and therefore the interaction variable should
not be statistically different from zero.
Rajan and Zingales find that various measures of financial development (total stock
market capitalization, domestic credit to the private sector accounting standards)
disproportionately affect real economic growth in industries that are more dependent on
external finance. The variable obtained by interacting industry external dependence with the
domestic degree of financial development is positive and significant, even after controlling for
country and industry fixed effects and for the industry’s output share in the relevant country.
Moreover, they find that the measures of financial development affect the growth of the
number of establishments rather than the growth of the average size of the existing
establishments.
In our empirical estimates of the finance-growth relation we rely on the Rajan-Zingales
methodology, extending the sample of countries and the indicators of financial development.
As we argue in Section 3, this methodology offers a convincing solution to the causality
problem and lends itself naturally to study the economic effects of financial integration and
how these effects are distributed among integrating countries.
The recognition of industry heterogeneity has proved to be very important not only to
study the effect of financial development on growth within a country but also to understand
the channels through which these effects operate. Carlin and Mayer (1999) use the Rajan-
Zingales approach to probe further into the relationships between industrial activity, financial
systems and legal arrangements. They conclude that in OECD countries market-based finance
and legal protection of investors are correlated with the growth of equity-financed and skill-
22
intensive industries, and particularly with R&D investment. In contrast, market-based finance
and accounting standards are not important for physical capital accumulation.
These findings provide indirect support for Allen and Gale’s (2000) claim that markets
and intermediaries are complementary and favor growth of technologies with different
characteristics: intermediaries are useful if large amounts of capital must be raised by firms
operating in traditional sectors. In contrast, the development of new technologies in high-risk
sectors is favored by the concurring funding of different investors who observe different
complementary signals on the future prospects of a project, because this allows pooling
several pieces of independent information.
The methodology proposed by Rajan and Zingales (1998) has been used also to test the
predictions of Obstfeld (1994). The model by Obstfeld shows that financial development can
affect growth by creating more risk sharing opportunities, since individuals invest in high-
profit, high-risk sectors only if they can share business risk. In this model, the reference to
financial integration is direct, since access to foreign assets – promoted by integration –
improves portfolio diversification. The model shows that finance can influence growth also by
affecting industry specialization. Recently, Svaleryd and Vlachos (2002) have tested these
predictions, using Rajan and Zingales’ (1998) methodology to study the relation between
financial market development and industry specialization. They conclude that countries with
relatively efficient financial institutions tend to specialize in sectors that use financial services
relatively intensively. The comparative advantage seems to derive primarily from stock
markets, since only the indicators of stock market development and efficiency help to explain
specialization in more finance-intensive industries.
The main contribution of the studies based on industry level data is the finding that
financial development spurs growth especially in sectors that are more dependent on external
finance. Moreover, stock market development and efficiency seem to be more important than
the development of financial intermediaries, at least in OECD countries. The relative
unimportance of the development of intermediaries and of the banking sector in particular
could depend on the fact that intermediaries play an important role only in the early phases of
development when large amount of capital must be mobilized. Moreover, the ambiguous
effect of bank competition on the availability of funds could obfuscate the relation between
availability of credit and growth. For instance, Cetorelli and Gambera (2001) show that bank
concentration promotes growth for those industries that are more in need of external finance,
23
facilitating access to credit especially for younger firms. However, the deadweight loss
associated with banking market concentration affects negatively growth in all sectors.
2.3.3. Firm-level studies
Some empirical evidence on the nexus between finance and growth comes from studies
using firm-level data. One obvious advantage of using firm-level data is that the structure of
the financial system can be considered exogenous with respect to the performance of
individual firms, especially if data on small and medium-sized firms are used.
Demirgüc-Kunt and Maksimovic (1998) are the first to test the relation between finance
and growth drawing on microeconomic data. They use firm-level data from thirty countries to
estimate the maximum growth rate that each firm in their sample could attain without access
to long-term financing and equity, using techniques that are common in financial planning.
They define the maximum growth rate of sales and assets that firms could attain if they relied
only on internally generated funds. Then they calculate the fraction of firms that in each
country grows at a higher rate and analyze how this fraction differs across countries with
different legal and financial systems. They show that in countries with better legal systems,
more active stock markets and larger banking sectors, a greater proportion of firms finance
their growth by external long-term finance and equity, and grow faster.
Indirect evidence in favor of the importance of financial development is provided also
by micro-econometric studies of investment equations, financial constraints (Levine, 1997)
and capital structures. Indeed, as shown by Giannetti (2002b), unlisted firms seem more
subject to agency problems in countries where institutions are weaker and financial
development is lower and this supposedly increases the cost of external funds and reduces
access to credit. These problems are worse for firms investing in intangible assets and with
high cash flow volatility.
Moreover, there is evidence that financial constraints are more stringent in countries
where investor protection and financial development are lower. Love (2001) estimates the
cash-flow sensitivity of investment in a cross-section of countries, and shows that this proxy
of financial constraints is larger in countries with poor institutions.
Using firm-level data, one can tackle issues that cannot be addressed with more
aggregate data. For instance, financial integration is expected to affect not only the size and
24
the efficiency of the financial sector but also to improve risk sharing. Evidence on the effects
of financial integration on risk sharing comes from the studies that analyze the changes in the
cost of capital in countries that opened their stock markets to foreign investors. Chari and
Henri (2001) estimate a capital asset pricing model using firm-level stock returns and find that
there are significant effects due to the repricing of systematic risk. Of course the magnitude of
this effect should be expected to be much smaller as EU equity markets integrate, since
foreign investment is already allowed and the covariance of the market portfolios of EU
countries is quite large. However, there may still be a reduction in the cost of capital if
European investor reduces their home equity bias. Hardouvelis, Malliaropoulos and Priestley
(1999) provide evidence that this reduction already occurred in the run-up to monetary union.
Increased portfolio diversification by controlling shareholders can also contribute to
stimulate investment. In countries with low investor protection, ownership is concentrated and
controlling shareholders, being not well diversified, require a high return on their investment.
This increases the cost of capital and thus decreases investment in equilibrium, as highlighted
by Himmelberg, Hubbard and Love (2002). If financial integration is accompanied by a “rise
to the top” in investor protection standards, it spurs a decrease in ownership concentration and
thereby reduces the risk premium demanded by controlling shareholders. At the same time, it
favors the participation of minority shareholders (see Giannetti 2002a), which also contributes
to reducing the cost of capital or the severity of equity rationing.
However, much more remains to be done with microeconomic data in this research area.
For example, these data could be used to test the prediction that financial development should
have differential effects across firms of different size.5 Larger businesses typically have
access to international capital markets, and therefore are little affected by local financial
conditions; conversely, the latter constrain small businesses severely. This point is
particularly relevant when assessing the effects of financial market integration across
countries with different firm-size distributions.6
5 Beck et al (2002) is a notable exception: especially small firms’ growth seems to be constrained by
firm reported financial, legal, and corruption problems.6 To our knowledge, so far Guiso, Sapienza and Zingales (2002) is the only study that examines the
differential effects of financial development for different firm size classes using micro data.

25
3. Estimating the relation between finance and growth
In this section we outline our strategy to estimate the relationship between finance and
growth. This approach, which builds on Rajan and Zingales (1998), starts by identifying the
main differences in firms’ financing patterns across countries, and in particular in their
dependence on external finance, and then relates growth in value added, output and number of
firms to indicators of financial development. The analysis exploits the variability of financial
market development between countries and the variability of financial market dependence
across sectors.
The approach by Rajan and Zingales is designed for industry-level data, but can also be
applied to firm-level data. The results are reported in Sections 4 and 6, respectively. To
illustrate the approach, consider an international database of industry-level (or firm-level)
data, and denote the growth rate of value added (or output and number of firms) by yi,c where i
identifies the industry (or the firm) and c the country. This variable is regressed on a set of
variables Xi,c that vary both across industries and countries, on an indicator of financial
dependence Di multiplied by an indicator of financial development Fc (for instance, stock
market capitalization or bank credit scaled by GDP), on industry-level fixed effects ai
(i=1,…,N) and country-level fixed effects �c (c=1,…,C):
cicicici FDXy ���� ���� ,, (1)
As explained in Section 2.3.2, the financial dependence measure Di measures each industry’s
need for external finance from U.S. firm-level data. The assumption is that access to financial
markets in U.S. listed firms is not an obstacle to investment, so that differences across firms
in reliance to external finance reflect primarily differences in demand triggered by differences
in technology. Therefore, the methodology rests on the assumption that technology, and
therefore capital requirements, varies across industries but not across countries. For instance,
the capital-intensity of steel production is assumed to be the same in the U.S. and India. This
assumption may be questioned because technology and (perhaps more importantly) factor
prices and hence the optimal factor mix may differ across countries. The only way to account
seriously for this problem is to have information on technology across countries and the
relation between the latter and the needs for external finance, and to estimate our equation

26
allowing for differences between developed and developing countries. This is obviously a
formidable task in terms of data requirements. One way to deal with the problem, however, is
to check the robustness of the results by dropping from the sample developing countries or
dummying them out.
An additional reason to distinguish between developing and developed countries is that
their degree of integration in the world capital markets is likely to be different, leading to
different values of the parameter � for the two groups (growth might be less sensitive to
domestic financial constraints in countries with better access to world capital markets).
Therefore, in estimating equation (1) we will test if the parameters are the same for developed
and developing countries.
Since industry (or firm) performance and measures of financial market development
may be driven by common factors (e.g., consumer demand), in estimating equation (1) one
faces a potential endogeneity problem. As we shall see, this problem can be handled by
instrumental variables (IV) estimation, using measures of creditor rights, legal origin of the
country and the quality of law enforcement as instruments. These instruments have been used
before in cross-sectional studies to capture the exogenous component of financial
development. In fact, an extensive literature on law and finance argues that the type of legal
system determines institution performance and, in particular, the size and efficiency of
financial markets.
Equation (1) is particularly well suited to study the effects of financial integration over
time and across countries.
First, it allows testing for the presence of financial integration over a specific time
interval. If all countries examined were fully integrated, then national (or local) financial
development should not matter for the growth of national firms, whatever their dependence on
external finance. In a fully integrated area, firms that are financially constrained at home
would simply borrow abroad (where funds are more easily available), implying that the
estimated parameter �̂ would not be statistically different from zero. Similarly, if one finds
that after a period of financial market integration �̂ declines, the extent of the decline can be
interpreted as reflecting financial integration. We exploit this feature to test whether the
27
process of financial integration in the 1990s has weakened the effects of domestic financial
development on domestic growth.7
Second, the approach can be used to assess the differential impact of financial
integration, because it allows us to identify the countries and sectors that are more likely to
benefit from financial integration. We can therefore rank countries in terms of relative gains
in economic growth from financial integration. Since we assume that financial integration
spurs financial development particularly in the most backward markets, its benefits will be
concentrated in these markets. Moreover, it will affect disproportionately the sectors where a
larger fraction of firms depend on external finance.
In particular, the product of the estimated coefficient �̂ and the interaction between
financial dependence and access to finance, i.e. the variable ciD ,�̂ , provides an indication of
the potential impact of changes in the degree of financial development of the various
countries of the EU. This impact depends on their industrial composition, on the assumed
degree of financial integration and on the assumed “target” of the integration process. Clearly,
the countries bound to gain more from financial integration and development are those with
backward financial markets that specialize in sectors that rely heavily on external finance. At
the other side of the spectrum, countries that are likely to gain little from financial market
integration are those that have already developed financial markets and that specialize in
sectors that do not require extensive use of external finance.
This methodology cannot, however, be used to test if the growth effects of financial
development are permanent or transitory (i.e. whether they affect only transitional dynamics
or steady state growth), since regression (1) is estimated on cross-sectional data. Our approach
exploits only the cross-sectional variation in the growth rates (the dependent variable) and in
the degree of financial development and of financial dependence (two of the dependent
variables). To assess the degree of persistence of the estimated effects, one would need to
exploit also the time-series variation of growth and financial development, using panel data
techniques. But this gain would come at the cost of much more severe endogeneity problems
in the measures of financial development. Furthermore, sorting out the transitory effects of
financial development on growth from its permanent effects would require several decades of
7 Needless to say, the reverse is not true. A finding that � is not statistically different from zero does
not imply that there is full financial integration, but only that finance does not matter for growth. Itis therefore important to estimate equation (1) in periods in which international financial markets are

28
data on economic performance with significant episodes of financial development: this would
allow comparing economies across steady states and avoid confounding slow transitional
dynamics with permanent effects. Such a data set has not yet been assembled. However, the
finding that differences in financial development across countries at a point in time affect
their average growth rate over many years leads at least to the conclusion that financial
development has persistent effects.
segmented. We run our basic regressions on data prior to 1991, i.e. before the EU lifted capitalcontrols and started the process of full financial integration.
29
4. Industry-level data and results
In this section we apply the approach illustrated in Section 3 to industry-level
international data. We start by describing the data, and then report and discuss the estimates.
4.1 Data
We merge four different data sets: (1) industry-level data on financial dependence; (2)
country-level data on financial development and other indicators of the quality of institutions;
(3) industry-level panel data on output, value added growth and number of firms; (4) country-
level data on institutional variables that are likely to affect financial development. This
section describes the sources and main features of these data sets.
4.1.1 External dependence
Data on external dependence are taken from Rajan and Zingales (1998), who measure
the dependence of US industries on external finance using the Compustat database. The
external dependence of industry j is the share of capital expenditure that the median firm in
the industry cannot finance through internal cash flow. The assumption is that for
technological reasons (such as the completion period of an investment project, its refinancing
needs, the distribution of cash flows over the lifetime of the project) some industries depend
on external finance more than others. Rajan and Zingales note that where financial markets
are well developed, as in the U.S., the supply of funds is very elastic, so that the use of
external finance reflects primarily the demand for finance, rather than its supply. Hence, the
identifying assumption is that differences across industries in financial dependence are mainly
dictated by technological differences. In addition, it is assumed that these technology-dictated
differences in financial dependence are the same in all countries. Therefore, the financial
dependence of industries in countries with well-developed financial markets (the U.S.) can be
used as an indicator of the financial dependence of the same industries also in other
countries.8
8 See Section 3 for a brief discussion of this assumption and of a way to take its limitations into
account.
30
The Compustat database used to construct the indicator of financial dependence
includes only publicly listed firms, but this is an advantage since these firms are less likely to
be constrained in capital markets. To avoid biasing the measure of financial dependence with
business cycle factors, the indicator is averaged over the 1980-90 period. Table 1 reports this
measure of external dependence for 36 three or four digits ISIC sectors. The Drug, Radio and
Plastic Products industries are the most dependent on external finance. On the other hand,
Footwear, Leather and Tobacco do not rely on external finance to invest, implying that the
indicator is negative.9
4.1.2 Financial development
Data on financial development are drawn from the database provided with the book by
Demirgüç-Kunt and Levine (2001). In Chapter 2 of the same book, Beck, Demirgüç-Kunt,
Levine and Maksimovic (2001) define three sets of indicators of financial intermediary and
stock market developments: (1) finance-activity indicators; (2) finance-size indicators; and (3)
finance-structure indicators. Finance-activity indicators refer to the overall activity of
financial intermediaries and markets, which can be measured by private credit (claims on the
private sector by deposit money banks and other financial institutions) divided by GDP, or
value traded (total value of shares traded on the stock market) and stock market capitalization
divided by GDP. Finance-size indicators are intended to measure the overall size of the
financial sector, and can be measured by the sum of private credit and stock market
capitalization. Finally, finance-efficiency indicators relate to the efficiency of financial
intermediaries and markets, and can be proxied by the overhead costs of the banking system
relative to the banking system assets, insofar as large overhead costs reflect inefficiency.
In principle, none of these indicators is superior to the others: they can rather be
regarded as complementary. In order to make our results more easily comparable with the
existing empirical literature on growth and finance, in this study we rely mainly on finance-
activity and finance-size indicators. As explained in Section 2.1, efficiency measures have
ambiguous effects on growth. For instance, this applies to efficiency measures based on the
9 The index of financial dependence is defined as capital expenditures minus net cash flow from
operations, all scaled by capital expenditures. Therefore, it can be negative for firms whose internalcash flow exceeds funding needs, indicating that they require no external funding. It can also exceedunity, for firms whose net cash flow is negative because of large investments in working capital.
31
degree of credit market competition. While a highly concentrated commercial banking
industry may limit competition and thus the overall efficient supply of funds to investors, a
highly fragmented market might result in undercapitalized banks that are unable to exploit
economies of scale. This may lead to a higher cost of loans and/or lower compensation of
deposits, and thus to lower investment. Furthermore, empirically, Demirgüç-Kunt and Levine
(2001) find that finance-activity and finance-size indicators are superior indicators of financial
development than efficiency indicators.
As we shall see, the indicators of financial development that contribute most to the
growth in output and value added are: (i) the ratio of stock market capitalization to GDP; (ii)
the ratio of private credit to GDP; and (iii) the sum of the two ratios. In our preferred
specification we use the latter indicator as an overall measure of financial development.
In some specifications we also proxy financial development by an indicator of the
“quality of accounting standards”, produced by International Accounting and Auditing Trends
(Center for International Financial Analysis & Research, Inc.). This indicator rates
companies’ 1990 annual reports on the basis of their inclusion or omission of 90 items in the
balance sheets and income statements, and ranges from 0 to 90. The 90 items are classified
along 7 general dimensions: general information, income statements, balance sheets, funds
flow statement, accounting standards, stock data and special items.
Table 2 reports the ratio of stock market capitalization to GDP, the ratio of private credit
to GDP, and accounting standards for each of the 60 countries that we include in our analysis.
The figures in the first two columns are 1980-1995 averages, while those in the third column
refer to 1990.10
4.1.3 Value added, output, and number of firms
Growth – our dependent variable – is measured as the growth of value added, output or
number of firms. These series are drawn from the Industrial Statistics Database (revision 2),
which is produced by the United Nations Statistical Division (UNIDO) and covers 169
countries. To match industrial sector definitions with those for the sectors for which we have
data on external dependence, we use both 3- and 4-digits ISIC codes. The 3-digits data span
10 The three variables are, respectively, the variables mcap, privo and account contained in the file
request80-95.xls in the CD-Rom attached to Demirgüç-Kunt and Levine (2001).

32
the 1963-99 period, while 4-digit data run from 1977 to 1999. The final sample includes data
for 36 manufacturing industries, of which 27 are 3-digits and 9 are 4-digits.
The sample has data on the number of establishments, number of employees, value
added, output, gross capital formation, wages and number of females working. Value added,
output and gross capital formation are first expressed in U.S. dollars, and then converted in
real figures using the U.S. Producer Price Index deflator.11 In our basic specification we
compute the growth rate of real value added, output and number of firms as the difference of
(log) real value added, output and number of firms in 1991 and 1981, respectively.
Since indicators of financial development or other institutional variables are not
available in many countries, we use only 61 of the 169 countries present in the database.
Overall, the resulting sample is a panel dataset of 36 industries in 61 countries, resulting in a
total of 2,196 observations per year. However, observations on some industries are lost due to
missing data on output, value added, or other variables used in the regressions, reducing
somewhat the final size of the sample used in estimation.
4.1.4. Institutional variables and other instruments
It is very hard to classify legal institutions and compress their description in quantitative
indicators that are the essential input to statistical analysis. Legal systems and their actual
working are highly complex and multi-dimensional mechanisms, and it is a quite daring
exercise to attempt eschewing their “key features” and describe them via quantitative
indicators. Often even lawyers consider this task as impossible. Nevertheless, economists
have designed such indicators, and used them to account for the cross-country variation in the
development of financial markets (as well as in other empirical work).
One such attempt was made by La Porta et al. (1998), who constructed measures of
creditor rights and of shareholder rights by collecting information on some characteristics of
the legal system in 49 countries. To characterize the degree of creditor rights protection, they
identify five features of the legal rules governing loan contracts, by asking if: (i)
reorganization procedures require an automatic stay on the borrower’s assets, preventing
secured creditors from seizing collateral; (ii) the secured creditors’ right to seize collateral is
junior relative to those of the government and workers; (iii) management can obtain
33
protection from creditors by starting a reorganization procedure without creditors’ consent;
(iv) management remains in charge during reorganization procedures; (v) firms must maintain
a minimum capital to avoid automatic liquidation. Depending on how it fares on each of the
first four criteria, each country receives a certain total score, which measures its degree of
creditor rights protection, or “creditor rights” variable.
The same authors use a similar method to construct an international measure of the
protection of shareholder rights. The “antidirector rights” indicator they devise is the sum of
six dummy variables, indicating (i) if proxy by mail is allowed; (ii) if shares are not blocked
before a shareholder meeting, (iii) if cumulative voting for directors is allowed, (iv) if
oppressed minorities are protected, (v) if the percentage of share capital required to call an
extraordinary shareholder meeting is less than 10 percent, and (vi) if existing shareholders
have pre-emptive rights at new equity offerings.12
We rely also on several survey-based indicators to measure the quality of legal
enforcement across countries, available in Demirgüç-Kunt and Levine (2001). The variable
“rule of law”, which is an “evaluation of the legal and order tradition in the country”, ranges
from 1 (weak law and order tradition) to 10 (strong law and order tradition) and is published
by the International Country Risk Guide (ICRG). We use the average of the 1982-95 values.
The same rating agency (ICR) produces other institutional variables used in our analysis:
“corruption”, which assesses the degree of corruption in the government; “risk of contract
repudiation by the government”, an evaluation of the “risk of a modification in a contract
taking the form of a repudiation, postponement or scaling down” due to “budget cutbacks,
indigenization pressure, a change in the government, or a change in government economic
and social objectives”; and “risk of expropriation”, a measure that reflects ICR’s evaluation of
the risk of “outright confiscation” or forced nationalization.
Another country-risk rating agency, Business International Corporation, produces a
“judicial efficiency” indicator, which is a survey-based assessment of the “efficiency and
11 The latter is downloaded from the Federal Reserve Bank of Saint Louis web site
(http://www.stls.frb.org/fred/).12 The “antidirector rights” measure by La Porta et al. (1998) was inspired by the U.S. Proxy VotingManual of Institutional Shareholder Services (I.S.S.), that contains a long list of shareholder rightsU.S. institutional investors consider crucial at U.S. companies. Some of these rights do not translatewell into the European context (for example blocking is necessary with bearer shares to protectminorities) and an alternative measure based on DSW (2000) will be devised that is more in line withthe institutional settings of the European Union.
34
integrity of the legal environment as it affects business, particularly foreign firms.” “Legal
origin”, built by La Porta et al. (1998), classifies countries in four groups, depending on
whether the origin of their legal system is Anglo-Saxon, French, German or Scandinavian.
Finally, in some regressions we use average years of schooling and per capita GDP as
additional regressors. Average years of schooling in the total population over 25 in 1980 is
drawn form Barro and Lee (1996). Real GDP per capita in 1980 is from Alan Heston, Robert
Summers and Bettina Aten, Penn World Table Version 6.0, Center for International
Comparisons at the University of Pennsylvania (CICUP), December 2001. These variables
are reported in Table 3, together with the creditor rights and rule of law indicators.
4.2 Regression results
Table 4 reports regressions for the growth of value added. The upper panel considers the
same sample of 41 countries as in Rajan and Zingales. We adopt a slightly more restrictive
choice for including sectors in the industry panel, since we retain observations only if output
or value added are reported for each year between 1981 and 1991.13 This results in a slightly
lower number of observations than Rajan and Zingales (around 1,100 against around 1,200).
Sensitivity analysis shows that this choice makes very little difference. In fact, the results do
not change if we use the 1980-95 growth rates. However, in this case the number of missing
sectors increases, so we focus on the 1981-91 growth rates. The United States is excluded
from the sample because it is the reference country whose capital markets are assumed to be
frictionless.
The estimation includes fixed industry effects and fixed country effects, which control
for all time-invariant country and industry variables that are potentially important for growth.
This is a considerable advantage in specification choice, since it would be very difficult to
13 Rajan and Zingales retain also observations for sectors with no less than 5 years of data.

35
account explicitly for all such variables in the regression. Inevitably, some variables would be
omitted due to erroneous specification or lack of information.14
All regressions include the industry’s share of total value added at the beginning of the
sample period (1981), and in all regressions the standard errors of the coefficient estimates are
robust to unknown forms of heteroskedasticity.
The regression in the first column of the upper panel uses stock market capitalization as
proxy for financial development. The estimated coefficients refer to a regression of the
growth of value added on the relevant industry’s initial share of value added and the
interaction between external dependence and market capitalization (the DiFc variable in
equation 1). The coefficient of the interaction term is positive and statistically different from
zero at the 1-percent level, indicating that financial development affects growth, particularly
in those sectors that rely more intensively on external finance.
The second regression replaces market capitalization with domestic private credit. The
results are similar: the coefficient of the interaction term is again positive and precisely
estimated. The regression reported in the third column uses our preferred indicator of
financial development, namely the sum of stock market capitalization and private credit,
which we call “total finance”. In the fourth regression, external dependence is interacted with
accounting standards. In each of these regressions the impact of financial development on
value added growth is positive and statistically different from zero at the 1-percent level.
The specification reported in the last column includes also an interaction term designed
to test if the effect of financial development is larger for non-OECD countries. This
hypothesis reflects the concern that OECD countries may already be much more closely
integrated in a single capital market than developing countries, and that therefore the effect of
financial development estimated in the previous regressions may apply only to the latter (in a
financially integrated area the coefficient on the interaction term including the financial
dependence indicator should be zero). However, this concern appears to be unwarranted. The
coefficient of the interaction term is almost identical as that in the third column (0.018 instead
of 0.019), while it should be zero in a financially integrated area. Correspondingly, the
14 When interpreting and simulating the effects of financial integration on economic growth it is
important to remember that the presence of country fixed effects might attenuate the coefficientestimate of financial development on growth. Suppose that financial development affects growthalso through different channels than relaxing financial dependence, for instance because countrieswith larger financial markets are also able to allocate funds more cheaply, regardless of the financial
36
coefficient of the same variable interacted with the non-OECD dummy is very small (0.001)
and not statistically different from zero.
We also experimented with other specifications – not reported for brevity – to test if
other subsets of countries are more closely financially integrated than the rest of the world. In
a specification that includes a further interaction term between DiFc and a dummy for the EU,
the coefficient on this variable is not statistically different from zero, indicating that the EU is
not more financially integrated than the rest of the world. We also estimated a specification
that includes a variable that interacts DiFc with a measure of trade openness (also drawn from
Demirgüç-Kunt and Levine, 2001), on the grounds that close trade partners may also be more
closely integrated financially. Also the coefficient on this further interaction variable is not
significantly different from zero. These results parallel those by Edison, Levine, Ricci and
Slok (2002), mentioned in Section 2.3.1. As in their estimates, proxies for international
financial integration appear not to affect growth, once one controls for domestic financial
development. One can interpret this as indicating that so far financial integration enhanced
growth only insofar as it improved domestic capital markets. Alternatively, it may indicate
that the financial market integration that has thus far taken place is still insufficient to show
up significantly in the data.
In the lower panel of Table 4 we use the maximum number of countries with valid data
on value added growth and indicators of financial development. The data collected by
Demirgüç-Kunt and Levine (2001) allow us to consider 20 additional countries with respect
to the Rajan-Zingales sample. Expanding the sample in this direction is quite important in the
present context, because the Rajan-Zingales sample does not include Ireland. Except for
Luxembourg, which we drop because the development of its financial sector is statistically
anomalous, we have therefore all EU countries in our sample.
Expanding the set of countries, besides increasing the precision of the estimates, also
increases the size of the coefficient of the interaction term between financial dependence and
financial development by one third. One rationale for this result is that, compared to the
sample used by Rajan and Zingales, the extended sample includes several countries that are
even less financially integrated with the rest of the world economy, thus making national
dependence of each particular industry. Country fixed effects will pick up these and other country-specific effects that do not operate by relaxing financial dependence.
37
financial development even more important for domestic growth.15 Despite the additional
countries, the effect of financial development in non-OECD countries is not statistically
different than that of OECD countries, as shown by the results reported in the last column of
the lower panel.
In Table 5 we report regressions for output growth. The structure of the table is the
same as Table 4. The upper panel refers to the Rajan-Zingales sample, and the lower panel to
the extended sample. For each sample we report five regressions, as in Table 4. The first four
specifications include interactions of external dependence with market capitalization, private
credit, the sum of the two, and accounting standards. The results confirm that financial
development promotes industry growth, since the coefficient of the interaction term is always
positive and statistically different from zero. The last column tests if the degree of financial
integration is the same inside or outside the OECD. Again, this hypothesis is not rejected.
In Table 6 we turn to regressions for the number of firms. In this case, the coefficient of
stock market capitalization is positive but not statistically different from zero. However, when
we interact external dependence with private credit, with the sum of stock market
capitalization and private credit, or with accounting standards, we find that financial
development exerts a positive impact on the growth of the number of firms.
In Table 7 the dependent variable is replaced with investment as a share of output for
each industry. The results for investment are not as strong as those reported so far. Most of
the coefficients are imprecisely estimated, and the overall fit of the regression is consistently
below that for other variables, probably a reflection of the greater volatility of investment or
its mismeasurement. In fact, the relevant left-hand side variable should be investment as a
share of the beginning-of-period net capital stock, rather than the investment-output ratio, but
unfortunately we have no data for the capital stock. The coefficient on the interaction term is
always positive, but it is statistically different from zero (at the 5-percent level) only when the
proxy for financial development is “total finance”.
As highlighted in Section 2, each of the three indicators of financial development is
potentially endogenous: economic growth may be driving stock market capitalization, bank
credit and the sum of the two, rather then the reverse. Furthermore, there might be other
15 The additional countries are Barbados, Bolivia, Cote d’Ivoire, Cyprus, Ecuador, Fiji, Honduras,Iceland, Indonesia, Iran, Ireland, Jamaica, Kuwait, Mauritius, Nigeria, Panama, Swaziland, Trinidadand Tobago, Tunisia and Uruguay.
38
determinants of manufacturing industry growth that are correlated with our indicator of
financial development. It is therefore important to check the sensitivity of our results to the
potential endogeneity of financial development and to the inclusion of additional regressors.
Accordingly, Table 8 displays the coefficient estimates of instrumental variable
regressions. For comparison with previous results, the first column replicates the OLS
estimates for the growth of value added using total finance (scaled by GDP) to measure
financial development. The second regression reports the IV estimates. The instruments are
institutional variables that affect financial development but are predetermined with respect to
economic growth over the time span covered by our data: legal origin of the country, rule of
law, and creditor rights. The coefficient of the interaction term increases in value (from 0.023
to 0.033) and retains its statistical significance, indicating that the potential endogeneity of
financial development is not an issue in our data.
The third regression in the upper panel of Table 8 adds to the set of right-hand-side
variables the interaction of schooling and initial per capita GDP with external financial
dependence. The empirical growth literature shows that schooling and initial GDP per capita
affect growth rates. Furthermore, they may influence the effect of financial development on
growth: an increased availability of external finance may have a larger growth impact in
countries with higher human capital endowment and higher level of economic development
(approximated by GDP per capita). Also this regression is estimated with instrumental
variables, using the same set of instruments as in the second column. The results are
qualitatively unchanged: the coefficients of the additional interaction terms are not
significantly different from zero.
The other three panels report several sensitivity tests for output growth and growth in
the number of firms on the extended sample. In each of these panels the first column reports
the OLS estimates already shown in Tables 5 and 6 using total finance; the second column the
IV estimates and the third the IV estimates with additional regressors. In the output growth
regressions the coefficient of the interaction term of external dependence and financial
development is positive and statistically different from zero at the 1-percent level, even using
instrumental variables or including schooling and per capita GDP among the regressors. In the
regression for the number of firms, the coefficient is positive and statistically different from
zero in the IV regression, and remains positive when we add other controls, though it is less
precisely estimated. Also for investment, IV estimates are not dissimilar from OLS ones.
39
Overall, these results indicate that financial development affects growth, even taking
into account the potential endogeneity of financial development and the potential impact of
human capital and per capita GDP.
In the present framework, a positive effect of financial development on industry and
country growth implies less than full financial market integration. If the world were fully
integrated (even if financially under-developed), domestic financial development would have
no effect on local growth. Therefore our results suggest that, as of 1991, geographical
segmentation was still effective, and financial markets were poorly integrated.
Did financial integration progress over the 1990s? Asking this question is important,
because the 1990s witnessed a considerable increase in international capital mobility,
removals of barriers and exchange controls, and harmonization of financial regulation. If
increased integration already weakened the link between domestic financial development and
national growth, the benefits from additional integration would be overstated by 1991 data.
To check the sensitivity of our findings to the particular sample used, in Table 9 we
report estimates obtained extending our sample up to 1995, the most recent year with
sufficient observations provided by the UNIDO data set. As in the previous tables, the first
column displays the OLS estimates, the second the IV estimates, and the third checks the
robustness with respect to the inclusion of additional variables. The estimated coefficients of
the interaction term between financial development and external dependence indicate that the
effect of financial development on value added or output growth is similar to the previous set
of estimates. This suggests that whatever integration took place in the first half of the 1990s
was partial or has not yet produced its effects on growth.
40
5. Assessing the impact of financial integration on growth
The estimates discussed in Section 4 can be used to evaluate the effect of financial
integration on economic performance and how benefits from integration will be distributed
among the integrating countries. To assess the impact of financial integration on the growth
rate of value added and output, we construct two different scenarios.
In the first scenario, we assume that financial integration in the EU will be associated
with the same level of financial development of the United States. We consider the U.S. as
a valid benchmark, being a highly developed and continent-wide financial market, probably
not dissimilar from what an integrated European financial market might look like. In the U.S.
the most comprehensive indicator of financial market size, i.e. the sum of stock market
capitalization and total private credit scaled by GDP, is 2.09, higher than that of any EU
country, though not far from the corresponding values for the most financially developed EU
countries (the score for Sweden, the U.K. and the Netherlands being 1.47, 1.50 and 1.69
respectively). In fact, the approach by Rajan and Zingales (1998) takes the U.S. as the
benchmark of a frictionless capital market. Also the size of the U.S. economy is comparable
to that of the EU taken as an integrated market. At the beginning of 2001, the U.S. population
was 278 million, as opposed to 377 million in the 15 EU countries; in 2000, the U.S. GDP
was € 10,709 billion against a total EU-15 GDP of € 8,524 billion at current prices.16
It should be stressed that the results of this scenario are similar to those obtained from a
slightly less optimistic scenario where the level of financial development of all EU countries
is raised to the level of financial development of the U.K. or the Netherlands. In particular, the
ranking of the simulated impacts by countries and sectors would not be affected by
considering raising financial development to the British or Dutch standards.
Even more importantly, it must be noted that assuming that all EU countries reach the
same level of financial development as the U.S. does not correspond to a hypothetical (and
unrealistic) situation where each EU country achieves the same stock market
capitalization/GDP ratio or the same private credit/GDP ratio as the U.S. Rather, it is intended
to capture a situation where any EU company, wherever it is located, would have the same
access to stock market financing and to bank credit as its U.S. counterparts. This may well
16 Source: Eurostat.
41
happen not as a result of its domestic capital market development, but rather as a result of
their improved access to other EU financial markets, that is, by raising equity or credit in
other EU countries, as explained in Section 2.2.2.
In the second scenario we recognize that financial development is the result of both
spontaneous market developments and variables that change as a consequence of economic
reform and policy action. Thus, the second scenario posits that policy actions by national and
EU legislators will bring the institutional determinants of financial development to the
highest EU standard. Then we predict their impact on financial development from a first-
stage cross-country regression of financial development on its institutional determinants.
Finally, we use the predicted value of financial development to evaluate the effect of financial
integration on the growth of EU countries.
To illustrate the simulation methodology for the first scenario, suppose one wants to
simulate the impact of raising financial development in country c to the U.S. value, as
measured by, say, the ratio of stock market capitalization to GDP.
We multiply the estimated coefficient �̂ by the difference between the degree of stock
market development in the U.S., denoted by usF , and that in country c, denoted by cF
(obviously usc FF � ), taking into account industry dependence on external finance. That is,
we estimate the impact of raising financial development to the U.S. level for sector i in
country c as follows:
)(ˆ cusi FFD ���� (2)
Clearly, for any given sector i, the countries whose growth benefits most from
integration are those with the largest financial development gap, cus FF � . Similarly, for any
given country gap, the sectors whose growth gains most from integration are those with the
highest dependence on external finance. The impact on a country’s growth rate will therefore
depend both on its financial development gap and on its industrial specialization.17
17 In simulating the impact of financial integration on economic growth we assume that financial
development does not alter the industrial specialization of the country. As noticed in Section 2,Svaleryd and Vlachos (2002) show that countries with better financial institutions tend to specializein sectors that rely intensively on financial institutions, implying that the sector weights tend tomove towards more financially dependent industries as the country progresses in financialdevelopment. Accounting for this extra link would further increase the benefits from financialintegration.
42
Finally, to summarize the benefits of financial integration we compute weighted
averages of the expression above for any country or sector, where the weights are the value
added shares in the relevant sector or country. More precisely, denoting by icx the value
added of sector i in country c, we compute the:
����
�
��
����
�� i cusi
i ci
ci FFDx
xc )(ˆcountry ofgrowth on theimpact
,
,� , (3)
����
�
���
��
� c cusi
c ci
ci FFDx
xi )(ˆsector ofgrowth on theimpact
,
,� , (4)
, ,
, ,ˆimpact on EU growth ( )i c i ci
i us cc ii c i ci c i
x xD F F
x x�
� �� ��� �� � � � � � ��
� � � �� �� �� �, (5)
where expression (5) is the estimated effect on the growth rate of all sectors and all EU
countries.
The exercise provides an estimate of the potential impact of raising financial
development to the US level (or, for that matter, to any other standard) for any country and
sector. It is worthwhile noticing that the expressions (3), (4) and (5) estimate the increase in
growth in country c, in sector i or in the EU that could be achieved from raising financial
development to the U.S. level. Alternatively, it can be considered as the growth in country c,
in sector i or in the EU that is currently forgone as a result of financial market imperfections.
As explained in Section 3, the cross-sectional nature of our estimation approach does not
allow us to predict whether this increase in growth is permanent or transitory.
5.1. Raising financial development in the EU
We estimate the impact of financial integration on country and industry growth of both
value added and output raising our indicator of financial development to the US standard. The
computation of the growth effect of financial integration is obtained using the coefficient
estimates of the instrumental variable regressions in the last column of Table 8, first two
panels. Averaging over all countries and sectors, the estimated impact of financial integration
on the growth of value added in the EU as a whole (expression (5)) amounts to 0.94
43
percentage points per year. The corresponding figure for output growth is 0.92 percentage
points, not statistically different from 0.94.
This overall impact, however, underlies considerable diversity in country and sector
growth, reflecting both the degree of financial backwardness (more backward countries gain
more) as well as the sector specialization (countries that specialize in financially dependent
sectors gain more).
Figure 1 reports the increase in the growth rate of value added by country. The effects
are similar if growth is measured by value added or output. The figure shows considerable
country dispersion in the growth effect of financial integration. In a first group of countries,
growth increases substantially by 1 percent per year or more: Belgium, Denmark, Finland,
Germany, Greece, Ireland, Italy, Portugal and Spain. In other countries, growth increases by
less than 1 percent per year: Austria, France, and in particular the Netherlands, Sweden and
the UK. It is interesting to note that even the first group includes some countries from
Northern Europe. And even in the second group there are several countries whose growth
increases considerably (Austria and France). Predictably, the only ones who do not gain much
are the most financially developed countries, that is, the Netherlands, Sweden and the U.K.
Figure 2 plots the growth effect of the 9 industries that are expected to contribute more
to European total growth (to make the graph more readable we focus on 9 industries only).
There is again some similarity between the impact of financial integration on output and value
added growth at the sector level. As with country growth, the total effect reflects (i) the
degree of financial dependence of the industry and (ii) the weight of highly financially
dependent industries in the industrial structure of financially backward countries. The
dispersion by industry is larger than the dispersion by country. In all the sectors reported in
Figure 2 growth increases by over 1 percentage point. And in some industries – notably
Drugs, Plastic Products and Professional Goods – the additional growth effect exceeds 3
percent per year (obviously, for some of the industries the effect is negligible).
The main conclusion from this exercise is that the potential growth benefits of
financial integration are considerable both at the country and the industry level, and that
they are not evenly distributed across countries and across sectors.
44
5.2. Improving the institutional determinants of financial development in the EU
It can be argued that the previous estimates tend to exaggerate the growth benefits of
policy actions aimed at promoting financial markets integration because financial integration
in not under complete control of policy makers but depends also on spontaneous market
developments. In other words, the previous experiment implicitly assumes that domestic
financial development is a control variable.
In this section, we simulate the growth effects of letting the determinants of financial
developments that are under policy control converge to the highest European standard. To
perform this exercise, we first regress our measure of total financial development on a set of
policy-controlled variables that literature has shown to be relevant for financial markets
efficiency.18 We assume that financial integration leads all integrating countries to adopt the
highest value of these determinants in the EU. We then predict the implied value of financial
development in each sector and country. Finally, we proceed as in the previous scenario to
compute the growth effects. We focus on three (policy-controlled) determinants of financial
development: the quality of accounting standards, the degree of creditors protection and the
rule of law.
The simulation clearly requires a regression relating financial development to its
institutional determinants as an intermediate input. This is done in Table 10, which reports the
results of the regression of financial development on accounting standards, creditor
protection, rule of law and dummies for the country’s legal origin (the latter variable is not
under policy control). Accounting standards and rule of law appear as the two most effective
variables in predicting financial development.19
18 In practice, this is the first-stage regression of our IV procedure with the omission of per capita GDP
and schooling.19 The regression is robust to the presence of influential values. We run an OLS regression, computethe Cook’s distance and exclude any observation for which the Cook’s distance is greater than 1. Afterexcluding potentially influential outliers, we proceed in two steps. We run iteratively least squaresregressions weighting the observations with Huber weights. After convergence is reached we constructbiweights with which we re-weight the observations. We finally run iteratively least squares untilconvergence is reached. Using a LAD regression we get similar results.
45
Figure 3 shows the effects on country growth when the three determinants of financial
development are simultaneously set at the maximum level within the EU countries. With
respect to the previous scenario there are some noteworthy differences.
First, as one would expect, the growth effects are smaller than when financial
development is raised to the U.S. standards. Averaging over all European countries and
sectors, growth of value added increases by 0.75 percentage points (down by 0.19 percentage
points with respect to the first scenario), and output growth increases by 0.74 percentage
points (down by 0.18 points).
Second, the two countries that gain most in terms of growth are Greece and Portugal.
Third, in this experiment even the Netherlands benefits approximately as much as Italy,
France, Germany and Spain. The group of countries that benefit the least now includes (in
decreasing order) Belgium, Austria, Denmark, Finland, the U.K. and Sweden. The fact that
the U.K. and Scandinavian countries gain the least in this simulation reflects the fact that their
regulatory framework and its effectiveness are already quite high.
Figure 4 shows the effects on the nine sectors that contribute most to the European
growth rate. Raising the institutional determinants of financial development, rather than in
financial development itself, reduces the absolute size of the effects only sligthly. The reason
is that the countries that would benefit most from the regulatory improvements are also those
where financial development is more limited.
Figures 5, 6 and 7 show the impact on countries growth when the three determinants of
financial development are modified once at a time. This experiment is of interest for two
reasons. First, it highlights which institutional variable is likely to have the largest growth
impact. Second, there are reasons to believe that some of the determinants of financial
development are easier to change than others. For instance, it might be easier to improve
accounting standards rather than to raise the rule of law, which may require deeper reforms in
each country.
The main message that emerges from Figures 5, 6 and 7 is that raising accounting
standards to the maximum EU levels is far more important than raising the degree of
creditors' protection and, even more so, modifying the rule of law. Again, Southern or Central
European countries appear to gain more than Nordic countries and the UK.
46
6. Firm-level data and results
In this section we apply the approach laid out in Section 3 to a large international panel
of firm-level data for companies in EU and transition countries. There are two reasons for
extending to firm-level data the same method used for industry data. First, we can test the
robustness of the conclusions reached on the basis of industry-level data. As will be seen,
apart from the obvious difference in their level of aggregation, our firm-level data differ in
several dimensions from the industry-level data analyzed so far. They refer to a later period,
with no overlapping years, spanning 1996-2001, while the UNIDO industry-level data cover
the 1981-95 period. Moreover, they refer to a partly different set of countries. They do not
include non-European countries, but include most former socialist European economies, none
of which was present in the industry-level data. The EU countries form the only intersection
between the two data sets.
A second reason for using firm-level data is that they allow us to check whether
financial development affects differentially firms belonging to different size classes, and not
only to different industries. Finding differences in the effect of financial dependence on firm’s
growth according to size would strengthen further the causal interpretation of our regressions.
Theoretically, we do not expect all firms to be equally affected by local financial
development. Larger firms can more easily tap markets far from their main headquarters.
Therefore, if finance affects growth we expect the effect of local financial development to be
mostly concentrated among small firms.
6.1. Data
We draw firm-level data for employees, sales, and value added from the Amadeus Top
200,000 company database of Bureau Van Dijck. Due to missing values, changes in the
definitions and our choice to focus only on the manufacturing sector, the number of firms for
which observations can be used is reduced to 70,679 firms.
The maximum interval for which data are observed for a firm is 1996-2001, but for
many firms the time interval over which data are available is shorter. Thus, the average
growth rates for each individual firm are computed using the available sample for each firm,
and are therefore estimated with different number of observations. Of course, the shorter the
47
time interval over which the averages are computed, the more precisely the average is
measured. But the resulting data set is a cross-section, and the asymptotic properties of the
estimates depend only on the total number of firms. The fact that growth rates may be
measured with different precision for different firms does not pose particular problems,
because the OLS estimates accommodate measurement error in the left-hand variable.
We exclude all firms for which only one observation is available for sales and value
added, since for them no growth rate can be computed.20 As in the industry level-analysis,
growth variables are merged with country-level data on indicators of financial development
and sector-level data on financial dependence.21
Table 11 shows the distribution of companies across countries, as well their average
sales growth by country, and the two basic indicators of financial development – bank credit
and stock market capitalization scaled by GDP. Iceland, Ireland, Latvia, Norway, Russian
Federation, and Slovenia are excluded from the analysis (and therefore do not appear in Table
11) because the growth rates of sales and value added are entirely missing for their firms.
Bosnia-Herzegovina and Yugoslavia (Serbia/Montenegro) are excluded because indicators of
financial development are not available. This reduces the total number of countries included
in the empirical analysis to 26.
The statistics in Table 11 show that average growth rates differ considerably depending
on whether one computes them from sales or from value added data. Also, unsurprisingly
most former socialist countries are far less financially developed than EU countries. Finally,
there are large international differences in firm size, as measured by the number of employees
of the median firm.
20 The Top 200,000 version of the Amadeus database covers European companies from the followingcountries: Austria, Belgium, Bosnia-Herzegovina, Bulgaria, Croatia, Czech Republic, Denmark,Estonia, Finland, France, Germany, Greece, Hungary, Iceland, Ireland, Italy, Latvia, Lithuania,Luxembourg, Macedonia, FYR, Netherlands, Norway, Poland, Portugal, Romania, RussianFederation, Slovak Republic, Slovenia, Spain, Sweden, Switzerland, Ukraine, United Kingdom,Yugoslavia, FR (Serbia/Montenegro). To be included in the Amadeus sample, companies must satisfythe following criteria. For the UK, Germany, France, Italy, Ukraine and Russian Federation, operatingrevenue must be at least € 15 million, total assets at least € 30 million, and the number of employeesmust be at least 150. For companies in other countries, operating revenue must be to at least 10million, total assets at least € 20 million, and the number of employees at least 100.21 The data on financial development used in the firm-level analysis are drawn from the WordDevelopment Indicators (2001), a database maintained by the World Bank, which covers 207countries and provide data from 1960. From this database, we extract the market capitalization oflisted companies and the domestic credit provided by the bank sector, both as percentage of GDP.
48
6.2. Estimation results
Table 12 reports the regressions where the dependent variable is each firm’s average
growth rate of sales over the 1996-2001 interval (or a shorter interval, as dictated by data
availability). To compute yearly growth rates, in the regressions we use only data for firms for
which at least two adjacent observations are available. As a result, the number of observations
used in the estimation is considerably lower than in Table 11. The upper panel reports the
OLS estimates with standard errors corrected for heteroskedasticity. The bottom panel shows
Least Absolute Deviation (LAD) estimates, which are robust to the presence of influential
values. The first three columns differ for the indicator of financial development in the
interaction term with external dependence: stock market capitalization, domestic credit to the
private sector, and the sum of the two. The fourth column reports a test of whether financial
development has a different growth impact in transition economies. All regressions include
country and industry fixed effects. Thus, any difference in firms growth due to differences in
common factors within countries (such as inflation) is captured by the country dummies.
The results are largely consistent with those obtained from the industry-level data and
presented in Section 4. The coefficient of the interaction term is positive and precisely
estimated in all regressions. The size of the coefficient is of the same order of magnitude as in
the industry-level estimates, especially when one considers the LAD coefficient estimates,
which are considerably smaller but also much more precise than the OLS estimates. The
estimates in the fourth column indicate that financial development does not have a different
impact in former socialist economies. The R2 of the OLS regressions is very small, due to the
presence of a large firm-specific noise that was absent in the industry data as a result of
aggregation.
In Table 13 we replace the dependent variable with the firms’ average growth of value
added. Again, the coefficient that measures the effect of financial development on growth is
positive, but in this case it is not statistically different from zero. In the value added
specifications the R2 of the OLS regressions is smaller than in the regressions for sales
growth, indicating the presence of larger noise in the micro data for this measure of growth.
This is not surprising because value added statistics from balance sheet information suffer
from differences in accounting practices and methodologies both across firms and countries,
resulting in large measurement errors and thus downward biased estimates. Differences in

49
methodologies are less of an issue with sales, which is the least ambiguous accounting
concept and the variable that is more readily comparable across countries with different
accounting standards.22
Our last test of the effect of financial development on growth is presented in Table 14.
We split the sample along the size dimension, and estimate two separate regressions,
respectively for firms above and below 200 employees. For the reasons explained above, we
report only regressions using the growth rate of sales as the dependent variable. We find that
financial development indicator (interacted with financial dependence) has a much larger
impact in the sample with small firms, regardless of the estimation method. In the OLS
regressions the effect of financial development on large firms growth does not differ
statistically from zero. In the LAD estimates it is only half the effect on small firms.
These results support the hypothesis that financial development constrains more
severely the growth of small and medium enterprises (SMEs), and therefore that financial
imperfections take a heavier toll in countries where SMEs are more prominent in the
population of firms. From Table 11, this appears to be the case in Austria, Belgium, Greece,
Italy, Spain, and Sweden, where the median firm is smaller than in the rest of the sample. As a
result, a given improvement in domestic financial development should be expected to have a
larger impact in these countries.
However, insofar as we are dealing with SMEs, one should refrain from rushing to the
conclusion that these countries will also benefit more from EU financial integration. The
effect might be attenuated, or even reversed, unless financial integration results in an
improvement in these countries’ domestic financial markets. The reason is that, as explained
in Section 2.2.3, SMEs are less likely than other firms to access foreign capital markets or
borrow from foreign banks, and therefore to reap the benefits from an integrated EU financial
market. For such companies, the assumption made in Section 5 that access to a developed EU
capital market is equivalent to access to a developed domestic capital market is less likely to
be met. Therefore, the results in Table 11 suggest that the simulations in Section 5 are likely
to overestimate the growth payoff of EU financial integration, especially for countries that
include a large proportion of SMEs.
22 Estimates using investment as dependent variable cannot be perfomed, because this variable is notavailable in the Amadeus database.

50
7. Summary and conclusions
In this concluding section we summarize the main findings of the report, and assess
their limitations and implications for the process of EU financial integration.
7.1. Summary of the results
The regression and simulation analysis based on the UNIDO industry-level data suggest
several conclusions about the effect of financial development on growth and about the likely
effects of financial integration in the EU:
1. There is still considerable dispersion in financial development across European
countries.
2. Our estimates imply that gaps in national financial development matter for economic
growth in the manufacturing sector.
3. These effects have not weakened in the early 1990s, when some financial integration
occurred, suggesting that financial development can still affect growth.
4. Simulations suggest that the potential benefits from financial integration – interpreted as
firms’ access to a financial market similar to that of the U.S. (or of the most developed
EU economies)– can have potentially large effects on countries and sectors growth.
Simulation analysis also shows that the overall effect depends on which institutional
determinant of financial development is varied to raise the current standards of the EU
financial development. Unsurprisingly, the largest benefits accrue when all determinants
are assumed to improve simultaneously.
5. Overall, we estimate that the impact of raising the level of financial development to
the U.S. level on the growth of European manufacturing industry is slightly less
than 1 percentage point per year (ranging from 0.75 to 0.94 percentage points
depending on the assumed scenario). Of course, the effect would be smaller if financial
integration were to occur at a lower level of financial development than that of the United
States.
6. This overall growth effect results from rather different country and sector effects, a
reflection of the heterogeneity of the EU in terms of sector composition and level of
51
financial development. Countries that currently have a comparably weak financial
structure (such as Belgium, Denmark, Greece and Italy) are predicted to benefit most,
while those which have already achieved a relatively high level of financial development
(such as the UK, Sweden and the Netherlands) are predicted to benefit little.
To a large extent, these results are confirmed by the estimates obtained using a large
sample of firms in 26 countries, drawn from the Amadeus Top 200,000 company database.
Both the sign and the estimated magnitude of the growth effect of financial development are
consistent with those obtained from industry-level data. In this sample the effect appears to
stem primarily from the effect of financial development on the sales growth of SMEs, defined
as firms with less than 200 employees. This implies that countries with comparatively small
firms (such Austria, Belgium, Greece, Italy, Spain, and Sweden) stand to gain more from
domestic financial development. However, it also suggests that for these countries EU
financial integration may have a smaller payoff than that implied by industry-level
simulations, insofar as financial integration will not lead to domestic financial development
for these countries but simply to improved access to international financial markets for their
firms. The reason is that SMEs are likely to be the least able to take advantage of such
improved access to foreign financial intermediaries and markets.
7.2. Limitations of the analysis and implications for EU financial integration
These conclusions raise some interesting issues. If the main beneficiaries of financial
market integration are the financially underdeveloped members of the EU, why should more
financially developed EU countries support financial market integration? This political
economy issue is important in light of the fact that financial integration is only partly driven
by spontaneous market developments. Much of it – as can be gauged by comparing Figure 3
with Figures 5 to 7 – stems from regulatory intervention and financial reform.
We advance three possible explanations for why more financially developed countries
not only do not oppose but actually favor – perhaps more than financially backward countries
� increased integration. First, even if in these countries manufacturing industry does not
benefit from financial market integration, financial industry may actually gain from
integration. The efficient financial intermediaries of more advanced countries can expand
52
abroad and gain a large market share at the expense of local institutions. Second, the enhanced
competition and the economies of scale in financial intermediation stemming from integration
can improve the working of financial markets in already relatively developed economies.
Finally, since financial market integration often goes hand-in-hand with economic integration,
more financially and economically developed countries can reap benefits also on this front.
Our analysis does not account for these growth effects of financial development because
the nature of our data constrains the estimation to manufacturing industry. However, for some
financially developed countries these growth effects could be the most important effect at
work. In particular, the financial service sector and the professional service sector in the U.K.
may greatly benefit from financial integration in the EU. Conversely, the financial service
industries of less financially developed countries may lose market shares and therefore face a
downturn in their activity. While financial market integration should enhance the growth and
formation of domestic firms in these countries, the same integration process is likely to hurt
their financial industry. Therefore, the effect of financial integration on the GDP of these
countries is likely to be smaller than its effect on their manufacturing industry. In other words,
insofar as they focus exclusively on manufacturing, our estimates are likely to underestimate
the growth effects of financial integration for financially developed countries and to
overestimate them for financially underdeveloped ones.
This highlights also that financial integration will not be a Pareto-improving process. It
will create not only winners but also some losers. In countries that are less financially
developed, the financial sector stands to lose market shares and profits. This may result in a
powerful constituency lobbying against financial integration, or at least slowing down its
progress. At the same time, the industrial sectors of these countries have an incentive to
promote financial integration because integration gives them an opportunity to expand. So the
overall balance of opinion in these countries will depend on whether the pro-integration
pressure of industry will win over the anti-integration resistance of local finance.
In financially developed countries, the situation is likely be reversed: the financial
sector will gain from integration, while industry will not gain much and may even lose from
the increased competitiveness of foreign manufacturing producers, which will be able to
access to hitherto inaccessible sources of financing. Therefore, in these countries finance is
likely to be in favor of integration while industry may be less favorable or even oppose.
53
References
Allen, Franklin and Douglas Gale (2000), Comparing Financial Systems, MIT Press,Cambridge MA.
Barro, Robert and Jong-Wha Lee (1996), “International Measures of Schooling Years andSchooling Quality,” American Economic Review, Papers and Proceedings, 86, 218-223
Beck, Thorsten, Ross Levine and Norman Loayza (2000a), “Financial Intermediation andGrowth: Causality and Causes,” Journal of Monetary Economics 46, 31-47.
Beck, Thorsten, Ross Levine and Norman Loayza (2000b), “Finance and the Sources ofGrowth,” Journal of Financial Economics 58, October/November, 261-300.
Beck, Thorsten, Asli Demirgüç-Kunt and Vojislav Maksimovic (2002), “Financial and LegalConstraints to Firm Growth: Does Size Matter?,” unpublished manuscript, WorldBank.
Beck, Thorsten, Asli Demirgüç-Kunt, Ross Levine and Vojislav Maksimovic (2001),“Financial Structure and Economic Development: Firm, Industry, and CountryEvidence,” in Demirgüc-Kunt, Asli, and Ross Levine (eds.), Financial Structure andEconomic Growth. A Cross-Country Comparison of Banks, Markets andDevelopment. Cambridge: MIT Press.
Berger, Allen and Gregory Udell (2002), “Small Business Credit Availability and SmallBusiness Lending: The Importance of Bank Organizational Structure,” EconomicJournal, forthcoming.
Carlin, Wendy, and Colin Mayer (1999), “Finance, Investment and Growth,” CEPRDiscussion Paper no. 2233, September.
Chari, Anusha and Peter Blair Henri (2001), “Stock Market Liberalizations and the Repricingof Systematic Risk,” NBER Working Paper no. 8265.
Cetorelli, Nicola and Michele Gambera (2001), “Banking Market Structure, FinancialDependence and Growth: International Evidence from Industry Data,” Journal ofFinance 56, 617-648.
Claessens, Stijn, Daniela Klingebiel, and Sergio Schmukler (2002), “Explaining the Migrationof Stocks from Exchanges in Emerging Economies to International Centers,” CEPRDiscussion Paper No. 3301, April.
Demirgüç-Kunt, Asli, and Vojislav Maksimovic (1998), “Law, Finance, and Firm Growth,”Journal of Finance 53, 2107-2137.
Demirgüc-Kunt, Asli, and Ross Levine eds. (2001), Financial Structure and EconomicGrowth. A Cross-Country Comparison of Banks, Markets and Development.Cambridge: MIT Press.

54
Deutsche Schutzvereinigung für Wertpapierbesitz (2000), “DSW Survey of Proxy Voting andMinority Shareholder Rights in 15 European Countries,” Düsseldorf: DSW (Englishtranslation published by IRRC: Washington D.C.)
Edison, Hali J., Ross Levine, Luca Ricci and Torsten Slok (2002), “International FinancialIntegration and Economic Growth,” unpublished manuscript, International MonetaryFund.
Fabbri, Daniela and Mario Padula (2001) “Does Poor Legal Enforcement Make HouseholdsCredit-Constrained?”, CSEF Working Paper no. 65.
Focarelli, Dario, Carmelo Salleo and Fabio Panetta (2002), “Why Do Banks Merge?,”Journal of Money, Credit and Banking, forthcoming.
Giannetti, Mariassunta (2002a), “Risk Sharing and the Growth of Firms: Theory andInternational Evidence,” unpublished manuscript, Stockholm School of Economics.
Giannetti, Mariassunta (2002b), “Do Better Institutions Mitigate Agency Problems? Evidencefrom Corporate Finance Choices,” Journal of Financial and Quantitative Analysis,forthcoming.
Goldsmith, Raymond W. (1969), Financial Structure and Development, New Haven, CT:Yale University Press.
Guiso, Luigi, Paola, Sapienza and Luigi Zingales (2002), “Does Local Financial DevelopmentMatter?,” CEPR Discussion Paper no. 3307.
Hardouvelis, Gikas A., Dimitrios Malliaropoulos and Richard Priestley (1999), “EMU andEuropean Stock Market Integration,” CEPR Discussion Paper no. 2124, April.
Himmelberg, Charles P., R. Glenn Hubbard and Inessa Love (2002), “Investment Protection,Ownership and the Cost of Capital, ” unpublished manuscript, Columbia University.
Jappelli, Tullio, Marco Pagano and Magda Bianco (2002), “Courts and Banks: Effects ofJudicial Efficiency on Credit Markets”, CSEF Working Paper no. 58 and CEPRDiscussion Paper no. 3347.
Jayaratne, Jith and Philip E. Strahan (1996), “The Finance-Growth Nexus: Evidence fromBank Branch Deregulation,” Quarterly Journal of Economics 111, 639-670.
King, Robert G., and Ross Levine (1993a), “Finance and Growth: Schumpeter May beRight,” Quarterly Journal of Economics 108, 713-737.
King, Robert G., and Ross Levine (1993b), “Finance, Entrepreneurship and Growth, ”Journal of Monetary Economics 32, 513-542.

55
La Porta, Rafael, Florencio Lopez-de-Silanes, and Andrei Shleifer (1998), “Law andFinance,” Journal of Political Economy 106, 1113-1155.
Levine, Ross (1997), “Financial Development and Economic Growth: Views and Agenda,”Journal of Economic Literature 35, 688-726.
Levine, Ross, and Sara Zervos (1998), “Stock Markets, Banks, and Economic Growth,”American Economic Review 88, 537-558.
Love, Inessa (2001), “Financial Development and Financing Constraints: InternationalEvidence from a Structural Investment Model,” unpublished manuscript, World Bank.
Obstfeld, Maurice (1994), “Risk Sharing, Global Diversification and Growth,” AmericanEconomic Review 84, 1310-1329.
Pagano, Marco (1993), “Financial Markets and Growth: an Overview,” European EconomicReview 37, 613-622.
Pagano, Marco, Ailsa Röell, Otto Randl, and Josef Zechner (2001), “What Makes StockExchanges Succeed? Evidence from Cross-Listing Decisions,” European EconomicReview, 45, 770-782.
Pagano, Marco, Ailsa Röell, and Josef Zechner (2002), “The Geography of Equity Listing:
Why Do Companies List Abroad?”, Journal of Finance, 57, 2651-2694.
Pelgrin, Florian and Sebastian Schich (2002), “Panel Cointegration Analysis of the Finance-Investment Link in OECD countries,” OECD Working Paper 02-2002.
Petersen, Mitchell A. and Raghuram G. Rajan (2002), “Does Distance Still Matter? DistanceStill Matter? The Information Revolution in Small Business Lending,” Journal ofFinance, 57.
Rajan, Raghuram G. and Luigi Zingales (1998), “Financial Dependence and Growth,”American Economic Review 88, 559-587.
Rajan, Raghuram G. and Luigi Zingales (2002), “Financial Systems, Industrial Structure andGrowth, ” unpublished manuscript, University of Chicago.
Stein, Jeremy C. (2002), “Information Production and Capital Allocation: Decentralized vs.Hierarchical Firms,” Journal of Finance, 57, 1891-1921.
Svaleryd, Helena and Jonas Vlachos (2002), “Financial Markets, Industrial Specialization andComparative Advantage: Evidence from OECD countries,” unpublished manuscript,Stockholm School of Economics.
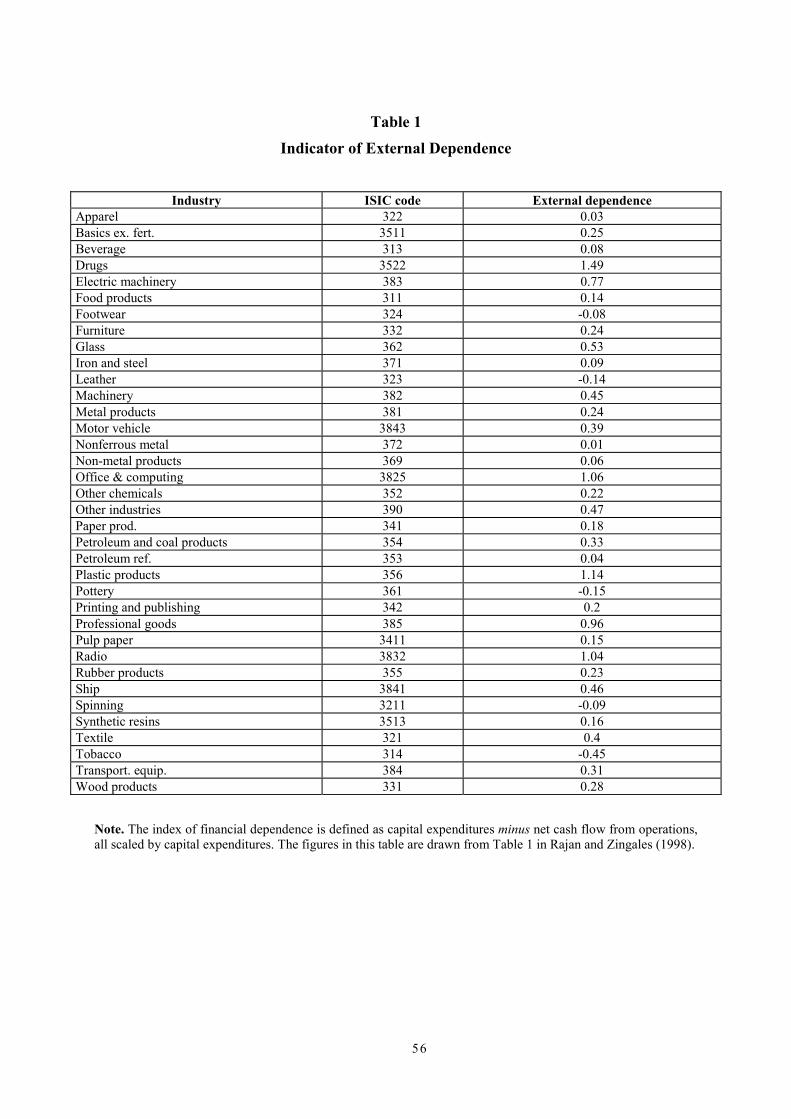
56
Table 1
Indicator of External Dependence
Industry ISIC code External dependenceApparel 322 0.03Basics ex. fert. 3511 0.25Beverage 313 0.08Drugs 3522 1.49Electric machinery 383 0.77Food products 311 0.14Footwear 324 -0.08Furniture 332 0.24Glass 362 0.53Iron and steel 371 0.09Leather 323 -0.14Machinery 382 0.45Metal products 381 0.24Motor vehicle 3843 0.39Nonferrous metal 372 0.01Non-metal products 369 0.06Office & computing 3825 1.06Other chemicals 352 0.22Other industries 390 0.47Paper prod. 341 0.18Petroleum and coal products 354 0.33Petroleum ref. 353 0.04Plastic products 356 1.14Pottery 361 -0.15Printing and publishing 342 0.2Professional goods 385 0.96Pulp paper 3411 0.15Radio 3832 1.04Rubber products 355 0.23Ship 3841 0.46Spinning 3211 -0.09Synthetic resins 3513 0.16Textile 321 0.4Tobacco 314 -0.45Transport. equip. 384 0.31Wood products 331 0.28
Note. The index of financial dependence is defined as capital expenditures minus net cash flow from operations,all scaled by capital expenditures. The figures in this table are drawn from Table 1 in Rajan and Zingales (1998).
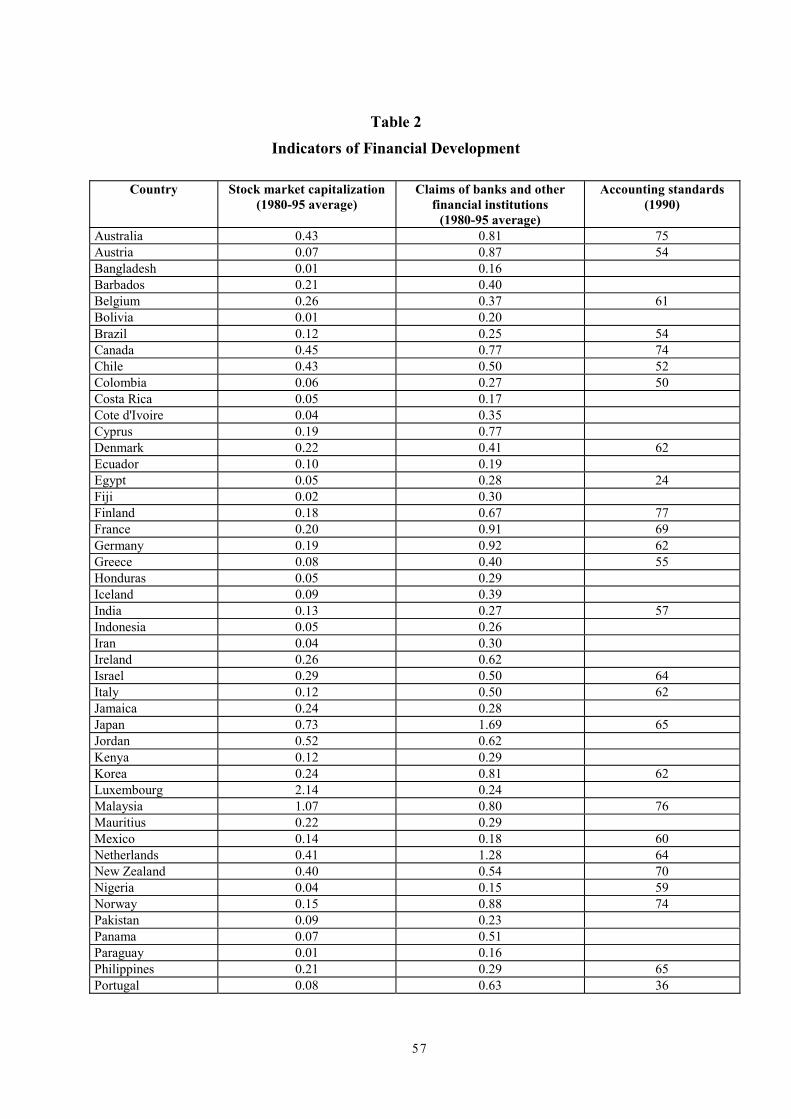
57
Table 2
Indicators of Financial Development
Country Stock market capitalization(1980-95 average)
Claims of banks and otherfinancial institutions
(1980-95 average)
Accounting standards(1990)
Australia 0.43 0.81 75Austria 0.07 0.87 54Bangladesh 0.01 0.16Barbados 0.21 0.40Belgium 0.26 0.37 61Bolivia 0.01 0.20Brazil 0.12 0.25 54Canada 0.45 0.77 74Chile 0.43 0.50 52Colombia 0.06 0.27 50Costa Rica 0.05 0.17Cote d'Ivoire 0.04 0.35Cyprus 0.19 0.77Denmark 0.22 0.41 62Ecuador 0.10 0.19Egypt 0.05 0.28 24Fiji 0.02 0.30Finland 0.18 0.67 77France 0.20 0.91 69Germany 0.19 0.92 62Greece 0.08 0.40 55Honduras 0.05 0.29Iceland 0.09 0.39India 0.13 0.27 57Indonesia 0.05 0.26Iran 0.04 0.30Ireland 0.26 0.62Israel 0.29 0.50 64Italy 0.12 0.50 62Jamaica 0.24 0.28Japan 0.73 1.69 65Jordan 0.52 0.62Kenya 0.12 0.29Korea 0.24 0.81 62Luxembourg 2.14 0.24Malaysia 1.07 0.80 76Mauritius 0.22 0.29Mexico 0.14 0.18 60Netherlands 0.41 1.28 64New Zealand 0.40 0.54 70Nigeria 0.04 0.15 59Norway 0.15 0.88 74Pakistan 0.09 0.23Panama 0.07 0.51Paraguay 0.01 0.16Philippines 0.21 0.29 65Portugal 0.08 0.63 36
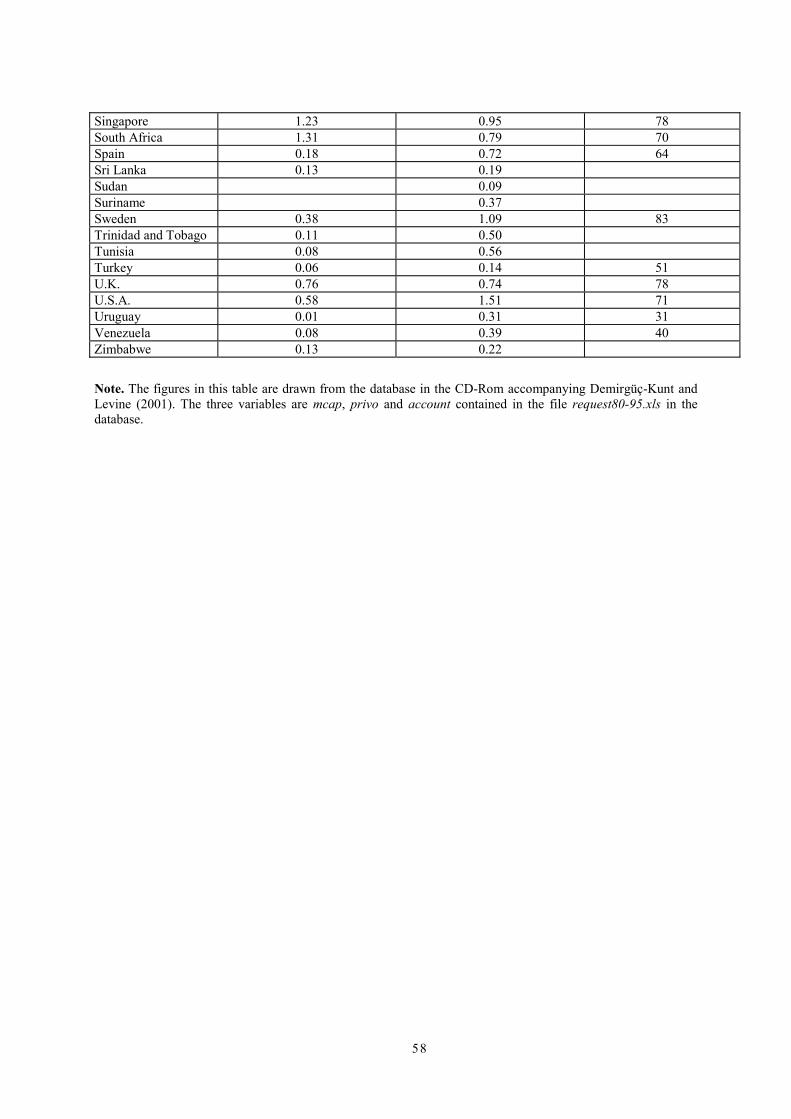
58
Singapore 1.23 0.95 78South Africa 1.31 0.79 70Spain 0.18 0.72 64Sri Lanka 0.13 0.19Sudan 0.09Suriname 0.37Sweden 0.38 1.09 83Trinidad and Tobago 0.11 0.50Tunisia 0.08 0.56Turkey 0.06 0.14 51U.K. 0.76 0.74 78U.S.A. 0.58 1.51 71Uruguay 0.01 0.31 31Venezuela 0.08 0.39 40Zimbabwe 0.13 0.22
Note. The figures in this table are drawn from the database in the CD-Rom accompanying Demirgüç-Kunt andLevine (2001). The three variables are mcap, privo and account contained in the file request80-95.xls in thedatabase.
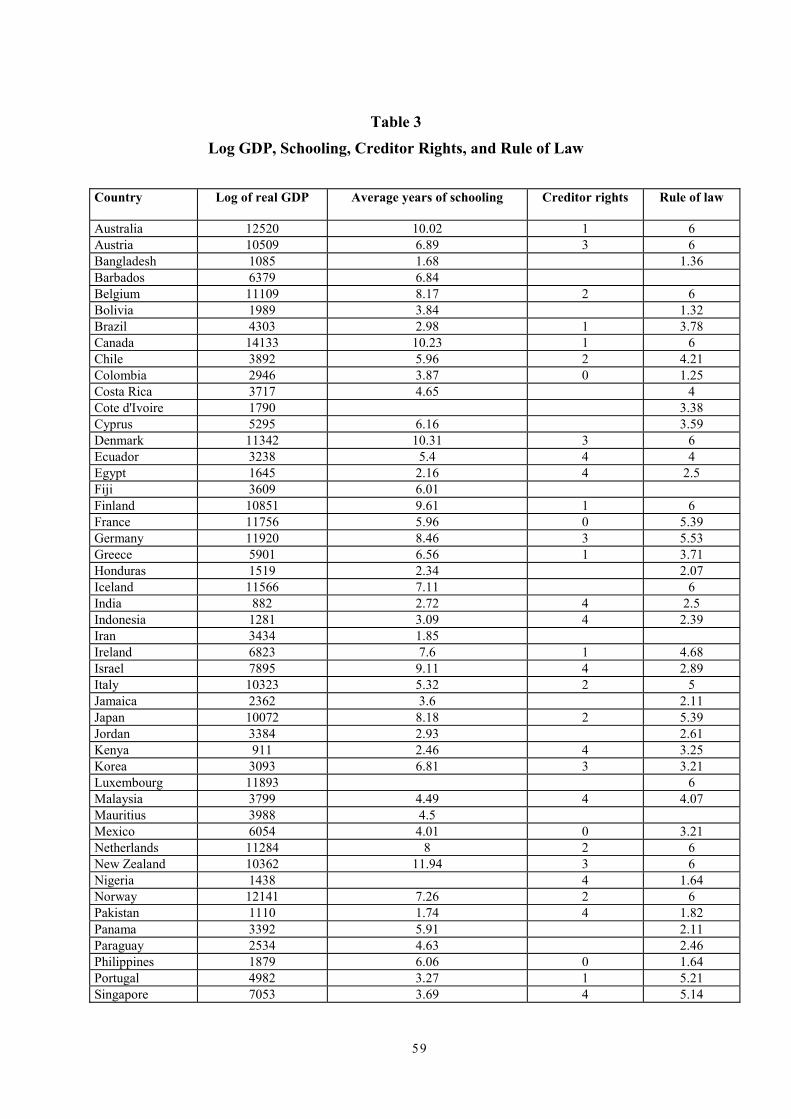
59
Table 3
Log GDP, Schooling, Creditor Rights, and Rule of Law
Country Log of real GDP Average years of schooling Creditor rights Rule of law
Australia 12520 10.02 1 6Austria 10509 6.89 3 6Bangladesh 1085 1.68 1.36Barbados 6379 6.84Belgium 11109 8.17 2 6Bolivia 1989 3.84 1.32Brazil 4303 2.98 1 3.78Canada 14133 10.23 1 6Chile 3892 5.96 2 4.21Colombia 2946 3.87 0 1.25Costa Rica 3717 4.65 4Cote d'Ivoire 1790 3.38Cyprus 5295 6.16 3.59Denmark 11342 10.31 3 6Ecuador 3238 5.4 4 4Egypt 1645 2.16 4 2.5Fiji 3609 6.01Finland 10851 9.61 1 6France 11756 5.96 0 5.39Germany 11920 8.46 3 5.53Greece 5901 6.56 1 3.71Honduras 1519 2.34 2.07Iceland 11566 7.11 6India 882 2.72 4 2.5Indonesia 1281 3.09 4 2.39Iran 3434 1.85Ireland 6823 7.6 1 4.68Israel 7895 9.11 4 2.89Italy 10323 5.32 2 5Jamaica 2362 3.6 2.11Japan 10072 8.18 2 5.39Jordan 3384 2.93 2.61Kenya 911 2.46 4 3.25Korea 3093 6.81 3 3.21Luxembourg 11893 6Malaysia 3799 4.49 4 4.07Mauritius 3988 4.5Mexico 6054 4.01 0 3.21Netherlands 11284 8 2 6New Zealand 10362 11.94 3 6Nigeria 1438 4 1.64Norway 12141 7.26 2 6Pakistan 1110 1.74 4 1.82Panama 3392 5.91 2.11Paraguay 2534 4.63 2.46Philippines 1879 6.06 0 1.64Portugal 4982 3.27 1 5.21Singapore 7053 3.69 4 5.14

60
South Africa 3496 4.6 3 2.65Spain 7390 5.38 2 4.68Sri Lanka 1635 5.18 3 1.14Sudan 866 0.64 1.89Suriname 3737 1.31Sweden 12456 9.45 2 6Trinidad and 11262 6.6 4Tunisia 2527 1.92 2.79Turkey 2874 2.61 2 3.10UK 10167 8.11 4 5.14Uruguay 5091 5.75 2 3Venezuela 7401 4.93 3.82Zimbabwe 1206 2.26 4 2.21
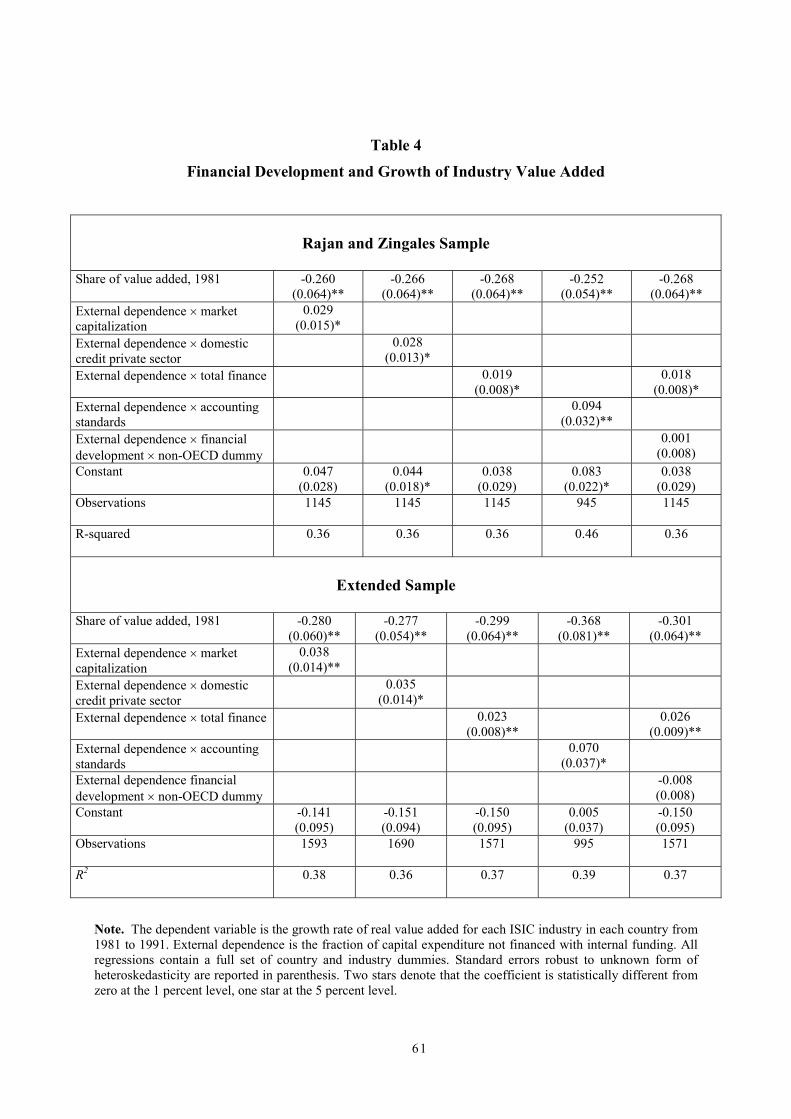
61
Table 4
Financial Development and Growth of Industry Value Added
Rajan and Zingales Sample
Share of value added, 1981 -0.260(0.064)**
-0.266(0.064)**
-0.268(0.064)**
-0.252(0.054)**
-0.268(0.064)**
External dependence � marketcapitalization
0.029(0.015)*
External dependence � domesticcredit private sector
0.028(0.013)*
External dependence � total finance 0.019(0.008)*
0.018(0.008)*
External dependence � accountingstandards
0.094(0.032)**
External dependence � financialdevelopment � non-OECD dummy
0.001(0.008)
Constant 0.047(0.028)
0.044(0.018)*
0.038(0.029)
0.083(0.022)*
0.038(0.029)
Observations 1145 1145 1145 945 1145
R-squared 0.36 0.36 0.36 0.46 0.36
Extended Sample
Share of value added, 1981 -0.280(0.060)**
-0.277(0.054)**
-0.299(0.064)**
-0.368(0.081)**
-0.301(0.064)**
External dependence � marketcapitalization
0.038(0.014)**
External dependence � domesticcredit private sector
0.035(0.014)*
External dependence � total finance 0.023(0.008)**
0.026(0.009)**
External dependence � accountingstandards
0.070(0.037)*
External dependence financialdevelopment � non-OECD dummy
-0.008(0.008)
Constant -0.141(0.095)
-0.151(0.094)
-0.150(0.095)
0.005(0.037)
-0.150(0.095)
Observations 1593 1690 1571 995 1571
R2 0.38 0.36 0.37 0.39 0.37
Note. The dependent variable is the growth rate of real value added for each ISIC industry in each country from1981 to 1991. External dependence is the fraction of capital expenditure not financed with internal funding. Allregressions contain a full set of country and industry dummies. Standard errors robust to unknown form ofheteroskedasticity are reported in parenthesis. Two stars denote that the coefficient is statistically different fromzero at the 1 percent level, one star at the 5 percent level.
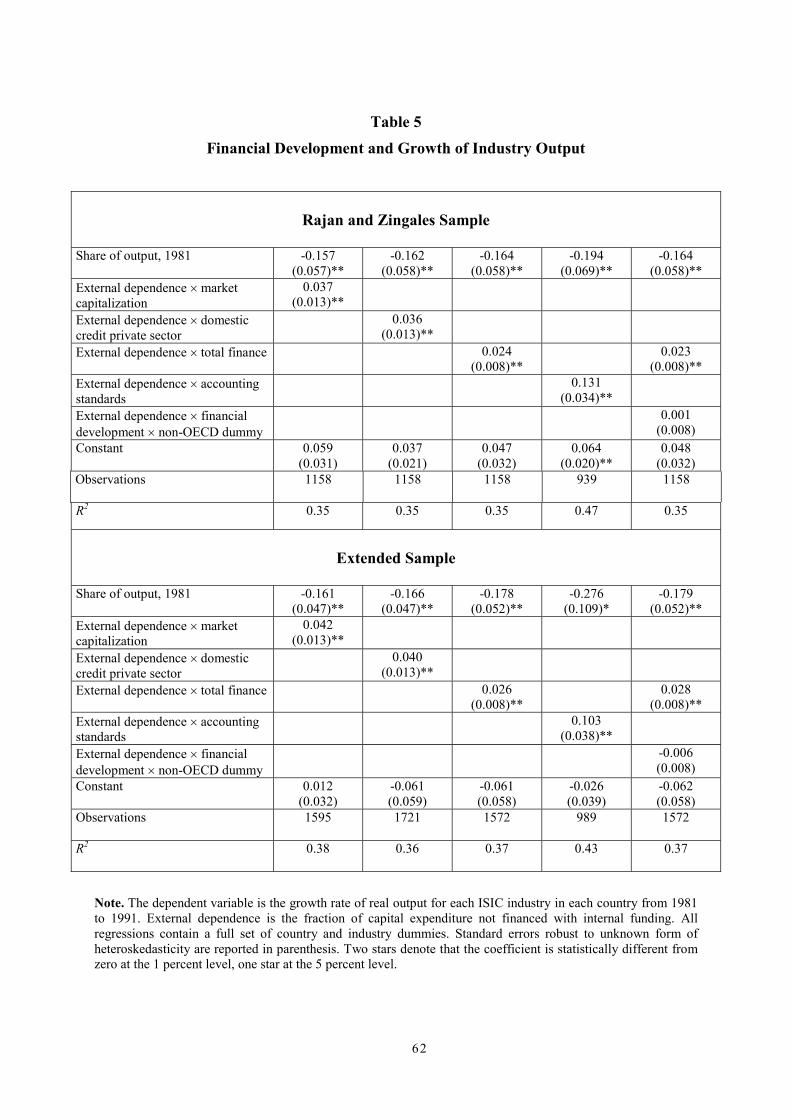
62
Table 5
Financial Development and Growth of Industry Output
Rajan and Zingales Sample
Share of output, 1981 -0.157(0.057)**
-0.162(0.058)**
-0.164(0.058)**
-0.194(0.069)**
-0.164(0.058)**
External dependence � marketcapitalization
0.037(0.013)**
External dependence � domesticcredit private sector
0.036(0.013)**
External dependence � total finance 0.024(0.008)**
0.023(0.008)**
External dependence � accountingstandards
0.131(0.034)**
External dependence � financialdevelopment � non-OECD dummy
0.001(0.008)
Constant 0.059(0.031)
0.037(0.021)
0.047(0.032)
0.064(0.020)**
0.048(0.032)
Observations 1158 1158 1158 939 1158
R2 0.35 0.35 0.35 0.47 0.35
Extended Sample
Share of output, 1981 -0.161(0.047)**
-0.166(0.047)**
-0.178(0.052)**
-0.276(0.109)*
-0.179(0.052)**
External dependence � marketcapitalization
0.042(0.013)**
External dependence � domesticcredit private sector
0.040(0.013)**
External dependence � total finance 0.026(0.008)**
0.028(0.008)**
External dependence � accountingstandards
0.103(0.038)**
External dependence � financialdevelopment � non-OECD dummy
-0.006(0.008)
Constant 0.012(0.032)
-0.061(0.059)
-0.061(0.058)
-0.026(0.039)
-0.062(0.058)
Observations 1595 1721 1572 989 1572
R2 0.38 0.36 0.37 0.43 0.37
Note. The dependent variable is the growth rate of real output for each ISIC industry in each country from 1981to 1991. External dependence is the fraction of capital expenditure not financed with internal funding. Allregressions contain a full set of country and industry dummies. Standard errors robust to unknown form ofheteroskedasticity are reported in parenthesis. Two stars denote that the coefficient is statistically different fromzero at the 1 percent level, one star at the 5 percent level.

63
Table 6
Financial Development and Growth of Number of Firms
Rajan and Zingales Sample
Share of firms, 1981 -0.470(0.139)**
-0.482(0.138)**
-0.479(0.139)**
-0.258(0.069)**
-0.481(0.138)**
External dependence � marketcapitalization
0.035(0.021)
External dependence � domesticcredit private sector
0.075(0.017)**
External dependence � total finance 0.036(0.011)**
0.044(0.010)**
External dependence � accountingstandards
0.53(0.033)**
External dependence � financialdevelopment � non-OECD dummy
-0.018(0.012)
Constant 0.085(0.030)**
0.011(0.026)
0.028(0.025)
0.027(0.037)
0.027(0.025)
Observations 1035 1035 1035 905 1035
R2 0.50 0.51 0.50 0.50 0.51
Extended Sample
Share of firms, 1981 -0.387(0.099)**
-0.420(0.094)**
-0.433(0.102)**
-0.282(0.071)**
-0.435(0.101)**
External dependence � marketcapitalization
0.036(0.020)
External dependence � domesticcredit private sector
0.071(0.014)**
External dependence � total finance 0.035(0.009)**
0.043(0.009)**
External dependence � accountingstandards
0.055(0.033)
External dependence � financialdevelopment � non-OECD dummy
-0.019(0.011)
Constant 0.104(0.029)**
0.002(0.035)
-0.111(0.042)**
-0.044(0.035)
-0.110(0.042)**
Observations 1372 1454 1349 928 1349
R2 0.46 0.50 0.47 0.43 0.48
Note. The dependent variable is the growth rate of the number of firms for each ISIC industry in each countryfrom 1981 to 1991. External dependence is the fraction of capital expenditure not financed with internal funding.All regressions contain a full set of country and industry dummies. Standard errors robust to unknown form ofheteroskedasticity are reported in parenthesis. Two stars denote that the coefficient is statistically different fromzero at the 1 percent level, one star at the 5 percent level.
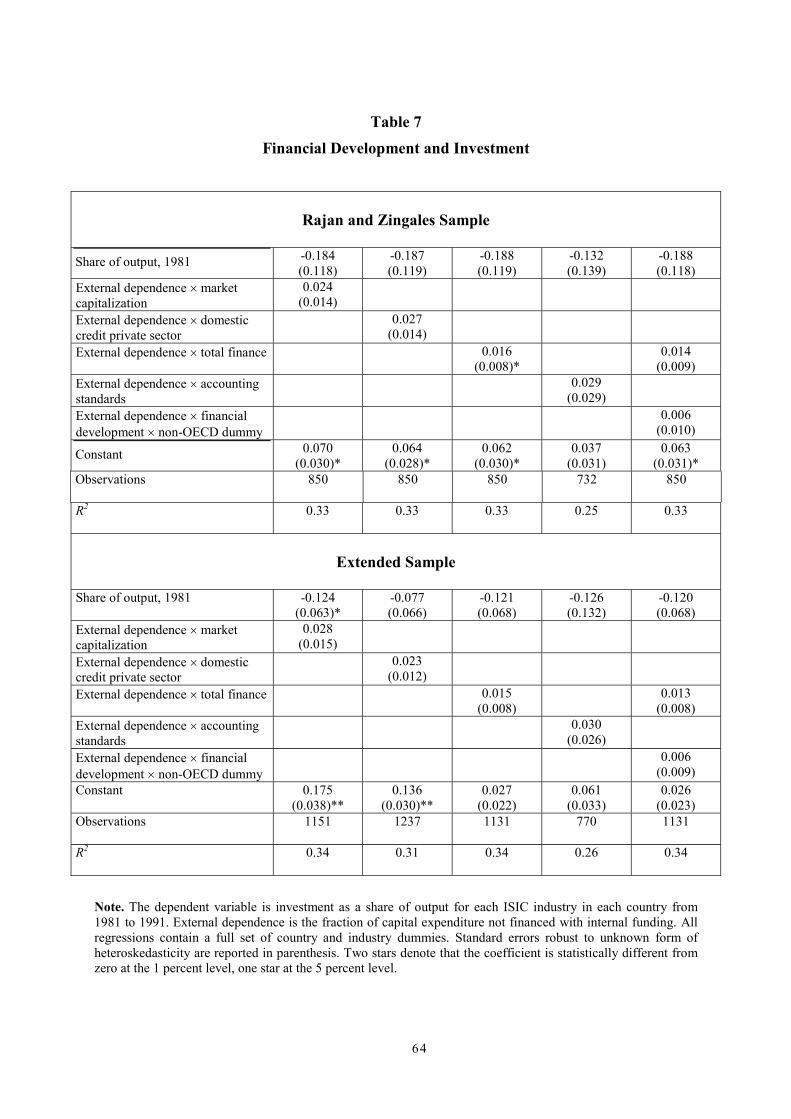
64
Table 7
Financial Development and Investment
Rajan and Zingales Sample
Share of output, 1981 -0.184(0.118)
-0.187(0.119)
-0.188(0.119)
-0.132(0.139)
-0.188(0.118)
External dependence � marketcapitalization
0.024(0.014)
External dependence � domesticcredit private sector
0.027(0.014)
External dependence � total finance 0.016(0.008)*
0.014(0.009)
External dependence � accountingstandards
0.029(0.029)
External dependence � financialdevelopment � non-OECD dummy
0.006(0.010)
Constant 0.070(0.030)*
0.064(0.028)*
0.062(0.030)*
0.037(0.031)
0.063(0.031)*
Observations 850 850 850 732 850
R2 0.33 0.33 0.33 0.25 0.33
Extended Sample
Share of output, 1981 -0.124(0.063)*
-0.077(0.066)
-0.121(0.068)
-0.126(0.132)
-0.120(0.068)
External dependence � marketcapitalization
0.028(0.015)
External dependence � domesticcredit private sector
0.023(0.012)
External dependence � total finance 0.015(0.008)
0.013(0.008)
External dependence � accountingstandards
0.030(0.026)
External dependence � financialdevelopment � non-OECD dummy
0.006(0.009)
Constant 0.175(0.038)**
0.136(0.030)**
0.027(0.022)
0.061(0.033)
0.026(0.023)
Observations 1151 1237 1131 770 1131
R2 0.34 0.31 0.34 0.26 0.34
Note. The dependent variable is investment as a share of output for each ISIC industry in each country from1981 to 1991. External dependence is the fraction of capital expenditure not financed with internal funding. Allregressions contain a full set of country and industry dummies. Standard errors robust to unknown form ofheteroskedasticity are reported in parenthesis. Two stars denote that the coefficient is statistically different fromzero at the 1 percent level, one star at the 5 percent level.
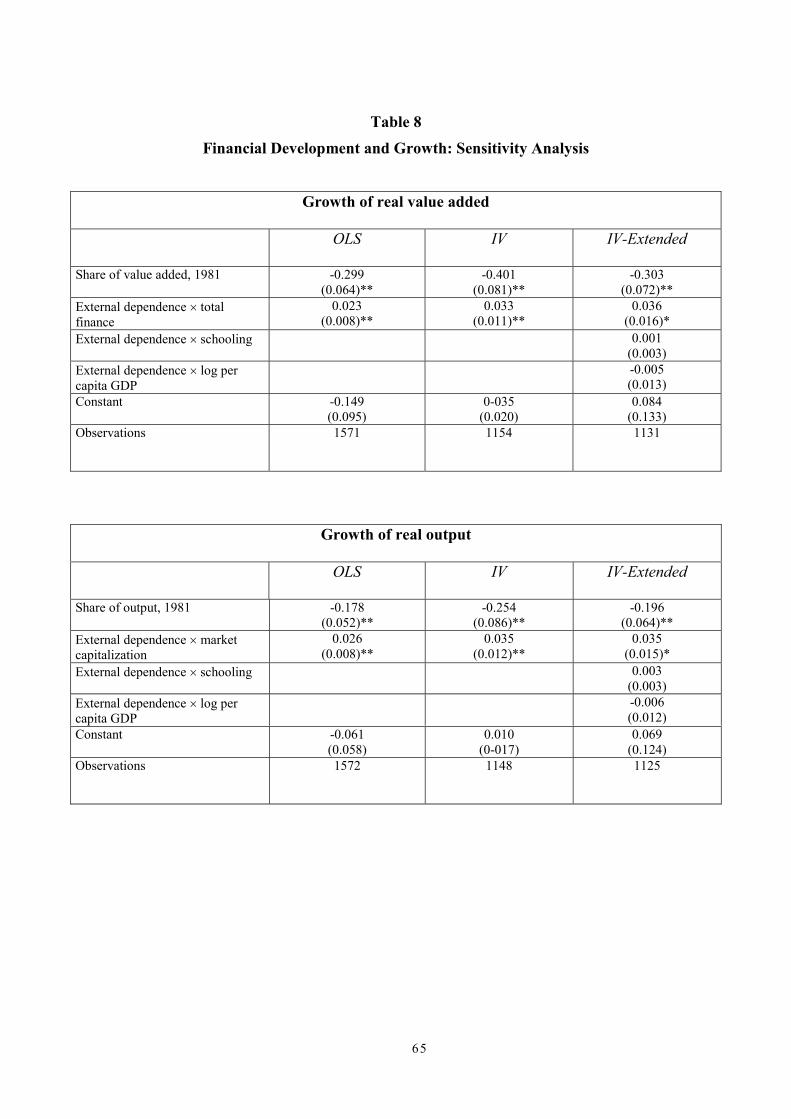
65
Table 8
Financial Development and Growth: Sensitivity Analysis
Growth of real value added
OLS IV IV-Extended
Share of value added, 1981 -0.299(0.064)**
-0.401(0.081)**
-0.303(0.072)**
External dependence � totalfinance
0.023(0.008)**
0.033(0.011)**
0.036(0.016)*
External dependence � schooling 0.001(0.003)
External dependence � log percapita GDP
-0.005(0.013)
Constant -0.149(0.095)
0-035(0.020)
0.084(0.133)
Observations 1571 1154 1131
Growth of real output
OLS IV IV-Extended
Share of output, 1981 -0.178(0.052)**
-0.254(0.086)**
-0.196(0.064)**
External dependence � marketcapitalization
0.026(0.008)**
0.035(0.012)**
0.035(0.015)*
External dependence � schooling 0.003(0.003)
External dependence � log percapita GDP
-0.006(0.012)
Constant -0.061(0.058)
0.010(0-017)
0.069(0.124)
Observations 1572 1148 1125

66
Table 8 - continued
Growth of number of firms
OLS IV IV-Extended
Share of firms, 1981 -0.433(0.102)**
-0.319(0.070)**
-0.297(0.068)**
External dependence � marketcapitalization
0.035(0.009)**
0.042(0.010)**
0.011(0.016)
External dependence � schooling 0.003(0.003)
External dependence � log percapita GDP
-0.004(0.003)
Constant -0.061(0.058)
0.010(0-017)
0.0030(0.015)*
Observations 1349 1052 1029
Investment
OLS IV IV-Extended
Share of output, 1981 -0.121(0.068)
-0.118(0.093)
-0.123(0.097)
External dependence � marketcapitalization
0.015(0.008)
0.007(0.011)
0.003(0.015)
External dependence � schooling -0.001(0.003)
External dependence � log percapita GDP
0.009(0.014)
Constant 0.027(0.022)
0.104(0.024)**
-0.063(0.152)
Observations 1131 889 868
Note. The dependent variables are the growth rate of real value added, output, number of firms and investmentfor each ISIC industry in each country from 1981 to 1991. In the IV regression, the instruments for financialdevelopment are dummies for the legal origin of the country (Anglo-Saxon, French, German and Scandinavian),and indicators of the rule of law and the degree of protection of creditor rights. All regressions contain a full setof country and industry dummies. Standard errors robust to unknown form of heteroskedasticity are reported inparenthesis. Two stars denote that the coefficient is statistically different from zero at the 1 percent level, onestar at the 5 percent level.
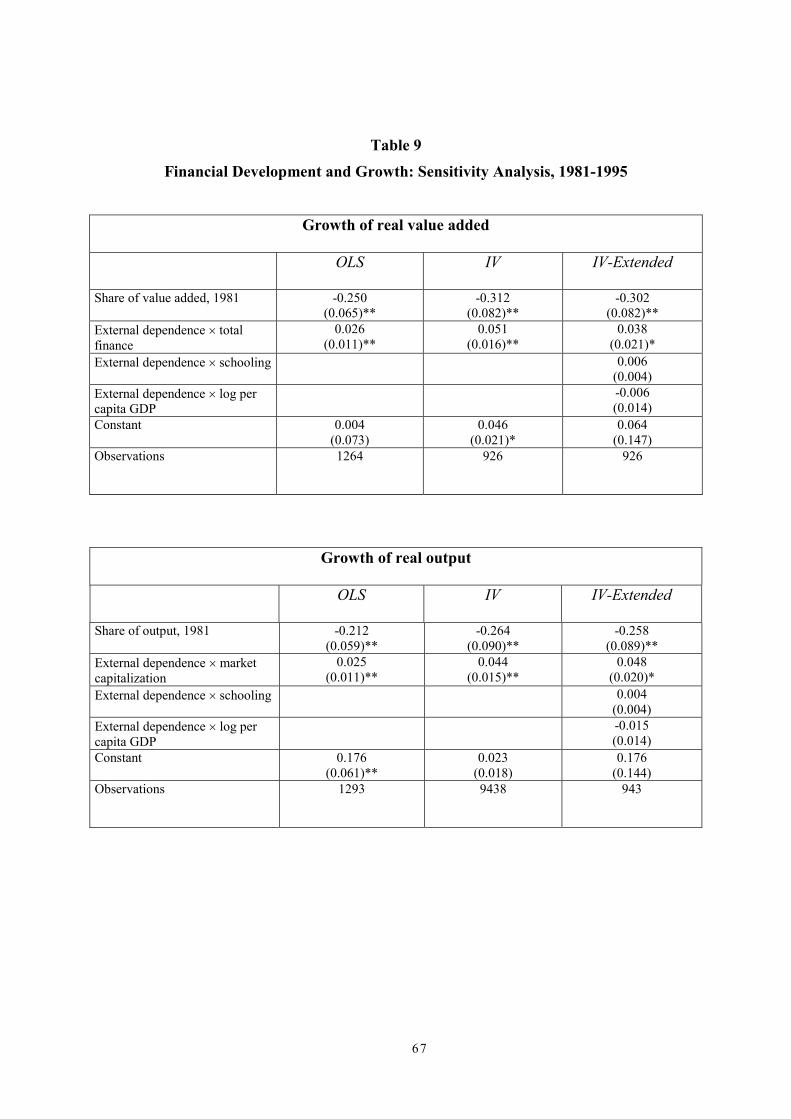
67
Table 9
Financial Development and Growth: Sensitivity Analysis, 1981-1995
Growth of real value added
OLS IV IV-Extended
Share of value added, 1981 -0.250(0.065)**
-0.312(0.082)**
-0.302(0.082)**
External dependence � totalfinance
0.026(0.011)**
0.051(0.016)**
0.038(0.021)*
External dependence � schooling 0.006(0.004)
External dependence � log percapita GDP
-0.006(0.014)
Constant 0.004(0.073)
0.046(0.021)*
0.064(0.147)
Observations 1264 926 926
Growth of real output
OLS IV IV-Extended
Share of output, 1981 -0.212(0.059)**
-0.264(0.090)**
-0.258(0.089)**
External dependence � marketcapitalization
0.025(0.011)**
0.044(0.015)**
0.048(0.020)*
External dependence � schooling 0.004(0.004)
External dependence � log percapita GDP
-0.015(0.014)
Constant 0.176(0.061)**
0.023(0.018)
0.176(0.144)
Observations 1293 9438 943
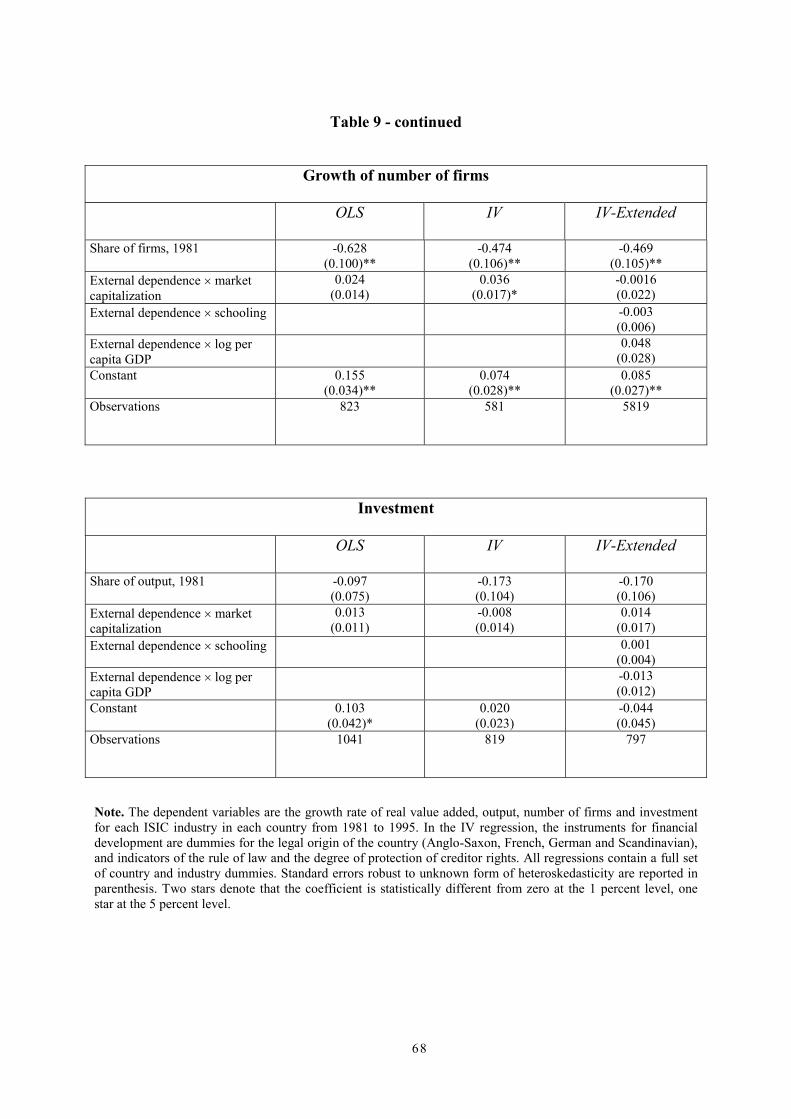
68
Table 9 - continued
Growth of number of firms
OLS IV IV-Extended
Share of firms, 1981 -0.628(0.100)**
-0.474(0.106)**
-0.469(0.105)**
External dependence � marketcapitalization
0.024(0.014)
0.036(0.017)*
-0.0016(0.022)
External dependence � schooling -0.003(0.006)
External dependence � log percapita GDP
0.048(0.028)
Constant 0.155(0.034)**
0.074(0.028)**
0.085(0.027)**
Observations 823 581 5819
Investment
OLS IV IV-Extended
Share of output, 1981 -0.097(0.075)
-0.173(0.104)
-0.170(0.106)
External dependence � marketcapitalization
0.013(0.011)
-0.008(0.014)
0.014(0.017)
External dependence � schooling 0.001(0.004)
External dependence � log percapita GDP
-0.013(0.012)
Constant 0.103(0.042)*
0.020(0.023)
-0.044(0.045)
Observations 1041 819 797
Note. The dependent variables are the growth rate of real value added, output, number of firms and investmentfor each ISIC industry in each country from 1981 to 1995. In the IV regression, the instruments for financialdevelopment are dummies for the legal origin of the country (Anglo-Saxon, French, German and Scandinavian),and indicators of the rule of law and the degree of protection of creditor rights. All regressions contain a full setof country and industry dummies. Standard errors robust to unknown form of heteroskedasticity are reported inparenthesis. Two stars denote that the coefficient is statistically different from zero at the 1 percent level, onestar at the 5 percent level.
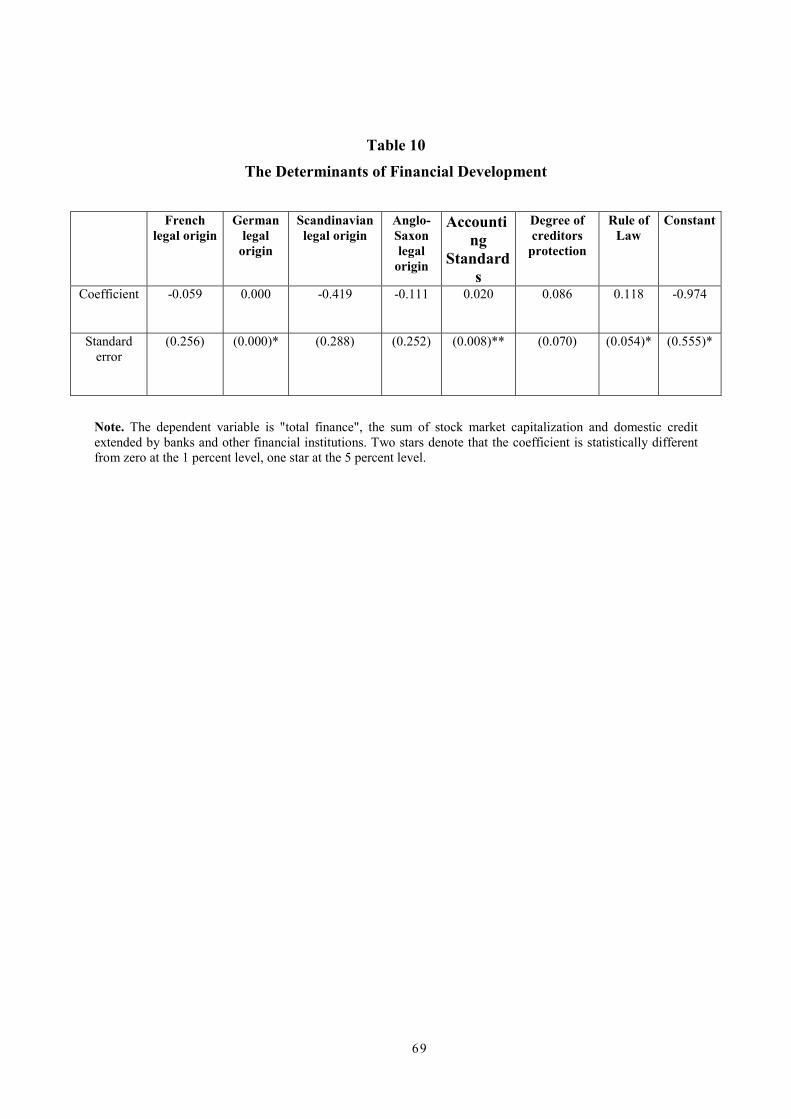
69
Table 10
The Determinants of Financial Development
Frenchlegal origin
Germanlegal
origin
Scandinavianlegal origin
Anglo-Saxonlegal
origin
Accounting
Standards
Degree ofcreditors
protection
Rule ofLaw
Constant
Coefficient -0.059 0.000 -0.419 -0.111 0.020 0.086 0.118 -0.974
Standarderror
(0.256) (0.000)* (0.288) (0.252) (0.008)** (0.070) (0.054)* (0.555)*
Note. The dependent variable is "total finance", the sum of stock market capitalization and domestic creditextended by banks and other financial institutions. Two stars denote that the coefficient is statistically differentfrom zero at the 1 percent level, one star at the 5 percent level.
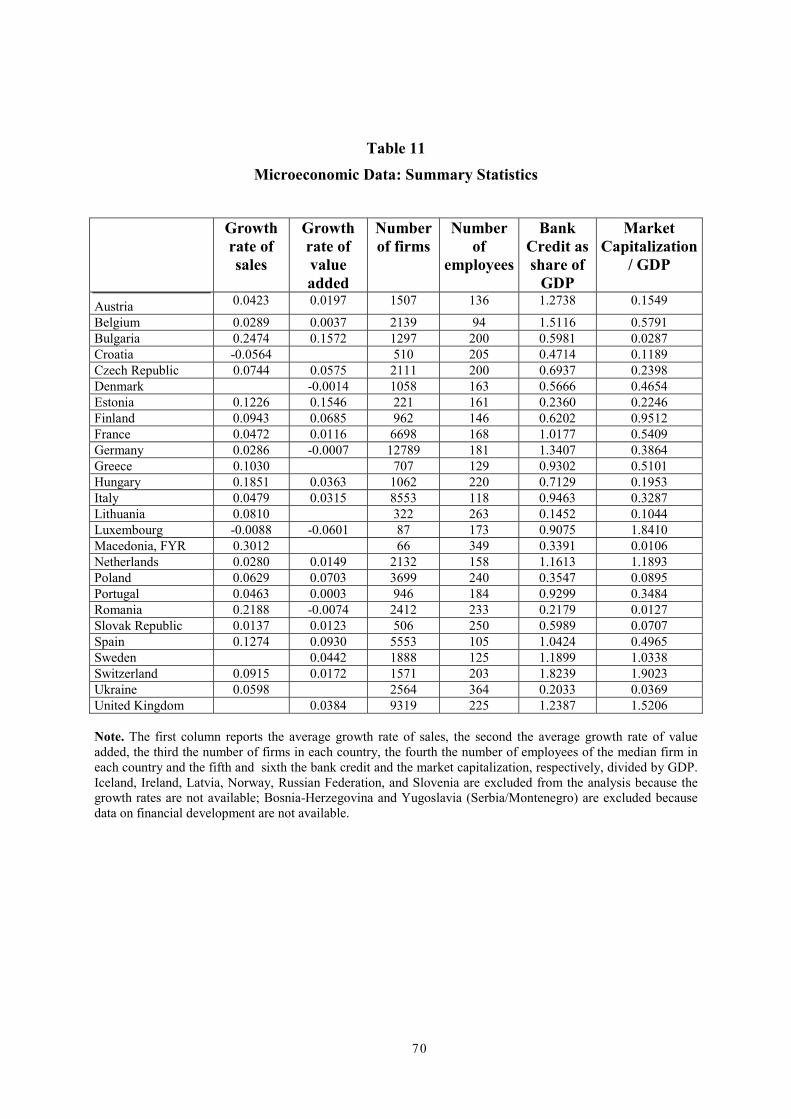
70
Table 11
Microeconomic Data: Summary Statistics
Growthrate ofsales
Growthrate ofvalueadded
Numberof firms
Numberof
employees
BankCredit asshare of
GDP
MarketCapitalization
/ GDP
Austria 0.0423 0.0197 1507 136 1.2738 0.1549
Belgium 0.0289 0.0037 2139 94 1.5116 0.5791Bulgaria 0.2474 0.1572 1297 200 0.5981 0.0287Croatia -0.0564 510 205 0.4714 0.1189Czech Republic 0.0744 0.0575 2111 200 0.6937 0.2398Denmark -0.0014 1058 163 0.5666 0.4654Estonia 0.1226 0.1546 221 161 0.2360 0.2246Finland 0.0943 0.0685 962 146 0.6202 0.9512France 0.0472 0.0116 6698 168 1.0177 0.5409Germany 0.0286 -0.0007 12789 181 1.3407 0.3864Greece 0.1030 707 129 0.9302 0.5101Hungary 0.1851 0.0363 1062 220 0.7129 0.1953Italy 0.0479 0.0315 8553 118 0.9463 0.3287Lithuania 0.0810 322 263 0.1452 0.1044Luxembourg -0.0088 -0.0601 87 173 0.9075 1.8410Macedonia, FYR 0.3012 66 349 0.3391 0.0106Netherlands 0.0280 0.0149 2132 158 1.1613 1.1893Poland 0.0629 0.0703 3699 240 0.3547 0.0895Portugal 0.0463 0.0003 946 184 0.9299 0.3484Romania 0.2188 -0.0074 2412 233 0.2179 0.0127Slovak Republic 0.0137 0.0123 506 250 0.5989 0.0707Spain 0.1274 0.0930 5553 105 1.0424 0.4965Sweden 0.0442 1888 125 1.1899 1.0338Switzerland 0.0915 0.0172 1571 203 1.8239 1.9023Ukraine 0.0598 2564 364 0.2033 0.0369United Kingdom 0.0384 9319 225 1.2387 1.5206
Note. The first column reports the average growth rate of sales, the second the average growth rate of valueadded, the third the number of firms in each country, the fourth the number of employees of the median firm ineach country and the fifth and sixth the bank credit and the market capitalization, respectively, divided by GDP.Iceland, Ireland, Latvia, Norway, Russian Federation, and Slovenia are excluded from the analysis because thegrowth rates are not available; Bosnia-Herzegovina and Yugoslavia (Serbia/Montenegro) are excluded becausedata on financial development are not available.
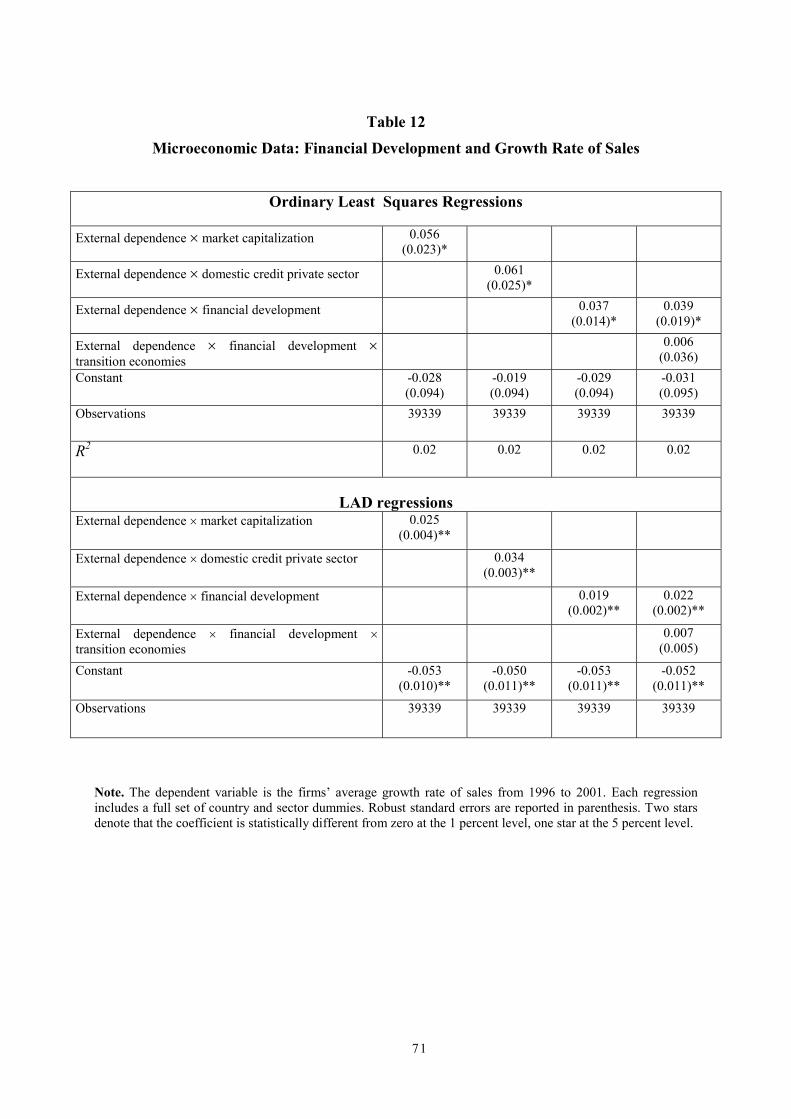
71
Table 12
Microeconomic Data: Financial Development and Growth Rate of Sales
Ordinary Least Squares Regressions
External dependence � market capitalization 0.056(0.023)*
External dependence � domestic credit private sector 0.061(0.025)*
External dependence � financial development 0.037(0.014)*
0.039(0.019)*
External dependence � financial development �
transition economies0.006
(0.036)Constant -0.028
(0.094)-0.019(0.094)
-0.029(0.094)
-0.031(0.095)
Observations 39339 39339 39339 39339
R2 0.02 0.02 0.02 0.02
LAD regressionsExternal dependence � market capitalization 0.025
(0.004)**
External dependence � domestic credit private sector 0.034(0.003)**
External dependence � financial development 0.019(0.002)**
0.022(0.002)**
External dependence � financial development �
transition economies0.007
(0.005)
Constant -0.053(0.010)**
-0.050(0.011)**
-0.053(0.011)**
-0.052(0.011)**
Observations 39339 39339 39339 39339
Note. The dependent variable is the firms’ average growth rate of sales from 1996 to 2001. Each regressionincludes a full set of country and sector dummies. Robust standard errors are reported in parenthesis. Two starsdenote that the coefficient is statistically different from zero at the 1 percent level, one star at the 5 percent level.
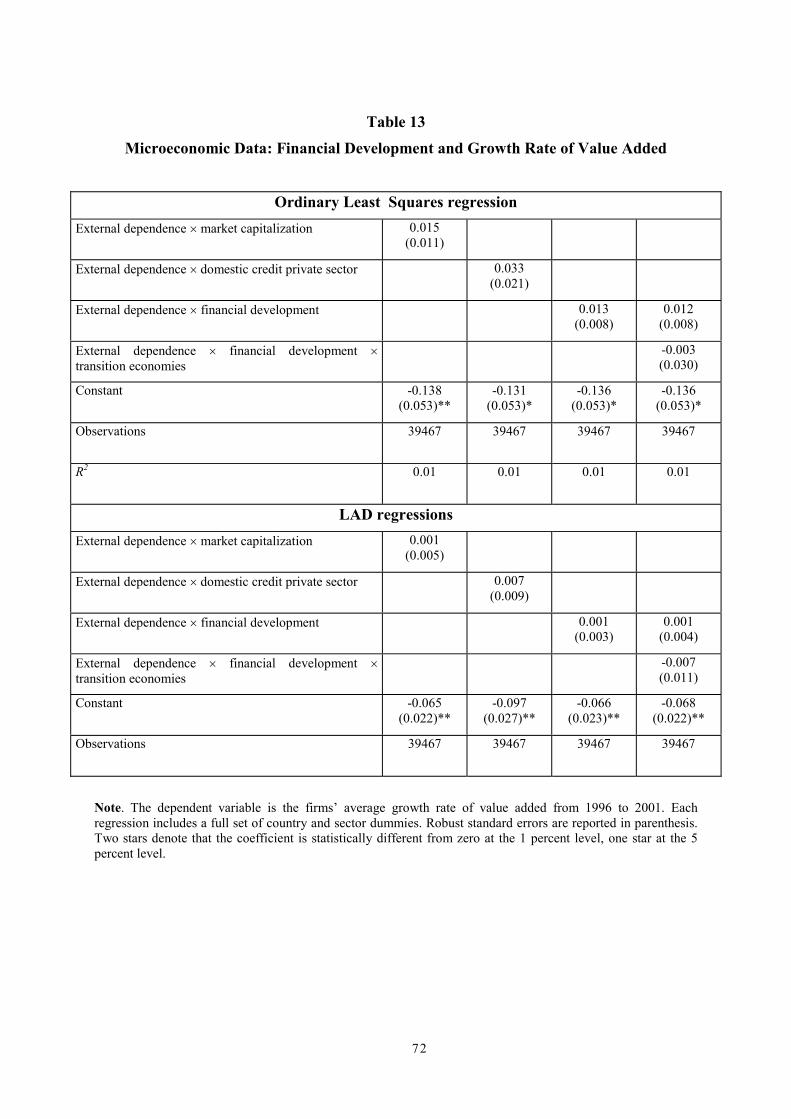
72
Table 13
Microeconomic Data: Financial Development and Growth Rate of Value Added
Ordinary Least Squares regressionExternal dependence � market capitalization 0.015
(0.011)
External dependence � domestic credit private sector 0.033(0.021)
External dependence � financial development 0.013(0.008)
0.012(0.008)
External dependence � financial development �
transition economies-0.003(0.030)
Constant -0.138(0.053)**
-0.131(0.053)*
-0.136(0.053)*
-0.136(0.053)*
Observations 39467 39467 39467 39467
R2 0.01 0.01 0.01 0.01
LAD regressionsExternal dependence � market capitalization 0.001
(0.005)
External dependence � domestic credit private sector 0.007(0.009)
External dependence � financial development 0.001(0.003)
0.001(0.004)
External dependence � financial development �
transition economies-0.007(0.011)
Constant -0.065(0.022)**
-0.097(0.027)**
-0.066(0.023)**
-0.068(0.022)**
Observations 39467 39467 39467 39467
Note. The dependent variable is the firms’ average growth rate of value added from 1996 to 2001. Eachregression includes a full set of country and sector dummies. Robust standard errors are reported in parenthesis.Two stars denote that the coefficient is statistically different from zero at the 1 percent level, one star at the 5percent level.

73
Table 14
Microeconomic Data: Financial Development and Growth, by Firms' Size
Growth of sales
OLS regression LAD regression
Small firms Large firms Small firms Large firms
External dependence �financial development
0.057(0.021)**
0.004(0.017)
0.025(0.004)**
0.012(0.006)*
Constant 0.202(0.130)
0.886(0.591)
-0.014(0.053)
0.103(0.066)
Observations 28982 10357 28982 10357
R2 0.04 0.02
Note. The dependent variable is the firms’ average growth rate of sales from 1996 to 2001. Firms’ size is definedon the basis of the average number of employees between 1996 and 2001. Small firms have less than 200employees, large firms more than 200 employees. Each regression includes a full set of country and sectordummies. Robust standard errors are reported in parenthesis. Two stars denote that the coefficient is statisticallydifferent from zero at the 1 percent level, one star at the 5 percent level.
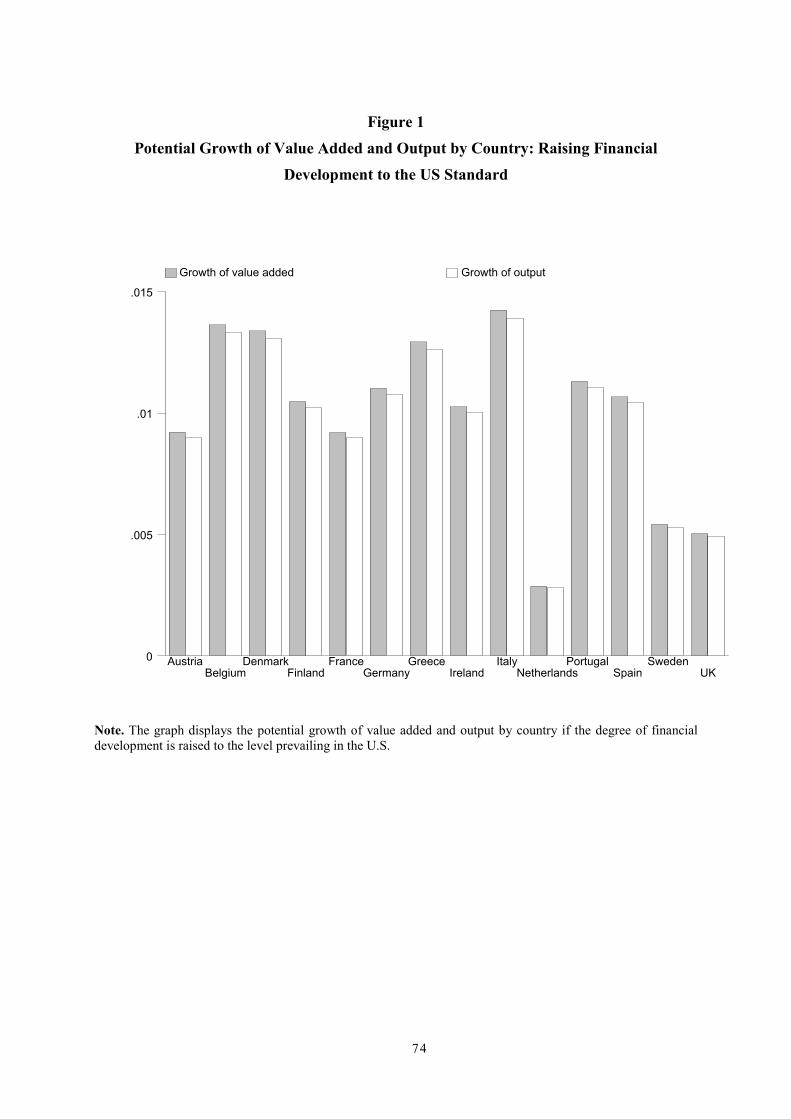
74
Figure 1
Potential Growth of Value Added and Output by Country: Raising Financial
Development to the US Standard
0
.005
.01
.015
Growth of value added Growth of output
AustriaBelgium
DenmarkFinland
FranceGermany
GreeceIreland
ItalyNetherlands
PortugalSpain
SwedenUK
Note. The graph displays the potential growth of value added and output by country if the degree of financialdevelopment is raised to the level prevailing in the U.S.

75
Figure 2
Potential Growth of Value Added and Output by Sector: Raising Financial
Development to the US Standard
0
.02
.04
Growth of value added Growth of output
DrugsElectric machinery
GlassOffice & computing
Other industriesPlastic products
Professional goodsRadio
Textile
Note. The graph displays the potential growth of value added and output by sector if the degree of financialdevelopment is raised to the U.S. level. We report the potential growth of value added and output of the ninemost growing sectors.

76
Figure 3
Potential Growth of Value Added and Output by Country: Raising the Determinants ofFinancial Development to the Maximum EU Standard
0
.005
.01
.015
Growth of value added Growth of output
AustriaBelgium
DenmarkFinland
FranceGermany
GreeceItaly
NetherlandsPortugal
SpainSweden
UK
Note. The graph displays the potential growth of value added and output by country if the determinants offinancial development (accounting standards, degree of creditors’ protection and rule of law) are raised to themaximum EU standard.
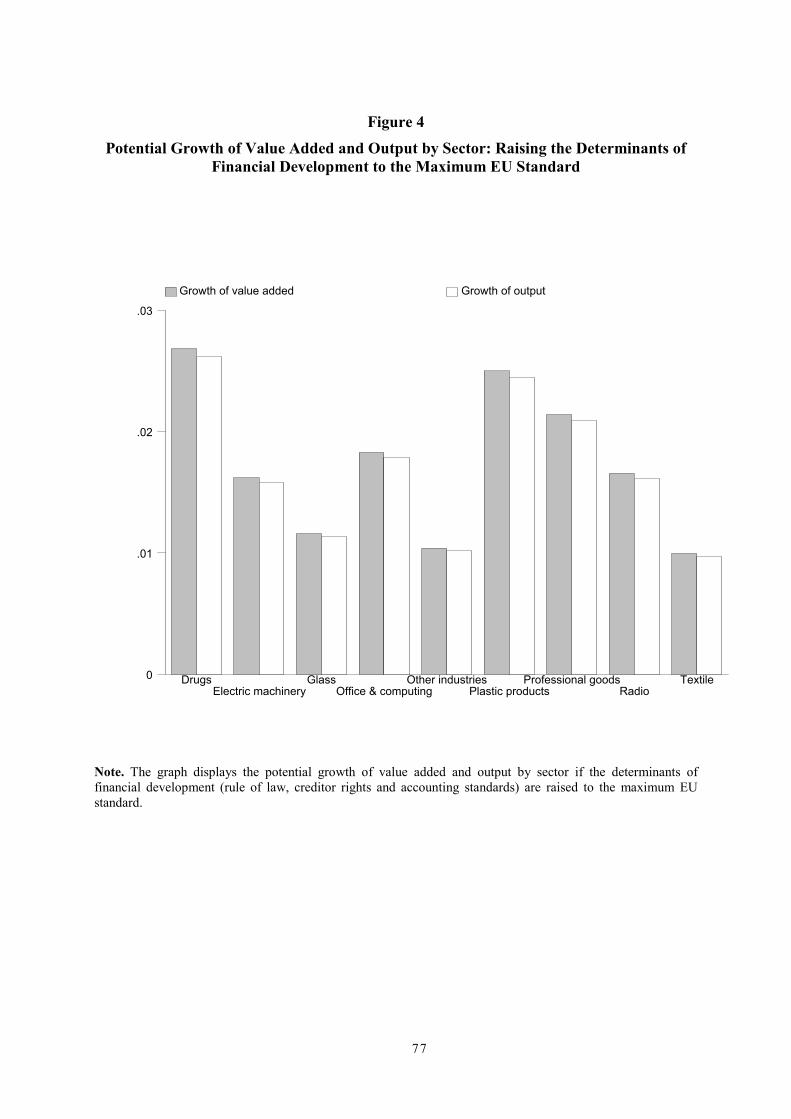
77
Figure 4
Potential Growth of Value Added and Output by Sector: Raising the Determinants ofFinancial Development to the Maximum EU Standard
0
.01
.02
.03
Growth of value added Growth of output
DrugsElectric machinery
GlassOffice & computing
Other industriesPlastic products
Professional goodsRadio
Textile
Note. The graph displays the potential growth of value added and output by sector if the determinants offinancial development (rule of law, creditor rights and accounting standards) are raised to the maximum EUstandard.
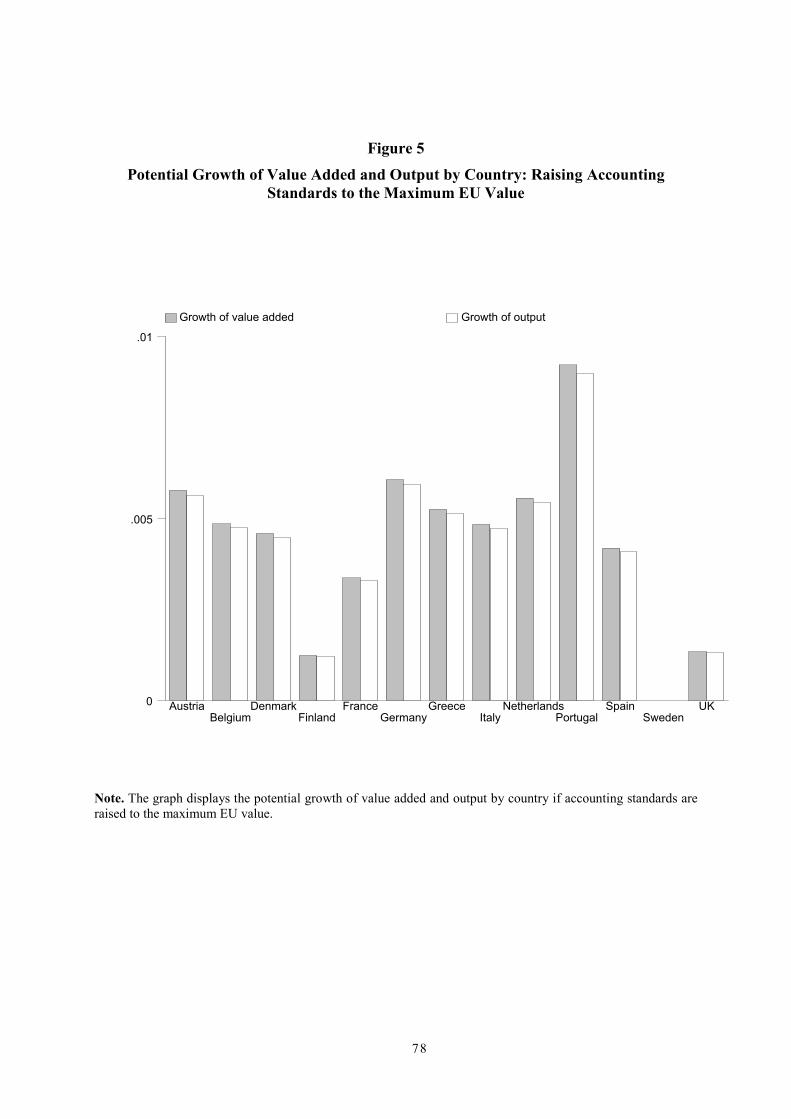
78
Figure 5
Potential Growth of Value Added and Output by Country: Raising AccountingStandards to the Maximum EU Value
0
.005
.01
Growth of value added Growth of output
AustriaBelgium
DenmarkFinland
FranceGermany
GreeceItaly
NetherlandsPortugal
SpainSweden
UK
Note. The graph displays the potential growth of value added and output by country if accounting standards areraised to the maximum EU value.

79
Figure 6
Potential Growth of Value Added and Output by Country: Raising the Degree ofCreditors’ Protection to the Maximum EU Standard
0
.002
.004
Growth of value added Growth of output
AustriaBelgium
DenmarkFinland
FranceGermany
GreeceItaly
NetherlandsPortugal
SpainSweden
UK
Note. The graph displays the potential growth of value added and output by country if the degree of creditors’protection is raised to the maximum EU standard.

80
Figure 7
Potential Growth of Value Added and Output by Country: Raising the Rule of Law tothe Maximum EU Standard
0
.001
.002
.003
Growth of value added Growth of output
AustriaBelgium
DenmarkFinland
FranceGermany
GreeceItaly
NetherlandsPortugal
SpainSweden
UK
Note. The graph displays the potential growth of value added and output by country if the rule of law is raised tothe maximum EU standard.