european economic 2009 -...
TRANSCRIPT

European Economic Forecast - autumn 2009EUROPEAN ECONOMY 10|2009
EUROPEAN COMMISSION

European Commission Directorate-General for Economic and Financial Affairs
COMMISSION STAFF WORKING DOCUMENT
European Economic Forecast Autumn 2009
EUROPEAN ECONOMY 10/2009

CONTENTS
iii
Overview 1
PART I: Economic developments at the aggregated level 5 1. The EU economy: the road ahead 7
1.1. Adjusting to a new steady state 7 1.2. The EU economy gradually emerging from the deep recession 10 1.3. Uncertainty remains high 32 1.4. Economic challenges ahead 33
2. Recent labour market developments and prospects 34 2.1. Labour market performance 34 2.2. Factors driving the labour market outlook 37
3. Government debt: past and future challenges 50 3.1. Economics of high government debt 51 3.2. Debt dynamics in historical perspective 52 3.3. Government developments during previous financial crisis periods 54 3.4. Government debt developments in the current crisis 56 3.5. Mechanical projections until 2020 59 3.6. A challenging consolidation ahead 62
PART II: Prospects by individual economy 67
Member States 69 1. Belgium: The path from policy-supported recovery to sustainable
growth 70 2. Bulgaria: From recession to a more balanced growth pattern 73 3. The Czech Republic: From recession to gradual recovery 76 4. Denmark: Fiscal stimulus and private consumption underpin
recovery 79 5. Germany: Export-led rebound eventually turning into broad-
based recovery 82 6. Estonia: On a path of rapid adjustment 86 7. Ireland: Significant domestic adjustment underlying a gradual
recovery 89 8. Greece: Economic downturn challenges public finances 92 9. Spain: A protracted economic adjustment ahead 95 10. France: Storm successfully weathered, uneven recovery
underway 99 11. Italy: After the crisis, a return to moderate growth 103 12. Cyprus: Ongoing economic adjustment, slow recovery ahead 107 13. Latvia: Bulk of output correction over, public finances and the
economy still reshaping 110 14. Lithuania: Sharp contraction puts public finances under strong
pressure 114 15. Luxembourg: Recession followed by a relatively mild recovery 117 16. Hungary: Forceful adjustments help reduce economic
vulnerabilities 120 17. Malta: Fragile recovery ahead 123 18. The Netherlands: Recovery from recession to be led by external
demand 126

iv
19. Austria: From export-led recession to gradual export-led recovery 129 20. Poland: Weathering the crisis relatively well 132 21. Portugal: Gradual and shallow recovery 135 22. Romania: Gradual recovery and correction of imbalances under
way 138 23. Slovenia: Sharp fall in activity followed by subdued recovery 141 24. Slovakia: Resuming real convergence following a deep
recession 144 25. Finland: Strong external exposure takes its toll on the economy 147 26. Sweden: Unemployment and fiscal deficit to peak amid muted
recovery 150 27. The United Kingdom: Path to recovery complicated by
remaining imbalances 153
Candidate Countries 157 28. Croatia: Mild recovery after strong contraction 158 29. The former Yugoslav Republic of Macedonia: Workers'
remittances support stability 161 30. Turkey: Drawn-out recovery after deep recession 163
Other non-EU Countries 167 31. The United States of America: Strong headwinds will slow down
recovery 168 32. Japan: Huge economic challenges for the new government 171 33. China: Will China's growth model change? 174 34. EFTA: Different paths towards recovery 177 35. Russian Federation: Unexpectedly deep recession, tentative
recovery 180
Statistical Annex 185
LIST OF TABLES I.1.1. International environment 16 I.1.4. Decomposition of the GDP growth forecast 20 I.1.2. Main features of the autumn 2009 forecast - EU 20 I.1.5. General government budgetary position - euro area and EU 30 I.1.6. Euro area - debt dynamics 31 I.1.3. Main features of the autumn 2009 forecast - euro area 33 I.2.1. Employment growth by type of contracts and level of
education 36 I.2.2. Employment and participation rates by age groups and
gender 36 I.2.3. Recessions followed by W- and V-shaped recoveries 42 I.3.1. Direct fiscal costs of banking crisis 56 I.3.2. Fiscal policy in the forecast horizon, EU and euro area 58 I.3.3. Decomposing the increases in debt ratio in the current crises 59 I.3.4. Public interventions in the banking sector (% GDP) 1/ 61 I.3.5. Levels and increases in projected age-related expenditure
as a share of GDP. 61 II.1.1. Main features of country forecast - BELGIUM 72 II.2.1. Main features of country forecast - BULGARIA 75

v
II.3.1. Main features of country forecast - THE CZECH REPUBLIC 78 II.4.1. Main features of country forecast - DENMARK 81 II.5.1. Main features of country forecast - GERMANY 85 II.6.1. Main features of country forecast - ESTONIA 88 II.7.1. Main features of country forecast - IRELAND 91 II.8.1. Main features of country forecast - GREECE 94 II.9.1. Main features of country forecast - SPAIN 98 II.10.1. Main features of country forecast - FRANCE 101 II.11.1. Main features of country forecast - ITALY 106 II.12.1. Main features of country forecast - CYPRUS 109 II.13.1. Main features of country forecast - LATVIA 112 II.14.1. Main features of country forecast - LITHUANIA 116 II.15.1. Main features of country forecast - LUXEMBOURG 118 II.16.1. Main features of country forecast - HUNGARY 122 II.17.1. Main features of country forecast - MALTA 125 II.18.1. Main features of country forecast - THE NETHERLANDS 128 II.19.1. Main features of country forecast - AUSTRIA 131 II.20.1. Main features of country forecast - POLAND 134 II.21.1. Main features of country forecast - PORTUGAL 137 II.22.1. Main features of country forecast - ROMANIA 140 II.23.1. Main features of country forecast - SLOVENIA 143 II.24.1. Main features of country forecast - SLOVAKIA 146 II.25.1. Main features of country forecast - FINLAND 149 II.26.1. Main features of country forecast - SWEDEN 152 II.27.1. Main features of country forecast - THE UNITED KINGDOM 156 II.28.1. Main features of country forecast - CROATIA 160 II.29.1. Main features of country forecast - THE FORMER YUGOSLAV
REPUBLIC OF MACEDONIA 162 II.30.1. Main features of country forecast - TURKEY 165 II.31.1. Main features of country forecast - THE UNITED STATES 170 II.32.1. Main features of country forecast - JAPAN 173 II.33.1. Main features of country forecast - CHINA 176 II.34.1. Main features of country forecast - EFTA 179 II.35.1. Main features of country forecast - RUSSIA 182
LIST OF GRAPHS I.1.1. GDP forecasts for 2009, euro area 8 I.1.2. Evolution of GDP and demand components across
recessions, EU 8 I.1.3a. Growth contributions in the downturn, current account
surplus countries 9 I.1.3b. Growth contributions in the downturn, current account
deficit countries 9 I.1.4a. Interbank market 11 I.1.4b. Corporate spreads over eurozone bonds 11 I.1.4c. Stock market performance 11 I.1.4d. Indicator of financing cost 11 I.1.5. Lending growth, euro area 13 I.1.6. Elasticity of world trade to world income (Freund 2009) 17 I.1.7. World trade and industrial activity advance indicators 17 I.1.8. Inventory adjustment and industrial production, euro area 19 I.1.9. Business cycle tracer, euro area 20

vi
I.1.10. Equipment investment and capacity utilisation in manufacturing, EU 22
I.1.11. Equipment investment and business confidence, EU 22 I.1.12. Private consumption, disposable income and net social
transfers, euro area 23 I.1.13. Employment growth and unemployment rate, EU 23 I.1.14. Average quarterly changes at the start of past recoveries,
euro area 26 I.1.15. Unemployment rate following recessions, euro area 26 I.1.16. Actual and structural unemployment rate, euro area 26 I.1.17. Contributions to inflation, euro area 27 I.1.18. Headline and core inflation forecast, euro area 27 I.1.19. Inflation expectations, euro area 29 I.1.20. Increase in government deficit across recessions, euro area 30 I.1.21. Total revenue and expenditure (four-quarter moving
average), EU 31 I.1.22. Euro area GDP forecasts: Uncertainty linked to the balance
of risks 33 I.2.1. Unemployment rates in the EU 34 I.2.2. Employment and GDP growth in the EU 35 I.2.3. Correlation between output growth and change in
unemployment 2006Q2-2009Q1 38 I.2.4. Average hours worked in selected countries - change
20008Q2-2009Q1 38 I.2.5a. Gap between actual and predicted employment growth 38 I.2.5b. Gap between actual and predicted unemployment rate
changes 38 I.2.6. Changes in unemployment around recessions 40 I.2.7. The Okun's coefficient over different periods 41 I.2.8. Okun's coefficients: rolling regression estimates 42 I.2.9a. Average evolution of GDP growth in the quarters following
the recession 43 I.2.9b. Average evolution of unemployment rate in the quarters
following the recession 43 I.2.9c. Average evolution of labour force in the quarters following
the recession 43 I.2.9d. Average evolution of employment in the quarters following
the recession 43 I.2.10a. Spain - A measure of sectoral reallocation - Employment
growth by sector (7 branches) - Standard deviation 44 I.2.10b. Italy - A measure of sectoral reallocation - Employment
growth by sector (7 branches) - Standard deviation 44 I.2.10c. France - A measure of sectoral reallocation - Employment
growth by sector (7 branches) - Standard deviation 44 I.2.10d. Germany - A measure of sectoral reallocation - Employment
growth by sector (7 branches) - Standard deviation 44 I.2.11. The Beveridge curve, euro area 46 I.2.12a. Compensation per employee and negotiated wages 47 I.2.12b. Compensation per employee and negotiated wages 47 I.3.1. Developments in government gross debt, primary balance,
real effective interest rate, nominal and potential GDP growth, EU 53

vii
I.3.2. Contributions to the change in government debt ratios of: interest expenditure, primary balance, stock flow adjustment, real GDP and GDP deflator growth, EU 54
I.3.3. Government balance, cyclically-adjusted primary balance and gross debt, EU 55
I.3.4. Historical changes in debt in previous financial crises 57 I.3.5. Developments up to 2020 in the gross debt-to-GDP ratio in
euro-area Member States assuming no consolidation on top of fiscal stimulus withdrawal 63
I.3.6. Developments up to 2020 in the gross debt-to-GDP ratio in non-euro-area Member States assuming no consolidation on top of fiscal stimulus withdrawal 63
I.3.7. Developments up to 2020 in the gross debt-to-GDP ratio in euro-area Member States assuming an annual 0.5 pp. consolidation 64
I.3.8. Developments up to 2020 in the gross debt-to-GDP ratio in non-euro-area Member States assuming an annual 0.5 pp. consolidation 64
I.3.9. The effort required to bring debt to 60% of GDP by 2020 65 I.3.10. Developments up to 2020 in the gross debt-to-GDP ratio in
the EU: unchanged policy vis-à-vis consolidation assumptions 65
I.3.11. Primary balances underlying the medium-term projections for government debt. 65
II.1.1. Belgium - Business confidence and GDP growth 70 II.1.2. Belgium - Public finance trends 71 II.2.1. Bulgaria - Inflation, current account balance and
contributions to GDP growth 73 II.3.1. The Czech Republic - Contributions to GDP growth 76 II.3.2. The Czech Republic - Government finances 77 II.4.1. Denmark - GDP growth and contributions 79 II.5.1. Germany - GDP growth and contributions 82 II.5.2. Germany - Private consumption and real disposable income 83 II.5.3. Germany - General government gross debt and deficit 84 II.6.1. Estonia - GDP, external balance, inflation and wage growth 86 II.7.1. Ireland - Real GDP growth, growth contributions and
unemployment rate 90 II.8.1. Greece - Net lending or net borrowing of the economy 92 II.9.1. Spain - Contributions to growth 96 II.9.2. Spain - General government accounts 97 II.10.1. France - GDP growth and contributions 99 II.10.2. France - General government gross debt and deficit 101 II.11.1. Italy - Real GDP levels and main components 103 II.11.2. Italy - Government revenues and primary expenditure
excluding one-offs 105 II.12.1. Cyprus - Public Finances 107 II.13.1. Latvia - GDP growth and contributions 110 II.13.2. Latvia - Output gap, inflation, unit labour cost 111 II.14.1. Lithuania - Unemployment rate and compensation per
employee 114 II.14.2. Lithuania - General government deficit and gross debt 115 II.15.1. Luxembourg - Employment and GDP 117 II.16.1. Hungary - General government balance and public debt 121 II.17.1. Malta - General government finances 124

viii
II.18.1. The Netherlands - Unemployment and vacancy rates 126 II.18.2. The Netherlands - Government balance and debt 127 II.19.1. Austria - GDP growth and contributions 130 II.20.1. Poland - GDP growth and contributions 132 II.21.1. Portugal - Net external liabilities, GDP and GNI 135 II.21.2. Portugal - Government debt 136 II.22.1. Romania - Contributions to growth 139 II.23.1. Slovenia - GDP and exports growth, volumes 141 II.24.1. Slovakia - GDP growth and contributions 144 II.25.1. Finland - Exports and imports 147 II.26.1. Sweden - Contributions to GDP growth 150 II.27.1. The United Kingdom - Output gap and contributions to GDP
growth 153 II.27.2. The United Kingdom - Households' balance sheet and saving
ratio 154 II.27.3. The United Kingdom - Monetary Conditions Indicators 155 II.28.1. Croatia - Contributions to GDP growth 159 II.29.1. The former Yugoslav Republic of Macedonia - Labour
market 161 II.29.2. The former Yugoslav Republic of Macedonia - Public
finances 162 II.30.1. Turkey - Growth, consumption and investment 163 II.30.2. Turkey - Public finances 164 II.31.1. USA - Quarterly growth rate of real GDP 169 II.32.1. Japan - Yen per US dollar 171 II.32.2. Japan - Consumer prices 172 II.33.1. China - Export volumes growth 174 II.33.2. China - Current account balance 175 II.34.1. EFTA - GDP growth 177 II.34.2. EFTA - Unemployment 178 II.35.1. Russia - GDP 180
LIST OF BOXES I.1.1. Some technical elements behind the forecast 12 I.1.2. Private sector's financial situation: impact on future growth 14 I.1.3. Developments in global imbalances 18 I.1.4. The household saving rate in the current recovery 24 I.1.5. Competitiveness divergence within the euro area could
weigh on the recovery 28 I.3.1. Assumptions underlying the medium term projection for
gross debt of the general government 66

EDITORIAL
ix
The EU economy is, finally, at the turning point. Signs of improvement in the economic situation and outlook have become increasingly apparent this autumn. For the first time in two years, the forecast has been revised up. GDP growth is expected to turn positive again in the second half of the year, thereby putting an end to the deepest, longest and most broad-based recession in EU's history. This would not have been possible without the determined and concerted policy action taken EU wide. In so doing, both a systemic meltdown and an outright depression were avoided. The extraordinary public support put in place under the umbrella of the European Economic Recovery Plan has been instrumental in stabilising the economy. It is now key to fully implement the announced measures to maintain the positive growth momentum. Moreover, it is time to move beyond short-term demand management to address the supply-side forces at play.
Indeed, while the recession may be over, the impact of the crisis is not. Although several financial stress indicators are back at pre-crisis levels, the banking sector remains fragile. Possible further losses are estimated to range from some €200 to €400 bn in 2009-2010 for this sector. There is also a need for deleveraging among households and firms. Capital costs are set to remain higher (than in the pre-crisis period) due to elevated risk premia. These factors are expected to put a brake on investment and consumption growth going forward. Moreover, the full impact of the crisis on the labour market and public finances is yet to come. However, there are also risks on the upside. The recovery could, for example, prove more pronounced if the impact of measures to restore the soundness of the financial sector and on confidence proves stronger than expected.
Following an initial, largely policy-driven boost, economic activity is expected to ease somewhat in the course of next year and to regain ground only gradually as domestic and external demand strengthen. Two areas stand out as particularly important in determining how the EU economy will evolve over the more medium term. This forecast document therefore contains two analytical chapters discussing the impact of the crisis on labour markets and public debt.
Starting with the labour markets, developments so far (although dire) are better than earlier expected. This is partly explained by the use of short-term policy measures along with labour hoarding in some Member States. Firms are, however, expected to increase job shedding and the unemployment rate is set to rise further. Historical evidence suggests that an increase in unemployment following a financial crisis could become persistent. On the other hand, the better-than-expected development could in part reflect the favourable impact of past labour-market reforms, which made the labour markets more resilient.
Turning to public finances, the crisis is taking its toll on debt developments via its impact on fiscal balances and lower growth. Although the projected sharp increase in government debt ratios is not necessarily out of the ordinary for a financial crisis episode, the high initial level of debt, especially in some Member States, makes it more difficult to sustain. Once the underlying recovery has gained sufficient traction, i.e. in 2011, a period of fiscal consolidation will have to follow to put public debt back on a sustainable footing.
Summing up, this outlook points to a gradual recovery. It will be key to tackle the labour-market and debt challenges identified to ensure the transition to a solid sustainable recovery further out. Addressing these challenges with determination will allow the EU economy to emerge stronger after the crisis.
Marco Buti Director General Economic and Financial Affairs
OVERVIEW
1
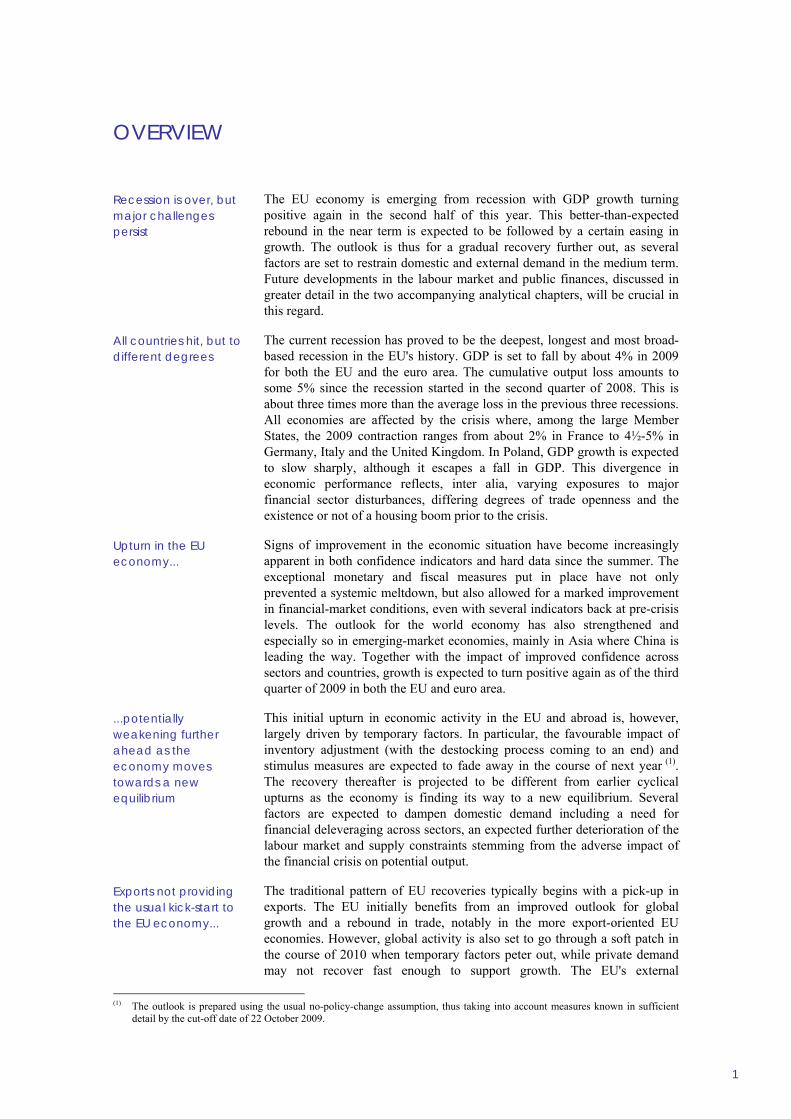
The EU economy is emerging from recession with GDP growth turning positive again in the second half of this year. This better-than-expected rebound in the near term is expected to be followed by a certain easing in growth. The outlook is thus for a gradual recovery further out, as several factors are set to restrain domestic and external demand in the medium term. Future developments in the labour market and public finances, discussed in greater detail in the two accompanying analytical chapters, will be crucial in this regard.
The current recession has proved to be the deepest, longest and most broad-based recession in the EU's history. GDP is set to fall by about 4% in 2009 for both the EU and the euro area. The cumulative output loss amounts to some 5% since the recession started in the second quarter of 2008. This is about three times more than the average loss in the previous three recessions. All economies are affected by the crisis where, among the large Member States, the 2009 contraction ranges from about 2% in France to 4½-5% in Germany, Italy and the United Kingdom. In Poland, GDP growth is expected to slow sharply, although it escapes a fall in GDP. This divergence in economic performance reflects, inter alia, varying exposures to major financial sector disturbances, differing degrees of trade openness and the existence or not of a housing boom prior to the crisis.
Signs of improvement in the economic situation have become increasingly apparent in both confidence indicators and hard data since the summer. The exceptional monetary and fiscal measures put in place have not only prevented a systemic meltdown, but also allowed for a marked improvement in financial-market conditions, even with several indicators back at pre-crisis levels. The outlook for the world economy has also strengthened and especially so in emerging-market economies, mainly in Asia where China is leading the way. Together with the impact of improved confidence across sectors and countries, growth is expected to turn positive again as of the third quarter of 2009 in both the EU and euro area.
This initial upturn in economic activity in the EU and abroad is, however, largely driven by temporary factors. In particular, the favourable impact of inventory adjustment (with the destocking process coming to an end) and stimulus measures are expected to fade away in the course of next year (1). The recovery thereafter is projected to be different from earlier cyclical upturns as the economy is finding its way to a new equilibrium. Several factors are expected to dampen domestic demand including a need for financial deleveraging across sectors, an expected further deterioration of the labour market and supply constraints stemming from the adverse impact of the financial crisis on potential output.
The traditional pattern of EU recoveries typically begins with a pick-up in exports. The EU initially benefits from an improved outlook for global growth and a rebound in trade, notably in the more export-oriented EU economies. However, global activity is also set to go through a soft patch in the course of 2010 when temporary factors peter out, while private demand may not recover fast enough to support growth. The EU's external
(1) The outlook is prepared using the usual no-policy-change assumption, thus taking into account measures known in sufficient
detail by the cut-off date of 22 October 2009.
Recession is over, but major challenges persist
All countries hit, but to different degrees
Upturn in the EU economy...
...potentially weakening further ahead as the economy moves towards a new equilibrium
Exports not providing the usual kick-start to the EU economy...

European Economic Forecast, Autumn 2009
2
environment is also affected by the ongoing rebalancing of world demand. As a result, EU export growth is set to firm only gradually over the forecast period.
Notwithstanding the support from an improved external environment, a sustained pick-up in the underlying recovery would require an improved outlook for private domestic demand. Traditionally, an upturn in exports spurs demand for investment which subsequently supports employment and private consumption growth. At present, however, this export - domestic demand nexus is anticipated to be weaker. A historically low capacity utilisation rate, relatively weak demand prospects, subdued profitability gains and still moderating credit growth underpin the projected (unusually moderate) recovery of gross fixed capital formation, which is projected to turn positive only in 2011. This, together with the need to deleverage households' balance sheets further and the expected bleak labour-market situation, is likely to make private consumption sluggish (recovering to about 1% growth only by 2011).
Overall, after the temporary boost expected during the second half of this year, real GDP growth is expected to ease somewhat and to regain ground only by the second half of next year. As both external and domestic demand gradually strengthen, growth could recover to about 0.5% quarter-on-quarter (q-o-q) during 2011 in both the EU and the euro area. Taking into account the weak carry-over from this year, annual growth rates will be limited to about ¾% in 2010 in both regions. The following year, GDP could grow by some 1½%, thereby starting to gradually close the output gap that will have opened up by then as a result of the crisis.
The recession has caused a deterioration in the labour market, although a less dramatic one than initially expected. This is largely explained by the use of short-term policy measures, along with the impact of past labour-market reforms and labour hoarding in some Member States. Firms are, however, expected to increase labour shedding in the coming quarters and the unemployment rate is set to increase further, reaching 10¼% in the EU in 2011 (10¾% in the euro area). Looking ahead to the medium term and as discussed in the labour-market chapter, the financial crisis implies a number of risks for labour-market developments – including the possibility of a 'jobless' recovery, persistently high unemployment and a shrinking workforce - with prospects further out depending on the flexibility of the market and the policies in place.
Growing slack in the economy, particularly high unemployment, should dampen wage and inflationary pressures in the period ahead, although consumer price inflation is expected to rebound somewhat from its current, very low level. HICP inflation is estimated to average 1-1¼% in 2010 and around 1½% in 2011 in both the EU and the euro area. Differences across countries are less pronounced than they were prior to the crisis and, area-wide, both actual inflation and inflation expectations appear well behaved.
Public finances have been hit hard by the crisis with the government deficit set to increase rapidly to 7½% of GDP by 2010 in the EU and to around 7% in the euro area (up from 2¼% in the EU and 2% in the euro area in 2008). This surge follows from the working of automatic stabilisers as the economic situation has deteriorated; the discretionary measures taken to support the economy; and the stronger-than-usual responsiveness of public revenues to the exceptional decline in economic activity and, as a result, tax bases, which
...while domestic demand is held back by the ongoing adjustment
Growth gradually picking up
But unemployment still on the rise...
...putting a lid on wage and price increases
Deficit and debt to soar as a result of the crisis

Overview
3
partly reflects the changed composition of growth (towards less tax-rich components). Similarly, public debt is bearing the brunt of the crisis and is expected to increase to 79¼% of GDP by 2010 in the EU (84% in the euro area). A certain improvement is foreseen in the deficit ratio in 2011 as economic activity picks up and temporary measures come to an end. However, the debt ratio remains on an increasing path in view of the still high primary deficit and rising interest payments, which have been only partly offset by the recovery in nominal GDP growth. Although a one-off increase in government debt does not in itself put public-finance sustainability at risk, the chapter on public-debt evolution argues that in combination with sustained large deficits, lower potential output and an unfavourable demographic development, the debt evolution is a source of concern for long-term sustainability.
The economic situation remains highly uncertain. Overall, risks to the growth outlook are broadly balanced. On the one hand, the recovery could prove more pronounced in the near term, with activity temporarily supported by the impact of discretionary measures and the turning of the inventory cycle. Further ahead, policy measures might boost the soundness of the financial sector, and confidence, by more than expected, thereby supporting domestic demand. Global demand (and hence exports) could also pick up more strongly. On the other hand, if the banking sector does not repair its balance sheet, the credit channel is likely to remain impaired posing a major downside risk to the sustainability of the recovery. The impact of deteriorating labour-market conditions on wage formation and savings behaviour could also prove worse than expected. Moreover, the low capacity utilisation and higher cost of capital could weigh more on investment.
Risks to the inflation outlook also appear largely balanced. Higher commodity prices imply upward price pressures, but these are expected to be broadly offset by downward pressure stemming from the remaining slack in the economy.
Uncertainty stays high, but risks are balanced


PART I Economic developments at the aggregated level


1. THE EU ECONOMY: THE ROAD AHEAD
7
1.1. ADJUSTING TO A NEW STEADY STATE
The world economy is beginning to gradually emerge from the worst recession in the post WWII era. The EU, like most other advanced regions, has been hit hard. Indeed, a key feature of the current severe downturn has been its global and synchronised nature, with all major regions registering a marked slowdown or contractions in output this year. The global nature of this recession reflects the high degree of interconnectedness of financial and product markets across international borders, which also played a role in the very rapid propagation of the global financial crisis to the real economy.
The size and impact of the financial shock have been markedly more pronounced than expected only a year ago. The current financial crisis is now widely regarded as the most severe shock to the global economy since the Great Depression of the 1930s. (2) While the financial turmoil broke out in the late summer of 2007, the failure of Lehman
(2) For a comprehensive account of the financial crisis and its
impact on the EU economy see European Commission (2009) Economic Crisis in Europe: Causes, Consequences and Responses, Directorate-General for Economic and Financial Affairs, European Economy Report (7/2009).
Brothers, a major US investment bank, in September 2008 dramatically changed the scene. It seriously damaged confidence among investors and thereafter rapidly pushed global financial markets to the brink of meltdown. The prevailing perception in the preceding period, that a systemic banking sector collapse was unlikely, suddenly lost credibility and gave way to panic. Interbank markets nearly stalled or became dysfunctional. Risk premia and credit spreads in the EU and abroad surged, while stocks, in particular those of financial institutions, went into tailspin. A second perception that changed was the belief that the EU economy would be partly immune to the financial turbulence, as the real economy was thought to be underpinned by strong fundamentals, at the aggregate level, and the financial system to have little direct exposure to the underlying source of the turbulence: the US sub-prime credit market. However, as graph I.1.1 shows, this perception rapidly gave way to a wave of pessimism, with forecasts being revised down at record speed to lows not seen in decades. Faced with a crisis that had began to feed on itself, reflecting feedback loops from deteriorating financial conditions to confidence and plunging economic activity, particularly in international trade and manufacturing, monetary and fiscal authorities acted decisively and in a concerted manner to
The EU economy is set to emerge from the deepest and longest recession in its history in the second half of this year and to embark on a gradual recovery over 2010 and 2011. This brighter outlook, compared with the Commission services’ spring forecast, reflects an upgrading of prospects for global growth and trade as well as noticeable improvements in financial market conditions, both supported by decisive policy actions to combat the crisis worldwide.
This cautiously optimistic outlook rests on the interplay of several important factors, which tend to push the economy in different directions in the short and medium term. The turning of the inventory cycle and the stimulus measures are expected to boost activity in the second half of this year and into 2010. Further ahead, elements restraining the pick-up in domestic private demand are expected to come to the fore. These include, inter alia, the deterioration of the labour market, the need for substantial financial deleveraging across all sectors and supply constraints stemming from the adverse impact of the financial crisis on potential output.
However, uncertainty is still high, as would be expected following a deep recession triggered by a global financial crisis that is not yet over. The impact on output, unemployment and balance sheets is likely to be profound and the underlying recovery, once the favourable effects of temporary factors peter out, may thus prove different from earlier cycles, as the EU economy finds its way to a new equilibrium in a changed domestic and external environment. Non-negligible risks, therefore, loom further out on the forecast horizon of the projected EU economic recovery.

European Economic Forecast, Autumn 2009
8
prevent a systemic meltdown. An unprecedented arsenal of policies was announced and implemented, which has managed to contain the crisis, stabilise financial markets and provide support to economic activity. (3)
Graph I.1.1: GDP forecasts for 2009, euro area
-5-4
-3-2-1
012
3
J08
F M A M J J A S O N D J09
F M A M J J A S O N D
Consensus CommissionIMF OECD
%
Nonetheless, the current recession is set to be the deepest, longest and most broad-based recession in the EU’s history, with real GDP expected to contract this year by some 4%. All Member States, except Poland, are estimated to register a fall in GDP this year. Among the largest Member States, the contractions range from about 2¼% in France to 5% in Germany and Italy. Within the euro area, the countries most affected are Slovenia and Ireland (around -7½%), followed closely by Finland (nearly -7%) and Slovakia (about -6%). Outside the euro area the contractions are generally more severe than for the euro area average, with, for instance, Denmark, Sweden and the UK estimated to contract by some 4½%. The situation is extreme in the Baltics, where the estimated GDP falls are in double digit figures (close to -14% in Estonia and about -18% in Latvia and Lithuania).
At the aggregate EU level, the cumulative output loss since GDP started to contract in the second quarter of 2008 is slightly over 5 pps. This is about three times as large as the average output loss in the previous three recessions since the 1970s (see graph I.1.2). In terms of length, the current recession spanned five consecutive quarters of contractions and was more than twice as long as the recessions of the early 1970s and 1980s, though only a quarter longer than that of the early 1990s. The relative size of the current loss of output is in line with recent research findings on (3) See section 1.2 in this chapter for a discussion on the
improvement in financial markets since the spring.
the characteristics of recessions following periods of financial distress, which are generally more severe than 'ordinary' recessions. According to this research, the output losses following banking crises are two to three times greater than in ordinary recessions. (4)
Graph I.1.2: Evolution of GDP and demand components across recessions, EU
-20
-15
-10
-5
0
5
GDP Priv.Cons.
Gov.Cons.
Invest. Exports Imports
Average of previous recessions Current recession
pps.
Note: 74Q4, 80Q2, 92Q2 and 08Q2 identify the first quarter of negative q-o-q GDP growth in the corresponding recession.
Within GDP, sizable losses in trade and investment spending characterise the current recession. Reflecting the near collapse of world trade at the turn of the year, the cumulative loss in export and import volumes has been staggering, in the order of 18 and 17 pps. respectively. The drop was over four times as large as the average decline in previous recessions for exports and about three times for imports. Next in order of importance was the decline in spending on gross fixed capital formation (incl. inventories), which fell by some 13 pps., also about three times larger a drop than in previous recessions. In stark contrast, the drop in private consumption spending was only slightly larger compared to the average of previous recessions. In fact, private consumption appears to have been a stabilising factor, contracting significantly less than GDP in this recession. Finally, owing to the forceful policy response to the crisis and the work of automatic stabilisers, public spending increased in this recession by more than the average of the previous recessions.
Consistent with this picture, the contributions of demand components show that the main drags on growth during this downturn were the collapse in fixed capital formation and strong stock
(4) See for instance Claessens, S., A. Ayhan Kose and M. E.
Terrones (2009) "What happens during recessions, crunches and busts?", Economic Policy, 24:60, October, pp. 653-700; Reinhart, C.M. and K. Rogoff (2009) "The aftermath of financial crises", American Economic Review Papers and Proceedings, 99:2, May, pp. 466-472.

Economic developments at the aggregated level
9
liquidation. However, given that the deep fall of exports mentioned above was nearly matched by that of imports, the drag from net exports appears comparatively small. Nevertheless, this perspective conceals the important role of external demand in the contraction of activity, as the former was in large part responsible for the decline in investment and the sharp destocking.
The crisis has had asymmetric effects across Member States. The impact varied depending, inter alia, on (i) the degree of exposure to risky assets and the size of the financial sector (e.g. the UK) (ii) the export dependency of the economy (e.g. Germany) and the current account position (e.g. Hungary, the Baltics) and (iii) the extent to which house prices had been overvalued and construction industries oversized (e.g. Ireland and Spain).
Graph I.1.3a: Growth contributions in the downturn, current account surplus countries
-6
-4
-2
0
2
4
07Q1 07Q2 07Q3 07Q4 08Q1 08Q2 08Q3 08Q4 09Q1
Priv. Cons. Gov.Cons.Invest. StocksNet Exports GDP (y-o-y%)
pps.
Graph I.1.3b: Growth contributions in the downturn, current account deficit countries
-5
-3
-1
1
3
5
07Q1 07Q2 07Q3 07Q4 08Q1 08Q2 08Q3 08Q4 09Q1
Priv. Cons. Gov.Cons.Invest. StocksNet Exports GDP (y-o-y%)
pps.
For instance, as illustrated in graphs (I.1.3a,b), the impact on the composition of growth has been different across countries, depending on their initial current account position (with surplus countries having had a comparatively stronger contraction of net exports, while deficit countries having registered larger contractions in domestic demand). Thus, the crisis appears to have triggered adjustments of current account imbalances within
the EU. To what extent this process is cyclical or lasting remains an open question (see also Box I.1.5).
The recognition that growth in the pre-crisis period was amply supported by unsustainable financial conditions suggests that the EU economy may now be in a transition phase to a new steady state, with possibly numerous structural breaks in the traditional relationships linking economic variables. These considerations, which come on top of the inherent difficulties in assessing the outlook at a cyclical turning point, make the context of the present forecast rather unique.
What might this new equilibrium for the EU economy look like? While it is certainly too early to provide an accurate description, one can point to the main forces likely to delineate its contours. Firstly, it seems reasonable to expect a higher cost of capital, due to higher risk premia than in the pre-crisis period, as the crisis has made investors acutely aware of consequences of mispricing risk. Secondly, a related aspect is that the current crisis has exposed sizable vulnerabilities within the EU economy, notably the excessive financial leverage of households, firms and governments. The ensuing deleveraging process is likely to take some time and constrain the response of each sector to the recovery. Thirdly, the full impact of the severe recession triggered by the crisis has yet to be felt in the labour market and public finances. In labour markets, apart from the cyclical deterioration, some traditionally key industries that are harshly hit by the crisis may have to be downsized or relocated, potentially leading to increases in structural unemployment (a higher NAIRU). Regarding public finances, following the exceptional stimulus, a protracted period of fiscal consolidation will have to follow at some stage to put public debt back on a sustainable footing. Fourthly, in the absence of appropriate policy responses, a considerable deterioration in these areas could impinge on growth prospects in the medium term. Indeed, a key question at the current juncture is whether and to what extent the crisis will cast a long shadow on potential output. (5) Finally, the external environment for the EU and the euro area is likely to become different too, with a euro that remains strong and if a sustainable
(5) See for example European Commission (2009) "Impact of
the current financial and economic crisis on potential output", Directorate-General for Economic and Financial Affairs, European Economy Occasional Paper N° 49, June; OECD (2009) Economic Outlook 85; IMF (2009) World Economic Outlook, October.

European Economic Forecast, Autumn 2009
10
rebalancing of world demand is to come via an export-led recovery for the US. (6)
These various forces are likely to affect Member States differently. For instance, within the euro area, Spain and Ireland, and outside it, the Baltics, which are most affected by an increase in unemployment, may also face the risk of a considerable increase in the NAIRU, as part of the deterioration in the labour market is related to the need to adjust oversized construction sectors.
The next sections of this chapter present the short-term outlook for the EU economy, addressing to some extent also these more medium-term questions, as the autumn forecast presented here extends the forecast horizon to 2011. Indeed, the outlook described below is shaped by different forces affecting in opposing direction the short-term and more medium-term growth dynamics. In the short term, growth is set to recover – quite strongly in some cases, e.g. Germany and France – on the back of the stimulus measures and an end to the sharp destocking. Beyond the short term, once the favourable impact of these temporary factors subsides, important forces restraining the pick-up in domestic private demand come into play. These include, inter alia, historically low levels of capacity utilisation, still impaired financial intermediation, the need for substantial financial deleveraging across all sectors, the further deterioration of the labour market, the possible increase in the household saving rate and, not least, the estimated adverse impact of the financial crisis on potential output.
1.2. THE EU ECONOMY GRADUALLY EMERGING FROM THE DEEP RECESSION
The economic situation in the EU and the euro area has brightened since spring. The pace of quarter-on-quarter (q-o-q) GDP contraction slowed markedly in the second quarter of 2009 in both regions, declining by merely 0.3% in the EU and 0.2% in the euro area. This follows GDP contractions of almost 2% in the last quarter of 2008 and some 2½% in the first quarter of 2009 in the two regions. This indicates that a cyclical turning-point might have been reached in the first quarter of this year. All GDP components except stock-building registered some improvement
(6) The technical exchange rate assumptions for 2009-11, as
well as other external assumptions, are spelled out in the technical box I.1.1.
relative to the first quarter. In particular, the two largest Member States, Germany and France, surprised on the upside, posting positive growth rates (+0.3% for both) in that quarter, after over a year of quarterly contractions. These two economies are thus leading the way in the region's nascent recovery. Activity continued to contract, although at an appreciably slower pace, in Italy (-0.5%), Spain and the Netherlands (both -1.1%).
The stabilisation of the pace of economic activity in the EU stems from exceptional monetary and fiscal policy stimuli as well as considerable improvements in the main factors that previously drained growth, namely financial markets and the external environment. Indeed, improvements in the latter are necessary to underpin any upgrading of prospects for the EU demand components most affected by the crisis: exports and investment.
Financial market conditions are improving and…
The swift and large-scale policy actions undertaken by governments and central banks in response to the crisis have not only been successful in preventing a systemic meltdown, they have also led to the marked improvement in financial market conditions observed in the last few months, with some stress indicators now back at pre-crisis levels. Confidence among market participants has also strengthened on the back of a widening stream of positive news on the outlook for the real economy as well as better-than-expected earnings reports by both non-financial corporates and banks.
Indeed, with falling risk perceptions and easing risk premia, financial markets have improved considerably since the spring. In interbank money markets, responding to sustained loose monetary policy and declines in the risk perception of financial institutions, spreads have continued to narrow, reaching levels not seen since the beginning of 2008, and in some cases even earlier (e.g. in the US). Corporate and sovereign bond spreads have also continued to narrow, supported by a decline in default perceptions and receding liquidity and solvency premia.
Stock markets around the world have rallied on the back of renewed optimism regarding corporate profits and the global economic outlook. Most EU stock indices have gained some 15% since the

Economic developments at the aggregated level
11
spring forecast was released in May, with the rebound in financial sector sub-indices being more pronounced (around 20%), in some cases already recovering the losses since November 2008 (S&P 500). (7) It is noteworthy that the increasing risk appetite across financial markets has not affected sovereign benchmark yields very much, which consequently remained broadly at low levels. (8). In sum, the markets currently appear to be pricing in a sustained economic recovery that has yet to be confirmed.
These developments combined with lower interest rates have translated into lower financing cost for both non-financial corporations and households. According to the Composite Financing Cost
(7) The rally in banking shares materialised in spite of ongoing
concerns regarding the health of banks' balance sheets in developed economies.
(8) Government bond yields seem to embody a more cautious assessment of the growth outlook than that reflected in stock price developments over the same period. Moreover, lower short-rate expectations have most likely added to lower long-term yields. Finally, a sustained buying of government bonds by the banking sector and institutional investors may have supported bond prices, despite strong issuance.
Indicator (CFCI) compiled by the Commission services,(9) nominal euro-area financing costs for non-financial corporations have declined by about 1½ pp. since the peak in October 2008, reflecting the lower cost of bank loans, equity capital and market debt. For households, the CFCI declined by 1 percentage point since the peak in October 2008, as the cost of all types of loans fell with lower retail and market interest rates. However, fund raising has been driven mostly by large high-rated borrowers in economic sectors that have been less hit by the crisis, while smaller and more distressed companies are still shut out.
(9) The CFCIs synthesise developments in external financing
costs for nonfinancial corporations and households. The indicators are calculated as averages of the different external financing costs, weighted according to their importance for financing (i.e. share of total outstanding liabilities). For euro area non-financial corporations the CFCI combines the marginal costs of taking up short-, medium- and long-term bank loans, market-based debt and quoted equity. For euro-area households, the CFCI combines the cost of bank lending for short-, medium- and long-term consumer credit, lending for house purchases and lending for other purposes. For further details, see European Commission (2008) Quarterly Report on the Euro Area, volume 7, No 4, where the CFCI were first presented.
0
50
100
150
200
250
300
350
400
Mar-07 Sep-07 Mar-08 Sep-08 Mar-09 Sep-09
3m EURIBOR over OIS (overnight index swaps)3m USD LIBOR over OIS3m GBP LIBOR over OIS
bps.Graph I.1.4a: Interbank market Graph I.1.4b: Corporate spreads over eurozone bonds
0
50
100
150
200
250
300
350
400
450
500
Jan-07 Jul-07 Jan-08 Jul-08 Jan-09 Jul-09
bps.
BBB
AAA
AA
A
Graph I.1.4c: Stock market performance
102030405060708090
100110
Jan-07 Jul-07 Jan-08 Jul-08 Jan-09 Jul-09Financials Eurostoxx 50
Jan 2007=100
Graph I.1.4d: Indicator of financing cost
3.0
3.5
4.0
4.5
5.0
5.5
6.0
Mar-03 Mar-04 Mar-05 Mar-06 Mar-07 Mar-08 Mar-09
Households Corporations
%

European Economic Forecast, Autumn 2009
12
Box I.1.1: Some technical elements behind the forecast
The overall cut-off date for taking new information into account in this update of the Commission's macroeconomic outlook was 22 October.
External assumptions
This forecast is based on a set of external assumptions, reflecting market expectations at the time of the forecast. To shield the assumptions from possible volatility during any given trading day, averages from a 10-day reference period (between 6 and 19 October) were used for exchange and interest rates, and for oil prices.
Exchange and interest rates
The technical assumption as regards exchange rates was standardised using fixed nominal exchange rates for all currencies. This technical assumption leads to implied average USD/EUR rates of 1.39 in 2009 and 1.48 in 2010 and 2011. For the average JPY/EUR rates it leads to 130.20 in 2009 and 132.82 in 2010 and 2011.
Interest-rate assumptions are market-based. Short-term interest rates for the euro area are derived from future contracts. Long-term interest rates for the euro area, as well as short- and long-term interest rates for other Member States, are calculated using implicit forward swap rates, corrected for the current spread between the interest rate and swap rate. In cases where no market instrument is available, a fixed spread vis-à-vis euro-area interest rates is taken for both short- and long-term rates. As a result, short-term interest rates are expected to be 1.3% on average in 2009, 1.5% in 2010 and 2.5% in 2011 in the euro area. Long-term interest rates are assumed to be 3.2% on average in 2009, 3.5% in 2010 and 3.8% in 2011.
Commodity prices
Commodity-price assumptions are also, as far as possible, based on market conditions. According to future markets, prices for Brent oil are projected to be on average 61.3 USD/bl. in 2009, 76.5 USD/bl. in 2010 and 80.5 USD/bl. in 2011. This would correspond to an oil price of 44.0 EUR/bl. in 2009, 51.7 EUR/bl. in 2010 and 54.3 EUR/bl. in 2011.
Budgetary data
Data up to 2008 are based on data notified by Member States to the European Commission on 1 October and validated by Eurostat on 22 October
2009 (1). In validating the data, Eurostat expressed a reservation for Greece ‘due to significant uncertainties over the figures notified by the Greek statistical authorities’.
As usual government deficit data notified by the UK for the years to 2008 have been slightly amended for consistency with Eurostat's view on the recording of UMTS licences proceeds.
For the forecast, measures in support of financial stability have been recorded in line with the Eurostat decision of 15 July 2009 (2). Unless reported otherwise by the Member State concerned, capital injections known in sufficient detail have been included in the forecast as financial transactions, i.e. increasing the debt, but not the deficit. State guarantees on bank liabilities and deposits are not included as government expenditure, unless there is evidence that they have been called at the time the forecast was closed. Note however that loans granted to banks by the government, or by other entities classified in the government sector, usually add to government debt.
For 2010, budgets adopted or presented to national parliaments and all other measures known in sufficient detail are taken into consideration. For 2011, the 'no-policy-change' assumption used in the forecasts implies the extrapolation of revenue and expenditure trends and the inclusion of measures that are known in sufficient detail.
The general government balances that are relevant for the excessive deficit procedure may be slightly different from those published in the national accounts. The difference concerns settlements under swaps and forward rate agreements (FRA). According to ESA95 (amended by regulation No 2558/2001), swap and FRA-related flows are financial transactions and therefore excluded from the calculation of the government balance. However, for the purposes of the excessive deficit procedure, those flows are recorded as net interest expenditure.
Calendar effects on GDP growth and output gaps
The number of working days may differ from one year to another. The Commission's annual GDP (1) Eurostat News Release N° 149/2009. (2) Eurostat News Release N° 103/2009.
(Continued on the next page)
Economic developments at the aggregated level
13
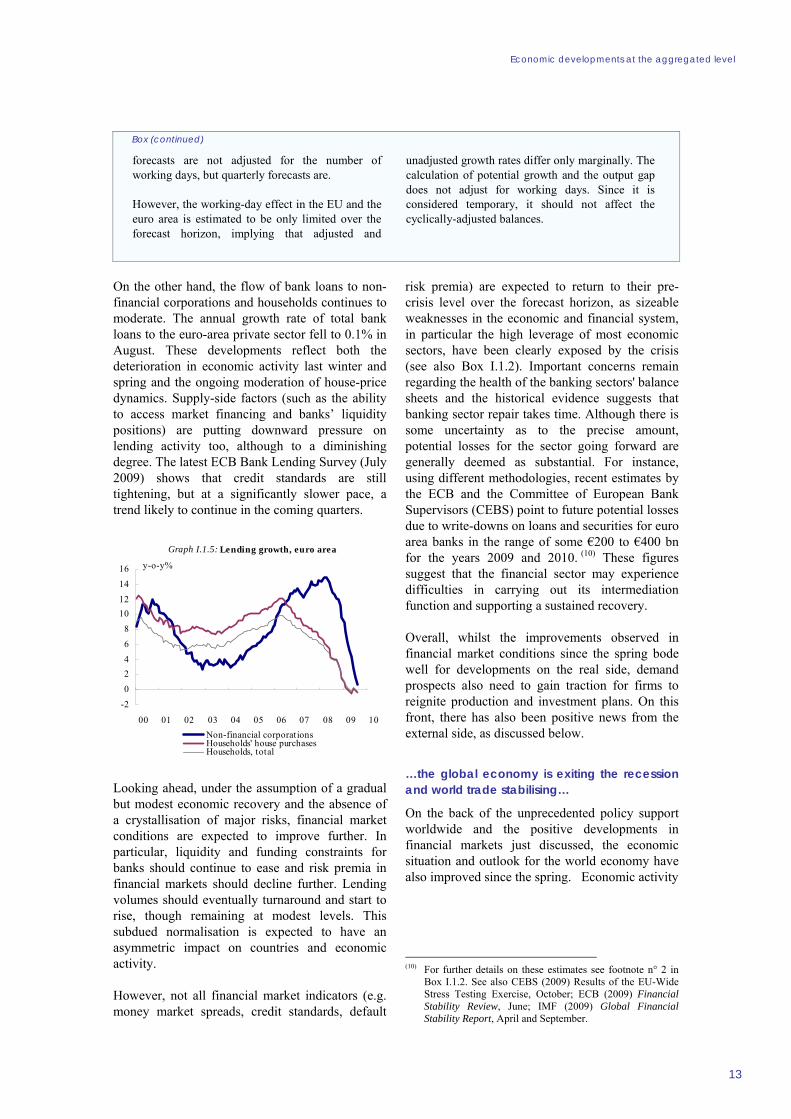
On the other hand, the flow of bank loans to non-financial corporations and households continues to moderate. The annual growth rate of total bank loans to the euro-area private sector fell to 0.1% in August. These developments reflect both the deterioration in economic activity last winter and spring and the ongoing moderation of house-price dynamics. Supply-side factors (such as the ability to access market financing and banks’ liquidity positions) are putting downward pressure on lending activity too, although to a diminishing degree. The latest ECB Bank Lending Survey (July 2009) shows that credit standards are still tightening, but at a significantly slower pace, a trend likely to continue in the coming quarters.
Graph I.1.5: Lending growth, euro area
-202468
10121416
00 01 02 03 04 05 06 07 08 09 10Non-financial corporationsHouseholds' house purchasesHouseholds, total
y-o-y%
Looking ahead, under the assumption of a gradual but modest economic recovery and the absence of a crystallisation of major risks, financial market conditions are expected to improve further. In particular, liquidity and funding constraints for banks should continue to ease and risk premia in financial markets should decline further. Lending volumes should eventually turnaround and start to rise, though remaining at modest levels. This subdued normalisation is expected to have an asymmetric impact on countries and economic activity.
However, not all financial market indicators (e.g. money market spreads, credit standards, default
risk premia) are expected to return to their pre-crisis level over the forecast horizon, as sizeable weaknesses in the economic and financial system, in particular the high leverage of most economic sectors, have been clearly exposed by the crisis (see also Box I.1.2). Important concerns remain regarding the health of the banking sectors' balance sheets and the historical evidence suggests that banking sector repair takes time. Although there is some uncertainty as to the precise amount, potential losses for the sector going forward are generally deemed as substantial. For instance, using different methodologies, recent estimates by the ECB and the Committee of European Bank Supervisors (CEBS) point to future potential losses due to write-downs on loans and securities for euro area banks in the range of some €200 to €400 bn for the years 2009 and 2010. (10) These figures suggest that the financial sector may experience difficulties in carrying out its intermediation function and supporting a sustained recovery.
Overall, whilst the improvements observed in financial market conditions since the spring bode well for developments on the real side, demand prospects also need to gain traction for firms to reignite production and investment plans. On this front, there has also been positive news from the external side, as discussed below.
…the global economy is exiting the recession and world trade stabilising…
On the back of the unprecedented policy support worldwide and the positive developments in financial markets just discussed, the economic situation and outlook for the world economy have also improved since the spring. Economic activity
(10) For further details on these estimates see footnote n° 2 in
Box I.1.2. See also CEBS (2009) Results of the EU-Wide Stress Testing Exercise, October; ECB (2009) Financial Stability Review, June; IMF (2009) Global Financial Stability Report, April and September.
Box (continued)
forecasts are not adjusted for the number of working days, but quarterly forecasts are.
However, the working-day effect in the EU and the euro area is estimated to be only limited over the forecast horizon, implying that adjusted and
unadjusted growth rates differ only marginally. The calculation of potential growth and the output gap does not adjust for working days. Since it is considered temporary, it should not affect the cyclically-adjusted balances.

European Economic Forecast, Autumn 2009
14
Box I.1.2: Private sector's financial situation: impact on future growth
After coming close to a meltdown, the functioning of the financial system has improved in recent months. This general stabilisation of financial markets, in parallel with signs of an economic recovery, has also led to a recovery, partly from very low levels, of the average creditworthiness of banks and non-financial corporations (See Graph 1) (1). However, the macro-financial situation remains fragile.
The present box looks at the balance sheets of financial and non-financial corporations as well as households, which all point to the need for further deleveraging amid relatively weak income prospects. This tends to reduce the potential for further improvements of financing conditions and the pace of the future economic growth, while it also increases the risk of setbacks.
Graph 1: Credit default swaps for banks
0
100
200
300
07 08 09
bps.
A rated banks AA rated banks
Stress in the banking sector has diminished in recent months. The availability of financing for banks has improved, but it is still impaired in some market segments. For example, while the functioning of interbank markets has recovered at the short end, it is still not fully functioning for longer maturities. Regarding banks' balance sheets, some repair has taken place in recent months. However, balance-sheet conditions remain challenging. Additional banks' write-downs related to securities and especially to loan exposures are likely as the outlook for the quality of loans to (1) A credit default swap is a financial instrument for
hedging the risk of debt default. The buyer of a CDS pays a premium (derived from the CDS spread) for effectively insuring against a debt default. He receives a previously agreed lump sum payment if the debt instrument is defaulted. The spread of a CDS is the annual amount the protection buyer must pay the protection seller over the length of the contract, expressed as a percentage of the notional amount.
households and firms is expected to deteriorate further.(2) On the other hand, the public guarantee and recapitalisation schemes in the financial sector have been used at the euro-area level up to about 30% with regard to debt guarantees, up to around 65% in terms of recapitalisation, and some 85% as regards asset relief programmes, leaving altogether an important buffer for possible future write-downs.(3) At the same time, the outlook for earnings from core banking activities is relatively weak, given the expected depressed level of economic activity and the possible damage to the business models of some banks following structural changes in their operating environment. The need for further deleveraging by banks seems significant (and could prove challenging). To some extent, this may lead to tightness in the availability of bank loans to firms and households once demand picks up.
Despite recent improvements, financing conditions for non-financial corporations remain relatively tight, especially for smaller firms and firms operating in industries which have been particularly hard hit by the recession, such as the construction sector. Fundamentals of the non-financial corporate sector appear, overall, weaker than during the downturns of the early 1990s and the early 2000s. The high aggregate indebtedness of non-financial corporations (see Graph 2) and the outlook of reduced profitability, at least compared to profitability levels of previous years, constitute a major drain on their balance sheets. The financial situation of non-financial corporations is further challenged in the near term by the fact that a large amount of debt will mature towards the end of 2009 and in 2010. In this environment, efforts by non-financial corporations to deleverage may add to dampening investment further ahead.
(2) Potential losses for the sector going forward are
deemed as substantial. The aggregate amounts estimated by the ECB, the IMF and the Committee of European Bank Supervisors (CEBS), however, differ due to the distinct methodologies employed. Over the period 2007–2010, the estimated losses of euro area banks due to write-downs on loans and securities range from some €450 bn. (ECB) and €580 bn. (IMF) billion, with about half still to be booked. The EU-wide stress testing exercise conducted by CEBS for a sample of 22 major European banks indicates that in a more adverse scenario potential credit and trading losses over the years 2009-2010 could amount to almost €400 bn.
(3) Based on information available by 30 September 2009, the total of approved and not yet effective measures amounts to €2200 bn, of which almost €2000 bn is in terms of guarantees on bank liabilities.
(Continued on the next page)

Economic developments at the aggregated level
15
and trade are stabilising generally and some economies have already started to rebound in the first half of 2009. This is particularly the case in emerging markets, mainly Asia, where China is leading the way.
A more general rebound is expected in the second half of this year and the first half of 2010. This is suggested by the strong upturn in short-term indicators of global economic activity. The global PMI for manufacturing moved back into expansionary territory in August and remained there in September. After two consecutive quarterly drops of above 5%, estimates by the CPB (Netherlands Bureau for Economic Policy Analysis) show that world industrial production increased by 2% q-o-q in the second quarter of 2009, the strongest rise since 2003. Among regions, emerging Asia recorded the most pronounced rebound in production, but advanced economies also saw a stabilisation in the second quarter.
Global GDP (excl. EU) growth is thus projected to rebound from a contraction of some –½% this year, the first contraction of world growth since WWII, to about 4% growth in 2010-2011. This compares to an average growth rate of about 5¼% registered in the 2005-2008 period. However, the projected annual profile masks the expectation that global growth may soften again in the second half of 2010 and remain subdued in 2011 in advanced economies, and that the recovery may prove more dynamic in parts of the emerging world. In the short-term, the broadening of the positive momentum is driven by the global stimulus measures and support from the inventory cycle. Further ahead, the world economy may face a soft patch, with the favourable impact of these temporary factors fading away and private demand not recovering fast enough to support growth. This is particularly the case for some advanced economies, where – being at the epicentre of the financial crisis – credit standards are likely to remain tight for some considerable time, adding to
Box (continued)
Graph 2: Debt of households and non-financial corporations, euro area
45
50
55
60
65
99 00 01 02 03 04 05 06 07 08 0965
75
85
95
105
Households (lhs)Non-financial corporations (rhs)
% of GDP % of GDP
Note: Debt of households is equal to total loans. Debt of non-financial corporations is the sum of loans and debt securities.
Lower interest rates and higher stock prices have recently provided some relief for the balance sheets of households. Yet, the situation remains challenging. Households' debt has risen significantly over recent years, and their financial net wealth has decreased slightly across the cycle. There are, however, noteworthy differences across Member States (see Graph 3). The negative impact of these developments may be partly cushioned by a more common use of a variable interest rate in some of the countries that have recorded the largest increases in debt-to-GDP ratio (like Ireland, Spain, Greece and Portugal) in an environment of low
Graph 3: Change in the households' debt-to-GDP ratio in 2001-2008
-20
-10
0
10
20
30
40
50
60
DEAT SI BE IT* EA FI SE SK HU NL PT EL ES DK IE
pps.
* Data for Italy end in 2007.
short-term interest rates assumed for the forecast horizon.
Looking forward, higher unemployment and decelerating wage growth is weighing on household income. Meanwhile, households' net wealth will also be affected by the weak near-term housing-market outlook in several Member States. Indeed, the ability of households to honour their debt may prove to be weaker than in previous recoveries following recessions. In this environment, the scope for strong, sustained increases in household expenditure appears limited unless the labour market reacts swiftly to economic activity.

European Economic Forecast, Autumn 2009
Table I.1.1:
International environment (Real annual percentage change) Autumn 2009 Difference vs
forecast spring 20092006 2007 2008 2009 2010 2011 2009 2010
Real GDP growth USA 2.7 2.1 0.4 -2.5 2.2 2.0 0.4 1.3 Japan 2.0 2.3 -0.7 -5.9 1.1 0.4 -0.6 1.0 Asia (excl. Japan) 9.1 9.7 7.2 4.9 6.8 7.3 1.6 1.2 of which China 11.6 13.0 9.7 8.7 9.6 9.5 2.6 1.8
ASEAN4 (a) + Korea 5.4 5.7 4.4 1.5 3.6 3.8 1.8 0.3 Candidate Countries 6.7 4.8 1.1 -5.7 2.6 3.5 -2.1 0.5 CIS 8.3 8.4 6.2 -6.8 2.3 3.1 -3.0 0.9 of which Russia 7.7 8.1 5.6 -7.2 2.3 2.7 -3.4 0.8 MENA 5.7 6.1 6.0 1.4 4.1 5.3 -0.1 2.5 Latin America 5.6 5.7 4.1 -2.5 3.1 3.4 -0.9 1.5 Sub-Saharan Africa 6.4 6.5 5.7 1.0 4.0 4.5 -1.5 0.5 World 5.1 5.1 3.1 -1.2 3.1 3.5 0.2 1.2
World merchandise trade World import growth 9.8 6.5 4.2 -14.0 3.6 4.6 -2.6 2.7 Extra EU export market growth 9.3 8.9 3.6 -12.7 4.2 4.5 -2.0 2.1
(a) ASEAN4 : Indonesia, Malaysia, Philippines, Thailand.
16
the formidable headwinds still to be faced to reanimate private spending in this region.
Among the largest non-EU advanced economies, US GDP is projected to recover from a contraction of 2½% this year to about 2¼% growth in 2010, before easing somewhat in 2011 (2%). In Japan, GDP is projected to recover from a contraction of some 6% this year to about 1% growth in 2010, before slowing to about ½% in 2011 (see Box I.1.3 for a discussion on global imbalances).
In contrast, in China, GDP is projected to grow robustly over the forecast horizon, by around 8¾% this year and 9½% in the two subsequent years, on the back of buoyant credit expansion and sizeable policy stimulus measures, which raises concern about its medium-term sustainability. However, China's growth in the forecast years remains below the 2005-2008 average.
Beyond China, the cyclical lead of emerging economies in Asia reflects their favourable starting position in this crisis, with large reserve holdings, low exposure to the financial market havoc, high saving rates and low household debt, placing their private sectors in a position to rapidly take advantage of the additional income from the stimulus measures. For instance, India and Indonesia, the largest emerging Asian economies after China, have shown remarkable resilience, with growth driven by domestic demand expected to average, respectively, some 5¾% and 4% this year. The smaller and more open economies in the region (that had been hit hard notably through the
collapse in trade) have clearly rebounded in the second quarter of 2009, driven by industrial production. Emerging Asia as a whole is expected to post 5% growth this year and some 7% in 2010-2011. Outside this region, Brazil and Russia, two other main emerging markets that have also been recovering strongly this year, are expected to rebound to respectively 4¼% and 2¼% growth in 2010 and continue at the same pace or somewhat higher in 2011, due, inter alia, to firmer commodity prices and the rebound in exports of capital goods.
World trade is also stabilising. The pace of the trade decline slowed significantly in the second quarter of this year, after collapsing in the previous two quarters. According to estimates by the CPB, world trade volumes fell by just 0.7% q-o-q in 2009Q2, compared to the unprecedented declines of –6¾% in 2008Q4 and -11% in 2009Q1. Several factors could possibly explain the deep fall in world trade, which was larger than could be expected on the basis of historical relationships. These factors include the truly global nature of the sharp downturn in demand, the stark impact of the recession on manufacturing activity, the drying-up of trade finance and the increased vertical integration of production across countries.
During the recession the global drop in demand affected mostly manufactured products, and especially capital goods and consumer durables, leading to a disproportionate impact on world trade, as these products form the bulk of international trade but represent a lower share of

Economic developments at the aggregated level
17
world output. With the deterioration in financial conditions, access to trade financing also contracted sharply in the latter part of 2008, further dampening trade activity. According to the OECD (2009), the tightening of financial conditions in late 2008 is estimated to have accounted for close to a third of the decline in world trade in the fourth quarter of 2008 and the first quarter of 2009. (11) Finally, there seems to have been a faster impact of activity on trade as a result of globalisation and the increased prevalence of global supply chains. (12) (13) The flip side of this vertical integration mechanism is that it could also be a force leading to a synchronised surge in global trade once a sustained recovery in global demand sets in.
Graph I.1.6: Elasticity of world trade to world income (Freund 2009)
0
0.5
1
1.5
2
2.5
3
3.5
4
1960s 1970s 1980s 1990s 2000s
Recent monthly data show that trade volumes were back in positive territory in the third quarter of this year. Trade volumes were up by 1.6% month-on-month in June and by 3.5% in July, the strongest rise in five years. These figures imply that in terms of the three-months moving average, a less volatile indicator than the monthly data, world trade was up in July 2009 for the first time in more than a year. Nonetheless, in July, world trade was still markedly below (16%) its peak of April 2008.
(11) OECD (2009) Economic Outlook, N° 85, June. (12) The increased presence of vertical specialisation boosts the
ratio of trade flows over production, given that it implies producing goods in two or more sequential stages, where at least one stage of production relies on imported inputs, and some part of that production is exported (see Yi, K-M. (2009) "The collapse of global trade: the role of vertical specialisation", in R. Baldwin and S. J Evenett (eds.) The collapse of global trade, murky protectionism, and the crisis: Recommendations for the G20, Voxeu.org.
(13) Freund (2009) estimates that, owing to the fragmentation of production, the elasticity of real world trade to real world income increased from around 2 in the 1960s and 1970s to 3.5 in recent years. See Freund, C. (2009) "The Trade Response to Global Downturns: Historical Evidence", Policy Research Working Paper 5015, Development Research Group, The World Bank.
OECD leading indicators and the global PMI for manufacturing suggest a recovery in world trade. The expected upswing should also be supported by the improved conditions in financial markets and regained access to trade financing. (14)
Graph I.1.7: World trade and industrial activity advance indicators
-20
-15
-10
-5
0
5
10
15
03 04 05 06 07 08 0930
40
50
60
World trade CPB (lhs)World manufacturing PMI (rhs)
y-o-y % -3-month moving average level
In sum, world trade (excluding the EU) is expected to contract by at least 12% in 2009, but expand afterwards, by 4¼% in 2010 and 5% in 2011. The figure for 2009 constitutes a downward revision compared to the spring forecast that can be explained by the worse-than-expected data for the first half of the year, whereas the recovery is set to kick-in in the latter part of the year.
After coming down sharply from the peaks of mid-2008, oil and commodity prices have been firming recently, supported by rising demand from Asia and moderate optimism regarding global demand prospects, particularly from Asia. Commodity prices are generally expected to rise moderately over the forecast horizon, in line with the expected mild economic recovery and some supply constraints. Oil prices are now assumed to increase from an average of USD 61¼/bl. in 2009 to USD 76½ /bl. in 2010 and USD 80½/bl. in 2011.
…providing support for an upgrading of the short-term EU outlook
The EU and euro area are beginning to benefit from the rebound of the global economy. As mentioned earlier, this is in line with the traditional pattern of EU recoveries, where exports are the first demand component to pick-up in a cyclical upswing. Monthly data on extra-euro area exports show a progressive slowdown in the pace of (14) In particular, the measures taken to alleviate the trade
finance constraints appear to be working effectively, with about ⅔ of the USD 250bn of G20 trade finance facility having been already used.

European Economic Forecast, Autumn 2009
18
Box I.1.3: Developments in global imbalances
Developments in the current accounts of major economies around the world have attracted attention in global policy debates, since current-account imbalances are widely viewed as a contributing factor in the run-up to the recession. Global current-account imbalances built up in the world economy starting in the late 1990s, and in the years 2003-07 current-account differences widened dramatically (see chart). Massive capital inflows allowed the US to finance their large and increasing current-account deficit although interest rates remained relatively low. These deficits were mirrored by substantial trade surpluses in and capital exports from other economies such as China, Japan and the oil-exporting countries. Some countries, such as the UK and Spain, also developed large and increasing current-account deficits. These were matched within the EU by current account surpluses in Germany and the Netherlands. Overall the EU and euro area current account has remained broadly balanced.
Graph 1: Current account balances in se lected countries
-1000
-800
-600
-400
-200
0
200
400
600
00 01 02 03 04 05 06 07 08 09 10 11
billion US$
US Japan MENA+CIS China
forecast
The current crisis has brought about a temporary narrowing…
The current-account deficit appears to be adjusting markedly in the US, from 4.3% of GDP in 2008Q4 to 2.9 % in 2009Q1 and to 2.8% in 2009Q2 (s.a.), much helped by lower oil prices compared to mid-2008. In Japan, the current-account surplus stabilised in 2009Q1, after having shrunk considerably in the previous quarters, and declined in the second quarter, due to the decline in the trade surplus. In China, the current-account surplus for the first half of 2009 showed a decrease by more than 4 pp. of GDP compared to the same period in the previous year. Due to the strong nominal growth rate, however, the forecast decline in the current account relative to GDP will not result in a
decline in nominal terms, so China's current-account surplus will remain high. In most of the oil-exporting countries, the surpluses widened in 2008 because of the steep increase in oil prices in the first half of the year, but were then reduced markedly in the second half of the year, as oil prices dropped.
…but no clear reversal up to 2011…
The chart depicts the new set of Commission current-account forecasts for 2009-11. The current-account deficit in the US is expected to stabilise in 2010-11 at around 3⅓% of GDP. Gains in competitiveness from past dollar depreciation are more than offset by the return to positive, albeit slow, growth. China’s surplus is forecast to start increasing slightly again, based on the technical assumptions of fixed nominal exchange rates. In most of the oil-exporting countries, the assumed rise in oil prices will boost surpluses again. Japan’s surplus, however, is forecast to diminish following the change in government. At global level, the Commission forecast shows a stabilisation of global imbalances at a lower level than in the immediate pre-crisis period. There is a temporary component of the narrowing of global imbalances in 2009, especially given the correction observed in oil prices and the collapse in trade, but there could also be a more lasting component, stemming from e.g. changes in US household savings behaviour.
…and global imbalances remain rather large
Given the expected current-account developments in the main contributing economies around the world (US, China, oil-exporting countries) and under current assumptions for oil prices, as a result, global imbalances remain large going forward. Japan, however, appear to be contributing less to the global imbalances going forward.
The euro area will switch from a broadly balanced current account to a moderate deficit of 0.6% of GDP in 2011. The contribution of the euro area to global imbalances is negligible, whilst the current changes at global level might have significant implications for the euro-area outlook, notably by changing the conditions on its traditional export markets or via exchange rate adjustments. However, like most other institutional forecasts, Commission forecasts use a technical assumption for exchange-rate developments, thus excluding the assessment of future developments in this area.

Economic developments at the aggregated level
19
contraction. While in year-on-year terms exports were still falling by about 20% in June (the latest available figure), the 3-month over 3-month rate of change, which better captures the short-term dynamics, has eased in recent months and even turned slightly positive. The effect is likely to be more pronounced for the more export-oriented economies (e.g. in 2009Q2, German exports were down by only 1.2% on the previous quarter, after drops of almost 11% in 2009Q1 and close to 8% in 2008Q4).
Before a revival of exports induces a pick-up in investment, however, a rebalancing of supply and demand conditions via inventories is required. Here recent signals are positive too: the inventory cycle appears to be at a point when stocks are no longer cut back, whereby it moves from acting as a significant drag on growth to contributing positively. The ratio of new orders to inventories in the manufacturing sector from the PMI survey, usually a good-leading indicator of underlying industrial production, has been trending up since early in the year, to reach just above 1.2 in the euro area in August and September, its highest level since late 2006.
The assessment of stocks from the EU manufacturing survey gives a similar message. Companies still consider stock levels to be excessive, but the indicator is now approaching its long-term average, signalling that considerable stock-adjustment has taken place. This comes after shaving off more than 1 percentage point from quarter-on-quarter EU GDP growth between the last quarter of 2009 and the second quarter of 2009 combined, and about ¾ pp. in the euro area (the largest negative inventory contribution since the start of the GDP series). Inventories should thus no longer act as a significant drag in the second half of this year.
These positive signs bode well for manufacturing activity going forward. They are complemented by continuing improvements in both hard and soft leading indicators of industrial activity. After falling precipitously at the end of last year and the beginning of this year, when industrial production in the euro area fell by annualised quarterly rates of some 30%, the pace slowed to about 5% in the second quarter and has largely stabilised over the summer. Indeed, the latest reading showed a 0.9% m-o-m increase in August as well as sizable upwards revisions to previous data, leaving industrial output so far in the third quarter about
1½% higher than the average in the second quarter. (15) An upswing in the industrial sector is also suggested by the OECD leading indicator for manufacturing activity in the euro area, which has improved gradually since the beginning of the year, reaching a level in August 2009 not seen since June 2008.
Graph I.1.8: Inventory adjustment and industrial production, euro area
0.0
0.2
0.4
0.6
0.8
1.0
1.2
1.4
98 99 00 01 02 03 04 05 06 07 08 09-25
-20
-15
-10
-5
0
5
10
New orders/Inventories ratio (lhs)Industrial production (rhs)
balance y-o-y%
Improved prospects are also reflected in overall business sentiment, which has continued to steadily recover from the historical lows reached at the beginning of the year. The composite Purchasing Managers' Index (PMI) reached 50.4 in August, passing the threshold that separates contraction from expansion for the first time in fifteen months. This upward momentum was maintained in September, when the composite PMI edged up to a level (51) not seen since May 2008, reflecting improvements in both manufacturing and services. In September, the Commission's Economic Sentiment Indicator (ESI) was up for the sixth consecutive month, in both the EU and the euro area.
Based on past experience, the current levels of the ESI and PMI, are consistent with a stabilisation or, possibly, positive GDP growth in the second half of 2009. This is in contrast to the negative figures presented in the spring forecast. Similarly, the Commission services' business-cycle tracer, which maps the survey results to the different phases of the business cycle, entered into the upswing area this summer, after having been deep in contraction territory for several months. (16) The improvement in business confidence is widespread among (15) Nonetheless, industrial production in August remained
some 15% below its level in the previous year. (16) The business cycle indicator is made up from a weighted
average of the five principal components from the survey series conducted in industry, services, building, retail trade and consumers.

European Economic Forecast, Autumn 2009
Table I.1.2:
Main features of the autumn 2009 forecast - EU (Real annual percentage change Autumn 2009 Difference vs unless otherwise stated) forecast ¹ spring 2009 (a)
2006 2007 2008 2009 2010 2011 2009 2010 GDP 3.2 2.9 0.8 -4.1 0.7 1.6 -0.1 0.8 Private consumption 2.2 2.1 0.8 -1.7 0.2 1.2 -0.2 0.6 Public consumption 2.0 1.9 2.2 2.0 1.0 0.6 0.1 -0.7 Total investment 6.2 5.9 -0.3 -11.4 -2.0 2.5 -0.9 0.9 Employment 1.5 1.7 0.9 -2.3 -1.2 0.3 0.3 0.2 Unemployment rate (b) 8.2 7.1 7.0 9.1 10.3 10.2 -0.3 -0.6 Inflation (c) 2.3 2.4 3.7 1.0 1.3 1.6 0.1 0.0 Government balance (% GDP) -1.4 -0.8 -2.3 -6.9 -7.5 -6.9 -0.9 -0.2 Government debt (% GDP) 61.3 58.7 61.5 73.0 79.3 83.7 0.4 -0.1 Adjusted current account balance (% GDP) -1.2 -1.1 -2.0 -1.7 -1.5 -1.3 0.2 0.5
¹ The Commission services' autumn 2009 forecast is based on available data up to October 22 2009. (a) A "+" ("-") sign means a higher (lower) positive figure or a lower (higher) negative one compared to spring 2009. (b) Percentage of the labour force. (c) Harmonised index of consumer prices, nominal change.
20
sectors and countries. Although at a slower pace, consumer confidence has also improved since the spring in most Member States.
Graph I.1.9: Business cycle tracer, euro area
-5
-4
-3
-2
-1
0
1
2
-0.6 -0.3 0 0.3
downswing expansion
upswingcontraction
Jan-00
Sep-09
leve
l
m-o-m change
Another element that points to further improvements in the EU economy in the coming quarters is the fiscal stimulus measures adopted by Member States, which are expected to continue supporting demand during the second half of 2009 and into 2010. Somewhat more than half of the planned amount for 2009 (about 1% of EU, GDP) is expected to be implemented in the second half of the year. According to Member States' intentions, the distribution between the third and fourth quarter should be broadly equal. For 2010, the stimulus measures are expected to be only slightly lower compared to 2009 (just below 1% of EU GDP). Going in the opposite direction, however, the termination of some of these measures in the meantime, such as the car-scrappage scheme in several Member States, will
weigh on car registrations and, thus, on private consumption.
Table I.1.4:Decomposition of the GDP growth forecastEU 2009 2010 2011
Carry-over from preceding year -1.7 0.2 0.4
Y-o-Y in Q4 -2.3 0.9 2.1
Annual average -4.1 0.7 1.6
euro area 2009 2010 2011
Carry-over from preceding year -1.6 0.3 0.3
Y-o-Y in Q4 -2.1 0.7 1.9
Annual average -4.0 0.7 1.5
These overall positive developments, which were also behind the upgrading of projections for the second half of 2009 in the September interim forecast, explain why the picture for the second half of this year is largely maintained in this autumn forecast. Real GDP is expected to contract by some 4.1% this year in the EU and 4% in the euro area, practically unchanged compared to the spring forecast. However, the upward-revised growth momentum (see for instance the year-on-year figures in the fourth quarter of 2009 in table 1.1.4, which are considerably less negative than in the spring) mechanically improves the EU and euro area outlook for 2010, with a carry-over effect at the end of 2009 of some 0.2 and 0.3 pp., respectively, compared to – 0.4 pp in the spring.

Economic developments at the aggregated level
Table I.1.3:
Main features of the autumn 2009 forecast - euro area (Real annual percentage change Autumn 2009 Difference vs unless otherwise stated) forecast ¹ spring 2009 (a)
2006 2007 2008 2009 2010 2011 2009 2010 GDP 3.0 2.8 0.6 -4.0 0.7 1.5 0.0 0.8 Private consumption 2.0 1.7 0.4 -1.0 0.2 1.0 -0.1 0.5 Public consumption 2.1 2.3 2.0 2.0 1.1 1.0 0.0 -0.6 Total investment 5.5 4.8 -0.4 -10.7 -1.9 2.1 -0.3 0.8 Employment 1.4 1.7 0.6 -2.3 -1.3 0.0 0.3 0.2 Unemployment rate (b) 8.3 7.5 7.5 9.5 10.7 10.9 -0.4 -0.8 Inflation (c) 2.2 2.1 3.3 0.3 1.1 1.5 -0.1 -0.1 Government balance (% GDP) -1.3 -0.6 -2.0 -6.4 -6.9 -6.5 -1.1 -0.4 Government debt (% GDP) 68.3 66.0 69.3 78.2 84.0 88.2 0.5 0.2 Adjusted current account balance (% GDP) -0.1 0.1 -1.1 -1.0 -0.8 -0.7 0.2 0.5
¹ The Commission services' autumn 2009 forecast is based on available data up to October 22 2009. (a) A "+" ("-") sign means a higher (lower) positive figure or a lower (higher) negative one compared to spring 2009. (b) Percentage of the labour force. (c) Harmonised index of consumer prices, nominal change.
21
Constraining factors to cap the recovery further ahead…
While the current recovery is being kick-started by an improved external environment (global activity and trade) and financial conditions and, not least, significant policy stimulus measures, making it sustainable ultimately requires a robust pick-up in private domestic spending. According to the typical recovery sequencing in the EU/euro area, the pick-up in exports normally spurs the demand for investment in capital and durable consumer goods, as these make up the bulk of international trade. However, at the current juncture there are important constraining factors at play that may hamper this traditional export-investment nexus. Furthermore, with subdued investment growth, the next stage in the traditional business cycle turnaround, which brings employment and subsequently private consumption into the positive loop, would also prove weaker than in the past.
In effect, as the favourable effect of the temporary factors currently supporting activity peters out, GDP growth is set to ease somewhat before regaining some ground only by the second half of next year. With both external and domestic demand gradually strengthening, GDP growth is projected to recover to about 0.5% q-o-q by the second quarter of 2011 in both the EU and the euro area. Taking into account the weak carry-over from 2009, annual growth rates are expected to be limited to 0.7% in 2010 in both regions. At the end of the forecast horizon, GDP is forecast to grow by some 1½%, thereby starting to gradually close the considerable output gap that has opened up during this crisis.
Turning to the forecast for the main domestic demand components, gross fixed capital formation typically plays a central role in shaping the business cycle dynamics, since despite accounting for little more than 20% of GDP, it is about three times more volatile than private consumption. As illustrated in section 1.1, investment spending was one of the main casualties of the current recession. However, the trough appears to have been reached in the first half of the year. After plummeting in the final quarter of last year and the first quarter of 2009, the pace of contraction of investment slowed considerably in the second quarter in both the EU and the euro area (-1.9% q-o-q and -1.3% respectively). The sectoral breakdown shows that the contraction was mostly due to non-construction investment, which was dragged down by the strong decline in manufacturing production (machinery and transport equipment essentially).
Going forward, a historically low capacity utilisation rate, weak demand prospects, subdued profitability gains, higher risk premia than in pre-crisis period and still tight credit standards for non-financial corporations, underpin the unusually moderate projected recovery of gross fixed capital formation. Overall investment spending is expected to continue contracting in 2010, albeit at a declining pace (by some 2%, compared to around -11% in 2009), before picking up in 2011 to about 2½% in the EU and 2% in the euro area.
The capacity utilisation rate in the EU collapsed in the first half of this year in response to the dramatic output drop that followed the intensification of the financial crisis last autumn. The July 2009 reading of the quarterly

European Economic Forecast, Autumn 2009
22
manufacturing survey showed that capacity utilisation stood at some 70%, the lowest level since DG ECFIN’s survey of the manufacturing industry started in 1990.
To put this figure in perspective, it is worth noting that in the period preceding the crisis, the rate of capacity utilisation hovered in a narrow band, with two cyclical peaks at around 84% at end 2000 and mid-2007, and lows around 80%. Moreover, in the past two upturns, equipment investment began to recover when capacity utilisation rates reached around 81%. Hence, going by past behaviour, this level may be seen as a reasonable threshold for firms to resume investment plans. Assuming that capacity utilisation adjusts at a similar average pace as that observed during the downturn, it would reach the 81% threshold only at the beginning of 2011.
Graph I.1.10: Equipment investment and capacity utilisation in manufacturing, EU
-25-20-15-10
-505
101520
95 97 99 01 03 05 07 09 1168
72
76
80
84
88
Equipment investment (lhs)Equipment investment (forecast, lhs)Capacity utilisation (rhs)
y-o-y% %
forecast
The manufacturing surveys also show that insufficient demand has increasingly been the main factor limiting production in the euro area during the past three quarters, followed by financial constraints, which have gained in importance during the last three months. An informative short-term indicator for equipment investment in the European Commission's monthly business surveys is the service sector's assessment of past demand conditions. (17) Having bottomed out in May, at well below its long-term average, the assessment of past demand conditions in services has risen fairly strongly up to 2009Q3, supporting the view that a trough in the trajectory of equipment investment may have already been reached.
(17) Interestingly, this indicator shows stronger correlation with
equipment investment than either the manufacturing PMIs or the EC manufacturing confidence indicator.
In terms of the financing of equipment investment, a useful piece of information contained in the ECB's bank lending survey is the assessment of credit availability, which is well-correlated with the quarter-on-quarter growth rate of equipment investment. After falling for several quarters, this series ceased to deteriorate in the second quarter and even improved in the third quarter, possibly signalling a reversal of the investment cycle. However, the current level of the series remains well-below its historical average, consistent with weak capital spending in the coming quarters.
Graph I.1.11: Equipment investment and business confidence, EU
-25-20-15-10
-505
101520
95 97 99 01 03 05 07 09 11-40-30-20
-1001020
3040
Equipment investment (lhs)Equipment investment (forecast , lhs)Services confidence: evolution of demand (rhs)
y-o-y% balance
forecast
Regarding the other main part of gross fixed capital formation, in the second quarter of 2009 investment in construction in the euro area registered its smallest fall since the first quarter of 2008, contracting by only 0.8%, with non-housing investment showing its second consecutive increase (0.3%). Housing investment, while still declining (-2%), registered a lower rate of contraction than in the past four quarters. Construction investment activity is expected to remain constrained by the ongoing adjustment of housing markets in several Member States, indicating that, unlike in previous upswings, this time little support can be expected from this side either.
Moving on to the next main component of private domestic demand, household consumption is also expected to recover only gradually in this upturn. As illustrated in the previous section, private consumption proved to be a stabilising factor during this recession. In the EU, household consumption contracted by significantly less than GDP in both 2008Q4 and 2009Q1 (around -¾%), and broadly stabilised in the second quarter. The relative resilience of household consumption is explained by the strong deceleration in inflation

Economic developments at the aggregated level
23
(down from an annual rate of 4.4% in August 2008 to just 0.3% in September 2009) and support from nominal disposable income.
In turn, the strength of nominal disposable income growth can be explained by several factors, including wage stickiness, lags in the response of employment to the slump in activity, policy measures such as the extension of short-term contracts as well as the positive impact of automatic stabilisers.
-0.6
-0.4-0.2
0.00.2
0.40.6
0.81.0
00 01 02 03 04 05 06 07 08 09
Net social benefits (contribution)Consumption (2Q ma)Disposable income (2Q ma)
q-o-q%
Graph I.1.12: Private consumption, disposable income and net social transfers, euro area
Private consumption is expected to contract this year by some 1¾% in the EU and 1% in the euro area, before stabilising next year in both areas and registering subdued growth in 2011 (about 1%). In addition to a weaker impulse than in past upturns from investment to employment and hence private consumption, there are at least two other factors restraining a sustainable, strong rebound in private consumption. One is the behaviour of the saving rate going forward. The economic crisis associated with the need for deleveraging of households' balance sheets has already led to an increase in the saving rate, by nearly 3 pps. in the EU (and by almost 2 pps. in the euro area) since the first half of 2008. If the adverse environment generated by the crisis persists, households may plan to increase their savings further, as data on expected savings from the EU consumer survey seem to suggest (see Box I.2.4 for more details). Another constraining factor relates back to the labour market. Notwithstanding some easing in the pace of the deterioration lately, as discussed in the next section, the usual lagged reaction to GDP developments indicates that labour market conditions are set to weaken further, with some stabilisation in the latter part of 2010 and in 2011.
Finally, a further factor restraining the recovery is the estimated adverse impact of the financial crisis on potential output. As argued in a recent Commission services' study (18), potential growth rates may not recover to pre-crisis levels, in view, inter alia, of a permanent change in financing conditions following a shift in risk aversion and/or a sustained need for deleveraging. The impact of the ensuing slower capital accumulation may be reinforced by parts of the capital stock becoming obsolete even faster. This in turn would adversely affect total factor productivity (TFP) growth, as resources are then locked into relatively unproductive activities. These long-lasting effects on growth would come on top of the expected adverse impact from an ageing population. It is estimated that potential growth in the EU and euro area could be reduced considerably in 2009-2010, compared with 2008, to less than 1% and would only recover to 1% by 2011.
…with labour market developments crucial
Having started to weaken in the course of 2008, the labour market situation deteriorated further in 2009, although by less than expected at the time of the spring forecast. By the first quarter, employment was falling in all Member States, a trend that continued into the second quarter in most of them; while the unemployment rate stood at 9.6% in the euro area and 9.1% in the EU in August, more than 2 percentage points above the lows of early 2008. Notwithstanding a certain improvement in economic prospects going forward, labour market conditions are expected to continue deteriorating in the second half of 2009
Graph I.1.13: Employment growth and unemployment rate, EU
-2.5
-1.5
-0.5
0.5
1.5
2.5
00 01 02 03 04 05 06 07 08 09 10 110
2
4
6
8
10
12
Employment growth (lhs)Unemployment rate (rhs)
y-o-y% % of labour force
forecast
(18) European Commission (2009) “Impact of the current
financial and economic crisis on potential output”, Directorate-General for Economic and Financial Affairs, European Economy Occasional Paper N° 49, June.

European Economic Forecast, Autumn 2009
24
Box I.1.4: The household saving rate in the current recovery
This box sheds some light on the main factors underpinning the projected saving rate developments that underlie the forecasts for private consumption.
Households’ saving rates across the EU started to increase in the first half of 2008, in line with plunging sentiment. Since then, the household saving rate has risen by nearly 3 pps. in the EU (and by almost 2 pps. in the euro area); to stand at 13¾% and 15½%, respectively, in the first quarter of 2009 (latest available data). These increases have largely mirrored the deterioration in overall consumer confidence and, particularly, consumer's assessment of unemployment prospects, which are currently well above their long-term average (by about two standard deviation).
Graph 1: Saving rate and unemployment expectations, EU
-3
-2
-1
0
1
2
3
01 02 03 04 05 06 07 08 0910
11
12
13
14
15
Unemployment expectations (lhs, normalised)Saving rate (rhs)
%balance
Looking forward, the autumn forecast assumes the household saving rate to remain at rather elevated levels over the forecast horizon (2009-2011), averaging around 15% in the EU (and almost 17% in the euro area). This represents an increase by some 2½ pps. compared to 2008 in the EU (and close to 2 pps. in the euro area), which, other things equal, will curb private consumption. There are a number of factors behind the projected increase in the household saving rate, including the cyclical deterioration in the labour market, the downward revision of long-term growth prospects, the impact of public finances and asset price corrections on saving behaviour. The variability in the household saving rates across Member States projected by the autumn forecast reflects, to a large extent, the differential impact of these factors.
Graph 2: Savings rate
0
5
10
15
20
25
UK PL PT FI DK SK IT EU EE FR EA DE NL AT IE ES
2008 Average 2009-2011
%
If households expect a decline in the discounted value of future labour income following, for instance, a downward revision of potential growth estimates as a result of the financial crisis, savings should increase and consumption accordingly drop. The expected significant deterioration of public finances may give rise to some Ricardian effects, whereby higher public deficits today lead to households' expectations of higher taxes in the future and should accordingly be met through higher savings. (1) Moreover, as argued in Box I.1.2 and below, the ongoing process of deleveraging of household balance sheets is also expected to put upward pressure on the saving propensity of households. Given that the first two aspects are fairly well known, this box briefly elaborates on the third aspect, taking stock of recent analysis carried on in DG ECFIN (2) on balance sheet adjustment in the household sector and savings attitudes.
Changes in asset prices may have important implications for households' consumption/saving decisions via the traditional wealth effects. For instance, a rise in house prices may boost the consumption of house owners, who see their wealth and the value of their collateral increase. On the other hand, it may also force credit-constrained households to save more in order to acquire a house, as it raises the amount of the down payment.
According to DG ECFIN’s estimation results, financial wealth seems to be the main determinant of the savings ratio in the euro area in the medium term. The more traditional housing-wealth channel (1) Christiane Nickel and Isabel Vansteenkiste, Fiscal
policies, the current account and Ricardian equivalence ECB WP (2008), N. 935.
(2) Quarterly Report on the Euro Area, Vol. 3, (2009), The interrelations between household savings, housing wealth, financial wealth and mortgage debt.
(Continued on the next page)
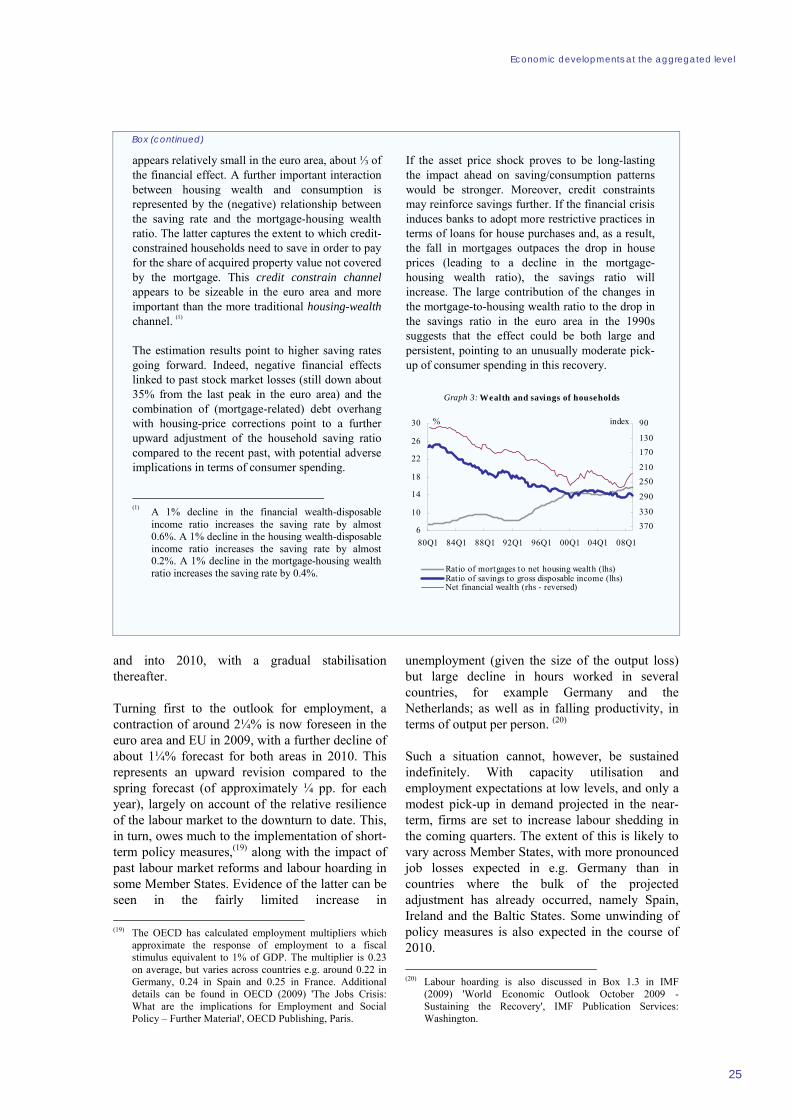
Economic developments at the aggregated level
25
and into 2010, with a gradual stabilisation thereafter.
Turning first to the outlook for employment, a contraction of around 2¼% is now foreseen in the euro area and EU in 2009, with a further decline of about 1¼% forecast for both areas in 2010. This represents an upward revision compared to the spring forecast (of approximately ¼ pp. for each year), largely on account of the relative resilience of the labour market to the downturn to date. This, in turn, owes much to the implementation of short-term policy measures,(19) along with the impact of past labour market reforms and labour hoarding in some Member States. Evidence of the latter can be seen in the fairly limited increase in (19) The OECD has calculated employment multipliers which
approximate the response of employment to a fiscal stimulus equivalent to 1% of GDP. The multiplier is 0.23 on average, but varies across countries e.g. around 0.22 in Germany, 0.24 in Spain and 0.25 in France. Additional details can be found in OECD (2009) 'The Jobs Crisis: What are the implications for Employment and Social Policy – Further Material', OECD Publishing, Paris.
unemployment (given the size of the output loss) but large decline in hours worked in several countries, for example Germany and the Netherlands; as well as in falling productivity, in terms of output per person. (20)
Such a situation cannot, however, be sustained indefinitely. With capacity utilisation and employment expectations at low levels, and only a modest pick-up in demand projected in the near-term, firms are set to increase labour shedding in the coming quarters. The extent of this is likely to vary across Member States, with more pronounced job losses expected in e.g. Germany than in countries where the bulk of the projected adjustment has already occurred, namely Spain, Ireland and the Baltic States. Some unwinding of policy measures is also expected in the course of 2010. (20) Labour hoarding is also discussed in Box 1.3 in IMF
(2009) 'World Economic Outlook October 2009 - Sustaining the Recovery', IMF Publication Services: Washington.
Box (continued)
appears relatively small in the euro area, about ⅓ of the financial effect. A further important interaction between housing wealth and consumption is represented by the (negative) relationship between the saving rate and the mortgage-housing wealth ratio. The latter captures the extent to which credit-constrained households need to save in order to pay for the share of acquired property value not covered by the mortgage. This credit constrain channel appears to be sizeable in the euro area and more important than the more traditional housing-wealth channel. (1)
The estimation results point to higher saving rates going forward. Indeed, negative financial effects linked to past stock market losses (still down about 35% from the last peak in the euro area) and the combination of (mortgage-related) debt overhang with housing-price corrections point to a further upward adjustment of the household saving ratio compared to the recent past, with potential adverse implications in terms of consumer spending.
(1) A 1% decline in the financial wealth-disposable
income ratio increases the saving rate by almost 0.6%. A 1% decline in the housing wealth-disposable income ratio increases the saving rate by almost 0.2%. A 1% decline in the mortgage-housing wealth ratio increases the saving rate by 0.4%.
If the asset price shock proves to be long-lasting the impact ahead on saving/consumption patterns would be stronger. Moreover, credit constraints may reinforce savings further. If the financial crisis induces banks to adopt more restrictive practices in terms of loans for house purchases and, as a result, the fall in mortgages outpaces the drop in house prices (leading to a decline in the mortgage-housing wealth ratio), the savings ratio will increase. The large contribution of the changes in the mortgage-to-housing wealth ratio to the drop in the savings ratio in the euro area in the 1990s suggests that the effect could be both large and persistent, pointing to an unusually moderate pick-up of consumer spending in this recovery.
Graph 3: Wealth and savings of households
6
10
14
18
22
26
30
80Q1 84Q1 88Q1 92Q1 96Q1 00Q1 04Q1 08Q1
90
130170
210250
290
330370
Ratio of mortgages to net housing wealth (lhs)Ratio of savings to gross disposable income (lhs)Net financial wealth (rhs - reversed)
% index

European Economic Forecast, Autumn 2009
26
This outlook for the second half of 2009 and early part of 2010 accords reasonably well with the average pattern observed at the end of previous recessions / start of recoveries, namely a lag of around 2-3 quarters between cyclical developments in activity and the labour market (see Graph 1.1.14). (21)
Graph I.1.14: Average quarterly changes at the start of past recoveries, euro area
-0.3
0.0
0.3
0.6
0.9
1.2
Q1 Q2 Q3 Q4 Q5 Q6Employment growth Unemployment rate (pp. difference)GDP growth
quarter
Note: end of recessions / start of recoveries in the euro area as identified by the CEPR (see Graph I.1.15 for details).
q-o-q%
Towards the end of 2010 and into 2011, employment is forecast to gradually stabilise as the recovery in the euro area and the EU takes hold. Beyond this point, prospects for employment very much depend on the flexibility of the labour market and the necessary structural adjustment taking place across sectors and firms.
Graph I.1.15: Unemployment rate following recessions, euro area
0
2
4
6
8
10
12
70 73 77 81 85 88 92 96 00 03 07 11
Recession Unemployment rate
% of labour force
forecast
Note: euro area recession periods as identified by the CEPR.
As for unemployment, anticipated developments largely reflect the above trends in employment. Thus, the unemployment rate is projected to rise significantly in the period ahead, reaching close to
(21) Note that the shape of the recovery (e.g. "V" or "W") can
have a bearing on the evolution of employment and unemployment in the quarters after the recession ends. See chapter 1.2 for further details.
11% in the euro area in 2011. For the EU, a levelling out is expected in 2010, at around 10¼%. This outlook is somewhat less pessimistic than the spring forecast on account of the relative resilience shown so far, but also partly because of labour supply effects (e.g. discouraged workers).
At Member State level, an increase in the unemployment rate is forecast for all countries between 2008 and 2011. Differences in terms of the scale of the projected increase are marked however, ranging from 1¼ pps. in Portugal to 9¼ pps. in Spain and almost 12½ pps. in Lithuania.
Looking beyond the forecast horizon, there is a risk that the high unemployment levels arising from the crisis will become persistent. As Graph I.1.5 shows, after a recession, the unemployment rate can remain above the pre-recession level for several years (though experiences differ across countries and downturns as discussed in Chapter 1.2), with considerable economic and social consequences. (22)
6
7
8
9
10
11
12
00 01 02 03 04 05 06 07 08 09 10 11
Actual unemployment rate NAWRU
%
forecast
Graph I.1.16: Actual and structural unemployment rate , euro area
Lastly, the unemployment rate in the euro area and the EU is set to rise above the structural rate (NAWRU i.e. the non-accelerating wage rate of unemployment). Thus, growing labour market slack is to be expected, dampening wage and inflation pressures ahead, as discussed below.
…inflation expectations well-anchored overall…
On the nominal side, consumer-price inflation continued to decline substantially in the course of 2009, reaching in July a low of -0.7% in the euro area and 0.2% in the EU. Compared to the peak in (22) See also OECD (2009) “OECD Employment Outlook:
Tackling the Jobs Crisis”, OECD Publishing, Paris.

Economic developments at the aggregated level
27
inflation last year, the disinflation has been remarkable, in the order of 4 pps. over four quarters in both regions. This has provided substantial support to household real disposable income in the downturn.
The decline in the headline inflation rate has been driven mostly by the energy and food price components, which have continued on the marked disinflationary path that started in the second half of last year. In effect, energy prices have been declining at a two-digit pace since the spring in the euro area (-11% year-on-year in September 2009, -8% in the EU). Disinflation in unprocessed food prices has been substantial, albeit much more subdued, with prices declining in the year to September 2009 (by -1.3% in the euro area and -0.5% in the EU). Reflecting the recessionary macroeconomic environment, underlying inflation pressure has also abated considerably. Core inflation (HICP inflation excluding energy and unprocessed food) decreased from over 2% in the euro area at the end of last year to 1.1% in September 2009 (1.5% in the EU). The decline was mainly the result of an easing in services' inflation and, to a lesser extent, in processed food inflation.
Graph I.1.17: Contributions to inflation, euro area
-2
-1
0
1
2
3
4
07 08 09
pps.
Services Processed foodUnprocessed food EnergyNon-energy industrial goods HICP (y-o-y%)
The effect of the sharp weakening in activity is particularly visible in producer-price inflation. It fell in the euro area from 8.4% (y-o-y) in August 2008 to -7.5% in August 2009, on the back of sharply decelerating prices for energy and food input products and strong base effects. However, the speed of the decline in industrial price inflation and its main components seems to have slowed in the last few months, suggesting an easing of downward price pressures.
Turning to wage indicators in the euro area, the picture is somewhat mixed at the current juncture. The annual growth rate of hourly labour costs remained relatively high in the first and second quarters of 2009 (at 3.6% and 4.0% respectively). This partly follows from a less than proportional decrease in labour remuneration compared to the decline in hours worked. Conversely, the growth of nominal compensation per employee slowed from 1.8% in the first quarter to 1.6% in the second quarter (significantly lower than the 3.1% growth figure for 2008). Moreover, due to the sizeable decline in labour productivity per head, unit labour costs rose markedly to some 4.8% in the second quarter of the year. However, this partly cyclical upturn is set to reverse in the coming quarters, as the moderation in inflationary pressure from the labour market becomes apparent.
Graph I.1.18: Headline and core inflation forecast, euro area
-1
0
1
2
3
4
5
04 05 06 07 08 09 10 11
forecast
y-o-y%
HICP All-itemsCore inflation (HICP excl. energy and unprocessed food)
Looking ahead, inflation in the EU and euro area is projected to rebound somewhat from the current very low levels (temporary negative rates in the euro area), but to remain subdued over the forecast horizon. HICP inflation is estimated to average 1% this year in the EU and 0.3% in the euro area. It is projected to increase moderately over the forecast horizon, to somewhat above 1% in 2010 and around 1½% in 2011 in both areas. This outlook is consistent with the projected subdued recovery on the real side. In particular, it is supported by the large degree of slack in the economy, the expected weak wage growth going forward and well-anchored inflation expectations.
In terms of the quarterly profile, inflation is expected to have reached a trough in the third quarter of 2009, of 0.4% in the EU and -0.4% in the euro area, and to increase gradually thereafter, but remain safely below 2%. The projected profile for inflation is shaped by two factors. On the one

European Economic Forecast, Autumn 2009
28
Box I.1.5: Competitiveness divergence within the euro area could weigh on the recovery
Since the launch of the euro, the euro area has experienced significant divergence in the "external" economic performance of individual Member States. Although the euro-area's current account was broadly balanced in the past two decades, the dispersion of current-account balances across euro-area Member States increased continuously between the mid-1990s and the beginning of the crisis, when it was at the highest level in more than three decades (Figure 1). This current account divergence has gone hand in hand with significant divergence in price and cost competitiveness as measured by the real effective exchange rate (REER) (Figure 2). (1)
Graph 1: Current accounts in surplus and deficit countries of the euro area (1)
-12-10
-8-6-4-202468
10
98 99 00 01 02 03 04 05 06 07 08 09 10 11
Surplus countries (2) Deficit countries (3)Euro area
% of GDP
(1) Net lending (+) or net borrowing (-), total economy; for LU balance on current transactions with the rest of the world. (2) Surplus countries are: DE, LU, AT, NL, FI. (3) Deficit countries are: EL, ES, PT, IE.
A large part of this divergence in the current accounts can be traced back to domestic demand. External factors such as fluctuations in oil prices and export performance have played only a second order role. There have been considerable and persistent differences in the strength of domestic demand across (1) The Commission Services have been working on the
issue for a significant time. See for example: European Commission – DG ECFIN (2006), "The EU Economy 2006 Review", European Economy 6/2006. European Commission – DG ECFIN (2008), "EMU@10: Successes and challenges after 10 years of Economic and Monetary Union", European Economy 2/2008.
For a more detailed discussion, see the special report: "Competitiveness developments in the euro area", Quarterly Report on the Euro Area, Volume 8 No. 1 (2009).
Member States since the launch of the euro butthese differences cannot be explained by'traditional' medium-term determinants of thecurrent account such as fiscal policy anddemographic factors. There is evidence that theeuro and European financial market integrationhave facilitated access to international capitalmarkets in the Member States engaged incatching-up processes. In these Member States,reduced credit constraints and low real interestrates on the back of comparatively highinflation have boosted domestic demand andfuelled current account deficits. Foreign capitalinflows have been mostly channelled by banksinto private consumption and the housingmarket. Current-account divergence thereforealso reflects the build up of significantdomestic imbalances, including housingbubbles and the accumulation of large privatesector debt.
Graph 2: Real e ffective exchange rate developments (1)
-20
-15
-10
-5
0
5
10
15
20
DE FI AT FR BE IT PT EL NL IE ES
1998-2008 2008-2011
change in %
(1) Intra-euro-area real effective exchange rate based on the GDP deflator.
Therefore, only part of the divergence of REERwithin the euro area since the late 1990s can beexplained by benign drivers such as theBalassa-Samuleson effect, price convergenceor responses to cyclical differences betweenMember States. Relative productivitydifferentials have very little explanatory powerfor REER developments in the euro area,which can be explained by limited wageequalisation and large differences in marginbehaviour. REER developments therefore donot reflect the benign drivers but are driven bydomestic demand pressure. Moreover,persistent divergence in REER was observed
(Continued on the next page)

Economic developments at the aggregated level
29
hand, the large energy- and food-related base effects of last year are set to reverse this autumn, thus adding to the headline inflation rate towards the end of 2009. Rising commodity prices should also produce some upward pressure. On the other hand, the weakening macroeconomic environment and the expected deceleration in unit labour costs are likely to continue to put a lid on underlying inflation.
Graph I.1.19: Inflation expectations, euro area
-0.5
0.0
0.5
1.0
1.5
2.0
2.5
3.0
06 07 08 09-18-12-60612182430
Consumer inflation expectations (rhs)Implied inflation expectations, 10-year (lhs)
y-o-y % balance
Inflation expectations are indeed crucial for the inflation outlook. Consumer and producer inflation expectations derived from surveys (ESI and PMI) provide a direct measure of expected inflation, though they tend to be highly correlated with recent or contemporaneous observations and perceptions rather than being driven by forward-looking rational expectations. These survey-based
consumer and producer inflationary expectations have continued to ease since the spring, in response to the subdued economic outlook and the continued drops in actual inflation.
Market-based expectations, on the other hand, provide information on inflation expectations in the medium to long-term. Amid a general increase in volatility since March 2008, these market-based inflation expectations (e.g. inflation index-linked bonds), appear to have "flirted" with a close to deflationary outlook at the turn of the year, but have rebounded to close to 2% since March. (23)
This picture of well-anchored inflation expectations is confirmed by the most recent results of the ECB's Survey of Professional Forecasters (SPF for third quarter 2009). SPF participants expect inflation to reach a trough in the period from July to September and thereafter move back into positive territory, although remaining at levels below 2% in 2010 and 2011. Long-term inflation expectations (for the year 2014) also remain in line with the ECB's price stability objective, at close to but below 2%.
(23) However, it must be borne in mind that such expectations
are prone to fluctuations originating in the financial market and, at the current juncture, they are distorted by unobservable risk and liquidity premia, which are not easy to disentangle.
Box (continued)
despite comparatively small differences in relative output gap positions. Country differences in price competitiveness also reflect a range of labour market problems, such as inappropriate wage responses to changes in productivity, excessive wage growth in the public sector or asymmetric responses of wages to the cycle. With the onset of the crisis, the rapidly worsening financing conditions as well as the negative confidence shock have led to a significant decline in domestic demand in all euro-area Member States. The demand shock has been particularly large in Member States with large current-account deficits and significant private sector indebtedness. This has led to an improvement in the trade balance via the import channel, as a large drop in domestic demand reduced imports more than
the decline in exports. Conversely, the tradeshock has tended to be stronger in MemberStates with large current-account surpluses,bringing their surpluses down via the exportchannel. Overall the crisis appears to haveworked to correct some of the current-accountimbalances within the euro area (Graph 1),albeit part of the adjustment may prove to becyclical and thus temporary. The crisis, however, has not yet led to thesignificant relative price adjustment amongeuro area Member States needed to eitherregain export markets or reallocate supply anddemand across the tradable and non-tradablesector. With the exception of Ireland and tosome extent Portugal, REER are projected tochange relatively little in most Member Statesover 2009-11 (Graph 2).

European Economic Forecast, Autumn 2009
Table I.1.5:
General government budgetary position - euro area and EU (% of GDP) Difference vs Difference vs
Euro area spring 2009 EU spring 20092008 2009 2010 2011 2009 2010 2008 2009 2010 2011 2009 2010
Total receipts (1) 44.8 44.0 43.7 43.7 -0.8 -0.7 44.6 43.4 43.2 43.2 -0.7 -0.6 Total expenditure (2) 46.8 50.4 50.5 50.2 0.3 -0.5 46.8 50.4 50.6 50.1 0.3 -0.5 Actual balance (3) = (1)-(2) -2.0 -6.4 -6.9 -6.5 -1.1 -0.4 -2.3 -6.9 -7.5 -6.9 -0.9 -0.2 Interest expenditure (4) 3.0 3.0 3.2 3.4 0.0 0.0 2.7 2.8 3.0 3.2 0.0 -0.1 Primary balance (5) = (3)+(4) 1.0 -3.4 -3.7 -3.1 -1.1 -0.4 0.4 -4.2 -4.5 -3.7 -1.0 -0.2 Cyclically adjusted budget balance -2.9 -5.0 -5.4 -5.3 -1.1 -0.7 -3.2 -5.5 -6.0 -5.7 -0.9 -0.4 Cyclically adjusted primary balance 0.1 -2.0 -2.2 -1.9 -1.1 -0.7 -0.5 -2.7 -3.0 -2.5 -0.9 -0.5 Structural budget balance -2.8 -4.9 -5.3 -5.3 -1.0 -0.6 -3.1 -5.4 -5.9 -5.7 -0.8 -0.4 Change in structural budget balance -1.0 -2.1 -0.4 0.1 -1.0 0.4 -1.0 -2.3 -0.5 0.3 -0.8 0.4 Gross debt 69.3 78.2 84.0 88.2 0.5 0.2 61.5 73.0 79.3 83.7 0.4 -0.1
The structural budget balance is the cyclically-adjusted budget balance net of one-off and other temporary measures estimatedby the Commission services.
30
Debt and deficits on the rise
The economic and financial crisis is having a significant impact on government finances. While discretionary fiscal stimulus measures together with the working of automatic stabilisers have been key to stabilising the economy, the implications of both the recession and the current expansionary stance are expected to lead to a significant increase in budget deficits and public debts.
The general government deficit in the EU is projected to rise from 2.3% of GDP in 2008 to almost 7% in 2009. In the euro area the increase is also sizeable, from 2% to just below 6½% of GDP. This is around 1 pp. above the projections of the spring forecast. Public deficits are expected to increase further in 2010, reaching 7½% in the EU and almost 7% in the euro area. The increase over these two years is therefore about 5 pps. in both areas. In 2010, all but one Member State (Bulgaria) are projected to have a government deficit in excess of the 3% of GDP reference value foreseen in the Treaty. Government deficits are, however, projected to ease somewhat in 2011, to some 7% in the EU and 6½% in the euro area. (24)
The sharp increase in general government deficits in 2009-2010 results mainly from the following three developments.
(24) Made on the basis of the usual no-policy-change
assumption, these projections exclude any budgetary decisions that Member States may take but which are not yet sufficiently known and/or spelled out.
Graph I.1.20: Increase in government deficit across recessions, euro area
0
1
2
3
4
5
6
74/75recession
80/81recession
92/93recession
08/09recession
Increase in government deficit (after 1 year)Increase in government deficit (after 2 years)
% of GDP
Firstly, considerable discretionary measures have been announced and implemented. In line with the European Economic Recovery Plan (EERP), many Member States have adopted or announced significant fiscal stimulus packages to promote investment, support households' purchasing power, help enterprises and sustain labour markets. They have also announced structural reform measures aimed at supporting economic growth over the medium-to-long term. Taken together, the overall discretionary measures amount to 1.4% of GDP in 2009 and 1.1% of GDP in 2010 in the EU (1.3% and 1.2% in the euro area). (25) However, many of the countries most affected by the crisis, particularly among the new Member States, have had very limited room to implement stimulus measures (and have often predominantly adopted
(25) As mentioned earlier in the text, fiscal stimulus measures
alone represent about ¾ of the overall discretionary measures in the EU (i.e. 1% of GDP in 2009 and 0.9% in 2010).

Economic developments at the aggregated level
31
consolidation measures with a view to avoiding a further fall-out from the crisis). (26)
Secondly, automatic stabilisers are operating. In addition to the discretionary measures, the severe economic downturn is triggering strong declines in tax revenue and sharp increases in social security expenditure, notably unemployment benefits. The budgetary impact of these automatic stabilisers is estimated at roughly 2½ pps. of GDP over 2009-10.
Thirdly, over and above discretionary measures and the working of automatic stabilisers, revenues have displayed a significantly higher responsiveness (elasticity) to faltering economic activity in the current exceptional crisis than in "normal" cyclical downswings. (27) This could partly be linked to the composition of growth, with declining tax intensity (in particular, falling asset prices and corporate profits as well as a general shift in growth away from domestic demand components). Having started to decline in 2008, the revenue-to-GDP ratio in the EU is thus estimated to fall by a further 1¼ pp. in 2009 and ¼ pp. in 2010.
Taking these three elements together, the expenditure ratio is projected to rise from nearly 46¾% of GDP in 2008 to around 50½% in 2009 and 2010 in the EU, while the revenue-to-GDP ratio is projected to decline from 44½% in 2008 to 43½% in 2009 and to 43¼% in 2010 in the EU.
The impact of the economic crisis on public finances varies across Member States. In countries with strong macroeconomic imbalances and/or where the bursting of an asset bubble adds to the effect of the global downturn (e.g. the UK), the
(26) Apart from stimulus and structural reform measures, more
than half of the EU Member States have undertaken consolidation measures. In total, these measures account for 0.3% of GDP in 2009 in both the EU and the euro area. In some countries, the consolidation measures outweigh the stimulus and structural measures taken, in particular in the Baltics and Romania, but also in Ireland and Greece.
(27) The relative resilience of the revenue ratio in 2009 in some countries (e.g. Germany) is partly explainable by the evolution of indirect taxes and social contributions, which are projected to be held up by relatively resilient private consumption expenditure and compensation of employees, counterbalancing somewhat the strong fall in direct taxes. In countries with a strongly domestically driven downturn and/or reversal of an asset boom, such as Ireland, Spain or the UK, revenue ratios have been falling substantially, while in countries where the slowdown has been mainly triggered by the external sector, such as Germany, the re-composition of tax bases towards tax-richer components has limited the impact on the revenue ratio.
budgetary deterioration is more pronounced than in other countries. In some of these countries the increase in government deficits combined with low (nominal GDP) growth is set to give rise to a large increase in debt positions.
Graph I.1.21: Total revenue and expenditure (four-quarter moving average), EU
42
43
44
45
4647
48
49
50
51
99Q4 01Q4 03Q4 05Q4 07Q4 09Q4 11Q4
Total revenues Total expenditure
forecast
% of GDP
The notable increase in deficits is contributing to the upward revision of government debt positions, compared to the spring forecast. However, the deterioration is also due to the rescue interventions in response to the financial crisis (bank recapitalisations, loans to private enterprises, etc.). The impact of such operations on the government debt is reflected in the so-called stock-flow adjustment, which is projected to be 0.6% of GDP in 2009 and 0.3% in 2010 (Table I.1.5).
Table I.1.6: Euro area - debt dynamics
(% of GDP) average 2003-07 2008 2009 2010 2011
Gross debt ratio1 68.6 69.3 78.2 84.0 88.2Change in the ratio -0.4 3.3 8.9 5.8 4.2Contributions 2 :
1. Primary balance -0.9 -1.0 3.4 3.7 3.12. “Snow-ball” effect 0.3 1.1 4.9 1.8 1.1
Of which:Interest expenditure 3.0 3.0 3.0 3.2 3.4Growth effect -1.4 -0.4 2.9 -0.5 -1.2Inflation effect -1.4 -1.5 -1.0 -0.8 -1.1
3. Stock-flow adjustment 0.3 3.2 0.6 0.3 0.1Notes:1 End of period.2 The snow-ball effect captures the impact of interest expenditure on accumulated debt, as well as the impact of real GDP growth and inflation on the debt ratio (through the denominator). The stock-flow adjustment includes differences in cash and accrual accounting, accumulation of financial assets and valuation and other residual effects.
In the EU, the gross debt ratio is now forecast to rise by almost 18 pps. between 2008 and 2010, to a level of close to 80% of GDP. In the euro area, gross debt is projected to rise even further to 84%
European Economic Forecast, Autumn 2009
32
of GDP. The rising debt positions are unprecedented in size at the aggregate level. (28) (29)
1.3. UNCERTAINTY REMAINS HIGH
While economic conditions and growth prospects have improved somewhat since the spring, the outlook for the EU economy remains highly uncertain and subject to non-negligible risks.
On the downside, a lingering important concern is the possible intensification of the negative feedback loop between the real economy and the still relatively fragile financial sector. There are several channels through which this could happen. For instance, an increase in corporate bankruptcies or mortgage defaults, on the back of weaker than expected economic and labour market conditions, could hamper the process of bank balance sheet repair and lead to renewed credit tightening, thus reinforcing vulnerabilities in the real economy. Equally, a structurally weaker banking system owing to an incomplete cleansing of balance sheets could weaken the sustainability of the recovery.
Headwinds on the domestic front pose a second downside risk to the growth outlook. In particular, deteriorating labour market conditions could constrain consumption to a greater extent than currently envisaged, even more so if the slack in the labour market were to result in lower wage growth than projected in the baseline. Moreover, in an environment characterised by uncertainty and rising unemployment, a further increase in the saving rate cannot be ruled out. As for investment,
(28) On top of the stimulus measures, Member States have
adopted numerous extra-budgetary measures (i.e. measures not affecting the general government balance) to support demand. These measures, such as loans and capital injections to the non-financial private sector or enhanced investment by public enterprises, are currently estimated at about ½% of GDP. Additionally, public money amounting to about 1¾% of EU GDP has been injected into the financial sector in the form of recapitalisations. These measures affect government debt, but not the deficit. Moreover, guarantees to the financial sector of around 24½% of EU GDP have been approved by the European Commission, of which around 8% of GDP has actually been granted so far. Impaired asset relief and liquidity support to the banking sector, similar in nature to guarantees, amount to around 4% of GDP (approved). Guarantees represent contingent liabilities which affect the government deficit (and debt) only once they are called upon.
(29) For further analysis on debt developments in the EU see also chapter 1.3 in this report and European Commission (2009) Sustainability Report, Directorate-General for Economic and Financial Affairs, European Economy (9/2009).
the dampening effect of ongoing housing-market corrections in several Member States and spare capacity could prove stronger than assumed, while the possibility of a permanently higher cost of capital is another negative factor. (30) In addition, the ending of a number of stimulus measures and the start of the consolidation phase could weigh on domestic demand more than expected at present. At the same time, the relative strength of the euro may restrain export growth somewhat more than predicted.
In terms of the external environment, rising oil and other commodity prices could mitigate the global recovery (31), as could a premature withdrawal of stimulus measures in key trading partners. Furthermore, growing social tension in light of high unemployment may trigger an increase in protectionist measures. (32)
On the upside, the turning of the inventory cycle could have a more favourable impact than expected, while policy measures in the EU (and abroad) may prove more effective than assumed to date in restoring the financial sector to health and boosting confidence among business and consumers. As a result, domestic demand could be stronger than projected. Added to this, a more pronounced pick-up in global demand poses an upside risk for export growth. The realisation of this risk would, in turn, support the export-investment link which has been a defining feature of previous upswings, but is seen as less strong in this recovery.
Overall, amid continuing sizeable uncertainty, risks to the EU growth outlook for 2009 and further out appear to be broadly balanced.
Graph I.1.22 quantifies the various risks in terms of the possible deviation of output growth from the central forecast. It shows the impact that different combinations of risks could have on euro-area GDP growth, the outcomes being weighted by the probability of their occurrence. At a 90% (30) Simulations showing the impact of an increase in capital
costs on investment trends can be found in European Commission (2009) “Impact of the current economic and financial crisis on potential growth”, Directorate-General for Economic and Financial Affairs, European Economy Occasional Paper N° 49, June.
(31) An illustrative simulation using the QUEST model shows that a €10 increase in the price of oil could lower growth in the EU by 0.1 percentage point in the first and second years.
(32) For a discussion of the consequences of protectionism, see Box 1 'The risks of protectionism' in the September 2009 issue of the ECB's Monthly Bulletin.

Economic developments at the aggregated level
33
confidence interval, GDP growth in the euro area in 2010 could be around 2 pp. lower than the central scenario if all negative factors were to materialise, but could be up to 2 pp. higher if the positive risks to the outlook were to come about. In 2011, uncertainties surrounding the forecast increase. In this case, again at the 90% confidence interval, euro-area GDP growth could be about 2¾ pp. lower or up to 2¾ pp. higher.
-6
-5
-4
-3
-2
-1
0
1
2
3
4
5
06 07 08 09 10 11
%
upper 90%upper 70%upper 40%lower 40%lower 70%lower 90%actualcentral scenario
Graph I.1.22: Euro area GDP forecasts: Uncertainty linked to the balance of risks
Turning to the inflation outlook, risks appear to be largely balanced over the forecast horizon. Higher oil and other commodity prices pose an upside risk, whereas the remaining slack in the economy (i.e. the large output gap) should keep inflationary pressures subdued. As for the risk of a deflation scenario, this has subsided further over the course of the year, at least at the aggregate level.
Looking beyond the forecast horizon and more towards the medium-term, a number of risks to the economy's growth prospects on account of the crisis can be identified. These include the possibility of a 'jobless' recovery and persistently high unemployment; unsustainable public finances; and, as discussed earlier, the risk that potential growth may not return to the pre-crisis level, in view, for example, of a permanent change in financing conditions following a shift in risk aversion and/or a sustained need for deleveraging. (33)
1.4. ECONOMIC CHALLENGES AHEAD
The outlook presented in this autumn forecast leaves authorities with formidable economic challenges ahead in order to secure a return to a
(33) See also the references in footnote 4.
balanced and sustainable growth path. The priority of these challenges may vary across Member States according to the position prior to the crisis, their fiscal room for manoeuvre, etc. These challenges are discussed within each of the country chapters. However, at least at the aggregate level four economic challenges stand out as the most urgent.
Given the crucial role of the labour market for a sustained recovery to materialise, a first economic challenge is to halt the worsening of labour market conditions and to prevent a return to the significant degree of hysteresis experienced by Europe in the past. With substantial restructuring across some sectors also to be expected in some countries, part of the challenge will be to reduce skills-mismatch and facilitate the reintegration of displaced workers back into employment.
The marked deterioration of public deficits and debt projected in this forecast points to a second key economic challenge: addressing the long-term sustainability of public finances. The importance of this challenge is raised further by the adverse implications of an ageing population.
Given the depth of the recession, a third economic challenge relates to mitigating the adverse impact of the financial and economic crisis on potential growth. With financial markets still fragile, particularly the banking sector, this includes addressing the outstanding vulnerabilities in this sector, so as to reduce risk premia and hence the cost of capital going forward.
Finally, there are also economic challenges related to adjustment within the euro area. The divergences which raised concern before the crisis are still present to a certain extent. While the crisis has triggered some adjustment, the remaining imbalances (e.g. persistent divergences in competitiveness positions) would need to be corrected in a more demanding domestic and external environment.

2. RECENT LABOUR MARKET DEVELOPMENTS AND PROSPECTS
Graph I.2.1: Unemployment rates in the EU
0
5
10
15
20
25
ES LV LT EE IE SK HU EA EU EL FR FI SE BE PL DE PT IT UK RO SI BG CZ MT LU CY AT DK NL
2008 2009 August 2010 forecast 2011 forecast
%
34
2.1. LABOUR MARKET PERFORMANCE
In 2009, and after years of relatively good performance, the EU labour market is undergoing a pronounced slowdown with significant job losses occurring across many Member States and sectors.
Against the background of a modest recovery in 2010, the unemployment rate is expected to continue to climb, reaching about 10½% in the EU by 2010 (about 11% in the euro area) and to remaining at this high level in 2011 (Graph I.2.1). Over the period 2008-2011, the most pronounced
increase in unemployment is expected in the Baltics Estonia, Ireland and Spain. On current policies, employment in the EU and in the euro area is expected to fall in 2010 with a very moderate recovery (0.3%) in 2011 in the EU.
Unemployment in the EU reached its lowest rate (6.7%) in a decade in the second quarter of 2008. Since then, and up to the second quarter of 2009, EU GDP has fallen by around 5%, while the jobless rate has increased by about 2 pps. (34)
(34) For the euro area, the lowest unemployment rate was
achieved in the first quarter of 2008; since then the
While labour markets held up well last year, the adjustment started in earnest in the first half of 2009 and unemployment had risen by over 2 pps. by the autumn. The responsiveness of unemployment to cyclical conditions appears to have increased in the recent years, but in the current recession this has to some extent been masked by the use in some countries of short term working schemes in the early phases of the crisis. On the contrary, in others there has been a huge contraction of employment owing to the need to reallocate resources away from low productive sectors.
However, the true scale of the adjustment is still to be seen over the next two years. Unemployment is set to rise well into next year, reaching levels not seen for over a decade. Given the expected path of the labour force and demographic projections, the participation rate in 2009 and 2010 is set to decline slightly in the euro area and to remain largely unchanged in the EU.
The outlook for the EU economy remains highly uncertain. The unemployment rate could turn out higher if uncertainty prevails, sectoral restructuring is more significant than assumed and wages in countries and sectors particularly hard hit do not adjust. Past labour market reforms have been effective at strengthening the labour market attachment of vulnerable groups. Yet, an uncertain recovery would in all likelihood deal a blow to labour supply through discouraged worker effects. It is worth noting that historically, the unemployment rate in Europe has always taken more than 3 years to return to pre-recession levels after recessions have ended. However, labour market reforms enacted over the last decade have made European labour markets more flexible and resilient, implying that increases in unemployment could be less persistent than those seen after previous post-war recessions.

Economic developments at the aggregated level
35
During the same period, the labour market lost more than 4 million jobs, of which more than two thirds in 2009. Almost three years of progress in bringing the unemployment rate down from 9% to 6.7% was wiped out in a year and a half.
To keep up with the growth of the population, the labour market would need to create about ½ and ¼ million jobs in 2009 and 2010 respectively, to avoid unemployment from increasing for a constant participation rate, while it is forecasted to lose about 4½ and 2¾ million respectively. So far, a reduction in the participation rate has been registered in only a few countries, namely Finland, Ireland, Italy and Portugal.
Workers with "weaker" work contracts, less qualified and less experienced workers have borne much of the brunt of the current recession (Table I.2.1). Men tend to be overrepresented in these categories. Conversely, women have so far been less affected than men, because the crisis hit first and foremost sectors such as construction and manufacturing, where male employment is relatively high. Yet, female employment was in the first quarter of 2009 below the level of one year earlier – the first such fall since the fourth quarter of 2005. The unemployment rate for young people (15-24) jumped by 4 pps. in one year to 20%. Employment for the same group fell by 1 million (5% quarter-on-quarter) in the fourth quarter of 2008, and by another million in the first quarter of 2009. The fall in employment of prime age workers, limited in the fourth quarter of 2008, intensified in the first quarter of 2009 when about 3 million jobs were lost.
harmonised unemployment rate has risen to 9.6% in August 2009.
At the onset of the crisis, the bulk of job losses was concentrated in just a few Member States (the Baltic States, Spain and Ireland), largely as a result of pre-existing weaknesses as well as a greater exposure to the direct consequences of the shocks. However, the crisis subsequently put a widespread brake on domestic demand across the whole of the EU at a time when external demand was fading, and employment started falling in all Member States. The unemployment rate increased everywhere, particularly in those countries which had already been strongly affected by the crisis in 2008.
The aggregate data conceal a rather heterogeneous adjustment to the global recession across Member States. Although, the labour market adjustment has so far been sizeable in Spain, Ireland, and the Baltic States, it has as yet been relatively limited in Italy and Germany. Yet the correlation between output growth and changes in unemployment is negative and significant in many Member States (Graph I.2.3). Moreover, for the EU as a whole it is stronger during the present recession than during the recessions of the early 1980s and 1990s, which suggest that today's labour market is far more flexible, although it could also be affected by the sheer size of the contraction in GDP.
Graph I.2.2: Employment and GDP growth in the EU
-5
-3
-1
1
3
5
7
9
96 97 98 99 00 01 02 03 04 05 06 07 08 09
GDP growthEmployment growth
Grey => Recession period
y-o-y %

European Economic Forecast, Autumn 2009
36
Table I.2.1:Employment growth by type of contracts and level of education
Employment growth y-o-y 1.6% 1.6% 0.6% -1.1% -1.6%Employees 1.8% 1.9% 1.2% -0.9% -1.4%Self-employed 4.0% 0.4% -1.7% -1.8% -1.8%Part-time* 4.6% 2.7% 1.4% 0.0% 0.7%Full-time* 2.3% 2.2% 0.5% -1.4% -2.1%Temporary employment 3.9% 1.3% -2.9% -8.5% -8.3%low skilled -0.8% -1.1% -3.8% -5.5% -5.4%medium skilled 2.5% 1.4% 1.4% -1.1% -1.6%high skilled 4.4% 4.4% 4.0% 3.3% 2.6%
Employment growth y-o-y 1.2% 1.7% 0.7% -1.0% -1.6%Employees 1.5% 2.0% 1.3% -0.8% -1.5%Self-employed 1.9% 0.7% -1.5% -1.3% -1.4%Part-time* 3.1% 2.4% 1.4% 0.3% 1.0%Full-time* 2.0% 2.2% 0.7% -1.3% -2.2%Temporary employment 4.4% 0.2% -2.8% -7.0% -6.3%low skilled -1.2% -1.4% -3.4% -4.7% -4.9%medium skilled 1.9% 1.6% 1.1% -1.5% -2.6%high skilled 4.4% 4.5% 4.0% 3.3% 3.1%
Euro-Area
European Union
Avg 2000-2007 2008 first half 2008 second half
2009 Q22009Q1
2008 second half
2009 Q22009Q1
Note: Employment data based on LFS differ from those on National Accounts. For a methodological discussion see the box"The measurement on employment in National Accounts and in the Labour Force Survey", in Labour market and wagedevelopments in 2007, European Economy No.5, 2008.
Avg 2000-2007 2008 first half
Table I.2.2:Employment and participation rates by age groups and gender
Employment rate (ages 15-64), %total 63.2 66.1 66.2 64.7 64.9young (15-24) 37.0 38.0 38.2 35.3 35.1prime-age (25-54) 76.9 79.5 79.5 78.1 78.2older (55-64) 38.3 44.4 44.8 44.5 45.5male 72.0 73.4 73.4 71.2 71.3female 54.4 58.8 59.1 58.1 58.5
Participation rate (ages 15-64)total 69.1 71.4 71.7 71.4 71.6young (15-24) 44.3 44.5 45.4 43.7 43.7prime-age (25-54) 83.3 85.2 85.3 85.3 85.3older (55-64) 41.4 46.8 47.5 47.8 48.8male 77.8 78.7 78.9 78.4 78.6female 60.4 63.9 64.4 64.3 64.7
Employment rate (ages 15-64), %total 63.2 65.8 66.1 64.6 64.8young (15-24) 36.6 37.6 37.9 35.3 35.0prime-age (25-54) 77.0 79.6 79.7 78.2 78.4older (55-64) 40.4 45.6 46.0 45.5 46.4male 70.9 72.8 72.9 70.8 70.9female 55.6 59.1 59.4 58.4 58.8
Participation rate (ages 15-64)total 69.3 70.7 71.2 70.8 71.1young (15-24) 44.5 43.9 45.1 43.5 43.6prime-age (25-54) 83.4 84.7 84.9 84.8 84.9older (55-64) 43.2 47.8 48.4 48.6 49.4male 77.2 77.8 78.2 77.6 77.8female 61.5 63.7 64.2 64.0 64.4
Avg 2000-2007 2008 first half 2008 second half
2009 Q22009Q1
Euro-Area
European Union
Avg 2000-2007 2008 first half 2008 second half
2009 Q22009Q1

Economic developments at the aggregated level
37
2.1.1. The role of labour hoarding in moderating the rise in unemployment
A major feature during the early quarters of the recession was the fall in output growth, accompanied by an only limited fall in employment growth for the EU as a whole (Graph I.2.2). However, by the summer of 2009, the overall adjustment in unemployment rates had caught up with the average during past recessions.
The importance of labour hoarding during the current recession is discussed below and can be illustrated by the fall in the average hours worked in countries where the increase in unemployment is relatively small while the fall in GDP is relatively large (35). For example, among countries with an output loss higher than the EU-27 average, the increase in unemployment is lower than average in Germany and Italy, while hours worked declined proportionally more than employment growth. (36) Conversely, the average number of hours worked increased slightly in France and declined in Spain (Graph I.2.4), despite similar output losses in both countries - about 3% from the first quarter of 2008 to the first quarter of 2009. (37)
"Okun's law" relates changes in unemployment to output growth. Assuming adjustments in labour supply are limited, estimates of Okun's law can, therefore, give some insight into the phenomenon of labour hoarding. This is done by comparing the actual changes in unemployment observed during the 2008/2009 recession quarters with the change implied by the historical relationship between output growth and unemployment changes (Graph I.2.5). (38) Evidence of strong labour hoarding compared to previous patterns is found for Finland, Austria, the Netherlands and Germany. On the (35) DG ECFIN (2009) "Economic crisis in Europe: Causes,
consequences and responses", Chapter 2 Impact on labour market and employment. European Economy, No 7.
(36) During the current recession the average hours worked fell in Italy and Germany more than during past recent recessions. The opposite is observed for France. DG ECFIN (2009), "Labour Market and Wage Developments in 2008", European Economy, No 8.
(37) The increase in the average hours worked in France may be due to the effect of the TEPA law, implemented in 2007, which introduced a tax break on overtime work and increased overtime premiums in firms with less than 20 employees. More detailed information about recent reform of the working time organisation in France can be found in the Country fiche on France in the report "Labour Market and wage developments in 2008", European Economy no. 8.
(38) See background material for this chapter in A. Arpaia, Carone, G. and Curci, N. (2009) "Labour market behaviour during the recession" DG ECFIN Economic Paper forthcoming.
other hand, the adjustment in Spain, Ireland, Greece and the Baltics is stronger than that suggested by historical patterns.
In summary, the labour market response to the global slowdown has been rather heterogeneous across countries. This is partly due to the need to reallocate resources away from specific industries characterised by low productivity growth and/or overcapacity. In addition, recourse to flexible working time arrangements has also differed significantly across Member States. In many European countries, government sponsored schemes were already available or were introduced during the crisis to supplement the wages of workers working at reduced hours. The use of these schemes has varied across countries, which explains some of the differences in the labour market responses.
Short-time schemes can be an effective instrument to contain wasteful labour shedding in the face of a temporary demand shock. This is less obvious if the recovery takes more time to materialise and/or companies face the need to restructure. In this situation adjustments in the workforce are required which could be hampered if schemes "freeze" employment patterns in the affected sectors and companies. To address this, Member States often impose strict conditionality for access to government support, but it is too early to tell to what extent this will help to avoid an increase in unemployment when the schemes expiry. In any event, the limited adjustment observed so far in some countries could imply significantly less hiring during the early years of the recovery. The risk of jobless or job-low growth beyond the forecast horizon is potentially high in these countries.
2.2. FACTORS DRIVING THE LABOUR MARKET OUTLOOK
The severity of the recession raises concerns about the labour market adjustment and its persistency. In particular, it is clear that employment will continue to be affected in the year ahead. Job losses may translate into longer spells of unemployment, which would lead to a deterioration of skills, contribute to the persistency of unemployment (hysteresis) and increase the likelihood of a fall in labour supply, ultimately translating into a higher natural rate of unemployment. A key question is how the labour

European Economic Forecast, Autumn 2009
38
market will behave during the early stages of the recovery. This section discusses the potential risks to the labour market outlook. It reviews the explanations given for a delayed labour market recovery and looks at the risks of jobless growth in Europe. The matching of vacant posts with the unemployed and the risk that high unemployment translates into high equilibrium unemployment is discussed subsequently. The final section examines
the impact of the recession on wages and labour costs.
2.2.1. Employment intensity of GDP growth: the risks of jobless recovery
At the early stages of recoveries, when firms have limited information about demand, they tend to adjust productivity more than employment, which implies that employment responds with a time lag
Graph I.2.3: Correlation between output growth and change in unemployment 2006Q 2-2009Q 1
-1.0
-0.8-0.6-0.4
-0.2
0.00.2
ES FI CZ LT UK DE FR CY NL LV EE GR SI PL SE MT HU SK IT AT PT LU RO IE BE DK
Correlation coefficient Rank order correlation coefficient
Graph I.2.4: Average hours worked in se lected countries - change 20008Q 2-2009Q1
-13-8-327
12
ES (-3.1)
EE (-15.7)
LT (-24)
IE (-8.6)
DK
(-4.4)
SE (-6.5)
HU
(-7.8)
CZ (-3.4)
FR (-3.1)
FI (-6.1)
BE (-3.5)
CY (0.2)
AT (-3.9)
IT (-6.7)
SK (-3.1)
BG (0)
NL (-5.2)
DE (-6.5)
Unemployment rate (pp. change)Average hours worked (% change)Note: In brackets GDP growth
Graph I.2.5a: Gap between actual and predicted employment growth
-4
-3
-2
-1
0
1
IE EE LV GR SI DK UK CZ BE IT PT ES LU AT FI FR NL DE LT SK EU
2008H12008H22009H1
pps.
Graph I.2.5b: Gap between actual and predicted unemployment rate changes
-0.6-0.10.40.91.41.92.4
FI NL DE AT PT FR UK SI CZ SK IT LU BE DK ES LT EE GR LV IE EU
2008H12008H22009H1
Note: Each bar represents the gap between the actual employment growth (unemployment change) and the employment growth (unemployment change) predicted on the basis of a country specific relationship linking employment growth (unemployment change) to GDP growth. EU weighted average.
pps.

Economic developments at the aggregated level
39
to changes in output. When these lags are substantial, job creation remains insufficient to bring unemployment down for a prolonged period of time after the upturn, and the recovery turns out to be jobless. (39) Economists have given a number of explanations for jobless recoveries:
• Employment lags the pickup in the economic growth as a consequence of labour hoarding during the preceding recession. As output falls firms do not fire their workers but hold on them for a time even if they are not fully utilised. Thus, when GDP increases, new workers are not hired until the existing ones are fully employed. Given the depth of the present recession, this effect could be significant.
• Macroeconomic uncertainty can be considered as a stand-alone reason for low employment growth at the early stages of economic recoveries. The combined effect of a temporary pause of aggregate demand and heightened uncertainty may lead firms to postpone hiring, thus delaying the time at which employment starts growing again (Bloom, 2008 and Bloom et al, 2009).
• Another view contends that a reduction in the utilisation of labour occurs after recessions which trigger a considerable degree of restructuring. Assuming that jobs are permanently destroyed in some sectors, aggregate employment growth depends on new positions being opened elsewhere. This is unlikely to happen without either a substantial reduction in real wages or a reduction in the uncertainty about the depth and duration of the slump. (40) Displaced workers are not necessarily suitable to fill new jobs and may exert little pressure on wages. As a consequence both the duration of unemployment and the NAIRU could increase. According to this interpretation, unemployment
(39) In the US, during the recovery from the 2001 recession,
employment grew more slowly than could have been explained by sluggish output growth alone. The gains in employment during the recovery were less than what observed for the average cycle and made the recovery jobless. Despite the employment growth of the second half of 2003, it was only in January 2004 that employment increased above the level recorded at the trough of the cycle. The total numbers of hours worked also resumed very slowly compared to previous recoveries.
(40) The evidence on the structural shift hypothesis is mixed. See DG ECFIN, "Labour market and wage developments in 2004, with special focus on the risk of jobless growth", European Commission - European Economy- Special report, No 3/2005.
is expected to start decreasing and employment increasing only when the recovery is set on a steady path.
• According to a fourth explanation, a weak labour market may prevail after periods of long expansion during which firms delay internal restructuring until the recession arrives; high aggregate job destruction would occur as many firms go through a period of internal re-organisation.
• Finally, "just-in-time" employment practices allow firms to wait before opening new vacancies and hiring full-time workers until the signs of a robust recovery materialise in the forms of strong demand for their goods and services. (41)
A further consideration concerning the current recession relates to the presence of an impaired financial sector. The empirical evidence on international banking crises shows that output losses that follow financial crises are highly persistent and accompanied by a persistent increase in unemployment (42) owing to: output losses; the disruption of the credit flows, which creates difficulty in funding operating expenses; hiring freezes and delay in the sectoral reallocation. (43) In addition, since the self-employed are more likely to be liquidity constrained, the financial crisis might reduce access to bank credit for potential new self-employed workers, which may make moves from self-employment into unemployment or inactivity more prevalent than entries into the labour market.
Implications for the European labour markets
Looking at previous recessions can give clues about the extent to which the current labour market adjustment is congruent with the past experience. In previous recessions unemployment spiked quickly and did not fall back to its pre-recession
(41) Schreft, S.L. and Singh, A. (2003), ‘A closer look at
jobless recoveries’, Economic review, Federal Reserve Bank of Kansas City, Second Quarter; Aaronson, D. Rissman, E.R. and Sullivan, D. (2004), Assessing the jobless recovery’, Economic perspective, Federal Reserve Bank of Chicago, Vol. 28, Second Quarter.
(42) Cerra, V. & S.C. Saxena (2008), "Growth Dynamics: The Myth of Economic Recovery", American Economic Review, Vol. 98:1 pp. 439-457. IMF (2009), "From Recession to Recovery: How soon and How strong?" Chapter 3 World Economic Outlook, April.
(43) Bloom, N. "The Impact of Uncertainty Shocks", Econometrica vol 77, No3 (May 2009), 623-685.

European Economic Forecast, Autumn 2009
40
level for several years (Graph I.2.6). In the recession of the early 1990s, GDP contracted for about five quarters in Italy and the UK and two quarters in Germany and France. However, the unemployment rate only returned to pre-recession levels after more than 30 months following the onset of the recession in Italy and the UK and after about 20 months in France and Germany. During the recovery of the early 2000s, the behaviour of the labour market differs from that of the average cycle. (44) For example, the increase in output in Spain and Italy between 2003 and 2004 translated almost entirely into higher employment. In France, where one year after the trough the recovery was jobless, the increase in productivity was higher and the participation rate less responsive than in the average recovery. In the UK, employment continued to increase up to two quarters ahead of the trough of GDP and stagnated for the remaining part of the year. In Germany, the recovery seemed less atypical as the disappointing economic recovery was accompanied by modest employment growth. Finally, there is a striking contrast between the behaviour of unemployment in the US in the aftermath of the severe recessions of the early 1980s and 1981 and the one that followed the two most recent recessions in 1990-1991 and 2001, which has made many observers to qualify the last two recoveries as jobless.
During the current recession, the EU and the euro-area unemployment rate increased by about 2 pps. between the second quarter of 2008 to second quarter of 2009, while GDP declined by about 5% over the same period. This means that each percentage point of decline in GDP has implied an increase in unemployment of about ½ pp. A key
(44) DG ECFIN (2004), "Labour Market and Wage
Developments in 2004, with a special focus on the risks of jobless growth in Europe", European Economy, No 3.
question is to what extent the actual increase in unemployment fully reflects the decline in output observed so far. Comparison with past experiences is useful and the "Okun relationship" can be a tool to address these issues.
Graph I.2.7 reports for different periods the coefficients of this relationship for a number of selected EU countries. Current changes in unemployment are regressed on current output growth, past output growth (up to three lags) and past changes in unemployment. The main results are the following:
• The coefficients of current output growth are higher than the coefficient of past output growth, but both are now larger than in the 1990s.
• In addition, the response of unemployment to output also depends on the persistence of the unemployment rate, which is due to mechanism that creates hysteresis. In the more recent decade this persistency falls. This implies that for a given change in output growth there is now less carry-over of changes in unemployment rate.
Thus, there is a change in the relationship between unemployment and output, which implies that the combined impact of the two effects on unemployment is stronger during the first quarters. (45) This suggests that past labour market
(45) Direct evidence of this is confirmed by the analysis of the
interim multipliers. These findings differ from those for the United States, which give more support to the possibility of jobless recovery in this country in the more recent period (Knotek 2007).
Graph I.2.6: Changes in unemployment around recessions
-4
-2
0
2
4
608
Q2
04Q
4+6M
03Q
1+6M
01Q
2+6M
92Q
2+18
M
82Q
2+9M
08Q
2
92Q
4+6M
08Q
2
02Q
4+9M
95Q
4+6M
91Q
2+6M
08Q
2
90Q
3+15
M
80Q
1+15
M
08Q
1
01Q
2+8M
90Q
3+8M
81Q
3+16
M
80Q
1+6M
Change in unemployment during the recession, percentage points Change in unemployment during the year following the end of the rec
Note: Recessions are identified as two consecutive quarters of negative growth. On the horizontal axis, the starting quarter and the duration of the recessions in months are reported. US recession dates are taken form NBER.
pps.
IT FR DE UK US
Change in unemployment during the current recession, percentage points

Economic developments at the aggregated level
41
reforms have made unemployment more responsive to the cycle. (46)
During the present recession, this has partly been offset by the use of short-time schemes, which could mean that a recovery would lead to a somewhat delayed fall in unemployment; yet, over the medium term, the fall in unemployment could be stronger than in the past. Thus, without significant improvements in output growth, a substantial effect on unemployment may be expected. Yet the lower persistency of unemployment of the more recent period may suggest a faster adjustment as the economy rebounds.
The extent to which recent labour market reforms have affected the relationship during the recession is unknown. To gain some insight, graph I.2.8 reports Okun's coefficients estimated using the rolling regressions technique. (47) By looking at the change in the estimates over time, one can infer how the relationship changes over the business cycle. The graph plots the coefficients of GDP growth together with the number of recession quarters that are included in the sample. It suggests that there is an increasing effect of GDP growth on unemployment (at various lags) in the recent years. However, during the most recent quarters this effect diminishes which could be caused by the use of reduced working time during the crisis. Moreover, the effect of the contemporaneous GDP growth prevails on the effects of lagged GDP growth and increases during recessions. What is
(46) See also Quarterly Report on the Euro area vol 7 no 1
(2008) "Recent labour market reforms in the Euro area: characteristics and estimated impact".
(47) For a discussion of the estimation technique see A. Arpaia, Carone, G. and Curci, N. (2009).
worrying is the fact that in the past the response of changes in unemployment to GDP growth has become smaller as the economy recovers – as is evident from the estimation ending in mid 1990s (see change in the coefficients around 1995q1 in graph I.2.8).
How does a W or V shape recovery influence unemployment and participation?
The reaction of the labour market during a recession influences its response during the recovery. In addition, the response of the labour market is also influenced by the timing and the shape of the recovery. If the initial recovery is tentative and lacks sustainability, employers will be reluctant to open new vacancies and hire workers. The shape of the cycle depends very much on the types of shock that caused the recession. In particular, recessions that take place together with a financial crisis, often caused by overoptimistic expectations of income growth, are followed by prolonged and uncertain recoveries (IMF, 2009, Knotek, 2009).
Graph I.2.7: The O kun's coefficient over different periods
-0.12
-0.1
-0.08
-0.06
-0.04
-0.02
0
Coefficient of GDP growth Coefficient of GDP growth(-1)
Coefficient of GDP growth(-2) Coefficient of GDP growth(-3)
Note: White bars display coefficients non statistically significant.Due to the data availaiblity the Okuns' coefficients are based on a panel composed of the following countries: Germany,France, Italy, Belgium,Sweden, the UK and Spain; Current changes in unemployment are regressed on current output growth, past output growth (up to three lags) and past changes in unemployment.
1981Q1 - 2008Q1 1981Q1 - 1990Q2 1990Q3 - 1999Q4 2000Q1 - 2008Q1
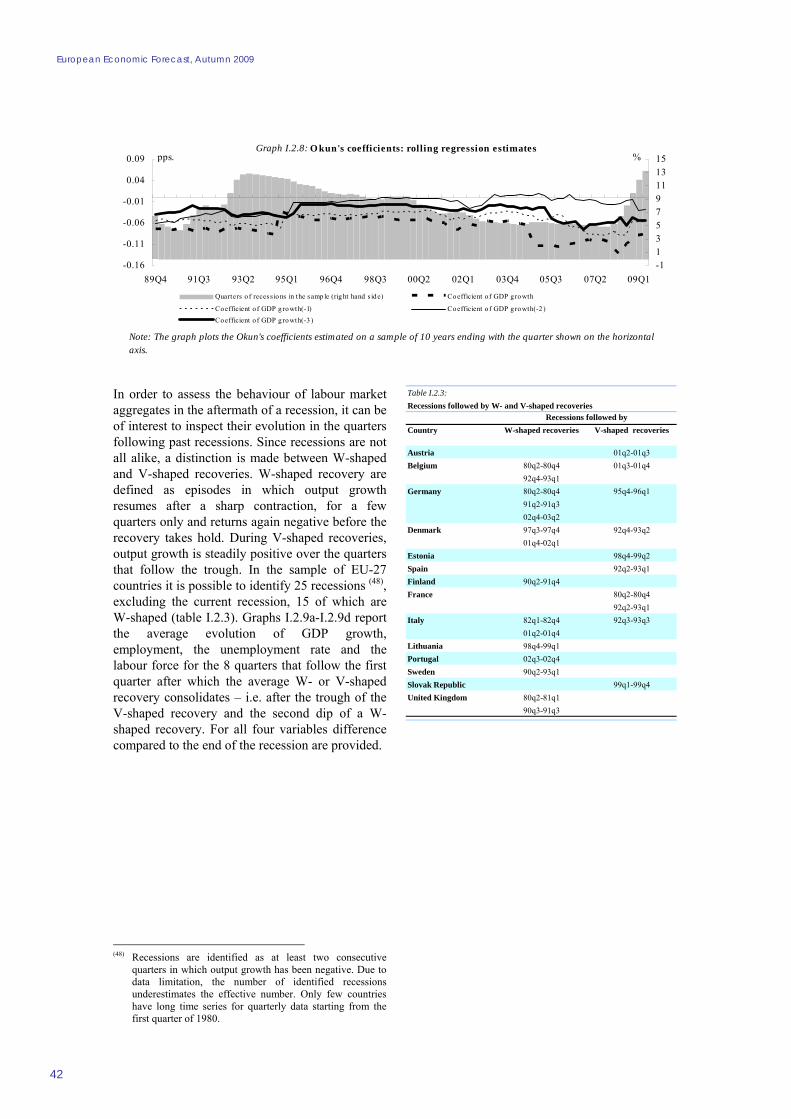
European Economic Forecast, Autumn 2009
42
In order to assess the behaviour of labour market aggregates in the aftermath of a recession, it can be of interest to inspect their evolution in the quarters following past recessions. Since recessions are not all alike, a distinction is made between W-shaped and V-shaped recoveries. W-shaped recovery are defined as episodes in which output growth resumes after a sharp contraction, for a few quarters only and returns again negative before the recovery takes hold. During V-shaped recoveries, output growth is steadily positive over the quarters that follow the trough. In the sample of EU-27 countries it is possible to identify 25 recessions (48), excluding the current recession, 15 of which are W-shaped (table I.2.3). Graphs I.2.9a-I.2.9d report the average evolution of GDP growth, employment, the unemployment rate and the labour force for the 8 quarters that follow the first quarter after which the average W- or V-shaped recovery consolidates – i.e. after the trough of the V-shaped recovery and the second dip of a W-shaped recovery. For all four variables difference compared to the end of the recession are provided.
(48) Recessions are identified as at least two consecutive
quarters in which output growth has been negative. Due to data limitation, the number of identified recessions underestimates the effective number. Only few countries have long time series for quarterly data starting from the first quarter of 1980.
Table I.2.3:Recessions followed by W- and V-shaped recoveries
Country W-shaped recoveries V-shaped recoveries
Austria 01q2-01q3Belgium 80q2-80q4 01q3-01q4
92q4-93q1Germany 80q2-80q4 95q4-96q1
91q2-91q302q4-03q2
Denmark 97q3-97q4 92q4-93q201q4-02q1
Estonia 98q4-99q2Spain 92q2-93q1Finland 90q2-91q4France 80q2-80q4
92q2-93q1Italy 82q1-82q4 92q3-93q3
01q2-01q4Lithuania 98q4-99q1Portugal 02q3-02q4Sweden 90q2-93q1Slovak Republic 99q1-99q4United Kingdom 80q2-81q1
90q3-91q3
Recessions followed by
Graph I.2.8: O kun's coefficients: rolling regression estimates
-0.16
-0.11
-0.06
-0.01
0.04
0.09
89Q4 91Q3 93Q2 95Q1 96Q4 98Q3 00Q2 02Q1 03Q4 05Q3 07Q2 09Q1-113579111315
Quarters o f recess io ns in the samp le (rig ht hand s ide) Coefficient o f GDP growth
Coefficient o f GDP growth(-1) Coefficient o f GDP growth(-2 )Coefficient o f GDP growth(-3 )
Note: The graph plots the Okun's coefficients estimated on a sample of 10 years ending with the quarter shown on the horizontal axis.
pps. %

Economic developments at the aggregated level
43
When the recovery is on a stable path, output growth follows a pattern which does not differ across the two types of recoveries – but of course it takes more time for W-shaped recoveries to reach this path. As expected, employment contracts more during W-shaped recoveries and remains below the trough level for longer time. In the V-shaped case, employment returns to the trough level after about 2 years from the upswing. Unemployment rates keep growing during the first year after both W-shape and V-shaped recoveries. Yet, unemployment continues to rise for a further two quarters in the case of the relatively faster and more solid V-shaped recovery. This finding suggests that during a solid recovery the perception of finding a job improves and more people enter into the labour market. Indeed, the fourth panel shows clearly that the labour force rises during V-shaped recoveries while it mainly hovers around the level which prevails at the early stage of a W-shaped recovery. Therefore, in W-shaped recoveries exit from the labour market, and the risks of seeing labour supply shrink, are more likely than in V-shaped recoveries.
As described in the previous chapter, the outlook for the EU economy is cautiously more optimistic
compared with the Spring forecast. Consistently with the historical experience described above, a more rapid recovery would be accompanied by an increase in the unemployment rate, owing to the usual lags in the response of employment to output and the positive effect of brighter outlook on the labour supply.
Sectoral reallocation and unemployment
Structural imbalances should lead to substantial mobility of workers across different industries. In the current situation, the main sectors with structural imbalances are construction, finance and the automotive sector. As construction output returns to levels consistent with the replacement of the old housing stock and the growth in the population (i.e. the housing boom comes to an end), employment in construction and related financial services needs to come down. (49) An additional contraction in labour demand is expected as the excessive increase in real house prices peters out. The time needed for reallocating
(49) Phelps, E. (2008), "US Monetary Policy and the
Prospective Structural Slump" Speech to the 7th Annual BIS Conference on Monetary Policy, Luzern, Switzerland.
Graph I.2.9a: Average evolution of GDP growth in the quarters following the recession
0.00.20.40.60.81.01.21.41.61.82.0
1 2 3 4 5 6 7 8 9quarters after the end of the recession
pps. %
W shaped V-shaped
T
Graph I.2.9b: Average evolution of unemployment rate in the quarters following the recession
0.00.10.20.30.40.50.60.70.80.91.0
0 1 2 3 4 5 6 7 8quarters after the end of the recessions
W-shaped V-shaped
pps. %
Graph I.2.9c: Average evolution of labour force in the quarters following the recession
-0.4
-0.2
0.0
0.2
0.4
0.6
0.8
1.0
1.2
0 1 2 3 4 5 6 7 8quarters after the end of the recession
% change W-shapedV-shaped
Note: Change compared to the end of the recession.
Graph I.2.9d: Average evolution of employment in the quarters following the recession
-0.8
-0.6
-0.4
-0.2
0.0
0.2
0.4
0 1 2 3 4 5 6 7 8
quarters after the end of the recession
W-shapedV-shaped
% change

European Economic Forecast, Autumn 2009
44
workers from these sectors into other sectors may lead to an increase in the structural rate of unemployment.
Graph I.2.10a-d display a measure of the sectoral reallocation for selected countries, the so called Lillien index. (50) For the largest euro area countries, this measure suggests only an occasional and mild sectoral reallocation during slowdowns/recessions, which contrasts with the more regular pattern observed in the US (51). In Italy and France, the dispersion of employment growth across sectors increases sharply during the
(50) The index of reallocation is calculated as in Lilien (1982)
as the weighted standard deviation of cross-sectoral employment growth rates using an industry breakdown in 6 Industries. This broad classification may not capture reallocations within sectors. See also European Commission, 2009, "European Product Market Review – microeconomic challenges in the crisis and beyond", European Economy (forthcoming).
(51) In the US, the dispersion of employment growth hovers around a level of 1.5% during expansions and doubling or tripling during recessions. Valletta and Cleary (2008) "Sectoral Reallocation and Unemployment", Federal Reserve Bank of San Francisco Economic Letter, 32, October.
recession of the early 1990s. During the shallow recession of 2003, it increased in Italy, as employment growth in manufacturing sector turned out negative while employment expanded strongly in services. The measure picks up the intense period of restructuring that followed the German reunification. Finally, in 2008 and 2009, the degree of sectoral reallocation increased in all countries except Italy. (52) Of course, this dispersion can increase as a result of shifts caused by normal business cycles (i.e. aggregate demand shocks) having differentiated impact across sectors. This implies that the positive correlation between the dispersion and the unemployment rate would be determined by aggregate demand shock rather than by structural change. Indirect evidence of the effect of the sectoral reallocation on the structural unemployment rate can be gained by comparing the result of a regression of respectively the unemployment rate and the NAIRU on the measure of sectoral reallocation (Lillien index). In
(52) Other countries (not shown for brevity) where the degree of
sectoral reallocation rises substantially include the Czech Republic, Denmark, Ireland, Lithuania, Netherlands, Slovenia, and Slovakia.
Graph I.2.10a: Spain - A measure of sectoral reallocation - Employment growth by sector (7
branches) - Standard deviation
0.0
0.5
1.0
1.5
2.0
2.5
80 82 84 86 88 90 92 94 96 98 00 02 04 06 0809
Graph I.2.10b: Italy - A measure of sectoral reallocation -Employment growth by sector (7 branches) - Standard
deviation
0.0
0.5
1.0
1.5
2.0
2.5
80 82 84 86 88 90 92 94 96 98 00 02 04 06 0809
Graph I.2.10c: France - A measure of sectoral reallocation - Employment growth by sector (7
branches) - Standard deviation
0.0
0.2
0.4
0.6
0.8
1.0
1.2
1.4
80 82 84 86 88 90 92 94 96 98 00 02 04 06 0809
Note: The index of sectoral reallocation is the standard deviation of the growth rate of employment across industries for the average quarter of each year.
Graph I.2.10d: Germany - A measure of sectoral reallocation - Employment growth by sector (7
branches) - Standard deviation
0.0
0.2
0.4
0.6
0.8
1.0
1.2
1.4
80 82 84 86 88 90 92 94 96 98 00 02 04 06 0809
Grey font => recession

Economic developments at the aggregated level
45
the first case, an increase by 1 pp. in the dispersion of employment growth across sectors is accompanied by an increase in the unemployment rate of 0.6pp. The same regression, this time with the NAIRU as a measure of the structural rate of unemployment, gives a response of 0.1 pp. (53) Thus, looking ahead, the structural unemployment rate may increase in those countries where structural reallocation was already occurring in 2008 and 2009. Compared to the effect on the total unemployment rate, this increase is relatively small.
2.2.2. Matching process and sectoral reallocation: the risk of hysteresis
One problem with the measure of sectoral reallocation is that employment dispersion may reflect both reallocation shocks and differences in industries' cyclical sensitivity and growth trends. In this case, it is difficult to distinguish true reallocations from differences across industries in the cyclical response of employment to aggregate fluctuations. (54) During a deep recession, the degree of sectoral reallocation can be very high. At the same time, the distribution of skills in the labour force is fixed in the very short run. As a result, the mismatch worsens significantly and the effectiveness of the matching process deteriorates.
The Beveridge curve provides a way to distinguish structural changes (e.g. due sectoral shifts) from cyclical developments. It depicts the relationship between job vacancies and unemployment rates. Over the cycle this relationship exhibits negative co-movement, with high vacancies and low unemployment when the economy is growing and vice versa when it is contracting. This leads to shifts along the curve. Shifts of the curve - i.e. positive co-movements between vacancies and unemployment – reflect changes in the effectiveness of the matching process, possibly related to skill mismatches or sectoral imbalances.
Graph I.2.11 shows the Beveridge curve for the euro area measured at quarterly frequencies over the period from first quarter of 1995 to the second quarter of 2009. Inspection of the data reveals two shifts of the curve leftward since the late 1990s. The first one coincides with the dot-com bubble of
(53) See A. Arpaia, Carone, G. and Curci, N. (2009)
forthcoming, (54) Abraham, K, and L.F. Katz (1986), “Cyclical
Unemployment: Sectoral Shifts or Aggregate Disturbances?” Journal of Political Economy 94(3), pp. 507–522.
the late 90s; the second can be identified after the 2001 downturn. Both shifts are likely to have been caused by reforms that have made the functioning of the labour market more efficient. The improvements have been significant: unemployment rates are about 2-3 pps lower for a given level of vacancies than in the mid 1990s. These results are consistent with analysis carried out by the OECD which suggests that actual unemployment now has a smaller impact on structural unemployment than in the mid 1990s. (55)
The behaviour of the data in the latest six quarters up to the second quarter of 2009, which include the current recession, should be interpreted with caution given the small number of observations available. However, so far it seems that we are observing changes along the curve rather than changes of the curve. Yet, it cannot be excluded that protracted sectoral shifts (56) may render the skills of some workers – particularly those formerly employed in industries with non-transferable skills – obsolete leading to skill mismatches.
2.2.3. Labour supply: the risk of a shrinking workforce
The massive unemployment inflows which a recession usually brings about can be harmful for the strength of the following recovery. When the large stock of new unemployed workers is not absorbed quickly as soon as economic activity becomes sustainably anchored, labour supply may be negatively affected, which may result in an obstacle to a steady recovery. Newly unemployed workers may become long-term unemployed for many reasons. As a result of a recession, unemployed people become less effective in their search for a job, leading to more persistent unemployment. This may occur because the recession influences either the efficiency with which information about vacancies is transmitted or the time and effort the unemployed devote to the job search. In particular, a prolonged period of weak labour demand may reduce the search effort of the unemployed as discouragement arises after many not successful attempts of finding a job (the
(55) OECD (2009) Economic Outlook No85, June 2009. (56) The sectoral shift hypothesis of unemployment rate
suggested by Lilien (1982) can be explained by different factors including labour and capital market imperfections that limit the possibility of moving resources between sectors and imperfect matching due to the lack of the skills of displaced workers who have to fill positions in new expanding sectors.

European Economic Forecast, Autumn 2009
46
so-called "discouraged" worker effect). This can be also result from unconditional and extremely generous unemployment benefits which may create a moral hazard problem reinforcing the propensity of job-searcher to be highly selective with regard to job offers.
At the same time, during recessions, households' income can be heavily affected by unemployment of the bread-winner (typically the man). This creates (the perceived risk of) a negative wealth effect that induces other members of the household to put more effort into finding a job to compensate for the expected loss in household income and to smooth consumption. The "added" worker effect implies that in periods of high unemployment the labour supply of non-working spouse increases, as the consumption smoothing motive prevails on other factors, such as the low substitution of leisure time between the husband and the wife (for cultural reasons or lack of childcare services), that keeps women out of the labour market. Whether the 'discouraged worker' or the 'added worker' effect prevails in the recessions is an empirical question. Eichengreen and Hutton (1987) studied unemployment patterns in the US during the Great Depression and found that a married woman was more likely to work if her husband was unemployed than if he was employed. (57)
In the current recession, some signals of discouraged worker effects prevailing over added worker effects have started to emerge, albeit on a small scale. The increase in unemployment so far has been limited by a fall in the labour force for (57) Eichengreen B.J. and T. J. Hatton (1987) Interwar
unemployment in international perspective, North Atlantic Treaty Organization, Scientific Affairs Division, Centre for Economic Policy Research, Kluver.
two consecutive quarters (-0.3% in the fourth quarter of 2008 and -0.5% in the first quarter of 2009). In 2009 and 2010, the activity rate is expected to decline slightly in the euro area and stagnate in the EU.
While these findings could raise some concerns about the effects of the crisis on total labour supply, it must be kept in mind that reforms in many countries have strengthened the labour market attachment of most vulnerable groups. As a consequence, large reductions in the overall activity rate should not occur, implying that job losses are likely to be largely reflected in a higher unemployment rate. In addition, there is evidence that governments are not repeating the mistakes of past recessions in which early retirement schemes were introduced to reduce unemployment by shrinking the size of the labour force. (58)
(58) See "The EU's response to support the real economy during
the economic crisis", European Economy, Occasional Paper No. 51 July 2009.
Graph I.2.11: The Beveridge curve, euro area
09Q2
09Q1
08Q4
08Q308Q208Q1
0123456789
10
7 7.5 8 8.5 9 9.5 10 10.5 11unemployment rate
fact
ors l
imiti
ng p
rodu
ctio
n: la
bour
07Q4
Note: Since data on vacancies are not available on a long time series, the variable form the Employers' survey "Factors limiting production: Labour" is used as proxy. The square symbols in black mark the quarters from the first quarter of 2008 to the second quarter of 2009.
02Q1 to 07Q4
99Q1 to 00Q4
00Q4
99Q1
98Q4
95Q1
95Q1 to 98Q402Q1
%
%

Economic developments at the aggregated level
47
2.2.4. Wage developments
A slack labour market is generally accompanied by reduced wage pressures. In the face of a prolonged period of weak demand, firms start to reduce their workforce. The resulting increase in the jobless rate, if not accompanied by a shrinking labour supply, puts downward pressure on wages, especially where the increase in unemployment is sizeable. Even so, unit labour costs increase as firms hoard labour during the recession (i.e. productivity growth declines) while wages are slow to react as they are not continuously negotiated. New negotiated wages incorporate the effects of the common aggregate demand shock as expired contracts are renegotiated. The capacity of wages to reflect changes in demand at the local and sectoral level is expected to influence the shape of the recovery, in particular in countries where competitiveness is a constraint for economic growth. Public wages can play an important role in signalling appropriate wage developments for the private sector.
Graph I.2.12 shows the growth of nominal unit labour costs and of its components, compensation per employees and changes in labour productivity. Even though the compensation per employee has slowed since the end of 2008, the growth in the nominal unit labour costs rose as labour productivity was negatively affected by labour hoarding. The decline in compensation per employee has been so far almost entirely led by the fall in the wage drift. Looking ahead, the growth in unit labour costs in the EU and the Euro area is projected to be more moderate in 2009 and negative in 2010, as new negotiated wages incorporate the effect of the recession and productivity growth recovers.
As the economy recovers, it will be important that relative wages adjust to respond to productivity differentials and demand patterns at the local level. This is of particular importance for those Member States that need to improve their competitive position. Given the considerable downward wage rigidity recorded in the past crises, reforms of the wage bargaining system in this respect will be essential in a number of cases.
Graph I.2.12a: Compensation per employee and negotiated wages
-3-2-10123456
06Q1 06Q3 07Q1 07Q3 08Q1 08Q3 09Q1
y-o-y %
Labour productivity (inverted scale)Compensation per employeeNominal unit labour costs
Graph I.2.12b: Compensation per employee and negotiated wages
0.00.51.01.52.02.53.03.54.0
01 02 03 04 05 06 07 08 09
Compensation per employeeNegotiated wages
y-o-y %
2.2.5. Summary and challenges ahead
The global downturn is now strongly affecting EU labour markets. As discussed above, job losses are set to translate into rising unemployment across the EU as the full impact of output losses starts to be felt and labour hoarding is reduced. The analysis in this chapter, therefore, suggests that at the level of the EU as a whole "Okun's law" is very much alive; there are considerable risks of "jobless growth" in the years to come, despite the beneficial effect of the labour market reforms of the past decades.
Moreover, the labour market response to the global slowdown varies considerably across Member States. This is partly due to differences in (i) the share of the most affected industries, (ii) pre-existing weaknesses and (iii) the exposure to international trade. In addition, recourse to flexible working time arrangements has also differed

European Economic Forecast, Autumn 2009
48
significantly across Member States. In many European countries, government sponsored schemes were already available or were introduced during the crisis to supplement wages of those working at reduced hours. The use of these schemes has varied across countries, which explains some of the differences in the labour market responses.
The significant fall in the average hours worked in countries where the increase in unemployment is relatively small suggests that these countries have contained the effect of the fall in GDP by resorting to substantial labour hoarding. Evidence of strong labour hoarding compared to previous patterns is found for Finland, Austria, the Netherlands, and Germany. On the other hand, the adjustment in Spain, Ireland, and the Baltics is stronger than what historical patterns would suggest.
Labour hoarding has often been induced by government policies. Short-time schemes can be an effective instrument to contain wasteful labour shedding in the face of a temporary demand shock. However, if these schemes delay transitions by protecting employment in structurally shrinking sectors, then an increase in unemployment upon their expiry will occur. While these schemes have often been successful in the short-run, the jury is still out on the medium term implications.
Sectoral imbalances and the industrial restructuring that this deep recession may trigger could require a substantial mobility of workers across different industries. Past labour market reforms have improved the matching of European labour markets, but the question is whether this will hold if sectoral restructuring becomes significant. The time needed to reallocate workers from these sectors to other sectors may lead to an increase in the structural unemployment as workers need time to be retrained – particularly those formerly employed in industries with non-transferable skills. A deterioration of the matching process would enhance the risk of unemployment hysteresis.
The analysis presented in this chapter suggests that the impact on unemployment can be sizeable, but less persistent than experienced after the recession of the early 1990s. Consistently with findings suggesting that hysteresis effects are now less important on account of previous labour market reforms than in the 1990s, this would suggest that after the absorption of unused labour resources by
firms, unemployment should come down as growth resumes in a durable basis.
Even so, as underlined in the previous chapter, the outlook for the EU economy remains highly uncertain and subject to significant risks. In particular, the historical experience suggests that in W-shaped recoveries employment losses are more persistent, which leads to more discouragement (people leaving the labour market and becoming inactive) than V-shaped recoveries. Interestingly, these discouragement effects have been so strong in the past that historically the unemployment rate rises more strongly during V-shaped than W-shaped recoveries.
In the current recession, some signals of discouraged worker effects have started to emerge. This raises concern about the effects of the crisis on total labour supply. However, it must be kept in mind that reforms in many countries have strengthened the labour market attachment of most vulnerable groups. As a consequence, a large reduction in the overall activity rate is less likely now than it was in the past – although careful monitoring will be required.
The shape of the recovery will also be influenced by the capacity of wages to reflect changes in demand at the local and sectoral level, in particular in countries where competitiveness weaknesses weigh on economic activity and employment. Public sector wages can play an important role in signalling appropriate wage developments for the private sector. Wage flexibility can, therefore, mitigate the rise in unemployment, particularly in hard hit industries and Member States.
In summary, the labour market prospects in the EU will depend critically not only on the nature of the recovery and the extent of sectoral restructuring, but also on the degree to which hysteresis and discouragement effects can be avoided and wages can adapt. This, in turn, depends on the implementation of reforms which are foreseen under the EU's flexicurity agenda and which can contribute significantly to addressing these challenges. These are likely to be of particular importance as the recovery becomes sustainably anchored and short-term labour market measures are gradually phased out.
These policy challenges should be seen against the background of other key elements of the "flexicurity" agenda, notably the objective of

Economic developments at the aggregated level
49
rebalancing employment protection legislation in parallel with ambitious activation measures, along with reforms of the tax and benefit systems that reduce benefit dependency by making work more economically attractive and rewarding. Moreover, as our societies will continue to age and, without action, the European labour force will begin to shrink (59), many recognise the need of increasing the effective retirement age.
The implementation of such measures will necessarily take place over a prolonged period of time, but decisions taken early will help to anchor expectations and underpin the recovery. Increasing participation and enhancing workers' employability would contribute to minimising the social consequences of the crisis, preserving European human capital and, ultimately, to return to strong growth.
(59) See EC-EPC 2009 Ageing Report, European Economy, No
2, May.

3. GOVERNMENT DEBT: PAST AND FUTURE CHALLENGES
50
The 58¾% of GDP that the government gross debt ratio in the EU reached in 2007 set what will remain a low for several years to come. On average, government debt ratios in 2007 were the lowest since 1992. However, the debt ratio started increasing in the vast majority of Member States already in 2008, when the global economic and financial crisis intensified. In the Commission’s autumn 2009 forecast, the government debt ratio is estimated to have soared in all EU countries in 2009, by 11½ pps. on average, to 73% of GDP (see Table I.3.3). The forecast projects the debt-to-GDP ratio to increase by further 6¼ pps. in the EU in 2010 and, based on a no-policy-change assumption, to continue rising by 4½ pps. in 2011, to 83¾%. A slightly lower increase in the debt ratio is projected in the euro area. From the higher level of 69¼% of GDP in 2008, in the euro area the debt ratio is expected to have risen by 9 pps. of GDP in 2009 and is projected to continue to increase by 5¾ pps. and 4¼ pps. in 2010 and 2011 respectively, to reach 88¼% of GDP.
The 11½ pps. surge projected in the debt-to-GDP in the EU in 2009 is the biggest one-year aggregate increase ever seen in peacetime. The overall 25
pps. rise projected in the EU by 2011 compared to its pre-crisis level (i.e. in 2007) is also unprecedented. Not only does it by far exceed the four-year increases recorded in the aftermath of the 1974-75 and 1992-93 recessions; it is also higher than the progressive rise which occurred in the EU-15 debt ratio in the seven years between 1989 and 1996, when the effects of the generalised 1992-93 recession combined with the implications of the financial crisis in Sweden and Finland and German reunification.
This chapter puts the projected increase in gross government debt-to-GDP ratios in a historical perspective. The first section briefly reviews the effect of debt on economic activity, while the second section analyses the dynamics of debt-to-GDP ratios in the EU since the 1970s.(60) The analysis is based on the customary breakdown of debt dynamics into their main drivers, namely: (i) the primary balance; (ii) the snowball effect, in
(60) Due to data constraints, from 1978 to 1996, the focus is on
the EU-15 aggregate. For the 1970-1977 period the analysis is further limited to an EU-11 aggregate (Belgium, West Germany, Ireland Greece, Spain, Italy, Luxembourg, Austria, Finland, Sweden and United Kingdom).
Rising government deficits, low economic growth and support to the financial sector are leaving a legacy of rapidly growing government debt ratios. While direct fiscal costs stemming from the outlays made to support countries' financial sectors have been, on average, relatively limited up to now, the global economic and financial crisis is taking its toll on debt developments via its impact on fiscal balances and low growth. After increasing by around 3 pps. in 2008, the debt-to-GDP ratio is estimated to rise by further 11½ pps. in the EU in 2009, to 73%. It is projected to continue increasing in 2010 and, based on a no-policy-change assumption, to reach 83¾% in 2011.
By historical standards, the projected sharp increase in government debt ratios is nothing out of the ordinary in a financial crisis. However, past episodes occurred only at the national or regional level, thus having a significantly lower impact on the overall supply of sovereign debt instruments. Furthermore, today's rise in debt comes on top of comparatively high starting points, reflecting the increase recorded in the 1980s which was only partially subsequently stemmed. Rising government debt ratios may harm growth prospects through reduced capital accumulation, i.e. via a crowding out private investment. Additionally, a high level of debt may raise concerns over its sustainability, with possible feedback loops through risk premia.
A phasing out of the stimulus measures and cyclical recovery, including a rebound in tax revenue from the crisis-related lows, will be insufficient to prevent government debt ratios rising to even higher levels before the end of the next decade. Mechanical projections for the debt ratios up to 2020 based on an unchanged-policy assumption suggest that a significant adjustment (in many cases well beyond the benchmark of 0.5% of GDP per annum) will be needed to halt and eventually reverse the increase in debt.

Economic developments at the aggregated level
51
turn split into interest expenditure, the impact of real GDP growth and inflation; and (iii) the stock-flow adjustment, i.e. the discrepancy between the change in government debt and the budget balance, which, in turn, reflects the accumulation of financial assets, differences between cash and accrual accounting, changes in the value of debt denominated in foreign currency and remaining statistical adjustments.(61) Section 3 considers how government debt ratios were affected by past economic and financial crises. Section 4 focuses on debt developments during the current crisis. The fifth section presents mechanical projections for the debt ratios up to 2020 based on an unchanged-policy assumption, while the final section presents the challenges for the coming years.
3.1. ECONOMICS OF HIGH GOVERNMENT DEBT
An essential issue linked to rising debt ratios relates to their sustainability. The widening of spreads on government bond yields in the euro area, both for countries with already high debt ratios as well as for countries with a sizeable increase in contingent liabilities linked to measures in support of their banking sectors, suggests that market perception of sustainability risks has changed. In particular, markets assess governments’ capacity to carry debt based on a forward-looking perspective, i.e. on their ability to generate future primary surpluses and on prevailing views about future potential growth and real interest rates.(62) Thus, while a one-off increase in the stock of government debt need not put sustainability at risk, fundamental concerns arise from the structural nature of the high deficit levels. The global economic and financial crisis can be expected to have a negative impact on potential output, which overlaps with the slowdown in potential GDP growth and the rise in government
(61) The change in the debt ratio is thus decomposed as follows:
t
t
t
tt
t
t
t
t
t
t
t
t
YSF
yyi
YD
YPD
YD
YD
+⎟⎟⎠
⎞⎜⎜⎝
⎛+−
+=−−
−
−
−
1*
1
1
1
1
where t is a time subscript; D, PD, Y and SF are the stock
of government debt, the primary deficit, nominal GDP and the stock-flow adjustment respectively, and i and y represent the average cost of debt and nominal GDP growth. The term in parenthesis is the snowball effect. This formula is the base of the decomposition of debt dynamics presented in Graph I.3.2, and Tables I.3.2 and I.3.3.
(62) Buiter, W. H. (2005) ‘Joys and pains of public debt’. In: de Gijsel, P. and H. Schenk, (eds.) Multidisciplinary economics: the birth of a new economics faculty in the Netherlands. Springer, Dordrecht, pp. 209-224.
expenditure already expected in the EU on account of population ageing.
Even when sustainable, a large stock of government debt affects the economy and policy making. The issue of the effects of public debt on economic growth has been intensely debated, with no straightforward conclusion.(63) On the one hand, according to the Ricardian equivalence hypothesis, government debt does not affect real allocations. Rational agents perceive that rising debt implies future taxation and correspondingly increase their saving. On the other hand, such debt neutrality holds only if a number of highly unrealistic conditions are met.
If debt neutrality does not apply, the main reason why the build-up of government debt may affect potential output is the reduction in capital accumulation. Public debt competes with private debt for the allocation of savings. To the extent that public debt is used to finance productive government expenditure and the availability of debt instruments that combine high liquidity with low risk could result in higher savings, this need not result in lowering capital accumulation. (64) However, if persistent deficits increase the share of debt in GDP over time, the newly issued bonds can only, ceteris paribus, be absorbed by the markets if they yield higher real returns, with a consequent crowding out of private investment. Moreover high debt may further dampen growth through the increase in the tax burden needed to ensure sustainability and the associated efficiency losses (unless matched by economy-wide efficiency gains stemming form the expenditure side).
Econometric evidence regarding the impact of fiscal variables on interest rates is not conclusive. However, several studies find significant
(63) Predictions from alternative views of the impact of
permanent budget deficits and the empirical relevance of the channels through which persistent budget deficits affect prospects for long-term income are presented in European Commission (2004) Public Finance Report in EMU - 2004, European Economy, No.3/2004, European Commission, Brussels. See also Balassone et al. (2004) in ‘Public Debt: A Survey of Policy Issues’ in Banca d'Italia, Public Debt, Banca d'Italia, Roma, pp. 27-68, and Chalk, N. and V. Tanzi (2002) ‘Impact of large public debt in growth in the EU: a discussion of potential channels’ in Buti, M. et al. (eds), The behaviour of fiscal authorities – Stabilisation, growth and institutions, Palgrave, Basingstoke, pp. 186-211.
(64) Government bonds are also important for the effectiveness of the transmission mechanisms of monetary policy. See Gokhale, J. (2002) ‘U.S. fiscal policy in an era of federal budget surpluses’ in The impact of fiscal policy, Banca d'Italia, Roma, pp. 709-725.

European Economic Forecast, Autumn 2009
52
effects.(65) Overall, empirical findings for EU countries are consistent with the expectation that persistent budget deficits may compromise income prospects via the crowding out of private investment. In particular, they show that countries with a low government debt-to-GDP ratio also had a significantly higher contribution of capital to growth.(66) Empirical evidence also points to a non-linear relationship between public finances and national savings. Namely, households tend to increase precautionary savings when debt reaches very high levels (of the order of 100% of GDP).(67)
The high degree of capital mobility normally implies that an increased supply of government bonds in one country can be absorbed by foreign/global savings, with no need or little change in the interest rate, depending on the size of the country concerned. However, in a context of a generalised soaring of public debt, the global increase in supply of sovereign bonds is sizeable, increasing competition for the allocation of global savings. Furthermore, a combination of high global risk aversion and a perception of low sovereign default risk despite public debt ratios ratcheting up can result in intensified crowding out of corporate sector investment, even in the face of low sovereign yield.
As evidenced during the current crisis, a high level of debt can also reduce a country’s ability to deal with shocks to interest rates or growth rates, even if those are temporary. With the cost of servicing the debt increasing with the level of debt, a shock to the cost of servicing has the potential to be significant for countries with a higher stock of debt to re-finance. However, the effect of increasing the debt servicing costs and the consequent increase in the interest burden faced by a government issuing (and/or re-financing) debt can also play a disciplinary role. In particular, once the financial markets signal a decreased willingness to take on a government’s debt by requiring higher interest rates in return, this can exert pressure on governments to contain further fiscal deficits. By setting out credible plans to stop and reverse the increase in their debt levels, governments can try (65) See International Monetary Fund (2009) ‘Companion
Paper – The State of Public Finances: Outlook and Medium-Term Policies After the 2008 Crisis’, International Monetary Fund, Washington D.C.
(66) European Commission (2008) Public Finance Report in EMU - 2008, European Economy No.4/2008, European Commission, Brussels.
(67) Nickel, C. and I. Vansteenkiste (2008) ‘Fiscal policies, the current account and Ricardian equivalence’, ECB Working Paper 935, Frankfurt.
to reduce the perceived sovereign risk. Once debt reaches a certain high level, such actions may become necessary to contain the ‘snowball effect’, i.e. the self-reinforcing effect of public debt accumulation arising from a positive differential between the implicit interest rate on public debt and the GDP growth rate.(68) That is why the economy can be expected to react to debt accumulation and authorities to take measures well before debt ratios reach the levels in the medium-term term projection presented in the last section.
Reflecting a prudential approach towards the effect of accumulation, the Treaty of Maastricht (Article 104 and annexed Protocol on the excessive deficit procedure) sets a reference value for debt at 60% of GDP in the context of the excessive deficit procedure.
3.2. DEBT DYNAMICS IN HISTORICAL PERSPECTIVE
By historical standards the expected sharp increase in government debt ratios is typical for a financial crisis episode. However, it adds to debt ratios already relatively high in several Member States and the unfavourable prospects due to population ageing.
Some Member States have already experienced debt ratios well above 100% of GDP and managed to reduce it substantially. In particular, in 2007 the debt-to-GDP ratio in Ireland was around 90 pps. lower than the peak of more than 110% reached in the late 1980s. In Belgium, it had progressively declined by 50 pps. from more that 130% in the early 1990s.
Even the debt ratios above 150% of GDP that, based on unchanged policy, have been mechanically projected for a few Member States in the medium term are not historically unprecedented in industrialised countries.(69)
(68) The snowball effect can also go in the opposite direction,
i.e. reduce the debt ratio if GDP growth exceeds the implicit interest rate.
(69) See Tanzi, V. and L. Schuknecht (2000) Public spending in the 20th century, Cambridge University Press, Cambridge , Masson, P.R. and M. Mussa (1995) ‘Long-term tendencies in budget deficits and debt’ Proceedings, Federal Reserve Bank of Kansas City (http://www.kc.frb.org/publicat/sympos/1995/pdf/s95mussa.pdf) and International Monetary Fund (2009) ‘The State of Public Finances; Outlook and Medium-term Policies After the 2008 Crisis’, International Monetary Fund, Washington DC.

Economic developments at the aggregated level
53
The case of the United Kingdom is particularly striking. Following the Napoleonic Wars, the debt ratio in the United Kingdom peaked at 185% of GDP in 1822, but was reduced to 30% by 1914. As a result of a generalised rise in government debt occurred during WWI, in 1920s debt ratios were well above 100% of GDP in several European countries.(70) Some of them inflated a substantial part of their debt away. Conversely, in the 1920s the United Kingdom succeeded in curbing the growth of the debt ratio against a background of low growth and deflation. However, it did not manage to reduce it. In the late 1930s, the government debt-to-GDP ratio in the United Kingdom was still at around 150% and peaked at 300% following WWII. It was steadily reduced afterwards and reached a low of around 33% of GDP in 1990.
The prolonged period of high nominal growth in the 1950s and 1960s brought down debt ratios all over the EU. By 1970, the debt-to-GDP ratio for an EU-11 aggregate was less than 40% of GDP. (71) Prudent fiscal policies also played a role in this decline. A trend growth in government size linked to the development of the welfare state had led to a progressive rise in the share of government expenditure and revenue in GDP since as far back
(70) See Dornbush, R. and M. Draghi (1990), Public debt
management: theory and history, Cambridge University Press, Cambridge.
(71) Belgium, Ireland, Spain, Italy, Greece, Luxembourg, Austria, Finland, Sweden, the United Kingdom and West Germany. See Graph I.3.1.
as the 1930s. However, with the exception of the war period, it is only in the 1970s that sizeable and persistent deficit spending started. Some analysts remarked that wrong expectations on future economic developments could have contributed to such behaviour. Expenditure that seemed to be affordable given the high growth in the previous two decades ceased to be so when productivity growth slowed in the 1970s. (72) Graph I.3.1 shows that primary balances switched from positive to negative in the mid-1970s, in the aftermath of the first oil crisis, and turned positive again only in the mid-1980s. Over the same period, potential output growth gradually declined.
Despite the negative developments in primary balances, in the second half of the 1970s the increase in the debt-to-GDP ratios was kept in check by the still relatively high, if volatile, real GDP growth and unprecedentedly high peacetime inflation. The unexpected inflation also resulted in negative real interest rates (see Graph I.3.1).
Rising debt ratios became the norm in the 1980s when inflation expectations became entrenched and real interest rates increased above real GDP growth. The resulting snowball effect would have required appropriate primary surpluses to avoid increasing debt ratios. However, on average the adjustment started only in the mid-1980s, with some Member States delaying it until the end of the decade. The debt also rose progressively to (72) See Masson and Mussa (1995).
Graph I.3.1: Developments in government gross debt, primary balance, real effective interest rate , nominal and potential GDP growth, EU
30
40
50
60
70
80
90
1970
1972
1974
1976
1978
1980
1982
1984
1986
1988
1990
1992
1994
1996
1998
2000
2002
2004
2006
2008
2010
-7-6-5-4-3-2-101234567
Government gross debt - lhs Primary balance % of GDP - rhsReal effective interest rate % - rhs Real GDP growth % - rhs
% of GDP % yoy / % of GDP
Note: EU-11 from 1970 to 1977: Belgium, Ireland, Spain, Italy, Greece, Luxembourg, Austria, Finland, Sweden, United Kingdom and West Germany. Former EU-15 from 1978 to 1996, EU-27 since 1997.Breaks in the series due to the use if different aggregates are not appearent, due to the comparatevely lower GDP of the new entrants.

European Economic Forecast, Autumn 2009
54
breach the 100% of GDP threshold in Belgium, Ireland, Italy and Greece.
Following the recession of 1991-93, consistently high primary balances offset a significant debt-increasing snowball effect. After peaking at 71½% of GDP in 1996, the average debt ratio declined progressively to 61½% in 2002. Combined with the substantial fall in interest rates that characterised the run-up to the euro, the decline in the level of debt also implied a substantial reduction of interest expenditure. The contribution of inflation to the reduction of debt ratios was considerably lower in the 1990s than in previous years (see Graph I.3.2).
With primary balances on a declining path since 2000, the debt ratios started increasing again in 2003. Only in 2006 and 2007, when the output gap was largely positive, did the primary surpluses reach a sufficiently high level to trigger a renewed decrease in the average debt ratio. However, the scenario changed dramatically in 2008, when the effects of the financial and economic crisis described in the following section started to appear, including a sizeable stock-flow adjustment due to bank rescue operations.
The build-up in debt which occurred in many EU Member States did not take place exclusively in
periods of economic slowdown.(73) During the cyclical upturns in 1978-91, debt-to-GDP ratios continued to increase (see Graph I.3.3). A partial improvement in this respect was achieved in subsequent years. The debt ratio decreased by around 10 pps between 1996 and 2007. This was due to both the marked consolidation which occurred in the 1990s on the back of the negative cyclical conditions, and the reduction of debt during the ensuing cyclical upturns. However, that reduction was fundamentally supported by a decline in interest expenditure (see Graph I.3.2), which masked a loosening of the fiscal stance.
3.3. GOVERNMENT DEVELOPMENTS DURING PREVIOUS FINANCIAL CRISIS PERIODS
Past financial crises have proven costly for the public finances. Although no two crises are alike in terms of their severity and the global macrofinancial environment in which they take place, past experience can give us valuable
(73) See Balassone, F. and M. Francese (2004) ‘Cyclical
asymmetry in fiscal policy, debt accumulation and the Treaty of Maastricht’, Banca d’Italia, Roma. See also Buti, M. and A. Sapir (eds.) (1998) Economic Policy in EMU: A study by the European Commission Services, Oxford University Press, Oxford.
Graph I.3.2: Contributions to the change in government debt ratios of: interest expenditure, primary balance, stock flow adjustment, real GDP and GDP deflator growth, EU
-10
-8
-6
-4
-2
0
2
4
6
8
10
12
1971
1973
1975
1977
1979
1981
1983
1985
1987
1989
1991
1993
1995
1997
1999
2001
2003
2005
2007
2009
2011
Contribution from primary balance Interest expenditure Real GDP growth effectInflation effect Stock-flow adjustment Change in debt ratio
% of GDP
Note: Data from 1971 to 1978 are aggregates for Belgium, Ireland, Spain, Italy, Greece, Luxembourg, Austria, Finland, Sweden, United Kingdom and West Germany. Former EU-15 from 1979 to 1997, EU-27 since 1998. Stock-flow adjustment net of exchange rate valuation effects in the aggregation in common currency.
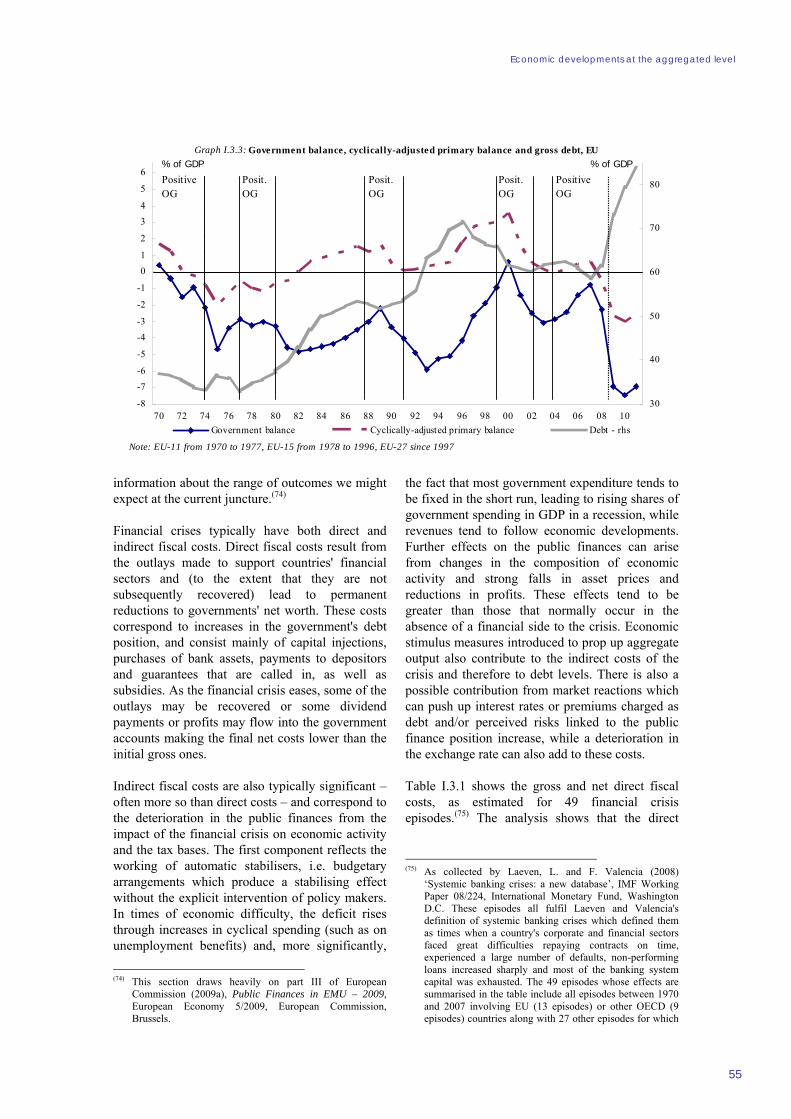
Economic developments at the aggregated level
55
information about the range of outcomes we might expect at the current juncture.(74)
Financial crises typically have both direct and indirect fiscal costs. Direct fiscal costs result from the outlays made to support countries' financial sectors and (to the extent that they are not subsequently recovered) lead to permanent reductions to governments' net worth. These costs correspond to increases in the government's debt position, and consist mainly of capital injections, purchases of bank assets, payments to depositors and guarantees that are called in, as well as subsidies. As the financial crisis eases, some of the outlays may be recovered or some dividend payments or profits may flow into the government accounts making the final net costs lower than the initial gross ones.
Indirect fiscal costs are also typically significant – often more so than direct costs – and correspond to the deterioration in the public finances from the impact of the financial crisis on economic activity and the tax bases. The first component reflects the working of automatic stabilisers, i.e. budgetary arrangements which produce a stabilising effect without the explicit intervention of policy makers. In times of economic difficulty, the deficit rises through increases in cyclical spending (such as on unemployment benefits) and, more significantly,
(74) This section draws heavily on part III of European
Commission (2009a), Public Finances in EMU – 2009, European Economy 5/2009, European Commission, Brussels.
the fact that most government expenditure tends to be fixed in the short run, leading to rising shares of government spending in GDP in a recession, while revenues tend to follow economic developments. Further effects on the public finances can arise from changes in the composition of economic activity and strong falls in asset prices and reductions in profits. These effects tend to be greater than those that normally occur in the absence of a financial side to the crisis. Economic stimulus measures introduced to prop up aggregate output also contribute to the indirect costs of the crisis and therefore to debt levels. There is also a possible contribution from market reactions which can push up interest rates or premiums charged as debt and/or perceived risks linked to the public finance position increase, while a deterioration in the exchange rate can also add to these costs.
Table I.3.1 shows the gross and net direct fiscal costs, as estimated for 49 financial crisis episodes.(75) The analysis shows that the direct
(75) As collected by Laeven, L. and F. Valencia (2008)
‘Systemic banking crises: a new database’, IMF Working Paper 08/224, International Monetary Fund, Washington D.C. These episodes all fulfil Laeven and Valencia's definition of systemic banking crises which defined them as times when a country's corporate and financial sectors faced great difficulties repaying contracts on time, experienced a large number of defaults, non-performing loans increased sharply and most of the banking system capital was exhausted. The 49 episodes whose effects are summarised in the table include all episodes between 1970 and 2007 involving EU (13 episodes) or other OECD (9 episodes) countries along with 27 other episodes for which
Graph I.3.3: Government balance, cyclically-adjusted primary balance and gross debt, EU
-8
-7
-6
-5
-4
-3
-2
-1
01
2
34
5
6
70 72 74 76 78 80 82 84 86 88 90 92 94 96 98 00 02 04 06 08 1030
40
50
60
70
80
Government balance Cyclically-adjusted primary balance Debt - rhs
Positive OG
Posit. OG
Posit. OG
Posit. OG
Positive OG
% of GDP % of GDP
Note: EU-11 from 1970 to 1977, EU-15 from 1978 to 1996, EU-27 since 1997

European Economic Forecast, Autumn 2009
56
fiscal costs corresponding to countries propping up their banking systems were substantial, averaging 13% of GDP. However, at 5½% of GDP on average, systemic banking crises were somewhat less expensive in the transition and mature economies of today's EU. This is a net figure and includes the funds recovered. Across all crisis episodes, on average, less than one fifth of the initial gross outlays were recovered. A notable exception among EU countries is Sweden, where the quick and comprehensive restructuring of the banking system allowed the initial fiscal outlays of 3.6% of GDP to be nearly fully recovered after the economic and financial crisis of the early 1990s.
The data presented above relate to the direct costs of crises; more comprehensive measures are necessary to look at the impact on deficits and debt. Graph I.3.4 shows the deterioration in debt seen in previous crisis episodes. On average, debt increased by 18 pps. of GDP from the year before the crisis to the end of the crisis, with significant differences across countries. What is universally true and has implications for the current crisis is that none of the country groups analysed saw debt return to its pre-crisis level even 8 years after the onset of the financial crises. Such crises clearly have long-lasting effects on debt.
detailed information on policies both during and after the crises is available.
3.4. GOVERNMENT DEBT DEVELOPMENTS IN THE CURRENT CRISIS
Just as might be expected on the basis of past evidence, the current financial and economic crisis is leading to a steep increase in debt ratios. This reflects the central role played by public finances in the EU in overcoming the crisis. Public finances are shouldering the burden needed to restore the health of the financial sector and supporting the intermediation function of financial markets. Furthermore, due to the depth of the recession and credit constraints, public finances have been called on to address demand shortfalls in the short run through fiscal stimulus measures and letting automatic stabilisers play.
Only a limited part of the projected rise in debt is due to direct costs. In 2008, the stock-flow adjustment, which includes inter alia the acquisition of financial assets, accounted on average for 3¼ pps. of the increase in Member States' debt-to-GDP ratios. And over 2009-11 the stock-flow adjustment is projected to add a further 1 pp. of GDP on average to the debt ratios (see Table I.3.3), taking account only of operations for which sufficient details are already available. Differences across countries are significant. However, on the basis of these projections, the direct cost would remain on average well below the figures recorded in past crisis episodes in Table
Table I.3.1:Direct fiscal costs of banking crisis
Crisis length (years)
Total gross fiscal cost 1/(% of GDP)
Total net fiscal cost 2/
(% of GDP)
Recovery ratio (% of gross fiscal cost)
Gross recapitalisation (%
of GDP)
Net recapitalisation 3/
(% of GDP)
Recovery ratio from capital
injections (% of capital injections)
Output loss (level estimate)
4/(% of trend
GDP)
EU-27 5/ 4.2 6.6 5.5 23.9 2.8 2.4 12.1 18.4
EU-15 6/ 4.0 7.3 5.6 53.9 5.2 4.2 19.7 44.9
OECD 3.9 11.4 11.8 29.7 8.5 7.9 20.1 20.2
OECD and EU 4.2 9.7 9.8 23.5 6.7 6.0 17.4 17.3
Other than EU and OECD 4.3 18.2 14.5 16.8 8.4 6.0 19.7 20.2
Big 5 industrial country-crises 7/ 4.2 7.7 6.4 46.6 4.9 3.9 29.3 26.8
Big 8 emerging market-crises 8/ 5.8 27.8 23.4 16.7 16.2 15.7 13.2 39.8
TOTAL 4.3 14.8 13.0 17.8 7.8 6.0 20.0 19.3
Notes: Based on 49 crises episodes. 1/ Gross fiscal costs are government outlays during the crisis. 2/ Gross fiscal costs minus recovery values during period t to t+5, where t is the first year of the crisis. Fewer data are available for gross than net fiscal costs; thus, country group averages between gross and net are not fully comparable.3/ Gross capital injections minus recovery during period t to t+5, where t is the first year of the crisis.4/ Calculated as the cumulative deviation (from t to t+3) of real GDP level from trend real GDP level before the crisis. The level estimates shown here are higher than output losses based on growth rates. For many transition economies no sufficient data were available to calculate the pre-crisis trend.5/ Includes crisis episodes in Bulgaria, Czech Republic, Estonia, Finland, Hungary, Latvia, Lithuania, Poland, Romania, Slovak Republic, Slovenia, Spain and Sweden. For several new Member States no fiscal and output costs are available, however.6/ Includes crisis episodes in Finland, Spain and Sweden, but no fiscal costs are available for Spain.7/ Includes crisis episodes in Finland, Norway, Sweden, Japan and Spain, but no fiscal costs are available for Spain.8/ Includes crisis episodes in Argentina (2001), Indonesia, Korea, Malaysia, Mexico (1994), Philippines, Thailand and Turkey (2000).Source: Calculations based on the database from Laeven and Valencia (2008). For more information see European Commission (2009) Public Finances in EMU.

Economic developments at the aggregated level
57
I.3.1. In contrast, the projections for the overall change of the debt ratio in 2011 as compared to 2007 is comparable and even higher, as the crisis takes its toll via an impact on fiscal balances and low nominal growth.
As shown in Table I.3.2, both in the euro area and in the EU as a whole, more than half of the approximately 4½ pps. rise in the government deficit projected in 2009 is explained by the effect of the cycle and related automatic stabilisers. In particular it is the inertia in adjusting the level of non-cyclical expenditure – the majority of public spending – to the lower GDP growth that produces the largest stabilising effect. Another quarter of the deficit increase in 2009 is accounted for by discretionary moves, including the fiscal stimulus measures adopted by Member States in response to the crisis. The estimated expansionary fiscal stance significantly exceeds the budgetary impact of the discretionary measures, mainly on account of a pronounced fall in revenues linked to the most volatile tax bases.
The large movement of fiscal variables should be seen in a context of the balance sheet adjustment triggered by the crisis, i.e. the reduction in the borrowing requirement of corporate and household sectors. Experience shows that episodes of balance sheet adjustments are typically consistent with matching increases in government deficits.
In 2010, the deficit is projected to further increase and the fiscal stance to remain expansionary both in the EU and in the euro area, with only ¼ pp. of
GDP of fiscal stimulus measures projected to be withdrawn on aggregate. In 2011, in contrast, fiscal balances are projected (on the assumption of unchanged policy) to improve, including in cyclically adjusted terms. The positive effect of the improvement in the cyclical conditions is expected to be amplified by a further partial withdrawal of the fiscal stimulus measures. These developments are projected to be only partially offset by the steady rise in interest expenditure triggered by the increasing debt.
The decomposition of the dynamics of debt ratios presented in Table shows that in fact sizeable primary deficits and interest expenditure are the main drivers of the approximately 25 pps. rise in the government debt-to-GDP ratio projected in the EU in 2011 compared to 2007. Namely, primary deficits account for almost one half of the increase in average debt ratio. The overall impact of the snowball effect is somewhat lower, as interest expenditure broadly matching primary deficits is in part offset by the effect of nominal GDP growth. This effect is however limited, also due to GDP contracting in 2009 even in nominal terms. While nominal GDP growth normally reduces the debt ratio, in 2009 negative growth is set to increase debt ratios in nearly all Member States (exceptions are Poland, Cyprus and Greece).
The slightly lower increase in the average debt ratio of the euro area as compared to the EU as a whole is explained by the lower primary deficits, partially offset by a higher snowball effect.
Graph I.3.4: Historical changes in debt in previous financial crises
0102030405060708090
t-4 t-3 t-2 t-1 t t+1 t+2 t+3 t+4 t+5 t+6 t+7
% of GDP
EU-27 1/ EU-15 2/ Big 5 industrial country-crises 3/B ig 8 emerging market-crises 4/ TOTAL 5/ Current crisis
Notes: Based on 49 crises episodes as shown in Annex Table III.1.Unweighted country averages. t = start of the crisis.1/ Includes crisis episodes in Czech Republic, Finland, Hungary, Latvia, Poland, Slovak Republic, Spain and Sweden. For new Member States data from 1991.2/ Includes crisis episodes in Finland, Spain and Sweden.3/ Includes crisis episodes in Finland, Norway, Sweden Japan and Spain.4/ In principle includes Argentina (2001), Indonesia, Malaysia, Mexico (1994), Turkey (2000), Philippines and Thailand. But data for the last three are missing.5/ Excludes Nicaragua which in 2003 (t+4) received a public debt relief.Sources: Calculations based on IMF International Financial Statistics and AMECO.

European Economic Forecast, Autumn 2009
58
Nearly all Member States are expected to run primary deficits over 2009-2011, though these vary substantially across countries, with consequent differences in debt dynamics. In Ireland, almost 40 pps. of the approximately 70 pps. projected increase in the debt-to-GDP ratio from 2007 to 2011 can be attributed to the primary deficit. The figure is expected to be around 30 pps. of GDP in the United Kingdom and Latvia, where the debt-to-GDP ratios are projected to increase by 40 and 50 pps., respectively. In Bulgaria, in contrast, the primary balance is projected to regain positive territory and the debt ratio a declining path in 2011.
The effect of nominal growth also varies significantly across countries. Nominal GDP growth is projected to continue to increase the debt ratios in 2010 in Ireland, Latvia, Lithuania and, to a lower extent, in Estonia and Spain.
In view of the already very high debt ratios, interest expenditure weights heavily in Greece and Italy.
The Commission's projections refer to government debt as defined in the Protocol annexed to the Treaty on European Union (Maastricht, 1992), according to which “Debt means total gross debt at nominal value outstanding at the end of the year and consolidated between and within the sectors of general government.”(76) This definition does not include assets owned by the government, or
(76) This definition is supplemented by revised Council
Regulation No 479/2009 specifying the components of government debt with reference to the definitions of financial liabilities in ESA95. In Council Regulation No 479/2009, the nominal value is considered equivalent to the face value of liabilities. It is therefore equal to the amount (contractually agreed) that the government will have to refund to creditors at maturity. See European Communities (2002) ESA95 manual on government deficit and debt Office for Official Publications of the European Communities, Luxembourg.
implicit and contingent liabilities.(77) Yet, in several Member States, part of the current increase in the debt ratio is due to capital injections, and thus has a counterpart in assets that in the future could be sold to repay debt. However, measures of net debt have considerable disadvantages in terms of transparency and volatility. While financial liabilities can be estimated in a timely and accurate manner, it is much more problematic to assess assets, including their liquidity. The current situation has made this difficulty even more evident. The role of implicit liabilities can, in part, be factored into an analysis based on the debt definition in the Treaty by including the cost of ageing in the medium-term projections. Contingent liabilities, including those linked to public interventions in the banking system, add to the fiscal risk, but quantifying their magnitude is fraught with difficulties. (78)
From the early days of the crisis, when the risk of a possible credit crunch was anticipated and the solvency of banks was called into question, it became clear that it was essential to ensure the normal functioning of wholesale credit markets and more generally to provide support for the banking sector in order to avoid a meltdown of the financial system and help restore market confidence. In October 2008, the EU heads of state or government agreed to implement a co-ordinated rescue plan for the EU banking sector, comprising (77) A contingent liability can be defined as a public sector
action that determines an outlay only if an when a certain event take place. Implicit liabilities are not backed up by law, but involve spending for which there is an expectation that it will continue or materialise – such as pension spending. Implicit and contingent liabilities are not mutually exclusive categories.
(78) Eurostat (news release 149/2009) has published supplementary tables for the financial crisis for the euro area and the EU that contain data on "outstanding amounts of assets, actual liabilities and contingent liabilities of government" in relation to government interventions in the context of the financial turmoil for the years 2007 and 2008 (http://epp.eurostat.ec.europa.eu/cache/ITY_PUBLIC/2-22102009-AP/EN/2-22102009-AP-EN.PDF).
Table I.3.2:Fiscal policy in the forecast horizon, EU and euro area
Cyclical effect Budgetary impact discretionary measures
Residual change in the primary cyclically-adjusted
balance
Budgetary impact change in the interest expenditure
2009EA-16 -4.4 -2.4 -1.1 -0.9 0.0EU-27 -4.6 -2.4 -1.3 -1.0 0.0
2010EA-16 -0.5 0.0 0.1 -0.3 -0.2EU-27 -0.6 0.0 0.2 -0.4 -0.2
2011EA-16 0.4 0.2 0.4 0.0 -0.2EU-27 0.6 0.2 0.4 0.2 -0.2
Total change in the deficit with respect to previous
year
of which:

Economic developments at the aggregated level
59
a set of broadly similar but separate national plans. The schemes approved encompass recapitalisation and other forms of equity intervention, guarantees, liquidity support and impaired assets relief. In addition to the general schemes, several Member States have adopted ad hoc interventions in favour of individual financial institutions.
Table I.3.4 presents the support measures committed and effectively granted by Member States since the start of the crisis to aid the functioning of the financial sector. The effect on the fiscal risk depends on the nature of the measure. The capital injections in the second column appear on the government sector's balance sheet and lead to increases in gross debt via the stock-flow adjustment presented in Table I.3.3. The injections provide the governments with assets which they sell in the future, but whose value is nevertheless subject to uncertainty. Columns three and four show the approved and effective guarantees provided to financial institutions. For some Member States these are particularly significant. These are explicit contingent liabilities as they represent the amount of government
underwriting that will not appear on the government's balance sheet unless the guarantees are called. And commitments to guarantee deposits in banks up to the ceiling specified in column nine will also only impose a cost on the government if the guarantee is called (NB their overall amount has not been quantified).
The asset relief and liquidity and bank support schemes are a mixed set of interventions, some of which transfer risk to the public sector without an outlay that appears in debt, thereby also increasing the explicit contingent liabilities of the government.(79)
3.5. MECHANICAL PROJECTIONS UNTIL 2020
By 2011 EU average deficits are forecast to start falling (from 7.5% of GDP in 2010 to 6.9% in 2011), but they remain at a level consistent with a steadily increasing level of debt. Although past (79) For an explanation on the recording in national accounts of
these measures, see European Commission (2009a), pp. 59-63.
Table I.3.3:Decomposing the increases in debt ratio in the current crises
% of GDP
Change in debt ratio
of which
Cyclical effect
Interest expenditure Growth effect Inflation effect
BE 84.2 89.8 97.2 101.2 104.0 19.7 2.9 3.1 15.8 -0.2 -5.6 6.8DE 65.0 65.9 73.1 76.7 79.7 14.7 1.8 2.4 11.1 0.6 -2.5 3.7IE 25.1 44.1 65.8 82.9 96.2 71.1 38.4 8.2 10.6 3.2 1.1 17.8EL 95.6 99.2 112.6 124.9 135.4 39.9 24.2 1.0 21.2 -1.2 -9.2 4.9ES 36.1 39.7 54.3 66.3 74.0 37.8 25.8 3.5 8.8 1.0 -2.1 4.3FR 63.8 67.4 76.1 82.5 87.6 23.8 16.2 3.3 11.4 -0.9 -5.1 2.3IT 103.5 105.8 114.6 116.7 117.8 14.3 -1.4 4.0 19.8 3.9 -9.6 1.5LU 6.6 13.5 15.0 16.4 17.7 11.1 6.1 5.8 2.2 0.1 -1.1 3.9NL 45.5 58.2 59.8 65.6 69.7 24.2 6.3 2.8 9.4 0.7 -3.3 11.1AT 59.5 62.6 69.1 73.9 77.0 17.6 3.9 2.2 11.6 -0.6 -4.0 6.6PT 63.6 66.3 77.4 84.6 91.1 27.5 15.0 3.9 12.4 0.9 -3.5 2.8SI 23.3 22.5 35.1 42.8 48.2 24.8 15.5 1.8 6.6 -0.3 -2.7 5.8FI 35.2 34.1 41.3 47.4 52.7 17.6 1.5 4.6 5.7 1.0 -2.7 12.0MT 62.0 63.8 68.5 70.9 72.5 10.5 4.7 -0.1 13.2 -1.5 -5.7 -0.3CY 58.3 48.4 53.2 58.6 63.4 5.1 4.9 -0.2 9.3 -2.6 -6.2 -0.3SK 29.3 27.7 34.6 39.2 42.7 13.4 14.9 -1.0 5.3 -1.7 -4.1 -1.0EU-16 66.0 69.3 78.2 84.0 88.2 22.3 9.2 3.2 12.5 0.7 -4.4 4.2BG 18.2 14.1 15.1 16.2 15.7 -2.5 -3.0 3.0 3.4 -0.5 -3.0 0.5CZ 29.0 30.0 36.5 40.6 44.0 15.0 14.2 0.5 5.7 -0.4 -2.0 -2.5DK 26.8 33.5 33.7 35.3 35.2 8.3 0.9 8.1 5.9 0.7 -2.5 3.2EE 3.8 4.6 7.4 10.9 13.2 9.4 10.1 5.8 1.8 0.4 -0.2 -2.7LV 9.0 19.5 33.2 48.6 60.4 51.4 29.2 4.9 8.4 5.1 1.7 7.0LT 16.9 15.6 29.9 40.7 49.3 32.4 25.0 4.1 6.8 3.2 -0.9 -1.8HU 65.9 72.9 79.1 79.8 79.1 13.2 -0.4 3.6 16.4 2.6 -8.6 3.2PL 45.0 47.2 51.7 57.0 61.3 16.3 14.3 0.9 10.8 -5.4 -5.1 1.6RO 12.6 13.6 21.8 27.4 31.3 18.7 19.9 0.3 6.1 -0.4 -4.8 -2.1SE 40.5 38.0 42.1 43.6 44.1 3.6 0.2 6.4 5.5 0.4 -4.3 1.9UK 44.2 52.0 68.6 80.3 88.2 44.0 31.2 3.7 10.0 0.2 -4.5 7.3EU-27 58.7 61.5 73.0 79.3 83.7 25.0 12.0 3.3 11.7 0.4 -4.5 4.3Notes : 1/The change in the gross debt ratio can be decomposed as follows:
Gross debt ratio Contributions to change in the ration debt ratio in 2011 with respect to 2007 1/
2007 2008 2009 2010 2007-2011 Primary balance
Stock-flow adjustment2011
For the EU-27 the stock-flow adjustment is net of exchange rate valuation effects in the aggregation in common currency.
where t is a time subscript; D, PD, Y and SF are the stock of government debt, the primary deficit, nominal GDP and the stock-flow adjustment respectively, and i and y represent the average cost of debt and nominal GDP growth.
Snowball
t
t
t
tt
t
t
t
t
t
t
t
t
YSF
yyi
YD
YPD
YD
YD
+⎟⎟⎠
⎞⎜⎜⎝
⎛+−
+=−−
−
−
−
1*
1
1
1
1

European Economic Forecast, Autumn 2009
60
experience tells us that the main increases in debt occur in the first two years of a financial crisis, current projections of the public finances raise serious concerns due to the combination of the structural nature of the high deficit levels, which combines with the trend slowdown in GDP growth and the rise in government expenditure already expected to happen in the EU on account of population ageing.
As highlighted in the previous chapters, there are also reasons to expect that the current crisis could lead to lasting negative effects on growth structural effects through a number of channels. (80) Particularly, the need to downsize traditionally key industries and the relatively high indebtedness of European firms towards a banking system that is also restructuring may affect the stock of capital and total factor productivity. In turn, this could influence the NAIRU. A central scenario might thus be for growth to recover its medium-term potential slowly.
Reflecting this scenario, this section presents medium-term projections for the gross debt-to-GDP ratio of the EU Member States based on the assumption that it will take until 2020 to get back to the long-term growth rates that were projected before the crisis intensified. The projections are derived as a mechanical extension of the Commission's autumn 2009 forecast based on an update of the "Lost Decade" macroeconomic scenario in the 2009 Ageing Report(81), as well as on the additional assumptions described in Box I.3.1. In particular, the projections do not assume policy measures other than those already announced within the horizon of the forecast. They are based on the technical assumption that the stimulus measures adopted in line with the European Economic Recovery Plan (EERP) might be only partially withdrawn in 2011 but fully reversed in 2012 and that no further additional consolidation is implemented.
(80) See European Commission (2009b) ‘Impact of the financial
and economic crisis on potential output’, European Economy – Occasional Papers 49, European Commission, Directorate-General for Economic and Financial Affairs, Brussels and European Commission (2009c) Economic Crisis in Europe: Causes, Consequences and Responses, European Commission, Directorate-General for Economic and Financial Affairs, Brussels.
(81) The "Lost Decade" scenario was presented as an alternative to the baseline Ageing Working Group (AWG) scenario in European Commission (2009d), 2009 Ageing report: Economic and budgetary projections for the EU-27 Member States (2008-2060), European Economy 2/2009, European Commission, Brussels.
The no-policy-change assumption (except for the full withdrawal of the fiscal stimulus) is chosen for purely illustrative purposes and the projections therefore cannot be taken as in any way foreshadowing future debt developments, which can be expected to be affected by future, as yet unspecified, consolidation measures. Rather, the projections serve to give an indication of the magnitude of the adjustment needed.
These projections are characterised by the explicit inclusion of a progressive increase in age-related expenditure. The estimated increase projected for the EU is already sizeable by 2020 (1.3 pps. of GDP), with significant variations across Member States (see Table I.3.6).
Graph I.3.5 and Graph I.3.6 present the trajectory of debt-to-GDP ratios in euro area and non-euro area Member States under the assumptions described in Box I.3.1, using a partial equilibrium analysis that does not consider the effect of the public finances on growth. Graph I.3.11 shows what these assumptions imply in terms of primary balance. The rise in ageing-related expenditure result in a steadily increasing primary deficit after the full withdrawal of the fiscal stimulus measures in 2012.
The projections show the debt ratio continuing to rise for a majority of Member States thereafter. Only in three Member States (Bulgaria, Denmark and Sweden) is the debt projected to start declining again. For the EU aggregate, debt is projected to increase from about 83% in 2011 to around 120% of GDP by 2020 – with the steady increase in the years after the crisis set to dwarf the direct impact of the crisis.

Economic developments at the aggregated level
61
Faced with increasing debt, governments will have to take action. The absence of any consolidation in the above exercise does not imply that no such action is anticipated. Rather, the exercise seeks to illustrate that the discontinuation of the stimulus measures and cyclical recovery, including a rebound in tax revenue from its crisis-related lows, will be insufficient to prevent debt rising to very high and in several cases likely unsustainable levels before the end of the next decade.
Graphs I.3.7 and I.3.8 show the projected trajectory of debt ratio with an annual adjustment of 0.5 pp. of GDP until Member States reach their medium-term objectives (MTO). This is the minimum consolidation that the Stability and Growth Pact recommends for countries that have not attained their MTOs. It leads, on average, to a primary surplus only at the end of the decade (see Graph I.3.11).
In terms of debt, it can be seen that this adjustment results in an overall slowing of the increase and stabilising of debt at around 100% of GDP in the EU overall, but is not sufficient to reduce it on average. Indeed, in some Member States, debt
ratios are projected to continue increasing strongly, with the consolidation having little real impact on sustainability.
Table I.3.5:Levels and increases in projected age-related expenditure as a share of GDP% of GDP 2011 2020 Change 2011-2020
BE 26.2 28.3 2.1BG 17.1 16.3 -0.8CZ 17.2 17.5 0.3DK 20.3 21.7 1.4DE 22.4 24.3 1.9EE 15.5 15.1 -0.4IE 19.6 23.7 4.1EL 24.0 25.2 1.2ES 20.9 22.9 2.0FR 28.4 29.7 1.3IT 24.5 25.6 1.1CY 17.0 18.4 1.4LV 13.1 14.0 0.9LT 15.4 15.9 0.5LU 19.9 22.2 2.2HU 22.6 23.5 0.9MT 18.4 21.2 2.8NL 18.9 20.6 1.7AT 24.2 25.8 1.6PL 17.7 16.9 -0.8PT 24.9 26.1 1.1RO 15.1 15.9 0.8SI 20.5 24.4 3.9SK 15.1 14.9 -0.2FI 23.6 26.2 2.6SE 24.0 25.3 1.3UK 19.4 20.3 0.9EA-16 23.9 25.5 1.6EU-27 22.7 23.9 1.3
Table I.3.4:
Total approved measures
Effective capital injections
Total approved measures Guarantees granted
Total approved measures
Effective interventions
BE 5.3 6.2 71.0 16.4 8.2 8.2 84.4 30.7 100,000BG 0.0 0.0 0.0 0.0 0.0 0.0 0.0 0.0 50,000CZ 0.0 0.0 0.0 0.0 0.0 0.0 0.0 0.0 50,000DK 6.3 2.5 258.5 2.6 0.3 0.3 265.0 5.3 100%DE 4.4 2.0 18.6 7.1 1.4 1.4 24.3 10.5 100%EE 0.0 0.0 0.0 0.0 0.0 0.0 0.0 0.0 50,000IE 6.7 6.6 167.5 167.5 0.0 0.0 174.2 174.1 100%EL 2.1 1.6 6.2 1.2 3.3 1.9 11.6 4.7 100,000ES 0.0 0.0 19.1 4.0 2.9 1.8 21.9 5.8 100,000FR 1.2 1.2 16.5 5.4 0.2 0.2 17.9 6.8 70,000IT 1.3 0.1 NA 0.0 0.0 0.0 1.3 0.1 circa 103 000CY 0.0 0.0 0.0 0.0 0.0 0.0 0.0 0.0 100,000LV 1.5 1.0 27.0 2.9 11.4 5.0 39.9 8.9 50,000LT 0.0 0.0 0.0 0.0 0.0 0.0 0.0 0.0 100,000LU 6.7 7.7 12.0 NR 0.9 0.9 19.5 8.5 100,000HU 1.1 0.1 5.6 0.0 0.0 2.5 6.8 2.6 100%MT 0.0 0.0 0.0 0.0 0.0 0.0 0.0 0.0 100,000NL 6.4 6.9 34.8 7.8 11.5 5.6 52.8 20.3 100,000AT 5.5 1.7 25.6 6.8 7.0 2.0 38.1 10.5 100%PL 0.0 0.0 0.0 0.0 0.0 0.0 0.0 0.0 50,000PT 2.5 0.0 10.1 3.3 0.0 0.0 12.6 3.3 100,000RO 0.0 0.0 0.0 0.0 0.0 0.0 0.0 0.0 50,000SI 0.0 0.5 33.8 6.5 0.0 0.0 33.8 6.9 100%SK 0.0 0.0 0.0 0.0 0.0 0.0 0.0 0.0 100%FI 0.0 0.0 28.4 0.0 0.0 0.0 28.4 0.0 50,000SE 1.6 0.2 46.8 10.6 12.1 0.0 60.5 10.8 50,000UK 3.5 2.6 21.6 11.2 16.3 14.6 41.4 28.4 50 000 (3/)EA-16 2.7 1.7 20.5 8.0 2.1 1.4 25.3 11.2EU-27 2.7 1.7 24.6 7.9 4.1 3.0 31.4 12.7
3/ The minimum level is £50 000 and in no event less than €50 000,
1/ Source: Commission services. Effective figures are provisional and subject to cross-checking with Member States, cut-off date: August 31, 2009. NA - Not Available indicates that theinformation is not available in the public domain. NR - Not Reported indicates that the amount was not reported by the Member State in its reply to the questionnaire.2/ Member States shall ensure that the coverage for the aggregate deposits of each depositor shall be at least EUR 50 000 in the event of deposits being unavailable. The same coveragelevel should apply to all depositors regardless of whether a Member State’s currency is the euro or not. Member States outside the euro area should have the possibility to round off theamounts resulting from the conversion without compromising the equivalent protection of depositors.
Public interventions in the banking sector (% GDP) 1/
Capital injections Guarantees on bank liabilities Relief of impaired asset and liquidity and bank support
Total for all approved measures
Total effective for all measures
Guarantees on deposits (€ or % of
deposits) 2/
Notes:

European Economic Forecast, Autumn 2009
62
However, a stronger consolidation of 1 pp. of GDP, leading to a primary surplus of around 3% of GDP by 2020, would be sufficient for debt to start declining on average (see Graph I.3.9). After reaching a peak of around 90% of GDP in 2015, by 2020 only the level effect would continue to show in the debt, which would be again at around 80% of GDP. However, for Ireland and Greece this would still not be sufficient to stabilise the debt.
An alternative way to see the challenge facing Member States is to consider the required primary balance (RPB) and the corresponding budgetary effort to meet it in order to for debt to reach the 60% threshold by 2020. (82) Graph shows what this would look like. On average, EU countries would need a primary balance of 4½% of GDP in the medium term in order to reach the 60% threshold, which corresponds to a budgetary effort of 8¾ pps. of GDP spread over the years 2011-15. For the euro area, the required primary balance would have to be higher, at 5½% of GDP, although reaching it would require the same budgetary effort.
3.6. A CHALLENGING CONSOLIDATION AHEAD
Against a background of an economic and financial crisis, running up sizeable deficits is a natural development for countries that markets judge solvable. The projected increase in debt ratios in the EU over the forecast horizon essentially reflects the support provided by Member States to economic activity and the financial system in the face of the risk of a global deflationary spiral. Although a counterfactual does not exist, there is every reason to believe that sizeable support from public finances prevented an even bigger recession.
However, current fiscal trends are unsustainable and, notwithstanding the temporary nature of the fiscal stimulus, a 'self-liquidating' exit strategy for fiscal policy is not an option for a vast majority of Member States. The structural deterioration in deficit and debt positions induced by the crisis has been such that a recovery in the economy, including in tax bases, together with a withdrawal
(82) The required primary balance (RPB) is the immediate and
permanent budgetary adjustment required to reach the 60% debt to GDP ratio in 2020 compounded with the projected average structural primary balance in 2011-2015. The budgetary effort is the RPB net of the primary balance estimated in 2009.
of the stimulus measures will be in most cases insufficient to put public finances back on a sustainable path. Restoring the sustainability of fiscal trends will require a protracted adjustment.
The empirical analysis confirms the influence of national fiscal rules and institutions in determining budgetary outcomes. In particular expenditure rules foreseeing automatic enforcement mechanisms, medium-term budgetary frameworks and independent fiscal institutions have been found to contribute to greater fiscal discipline and help ensure sustainability. They can also support the shift to growth-enhancing spending areas.
Finally, not least in the light of the ageing population and the trend increase in expenditure and slowdown in growth that it implies, it is important that consolidation is underpinned in a medium-term perspective by structural reforms with direct effect on implicit liabilities (pensions and other entitlements reforms) and indirect effect through increasing potential growth.
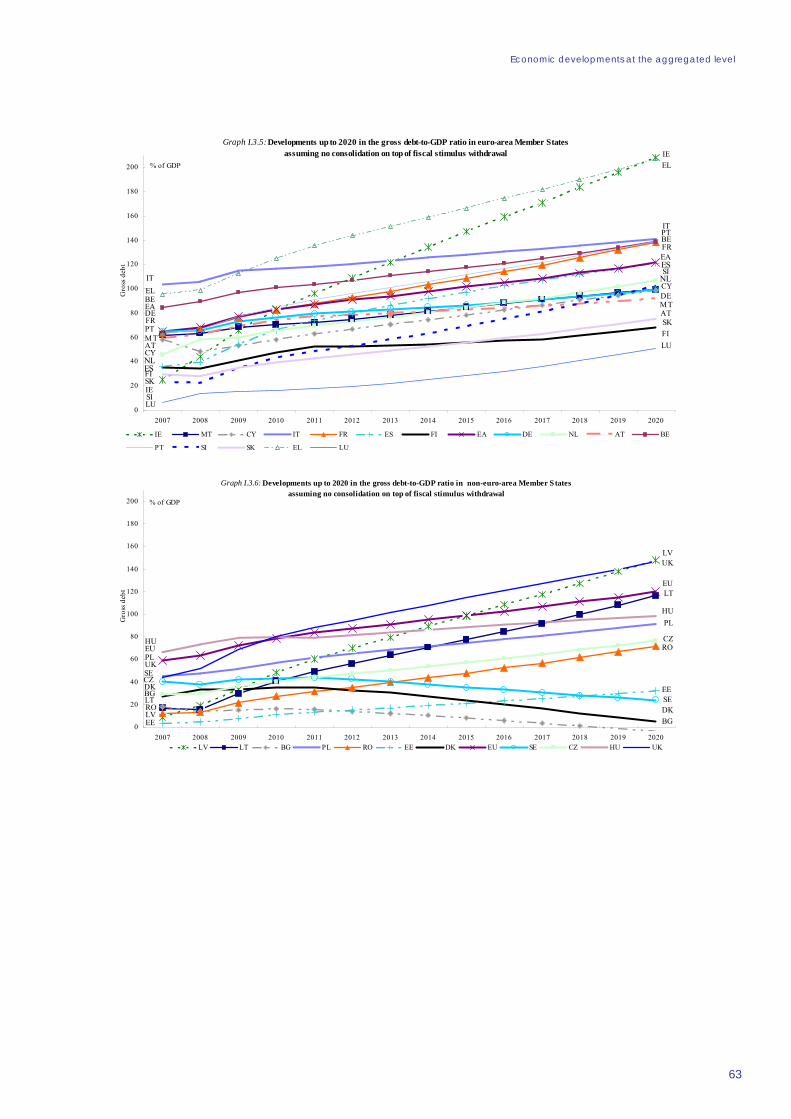
Economic developments at the aggregated level
63
Graph I.3.5:Developments up to 2020 in the gross debt-to-GDP ratio in euro-area Member Statesassuming no consolidation on top of fiscal stimulus withdrawal IE
IE
MT
MT
CY
CY
IT
IT
FR
FR
ES
ES
FI
FI
EA
EADE
DE
NL
NL
AT
AT
BE
BE
PT
PT
SI
SI
SK
SK
EL
EL
LU
LU0
20
40
60
80
100
120
140
160
180
200
2007 2008 2009 2010 2011 2012 2013 2014 2015 2016 2017 2018 2019 2020
Gro
ss d
ebt
IE MT CY IT FR ES FI EA DE NL AT BE
PT SI SK EL LU
% of GDP
Graph I.3.6: Developments up to 2020 in the gross debt-to-GDP ratio in non-euro-area Member Statesassuming no consolidation on top of fiscal stimulus withdrawal
LV
LV
LT
LT
BG
BG
PL
PL
RO
RO
EE
EEDK
DK
EU
EU
SE
SECZ
CZHU
HU
UK
UK
0
20
40
60
80
100
120
140
160
180
200
2007 2008 2009 2010 2011 2012 2013 2014 2015 2016 2017 2018 2019 2020
Gro
ss d
ebt
LV LT BG PL RO EE DK EU SE CZ HU UK
% of GDP

European Economic Forecast, Autumn 2009
64
Graph I.3.7: Developments up to 2020 in the gross debt-to-GDP ratio in euro-area Member Statesassuming an annual 0.5 pp. consolidation
IE
IE
MTMT CY
CY
IT
IT
FR
FR
ES
ES FIFI
EAEA
DEDE
NL
NL
ATAT
BE
BE
PT
PT
SI
SI
SK
SK
EL
EL
LU
LU
0
20
40
60
80
100
120
140
160
180
200
2007 2008 2009 2010 2011 2012 2013 2014 2015 2016 2017 2018 2019 2020
Gro
ss d
ebt
IE MT CY IT FR ES FI EA DE NL ATBE PT SI SK EL LU
% of GDP
Graph I.3.8:Developments up to 2020 in the gross debt-to-GDP ratio in non-euro-area Member Statesassuming an annual 0.5 pp. consolidation
HU
LV
LV
LT
LT
BG
BG
PL
PL RO
ROEE
EE
DK
DK
EU
EU
SE
SE
CZ
CZ
HU
UK
UK
0
20
40
60
80
100
120
140
160
180
200
2007 2008 2009 2010 2011 2012 2013 2014 2015 2016 2017 2018 2019 2020
Gro
ss d
ebt
LV LT BG PL RO EE DK EU SE CZ HU UK
% of GDP

Economic developments at the aggregated level
65
Graph I.3.9: The effort required to bring debt to 60% of GDP by 2020
-10
-5
0
5
10
15
20
BG DK LU EE SE CY FI PL SK CZ SI DE AT NL RO HU MT LT EAEU27BE PT IT FR LV ES UK EL IE
% of GDP
RPB Budgetary effort
Graph I.3.10: Developments up to 2020 in the gross debt-to-GDP ratio in the EU:unchanged policy vis-à-vis consolidation assumptions
40
50
60
70
80
90
100
110
120
130
2007 2008 2009 2010 2011 2012 2013 2014 2015 2016 2017 2018 2019 2020
% of GDP
Baseline Consolidation 0.5 pp. of GDP Consolidation 1.0 pp. of GDP
Graph I.3.11: Primary balances underlying the medium-term projections for government debt.
-6
-5
-4
-3
-2
-1
0
1
2
3
4
2007 2008 2009 2010 2011 2012 2013 2014 2015 2016 2017 2018 2019 2020
Baseline Primary Balance Consolidation 1 pp. of GDP Consolidation 0.5 pp. of GDP
% of GDP

European Economic Forecast, Autumn 2009
66
Box I.3.1: Assumptions underlying the medium term projection for gross debt of the general government
In order to simulate the order of magnitude of the risks to potential output related to the economic crisis, the 2009 Ageing report(1) presented a "Lost Decade" macroeconomic scenario that assumes that it will take until 2020 to get back to the long-term growth rates in the AWG baseline, which are based on the Commission's spring 2008 forecast. The projections presented below are derived as mechanical extension of the autumn 2009 forecast built on an update of the "Lost Decade" macroeconomic scenario. Notably, these projections assume: • A potential GDP path based on the AWG "Lost Decade" scenario. The output gap in the Commission's forecast shrinks linearly so that it is completely eliminated in 2017 and becomes positive afterwards; • A progressive increase in age-related expenditure, also derived from the Lost Decade scenario. Over the projection period age-related (1) Economic Policy Committee and European Commission, 2009 Ageing Report. Economic and budgetary projections for the EU-27 Member States (2008-2060), European Economy No. 2/2009, European Commission, Brussels.
expenditure increases, on average, by 0.6 pp. ofGDP in the euro area and by 0.4 pp. of GDP inthe EU as a whole; • Convergence, by 2017, of the ratio of taxes toGDP to the pre-2007 level for countries with2011 value below its 2007 level. For countrieswith 2011 tax to GDP ratio above the pre-2007level, it is assumed that the ratio remainsconstant till 2017. The cyclical component oftax revenues is added to the projected values onthe basis of OECD elasticities; • Linear convergence of implicit interest rate inreal terms from the current level to 3% (thevalue assumed for the purposes of the long-term sustainability of public financeassessment) in 2020 for all countries. Otherthings being equal, if interest rates were toconverge to a lower (or higher) level, the debtlevels would be 5 pps. of GDP higher (orlower) on average by 2020; • Withdrawal in 2012 of the stimulus measuresas estimated in 2011. No other discretionarymeasure is incorporated in the projection; • Zero stock-flow adjustment, which also implies no further financial purchases of assets/recapitalisations of financial institutions nor disposal of such assets.

PART II Prospects by individual economy


Member States

1. BELGIUM The path from policy-supported recovery to sustainable growth
70
Small open economy hit by global crisis
The global financial crisis has hit Belgium mainly through two channels. First, as a small open economy, the country has been affected strongly by the fall in world trade. Second, the problems in the banking sector have depressed domestic demand through confidence and wealth effects, and a tightening of lending conditions. These effects came on top of the ongoing weakening of activity, also reflecting the impact of high inflation on private consumption at the beginning of 2008. In the last quarter of 2008, the slowdown turned into a sharp contraction (1.7% quarter-on-quarter). Overall, GDP growth in 2008 stood at 1%. The contraction continued at the same pace in the first quarter of 2009, as investment and inventories, which had resisted well up to then, also fell strongly because corporations reacted with a lag.
In response, the government adopted expansionary fiscal measures which are broadly in line with the European Economic Recovery Plan and have an estimated budgetary impact of ½% of GDP in both 2009 and 2010. The package included wage subsidies as well as financing and payment facilities for firms, increases in social benefits, a reduction of the VAT rate for residential construction and an acceleration of public investment. At the same time, a series of actions were taken to support the financial sector, helping it to cope with the crisis. Up to now, the problems in the banking sector have mainly affected the economy through tighter lending conditions and adverse wealth and confidence effects. The direct impact on the other hand, i.a. through employment and investment, has been more contained. Nevertheless, banks remain vulnerable, also as a result of their exposure to troubled markets.
Gradual recovery ahead
In view of the improved international environment and the absence of a further negative contribution of inventories, growth is expected to be slightly positive in the second half of 2009, as also indicated by the improvement of business confidence readings. This should result in a contraction of 2.9% in 2009 as a whole. And the recovery is expected to be very gradual as global headwinds continue to impact negatively on growth, in particular in the first half of 2010.
These stem from the restructuring that financial institutions still need to undergo, and a further rise in unemployment together with low capacity utilisation. In this context, GDP is forecast to expand by 0.6% in 2010 and by 1.5% in 2011. Overall, the recession in Belgium has been less severe than in the euro area as a whole.
Graph II.1.1: Belgium - Business confidence and GDP growth
forecast
-4
-2
0
2
4
00 01 02 03 04 05 06 07 08 09 10 11
y-o-y%
-35
-30-25-20-15-10-505
10index
GDP growth (lhs) Seasonally adjusted series (rhs)
Belgium's better performance than the euro area in 2009 stems from a projected smaller contraction of domestic demand. First, the inventory cycle had a lower impact than in the euro area, partly because of the lower initial level of inventories. Second, investment contracted less. While the decline in capacity utilisation, weak demand prospects, worse financing conditions and lower profits are the main factors behind the fall in corporate investment both in Belgium and in the euro area, these forces seem to have been more limited in Belgium. This reflects to some extent the better initial balance sheet position of Belgian corporations compared to their euro area counterparts. In addition, the ECB's Bank Lending Survey points to a more limited tightening of lending conditions.
With no significant imbalances in the residential real estate market, housing investment is also set to decline by less than in the euro area in 2009. Moreover, the temporary reduction of the VAT rate for residential construction should cushion the contraction of housing investment.
Private consumption is in turn expected to contract at the same pace as in the euro area in 2009. The decline in households' financial assets and the deterioration of confidence is likely to lead to an

Member States, Belgium
71
increase in the saving rate by about 1½ percentage points. The rise in real disposable income (0.7%) as a result of lagged wage indexation in combination with foreseen zero inflation, mainly on the back of strong base effects on the energy component, has helped cushion private consumption from sharper fall. In 2010, consumption is projected to expand only moderately as lower employment and less buoyant wage growth depress real disposable income and continued negative confidence effects keep the savings rate high. Stronger wage growth and a stabilisation of employment are predicted to lead to stronger consumption growth in 2011.
The recession in Belgium is also expected to be more contained than in the euro area because the negative contribution of net exports to growth is forecast to remain relatively limited in spite of the open nature of the economy. This is because, in the absence of support from domestic demand, the pattern of imports is largely dependent on the trend in exports, due to the close international integration of the production chains. While the contraction of world trade is expected to have come to an end in the third quarter of 2009, the recovery of exports is expected to be rather subdued.
The above scenario is subject to a number of risks. On the positive side, a more vigorous recovery of global demand would boost exports. Negative risks could stem from worse-than-expected developments in domestic demand. A stronger increase in unemployment could lead to lower consumption, while a stronger-than-projected tightening of lending conditions, in particular if the banks' solvency position had not sufficiently improved to accommodate higher credit demand, would depress investment.
Weakened competitive position in recent years weighs on the recovery
Belgium will likely not be able to fully benefit from a rebound of the world economy. Since 2005, unit labour costs increased more in Belgium than in the euro area, mainly as a result of the lacklustre development of productivity. In addition, unit labour costs in Belgium were driven up by the strong increase in wages, in particular compared to Germany.
Export performance also suffered from an adverse geographical and product market orientation.
Indeed, exports are mainly oriented towards other euro-area countries, whose imports have been less dynamic than world trade. In addition, Belgium's product specialisation, in goods with relatively low technology content, appears to have been less beneficial than for the euro area as a whole. Looking forward, the demand for these products may continue to underperform while price competition could become even stronger, thus posing challenges regarding the sustainability of export growth and firms' profitability.
Overall, it is not foreseen that the weaknesses in the competitive position will be corrected over the forecast horizon, one reason being that unit labour costs are not expected to grow any more slowly than in the euro area. As a result, Belgium is set to continue losing market share beyond the loss experienced by other mature economies.
Graph II.1.2: Belgium - Public finance trends
-8
-6
-4
-2
0
2
4
6
8
01 02 03 04 05 06 07 08 09 10 11
% of GDP
0
20
40
60
80
100
120% of GDP
Headline deficit (lhs) Primary balance (lhs)
Public debt (rhs)
forecast
Unemployment peak still ahead
The impact of the economic downturn on employment has up to now been relatively contained as most employers have resorted to the extended schemes for temporary unemployment, leading to a reduction in the number of hours worked. However, in view of the lagged reaction of employment to changes in economic activity, employment is expected to contract more strongly in the coming quarters and the unemployment rate is forecast to increase up to 2011. Given the characteristics of the Belgian labour market, with high marginal tax rates, long unemployment-benefit duration and limited job mobility, there is a risk that those workers will become permanently inactive, further reducing the already low labour supply, as illustrated by the comparatively low employment rate and number of hours worked and the high long-term unemployment rate.

European Economic Forecast, Autumn 2009
Table II.1.1:Main features of country forecast - BELGIUM
2008 Annual percentage changebn Euro Curr. prices % GDP 92-05 2006 2007 2008 2009 2010 2011
GDP 344.7 100.0 2.0 2.8 2.9 1.0 -2.9 0.6 1.5 Private consumption 179.1 52.0 1.5 1.8 1.7 1.1 -1.0 0.6 1.4 Public consumption 79.8 23.2 1.7 1.0 2.6 3.3 1.8 1.4 1.5 Gross fixed capital formation 78.0 22.6 2.3 2.7 5.9 4.3 -4.0 -2.8 2.2 of which : equipment 34.5 10.0 2.5 3.7 8.9 5.8 -5.1 -2.2 3.9 Exports (goods and services) 295.6 85.8 4.9 5.0 4.5 1.5 -15.7 1.4 2.8 Imports (goods and services) 292.7 84.9 4.6 4.7 4.7 3.1 -14.8 0.8 2.9 GNI (GDP deflator) 347.0 100.7 2.1 3.0 3.0 0.7 -2.9 0.5 1.5 Contribution to GDP growth : Domestic demand 1.7 1.7 2.7 2.2 -1.0 0.1 1.6
Stockbuilding 0.0 0.6 0.3 0.0 -1.0 0.1 0.0Foreign balance 0.3 0.5 0.0 -1.2 -0.9 0.4 -0.1
Employment 0.7 1.2 1.6 1.9 -0.8 -1.4 0.1 Unemployment rate (a) 8.4 8.3 7.5 7.0 8.2 9.9 10.3 Compensation of employees/head 2.9 3.3 3.5 3.0 0.7 1.7 2.0 Unit labour costs whole economy 1.5 1.8 2.2 3.9 2.8 -0.2 0.6 Real unit labour costs -0.4 -0.5 -0.1 2.0 1.5 -1.6 -1.0 Savings rate of households (b) - - 16.2 16.6 18.0 17.9 17.7 GDP deflator 1.9 2.2 2.3 1.8 1.3 1.3 1.6 Harmonised index of consumer prices 1.9 2.3 1.8 4.5 0.0 1.3 1.5 Terms of trade of goods -0.4 -0.4 0.3 -2.4 1.9 -0.2 -0.1 Trade balance (c) 3.2 1.9 1.6 -1.6 -1.0 -0.7 -1.0 Current account balance (c) 4.5 3.3 3.8 0.2 0.6 0.9 0.8 Net lending(+) or borrowing(-) vis-à-vis ROW (c) 4.4 3.3 3.5 -0.2 0.1 0.4 0.3 General government balance (c) -2.4 0.3 -0.2 -1.2 -5.9 -5.8 -5.8 Cyclically-adjusted budget balance (c) -2.3 -0.5 -1.5 -2.1 -4.6 -4.3 -4.5 Structural budget balance (c) - -1.4 -1.4 -2.2 -4.2 -4.4 -4.5 General government gross debt (c) 114.7 88.1 84.2 89.8 97.2 101.2 104.0 (a) Eurostat definition. (b) gross saving divided by gross disposable income. (c) as a percentage of GDP.
72
The fiscal position has deteriorated
The budget balance has been strongly affected by the economic downturn. The effect of automatic stabilisers was larger than could have been expected on the basis of standard elasticities mainly as a result of a strong fall in corporate tax receipts. Furthermore, the deficit includes one-offs that increase expenditure by 0.5% of GDP, in particular reflecting capital transfers to the private sector following two court decisions (83). The widening of the deficit to 5.9% of GDP in fact reflects only to a relatively limited extent the impact of the expansionary measures included in the budget for 2009 (½% of GDP) and the fiscal stimulus packages (½% of GDP).
In 2010, the deficit is projected to remain broadly stable. On the one hand, the economic situation will continue to have a negative impact on public finances, especially as a result of the further strong increase in unemployment. Also interest expenditure is projected to rise, while measures (83) First, the European Court of Justice ruled that corporate
taxes had to be repaid as the Belgian 'received dividends deduction regime' was not compatible with Council Directive 90/435/EEC of 23 July 1990 on the common system of taxation applicable in the case of parent companies and subsidiaries of different Member States. Second, the Belgian Constitutional Court ruled that unduly paid personal income taxes should be repaid to cohabiting and married unemployed persons to ensure equal treatment.
taken in the past, e.g. to raise pensions, increase social expenditure. The impact of the stimulus remains at ½% of GDP, mainly because the package includes a number of permanent measures but also following (i) the prolongation of the reduction of the VAT rate for residential construction and (ii) the further extension of temporary unemployment schemes. On the other hand, the government agreed on corrective measures amounting to ¾% of GDP. These include a reduction of the "work bonus" in Flanders, an increase in excise duties, a number of savings in the social security system (including health care), as well as non-fiscal revenues stemming from the banking sector and the producers of nuclear energy.
In 2011, the headline deficit would remain at 5.8% of GDP in spite of the economic recovery, the positive impact associated with a number of already decided corrective measures (¼% of GDP), and the marginal withdrawal of the stimulus package (0.1% of GDP). This suggests that the trend of expenditure growth under unchanged policy could be unsustainable.
As a result of the sizeable headline deficits and contained nominal GDP growth, especially in 2009 and 2010, the debt-to-GDP ratio is forecast to increase from 90% in 2008 to 104% in 2011.

2. BULGARIA From recession to a more balanced growth pattern
73
The unfolding financial crisis has reinforced the need for adjustment
Over the past five years, buoyant FDI inflows and strong domestic demand-driven real GDP growth of above 6% on average have been accompanied by widening external deficits and high inflation. The financial crisis and its consequences - tighter financing conditions and increased uncertainty - have brought investment-led growth to an end, making the adjustment to a more balanced growth even more urgent. The Bulgarian economy was hit hard by the global crisis and economic growth figures moved into negative territory in the first half of 2009, when real GDP fell by 4¼%. The deterioration stemmed from the sharp contraction in both external demand and foreign investment inflows. Reflecting the fall in investment and private consumption, domestic demand is expected to decline even further by the end of 2009. For the year as a whole, gross fixed capital formation is expected to contract by more than 21%, while private consumption should fall by approximately 5¾%.
Graph II.2.1: Bulgaria - Inflation, current account balance and contributions to GDP
growth
-15
-10
-5
0
5
10
15
03 04 05 06 07 08 09 10 11
pps.
-30
-25
-20
-15
-10
-5
0% of GDP
Inventories (lhs)Net exports (lhs)Domestic demand, excluding inventories (lhs)Inflation (%, lhs)Current account balance (rhs)
forecast
At the same time, some of the imbalances have started to unwind. Inflation decelerated in the first half of the year and is expected to remain subdued over the forecast horizon. The large pre-crisis savings-investment gap has started to narrow, leading to a welcome adjustment in external imbalances. As imports have been declining faster than exports, the contribution of net exports to growth is set to turn positive in 2009 and the current account deficit has been decreasing. The downturn has taken its toll on public finances: after the first half of 2009, the budgetary surplus
vanished as revenues decreased while expenditures rose. Reliance on public finances to cushion the negative impact of the crisis has been limited by the need to maintain a sound budgetary position in order to underpin macroeconomic stability. To mitigate the adverse effects of the crisis, the authorities have introduced a number of measures aimed at strengthening the economy's resilience, expenditure restraint and improving revenue and tax collection. The direct influence of the financial crisis on the Bulgarian banking sector has been limited; accordingly, no support measures have been implemented by the government.
Turnaround expected in 2010 and recovery in 2011
After the projected contraction of slightly less than 6% in 2009, real GDP is expected to continue to decline in 2010, albeit at a decelerating pace of around 1%. The economy is expected to start to recover, under the impact of the international cycle, in the second half of 2010; real GDP should grow by around 3% in 2011. While the magnitude of the recovery might be higher than in other EU countries, growth in 2011 should remain well below the pre-crisis average over the past five years, thus temporarily slowing the catching-up process. Stronger economic prospects, accompanied by improved lending conditions and credit easing, are expected to lead to a smaller decline in both gross fixed capital formation and private consumption in 2010 and to bring about positive growth rates in 2011. The increase in infrastructure investment, mainly due to the absorption of EU funds, is expected to have a stabilising role at the beginning of the forecast period but this may not be sufficient to compensate for the slowdown in corporate investment and construction. The envisaged government infrastructure projects should contribute to the rebound of fixed investment in 2011. The projected increase in private consumption is expected to be supported by improving economic prospects and higher employment.
Looking ahead, the pattern of growth is expected to partially shift from domestic demand to the external side. The growth contribution of net exports is projected to remain positive even in 2011 when domestic demand should pick up again. This rebalancing should result in a partial

European Economic Forecast, Autumn 2009
74
unwinding of the external imbalances, as imports fall faster than exports during the downturn. In line with the positive developments in external demand, exports are expected to start to pick up in 2010, ahead of imports. As real GDP growth resumes in 2011 and imports start to rise again, projected gains in price competitiveness stemming from the adjustment in nominal wages should lead to a further narrowing of the trade deficit.
Risks to this baseline scenario are tilted to the upside. Foreign capital inflows may turn out to be larger than expected, either through a partial recovery in FDI, or through higher absorption of EU funds, which would support domestic demand and mitigate the strong fall in investment still in 2010. Following the marked run-down in 2009, a rebound of inventories could offer an additional boost to growth as the economy starts to recover. In addition, the commitment by foreign parent banks to support their local subsidiaries might translate in some credit easing. A faster-than-projected adjustment in nominal wages could bring unit labour costs further down and lead to an improvement in price competitiveness. On the negative side, despite the relative resilience of the labour market in the first half of 2009, unemployment could increase faster should the slowdown turn out to be more protracted, thus putting further pressure on private consumption. In addition, within the context of credit restraint, the servicing of the economy’s high external debt might crowd out domestic investment and spending. In the event that external financing conditions become even tighter, the external imbalance could narrow more rapidly, but at the expense of a slower economic recovery.
Correcting domestic and external imbalances
With the lowest GDP-per-capita level in the EU, the main challenge for Bulgaria is to ensure sustained and quick catching-up process while preserving macroeconomic stability. Given the projected lower contribution of FDI-driven investment to economic activity, the adjustment of the economy is expected to involve a shift to a more export-oriented growth pattern, which would depend to a large extent on a recovery in external demand. In addition, real convergence could be enhanced by improved competitiveness and structural reforms to boost potential growth.
With domestic demand contracting in 2009 and 2010 and recovering only partially towards the end
of the forecast horizon, a significant correction of the external deficit by 2011 is projected. After reaching a level of around 25% of GDP at the end of 2008, the current account deficit has been adjusting rapidly in 2009 and is expected to more than halve by the end of 2010 and to fall further to around 8% of GDP thereafter - but to still remain at high levels. The sustainability of the current account adjustment would depend crucially on the supply-side response. With the external imbalances correcting, the economy's net borrowing vis-à-vis the rest of the world is expected to undergo a significant downward adjustment. However, given the competitiveness challenges in recent years, it remains to be seen how sustainable these adjustments will be and how far they will go.
Due to tight labour market conditions, nominal wage growth in the boom years has by far exceeded productivity growth, raising nominal unit labour costs and fuelling inflation. As a result, over the past few years high unit labour costs have led to a strong appreciation of the real effective exchange rate, worsening the economy's price competitiveness vis-à-vis the EU average.
After peaking at 12% on average last year, HICP inflation has been on a fast downward path and is projected to remain low over the forecast horizon. However, when the global recovery gains momentum, the prices of oil and other commodities in international markets could again become sources of inflationary pressures. In addition, core inflation is set to slightly exceed 3% over the forecast horizon, remaining well above headline inflation and reflecting a certain degree of price rigidity in product markets. At the same time, nominal wage adjustment appears to be much more sluggish. These trends have persisted in 2009, which could result in high real wage growth.
The labour market has remained relatively resilient, although the downturn led to a fall in employment and an increase in unemployment, mainly affecting the labour-intensive sectors, in particular construction. Total employment is expected to decline by 2% in 2009 and should start to increase only in 2011. The decline is due to a decrease in the number of employees; the number of self-employed will increase over the whole forecast period. As a result of the significant fall in output, far in excess of the decline in employment, productivity growth should be negative in 2009, impacting adversely on price competitiveness. Only towards the end of the forecast horizon is the

Member States, Bulgaria
Table II.2.1:Main features of country forecast - BULGARIA
2008 Annual percentage changebn BGN Curr. prices % GDP 92-05 2006 2007 2008 2009 2010 2011
GDP 66.7 100.0 1.3 6.3 6.2 6.0 -5.9 -1.1 3.1 Private consumption 45.5 68.2 1.9 9.5 5.3 4.8 -5.7 -2.1 2.0 Public consumption 10.9 16.3 -2.8 -1.3 3.1 0.0 -0.2 -0.1 0.2 Gross fixed capital formation 22.3 33.4 - 14.7 21.7 20.4 -21.1 -8.7 3.1 of which : equipment - - - - - - - - - Exports (goods and services) 40.4 60.5 - 8.7 5.2 2.9 -13.3 2.3 4.5 Imports (goods and services) 55.6 83.3 - 14.0 9.9 4.9 -19.9 -2.8 2.3 GNI (GDP deflator) 64.1 96.1 - 2.7 7.6 5.7 -5.4 -0.8 3.5 Contribution to GDP growth : Domestic demand - 10.0 9.9 9.4 -11.0 -3.8 2.1
Stockbuilding - 1.8 1.2 -1.1 -3.4 -0.1 0.1Foreign balance - -5.4 -4.9 -2.3 8.5 2.8 0.9
Employment -0.1 3.3 2.8 3.3 -2.0 -1.3 0.8 Unemployment rate (a) 14.8 9.0 6.9 5.6 7.0 8.0 7.2 Compensation of employees/head - 7.4 17.9 19.3 7.8 2.5 5.1 Unit labour costs whole economy - 4.4 14.2 16.2 12.2 2.2 2.8 Real unit labour costs - -3.8 5.9 4.3 7.9 0.3 0.2 Savings rate of households (b) - - - - - - - GDP deflator 48.9 8.5 7.9 11.4 4.0 1.9 2.5 Harmonised index of consumer prices - 7.4 7.6 12.0 2.4 2.3 2.9 Terms of trade of goods - 5.1 -1.4 -2.5 0.8 1.2 1.1 Trade balance (c) -7.2 -22.0 -25.5 -25.8 -15.7 -12.9 -11.7 Current account balance (c) -4.4 -18.6 -22.5 -22.9 -13.7 -9.8 -7.9 Net lending(+) or borrowing(-) vis-à-vis ROW (c) -4.3 -17.9 -21.3 -22.1 -12.8 -8.7 -6.7 General government balance (c) - 3.0 0.1 1.8 -0.8 -1.2 -0.4 Cyclically-adjusted budget balance (c) - 1.4 -1.8 -0.3 0.3 1.0 1.5 Structural budget balance (c) - 1.5 -1.8 -0.3 0.3 1.0 1.5 General government gross debt (c) - 22.7 18.2 14.1 15.1 16.2 15.7 (a) Eurostat definition. (b) gross saving divided by gross disposable income. (c) as a percentage of GDP. Note : Contributions to GDP growth may not add up due to statistical discrepancies.
75
adjustment in the competitiveness determinants expected to gather momentum, with productivity increases exceeding real wage growth.
Maintaining a sound budgetary position
The economic downturn, which is adversely affecting the tax intensity of the economy and leading to higher spending pressures, has already resulted in the accumulation of a small deficit amounting to around ¾% of GDP in the first eight months of 2009. The new government has started to implement a number of revenue-raising measures targeted at increasing tax compliance and combating fraud, as well as expenditure cuts, which would limit the general government deficit to around ¾% of GDP this year. Under a no-policy-change assumption, the budgetary outcome should yield a deficit of around 1¼% of GDP in 2010 and less than ½% in 2011. There are risks that the budgetary deficit might turn out to be higher. On the revenue side, Bulgaria could face a protracted period of significantly less tax-intensive growth composition, as the economy shifts to a more export-oriented pattern. At the same time, the envisaged measures might have a smaller-than-estimated and/or only temporary impact on compliance in the context of the sharp downturn. On the expenditure side, as the effect of the crisis on the labour market unfolds, social spending
should increase. As regards the envisaged expenditure cuts, while these are essential for keeping total expenditure under control, across-the-board downsizing in items such as capital expenditure could affect the economy’s potential and the growth prospects in the medium term.
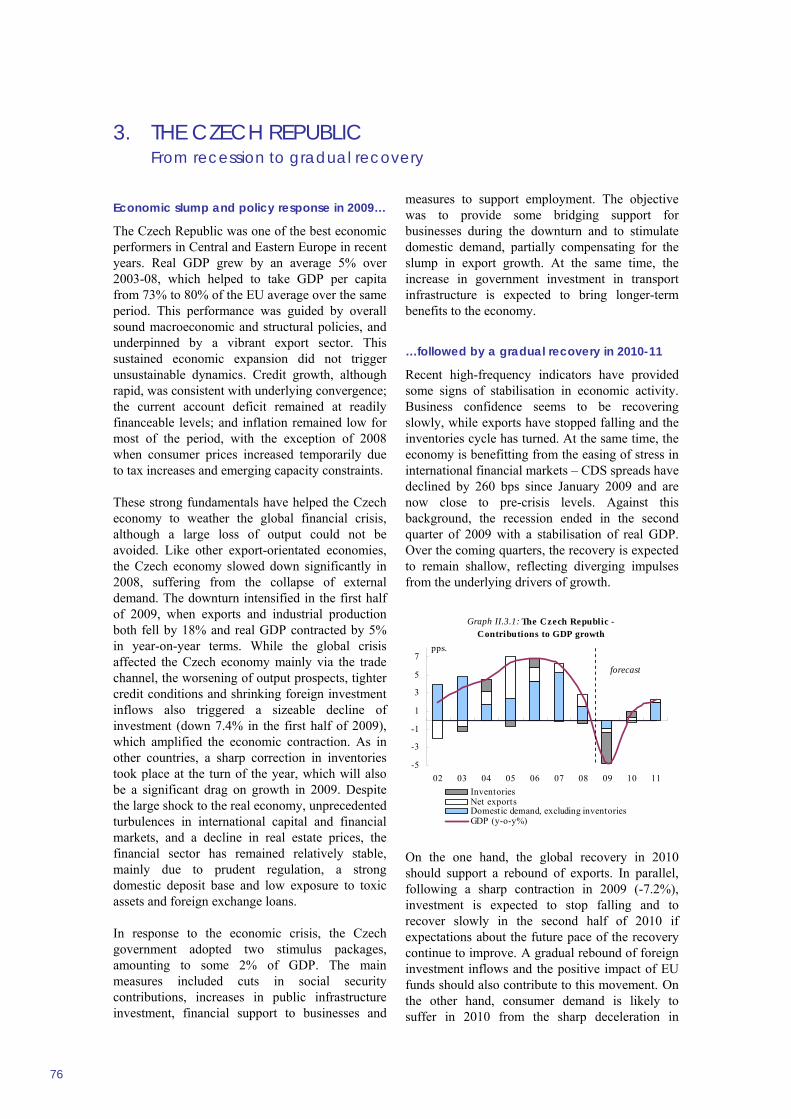
3. THE CZECH REPUBLIC From recession to gradual recovery
76
Economic slump and policy response in 2009…
The Czech Republic was one of the best economic performers in Central and Eastern Europe in recent years. Real GDP grew by an average 5% over 2003-08, which helped to take GDP per capita from 73% to 80% of the EU average over the same period. This performance was guided by overall sound macroeconomic and structural policies, and underpinned by a vibrant export sector. This sustained economic expansion did not trigger unsustainable dynamics. Credit growth, although rapid, was consistent with underlying convergence; the current account deficit remained at readily financeable levels; and inflation remained low for most of the period, with the exception of 2008 when consumer prices increased temporarily due to tax increases and emerging capacity constraints.
These strong fundamentals have helped the Czech economy to weather the global financial crisis, although a large loss of output could not be avoided. Like other export-orientated economies, the Czech economy slowed down significantly in 2008, suffering from the collapse of external demand. The downturn intensified in the first half of 2009, when exports and industrial production both fell by 18% and real GDP contracted by 5% in year-on-year terms. While the global crisis affected the Czech economy mainly via the trade channel, the worsening of output prospects, tighter credit conditions and shrinking foreign investment inflows also triggered a sizeable decline of investment (down 7.4% in the first half of 2009), which amplified the economic contraction. As in other countries, a sharp correction in inventories took place at the turn of the year, which will also be a significant drag on growth in 2009. Despite the large shock to the real economy, unprecedented turbulences in international capital and financial markets, and a decline in real estate prices, the financial sector has remained relatively stable, mainly due to prudent regulation, a strong domestic deposit base and low exposure to toxic assets and foreign exchange loans.
In response to the economic crisis, the Czech government adopted two stimulus packages, amounting to some 2% of GDP. The main measures included cuts in social security contributions, increases in public infrastructure investment, financial support to businesses and
measures to support employment. The objective was to provide some bridging support for businesses during the downturn and to stimulate domestic demand, partially compensating for the slump in export growth. At the same time, the increase in government investment in transport infrastructure is expected to bring longer-term benefits to the economy.
…followed by a gradual recovery in 2010-11
Recent high-frequency indicators have provided some signs of stabilisation in economic activity. Business confidence seems to be recovering slowly, while exports have stopped falling and the inventories cycle has turned. At the same time, the economy is benefitting from the easing of stress in international financial markets – CDS spreads have declined by 260 bps since January 2009 and are now close to pre-crisis levels. Against this background, the recession ended in the second quarter of 2009 with a stabilisation of real GDP. Over the coming quarters, the recovery is expected to remain shallow, reflecting diverging impulses from the underlying drivers of growth.
Graph II.3.1: The Czech Republic - Contributions to GDP growth
-5
-3
-1
1
3
5
7
02 03 04 05 06 07 08 09 10 11
pps.
InventoriesNet exportsDomestic demand, excluding inventoriesGDP (y-o-y%)
forecast
On the one hand, the global recovery in 2010 should support a rebound of exports. In parallel, following a sharp contraction in 2009 (-7.2%), investment is expected to stop falling and to recover slowly in the second half of 2010 if expectations about the future pace of the recovery continue to improve. A gradual rebound of foreign investment inflows and the positive impact of EU funds should also contribute to this movement. On the other hand, consumer demand is likely to suffer in 2010 from the sharp deceleration in

Member States, The Czech Republic
77
disposable income. Declining employment, slowing wages, and the recently-approved fiscal consolidation measures should weigh on private consumption next year. The planned tax increases are set to push inflation up slightly despite low commodity prices and the negative output gap. The sluggishness of private consumption should persist up to the end of 2010, when labour market conditions are expected to improve. Overall, following the sharp contraction of 4.8% this year, real GDP is expected to increase by 0.8% in 2010 and to gather pace in 2011 with growth above 2%. It appears that, despite considerable uncertainty, the risks to the growth outlook are broadly balanced. On the upside, a faster recovery would be possible if demand for Czech exports were to pick up more rapidly than expected. The downside risks are linked to the steeply rising unemployment and weak private consumption.
Unemployment is set to rise…
One of the main challenges facing the Czech economy in the post-crisis environment will be to ensure a rapid adjustment of the labour market to the downturn. There is a risk that the large drop in economic activity, which is particularly pronounced in some export-oriented areas like the automotive sector, might translate into an extended period of high unemployment in some regions. This could affect the growth potential of the economy through hysteresis and losses in human capital. The unemployment rate, while lower than in most of other new Member States, is expected to increase markedly (by around 3 percentage points) over the forecast horizon. Also, following the large fall in labour productivity during the crisis – 3 percent in 2009, compared to average annual gains of around 4 percent during the boom phase – the risk exists of a jobless recovery. A rapid adjustment of wages could help ensure convergence toward a desirable equilibrium in the labour market. The impact of the recession on labour market developments also depends on the speed at which longer-term structural constraints on labour market participation and flexibility such as low regional and sectoral mobility as well as skills mismatches are alleviated, allowing reallocation of the labour force from those sectors that were hard-hit during the crisis – including the large automotive sector – to those with the most favourable medium-term outlook.
The speed of future real convergence also depends on developments in external competitiveness and
the capacity of the Czech economy to continue its successful integration in the global economy. Available indicators suggest that the external position of the Czech economy has remained strong during the crisis, with the koruna valued at a level broadly in line with fundamentals. However, while a relative advantage in labour-intensive goods still exists, it is diminishing over time given the increasing competition from lower-wage EU members and non-EU countries.
Graph II.3.2: The Czech Republic - Government finances
23
28
33
38
43
05 06 07 08 09 10 11-9
-7
-5
-3
-1
1
3
5
General government debt (lhs)General government deficit (rhs)
forecast
% of GDP % of GDP
…while public finances deteriorate further
Years of pro-cyclical policy during the boom phase had left Czech public finances in a structurally weak position at the outset of the crisis. While the headline deficit improved by one percentage point between 2004 and 2008, the structural deficit increased from 2½% to over 4% of GDP over the same period. Also, the fiscal room for manoeuvre was limited by the risks implied by an ageing population for the long-term sustainability of public finances. Although the first stages of the pension and healthcare reforms were initiated in 2008, both pension- and healthcare-related expenditures remain high and are set to increase markedly in future.
The public finances are expected to worsen considerably in 2009. The general government deficit is set to widen from 2.1% of GDP in 2008 to 6.6% of GDP in 2009, mainly as a result of the economic downturn. The structural deficit should also increase, reflecting anti-crisis measures. On the revenue side, cuts in social security contributions and a reduction of the corporate income tax rate from 21% to 19% will contribute to the estimated fall in the revenue-to-GDP ratio. The expenditure-to-GDP ratio will increase

European Economic Forecast, Autumn 2009
Table II.3.1:Main features of country forecast - THE CZECH REPUBLIC
2008 Annual percentage changebn CZK Curr. prices % GDP 92-05 2006 2007 2008 2009 2010 2011
GDP 3689.0 100.0 2.4 6.8 6.1 2.5 -4.8 0.8 2.3 Private consumption 1834.0 49.7 3.7 5.2 5.0 3.6 1.0 -0.5 1.7 Public consumption 753.2 20.4 1.0 1.2 0.7 1.0 1.4 0.1 0.8 Gross fixed capital formation 883.2 23.9 4.7 6.0 10.8 -1.5 -7.2 0.3 4.5 of which : equipment 380.0 10.3 8.5 8.4 16.9 -0.6 -11.0 -0.5 5.8 Exports (goods and services) 2844.0 77.1 10.1 15.8 15.0 6.0 -16.5 2.1 5.8 Imports (goods and services) 2676.0 72.5 13.1 14.3 14.3 4.7 -17.0 1.8 5.9 GNI (GDP deflator) 3426.0 92.9 - 6.3 3.9 2.3 -4.7 1.2 2.6 Contribution to GDP growth : Domestic demand 3.4 4.3 5.2 1.5 -0.9 -0.2 2.0
Stockbuilding 0.2 1.0 -0.2 -0.4 -3.5 0.8 0.0Foreign balance -1.2 1.5 1.1 1.3 -0.4 0.3 0.3
Employment - 1.8 2.7 1.5 -2.0 -1.4 0.3 Unemployment rate (a) - 7.2 5.3 4.4 6.9 7.9 7.4 Compensation of employees/head - 6.0 6.4 6.0 0.5 1.6 3.3 Unit labour costs whole economy - 1.1 3.0 5.1 3.4 -0.7 1.3 Real unit labour costs - 0.0 -0.4 3.2 2.1 -2.0 -0.4 Savings rate of households (b) - - 10.7 10.2 11.0 11.6 11.9 GDP deflator 7.3 1.1 3.4 1.8 1.3 1.3 1.7 Harmonised index of consumer prices - 2.1 3.0 6.3 0.6 1.5 1.8 Terms of trade of goods - -1.7 1.2 -2.3 1.4 0.4 0.1 Trade balance (c) -4.1 2.0 3.4 2.7 3.2 3.5 3.6 Current account balance (c) -3.6 -2.1 -2.6 -3.3 -2.5 -1.4 -0.8 Net lending(+) or borrowing(-) vis-à-vis ROW (c) -3.9 -1.7 -1.9 -2.2 -1.5 -0.7 -0.4 General government balance (c) - -2.6 -0.7 -2.1 -6.6 -5.5 -5.7 Cyclically-adjusted budget balance (c) - -4.2 -3.1 -4.1 -6.0 -4.5 -4.8 Structural budget balance (c) - -4.0 -3.1 -4.1 -6.3 -4.7 -4.9 General government gross debt (c) - 29.4 29.0 30.0 36.5 40.6 44.0 (a) Eurostat definition. (b) gross saving divided by gross disposable income. (c) as a percentage of GDP.
78
sharply on account of higher social transfers and public investment. The contraction in GDP combined with a high deficit will drive up the government debt level, which is projected to deteriorate from 30% in 2008 to around 44% in 2011. Unavoidably, debt service costs will rise, crowding out some productive public spending.
Faced with a larger-than-planned deterioration of government finances, the Czech government has started to take measures to correct fiscal imbalances. A sizeable fiscal consolidation package for 2010 - estimated at approximately 1½% of GDP - was adopted in October 2009, in the context of the 2010 budget. The main measures include increases in VAT, excise duties and real estate tax and withdrawal of some anti-crisis measures such as higher unemployment benefits and temporary reductions in social security contributions, all implemented in the course of 2009. Cuts in public wages have also been announced. The consolidation package is expected to reduce the general government deficit to around 5½% of GDP in 2010. Under the no-policy-change assumption, public finances are projected to deteriorate slightly in 2011 despite higher real GDP growth, as parliamentary elections planned spring 2010 make consolidation efforts after 2010 more uncertain. Given the large degree of openness of the economy, and the high level of the
government deficit in 2009, a credible fiscal consolidation plan for the medium term should not be detrimental to growth. Direct negative effects could be offset by a positive impact on private sector agents' confidence.

4. DENMARK Fiscal stimulus and private consumption underpin recovery
79
Early recession and quick policy response
A decade of sustained growth and strong economic performance in Denmark had already come to an end in early 2008. This was initially due to domestic reasons, as the economy was suffering from a bursting real estate bubble and overheating. The global financial and economic crisis therefore hit an economy that was already in a recession and GDP fell by 1.2% in 2008
Thanks to their robust public finance position, the Danish authorities reacted to the crisis with a significant fiscal expansion, notably with large tax reductions, which came into play already in early 2009 because they had been targeted at the ongoing domestic recession rather than the more severe global recession that was felt in Denmark from the end of 2008. These measures are expected to turn a comfortable budget surplus of 3.4% of GDP in 2008 into an expected deficit of 4 ¾% in 2010. In addition, the financial system was stabilised by two bank rescue packages.
Apart from its early beginning and the rapid government response, the crisis is Denmark differs from other countries in its remarkable weakness of private consumption, which fell by ¼% in 2008 and by an expected 4½% in 2009. This is notable because real disposable income at the same time continued to increase by ½%, as households benefitted from favourable wage increases, initially stable employment, sizeable tax reductions and the release of pension funds. Nevertheless, due to falling confidence, diminishing real estate prices and the bleak global economic outlook, Danish consumers cut back their consumption substantially and the savings rate is expected to have almost doubled in one year from 5.7% of GDP in 2008 to over 10% of GDP in 2009, motivated by insecurity and the need to deleverage balance sheets.
In this environment, the massive government intervention and sizeable automatic stabilisers could not keep the economy from contracting by an expected 4½% in 2009, due to the decline in private consumption combined with a fall in exports and investment at double-digit rates.
Private consumption, public investment and exports turn the cycle around
In spite of the weak response of the Danish economy so far, this forecast expects that the seed has been sown for a modest recovery starting in the second half of 2009. Rising confidence indicators point to a rebound in consumer spending. On top of this, large public investment programmes are beginning to take effect, the inventory cycle is coming to an end and the decline in exports also appears to have come to a halt. Investment, by contrast, will probably only start to increase quite late in the recovery.
Graph II.4.1: Denmark - GDP growth and contributions
-6
-3
0
3
6
95 96 97 98 99 00 01 02 03 04 05 06 07 08 09 10 11
Net tradeDomestic demandGDP growth (y-o-y%)
pps. forecast
The stabilisation of the world economy and the gradual pick-up in economic activity around the world, together with low interest rates and the continued rise in disposable incomes, are expected to restore consumer confidence. Private consumption is therefore expected to become the main driver of the economic recovery from the end of 2009 onwards.
By contrast, investment is expected to lag behind. Low demand, rising unit labour costs, falling profits and an uncertain economic outlook had already led companies to cut back investments sharply in 2007, with the construction sector hit especially hard due to the cooling housing market. The fall in business investment is expected to continue throughout 2009 and into 2010. With plenty of spare capacity in the corporate sector, business investment is expected to be subdued throughout the entire forecast period.

European Economic Forecast, Autumn 2009
80
Through the fiscal bills for 2009 and 2010, the government has given a boost to public consumption and to infrastructure investment in railroads, roads, schools and daycare facilities. The government investment programs are not expected to offset the steep decline in business investment completely, but they will cushion it. The timing of the investment programs is hard to predict. While some projects can be initiated almost immediately, others require extensive planning before they can be executed. Apart from the immediate stimulus effect of the investment programs, they are also expected to have a positive long-term effect on productivity.
With an improving external environment, Danish trade is expected to pick up at the end of 2009 and to continue to grow slowly in both 2010 and 2011. However, the global economic crisis has forced companies around the world to reassess their supply chains. Because of their loss of competitiveness in the last decade, Danish companies will find themselves in an increasingly difficult situation vis-à-vis their foreign competitors. Despite the erosion of competitiveness, Danish exports have performed well compared with other countries in the European Union. This can probably be explained by the composition of Danish exports, with a relative large share of chemical, agriculture and energy-technology products, which are traditionally less sensitive to business cycle swings. Regardless of the favourable product mix in its exports, Denmark is still expected to lose market shares throughout the forecast period.
The fall in demand has also affected employment, leading companies to lay off workers in order to cut costs. The unemployment rate rose from a historical low of 3.3 % in 2008 to an expected 4½ % in 2009 and is projected to rise through 2010, reaching close to 6% by the beginning of 2011 before beginning to decline. Although the rise in unemployment has been dramatic, the flexible Danish labour market and active labour market policies are expected to limit the likely rise in structural unemployment.
Inflation is expected to bottom out at just above 1% in 2009, reflecting strong base effects from declining fuel and food prices and recession-induced downward pressure on profits. With higher energy and environmental taxes and an expected rise in oil and other commodity prices, inflation is forecast to rise by 1½% in 2010. With
the recovery gaining ground and a gradual widening of profit margins, a further increase in inflation to 1¾% in 2011 is expected.
The above scenario is subject to a number of positive and negative risks. On the positive side, a stronger-than-expected recovery in Denmark's main trading partners could lead to a stronger rebound in exports, raising the growth prospect for the entire forecast period. Moreover, private consumption may grow more quickly than anticipated, given the current upsurge in consumer confidence and improved global economic outlook. The household savings rate is at a historically high level, which creates room for increased consumption. The stabilisation of the housing and stock markets could be the trigger that restores consumer confidence and leads to a strong rebound in private consumption. Downward risks to the recovery may, on the other hand, materialise in the event of renewed trouble in the financial sector.
Financial system stability secured through government action
The financial side of the global economic crisis became visible in Denmark at the end of 2008, when the 10th largest Danish bank, Roskilde Bank, was taken over by the Danish Central Bank due to insolvency. Several other minor banks have since been taken over by the government or forced to merge. The crisis made it difficult for the Danish financial sector to acquire funding and raised concerns about the sector's financial health. The Danish government enacted two bank rescue packages providing depositor guarantees and capital injections, and the mandate and resources of the Danish financial supervisory authority was strengthened. The measures taken appear to have helped and there are no indications of a serious credit squeeze. Risks still exist in the financial system, and it can not be ruled out that more banks might be either liquidated or forced to merge. But the overall stability of the system is expected to remain robust, at least until the expiry of the bank rescue packages.
Fiscal sustainability and the need for post-crisis consolidation
The fiscal consolidation and structural reforms implemented in Denmark over the last decade are serving the country well in the current crisis,

Member States, Denmark
Table II.4.1:Main features of country forecast - DENMARK
2008 Annual percentage changebn DKK Curr. prices % GDP 92-05 2006 2007 2008 2009 2010 2011
GDP 1733.5 100.0 2.2 3.3 1.6 -1.2 -4.5 1.5 1.8 Private consumption 851.2 49.1 2.0 4.4 2.4 -0.2 -4.6 2.3 1.7 Public consumption 463.0 26.7 2.1 2.1 1.3 1.5 2.1 1.3 1.4 Gross fixed capital formation 363.8 21.0 3.9 13.5 3.1 -5.1 -12.4 -4.1 2.1 of which : equipment 132.0 7.6 3.5 13.2 5.4 -4.8 -13.5 -5.2 1.9 Exports (goods and services) 950.9 54.9 4.8 9.1 2.2 2.2 -10.3 2.1 4.4 Imports (goods and services) 911.1 52.6 5.8 13.9 2.8 3.4 -13.2 2.0 4.1 GNI (GDP deflator) 1767.5 102.0 2.5 3.8 0.3 0.1 -5.1 1.7 1.8 Contribution to GDP growth : Domestic demand 2.3 5.3 2.2 -0.8 -4.3 0.7 1.6
Stockbuilding 0.1 -0.3 -0.3 0.2 -1.4 0.7 -0.1Foreign balance -0.2 -1.7 -0.2 -0.5 1.3 0.1 0.3
Employment 0.4 2.0 2.7 0.8 -2.6 -2.1 -0.1 Unemployment rate (a) 6.0 3.9 3.8 3.3 4.5 5.8 5.6 Compensation of employees/head 3.5 3.6 3.1 4.9 3.4 3.0 2.9 Unit labour costs whole economy 1.6 2.2 4.2 7.1 5.4 -0.7 1.0 Real unit labour costs -0.3 0.3 2.2 3.0 4.5 -1.8 -1.2 Savings rate of households (b) - - 5.1 5.7 10.4 10.1 8.9 GDP deflator 1.9 2.0 2.0 4.0 0.9 1.1 2.2 Harmonised index of consumer prices 1.9 1.9 1.7 3.6 1.1 1.5 1.8 Terms of trade of goods 1.0 0.6 -1.1 0.6 -1.6 0.3 1.0 Trade balance (c) 3.2 0.4 -0.8 -1.1 0.0 0.2 0.5 Current account balance (c) 2.0 2.9 0.7 2.2 1.9 2.2 2.9 Net lending(+) or borrowing(-) vis-à-vis ROW (c) 2.1 2.9 0.7 2.2 2.0 0.5 1.0 General government balance (c) 0.0 5.2 4.5 3.4 -2.0 -4.8 -3.4 Cyclically-adjusted budget balance (c) 0.0 3.5 2.9 3.4 1.3 -2.1 -1.3 Structural budget balance (c) - 3.5 2.9 3.4 1.4 -1.5 -1.3 General government gross debt (c) 58.8 31.3 26.8 33.5 33.7 35.3 35.2 (a) Eurostat definition. (b) gross saving divided by gross disposable income. (c) as a percentage of GDP.
81
giving the authorities room for manoeuvre to support the economy where needed.
The crisis and the expansionary fiscal policy have put pressure on public finances, leading to sizeable deficits in both 2010 and 2011. The increase in expenditures projected for 2009 and 2010, including the draft budget bill for 2010, reflect the functioning of automatic stabilisers, especially higher unemployment benefits, higher public investment brought about by the fiscal stimulus programs, and higher interest expenditure due to the increase in public debt. Tax revenues are expected to be sluggish in the forecast period, reflecting the tax cuts decided in 2007 and 2009. With the expected deficits in the forecast period, government debt is set to increase modestly from 33½% of GDP in 2008 to 35¼% of GDP in 2011.
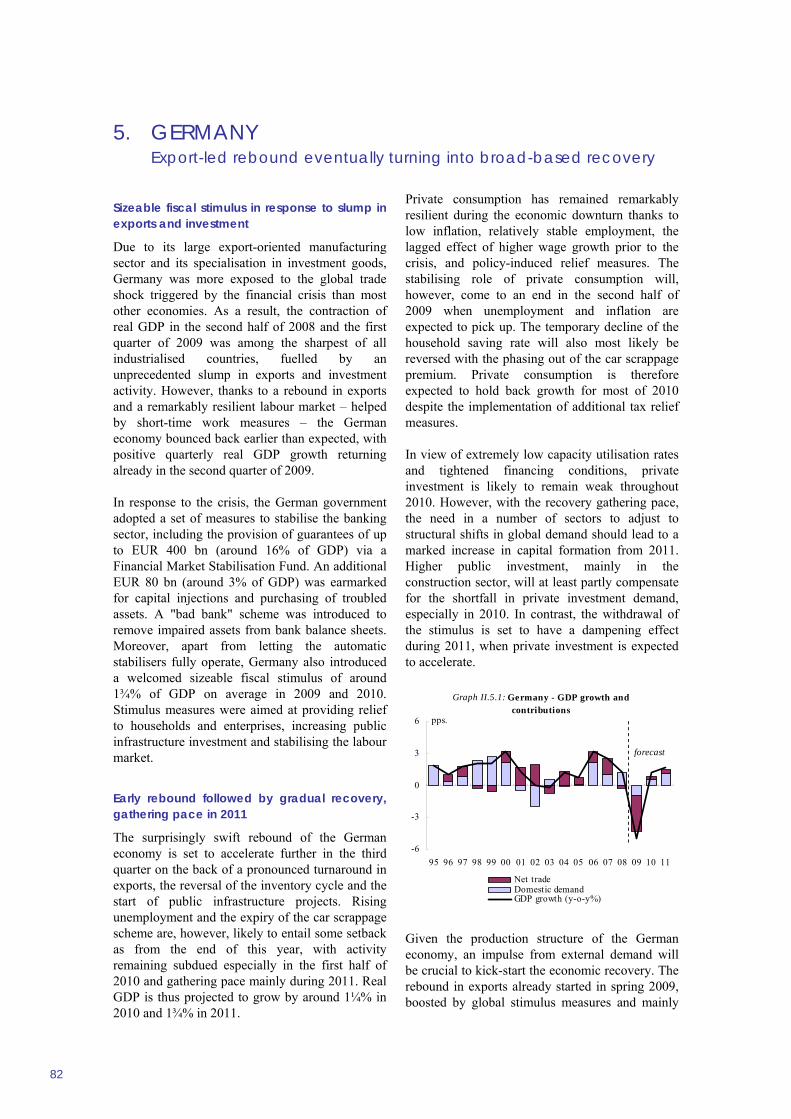
5. GERMANY Export-led rebound eventually turning into broad-based recovery
82
Sizeable fiscal stimulus in response to slump in exports and investment
Due to its large export-oriented manufacturing sector and its specialisation in investment goods, Germany was more exposed to the global trade shock triggered by the financial crisis than most other economies. As a result, the contraction of real GDP in the second half of 2008 and the first quarter of 2009 was among the sharpest of all industrialised countries, fuelled by an unprecedented slump in exports and investment activity. However, thanks to a rebound in exports and a remarkably resilient labour market – helped by short-time work measures – the German economy bounced back earlier than expected, with positive quarterly real GDP growth returning already in the second quarter of 2009.
In response to the crisis, the German government adopted a set of measures to stabilise the banking sector, including the provision of guarantees of up to EUR 400 bn (around 16% of GDP) via a Financial Market Stabilisation Fund. An additional EUR 80 bn (around 3% of GDP) was earmarked for capital injections and purchasing of troubled assets. A "bad bank" scheme was introduced to remove impaired assets from bank balance sheets. Moreover, apart from letting the automatic stabilisers fully operate, Germany also introduced a welcomed sizeable fiscal stimulus of around 1¾% of GDP on average in 2009 and 2010. Stimulus measures were aimed at providing relief to households and enterprises, increasing public infrastructure investment and stabilising the labour market.
Early rebound followed by gradual recovery, gathering pace in 2011
The surprisingly swift rebound of the German economy is set to accelerate further in the third quarter on the back of a pronounced turnaround in exports, the reversal of the inventory cycle and the start of public infrastructure projects. Rising unemployment and the expiry of the car scrappage scheme are, however, likely to entail some setback as from the end of this year, with activity remaining subdued especially in the first half of 2010 and gathering pace mainly during 2011. Real GDP is thus projected to grow by around 1¼% in 2010 and 1¾% in 2011.
Private consumption has remained remarkably resilient during the economic downturn thanks to low inflation, relatively stable employment, the lagged effect of higher wage growth prior to the crisis, and policy-induced relief measures. The stabilising role of private consumption will, however, come to an end in the second half of 2009 when unemployment and inflation are expected to pick up. The temporary decline of the household saving rate will also most likely be reversed with the phasing out of the car scrappage premium. Private consumption is therefore expected to hold back growth for most of 2010 despite the implementation of additional tax relief measures.
In view of extremely low capacity utilisation rates and tightened financing conditions, private investment is likely to remain weak throughout 2010. However, with the recovery gathering pace, the need in a number of sectors to adjust to structural shifts in global demand should lead to a marked increase in capital formation from 2011. Higher public investment, mainly in the construction sector, will at least partly compensate for the shortfall in private investment demand, especially in 2010. In contrast, the withdrawal of the stimulus is set to have a dampening effect during 2011, when private investment is expected to accelerate.
Graph II.5.1: Germany - GDP growth and contributions
-6
-3
0
3
6
95 96 97 98 99 00 01 02 03 04 05 06 07 08 09 10 11
Net tradeDomestic demandGDP growth (y-o-y%)
pps.
forecast
Given the production structure of the German economy, an impulse from external demand will be crucial to kick-start the economic recovery. The rebound in exports already started in spring 2009, boosted by global stimulus measures and mainly

Member States, Germany
83
from emerging market economies. The sustainability of this recovery still needs to be confirmed. The expiry of stimulus measures and the continued deleveraging of the private sector in a number of countries are likely to weigh on export growth, especially in 2010. Nevertheless, with its cost competitiveness largely intact and its comparative advantage in supplying investment goods, Germany should be well placed to benefit from the recovery especially in emerging market economies and should be able to reverse the loss of market shares encountered during the crisis. Therefore, a moderate but steady recovery in exports is projected for 2010, gathering momentum in 2011 and sustaining a relatively broad-based post-crisis recovery in the economy. With domestic demand projected to respond more vigorously to the increase in economic activity than in the past, import growth should also pick up markedly, especially in 2011. The contribution of net exports to growth is projected to remain moderate compared with the pre-crisis situation, reflecting a more balanced growth composition.
Given the sharp contraction in economic activity, inflationary pressures are projected to remain subdued throughout the forecast period. Thanks to lower energy prices and associated favourable base effects, annual HICP inflation has decelerated sharply during 2009 and has turned temporarily negative. With the base effects gradually petering out by the end of the year and energy prices rising again, HICP inflation is expected to edge up from 0.3% on average in 2009 to 0.8% in 2010. With the recovery gaining ground and the negative output gap gradually starting to close, a slight pick-up in inflation is projected for 2011.
This forecast is subject to a number of risk factors. Firstly, a sharper-than-expected increase in unemployment could lead to a stronger contraction of private consumption in 2010 and a more moderate recovery in 2011. Secondly, bank balance sheets have been considerably weakened because of the high exposure to toxic assets, concentrated in some commercial banks and Landesbanken. This could impair the capacity of the banking sector to provide finance to the corporate sector, thereby hampering a recovery in investment demand. On the other hand, following the sharp and sudden contraction of economic activity in 2008/09, a normalisation of the situation could entail a more buoyant rebound than currently envisaged. In line with strong improvements in business and consumer confidence indicators, the
internal dynamics of the recovery could turn out stronger than currently expected and together with a stronger labour market counterbalance the dampening factors identified above.
Internal adjustments in the 2000s laid the basis for more balanced growth
The medium-term outlook is influenced by the fact that Germany went through a decade of profound internal adjustments prior to the crisis. Following the post-unification boom with above-average wage and price inflation, a prolonged period of wage moderation helped to restore price competitiveness. The household saving rate, which had dropped after unification, returned to its longer-term average. Companies used increasing profit margins to strengthen their balance sheets. This came primarily at the expense of domestic investment, as the establishment of the euro area, enlargement of the EU, globalisation and closer financial integration triggered higher capital exports from Germany. In the public sector, fiscal consolidation brought the general government budget back into balance by 2007, from a deficit of 3.8% of GDP in 2004. A series of labour market reforms – in combination with wage restraint – helped tackle the high level of structural unemployment.
Graph II.5.2: Germany - Private consumption and real disposable income
-2
0
2
4
6
8
92 94 96 98 00 02 04 06 08 10
y-o-y%
13.514.014.515.015.516.016.517.017.518.018.5%
Saving rate (rhs)Gross disposable income (lhs)Private consumption (lhs)
forecast
As a consequence, domestic demand remained sluggish for almost a decade with weak private investment growth, fiscal tightening and lacklustre private consumption due to stagnant real disposable incomes and a rising saving rate. The mirror image of these internal adjustments was a growth pattern that was tilted towards exports, fuelled by improved competitiveness and ebullient demand from countries experiencing asset bubbles and strong capital inflows.

European Economic Forecast, Autumn 2009
84
At the onset of the crisis, the process of internal adjustment had effectively come to an end. Economic growth picked up strongly as from 2006, with private investment increasing sharply. Thanks to past wage moderation and labour market reforms, unemployment decreased markedly and employment growth accelerated, spilling over into higher wage growth. These wage gains did not immediately lead to stronger private consumption growth, as the 2007 increase in VAT and higher energy prices in 2008 reduced real disposable incomes. However, the resilience of private consumption during the downturn is clearly linked to the improved labour market situation and past income gains. As a result, Germany's growth composition has become considerably more balanced already during the crisis, with the current account surplus almost halving from close to 8% of GDP in 2007 to 4% of GDP in 2009. Moreover, after the protracted adjustment period in the 2000s, Germany's medium-term growth outlook is no longer hampered by major domestic imbalances.
Labour market adjustments ahead
Contrary to most other countries, the economic crisis so far had only a very limited impact on the German labour market. The unemployment rate has increased by less than 1 pp. since October 2008 and employment initially kept growing even during the downturn. A number of factors have been responsible for this. First, companies took advantage of the increased use of flexible working time arrangements, cushioning the impact of the crisis by reducing overtime work and depleting working time accounts. Second, they resorted on a large scale to short-time work, especially since the German stimulus package increased the maximum duration of short-time work to 24 months and offered additional financial incentives to companies to use the scheme. Third, given the difficulties in hiring qualified workers during the 2007/08 upswing, many companies proved reluctant to lay off workers prematurely. Fourth, past labour market reforms and wage moderation have arguably reduced structural unemployment in Germany. The adjustment to this lower level of unemployment was not yet fully completed at the beginning of the crisis.
Nevertheless, the sharp contraction in economic activity combined with relatively stable employment levels has led to a sharp drop in productivity and an accompanying hike in nominal unit labour costs. This is hardly sustainable and
companies will inevitably start to adjust their employment levels. Therefore, unemployment is set to increase noticeably well into 2011, albeit to a much lesser degree than envisaged in the spring forecast. In this context, the challenge is to prevent the cyclical increase in unemployment from turning once again into higher structural unemployment. Thus, strengthening the capacity of the labour market to generate jobs during the upswing will be critical for sustaining the recovery of private consumption.
Graph II.5.3: Germany - General government gross debt and deficit
-2
-1
0
1
2
3
4
5
6
99 00 01 02 03 04 05 06 07 08 09 10 11
% of GDP
50
55
60
65
70
75
80
85
Gross debt (rhs) Deficit (lhs)Deficit threshold (3%) Debt threshold (60%)
forecast% of GDP
Overcoming the crisis requires sustained rise in productivity…
For Germany, the unwinding of global imbalances after the crisis implies a number of challenges. With the process of deleveraging in full swing in countries with high current account deficits, the recovery of the German economy relies to a larger extent on domestic factors than in the past. This entails a number of structural changes, including a certain re-allocation of resources between sectors, which depends crucially on flexible product and factor markets. Particularly important for boosting potential output and sustaining high income growth would be a reversal of the observed trend of declining productivity growth. At the same time, the growth and employment opportunities in the services sector still appear to be largely untapped in Germany.
…and a stable banking sector
The German banking sector has come under severe strain from the financial and economic crisis. The capital base of financial institutions has been significantly weakened by losses and write-downs from investments in structured assets. Moreover, bank balance sheets could be burdened in the

Member States, Germany
Table II.5.1:Main features of country forecast - GERMANY
2008 Annual percentage changebn Euro Curr. prices % GDP 92-05 2006 2007 2008 2009 2010 2011
GDP 2495.8 100.0 1.4 3.2 2.5 1.3 -5.0 1.2 1.7 Private consumption 1409.7 56.5 1.3 1.3 -0.3 0.4 0.6 -0.2 0.8 Public consumption 451.8 18.1 1.3 1.0 1.7 2.1 2.3 1.5 0.8 Gross fixed capital formation 474.7 19.0 0.5 7.8 5.0 3.1 -8.9 2.1 3.9 of which : equipment 201.8 8.1 1.4 11.1 6.9 5.3 -20.8 1.0 7.0 Exports (goods and services) 1179.4 47.3 6.0 13.0 7.5 2.9 -15.4 2.6 4.7 Imports (goods and services) 1023.7 41.0 5.0 11.9 4.8 4.3 -9.5 2.0 4.3 GNI (GDP deflator) 2537.0 101.7 1.4 4.1 2.4 0.9 -5.0 0.8 1.6 Contribution to GDP growth : Domestic demand 1.2 2.3 1.0 1.2 -0.9 0.6 1.4
Stockbuilding -0.2 -0.2 -0.1 0.5 -0.7 0.3 0.0Foreign balance 0.4 1.1 1.5 -0.3 -3.4 0.3 0.3
Employment -0.8 0.2 1.5 1.4 -0.5 -1.9 -0.3 Unemployment rate (a) 8.5 9.8 8.4 7.3 7.7 9.2 9.3 Compensation of employees/f.t.e. 3.2 1.5 1.1 2.0 -0.2 1.3 1.6 Unit labour costs whole economy 1.0 -1.4 0.2 2.2 4.6 -1.8 -0.4 Real unit labour costs -0.3 -1.9 -1.7 0.7 3.6 -2.4 -0.9 Savings rate of households (b) - - 16.8 17.2 16.9 17.2 17.2 GDP deflator 1.4 0.5 1.9 1.5 0.9 0.6 0.5 Harmonised index of consumer prices - 1.8 2.3 2.8 0.3 0.8 1.0 Terms of trade of goods 0.5 -1.8 0.6 -1.1 3.4 -0.4 -0.7 Trade balance (c) 4.0 7.0 8.2 7.3 4.7 4.7 4.7 Current account balance (c) 0.3 6.6 7.9 6.6 4.0 3.8 3.7 Net lending(+) or borrowing(-) vis-à-vis ROW (c) 0.3 6.6 7.9 6.6 4.0 3.8 3.7 General government balance (c) -2.7 -1.6 0.2 0.0 -3.4 -5.0 -4.6 Cyclically-adjusted budget balance (c) -2.6 -2.2 -1.2 -1.5 -1.9 -3.6 -3.5 Structural budget balance (c) - -2.2 -1.2 -1.1 -1.9 -3.6 -3.5 General government gross debt (c) 57.6 67.6 65.0 65.9 73.1 76.7 79.7 (a) Eurostat definition. (b) gross saving divided by gross disposable income. (c) as a percentage of GDP.
85
future by further rating downgrades of borrowers and by a surge in insolvencies and credit defaults. This may impair the ability of banks to provide financing to the corporate and household sector. A successful economic recovery will therefore crucially depend on the stabilisation of the banking sector and securing access to finance by the corporate sector.
Sound fiscal positions allowed budgetary expansion
Benefiting from the balanced budgetary position in 2008, the German authorities adopted a wide range of measures to counter the economic downturn, including measures to stabilise financial markets and a sizeable fiscal stimulus. At the same time, automatic stabilisers were allowed to operate fully (around 3% of GDP in 2009), including a massive increase in short-time work benefits.
Consequently, the general government balance fell to a deficit of 3½% of GDP in 2009. The deficit is projected to increase further in 2010 (5% of GDP) mainly on the back of substantial tax losses and measures in support of the economy. It is set to diminish in 2011 to 4½% of GDP as a result of the withdrawal of certain stimulus measures and with additional investment leveling off. Debt is projected to increase from almost 66% of GDP in
2008 to close to 80% of GDP in 2011, fuelled by increasing deficits and financial market stabilisation measures.
The budgetary situation after the recession will be complicated by the implicit shortfall in tax revenues and significantly higher expenditure. Uncertainties related to the strength of the recovery also pose a risk to public finances. At the same time, the new fiscal rule anchored in the German constitution, which prescribes a structural deficit ceiling of 0.35% of GDP for the Federal government as of 2016 – and a structurally balanced budget for the Länder as of 2020 – requires retrenchment from 2011 onwards with an additional structural effort estimated by the German authorities in the draft medium-term financial plan (2009-2013) of 0.2% of GDP annually.
The main challenge will be to reconcile the necessary fiscal consolidation with the strengthening of the economy's long-term growth potential. A careful review of government expenditure, including the fiscal stimulus administered, the removal of subsidies potentially hindering structural adjustment, and safeguarding growth-enhancing spending should be conducive to higher potential growth.

6. ESTONIA On a path of rapid adjustment
86
Convergence of recent years sharply reversed in the current downturn…
Estonia's years of rapid catching up, with growth at 8½% on average between 2000 and 2007, gave way in 2008-9 to the deepest economic contraction since the country's independence. Sizeable imbalances accumulated during the years of high growth, ultimately leading to a reversal of the cycle, which started with a contraction in domestic demand. Quarterly growth rates turned negative in early 2008 and, as the global loss of confidence in the second half of the year depressed external demand, the contraction in economic activity accelerated, reaching 3.6% in the year as a whole. The initially slow unravelling of accumulated imbalances reflected high price and wage inflation and a subdued labour market response.
Significantly over-optimistic official growth assumptions, coupled with a sharp fall in revenue, resulted in a distinctly expansionary fiscal stance in 2008, which helped counter the worsening cyclical conditions. Despite the adoption of a restrictive supplementary budget in mid-2008, the headline deficit reached 2.7% of GDP, following six years of nominal surpluses.
The contraction continued in 2009 and the economy had shrunk by almost a fifth by mid-year compared to the high point of the cycle in 2007. This was notably a reflection of the continued contraction in domestic demand, which had shrunk by 30% in the second quarter of the year compared to the same period of 2008. This was, in particular, due to a decline in fixed investment and de-stocking, and a smaller but still sizeable fall in private consumption. Although contributing to the contraction to a lesser extent than domestic components, external demand also continued to act as a drag on the economy. Across sectors, the most pronounced decline was registered in construction and financial intermediation – formerly the backbone of high growth rates – and in manufacturing. The decline in domestic demand was mirrored in the pronounced fall in imports.
Although there are some indications that the economy may have bottomed out during the summer months, there are no immediate prospects for quick recovery. Thus, even with a stabilisation in the last few months of the year, the overall
output contraction is expected to approach 14% for 2009 as a whole.
Graph II.6.1: Estonia - GDP, external balance, inflation and wage growth
-20-15-10
-505
10152025
00 01 02 03 04 05 06 07 08 09 10 11-18
-12
-6
0
6
12
18
GDP (lhs) External balance (rhs)HICP (lhs) Wage growth (lhs)
forecast
y-o-y% % of GDP
...but ongoing adjustment of the economy in 2009 narrows imbalances
In the context of Estonia's fixed exchange rate regime, the adjustment of the economy to correct the imbalances accumulated over the past years is largely taking place through the labour market and in prices.
After initial inertia – partly explained by the almost full employment achieved during the boom years – the adjustment in the labour market became very pronounced from the beginning of 2009, with employment falling by over 7% in the first quarter and almost 2% in the second. Unemployment increased significantly throughout the year, with the seasonal pattern being affected by changes to the labour law since the summer. Wage growth, which had contributed to the erosion of cost competitiveness in recent years, turned negative during the same period.
After the double-digit figures reached in spring 2008 (11.6%), HICP inflation converged quickly towards the euro area average and then turned negative in mid-2009, pulled down by a rapid fall in world commodity prices, the fading impact of earlier administrative price increases, as well as negative price pressure from weak domestic consumption. The latter's weakness also helped to limit the impact of a 2 pps. increase in the VAT rate, which took effect from mid-year, but was partly absorbed in mark-ups. Inflation is expected to remain low in the forecast period, given the still

Member States, Estonia
87
weak global economy and the low degree of capacity utilisation.
The severe contraction in internal demand contributed to a sudden retrenchment of imports, resulting in a sharp move from the high current account deficits recorded until 2008 to surpluses in the first half of 2009. The main adjustment took place through a narrowing of the merchandise trade deficit and diminishing profits in companies with foreign ownership (reducing the net income deficit), while services continued to perform rather well during the downturn and transfer receipts related to EU structural funds grew further.
Public sector also contributes to the rebalancing of the economy
Given the need to correct significant external and internal imbalances, the Estonian authorities implemented an ambitious fiscal consolidation in 2009. Their task became increasingly more challenging, however, as in the face of the worsening economic situation the government implemented successive ambitious packages, amounting in total to over 8% of GDP.
The very significant consolidation effort put in place in 2009 was achieved through a mixture of permanent and temporary measures, both on the revenue and expenditure sides. In particular, the reduction of the public sector wage bill has contributed positively to the unravelling of imbalances in the economy, while scaling down planned pension increases and other changes to the pension law will also improve sustainability of public finances in the medium term. On the revenue side, measures include increases in indirect and labour taxes and higher dividends from state-owned companies. The deficits in 2008 and 2009 were largely financed by running down assets accumulated as a result of previous years' surpluses, so leading to an only modest increase in public debt.
The consolidation effort is expected to bring the general government deficit to 3% of GDP in 2009, although there are significant risks surrounding this forecast, related to the possibility of higher unemployment growth and lower tax revenue, as well as to meeting targets on expenditure and non-tax revenue. Hence, the possibility of a deficit above 3% in 2009 cannot be excluded. These downward risks should be seen against the potential for a faster recovery and the
determination of the authorities to ensure compliance with the Treaty deficit criterion.
The fiscal consolidation implemented so far, coupled with the ongoing modernisation of the public service, are expected to restrain expenditure growth going forward. At the same time, tax revenue is expected to be sluggish over the forecast period, even taking into account already implemented and planned tax increases. As a result, in the absence of further steps in addition to those foreseen in the current draft budget, the deficit in 2010 is projected to increase to marginally above 3% and remain around 3% in 2011. In view of the risks and of the need to reduce the deficit in a sustainable way, improving expenditure controls and the efficiency of public spending, as well as identifying additional revenue sources, could help to strengthen the fiscal position over the forecast period. General government debt, while increasing, is set to remain low, reaching 13% of GDP in 2011.
Recovery likely to be slow and initially supported by exports
Although the decline in economic activity appears to have stabilised, there is little reason to expect a fast recovery. The preceding boom and subsequent bust have brought economic activity back to the levels of 2005 and have left the economy with a higher burden of external debt. Servicing this debt will be one of the factors weighing on the recovery of domestic demand in the medium term.
While a modest recovery is expected in the coming quarters, growth is set to remain flat in 2010, with growth for the year as a whole turning positive only in 2011. Private consumption is not likely to support the recovery before 2011, given growing unemployment and declining nominal wages, even though consumer confidence is gradually strengthening. Likewise, fixed investment is not expected to start recovering before 2011, when the need to upgrade existing capacity will stimulate equipment investment in particular. However, some earlier positive impact can be expected from a turn in the stock cycle, as the confidence of companies strengthens and new orders show a stronger upward trend, taking into account the massive de-stocking that took place throughout 2008 and 2009.
With domestic demand flat, a modest positive growth impulse is expected in 2010 from external

European Economic Forecast, Autumn 2009
Table II.6.1:Main features of country forecast - ESTONIA
2008 Annual percentage changebn EEK Curr. prices % GDP 92-05 2006 2007 2008 2009 2010 2011
GDP 251.5 100.0 - 10.0 7.2 -3.6 -13.7 -0.1 4.2 Private consumption 140.6 55.9 - 12.9 9.0 -4.7 -16.7 -1.9 2.9 Public consumption 48.8 19.4 - 3.5 3.7 4.1 -2.8 -3.5 1.5 Gross fixed capital formation 73.7 29.3 - 18.6 9.0 -12.1 -32.8 -3.2 8.8 of which : equipment 29.6 11.8 - 27.2 10.1 -2.9 -25.0 -5.0 11.0 Exports (goods and services) 190.2 75.6 - 14.0 0.0 -0.7 -15.2 1.6 5.8 Imports (goods and services) 200.7 79.8 - 22.9 4.7 -8.7 -29.7 0.8 5.5 GNI (GDP deflator) 236.3 94.0 - 8.3 5.2 -2.6 -11.4 -0.8 2.4 Contribution to GDP growth : Domestic demand - 13.7 8.8 -6.1 -19.5 -2.4 3.8
Stockbuilding - 2.8 2.2 -5.7 -6.4 1.8 0.0Foreign balance - -8.4 -4.4 6.8 12.3 0.6 0.4
Employment -2.2 5.6 0.8 0.2 -9.0 -2.5 1.6 Unemployment rate (a) - 5.9 4.7 5.5 13.6 15.2 14.2 Compensation of employees/f.t.e. - 14.1 24.8 10.1 -4.5 -2.7 1.4 Unit labour costs whole economy - 9.6 17.3 14.3 0.7 -5.0 -1.2 Real unit labour costs - 1.9 6.4 7.2 0.9 -2.0 -3.1 Savings rate of households (b) - - -0.5 3.0 11.2 5.4 4.3 GDP deflator - 7.6 10.2 6.7 -0.2 -3.1 1.9 Harmonised index of consumer prices - 4.4 6.7 10.6 0.2 0.5 2.1 Terms of trade of goods - 2.7 3.4 -0.7 -6.4 -4.6 -0.3 Trade balance (c) - -18.1 -17.8 -11.7 -3.5 -5.4 -5.5 Current account balance (c) - -17.0 -17.9 -9.1 3.9 1.3 -0.3 Net lending(+) or borrowing(-) vis-à-vis ROW (c) - -15.0 -16.9 -8.2 6.3 3.7 2.4 General government balance (c) - 2.3 2.6 -2.7 -3.0 -3.2 -3.0 Cyclically-adjusted budget balance (c) - -0.2 -0.7 -4.2 -0.1 -0.4 -1.3 Structural budget balance (c) - -1.1 -1.0 -4.4 -2.5 -2.4 -1.9 General government gross debt (c) - 4.5 3.8 4.6 7.4 10.9 13.2 (a) Eurostat definition. (b) gross saving divided by gross disposable income. (c) as a percentage of GDP. Note : Contributions to GDP growth may not add up due to statistical discrepancies.
88
demand, in line with the global recovery. While market shares are unlikely to rise in 2010, improving competitiveness could lead to some increase in Estonia's share in global trade from 2011 onwards.
Lower costs and higher productivity growth lead to improved competitiveness
The competitiveness of exporting enterprises has benefitted from increased financial support made available through state programmes – in particular through EU structural funds – and via the banking sector. Such firms' exporting capacity is further reinforced by decreasing costs, as wage adjustment is already taking place and is expected to continue for some time, given the very flexible labour market, recently strengthened by the modernised Labour Law. Higher productivity growth is also expected to boost competitiveness. Ongoing efforts to further raise labour skills are helping to strengthen human capital efficiency and support a shift to more sophisticated exports. The counterparts to the increased capital formation in the tradable sector – supporting higher productivity growth – include increased domestic saving and recovering inward investment. Here, the financial sector is expected to play a key role in providing and facilitating the necessary financing in the right sectors. Despite the deteriorating quality of loan
portfolios, the banking sector remains stable and well capitalised.

7. IRELAND Significant domestic adjustment underlying a gradual recovery
89
Economic adjustment and policy response in 2008
The global economic and financial crisis has aggravated what started as a home-grown downturn and turned it into a protracted recession. After over a decade of strong economic growth that had been increasingly driven by domestic demand, a sharp adjustment from its 2006 peak started in the Irish housing market and has since spread to the wider economy. This development was amplified by the decline in global demand and especially by the recession in Ireland's main trading partners (euro area, US and UK). Similarly, the international financial crisis contributed to the deepening of the downturn, given the weight of the financial services sector in the Irish economy and banks' high dependence on foreign wholesale funding. The economy entered recession in 2008, with real GDP falling by 3% over the year. The downturn has also produced a dramatic deterioration in the Irish public finances, with a large general government deficit emerging and feeding into a projected steep increase in debt.
Against this background, Ireland's policy response to the crisis has focused on containing the fiscal imbalances, while also providing support to the weakened financial sector, inter alia through guarantees and capital injections. In line with the European Economic Recovery Plan, and within the constraints of the medium-run consolidation strategy, Ireland also adopted a modest package of measures to support economic activity.
Domestic demand is rebalancing
A large drop in real GDP is expected in 2009, followed by a smaller decline in 2010, before positive growth resumes in 2011. The recession continues to be driven by domestic demand. In particular, the strong fall in employment and incipient nominal wage declines are taking their toll on household disposable income, despite the fall in domestic prices and the increase in social transfers. Together with a significant rise in precautionary savings, influenced by households' negative employment expectations, this is projected to lead in 2009 to the strongest decline in real private consumption expenditure in over 25 years. As the pace of deterioration in the labour market slows in 2010, this should also be reflected
in somewhat more benign developments in consumption, although the adjustment of accumulated imbalances in household balance sheets, reflecting in particular their past over-investment in housing, should continue.
In the aftermath of the bursting of the housing market bubble, gross fixed capital formation is expected to further contract by nearly one third in 2009 and one sixth in 2010 before returning to moderate growth in 2011. The ongoing downsizing of the construction sector is a major determinant of the contraction, and is expected to continue well into 2010. On the back of subdued demand developments, equipment and machinery investment is also declining substantially but might pick up in the course of 2010 as prospects for global demand and the domestic economy improve. Given the need to consolidate the public finances, no support can be expected from public investment, which should show a marked decline in 2009, followed by smaller falls in 2010-2011.
Driven exclusively by the good performance of the – relatively acyclical – chemical and pharmaceutical goods sector, Ireland's exports have held up remarkably well in the crisis and are only expected to record a fairly moderate decline in 2009 – the smallest in the euro area. They should expand again in the following years. At the same time, the strong declines in private consumption and investment expected in 2009 should translate into a marked fall in imports, implying a strong positive contribution of external trade to GDP growth. The contribution of net exports should be smaller but stay positive in the remaining years of the forecast horizon, thereby contributing to the gradual narrowing of the current account deficit.
As regards risks to the baseline scenario, net exports could suffer from a slower recovery in the main trading partners or from further appreciation of the euro vis-à-vis the USD and GBP, to which Irish exports are particularly exposed. At the same time, the composition of exports, which allowed for their resilience in the downturn, might dampen their growth in an upswing. Concerning the public finance forecast, the bulk (around 4.3% of GDP) of the consolidation effort for 2010 and 2011 announced in the April 2009 supplementary budget has not been taken into account in the forecast as

European Economic Forecast, Autumn 2009
90
the underlying measures are still to be specified in the annual budgets (the exception is the announced retrenchment of public investment); the budget for 2010 will be presented in December 2009. Depending on the specific consolidation measures that are eventually implemented, a dampening effect on domestic demand cannot be excluded. On the upside, a faster pace of sectoral adjustment than assumed might provide support to consumption and investment demand.
Graph II.7.1: Ireland - Real GDP growth, growth contributions and unemployment rate
-11
-6
-1
4
9
14
04 05 06 07 08 09 10 11Net exportsDomestic demand including inventoriesGDP (y-o-y%)Unemployment rate (%)
forecast
pps.
Unemployment rising steeply
The pace of recovery will depend crucially on the speed at which imbalances accumulated in the past can be corrected. This includes the domestic rebalancing of economic activity from construction to more productive sectors, regaining competitiveness, cleaning up private and corporate balance sheets, and far-reaching fiscal consolidation.
At the peak of the housing market cycle in 2006, the construction sector accounted for over 13% of total employment, compared to below 8% in the euro area. The ongoing downsizing of the housing market and the contraction in overall activity are reflected in a large decline in employment in 2009. This adjustment is expected to continue, albeit less markedly, in the following years. In response to worsening labour market conditions, people have started to withdraw from the labour force, as evidenced by a fall in the participation rate. At the same time, after the significant inward migration flows of the last few years, net outward migration is now expected as Irish and immigrant workers seek job opportunities elsewhere. Despite this, the unemployment rate should rise further and peak at around 14% in 2010, with young and low-skilled workers being hardest hit.
Downward price and wage adjustment helps to regain competitiveness
Over the past few years, Ireland has suffered significant losses in competitiveness, as reflected in a strong rise in unit labour cost since 2002. The Irish price level was among the highest in the euro area in recent years and a downward adjustment of prices is currently taking place, driven partly by negative base effects in commodity prices but also by downward revisions of profit margins in the context of weak domestic demand. Led by developments in the public sector, there also appears to have been a reduction in nominal wages in the private sector in 2009, albeit by less than expected earlier. Adequate changes in relative prices would further support resource reallocation towards the tradables sector. These adjustments are projected to continue over the forecast horizon, thus helping to reverse the past competitiveness losses and in turn strengthening the potential growth contribution of the external sector. Productivity growth, which had declined over the past few years, should pick up somewhat as the construction sector shrinks, thus contributing further to the adjustment.
Regaining competitiveness will be important also given that balance sheet adjustments should continue to weigh on domestic demand over the next years. The projected increase in households' savings rate reflects not only precautionary motives but also the need to reduce indebtedness, after household debt as a share in GDP had doubled between 2001 and 2007 in the context of the housing boom. Corporate demand for investment credit should also moderate in the short term, while bank deleveraging in the aftermath of the financial sector crisis might weigh on credit supply. It is expected that the measures for the financial sector that have been put in place and announced by the government should facilitate an orderly restructuring process. In particular, a National Asset Management Agency (NAMA) has been set up to purchase impaired assets from banks operating in Ireland in order to revive commercial banking operations.
Focus on fiscal consolidation
The domestic property market correction and the financial crisis have taken a heavy toll on Ireland's public finances. Starting from mid-2008, the government implemented deficit-reducing measures estimated to amount to 4½% of GDP in 2009. Nevertheless, the general government deficit

Member States, Ireland
Table II.7.1:Main features of country forecast - IRELAND
2008 Annual percentage changebn Euro Curr. prices % GDP 92-05 2006 2007 2008 2009 2010 2011
GDP 181.8 100.0 6.9 5.4 6.0 -3.0 -7.5 -1.4 2.6 Private consumption 91.0 50.1 5.4 6.5 9.3 -0.7 -7.7 -2.4 1.8 Public consumption 32.2 17.7 4.7 6.3 7.8 1.5 -2.5 1.4 2.1 Gross fixed capital formation 39.5 21.7 8.6 3.9 2.4 -15.5 -30.4 -15.0 5.1 of which : equipment 8.6 4.7 8.9 -2.5 15.6 -16.8 -25.0 -5.0 6.0 Exports (goods and services) 151.9 83.5 12.3 5.1 8.6 -1.0 -3.4 1.2 3.7 Imports (goods and services) 133.0 73.2 11.5 6.5 5.6 -2.1 -8.5 -1.0 3.7 GNI (GDP deflator) 155.9 85.8 6.3 6.9 4.3 -2.9 -11.2 -2.6 2.8 Contribution to GDP growth : Domestic demand 5.2 5.0 6.1 -4.1 -10.9 -3.2 1.9
Stockbuilding 0.0 0.4 -0.8 0.2 -0.1 0.0 0.0Foreign balance 1.9 -0.4 2.9 0.7 3.4 1.9 0.7
Employment 3.7 4.3 3.6 -0.8 -7.8 -3.9 0.7 Unemployment rate (a) 8.5 4.5 4.6 6.0 11.7 14.0 13.2 Compensation of employees/head 5.3 4.6 6.0 5.5 -1.6 -1.8 1.1 Unit labour costs whole economy 2.2 3.6 3.6 7.9 -1.9 -4.2 -0.9 Real unit labour costs -1.5 0.1 2.3 9.2 0.5 -3.4 -2.0 Savings rate of households (b) - - 8.4 10.2 16.1 16.0 16.0 GDP deflator 3.7 3.5 1.3 -1.2 -2.3 -0.9 1.1 Harmonised index of consumer prices - 2.7 2.9 3.1 -1.5 -0.6 1.0 Terms of trade of goods -0.2 -2.6 -4.2 -2.8 0.7 -1.7 -1.5 Trade balance (c) 20.9 13.3 10.4 13.1 20.5 22.5 22.2 Current account balance (c) 0.9 -4.1 -5.3 -5.1 -3.1 -1.8 -1.5 Net lending(+) or borrowing(-) vis-à-vis ROW (c) 1.7 -4.0 -5.3 -5.1 -3.1 -1.8 -1.4 General government balance (c) 0.5 3.0 0.3 -7.2 -12.5 -14.7 -14.7 Cyclically-adjusted budget balance (c) 0.4 1.9 -1.7 -7.1 -9.6 -11.5 -12.5 Structural budget balance (c) - 1.9 -1.7 -7.1 -10.1 -11.5 -12.5 General government gross debt (c) 56.2 25.0 25.1 44.1 65.8 82.9 96.2 (a) Eurostat definition. (b) gross saving divided by gross disposable income. (c) as a percentage of GDP.
91
is expected to widen in 2009 beyond the target set in the April 2009 supplementary budget (10¾% of GDP), largely due to weaker tax revenue growth than expected. Based on the no-policy-change assumption, a further worsening of the deficit is projected over the forecast horizon.
In 2009, a series of tax-increasing measures moderated the revenue decline which followed the severe economic downturn and ongoing adjustment in housing market. In 2010-11, tax revenue developments are in line with expected economic growth, while also reflecting the full-year effect of measures taken in the course of 2009 (as well as the disappearance of some deficit-reducing one-off measures in 2009). The shift away from tax-rich domestic demand-driven growth to export-led growth, with sluggish employment and consumption growth, would lead to only a moderate tax revenue increase once the economic recovery takes hold.
Total expenditure is set to broadly stabilise in 2009. While there is a significant increase in unemployment-related spending and in debt-service costs, the consolidation measures taken so far have resulted in a decline in other expenditure categories. In particular, public investment will decline by 24% compared to 2008. The relatively low expenditure growth, by around 2½% in 2010-
11, results from the pay freeze in the public sector in 2010 and the implementation of the capital expenditure cuts announced in the April 2009 supplementary budget. Social benefits should reflect the growing number of recipients, while welfare rates are assumed to be flat in the negative inflation environment of 2010, but increase by the rate of inflation in 2011.
A combination of the large primary deficits, rising interest expenditure and, until 2010, falling nominal GDP, should lead to a rise in the debt ratio to around 96% of GDP by 2011. In line with the 19 October 2009 preliminary view of Eurostat (84), the bonds (around 30% of GDP) expected to be issued by the Special Purpose Vehicle associated to the NAMA to finance the purchase of loan books from certain financial institutions are not recorded as government debt, while the majority of those bonds are guaranteed by the Irish State. Still, the interaction between deficit and debt dynamics on the one hand and low nominal growth on the other underlines the importance of fiscal consolidation.
(84) See
http://epp.eurostat.ec.europa.eu/portal/page/portal/government_finance_statistics/documents/Irish_letter_19_10_2009.pdf.

8. GREECE Economic downturn challenges public finances
92
Economic adjustment and policy response
Having experienced a decade of strong economic growth of 4% on average, the Greek economy entered a recessionary phase in 2009. The accumulation of growing and long-term persistent domestic and external imbalances was accelerated by the unfolding of the ongoing crisis, weighing on the sustainability of the real convergence process in the long run. Both consumer and business confidence were strongly hit, weakening economic activity in 2008 and weighing on medium-term prospects. Although it reacted later than in other countries, GDP growth decelerated strongly in 2008, growing at only 2% compared with 4½% in 2007. The downturn is already taking a heavy toll on public finances. Tax revenue started to weaken in late 2008, while government debt financing became more challenging and more expensive, putting further pressure on the fragile budget.
Graph II.8.1: Greece - Net lending or net borrowing of the economy
-15
-10
-5
0
5
10
03 04 05 06 07 08 09 10 1190
100
110
120
130
140
Private sector (lhs)General government (lhs)Net lending (+) or net borrowing (-): total economy (lhs)Government gross debt (rhs)
forecast% of GDP % of GDP
Given the lack of room for manoeuvre, no expansionary fiscal policy response to the crisis was adopted within the EERP. However, a number of temporary measures were implemented in late 2008 and 2009, aimed at supporting vulnerable social groups and the sectors most hit by the crisis. In addition, although the direct impact of the financial crisis on the banking sector has been relatively contained, mainly thanks to the limited exposure of the Greek banks to high risk financial investments, a series of measures was implemented to safeguard the stability of the sector.
Flat growth in 2010 – mild recovery in 2011
The outlook is for real GDP to remain almost flat in 2010, before recovering mildly in 2011. Credit expansion, although still positive, should remain sluggish on the back of tighter credit conditions and high household indebtedness. Moreover, falling employment growth, declining wages and lower non-labour income growth should weigh on disposable income over the medium-term, putting a brake on real demand. In view of the highly uncertain environment, the households saving rate might increase, leading to further pressure on consumption growth. As a result, private consumption is projected to contract by 1¼% in 2010, while returning to positive growth rates by the end of the forecast horizon.
Negative prospects and tightening credit conditions are also expected to worsen profit expectations and discourage investment. Gross fixed capital formation continued to fall markedly in 2009, on the back of both housing and equipment investment retrenchment. In spite of the government's attempt to accelerate the execution of public investment and projects through Public Private Partnerships (PPP) in 2009, only a few of these projects have as yet started. Public investment activity however, is expected to resume in 2010 and to continue to rise in 2011. Investment should decline further in 2010 before showing some positive signs by the end of 2011, reflecting the continuing downsizing of the housing sector and the contraction in corporate investment.
The contraction in domestic demand is expected to continue in 2010, mirrored also by shrinking imports, which are projected to continue falling by around 3% in real terms. Total exports, in turn, should recover mildly in 2010, after the significant fall recorded in 2009, largely because of more favourable world demand prospects. Exports of goods should rise by almost 2½% in 2010 and increase further in 2011, while exports of services - in particular world trade sensitive merchant shipping and tourist receipts - should return to positive territory. All in all, the contribution of net exports to GDP growth should be positive both in 2010 and to a lesser extent in 2011, mainly due to the ongoing fall in imports, which goes well beyond that implied by historical elasticities.

Member States, Greece
93
The contraction of economic activity is weighing heavily on employment which is set to fall by some 2% over the forecast horizon. This will push the unemployment rate up to around 10¼% and 11% in 2010 and 2011, respectively.
The main risks to this baseline scenario are quite balanced. On the positive side, the resurgence of both consumer and business confidence and the gradual improvement of liquidity and capitalisation of Greek banks may help to sustain credit expansion at modest levels, which could underpin private consumption and ease the adjustment of the housing sector. In addition, if the fall in domestic output is not proportionate to the decline in demand, the increase in net exports may compensate more for the fall in domestic demand, leading to a higher contribution of net exports to GDP growth than assumed. On the negative side, a sharper fall in external demand would weigh more on economic activity. Moreover, within a context of tighter credit conditions, external financing could prove less benign and so the servicing of Greece's fast-rising external debt might crowd out domestic spending.
Sustained recovery implies correcting domestic and external imbalances…
The significant progress made by Greece in terms of real convergence over the last decade may be considerably challenged. Bringing the Greek economy back to a sustained convergence path involves the prompt identification and correction of the factors underlying the widening domestic and external imbalances.
The developments in the external sector are expected to lead to a significant correction of the external deficit in 2010. Nevertheless, the expected improvement over the medium term is likely to be much more moderate, given the structural weaknesses of the external performance of the economy. Notably, the current account deficit, although improving, may still account for almost 8% of GDP by 2011. In a context of weak growth in both real and nominal terms, external constraints are becoming more severe and should eventually lead to a serious adjustment.
Mounting competitiveness losses over the last decade are reflected in the sizeable appreciation of the real effective exchange rate (REER) based on unit labour costs. The rapid rise of wage costs and mark-ups in excess of productivity growth, as well
as the persistence of the inflation differential with the euro area, has contributed to a wage-price spiral. While nominal compensation per employee is set to increase by about 2¼% in 2009, HICP inflation is projected to remain close to 1% in 2009, resulting in high real wage growth, well above productivity growth. The disconnection between wages and labour-market conditions and productivity developments, including the weak response of wages growth to the current downturn, are set to continue in the medium-term, thus undermining further the competitive position of the economy. The promotion of productivity, together with appropriate wage developments, would help to regain lost competitiveness. Although current inflation rates are low, they are projected to quickly return to an upward trend over the forecast period. Core inflation should also rise more rapidly than the euro area average, also reflecting the poor functioning of domestic markets, especially services.
…and adjusting public finances.
The persistent deterioration of external imbalances reflects both rising investment and falling savings. The private and public sectors have alternated over time as the driving force of this deterioration, with the share of general government de-savings having markedly increased in the most recent years. The ongoing crisis, however, has the potential to make these imbalances unsustainable in the medium-term, with obvious implications for the financing of the large external and public deficits.
As public revenue depends strongly on indirect taxation and customs, weak consumption and decreasing imports translate swiftly into lower tax receipts and significant revenue shortfalls. In addition, the economic downturn is burdening social protection expenditure, leading to a further fiscal deterioration. With the general government deficit well above 3% of GDP on average over the current decade, and the accumulation of large debt-increasing below-the-line operations, public debt is quickly returning to levels well above 100% of GDP, which will raise the cost of financing government debt. This would not only render the financing of any additional issuance more expensive, but would also increase the cost of refinancing the existing stock of public debt.
The 2008 general government deficit notified by the Greek authorities in October 2009 stands at 7¾% of GDP, higher by 2¾% percentage points of

European Economic Forecast, Autumn 2009
Table II.8.1:Main features of country forecast - GREECE
2008 Annual percentage changebn Euro Curr. prices % GDP 92-05 2006 2007 2008 2009 2010 2011
GDP 239.3 100.0 2.9 4.5 4.5 2.0 -1.1 -0.3 0.7 Private consumption 173.3 72.4 2.9 5.3 3.3 2.3 -2.5 -1.3 0.8 Public consumption 40.4 16.9 2.7 -0.1 8.4 0.6 2.0 -0.1 0.7 Gross fixed capital formation 46.3 19.4 4.0 9.8 4.6 -7.4 -16.2 -3.9 1.3 of which : equipment 21.9 9.1 9.4 4.7 20.9 6.3 -19.0 -4.8 1.1 Exports (goods and services) 55.5 23.2 6.4 5.3 5.8 4.0 -11.8 2.7 3.1 Imports (goods and services) 80.0 33.4 5.6 9.0 7.1 0.2 -20.3 -3.1 1.9 GNI (GDP deflator) 231.5 96.7 2.7 4.0 3.7 1.6 -1.6 -0.7 0.7 Contribution to GDP growth : Domestic demand 3.2 5.9 4.8 0.1 -4.9 -1.6 0.9
Stockbuilding -0.1 0.4 0.8 1.0 -0.6 -0.1 -0.4Foreign balance -0.3 -1.7 -1.1 0.8 4.4 1.5 0.1
Employment 1.0 2.0 1.4 0.1 -0.9 -0.8 -0.2 Unemployment rate (a) 9.9 8.9 8.3 7.7 9.0 10.2 11.0 Compensation of employees/head 8.2 3.1 6.6 5.9 2.3 1.4 1.8 Unit labour costs whole economy 6.2 0.7 3.5 3.9 2.5 0.9 0.9 Real unit labour costs -0.3 -2.3 0.5 0.3 0.8 -0.5 -1.3 Savings rate of households (b) - - - - - - - GDP deflator 6.5 3.1 3.0 3.5 1.7 1.4 2.3 Harmonised index of consumer prices - 3.3 3.0 4.2 1.2 1.4 2.1 Terms of trade of goods 0.0 0.4 0.9 -2.2 6.5 -0.9 -0.3 Trade balance (c) -14.8 -17.1 -17.7 -16.6 -11.0 -10.3 -10.5 Current account balance (c) -5.9 -12.8 -14.7 -13.8 -8.8 -7.9 -7.7 Net lending(+) or borrowing(-) vis-à-vis ROW (c) - -10.5 -12.5 -12.4 -7.5 -6.8 -6.7 General government balance (c) -6.6 -2.9 -3.7 -7.7 -12.7 -12.2 -12.8 Cyclically-adjusted budget balance (c) -6.3 -3.8 -5.1 -8.9 -12.6 -11.3 -11.6 Structural budget balance (c) - -4.3 -4.9 -8.1 -11.3 -11.3 -11.6 General government gross debt (c) 98.1 97.1 95.6 99.2 112.6 124.9 135.4 (a) Eurostat definition. (b) gross saving divided by gross disposable income. (c) as a percentage of GDP.
94
GDP than the previous notification made in April 2009. Eurostat expressed a reservation on the figures reported by Greece on 21 October 2009 and did not validate the data (85). Any upward revision in the 2008 deficit figure would mainly be due to higher public expenditure, which had not been recorded in the previous notifications according to the Greek authorities. The notified expenditure figure includes a one-off capital expenditure of around 1¼ p.p. of GDP, related to past years' general government liabilities to the private sector, mainly public hospitals' arrears to the suppliers of paramedical and pharmaceutical procurement.
For 2009, the official public deficit estimate stands at 12½% of GDP, compared with the budgetary target of 3.7% of GDP included in the January 2009 update of the stability programme. On the expenditure side, a number of one-off expenditures mainly related to arrears to hospitals' suppliers amounting to around 1½ percentage points of GDP have been included. Taking into account relevant information provided by the Greek authorities, and the budget implementation cash-data over the first
(85) Eurostat (news release 149/2009) has expressed a
reservation on the data reported by Greece on 21 October 2009, due to significant uncertainties over the figures notified by the Greek statistical authorities.
nine months, the general government deficit in 2009 is expected to reach 12¾% of GDP. The Commission services' projection also includes the impact of measures announced in the 2009 budget law, the January 2009 update of the stability program and in the fiscal package of March 2009. However, the measures presented in June 2009 but not implemented in the course of the year, have not been taken into account in the projection for 2009.
Under a no-policy-change scenario assumption and on the back of the discontinuation of one-off expenditure realised in 2009, the headline deficit should remain above 12% of GDP in 2010 and increase further over the forecast horizon, exceeding 12¾% of GDP by 2011. Both falling revenue-to-GDP and rising expenditure-to-GDP ratios will contribute to this fiscal deterioration.
The economic downturn, coupled with high budget deficits, is expected to push debt higher, from 112½% of GDP in 2009 to over 135% of GDP by 2011, thus weakening the already fragile sustainability of Greek public finances in the long term.

9. SPAIN A protracted economic adjustment ahead
95
Economic adjustment and policy response in 2009
More than a decade of sustained and strong economic expansion in Spain came to an end in the second half of 2008. The accumulation of external imbalances, a high degree of household indebtedness, an oversized housing sector, and persistent competitiveness losses had prompted an adjustment of the economy which started in 2007, in terms of saving and investment balances and a rebalancing of the contribution of domestic demand to GDP growth. GDP actually contracted in the second half of 2008 and in the first half of 2009. The Spanish economy is expected to continue to post negative growth in the third and fourth quarters of the year, although the pace of contraction should ease. In 2009 as a whole, economic activity is estimated to have fallen by 3¾% compared to a still positive growth of 0.9% in 2008.
The downturn took a heavy toll on both jobs and public finances, which may result in high long-term unemployment and a sharp worsening of the long-term sustainability of public finances. Domestic demand is estimated to show a sharp fall, driven by a significant contraction in both investment - especially housing - and private consumption. Exports and more especially imports are estimated to post very high falls. As a result, domestic demand should drag GDP growth down by more than 6½ pps. this year, compared to a negative contribution of just ¾ pp. last year.
The policy response in Spain has been twofold. On the one hand, expansionary fiscal measures to stimulate the economy were adopted in line with the European Economic Recovery Plan. The fiscal stimulus – aimed at enhancing infrastructure and supporting households and businesses – has amounted to about 2½% of GDP in 2009. On the other hand, although the direct impact of the financial crisis on the Spanish banking sector has been relatively contained, owing mainly to a sound system of dynamic provisions set by the Bank of Spain, a series of measures was implemented to support the financial sector in its current process of productivity enhancement.
Slow economic recovery and decelerating job destruction over the forecast horizon
The outlook features a further contraction, albeit much smaller, of the economy in 2010, when it is projected to fall by around ¾%, followed by a moderate recovery of 1% in 2011. Overall, domestic demand is projected to reduce GDP growth in 2010 by around 1¾ pps., before starting to make a small positive contribution of ¾ pp. in 2011. This projection is mainly based on weak private consumption and still shrinking investment. Specifically, private consumption is set to contract by ½% in 2010 and to increase by nearly 1% in 2011.
The protracted fall in employment is set to induce slow growth in disposable income, both in nominal terms, thus affecting households' balance-sheet ratios, and in real terms, with an obvious impact on real demand, and thus leading to an increase in precautionary saving. In addition, access to consumer credit remains more difficult than in the past, due not only to tight credit conditions imposed by financial institutions, but also to high household indebtedness. Sluggish disposable income growth is projected to take place despite nominal wage growth above inflation, lower mortgage burdens, consistent with falling interest rates, and the impact of a partial extension into 2010 of the 2009 Local Investment Fund, which is expected to bring some additional labour income. The saving rate of households may reach a level close to 19% of gross disposable income in 2009, which compares with about 10% in 2007.
Gross fixed capital formation is set to keep on falling in 2010 and in 2011, albeit at a slower pace. Excess supply in the construction sector, where a considerable stock of new houses remains unsold, is expected to face a diminishing demand, driven by negative demographic developments. As a result, the adjustment process in the construction sector is projected to take longer than expected. Construction should contract further - by more than 10% in 2010 and almost 4% in 2011 - driven by a slimming down of the production capacity in housing construction of 16% in 2010 and 6¼% in 2011, which will help to reduce the large unsold dwellings stock. However, while equipment investment should still post a contraction in 2010, albeit at a lower pace, improving economic

European Economic Forecast, Autumn 2009
96
prospects are assumed to lead to mild growth by 2011. The projected fall in infrastructure investment in 2010, reflecting a partial reversal of the 2009 Local Investment Fund, will contribute to the contraction of other construction over the forecast horizon.
Graph II.9.1: Spain - Contributions to growth
-8
-6-4
-20
2
46
8
02 03 04 05 06 07 08 09 10 11
pps.
Domestic demand + inventoriesNet exportsGDP (y-o-y%)
forecast
In the external sector, imports are expected to shrink less markedly in 2010 and to return to positive growth in 2011 in line with final demand. Exports are projected to show a limited recovery in the medium term, reflecting not only weak world demand, but also a continued deterioration in competitiveness. Exports of goods and services should increase in 2010 and 2011 by around 1¼% and 3¼% respectively. All in all, the positive contribution of net exports to GDP growth is forecast to decrease in both 2010 and 2011.
In the current context of external financing constraints, with a primary income deficit that remains at around 4%, the cushioning of the real GDP decline at the expense of significant public sector dissaving may require domestic financing. This financing could come from higher saving ratios or from a further contraction in investment, thus weighing on real GDP growth over the medium term.
The contraction in economic activity, which particularly affects labour-intensive sectors, continues to weigh heavily on employment, which is projected to suffer a cumulative fall of some 2¾ in 2010 and 2011. Despite a projected easing in population growth and in labour force, the unemployment rate is forecast to rise to just above 20% of the labour force in 2011.
The present outlook represents a baseline scenario, which is subject to a number of risks that are considered to be broadly balanced. The fall in
interest rates, the record lows of inflation outcomes, and some growth in wages could boost disposable income and confidence, thus strengthening private consumption and softening the adjustment of the housing sector. Private consumption might also receive an extra impulse should the household saving rate, which is at a historical high, stagnate or even fall back. In addition, imports may continue to be very sensitive to final demand as they were in late 2008 and early 2009, leading to a higher contribution from net exports to GDP growth over the forecast horizon.
On the other hand, the still subdued employment prospects and currently high unemployment rates might contribute to a further reduction in confidence and household expenditure. In addition, some of the recent fiscal measures announced in the 2010 Budged Law, such as the elimination of tax rebates and the VAT increases, might also have a negative impact on private consumption. At the same time, a tightening of credit conditions would further constrain private investment. A lower-than-expected recovery of external demand would certainly weigh more heavily on economic activity than was projected in the baseline scenario. Finally, an increase in mortgage defaults could undermine balance sheet repair in banks with high exposure to the real estate sector, which might have an adverse impact on the real economy.
Correction of imbalances would help to restore sustained convergence
The challenge of bringing the Spanish economy back to a sustained convergence path could be successfully secured if the recovery were to lead not only to a rebalancing of domestic demand but also to higher export growth and to underpinning higher potential growth.
Due to the strong deceleration of activity in 2009, the current account deficit as a percentage of GDP is projected to fall from 9.5% in 2008 to around 5¼% in 2009. However, over the medium term, the expected improvement is likely to be more moderate, given Spain's current nominal GDP growth, which is low by historical standards. Notably, the current account may still reach some 4¼% of GDP by 2011.
All in all, the total borrowing needs of the country are projected to remain relatively high. The negative net investment position has continued to feed the deficit in the primary incomes account,

Member States, Spain
97
and the trade balance has persistently been in red territory, which partially reflects a steady deterioration in the country's competitive position.
Competitiveness could be recovered through wage moderation,…
The deterioration in competitiveness is due to a wide range of factors. Competitiveness losses are partially driven by a weak response of wages to the current recession. Nominal wages do not seem to be adjusting fully to labour market conditions, while job losses and unemployment are sharply rising. In addition, imbalances in the job market, namely high segmentation and inadequate bargaining mechanisms, can lead, as in the past, to a significant increase in long-term unemployment, thus reducing the potential growth of the Spanish economy. The activation of indexation clauses, in line with the high inflation rate recorded last year, implies that nominal wages have been growing at rates above the euro area average and above the expected inflation rate resulting in an increase of real wage growth. After recording 3¾% growth in 2009 on the back of falling real GDP, the pace of growth of real compensation per employee is projected to decelerate to 1¾% in 2010, which is still above productivity growth. This disconnection between wages and productivity developments is undermining the competitive position of the Spanish economy. In 2010, the REER based on unit labour costs is projected to appreciate by over 1¾%.
…productivity enhancement...
Productivity growth in Spain has been sluggish during the last decade (around ½% on average). This mirrors a relatively high allocation of investment to the construction sector and some low-productivity services. Although measured productivity is estimated to increase in 2009 by 5½%, thus above the euro area average, this is mainly due to the sharp contraction of the above-mentioned activities rather than a significant improvement in the structural drivers of total factor productivity. Consequently, over the medium term, once the adjustment of these low-productivity sectors is over, productivity gains might be more limited. Over the forecast period, productivity is projected to decelerate to around ¾ on average in 2010 and 2011. Therefore, the challenge is to enhance innovation and investment by firms, enhance permanent training of workers, and to encourage competition.
…and inflation control
Although inflation rates are estimated to be slightly negative in 2009, they are projected to return to positive territory next year, when inflation should reach ¾%. In this respect, the prices of oil and other commodities in international markets represent a significant source of uncertainty. In addition, inflation should reach 2% over the forecast horizon, thus not closing the competitiveness gap with the rest of the euro area, and reflecting poor functioning product markets, especially services.
Restoring the long term sustainability of public finances
The economic downturn, which has significantly reduced the tax intensity of the economy and significantly increased social protection needs, has led to both rapidly falling revenue-to-GDP and rising expenditure-to-GDP ratios, in turn resulting in a sharp deterioration in the public accounts in 2009. Total revenues are estimated to fall by 3 pps. of GDP, driven by a contraction of revenues from both direct and indirect taxes. This includes one-off revenues of ¾% of GDP. Total expenditures should increase by 4¼ pps. of GDP, mostly due to higher social transfers and higher government consumption. The Commission services project a deficit of 11¼% of GDP in 2009, compared to a deficit of 4.1% of GDP in 2008.
Graph II.9.2: Spain - General government accounts
-15
-12
-9
-6
-3
0
3
02 03 04 05 06 07 08 09 10 11
% of GDP% of GDP
30
40
50
60
70
80
Net lending (+)/net borrowing (-) according to EDPdefinition (lhs)Gross debt (rhs)
forecast
For 2010, the Draft Budget Law targets a deficit of 8.1%. Total revenues are budgeted to rise by nearly 1½ pp. of GDP, through both direct and indirect tax revenues. Total expenditures should increase by less than ½ pp. of GDP, mostly due to containment of public consumption and a reduction in public investment. Due to a less favourable growth scenario and a more prudent

European Economic Forecast, Autumn 2009
Table II.9.1:Main features of country forecast - SPAIN
2008 Annual percentage changebn Euro Curr. prices % GDP 92-05 2006 2007 2008 2009 2010 2011
GDP 1088.5 100.0 3.0 4.0 3.6 0.9 -3.7 -0.8 1.0 Private consumption 622.8 57.2 2.9 3.8 3.6 -0.6 -5.2 -0.5 0.9 Public consumption 211.1 19.4 3.6 4.6 5.5 5.5 4.3 1.7 2.2 Gross fixed capital formation 314.0 28.8 4.1 7.2 4.6 -4.4 -15.6 -8.4 -1.3 of which : equipment 80.3 7.4 4.2 9.9 9.0 -1.8 -25.4 -6.0 2.2 Exports (goods and services) 289.0 26.5 7.7 6.7 6.6 -1.0 -13.0 1.3 3.3 Imports (goods and services) 353.0 32.4 8.3 10.2 8.0 -4.9 -20.0 -2.7 2.2 GNI (GDP deflator) 1060.6 97.4 2.9 3.8 2.9 0.6 -3.9 -0.9 0.9 Contribution to GDP growth : Domestic demand 3.4 5.1 4.5 -0.7 -6.6 -1.9 0.7
Stockbuilding 0.0 0.3 -0.1 0.1 -0.1 0.1 0.0Foreign balance -0.4 -1.4 -0.9 1.4 3.0 1.0 0.3
Employment 2.1 3.3 2.8 -0.6 -6.6 -2.3 -0.4 Unemployment rate (a) 14.0 8.5 8.3 11.3 17.9 20.0 20.5 Compensation of employees/f.t.e. 4.0 4.0 4.5 6.1 3.7 2.2 2.5 Unit labour costs whole economy 3.1 3.3 3.8 4.6 0.5 0.6 1.1 Real unit labour costs -0.8 -0.8 0.5 2.0 0.4 0.1 -0.3 Savings rate of households (b) - - 10.6 12.9 18.7 17.3 16.7 GDP deflator 4.0 4.1 3.3 2.5 0.1 0.5 1.4 Harmonised index of consumer prices - 3.6 2.8 4.1 -0.4 0.8 2.0 Terms of trade of goods 0.4 0.6 0.1 -2.3 6.1 -0.6 -0.7 Trade balance (c) -4.5 -8.4 -8.6 -7.9 -3.9 -3.2 -3.2 Current account balance (c) -2.9 -9.0 -10.0 -9.5 -5.4 -4.6 -4.2 Net lending(+) or borrowing(-) vis-à-vis ROW (c) -2.0 -8.4 -9.6 -9.1 -4.5 -3.7 -3.3 General government balance (c) -2.7 2.0 1.9 -4.1 -11.2 -10.1 -9.3 Cyclically-adjusted budget balance (c) -2.3 1.7 1.2 -4.4 -10.0 -8.5 -8.1 Structural budget balance (c) - 1.7 1.2 -4.1 -9.3 -8.5 -8.1 General government gross debt (c) 56.3 39.6 36.1 39.7 54.3 66.3 74.0 (a) Eurostat definition. (b) gross saving divided by gross disposable income. (c) as a percentage of GDP.
98
assessment of measures on the revenue side, the deficit is projected to reach 10¼% of GDP in 2010. Based on the customary unchanged-policy assumption, the 2011 deficit is forecast at 9¼% of GDP. With such a downturn in GDP and high public deficits, the government debt is set to increase from 39¾% of GDP in 2008 to 74% of GDP by 2011. Thus, there is a risk of weakening the long-term sustainability of the public finances.
Public finances in Spain are likely to face a relatively long period of subdued tax revenues, reflecting from a less tax-friendly growth composition associated with the fading out of the asset boom, which is expected to be partially compensated for by the revenue-increasing discretionary measures included in the 2010 Budget Law. Social contributions may also be lower over the medium term because of shrinking employment. Enhancing total public receipts without distorting economic agents' incentives constitutes an important challenge.
The sharp increase in expenditures projected for this year and next reflects the functioning of automatic stabilisers, and especially higher unemployment benefits, as well as the higher burden of interest payments associated with rising debt levels. Given the likely negative impact of the crisis on potential growth and the associated rise in
long-term unemployment, promoting a swift transition into employment, while still reining in public expenditures and ensuring social cohesion, pose another challenge for the social protection system. In addition, structural problems linked to population ageing, especially with regards to the pension and health care systems, are set to undermine fiscal sustainability.
Against this setting, reducing budget deficits is key to boost confidence of economic agents and lead to a retrenchment of productive investment and consumption. Increasing public saving and improving competitiveness would enhance economic growth, and job creation, while mitigating the existing structural domestic and external imbalances.

10. FRANCE Storm successfully weathered, uneven recovery underway
99
Recession and policy response
The global financial crisis has dragged France into a recession that will have a protracted impact on its economy. GDP, which had been growing relatively robustly for several years, lost its dynamism in the course of 2008 and collapsed in the fourth quarter of that year and in the first quarter of 2009 (falling by -1.4% in both periods). In the second quarter of 2009 it picked up again by a strong +0.3%. The French banking system has been resilient, mainly due to the predominance of retail banking and relatively sound balance sheets in the corporate sector and the financial sector. Still, the confidence crisis in the banking sector has entailed a tightening of liquidity and lending conditions. Moreover, the free fall in world trade has taken its toll on the French economy.
Fiscal policy, together with the monetary policy implemented by the ECB, has aimed at containing the economic downturn and have added to the sizeable impact of automatic stabilisers. Specifically, a recovery plan amounting to around 1¼% of GDP has been implemented. Its impact was already starting to be felt in the second quarter of 2009, most notably in the automotive industry, and is expected to last until the beginning of 2010. The plan consists mainly of public investment and support to firms. Furthermore, cuts in the local business tax have recently been proposed, and these should encourage investment decisions from 2010 onwards. In addition, the French authorities have also announced an investment programme, which is aimed at financing spending to stimulate potential growth and, which will probably be financed through debt issuance (“Grand Emprunt”); its impact on public finances is still unknown. In the wake of massive state intervention and compared to the end of 2008, spreads are smaller, lending criteria are less tight and interest rates have gradually diminished.
The role played by automatic stabilisers
The recovery in economic activity in the second quarter of 2009 is set to last, with GDP growth positive throughout the second half of 2009. However, it is not likely to be so smooth in 2010 as a consequence of the interaction of the stabilisation of global trade and the stimulus measures, on the one hand, and the weak domestic
demand on the other. Overall, GDP is expected to fall by 2.2% in 2009. However, the recession has been less steep than in many neighbouring countries and the euro area as a whole. The resilience of domestic demand has played a prominent role: private consumption has slowed markedly but has remained positive (+0.3% q-o-q during the second quarter of 2009). Real disposable income is expected to increase slightly over 2009 given that the drop in earned income, notably due to the substantial foreseeable increase in unemployment and the drop in income from other sources (such as financial assets and real estate), should be more than compensated by the fall in inflation and the increase in public transfers. Whereas the relatively large size of the public sector compared to other euro area countries might have played a strong stabilising role in the current downturn, it could turn out to be a reason for a less dynamic pick-up. In particular, social contributions that help finance the state expenditures could weigh on the employment rate and harm competitiveness. Other factors can also help to explain the relative resilience of the economy, such as the smaller degree of openness and the size of the manufacturing sector, which is not as specialized in investment goods as is the case in other large neighbouring countries such as Germany or Italy.
Graph II.10.1: France - GDP growth and contributions
forecast
-5-4-3-2-101234
03 04 05 06 07 08 09 10 11
pps.
Private consumptionNet tradeDomestic demand excluding private consumptionGDP growth (y-o-y%)
Production has bottomed out and is showing signs of recovery, notably thanks to temporary measures in favour of the automotive industry in France but also in other EU countries. However, the uncertain demand outlook and the underutilisation of production capacities, combined with widespread
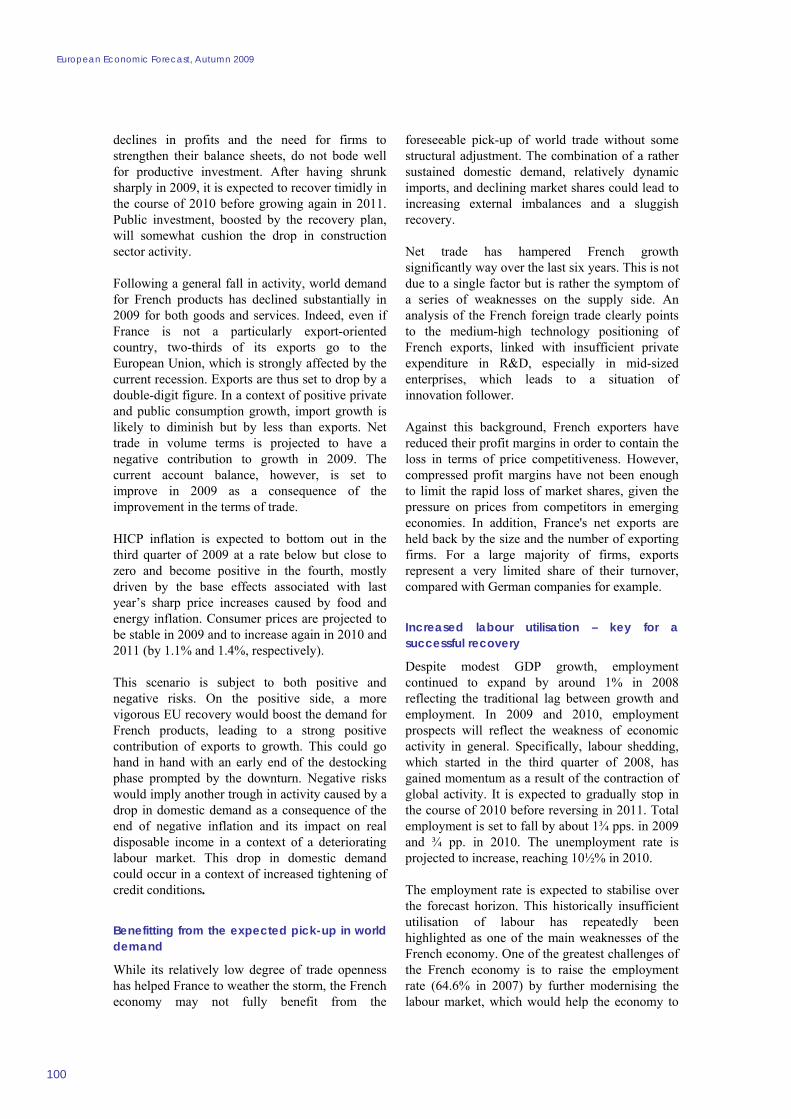
European Economic Forecast, Autumn 2009
100
declines in profits and the need for firms to strengthen their balance sheets, do not bode well for productive investment. After having shrunk sharply in 2009, it is expected to recover timidly in the course of 2010 before growing again in 2011. Public investment, boosted by the recovery plan, will somewhat cushion the drop in construction sector activity.
Following a general fall in activity, world demand for French products has declined substantially in 2009 for both goods and services. Indeed, even if France is not a particularly export-oriented country, two-thirds of its exports go to the European Union, which is strongly affected by the current recession. Exports are thus set to drop by a double-digit figure. In a context of positive private and public consumption growth, import growth is likely to diminish but by less than exports. Net trade in volume terms is projected to have a negative contribution to growth in 2009. The current account balance, however, is set to improve in 2009 as a consequence of the improvement in the terms of trade.
HICP inflation is expected to bottom out in the third quarter of 2009 at a rate below but close to zero and become positive in the fourth, mostly driven by the base effects associated with last year’s sharp price increases caused by food and energy inflation. Consumer prices are projected to be stable in 2009 and to increase again in 2010 and 2011 (by 1.1% and 1.4%, respectively).
This scenario is subject to both positive and negative risks. On the positive side, a more vigorous EU recovery would boost the demand for French products, leading to a strong positive contribution of exports to growth. This could go hand in hand with an early end of the destocking phase prompted by the downturn. Negative risks would imply another trough in activity caused by a drop in domestic demand as a consequence of the end of negative inflation and its impact on real disposable income in a context of a deteriorating labour market. This drop in domestic demand could occur in a context of increased tightening of credit conditions.
Benefitting from the expected pick-up in world demand
While its relatively low degree of trade openness has helped France to weather the storm, the French economy may not fully benefit from the
foreseeable pick-up of world trade without some structural adjustment. The combination of a rather sustained domestic demand, relatively dynamic imports, and declining market shares could lead to increasing external imbalances and a sluggish recovery.
Net trade has hampered French growth significantly way over the last six years. This is not due to a single factor but is rather the symptom of a series of weaknesses on the supply side. An analysis of the French foreign trade clearly points to the medium-high technology positioning of French exports, linked with insufficient private expenditure in R&D, especially in mid-sized enterprises, which leads to a situation of innovation follower.
Against this background, French exporters have reduced their profit margins in order to contain the loss in terms of price competitiveness. However, compressed profit margins have not been enough to limit the rapid loss of market shares, given the pressure on prices from competitors in emerging economies. In addition, France's net exports are held back by the size and the number of exporting firms. For a large majority of firms, exports represent a very limited share of their turnover, compared with German companies for example.
Increased labour utilisation – key for a successful recovery
Despite modest GDP growth, employment continued to expand by around 1% in 2008 reflecting the traditional lag between growth and employment. In 2009 and 2010, employment prospects will reflect the weakness of economic activity in general. Specifically, labour shedding, which started in the third quarter of 2008, has gained momentum as a result of the contraction of global activity. It is expected to gradually stop in the course of 2010 before reversing in 2011. Total employment is set to fall by about 1¾ pps. in 2009 and ¾ pp. in 2010. The unemployment rate is projected to increase, reaching 10½% in 2010.
The employment rate is expected to stabilise over the forecast horizon. This historically insufficient utilisation of labour has repeatedly been highlighted as one of the main weaknesses of the French economy. One of the greatest challenges of the French economy is to raise the employment rate (64.6% in 2007) by further modernising the labour market, which would help the economy to
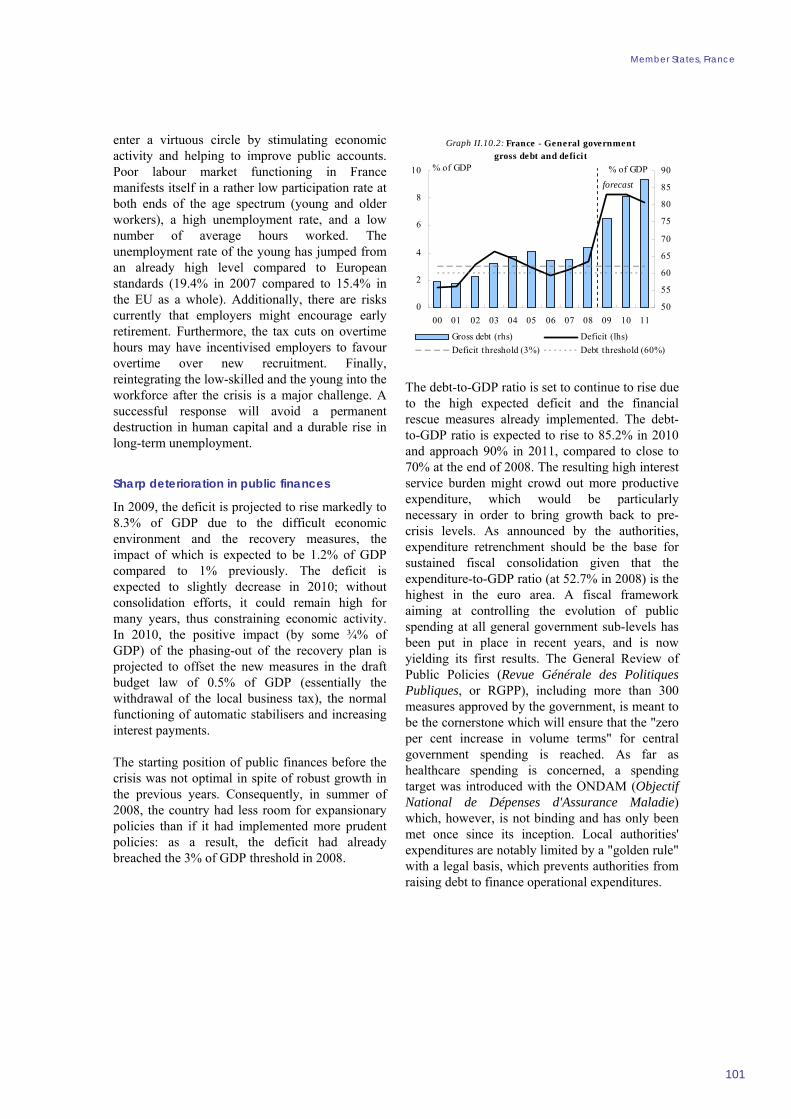
Member States, France
101
enter a virtuous circle by stimulating economic activity and helping to improve public accounts. Poor labour market functioning in France manifests itself in a rather low participation rate at both ends of the age spectrum (young and older workers), a high unemployment rate, and a low number of average hours worked. The unemployment rate of the young has jumped from an already high level compared to European standards (19.4% in 2007 compared to 15.4% in the EU as a whole). Additionally, there are risks currently that employers might encourage early retirement. Furthermore, the tax cuts on overtime hours may have incentivised employers to favour overtime over new recruitment. Finally, reintegrating the low-skilled and the young into the workforce after the crisis is a major challenge. A successful response will avoid a permanent destruction in human capital and a durable rise in long-term unemployment.
Sharp deterioration in public finances
In 2009, the deficit is projected to rise markedly to 8.3% of GDP due to the difficult economic environment and the recovery measures, the impact of which is expected to be 1.2% of GDP compared to 1% previously. The deficit is expected to slightly decrease in 2010; without consolidation efforts, it could remain high for many years, thus constraining economic activity. In 2010, the positive impact (by some ¾% of GDP) of the phasing-out of the recovery plan is projected to offset the new measures in the draft budget law of 0.5% of GDP (essentially the withdrawal of the local business tax), the normal functioning of automatic stabilisers and increasing interest payments.
The starting position of public finances before the crisis was not optimal in spite of robust growth in the previous years. Consequently, in summer of 2008, the country had less room for expansionary policies than if it had implemented more prudent policies: as a result, the deficit had already breached the 3% of GDP threshold in 2008.
Graph II.10.2: France - General government gross debt and deficit
forecast
0
2
4
6
8
10
00 01 02 03 04 05 06 07 08 09 10 11
% of GDP
50
55
60
65
70
75
80
85
90% of GDP
Gross debt (rhs) Deficit (lhs)Deficit threshold (3%) Debt threshold (60%)
The debt-to-GDP ratio is set to continue to rise due to the high expected deficit and the financial rescue measures already implemented. The debt-to-GDP ratio is expected to rise to 85.2% in 2010 and approach 90% in 2011, compared to close to 70% at the end of 2008. The resulting high interest service burden might crowd out more productive expenditure, which would be particularly necessary in order to bring growth back to pre-crisis levels. As announced by the authorities, expenditure retrenchment should be the base for sustained fiscal consolidation given that the expenditure-to-GDP ratio (at 52.7% in 2008) is the highest in the euro area. A fiscal framework aiming at controlling the evolution of public spending at all general government sub-levels has been put in place in recent years, and is now yielding its first results. The General Review of Public Policies (Revue Générale des Politiques Publiques, or RGPP), including more than 300 measures approved by the government, is meant to be the cornerstone which will ensure that the "zero per cent increase in volume terms" for central government spending is reached. As far as healthcare spending is concerned, a spending target was introduced with the ONDAM (Objectif National de Dépenses d'Assurance Maladie) which, however, is not binding and has only been met once since its inception. Local authorities' expenditures are notably limited by a "golden rule" with a legal basis, which prevents authorities from raising debt to finance operational expenditures.

European Economic Forecast, Autumn 2009
Table II.10.1:Main features of country forecast - FRANCE
2008 Annual percentage changebn Euro Curr. prices % GDP 92-05 2006 2007 2008 2009 2010 2011
GDP 1950.1 100.0 1.9 2.2 2.3 0.4 -2.2 1.2 1.5 Private consumption 1114.1 57.1 2.0 2.4 2.5 1.0 0.8 0.8 0.8 Public consumption 451.6 23.2 1.5 1.3 1.5 1.2 1.5 0.9 1.1 Gross fixed capital formation 427.2 21.9 2.0 4.1 6.5 0.6 -6.2 -1.6 2.2 of which : equipment 119.9 6.1 3.2 2.2 9.5 2.7 -11.8 -1.4 2.0 Exports (goods and services) 515.6 26.4 5.2 4.8 2.6 -0.2 -10.9 2.8 3.4 Imports (goods and services) 563.8 28.9 5.3 5.6 5.4 0.8 -9.5 2.2 3.7 GNI (GDP deflator) 1963.0 100.7 2.0 2.6 2.4 0.0 -2.2 1.2 1.5 Contribution to GDP growth : Domestic demand 1.9 2.5 3.1 1.0 -0.6 0.4 1.2
Stockbuilding 0.0 0.0 0.0 -0.3 -1.4 0.8 0.4Foreign balance 0.0 -0.3 -0.8 -0.3 -0.1 0.1 -0.1
Employment 0.6 1.0 1.5 0.6 -1.8 -0.9 0.4 Unemployment rate (a) 10.1 9.2 8.4 7.8 9.5 10.2 10.0 Compensation of employees/f.t.e. 2.6 3.2 2.5 2.7 1.2 1.5 1.5 Unit labour costs whole economy 1.2 2.0 1.8 2.8 1.6 -0.6 0.4 Real unit labour costs -0.3 -0.3 -0.7 0.3 -0.3 -1.8 -1.3 Savings rate of households (b) - - 15.3 15.1 16.2 16.1 16.1 GDP deflator 1.5 2.4 2.5 2.5 1.9 1.2 1.7 Harmonised index of consumer prices 1.8 1.9 1.6 3.2 0.1 1.1 1.4 Terms of trade of goods 0.0 -0.3 1.1 -1.8 6.8 0.0 0.3 Trade balance (c) 0.5 -1.5 -2.0 -2.7 -1.5 -1.4 -1.4 Current account balance (c) 0.8 -1.8 -2.3 -3.3 -2.3 -2.2 -2.4 Net lending(+) or borrowing(-) vis-à-vis ROW (c) 0.8 -1.8 -2.2 -3.3 -2.3 -2.3 -2.3 General government balance (c) -3.5 -2.3 -2.7 -3.4 -8.3 -8.2 -7.7 Cyclically-adjusted budget balance (c) -3.3 -2.9 -3.6 -3.8 -7.0 -7.0 -6.5 Structural budget balance (c) - -3.2 -3.7 -3.9 -7.0 -6.6 -6.5 General government gross debt (c) 56.7 63.7 63.8 67.4 76.1 82.5 87.6 (a) Eurostat definition. (b) gross saving divided by gross disposable income. (c) as a percentage of GDP.
102

11. ITALY After the crisis, a return to moderate growth
103
Long-standing weaknesses and a constrained policy response
While the low indebtedness of the household sector and relatively solid financial system have provided some shelter from the financial turmoil, deep-seated structural problems, giving rise to unsatisfactory productivity growth, had weakened the Italian economy long before the global downturn. A marked slowdown of economic activity was already underway before the deepening of the financial crisis. In the second quarter of 2008, real GDP started declining at an increasing pace, initially driven by the impact of surging commodity prices and subsequently by the collapse in global trade and rising risk aversion. Overall, between the first quarter of 2008 and the second quarter of 2009, the cumulative loss of real GDP was 6½%, similar to that of Germany but higher than in most other euro area countries.
The government's policy response to the crisis was constrained by Italy's fragile public finances, in particular its very high public debt. Efforts have been limited to reallocating public expenditure towards growth-enhancing items, while stemming the impact of the crisis on the most vulnerable groups. Even when the recovery from the current downturn starts to take hold, structural weaknesses, including very high public debt, will continue to weigh on the Italian economy. Unless these weaknesses are tackled, economic activity is set to return to a moderate growth path after the crisis.
Demand for goods hardest hit
Real GDP in 2008 and early 2009 mirrors developments in industrial output: manufacturing value-added shrank by around one-fifth between the beginning of 2008 and mid-2009. The contraction was particularly pronounced in the last quarter of 2008 and the first three months of 2009, while it eased in the second quarter. A significant rebound is anticipated in the third quarter. Accordingly, real GDP is projected to regain some strength in the second half of the year. Still, the depth of the output contraction so far means that for 2009 as a whole real GDP is set to record its steepest fall in decades.
The collapse in global demand is reflected in Italy's external performance. Despite some improvement expected in the second half of the year, export volumes are set to decline by more than 20% in 2009 as a whole. Demand for goods across most manufacturing sectors is being hard hit. Exports of services have been declining as well, although at a less marked pace. The projected significant fall in domestic demand in 2009, and particularly the substantial retrenchment in investment, is also affecting imports. However, the expected drop in import volumes in 2009 will not fully offset the export drag on the economy. This implies a negative contribution of net exports to growth and a sharp reduction in the already relatively low degree of openness of the economy. Still, the assumed lower commodity prices should lead to an improvement in the trade balance.
Graph II.11.1: Italy - Real GDP levels and main components
75
80
85
90
95
100
105
08Q3 09Q1 09Q3 10Q1 10Q3 11Q1 11Q3
GDP Private consumptionInvestment ExportsImports
forecast
index (2007Q4 = 100)
The plunge in external demand has triggered a sharp contraction in investment. High uncertainty about the pace of the international recovery and still moderate growth in domestic demand are expected to lead firms to continue scaling back their investment plans throughout the second half of 2009. For the year as a whole, investment expenditure is projected to fall by over 12% in volume terms as the huge contraction of private investment will be only partly offset by the planned acceleration of government capital spending. Equipment investment is set to drop very sharply on the back of historically low capacity utilisation and deteriorating profits. After a decade of continuous expansion supported by favourable financial conditions, investment in residential building declined moderately in 2008 and a more

European Economic Forecast, Autumn 2009
104
substantial drop is expected in 2009. The fading away of demand and tighter financial conditions have also implied a significant reduction in firms' stockbuilding in 2008 and 2009.
Private consumption had already fallen in the second quarter of 2008 due to the loss of purchasing power related to the surge in commodity prices. It contracted again in the final quarter of 2008 and the first quarter of 2009 because of the high uncertainty brought about by the financial crisis. The tightening of spending on durable goods was followed by a decrease in expenditure on non-durable goods on the back of strengthened precautionary savings. Several measures taken by the government since October 2008, such as the "social card" to support the daily purchase of consumables, the "family bonus" one-off transfer to poorer households and the expansion of wage-supplementation schemes to additional categories of workers, have all helped to underpin household income. Thanks also to tax incentives supporting the purchase of durable goods, in particular vehicles, private consumption recorded a mild recovery in the second quarter of 2009. This recovery is set to gather strength in the rest of the year, carrying a moderate positive growth impulse into 2010.
Private consumption and exports to drive the recovery
In 2010 and 2011, economic activity is projected to recover gradually. The improvement in private consumption over the forecast horizon relies on various factors. First, the household sector is expected to reduce precautionary savings made over 2008-2009 as the global financial crisis fades away. Second, the still marginal role of pension funds and the absence of a housing bubble are expected to help minimise negative wealth effects on aggregate consumption. Finally, purchasing power should recover after the losses of 2008, thanks to the moderate inflation anticipated for the 2009-2011 period.
Investment expenditure is expected to improve over 2010, also boosted by a tax break for equipment investment ending in June 2010 and despite the projected reduction in public investment. It is expected to record positive growth in 2011 as the increase in corporate investment is projected to more than offset the further drop in government capital spending.
The assumed increase in demand from Italy’s trading partners is set to provide an impulse to exports. Imports are expected to regain even more strength, but the projected improvement in the terms of trade would allow the trade balance to remain broadly stable in both 2010 and 2011. The current account deficit is set to remain at around 2½% of GDP over the forecast horizon.
Risks to the productive base
Export growth is expected to continue to lag behind global demand over the forecast horizon also due to Italy's failure to recoup the heavy losses in cost and price competitiveness accumulated since the start of this decade. The size of the market share loss also depends on the ability of firms to survive the crisis. The Italian manufacturing sector has undertaken a deep restructuring process in recent years to face increasing global competition, in particular in traditional and medium-to-high technology products. Non-price competitiveness has been improving, namely in terms of product quality. The global financial crisis could jeopardise the ongoing restructuring process as export–oriented firms are hit hard. Having heavily invested in opening up internationally and starting from a relatively low capitalisation, some firms have been taking on debt and now have to cope with both tighter financial conditions and the fall in demand. The closure of firms that would have the capability to compete and expand when the global economy recovers could negatively affect the potential growth of the Italian economy.
Resilient employment
In 2008, full-time equivalent employment declined by 0.1%, combining a 1.5% contraction in self-employment with a 0.5% expansion of wage and salary earners. The diverging dynamics of value-added (-0.9% in 2008) and employment continued in the first half of 2009, intensifying the deterioration in productivity already underway. Going forward, this trend is expected to reverse. While value-added is forecast to recover slowly, further job losses are expected in the rest of 2009 and in 2010 because of the assumed lagged impact of the sharp downturn onto the labour market.
In response to the crisis, access to the wage supplementation fund (CIG) has been extended to additional categories of workers. The scheme mitigates the impact of the downturn on headcount

Member States, Italy
105
employment by subsidising part of the income loss due to reduced hours worked. The forecast output recovery, notably in manufacturing, is expected to translate first into a rebound of productivity, then into an expansion of hours worked, and only later into headcount employment increases. The asymmetry between permanent employees and semi-independent workers (who have lower or no CIG coverage) concentrates the risk of unemployment on the latter. Data from the labour surveys show that the self-employed and fixed-term employees account for most of the job losses in the first half of 2009. By allowing employees to keep their contractual bond with the employer, thus reducing the risks of labour shedding during a recession, the CIG scheme has so far attenuated the impact of the crisis on household labour incomes and helped to preserve human capital in the hardest-hit industries. Still, over-reliance on this scheme may delay the needed labour reallocation to more productive industries.
Since the second half of 2008, the evolution of the labour force has almost matched the fall in headcount employment, in particular in the poorer Southern regions where discouragement over the prospects of finding a job is more widespread. As a consequence, the unemployment rate has increased only moderately so far, to reach 7.4% in the second quarter of 2009. The regularisation of immigrant workers, most of them in-home caregivers, in the final part of the year should have a favourable impact on the unemployment rate. However, the rate is set to continue increasing in 2010 due to the assumed further decline in employment, and to stabilise in 2011.
After the 3.3% growth recorded in 2008, wages per full-time employee are set to moderate in 2009, while outpacing inflation also because of lagged contract renewals. As of 2010, the application of the newly-reformed bargaining framework would result in wage increments consistent with inflation measured excluding imported energy goods at the national level. The productivity-related pay component is to be agreed at the firm level. By better aligning wages to productivity developments, this new system is expected to exert a positive influence on unit labour costs, after several years of relatively steep rises.
Headline inflation is projected to decelerate to 0.8% on average in 2009, squeezed by the fall in energy prices and the compression of business profit margins. It is then projected to increase, to
2% in 2011, further widening the differential with the euro area. Core inflation is anticipated to remain below 2% over the forecast horizon.
The crisis takes its toll on public finances
The government's response to the crisis has had to be carefully balanced with the need to avoid a substantial deterioration in public finances, given the very high government debt in a context of increased global risk aversion. Measures taken to date to support low-income groups and key industrial sectors have been financed mainly by reallocating existing funds.
Graph II.11.2: Italy - Government revenues and primary expenditure excluding one-offs
-3-2-10123456789
02 03 04 05 06 07 08 09 10 11
Total revenues excluding one-offsPrimary expenditure excluding one-offs
forecast
y-o-y%
Even so, the government deficit is forecast to widen markedly to 5.3% of GDP in 2009 (from 2.7% in 2008) and to remain at around that level in 2010 and 2011. Both sides of the government account contribute to the deficit increase. Primary expenditure is set to rise by more than 4½% in 2009, significantly faster than planned in the stability programme update submitted in February 2009. In particular, public wage growth is set to continue outpacing inflation. In addition, intermediate consumption is still increasing substantially despite the budgetary measures adopted to contain it. Social transfers are particularly dynamic in 2009 due to a combination of the indexation of pensions to previous-year inflation, one-off transfers to poor households and the extended coverage of the wage supplementation fund. Capital spending is poised to rise by some 13%, reflecting recovery measures that aim to bring forward some investment plans. The only significant item expected to decrease is interest expenditure, which is benefitting from historically low short-term interest rates. While the deep downturn in 2009 has derailed the three-year budgetary consolidation plan adopted in summer

European Economic Forecast, Autumn 2009
Table II.11.1:Main features of country forecast - ITALY
2008 Annual percentage changebn Euro Curr. prices % GDP 92-05 2006 2007 2008 2009 2010 2011
GDP 1572.2 100.0 1.3 2.0 1.6 -1.0 -4.7 0.7 1.4 Private consumption 928.8 59.1 1.3 1.3 1.2 -0.9 -1.5 0.8 1.3 Public consumption 318.1 20.2 0.9 0.5 1.0 0.6 1.2 0.4 0.3 Gross fixed capital formation 328.4 20.9 1.4 2.9 2.0 -3.0 -12.2 0.1 2.4 of which : equipment 143.2 9.1 2.0 5.1 3.0 -4.6 -19.8 0.9 4.6 Exports (goods and services) 453.4 28.8 4.3 6.2 4.6 -3.7 -20.2 1.6 3.7 Imports (goods and services) 461.2 29.3 3.8 5.9 3.8 -4.5 -15.7 2.0 3.9 GNI (GDP deflator) 1548.1 98.5 1.4 2.2 1.1 -1.9 -4.5 0.7 1.4 Contribution to GDP growth : Domestic demand 1.2 1.5 1.3 -1.0 -3.2 0.6 1.3
Stockbuilding 0.0 0.5 0.0 -0.3 -0.2 0.2 0.1Foreign balance 0.1 0.1 0.2 0.3 -1.2 -0.1 -0.1
Employment 0.2 1.5 1.0 -0.1 -2.6 -0.4 0.4 Unemployment rate (a) 9.8 6.8 6.1 6.8 7.8 8.7 8.7 Compensation of employees/f.t.e. 3.4 2.7 2.2 3.3 1.7 1.6 1.9 Unit labour costs whole economy 2.3 2.2 1.5 4.2 4.0 0.5 0.9 Real unit labour costs -0.9 0.3 -0.8 1.4 1.6 -1.3 -0.9 Savings rate of households (b) - - 14.6 15.1 15.4 14.8 14.7 GDP deflator 3.2 1.8 2.4 2.8 2.3 1.8 1.8 Harmonised index of consumer prices 3.1 2.2 2.0 3.5 0.8 1.8 2.0 Terms of trade of goods -0.2 -3.4 1.5 -2.6 7.9 0.4 0.2 Trade balance (c) 1.9 -0.7 0.2 0.0 0.3 0.2 0.2 Current account balance (c) 0.6 -2.0 -1.8 -3.0 -2.4 -2.4 -2.4 Net lending(+) or borrowing(-) vis-à-vis ROW (c) 0.7 -1.9 -1.7 -2.9 -2.3 -2.3 -2.3 General government balance (c) -4.8 -3.3 -1.5 -2.7 -5.3 -5.3 -5.1 Cyclically-adjusted budget balance (c) -4.5 -4.3 -2.9 -3.4 -3.5 -3.7 -3.8 Structural budget balance (c) - -3.9 -3.1 -3.6 -3.7 -3.7 -3.7 General government gross debt (c) 112.1 106.5 103.5 105.8 114.6 116.7 117.8 (a) Eurostat definition. (b) gross saving divided by gross disposable income. (c) as a percentage of GDP.
106
2008, a marked slowdown in expenditure dynamics is forecast for 2010 and 2011, assuming a return to the planned consolidation path. Capital expenditure is set to decrease in both years, while modest increases are projected for current primary expenditure. Interest expenditure is expected to rise, also due to the expanding debt.
On the revenue side, a sizeable contraction is expected in 2009 in both direct and indirect taxes. Direct tax revenues are set to be dragged down by plummeting corporate profits, whereas personal income taxes are expected to decrease only slightly. Indirect taxes are also forecast to drop, driven by the plunge in VAT recorded in the first half of 2009. This drop is much sharper than implied by developments of its most relevant tax base, i.e. nominal private consumption, and does not seem to be fully explained by the shift towards less-tax-rich consumption items. Sizeable one-off capital taxes (0.4% of GDP) related to the revaluation of companies' assets will mitigate the fall in total revenue. The one-off proceeds of the extraordinary tax on repatriated assets illegally held abroad could further raise capital revenues, but the size of this effect is not yet known. Going forward, indirect tax revenues are assumed to grow broadly in line with nominal consumption in 2010 and 2011, while the direct tax base would take longer to return to pre-crisis levels, especially in
the corporate component. The primary balance is projected to turn negative in 2009 and to return to a balanced position only in 2011. Even adjusting for the cycle, the primary balance is set to deteriorate in 2009 relative to 2008.
The gross government debt-to-GDP ratio is expected to climb by almost 9 pp. in 2009, to around 114.5%, and to continue rising over the forecast horizon, to around 118% in 2011. The bulk of the increase in 2009 is due to falling nominal GDP. The projected negative primary balance accounts for an additional ½ pp. increase in the debt-to-GDP ratio, while the voluntary use of government funds to recapitalise the banking sector is assumed to contribute some ¼ pp. of GDP, i.e. less than made available for this purpose. Looking forward, the interaction between high debt-service requirements and low potential growth underline the importance of raising the primary balance so as to put the very high debt ratio on a declining path once again.

12. CYPRUS Ongoing economic adjustment, slow recovery ahead
107
Declining activity and policy response
After more than a decade of sustained and strong expansion, the Cypriot economy has decelerated sharply. Notwithstanding the robust growth of 3¾% recorded in 2008 as a whole, the slowdown of economic activity started in the third quarter of last year and gained momentum in the first half of the current year. An adverse external economic environment, high household indebtedness together with tight lending conditions, restructuring corporate balance sheets and deteriorating confidence weighed on growth. The crisis has also highlighted the accumulation of a high external imbalance, a particularly oversized housing sector and competitiveness losses. These factors set the stage for the structural adjustment of the economy.
GDP contracted in the second quarter of 2009. This trend is expected to continue until the year's end and, for the first time in 30 years, Cyprus is set to record a negative growth rate (-¾%). The downturn is expected to take a heavy toll on public finances: deficits exceeding 3% of GDP are projected over the forecast period, reflecting both lower tax elasticities and higher expenditure. As a result, the long-term sustainability prospects for public finances are deteriorating. The labour market is also expected to suffer, especially the labour–intensive sectors.
Graph II.12.1: Cyprus - Public Finances
-8
-4
0
4
8
03 04 05 06 07 08 09 10 1140
50
60
70
80
Deficit: general government (lhs)Deficit excluding interest: general government (lhs)Cyclically-adjusted balance (lhs)Consolidated gross debt (rhs)
forecast
% of GDP% of GDP
As a response to the crisis, the Cypriot government acted in a timely manner, adopting some fiscal stimulus and structural measures amounting to 1 ½% of GDP. The stimulus package was essentially
addressed to construction (1 ¼% of GDP) and tourism (¼% of GDP) Some support measures without a direct impact on the deficit were also targeted to households.
Regarding the financial sector, Cypriot banks have not been exposed to toxic assets, mainly thanks to strict supervision by the Central Bank. However, in order to underpin confidence in the banking system, the government raised the deposits guarantee and issued treasury bills to provide liquidity to the banking system.
Subdued growth weighs on labour market
The outlook envisages a slow economic recovery in 2010 and 2011, with Cyprus lagging behind the EU average in both years. GDP is projected to stall in 2010, reflecting mainly sluggish world demand and depressed private consumption and investment. Specifically, private consumption growth is likely to be subdued over the forecast period despite nominal wage growth above inflation and a falling debt-servicing burden consistent with declining interest rates. This is due to a high household debt burden, tight financial conditions and downbeat consumer sentiment in an uncertain environment. Prospects for gross fixed capital formation are also likely to remain muted over the forecast years. Given the economic outlook in Cyprus' main trading partners, foreign demand for dwellings by non-residents should remain weak. Domestic demand for housing and activity in real estate is also expected to stay subdued, on the back of high indebtedness and high growth of prices in recent years. Although infrastructure projects, including private and Public Private Partnerships (PPP), should support investment somewhat, it is unlikely that they would be sufficient to fully offset the impact of the contraction in housing on total investment. Investment in equipment, largely associated with construction, is also set to follow a similar trend.
As regards the external sector, imports should shrink in 2010 and recover only in 2011 due to the slowdown in final demand. Exports of both goods and services, particularly tourism, are set to recover somewhat in view of an improving economic outlook in Cyprus’ main trading partners. All in all, the contribution of net exports

European Economic Forecast, Autumn 2009
108
to GDP growth should be positive in both 2010 and 2011.
The subdued economic outlook should weigh particularly on labour-intensive sectors in 2010, especially construction and tourism. Accordingly, employment is projected to decline while unemployment should rise to historically high levels, reaching 6½% in 2010.
Overall, the balance of risks appears to be neutral. Higher total demand would hinge on a faster recovery of the economies of Cyprus' major trading partners. Also, a reduction in interest rate spreads and in banking lending rates could underpin private consumption and soften the adjustment of the housing sector. On the negative side, a sharper-than-expected fall of external demand would certainly weigh on economic activity more than projected in the baseline scenario. At the same time, a tightening of credit conditions coupled with high indebtedness of private agents could lead to a sharper fall in investment and consumption. Furthermore, in a context of weak growth in both real and nominal terms, the external constraint becomes more severe. Eventually, it could lead to either higher cost of debt-financing or higher savings, in each case affecting adversely economic activity.
Restoring the external balance should underpin a sustained recovery
Within this economic outlook, the challenge for the Cypriot economy is to return to a sustained convergence path. This could be tackled more successfully if the recovery were to lead to the correction of the imbalances, in a context of higher potential growth.
Due to the strong deceleration of activity in 2009 there was a significant, yet partial, correction of the external deficit. However, as a percentage of GDP, it is set to remain at two-digit levels. In the medium term, the deficit should continue to improve but at a much more moderate rate, reflecting lower GDP growth. In particular, the current account deficit should still reach 7¾% of GDP by 2011. As a result, the external imbalance is likely to weigh on economic growth over the medium-term. Growing public sector dissavings would need to be financed by either foreign debt or domestic private savings. Thus, the adjustment of the current account imbalance would require either higher cost of debt-financing or higher savings
from the private sector. The latter would imply lower output growth through lower private consumption or investment (crowding-out effect).
The external imbalance to a certain extent reflects a deterioration of competitiveness, partly due to a weak response of wages in both the public and private sectors to the current recession. In particular, nominal compensation per employee is estimated to increase by about 1¾% in 2009, which exceeds productivity growth. Furthermore, even with the prospect of no or minimal wage growth in the forthcoming sectoral collective agreements, the wage drift and indexation (COLA), which adjusts wages based on inflation in the previous 6 months, should contribute to a sustained wage growth, especially in the second half of the forecast period. In line with slowing activity, productivity growth is expected to slump. This, coupled with a minor acceleration in wages, is set to keep unit labour costs rising modestly, yet higher than the euro area. All in all, the disassociation between wages and developments in productivity is undermining the competitiveness of the Cypriot economy.
Although the inflation rate is estimated to be very low in 2009, a rapid return to the trend rate of 2½% is envisaged over the forecast horizon. This should be driven by developments in oil prices, on which Cyprus is highly dependent, and a powerful base effect. Core inflation should remain above the euro area average, mainly reflecting pressures in product markets, especially services.
Deterioration in public finances
Public finances in Cyprus are likely to face a relatively prolonged period of low tax elasticities, reflecting not only lower growth but also a less tax-friendly growth composition linked to the fading out of the asset boom. The projected increase of expenditures for this year and next largely reflects the functioning of automatic stabilisers and interest payments associated with increasing debt levels and the continuation of largely untargeted social transfers.
While the Cypriot budget balance was in surplus during the last two years, it is expected to have turned into a deficit of about 3½% in 2009 compared to a 0.9% surplus in 2008, due to both lower than anticipated revenue and to higher-than-planned expenditure. Revenue appears to be declining across the board, reflecting the downturn

Member States, Cyprus
Table II.12.1:Main features of country forecast - CYPRUS
2008 Annual percentage changemio Euro Curr. prices % GDP 92-05 2006 2007 2008 2009 2010 2011
GDP 16948.5 100.0 4.4 4.1 4.4 3.7 -0.7 0.1 1.3 Private consumption 11668.3 68.8 - 4.5 8.2 7.0 -1.4 0.3 0.6 Public consumption 3091.8 18.2 - 7.4 0.1 8.7 8.5 3.1 2.4 Gross fixed capital formation 3952.2 23.3 - 10.4 10.4 9.8 -11.9 -9.0 0.9 of which : equipment 1088.9 6.4 - 15.3 4.5 21.7 -19.0 -14.0 1.5 Exports (goods and services) 7978.3 47.1 - 3.9 7.2 1.1 -15.0 0.7 3.4 Imports (goods and services) 9904.9 58.4 - 6.6 12.5 9.9 -15.9 -1.5 2.4 GNI (GDP deflator) 15728.6 92.8 4.2 3.5 3.4 2.0 1.0 1.8 2.6 Contribution to GDP growth : Domestic demand - 6.2 7.5 8.3 -2.2 -1.0 1.1
Stockbuilding - -0.5 0.2 0.7 -0.8 0.0 0.0Foreign balance - -1.6 -3.2 -5.3 2.3 1.1 0.2
Employment - 1.8 3.2 2.6 -0.4 -0.1 0.6 Unemployment rate (a) - 4.6 4.0 3.6 5.6 6.6 6.7 Compensation of employees/head - 3.0 2.1 4.0 2.0 1.8 2.2 Unit labour costs whole economy - 0.6 0.9 3.0 2.3 1.6 1.5 Real unit labour costs - -2.3 -2.4 -1.8 -0.2 -1.6 -1.5 Savings rate of households (b) - - - - - - - GDP deflator 3.2 3.0 3.4 4.8 2.5 3.2 3.0 Harmonised index of consumer prices - 2.2 2.2 4.4 0.8 3.1 2.5 Terms of trade of goods - 4.3 0.1 -2.6 5.4 -0.3 -0.3 Trade balance (c) - -27.2 -30.2 -32.7 -24.2 -23.6 -24.1 Current account balance (c) - -7.0 -12.0 -18.0 -11.6 -9.0 -7.7 Net lending(+) or borrowing(-) vis-à-vis ROW (c) - -6.8 -11.9 -17.9 -11.5 -8.8 -7.5 General government balance (c) - -1.2 3.4 0.9 -3.5 -5.7 -5.9 Cyclically-adjusted budget balance (c) - -1.4 2.6 -0.2 -3.4 -5.2 -5.6 Structural budget balance (c) - -1.4 2.6 -0.2 -4.7 -5.2 -5.6 General government gross debt (c) - 64.6 58.3 48.4 53.2 58.6 63.4 (a) Eurostat definition. (b) gross saving divided by gross disposable income. (c) as a percentage of GDP.
109
of economic activity, particularly in the construction and real estate sector coupled with the fading out of the asset boom. Social contributions are the only revenue item to post positive growth, benefiting from the rise of contribution rates as part of the pension reform adopted this year. One-off revenues associated with the penalty imposed by the Competition Authority on oil companies, corporate tax obligations and the shortening of payment period for VAT account for almost ¾% of GDP. One-off expenditure cuts associated with budgeted appropriations for ministries account for an additional ½% of GDP.
For 2010, the Draft Budget Law targets a deficit of 4½% of GDP, on the basis of an estimated deficit outcome for 2009 of 2.9% of GDP. The 2010 Draft Budget does not incorporate any additional measures to the previous year thus foreseeing a continuation of the 2009 policies. Although the Draft Budget mentions a series of supplementary measures that could be taken during the course of the year as a means to restrain the budgetary deficit in 2010 below 3%, they are not accounted in the budget target. These measures are namely aimed at fighting tax evasion, at a real property amnesty (one-off), freezing public sector employment for the next 18 months and improving the state's cash management.
The Commission services project a deficit of 5¾% of GDP for 2010, reflecting the base effect of a higher estimated deficit for 2009 (3½%), a somewhat gloomier macroeconomic scenario and a more prudent assessment of measures on the revenue side. In the absence of information on the modalities of implementation of the potential extra-budget measures, this deficit forecast does not take them into account.
Based on the customary no-policy-change scenario assumption, the deficit should increase further to almost 6% of GDP in 2011. This projected fiscal deterioration is driven by rising expenditure, which is only partly offset by moderately increasing revenues. With weak GDP growth and an increasing deficit, the debt-to-GDP ratio will raise and exceed 60% of GDP by 2011, thus weakening the long-term sustainability of the public finances.

13. LATVIA Bulk of output correction over, public finances and the economy still reshaping
110
A dramatic end to the boom
For several years before the financial crisis, Latvia registered the highest GDP growth in the EU. Double-digit output growth was driven by a credit-fuelled housing boom, which was based on high expectations about households' future income potential. On the other hand, the supply side of the economy was not able to keep up with the surging domestic demand, leading to an acute shortage of labour, high inflation, a large trade deficit and a deterioration in cost competitiveness. The structure of the economy, including investment, shifted towards non-tradeables.
The reversal of the credit cycle started in 2007 and the adjustment process was rather gradual until mid-2008. However, when risk aversion in global financial markets became extreme later in the year, funding constraints - apparent when a domestic bank ran into trouble - forced the government to turn to international institutional financing. Credit growth in the private sector turned negative in November 2008 and has remained so. The deleveraging process was exacerbated by credit rating agency downgrades, deepening the downturn on the property market and causing financing difficulties even for firms with viable business models. As risk perception towards Latvia increased, companies' ability to sign foreign contracts was adversely affected. The provision of international financial assistance - conditional on the implementation of the necessary fiscal consolidation as well as financial system and structural reforms - helped to stabilise confidence, and provided the needed liquidity to the Latvian economy.
At the end of 2008, on top of its domestic market woes, Latvia also suffered a large export shock following the temporary collapse of global trade. The double-hit from external and internal demand led to an unprecedented 11% quarterly output loss in the first quarter of 2009. Economic sentiment hit an all-time low in March, after the prime minister resigned following loss of support from the governing coalition. Nevertheless, in the second quarter of 2009, industrial output and exports started to show signs of stabilisation and GDP fell by a relatively modest 0.8% from the preceding quarter. Market sentiment improved after the
conditions of the international financial assistance programme were reviewed, taking into account the performance in the first half of the year, and after a significant supplementary budget to address the unsustainable trends. Nevertheless, uncertainties in the implementation of the programme at times created volatility in confidence vis-à-vis the country's commitment to ensure the needed adjustment. Recent business and consumer survey results and monthly industrial output data suggest a continuation of the relative stabilisation trend as regards output, although monthly retail sales and tax receipts data point to a further significant fall in domestic demand. As regards asset price adjustment, by mid-2009 the price of standard Riga apartments had fallen to one third of mid-2007 peak levels. Although the current property price level appears to be in line with long-term local income potential, an imminent revival of the real estate market is not in sight.
Graph II.13.1: Latvia - GDP growth and contributions
-35
-25
-15
-5
5
15
25
00 01 02 03 04 05 06 07 08 09 10 11
y-o-y%
Domestic demand InventoriesExternal balance GDP growth
forecast
Output trough still to be reached, but adjustment ongoing
Despite the massive correction already experienced in domestic demand, it is expected to contract still further due to the deleveraging process in the financial sector, the weakness of the labour market, the down-scaling of industries which depended on previously above-potential domestic demand and the ongoing fiscal consolidation process. The recovery of private investment hinges on a clearer view on public finances and in particular, future tax policy. It appears fair to assume that further specification of

Member States, Latvia
111
these measures would be accompanied by positive confidence effects, which could ease financing conditions and would counterbalance the negative impact of the measures themselves. While uncertainty on the timing and composition of fiscal consolidation measures represent a risk which may weigh on domestic demand, public investment will continue to provide some cushion, given that EU-funded projects are safeguarded under the fiscal consolidation programme and their faster implementation is being actively sought. Further risks are related to the financial sector's ability to provide credit to the economy, notably against the background of increasing non-performing loans.
A sizeable correction in the external sector
The domestic cost adjustment, together with efforts to shift economic resources to the tradable sector, should put the economy on a stronger footing for a sustainable export-led recovery from end-2010. Latvia can also build on its relatively favourable fundamentals. Over the past decade the country performed fairly well in gaining export market shares, with improvements in its product composition and with services exports being particularly dynamic. The product and geographical diversification of Latvian exports has also improved considerably. Future export prospects could also be supported by Latvia's large absolute cost advantage relative to other EU countries. However, this latter potential could be best exploited with productivity-increasing capital investment, which requires a stable business environment, with predictable tax policy.
Marking a sharp turnaround compared to the situation of only a year earlier, when the current account balance was in double-digit deficit, the overall external balance turned into a sizeable surplus in the second quarter. This reflected inter alia the recording of high losses in the banking sector, advance payments by the EU funds and a balance in goods and services trade. The current account is projected to be in surplus over the forecast period, reflecting sustained transfers from EU funds and subdued imports and further losses of foreign banks due to the prolonged weakness in the economy. The ratio to GDP of net external liabilities is set to increase during the recession.
Real incomes hit by falling wages and rising unemployment
Labour market conditions are changing dramatically. Falling employment and hours worked per employee, plus some nominal reduction of full-time equivalent gross wages helped firms to absorb the adjustment during the crisis. Gross wages fell by 1% in the second quarter from its level a year earlier, with private sector wages broadly unchanged and public sector wages falling by over 6%. On a seasonally-adjusted basis, private sector wages already fell in the first half of the year, at an annualised rate of around 5-6%. As official wage statistics are blurred by composition changes (initially, mainly the lower-paid employees entered unemployment) and by the large grey economy (it being easier to cut the unofficial part of the wages, there being no need to rewrite contracts and also because a large share of the workforce is reported at the minimum wage), a faster adjustment may have taken place.
The labour market adjustment is projected to continue at its current high pace with unemployment rising rapidly. However, the impact of falling employment should be reduced by an expected fall in the participation rate and by higher outward migration. Compensation of employees per head is set to fall markedly in both 2009 and 2010, with the driver shifting from hours worked to nominal wage reduction. Latvia's real effective exchange rate – which, given fixed exchange rate vis-à-vis the euro, appreciated during the crisis due to the depreciation of partner currencies - depreciated during the summer of 2009. This trend is expected to continue as disinflationary forces in Latvia exert their full effect. However, it is still too early to conclude when the objective of realigning wages with productivity through internal price adjustment will be attained.
Graph II.13.2: Latvia - O utput gap, inflation, unit labour cost
-22-16-10
-428
14202632
99 00 01 02 03 04 05 06 07 08 09 10 11
y-o-y%
-12
-6
0
6
12
18
Output gap (rhs) HICP (lhs) ULC (lhs)
forecast
% of potential GDP

European Economic Forecast, Autumn 2009
Table II.13.1:Main features of country forecast - LATVIA
2008 Annual percentage changemio LVL Curr. prices % GDP 92-05 2006 2007 2008 2009 2010 2011
GDP 16274.6 100.0 1.1 12.2 10.0 -4.6 -18.0 -4.0 2.0 Private consumption 10065.4 61.8 - 21.2 14.8 -5.4 -22.0 -11.0 0.5 Public consumption 3208.0 19.7 - 4.9 3.7 1.5 -9.0 -10.3 -4.0 Gross fixed capital formation 4777.3 29.4 - 16.4 7.5 -15.6 -34.0 -12.0 3.0 of which : equipment - - - - - - - - - Exports (goods and services) 6792.2 41.7 - 6.5 10.0 -1.3 -17.5 1.5 5.0 Imports (goods and services) 8920.8 54.8 - 19.4 14.7 -13.6 -35.0 -9.7 2.6 GNI (GDP deflator) 16030.3 98.5 0.9 10.3 9.6 -2.8 -11.2 -9.6 -1.3 Contribution to GDP growth : Domestic demand - 20.2 13.5 -9.3 -27.9 -12.3 0.4
Stockbuilding - 0.7 1.6 -3.7 -3.4 3.0 0.5Foreign balance - -8.7 -5.1 8.5 13.3 5.3 1.1
Employment -2.2 4.7 3.6 0.7 -11.9 -5.6 -0.2 Unemployment rate (a) 12.9 6.8 6.0 7.5 16.9 19.9 18.7 Compensation of employees/head - 23.6 34.8 16.7 -12.0 -8.0 1.0 Unit labour costs whole economy - 15.3 27.0 23.2 -5.4 -9.5 -1.2 Real unit labour costs - 4.9 5.6 6.8 -3.4 -4.8 0.1 Savings rate of households (b) - - - - - - - GDP deflator 31.9 9.9 20.3 15.4 -2.1 -5.0 -1.3 Harmonised index of consumer prices - 6.6 10.1 15.3 3.5 -3.7 -1.2 Terms of trade of goods - 0.0 7.2 0.6 0.0 -1.0 0.0 Trade balance (c) -13.0 -25.6 -23.9 -17.0 -7.4 -4.6 -4.3 Current account balance (c) -3.3 -22.5 -22.5 -13.0 6.8 5.4 3.4 Net lending(+) or borrowing(-) vis-à-vis ROW (c) -0.9 -21.3 -20.6 -11.5 8.9 8.0 6.1 General government balance (c) - -0.5 -0.3 -4.1 -9.0 -12.3 -12.2 Cyclically-adjusted budget balance (c) - -3.4 -4.8 -6.7 -6.4 -9.3 -10.2 Structural budget balance (c) - -3.4 -4.8 -6.7 -7.0 -10.2 -10.2 General government gross debt (c) - 10.7 9.0 19.5 33.2 48.6 60.4 (a) Eurostat definition. (b) gross saving divided by gross disposable income. (c) as a percentage of GDP.
112
Extent of price adjustment uncertain
Inflation has been decreasing rapidly since its double-digit peak in 2008 and the headline figure should shortly turn negative, given falling domestic demand, wages and energy prices. However, the inflation forecast does not take into account the impact on prices of possible tax increases or other measures required for fiscal consolidation, though the probability of such measures is high. Lower consumer prices would facilitate coping with lower nominal wages and encourage the reorientation of the economy towards external markets. The scope for price and wage reduction in Latvia is however limited by the free movement of goods and labour within the Single Market.
Public finances struggle to meet EU-IMF programme targets
The impact on public finances of the unexpected macroeconomic deterioration in the first half of 2009 was partly mitigated thanks to the supplementary budget adopted in June, consisting of a consolidation package of around 4.5% of GDP, mostly on the expenditure side. Despite revenues slightly lower than expected when the supplementary budget was adopted, the fiscal outturn for 2009 is so far consistent with the
corresponding deficit target of 10% of GDP agreed with the EU in July 2009, thanks to lower spending expected at the central government level. Some risks are linked to local governments, which were obliged to adopt supplementary budgets before 1 October in an unprecedented context: municipalities face tight fiscal constraints (tax revenues are hard hit by the recession), and have to cope with a major administrative reform reducing their number to a fifth. However, the necessary expenditure cuts could prove feasible given that, in comparison with central government, local governments were assessed to have greater scope to implement reductions, and the risk of overruns is limited by the strict restrictions on their borrowing capacity.
The picture is more uncertain as regards the fiscal outcome for 2010. The forecast deficit for 2010 of 12.5% of GDP includes positive carry-over effects of the 2009 supplementary budget, notably lower pension and wage bills, and higher personal income tax, and assumes lower tax bases given the macroeconomic context. However, the forecast does not incorporate the budget currently in preparation, which is being designed in order to meet the commitment to international lenders to undertake a consolidation entailing a further improvement in the budget balance by 500 million lats, thereby targeting a deficit of no more than

Member States, Latvia
113
8.5% of GDP in ESA terms. Government gross debt is projected to increase from about 20% of GDP in 2008 to slightly above 60% of GDP by 2011. This projection may be affected by further financial sector costs and the profile of international financial assistance.

14. LITHUANIA Sharp contraction puts public finances under strong pressure
114
Severe economic downturn and strong policy response
Several years of rapid and increasingly unsustainable growth, mainly driven by domestic demand and a real estate boom, came to a halt in 2008. Growth still reached 2.8% for the year as a whole, but Lithuania quickly moved into recession and in the first half of 2009 output fell 17% year-on-year, one of the sharpest declines in the EU. The bursting of the domestic bubble was reinforced by the global financial crisis and a fading away of external demand, nearly returning output to pre-boom levels. The sharp decline in revenues resulting from the economic contraction, together with an expansionary fiscal policy before the parliamentary elections in 2008, left Lithuania facing significant challenges.
A strong policy response was put in place by the new government in autumn 2008. Fiscal consolidation measures were adopted in December to contain the deterioration in public finances and limit debt accumulation, as well as to facilitate the adjustment needed in the economy, thereby supporting the credibility of the currency board arrangement. Due to accumulated imbalances and constrained financing conditions, there was no space for fiscal stimulus. The adjustment of the economy is expected to occur via decreases in prices and wages and via a restructuring of the economy towards tradable sectors.
Steep contraction of domestic demand, to be followed by fragile recovery
A large drop in real GDP in 2009 is expected to be followed by a smaller decline in 2010 before positive growth resumes in 2011. The recession is driven by the plunge in domestic demand, especially investment and household consumption.
Despite some tentative signs of economic stabilisation, such as a marginal upturn in confidence indicators, moderation in the steep declines in retail sales and industrial production, and green shoots in the global economy, recovery still looks very fragile. The situation in the labour market is expected to worsen further, while fiscal policy is set to remain tight and investment depressed.
Private consumption has plummeted in 2009 and should still decline further in 2010. Due to wage cuts in the private and public sectors, an expected reduction of social benefits and indirect tax increases in 2009, household disposable income has fallen and borrowing remained restricted. Remittances from abroad are also assumed to be lower due to recessions in Lithuania's major emigration destinations.
The contraction of economic activity is weighing heavily on employment, which is projected to suffer a cumulative fall of some 11% in 2009 and 2010. Even though nominal wages are adjusting to labour market conditions, job losses particularly in the non-tradable sectors are pronounced. Unemployment is set to increase strongly during the forecast period, reaching close to 18% in 2010. Youth unemployment is particularly high and already reached 30% in mid-2009, threatening a new emigration wave.
Graph II.14.1: Lithuania - Unemployment rate and compensation per employee
-10
0
10
20
30
40
98 00 02 04 06 08 10
y-o-y%
Unemployment rate (def. EUROSTAT)Compensation per employee
forecast
Investment is undergoing a severe adjustment this year due to tight lending conditions, a sharp decline in domestic and external demand and major uncertainty about future prospects. Moreover, the real estate market does not yet seem to have reached bottom. However, public investment is projected to accelerate as the government is committed to frontloading EU co-financed projects, especially to enhance investments in infrastructure and improve energy efficiency of public and private buildings.
The main risk to this baseline scenario could be a more rapid than expected rise in unemployment, thus contributing further to declines in confidence

Member States, Lithuania
115
and spending, with negative feedback effects on business revenue, investment and employment. A stronger-than-assumed credit tightening could lead to a more negative outlook. On the other hand, a stronger performance by the exporting sectors could create new job opportunities.
Some support from external sector
Net exports are supporting GDP growth as a result of a sharp fall in imports rather than strong growth in exports. The previously high current account deficit has narrowed significantly and recorded a slight surplus in the first half of 2009, mainly driven by a much lower merchandise trade deficit. Furthermore, the income balance deficit has been narrowing, due to lower earnings of inward investors. On the other hand, the balance of current and capital transfers is set to improve due to frontloading of EU funds, although private sector transfer receipts are likely to be lower than in previous years.
With major trade partners showing signs of recovery, exports are expected to pick up, providing a key impulse to recovery from the recession. Some export-oriented industries, such as machinery and equipment, chemistry and food, are set to revive once global demand bounces back. After an initial loss of market shares in some neighbouring trade partners that experienced currency depreciations, Lithuania has been regaining its positions in these markets and diversifying in others. Although domestic demand for investment and consumption goods can be expected to remain depressed for some time, the increase in energy imports after the closure of the Ignalina nuclear power plant at the end of 2009 is expected to limit the fall in imports.
Restoring competitiveness through price…
Strong disinflationary pressures are expected to help restore some of the competitiveness lost in the boom years. There are already signs of improvement in terms of real exchange rate indicators in 2009. This adjustment is expected to continue throughout the forecast period. HICP inflation declined rapidly from over 11% in 2008 to under 4% in 2009. Due to low economic confidence and reduced consumer spending, it should turn slightly negative in 2010, despite a significant energy price shock. The closure of the Ignalina plant is expected to result in a 30% electricity price increase, adding about 0.75 pp to
annual inflation. Moreover, the prices of oil and other commodities in international markets and the extent of the secondary effects related to higher production costs pass-through to consumers are uncertain. On the other hand, due to very weak domestic demand, high unemployment and negative wage pressures, core inflation should remain subdued over the forecast horizon.
…and wage adjustment
The necessary adjustment of labour costs started in the second half of 2008. The labour market has proved to be very flexible as private sector wages declined by around 6% year-on-year in the second quarter of 2009, and decreased even more dramatically by over 20% in some previously booming non-tradable sectors. Recently adopted changes regarding work contracts should provide a higher degree of labour market flexibility. Therefore, nominal compensation per employee is projected to decrease over the forecast horizon, falling by some 7% in 2009 and another 6% in 2010 before stabilising in 2011 when the economy starts to recover. Such wage adjustment and labour-market conditions are helping to improve the competitive position of the Lithuanian economy and should underpin the rebalancing towards tradables.
The government has also demonstrated significant determination to achieve the goal of wage adjustment by adopting a number of wage-reducing measures in 2009 and streamlining public administration. After having shown slight positive growth in the first half of 2009, public sector wages are expected to respond more strongly as of the second half of 2009: the second supplementary 2009 budget reduced public sector wages by 8-10% from 1 August 2009.
Graph II.14.2: Lithuania - General government deficit and gross debt
-10
-5
0
5
10
15
20
25
30
98 00 02 04 06 08 10
% of GDP
-20
-10
0
10
20
30
40
50
60
Deficit (lhs) Gross debt (rhs)
forecast
% of GDP

European Economic Forecast, Autumn 2009
Table II.14.1:Main features of country forecast - LITHUANIA
2008 Annual percentage changebn LTL Curr. prices % GDP 92-05 2006 2007 2008 2009 2010 2011
GDP 111.2 100.0 0.8 7.8 9.8 2.8 -18.1 -3.9 2.5 Private consumption 72.4 65.1 - 10.6 12.1 3.6 -19.5 -6.3 1.2 Public consumption 21.5 19.3 - 3.7 3.2 7.9 -7.0 -7.9 0.1 Gross fixed capital formation 28.0 25.2 - 19.4 23.0 -6.5 -43.0 -7.3 5.4 of which : equipment 7.4 6.7 - 16.8 21.9 -19.8 -56.0 -11.1 5.0 Exports (goods and services) 67.0 60.2 - 12.0 3.0 12.2 -20.6 1.3 3.9 Imports (goods and services) 79.7 71.7 - 13.7 10.7 10.5 -35.2 -0.5 3.2 GNI (GDP deflator) 107.8 96.9 - 7.3 7.4 4.2 -17.8 -5.0 1.4 Contribution to GDP growth : Domestic demand - 11.9 14.2 1.9 -24.9 -7.1 1.6
Stockbuilding - -2.2 1.3 1.4 -6.1 2.3 0.5Foreign balance - -1.9 -5.7 -0.5 12.8 0.9 0.5
Employment -1.1 1.8 2.8 -0.5 -8.3 -2.4 -0.2 Unemployment rate (a) 9.8 5.6 4.3 5.8 14.5 17.6 18.2 Compensation of employees/head - 16.7 13.9 12.9 -6.8 -5.7 0.9 Unit labour costs whole economy - 10.1 6.5 9.3 4.5 -4.3 -1.8 Real unit labour costs - 3.4 -1.8 -0.3 5.8 -2.9 -2.1 Savings rate of households (b) - - - - - - - GDP deflator 42.9 6.5 8.5 9.7 -1.3 -1.5 0.4 Harmonised index of consumer prices - 3.8 5.8 11.1 3.9 -0.7 1.0 Terms of trade of goods - -3.5 0.9 3.5 -3.0 0.2 -0.3 Trade balance (c) - -13.9 -15.0 -12.0 -1.1 -0.1 0.1 Current account balance (c) - -10.4 -15.0 -12.4 0.1 0.3 -0.4 Net lending(+) or borrowing(-) vis-à-vis ROW (c) - -8.9 -13.1 -10.6 3.3 4.8 4.3 General government balance (c) - -0.4 -1.0 -3.2 -9.8 -9.2 -9.7 Cyclically-adjusted budget balance (c) - -2.4 -4.2 -6.4 -7.6 -6.3 -7.5 Structural budget balance (c) - -2.4 -3.7 -6.3 -8.0 -7.0 -7.5 General government gross debt (c) - 18.0 16.9 15.6 29.9 40.7 49.3 (a) Eurostat definition. (b) gross saving divided by gross disposable income. (c) as a percentage of GDP.
116
Public finances under strong pressure but adjustment underway
The public sector recorded a deficit of 3.2% of GDP in 2008 but this is projected to deteriorate markedly over the forecast period given the contraction in output and thus revenues. The rapid deterioration of the public finances has been addressed by implementing restrictive initial and supplementary budgets. Total fiscal adjustment measures are estimated at around 7½% of GDP in 2009, achieved through a combination of spending cuts and tax increases and a temporary reduction of transfers to the second pillar pension funds. However, expenditure has continued to grow, mainly reflecting increases in social expenditure and public sector wages due to decisions taken last year. In spite of repeated fiscal consolidation efforts, the deficit has been widening and is projected to reach nearly 10% of GDP in 2009.
In July 2009, the government initiated a medium-term strategy initiative entailing discussions with the social partners (the so-called National Agreement) and proposing possible measures and structural reforms to be implemented over the medium term. In September, the government approved cuts in social benefits including pensions and generous maternity leave benefits to be implemented as of 2010, with some progressivity
to protect the most vulnerable groups. Other measures proposed by the government together with the 2010 budget include a substantial reduction in current government spending, including the wage bill, an increase in the social contribution rate by 2 pp and a reduction in the corporate income tax rate by 5 pp. The latter was raised only in January 2009. However, even a substantial consolidation package will limit the deficit only to some extent, as tax revenue is projected to decline further and some expenditure items, such as net interest on public debt, are set to increase. The steps taken so far have enabled the government to borrow on international capital markets after being absent since October 2007. The government's intention to focus on long-term structural reforms is expected to help improve the sustainability of public finances and the competitiveness of the economy. A major higher education reform is under way and the government is preparing health sector and social security system reforms.
With such a strong downturn in GDP growth and high deficits, government debt is projected to increase from 15.6% of GDP in 2008 to nearly 30% in 2009 and to around 40% in 2010.

15. LUXEMBOURG Recession followed by a relatively mild recovery
117
Economic activity bottoming out after sharp downturn
The recession is taking a relatively high toll on Luxembourg, even if the latest news is somewhat encouraging. After four years of robust growth (5.5% a year on average over the period 2004-2007), real GDP stagnated in 2008, with a large drop in the fourth quarter (-2.9% quarter-on-quarter) and in the first quarter of 2009 (-1.7%). However, the decline was much more limited in the second quarter (-0.3%), which suggests that the downturn is bottoming out.
The first victim of the recession was the manufacturing industry, which exports almost all of its production and is thus totally dependent on developments in world trade. Industrial production dropped markedly in the fourth quarter of 2008 (-18% quarter-on-quarter) and in the first quarter of 2009 (-10%). Luxembourgish industry is heavily concentrated in steel products, car suppliers and glass, which makes it very dependent on the automotive industry and on construction. Construction and services have also been hit, in particular services to enterprises but also the financial sector, which, due to its ownership structure (nearly all financial institutions belong to foreign groups) and the international character of its activity, is extremely sensitive to developments abroad. However, the financial sector has been less severely affected by the crisis than might have been expected. This is probably because much of its core business, mainly private banking as well as the management and back office work of investment funds (86), has been relatively sheltered from the financial turmoil. Moreover, Luxembourgish financial institutions seem to have shown less appetite than many others for risky assets which eventually proved toxic. Thus the country's financial sector seems comparatively sound but its dependence on developments abroad is a source of vulnerability. The Luxembourgish authorities intervened in October 2008 together with the Belgian and Dutch governments in order to support two of the country's largest banks (Fortis and Dexia). The government granted each of these two banks a loan (the loan to Fortis was later converted into capital) and guaranteed
(86) Luxembourg is the world's second largest investment-fund
centre after New-York.
Dexia's new liabilities towards other financial institutions and institutional investors for a limited period of time.
Employment remained buoyant for the larger part of 2008, rising by 4.8% over the year. Since then, the drop in activity has led to a standstill in job creation. Unemployment, which had been rising since the beginning of 2008, strongly accelerated in the autumn, surging from 4.2% of the active population in January 2008 to 5.9% last August. The recession also led to a strong rise in short-time working, which was encouraged by the government in order to limit the rise in unemployment.
Graph II.15.1: Luxembourg - Employment and GDP
forecast
-4
0
4
8
12
80 82 84 86 88 90 92 94 96 98 00 02 04 06 08 10
y-o-y%
Domestic employment Real GDP
The outlook for this year is negative: private consumption has been weakened by the negative developments on the labour market and the general deterioration in the economic environment. However, it could be supported to some extent by the cuts in income tax enacted in 2008 and 2009, by the fall in inflation and by the recent decline in interest rates (most mortgage loans are at a variable rate). Private investment collapsed at the end of 2008 and will probably continue to contract this year. This fall is likely to be only partially compensated by a more than 10% surge in public investment decided under the country's recovery plan. With markets projected to contract by almost 15%, exports of goods are set to record a historic fall in 2009. Exports of services (both financial and non-financial) are expected to drop too, though probably by less than exports of goods. However, this fall in exports should be partially offset by a parallel drop in imports. Overall, real GDP is forecast to contract by about 3½%.

European Economic Forecast, Autumn 2009
Table II.15.1:Main features of country forecast - LUXEMBOURG
2008 Annual percentage changemio Euro Curr. prices % GDP 92-05 2006 2007 2008 2009 2010 2011
GDP 39346.7 100.0 4.3 5.6 6.5 0.0 -3.6 1.1 1.8 Private consumption 12741.3 32.4 2.5 2.7 2.8 3.9 0.2 0.8 1.5 Public consumption 5940.4 15.1 4.3 2.8 2.9 3.0 4.6 2.0 1.8 Gross fixed capital formation 7602.8 19.3 4.5 4.7 12.6 -0.1 -14.8 0.3 2.9 of which : equipment 2350.3 6.0 3.0 7.8 18.5 5.5 -17.0 -0.5 4.0 Exports (goods and services) 67994.9 172.8 7.1 13.3 8.8 1.5 -10.0 1.8 3.2 Imports (goods and services) 55196.8 140.3 6.9 12.9 8.3 3.3 -11.5 1.9 3.5 GNI (GDP deflator) 31695.6 80.6 3.5 -6.3 10.7 1.7 -5.0 2.3 2.3 Contribution to GDP growth : Domestic demand 2.8 2.4 3.8 1.6 -2.7 0.7 1.4
Stockbuilding 0.0 -0.8 -0.9 0.5 -0.9 0.1 0.0Foreign balance 1.5 4.0 3.6 -2.1 0.0 0.3 0.3
Employment 3.3 3.6 4.4 4.7 1.1 -1.3 0.0 Unemployment rate (a) 3.0 4.6 4.2 4.9 6.2 7.3 7.7 Compensation of employees/head 3.4 3.3 3.6 2.0 1.2 1.8 2.0 Unit labour costs whole economy 2.4 1.4 1.6 6.8 6.2 -0.6 0.2 Real unit labour costs -0.3 -5.0 -1.4 1.7 7.3 -3.7 -2.5 Savings rate of households (b) - - - - - - - GDP deflator 2.7 6.8 3.0 5.0 -1.0 3.2 2.8 Harmonised index of consumer prices - 3.0 2.7 4.1 0.0 1.8 1.7 Terms of trade of goods -0.6 3.0 2.6 0.2 0.5 0.0 1.5 Trade balance (c) -11.2 -9.3 -8.6 -10.4 -8.4 -8.6 -8.1 Current account balance (c) 11.1 10.3 9.7 5.5 9.4 11.2 12.2 Net lending(+) or borrowing(-) vis-à-vis ROW (c) - - - - - - - General government balance (c) 2.3 1.3 3.7 2.5 -2.2 -4.2 -4.2 Cyclically-adjusted budget balance (c) - 0.0 1.0 1.6 -0.3 -2.0 -1.8 Structural budget balance (c) - 0.0 1.0 1.6 -0.3 -2.0 -1.8 General government gross debt (c) 6.5 6.6 6.6 13.5 15.0 16.4 17.7 (a) Eurostat definition. (b) gross saving divided by gross disposable income. (c) as a percentage of GDP.
118
Gradual recovery in the offing
The economy is expected to begin to revive in the second half of this year following the recovery in the EU economy. However, GDP growth will probably remain fairly low in 2010, as most demand components should post only modest positive growth rates with the exception of public expenditure, which is forecast to remain extremely dynamic. Activity should progressively accelerate in the course of 2010 but even in 2011 growth is expected to remain far below the strong rates recorded a few years ago. Employment is projected to contract throughout 2009 (the positive growth rate forecast for this year being exclusively due to the large carry-over from 2008), even if this contraction is certainly limited at the moment by the massive recourse to part-time unemployment. Conversely, the negative carry-over at the end of 2009 will result in a decline in employment in annual terms in 2010, although it could begin to recover in the course of the year. However, the rise in unemployment will be limited by the fact that a large part of the workers who will lose their job will be non-residents, who will not be registered as unemployed in Luxembourg but in their country of residence. Despite this, unemployment is still projected to rise substantially and to reach by the end of the forecast period levels unseen for many
years, though still lower than in most Member States.
Budget balance set to move into deficit
Thanks to still buoyant tax receipts and employment, the government surplus declined only from 3.7% of GDP in 2007 to 2.5% in 2008. This surplus will turn into a deficit this year, due not only to the impact of the crisis on government revenues and on unemployment outlays but also to the tax cuts decided in the 2009 budget before the aggravation of the crisis. Moreover, expenditure is forecast to rise substantially, reflecting in particular the sharp increase in public investment which constitutes the bulk of the government's recovery plan. Public investment, which had already risen by 0.3 of a percentage point of GDP in 2008, is set to increase by another 0.6 of a percentage point of GDP in 2009 and by 0.3 in 2010. Other measures aimed at supporting activity comprise large tax cuts, especially in taxes paid by households. In particular, personal income tax brackets were raised by 9% (after a similar increase by 6% in 2008) in order to compensate for their non-indexation since 2001, leading to a decline in the taxes paid by households by about 1.2 percentage points of GDP in 2009. Even if these tax cuts had already been decided in the 2009 budget before the aggravation of the crisis and

Member States, Luxembourg
119
were not originally designed to address it, they can also serve this purpose.
The deficit could exceed 2% of GDP this year and widen to more than 4 % in both 2010 and 2011 (on an unchanged policy basis), as a result of the delayed effects of the recession on tax revenues and social transfers. The public debt doubled in 2008, due to the financing of the support to the financial sector. It could reach about 18% of GDP in 2011 but would still be one of the lowest in the EU. The current situation of public finance thus remains comparatively sound. However, the debt is set to increase in the coming decades due to the rise in age-related public expenditure and in particular in pension payments, which is projected to be one of the strongest in the EU.

16. HUNGARY Forceful adjustments help reduce economic vulnerabilities
120
Fragile situation at the onset of the crisis
Hungary was in a fragile economic condition when the financial crisis broke out in autumn 2008. Labour productivity and thus potential output had started to decelerate some years earlier, while lax fiscal policy and growing private sector indebtedness had sustained domestic demand at elevated levels. Moreover, from 2004 onwards, the share of foreign-exchange-denominated debt also increased quickly. Despite the fiscal stimulus that raised the general government deficit to 9.3% of GDP in 2006, GDP grew by only 4% in that year, still lower than the average of the preceding years. The mid-2006 fiscal policy reversal, which was aimed at correcting the existing economic imbalances and restraining the accumulation of the public debt, successfully reduced the budget deficit to 3.8% of GDP by 2008.(87) However, these corrective fiscal measures mainly focused on achieving higher revenues and not sufficiently on expenditure cuts based on structural reforms, which contributed to lower GDP growth compared with most neighbouring countries and even old Member States in both 2007 and 2008.
Initial effects of the crisis and short-term remedies
In autumn 2008, in a context of reduced risk appetite linked to the global financial crisis, financial market conditions in Hungary rapidly deteriorated to the extent that the external financing needs of the government could no longer be met through market channels. Moreover, due to a sudden decline in external demand and high uncertainty regarding the severity and duration of the crisis, both exports and industrial production dropped at double digit rates in the fourth quarter of 2008. In the context of an absence of fiscal space and financing difficulties, the policy response consisted of continued fiscal consolidation and measures to support the financial sector. In November 2008, acknowledging the government’s commitment to maintain the fiscal consolidation process and to prevent a more severe financial market crash, a joint financial assistance of up to EUR 20 billion was provided to Hungary (87) In the context of second notification, the ESA95 general
government deficit increased by 0.4 of a percentage point to 3.8% of GDP compared to the first notification in spring 2009.
by the EU, the IMF and the World Bank linked to policy conditions. In order to counteract the decreasing revenues caused by declining output, the government also implemented a mix of structural and temporary expenditure saving measures.
Second round effects in the downturn
In a controlled deleveraging process, financial institutions tightened credit conditions, which led to a decline in corporate lending and a negligible net flow to households during the first eight months of 2009, also in line with a limited demand for credit. Nevertheless, financial market conditions are expected to slowly but continuously improve over the forecast horizon as uncertainty about the recovery subsides and investor confidence picks up.
Based on diminishing real wages and increased uncertainty regarding employment, consumption expenditure by households is foreseen to decline by more than 10% between 2008 and 2010. At the same time, fixed capital formation is also expected to decrease substantially due to financing difficulties and low capacity utilisation with the possible exception of infrastructure investments linked to EU funds. The depletion of inventories was extremely strong in the fourth quarter of 2008 and the first quarter of 2009, when their contribution to the decline in GDP is estimated to have been around 4½ percentage points. However, net exports are projected to make a large positive contribution to growth as imports fall even faster than exports. GDP is forecast to decrease by 6½% in 2009, and to decline further in 2010 before returning to positive territory (at around 3%) in 2011.
The sharp decline in production has induced a pronounced flow from full-time employment to part-time and non-employment and has also capped wage expectations for those who remained active in the labour market. The drop in full-time-equivalent employment in the private sector could be roughly 5% in 2009 and, due to a lagged response of the labour market, a further decline is expected in 2010. At the same time, the government launched its 'Pathway to Work' programme, which provided short-term employment in public services for a large number

Member States, Hungary
121
of non-employed. Moreover, in an attempt to boost employment in a budget-neutral way, the authorities shifted a part of the tax burden from labour to consumption and wealth. All in all, these measures, together with growing unemployment and deleveraging in the financial markets, took a heavy toll on the purchasing power of households in the short run.
The rapid adjustment in consumption and thus imports also induced a remarkable decline in the current account deficit, which improved from 7.2% of GDP in 2008 to 2.7% in the first quarter of 2009 and turned into a 2.1% of GDP surplus by the second quarter of this year. It appears that the adjustment in the current account is heavily frontloaded: no further improvement is therefore foreseen in 2010. In the medium term, a smaller export–import gap is expected, with the external deficit stabilising at a more sustainable level.
Labour market challenges in a medium-term perspective
Starting from 2011, the recovery is set to be largely supported by an improved external environment with both higher demand for Hungarian exports and better market sentiment in global finances. Moderate wage growth, low inflation and decreasing income taxes may enhance consumption and previously subdued investments may also accelerate. As a result, cost competitiveness should improve and attract additional direct investment. However, the structural problems of the labour market are likely to deepen during the crisis as high and persistent unemployment depletes acquired skills. This phenomenon, in combination with a permanently lower risk appetite, could set the stage for jobless and credit-less growth in the medium run. While growth could nonetheless become more balanced with a lower contribution from public and private consumption than previously, which would also suggest more sustainable external balances, the challenge of escaping a 'low-growth' trap will remain.
Focus on consolidation of public finances
General government revenues are forecast to decrease by about 6% in real terms in 2009 and by 4% in 2010, reflecting mainly the deterioration of tax bases and to a smaller extent the reduction of the tax wedge on wages. In 2009 and 2010, this revenue shortfall is expected to be broadly
counterbalanced by reforms in the pension system and in social transfers, and numerous saving measures, e.g. freezing the wage bill in the public sector.
As a baseline scenario, taking into account adopted measures and the draft 2010 budget and applying the no-policy-change assumption, the general government deficit is forecast to come out at around 4% of GDP in the period 2009-2011.
Graph II.16.1: Hungary - General government balance and public debt
-10-9-8-7-6-5-4-3-2-10
05 06 07 08 09 10 11
% of GDP
0102030405060708090100 % of GDP
General government balance (lhs) - reversedPublic debt (rhs)
forecast
In 2009, despite the unfavourable economic environment, the deficit should not increase significantly from the level reached in 2008 reflecting the projected structural effort of some 2¾ pp. However, the deficit is foreseen to slightly exceed the government's target set at 3.9% of GDP, mainly due to the decreasing tax revenues related to diminishing corporate profits.
In 2010, despite the already-adopted and additional budgeted measures, as well as the increased level of reserves, the deficit target of 3.8% of GDP is expected to be exceeded for several reasons. First, a larger local government deficit than foreseen in the draft budget (1.0% vs. 0.7% of GDP) is expected as the reduction of central support to local governments could be replaced by a depletion of their large liquid assets. Second, for the time being, the intended reduction of the subsidy (of 0.4% of GDP) for the state-owned railway company cannot be taken into account due to the lack of detailed measures. Third, expenditure is forecast 0.3% of GDP higher than planned in the draft 2010 budget, notably in the area of health care financing, partly linked to

European Economic Forecast, Autumn 2009
Table II.16.1:Main features of country forecast - HUNGARY
2008 Annual percentage changebn HUF Curr. prices % GDP 92-05 2006 2007 2008 2009 2010 2011
GDP 26543.3 100.0 3.0 4.0 1.0 0.6 -6.5 -0.5 3.1 Private consumption 14331.8 54.0 - 1.7 0.4 -0.5 -7.4 -2.5 3.0 Public consumption 5743.1 21.6 1.2 3.8 -7.4 -0.8 -1.1 -1.6 1.8 Gross fixed capital formation 5559.1 20.9 5.7 -3.6 1.6 0.4 -6.0 1.0 4.3 of which : equipment 2231.2 8.4 - - - - -9.0 2.7 3.9 Exports (goods and services) 21804.9 82.1 12.5 18.6 16.2 5.6 -13.1 3.6 6.0 Imports (goods and services) 21545.5 81.2 12.9 14.8 13.3 5.7 -16.2 2.5 6.2 GNI (GDP deflator) 24615.6 92.7 - 3.6 -0.4 1.1 -5.2 -0.8 3.7 Contribution to GDP growth : Domestic demand 3.1 0.9 -1.1 -0.4 -5.5 -1.4 2.9
Stockbuilding 0.2 0.8 0.0 1.0 -3.4 0.0 0.0Foreign balance -0.3 2.3 2.2 0.0 2.4 1.0 0.2
Employment - 0.9 -0.1 -1.2 -3.0 -0.8 0.9 Unemployment rate (a) 8.1 7.5 7.4 7.8 10.5 11.3 10.5 Compensation of employees/f.t.e. - 4.5 6.8 6.6 -1.4 0.0 3.9 Unit labour costs whole economy - 1.4 5.6 4.6 2.3 -0.3 1.7 Real unit labour costs - -2.4 -0.3 0.8 -1.5 -2.8 -0.1 Savings rate of households (b) - - - - - - - GDP deflator 13.2 3.9 5.9 3.8 3.8 2.6 1.8 Harmonised index of consumer prices - 4.0 7.9 6.0 4.3 4.0 2.5 Terms of trade of goods - -1.4 -0.1 -1.4 0.9 -0.6 -1.1 Trade balance (c) -4.5 -2.3 0.2 -0.1 2.7 3.0 2.3 Current account balance (c) - -7.5 -6.5 -6.6 -1.3 -1.7 -1.8 Net lending(+) or borrowing(-) vis-à-vis ROW (c) - -6.9 -5.5 -5.6 0.5 0.3 0.4 General government balance (c) - -9.3 -5.0 -3.8 -4.1 -4.2 -3.9 Cyclically-adjusted budget balance (c) - -10.9 -6.4 -5.1 -2.2 -2.1 -3.0 Structural budget balance (c) - -10.6 -5.5 -4.8 -2.1 -2.1 -3.0 General government gross debt (c) - 65.6 65.9 72.9 79.1 79.8 79.1 (a) Eurostat definition. (b) gross saving divided by gross disposable income. (c) as a percentage of GDP.
122
policy announcements. These expenditure overruns could not be counteracted even if most of the 0.7% of GDP reserves were to be frozen (88).
In 2011, the forecast recovery should trigger the increase of the budget revenues, but this cyclical increase in revenues is not likely to be fully realised due to the decision to increase the ceiling of the lower personal income tax bracket from 5 to 15 million forints. This measure, which is expected to lower the budget revenue by 0.6% of GDP, was already adopted by Parliament in June 2009 and will be effective as of 2011. Moreover, the expected losses (of about 0.4% of GDP) of the central bank in 2010 will also have to be compensated in 2011. Thus, under the no-policy-change assumption, the deficit is expected to remain above the 3% of GDP threshold.
This deficit forecast is subject to risks. In 2009, it mainly refers to further expenditure overruns, notably in the health care system. In 2010 and 2011, the risk is higher and is mainly related to two factors. First, some measures that have recently supported the deficit reduction do not look sustainable (notably a freeze in public sector wages and expenditure by institutions, lower (88) It is assumed that all the stability and the interest rate risk
reserve (0.5% of GDP) and half of the general reserve (0.1% of GDP) can be saved.
spending on education, health care and the local government system without structural reform, and an increase in the carryover balance). Second, there is a risk of lower-than-budgeted revenues arising from insufficient companies' profits also in 2010.
The general government debt as a ratio of GDP is expected to increase significantly in 2009 and to reach its peak in 2010 at almost 80% of GDP, the highest among the central and eastern European countries. The drivers of this increase are the lower nominal GDP and the exchange rate depreciation in 2009 compared to 2008. A fall in the debt ratio is foreseen from the end of 2010, mainly in view of the expected use of the accumulated assets although the advance financing obligations of EU funds might partly counteract this trend.

17. MALTA Fragile recovery ahead
123
Slowing economic activity and policy responses
Malta registered strong economic growth in the years preceding the global economic crisis. During 2005-07, real GDP growth averaged almost 4%, mainly driven by domestic demand. Exports - dominated by electronics and tourism - expanded due to a growing services sector. Although euro-area membership (since 2008) has cushioned the impact of the crisis by offering enhanced financial stability, the economy's resilience has come under strain, underscoring the importance of strengthening competitiveness.
The global crisis affected Malta primarily through the trade channel as external demand for its products fell. Exports of electronics were hit hard, while the tourism sector suffered from fewer visitors from key source markets. Real GDP growth slowed in the last few months of 2008 as the global recession took its toll on Malta's small and open economy. In 2008 as a whole, real GDP growth decelerated to 2.1%. Domestic demand held up well as the strong growth in private and public consumption outweighed the sharp decline in investment caused by lower construction activity. The impact of the global financial turmoil on the banking system was limited, reflecting the fact that banks are funded from resident deposits and their lending is almost exclusively local, while their involvement in inter-banking activity with overseas banks is limited. The liquidity position of the banking sector remains relatively strong even if the vulnerability of the system has increased, in the wake of the ongoing decline in property prices.
With no need to directly assist the financial sector, Malta's response to the crisis consists of several fiscal measures to support the real sector in 2009. The main focus of the recovery measures, which amount to around 1½% of GDP, is on increasing public infrastructure and on support to manufacturing, tourism and SMEs. At the same time, measures were taken to help contain the widening of the government deficit.
Sharp output contraction gives way to a fragile recovery
On the back of a significant contraction in output in the first half of the year, real GDP is expected to
shrink by 2.2% in 2009. Even if on a quarterly basis the pace of contraction eased in the second quarter of 2009, the scope for a quick turnaround appears limited. Economic activity is projected to gradually improve in 2010 and 2011, although growth is set to remain below historical trends.
Declining exports will continue to weigh on real GDP throughout 2009. Imports are set to fall by slightly more than exports, due to weak domestic demand and the import-intensity of exports, leading to a positive contribution of net exports to GDP growth. Over the medium term, foreign sales of goods and services are projected to move into positive territory, albeit mildly in view of weak economic prospects in Malta's key trading partners, as well as unfavourable cost developments affecting the price-sensitive electronics and tourism sectors. Despite increased public capital spending, gross fixed capital formation is forecast to act as a drag on GDP growth in 2009 as low capacity utilisation, weak external demand and lower profits induce companies to scale back their investment plans, while construction activity is expected to remain weak. For 2010-11, investment is set to recover marginally, supported by the construction of a major ICT business park and improved conditions of foreign-owned companies, in line with the assumed global economic turnaround. Private consumption is set to contract in 2009 due to lower real disposable income stemming from rising unemployment and slower wage growth. This is expected to more than neutralise the support to purchasing power provided by personal income tax cuts and overall lower inflation. Looking forward, private consumption is anticipated to post a mild recovery, mainly as a result of improved labour market conditions.
Risks to the macroeconomic outlook stem from a protracted period of weak external demand, given Malta's reliance on trade flows. Private consumption may be dampened further as a result of deteriorating labour market conditions and possible adverse wealth effects from the correction in property prices.
Wage growth exceeds productivity growth
After moderating until 2007, wage inflation accelerated in 2008. Apart from cost-of-living

European Economic Forecast, Autumn 2009
124
adjustments, these dynamics reflect pay increases in the public sector. Despite the contraction in output, nominal wages continued to accelerate in the first half of 2009 compared to the same period in the previous year, which may jeopardise competitiveness. In addition, the cost-of-living adjustment in line with the high inflation registered in the past months is expected to entail nominal wage growth above the euro-area average in 2010, although the relatively flexible private sector wages may limit this development. Wage growth in excess of HICP inflation is also foreseen up to 2010, boosted by negotiated rises in public sector pay. Despite a deceleration from the peak reached in 2008, HICP inflation is projected to stay above the euro-area average. Food prices are expected to remain dynamic over the forecast horizon. Notwithstanding increased competition in the distribution trade and lower global prices, domestic food prices have proved sticky.
New high value-added services activities boosted productivity during 2004-07. Thereafter, productivity receded with the turn of the cycle as the slowing output was accompanied by a still relatively strong employment growth in 2008, led by ICT and remote gaming. It is anticipated that productivity will remain weak in 2009 as firms continue to hoard labour in sectors that have benefited from public financial support to retain workers, as well as those sectors with a high incidence of skilled workers. As a result, job growth will be low in the subsequent years. Although it will benefit from the expected turnaround in output growth, productivity gains are set to remain weak. Against this background, unit labour cost growth in Malta over the forecast horizon is projected to be above the euro-area average. This, coupled with the projected weakening of the dollar, which is the transaction currency used by the electronics sector, may harm Malta's competitiveness.
Restoring public finances
Following years of fiscal consolidation, the general government deficit increased to 4.7% of GDP in 2008 due to one-off early retirement payments to shipyards' employees, the reclassification of the yards in the general government sector and lower tax receipts.
For 2009, the deficit is estimated to decline slightly to 4.5% of GDP. The worsening economic situation is expected to depress the tax intake.
Indirect taxes are projected to decline by 0.7% on the back of weak private consumption, while social contributions are set to fall as a result of softer labour market conditions. Similarly, tax receipts on property transactions are expected to decline, reflecting the cooling real estate market. In line with developments in cash data for the first eight months of 2009, revenue from direct taxes is projected to show some resilience for the year as a whole, supported by an amnesty on past income tax dues and the part-recuperation of delayed tax payments owed by companies in 2008.
Helped by favourable base effects related to the higher remuneration to health sector employees in 2008 and the liquidation of the shipyards, the growth in government consumption expenditure is set to decelerate in 2009. Social transfers are projected to rise further amid higher healthcare running costs, rising age-related spending and higher demand for unemployment benefits. Subsidies, on the other hand, are foreseen to fall significantly mostly due to the withdrawal of aid to the water and energy providers. Capital spending is set to increase significantly, as the government embarks on environment and infrastructure investment projects and provides support to manufacturing as part of the economic recovery measures.
Based on the no-policy-change assumption which does not include the forthcoming 2010 budget, the general government deficit is projected to decline marginally to 4.4% of GDP in 2010. Revenue is set to recover in line with the incipient economic turnaround, and to grow at a faster pace than expenditure. Receipts are anticipated to be buoyant primarily due to direct taxes as the delayed income tax owed by companies is assumed to be recuperated. Social contributions are also expected to increase as employment growth resumes.
Graph II.17.1: Malta - General government finances
-12
-10
-8
-6
-4
-2
003 04 05 06 07 08 09 10 11
55
60
65
70
75
80
General government debt ratio (rhs)General government deficit (lhs)
% of GDP% of GDP
forecast

Member States, Malta
Table II.17.1:Main features of country forecast - MALTA
2008 Annual percentage changemio Euro Curr. prices % GDP 92-05 2006 2007 2008 2009 2010 2011
GDP 5687.2 100.0 3.5 3.8 3.7 2.1 -2.2 0.7 1.6 Private consumption 3626.2 63.8 - 0.6 2.0 5.8 -1.1 0.4 1.1 Public consumption 1219.1 21.4 - 6.0 -0.5 12.9 2.9 1.5 1.5 Gross fixed capital formation 901.0 15.8 - 2.4 1.3 -21.3 -8.0 1.6 3.1 of which : equipment - - - - - - - - - Exports (goods and services) 4647.2 81.7 - 10.5 2.7 -5.4 -12.3 1.6 2.8 Imports (goods and services) 4828.2 84.9 - 9.5 1.2 -6.0 -13.7 1.9 2.5 GNI (GDP deflator) 5496.9 96.7 2.7 3.9 4.8 2.2 -1.9 1.0 1.8 Contribution to GDP growth : Domestic demand - 2.1 1.5 1.9 -1.4 0.9 1.5
Stockbuilding - 1.6 0.9 -0.7 -2.7 0.2 0.0Foreign balance - 0.1 1.3 0.9 1.9 -0.3 0.1
Employment 1.0 1.3 3.2 2.4 -0.6 0.3 0.6 Unemployment rate (a) 6.4 7.1 6.4 5.9 7.1 7.4 7.3 Compensation of employees/head 5.1 3.8 1.5 3.4 2.5 2.1 2.2 Unit labour costs whole economy 2.6 1.3 1.0 3.8 4.2 1.7 1.2 Real unit labour costs 0.1 -1.7 -1.7 1.5 2.2 -0.6 -1.1 Savings rate of households (b) - - - - - - - GDP deflator 2.5 3.1 2.7 2.2 1.9 2.3 2.4 Harmonised index of consumer prices - 2.6 0.7 4.7 2.0 2.0 2.2 Terms of trade of goods - -2.5 2.8 -1.4 -0.2 0.5 -0.4 Trade balance (c) -18.3 -18.9 -18.0 -20.5 -15.6 -15.4 -15.7 Current account balance (c) - -9.2 -7.0 -5.6 -3.2 -2.8 -2.5 Net lending(+) or borrowing(-) vis-à-vis ROW (c) - -6.2 -6.0 -5.1 -2.4 -1.8 -1.4 General government balance (c) - -2.6 -2.2 -4.7 -4.5 -4.4 -4.3 Cyclically-adjusted budget balance (c) - -2.5 -2.6 -5.4 -4.2 -4.1 -4.4 Structural budget balance (c) - -3.1 -3.3 -5.0 -4.3 -4.1 -4.4 General government gross debt (c) - 63.6 62.0 63.8 68.5 70.9 72.5 (a) Eurostat definition. (b) gross saving divided by gross disposable income. (c) as a percentage of GDP.
125
Expenditure is projected to grow steadily, partly stemming from more dynamic developments in the public sector wage bill and health and age-related costs. In 2011, assuming no policy change, the deficit is foreseen to decline further to 4.3% of GDP. Revenue is expected to continue to recover as tax-rich domestic demand improves. Expenditure growth is assumed to stabilise, partly reflecting the authorities' stated objective of following an expenditure-based fiscal consolidation. Moreover, with the expiration of the current public service collective agreement in 2010, compensation of employees is assumed to grow in line with inflation in 2011. However, in the absence of concrete measures to tackle the spending pressures from healthcare and pensions, intermediate consumption and social benefits will increase at a sustained pace. Public investment is assumed to remain constant as a ratio to GDP. The general government debt is projected to continue on an upward path over the forecast horizon, increasing to around 72½% of GDP by 2011.

18. THE NETHERLANDS Recovery from recession to be led by external demand
126
Strong downturn in 2008 leading to a strong policy response
As one of the most open economies in Europe the Netherlands could not remain untouched by the effects of the global economic and financial crisis. As a result, the high economic growth recorded in the Netherlands in 2006 and 2007 came to a sudden end in the second quarter of 2008. Thereafter, the economic downturn accelerated further, with a contraction of 1.1% quarter-on-quarter in the fourth quarter, as exports were particularly severely hit by the abrupt fall in world trade. A sizable effort from the government to stabilise financial markets helped financial institutions to cope with the crisis, although Dutch financial institutions remain vulnerable. Despite the sharp downturn, neither public finances nor the labour market reacted immediately, with the government budget still posting a surplus in 2008 (0.7% of GDP) and unemployment even falling to 2.8% during 2008.
In response to the economic crisis, the Dutch government adopted a total of three recovery packages, containing stimulus measures which were broadly in line with the EERP. The first two packages, which were adopted at the end of 2008 and the beginning of 2009 amounted to ½% of GDP in both 2009 and 2010. The third package adopted in March 2009 in view of a further economic deterioration, was roughly twice the size of the two previous packages taken together, providing a total stimulus of around 2%. The stimulus measures were aimed at the areas most affected by the crisis, focusing on household purchasing power, private (and public) investment and employment protection.
Economy hit by weak external and domestic demand
GDP growth is projected to only just escape negative territory at the end of 2009, after six consecutive quarters of negative growth. The moderate recovery is expected to come from a rebound in external demand and should lead to zero growth in the fourth quarter. Overall in 2009, GDP should fall by 4½%, which is the sharpest contraction ever registered. In 2010, domestic demand is foreseen to show a protracted decrease, mostly due to lingering wealth effects, but its
negative contribution to GDP growth will most likely be more than offset by a positive one from net exports so that GDP growth comes out at 0.3%. A recovery in domestic demand, notably in private consumption, should then lead to a further recovery of economic growth - to 1.6% - in 2011.
Exports, which account for almost 80% of GDP, are expected to fall sharply in 2009, which will undoubtedly have a considerable negative impact on GDP growth. In line with the recovery in world trade, exports should post positive growth again in 2010 and 2011. In combination with the projected slower recovery of domestic demand, which leads to slower import growth, the contribution of net exports in 2010 and 2011 should be positive overall.
The global economic and financial crisis provoked a sharp decrease in asset prices. The resulting negative wealth effects led to a strong contraction in private consumption expenditure in the first half of 2009, despite a rise in real disposable income resulting from pre-crisis wage negotiations.
Graph II.18.1: The Netherlands - Unemployment and vacancy rates
0
1
2
3
4
5
6
7
01 02 03 04 05 06 07 08 09 10 11Unfilled vacancy rate Unemployment rate
forecast
% of labour force
Negative wealth effects seem to have a larger impact on consumption in the Netherlands than in other European countries. Household wealth is influenced by falling asset prices, both directly via households' role as investors, and indirectly through the impact on pension fund assets. The wealth losses suffered by households are foreseen to have a prolonged upward effect on their saving rate which is expected to increase by about 5 pp. in 2009 to 18%. In combination with precautionary saving, in view of adverse unemployment expectations this should lead to a further

Member States, The Netherlands
127
contraction of private consumption in 2010. As the labour market adjusts to lower production levels, unemployment is expected to roughly double over the forecast period, to around 6%. Until now, the increase in unemployment has been dampened by flexible working hour arrangements, the part-time working scheme introduced by the government and labour hoarding, as companies are reluctant to let qualified personnel go. With unemployment growth expected to start decreasing from 2011 onwards, the savings rate is expected to start to (slowly) adjust downwards.
A sharp decrease in production caused by global weak demand and tightening credit conditions, resulted in a historically low capacity utilisation rate. This, combined with widespread declines in profits and the need to strengthen their balance sheets, means that businesses are expected to sharply cut their investment by almost 15% in 2009. The strongest decline will most likely be recorded by cyclically-sensitive investment. Construction should show a prolonged contraction, which could last well into 2010, because of its relatively long planning period, resulting in a negative private investment growth close to 8% in 2010. With replacement investment picking up again, gross fixed capital formation is foreseen to recover moderately in 2011, showing a growth of ½%.
Graph II.18.2: The Netherlands - Government balance and debt
-40
-20
0
20
40
60
80
96 97 98 99 00 01 02 03 04 05 06 07 08 09 10 11
% of GDP -7-6-5-4-3-2-10123
% of GDP
General government debt (lhs)Deficit threshold (3%)Government balance (rhs) - reversedDebt threshold (60%)
forecast
Since consumer gas prices are only adjusted twice a year, energy prices tend to have long adjustment lags in the Netherlands. This led to part of the sharp increase in energy prices in 2008 only being passed through to consumer prices in the first half of 2009. This limits the expected decrease in inflation in 2009, which is now projected to come out at around 1% in 2009, from just over 2% in 2008. For 2010 and 2011, inflation is forecast to
remain relatively stable as it will remain difficult for producers to strongly increase prices to restore profit margins.
This scenario is subject to both positive and negative risks. On the positive side, a more dynamic recovery in world trade would lead to a stronger contribution of exports to growth. Negative risks are mainly related to ongoing uncertainties in the financial sector. The risk to the stability of the financial sector has not yet fully disappeared, due to its relatively large exposure to troubled markets. This may also lead to a structural lower supply of credit, which could hamper a sustained economic recovery.
Sustained recovery linked to competitiveness
Although the significantly positive trade balance in 2008 pointed to a relatively favourable competitive stance, a closer look reveals that Dutch price and cost competitiveness have been deteriorating since 2000 as unit labour costs have increased more sharply than in neighbouring countries. The dynamic development of unit labour costs is mainly due to a relatively strong increase in compensation of employees and to a much lesser extent to productivity developments. Despite a policy of wage moderation in 2004 and 2005, employees have profited from a generally tight labour market over the past years, which put upward pressure on wages. For the coming years, the government has announced a renewed policy of wage moderation. Combined with the expected loosening of the labour market, this could exert downward pressure on wage increases, thereby improving competitiveness. This would in turn increase the probability for the Netherlands to benefit fully from the expected recovery in external demand in 2010 and 2011.
In the short run, labour supply is negatively affected by discouraged workers. Some rigidity in the labour market, as reflected for example by difficulties in work-to-work transitions, may lead to some hysteresis in the aftermath of the crisis. This could also hamper labour productivity and could eventually limit the possibilities for future real wage growth without damaging competitiveness. In the long run, the labour market is expected to tighten again, as a result of ageing. This will lead to a structural decrease in the labour force and thus in labour supply, which could have an adverse effect on future wage growth and competitiveness.

European Economic Forecast, Autumn 2009
Table II.18.1:Main features of country forecast - THE NETHERLANDS
2008 Annual percentage changebn Euro Curr. prices % GDP 92-05 2006 2007 2008 2009 2010 2011
GDP 595.9 100.0 2.6 3.4 3.6 2.0 -4.5 0.3 1.6 Private consumption 272.5 45.7 2.3 -0.3 1.7 1.3 -2.7 -0.6 0.6 Public consumption 151.8 25.5 2.1 9.5 3.7 2.0 2.4 0.7 0.4 Gross fixed capital formation 121.7 20.4 2.6 7.5 4.8 4.9 -11.7 -6.0 0.4 of which : equipment 40.4 6.8 3.9 11.4 7.8 4.0 -14.8 -6.1 3.1 Exports (goods and services) 457.4 76.8 6.2 7.3 6.7 2.7 -10.8 1.9 4.1 Imports (goods and services) 407.6 68.4 6.0 8.8 5.1 3.7 -10.6 0.5 2.9 GNI (GDP deflator) 580.2 97.4 2.6 5.7 2.4 -2.1 -4.6 0.0 1.4 Contribution to GDP growth : Domestic demand 2.2 3.5 2.7 2.1 -3.0 -1.2 0.4
Stockbuilding 0.0 0.2 -0.6 0.3 -0.5 0.4 0.0Foreign balance 0.4 -0.3 1.5 -0.4 -1.0 1.0 1.1
Employment 1.0 1.6 2.3 1.2 -0.1 -2.1 -0.9 Unemployment rate (a) 4.5 3.9 3.2 2.8 3.4 5.4 6.0 Compensation of employees/f.t.e. 3.6 2.4 3.4 3.8 2.6 2.5 1.7 Unit labour costs whole economy 2.0 0.7 2.1 2.9 7.4 0.1 -0.8 Real unit labour costs -0.4 -1.1 0.5 0.2 6.2 -0.8 -2.2 Savings rate of households (b) - - 13.8 13.1 18.1 18.4 17.9 GDP deflator 2.4 1.8 1.6 2.7 1.0 1.0 1.4 Harmonised index of consumer prices 2.2 1.7 1.6 2.2 1.1 0.9 1.2 Terms of trade of goods 0.5 -0.3 -0.3 -0.1 0.3 -0.5 0.1 Trade balance (c) 5.7 7.7 8.0 7.4 6.0 6.2 6.8 Current account balance (c) 5.4 9.0 8.5 4.2 3.1 3.1 3.9 Net lending(+) or borrowing(-) vis-à-vis ROW (c) 5.1 8.7 8.1 3.9 2.7 2.7 3.6 General government balance (c) -1.7 0.5 0.2 0.7 -4.7 -6.1 -5.6 Cyclically-adjusted budget balance (c) -1.5 0.1 -1.3 -1.0 -3.2 -4.4 -4.3 Structural budget balance (c) - 0.1 -1.3 -1.0 -3.6 -4.4 -4.3 General government gross debt (c) 63.4 47.4 45.5 58.2 59.8 65.6 69.7 (a) Eurostat definition. (b) gross saving divided by gross disposable income. (c) as a percentage of GDP.
128
Rapid deterioration of public finances
In 2009, the budget is foreseen to show the sharpest drop ever recorded in the Netherlands. The surplus of 0.7% of GDP posted in 2008 has turned into a deficit of 4.7% of GDP in 2009. Despite the relatively good starting position, the recovery measures taken by the government in response to the economic crisis, the full working of the automatic stabilisers and decreasing gas revenues have eroded the budgetary position very quickly. In 2010, the deficit will most likely widen further to over 6% of GDP, as unemployment benefits and interest expenditure in particular will show further increases.
The recovery packages, amounting to about 1% of GDP in 2009, are planned to be continued in 2010. Depending on growth dynamics, they will be (partially) reversed in 2011. Furthermore, government plans indicate the start of consolidation in 2011. This would lead to an improvement of the budget to around 5½% of GDP in 2011.
After the sharp increase in the debt level in 2008, because of government operations to stabilise the financial markets (amounting to approximately 15% of GDP), debt is set to increase further over the forecast period, mainly as a result of the
deficits exceeding nominal GDP growth. In 2009 it would come very close to 60.0% of GDP and should further increase to 70% of GDP in 2011, reaching a level not recorded since 1996.
In March 2009, the government updated the budgetary framework by removing the cyclically sensitive unemployment benefits from the expenditure ceilings. This measure prevented pro-cyclical budget cuts as a result of increasing unemployment. It also resulted in a strengthening of the automatic stabilisers, which at the same time negatively affected the general government balance. In principle this is a temporary measure, although there is not yet a clear indication of how it will eventually be reintegrated under the expenditure ceiling.
Measures were also announced to improve the long-term sustainability of public finances. Most importantly, the government decided to increase the pensionable age from 65 to 67 in two steps (to 66 in 2020 and 67 in 2025).

19. AUSTRIA From export-led recession to gradual export-led recovery
129
Gradual slowdown turns into recession
The global financial and economic crisis has pushed the Austrian economy into the deepest recession in post-war history. The Austrian financial system was fairly well balanced at the onset of the crisis, mainly due to the predominance of a retail banking system, sound balance sheets in the corporate and financial sector, the absence of a domestic real estate bubble and only negligible financial investment in toxic assets. However, the Austrian economy was unable to escape the global shock-waves of the financial crisis. As international financial markets' risk aversion towards countries in Central and Eastern Europe (CEE) rose sharply, the strong engagement of Austrian banks in this region led to a critical international reassessment. As a consequence, bank share values dropped sharply and risk premia for Austrian bank credit-default swaps increased. In addition, the economic downturn has primarily been transmitted to the Austrian economy by falling exports, reflecting the collapse in world trade, and shrinking fixed investment in the light of declining demand as well as tighter credit market conditions. As a consequence of the slump, labour market conditions and public finances are set to deteriorate sharply in 2009 and 2010.
After three years of strong mainly export-driven growth, economic activity in Austria lost momentum already in 2008. Initially the gradual deceleration was caused by weakening consumer demand stemming from a fall in the purchasing power of private households caused in turn by of a sharp increase in inflation. In the second half of the year external factors became predominant, in the wake of the evolving global economic crisis.
Policy measures to support recovery
At the end of 2008, monetary and fiscal policy initiatives were undertaken across the world with the aim of dampening the downturn and stabilising financial markets. As part of the European Economic Recovery Plan (EERP) the Austrian government introduced discretionary fiscal measures providing a timely stimulus, as a large part of these took effect in the first four months of 2009. Two economic recovery programmes, income tax cuts and two labour-market-support packages were introduced which focused on
supporting income, reducing lay-offs and improving access to training, sustaining investment and facilitating access by the private sector to finance. Support to credit-constrained enterprises came mainly in off-budget form as guarantees and subsidised loans. To support the automotive sector, a premium was offered for scrapping old cars in conjunction with the purchase of new ones. Together with fiscal measures taken in 2008 to support private household purchasing power, which became effective in 2009, fiscal support to the tune of 1½% of GDP was implemented in 2009. In addition to discretionary measures, automatic stabilisers were allowed to operate freely. As a small and very open economy, Austria benefited from action taken by other countries within the EERP. It is estimated that the stimulus undertaken by Austria's European partners almost doubled the supportive impulse taken by the Austrian government, highlighting the importance of coordinated fiscal measures.
The banking sector suffered from profit reductions in 2008, in particular from their foreign activities in CEE, where Austrian banks hold the largest share of total foreign claims. To stabilise financial markets, several measures were taken, including: guarantees of bank deposits held by individuals; and the provision of guarantees up to 24% of GDP for interbank loans, bond issues by the newly-funded Austrian Clearing Bank and commercial paper issues by banks. In addition, the government has allocated up to EUR 15 billion (5½% of GDP) for capital injections and asset relief measures to financial institutions. By the end of September 2009, EUR 6 billion of these funds had effectively been called. As indicated by assessments by the Austrian financial market surveillance authorities, the Austrian financial sector is still in a solid position and would remain so even if, in contrast to the forecast presented here, economic prospects in Austria and CEE were to deteriorate more sharply.
A deep recession in 2009
The outlook features a sharp contraction of the economy over 2009: GDP is projected to shrink by 3¾%, reflecting a severe fall in net exports and private investment. Private consumption growth, although much lower than in recent years, has become a stabilising factor.

European Economic Forecast, Autumn 2009
130
Foreign trade declined strongly in the first half of 2009, as the recession in Austria’s main trading partners (Germany, Italy and some of the new member states in CEE) deepened. Although the external competiveness of the Austrian manufacturing sector further improved in 2008, the negative external demand effects could not be avoided. The strongly export-oriented manufacturing sector has suffered most, as merchandise exports are forecast to shrink by 16% in 2009. As a consequence, private investment in equipment is set to fall by 12% in 2009, because of worsening corporate profits, low capital utilisation, higher lending margins and tighter credit conditions, especially for larger enterprises, which also face tighter conditions for issuing corporate bonds and raising equity capital. Due to several fiscal measures (such as infrastructure investment and subsidies for thermal renovation of buildings), the projected decline is less severe for investment in construction.
Despite lower capital income and a weakening labour market, private consumption should benefit from rising real disposable income, as wages increase, inflation has dropped off quickly, income taxes have been cut, and transfer payments have risen. As a result, and in contrast to most other euro-area countries, real private consumption is projected to increase, by ½% in 2009. At the same time, it is expected that a large part of the increase in disposable income will be saved by private households, thereby raising the savings rate.
Graph II.19.1: Austria - GDP growth and contributions
-6
-3
0
3
6
95 96 97 98 99 00 01 02 03 04 05 06 07 08 09 10 11Net tradeDomestic demandGDP growth (y-o-y%)
pps.forecast
Signs of a muted but steady recovery
Business surveys and other leading indicators point to an improving economic situation since the middle of 2009 and economic growth is expected to resume as of the third quarter of 2009. While
private domestic demand may still stay sluggish for some time, fiscal policy is set to stimulate demand also in 2010. As a consequence, the domestic component of economic activity will remain policy-driven, while endogenous forces of growth are too weak to stimulate a self-sustained recovery. Foreign demand is expected to strengthen gradually as a result of support from policy worldwide, leading to a pick-up in Austrian exports. Subsequently, domestic industrial output will start growing again. Indeed, some firms have already reacted and switched back from short-time work to normal working hours. The slump in investment in machinery and equipment is expected to come to an end with a revival of industrial production. Tax incentives for enterprises in 2010 are also likely to encourage firms to invest in new production facilities. Equipment investment is thus expected to edge up slightly but, due to a strong negative carry-over from 2009, the annual growth rate is likely to be still negative in 2010. While investment in public infrastructure is set to be supported by the fiscal stimulus packages, private residential building is expected to be trimmed further. Hence, domestic construction is expected to stay on a downward trend also in 2010.
For 2010 and 2011, GDP growth is forecast to pick up gradually to 1% and 1½% respectively. However, this scenario is subject to both positive and negative risks. On the positive side, a stronger recovery for the European economy as a whole could also lead to stronger demand for goods produced by Austrian firms, reinforcing the growth contribution of net exports and domestic fixed investment. If, however, the expected recovery of international trade is weaker, this would also drag down the prospects for the Austrian economy.
Low inflation and wages are set to moderate
Strong increases in food and energy prices resulted in a high rate of inflation in 2008 (3.2%). In 2009, consumer prices are expected to rise by a mere ½%, mainly on the back of strong base effects from declining fuel and heating oil prices and the downward pressure on profit margins from weak demand conditions. As commodity prices are expected to rise, inflation is forecast to rise to +1¼% in 2010. With the recovery gaining ground and a gradual rebound in profit margins, a further, yet small, increase in inflation is expected for 2011. Wage settlements negotiated for 2009 were based on the higher rate of inflation and strong

Member States, Austria
Table II.19.1:Main features of country forecast - AUSTRIA
2008 Annual percentage changebn Euro Curr. prices % GDP 92-05 2006 2007 2008 2009 2010 2011
GDP 281.9 100.0 2.1 3.5 3.5 2.0 -3.7 1.1 1.5 Private consumption 148.8 52.8 1.7 1.8 0.8 0.8 0.5 0.5 0.6 Public consumption 52.6 18.6 1.9 2.7 1.7 3.2 1.0 1.4 1.1 Gross fixed capital formation 61.5 21.8 1.4 2.4 3.8 1.0 -6.6 -0.3 3.0 of which : equipment 23.0 8.2 1.4 -0.5 5.0 0.0 -12.0 0.6 4.0 Exports (goods and services) 167.3 59.4 6.0 7.5 9.4 0.8 -13.7 2.1 3.5 Imports (goods and services) 151.1 53.6 5.0 5.3 7.3 -0.7 -9.8 1.6 3.1 GNI (GDP deflator) 277.4 98.4 2.2 3.3 2.6 2.5 -3.7 1.0 1.5 Contribution to GDP growth : Domestic demand 1.6 2.0 1.6 1.2 -1.0 0.5 1.2
Stockbuilding 0.0 0.2 0.1 -0.1 0.1 0.2 0.0Foreign balance 0.5 1.4 1.5 0.8 -2.9 0.3 0.3
Employment 0.4 1.0 1.6 1.8 -1.5 -0.7 0.3 Unemployment rate (a) 4.1 4.8 4.4 3.8 5.5 6.0 5.7 Compensation of employees/f.t.e. 2.6 3.4 3.0 3.1 3.0 2.0 2.6 Unit labour costs whole economy 0.9 1.0 1.0 2.9 5.4 0.2 1.3 Real unit labour costs -0.6 -0.7 -1.1 0.8 3.8 -0.7 -0.3 Savings rate of households (b) - - 16.0 16.7 18.3 19.2 19.8 GDP deflator 1.6 1.6 2.1 2.0 1.6 0.9 1.7 Harmonised index of consumer prices 1.9 1.7 2.2 3.2 0.5 1.3 1.6 Terms of trade of goods -0.1 -0.7 -0.5 -2.1 0.3 -0.7 0.4 Trade balance (c) -2.3 0.3 0.7 0.1 -2.2 -2.4 -2.1 Current account balance (c) -0.7 3.0 3.4 3.6 1.5 1.4 1.8 Net lending(+) or borrowing(-) vis-à-vis ROW (c) -0.9 2.7 3.3 3.6 1.4 1.3 1.7 General government balance (c) -2.6 -1.6 -0.6 -0.4 -4.3 -5.5 -5.3 Cyclically-adjusted budget balance (c) -2.5 -1.9 -1.7 -1.8 -3.3 -4.3 -4.0 Structural budget balance (c) - -1.9 -1.7 -1.8 -3.3 -4.3 -4.0 General government gross debt (c) 64.9 62.2 59.5 62.6 69.1 73.9 77.0 (a) Eurostat definition. (b) gross saving divided by gross disposable income. (c) as a percentage of GDP. Note : Contributions to GDP growth may not add up due to statistical discrepancies.
131
productivity growth in the previous years. As a reaction to the deterioration of economic activity in 2009, government policy measures to shield the labour market dampened the decrease in employment. As a consequence, productivity is expected to fall sharply while unit labour costs are set to rise. However, this increase is overstated to some extent because part of the wage costs for employees in short-time work is borne by the government. For 2010 and 2011, rising unemployment and low inflation are likely to contain wage pressures.
Despite a gradual slowdown of GDP growth in 2008 employment continued to expand by 1.8%. In 2009 and 2010, employment prospects will reflect both the weakness of economic activity and policy measures shielding the labour market. Short-time work and extended training in particular contribute to a smaller fall in employment than might have been expected given the scale of the contraction in activity. Total employment is forecast to fall by 1½% in 2009 and ¾% in 2010. Consequently, unemployment should increase sharply, from 3.8% of the workforce in 2008 to 5½% in 2009 and 6% in 2010. For 2011 only a slight improvement of labour market conditions is expected.
Public finances set to deteriorate
Public finances are set to deteriorate rapidly in 2009 to a deficit of 4¼% of GDP, and to worsen further to 5½% of GDP in 2010. This is the result of discretionary tax cuts and an erosion of tax bases and higher social expenditure in the wake of the recession. In addition, Austria has launched several fiscal measures to address the effects of the economic crisis on the real economy. In the light of the more critical assessment of the foreign business activities of Austrian banks and government support for financial markets, the risk premium on Austrian government long-term bonds also soared by as much as 130 basis point in early 2009. Although in the spring, the long-term interest rate spread vis-à-vis Germany came down again to around 50 basis points, it is still above pre-crisis levels. The financial markets support measures passed at the end of 2008 led to an increase in the debt-to-GDP ratio without raising the deficit. As a result of the expansionary fiscal stance and automatic stabilisers, government debt is expected to rise rapidly to 77% of GDP in 2011 after having dipped below 60% in 2007. Restoring the long-term sustainability of public finances will involve tackling fiscal consolidation once the crisis has abated, while supporting the still weak economic recovery and enhancing long-term potential growth prospects.

20. POLAND Weathering the crisis relatively well
132
Strong resilience during the crisis, supported by a mix of factors
Poland’s rapid growth over 2003-08 (5.1% on average over the period) did not give rise to any major macroeconomic imbalances, even if the economy started to face capacity utilisation constraints by the end of the period. The external position remained sustainable and the economic boom facilitated the reduction of the government deficit to a relatively low level – below 2 % of GDP in 2007. These sound fundamentals have helped the Polish economy weather the global crisis better than other central and eastern European countries. With real GDP growth projected at around 1¼%, Poland is expected to be the only country in the EU to post positive growth in 2009.
The resilience of the economy during the crisis also reflects a number of other factors. First, with a ratio of exports to GDP of about 40%, the Polish economy is relatively closed compared to its regional peers, which limited the size of the demand shock related to the sharp fall in exports at the turn of the year (12% in the first half of 2009, year-on-year). Second, the depreciation of the currency (down 41% against the euro over the period August 2008-Fabruary 2009) is set to translate into a positive contribution of net exports in 2009, as the estimated fall in exports should be more than offset by the even larger projected fall in imports. The latter is being driven by the decline in domestic demand and a price-driven shift in its composition from imported goods towards domestically produced goods and non-tradables. Third, an investment-focused recovery plan and the inflow of EU funds have partly cushioned the decline in investment, which was severely affected by the underutilisation of production capacities and tighter credit conditions. Fourth, fiscal measures in support of households' disposable income (cuts in personal income tax rates and high indexation of pensions) have limited the deceleration of private consumption.
The Polish banking system has been resilient during the crisis, mainly due to the predominance of universal banks, a relatively conservative regulatory policy and sound balance sheets in the corporate and financial sectors. Still, the crisis has increased risk aversion in the banking sector,
which has led to a tightening of lending conditions, particularly for the corporate sector.
Extended slowdown and muted rebound over the forecast horizon
The outlook features sluggish growth in 2010 and a moderate rebound in 2011. Real GDP is projected to increase by 1¾% in 2010 and 3¼% in 2011. The main drivers of this recovery are the recovery plan, the gradual rebound of global trade, and softer monetary conditions – reflecting monetary easing and the easing of financial stress in international capital markets.
The recovery is however likely to be delayed by unfavourable labour market developments at the turn of 2009-10, reflecting a lagged response to the effects of the economic downturn. Falling employment and slowing real wages should weigh on real disposable income and, combined with higher precautionary savings, depress consumption. Investment spending is expected to be moderately positive in 2010, the planned growth in public investment being almost totally offset by the expected fall in private investment, which is in turn explained by still tight financing conditions, falling housing investment and overcapacity in certain sectors. The rebound in external demand is set to support export growth in 2010, though the increase in market shares may already be negatively affected by the recent appreciation of the currency (up 11% against the euro over the period February-September 2009).
-5
-3
-1
1
3
5
7
9
06 07 08 09 10 11
Inventories DomesticExternal Total growth (y-o-y%)
forecast
Graph II.20.1: Poland - GDP growth and contributions
pps.
In 2011, real GDP growth is projected to further accelerate to about 3¼%. As the effects of the

Member States, Poland
133
crisis fade away and the world economy continues to recover, these developments should be supported by stronger domestic demand and export growth. The stabilisation of the situation in the labour market is set to underpin a recovery in private consumption. In parallel, higher FDI inflows, public spending in infrastructure, growing capacity utilisation and a recovery in the housing market are projected to support investment. Stronger export growth is expected in 2011. However, the increase in domestic demand, combined with the appreciation of the currency fuelling imports in 2010, should also lead to an acceleration of import growth, turning the contribution of net exports to growth slightly negative.
Inflation is expected to remain low over the forecast horizon, reflecting the large negative output gap following the crisis and the dampening effects of the appreciating currency in 2010. It should however slightly increase in 2011, pushed up by the rebound in economic activity and, to a lesser extent, in unit labour costs.
This scenario is subject to both positive and negative risks. On the positive side, a more resilient labour market and lower precautionary household savings would boost private spending. On the negative side, a stronger appreciation of the currency could hamper exports while increasing the cost competitiveness of imported goods and contributing negatively to growth. In addition, the deteriorating situation of public finances could affect market sentiment adversely, thus limiting financial inflows and increasing the costs of borrowing.
Sustainable growth dependent on labour market reforms
While the Polish economy has remained surprisingly resilient during the crisis, a key challenge for the years ahead is to ensure that it remains on a sustainable growth path over the medium-term. One of the main issues in this respect is the low labour force participation rate. The sustained and robust economic performance of the economy since 2003 has translated into growing employment and a steeply falling unemployment rate. However, the employment rate has remained low (59.2% in 2008). More specifically, Poland's labour market challenge seems to be particularly acute at both ends of the working age population, with a poor relative
performance for both relatively young and relatively old workers. The high unemployment and low participation rates of young workers might be partly explained by a relatively high minimum wage (which may discourage firms from hiring the least productive workers), the return of emigrants affected by the crisis in other EU countries, and the poor quality occupational education system which does not always provide young workers with the appropriate skills. The participation of older workers in the labour market is discouraged by a relatively generous early retirement system and a high tax wedge, although recent reforms have improved the situation.
Increased competitiveness would also boost growth
The depreciation of the currency has played a key role in supporting growth by improving the price competitiveness of Polish exports and limiting imports. However, this effect will vanish in the coming quarters and in the medium-term the competitiveness of the export sector will largely depend on its capacity to continue to upgrade the product structure, which is gradually moving in the direction of research-intensive goods and high-technology industries. As there is a risk that the contribution of foreign direct investments to this change in specialisation will be more limited in the future, domestically driven productivity improvements induced by investments in R&D will have to play an even more important role than in the past.
Persistently high structural fiscal deficits
The structural position of Polish government finances was relatively weak at the outset of the crisis. The headline deficit had been reduced to below 2% of GDP in 2007, but this was in a period of high real GDP growth during which the economy was operating above potential. The sharp swing in the output gap from positive to negative territory between 2007 and 2009 exposed these underlying problems, and the general government deficit is set to widen by 4½ percentage points of GDP in that period.
Poland is expected to experience a sizeable deterioration of its government finances in 2009-11, with the general government deficit forecast to rise from 3.6% of GDP in 2008 to 6.4% of GDP in 2009 and about 7½% in 2010 and 2011. While the projected increase in the deficit mainly reflects the

European Economic Forecast, Autumn 2009
Table II.20.1:Main features of country forecast - POLAND
2008 Annual percentage changebn PLN Curr. prices % GDP 92-05 2006 2007 2008 2009 2010 2011
GDP 1272.8 100.0 4.3 6.2 6.8 5.0 1.2 1.8 3.2 Private consumption 785.2 61.7 4.2 5.0 4.9 5.9 2.1 1.3 3.3 Public consumption 236.3 18.6 3.1 6.1 3.7 7.5 1.0 1.0 1.8 Gross fixed capital formation 280.9 22.1 6.3 14.9 17.6 8.2 -1.9 1.9 5.0 of which : equipment 107.9 8.5 - 17.1 22.3 10.9 -7.3 0.5 4.5 Exports (goods and services) 508.9 40.0 10.7 14.6 9.1 7.1 -11.2 2.9 5.7 Imports (goods and services) 559.5 44.0 11.2 17.3 13.7 8.0 -14.1 3.3 6.7 GNI (GDP deflator) 1239.3 97.4 4.5 5.5 5.6 6.0 1.4 1.5 3.2 Contribution to GDP growth : Domestic demand 4.5 7.0 7.2 6.7 1.1 1.4 3.4
Stockbuilding 0.0 0.4 1.7 -1.1 -1.6 0.6 0.3Foreign balance -0.2 -1.1 -2.1 -0.6 1.7 -0.2 -0.5
Employment - 3.2 4.4 3.8 -0.7 -1.1 0.1 Unemployment rate (a) 15.2 13.9 9.6 7.1 8.4 9.9 10.0 Compensation of employees/head 18.0 1.8 4.9 8.1 4.5 1.5 3.1 Unit labour costs whole economy - -1.1 2.6 6.9 2.6 -1.4 0.0 Real unit labour costs - -2.5 -1.3 3.8 -1.1 -2.8 -2.6 Savings rate of households (b) - - 8.8 7.7 8.3 8.5 8.0 GDP deflator 13.8 1.5 4.0 3.0 3.7 1.5 2.6 Harmonised index of consumer prices - 1.3 2.6 4.2 3.9 1.9 2.0 Terms of trade of goods 0.2 -0.3 2.0 -2.1 2.5 -0.9 0.3 Trade balance (c) -3.0 -2.0 -4.0 -4.9 -2.8 -3.1 -3.4 Current account balance (c) -1.9 -3.0 -5.2 -5.1 -1.9 -2.8 -3.2 Net lending(+) or borrowing(-) vis-à-vis ROW (c) -1.2 -2.1 -4.1 -4.0 -0.2 -0.3 -0.7 General government balance (c) - -3.6 -1.9 -3.6 -6.4 -7.5 -7.6 Cyclically-adjusted budget balance (c) - -4.1 -2.9 -4.7 -6.3 -6.6 -6.7 Structural budget balance (c) - -4.1 -2.9 -4.7 -6.4 -6.6 -6.7 General government gross debt (c) - 47.7 45.0 47.2 51.7 57.0 61.3 (a) Eurostat definition. (b) gross saving divided by gross disposable income. (c) as a percentage of GDP.
134
effects of the economic downturn, its overall size reflects a persistently high structural deficit, which is expected to hover at about 6½% of GDP over the forecast period. These projections take into account the 2010 draft budget.
The expected worsening of government finances in 2009 in part reflects the effect of discretionary measures, mainly the personal income tax cut with a budgetary cost estimated at about ¾ p.p. of GDP in 2009. The deterioration in tax revenues is mainly due to the unfavourable composition of growth. On the expenditure side, social transfers have been dynamic, reflecting their indexation to past prices and wages. In addition, the impact of the replacement of early pensions with less costly “bridge pensions”, which appears to have reduced the number of new early retirees, was offset by an increase in unemployment benefits as well as a rise in regular retirement and other types of transfers, such as sickness benefits, as a result of the crisis. In 2010, total expenditure is projected to increase by 2 pps. of GDP, mainly on the back of increasing social transfers and interest expenditure, and a very high increase in the public investment ratio (by about 1½ pp. of GDP). The latter is however supposed to be broadly neutral for the fiscal balance because it will be to large extent financed by more capital transfers from the EU funds. This absorption should contribute strongly to the
stimulation of the economy, while enhancing the long-term growth potential through an upgrade of public infrastructure.
As a consequence of high deficits, gross debt is projected to increase sharply from slightly above 47% of GDP in 2008 to more than 61% in 2011. The projected debt figures are subject to significant uncertainty because of the high volatility of the exchange rate and the ensuing valuation effects of the foreign-denominated part of the debt (which is more than ¼ of the total debt). Finally, given the higher global risk aversion of investors, interest expenditure is projected to rise significantly over the period, further limiting the margin for manoeuvre on the fiscal side.

21. PORTUGAL Gradual and shallow recovery
135
Impact of the crisis and policy response in 2009
Since the early 2000s, Portugal has been recording weak economic growth below the euro-area average. This has been characterised by persistently low productivity, eroded competitiveness, rising unemployment and a sizeable external deficit. The current crisis has exacerbated these weaknesses and some of those imbalances are being corrected only slowly and partially. Under the impact of the international crisis, GDP began to fall already in late 2008, reversing the earlier mild upward trend. Annual GDP stagnated. In 2009, GDP is projected to contract by nearly 3%, with all its components falling, barring government consumption. Exports, imports and investment are contracting most, by over double-digit figures, while the fall in private consumption is relatively contained.
The policy response to the crisis has consisted mainly of the implementation of discretionary measures to stimulate the economy, together with the pursuit of structural reforms. The fiscal stimulus – focused on public investment, social protection and support to employment, investment and exports by the private sector – has amounted to about 1¼% of GDP in 2009. Some other fiscal measures include support to households and firms as well as a cut of one point in the standard VAT rate already in mid-2008. At the same time, while the direct impact of the financial crisis on the Portuguese banking sector has been relatively contained, a series of measures have been implemented to strengthen financial stability. Against this backdrop, the challenge is to put the Portuguese economy on a footing of higher and sustained long-term GDP growth, while restoring competitiveness. These are necessary conditions for a sustained reduction of the large external deficit.
Mild recovery over the forecast period
The current outlook is one of stagnation of economic activity in 2010, to be followed by a moderated upswing in 2011, with GDP growing by 1%. Domestic demand is projected to essentially stagnate in 2010, mirroring a mild recovery of private consumption and still shrinking investment. However, growth in investment is set to turn
moderately positive, thus pushing domestic demand to increase more significantly in 2010.
Sluggish labour income, with the unemployment rate reaching historical highs is expected to lead private consumption to be relatively weak in 2011. In addition, after a trough in interest rates, the burden of servicing the relatively high level of household debt will dampen disposable income. At the same time, access to credit remains more difficult than in the past as the result of tighter credit conditions imposed by financial institutions, in the context of high household indebtedness. The saving rate of households is expected to remain at around 8% of gross disposable income, higher than the rates recorded in recent years.
Investment is projected to keep falling in 2010 and to recover mildly in 2011. Against still weak demand prospects and dampened profitability, few incentives will exist for investment. In addition, the coming years are expected to be characterised by the consolidation of corporate balance sheets as average credit conditions are likely to be stricter than before, which will trigger some deleveraging and limit the room for private investment.
Graph II.21.1: Portugal - Net external l iabil ities, GDP and GNI
98
100
102
104
106
108
110
00 01 02 03 04 05 06 07 08 09 10 11
index
0
20
40
60
80
100
120
Net external liabilities (rhs) GDP (lhs) GNI (lhs)
% of GDPforecast
The present outlook for domestic demand is subject to a number of interrelated uncertainties. On the one hand, the recent fall in interest rates could relieve debt service burdens for both households and corporations still well into 2010. And the record low inflation rates could underpin real disposable income growth more than assumed in the current outlook. On the other hand, subdued employment prospects, and especially the possibility of a rise in long-term unemployment,

European Economic Forecast, Autumn 2009
136
might damage confidence and lead to a further rise in household savings. Last but not least, given the large borrowing needs of the Portuguese economy, mirroring the large external deficit, the pace of domestic spending and savings will crucially depend on the financial conditions that prevail in the future.
Exports are projected to follow the external demand recovery, which is expected to be shallow given the rather bleak outlook for imports by the country's main trading partners, notably Spain, which accounts for around a quarter of Portuguese exports. In addition, an expected deterioration in competitiveness will limit the rebound in exports in the medium term. The contraction in imports is expected to be smaller in 2010. Imports are expected to grow in 2011, largely following the path of final demand. All in all, the contribution of net exports to GDP growth is forecast to remain positive, while declining in both 2010 and 2011.
Unemployment continues to raise challenges for labour market functioning
The crisis keeps weighing on employment, which is projected to shrink by nearly ½% in 2010, after a significant contraction of 2¼% this year. In 2010 and 2011, the unemployment rate may reach some 9¼%, the highest rate in decades. Yet the increase in the unemployment rate is expected to be dampened by the fall in labour participation. Wage moderation is expected to follow but only in a gradual way.
External deficit remains large…
With the crisis the current account deficit is set to fall from 12% of GDP in 2008 to 10% of GDP in 2009. But the correction is not expected to continue over the medium term. The trade balance, affected by a weak exports performance and a rebound in commodities prices, is expected to hinder any further improvements in 2010 and 2011. Overall, this unsustainable external deficit path highlights the insufficiency of the domestic savings and the competitiveness position.
The long period of large external deficits has added to net external liabilities that have now reached 100% of GDP. The servicing of these liabilities will continue to absorb a non-negligible share of income over the medium term, mirrored in the deficit in the primary income balance. The primary income deficit is already a major
component of the current account as well as an element of rigidity in the narrowing of the overall external deficit. As a result, the gap between the gross domestic product and gross national income remains large.
…while productivity growth remains sluggish…
Thus, addressing the external imbalance hinges upon a sustained recovery in the trade balance, which depends on the competitive position of the country. Productivity growth in Portugal has been sluggish during the last decade, partly on account of labour market rigidities such as high employment protection and insufficient human capital accumulation. These weaknesses have led to a further widening of the large productivity gap with respect to the euro-area. Measured productivity is projected to grow by just over ¾% on average in 2010/2011, thus remaining below the euro-area average. From a longer term perspective, the challenge is to lift productivity growth in a sustained way, which will support competitiveness as well as boosting potential GDP growth.
Cost competitiveness developments also reflect inadequate wage and price behaviour, including also the weak response of wages to productivity and labour market developments. After growing strongly in 2009, nominal compensation per employee is projected to decelerate to 2% in 2010 and 2011, above productivity growth. Furthermore, combined productivity and wage developments are expected to lead to higher unit labour costs growth than in most of the country's main trading partners, thereby hampering the potential of the external sector to contribute more to the recovery in overall economic activity.
Graph II.21.2: Portugal - Government debt
0102030405060708090
100
00 01 02 03 04 05 06 07 08 09 10 11
% of GDP
2.0
2.5
3.0
3.5
4.0
Gross debt (lhs) Interest (rhs)
% of GDPforecast
After a fall in the price level in 2009, inflation is projected to return to positive territory reaching

Member States, Portugal
Table II.21.1:Main features of country forecast - PORTUGAL
2008 Annual percentage changebn Euro Curr. prices % GDP 92-05 2006 2007 2008 2009 2010 2011
GDP 166.4 100.0 2.2 1.4 1.9 0.0 -2.9 0.3 1.0 Private consumption 110.7 66.5 2.5 1.9 1.6 1.7 -0.9 0.6 0.7 Public consumption 34.5 20.7 2.7 -1.4 0.0 0.7 1.7 0.7 0.7 Gross fixed capital formation 36.1 21.7 2.2 -0.7 3.1 -0.7 -15.2 -4.1 1.1 of which : equipment 12.2 7.3 3.0 6.6 8.1 4.6 -21.7 -6.8 0.6 Exports (goods and services) 54.9 33.0 5.3 8.7 7.8 -0.5 -14.0 0.7 3.3 Imports (goods and services) 70.8 42.5 5.8 5.1 6.1 2.7 -13.7 -0.2 2.2 GNI (GDP deflator) 159.7 96.0 2.1 -0.3 1.7 -0.4 -2.7 0.4 1.1 Contribution to GDP growth : Domestic demand 2.7 0.8 1.8 1.1 -3.5 -0.2 0.8
Stockbuilding 0.2 0.1 0.1 0.3 -0.6 0.3 0.1Foreign balance -0.7 0.6 0.0 -1.2 1.2 0.3 0.1
Employment 0.5 0.5 0.0 0.4 -2.3 -0.4 0.1 Unemployment rate (a) 5.8 7.8 8.1 7.7 9.0 9.0 8.9 Compensation of employees/head 6.3 2.1 3.4 3.1 4.7 2.0 2.0 Unit labour costs whole economy 4.5 1.3 1.4 3.6 5.4 1.2 1.0 Real unit labour costs 0.3 -1.5 -1.5 1.5 4.9 0.4 -0.6 Savings rate of households (b) - - 6.1 6.4 8.6 7.8 7.8 GDP deflator 4.2 2.8 3.0 2.1 0.5 0.8 1.6 Harmonised index of consumer prices 3.7 3.0 2.4 2.7 -1.0 1.3 1.4 Terms of trade of goods 0.4 0.4 1.5 -2.3 2.2 -1.4 -0.2 Trade balance (c) -9.9 -10.1 -10.1 -12.1 -9.5 -9.7 -9.7 Current account balance (c) -7.4 -10.4 -9.8 -12.1 -10.2 -10.2 -10.2 Net lending(+) or borrowing(-) vis-à-vis ROW (c) -5.1 -9.3 -8.5 -10.3 -8.5 -8.6 -8.6 General government balance (c) -4.0 -3.9 -2.6 -2.7 -8.0 -8.0 -8.7 Cyclically-adjusted budget balance (c) -4.0 -3.6 -2.8 -2.6 -6.6 -6.7 -7.5 Structural budget balance (c) - -3.6 -3.0 -3.5 -6.6 -6.7 -7.5 General government gross debt (c) 56.1 64.7 63.6 66.3 77.4 84.6 91.1 (a) Eurostat definition. (b) gross saving divided by gross disposable income. (c) as a percentage of GDP.
137
1¼% in 2010 and 2011. Whereas, the prices of oil and other commodities have been a key driver of the negative inflation rate in 2009, they may create some inflationary pressures in 2010 and 2011. However, sluggish demand prospects are an offsetting factor. After a negative inflation differential with the euro area in 2008 and 2009, the gap may turn positive again in the years ahead.
…and public finances deteriorate
Public finances are strongly affected by the fall in economic activity. In 2009, the government deficit is expected to be 8% of GDP in 2009, after recording 2.7% of GDP in 2008.
Fiscal slippages in 2009 reflect the severity of the economic downturn. Notably, sharp falls in tax revenue are being recorded and, at the same time, a rocketing expenditure-to-GDP ratio is expected given the fall in nominal GDP coupled with a marginal acceleration in underlying spending. The upswing in spending is the result of higher increases in nominal government wages and social benefits outlays when compared with earlier years, as well as of the customary anti-cyclical behaviour of a number of social transfers. In addition, discretionary measures taken largely in response to the downturn and amounting to around 1½% of
GDP in 2009 are weighing further on the budgetary position.
On the basis of unchanged policies, the government deficit is expected to remain largely stable in 2010 and to rise to 8¾% of GDP in 2011. Although the assumed reversal in 2010 of most of the 2009 temporary fiscal expansion measures, as announced in the January 2009 update of the Stability Programme, will relieve some pressure from public finances, the sluggish pace of economic activity will not help narrow the fiscal imbalance. It is not only government revenue that is hurt by the downturn: expenditure too is expected to grow in excess of the sluggish nominal GDP over the entire forecast period.
With high deficits and continued low GDP growth, government debt is rising rapidly, and may reach as much as 91% of GDP in 2011, up from 66% of GDP in 2008. High government debt ratios, coupled with an assumed rebound in interest rates, should lead to a fast increase in interest spending, which is already a major force behind the projected deficit increase in 2011.

22. ROMANIA Gradual recovery and correction of imbalances under way
138
High external and fiscal imbalances increased Romania's exposure to the global economic downturn
The economic boom between 2004 and 2008 has led to overheating pressures and unsustainable fiscal and external imbalances: real GDP growth in this period averaged 6.6%; inflation peaked at 8.4% in Q2-2008; the current account deficit reached 12.3% of GDP in 2009; banks and other businesses were increasingly reliant on short-term external funding; and half of domestic private credit was in foreign currency. Moreover, years of procyclical budgetary policy had led to a sizeable deterioration in the underlying fiscal position, with the structural deficit rising from 2.4% of GDP in 2005 to 8.5% of GDP in 2008. Market participants and economic agents became increasingly concerned by these developments. This resulted in a significant tightening of capital flows to Romania and stress in the banking system. Pressures on the exchange rate increased, resulting in a more than 30% cumulative depreciation between August 2007 and January 2009. Balance-sheet effects and a sharp decline of export demand plunged the economy in a severe recession in late 2008.
In these conditions, the authorities decided to seek external financial support. The EU, the IMF, the World Bank, the EIB and the EBRD responded by making available to Romania medium-term financial assistance of up to EUR 20bn. This assistance is conditional upon the implementation of a comprehensive economic policy programme, comprising fiscal consolidation and reform measures in the area of fiscal governance, structural reform and financial sector supervision. The adoption of the policy programme has contributed to an improvement in market sentiment and had a positive impact on the Romanian economy. Financial stress eased, pressures on the exchange rate declined and strains on the government securities market diminished with average yields on government bonds declining from 14% end-2008 to just above 10% in August 2009.
Deeper-than-expected recession in 2009, shallow recovery starting in 2010
The tightening of access to credit and the decline in export demand resulting from the worldwide crisis caused the Romanian economy to plunge into a severe recession, which has been deeper than previously expected. For 2009, growth is expected to decline by about 8%, followed by a shallow recovery by 2010.
In the first half of 2009, real GDP contracted by 7.5% y-o-y. As in many other countries in the region, the recession was led by a large drop of export volumes, followed by a very sharp contraction of domestic demand. The unemployment rate has jumped to 6.6% of the labour force in August, up from 5.4% one year earlier. Although wage and price pressures are easing, headline CPI inflation has remained relatively high: it stood at 5.0% in September reflecting, inter alia, hikes in excise duties and increases in the public wage bill.
A large balance of payments adjustment is under way. The current account deficit fell by about ¾ in the first half of 2009 compared to the same period of 2008. This reflects the sharp contraction of import volumes associated with the drop in domestic demand, which more than offset the decline of exports. Developments in the capital and financial account have been more favourable than projected, with higher rollover by corporates and stronger FDI inflows more than offsetting a slightly lower rollover rate for foreign banks. Against this background, pressures on the exchange rate have eased.
In the second half of 2009, first signs of economic recovery started to appear, initially driven by export demand. The decline in industrial production and exports has been moderating and m-o-m private credit developments turned positive in August after 5 months of negative growth. The forecast assumes these trends will consolidate over the coming quarters. The recovery of domestic demand is expected to follow with some delay given still rising unemployment and decelerating wage growth. Real GDP growth is expected to turn positive by the first quarter of 2010 leading to a moderate ½% real GDP growth rate in 2010, gradually accelerating to 2½% in 2011. The

Member States, Romania
139
recovery, however, will remain shallow because of a continued need for fiscal adjustment, diminished capital inflows, at least in comparison with the pre-crisis period, and the continued high rate of unemployment.
There are upside risks to this macroeconomic outlook. Assuming that global financial markets do not go through another round of stress, the economy may recover slightly faster than projected in this baseline. On the negative side, the current political uncertainty could delay the implementation of measures aimed at stabilising the economy and weaken the recovery in a still fragile external environment.
Graph II.22.1: Romania - Contributions to growth
-17
-12
-7
-2
3
8
13
02 03 04 05 06 07 08 09 10 11
pps.
Domestic demand + inventoriesNet exportsGDP (y-o-y%)
forecast
The unemployment rate is expected to rise from 5.8% in 2008 to about 9% in 2009, followed by a gradual easing to about 8 ½ % in 2011. Wage pressures have diminished considerably in the course of 2009 but are likely to re-emerge, although to a lesser extent, once the economy rebounds. The widening output gap, the declining domestic demand and the recent stabilisation of the RON exchange rate have significantly eased inflationary pressures over recent months. Yet, core inflation remains relatively high, following the increase in excise duties and structural rigidities in the labour market, driven among others by still significant increases in the public wage bill observed in the first 8 months of the year. HICP inflation is expected to edge down from 7.9% in 2008 to 5.7% in 2009 and entering into the Central Bank end-2009 target band of 3.5 +/-1%. For 2010 and 2011, a further easing to 3.5% and 3.4%, respectively, is anticipated.
As the economy returns to a more sustainable growth path for a transition country, external balances are expected to remain in negative territory. As the projected rates of increase in
imports exceed those in exports, both the trade and current account deficits are forecasted to go up by one quarter of a percentage point between 2009 and 2011.
Improving competitiveness would help achieve sustainable growth
The external competitiveness of the Romanian economy has been eroded by years of high wage increases, driven by loose income policy in the public sector – wage agreements in the public sector play an important signalling role for private sector wages. In addition, growing skill shortages have put upward pressure on compensation levels in the private sector. In 2005, 2007 and 2008 real compensation per head rose at double-digit rates. In parallel the export sector had to cope with a 22% nominal appreciation of the RON between 2004 and 2007. Even though annual productivity growth rates in this period exceeded 5%, significant losses in competitiveness were unavoidable. The real effective exchange rate of the RON (based on unit labour costs in the total economy) rose by no less than 72% between 2004 and 2008. The measures taken in the framework of the balance of payments assistance programme to support wage moderation in the public sector will therefore help not only to reduce budgetary deficits but also act, in the medium-term, as a stimulus to competitiveness. Over the past decade Romania has recorded significant productivity gains. Following the set-back of 2009 it faces the challenge to bring back labour productivity growth rates to pre-recession levels.
Deterioration in public finances
The sharper than anticipated growth contraction in the first half of the year has resulted in a significant decline in government revenue. The general government deficit is forecast to deteriorate from 5.5% of GDP in 2008 to 7.8% of GDP in 2009. Yet, achieving this target assumes that the government will implement the announced measures to freeze the wage bill. Furthermore, the target assumes full implementation of the announced spending cuts in goods and services and in subsidies. Considerable risks remain. In particular, the current political turmoil could delay the implementation of the announced expenditure cuts and could weaken the willingness and capacity of the authorities to control the traditional end-year surge in public spending.

European Economic Forecast, Autumn 2009
Table II.22.1:Main features of country forecast - ROMANIA
2008 Annual percentage changebn RON Curr. prices % GDP 92-05 2006 2007 2008 2009 2010 2011
GDP 504.0 100.0 1.8 7.9 6.3 6.2 -8.0 0.5 2.6 Private consumption 330.4 65.6 4.3 12.7 11.9 8.9 -12.5 2.2 3.6 Public consumption 78.8 15.6 0.0 -4.1 -0.1 -0.3 -3.0 -4.0 -1.4 Gross fixed capital formation 167.9 33.3 7.2 19.9 30.3 19.3 -12.3 1.1 5.8 of which : equipment 78.9 15.7 9.6 23.5 28.3 19.0 -13.1 1.0 6.0 Exports (goods and services) 155.8 30.9 11.0 10.4 7.8 19.4 -8.9 3.1 5.0 Imports (goods and services) 219.3 43.5 12.0 22.6 27.3 17.5 -20.8 5.0 7.5 GNI (GDP deflator) 483.6 96.0 1.6 7.4 6.0 5.8 -6.5 0.5 2.7 Contribution to GDP growth : Domestic demand 5.1 12.9 15.9 11.7 -12.8 1.1 3.9
Stockbuilding -1.8 1.4 0.0 -3.6 -1.5 0.3 0.0Foreign balance -1.3 -6.3 -9.6 -1.9 6.3 -0.9 -1.3
Employment -2.1 0.7 0.4 0.3 -3.3 0.8 0.9 Unemployment rate (a) 6.6 7.3 6.4 5.8 9.0 8.7 8.5 Compensation of employees/head 69.5 12.4 22.0 21.7 4.8 5.5 6.0 Unit labour costs whole economy 63.1 4.9 15.2 14.9 10.2 5.8 4.3 Real unit labour costs -0.6 -5.1 1.5 0.7 2.8 0.5 -0.7 Savings rate of households (b) - - - - - - - GDP deflator 64.1 10.6 13.5 14.0 7.2 5.3 5.0 Harmonised index of consumer prices - 6.6 4.9 7.9 5.7 3.5 3.4 Terms of trade of goods 0.9 7.2 10.6 2.9 3.7 1.9 1.9 Trade balance (c) -7.2 -12.0 -14.3 -13.3 -6.2 -6.2 -6.5 Current account balance (c) - -10.6 -13.6 -12.3 -5.5 -5.5 -5.7 Net lending(+) or borrowing(-) vis-à-vis ROW (c) -4.5 -10.4 -13.1 -11.8 -5.0 -5.1 -5.2 General government balance (c) - -2.2 -2.5 -5.5 -7.8 -6.8 -5.9 Cyclically-adjusted budget balance (c) - -4.4 -5.1 -8.5 -7.1 -5.5 -4.6 Structural budget balance (c) - -3.8 -5.1 -8.5 -7.1 -5.5 -4.6 General government gross debt (c) - 12.4 12.6 13.6 21.8 27.4 31.3 (a) Eurostat definition. (b) gross saving divided by gross disposable income. (c) as a percentage of GDP.
140
The general government deficit is expected to decline only marginally to respectively 6.8% and 5.9% of GDP in 2010 and 2011. As the 2010 budget has not yet been adopted, this forecast only partially includes the effect of the announced additional cuts in goods and services expenditure and a freeze in pensions (excluding social pensions). Risks to the 2010 budget are mixed: on the one hand, the adoption and full implementation of the Unified Wage law would contribute to reducing the size of the public wage bill (this law was designed to gradually reduce the size of the public wage bill to 7% of GDP by 2015, but it is currently under review by the Constitutional Court). Similarly, progress on key structural fiscal reforms (pension law and fiscal responsibility law), as required in the balance of payments programme, would contribute to the fiscal consolidation process. On the other hand, the current political gridlock may weaken or delay the fiscal consolidation and structural reform efforts.
The large budget deficits will result in a more than doubling of public debt from 13.6% of GDP in 2008 to 31½ % of GDP in 2011, which however remains one of the lowest in the EU.

23. SLOVENIA Sharp fall in activity followed by subdued recovery
141
From buoyant demand to recession
In the years preceding the crisis, Slovenia enjoyed solid economic growth driven by flourishing exports and investment. At the same time, 2007 saw the start of strong inflationary pressures, along with a widening external deficit as low real interest rates fuelled credit, domestic demand and imports, while accelerating wage growth started to threaten competitiveness.
Thus, after rapid expansion until the third quarter of 2008, the economy was hit hard and rather abruptly by the global crisis, chiefly through trade in view of Slovenia’s very high degree of openness. Export volumes contracted significantly for two quarters in a row, losing a cumulative 23% in the final quarter of 2008 and the first quarter of 2009, which gave rise to a sharp contraction in overall activity, by more than 10%, in the same period. The global financial turmoil also led to a tightening of financing conditions in Slovenia and several measures to strengthen the stability of the financial sector were adopted, mainly in the form of guarantees.
Given the low government deficit and debt levels at the onset of the crisis, the government aimed to contain the impact of the downturn on the economy with targeted stimulus measures, which, together with tax relief for companies decided before the onset of the crisis, added up to almost 2% of GDP.
Broad-based recession followed by an export-led recovery
The very negative growth outcomes in the last quarter of 2008 and the first of 2009 imply an acute contraction of real GDP for 2009 as a whole. However, benefitting from stimulus measures supporting demand in Slovenia's main trading partners, tentative signs of stabilisation in economic activity became apparent in the second quarter of 2009, when real GDP growth turned mildly positive on a quarterly basis. A pick-up led by exports, in line with the assumed recovery in Slovenia's main export markets, is expected for the second half of the year. Overall, for 2009 as a whole, real GDP is projected to decline by 7.4%, one of the sharpest falls in the euro area.
The recession has been broad-based across all demand components except for government consumption, which is projected to continue to make a positive contribution to growth in 2009. Exports have been hit hard by the collapse of foreign demand. However, the massive contraction in imports projected for 2009 (in line with falling domestic demand and exports) would still imply a positive contribution of net exports to growth as well as a marked narrowing of the external deficit. The drop in exports, exacerbated by low capacity utilisation, weaker profitability and tighter financing conditions, also triggered a sharp contraction in private investment. This includes a sharp fall in construction, after the double-digit real growth rates recorded in 2007-2008, while public investment is not expected to provide any support. Over 2009 as a whole, it is projected that gross fixed capital formation will drop by around one quarter in real terms. The fading away of demand has also led to a downward adjustment in stock-building by firms.
Graph II.23.1: Slovenia - GDP and exports growth, volumes
-20
-10
0
10
20
04 05 06 07 08 09 10 11-8
-4
0
4
8
Real GDP growth (rhs)Real exports growth (lhs)
y-o-y% y-o-y%
forecast
In 2008, private consumption expanded by 2%, supported by strong increases in employment and wages but at the same time adversely affected by high inflation and decelerating consumer confidence. In 2009, even though average wages are projected to still outpace inflation, consumer demand is likely to be constrained by a significant drop in employment and increasing precautionary savings.
The assumed positive momentum in the second half of 2009 and further gradual recovery in Slovenia's main trading partners are projected to result in mildly positive real GDP growth in 2010,

European Economic Forecast, Autumn 2009
142
led by exports, and a more robust rebound in 2011. Private consumption is projected to post positive growth only in 2011, given the lagged impact of the recession on the labour market and low growth in average wages in 2010. Similarly, gross fixed capital formation is projected to take some time to regain strength. Accordingly, the recovery of import growth is set to be more gradual than that of exports, entailing a positive contribution of net exports to real GDP growth in both 2010 and 2011.
The abrupt slowdown of the economy after a phase marked by emerging overheating risks is bringing about some adjustment of the domestic economy. The forecast embodies a sharp rise in private sector savings, reflecting households' precautionary motives and enterprises' efforts towards restoring their balance sheets, while the government sector acts to some extent as a cushion by increasing its net borrowing significantly. Meanwhile, the projected improvement of the external balance over the forecast horizon mainly reflects favourable terms-of-trade developments in 2009 and weak domestic demand holding back import growth.
Wage–unemployment nexus affected by public wage developments
Given the openness of the Slovenian economy, maintaining competitiveness by bringing wage growth in line with productivity improvements would help ensure a healthy recovery. In the absence of a private sector wage agreement between the social partners beyond 2009, the forecast assumes that average real wage growth in the private sector will be subdued in 2010 and 2011 in response to competitive pressures and rising unemployment. However, there could be some secondary effects from the recent increases in public sector wages as part of a move to eliminate existing pay differences among the various professions in the public sector.
The downturn has brought the unemployment rate up from a low of just above 4% in December 2008 to 6% in July 2009. A further increase is expected in the remainder of 2009. Measures to stem the rise in unemployment, in the form of subsidy schemes for reduced working hours and workers on forced leave, have been the focus of the government’s efforts to stem the impact of the crisis. As the schemes are set to gradually expire in 2010 and 2011, a certain outflow of employees from these
schemes into unemployment is assumed to take place.
After peaking in 2008, inflation is expected to decrease sharply in 2009 on the back of lower commodity prices and weakening economic activity. Still, at around 1%, inflation is expected to remain above the euro-area average, reflecting, inter alia, increases in excise duties throughout the year. In 2010 and 2011, inflation is projected to increase due to the base effect from 2009, reviving economic activity and the assumed higher oil prices.
Marked deterioration in public finances
After reaching a balanced position in 2007, the general government balance is estimated to have posted a deficit of 1.8% of GDP in 2008. For 2009, the deficit is set to widen significantly, to around 6¼% of GDP. On the expenditure side, the strong dynamics of social transfers, especially pensions (given indexation arrangements), and of the public sector wage bill together with discretionary measures, including measures to respond to the crisis, are set to lead to a steep increase in the expenditure ratio. In addition to the impact of the automatic stabilisers, the revenue side is affected by various measures providing corporate tax relief (phasing-out of the payroll tax, further cut in the corporate income tax rate and increase in investment-related tax allowances), which are expected to be broadly offset by the impact of higher excise duties.
Given the widening deficit, the government is now turning its attention to resuming fiscal consolidation. In the draft budget for 2010, which is incorporated in the forecast, the government aims to rein in the widening deficit by limiting current expenditure growth in, inter alia, the areas of the public sector wage bill and social transfers. The forecast also incorporates the subsequent agreement between the government and the trade unions on public sector wages over the period 2010-2011. The forecast projects a further increase of the deficit ratio in 2010 to around 7% of GDP and, under the no-policy-change assumption, a stabilisation in 2011.
Having fallen gradually over several years, gross government debt stood at 22½% of GDP in 2008. It is forecast to increase gradually to around 48% of GDP by 2011. The sizeable increase in the primary deficit accounts for about one third of the

Member States, Slovenia
Table II.23.1:Main features of country forecast - SLOVENIA
2008 Annual percentage changebn Euro Curr. prices % GDP 92-05 2006 2007 2008 2009 2010 2011
GDP 37.1 100.0 3.3 5.8 6.8 3.5 -7.4 1.3 2.0 Private consumption 19.6 52.7 3.8 2.9 6.7 2.0 -1.7 -0.2 1.6 Public consumption 6.7 18.1 3.0 4.0 0.7 6.2 3.4 0.6 0.5 Gross fixed capital formation 10.7 28.9 6.5 9.9 11.7 7.7 -24.8 -0.6 2.5 of which : equipment 4.0 10.8 9.1 20.2 5.2 4.2 -30.0 -0.7 3.3 Exports (goods and services) 25.1 67.7 4.3 12.5 13.7 2.9 -18.5 2.4 4.0 Imports (goods and services) 26.3 70.7 6.1 12.2 16.3 2.9 -21.0 0.5 3.5 GNI (GDP deflator) 36.3 97.6 3.3 5.4 5.8 3.2 -7.3 1.0 1.8 Contribution to GDP growth : Domestic demand 4.1 4.9 6.8 4.3 -7.4 -0.1 1.5
Stockbuilding 0.4 0.7 1.9 -0.7 -2.3 0.3 0.1Foreign balance -1.0 0.2 -1.8 -0.1 2.4 1.1 0.4
Employment - 1.5 3.0 2.9 -2.6 -2.0 -0.3 Unemployment rate (a) - 6.0 4.9 4.4 6.7 8.3 8.5 Compensation of employees/head - 5.3 6.5 6.7 2.9 1.7 3.1 Unit labour costs whole economy - 1.0 2.6 6.0 8.2 -1.6 0.8 Real unit labour costs - -1.0 -1.5 2.1 4.9 -2.7 -1.1 Savings rate of households (b) - - 15.3 15.6 16.7 17.0 16.7 GDP deflator 19.4 2.1 4.2 3.8 3.2 1.1 1.9 Harmonised index of consumer prices - 2.5 3.8 5.5 0.9 1.7 2.0 Terms of trade of goods 0.9 -0.4 0.2 -1.8 5.7 -0.6 -1.1 Trade balance (c) -2.8 -3.8 -4.9 -7.2 -1.8 -1.3 -1.5 Current account balance (c) 0.0 -2.4 -4.5 -6.1 -0.8 -0.2 -0.6 Net lending(+) or borrowing(-) vis-à-vis ROW (c) -0.2 -2.8 -4.6 -6.0 -0.7 -0.1 -0.5 General government balance (c) - -1.3 0.0 -1.8 -6.3 -7.0 -6.9 Cyclically-adjusted budget balance (c) - -2.3 -2.6 -4.5 -4.8 -5.4 -5.6 Structural budget balance (c) - -2.3 -2.6 -4.5 -4.7 -5.4 -5.6 General government gross debt (c) - 26.7 23.3 22.5 35.1 42.8 48.2 (a) Eurostat definition. (b) gross saving divided by gross disposable income. (c) as a percentage of GDP.
143
rise in the debt ratio in 2009. The remainder of the increase is due to rising interest expenditure, the decline in nominal GDP and a debt-increasing stock-flow adjustment reflecting operations to support the financial sector, namely the proceeds of some recent bond issuances that were deposited by the government with banks (around 4½% of GDP).

24. SLOVAKIA Resuming real convergence following a deep recession
144
The crisis and policy response in 2009
With an average real GDP growth rate of over 7% during the period 2003-08, Slovakia was one of the best-performing EU countries. At the same time, overall sound macroeconomic and structural policies kept the key macroeconomic balances in check. The external position remained strong, government finances were kept under control and, while a few signs of overheating emerged by mid-2008, inflation hovered in a range from 2 to 5%. These achievements enabled Slovakia to adopt the euro in January 2009, which helped to shield the country from potential exchange rate pressure and supported confidence during the crisis.
Given its high degree of trade openness, the Slovak economy has been particularly exposed to the crisis. It has been affected primarily through the trade channel, as demand from trading partners has plummeted, triggering a plunge in exports by some 25% in the first half of 2009 compared to the same period of 2008. This was followed by an even larger fall in imports, as uncertainties related to the crisis led to a massive increase of savings by both households and the corporate sector. Private investment and consumption fell respectively by 4.6% and 4.8% in the year to the first quarter of 2009. As a result, real GDP slowed markedly in late 2008 and tumbled by 11% (non annualised) in the first quarter of 2009. Despite the large shock to the real sector of the economy and intense stress in global financial markets, the Slovak banking sector has been relatively resilient, due to the good liquidity situation of credit institutions and low dependence on cross-border lending. Consequently, apart from capital injections in two small state-owned banks, no major rescue operations have been necessary.
The policy response of the Slovak government to the crisis has aimed to contain the economic downturn by supporting domestic demand in order to partly offset the slump in external demand. Fiscal policy has allowed the full operation of automatic stabilisers. The authorities adopted anti-crisis packages in November 2008 and February 2009, which amount to roughly 0.5% of GDP for both 2009 and 2010. But these measures have mainly been financed through a reallocation of resources within the budget, and therefore do not have a negative impact on public accounts. They
are targeted at specific sectors of the economy (car-scrapping scheme) and disadvantaged groups (increase in tax credit for low earners), and aim at supporting employment (contributions for retention of employment) and R&D activities.
Gradual recovery expected in 2010-11
The Slovak economy is projected to recover progressively in 2010 and 2011, against the backdrop of a gradual pick-up in private consumption and investment. After a decline by 5.8% in 2009, real GDP is projected to increase by around 1.9% in 2010 and 2.6% in 2011. While positive, these figures are much lower than those recorded during the boom phase. This reflects the influence of several factors playing in various directions. On the positive side, recent high-frequency indicators have provided some signs of stabilisation in economic activity. Business confidence appears to be recovering slowly, while exports have stopped falling and the inventories cycle is gradually turning around. With an increase of about 2% in the second quarter of 2009 (non-annualised), real GDP recorded a technical rebound after the sharp fall in the first three months of the year, and growth is expected to remain in positive territory over the forecast horizon.
Graph II.24.1: Slovakia - GDP growth and contributions
-10
-5
0
5
10
15
04 05 06 07 08 09 10 11
pps.
InventoriesNet exportsDom. demand, excl. invent.GDP (y-o-y%)
forecast
However, powerful headwinds are likely to slow the recovery. The adjustment of the labour market will come with a lag – in 2010 employment growth is projected to remain negative and unemployment is set to approach 13%, one of the highest levels among central and eastern European countries. This will weigh on real disposable income and

Member States, Slovakia
145
contribute to maintaining the households saving rate at a high level, thus explaining the projected sluggishness of private consumption in 2010-11. Similarly, the underutilisation of production capacities and the sharp decline of new orders in the automotive and electronics sectors, combined with a significant reduction in profits and uncertain economic outlook, seem likely to prevent a sizeable rebound of investment in the short run, following the contraction by 12.4% in 2009. Inflation, which has been pushed down significantly by the contraction in economic activity, is projected to remain low over the forecast period. A faster economic recovery would be possible if export demand were to prove higher than expected and total investment were to benefit from ongoing public–private partnership projects for motorway construction and further foreign direct investment. By contrast, a larger deterioration in consumer confidence, driven by a bleak labour market outlook, could weigh on the recovery.
Key challenges are to limit the medium-term consequences of the crisis on the economy…
Following the large loss of output during the crisis, one main challenge will be to ensure that the downturn does not durably affect the potential growth of the Slovak economy. While subject to considerable uncertainties in the current circumstances, available estimates suggest that Slovak potential growth will be, at least temporarily, impacted by the crisis, mainly due to a slower accumulation of productive capital. If not appropriately managed, the restructuring of the automotive sector, currently characterised by ample – and perhaps in part structural – overcapacity, could also weigh on growth in the coming years. Finally, a further rise in the already high structural rate of unemployment cannot be excluded. Against this background, it would appear to be important to prevent the increase in unemployment from having permanent effects and to facilitate the transition to new types of economic activity.
…and to preserve competitiveness in the post-crisis environment
Following accession to the euro area, Slovakia's external imbalances can only be tackled through adjustments in domestic prices and costs vis-à-vis competitors and through improvements in non-price competitiveness. Since 2000, Slovakia had
had one of the fastest appreciating currencies in the EU – the currency appreciated by more than 40% in effective real terms. The appreciation has continued during the crisis, mainly reflecting nominal exchange rate movements in neighbouring countries. Although it is difficult to draw firm conclusions on the magnitude of a possible deterioration in Slovakia's external price competitiveness during the crisis, the evolution of relative prices and cost developments and developments in non-price factors are crucial for enhancing competitiveness.
Rapid deterioration of public finances
Several years of expansionary policies during the economic boom phase – with a deterioration in the structural deficit from 1.8% of GDP to 4.7% of GDP over the period 2005-08 – left Slovakia's government finances in a vulnerable position at the onset of the crisis. The sharp swing in the output gap from very positive to mildly negative territory between 2008 and 2009 has unmasked looming fiscal imbalances, and the general government deficit widened by 4 percentage points of GDP to 6.3% of GDP in 2009. In line with the European Economic Recovery Plan, the government decided to let automatic stabilisers operate freely in 2009. In view of shallow recovery expectations in 2010, the announced consolidation efforts are expected to lead to a narrowing of the general government deficit, which is projected to decline to 6% of GDP in 2010. Government debt is projected to rise from 28% of GDP in 2008 to about 39% of GDP in 2010 and, under the no-policy-change assumption, to roughly 43% of GDP in 2011.
Graph II.24.2: Slovakia - Public finances
-9
-6
-3
0
3
6
9
02 03 04 05 06 07 08 09 10 11
% of GDP
20
25
30
35
40
45
50% of GDP
General government deficit (lhs)General government gross debt (rhs)
forecast
Slovakia is a small and very open economy, implying low fiscal multipliers even in normal times. At the current high levels of deficit and in

European Economic Forecast, Autumn 2009
Table II.24.1:Main features of country forecast - SLOVAKIA
2008 Annual percentage changebn Euro Curr. prices % GDP 92-05 2006 2007 2008 2009 2010 2011
GDP 67.3 100.0 - 8.5 10.4 6.4 -5.8 1.9 2.6 Private consumption 38.0 56.5 - 5.8 7.0 6.1 -1.2 0.5 2.2 Public consumption 11.7 17.4 - 10.2 -1.3 4.3 4.6 3.5 2.8 Gross fixed capital formation 17.5 25.9 - 9.3 8.7 6.8 -12.4 2.5 3.3 of which : equipment 7.3 10.8 - -6.3 4.2 19.6 -12.5 2.7 3.5 Exports (goods and services) 55.6 82.6 - 21.0 13.8 3.2 -15.7 2.4 5.0 Imports (goods and services) 57.2 85.0 - 17.7 8.9 3.3 -13.5 2.4 4.9 GNI (GDP deflator) 65.7 97.5 - 9.0 10.0 6.7 -6.0 1.7 2.5 Contribution to GDP growth : Domestic demand - 7.6 6.1 6.0 -3.1 1.5 2.6
Stockbuilding - -0.9 0.6 0.5 -1.3 0.3 0.0Foreign balance - 1.7 3.8 -0.2 -1.5 0.0 0.1
Employment - 2.3 2.1 2.9 -2.0 0.0 0.6 Unemployment rate (a) - 13.4 11.1 9.5 12.3 12.8 12.6 Compensation of employees/head - 7.6 8.8 8.7 3.6 3.9 4.3 Unit labour costs whole economy - 1.5 0.6 5.2 7.8 2.0 2.3 Real unit labour costs - -1.4 -0.5 2.2 3.1 -1.0 -0.6 Savings rate of households (b) - - - - - - - GDP deflator - 2.9 1.1 2.9 4.5 3.0 2.9 Harmonised index of consumer prices - 4.3 1.9 3.9 1.1 1.9 2.5 Terms of trade of goods - -1.8 -1.1 -1.9 3.6 0.7 0.6 Trade balance (c) - -5.2 -1.7 -1.7 -1.0 -0.5 -0.1 Current account balance (c) - -7.4 -5.1 -6.8 -5.8 -5.3 -5.0 Net lending(+) or borrowing(-) vis-à-vis ROW (c) - -7.0 -4.7 -5.6 -4.8 -4.3 -4.2 General government balance (c) - -3.5 -1.9 -2.3 -6.3 -6.0 -5.5 Cyclically-adjusted budget balance (c) - -4.2 -4.0 -5.0 -6.0 -5.4 -4.6 Structural budget balance (c) - -3.9 -4.0 -5.2 -6.2 -5.4 -4.6 General government gross debt (c) - 30.5 29.3 27.7 34.6 39.2 42.7 (a) Eurostat definition. (b) gross saving divided by gross disposable income. (c) as a percentage of GDP.
146
the context of a global crisis, the size and even sign of fiscal multipliers are even more uncertain, implying that fiscal consolidation may not be harmful for growth. Reversing current negative trends in public finances will however be more difficult than in the past. Previous strategies, based on the partial allocation of revenue windfalls to deficit reduction in the context of exceptional economic performance, are not likely to be effective given the mixed economic outlook for Slovakia in the medium term.

25. FINLAND Strong external exposure takes its toll on the economy
147
From strong growth to rapid contraction
After a decade of rapid export-driven growth, Finland entered the global crisis in 2008 from a relatively strong position, having built up a substantial surplus in the current account and government finances. Nevertheless, the global crisis has had a strong impact on the export-dominated Finnish industry, as well as on the domestic sectors through negative confidence effects. At the outset, the global crisis had a sharply negative impact on consumer confidence, even though domestic factors implied a solid rise in consumer purchasing power in 2008 and 2009. In contrast, over the course of 2009, consumer confidence has rebounded to close to pre-crisis levels. However, that rebound and a more moderate recovery in industry confidence indicators were not yet reflected in actual output data for the first half of 2009. GDP contracted at a quarterly rate of about 3% in both the first and second quarters of 2009, yielding an annualised contraction of about 8½% over the first half of 2009.
Downturn driven by exports of manufactured goods
Finnish industry has traditionally had a highly concentrated structure, with 70% of exports generated by the metal engineering, electronics, and forestry sectors. A strong specialisation in investment goods allowed Finnish exporters to benefit from the global economic boom of the past few years (see Graph II.25.1).
Graph II.25.1: Finland - Exports and imports
30
35
40
45
50
02 03 04 05 06 07 08 09 10 11
% of GDP
Exports Imports
forecast
With the global economic cycle turning to bust, demand for investment goods has plummeted and is expected to revive only with a lag after global growth has gained strength. Over the first half of 2009, Finnish exports dropped by the most in the euro area. Apart from the unfavourable composition effect, the sudden appreciation of the euro's exchange rate against the currencies of Finland's main trading partners has had a relatively strong impact on external trade, given that almost 70% of Finnish exports go outside the euro area, which is the highest share of any euro-area country. Additionally, the sizeable forestry industry appears to be in a long-term process of downsizing its production capacity in Finland due to global shifts in demand and production towards Latin America and Asia. Production volumes in the electronics industry have traditionally been highly volatile and correlated with global demand conditions. Because the import content of exports is relatively high and domestic consumption has also declined by over 5%, the drop in exports is similarly mirrored in imports. Since import prices have fallen faster than export prices in 2009, the impact on the current account is somewhat less severe and a slight surplus position of about 1% of GDP is still maintained.
Policy response concentrated on tax cuts
Given the sizeable surplus in public finances recorded in 2008, Finland allowed the full operation of automatic stabilisers and in addition provided for a relatively large fiscal stimulus amounting to 1½% of GDP in 2009 and a further 1% of GDP in 2010. The fiscal stimulus is heavily concentrated on tax cuts (primarily cuts to personal income tax), making up about 80% of the stimulus packages. The expenditure measures designed to boost public investment are therefore relatively smaller. In addition, funding for export financing was sharply increased, as were other measures aimed at reducing financing costs for enterprises. Given that households have sharply increased their savings in the current uncertain economic environment, the effect of the tax stimulus on consumption appears to have been relatively limited.
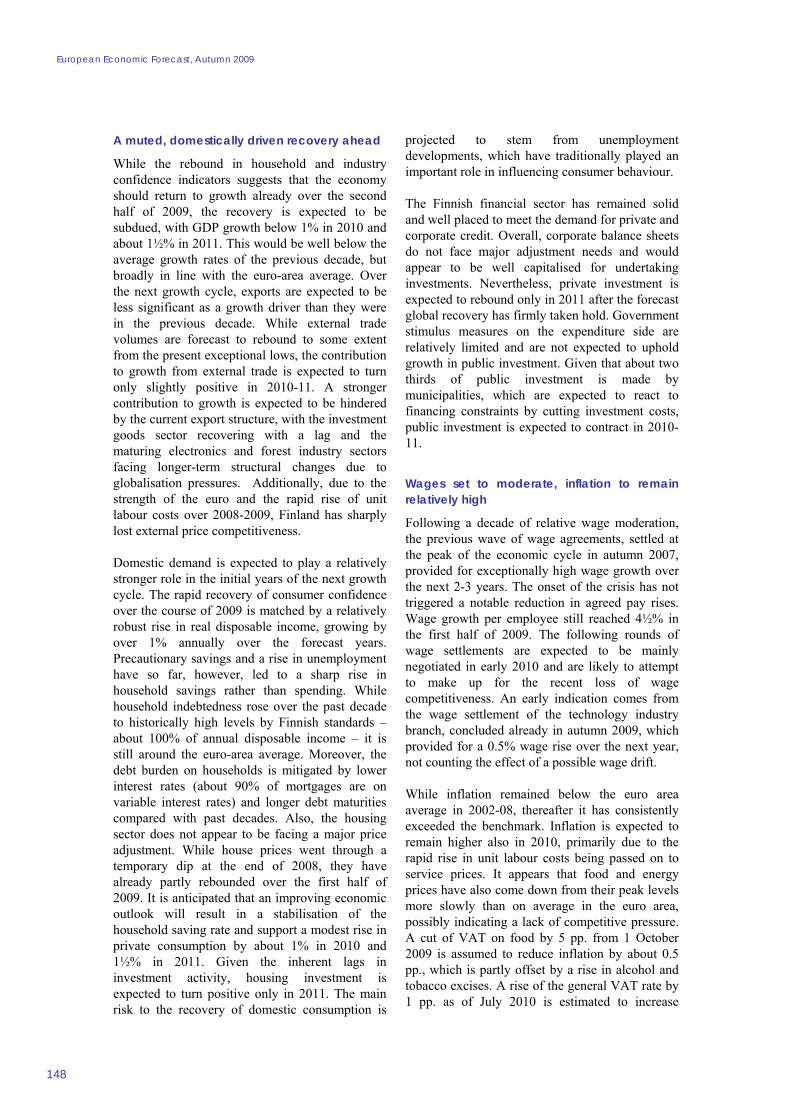
European Economic Forecast, Autumn 2009
148
A muted, domestically driven recovery ahead
While the rebound in household and industry confidence indicators suggests that the economy should return to growth already over the second half of 2009, the recovery is expected to be subdued, with GDP growth below 1% in 2010 and about 1½% in 2011. This would be well below the average growth rates of the previous decade, but broadly in line with the euro-area average. Over the next growth cycle, exports are expected to be less significant as a growth driver than they were in the previous decade. While external trade volumes are forecast to rebound to some extent from the present exceptional lows, the contribution to growth from external trade is expected to turn only slightly positive in 2010-11. A stronger contribution to growth is expected to be hindered by the current export structure, with the investment goods sector recovering with a lag and the maturing electronics and forest industry sectors facing longer-term structural changes due to globalisation pressures. Additionally, due to the strength of the euro and the rapid rise of unit labour costs over 2008-2009, Finland has sharply lost external price competitiveness.
Domestic demand is expected to play a relatively stronger role in the initial years of the next growth cycle. The rapid recovery of consumer confidence over the course of 2009 is matched by a relatively robust rise in real disposable income, growing by over 1% annually over the forecast years. Precautionary savings and a rise in unemployment have so far, however, led to a sharp rise in household savings rather than spending. While household indebtedness rose over the past decade to historically high levels by Finnish standards – about 100% of annual disposable income – it is still around the euro-area average. Moreover, the debt burden on households is mitigated by lower interest rates (about 90% of mortgages are on variable interest rates) and longer debt maturities compared with past decades. Also, the housing sector does not appear to be facing a major price adjustment. While house prices went through a temporary dip at the end of 2008, they have already partly rebounded over the first half of 2009. It is anticipated that an improving economic outlook will result in a stabilisation of the household saving rate and support a modest rise in private consumption by about 1% in 2010 and 1½% in 2011. Given the inherent lags in investment activity, housing investment is expected to turn positive only in 2011. The main risk to the recovery of domestic consumption is
projected to stem from unemployment developments, which have traditionally played an important role in influencing consumer behaviour.
The Finnish financial sector has remained solid and well placed to meet the demand for private and corporate credit. Overall, corporate balance sheets do not face major adjustment needs and would appear to be well capitalised for undertaking investments. Nevertheless, private investment is expected to rebound only in 2011 after the forecast global recovery has firmly taken hold. Government stimulus measures on the expenditure side are relatively limited and are not expected to uphold growth in public investment. Given that about two thirds of public investment is made by municipalities, which are expected to react to financing constraints by cutting investment costs, public investment is expected to contract in 2010-11.
Wages set to moderate, inflation to remain relatively high
Following a decade of relative wage moderation, the previous wave of wage agreements, settled at the peak of the economic cycle in autumn 2007, provided for exceptionally high wage growth over the next 2-3 years. The onset of the crisis has not triggered a notable reduction in agreed pay rises. Wage growth per employee still reached 4½% in the first half of 2009. The following rounds of wage settlements are expected to be mainly negotiated in early 2010 and are likely to attempt to make up for the recent loss of wage competitiveness. An early indication comes from the wage settlement of the technology industry branch, concluded already in autumn 2009, which provided for a 0.5% wage rise over the next year, not counting the effect of a possible wage drift.
While inflation remained below the euro area average in 2002-08, thereafter it has consistently exceeded the benchmark. Inflation is expected to remain higher also in 2010, primarily due to the rapid rise in unit labour costs being passed on to service prices. It appears that food and energy prices have also come down from their peak levels more slowly than on average in the euro area, possibly indicating a lack of competitive pressure. A cut of VAT on food by 5 pp. from 1 October 2009 is assumed to reduce inflation by about 0.5 pp., which is partly offset by a rise in alcohol and tobacco excises. A rise of the general VAT rate by 1 pp. as of July 2010 is estimated to increase

Member States, Finland
Table II.25.1:Main features of country forecast - FINLAND
2008 Annual percentage changebn Euro Curr. prices % GDP 92-05 2006 2007 2008 2009 2010 2011
GDP 184.7 100.0 2.8 4.9 4.2 1.0 -6.9 0.9 1.6 Private consumption 95.6 51.7 2.3 4.1 3.3 1.9 -2.8 1.0 1.4 Public consumption 41.3 22.3 0.9 0.6 0.8 2.0 1.7 0.7 0.6 Gross fixed capital formation 38.1 20.6 1.8 4.8 8.7 0.3 -11.0 -2.4 1.9 of which : equipment 10.4 5.6 2.0 4.1 11.7 8.6 -11.5 -4.4 2.5 Exports (goods and services) 86.8 47.0 8.8 11.8 8.1 7.3 -25.3 4.6 4.8 Imports (goods and services) 79.6 43.1 6.9 7.8 6.5 7.0 -22.1 3.8 4.2 GNI (GDP deflator) 184.3 99.8 3.1 5.4 3.1 0.9 -6.4 0.9 1.6 Contribution to GDP growth : Domestic demand 1.7 3.2 3.6 1.4 -3.3 0.2 1.3
Stockbuilding 0.3 -0.2 0.5 -0.8 -1.2 0.3 0.0Foreign balance 1.0 2.0 1.0 0.5 -2.4 0.3 0.3
Employment 0.2 1.8 2.2 1.6 -2.9 -2.5 0.1 Unemployment rate (a) 11.7 7.7 6.9 6.4 8.5 10.2 9.9 Compensation of employees/head 2.9 2.9 3.4 5.3 3.4 2.7 1.9 Unit labour costs whole economy 0.3 -0.2 1.5 5.9 7.8 -0.7 0.5 Real unit labour costs -1.3 -1.6 -1.7 4.1 5.6 -2.1 -1.1 Savings rate of households (b) - - 6.4 6.7 10.8 11.1 10.9 GDP deflator 1.6 1.3 3.2 1.8 2.1 1.5 1.5 Harmonised index of consumer prices 1.7 1.3 1.6 3.9 1.8 1.6 1.5 Terms of trade of goods -0.6 -3.8 -1.6 -3.4 1.6 -1.0 -1.0 Trade balance (c) 8.3 5.5 4.9 3.2 2.0 1.9 1.9 Current account balance (c) 4.6 4.9 4.0 2.6 1.1 1.2 1.3 Net lending(+) or borrowing(-) vis-à-vis ROW (c) 5.1 6.0 4.9 3.0 1.1 1.2 1.3 General government balance (c) -0.3 4.0 5.2 4.5 -2.8 -4.5 -4.3 Cyclically-adjusted budget balance (c) 0.3 2.7 2.9 2.7 -0.5 -2.3 -2.4 Structural budget balance (c) - 2.7 2.9 2.7 -0.5 -2.2 -2.4 General government gross debt (c) 48.0 39.3 35.2 34.1 41.3 47.4 52.7 (a) Eurostat definition. (b) gross saving divided by gross disposable income. (c) as a percentage of GDP. Note : Contributions to GDP growth may not add up due to statistical discrepancies.
149
inflation by about 0.2 pp., also partly offset by a 9 pp. cut in VAT on restaurant services.
Population ageing starting to impact on the labour market
The labour market reaction to the crisis has so far been more subdued than might have been expected from the steep fall in output. About half of the decline in employment is explained by lay-offs in industry. In addition, temporary lay-offs and various schemes to reduce working time, mostly not reflected in unemployment statistics, have been commonly used, amounting to almost 3% of the labour force. In the medium term, the Finnish labour market is expected to be seriously affected by the ageing of the population, with the working-age population in steady decline from 2010 onwards. This is expected to tighten the labour market over the forecast period and lead to a reduction in unemployment at a relatively early stage of the economic recovery cycle.
Sharp budgetary easing exacerbates fiscal sustainability challenge
General government finances are set to fall by over 7 pps. from a surplus of 4.5% of GDP in 2008 to a deficit of almost 3% of GDP in 2009. The weakening of government balances is largely
explained by a shortfall in tax revenues, with expenditure increases accounting only for a minor part. About a half of the tax revenue decline in 2009 is explained by plummeting corporate income tax accrual, which is forecast to drop by about 44%, representing almost 2% of GDP. The tax cuts as part of the fiscal stimulus amount to over 1% of GDP in 2009. The deficit is forecast to widen further to 4½ % of GDP in 2010, as the expected modest recovery of economic activity would generate only a minor rise in tax revenue, countered by further stimulus measures of about 1% of GDP and expenditure pressures arising from public sector wage rises and social expenditure. Based on current policies, including the 2010 budget proposal, the deficit is projected to edge down only slightly in 2011 to below 4½% of GDP, which is above the deficit threshold of 3% of GDP set out in the Stability and Growth Pact and not in line with the government's aim to ensure long-term sustainability of public finances. The government has not yet announced a fully fledged medium-term consolidation strategy. Driven largely by central government lending, the general government debt ratio is expected to shoot up from below 34% of GDP in 2008 to just below 53% of GDP by 2011.

26. SWEDEN Unemployment and fiscal deficit to peak amid muted recovery
150
Recession extends into 2009
As a small open economy with an export structure oriented towards investment goods and transport equipment, Sweden has been hit relatively hard by the global recession. While the headwinds from the global slowdown were already discernible in early 2008, it was not until the final months of the year that the full force of the global financial crisis impacted the Swedish economy. The fourth quarter saw GDP shrink by almost 5% compared with the preceding quarter as a result of dwindling exports, household belt-tightening and a very rapid draw-down of stocks. For the year as a whole, GDP contracted by 0.2%.
The downturn has been met by a significant loosening of fiscal policy and the central bank has lowered interest rates to very low levels. Discretionary fiscal measures of about 1½% of GDP were enacted in 2009 and further measures amounting to around 1% of GDP have been announced in the budget for 2010. Fiscal policy has been geared towards dampening the negative effect of the crisis on the labour market and providing general support to domestic demand, but also towards supporting the long-term goal of improving incentives to work.
A muted recovery from mid-2009 onwards
After a weak start to 2009, when falling investment and continued subdued exports led to a further drop in activity, the Swedish economy subsequently stabilised, posting its first quarter of positive GDP growth in over a year in the second quarter (+0.2% compared to the previous quarter).
Graph II.26.1: Sweden - Contributions to GDP growth
-6
-4
-2
0
2
4
6
98 99 00 01 02 03 04 05 06 07 08 09 10 11
pps.
Net exportsDomestic demand, excluding inventoriesGDP (y-o-y%)
forecast
Since spring 2009, a number of indicators point to a continued gradual recovery of the Swedish economy in the second half of 2009. Partly thanks to a swift and powerful policy reaction to the financial crisis, the situation in the financial markets has gradually normalised in the course of 2009. Spreads on risky assets have come down substantially and companies are now more able to tap capital markets once again.
The improved financing conditions and outlook are also reflected by the fact that the main Swedish stock market index was up by more than 40% in mid-October 2009. Survey results indicate that business and, in particular, consumer confidence have recovered strongly from the very low levels recorded earlier in the year. The burgeoning optimism of households is also underpinned by the apparent resilience of the housing market, where prices – contrary to what has happened in many other countries – have started to rise again after falling back somewhat in the autumn of 2008.
The number of redundancy notices has dwindled in recent months. This could imply that unemployment might grow a bit more slowly going forward. While not yet evident in actual production and trade data, there has also been a pick-up, albeit muted, in new orders, including export orders, during the summer of 2009, pointing to a strengthening of activity in the final months of 2009. However, given the depth of last winter's contraction, it appears that these incipient signs of recovery will not be able to prevent the economy from recording its largest year-on-year decline since the 1940s, with GDP expected to contract by about 4½% in 2009.
The outlook for the remainder of the forecast period is likely to be characterised by a continued subdued recovery in 2010, gradually gaining momentum in 2011 on the back of renewed demand for Swedish exports from the rest of the world and relatively strong household consumption growth. Exports should receive some support from a still relatively weak krona. Between September 2008 and March 2009, the trade-weighted exchange rate index rose by about 25%, indicating a rapid depreciation. Subsequently, the krona has recovered about two thirds of this depreciation. Private consumption should be underpinned by increases in real disposable

Member States, Sweden
151
income stemming from positive nominal wage growth, relatively subdued inflation, low monetary policy rates that keep mortgage expenses down, as well as tax cuts. In addition, as the labour market deterioration comes to a halt, the household savings rate should start to fall.
Given the large drop in output, capacity utilisation is low and investment is therefore likely to lag behind somewhat initially but should ultimately recover towards the end of the forecast period. Overall, annual GDP growth should reach about 1½% in 2010 and 2% in 2011.
It cannot be excluded that the Swedish economy may grow more quickly than foreseen in the main scenario, given the current upsurge in consumer confidence. The household saving rate is at a historically high level, which creates room for increased consumption. The wealth effect from rising house prices and stock market indices could prove stronger than expected, in particular since survey data indicate that households expect house prices to continue to rise over the coming year.
Inflation to remain below target
Consumer price inflation reached a high in the autumn of 2008, but has subsequently fallen significantly, as energy prices have reversed their previous strong upward movement. Given the weak demand, price pressures are likely to be subdued during the forecast period, despite fairly loose financial conditions. Annual HICP inflation is expected to fall below 2% in 2009, where it is forecast to stay for the remainder of the forecast period.
Inflation is likely to be partly determined by domestic cost pressures. In this regard, the outcome of the upcoming negotiations between the social partners on a new set of collective agreements covering about 3 million wage earners, i.e. the bulk of the labour force, could be important. The negotiations are likely to prove more difficult than usual given the wide difference in expectations between employers and unions regarding the available room for wage increases. The economic downturn and the ensuing sharp rise in unemployment are nevertheless expected to contain wage pressures over the forecast period. Negative wage drift and a general cutback in over-time compensation have already lowered the pace of nominal wage increases. This, combined with
an expected upswing in productivity growth in 2010, should benefit corporate profitability.
Financial vulnerabilities remain
Swedish banks are considered relatively solid and should be able to cope with expected credit losses, which stem mostly from the exposure of some big banks to the Baltic States. Unexpectedly large losses that are not matched by further recapitalisation efforts could, however, hamper the lending capacity of the banking system.
An additional medium-term vulnerability is the ongoing rise in household indebtedness, which looks set to reach 160% of disposable income in 2009 and is likely to continue rising in 2010. After a slight slowdown in its rate of expansion in 2008, household borrowing has accelerated again, rising at an annual pace of more than 8% per month in the summer of 2009. This process is to a large extent driven by the currently exceptionally low interest rates and household optimism regarding house prices (household borrowing mainly takes the form of mortgages). Once interest rates normalise, an increased debt service burden could weigh on household consumption in the medium term – in particular so if house price inflation should fall short of expectations. Swedish house prices are currently rising at one of the fastest rates in the EU.
Avoiding hysteresis in the labour market a key policy challenge
Since the onset of the crisis, the situation in the Swedish labour market has deteriorated significantly, with unemployment rising from an average level of 6.2% in 2008 to 8.3% in September 2009. So far, the bulk of the job-cutting has taken place in the manufacturing industry, with the public sector and the services sector proving more resilient. While the number of redundancy notices has fallen back significantly since the peak levels of last autumn, they are still relatively high. As the economy is expected to continue to grow fairly slowly in the near term and taking into account the new cohorts entering the labour force without finding jobs, unemployment looks set to continue to rise for yet some time. It should increase to an average level of 8.6% in 2009 before peaking at slightly above 10% in 2010.
Once the recovery gets under way, job growth is likely to be fairly subdued, partly because

European Economic Forecast, Autumn 2009
Table II.26.1:Main features of country forecast - SWEDEN
2008 Annual percentage changebn SEK Curr. prices % GDP 92-05 2006 2007 2008 2009 2010 2011
GDP 3156.9 100.0 2.4 4.2 2.6 -0.2 -4.6 1.4 2.1 Private consumption 1466.9 46.5 1.8 2.3 3.0 -0.2 -1.3 1.0 1.5 Public consumption 834.4 26.4 0.6 2.0 0.4 1.5 1.5 0.6 0.5 Gross fixed capital formation 615.5 19.5 2.0 9.1 7.5 2.7 -17.0 -1.5 3.2 of which : equipment 259.7 8.2 5.1 9.3 10.1 5.6 -25.5 -3.2 5.0 Exports (goods and services) 1711.5 54.2 7.3 8.9 5.8 1.8 -14.4 1.9 7.1 Imports (goods and services) 1476.8 46.8 5.4 8.7 9.4 3.0 -15.9 1.3 7.0 GNI (GDP deflator) 3229.3 102.3 2.7 6.2 3.3 -0.3 -6.2 1.0 2.1 Contribution to GDP growth : Domestic demand 1.3 3.2 2.9 0.8 -3.5 0.4 1.4
Stockbuilding 0.1 0.2 0.8 -0.6 -0.7 0.5 0.1Foreign balance 1.0 0.8 -1.1 -0.4 -0.4 0.4 0.7
Employment -0.2 1.7 2.2 0.9 -2.2 -1.8 0.0 Unemployment rate (a) 7.3 7.0 6.1 6.2 8.5 10.2 10.1 Compensation of employees/head 4.1 2.1 5.1 1.6 2.3 2.1 2.3 Unit labour costs whole economy 1.4 -0.4 4.7 2.6 4.9 -1.1 0.2 Real unit labour costs -0.3 -2.1 1.7 -0.5 1.5 -3.3 -1.8 Savings rate of households (b) - - 11.7 14.7 15.5 14.8 13.5 GDP deflator 1.6 1.7 3.0 3.2 3.4 2.3 2.0 Harmonised index of consumer prices 1.9 1.5 1.7 3.3 1.9 1.7 1.7 Terms of trade of goods -1.1 -0.3 2.7 -0.7 4.3 1.0 0.0 Trade balance (c) 6.1 5.6 4.6 4.0 5.3 5.7 6.0 Current account balance (c) 3.9 8.5 9.0 8.3 7.8 7.9 8.3 Net lending(+) or borrowing(-) vis-à-vis ROW (c) 3.6 7.9 8.9 8.1 7.6 7.7 8.1 General government balance (c) -2.2 2.5 3.8 2.5 -2.1 -3.3 -2.7 Cyclically-adjusted budget balance (c) -1.4 0.7 2.0 1.9 0.5 -1.0 -0.7 Structural budget balance (c) - 0.7 2.0 1.6 0.3 -1.0 -0.7 General government gross debt (c) 61.9 45.9 40.5 38.0 42.1 43.6 44.1 (a) Eurostat definition. (b) gross saving divided by gross disposable income. (c) as a percentage of GDP.
152
companies have hoarded labour to a larger extent than usual. Up to 100 000 workers may already be covered by exceptional crisis agreements at local level stipulating shorter working hours and lower pay. This provides a pool of underemployed workers that can be tapped once production expands.
A key challenge will be to avoid that a relatively job-anaemic recovery leads to hysteresis in the labour market with permanent loss of labour supply. This will also be important in order to ensure a continued and sufficient improvement in the fiscal position as GDP growth gains momentum. Ensuring that active labour market policies remain of high quality even as they expand in scope will be important in this regard.
Fiscal deficit on the rise until 2010
Due to a combination of cyclical effects, reflecting a high tax elasticity, and discretionary fiscal measures (in the form of various fiscal packages totalling about 1½% of GDP in 2009), public finances are expected to swing from a surplus of 2.5% of GDP in 2008 to a deficit of slightly above 2% of GDP in 2009. Further stimulus measures introduced with the 2010 Budget Bill combined with an expected further rise in unemployment in 2010 are likely to widen the deficit to 3¼% of
GDP in 2010. While unemployment is expected to remain high in 2011, stronger GDP growth should contribute to bringing the deficit down to the 2½-2¾% of GDP range in 2011.
The return to deficits, combined with negative or slow nominal GDP growth, is likely to reverse the previous trend towards a lower government debt ratio. The government has also put further privatisations on hold at least until after the general elections in the autumn of 2010. The gross public debt ratio is forecast to rise from about 38% of GDP in 2008 to 44% of GDP in 2011. Significant guarantee schemes for the banking sector remain in place, which imply potentially large contingent liabilities.

27. THE UNITED KINGDOM Path to recovery complicated by remaining imbalances
153
Abrupt end to decade of growth and stability
The UK entered its deepest post-war recession in the second half of 2008, after a decade of strong and continuous expansion, falling unemployment and steep rises in asset prices. As in many other countries, the recession undid much of the output, employment and financial gains built up in previous years: GDP at the end of the second quarter 2009 stood at the level of late 2005, while the unemployment rate surged by 2.5 pps. to around 8% in the year to mid-2009. In addition, a number of imbalances had been mounting in the UK economy over the last decade - notably in the housing market and public finances - that compounded the impact.
Policy intervention since the onset of the crisis has aimed at stemming systemic failure and restoring financial stability through a range of operations to improve banks' liquidity and solvency, as well as increasing the flow of credit to the private sector and supporting domestic demand through radical monetary easing and fiscal policy measures. Partly in response to the change in the monetary stance, which as well as historically low interest rates included the exceptional use of quantitative easing mainly through the purchases of UK government bonds, the exchange rate weakened substantially. While the success of some of these measures intended to support broad money growth and spending cannot yet be adequately gauged, financial market conditions are gradually returning to normality, although credit growth remains low.
Exiting recession with weak domestic demand and some support from the external sector
Following the sharpest quarterly loss of GDP in over fifty years in the first quarter of 2009, the speed of contraction moderated in the following quarter.(89) Positive growth is expected in the second half of the year, though this reflects a number of temporary factors, such as high government spending, a rebound in the inventories cycle and the re-increase of the VAT rate in 2010. Notwithstanding this positive development, GDP in 2009 as a whole is expected to contract by 4½%,
(89) GDP data published after the forecast cut-off date show
weaker-than-expected activity in Q3, which increases downside risks to the forecast.
before returning to very modest growth of around 1% in 2010 and 1¾% in 2010.
Graph II.27.1: The United Kingdom - O utput gap and contributions to GDP growth
-6
-4
-2
0
2
4
01 02 03 04 05 06 07 08 09 10 11
pps.
Output gap (% of GDP)InventoriesNet exportsDomestic demand, excluding inventoriesGDP (y-o-y%)
forecast
Throughout the recession, falling domestic demand has dominated the overall picture, as fixed investment fell by around 17% between the first quarter of 2008 and the second quarter of 2009, and private consumption contracted by close to 4% over the same period. Looking ahead, domestic demand is not expected to improve in 2010, although it is likely to do so in 2011, albeit modestly.
The outlook for private consumption, which accounts for around 60% of domestic demand, is marked by weak household income throughout most of the forecast period, as additional expected falls in employment in 2009 and 2010 depress labour income and impact on consumer confidence and spending intentions. This will be compounded by weaker earnings growth, as inflation moderates and rising unemployment keeps wage pressures in check. On the other hand, higher transfer payments to households will temper the labour market's negative impact on gross disposable income in 2010, as was already the case throughout 2008 and the first half of 2009. As employment is expected to begin to rise in 2011 and earnings growth to recover somewhat, disposable income would then rise again in both nominal and real terms.
Household spending growth will be tempered by a number of factors over the forecast period, notably households' desire to increase savings in response to a higher risk of unemployment and the sizeable falls in households' net wealth brought about by sharp asset price falls since the onset of the crisis. Households may also wish to provide for future

European Economic Forecast, Autumn 2009
154
interest rate rises that would increase their debt servicing costs appreciably, following sharp increases in household indebtedness in the last ten years. Furthermore, those intending to buy residential property are now faced with a significantly higher deposit requirement, while households with negative housing equity intending to move home are also likely to increase their saving. Overall, this supports an outlook for consumption that involves a fall in 2009 and a bottoming-out in 2010 before rising moderately in 2011. As a result, the household saving rate is expected to rise over the forecast horizon, reaching levels last seen at the beginning of the decade.
Graph II.27.2: The United Kingdom - Households' balance sheet and saving ratio
0
20
40
60
80
100
120
140
01 02 03 04 05 06 07 08 09 10 110
1
2
3
4
5
6
7
Households' financial liabilit ies (lhs)Households' deposits and equity (lhs)Households' saving ratio (rhs)
% of GDP % of total households' resources
forecast
Fixed investment was more affected by the crisis than other demand components, not least due to its greater dependence on credit financing and its link to both expected and actual capacity utilisation. The latter fell sharply during the crisis as production cuts reduced the stock of active capital, which in turn reduced the amount of gross investment required to offset depreciation of active capital. The outlook for investment spending shows little improvement as weak demand growth limits the need for net new capacity: fixed investment stabilises in early 2010, but grows at low rates thereafter, especially for machinery and equipment. Investment in housing, which was badly affected by the fall in mortgage lending during the crisis, is assumed to perform slightly better on account of improved credit conditions.
Changes in inventories throughout the recession were comparatively large and showed sizeable variation over time, as stockbuilding turned sharply negative in the final quarter of 2008, particularly in the retail and motor trade industries. The rate of destocking slowed after the first quarter 2009 and is expected to continue doing so until the
second half of 2010, when replenishment of depleted stock levels is expected to start. Overall, inventories are likely to subtract 1¼ pps. from GDP growth in 2009, but will add ¾ pp. and ½ pp. respectively in 2010 and 2011.
Government consumption expenditure continued growing throughout the recession, although at relatively modest levels, thereby providing only a minor stimulus to domestic demand in the first half of 2009, although transfer payments to households and lower tax receipts supported disposable income growth. Current budget plans imply that government spending growth should pick up throughout the remainder of the financial year 2009/10, before fiscal plans for the following financial year dictate reductions in expenditure that will dampen domestic demand.
Net external demand for goods and services, by contrast, recorded a positive contribution to output growth in 2008 and the first half of 2009, driven by import falls that outstripped the reduction in exports, which benefitted from the weaker pound. The supporting effect from net foreign demand is likely to peak in 2009, but will continue over the forecast horizon, by around ½ pp. in each year.
Unemployment still rising
Developments on the labour market throughout the crisis have reflected the severity of the output contraction in falling employment and rising unemployment levels, particularly for full-time employment. The unemployment rate in the second quarter of 2009 reached 7.9%, from 5.3% one year earlier. Employers' employment intentions in the third quarter continue to signal further employment losses, albeit at a lower rate, and the number of vacancies remains historically low, suggesting further unemployment rises in the near term. Given the UK's relatively flexible labour market, the lag between output losses and employment response should be short, so that the unemployment rate is expected to peak in the second quarter of 2010. The rate of net job creation thereafter is expected be moderate, in line with expectations for a relatively muted recovery in domestic demand.
Deleveraging and banking sector uncertainties
These projections are clouded with considerable risks and uncertainties. The prospects for a return to strong and sustainable growth will depend in

Member States, The United Kingdom
155
part on when and how imbalances in the government and household sectors are unwound.. An important trade-off in this respect will be the rebalancing speed, which will determine the extent to which adjustment in the household and government sector takes a toll on economy-wide expenditure in the short term. However, an excessively protracted adjustment could be at the expense of domestic and external confidence, and might thereby fail to strengthen resilience to future shocks. Furthermore, the expected recovery in domestic demand is heavily contingent on credit demand rising and on credit provision being improved on price and quantity terms. The extent to which loan default rates rise from their current level will be one important determinant of the latter, together with future developments in wholesale funding conditions and the potentially large further losses by UK banks.
Graph II.27.3: The United Kingdom - Monetary Conditions Indicators
0
2
4
6
8
10
12
05 06 07 08 09707580
859095100
105110
New lending rates, non-financial corporations (lhs)New unsecured lending rates, households (lhs)Bank Rate (lhs)Nominal effective exchange rate (rhs)
index (year 2005 = 100)%
Housing market stabilisation not yet solidified
The previously buoyant UK residential property market succumbed to its own exuberance in late 2007, with the impact of the financial crisis compounding the effects. Following a tripling of average house prices between 1997 and late 2007, these fell thereafter by 20% up to early 2009, with moderate price growth resuming thereafter. The number of transactions slumped, and in the third quarter of 2009 remained well below average. Available evidence points towards the recent price recovery being in large part due to a shortage of properties for sale. As price rises are expected to attract more sellers and forced sales rise with unemployment, supply pressures should ease, thus dampening price growth in the near term. Housing demand is expected to remain depressed, as labour market conditions will affect disposable income.
Inflation surprisingly sticky, to ease further
Despite the large rise in economy-wide spare productive capacity and oil prices having halved compared to their previous year's level, annual HICP inflation moderated only gradually throughout 2009 to 1.1% in September. This was driven to a large extent by the sharp nominal effective depreciation of sterling compared to the previous year (-10%, Q3 average). In view of the weakness of economic activity relative to potential, disinflationary pressures should continue to bear down on inflation throughout the forecast period, although in January 2010 the reversal of the 2.5 pps. VAT reduction is likely to lift inflation temporarily. Average earnings growth slowed noticeably throughout 2009 to around 2%, and should continue to slow further in 2010.
Competitiveness gain through depreciation
As markets' perception of risks in the UK financial sector turned increasingly pessimistic throughout the crisis, sterling depreciated substantially. This is expected to help rebalance the economy and generate a positive growth contribution from net external trade throughout the forecast period. The merchandise trade deficit has widened since the late 1990s, only partly financed by a rising surplus in services trade and investment income. An improvement in the trade balance is likely over the forecast horizon, driven by a recovery in exports of goods and services in 2010 as world trade activity resumes following its partly trade-finance-induced collapse in early 2009. The UK is in a good position to consolidate its strong services trade surplus in the medium term, and could further capitalise on its science and technology base by raising skill levels and private R&D spending. Imports are expected to lag the expected export recovery, as domestic demand stays weak and higher import prices gradually lead to a substitution for domestically produced output.
Extraordinary deterioration in public finances
The public finances are expected to remain in a very weak position throughout the forecast period. The high level of the structural government deficit before the outbreak of the present economic crisis limited the government's capacity to pursue a looser fiscal stance without compromising budgetary sustainability. The recent financial sector rescue operations have helped to shore up the banking sector, but have also generated large new contingent liabilities. The government deficit

European Economic Forecast, Autumn 2009
Table II.27.1:Main features of country forecast - THE UNITED KINGDOM
2008 Annual percentage changebn GBP Curr. prices % GDP 92-05 2006 2007 2008 2009 2010 2011
GDP 1448.3 100.0 2.8 2.9 2.6 0.6 -4.6 0.9 1.9 Private consumption 928.4 64.1 3.2 1.5 2.1 1.0 -3.3 -0.3 1.5 Public consumption 313.3 21.6 1.8 1.6 1.2 2.5 2.9 1.4 -1.8 Gross fixed capital formation 243.1 16.8 3.7 6.5 7.8 -3.3 -15.9 -3.8 3.0 of which : equipment 83.8 5.8 5.0 4.5 11.5 -3.0 -26.8 -9.3 2.3 Exports (goods and services) 422.2 29.2 5.6 11.3 -2.8 1.0 -11.5 1.8 4.6 Imports (goods and services) 459.5 31.7 6.6 8.8 -0.7 -0.8 -13.7 0.1 3.0 GNI (GDP deflator) 1474.7 101.8 3.0 1.8 3.3 1.0 -5.1 1.7 2.0 Contribution to GDP growth : Domestic demand 3.1 2.4 3.0 0.5 -4.3 -0.4 1.0
Stockbuilding 0.1 0.1 0.2 -0.4 -1.2 0.8 0.5Foreign balance -0.3 0.4 -0.6 0.5 1.0 0.4 0.4
Employment 0.7 0.9 0.7 0.7 -2.0 -0.9 1.3 Unemployment rate (a) 6.8 5.4 5.3 5.6 7.8 8.7 8.0 Compensation of employees/head 4.2 4.2 4.9 2.3 1.2 1.2 2.3 Unit labour costs whole economy 2.1 2.2 3.0 2.5 4.0 -0.6 1.7 Real unit labour costs -0.4 -0.6 0.1 -0.4 2.9 -2.2 -0.3 Savings rate of households (b) - - 2.2 1.5 4.3 5.0 6.1 GDP deflator 2.5 2.8 2.9 2.9 1.1 1.7 2.0 Harmonised index of consumer prices 1.9 2.3 2.3 3.6 2.0 1.4 1.6 Terms of trade of goods 0.1 -0.1 0.6 0.3 -1.5 0.3 0.5 Trade balance (c) -3.1 -5.8 -6.4 -6.5 -5.8 -5.5 -5.2 Current account balance (c) -1.6 -3.3 -2.7 -1.6 -2.4 -1.6 -0.9 Net lending(+) or borrowing(-) vis-à-vis ROW (c) -1.5 -3.2 -2.5 -1.4 -2.2 -1.4 -0.7 General government balance (c) -2.8 -2.7 -2.7 -5.0 -12.1 -12.9 -11.1 Cyclically-adjusted budget balance (c) -2.8 -3.5 -3.8 -5.7 -10.5 -11.4 -9.9 Structural budget balance (c) - -3.5 -3.8 -5.2 -10.3 -11.4 -9.9 General government gross debt (c) 43.6 43.2 44.2 52.0 68.6 80.3 88.2 (a) Eurostat definition. (b) gross saving divided by gross disposable income. (c) as a percentage of GDP.
156
in 2009/10 is estimated to increase to over 13% of GDP from 6.9% in the preceding financial year (running from April to March). Three-fifths of the forecast deterioration in 2009/10 is due to a drop in the revenue ratio that is largely a result of two interconnected factors: first, the sharp contraction in economic activity; and secondly, the additional losses in tax revenue from two hitherto major sources: the financial sector and the housing market. The expenditure ratio is also forecast to rise sharply, primarily reflecting the planned increase in non-cyclical primary and investment expenditure, higher social security expenditure and the front-loading of expenditure from 2010/11.
Table 2.27.2:General government projections on a financial year basis
2007/08 2008/09 2009/10 2010/11 2011/12Budget balance1 -2.8 -6.9 -13.0 -12.5 -10.7Structural budget balance -3.8 -6.3 -11.4 -11.0 -9.6Debt 43.3 55.2 71.8 82.0 89.11 Data adjusted for the consistent recording of UMTS licence proceeds.
The stimulus measures of around 1½% of GDP that were announced by the government for 2009/10 are estimated to account for a quarter of the increase in the deficit ratio in that year. The reversal of those stimulus measures should contribute to an improvement in the primary balance in 2010/11, though the reduction in the total deficit will be more modest as a result of a surge in debt servicing costs. In 2011/12, fiscal
consolidation is set to accelerate, driven by a sharp deceleration in planned discretionary expenditure, especially through lower investment spending, and an increase in social security contribution rates. A temporary fiscal operating rule has been devised to apply after the end of the crisis, but it will impose only a relatively weak constraint in terms of minimum fiscal effort (0.5 pp. of GDP p.a.).
The decline in the share of domestic demand in economic activity will depress revenue growth in 2011/12 and beyond. Revenue from corporate taxation, which accounted for a quarter of the tax revenue increase during the five years to 2007/08, and income tax will be also affected by financial sector weakness. On the expenditure side, the spending plans announced in the 2009 Budget imply a freeze in real government expenditure from 2011/12 to 2013/14, compared to an annual increase of 4¼% between 1999/00 and 2010/11. These spending targets, however, are not yet backed by published departmental spending plans.
The UK's debt ratio in 2009/10 is estimated to increase by around 16 pps. of GDP, driven by the high primary deficit and, to a lesser extent, by debt-increasing financial sector interventions and a denominator effect from lower GDP. In 2011/12 the debt ratio, at around 90% of GDP, is set to overtake that of the European Union as a whole.

Candidate Countries

28. CROATIA Mild recovery after strong contraction
158
The economy decelerated markedly in the first half of the year…
Over the last few years, Croatia enjoyed relatively strong economic growth, averaging 4.3% in 2004-08. The growth performance was primarily domestic-demand-driven, fuelled by large capital inflows and strong credit growth. This was accompanied by a marked expansion of non-tradable industries, such as retail, construction and the financial sector. The global financial crisis and economic slowdown in Croatia's main trading partners started to affect the Croatian economy in the last quarter of 2008, when domestic demand and trade flows declined abruptly. In the first half of 2009, Croatia went into a deep recession. Real GDP growth declined markedly – by 6.5% year-on-year compared to 2.4% in 2008. The contraction in output was mainly driven by a considerable drop in domestic demand. Private consumption fell by around 9.7% and real investment dropped by 12.6%. Only government consumption maintained positive growth of close to 2.6%, as spending was not reduced in line with falling revenues. All in all, domestic demand posted a negative contribution to GDP growth of 12.3 pp. At the same time, total exports declined by 17% year-on-year, though less strongly than total imports (-22.8%), resulting in a positive contribution by net exports to GDP growth of 5.8 pp.
…but the downturn is expected to be less pronounced in the remainder of 2009…
Recently published high frequency indicators suggest a further contraction of the economy in the third quarter. Industrial production and retail trade recorded strong declines in the two months of July and August of 8.7% and 14% year-on-year respectively.
However, there are some signs that the pace of economic downturn has somewhat moderated recently. In particular, revenues from tourism came out better than expected and seasonally adjusted production data point to a marginal positive growth in the second compared to the first quarter. A slowly improving external environment is expected to lead to a moderation of export losses towards the end of the year. External financing constraints have somewhat eased, and the
deceleration of credit growth is set to stop in the second half of 2009. Therefore, a continuation of a very modest recovery on a quarterly basis is to be expected in the third and fourth quarter. This will however not be sufficient to avoid a significant decline in real GDP for the year as whole. The forecast projects a fall in GDP of close to 6% year-on-year.
…followed by a zero growth rate in 2010 and continued mild recovery in 2011
The outlook for 2010 remains rather uncertain. It is still to be seen whether recent improvements in the external environment will translate into a strengthening of external demand. External financing constraints have eased somewhat in the course of the year, as evidenced by an increase in the external liabilities of domestic banks. However, a higher risk awareness among potential investors and the huge debt amortisation obligations weighing on both the private and general government sectors are likely to constrain financing for new investment. Domestic confidence levels and disposable incomes may not recover quickly, as the unemployment rate is set to increase and the number of employed to fall. Credit growth has decelerated significantly during the crisis, due to both demand and supply factors. Lower demand for loans as well as tighter financing constraints and higher risk awareness by banks have led to a slowdown in bank lending, particularly to private households. Although the banking sector is well-capitalised, sound and profitable, credit activity to the private sector will only slowly accelerate. Moreover, important public sector borrowing requirements limit the availability of credit to the private sector. Therefore, relatively low growth of private sector borrowing, in combination with higher interest rates, is expected to continue to put a brake on economic activity, particularly over the first part of the forecast horizon. Public consumption and investment are unlikely to accelerate in view of the fiscal constraints and huge refinancing needs of the public sector. On this basis, the forecast projects that the Croatian economy is likely to stagnate in real terms in 2010 on a year-on-year basis. Upside risks are mainly related to a faster-than-projected economic recovery in the EU as well as to the clear prospect of Croatia's accession in the near future which may provide additional impetus to the

Candidate Countries, Croatia
159
economy, through stronger net FDI flows, inter alia. For 2011, the forecast projects a small positive growth of around 2%, mainly based on a slight acceleration of private consumption and investment growth, while net exports continue to contribute negatively to output growth.
Graph II.28.1: Croatia - Contributions to GDP growth
-7
-5
-3
-11
3
5
7
04 05 06 07 08 09 10 11
y-o-y %
Net exports HH consumpt.Gov. consumpt. GFCFGDP
forecast
External deficits are likely to fall temporarily
As a result of the financial crisis, the high external deficits of the past years have undergone severe adjustments. Reduced capital inflows and a contraction of domestic demand have led to a sharp reduction of trade and current account deficits. In the first half of 2009, the current account deficit declined by around 40% year-on-year. In terms of GDP, it fell from 9.3% in 2008 to 6% annualised in June. As to the outlook, total exports are expected to fall less strongly in the second half of 2009, and to slightly increase in 2010, in line with an expected strengthening of foreign demand in key trading partner countries. Total imports are likely to continue to contract at a stronger pace than exports through 2009, and will pick up only slowly thereafter. In light of expected trade flows and on the assumption that external financing constraints may somewhat persist, the current account balance is projected to fall to around 6% of GDP in 2009 and to slightly widen to around 7¼% on average over the forecast period, mainly due to an expected increase in commodity prices.
Inflation pressures to remain low
Annual inflation has fallen markedly from its peak of 8.4% in July 2008, as a result of rapidly contracting domestic demand and lower commodity prices. Inflationary pressures are expected to remain low over the forecast horizon. Domestic demand is set to only slowly and
gradually recover. Cost push pressures are expected to remain limited as the growth of unit labour costs will slow down. Upside risks are related both to foreign and domestic factors. On the external front, somewhat higher prices for imported raw material are likely to have some effect on the domestic price level. Moreover, some mild inflationary pressures will result from the recent increase of VAT (by 1pp.) and excises as well as further adjustments of administrative prices, which will be necessary in the context of EU accession. At the same time, it is reasonable to assume that a stability-oriented monetary policy framework will help to prevent a significant re-acceleration of inflation over the medium term.
Labour market performance to suffer eventually
Wage developments have so far been moderate and remained in line with productivity growth. The government made an attempt to reverse earlier public sector wage increases which should contribute to limiting wage pressures in 2009 and 2010. In addition, the economic slowdown means that only moderate increases in labour costs in the private sector are expected.
As elsewhere, slowing growth and investment dynamics will have an impact on labour market developments with some delay. In 2009, employment is set to fall and the unemployment rate (labour force survey) to increase. The slight recovery of economic activity forecast for 2010 and 2011 is expected to somewhat ease the pressures on the labour market, but not yet to support a significant reduction of unemployment.
Fiscal deficit is widening significantly despite re-balancing measures
Fiscal policy was strongly affected by the crisis from late 2008, when revenues started to underperform markedly in line with declining economic activity. While some short-term adjustments were made in late 2008 to keep the deficit in line with the envisaged target, public finances came under increasing pressure in 2009. In the first half, state budget revenues declined by 8.6% year-on-year while total spending increased by 7.9%. The budget balance turned into a deficit, equivalent to 2.2% of projected GDP, compared to a small surplus in the same period a year ago. A bleaker-than-expected economic outlook and worsening fiscal trends forced the authorities to

European Economic Forecast, Autumn 2009
Table II.28.1:Main features of country forecast - CROATIA
2008 Annual percentage changebn HRK Curr. prices % GDP 92-05 2006 2007 2008 2009 2010 2011
GDP 342.2 100.0 - 4.7 5.5 2.4 -5.8 0.2 2.2 Private consumption 202.2 59.1 - 2.7 6.2 0.8 -7.0 0.5 2.5 Public consumption 63.5 18.6 - 5.0 3.4 1.9 -2.0 1.0 2.0 Gross fixed capital formation 94.3 27.6 - 10.9 6.5 8.2 -13.0 1.0 4.0 of which : equipment - - - - - - - - - Exports (goods and services) 143.4 41.9 - 6.5 4.3 1.7 -13.4 1.0 1.1 Imports (goods and services) 172.0 50.3 - 7.4 6.5 3.6 -21.5 2.5 2.5 GNI (GDP deflator) 330.7 96.6 - 4.6 5.8 1.7 -6.7 0.3 2.4 Contribution to GDP growth : Domestic demand - 5.3 6.1 3.0 -8.2 0.7 2.9
Stockbuilding - 0.4 0.8 0.4 -2.9 0.2 0.0Foreign balance - -0.9 -1.4 -1.1 5.4 -0.7 -0.7
Employment - 3.9 3.5 1.1 -1.0 0.5 0.5 Unemployment rate (a) - 11.2 9.6 8.4 10.0 9.8 9.4 Compensation of employees/head - 3.9 5.3 9.3 1.5 3.3 4.9 Unit labour costs whole economy - 3.0 3.3 7.9 6.7 3.6 3.1 Real unit labour costs - -0.4 -0.7 1.4 3.8 0.6 0.5 Savings rate of households (b) - - - - - - - GDP deflator - 3.4 4.0 6.4 2.8 3.0 2.5 Harmonised index of consumer prices - 3.2 2.9 6.1 2.6 3.0 3.0 Terms of trade of goods - - - - - - - Trade balance (c) - -21.3 -22.0 -22.9 -17.3 -18.2 -18.8 Current account balance (c) - -7.0 -7.6 -9.3 -6.3 -6.9 -7.7 Net lending(+) or borrowing(-) vis-à-vis ROW (c) - -7.3 -7.5 -9.2 - - - General government balance (c) - -3.0 -2.5 -1.4 -3.7 -3.0 -2.4 Cyclically-adjusted budget balance (c) - - - - - - - Structural budget balance (c) - - - - - - - General government gross debt (c) - 35.7 33.1 33.5 37.8 39.2 39.3 (a) as % of total labour force. (b) gross saving divided by gross disposable income. (c) as a percentage of GDP.
160
adopt a second and, shortly thereafter, a third budget revision in July. The re-balancing efforts foresaw some spending cuts, but were mostly concentrated on measures to compensate for falling revenues. This included, among other things, a special tax on income, a VAT increase of 1 pp., and increases in excises. Despite those adjustments, the planned fiscal deficit increased to 3.3% of GDP, compared to an original budget target of 1.4% of GDP. There remain downside risks to the 2009 budget execution: if the economic downturn persists for longer than expected, government revenues would be reduced further. Also, pressures for more government activism could result in higher-than-projected spending to combat the recession.
The forecast projects the fiscal deficit to increase to around 3½%-4% of GDP in 2009. A mild economic recovery and stronger revenue performance are expected to support a reduction of the deficit to around 3% in 2010. The general government debt-to-GDP ratio is set to increase from 33.3% to around 39½% of GDP.
Overall, public finances in Croatia are expected to remain under pressure as downside risks are evident on both the revenue and spending side of the budget. Therefore, a key challenge will be to design and implement a credible medium-term
fiscal strategy aimed at reducing budget rigidities and enhancing the efficiency and quality of public spending. Such a strategy would need to be supported by a continuation and acceleration of economic restructuring on a broader front as well as by deeper reforms of the social benefit system.

29. THE FORMER YUGOSLAV REPUBLIC OF MACEDONIA Workers' remittances support stability
161
Output decline accelerated during first half year
The global financial crisis increasingly affected economic activity from the last quarter of 2008 onwards. Investment dropped markedly end of 2008 in response to declining export prospects and increased uncertainty. Private consumption dropped in the second quarter, reflecting growing uncertainty among households about the near-term future and increasing lay-offs in the manufacturing industry. However, the output decline has remained rather moderate so far, partly thanks to a resilient banking sector but also due to significant government spending at the end of 2008, turning an accumulated fiscal surplus of 2% of GDP into the envisaged end-year deficit of 1% of GDP.
In response to the financial crisis, the government announced two anti-crisis packages, one in December 2008, claiming a volume of some 5% of GDP and another in March in the form of an extended investment programme, envisaging an increase of public investment from some 3% of GDP in the past to 7% of GDP in 2009. However, the actual impact of both packages on public revenue and expenditure so far has been very limited, leaving the end-year spending boom as the main fiscal stimulus. These substantial income transfers and public purchases probably supported domestic demand in the first quarter of 2009, but at the same time kept external imbalances rather high. In view of declining capital inflows, the financing of these imports created pressure on the country's foreign reserves.
Consumer price inflation further decelerated during 2009, from some 4% in December 2008 to slightly negative rates since mid-2009. The main driving factors for the decline in inflation are lower prices for food, energy and transport.
The labour market situation worsened towards the end of 2008, when the slowdown in economic activity was accompanied by a deceleration in employment growth. Furthermore, many of the newly created jobs were low income jobs in the agricultural sector or were related to public construction activities. Unemployment dropped slightly, but still remained at the alarmingly high level of some 34% of the labour force. Youth unemployment stayed at some 54%.
Graph II.29.1: The former Yugoslav Republic of Macedonia - Labour market
-5-4-3-2-101234567
03 04 05 06 07 08 09 10 11
% of GDP
30
32
34
36
38
40
42
Unemployment rate (rhs) Employment growth (lhs)GDP growth (lhs)
forecast
% of labour force
The exchange rate of the Denar has remained largely unchanged against the euro at a level of 61.4 MKD/EUR. The Central Bank intends to maintain its current informal peg to the euro.
A moderate recession but protracted structural challenges remain
Overall, economic activity is expected to decline by about 2% in 2009, due to shrinking exports, lower investment and a drop in private consumption. In 2010, the negative impulse from the global crisis is expected to subside, which should allow the economy to expand by around 1½%. The main sources for this recovery will be private and public consumption, while exports are likely to remain sluggish. In 2011, economic activity is expected to increase by some 2½%, benefiting from the recovery of the country's export markets.
Given the uncertainties related to the global economy, domestic demand, and in particular real disposable income will be key factors for the country's growth dynamics. Overall, real disposable income is expected to remain rather stable, benefiting from relatively low inflation and the stabilising impact of workers' remittances on household income.
In recent years, workers' remittances and other private capital inflows had increased to up to 19% of GDP. During the forecast period, those inflows are expected to return to their previous levels of some 15% of GDP, reflecting the more difficult labour market situation in the host countries. Nevertheless, this source of income is expected to

European Economic Forecast, Autumn 2009
Table II.29.1:Main features of country forecast - THE FORMER YUGOSLAV REPUBLIC OF MACEDONIA
2008 Annual percentage changebn MKD Curr. prices % GDP 92-05 2006 2007 2008 2009 2010 2011
GDP 398.6 100.0 - 4.0 5.9 4.9 -2.0 1.5 2.5 Private consumption 312.9 78.5 - 6.0 9.8 6.9 -1.0 1.5 2.1 Public consumption 75.7 19.0 - 1.8 0.4 9.7 4.0 3.0 2.5 Gross fixed capital formation 97.6 24.5 - 11.6 13.1 20.3 -18.0 1.0 2.2 of which : equipment 40.1 10.1 - 8.0 22.7 - - - - Exports (goods and services) 209.6 52.6 - 8.4 14.3 -4.3 -25.0 1.4 4.5 Imports (goods and services) 313.2 78.6 - 10.9 17.4 5.8 -19.7 1.8 2.9 GNI (GDP deflator) 392.9 98.6 - 5.4 1.4 8.7 -1.7 1.4 2.5 Contribution to GDP growth : Domestic demand - 7.0 10.1 11.1 -4.4 2.0 2.6
Stockbuilding - 0.0 0.5 0.2 0.0 0.0 0.0Foreign balance - -3.1 -4.7 -6.5 2.4 -0.6 0.0
Employment - 3.2 4.3 3.2 -2.7 -0.5 0.1 Unemployment rate (a) - 36.0 34.9 33.8 35.6 36.1 36.4 Compensation of employees/head - 11.7 -4.8 4.5 1.4 0.5 0.9 Unit labour costs whole economy - 10.8 -6.3 2.8 0.7 -1.4 -1.5 Real unit labour costs - 6.2 -12.8 -4.2 -0.7 -2.7 -3.8 Savings rate of households (b) - - - - - - - GDP deflator - 4.4 7.5 7.3 1.4 1.3 2.3 Harmonised index of consumer prices - 3.2 2.2 8.3 -0.6 1.1 2.2 Terms of trade of goods - 2.4 8.4 -0.4 0.0 0.0 0.0 Trade balance (c) - -20.2 -20.3 -26.7 -22.6 -21.9 -21.4 Current account balance (c) - -0.9 -7.2 -13.1 -9.6 -9.2 -8.9 Net lending(+) or borrowing(-) vis-à-vis ROW (c) - - - - - - - General government balance (c) - -0.5 0.6 -1.0 -4.0 -3.5 -3.3 Cyclically-adjusted budget balance (c) - - - - - - - Structural budget balance (c) - - - - - - - General government gross debt (c) - 36.5 27.6 20.8 25.5 28.3 30.3 (a) as % of total labour force. (b) gross saving divided by gross disposable income. (c) as a percentage of GDP.
162
remain at a very significant level. As long as international prices for energy and raw materials remain moderate, inflation probably will be low during the forecasting period. This should support the real income of households.
Labour income is likely to shrink in 2009, resulting from declining employment and low wage growth. During recent years, employment growth has been rather high at some 3% annually. However, many of the newly created jobs were in sectors with low productivity, such as agriculture. In view of the likely still difficult international environment in 2010 and 2011, the country's potential for creating additional jobs or raising real wages will remain limited. Improving the country's labour income thus is closely linked to improving productivity by modernising and deepening the capital stock.
As a result of subdued domestic activity, the current account deficit is likely to decline in 2009, but to remain relatively high. Increasing domestic demand in 2010 and 2011 will keep the external imbalances at a high level.
Public finances are likely to deteriorate
Weaker domestic activity and low inflation imply a significant drop in public revenues. At the same
time, a high share of non-discretionary spending is likely to keep public expenditure high. So far crisis-related spending, such as the need to recapitalise troubled banks, has remained rather limited.
Graph II.29.2: The former Yugoslav Republic of Macedonia - Public finances
-5-4-3-2-10123
03 04 05 06 07 08 09 10 11
% of GDP
102030405060708090
Gen.Gov. debt (rhs) Gen.Gov. deficit (lhs)
forecast% of GDP
As a result, the forecast expects an only moderate increase in the deficit, assuming that revenue shortfalls will be partly compensated by lowering spending for capital investment. Accelerating economic activity in 2010 and 2011 will help to lower the deficit towards 3% of GDP. However, public debt is likely to increase, reaching some 30% of GDP by 2011.

30. TURKEY Drawn-out recovery after deep recession
163
Economic activity slumps in 2008
After an outstanding growth performance during 2002-06, the Turkish economy started to decelerate already in 2007. Domestic factors, such as increased political uncertainty, a slowdown of reforms and tight monetary policy following the currency crisis in mid-2006, took a heavy toll on the growth dynamics.
In 2008 the economic crisis hit Turkey mainly via the trade and financial channels. In the last quarter of the year real GDP contracted by 6½% in annual terms, as exports and investment declined by 8½% and 17⅔% respectively. Global demand shrank fast in sectors such as automotive and white goods, where Turkey had previously built a solid manufacturing basis for the European market. Simultaneously, lower private external inflows and decelerating domestic credit led to a 5⅓% annual decline in private consumption. The combined trade and financial shock disrupted activity in the manufacturing sector causing a 12⅔% decline of industrial output in the last quarter of 2008. Overall, real GDP growth slowed to below 1% while investment growth already turned negative by -5% in 2008.
Previous structural reforms, in the banking sector in particular, had put Turkey on a sturdy footing. It was therefore rather resilient to the global turmoil and avoided a full-fledged financial crisis. The authorities could also afford to significantly loosen both the monetary and fiscal stance in response to the crisis. This helped cushion the downturn and in particular the decline in private consumption. The fiscal stimulus, planned at around 5% of GDP during 2008-10, was focused and prioritised after the local elections in March 2009, when significant consumption tax incentives and an investment scheme were introduced. Private sector confidence would have benefitted from clearer fiscal plans however, including a timely release of the Medium-Term Economic Programme.
Deep contraction in 2009 followed by gradual recovery
The recession hit its trough in the first quarter of 2009 when real GDP collapsed by 14⅓% year-on-year. The decline in private consumption, investment and exports were all in the double-digit
range. The anti-crisis measures introduced by the government, in particular the consumption tax cuts, helped limit the decline in private consumption to -1¼% year-on-year in the second quarter of 2009. Indeed, seasonally adjusted real GDP even increased by around 7% quarter-on-quarter in the second quarter of the year. But investments and exports improved only marginally compared to their disappointing performance in the first quarter, suggesting that the pace of the recovery would slow down once the effects of the fiscal stimulus fade away. Overall, economic output is expected to decline by 5¾% in real terms in 2009.
With regard to the GDP components, private consumption is expected to drop sharply by almost 5% even though it is cushioned by the government fiscal incentives. The decline in total domestic demand would be somewhat alleviated by the 3¼% growth in public consumption. Among the domestic demand components, investment is forecast to experience the sharpest decline in excess of 20%. A substantial destocking as companies try to adjust to lower sales is also expected to contribute negatively to growth, cutting about 1¼ pps. off the real GDP growth rate. The unfavourable external environment is expected to lead to a double-digit decline in exports, which represents a significant drag on economic activity in 2009.
Graph II.30.1: Turkey - Growth, consumption and investment
-25
-20
-15
-10
-5
0
5
10
15
06 07 08 09 10 11
y-o-y %
-8
-6
-4
-2
0
2
4
6
8y-o-y %
GDP (rhs) Private consumption (lhs)Gov. consumption (lhs) GFCF (lhs)
forecast
The feedback loop from the underperforming real economy to the financial sector is likely to remain subdued given the still moderate increase in non-performing loans. Having been reshuffled after the

European Economic Forecast, Autumn 2009
164
2001 crisis, the banking sector is now well capitalised and its exposure to currency and maturity mismatches remains limited. Nonetheless, loan growth has decelerated markedly in the crisis due to external financing constraints, lower economic activity and tightened lending standards. This has negatively affected domestic demand in 2009 and is likely to slow the recovery of private consumption and investment also over the forecast horizon. Moreover, the notable increase in public sector borrowing requirements would further limit the availability of credit for the private sector.
The recovery of investment in equipment is likely to be hampered by the low capacity utilisation rate, which is still about 10 pps. below the 2007 average level. As the external demand is also projected to pick up only slowly and the fiscal expansion to be gradually reined in, the recovery is likely to be less robust than in previous boom-bust cycles. Therefore, real GDP growth is expected to return to positive territory, 2¾% in 2010 and 3⅔% in 2011, but to remain below potential growth over the forecast horizon. Unlike in 2009, domestic demand and stock-building are likely to make a positive contribution to growth, but the contribution of net exports will turn negative again.
Graph II.30.2: Turkey - Public finances
-8-7-6-5-4-3-2-1012
04 05 06 07 08 09 10 11
% of GDP
10
20
30
40
50
60
70
Gen.Gov. debt (rhs) Gen.Gov. deficit (lhs)
forecast% of GDP
Lower external imbalances
The positive terms-of-trade shock caused by the decline in oil and commodity prices together with the depressed domestic demand are leading to a major contraction of the trade and current account deficits in 2009. In the first eight months of the year, the current account deficit declined by more than 80% year-on-year. It is projected to shrink from around 5⅔% of GDP in 2008 to about 2% of GDP in 2009. Over the forecast horizon, it is
expected to grow moderately to around 3⅔% of GDP in 2011, as foreign capital inflows recover.
Exports of goods and services will return to positive, but relatively slow annual growth of about 2% in 2010 and 4% in 2011. This is in line with an expected strengthening of external demand and benefits from the 2008 base effect. Helped by the recovery of domestic demand, imports are projected to pick up faster than exports, leading to wider external imbalances. At the same time, the high level of unaccounted inflows in foreign currency, which made up for the shortfall in official capital inflows since October 2008 are unlikely to continue at the same pace going forward.
The welcome adjustment of external imbalances together with the relatively smooth access to external financing relieved the pressure on the exchange rate. The continuation of FDI inflows in the crisis, albeit at a lower pace, may provide additional impetus to the recovery.
Inflation to meet targets during 2009-11
In 2009, the disinflation process has been supported by the depressed aggregate demand and the decline in energy prices which outweighed inflationary pressures stemming from the central bank's substantial interest rate cuts. The end-of-period inflation is expected to recede substantially below the central bank's target of 7½%. Inflationary pressures are likely to remain subdued over the forecast horizon. Given the slow and gradual recovery of domestic demand the 2010 and 2011 targets of 6½% and 5½% respectively are also expected to be met. The elevated unemployment rate is expected to help lower unit labour costs in real terms, thus facilitating the structural adjustment process.
Unemployment shoots up
The situation on the labour market worsened already in 2008, when the unemployment rate started to pick up, in particular in the last quarter of the year. The 2009 recession is likely to lead to the unemployment rate surging by almost 4% pps. Although employment is expected to grow over the rest of the forecast horizon, the unemployment rate will continue to rise towards 14% in 2010 and recede only modestly in 2011. The annual inflows into the labour force are large at around 2% annually given Turkey's young population.

Candidate Countries, Turkey
Table II.30.1:Main features of country forecast - TURKEY
2008 Annual percentage changebn TRY Curr. prices % GDP 92-05 2006 2007 2008 2009 2010 2011
GDP 948.7 100.0 4.2 6.9 4.7 0.9 -5.8 2.8 3.6 Private consumption 663.0 69.9 4.3 4.6 5.5 -0.1 -4.9 2.2 3.7 Public consumption 121.9 12.8 3.8 8.4 6.5 1.9 3.2 1.8 2.6 Gross fixed capital formation 188.8 19.9 5.5 13.3 3.1 -5.0 -20.6 3.1 6.2 of which : equipment 98.4 10.4 7.3 10.2 1.2 -3.4 -22.3 3.3 6.3 Exports (goods and services) 227.7 24.0 9.5 6.6 7.3 2.3 -10.4 1.9 4.1 Imports (goods and services) 275.3 29.0 10.6 6.9 10.7 -3.8 -19.6 4.8 6.5 GNI (GDP deflator) 938.6 98.9 4.2 6.8 4.8 0.9 -5.8 2.8 3.6 Contribution to GDP growth : Domestic demand 4.9 7.4 5.4 -1.1 -7.6 2.4 4.1
Stockbuilding 0.1 -0.1 0.6 0.3 -1.2 1.2 0.2Foreign balance -0.7 -0.4 -1.3 1.7 3.1 -0.7 -0.7
Employment 0.8 1.3 1.1 2.2 -1.3 0.9 1.4 Unemployment rate (a) 8.4 9.9 8.5 9.8 13.5 13.9 13.5 Compensation of employees/head 55.3 12.7 12.7 8.6 -1.2 6.4 7.2 Unit labour costs whole economy 50.2 6.8 8.9 10.0 3.5 4.4 5.0 Real unit labour costs -2.6 -2.3 2.5 -1.5 -2.0 -1.3 -0.3 Savings rate of households (b) - - - - - - - GDP deflator 54.3 9.3 6.2 11.7 5.6 5.8 5.3 Harmonised index of consumer prices - 9.3 8.8 10.4 6.1 5.6 5.5 Terms of trade of goods -0.1 -4.9 3.3 -2.7 2.7 -1.0 -1.0 Trade balance (c) -6.3 -7.5 -7.3 -7.0 -3.6 -4.2 -4.8 Current account balance (c) -2.2 -6.1 -5.9 -5.7 -2.1 -2.8 -3.6 Net lending(+) or borrowing(-) vis-à-vis ROW (c) - - - - - - - General government balance (c) - 1.2 -1.0 -2.2 -7.9 -6.8 -5.8 Cyclically-adjusted budget balance (c) - - - - - - - Structural budget balance (c) - - - - - - - General government gross debt (c) - 46.1 39.4 39.5 47.3 49.8 51.0 (a) as % of total labour force. (b) gross saving divided by gross disposable income. (c) as a percentage of GDP.
165
Consequently, the relatively slow recovery foreseen during 2010-11 is unlikely to bring the unemployment rate down rapidly.
Protracted fiscal adjustment after the crisis
In 2009, the fiscal stance was loosened significantly in response to the crisis and before the local elections. While revenues remained almost flat compared to 2008, public expenditures accelerated at a double-digit rate and in particular for current transfers. The authorities expect the central budget deficit – on a cash basis – to widen by almost 5% pps. to 6⅔% of GDP in 2009. Therefore, the general government balance is likely to reach almost 8% of GDP in 2009 in ESA 95 terms.
As a corollary, public debt is expected to surge to about 47⅓% of GDP from 39½% of GDP in 2008. The announcement of the Medium-Term Economic Programme - although delayed by several months - removed some of the uncertainty regarding the fiscal path. Pending further elaboration of the programme's measures to support the achievement of the fiscal targets, the budget deficit is expected to decline more slowly than foreseen in the programme and reach around 6¾% of GDP in 2010 and 5¾% of GDP in 2011. This would not be enough to ensure the planned
stabilisation of the public debt-to-GDP ratio over the programme period. As a result, the public debt-to-GDP ratio will continue to rise over the forecast horizon to 51% of GDP in 2011.


Other non-EU Countries

31. THE UNITED STATES OF AMERICA Strong headwinds will slow down recovery
168
The recession which started at the end of 2007 has been the deepest and longest in the United States for more than sixty years. It has taken a heavy toll in terms of employment and output loss. Current data indicate that output contraction ended last summer and that the economy is stabilising although unemployment continues to rise. The financial system has improved, but remains fragile. The headwinds facing the economy are formidable and are likely to make the recovery relatively sluggish and prone to setbacks over the forecast period.
Exit from the Great Recession
The National Bureau of Economic Research, the quasi-official arbiter of the US business cycle, has determined that the recession started in December 2007. The downturn was moderate at first, partly because the stimulus package from February 2008 supported domestic demand temporarily. When the financial crisis worsened in connection with the failure of Lehman Brothers, economic activity started to contract sharply. According to current data, real GDP declined by 3.8% from the second quarter of 2008 to the second quarter of 2009.
Currently, a wide array of data is suggesting that the recession ended in the summer months although this will not be confirmed for some time. Data on industrial production and the purchasing managers' index indicate that manufacturing is expanding again. The PMI for the non-manufacturing sector has also risen above the 50%-mark in September. Capital spending shows signs of stabilisation after the free fall of last winter. Export volumes have started to increase again. The housing sector seems to have bottomed out with home sales and housing starts rising from very low levels. House prices have stopped declining and may even be rising again, according to some national measures. Consumer spending has increased in the third quarter, helped by government incentives for car purchasing. Overall, economic activity seems to be expanding at an above-trend pace in the second half of 2009. Certainly employment, always a lagging indicator of the business cycle, has continued to fall, but at a much reduced speed compared to the worst months of the recession last winter.
Drivers of the recovery
One of the main drivers of domestic demand at the current juncture is the fiscal stimulus contained in the American Recovery and Reinvestment Act of 2009 which was adopted in February. According to the Congressional Budget Office, the Recovery Act will increase the federal deficit by $787 billion over the next ten years, predominantly in the first three years. The expected sequence of measures means that the fiscal stimulus amounts to 2.0% of GDP in 2009, 2.3% in 2010 and 0.7% in 2011. About one quarter of the stimulus consists of tax cuts. Most of the rest is devoted to infrastructure projects, but it also includes assistance to state and local governments, an extension of unemployment insurance benefits, and additional funding for other social programmes. Most of the $150 billion of expenses in the first six months have been for individual tax cuts, state fiscal relief, and transfers to those most directly hurt by the recession.
Plausible estimates of the macroeconomic impact of the Recovery Act suggest that annualised real GDP growth has been lifted by about 2 pps. in the second quarter and by 3 pps. in the third quarter. The effect on GDP growth will decline gradually in subsequent quarters and turn negative in the second half of 2010. In addition to February's stimulus package, consumer spending and GDP growth received temporary support in the third quarter from the $3 billion spent under the government incentive programme for new car purchases ("cash for clunkers").
A second important driver of the economy in the near term is the inventory cycle. In the first half of 2009 business inventories were reduced at a very fast rate, which deepened the recession significantly. Stocks have now been brought into much better alignment with sales, particularly in the automotive industry. Although inventories overall are still declining, this now seems to happen at a slower rate which already provides a positive contribution to GDP growth. As the inventory cycle progresses and enters the restocking phase, the positive growth contribution will continue. It is expected that the effect will be very strong until next spring and then flatten out.
The dollar's recent depreciation will also strengthen the recovery over time (based on the

Other non-EU Countries, The United States of America
169
assumption of constant exchange rates). In real effective terms the dollar's exchange value has fallen by 8% between March and September 2009, thereby reversing the appreciation over the preceding six month period and benefitting the international competitiveness of US goods and services. Once import-intensive restocking has petered out and trade flows have normalised, net exports are expected to make a positive contribution to GDP growth.
In addition, the recovery will be supported by a continuation of an extremely accommodative monetary policy and the recent improvement in financial market conditions. The Federal Reserve already lowered the policy interest rate to close to zero at the end of last year and continues to state that "economic conditions are likely to warrant exceptionally low levels of the federal funds rate for an extended period". There has been an impressive rise in equity values since March and a material decline in private sector borrowing rates
Graph II.31.1: USA - Q uarterly growth rate of real GDP
-8
-6
-4
-2
0
2
4
6
07Q3 08Q3 09Q3 10Q3 11Q3
saar %
forecast
Headwinds
The fiscal stimulus and the inventory cycle will only boost growth temporarily. The key question for the recovery is therefore whether it will have become self-sustained when the temporary factors subside. A cyclical upturn has an inherent dynamism which will usually ensure this. However, the US economy is currently encumbered by a number of weaknesses which will tend to mitigate the recovery.
(1) The drop in house and equity prices has reduced the net worth of US household by close to 17% between the beginning of the recession and mid-2009. This is bound to result in a large negative wealth effect. Households will cut back on consumption as they try to rebuild their wealth
by saving out of income to compensate for the fall in the value of their assets. The net saving rate (measured as personal saving as a percentage of personal disposable income) has already doubled from 2% in the pre-recession period to around 4% between May 2008 and August 2009. A further significant rise is likely since wealth effects usually operate with a time lag.
(2) Although the fiscal stimulus is going to add to GDP growth until the middle of next year, the effect has probably already peaked. Unless additional stimulus is injected into the economy or other demand-boosting factors will take over from the Recovery Act, the payback in terms of reduced growth numbers will become clear in the course of 2010. In addition, the budgets of states and local governments are facing large revenue shortfalls which need to be addressed with tax increases or spending cuts under existing constitutional requirements. Federal transfers appropriated in the Recovery Act will only finance part of the growing budget deficits. This means that the sub-federal public sector will exert a drag on the recovery over the forecast period.
(3) The labour market has continued to weaken in recent months although the rest of the economy is stabilising. Employment has declined throughout the third quarter while unemployment has approached the 10% mark. Even a more concurrent indicator like first-time claims for unemployment benefits has remained in recessionary territory and hourly earnings are close to stagnation. The implication is that income growth will continue to suffer and consumer spending with it. The experience of "jobless recoveries" after the two preceding recessions seems to be repeated. The dismal state of the labour market is also reflected in consumer confidence. Although it is up from the record-low early this year, it remains close to a level which represented the lows during previous recessions.
(4) The economy's spare capacity in the form of unemployed workers, idle manufacturing capacity and vacant homes are at or close to record-high levels. The Congressional Budget Office estimates that output will be about 7% below its potential in 2009. The existing slack in resource utilisation is likely to restrain private fixed investment throughout the forecast period.
(5) Although financial conditions have improved recently, credit availability for households is likely

European Economic Forecast, Autumn 2009
Table II.31.1:Main features of country forecast - THE UNITED STATES
2008 Annual percentage changebn USD Curr. prices % GDP 92-05 2006 2007 2008 2009 2010 2011
GDP 14441.2 100.0 3.3 2.7 2.1 0.4 -2.5 2.2 2.0 Private consumption 10129.9 70.1 3.7 2.9 2.6 -0.2 -0.8 -0.2 0.4 Public consumption 2386.8 16.5 1.5 1.2 1.5 3.4 2.5 4.1 2.9 Gross fixed capital formation 2667.1 18.5 5.7 2.3 -1.4 -4.2 -14.5 4.6 4.5 of which : equipment 1264.9 8.8 7.4 8.2 1.5 -4.4 -15.0 3.9 4.4 Exports (goods and services) 1831.1 12.7 5.2 9.0 8.7 5.4 -10.9 7.7 8.4 Imports (goods and services) 2538.9 17.6 8.2 6.1 2.0 -3.2 -14.9 7.5 5.7 GNI (GDP deflator) 14583.1 101.0 3.5 3.5 0.9 -0.2 -2.8 2.2 2.0 Contribution to GDP growth : Domestic demand 3.8 2.7 1.8 -0.4 -2.8 1.3 1.5
Stockbuilding 0.1 0.1 -0.3 -0.4 -0.7 1.1 0.3Foreign balance -0.5 -0.1 0.6 1.2 1.1 -0.2 0.2
Employment (*) 1.3 2.1 1.1 -0.5 -3.5 -0.5 0.3 Unemployment rate (a) 5.4 4.6 4.6 5.8 9.2 10.1 10.2 Compensation of employees/head 3.8 4.1 3.7 2.6 -0.2 0.6 0.7 Unit labour costs whole economy 1.7 3.5 2.7 1.7 -1.3 -2.1 -0.9 Real unit labour costs -0.4 0.2 -0.2 -0.5 -2.4 -2.1 -0.8 Savings rate of households (b) - - 4.5 5.3 7.2 8.2 10.0 GDP deflator 2.1 3.3 2.9 2.1 1.1 0.0 -0.1 General index of consumer prices - 3.2 2.8 3.8 -0.5 0.8 0.1 Terms of trade of goods -0.2 -0.8 -0.1 -5.7 6.4 -2.5 -0.9 Trade balance (c) -3.6 -6.5 -6.1 -6.0 -3.7 -4.2 -4.2 Current account balance (c) -3.0 -6.0 -5.2 -4.9 -2.9 -3.4 -3.3 Net lending(+) or borrowing(-) vis-à-vis ROW (c) -3.1 -4.3 -5.1 -5.6 -3.0 -3.4 -3.3 General government balance (c) -2.6 -2.0 -2.7 -6.4 -11.3 -13.0 -13.1 Cyclically-adjusted budget balance (c) - - - - - - - Structural budget balance (c) - - - - - - - General government gross debt (c) 64.5 61.2 62.2 70.7 82.7 93.9 105.3 (a) as % of total labour force. (b) gross saving divided by gross disposable income. (c) as a percentage of GDP. (*) Employment data from the BLS household survey.
170
to remain more restricted than before the financial crisis. Mortgage lending has clearly returned to stricter lending standards. New issues of subprime mortgages have practically disappeared and non-conforming loans are only made with large premiums. Consumer credit is contracting, partly reflecting stricter lending practices. At least as long as unemployment is rising and, thereby, default risk, credit availability is unlikely to improve. This will be an additional restraint on consumer spending going forward.
A subdued recovery with a second dip in 2010
The balance and sequence of driving forces and headwinds suggests a growth profile with an above-trend expansion of around 3% during three quarters starting in mid-2009. But when the fiscal stimulus and the inventory cycle lose most of their power next spring, the economy is likely to fall into a state of low growth in which the inherent dynamics of the recovery are largely offset by the restraints listed above. Only in 2011 the economy should be able to return gradually to growth close to its long-run potential. But this will be far from sufficient to close the output gap by the end of the forecasting period. It would result in annual average growth of 2.2% in 2010 and 2.0% in 2011. This would represent a very subdued performance
by historical standards and in view of the depth of the preceding recession.
In this scenario, the unemployment rate will rise to 10% next year and slightly higher in 2011. The large slack in resource utilisation should keep headline inflation low over the forecasting period. The household saving rate will rise by 4½ pps. from 2008 to 2011. Over the same period, the fiscal deficit of general government will more than double to 13% of GDP. The current account deficit is narrowing significantly from 4.9% of GDP last year to 2.9% in 2009. But this improvement is not expected to last. In 2010 and 2011 the current account deficit should widen again to around 3⅓% of GDP although export growth is projected to be higher than import growth, particularly in 2011.
The risks associated with this forecast are considerable, but appear to be balanced. Regarding GDP growth, the risks relate mainly to the uncertainties about the magnitude of the rise in the household saving rate.

32. JAPAN Huge economic challenges for the new government
171
More than one 'lost decade'?
Following the bursting of asset bubbles in 1989-90 Japan had been going through a period of very low annual GDP growth, the so-called 'lost decade.' The lack of reduction in existing overcapacities in industry and banking and the slow resolution of problems in the banking sector led to a period of anaemic growth coupled with deflationary developments. This drove Japan into a recession in 1998, when the unfortunate timing of the rise in the sales tax coincided with the outbreak of the Asian financial crisis. To each crisis, the LDP-led government reacted with huge fiscal stimulus plans focused on construction projects. In a highly developed country like Japan, this not only led to 'cathedrals in the desert', but also induced a fast rise in the country's debt burden, bringing the gross debt-to-GDP ratio to the highest among G7 countries. The economy took another hit when the global IT bubble burst in 2001.
Japan's experience in tackling this long crisis period is noteworthy. Economic developments only turned better, when in the same year the newly appointed government started to implement some overdue structural reforms. The problems related to non-performing loans of the banking sector were resolved through the injection of considerable budgetary means into the banks' capital (however, this did not change the chronic inefficiency of most of Japan's banking sector). Furthermore, the successive governments in the years 2001 to 2006 implemented strong cuts in the construction budget(s) and the country's pension system, which succeeded in bringing to a halt the fast rise in the debt ratio. Structural labour market reforms were enacted, which led to a rapid increase in the share of non-regular employment in overall employment. The favourable global developments and a Yen weakened by carry-trades supported an export-driven recovery, which for the first time since 1990 led to considerable recovery in land prices in Tokyo, Nagoya and Osaka, underlining the rising regional discrepancies in economic development. In the final phase, deflation was overcome and nominal GDP was finally clearly higher than in 1990. Private consumption also started to perform well, driven not least by a considerable decline in the country's saving rate.
Following the Prime Minister's resignation in 2006, however, the reform process stalled, leaving Japan relatively unprepared for the current Great Recession, in spite of the low exposure of the country's banks to toxic assets.
The downturn was precipitous
In spite of this low exposure and of the rising importance of other Asian markets for Japanese exports - China's share in Japanese exports (19.1%) is now clearly higher than the US share (15.8%) or the EU one (11.4%) - Japan was hit early by developments in the US. Following the rising problems of the financial sector in the US, carry-trades reversed as Japanese investors repatriated funds into Japan's safe heaven. As a consequence, the Yen appreciated strongly, rising from an average monthly rate of Yen 122.7 to the US dollar in June 2007 to Yen 112.5 in December 2007, and Yen 106.7 in September 2008. On a relative effective basis, the negative impact of exchange rate developments was worsened by the fact that in July 2008 China de facto re-pegged its currency to the US dollar and that neighbouring countries like Korea saw their currency decline strongly against the US dollar.
Graph II.32.1: Japan - Yen per US dollar
60
70
80
90
100
110
120
130
Jan-07
May-07
Sep-07
Jan-08
May-08
Sep-08
Jan-09
May-09
Sep-09
Yen/USD
Following the failure of Lehman Brothers in September last year, the already ongoing decline in Japan's growth accelerated clearly and a second-wave of Yen repatriation started, driving the Yen up to Yen 91 per US dollar in December 2008 and Yen 88.3 at the point of writing. This time, the Yen also appreciated strongly against the euro,

European Economic Forecast, Autumn 2009
172
rising from an average of Yen 153 to the euro in September 2008 to Yen 123 in December last year.
With exports down by 13.6% in the fourth quarter of last year (in volume and seasonally-adjusted terms), and by 22.5% in the first quarter - while imports proved more resilient - GDP declined by 3.5% q-o-q in the fourth quarter of 2008 and by another 3.1% in the first quarter of 2009. Supported by the government's stimulus package, in the second quarter both public investment and private consumption contributed positively to the quarterly growth rate of 0.6% as did net exports.
Trade as a whole, however, continues to underperform. Exports in August were still down by 37.1% on the year (in value terms), following a decline by 37.6% in July and imports in August declined by 42.8% (following a drop by 41.2% in July and by 43.8% in June). In the first seven months of this year, the current account surplus has declined further, due to the ongoing decline in income from abroad.
Given the strong appreciation of the Yen and the rising (negative) output gap, it does not surprise that the growth of consumer prices has also turned negative again. In August, the core index (i.e. excluding volatile fresh food prices) was down by 2.2% on the year, the sharpest drop since comparable data was first recorded in 1971. As growth is expected to remain weak in the short-term and on the basis of our exchange-rate assumptions, it seems likely that deflationary developments will continue for some time and that the 2010 inflation rate will still be negative.
Graph II.32.2: Japan - Consumer prices
-2
-1
0
1
2
00 01 02 03 04 05 06 07 08 09 10 11
y-o-y%
forecast
Subdued growth in the short-term
The short-term outlook for the Japanese economy has improved compared to the quarterly projections of the spring forecast. With public investment in particular and final demand as a whole expected to be higher than assumed in spring, growth in the second half of the current year is likely to be higher than forecast in spring. Industrial production in the third quarter has increased regularly and the short-term outlook for industrial production for October remains positive, with METI (Ministry for Economy, Trade and Industry) forecasting a rise by 2.2% on the month. Furthermore, the Tankan, the most accurate leading indicator for the Japanese economy has also continued to improve in September, rising from minus 48 in the June survey to minus 33 among large manufacturers and from minus 29 in June to minus 24 in September among large non-manufacturers. Nevertheless, given the worse-than-projected performance in preceding quarters, the expected GDP growth rate for the current year as a whole has deteriorated from -5.3% in spring to -5.9% now.
Regarding the year 2010, the improved outlook for the second half of this year also implies a slightly higher positive overhang into next year. Combined with the improved outlook for the US, this induces a higher growth in the order of 1% compared to a forecast of 0.1% in spring.
Risks to the forecast are relatively balanced. On the one hand, private consumption could perform worse than anticipated, as unemployment is at record levels and nominal wages are falling. On the other hand, growth in China, in particular in 2010, could turn out even higher than forecast, implying a better Japanese export performance than currently anticipated. Furthermore, the technical assumption of this forecast, i.e. a stable nominal exchange-rate of the Yen could turn out to be relatively 'pessimistic' for exports.
The outlook both for 2010 and 2011, however, is particularly uncertain, given the first clear election victory by an opposition party against the LDP since the LDP's foundation in 1955 on 30 August 2009. In its election manifesto, the victorious Democratic Party of Japan (DPJ) has inter alia announced higher spending on child allowances and education to be financed by the elimination of waste and the ending of "unnecessary and non-urgent projects", e.g. in infrastructure. In line with this announcement, the new government, which

Other non-EU Countries, Japan
Table II.32.1:Main features of country forecast - JAPAN
2008 Annual percentage changebn YEN Curr. prices % GDP 92-05 2006 2007 2008 2009 2010 2011
GDP 507569.4 100.0 1.1 2.0 2.3 -0.7 -5.9 1.1 0.4 Private consumption 293433.6 57.8 1.2 1.5 0.7 0.6 -1.2 0.9 1.0 Public consumption 94076.3 18.5 2.7 0.4 1.9 0.8 0.8 0.7 0.9 Gross fixed capital formation 117168.2 23.1 -0.7 0.5 0.8 -5.0 -12.3 0.2 -0.3 of which : equipment - - - - - - - - - Exports (goods and services) 88473.8 17.4 5.0 9.7 8.4 1.8 -26.6 7.9 3.1 Imports (goods and services) 87758.5 17.3 4.1 4.2 1.5 0.9 -16.7 2.9 7.6 GNI (GDP deflator) 524316.7 103.3 1.2 2.5 2.8 -0.7 -6.9 1.0 0.3 Contribution to GDP growth : Domestic demand 0.9 1.0 0.9 -0.7 -3.2 0.7 0.7
Stockbuilding 0.0 0.2 0.3 -0.2 -0.3 -0.3 0.0Foreign balance 0.2 0.8 1.1 0.2 -2.4 0.7 -0.4
Employment -0.2 0.4 0.4 -0.4 -3.0 -1.2 -0.2 Unemployment rate (a) 4.0 4.1 3.9 4.0 5.8 6.3 7.0 Compensation of employees/head 0.1 0.4 -0.4 0.5 -0.8 0.5 0.9 Unit labour costs whole economy -1.1 -1.2 -2.3 0.8 2.2 -1.8 0.3 Real unit labour costs -0.6 -0.3 -1.7 1.7 1.5 -0.8 0.8 Savings rate of households (b) - - 10.4 10.1 11.1 10.5 9.3 GDP deflator -0.6 -0.9 -0.7 -0.9 0.7 -1.0 -0.5 General index of consumer prices - 0.3 0.0 1.4 -1.2 -0.4 0.3 Terms of trade of goods -1.1 -8.0 -4.4 -11.0 14.8 -2.0 -1.8 Trade balance (c) 2.6 1.9 2.4 0.8 0.6 0.9 0.5 Current account balance (c) 2.7 3.9 4.8 3.2 1.8 2.0 1.0 Net lending(+) or borrowing(-) vis-à-vis ROW (c) 2.6 3.8 4.7 3.1 1.7 1.9 0.9 General government balance (c) -5.5 -1.6 -2.5 -3.8 -8.0 -8.9 -9.1 Cyclically-adjusted budget balance (c) - - - - - - - Structural budget balance (c) - - - - - - - General government gross debt (c) 127.2 191.3 187.7 173.1 189.8 197.6 206.0 (a) as % of total labour force. (b) gross saving divided by gross disposable income. (c) as a percentage of GDP.
173
was formed after the election of Y. Hatoyama as Japan's new Prime Minister on 16 September, has stopped many projects contained in this fiscal year's supplementary budgets (FY 2009). Furthermore, on 29 September, the government has asked for fresh requests from ministries and agencies for the budget for the FY 2010 (starting on 1 April 2010) until 15 October to "redraft the state budget from scratch".
While the new government's insistence on changing Japan's growth model from business and export-orientation towards private demand ("put people's life first") is encouraging for consumption in coming quarters and welcome globally, it remains to be seen whether this policy orientation will be able to withstand the huge challenges the country is facing, especially the fast ageing and the demographic decline. Overall, given the information that we have at this stage, a dynamic rebound of the Japanese economy appears unlikely.
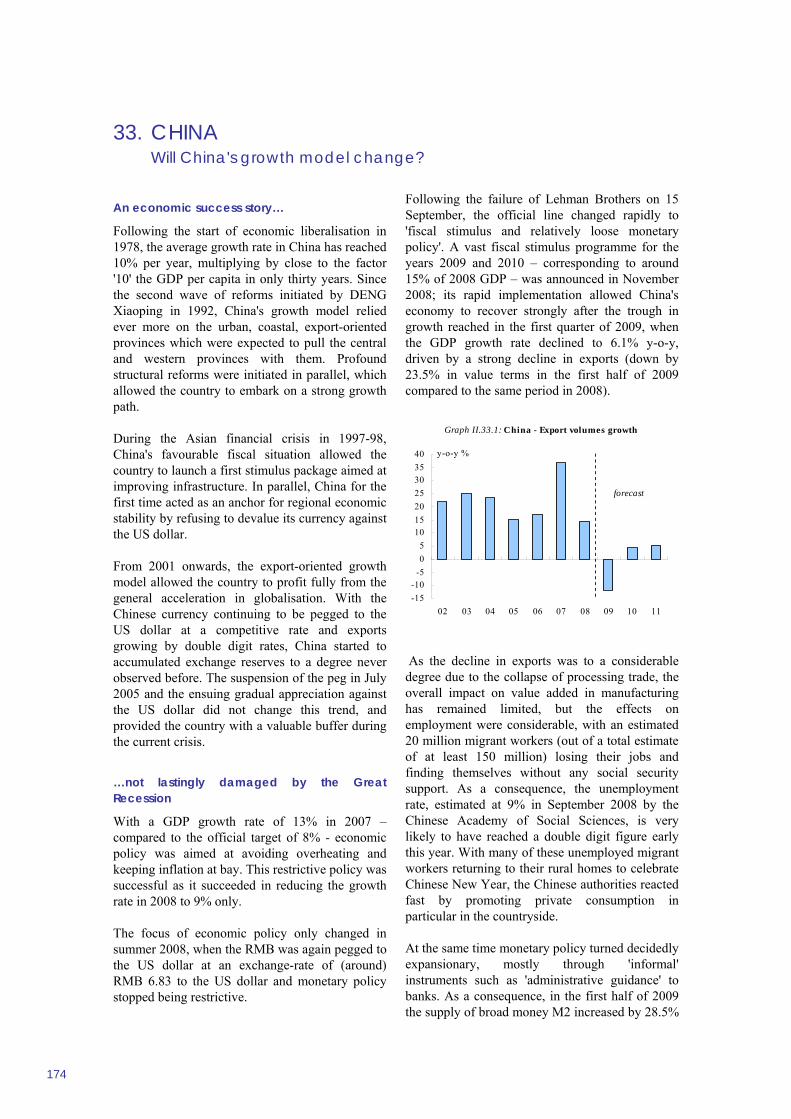
33. CHINA Will China's growth model change?
174
An economic success story…
Following the start of economic liberalisation in 1978, the average growth rate in China has reached 10% per year, multiplying by close to the factor '10' the GDP per capita in only thirty years. Since the second wave of reforms initiated by DENG Xiaoping in 1992, China's growth model relied ever more on the urban, coastal, export-oriented provinces which were expected to pull the central and western provinces with them. Profound structural reforms were initiated in parallel, which allowed the country to embark on a strong growth path.
During the Asian financial crisis in 1997-98, China's favourable fiscal situation allowed the country to launch a first stimulus package aimed at improving infrastructure. In parallel, China for the first time acted as an anchor for regional economic stability by refusing to devalue its currency against the US dollar.
From 2001 onwards, the export-oriented growth model allowed the country to profit fully from the general acceleration in globalisation. With the Chinese currency continuing to be pegged to the US dollar at a competitive rate and exports growing by double digit rates, China started to accumulated exchange reserves to a degree never observed before. The suspension of the peg in July 2005 and the ensuing gradual appreciation against the US dollar did not change this trend, and provided the country with a valuable buffer during the current crisis.
…not lastingly damaged by the Great Recession
With a GDP growth rate of 13% in 2007 – compared to the official target of 8% - economic policy was aimed at avoiding overheating and keeping inflation at bay. This restrictive policy was successful as it succeeded in reducing the growth rate in 2008 to 9% only.
The focus of economic policy only changed in summer 2008, when the RMB was again pegged to the US dollar at an exchange-rate of (around) RMB 6.83 to the US dollar and monetary policy stopped being restrictive.
Following the failure of Lehman Brothers on 15 September, the official line changed rapidly to 'fiscal stimulus and relatively loose monetary policy'. A vast fiscal stimulus programme for the years 2009 and 2010 – corresponding to around 15% of 2008 GDP – was announced in November 2008; its rapid implementation allowed China's economy to recover strongly after the trough in growth reached in the first quarter of 2009, when the GDP growth rate declined to 6.1% y-o-y, driven by a strong decline in exports (down by 23.5% in value terms in the first half of 2009 compared to the same period in 2008).
Graph II.33.1: China - Export volumes growth
-15-10
-505
10152025303540
02 03 04 05 06 07 08 09 10 11
y-o-y %
forecast
As the decline in exports was to a considerable degree due to the collapse of processing trade, the overall impact on value added in manufacturing has remained limited, but the effects on employment were considerable, with an estimated 20 million migrant workers (out of a total estimate of at least 150 million) losing their jobs and finding themselves without any social security support. As a consequence, the unemployment rate, estimated at 9% in September 2008 by the Chinese Academy of Social Sciences, is very likely to have reached a double digit figure early this year. With many of these unemployed migrant workers returning to their rural homes to celebrate Chinese New Year, the Chinese authorities reacted fast by promoting private consumption in particular in the countryside.
At the same time monetary policy turned decidedly expansionary, mostly through 'informal' instruments such as 'administrative guidance' to banks. As a consequence, in the first half of 2009 the supply of broad money M2 increased by 28.5%

Other non-EU Countries, China
175
on the year and new loans were up by RMB 7.4 trillion to RMB 37.7 billion. This monetary loosening combined with the fiscal stimulus programme led to a strong rise in fixed asset investments, which rose by more than 33% on the year in the first six months of 2009. Industrial production, which had 'only' risen by 5.1% in the first quarter accelerated to a growth rate of 9.1% in the second quarter (and 10.7% in June), confirming the early and strong recovery of the Chinese economy.
Graph II.33.2: China - Current account balance
050
100150200250300350400450500
02 03 04 05 06 07 08 09 10 11
bn US $
forecast
Favourable short-term outlook…
Not surprisingly under these circumstances, GDP growth accelerated to 8.9% on the year in the second quarter, already higher than the official 8% growth target. Given the strong rise in loans, an improving external environment and the statistical base effect (due to a very weak fourth quarter 2008), the annual growth rate is likely to accelerate further in the last quarter of this year, bringing the overall growth rate for 2009 to more than 8.5%.
Developments in 2010 are likely to remain favourable, as the fiscal stimulus will be maintained and the external environment is expected to improve further. The likely tightening of monetary policy and the announced reduction in overcapacities in some sectors like steel, however, should lead to slightly lower growth rates in the second half of 2010. With growth in the US forecast to accelerate again in 2011, the running out of the domestic stimulus package should be at least partly compensated for by a more favourable external environment, not least due to a clear recovery in processing trade. However, because of overall strong domestic demand, import growth should be higher than the growth rate of exports both in 2010 and 2011.
All in all, GDP growth in 2010 and 2011 is forecast to reach 9.6% and 9.5% respectively, still implying a relative underperformance compared to the average rate observed since 1978. However, demand by China should give a bottom to global prices of raw materials including petrol.
The growth rate of consumer prices, which is likely to be slightly negative in the current year, is expected to turn positive in 2010 and rise further in 2011.
Data on general government finance is not easily available, but on current trends is appears likely that the general government deficit will be only somewhat higher than the official target of 3% of GDP, in spite of the considerable volume of the fiscal stimulus package.
China's GDP valued at market exchange rates is likely to be the second highest in the world as early as next year and China's contribution to world growth will continue to be the single most important one, far ahead of any other country or region.
…but how about medium to long-term imbalances?
The focus of the stimulus package on infrastructure investment, welcome as it may be in the short term, not least to mitigate the impact of the slowdown on unemployment, has however contributed to increase the existing domestic imbalances of the Chinese economy. Even with real consumption likely to grow by more than 8% in the current year, the extremely high growth rate of fixed asset investment implies that the already low share of private consumption in overall GDP will decline further. In addition, the fiscal stimulus package has allowed some sectors like steel to maintain capacities, which might turn out to be idle if external demand does not return to the growth rates observed in the pre-crisis years.
While the Chinese authorities have announced their intention to cut down on potential overcapacities in these sectors, it remains unclear if and when they will implement this announcement. Furthermore, the expansionary monetary policy is likely to lead to a considerable misallocation of resources, which would not only fuel the growth of non-performing loans in the banking sector, but might even create new overcapacities.

European Economic Forecast, Autumn 2009
Table II.33.1:Main features of country forecast - CHINA
2008 Annual percentage changebn CNY Curr. prices % GDP 92-05 2006 2007 2008 2009 2010 2011
GDP 30067.0 100.0 10.2 11.7 13.0 9.7 8.7 9.6 9.5 Private consumption 10839.2 36.1 - - - - - - - Public consumption 4072.0 13.5 - - - - - - - Gross fixed capital formation (1) 111417.4 43.3 - - - - - - - of which : equipment - - - - - - - - - Change in stocks as % of GDP - - - - - - - - - Exports (goods and services) 14306.9 47.6 - 17.1 34.3 8.2 -11.4 4.5 5.1 Final demand - - - - - - - - - Imports (goods and services) 9559.5 31.8 - 16.4 11.7 6.5 -6.8 5.9 5.1 GNI (GDP deflator) - - - - - - - - - Contribution to GDP growth : Domestic demand - - - - - - -
Stockbuilding - - - - - - -Foreign balance - - - - - - -
Employment 1.1 0.8 0.8 0.6 Unemployment (a) 3.3 4.1 4.0 4.2 - - - Compensation of employees/head - - - - - - - Unit labour costs - - - - - - - Real unit labour costs - - - - - - - Savings rate of households - - - - - - - GDP deflator - 3.6 7.4 6.5 1.5 3.0 3.0 Private consumption deflator - - - - - - - Index of consumer prices (c) 5.6 1.5 4.8 5.9 Trade balance (b) 2.7 8.2 9.3 8.3 6.5 4.8 4.3 Current account balance (b) 2.1 9.5 11.0 9.8 7.3 6.1 5.6 Net lending(+) or borrowing(-) vis-à-vis ROW (b) - - - - - - - General government balance (b) -1.5 -0.8 0.6 - General government gross debt (b) - - - - - - - (a) urban unemployment, as % of labour force. (b) as a percentage of GDP. (c) national indicator. (1) 2007
176
One of the counterparts of this domestic imbalance is the external imbalance. While the huge current account surplus, 11% of GDP in 2007, is likely to continue to decline, as was already observed in 2008, it will remain sizeable in absolute terms (around USD 350 billion in both 2010 and 2011), the decline in terms of GDP being primarily due to the ongoing strong rise in China's nominal GDP figure.
Reducing both domestic and external imbalances appears to be the crucial challenge facing the Chinese economy in the medium to longer term. Under current policies, China risks to see its monetary policy having less and less traction, as speculative capital inflows are likely to rise again, obliging the central bank to intervene via the compulsory purchases of bonds by Chinese banks, which impacts negatively on bank profitability. The assumption of no-policy-change behind this forecast also assumes that the Chinese renminbi de facto remains pegged to the US dollar throughout the forecast horizon.

34. EFTA Different paths towards recovery
177
While all EFTA countries have been severely hit by the crisis in their path to recovery, challenges vary by country. Norway enjoys the relatively comfortable position related to its substantial oil-income, which allows a strong fiscal stimulus to reboot the economy. Switzerland is struggling with a banking sector under pressure following the eroding bank secrecy and feels the threat of deflation this year. The outlook for the forecast years, shows a return to moderate growth in Switzerland1, and Norway. Iceland faces a severe recession. Iceland's GDP is forecast to grow significant in 2010 and 2011 but much depends on the successful implementation of the IMF programme. Also, Iceland's application for EU membership on July this year may help raise confidence.
Growth depends largely on fiscal spending in Norway
Norway has been hit hard by the global economic downturn. The export sector has been severely affected, and domestic demand, mainly investment, has been contracting rapidly.
Domestic demand is shrinking through all its components, apart from government spending, and also external trade is contributing to the contraction. Real GDP for 2009 is forecast to contract by 2.2% to only return to slight growth by the end of 2010. This growth is expected to be mostly driven by domestic demand, particularly government spending. The challenge for Norway will be to keep growth momentum, even when the fiscal stimulus fades away.
The decline in investment in Norwegian mainland industries that started earlier this year is expected to continue into 2010. Afterwards investment in the mainland industries (offshore excluded) is expected to increase in 2011 however without reaching the record high 2008 level. Investments in petroleum are expected to fall somewhat from the first half of this year, but on an annual basis will increase slightly this year to remain stable in 2010.
The fiscal policy has been expansionary this year, with estimated growth in public consumption and investments of 5.2% and 12% respectively. The policy is expected to be far less expansive in 2010.
The stance of the fiscal policy in 2011 is expected to be relatively neutral.
Household consumption, responsible for around 55% of the GDP in mainland Norway, is likely to increase significantly in the second part of the forecast period. Low interest rates, increased incomes, increased wealth and better prospects all contributed to increased household consumption in the second quarter of 2009, after being in decline for a year. While for 2009 consumer spending is expected to decrease slightly, in 2010 and 2011 a rebound to growth is expected in house hold consumption.
Housing prices fell during the second half of 2008, but have subsequently increased since. However, no further increase is expected for the rest of 2009 though housing prices are expected to continue to increase in 2010 and 2011. The improvement in the housing market is expected to contribute to increased investments in housing, thus turning the decline of the past two years into an upswing next year.
Graph II.34.1: EFTA - GDP growth
-12-10
-8-6-4-202468
10
00 01 02 03 04 05 06 07 08 09 10 11
CH NO IS EU-27
forecast
y-o-y%
Whilst unemployment is the main challenge
The Norwegian government budget for 2010 top priority aims to secure jobs and Norway is among the countries in Europe with the lowest unemployment. However, unemployment in Norway is expected to be relatively high in the forecast years, from 4.8% of the total work force this year to 5.0% in 2010 and 2011.
The current slump in the Norwegian economy is partly responsible for the clear fall in wage growth. Wage growth will be slowing further in the

European Economic Forecast, Autumn 2009
178
forecast period. Consumer inflation is expected to fall, with an annual average in 2009 of 1.9%. A strong Norwegian Krona is expected to contribute to inflation falling below 1% next year.
Switzerland, exports are key
Switzerland's economy slipped into its worst recession in over three decades in mid-2008 as the global economic slump hit its exporters hard. The economy is expected to shrink by 2.4% this year, to stagnate in 2010, to finally rebound slightly only in 2011 with GDP growth of 0.6%.
In the first quarter of 2009 exports, key economic factor for Switzerland, declined by 14 % and imports were down by 11%. However, Switzerland's deep recession unexpectedly slightly eased in the second quarter driven by an increase in private and public spending, while a drop in imports outstripped the decline in export. The biggest challenge ahead for Switzerland might well be the drop in real growth in exports of goods and services. Export growth is expected to decelerate significantly in the forecast years with a serious downside risk to the service sector in relation to the eroding bank secrecy, which may have a serious impact on the contribution of the financial sector to GDP. Overall external trade should continue to provide a positive, and growing, net contribution in the forecast years.
With saving rates on the increase and consumer confidence being low household consumption is dropping in 2009 and 2010. However, in 2011 it is likely to return to growth. Growth in public investment is expected to be modest in the forecast years despite increased government spending on infrastructure. Weak export demand for Swiss machinery and equipment will cause little extra incentive for Swiss corporations to invest and government investments will not be sufficient to offset the sharp fall in investment of the private sector. The Swiss National Bank is likely to continue fighting the threat of deflation using all available means, including currency interventions. Inflation rates should stay close to zero in 2009, 2010 and 2011.
Worsening labour market
The unemployment rate is expected to continue to rise significantly, and for 2010 and 2011 unemployment is expected to breach the 5% level, these levels have not been observed since 1997.
Wage growth is expected to diminish significantly in the same period, having a decreasing impact on inflation subsequently.
Graph II.34.2: EFTA - Unemployment
0
2
4
6
8
10
12
00 01 02 03 04 05 06 07 08 09 10 11
CH NO IC EU-27
forecast
% of labour force
Iceland’s road to recovery
After a period of high growth rates supported by large investment projects and strong domestic demand, which have generated significant imbalances, Iceland is now facing the consequences of the currency crash of 2008 and the ensuing economic crisis. For the economic recovery to take hold, the banking system needs to function again. During the early days of the crisis, the authorities nationalised the three biggest banks and created three new, holding all domestic deposits and claims from the old banks. Privatisation of these new banks, possibly with foreign banks participation, is likely to contribute to restoring a sound financial sector in Iceland.
Domestic demand declined sharply in 2008 and is forecast to further decrease significantly in the forecast years, due to high interest rates and collapsed private consumption. Incomes are under pressure and specifically pensioners are facing benefit cuts following the worsened position of the Icelandic pension fund. Unemployment is set to increase significantly in the forecast years, following the impact of the crisis, in all sectors and the banking sector in particular. Inflation peaked in 2008 and is expected to remain high in 2009 easing to around 2% by the end of 2011. The current account deficit, high in the previous years, is expected to decline significantly, following decreasing imports and is expected turn into a small surplus by the end of 2010 which may not be sustained in 2011.

Other non-EU Countries, EFTA
Table II.34.1:Main features of country forecast - EFTA
Iceland Norway Switzerland (Annual percentage change) 2009 2010 2011 2009 2010 2011 2009 2010 2011 GDP -9.8 1.9 2.9 -2.2 0.6 2.0 -2.4 -0.1 1.1 Private consumption -16.5 1.6 2.6 -0.5 1.3 1.5 -0.9 -0.9 1.5 Public consumption -0.7 2.8 3.8 5.2 4.3 3.5 2.9 0.6 2.4 Gross fixed capital formation -36.4 5.0 6.0 -5.7 -3.2 0.1 -5.7 -1.4 -0.4 of which : equipment -39.0 5.6 6.6 -5.5 -0.5 2.6 -5.9 -2.5 -1.5 Exports (goods and services) 1.4 1.9 2.9 -8.4 0.5 3.8 -9.3 0.8 2.2 Imports (goods and services) -15.5 3.7 4.7 -6.1 1.5 3.7 -7.7 -0.6 2.6 GNI (GDP deflator) 21.1 5.9 1.4 -1.8 0.8 2.2 -2.1 0.8 1.3 Contribution to GDP growth : Domestic demand -17.3 2.1 3.1 -0.4 0.8 1.4 -1.4 -0.7 1.0
Stockbuilding - - - - - - - - -Foreign balance 8.0 -0.2 -0.2 -2.3 -0.2 0.5 -1.8 0.7 0.1
Employment -2.0 -2.5 -0.1 -1.8 0.5 1.6 -0.8 -1.0 1.5 Unemployment rate (a) 8.7 10.4 9.4 4.8 5.0 5.0 3.9 5.2 5.2 Compensation of employees/head - - - 3.2 2.8 3.6 - - - Unit labour costs whole economy - - - 3.6 2.7 3.2 - - - Real unit labour costs - - - 11.8 -2.7 0.7 - - - Savings rate of households (b) -20.6 -46.9 -70.1 15.9 11.9 12.6 17.4 18.1 15.1 GDP deflator 25.1 2.8 9.5 -7.4 5.5 2.4 2.5 -0.2 0.4 Harmonised index of consumer prices 12.0 7.0 3.0 1.7 1.1 1.7 0.1 0.4 0.6 Terms of trade of goods 47.2 -12.2 6.9 -25.3 15.8 1.3 7.6 -1.4 -1.4 Trade balance (c) 14.2 10.2 11.2 7.5 11.1 12.0 3.9 4.9 4.9 Current account balance (c) -1.7 -2.3 -1.5 9.5 13.4 14.3 7.3 7.0 6.9 Net lending(+) or borrowing(-) vis-à-vis ROW (c) -2.2 -2.6 -1.8 9.5 13.4 14.3 7.1 6.8 6.7 General government balance (c) -21.2 -16.9 -14.1 7.9 10.4 11.8 -2.9 -3.6 -3.9 Cyclically-adjusted budget balance (c) - - - - - - - - - Structural budget balance (c) - - - - - - - - - General government gross debt (c) 53.3 65.4 70.1 54.3 50.6 45.2 42.8 44.9 46.7 (a) as % of total labour force. (b) gross saving divided by gross disposable income. (c) as a percentage of GDP.
179
Jobs wanted
Unemployment in Iceland increased within months from a low 1% to around 8.7% in May 2009. Unemployment in Iceland is now at a similar level on average as in the neighbouring countries. However, due to the fact that the increase is relatively recent in Iceland, long-term unemployment is still considerably lower than in the euro area or the EU as a whole. This should make it somewhat easier to reduce as the economic situation improves. For 2010 and 2011 however the unemployment is still expected to remain high, around the 10% level.
Capital restrictions
Capital controls were introduced early on in the crisis, within the framework of the IMF Stand-By Arrangement. Whilst being in place, they helped to prevent massive outflows and support the exchange rate. However, it is likely that these restrictions will be lifted during the forecast period, to re-introduce normal financial relations with foreign markets. This may impose further pressure on the exchange rate and further sliding of the currency and as such constitute a downside risk to this forecast.
EU Membership
The outcome of Iceland's bid for an EU membership is not part of this forecast, nevertheless it is likely that Iceland's application bid may have a positive effect, boost confidence levels and provide an upside risk to this forecast.
Challenges
Iceland will be facing challenges generated by the current credit crisis and possible further krona depreciation, as well as the mounting unemployment, entailing significant downside risks to this forecast.

35. RUSSIAN FEDERATION Unexpectedly deep recession, tentative recovery
180
Russia in 2008 saw its 10th straight year of strong growth, with GDP growing at 5.6% in that year and bringing the 1999-2008 average to 6.9%. However, amidst the global crisis, in 2009 the country was hit by an unexpectedly deep recession. After a double-digit GDP fall in the first half of 2009 (the economy contracted by 9.8% in the first quarter, and by a surprising 10.9% in the second quarter) growth in 2009 is expected to be -7.2%, while a relatively mild recovery is foreseen for 2010 (2.3%), gaining some speed in 2011 (2.7%). The main reason behind this expected recovery is positive net exports, linked to a recovery in commodity prices.
This contraction was the result of the twin shocks that hit the Russian economy and the interaction between these: firstly the financial shock caused by the sudden stop in access to international capital flows (affecting a domestic banking system that was financing double-digit credit growth with external resources); and secondly the real shock linked to the sudden and sharp fall in commodity prices that form the bulk of Russia’s exports. On the demand side, the profile in 2009 is driven by steep falls in the main domestic demand components: investment fell by around 19% until July, and retail sales (a proxy for consumption) by over 8% in the same period (on the other hand, the contribution of net exports to GDP became positive for the first time since 2006).
-10
-5
0
5
10
15
00 01 02 03 04 05 06 07 08 09 10 11
y-o-y%
Graph II.35.1: Russia - GDP
forecast
This GDP fall should be accompanied by a reduction of the current account and trade surpluses and by a swing from large fiscal surpluses to significant fiscal deficits. The budget is expected to swing sharply from a hefty surplus
to large deficits, of around 6% of GDP in 2009, falling to around 2% in 2010 and 2011, due to the reduction in commodity prices and in economic activity, plus the fiscal stimulus package. In the case of Russia, it is important to keep in mind that, at least for 2009 and 2010, these fiscal deficits will be financed by the Oil Stabilisation Fund. Russia is also forecast to see a large fall in its trade and current account surpluses in 2009, with slight increases in 2010 and 2011. Respectively, the trade surplus shall be 3.6%, 5.3% and 6.4%, while the current account surplus is expected to reach 1.7% in 2009, growing to around 3% and 4% of GDP. Unemployment is also foreseen to reach around 8%, falling slowly towards 7%, while inflation is expected to slow from 10.5% in 2009 to below 8% by 2011.
Financial and real sector developments
Signs of recovery in financial variables appeared in March 2009 (when oil prices started to increase again), while indications of improvement in real variables only occurred by the summer of 2009.
Russia’s main stock markets indexes (the MICEX and the RTS) fell by 33% and 47% respectively since mid-2008, but had stabilised in levels already by November 2008 (after foreign investors withdrew speculative short-run liquidity from the Russian markets). These indexes increased by around 52% and 78% respectively between the end of the first quarter and early October 2009.
A similar pattern is to be found in exchange rate developments. The Central Bank of Russia (CBR) aim is to stabilise a nominal euro-dollar currency basket (set at 45 cents of the EUR and 55 cents of the USD). Faced with the 2008 terms of trade shock, the CBR chose for greater flexibility, announcing in January 2009 a 26-41 rouble “band” to the basket in which the currency has be allowed to float mostly freely. While the rouble lost around 22% against the basket since mid-2008, the exchange rate has not only stabilised since the introduction of the band, but appreciated by over 8% up to early October 2009 (with the CBR even having to recently intervene to counteract what it perceived as excessive appreciation).
Russian hard currency reserves fell from a peak of almost USD 600 billion at the summer of 2008 to

Other non-EU Countries, Russian Federation
181
around USD 413 billion by late September 2009 (still the third largest reserves worldwide). This is a fall of around 31%, but this hides the fact that reserves have stabilised roughly at the current level since late January 2009. Additionally, at least part of the loss in reserves was potentially justified as a tool to enable a staged and orderly de-leveraging of foreign currency debt by Russian companies and banks, faced with the “sudden stop” of capital flows in late 2008. The Russian banking system was financing double-digit growth rates of credit (over and above the double-digit growth rates of domestic deposits) via external financing. Since the significant and abrupt worsening of international capital markets in the fall of 2008, the net external liabilities of the Russian banking system fell from USD 130 billion in mid-2008 to USD 26 billion by June 2009. This huge adjustment was only possible without widespread bank failures due to the massive transfer of hard currency reserves from the CBR to the banking system. Also, data up to July 2009 indicates a limited nominal increase in deposits.
Finally, another sign of stabilisation lies in interest rates. After massive liquidity provisions by the CBR, the overnight “Mosprime” rate declined from 25% to 6.2% by early October 2009. Parallel to that and to the fall in inflation, the CBR reduced its own overnight rates (which had been hiked in late 2008, as part of its initial strategy to defend the peg) six times up to late September 2009.
Indications of stabilisation in real variables are both more recent and more tentative. The “Basic Sectors” monthly index, a composite indicator that proxies for GDP, started showing month-on-month positive growth only in June (following the pattern of industrial production). This brief positive trend was interrupted in August 2009, which might merely reflect a base effect (as August 2008 was the peak of the previous positive manufacturing cycle). On the other hand, the Russian PMI finally went above the 50-mark for the first time in fourteen months in September 2009 (signalling a return to expansion). Russia is the third most important trading partner of the EU (and its second export market after the US). Its nominal USD exports fell by an estimated 45% y-o-y up to September 2009 (although the speed of the fall seems to be slowing, reflecting the relative recovery in oil prices, from –48% in January 2009 to around -40% by September). Imports, on the other hand, fell by somewhat less, by –40%, during the same period, but the speed of decline
seems to have increased as 2009 progressed (from –33% in January 2009 to over -40%). This may reflect some limited lagged expenditure-switching effects arising from the earlier rouble devaluation. As a result, the trade surplus until September 2009 was down by –52% compared to September 2008, but improving from the –60% in January to around –40% by September.
Policy reactions
Similarly to other countries, Russia enacted an extensive set of policy measures, from the provision of liquidity to direct support to the banking sector, discretionary fiscal stimulus and a more flexible exchange rate. Some of these were discontinued as the economic situation stabilised (notably, the auctioning of fiscal funds by the Ministry of Finance to banks and the provision of uncollateralised short term funds by the CBR).(90) The additional fiscal impulse for 2009-10 is estimated at around 6% of the 2008 GDP.
Policy issues and overall prospects till 2011
Russia has been significantly affected by the global downturn, although some initial, early signs of stabilisation may be appearing. Arguably for Russia the main channel of transmission was the real one, while the financial channel also had large effects. The real channel originates in the fall of commodity prices, which, beyond trade, has direct investment, consumption and budgetary consequences. The unexpected depth and duration of the downturn, given Russia’s strong initial position, is due to the specific way in which those shocks interacted in the country. Briefly, the forecast is of a subdued recovery from the depths of a profound 2009 recession. Inflation should fall below double-digit levels only slowly. The budget is expected to post significant deficit throughout the forecast horizon. Trade and current account surpluses are expected to decline. Unemployment will only progressively be reduced.
Russian policies used to counteract the downturn are very similar to the ones pursued in more mature economies: measures to support and re-capitalise financial markets and institutions,
(90) Also similarly to other regions, there is a significant
difference between the announced amounts of the stimulus and the totals actually committed. For instance, in terms of capital injections in the banking sector, the values committed are around 40% of the ones announced, while for the purchase of assets and lending by the Ministry of Finance, this is even lower, at around 31%.

European Economic Forecast, Autumn 2009
Table II.35.1:Main features of country forecast - RUSSIA
2008 Annual percentage changebn RUB Curr. prices % GDP 92-05 2006 2007 2008 2009 2010 2011
GDP 41173.4 100.0 - 7.7 8.1 5.6 -7.2 2.3 2.7 Private consumption 19634.4 47.7 - 11.2 13.6 11.2 -6.0 2.5 3.0 Public consumption 6975.7 16.9 - 2.4 3.4 2.5 0.9 1.5 1.0 Gross fixed capital formation 9408.7 22.9 - 18.0 21.1 10.0 -21.0 1.8 3.9 of which : equipment 3388.5 8.2 - - - - -20.0 2.0 4.0 Exports (goods and services) 13067.5 31.7 - 7.3 6.3 0.5 -11.6 3.0 2.5 Imports (goods and services) 9156.0 22.2 - 21.3 26.5 15.0 -20.0 2.0 3.0 GNI (GDP deflator) 39952.2 97.0 - 7.2 8.8 5.0 -5.4 2.2 2.7 Contribution to GDP growth : Domestic demand - 9.2 11.1 8.0 -7.5 2.0 2.6
Stockbuilding - - - - - - -Foreign balance - -2.0 -3.4 -3.1 0.8 0.3 0.1
Employment - 0.6 0.8 -0.5 -1.3 0.6 0.0 Unemployment rate (a) - 6.7 5.6 5.6 7.2 6.8 6.5 Compensation of employees/head - - - - - - - Unit labour costs whole economy - - - - - - - Real unit labour costs - - - - - - - Savings rate of households (b) - - - - - - - GDP deflator - 15.5 13.9 19.2 1.0 9.7 9.3 General index of consumer prices - 9.7 9.0 14.1 10.5 9.0 7.8 Terms of trade of goods - - - - - - - Trade balance (c) - 14.1 10.1 10.7 5.0 6.4 7.3 Current account balance (c) - 9.6 5.9 6.1 1.7 3.2 4.3 Net lending(+) or borrowing(-) vis-à-vis ROW (c) - 9.6 5.2 6.1 - - - General government balance (c) - - - - -6.5 -2.6 -2.7 Cyclically-adjusted budget balance (c) - - - - - - - Structural budget balance (c) - - - - - - - General government gross debt (c) - - - - 7.7 10.4 10.9 (a) as % of total labour force. (b) gross saving divided by gross disposable income. (c) as a percentage of GDP.
182
enabling credit markets to continue to work, plus fiscal support packages for the wider economy. Additionally, Russia, a country with a pegged exchange rate, allowed more flexibility in the rouble as part of its policy tools. As the economic situation stabilizes, some tools are already being withdrawn or scaled back.
Certain longer-term policy issues could also be drawn from the current downturn. A first one is that a greater integration into the World economy, via trade and capital flows (the large capital outflow from Russia, for instance, was only possible because of its liberalised capital account, while its most exposed banks were those that were privately-owned, either domestically or foreign) might also imply some costs. However, such recognition of some possible costs associated with “Globalisation” does not imply a support for protectionism. The relevant policy question to be potentially explored would be to design mechanisms that could dampen the transmission mechanisms of negative shocks arising from the changes brought about by greater global economic integration.
A second point is that, as the financial component of the shock arguably led (or at least preceded) the real one, supervisory and regulatory financial frameworks reforms are central in this respect.
Given the observed spillovers and the integration of the global financial system (which, again, ought to ultimately be preserved), such reforms should have a global and coordinated character. The G-20 process, in which both the EU and Russia are already intensely involved, is the best example of those global coordinated policy responses.
A third element is that albeit macroeconomic stabilisation factors (sound fiscal positions, robust fiscal rules, large hard currency reserves, a more flexible exchange rate) did not insulate Russia from the crisis, they enabled it to implement policies that cushioned the shock. This could be interpreted as reinforcing the importance of the (largely pre-existing) robust and consistent macroeconomic policy frameworks.
A fourth aspect is that the growth models that relied more on primary sectors have seemingly showed themselves to be more affected by the downturn. Efforts for a diversification of growth sources towards a less commodities-biased economic structure could be intensified in the future. This, incidentally, is something that is explicitly indicated in Russia’s own long-term development strategy, the so-called “Russia 2020”.

ACKNOWLEDGEMENTS
183
This report was prepared in the Directorate-General for Economic and Financial Affairs under the direction of Marco Buti, Director-General, and István Székely, Director of the "Economic studies and research". Executive responsibilities were attached to Annika Melander, Head of Unit for "Forecasts and economic situation", and the forecast coordinator Michael Stierle. The Overview was prepared by Annika Melander under the direction of István Székely, Director of the "Economic studies and research". Chapter 1 on "The EU economy: The road ahead" was prepared by Moisés Orellana Peña under the responsibility of István Székely, Director of the "Economic studies and research" and Annika Melander, Head of Unit for "Forecasts and economic situation". This chapter benefited from contributions by Narcissa Balta, Reuben Borg, Chris Bosma, Christian Gayer, Peter Grasmann, Jan In 't Veld, Per Iversen, Lauri Kajanoja, Guy Lejeune, Kieran Mc Morrow, Michał Narożny, Loretta O'Sullivan, Dario Paternoster, Valérie Rouxel-Laxton, Eric Ruscher, Michael Stierle and Guntram Wolff. Chapter 2 on "Recent labour market developments and prospects" was prepared by Alfonso Arpaia and Nicola Curci under the responsibility of Gert-Jan Koopman, Director of the "Economic service and structural reforms" and Giuseppe Carone Head of Unit for "Labour market reforms". Chapter 3 on "Government debt: Past and future challenges" was prepared by Christine Frayne and Lucia Piana under the responsibility of Servaas Deroose, Director of the "Macroeconomy of the euro area and the EU", and Lucio Pench, Head of Unit for "Fiscal policy in the euro area and EU". This chapter benefited from contributions by Kamil Dybczak and Veli Laine. The sections on "Member States" were prepared under the supervision of Elena Flores Gual and Jürgen Kröger, Directors for the "Economies of the Member States". These sections benefited from contributions by Jean-Luc Annaert, Paolo Battaglia, Josef Baumgartner, Piotr Bogumil, Mateo Capo Servera, Pedro Cardoso, Samuel de Lemos Peixoto, Adriaan Dierx, Christophe Doin, Ivan Ebejer, Pierre Ecochard, Gatis Eglitis, Polyvios Eliofotou, Carsten Eppendorfer, Balazs Forgo, Malgorzata Galar, Agne Geniusaite, Oskar Grevesmuhl, Dalia Grigonyte, Zoltan Gyenes, Renata Hruzova, Javier Jareno Morago, Julda Kielyte, Mitja Košmrl, Bozhil Kostov, Bettina Kromen, Robert Kuenzel, Baudouin Lamine, Karolina Leib, Pim Lescrauwaet, Mart Maivali, Janis Malzubris, Maarten Masselink, George Moschovis, Per Wagner Nielsen, Manuel Palazuelos Martinez, Carmine Pappalardo, Balazs Parkanyi, Stefaan Pauwels, Elena Pavlova, Julien Rousselon, Aleksander Rutkowski, Karl Scerri, Vladimir Solanic, Harald Stieber, Ingrid Toming, Mariana Tomova, Jonathan Van Der Heijden, Corina Weidinger Sosdean and Norbert Wunner. The sections on "Candidate Countries" and "Other non-EU countries" were prepared under the supervision of Antonio de Lecea, Director of the "International economic and financial affairs". These sections, and forecasts for all other non-EU economies, benefited from contributions by Nicolaas Beinema, Bernhard Boehm, Isabel Colina, Hans B. Feddersen, Oscar Gomez Lacalle, Ulrich Jochheim, Willem Kooi, Mihai Macovei, Marga Peeters, Uwe Stamm, Dirk Verbeken and Lucio Vinhas de Souza. Editorial support by Sophie Bland and Chris Maxwell is gratefully acknowledged. Statistical and layout assistance was provided Yves Bouquiaux, Eulalia Claros Gimeno, Andrzej Erdmann, Anita Janicka, Johann Korner, Fabrizio Melcarne, Christiaan Muller, Alberto Noriega Guerra, Daniela Porubská, Mariola Przygoda, Vito Ernesto Reitano, Adriana Reut, Emilio Rodriguez Castro,

184
Etienne Sail, Antonio Sanchez Pareja, Ewa Sdrakas, Andrea Sipos, Jacek Szelozynski, Tamas Gabor Szin, Rajko Vodovnik, Carmela Zammit and Christos Zavos. Valuable comments and suggestions by Orlando Abreu, Laura Bardone, Moreno Bertoldi, Georg Busch, Servaas Deroose, Reinhard Felke, Carole Garnier, Gabriele Giudice, Martin Hallet, Fabienne Ilzkovitz, Heinz Jansen, Lauri Kajanoja, Barbara Kauffmann, Jürgen Kröger, Mary McCarthy, Carlos Martinez Mongay, Laurent Moulin, Loretta O'Sullivan, Andreas Papadopoulos, Christophe Pavret de la Rochefordière, Moisés Orellana Peña, Lucia Piana, Karl Pichelmann, Elena Reitano, Stephanie Riso, Valérie Rouxel-Laxton, Loukas Stemitsiotis, Michael Stierle, Heliodoro Temprano, Paul Van Den Noord, Charlotte Van Hooydonk, Peter Weiss, Ralph Wilkinson and Javier Yaniz Igal are gratefully acknowledged. Secretarial support for the finalisation of this report was provided by Solange Baute and Maria Davi-Pilato. Comments on the report would be gratefully received and should be sent to: Directorate-General for Economic and Financial Affairs Unit A4: Forecast and Economic Situation European Commission B-1049 Brussels E-mail: [email protected]

Statistical Annex

Contents
186
Output : GDP and its components 1. Gross Domestic Product 188 2. Profiles (qoq) of quarterly GDP 188 3. Profiles (yoy) of quarterly GDP 189 4. GDP per capita 189 5. Final domestic demand 190 6. Final demand 190 7. Private consumption expenditure 191 8. Government consumption expenditure 191 9. Total investment 192 10. Investment in construction 192 11. Investment in equipment 193 12. Public investment 193 13. Potential output gap 194
Prices 14. Deflator of GDP 194 15. Deflator of private consumption 195 16. Consumer prices index 195 17. Consumer prices quarterly profiles 196 18. Deflator of exports of goods 196 19. Deflator of imports of goods 197 20. Terms of trade of goods 197
Wages, population and labour market 21. Total population 198 22. Total employment 198 23. Number of unemployed 199 24. Compensation of employees per head 199 25. Real compensation of employees per head 200 26. Labour productivity 200 27. Unit labour costs, whole economy 201 28. Real unit labour costs 201
Interest and exchange rates 29. Nominal bilateral exchange rates 202 30. Nominal effective exchange rates 202 31. Relative unit labour costs 203 32. Real effective exchange rates 203 33. Short term interest rates 204 34. Long term interest rates 204

187
General Government 35. Total expenditure 205 36. Total revenue 205 37. Net lending(+) or net borrowing(-) 206 38. Interest expenditure 206 39. Primary balance 207 40. Cyclically adjusted net lending(+) or net borrowing(-) 207 41. Cyclically adjusted primary balance 208 42. Gross debt 208
Saving 43. Gross national saving 209 44. Gross saving of the private sector 209 45. Gross saving of general government 210
Trade and international payments 46. Exports of goods and services 210 47. Imports of goods and services 211 48. Merchandise trade balance (% of GDP) 211 49. Current account balance (% of GDP) 212 50. Net lending(+) or net borrowing(-) 212 51. Merchandise trade balance (billion Ecu/euro) 213 52. Current account balance (billion Ecu/euro) 213 53. Export markets (goods and services) 214 54. Export performance (goods and services) 214
World economy 55. World GDP 215 56. World exports of goods and services 216 57. Export shares (goods) in EU trade 216 58. World imports of goods and services 217 59. Import shares (goods) in EU trade 217 60. World merchandise trade balances (billion USD) 218 61. World current account balances (billion USD) 218 62. Primary commodity prices 218

188
STATISTICAL ANNEX : AUTUMN 2009 ECONOMIC FORECAST
TABLE 1 : Gross domestic product, volume (percentage change on preceding year, 1992-2011) 22.10.20095-year averages 2009 2010 2011
1992-96 1997-01 2002-06 2005 2006 2007 2008 IV-2009 X-2009 IV-2009 X-2009 IV-2009 X-2009 Belgium 1.5 2.7 2.0 1.8 2.8 2.9 1.0 -3.5 -2.9 -0.2 0.6 : 1.5 Germany 1.4 2.1 1.0 0.8 3.2 2.5 1.3 -5.4 -5.0 0.3 1.2 : 1.7 Ireland 5.9 9.1 5.4 6.2 5.4 6.0 -3.0 -9.0 -7.5 -2.6 -1.4 : 2.6 Greece 1.1 3.8 4.1 2.2 4.5 4.5 2.0 -0.9 -1.1 0.1 -0.3 : 0.7 Spain 1.5 4.4 3.3 3.6 4.0 3.6 0.9 -3.2 -3.7 -1.0 -0.8 : 1.0 France 1.2 3.0 1.7 1.9 2.2 2.3 0.4 -3.0 -2.2 -0.2 1.2 : 1.5 Italy 1.2 2.0 0.9 0.7 2.0 1.6 -1.0 -4.4 -4.7 0.1 0.7 : 1.4 Cyprus 5.5 4.2 3.3 3.9 4.1 4.4 3.7 0.3 -0.7 0.7 0.1 : 1.3 Luxembourg 2.6 6.3 4.2 5.4 5.6 6.5 0.0 -3.0 -3.6 0.1 1.1 : 1.8 Malta 5.0 3.4 2.1 4.1 3.8 3.7 2.1 -0.9 -2.2 0.2 0.7 : 1.6 Netherlands 2.5 3.7 1.6 2.0 3.4 3.6 2.0 -3.5 -4.5 -0.4 0.3 : 1.6 Austria 1.8 2.6 2.2 2.5 3.5 3.5 2.0 -4.0 -3.7 -0.1 1.1 : 1.5 Portugal 2.0 3.8 0.7 0.9 1.4 1.9 0.0 -3.7 -2.9 -0.8 0.3 : 1.0 Slovenia 2.0 4.2 4.3 4.5 5.8 6.8 3.5 -3.4 -7.4 0.7 1.3 : 2.0 Slovakia : 2.7 5.9 6.5 8.5 10.4 6.4 -2.6 -5.8 0.7 1.9 : 2.6 Finland 1.3 4.6 2.9 2.8 4.9 4.2 1.0 -4.7 -6.9 0.2 0.9 : 1.6 Euro area 1.5 2.8 1.7 1.7 3.0 2.8 0.6 -4.0 -4.0 -0.1 0.7 : 1.5 Bulgaria -2.8 2.0 6.0 6.2 6.3 6.2 6.0 -1.6 -5.9 -0.1 -1.1 : 3.1 Czech Republic 2.3 1.2 4.6 6.3 6.8 6.1 2.5 -2.7 -4.8 0.3 0.8 : 2.3 Denmark 2.6 2.4 1.8 2.4 3.3 1.6 -1.2 -3.3 -4.5 0.3 1.5 : 1.8 Estonia : 6.5 8.4 9.4 10.0 7.2 -3.6 -10.3 -13.7 -0.8 -0.1 : 4.2 Latvia -8.8 6.3 9.0 10.6 12.2 10.0 -4.6 -13.1 -18.0 -3.2 -4.0 : 2.0 Lithuania -8.3 4.7 8.0 7.8 7.8 9.8 2.8 -11.0 -18.1 -4.7 -3.9 : 2.5 Hungary 0.6 4.6 4.2 3.5 4.0 1.0 0.6 -6.3 -6.5 -0.3 -0.5 : 3.1 Poland 4.9 4.4 4.1 3.6 6.2 6.8 5.0 -1.4 1.2 0.8 1.8 : 3.2 Romania 1.4 -0.9 6.2 4.2 7.9 6.3 6.2 -4.0 -8.0 0.0 0.5 : 2.6 Sweden 1.2 3.3 3.2 3.3 4.2 2.6 -0.2 -4.0 -4.6 0.8 1.4 : 2.1 United Kingdom 2.5 3.4 2.6 2.2 2.9 2.6 0.6 -3.8 -4.6 0.1 0.9 : 1.9 EU 1.4 2.9 2.0 2.0 3.2 2.9 0.8 -4.0 -4.1 -0.1 0.7 : 1.6 USA 3.3 3.8 2.7 3.1 2.7 2.1 0.4 -2.9 -2.5 0.9 2.2 : 2.0 Japan 1.3 0.5 1.7 1.9 2.0 2.3 -0.7 -5.3 -5.9 0.1 1.1 : 0.4
TABLE 2 : Profiles (qoq) of quarterly GDP, volume (percentage change from previous quarter, 2009-2011)
2009/1 2009/2 2009/3 2009/4 2010/1 2010/2 2010/3 2010/4 2011/1 2011/2 2011/3 2011/4 Belgium -1.7 -0.3 0.3 0.1 0.1 0.2 0.3 0.3 0.4 0.4 0.4 0.5 Germany -3.5 0.3 0.7 0.2 0.1 0.1 0.2 0.3 0.4 0.5 0.6 0.6 Ireland -2.3 0.0 : : : : : : : : : : Greece -1.2 0.2 : : : : : : : : : : Spain -1.6 -1.1 -0.4 -0.3 -0.2 -0.1 0.1 0.2 0.2 0.3 0.5 0.5 France -1.4 0.3 0.7 0.4 0.3 0.0 0.1 0.3 0.5 0.5 0.5 0.5 Italy -2.7 -0.5 0.8 0.1 0.1 0.1 0.2 0.3 0.4 0.4 0.4 0.4 Cyprus -0.6 -0.4 -0.2 -0.1 -0.1 0.3 0.4 0.4 0.3 0.4 0.4 0.5 Luxembourg -1.7 -0.3 : : : : : : : : : : Malta -1.2 -0.9 : : : : : : : : : : Netherlands -2.7 -1.1 -0.1 0.0 0.1 0.2 0.3 0.3 0.4 0.4 0.4 0.5 Austria -2.7 -0.5 0.3 0.4 0.5 0.2 0.2 0.3 0.3 0.5 0.6 0.6 Portugal -1.8 0.3 0.4 0.1 0.0 0.0 0.0 0.1 0.3 0.4 0.5 0.5 Slovenia -6.4 0.7 : : : : : : : : : : Slovakia -11.0 2.2 1.7 0.7 0.0 0.1 0.1 0.1 0.5 1.2 1.3 1.3 Finland -3.0 -2.6 0.3 0.5 0.3 0.4 0.4 0.4 0.4 0.3 0.4 0.4 Euro area -2.5 -0.2 0.5 0.2 0.1 0.1 0.2 0.3 0.4 0.5 0.5 0.5 Bulgaria -8.6 1.7 -0.4 -0.4 -0.5 -0.4 -0.4 0.0 0.6 1.5 1.9 2.6 Czech Republic -4.8 0.1 0.6 0.2 0.0 0.2 0.3 0.4 0.6 0.7 0.9 1.1 Denmark -1.3 -2.6 0.7 0.8 0.4 0.6 0.5 0.5 0.4 0.4 0.4 0.4 Estonia -6.0 -3.4 -1.1 0.1 0.2 0.7 0.8 0.9 1.1 1.2 1.3 1.4 Latvia -11.0 -0.8 -3.5 -3.0 -0.2 -0.1 0.5 0.7 0.4 0.4 0.6 0.8 Lithuania -10.4 -9.8 0.0 0.2 -1.3 -0.3 0.2 0.0 0.8 1.2 1.2 1.2 Hungary -2.6 -2.0 -0.6 -0.3 0.0 0.2 0.5 0.7 0.8 0.9 0.9 1.0 Poland 0.3 0.5 0.0 -0.2 0.5 0.6 0.8 0.9 0.8 0.7 0.9 0.8 Romania -4.6 -1.1 -1.0 -0.1 0.3 0.5 0.6 0.7 0.7 0.7 0.8 0.8 Sweden -0.9 0.2 0.2 0.2 0.3 0.4 0.5 0.5 0.5 0.5 0.6 0.7 United Kingdom -2.5 -0.6 -0.2 0.4 0.3 0.3 0.3 0.4 0.4 0.6 0.7 0.7 EU -2.4 -0.3 0.3 0.2 0.2 0.1 0.2 0.3 0.4 0.5 0.6 0.6 USA -1.6 -0.2 0.8 0.8 0.7 0.3 0.3 0.4 0.5 0.6 0.6 0.6 Japan -3.3 0.6 0.8 0.8 0.1 0.0 0.0 -0.1 0.3 0.0 0.1 0.3

189
TABLE 3 : Profiles (yoy) of quarterly GDP, volume (percentage change from corresponding quarter in previous year, 2009-2011) 22.10.2009
2009/1 2009/2 2009/3 2009/4 2010/1 2010/2 2010/3 2010/4 2011/1 2011/2 2011/3 2011/4 Belgium -3.1 -3.7 -3.4 -1.6 0.1 0.6 0.6 0.8 1.1 1.3 1.5 1.8 Germany -6.7 -5.9 -4.8 -2.3 1.4 1.2 0.7 0.8 1.1 1.6 2.0 2.3 Ireland -9.3 -7.3 : : : : : : : : : : Greece 0.3 -0.3 : : : : : : : : : : Spain -3.2 -4.2 -4.2 -3.3 -1.9 -1.0 -0.5 0.0 0.4 0.8 1.2 1.5 France -3.5 -2.8 -1.8 -0.1 1.7 1.4 0.8 0.7 0.9 1.4 1.8 2.0 Italy -6.0 -6.0 -4.4 -2.3 0.5 1.1 0.4 0.7 1.0 1.4 1.6 1.7 Cyprus 0.8 -0.7 -1.0 -1.3 -0.8 -0.1 0.5 1.0 1.4 1.5 1.4 1.5 Luxembourg -5.9 -5.3 : : : : : : : : : : Malta -1.7 -3.0 : : : : : : : : : : Netherlands -4.2 -5.2 -4.9 -3.8 -1.0 0.3 0.7 1.1 1.4 1.6 1.7 1.9 Austria -3.8 -4.5 -3.9 -2.6 0.6 1.3 1.3 1.2 0.9 1.3 1.7 2.0 Portugal -4.0 -3.7 -2.9 -1.1 0.7 0.5 0.1 0.1 0.4 0.7 1.3 1.7 Slovenia -8.9 -9.0 : : : : : : : : : : Slovakia -5.7 -5.4 -5.5 -6.8 4.7 2.5 0.8 0.2 0.7 1.9 3.2 4.5 Finland -6.5 -8.9 -7.6 -4.7 -1.4 1.7 1.8 1.7 1.7 1.6 1.6 1.6 Euro area -4.9 -4.8 -4.0 -2.1 0.5 0.8 0.5 0.7 1.0 1.4 1.7 1.9 Bulgaria -4.7 -4.5 -6.3 -7.8 0.4 -1.7 -1.7 -1.3 -0.2 1.7 4.0 6.7 Czech Republic -4.5 -5.5 -5.3 -3.9 0.9 1.0 0.6 0.8 1.4 2.0 2.6 3.3 Denmark -3.6 -7.0 -5.1 -2.4 -0.7 2.6 2.4 2.1 2.1 1.8 1.7 1.6 Estonia -14.2 -15.8 -14.3 -10.1 -4.3 -0.2 1.8 2.5 3.5 4.0 4.5 5.0 Latvia -18.6 -17.4 -18.8 -17.4 -7.3 -6.6 -2.7 1.1 1.6 2.1 2.1 2.2 Lithuania -12.5 -21.1 -20.3 -19.0 -10.8 -1.4 -1.2 -1.5 0.6 2.1 3.1 4.4 Hungary -5.6 -7.3 -6.9 -5.4 -2.9 -0.7 0.4 1.4 2.2 2.9 3.3 3.6 Poland 1.7 1.4 0.7 0.5 0.8 0.9 1.8 2.9 3.1 3.2 3.3 3.1 Romania -5.7 -8.3 -9.2 2.9 -1.3 -4.2 -6.5 -3.9 -1.5 -0.3 0.6 1.2 Sweden -6.5 -6.1 -5.4 -0.3 1.0 1.2 1.5 1.8 1.9 2.0 2.2 2.4 United Kingdom -5.0 -5.5 -5.0 -2.8 0.0 0.9 1.3 1.2 1.3 1.7 2.1 2.4 EU -4.8 -4.9 -4.2 -2.2 0.4 0.8 0.7 0.9 1.1 1.5 1.8 2.1 USA -3.3 -3.8 -2.4 -0.3 2.1 2.6 2.2 1.8 1.6 1.9 2.1 2.3 Japan -8.4 -7.2 -5.3 -1.2 2.2 1.6 0.8 0.0 0.2 0.2 0.3 0.7
TABLE 4 : Gross domestic product per capita (percentage change on preceding year, 1992-2011)5-year averages 2009 2010 2011
1992-96 1997-01 2002-06 2005 2006 2007 2008 IV-2009 X-2009 IV-2009 X-2009 IV-2009 X-2009 Belgium 1.2 2.5 1.5 1.2 2.1 2.2 1.0 -4.1 -3.6 -0.9 -0.1 : 0.8 Germany 0.9 1.9 1.0 0.8 3.3 2.6 1.4 -5.2 -4.9 0.4 1.3 : 1.8 Ireland 5.3 7.8 3.4 3.9 2.8 3.5 -4.9 -9.4 -8.0 -2.8 -1.6 : 2.5 Greece 0.2 3.4 3.8 1.9 4.1 4.1 1.6 -1.2 -1.5 -0.2 -0.7 : 0.3 Spain 1.3 3.7 1.7 1.9 2.4 1.7 -0.7 -4.4 -4.9 -1.8 -1.7 : 0.2 France 0.8 2.4 1.0 1.1 1.5 1.7 -0.1 -3.4 -2.6 -0.7 0.7 : 1.0 Italy 1.1 2.0 0.2 -0.1 1.5 0.8 -1.8 -4.9 -5.2 -0.3 0.2 : 1.0 Cyprus 3.3 3.0 1.3 1.5 2.1 2.9 2.7 -1.0 -1.7 -0.6 -0.8 : 0.4 Luxembourg 1.1 5.1 2.8 3.8 3.9 4.8 -1.7 -4.4 -4.9 -0.6 0.0 : 0.7 Malta 4.1 2.7 1.4 3.5 2.7 3.1 1.6 -1.4 -3.0 -0.3 -0.1 : 0.8 Netherlands 1.9 3.1 1.2 1.8 3.2 3.4 1.6 -3.7 -4.9 -0.7 -0.1 : 1.2 Austria 1.3 2.4 1.6 1.7 2.9 3.1 1.7 -4.3 -4.0 -0.4 0.8 : 1.2 Portugal 1.8 3.3 0.2 0.5 1.0 1.6 -0.2 -3.8 -3.1 -0.9 0.2 : 0.9 Slovenia 2.1 4.2 4.1 4.3 5.4 6.2 2.4 -1.9 -7.0 0.3 1.2 : 1.8 Slovakia : 2.7 5.9 6.5 8.4 10.3 6.1 -2.6 -5.9 0.6 1.8 : 1.4 Finland 0.8 4.4 2.6 2.4 4.5 3.8 0.6 -5.0 -7.3 -0.1 0.6 : 1.4 Euro area 1.2 2.5 1.1 1.1 2.4 2.2 0.1 -4.4 -4.4 -0.5 0.3 : 1.1 Bulgaria -2.2 3.1 6.5 6.8 6.6 6.2 6.0 -1.1 -5.4 0.4 -0.6 : 3.6 Czech Republic 2.3 1.4 4.5 6.0 6.5 5.6 1.4 -3.1 -5.5 0.0 0.5 : 2.0 Denmark 2.2 2.1 1.5 2.1 3.0 1.2 -1.8 -3.5 -4.7 0.0 1.3 : 1.6 Estonia : 7.4 8.8 9.7 10.2 7.4 -3.5 -10.2 -13.6 -0.7 -0.1 : 4.2 Latvia -7.4 7.2 9.6 11.2 12.8 10.6 -4.1 -12.7 -17.6 -2.7 -3.5 : 2.5 Lithuania -7.8 5.5 8.6 8.5 8.5 10.4 3.3 -10.4 -17.5 -4.2 -3.3 : 3.2 Hungary 0.7 4.8 4.4 3.7 4.1 1.1 0.8 -6.3 -6.4 -0.2 -0.4 : 3.1 Poland 4.7 4.4 4.2 3.7 6.3 6.8 5.0 -1.3 1.2 0.8 1.8 : 3.2 Romania 1.8 -0.7 7.0 4.4 8.1 6.5 6.5 -3.8 -7.8 0.2 0.7 : 2.8 Sweden 0.7 3.1 2.8 2.9 3.7 1.8 -0.9 -4.2 -5.0 0.7 1.2 : 2.1 United Kingdom 2.3 3.0 2.1 1.5 2.3 1.9 -0.1 -4.1 -5.2 -0.2 0.2 : 1.2 EU 1.1 2.7 1.6 1.5 2.8 2.4 0.3 -4.2 -4.5 -0.3 0.4 : 1.4 USA 2.1 2.6 1.8 2.1 1.7 1.1 -0.5 -3.8 -3.3 0.0 1.3 : 1.1 Japan 1.0 0.2 1.6 1.9 2.0 2.3 -0.8 -5.2 -5.8 0.2 1.2 : -0.5

190
TABLE 5 : Domestic demand, volume (percentage change on preceding year, 1992-2011) 22.10.20095-year averages 2009 2010 2011
1992-96 1997-01 2002-06 2005 2006 2007 2008 IV-2009 X-2009 IV-2009 X-2009 IV-2009 X-2009 Belgium 1.4 2.2 1.7 2.6 2.4 3.1 2.3 -1.9 -2.0 -0.2 0.1 : 1.6 Germany 1.5 1.5 0.1 0.0 2.2 1.0 1.7 -2.3 -1.8 -0.2 0.9 : 1.4 Ireland 4.2 8.2 5.4 8.6 6.1 6.0 -4.4 -11.9 -12.2 -4.8 -3.8 : 2.4 Greece 1.2 4.3 3.9 1.4 5.7 5.0 1.0 -1.0 -5.0 0.1 -1.7 : 0.5 Spain 0.8 5.0 4.4 5.1 5.2 4.2 -0.5 -4.9 -6.3 -1.6 -1.8 : 0.7 France 0.7 3.0 2.2 2.6 2.5 3.1 0.7 -1.9 -2.0 0.0 1.1 : 1.6 Italy 0.0 2.6 1.3 0.9 2.0 1.4 -1.3 -3.6 -3.4 0.2 0.8 : 1.4 Cyprus : 3.6 4.3 3.1 5.6 7.4 8.4 1.3 -2.7 1.3 -0.9 : 1.0 Luxembourg 1.6 5.9 2.7 5.2 2.2 4.2 3.2 -1.8 -4.8 0.6 1.1 : 2.0 Malta : 1.4 2.8 6.3 3.4 2.2 1.1 0.6 -3.9 1.2 1.0 : 1.5 Netherlands 2.1 3.9 1.2 1.4 4.1 2.3 2.7 -1.8 -3.8 -0.5 -0.9 : 0.5 Austria 2.0 1.6 1.5 1.9 2.3 1.7 1.1 -2.8 -0.9 0.3 0.8 : 1.2 Portugal 2.4 4.6 0.6 1.5 0.8 1.7 1.3 -3.8 -3.8 -1.5 0.1 : 0.8 Slovenia 5.2 4.2 4.1 2.3 5.6 8.6 3.5 -3.8 -9.5 0.5 0.2 : 1.7 Slovakia : 2.5 4.8 8.5 6.5 6.5 6.4 -0.6 -4.2 0.8 1.8 : 2.6 Finland -0.3 3.8 3.2 4.4 3.2 4.4 0.7 -2.1 -4.7 0.4 0.6 : 1.3 Euro area 1.1 2.7 1.7 1.9 2.9 2.4 0.6 -2.9 -3.2 -0.3 0.3 : 1.3 Bulgaria : 5.2 8.3 9.9 10.2 9.3 6.8 -3.5 -11.7 -0.4 -3.5 : 2.0 Czech Republic 6.2 1.2 3.6 1.7 5.4 5.2 1.2 -1.3 -4.6 0.2 0.6 : 2.2 Denmark 2.9 2.1 3.0 3.5 5.3 1.9 -0.7 -2.4 -5.9 0.7 1.5 : 1.6 Estonia : 6.0 10.8 9.4 15.5 9.9 -10.5 -11.8 -24.7 -1.5 -0.7 : 4.0 Latvia : 6.9 11.2 9.3 18.1 12.4 -10.5 -20.6 -26.9 -6.5 -8.9 : 0.9 Lithuania : 5.3 9.6 7.7 9.1 14.1 2.9 -17.0 -27.8 -6.6 -4.8 : 2.1 Hungary 0.6 4.9 3.9 1.0 1.7 -1.2 0.7 -6.5 -9.0 -0.6 -1.5 : 3.1 Poland 5.4 4.5 3.9 2.5 7.3 8.7 5.5 -1.6 -0.5 0.1 2.0 : 3.6 Romania 1.4 0.5 9.0 7.9 12.9 14.2 7.1 -5.6 -12.7 -0.3 1.3 : 3.6 Sweden 0.0 2.6 2.4 3.1 3.8 4.0 0.2 -4.6 -4.6 -0.1 1.0 : 1.6 United Kingdom 2.3 4.1 2.8 2.1 2.4 3.0 0.1 -4.7 -5.3 -0.2 0.4 : 1.5 EU 1.5 3.0 2.1 2.1 3.1 2.9 0.7 -3.3 -3.9 -0.3 0.4 : 1.5 USA 3.5 4.4 3.0 3.2 2.6 1.4 -0.8 -2.8 -3.4 1.0 2.3 : 1.8 Japan 1.5 0.3 1.0 1.7 1.2 1.2 -0.9 -4.4 -3.7 -0.3 0.4 : 0.8
TABLE 6 : Final demand, volume (percentage change on preceding year, 1992-2011)5-year averages 2009 2010 2011
1992-96 1997-01 2002-06 2005 2006 2007 2008 IV-2009 X-2009 IV-2009 X-2009 IV-2009 X-2009 Belgium 2.5 4.1 2.7 3.5 3.6 3.7 1.9 -7.1 -8.4 -0.6 0.7 : 2.1 Germany 1.7 3.2 2.3 2.3 5.7 3.2 2.2 -6.9 -6.3 -0.3 1.4 : 2.4 Ireland 8.3 12.5 5.1 6.9 5.6 7.2 -2.8 -10.4 -8.0 -2.5 -1.2 : 3.1 Greece 1.6 5.3 3.9 1.5 5.7 5.2 1.5 -2.2 -6.2 0.3 -0.9 : 0.9 Spain 2.3 5.8 4.3 4.6 5.5 4.6 -0.6 -5.9 -7.7 -1.3 -1.2 : 1.2 France 1.5 4.0 2.3 2.7 3.0 3.0 0.5 -3.8 -3.8 -0.1 1.4 : 1.9 Italy 1.3 2.9 1.3 0.9 2.9 2.1 -1.8 -6.3 -7.2 0.2 0.9 : 1.9 Cyprus : 4.5 3.3 3.6 5.0 7.3 6.0 -1.0 -6.6 0.9 -0.4 : 1.7 Luxembourg 3.0 8.9 5.9 4.7 9.8 7.5 2.0 -5.0 -8.5 -0.5 1.6 : 2.8 Malta : 2.7 2.9 3.6 6.6 2.4 -2.0 -3.0 -7.8 0.2 1.3 : 2.0 Netherlands 3.4 5.6 2.7 3.4 5.6 4.3 2.7 -5.8 -7.0 -0.4 0.3 : 2.1 Austria 2.3 3.8 3.1 3.8 4.1 4.6 1.0 -5.9 -5.8 0.3 1.2 : 2.0 Portugal 3.2 4.8 1.3 1.6 2.6 3.2 0.8 -5.6 -6.1 -1.2 0.2 : 1.3 Slovenia 2.7 5.4 6.0 5.4 8.4 10.7 3.2 -7.0 -13.1 0.2 1.0 : 2.5 Slovakia : 5.4 7.9 9.2 13.1 10.0 4.8 -4.9 -9.3 0.5 2.1 : 3.6 Finland 2.0 5.7 4.0 5.2 6.0 5.7 3.1 -7.2 -11.5 0.6 1.6 : 2.3 Euro area 2.0 4.1 2.6 2.8 4.5 3.6 0.8 -5.9 -6.5 -0.3 0.8 : 2.0 Bulgaria : 5.2 8.6 9.4 9.7 7.9 5.5 -6.0 -12.3 0.4 -1.7 : 2.8 Czech Republic 7.3 4.4 6.7 5.8 9.8 9.6 3.4 -5.9 -9.9 0.4 1.2 : 3.7 Denmark 3.0 3.7 3.5 5.0 6.6 2.0 0.4 -5.4 -7.5 0.4 1.7 : 2.5 Estonia : 8.6 10.6 13.1 14.9 5.7 -6.6 -12.7 -20.7 -0.7 0.2 : 4.7 Latvia : 6.6 10.7 12.1 14.9 11.8 -8.2 -18.5 -24.3 -4.5 -5.8 : 2.2 Lithuania : 5.8 10.4 11.0 10.1 10.2 5.9 -16.3 -25.3 -4.4 -2.7 : 2.8 Hungary : 9.1 7.1 5.6 9.6 7.6 3.3 -9.0 -10.8 0.1 0.8 : 4.4 Poland 6.4 5.5 5.6 3.9 9.3 8.8 5.9 -4.2 -3.5 0.1 2.2 : 4.2 Romania 0.9 2.6 9.6 7.8 12.3 12.8 9.6 -8.0 -11.9 -0.1 1.7 : 4.0 Sweden 2.3 4.3 3.8 4.4 5.7 4.7 0.8 -6.3 -8.2 0.3 1.3 : 3.5 United Kingdom 3.3 4.4 3.3 3.2 4.2 1.8 0.3 -5.9 -6.6 -0.3 0.7 : 2.1 EU 2.2 4.2 3.0 3.1 4.9 3.7 1.0 -6.0 -6.8 -0.3 0.8 : 2.2 USA 3.9 4.4 3.2 3.5 3.2 2.1 -0.1 -4.1 -4.2 0.9 2.8 : 2.5 Japan 1.7 0.5 1.9 2.3 2.3 2.2 -0.5 -6.4 -7.0 -0.1 1.3 : 1.0

191
TABLE 7 : Private consumption expenditure, volume (percentage change on preceding year, 1992-2011) 22.10.20095-year averages 2009 2010 2011
1992-96 1997-01 2002-06 2005 2006 2007 2008 IV-2009 X-2009 IV-2009 X-2009 IV-2009 X-2009 Belgium 1.5 2.1 1.1 1.0 1.8 1.7 1.1 -0.7 -1.0 -0.4 0.6 : 1.4 Germany 1.9 1.9 0.2 0.3 1.3 -0.3 0.4 -0.5 0.6 -0.7 -0.2 : 0.8 Ireland 4.1 7.8 4.6 6.6 6.5 9.3 -0.7 -7.9 -7.7 -4.0 -2.4 : 1.8 Greece 1.8 3.1 4.3 4.6 5.3 3.3 2.3 0.4 -2.5 0.5 -1.3 : 0.8 Spain 1.1 4.3 3.6 4.2 3.8 3.6 -0.6 -3.1 -5.2 -1.1 -0.5 : 0.9 France 1.0 2.8 2.4 2.6 2.4 2.5 1.0 0.2 0.8 0.3 0.8 : 0.8 Italy 0.5 2.5 0.9 1.2 1.3 1.2 -0.9 -1.7 -1.5 0.2 0.8 : 1.3 Cyprus : 4.4 3.6 4.0 4.5 8.2 7.0 1.0 -1.4 1.2 0.3 : 0.6 Luxembourg 1.7 4.3 1.5 2.6 2.7 2.8 3.9 1.2 0.2 1.5 0.8 : 1.5 Malta : 3.6 1.5 2.2 0.6 2.0 5.8 0.8 -1.1 0.7 0.4 : 1.1 Netherlands 2.1 3.9 0.5 1.0 -0.3 1.7 1.3 -0.2 -2.7 -0.5 -0.6 : 0.6 Austria 1.9 1.6 1.7 2.1 1.8 0.8 0.8 0.1 0.5 0.4 0.5 : 0.6 Portugal 2.0 3.8 1.5 2.0 1.9 1.6 1.7 -1.3 -0.9 -0.4 0.6 : 0.7 Slovenia 5.1 3.2 2.8 2.6 2.9 6.7 2.0 -0.4 -1.7 0.6 -0.2 : 1.6 Slovakia : 3.7 4.8 6.5 5.8 7.0 6.1 0.5 -1.2 0.9 0.5 : 2.2 Finland 0.5 3.2 3.5 3.3 4.1 3.3 1.9 -1.4 -2.8 0.9 1.0 : 1.4 Euro area 1.4 2.7 1.5 1.8 2.0 1.7 0.4 -0.9 -1.0 -0.3 0.2 : 1.0 Bulgaria -1.4 2.0 6.8 6.1 9.5 5.3 4.8 -0.3 -5.7 0.1 -2.1 : 2.0 Czech Republic 6.2 1.5 3.7 2.5 5.2 5.0 3.6 0.2 1.0 0.3 -0.5 : 1.7 Denmark 2.4 1.0 3.1 3.8 4.4 2.4 -0.2 -1.6 -4.6 1.1 2.3 : 1.7 Estonia : 5.8 10.2 9.8 12.9 9.0 -4.7 -9.0 -16.7 -1.3 -1.9 : 2.9 Latvia : 4.7 11.4 11.2 21.2 14.8 -5.4 -22.0 -22.0 -6.5 -11.0 : 0.5 Lithuania : 5.0 10.2 12.2 10.6 12.1 3.6 -17.5 -19.5 -7.2 -6.3 : 1.2 Hungary : 4.8 5.4 3.2 1.7 0.4 -0.5 -6.6 -7.4 -0.3 -2.5 : 3.0 Poland 4.8 4.6 3.4 2.1 5.0 4.9 5.9 0.6 2.1 0.2 1.3 : 3.3 Romania 3.1 1.2 10.6 10.1 12.7 11.9 8.9 -3.7 -12.5 -0.3 2.2 : 3.6 Sweden 0.0 3.0 2.4 2.7 2.3 3.0 -0.2 -3.0 -1.3 0.5 1.0 : 1.5 United Kingdom 2.4 4.2 2.7 2.2 1.5 2.1 1.0 -3.4 -3.3 -1.5 -0.3 : 1.5 EU 1.7 3.0 2.0 2.1 2.2 2.1 0.8 -1.5 -1.7 -0.4 0.2 : 1.2 USA 3.4 4.4 3.0 3.4 2.9 2.6 -0.2 -2.0 -0.8 -1.2 -0.2 : 0.4 Japan 1.9 0.6 1.2 1.3 1.5 0.7 0.6 -1.0 -1.2 -0.2 0.9 : 1.0
TABLE 8 : Government consumption expenditure, volume (percentage change on preceding year, 1992-2011)5-year averages 2009 2010 2011
1992-96 1997-01 2002-06 2005 2006 2007 2008 IV-2009 X-2009 IV-2009 X-2009 IV-2009 X-2009 Belgium 1.2 2.0 1.7 1.2 1.0 2.6 3.3 1.8 1.8 1.7 1.4 : 1.5 Germany 2.4 1.1 0.5 0.4 1.0 1.7 2.1 2.0 2.3 1.8 1.5 : 0.8 Ireland 2.8 7.4 4.2 3.8 6.3 7.8 1.5 -0.6 -2.5 2.0 1.4 : 2.1 Greece 1.0 4.3 2.1 1.1 -0.1 8.4 0.6 1.9 2.0 1.9 -0.1 : 0.7 Spain 2.1 3.8 5.1 5.5 4.6 5.5 5.5 5.1 4.3 4.7 1.7 : 2.2 France 1.8 1.0 1.7 1.2 1.3 1.5 1.2 1.8 1.5 1.1 0.9 : 1.1 Italy -1.0 1.7 1.8 1.9 0.5 1.0 0.6 0.7 1.2 0.6 0.4 : 0.3 Cyprus : 5.3 3.5 3.4 7.4 0.1 8.7 7.0 8.5 2.4 3.1 : 2.4 Luxembourg 4.1 4.8 3.8 3.3 2.8 2.9 3.0 5.0 4.6 2.4 2.0 : 1.8 Malta : 0.0 2.6 -0.5 6.0 -0.5 12.9 -1.2 2.9 1.6 1.5 : 1.5 Netherlands 1.7 2.9 3.2 0.5 9.5 3.7 2.0 2.0 2.4 1.0 0.7 : 0.4 Austria 2.6 2.0 1.4 1.7 2.7 1.7 3.2 0.6 1.0 0.8 1.4 : 1.1 Portugal 2.0 3.8 1.4 3.2 -1.4 0.0 0.7 0.6 1.7 0.2 0.7 : 0.7 Slovenia 2.2 3.7 3.3 3.4 4.0 0.7 6.2 2.9 3.4 2.9 0.6 : 0.5 Slovakia : 1.6 3.8 3.3 10.2 -1.3 4.3 2.0 4.6 1.2 3.5 : 2.8 Finland -0.6 1.5 1.7 2.0 0.6 0.8 2.0 2.3 1.7 1.9 0.7 : 0.6 Euro area 1.5 1.7 1.9 1.6 2.1 2.3 2.0 2.0 2.0 1.7 1.1 : 1.0 Bulgaria -15.4 5.2 3.4 2.5 -1.3 3.1 0.0 0.2 -0.2 0.4 -0.1 : 0.2 Czech Republic -1.7 1.9 2.8 2.9 1.2 0.7 1.0 0.5 1.4 0.4 0.1 : 0.8 Denmark 2.6 2.2 1.6 1.3 2.1 1.3 1.5 2.1 2.1 1.1 1.3 : 1.4 Estonia : 0.1 1.7 -0.2 3.5 3.7 4.1 -3.6 -2.8 -2.4 -3.5 : 1.5 Latvia : 2.8 2.7 2.7 4.9 3.7 1.5 -5.0 -9.0 -2.0 -10.3 : -4.0 Lithuania : 0.7 4.1 3.5 3.7 3.2 7.9 -9.9 -7.0 -3.2 -7.9 : 0.1 Hungary -1.7 2.2 3.6 2.1 3.8 -7.4 -0.8 -3.2 -1.1 0.2 -1.6 : 1.8 Poland 3.3 2.4 4.1 5.2 6.1 3.7 7.5 -0.3 1.0 0.7 1.0 : 1.8 Romania 3.6 -3.5 -0.9 3.8 -4.1 -0.1 -0.3 -11.0 -3.0 0.1 -4.0 : -1.4 Sweden 0.4 0.8 0.9 0.4 2.0 0.4 1.5 0.5 1.5 0.6 0.6 : 0.5 United Kingdom 0.6 1.9 2.7 2.0 1.6 1.2 2.5 3.6 2.9 2.9 1.4 : -1.8 EU 0.8 1.8 2.0 1.7 2.0 1.9 2.2 1.9 2.0 1.7 1.0 : 0.6 USA -0.1 2.4 2.2 0.7 1.2 1.5 3.4 5.6 2.5 5.9 4.1 : 2.9 Japan 3.1 2.8 1.7 1.6 0.4 1.9 0.8 1.3 0.8 0.9 0.7 : 0.9

192
TABLE 9 : Total investment, volume (percentage change on preceding year, 1992-2011) 22.10.20095-year averages 2009 2010 2011
1992-96 1997-01 2002-06 2005 2006 2007 2008 IV-2009 X-2009 IV-2009 X-2009 IV-2009 X-2009 Belgium 0.8 3.6 2.6 7.1 2.7 5.9 4.3 -6.2 -4.0 -2.2 -2.8 : 2.2 Germany 0.7 1.8 0.3 0.9 7.8 5.0 3.1 -10.3 -8.9 -0.8 2.1 : 3.9 Ireland 7.2 10.1 7.4 14.7 3.9 2.4 -15.5 -29.2 -30.4 -15.6 -15.0 : 5.1 Greece -0.2 8.2 5.4 -4.5 9.8 4.6 -7.4 -5.6 -16.2 0.7 -3.9 : 1.3 Spain -0.3 7.6 5.7 7.0 7.2 4.6 -4.4 -14.7 -15.6 -8.0 -8.4 : -1.3 France -0.9 5.0 2.5 4.4 4.1 6.5 0.6 -5.9 -6.2 -2.6 -1.6 : 2.2 Italy -0.8 3.7 1.7 0.8 2.9 2.0 -3.0 -12.3 -12.2 -0.6 0.1 : 2.4 Cyprus : 1.7 6.8 3.3 10.4 10.4 9.8 1.7 -11.9 0.6 -9.0 : 0.9 Luxembourg 1.1 8.2 4.3 2.5 4.7 12.6 -0.1 -8.9 -14.8 -2.3 0.3 : 2.9 Malta : -0.1 2.0 10.2 2.4 1.3 -21.3 3.4 -8.0 3.1 1.6 : 3.1 Netherlands 3.3 4.9 0.6 3.7 7.5 4.8 4.9 -7.6 -11.7 -3.2 -6.0 : 0.4 Austria 1.8 1.6 0.9 1.2 2.4 3.8 1.0 -11.6 -6.6 0.1 -0.3 : 3.0 Portugal 1.7 7.2 -2.5 -0.9 -0.7 3.1 -0.7 -14.4 -15.2 -8.0 -4.1 : 1.1 Slovenia 6.9 7.8 5.5 3.7 9.9 11.7 7.7 -13.6 -24.8 -1.1 -0.6 : 2.5 Slovakia : 1.4 5.6 17.6 9.3 8.7 6.8 -5.2 -12.4 0.2 2.5 : 3.3 Finland -3.8 7.5 2.5 3.4 4.8 8.7 0.3 -8.5 -11.0 -2.9 -2.4 : 1.9 Euro area 0.3 4.0 2.1 3.2 5.5 4.8 -0.4 -10.4 -10.7 -2.7 -1.9 : 2.1 Bulgaria : 13.0 14.7 23.3 14.7 21.7 20.4 -12.7 -21.1 -2.0 -8.7 : 3.1 Czech Republic 10.9 0.3 3.4 1.8 6.0 10.8 -1.5 -5.1 -7.2 -0.2 0.3 : 4.5 Denmark 4.3 4.8 4.3 4.7 13.5 3.1 -5.1 -9.1 -12.4 -0.7 -4.1 : 2.1 Estonia : 10.1 16.2 15.3 18.6 9.0 -12.1 -20.7 -32.8 -1.2 -3.2 : 8.8 Latvia : 17.4 17.7 23.6 16.4 7.5 -15.6 -24.0 -34.0 -8.0 -12.0 : 3.0 Lithuania : 8.0 14.1 11.2 19.4 23.0 -6.5 -22.1 -43.0 -7.3 -7.3 : 5.4 Hungary 2.7 8.1 4.4 5.7 -3.6 1.6 0.4 -10.6 -6.0 -2.1 1.0 : 4.3 Poland 9.9 6.6 4.0 6.5 14.9 17.6 8.2 -6.2 -1.9 -0.8 1.9 : 5.0 Romania 10.4 1.3 12.7 15.3 19.9 30.3 19.3 -6.5 -12.3 -0.5 1.1 : 5.8 Sweden -1.4 4.4 4.6 8.9 9.1 7.5 2.7 -14.6 -17.0 -2.9 -1.5 : 3.2 United Kingdom 2.3 5.7 3.7 2.4 6.5 7.8 -3.3 -12.3 -15.9 -6.3 -3.8 : 3.0 EU 2.2 4.3 2.7 3.5 6.2 5.9 -0.3 -10.5 -11.4 -2.9 -2.0 : 2.5 USA 7.0 6.6 2.7 5.3 2.3 -1.4 -4.2 -12.1 -14.5 3.6 4.6 : 4.5 Japan -0.2 -1.6 -0.1 3.1 0.5 0.8 -5.0 -11.9 -12.3 -2.2 0.2 : -0.3
TABLE 10 : Investment in construction, volume (percentage change on preceding year, 1992-2011)5-year averages 2009 2010 2011
1992-96 1997-01 2002-06 2005 2006 2007 2008 IV-2009 X-2009 IV-2009 X-2009 IV-2009 X-2009 Belgium 1.8 0.4 2.4 7.0 1.2 3.0 2.7 -3.0 -2.7 -2.3 -3.4 : 0.3 Germany 2.9 -1.6 -2.0 -3.0 4.6 0.0 2.6 -4.0 -0.6 1.9 2.7 : 1.5 Ireland 7.1 10.2 8.5 13.9 5.2 -1.6 -16.6 -31.9 -32.1 -19.4 -18.9 : 4.7 Greece -3.1 6.6 3.2 -6.2 14.3 -5.3 -19.1 -3.9 -17.8 0.1 -3.3 : 1.3 Spain -0.9 6.6 6.0 6.1 6.0 3.2 -5.5 -12.8 -11.4 -8.9 -10.4 : -3.9 France -2.5 2.8 3.1 4.7 4.9 5.1 -1.0 -2.6 -4.5 -2.0 -1.9 : 1.6 Italy -2.0 2.2 2.4 0.5 1.0 1.0 -1.8 -8.2 -6.8 -1.3 -0.6 : 0.6 Cyprus : -0.1 8.4 8.6 8.1 13.1 4.7 2.0 -8.4 0.3 -6.8 : 0.6 Luxembourg 4.1 6.2 5.0 0.7 3.6 7.5 -1.5 -4.6 -7.8 -1.6 1.0 : 2.4 Malta : : : : : : : : : : : : : Netherlands 1.4 3.7 -0.6 3.7 4.2 5.2 4.6 -6.3 -10.0 -4.9 -6.0 : -1.3 Austria 2.1 -0.4 0.8 -0.7 2.8 2.9 1.8 -6.1 -2.4 0.2 -1.1 : 2.2 Portugal 2.3 6.5 -4.7 -3.2 -5.4 -0.2 -5.7 -14.9 -13.0 -9.3 -3.7 : 1.4 Slovenia 2.3 4.5 3.9 6.2 2.9 17.1 10.2 -13.8 -21.0 -1.6 -0.6 : 2.0 Slovakia : 1.7 6.9 13.3 31.0 4.4 1.9 -4.3 -11.4 0.3 2.4 : 3.2 Finland -5.9 7.8 2.7 4.1 5.0 8.4 -1.8 -6.8 -11.9 -3.1 -2.1 : 1.8 Euro area : 2.2 1.6 1.7 4.0 2.3 -0.8 -6.5 -6.1 -2.5 -2.4 : 0.6 Bulgaria : : : : : : : : : : : : : Czech Republic 4.3 -4.9 3.9 2.5 4.2 5.8 -2.8 -4.9 -4.9 -0.1 0.7 : 3.6 Denmark 3.2 2.3 4.7 7.2 13.3 2.0 -6.5 -6.0 -12.2 -1.3 -3.5 : 2.1 Estonia : : 16.1 26.5 10.7 8.3 -16.9 -25.4 -39.0 -4.3 -1.7 : 7.0 Latvia : : : : : : : : : : : : : Lithuania : 4.1 13.9 11.3 22.0 21.5 0.2 -23.7 -39.0 -7.3 -5.9 : 6.0 Hungary : : : : : : : -12.4 -3.5 -2.8 -0.2 : 4.5 Poland : 5.6 3.7 5.0 13.0 13.4 6.9 -3.9 2.1 -1.8 2.8 : 5.3 Romania 15.0 1.9 9.9 13.4 20.1 35.0 19.7 -6.0 -11.0 0.0 1.2 : 5.7 Sweden -7.4 0.8 4.2 4.7 10.3 6.4 1.5 -11.8 -12.4 0.1 -0.7 : 1.9 United Kingdom 0.8 2.6 4.6 2.5 7.7 6.3 -3.3 -13.2 -11.0 -5.7 -1.3 : 3.6 EU : : : : : : : : : : : : : USA 3.9 3.6 1.3 2.9 -1.7 -4.8 -6.3 -7.6 -14.0 1.5 5.3 : 4.7 Japan : : : : : : : : : : : : :

193
TABLE 11 : Investment in equipment, volume (percentage change on preceding year, 1992-2011) 22.10.20095-year averages 2009 2010 2011
1992-96 1997-01 2002-06 2005 2006 2007 2008 IV-2009 X-2009 IV-2009 X-2009 IV-2009 X-2009 Belgium -0.9 6.9 1.9 7.4 3.7 8.9 5.8 -9.0 -5.1 -2.0 -2.2 : 3.9 Germany -2.9 6.3 2.9 6.0 11.1 6.9 5.3 -19.7 -20.8 -5.5 1.0 : 7.0 Ireland 9.2 8.8 6.1 21.6 -2.5 15.6 -16.8 -20.0 -25.0 -5.0 -5.0 : 6.0 Greece 7.4 10.9 8.9 -2.6 4.7 20.9 6.3 -9.5 -19.0 1.5 -4.8 : 1.1 Spain -0.1 9.1 5.0 9.2 9.9 9.0 -1.8 -23.3 -25.4 -9.6 -6.0 : 2.2 France 0.8 7.6 1.1 3.2 2.2 9.5 2.7 -11.4 -11.8 -4.4 -1.4 : 2.0 Italy 0.1 5.2 1.3 1.7 5.1 3.0 -4.6 -17.8 -19.8 0.3 0.9 : 4.6 Cyprus : 5.3 4.3 -5.6 15.3 4.5 21.7 1.2 -19.0 1.2 -14.0 : 1.5 Luxembourg -4.2 11.0 3.6 1.3 7.8 18.5 5.5 -15.0 -17.0 -4.0 -0.5 : 4.0 Malta : : : : : : : : : : : : : Netherlands 4.7 6.2 2.1 3.3 11.4 7.8 4.0 -9.4 -14.8 -0.6 -6.1 : 3.1 Austria 0.9 2.9 0.1 4.3 -0.5 5.0 0.0 -17.9 -12.0 0.1 0.6 : 4.0 Portugal 1.1 9.1 -0.2 1.0 6.6 8.1 4.6 -17.2 -21.7 -8.6 -6.8 : 0.6 Slovenia 9.6 11.8 8.2 1.7 20.2 5.2 4.2 -13.3 -30.0 -0.5 -0.7 : 3.3 Slovakia : 1.8 4.4 22.0 -6.3 4.2 19.6 -4.1 -12.5 0.1 2.7 : 3.5 Finland -1.4 6.7 1.2 -0.2 4.1 11.7 8.6 -12.0 -11.5 -2.9 -4.4 : 2.5 Euro area : 6.9 2.5 4.7 6.8 7.7 1.6 -16.4 -17.9 -3.6 -1.3 : 4.1 Bulgaria : : : : : : : : : : : : : Czech Republic 17.0 5.6 3.2 1.2 8.4 16.9 -0.6 -5.9 -11.0 -0.5 -0.5 : 5.8 Denmark 3.4 6.2 2.8 1.6 13.2 5.4 -4.8 -13.0 -13.5 0.2 -5.2 : 1.9 Estonia : : 15.5 2.5 27.2 10.1 -2.9 -15.0 -25.0 2.2 -5.0 : 11.0 Latvia : : : : : : : : : : : : : Lithuania : 13.5 15.2 11.5 16.8 21.9 -19.8 -19.0 -56.0 -8.3 -11.1 : 5.0 Hungary : : : : : : : -12.5 -9.0 -1.5 2.7 : 3.9 Poland : 7.1 4.8 9.9 17.1 22.3 10.9 -9.2 -7.3 1.0 0.5 : 4.5 Romania 6.2 10.5 14.9 18.9 23.5 28.3 19.0 -7.0 -13.1 -1.0 1.0 : 6.0 Sweden 5.1 5.9 5.2 12.3 9.3 10.1 5.6 -17.5 -25.5 -5.7 -3.2 : 5.0 United Kingdom 4.5 8.1 2.5 2.9 4.5 11.5 -3.0 -12.7 -26.8 -7.9 -9.3 : 2.3 EU : : : : : : : : : : : : : USA 10.0 8.2 4.1 8.9 8.2 1.5 -4.4 -15.6 -15.0 5.3 3.9 : 4.4 Japan : : : : : : : : : : : : :
TABLE 12 : Public investment (as a percentage of GDP, 1992-2011)5-year averages 2009 2010 2011
1992-96 1997-01 2002-06 2005 2006 2007 2008 IV-2009 X-2009 IV-2009 X-2009 IV-2009 X-2009 Belgium 1.6 1.8 1.7 1.8 1.6 1.6 1.7 1.8 1.8 1.8 1.9 : 2.0 Germany 2.4 1.8 1.5 1.3 1.4 1.4 1.5 1.9 1.7 2.0 1.9 : 1.6 Ireland 2.2 3.2 3.8 3.5 3.8 4.6 5.3 4.4 4.4 4.5 4.1 : 3.7 Greece 2.9 3.3 3.2 2.8 3.0 2.9 2.9 3.0 3.0 2.8 3.0 : 3.0 Spain 3.7 3.2 3.6 3.6 3.7 4.0 3.8 4.7 4.7 3.7 3.9 : 3.5 France 3.2 3.0 3.1 3.3 3.2 3.3 3.2 3.5 3.5 3.5 3.3 : 3.3 Italy 2.4 2.3 2.3 2.4 2.3 2.3 2.2 2.5 2.5 2.4 2.2 : 2.1 Cyprus : 2.9 3.3 3.1 3.0 2.9 3.0 3.0 3.3 3.0 3.5 : 3.5 Luxembourg 4.2 4.0 4.4 4.5 3.6 3.3 3.6 4.6 4.2 5.1 4.5 : 4.5 Malta : 4.0 4.3 4.7 3.9 3.7 2.5 3.4 3.3 3.4 3.4 : 3.4 Netherlands 2.5 3.1 3.4 3.3 3.3 3.4 3.5 3.5 3.7 3.6 3.9 : 3.9 Austria 3.1 1.6 1.2 1.1 1.1 1.0 1.1 1.1 1.2 1.1 1.2 : 1.2 Portugal 3.7 4.0 3.0 2.9 2.4 2.3 2.2 2.5 2.7 2.0 2.3 : 2.3 Slovenia : 3.1 3.3 3.2 3.7 4.2 4.3 4.4 4.4 4.4 4.5 : 4.5 Slovakia : 3.6 2.5 2.1 2.2 1.9 2.0 2.0 1.8 2.1 1.9 : 1.8 Finland 2.9 2.8 2.7 2.6 2.4 2.5 2.6 2.8 2.8 2.9 2.8 : 2.7 Euro area 2.8 2.5 2.5 2.5 2.5 2.6 2.5 2.9 2.8 2.8 2.7 : 2.6 Bulgaria : 3.1 3.4 4.2 4.2 4.8 5.7 6.7 6.9 7.0 7.0 : 7.1 Czech Republic : 3.8 4.6 4.9 5.0 4.7 5.0 5.4 5.4 5.8 5.4 : 5.4 Denmark 1.8 1.7 1.8 1.8 1.9 1.7 1.8 2.0 2.2 2.1 2.5 : 2.3 Estonia : 4.2 4.4 4.0 4.7 5.2 5.3 6.2 6.2 6.8 7.2 : 7.2 Latvia : 1.3 2.9 3.1 4.6 5.7 4.8 5.6 3.6 6.1 3.9 : 3.9 Lithuania : 2.4 3.4 3.4 4.1 5.2 5.0 5.0 5.0 5.8 5.6 : 5.8 Hungary : 3.1 4.1 4.0 4.4 3.6 2.8 3.1 2.9 3.6 2.6 : 2.2 Poland : 3.4 3.5 3.4 3.9 4.2 4.6 5.5 5.1 6.0 6.6 : 7.0 Romania : 2.5 3.8 3.9 5.1 5.7 5.6 6.3 5.7 6.7 5.7 : 5.7 Sweden 2.7 3.0 3.0 3.0 3.1 3.1 3.3 3.6 3.5 3.7 3.6 : 3.6 United Kingdom 1.8 1.3 1.4 0.7 1.8 1.8 2.3 2.7 2.7 2.7 2.5 : 2.0 EU : 2.4 2.4 2.2 2.5 2.6 2.7 2.8 3.0 2.8 2.9 : 2.7 USA 2.4 2.4 2.5 2.4 2.4 2.5 2.5 4.3 3.8 5.6 4.7 : 4.8 Japan 6.1 5.5 4.0 3.6 3.3 3.1 3.0 3.2 3.9 3.2 4.3 : 4.1
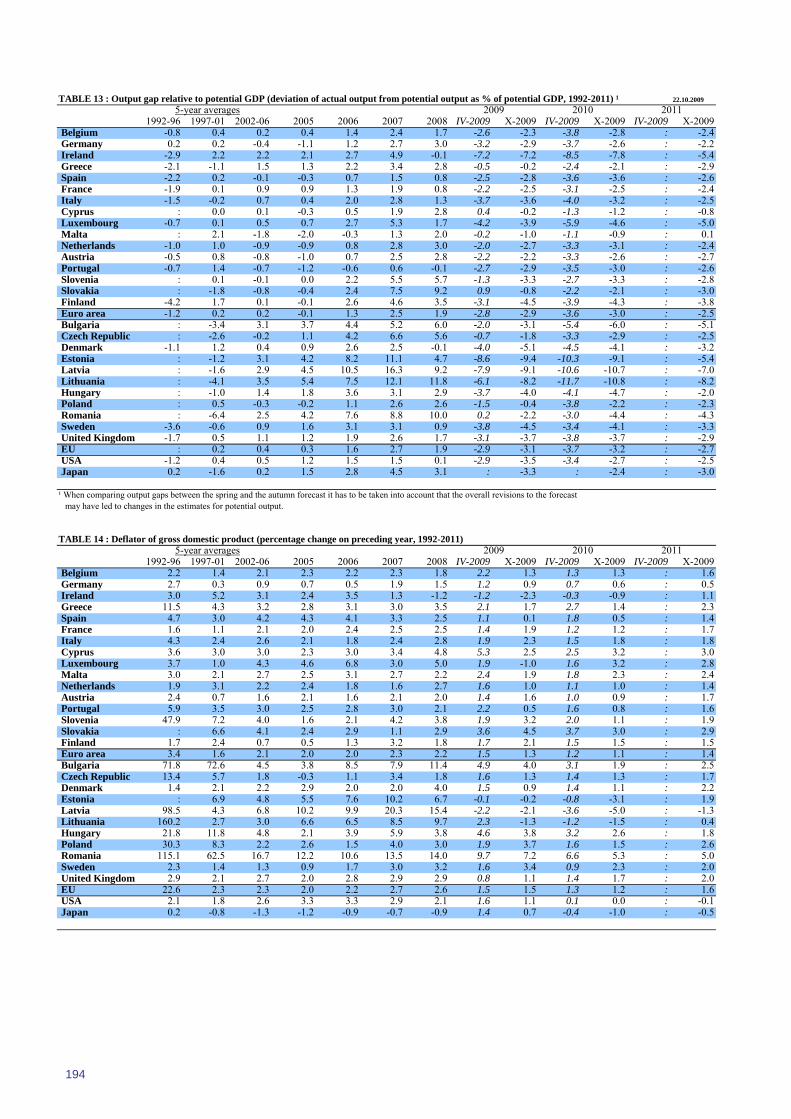
194
TABLE 13 : Output gap relative to potential GDP (deviation of actual output from potential output as % of potential GDP, 1992-2011) ¹ 22.10.20095-year averages 2009 2010 2011
1992-96 1997-01 2002-06 2005 2006 2007 2008 IV-2009 X-2009 IV-2009 X-2009 IV-2009 X-2009 Belgium -0.8 0.4 0.2 0.4 1.4 2.4 1.7 -2.6 -2.3 -3.8 -2.8 : -2.4 Germany 0.2 0.2 -0.4 -1.1 1.2 2.7 3.0 -3.2 -2.9 -3.7 -2.6 : -2.2 Ireland -2.9 2.2 2.2 2.1 2.7 4.9 -0.1 -7.2 -7.2 -8.5 -7.8 : -5.4 Greece -2.1 -1.1 1.5 1.3 2.2 3.4 2.8 -0.5 -0.2 -2.4 -2.1 : -2.9 Spain -2.2 0.2 -0.1 -0.3 0.7 1.5 0.8 -2.5 -2.8 -3.6 -3.6 : -2.6 France -1.9 0.1 0.9 0.9 1.3 1.9 0.8 -2.2 -2.5 -3.1 -2.5 : -2.4 Italy -1.5 -0.2 0.7 0.4 2.0 2.8 1.3 -3.7 -3.6 -4.0 -3.2 : -2.5 Cyprus : 0.0 0.1 -0.3 0.5 1.9 2.8 0.4 -0.2 -1.3 -1.2 : -0.8 Luxembourg -0.7 0.1 0.5 0.7 2.7 5.3 1.7 -4.2 -3.9 -5.9 -4.6 : -5.0 Malta : 2.1 -1.8 -2.0 -0.3 1.3 2.0 -0.2 -1.0 -1.1 -0.9 : 0.1 Netherlands -1.0 1.0 -0.9 -0.9 0.8 2.8 3.0 -2.0 -2.7 -3.3 -3.1 : -2.4 Austria -0.5 0.8 -0.8 -1.0 0.7 2.5 2.8 -2.2 -2.2 -3.3 -2.6 : -2.7 Portugal -0.7 1.4 -0.7 -1.2 -0.6 0.6 -0.1 -2.7 -2.9 -3.5 -3.0 : -2.6 Slovenia : 0.1 -0.1 0.0 2.2 5.5 5.7 -1.3 -3.3 -2.7 -3.3 : -2.8 Slovakia : -1.8 -0.8 -0.4 2.4 7.5 9.2 0.9 -0.8 -2.2 -2.1 : -3.0 Finland -4.2 1.7 0.1 -0.1 2.6 4.6 3.5 -3.1 -4.5 -3.9 -4.3 : -3.8 Euro area -1.2 0.2 0.2 -0.1 1.3 2.5 1.9 -2.8 -2.9 -3.6 -3.0 : -2.5 Bulgaria : -3.4 3.1 3.7 4.4 5.2 6.0 -2.0 -3.1 -5.4 -6.0 : -5.1 Czech Republic : -2.6 -0.2 1.1 4.2 6.6 5.6 -0.7 -1.8 -3.3 -2.9 : -2.5 Denmark -1.1 1.2 0.4 0.9 2.6 2.5 -0.1 -4.0 -5.1 -4.5 -4.1 : -3.2 Estonia : -1.2 3.1 4.2 8.2 11.1 4.7 -8.6 -9.4 -10.3 -9.1 : -5.4 Latvia : -1.6 2.9 4.5 10.5 16.3 9.2 -7.9 -9.1 -10.6 -10.7 : -7.0 Lithuania : -4.1 3.5 5.4 7.5 12.1 11.8 -6.1 -8.2 -11.7 -10.8 : -8.2 Hungary : -1.0 1.4 1.8 3.6 3.1 2.9 -3.7 -4.0 -4.1 -4.7 : -2.0 Poland : 0.5 -0.3 -0.2 1.1 2.6 2.6 -1.5 -0.4 -3.8 -2.2 : -2.3 Romania : -6.4 2.5 4.2 7.6 8.8 10.0 0.2 -2.2 -3.0 -4.4 : -4.3 Sweden -3.6 -0.6 0.9 1.6 3.1 3.1 0.9 -3.8 -4.5 -3.4 -4.1 : -3.3 United Kingdom -1.7 0.5 1.1 1.2 1.9 2.6 1.7 -3.1 -3.7 -3.8 -3.7 : -2.9 EU : 0.2 0.4 0.3 1.6 2.7 1.9 -2.9 -3.1 -3.7 -3.2 : -2.7 USA -1.2 0.4 0.5 1.2 1.5 1.5 0.1 -2.9 -3.5 -3.4 -2.7 : -2.5 Japan 0.2 -1.6 0.2 1.5 2.8 4.5 3.1 : -3.3 : -2.4 : -3.0
¹ When comparing output gaps between the spring and the autumn forecast it has to be taken into account that the overall revisions to the forecast may have led to changes in the estimates for potential output.
TABLE 14 : Deflator of gross domestic product (percentage change on preceding year, 1992-2011)5-year averages 2009 2010 2011
1992-96 1997-01 2002-06 2005 2006 2007 2008 IV-2009 X-2009 IV-2009 X-2009 IV-2009 X-2009 Belgium 2.2 1.4 2.1 2.3 2.2 2.3 1.8 2.2 1.3 1.3 1.3 : 1.6 Germany 2.7 0.3 0.9 0.7 0.5 1.9 1.5 1.2 0.9 0.7 0.6 : 0.5 Ireland 3.0 5.2 3.1 2.4 3.5 1.3 -1.2 -1.2 -2.3 -0.3 -0.9 : 1.1 Greece 11.5 4.3 3.2 2.8 3.1 3.0 3.5 2.1 1.7 2.7 1.4 : 2.3 Spain 4.7 3.0 4.2 4.3 4.1 3.3 2.5 1.1 0.1 1.8 0.5 : 1.4 France 1.6 1.1 2.1 2.0 2.4 2.5 2.5 1.4 1.9 1.2 1.2 : 1.7 Italy 4.3 2.4 2.6 2.1 1.8 2.4 2.8 1.9 2.3 1.5 1.8 : 1.8 Cyprus 3.6 3.0 3.0 2.3 3.0 3.4 4.8 5.3 2.5 2.5 3.2 : 3.0 Luxembourg 3.7 1.0 4.3 4.6 6.8 3.0 5.0 1.9 -1.0 1.6 3.2 : 2.8 Malta 3.0 2.1 2.7 2.5 3.1 2.7 2.2 2.4 1.9 1.8 2.3 : 2.4 Netherlands 1.9 3.1 2.2 2.4 1.8 1.6 2.7 1.6 1.0 1.1 1.0 : 1.4 Austria 2.4 0.7 1.6 2.1 1.6 2.1 2.0 1.4 1.6 1.0 0.9 : 1.7 Portugal 5.9 3.5 3.0 2.5 2.8 3.0 2.1 2.2 0.5 1.6 0.8 : 1.6 Slovenia 47.9 7.2 4.0 1.6 2.1 4.2 3.8 1.9 3.2 2.0 1.1 : 1.9 Slovakia : 6.6 4.1 2.4 2.9 1.1 2.9 3.6 4.5 3.7 3.0 : 2.9 Finland 1.7 2.4 0.7 0.5 1.3 3.2 1.8 1.7 2.1 1.5 1.5 : 1.5 Euro area 3.4 1.6 2.1 2.0 2.0 2.3 2.2 1.5 1.3 1.2 1.1 : 1.4 Bulgaria 71.8 72.6 4.5 3.8 8.5 7.9 11.4 4.9 4.0 3.1 1.9 : 2.5 Czech Republic 13.4 5.7 1.8 -0.3 1.1 3.4 1.8 1.6 1.3 1.4 1.3 : 1.7 Denmark 1.4 2.1 2.2 2.9 2.0 2.0 4.0 1.5 0.9 1.4 1.1 : 2.2 Estonia : 6.9 4.8 5.5 7.6 10.2 6.7 -0.1 -0.2 -0.8 -3.1 : 1.9 Latvia 98.5 4.3 6.8 10.2 9.9 20.3 15.4 -2.2 -2.1 -3.6 -5.0 : -1.3 Lithuania 160.2 2.7 3.0 6.6 6.5 8.5 9.7 2.3 -1.3 -1.2 -1.5 : 0.4 Hungary 21.8 11.8 4.8 2.1 3.9 5.9 3.8 4.6 3.8 3.2 2.6 : 1.8 Poland 30.3 8.3 2.2 2.6 1.5 4.0 3.0 1.9 3.7 1.6 1.5 : 2.6 Romania 115.1 62.5 16.7 12.2 10.6 13.5 14.0 9.7 7.2 6.6 5.3 : 5.0 Sweden 2.3 1.4 1.3 0.9 1.7 3.0 3.2 1.6 3.4 0.9 2.3 : 2.0 United Kingdom 2.9 2.1 2.7 2.0 2.8 2.9 2.9 0.8 1.1 1.4 1.7 : 2.0 EU 22.6 2.3 2.3 2.0 2.2 2.7 2.6 1.5 1.5 1.3 1.2 : 1.6 USA 2.1 1.8 2.6 3.3 3.3 2.9 2.1 1.6 1.1 0.1 0.0 : -0.1 Japan 0.2 -0.8 -1.3 -1.2 -0.9 -0.7 -0.9 1.4 0.7 -0.4 -1.0 : -0.5

195
TABLE 15 : Price deflator of private consumption (percentage change on preceding year, 1992-2011) 22.10.20095-year averages 2009 2010 2011
1992-96 1997-01 2002-06 2005 2006 2007 2008 IV-2009 X-2009 IV-2009 X-2009 IV-2009 X-2009 Belgium 1.8 1.6 2.2 2.7 3.0 2.8 3.8 0.3 0.0 1.2 1.3 : 1.5 Germany 2.4 1.0 1.3 1.4 1.0 1.8 2.1 0.5 -0.2 0.7 0.6 : 0.7 Ireland 2.6 3.8 3.1 1.8 2.4 0.0 3.1 -1.6 -1.8 0.3 -0.8 : 1.2 Greece 11.6 4.5 3.1 3.3 3.4 3.0 4.1 2.0 1.2 2.1 1.4 : 1.9 Spain 4.9 2.8 3.3 3.4 3.6 3.2 3.7 0.2 -0.4 1.7 0.8 : 1.8 France 1.6 0.9 1.7 1.8 2.1 2.1 2.8 0.3 0.1 1.0 1.1 : 1.6 Italy 5.1 2.4 2.6 2.3 2.7 2.2 3.2 0.8 0.3 1.8 1.8 : 2.0 Cyprus : 2.3 2.6 2.5 2.3 2.8 4.8 1.4 1.0 2.3 3.3 : 2.8 Luxembourg 2.8 2.3 2.0 2.8 2.2 2.0 3.7 0.1 0.4 1.9 1.7 : 1.7 Malta : 1.9 2.0 2.5 2.4 1.6 2.9 1.0 1.8 1.8 1.6 : 2.3 Netherlands 2.4 2.9 2.1 2.1 2.2 1.6 2.1 1.3 1.1 1.1 1.2 : 1.4 Austria 2.5 1.4 1.8 2.6 2.1 2.6 2.6 0.4 0.5 1.1 1.3 : 1.6 Portugal 5.6 2.8 2.9 2.7 3.1 2.7 2.6 -0.2 -1.1 1.5 1.1 : 1.6 Slovenia 45.8 7.3 4.0 2.1 2.2 4.1 5.3 0.7 0.6 2.0 1.7 : 2.0 Slovakia : 7.5 4.8 2.6 4.9 2.6 4.4 2.3 1.6 3.0 2.3 : 2.8 Finland 1.9 2.5 1.0 0.6 1.6 2.3 3.4 1.4 1.2 1.3 1.4 : 1.3 Euro area 3.5 1.7 2.1 2.1 2.2 2.2 2.9 0.5 0.1 1.2 1.1 : 1.4 Bulgaria 80.5 70.1 3.9 5.2 5.7 6.8 11.0 3.0 1.4 2.9 1.3 : 2.0 Czech Republic 11.2 5.3 1.3 0.8 1.4 2.9 4.9 1.0 0.4 1.5 1.4 : 1.6 Denmark 1.7 2.1 1.5 1.5 1.9 1.8 3.1 0.9 1.3 1.4 1.6 : 1.7 Estonia : 6.8 3.1 3.6 5.3 7.4 9.2 0.7 0.2 0.6 0.5 : 2.1 Latvia : 4.1 5.4 8.7 6.0 10.3 15.5 2.0 3.0 -1.0 -3.7 : -1.2 Lithuania : 2.8 0.9 1.7 4.0 6.4 9.7 3.0 3.5 -1.1 -1.2 : 0.5 Hungary : 11.7 3.9 3.8 3.4 6.2 5.6 4.7 4.2 3.6 4.2 : 2.5 Poland 31.6 9.0 2.0 2.1 1.2 2.4 4.2 2.6 3.8 1.9 2.0 : 2.1 Romania 117.3 59.1 12.0 6.9 4.9 4.8 9.0 6.1 5.8 3.9 3.6 : 3.5 Sweden 3.1 1.3 1.3 1.2 1.0 1.1 2.8 1.2 1.9 0.9 1.9 : 1.9 United Kingdom 3.4 1.8 2.0 2.4 2.7 2.9 3.0 1.1 1.4 1.2 1.4 : 1.6 EU 23.1 2.5 2.1 2.1 2.3 2.4 3.1 0.8 0.6 1.3 1.2 : 1.5 USA 2.3 1.8 2.3 3.0 2.7 2.7 3.3 -0.4 -0.2 0.0 0.2 : 0.0 Japan 0.6 -0.3 -0.8 -0.8 -0.2 -0.4 0.5 -1.4 -1.6 -0.6 -0.9 : 0.0
TABLE 16 : Harmonised index of consumer prices (national index if not available), (percentage change on preceding year, 1992-2011)5-year averages 2009 2010 2011
1992-96 1997-01 2002-06 2005 2006 2007 2008 IV-2009 X-2009 IV-2009 X-2009 IV-2009 X-2009 Belgium 2.2 1.7 2.0 2.5 2.3 1.8 4.5 0.3 0.0 1.2 1.3 : 1.5 Germany 3.1 1.2 1.6 1.9 1.8 2.3 2.8 0.3 0.3 0.7 0.8 : 1.0 Ireland 2.2 3.0 3.2 2.2 2.7 2.9 3.1 -1.3 -1.5 0.4 -0.6 : 1.0 Greece 11.6 3.7 3.4 3.5 3.3 3.0 4.2 1.8 1.2 2.3 1.4 : 2.1 Spain 4.7 2.4 3.3 3.4 3.6 2.8 4.1 -0.1 -0.4 1.4 0.8 : 2.0 France 2.0 1.2 2.1 1.9 1.9 1.6 3.2 0.2 0.1 0.9 1.1 : 1.4 Italy 4.6 2.1 2.4 2.2 2.2 2.0 3.5 0.8 0.8 1.8 1.8 : 2.0 Cyprus 4.3 2.7 2.6 2.0 2.2 2.2 4.4 1.1 0.8 2.0 3.1 : 2.5 Luxembourg 1.8 1.9 2.9 3.8 3.0 2.7 4.1 -0.6 0.0 2.0 1.8 : 1.7 Malta 3.3 3.1 2.5 2.5 2.6 0.7 4.7 1.0 2.0 1.8 2.0 : 2.2 Netherlands 2.5 2.6 2.1 1.5 1.7 1.6 2.2 1.4 1.1 0.9 0.9 : 1.2 Austria 2.9 1.3 1.7 2.1 1.7 2.2 3.2 0.5 0.5 1.1 1.3 : 1.6 Portugal 5.6 2.7 2.9 2.1 3.0 2.4 2.7 -0.3 -1.0 1.7 1.3 : 1.4 Slovenia : 8.0 4.3 2.5 2.5 3.8 5.5 0.7 0.9 2.0 1.7 : 2.0 Slovakia : 8.5 5.3 2.8 4.3 1.9 3.9 2.0 1.1 2.4 1.9 : 2.5 Finland 1.5 1.9 1.1 0.8 1.3 1.6 3.9 1.3 1.8 1.1 1.6 : 1.5 Euro area 3.4 1.7 2.2 2.2 2.2 2.1 3.3 0.4 0.3 1.2 1.1 : 1.5 Bulgaria 87.7 : 5.5 6.0 7.4 7.6 12.0 3.9 2.4 3.6 2.3 : 2.9 Czech Republic : 5.6 1.5 1.6 2.1 3.0 6.3 1.1 0.6 1.6 1.5 : 1.8 Denmark 1.9 2.1 1.8 1.7 1.9 1.7 3.6 0.9 1.1 1.4 1.5 : 1.8 Estonia 120.7 6.1 3.3 4.1 4.4 6.7 10.6 0.6 0.2 0.5 0.5 : 2.1 Latvia 70.3 3.9 4.9 6.9 6.6 10.1 15.3 4.6 3.5 -0.7 -3.7 : -1.2 Lithuania 179.8 3.9 1.4 2.7 3.8 5.8 11.1 3.6 3.9 -0.4 -0.7 : 1.0 Hungary 23.2 12.3 4.8 3.5 4.0 7.9 6.0 4.4 4.3 4.1 4.0 : 2.5 Poland 31.4 9.8 1.9 2.2 1.3 2.6 4.2 2.6 3.9 1.9 1.9 : 2.0 Romania 116.9 63.2 12.9 9.1 6.6 4.9 7.9 5.8 5.7 3.5 3.5 : 3.4 Sweden 2.4 1.5 1.5 0.8 1.5 1.7 3.3 1.6 1.9 0.7 1.7 : 1.7 United Kingdom 2.8 1.3 1.7 2.1 2.3 2.3 3.6 1.0 2.0 1.3 1.4 : 1.6 EU 24.3 4.3 2.3 2.3 2.3 2.4 3.7 0.9 1.0 1.3 1.3 : 1.6 USA 2.9 2.5 2.6 3.4 3.2 2.8 3.8 -0.7 -0.5 0.3 0.8 : 0.1 Japan 0.7 0.1 -0.2 -0.3 0.3 0.0 1.4 -1.0 -1.2 -0.5 -0.4 : 0.3

196
TABLE 17 : Profiles of quarterly harmonised index of consumer prices (percentage change on corresponding quarter in previous year, 2009-2011) 22.10.2009
2009/1 2009/2 2009/3 2009/4 2010/1 2010/2 2010/3 2010/4 2011/1 2011/2 2011/3 2011/4 Belgium 1.6 -0.2 -1.2 -0.2 0.7 1.3 1.5 1.5 1.4 1.4 1.5 1.5 Germany 0.8 0.2 -0.4 0.6 0.8 0.8 0.9 0.8 0.9 1.0 1.1 1.1 Ireland 0.2 -1.6 -2.6 -2.1 -1.4 -0.9 -0.3 0.4 0.5 1.0 1.2 1.2 Greece 1.8 0.8 0.8 1.0 1.2 1.3 1.5 1.7 1.8 2.0 2.2 2.6 Spain 0.5 -0.7 -1.1 -0.2 0.2 0.4 0.8 1.7 2.5 2.4 1.7 1.5 France 0.7 -0.2 -0.4 0.5 1.1 1.1 1.1 1.1 1.0 1.2 1.4 1.8 Italy 1.4 0.9 0.1 0.9 1.6 1.8 1.9 2.0 2.1 2.0 2.0 1.9 Cyprus 0.8 0.4 -1.1 2.3 4.0 3.7 2.4 2.3 3.1 2.5 2.4 2.0 Luxembourg 0.2 -0.7 -0.7 1.4 2.7 1.9 1.4 1.4 1.5 1.6 1.7 1.8 Malta 3.5 3.4 0.9 0.2 1.6 2.2 1.8 2.3 2.6 2.3 2.1 1.8 Netherlands 1.8 1.6 -0.1 1.2 0.7 0.4 1.4 1.4 1.2 1.2 1.3 1.3 Austria 1.0 0.1 -0.1 1.1 1.4 1.3 1.5 1.1 1.6 1.7 1.7 1.6 Portugal -0.1 -1.1 -1.5 -0.9 0.3 1.1 1.6 1.7 1.3 1.4 1.4 1.4 Slovenia 1.7 0.6 -0.2 1.3 1.6 1.7 1.7 1.8 1.9 1.9 2.1 2.2 Slovakia 2.3 1.1 0.4 0.7 1.5 1.6 2.1 2.3 2.4 2.6 2.5 2.6 Finland 2.4 1.7 1.1 1.9 1.7 1.5 1.4 1.6 1.4 1.6 1.4 1.5 Euro area 1.0 0.2 -0.4 0.5 0.9 1.1 1.2 1.3 1.4 1.5 1.5 1.7 Bulgaria 5.1 3.1 0.8 0.8 1.8 2.2 2.6 2.6 2.6 2.7 3.1 3.3 Czech Republic 1.5 1.0 -0.1 0.2 1.5 1.5 1.5 1.5 1.6 1.7 1.9 2.0 Denmark 1.7 1.1 0.6 1.2 1.4 1.6 1.6 1.6 1.9 1.7 1.7 1.7 Estonia 3.7 0.2 -0.9 -1.9 -0.4 0.9 0.5 1.2 1.7 2.1 2.2 2.4 Latvia 9.0 4.4 1.2 -0.7 -3.7 -3.9 -3.6 -3.4 -2.6 -1.7 -0.7 0.3 Lithuania 8.4 4.9 2.4 0.1 -0.6 -0.6 -0.7 -0.9 0.6 1.2 1.2 1.1 Hungary 2.7 3.6 4.9 6.0 6.1 5.4 2.3 2.5 2.3 2.5 2.4 2.7 Poland 3.6 4.3 4.3 3.5 2.8 2.0 1.4 1.4 1.8 1.9 2.1 2.4 Romania 6.9 6.1 5.1 4.5 3.7 3.5 3.6 3.3 3.3 3.4 3.5 3.3 Sweden 2.1 1.7 1.7 2.3 2.0 1.6 1.5 1.5 1.6 1.6 1.7 1.7 United Kingdom 3.0 2.1 1.5 1.5 2.0 1.2 1.1 1.3 1.4 1.5 1.6 1.7 EU 1.6 0.9 0.4 1.0 1.2 1.2 1.2 1.4 1.5 1.6 1.7 1.8 USA -0.2 -0.9 -1.6 0.8 1.5 1.2 0.4 0.3 0.2 0.1 0.1 0.1 Japan -0.1 -0.9 -2.1 -1.5 -0.8 -0.7 -0.3 0.1 0.4 0.0 0.2 0.4
TABLE 18 : Price deflator of exports of goods in national currency (percentage change on preceding year, 1992-2011)5-year averages 2009 2010 2011
1992-96 1997-01 2002-06 2005 2006 2007 2008 IV-2009 X-2009 IV-2009 X-2009 IV-2009 X-2009 Belgium -0.7 1.3 1.3 4.9 3.2 1.8 3.9 -2.4 -2.2 1.6 0.9 : 2.1 Germany 0.4 0.5 -0.1 0.6 1.3 0.4 0.3 -1.4 -1.8 0.4 0.5 : 1.3 Ireland 1.1 3.3 -2.7 -0.5 0.0 -2.3 -2.3 -0.8 2.0 0.5 -1.6 : 0.0 Greece 7.5 4.1 2.3 4.2 4.3 3.0 2.7 1.8 -0.4 2.2 1.0 : 1.9 Spain 3.5 2.1 1.7 5.0 4.5 2.0 2.3 -1.7 -3.3 1.8 0.4 : 1.2 France -0.8 0.0 0.0 1.5 2.9 1.5 2.5 -3.1 -4.3 1.6 1.3 : 2.0 Italy 4.7 2.0 2.6 4.4 5.2 4.7 5.3 0.8 -0.3 2.6 2.1 : 2.5 Cyprus : 3.6 0.7 2.5 6.8 2.7 1.6 1.4 -3.0 2.2 3.2 : 3.5 Luxembourg -0.2 0.5 2.1 5.7 2.5 4.6 5.8 -1.5 -2.0 1.0 2.0 : 3.0 Malta : 1.4 -0.4 -3.0 8.2 8.8 0.5 0.9 -6.5 2.0 1.2 : 1.8 Netherlands -0.9 0.9 0.5 3.7 3.2 1.6 4.5 -4.1 -6.5 1.7 0.5 : 1.7 Austria 0.3 0.5 0.9 2.1 2.9 1.4 2.2 -0.9 -3.1 0.5 1.1 : 2.4 Portugal 1.2 1.9 0.8 1.8 4.5 2.7 2.4 -0.9 -4.5 2.1 0.9 : 1.9 Slovenia 39.9 5.3 2.8 2.7 2.8 2.2 1.2 0.2 -2.8 1.9 0.5 : 0.9 Slovakia : 5.0 1.7 1.5 1.8 0.5 0.9 1.1 1.7 0.8 0.8 : 1.2 Finland 3.7 -1.6 -0.4 1.0 3.0 0.1 -2.9 -3.4 -6.5 0.4 1.0 : 1.2 Euro area 1.6 1.0 0.5 2.3 2.7 1.5 2.1 -1.7 -2.7 1.3 0.8 : 1.7 Bulgaria : : 4.8 7.5 17.0 5.9 8.1 -6.4 -11.0 5.7 3.1 : 4.2 Czech Republic : 2.0 -1.8 -2.8 -1.5 -0.2 -5.8 5.1 2.6 0.9 -1.8 : 1.7 Denmark 0.2 1.3 1.6 5.0 3.7 1.8 6.9 -3.2 -6.6 0.8 2.5 : 1.8 Estonia : 4.5 2.1 4.0 7.6 6.7 6.0 -4.0 -15.1 -1.0 -3.1 : 2.2 Latvia : -0.2 8.8 10.2 9.7 13.4 9.8 -11.0 -7.0 1.0 0.0 : 2.0 Lithuania : 0.8 2.9 9.6 4.9 5.8 12.9 -5.5 -13.6 3.3 2.1 : 3.2 Hungary : 8.6 -0.3 -0.7 6.5 -4.5 1.3 13.9 7.5 2.0 -3.3 : 1.8 Poland 21.1 6.5 3.8 -3.3 2.5 2.8 -1.8 12.0 15.8 1.7 -2.9 : 2.3 Romania 115.2 49.6 9.8 -0.2 5.8 0.5 6.6 11.7 13.0 4.1 3.9 : 3.8 Sweden 2.1 0.0 0.2 2.9 3.7 2.1 3.4 10.0 8.0 1.0 -1.0 : 2.0 United Kingdom 3.1 -2.7 1.2 1.8 3.3 0.6 13.5 3.7 2.4 3.7 3.5 : 2.8 EU : 6.4 0.7 2.1 2.9 1.4 3.0 0.0 -1.1 1.5 0.8 : 1.8 USA -0.3 -1.3 2.3 3.2 3.3 3.6 5.0 -7.0 -7.2 0.6 0.7 : 0.2 Japan -2.6 -1.9 -0.3 1.4 3.7 2.2 -4.6 -6.0 -10.0 1.4 -0.4 : 0.0

197
TABLE 19 : Price deflator of imports of goods in national currency (percentage change on preceding year, 1992-2011) 22.10.20095-year averages 2009 2010 2011
1992-96 1997-01 2002-06 2005 2006 2007 2008 IV-2009 X-2009 IV-2009 X-2009 IV-2009 X-2009 Belgium -0.5 2.0 1.5 4.9 3.6 1.5 6.5 -4.0 -4.0 1.7 1.2 : 2.2 Germany -1.2 1.2 -0.2 2.4 3.1 -0.1 1.3 -2.5 -5.0 1.0 0.9 : 2.0 Ireland 1.7 3.4 -2.3 0.9 2.6 2.0 0.5 -4.4 1.3 2.4 0.1 : 1.5 Greece 7.2 4.3 2.4 4.2 3.9 2.1 5.1 -3.5 -6.5 3.0 1.9 : 2.2 Spain 2.9 2.1 1.1 4.2 3.9 1.9 4.8 -4.1 -8.9 2.4 1.0 : 1.9 France -1.0 0.2 0.0 2.8 3.1 0.4 4.4 -5.9 -10.4 2.0 1.3 : 1.7 Italy 5.0 2.1 3.3 6.8 8.9 3.1 8.1 -6.2 -7.6 3.0 1.7 : 2.3 Cyprus : 2.3 2.4 6.4 2.3 2.6 4.4 -8.0 -8.0 2.3 3.5 : 3.8 Luxembourg 0.4 1.9 1.0 6.1 -0.5 1.9 5.6 -6.0 -2.5 1.5 2.0 : 1.5 Malta : 2.5 1.9 1.6 10.9 5.8 1.9 -1.8 -6.3 2.2 0.6 : 2.2 Netherlands -1.3 0.2 0.1 3.2 3.5 1.9 4.5 -4.9 -6.8 2.3 1.0 : 1.6 Austria 0.4 0.7 0.9 2.7 3.7 1.9 4.4 -2.0 -3.4 0.6 1.8 : 2.0 Portugal 0.1 1.7 0.9 3.0 4.0 1.2 4.8 -5.5 -6.6 2.2 2.3 : 2.1 Slovenia 36.0 5.5 3.1 5.2 3.3 2.0 3.1 -1.1 -8.0 2.0 1.1 : 2.0 Slovakia : 4.6 2.1 1.7 3.6 1.6 2.8 -0.1 -1.8 -0.1 0.1 : 0.6 Finland 3.2 -1.0 2.0 5.5 7.1 1.8 0.5 -4.2 -8.0 1.5 2.0 : 2.2 Euro area 1.1 1.3 0.7 3.6 4.1 1.2 4.0 -4.2 -6.5 1.8 1.2 : 1.9 Bulgaria : : 4.0 10.0 11.4 7.3 10.8 -7.3 -11.7 4.0 1.9 : 3.1 Czech Republic : 1.9 -1.7 -1.1 0.2 -1.4 -3.6 5.0 1.2 1.1 -2.2 : 1.6 Denmark -0.8 0.4 0.7 3.6 3.1 2.9 6.3 -3.9 -5.1 0.8 2.2 : 0.8 Estonia : 2.7 1.4 2.8 4.8 3.2 6.7 -6.0 -9.3 2.0 1.6 : 2.5 Latvia : 2.2 8.6 12.3 9.6 5.7 9.2 -7.0 -7.0 3.0 1.0 : 2.0 Lithuania : -1.5 1.6 9.0 8.8 4.9 9.1 -9.0 -10.9 3.2 1.9 : 3.5 Hungary : 9.1 0.6 1.5 8.0 -4.4 2.7 12.5 6.5 2.0 -2.7 : 2.9 Poland 19.3 7.7 3.5 -4.2 2.8 0.8 0.3 12.5 13.0 1.6 -2.0 : 2.0 Romania 125.4 41.5 6.6 -3.6 -1.2 -9.2 3.6 3.5 9.0 2.0 2.0 : 1.9 Sweden 2.9 1.5 1.3 5.1 3.9 -0.5 4.1 7.5 3.5 2.0 -2.0 : 2.0 United Kingdom 3.4 -2.7 0.6 4.0 3.4 0.0 13.2 6.2 4.0 4.3 3.2 : 2.3 EU : 5.7 0.8 3.4 4.0 0.8 4.9 -1.6 -3.9 2.0 1.1 : 2.0 USA -0.2 -1.7 3.3 6.5 4.2 3.7 11.4 -12.7 -12.8 1.4 3.2 : 1.1 Japan -3.2 -0.8 4.2 9.3 12.6 7.0 7.2 -18.0 -21.6 2.0 1.6 : 1.8
TABLE 20 : Terms of trade of goods (percentage change on preceding year, 1992-2011)5-year averages 2009 2010 2011
1992-96 1997-01 2002-06 2005 2006 2007 2008 IV-2009 X-2009 IV-2009 X-2009 IV-2009 X-2009 Belgium -0.1 -0.8 -0.2 0.0 -0.4 0.3 -2.4 1.7 1.9 -0.1 -0.2 : -0.1 Germany 1.6 -0.7 0.1 -1.8 -1.8 0.6 -1.1 1.1 3.4 -0.6 -0.4 : -0.7 Ireland -0.5 -0.2 -0.5 -1.4 -2.6 -4.2 -2.8 3.8 0.7 -1.9 -1.7 : -1.5 Greece 0.3 -0.1 -0.1 0.0 0.4 0.9 -2.2 5.4 6.5 -0.8 -0.9 : -0.3 Spain 0.6 0.0 0.5 0.8 0.6 0.1 -2.3 2.5 6.1 -0.6 -0.6 : -0.7 France 0.1 -0.2 0.0 -1.3 -0.3 1.1 -1.8 3.0 6.8 -0.3 0.0 : 0.3 Italy -0.3 -0.1 -0.7 -2.3 -3.4 1.5 -2.6 7.5 7.9 -0.4 0.4 : 0.2 Cyprus : 1.3 -1.7 -3.7 4.3 0.1 -2.6 10.2 5.4 -0.1 -0.3 : -0.3 Luxembourg -0.6 -1.4 1.0 -0.4 3.0 2.6 0.2 4.8 0.5 -0.5 0.0 : 1.5 Malta : -1.1 -2.2 -4.5 -2.5 2.8 -1.4 2.7 -0.2 -0.2 0.5 : -0.4 Netherlands 0.4 0.7 0.4 0.5 -0.3 -0.3 -0.1 0.8 0.3 -0.6 -0.5 : 0.1 Austria -0.1 -0.2 0.0 -0.6 -0.7 -0.5 -2.1 1.1 0.3 -0.1 -0.7 : 0.4 Portugal 1.1 0.2 -0.1 -1.2 0.4 1.5 -2.3 4.9 2.2 -0.1 -1.4 : -0.2 Slovenia 2.9 -0.2 -0.3 -2.4 -0.4 0.2 -1.8 1.3 5.7 -0.1 -0.6 : -1.1 Slovakia : 0.4 -0.3 -0.2 -1.8 -1.1 -1.9 1.3 3.6 0.9 0.7 : 0.6 Finland 0.5 -0.6 -2.3 -4.3 -3.8 -1.6 -3.4 0.8 1.6 -1.1 -1.0 : -1.0 Euro area : -0.3 -0.2 -1.3 -1.3 0.3 -1.8 2.5 4.1 -0.5 -0.4 : -0.3 Bulgaria : : 0.8 -2.2 5.1 -1.4 -2.5 1.0 0.8 1.6 1.2 : 1.1 Czech Republic : 0.1 -0.1 -1.7 -1.7 1.2 -2.3 0.1 1.4 -0.2 0.4 : 0.1 Denmark 1.0 0.9 0.9 1.3 0.6 -1.1 0.6 0.7 -1.6 0.0 0.3 : 1.0 Estonia : 1.7 0.7 1.2 2.7 3.4 -0.7 2.1 -6.4 -2.9 -4.6 : -0.3 Latvia : -2.3 0.2 -1.8 0.0 7.2 0.6 -4.3 0.0 -1.9 -1.0 : 0.0 Lithuania : 2.3 1.2 0.6 -3.5 0.9 3.5 3.8 -3.0 0.1 0.2 : -0.3 Hungary : -0.4 -0.9 -2.2 -1.4 -0.1 -1.4 1.2 0.9 0.0 -0.6 : -1.1 Poland 1.5 -1.1 0.3 1.0 -0.3 2.0 -2.1 -0.4 2.5 0.1 -0.9 : 0.3 Romania -4.5 5.8 3.0 3.5 7.2 10.6 2.9 7.9 3.7 2.1 1.9 : 1.9 Sweden -0.7 -1.5 -1.0 -2.0 -0.3 2.7 -0.7 2.3 4.3 -1.0 1.0 : 0.0 United Kingdom -0.3 0.1 0.6 -2.1 -0.1 0.6 0.3 -2.4 -1.5 -0.6 0.3 : 0.5 EU : : -0.1 -1.3 -1.0 0.6 -1.8 1.7 3.0 -0.5 -0.3 : -0.1 USA -0.1 0.4 -1.0 -3.2 -0.8 -0.1 -5.7 6.5 6.4 -0.7 -2.5 : -0.9 Japan 0.6 -1.1 -4.3 -7.2 -8.0 -4.4 -11.0 14.6 14.8 -0.6 -2.0 : -1.8

198
TABLE 21 : Total population (percentage change on preceding year, 1992-2011) 22.10.20095-year averages 2009 2010 2011
1992-96 1997-01 2002-06 2005 2006 2007 2008 IV-2009 X-2009 IV-2009 X-2009 IV-2009 X-2009 Belgium 0.3 0.2 0.5 0.5 0.7 0.7 0.0 0.7 0.7 0.7 0.7 : 0.7 Germany 0.5 0.1 0.0 0.0 -0.1 -0.1 -0.2 -0.2 -0.2 -0.2 -0.2 : -0.2 Ireland 0.6 1.3 2.0 2.2 2.5 2.4 2.0 0.4 0.4 0.2 0.2 : 0.2 Greece 0.9 0.4 0.4 0.4 0.4 0.4 0.4 0.4 0.4 0.2 0.4 : 0.4 Spain 0.2 0.6 1.6 1.7 1.5 1.8 1.6 1.3 1.3 0.9 0.9 : 0.7 France 0.4 0.5 0.7 0.7 0.7 0.6 0.6 0.5 0.5 0.5 0.5 : 0.5 Italy 0.0 0.0 0.7 0.7 0.6 0.7 0.8 0.6 0.6 0.4 0.4 : 0.4 Cyprus 2.1 1.2 1.9 2.4 2.0 1.5 1.0 1.3 1.0 1.3 0.9 : 0.9 Luxembourg 1.4 1.2 1.4 1.5 1.6 1.6 1.8 1.5 1.3 0.8 1.1 : 1.1 Malta 0.9 0.7 0.7 0.6 1.1 0.6 0.5 0.5 0.8 0.5 0.8 : 0.8 Netherlands 0.6 0.7 0.4 0.3 0.1 0.2 0.4 0.3 0.4 0.3 0.3 : 0.3 Austria 0.5 0.2 0.6 0.7 0.6 0.4 0.3 0.3 0.3 0.3 0.3 : 0.3 Portugal 0.2 0.5 0.6 0.5 0.3 0.2 0.1 0.1 0.2 0.2 0.2 : 0.2 Slovenia -0.1 0.0 0.2 0.2 0.4 0.5 1.1 -1.5 -0.4 0.4 0.1 : 0.2 Slovakia 0.3 0.0 0.0 0.1 0.1 0.1 0.2 0.1 0.1 0.1 0.1 : 1.2 Finland 0.4 0.2 0.3 0.3 0.4 0.4 0.5 0.4 0.4 0.3 0.4 : 0.2 Euro area 0.3 0.3 0.6 0.6 0.5 0.6 0.5 0.4 0.4 0.3 0.3 : 0.3 Bulgaria -0.6 -1.2 -0.5 -0.5 -0.3 0.0 0.0 -0.5 -0.5 -0.5 -0.5 : -0.5 Czech Republic 0.0 -0.2 0.1 0.3 0.3 0.5 1.0 0.4 0.7 0.3 0.3 : 0.3 Denmark 0.4 0.4 0.3 0.3 0.3 0.4 0.6 0.3 0.3 0.2 0.2 : 0.2 Estonia -2.0 -0.8 -0.3 -0.3 -0.2 -0.2 -0.1 -0.1 0.0 -0.1 0.0 : 0.1 Latvia -1.5 -0.8 -0.6 -0.5 -0.5 -0.5 -0.4 -0.5 -0.5 -0.5 -0.5 : -0.5 Lithuania -0.6 -0.7 -0.5 -0.6 -0.6 -0.5 -0.5 -0.6 -0.7 -0.6 -0.6 : -0.6 Hungary -0.1 -0.2 -0.2 -0.2 -0.2 -0.2 -0.2 -0.1 -0.1 0.0 0.0 : 0.0 Poland 0.2 0.0 -0.1 0.0 -0.1 0.0 0.0 0.0 0.0 0.0 0.0 : 0.0 Romania -0.3 -0.2 -0.7 -0.2 -0.2 -0.2 -0.2 -0.2 -0.2 -0.2 -0.2 : -0.2 Sweden 0.5 0.1 0.4 0.4 0.6 0.7 0.8 0.2 0.5 0.1 0.2 : 0.0 United Kingdom 0.3 0.3 0.5 0.7 0.6 0.6 0.6 0.3 0.7 0.4 0.7 : 0.7 EU 0.2 0.2 0.4 0.5 0.4 0.5 0.4 0.3 0.4 0.3 0.3 : 0.3 USA 1.2 1.1 0.9 0.9 0.9 1.0 0.9 0.9 0.9 0.9 0.8 : 0.8 Japan 0.3 0.2 0.1 0.1 0.0 0.0 0.1 -0.1 -0.1 -0.1 -0.1 : 0.9
TABLE 22 : Total employment (percentage change on preceding year, 1992-2011)5-year averages 2009 2010 2011
1992-96 1997-01 2002-06 2005 2006 2007 2008 IV-2009 X-2009 IV-2009 X-2009 IV-2009 X-2009 Belgium 0.1 1.4 0.7 1.4 1.2 1.6 1.9 -1.2 -0.8 -1.5 -1.4 : 0.1 Germany -1.4 0.0 -0.7 -0.6 0.2 1.5 1.4 -1.5 -0.5 -2.2 -1.9 : -0.3 Ireland 2.5 5.6 3.2 4.7 4.3 3.6 -0.8 -9.0 -7.8 -4.0 -3.9 : 0.7 Greece 0.9 0.7 1.7 0.9 2.0 1.4 0.1 -1.1 -0.9 -0.1 -0.8 : -0.2 Spain -0.3 4.1 2.8 3.2 3.3 2.8 -0.6 -5.3 -6.6 -2.7 -2.3 : -0.4 France -0.5 1.7 0.5 0.6 1.0 1.5 0.6 -2.2 -1.8 -1.2 -0.9 : 0.4 Italy -0.9 1.1 0.8 0.2 1.5 1.0 -0.1 -3.3 -2.6 -0.6 -0.4 : 0.4 Cyprus : 1.6 3.0 3.6 1.8 3.2 2.6 -0.4 -0.4 0.1 -0.1 : 0.6 Luxembourg 2.5 4.7 2.8 2.9 3.6 4.4 4.7 0.5 1.1 -0.8 -1.3 : 0.0 Malta 1.5 0.8 0.7 1.5 1.3 3.2 2.4 -0.5 -0.6 0.2 0.3 : 0.6 Netherlands 1.0 2.4 -0.2 0.0 1.6 2.3 1.2 -1.0 -0.1 -2.8 -2.1 : -0.9 Austria 0.0 0.8 0.5 1.2 1.0 1.6 1.8 -2.7 -1.5 -0.9 -0.7 : 0.3 Portugal -0.8 2.1 0.0 -0.3 0.5 0.0 0.4 -1.4 -2.3 -0.6 -0.4 : 0.1 Slovenia : 0.2 0.6 -0.1 1.5 3.0 2.9 -4.7 -2.6 -0.6 -2.0 : -0.3 Slovakia : -1.1 0.9 1.4 2.3 2.1 2.9 -1.7 -2.0 0.4 0.0 : 0.6 Finland -2.3 2.3 0.9 1.3 1.8 2.2 1.6 -2.9 -2.9 -0.8 -2.5 : 0.1 Euro area -0.6 1.4 0.6 0.7 1.4 1.7 0.6 -2.6 -2.3 -1.5 -1.3 : 0.0 Bulgaria -1.6 -0.4 2.4 2.7 3.3 2.8 3.3 -2.2 -2.0 -1.0 -1.3 : 0.8 Czech Republic : -0.8 0.5 1.1 1.8 2.7 1.5 -1.7 -2.0 -1.3 -1.4 : 0.3 Denmark 0.1 1.0 0.3 1.0 2.0 2.7 0.8 -2.2 -2.6 -2.0 -2.1 : -0.1 Estonia -5.2 -1.8 1.9 1.8 5.6 0.8 0.2 -7.3 -9.0 -3.3 -2.5 : 1.6 Latvia -7.4 0.3 2.2 1.7 4.7 3.6 0.7 -8.9 -11.9 -3.3 -5.6 : -0.2 Lithuania -2.7 -2.1 2.0 2.5 1.8 2.8 -0.5 -7.7 -8.3 -2.4 -2.4 : -0.2 Hungary : 1.3 0.3 0.4 0.9 -0.1 -1.2 -3.0 -3.0 -2.0 -0.8 : 0.9 Poland : -1.1 0.5 2.2 3.2 4.4 3.8 -2.3 -0.7 -1.4 -1.1 : 0.1 Romania -2.8 -1.8 -1.1 -1.5 0.7 0.4 0.3 -2.2 -3.3 0.6 0.8 : 0.9 Sweden -1.9 1.4 0.1 0.3 1.7 2.2 0.9 -2.4 -2.2 -2.3 -1.8 : 0.0 United Kingdom 0.0 1.2 0.9 1.0 0.9 0.7 0.7 -2.4 -2.0 -0.9 -0.9 : 1.3 EU : 0.9 0.6 0.8 1.5 1.7 0.9 -2.6 -2.3 -1.4 -1.2 : 0.3 USA 1.8 1.7 0.6 1.3 2.1 1.1 -0.5 -3.5 -3.5 -0.9 -0.5 : 0.3 Japan 0.4 -0.6 -0.2 0.4 0.4 0.4 -0.4 -3.0 -3.0 -1.2 -1.2 : -0.2
Note : See note 6 on concepts and sources where countries using full time equivalents are listed.

199
TABLE 23 : Number of unemployed (as a percentage of total labour force, 1992-2011) ¹ 22.10.20095-year averages 2009 2010 2011
1992-96 1997-01 2002-06 2005 2006 2007 2008 IV-2009 X-2009 IV-2009 X-2009 IV-2009 X-2009 Belgium 8.9 8.1 8.2 8.5 8.3 7.5 7.0 8.5 8.2 10.3 9.9 : 10.3 Germany 7.8 8.4 9.6 10.7 9.8 8.4 7.3 8.6 7.7 10.4 9.2 : 9.3 Ireland 13.9 6.3 4.6 4.4 4.5 4.6 6.0 13.3 11.7 16.0 14.0 : 13.2 Greece 8.8 10.9 9.9 9.9 8.9 8.3 7.7 9.1 9.0 9.7 10.2 : 11.0 Spain 17.8 13.1 10.1 9.2 8.5 8.3 11.3 17.3 17.9 20.5 20.0 : 20.5 France 11.0 10.0 9.1 9.3 9.2 8.4 7.8 9.6 9.5 10.7 10.2 : 10.0 Italy 10.3 10.6 7.9 7.7 6.8 6.1 6.8 8.8 7.8 9.4 8.7 : 8.7 Cyprus : 3.9 4.5 5.3 4.6 4.0 3.6 4.7 5.6 6.0 6.6 : 6.7 Luxembourg 2.7 2.4 4.1 4.6 4.6 4.2 4.9 5.9 6.2 7.0 7.3 : 7.7 Malta 5.2 6.8 7.4 7.2 7.1 6.4 5.9 7.1 7.1 7.6 7.4 : 7.3 Netherlands 6.2 3.4 3.9 4.7 3.9 3.2 2.8 3.9 3.4 6.2 5.4 : 6.0 Austria 3.9 4.0 4.7 5.2 4.8 4.4 3.8 6.0 5.5 7.1 6.0 : 5.7 Portugal 6.2 4.9 6.7 7.7 7.8 8.1 7.7 9.1 9.0 9.8 9.0 : 8.9 Slovenia : 6.9 6.4 6.5 6.0 4.9 4.4 6.6 6.7 7.4 8.3 : 8.5 Slovakia : 15.8 16.8 16.3 13.4 11.1 9.5 12.0 12.3 12.1 12.8 : 12.6 Finland 14.9 10.6 8.6 8.4 7.7 6.9 6.4 8.9 8.5 9.3 10.2 : 9.9 Euro area 10.2 9.3 8.7 9.0 8.3 7.5 7.5 9.9 9.5 11.5 10.7 : 10.9 Bulgaria 14.1 16.4 12.6 10.1 9.0 6.9 5.6 7.3 7.0 7.8 8.0 : 7.2 Czech Republic : 7.3 7.7 7.9 7.2 5.3 4.4 6.1 6.9 7.4 7.9 : 7.4 Denmark 7.8 4.8 4.8 4.8 3.9 3.8 3.3 5.2 4.5 6.6 5.8 : 5.6 Estonia : 11.1 8.8 7.9 5.9 4.7 5.5 11.3 13.6 14.1 15.2 : 14.2 Latvia 13.8 14.0 9.8 8.9 6.8 6.0 7.5 15.7 16.9 16.0 19.9 : 18.7 Lithuania 5.0 13.3 10.3 8.3 5.6 4.3 5.8 13.8 14.5 15.9 17.6 : 18.2 Hungary 10.3 7.3 6.5 7.2 7.5 7.4 7.8 9.5 10.5 11.2 11.3 : 10.5 Poland 13.4 13.8 18.1 17.8 13.9 9.6 7.1 9.9 8.4 12.1 9.9 : 10.0 Romania 5.8 6.4 7.6 7.2 7.3 6.4 5.8 8.0 9.0 7.7 8.7 : 8.5 Sweden 8.5 7.1 6.2 7.4 7.0 6.1 6.2 8.4 8.5 10.4 10.2 : 10.1 United Kingdom 9.1 5.8 5.0 4.8 5.4 5.3 5.6 8.2 7.8 9.4 8.7 : 8.0 EU 9.7 8.8 8.8 8.9 8.2 7.1 7.0 9.4 9.1 10.9 10.3 : 10.2 USA 6.3 4.5 5.4 5.1 4.6 4.6 5.8 8.9 9.2 10.2 10.1 : 10.2 Japan 2.8 4.4 4.8 4.4 4.1 3.9 4.0 5.8 5.8 6.3 6.3 : 7.0
¹ Series following Eurostat definition, based on the labour force survey.
TABLE 24 : Compensation of employees per head (percentage change on preceding year, 1992-2011)5-year averages 2009 2010 2011
1992-96 1997-01 2002-06 2005 2006 2007 2008 IV-2009 X-2009 IV-2009 X-2009 IV-2009 X-2009 Belgium 3.5 2.8 2.5 1.8 3.3 3.5 3.0 2.1 0.7 1.8 1.7 : 2.0 Germany 5.4 2.3 1.6 0.5 1.5 1.1 2.0 1.0 -0.2 0.9 1.3 : 1.6 Ireland 4.5 5.9 5.4 6.4 4.6 6.0 5.5 -4.1 -1.6 -2.4 -1.8 : 1.1 Greece 10.8 7.0 5.8 4.3 3.1 6.6 5.9 4.4 2.3 1.9 1.4 : 1.8 Spain 6.0 2.5 3.5 3.7 4.0 4.5 6.1 3.4 3.7 2.7 2.2 : 2.5 France 2.8 2.1 3.1 3.1 3.2 2.5 2.7 1.3 1.2 1.5 1.5 : 1.5 Italy 4.8 2.1 3.1 3.2 2.7 2.2 3.3 2.1 1.7 1.5 1.6 : 1.9 Cyprus : 4.6 3.8 1.8 3.0 2.1 4.0 5.4 2.0 4.3 1.8 : 2.2 Luxembourg 3.9 3.2 3.1 4.6 3.3 3.6 2.0 1.7 1.2 1.5 1.8 : 2.0 Malta 7.8 4.5 2.9 2.2 3.8 1.5 3.4 2.9 2.5 2.7 2.1 : 2.2 Netherlands 2.9 4.1 3.4 1.7 2.4 3.4 3.8 3.5 2.6 2.4 2.5 : 1.7 Austria 3.9 1.9 2.3 2.5 3.4 3.0 3.1 2.8 3.0 1.4 2.0 : 2.6 Portugal 9.4 5.4 3.3 4.7 2.1 3.4 3.1 -0.6 4.7 2.1 2.0 : 2.0 Slovenia : 10.4 7.1 5.5 5.3 6.5 6.7 2.3 2.9 3.1 1.7 : 3.1 Slovakia : 10.3 8.5 9.7 7.6 8.8 8.7 4.9 3.6 5.5 3.9 : 4.3 Finland 2.5 3.3 3.0 3.8 2.9 3.4 5.3 3.8 3.4 3.6 2.7 : 1.9 Euro area 4.6 2.5 2.6 2.2 2.6 2.6 3.4 1.9 1.6 1.5 1.6 : 1.8 Bulgaria : 73.8 5.8 5.9 7.4 17.9 19.3 6.5 7.8 4.2 2.5 : 5.1 Czech Republic : 7.8 6.6 4.9 6.0 6.4 6.0 3.1 0.5 3.4 1.6 : 3.3 Denmark 3.2 3.8 3.6 3.6 3.6 3.1 4.9 3.1 3.4 2.5 3.0 : 2.9 Estonia : 13.5 11.7 11.1 14.1 24.8 10.1 0.7 -4.5 -3.5 -2.7 : 1.4 Latvia : 7.3 15.4 25.3 23.6 34.8 16.7 -9.0 -12.0 -3.0 -8.0 : 1.0 Lithuania : 9.1 10.5 11.5 16.7 13.9 12.9 -10.3 -6.8 -8.8 -5.7 : 0.9 Hungary : 14.0 9.2 7.1 4.5 6.8 6.6 1.4 -1.4 5.8 0.0 : 3.9 Poland 37.8 13.8 1.9 1.7 1.8 4.9 8.1 3.4 4.5 2.1 1.5 : 3.1 Romania 117.4 70.5 21.0 28.6 12.4 22.0 21.7 8.5 4.8 7.5 5.5 : 6.0 Sweden 4.8 4.0 3.1 3.1 2.1 5.1 1.6 2.1 2.3 2.0 2.1 : 2.3 United Kingdom 3.6 5.1 3.9 3.3 4.2 4.9 2.3 0.9 1.2 1.5 1.2 : 2.3 EU : 4.1 2.9 2.6 2.7 3.2 3.3 1.9 1.7 1.6 1.5 : 2.0 USA 3.0 4.3 3.9 3.5 4.1 3.7 2.6 3.5 -0.2 0.4 0.6 : 0.7 Japan 1.2 0.0 -0.8 -0.1 0.4 -0.4 0.5 -0.8 -0.8 0.4 0.5 : 0.9
Note : See note 6 on concepts and sources where countries using full time equivalents are listed.

200
TABLE 25 : Real compensation of employees per head ¹ (percentage change on preceding year, 1992-2011) 22.10.20095-year averages 2009 2010 2011
1992-96 1997-01 2002-06 2005 2006 2007 2008 IV-2009 X-2009 IV-2009 X-2009 IV-2009 X-2009 Belgium 1.7 1.1 0.3 -0.9 0.3 0.6 -0.7 1.7 0.7 0.6 0.4 : 0.4 Germany 2.8 1.3 0.3 -0.8 0.5 -0.7 -0.1 0.5 0.0 0.2 0.7 : 0.9 Ireland 1.9 2.0 2.3 4.5 2.1 6.1 2.3 -2.6 0.2 -2.7 -1.0 : -0.1 Greece -0.7 2.4 2.6 1.0 -0.2 3.5 1.7 2.4 1.1 -0.2 0.0 : -0.1 Spain 1.0 -0.3 0.2 0.2 0.4 1.2 2.3 3.2 4.1 1.0 1.4 : 0.7 France 1.1 1.2 1.4 1.3 1.1 0.5 -0.1 1.0 1.1 0.6 0.4 : -0.1 Italy -0.3 -0.2 0.5 0.9 0.0 -0.1 0.0 1.4 1.4 -0.3 -0.2 : -0.1 Cyprus : 2.2 1.2 -0.8 0.7 -0.7 -0.7 3.9 1.0 2.0 -1.5 : -0.6 Luxembourg 1.0 0.9 1.0 1.7 1.1 1.6 -1.6 1.6 0.9 -0.4 0.1 : 0.3 Malta : 2.5 1.0 -0.3 1.4 -0.1 0.5 1.9 0.7 0.9 0.5 : -0.1 Netherlands 0.5 1.2 1.3 -0.4 0.3 1.8 1.6 2.2 1.5 1.3 1.3 : 0.3 Austria 1.4 0.6 0.5 -0.1 1.3 0.3 0.5 2.4 2.4 0.3 0.7 : 1.0 Portugal 3.7 2.5 0.4 1.9 -1.0 0.6 0.5 -0.4 5.9 0.6 0.8 : 0.4 Slovenia : 2.8 2.9 3.4 3.0 2.2 1.2 1.6 2.3 1.1 0.0 : 1.1 Slovakia : 2.7 3.5 6.9 2.6 6.0 4.2 2.5 2.0 2.5 1.5 : 1.5 Finland 0.6 0.8 2.0 3.2 1.3 1.1 1.9 2.3 2.2 2.2 1.4 : 0.7 Euro area 1.4 0.7 0.5 0.1 0.4 0.4 0.5 1.4 1.5 0.3 0.5 : 0.4 Bulgaria : 2.2 1.9 0.7 1.6 10.5 7.4 3.4 6.3 1.2 1.2 : 3.0 Czech Republic : 2.4 5.3 4.0 4.6 3.4 1.0 2.1 0.1 1.8 0.2 : 1.7 Denmark 1.5 1.7 2.1 2.1 1.7 1.3 1.7 2.1 2.1 1.1 1.3 : 1.2 Estonia : 6.2 8.3 7.3 8.4 16.2 0.8 0.0 -4.7 -4.1 -3.2 : -0.7 Latvia : 3.1 9.5 15.2 16.6 22.3 1.0 -10.8 -14.6 -2.0 -4.5 : 2.2 Lithuania : 6.2 9.6 9.7 12.1 7.0 2.9 -12.9 -9.9 -7.8 -4.6 : 0.4 Hungary : 2.0 5.1 3.2 1.1 0.5 0.9 -3.2 -5.4 2.2 -4.0 : 1.3 Poland 4.7 4.4 -0.1 -0.4 0.6 2.4 3.8 0.8 0.7 0.2 -0.5 : 1.0 Romania 0.0 7.2 8.0 20.3 7.2 16.5 11.7 2.2 -0.9 3.4 1.8 : 2.5 Sweden 1.7 2.6 1.7 1.9 1.1 3.9 -1.2 0.8 0.4 1.1 0.2 : 0.3 United Kingdom 0.2 3.2 1.8 0.9 1.5 1.9 -0.6 -0.1 -0.2 0.3 -0.2 : 0.7 EU : 1.5 0.8 0.5 0.4 0.8 0.1 1.1 1.1 0.3 0.3 : 0.4 USA 0.7 2.5 1.6 0.5 1.3 1.0 -0.8 4.0 0.0 0.4 0.3 : 0.7 Japan 0.6 0.3 0.0 0.7 0.6 -0.1 0.1 0.6 0.8 1.0 1.4 : 0.9
¹ Deflated by the price deflator of private consumption.Note : See note 6 on concepts and sources where countries using full time equivalents are listed.
TABLE 26 : Labour productivity (real GDP per occupied person) (percentage change on preceding year, 1992-2011)5-year averages 2009 2010 2011
1992-96 1997-01 2002-06 2005 2006 2007 2008 IV-2009 X-2009 IV-2009 X-2009 IV-2009 X-2009 Belgium 1.4 1.3 1.3 0.4 1.6 1.3 -0.8 -2.3 -2.1 1.2 2.0 : 1.4 Germany 2.8 2.0 1.7 1.3 2.9 0.9 -0.1 -3.9 -4.6 2.5 3.1 : 2.0 Ireland 3.3 3.3 2.2 1.4 1.0 2.4 -2.2 -0.1 0.3 1.5 2.6 : 2.0 Greece 0.2 3.1 2.4 1.3 2.4 3.1 1.9 0.3 -0.2 0.2 0.5 : 0.9 Spain 1.8 0.2 0.5 0.4 0.7 0.7 1.5 2.3 3.1 1.8 1.5 : 1.4 France 1.6 1.2 1.2 1.3 1.2 0.8 -0.1 -0.8 -0.4 1.1 2.1 : 1.1 Italy 2.2 0.9 0.1 0.5 0.5 0.6 -0.9 -1.1 -2.1 0.7 1.1 : 1.0 Cyprus : 2.6 0.3 0.3 2.3 1.2 1.0 0.7 -0.3 0.6 0.2 : 0.7 Luxembourg 0.1 1.5 1.4 2.5 1.9 2.0 -4.5 -3.5 -4.7 0.9 2.4 : 1.8 Malta 3.5 2.6 1.3 2.5 2.4 0.5 -0.3 -0.4 -1.6 0.0 0.4 : 1.0 Netherlands 1.4 1.4 1.8 2.1 1.7 1.3 0.8 -2.5 -4.4 2.5 2.4 : 2.5 Austria 1.8 1.8 1.6 1.2 2.4 2.0 0.2 -1.3 -2.3 0.8 1.8 : 1.2 Portugal 2.7 1.6 0.7 1.2 0.9 1.9 -0.5 -2.3 -0.6 -0.2 0.8 : 0.9 Slovenia : 4.0 3.7 4.6 4.2 3.7 0.6 1.3 -4.9 1.4 3.4 : 2.3 Slovakia : 3.8 5.0 5.1 6.1 8.1 3.4 -0.9 -3.9 0.2 1.9 : 2.0 Finland 3.7 2.3 2.0 1.4 3.1 2.0 -0.6 -1.8 -4.1 1.0 3.4 : 1.5 Euro area 2.1 1.5 1.2 1.1 1.7 1.1 0.1 -1.4 -1.8 1.5 2.1 : 1.5 Bulgaria -1.2 2.4 3.5 3.5 2.9 3.3 2.7 0.6 -3.9 0.9 0.3 : 2.2 Czech Republic : 2.0 4.1 5.2 4.9 3.3 0.9 -1.1 -2.8 1.6 2.2 : 2.0 Denmark 2.5 1.4 1.5 1.4 1.3 -1.0 -2.0 -1.0 -1.9 2.3 3.7 : 1.9 Estonia : 8.5 6.3 7.5 4.1 6.4 -3.7 -3.2 -5.1 2.6 2.4 : 2.6 Latvia -1.5 6.0 6.7 8.7 7.2 6.2 -5.2 -4.6 -6.9 0.1 1.7 : 2.2 Lithuania -5.8 6.9 5.9 5.2 5.9 6.9 3.3 -3.6 -10.8 -2.4 -1.5 : 2.7 Hungary : 3.2 3.9 3.1 3.0 1.1 1.9 -3.5 -3.6 1.8 0.3 : 2.1 Poland : 5.5 3.6 1.4 2.9 2.3 1.2 1.0 1.9 2.3 2.9 : 3.1 Romania 4.3 0.9 7.3 5.8 7.1 5.9 5.9 -1.9 -4.9 -0.6 -0.3 : 1.7 Sweden 3.1 1.8 3.0 3.0 2.5 0.4 -1.1 -1.6 -2.4 3.1 3.2 : 2.1 United Kingdom 2.5 2.1 1.6 1.1 2.0 1.9 -0.2 -1.4 -2.6 1.1 1.8 : 0.5 EU : 2.0 2.0 1.6 2.2 1.6 0.4 -1.3 -2.0 1.4 2.0 : 1.5 USA 1.5 2.0 2.1 1.7 0.6 1.0 0.9 0.6 1.1 1.8 2.8 : 1.6 Japan 0.9 1.1 1.9 1.5 1.6 2.0 -0.3 -2.4 -3.0 1.3 2.3 : 0.6
Note : See note 6 on concepts and sources where countries using full time equivalents are listed.

201
TABLE 27 : Unit labour costs, whole economy ¹ (percentage change on preceding year, 1992-2011) 22.10.20095-year averages 2009 2010 2011
1992-96 1997-01 2002-06 2005 2006 2007 2008 IV-2009 X-2009 IV-2009 X-2009 IV-2009 X-2009 Belgium 2.0 1.5 1.2 1.4 1.8 2.2 3.9 4.5 2.8 0.6 -0.2 : 0.6 Germany 2.5 0.3 -0.1 -0.8 -1.4 0.2 2.2 5.1 4.6 -1.5 -1.8 : -0.4 Ireland 1.2 2.5 3.2 4.9 3.6 3.6 7.9 -4.0 -1.9 -3.9 -4.2 : -0.9 Greece 10.6 3.7 3.3 3.0 0.7 3.5 3.9 4.1 2.5 1.7 0.9 : 0.9 Spain 4.1 2.3 3.0 3.3 3.3 3.8 4.6 1.1 0.5 0.9 0.6 : 1.1 France 1.1 0.8 1.9 1.8 2.0 1.8 2.8 2.0 1.6 0.4 -0.6 : 0.4 Italy 2.6 1.2 3.0 2.7 2.2 1.5 4.2 3.3 4.0 0.8 0.5 : 0.9 Cyprus : 1.9 3.5 1.4 0.6 0.9 3.0 4.7 2.3 3.7 1.6 : 1.5 Luxembourg 3.8 1.7 1.7 2.1 1.4 1.6 6.8 5.4 6.2 0.6 -0.6 : 0.2 Malta 4.2 1.9 1.6 -0.3 1.3 1.0 3.8 3.4 4.2 2.7 1.7 : 1.2 Netherlands 1.5 2.7 1.6 -0.4 0.7 2.1 2.9 6.2 7.4 0.0 0.1 : -0.8 Austria 2.0 0.1 0.6 1.2 1.0 1.0 2.9 4.1 5.4 0.6 0.2 : 1.3 Portugal 6.5 3.8 2.5 3.4 1.3 1.4 3.6 1.7 5.4 2.3 1.2 : 1.0 Slovenia : 6.2 3.3 0.9 1.0 2.6 6.0 1.0 8.2 1.7 -1.6 : 0.8 Slovakia : 6.3 3.4 4.3 1.5 0.6 5.2 5.9 7.8 5.2 2.0 : 2.3 Finland -1.1 1.0 0.9 2.3 -0.2 1.5 5.9 5.7 7.8 2.5 -0.7 : 0.5 Euro area 2.5 1.1 1.6 1.3 1.1 1.6 3.4 3.4 3.4 0.1 -0.5 : 0.3 Bulgaria : 69.7 2.2 2.4 4.4 14.2 16.2 5.9 12.2 3.3 2.2 : 2.8 Czech Republic : 5.7 2.3 -0.3 1.1 3.0 5.1 4.2 3.4 1.8 -0.7 : 1.3 Denmark 0.6 2.3 2.1 2.2 2.2 4.2 7.1 4.1 5.4 0.2 -0.7 : 1.0 Estonia : 4.6 5.0 3.3 9.6 17.3 14.3 4.1 0.7 -5.9 -5.0 : -1.2 Latvia : 1.3 8.2 15.2 15.3 27.0 23.2 -4.6 -5.4 -3.1 -9.5 : -1.2 Lithuania : 2.1 4.4 6.0 10.1 6.5 9.3 -7.0 4.5 -6.6 -4.3 : -1.8 Hungary : 10.4 5.1 3.8 1.4 5.6 4.6 5.1 2.3 4.0 -0.3 : 1.7 Poland : 7.9 -1.7 0.3 -1.1 2.6 6.9 2.4 2.6 -0.2 -1.4 : 0.0 Romania 108.4 68.9 12.8 21.6 4.9 15.2 14.9 10.5 10.2 8.1 5.8 : 4.3 Sweden 1.6 2.1 0.0 0.1 -0.4 4.7 2.6 3.7 4.9 -1.1 -1.1 : 0.2 United Kingdom 1.1 2.9 2.2 2.1 2.2 3.0 2.5 2.4 4.0 0.4 -0.6 : 1.7 EU : 2.1 1.7 1.6 1.3 2.2 3.6 3.3 3.6 0.2 -0.5 : 0.6 USA 1.5 2.3 1.8 1.8 3.5 2.7 1.7 2.9 -1.3 -1.5 -2.1 : -0.9 Japan 0.3 -1.1 -2.6 -1.6 -1.2 -2.3 0.8 1.7 2.2 -0.9 -1.8 : 0.3
¹ Compensation of employees per head divided by labour productivity per head, defined as GDP in volume divided by total employment.Note : See note 6 on concepts and sources where countries using full time equivalents are listed.
TABLE 28 : Real unit labour costs ¹ (percentage change on preceding year, 1992-2011)5-year averages 2009 2010 2011
1992-96 1997-01 2002-06 2005 2006 2007 2008 IV-2009 X-2009 IV-2009 X-2009 IV-2009 X-2009 Belgium -0.2 0.1 -1.0 -0.9 -0.5 -0.1 2.0 2.2 1.5 -0.7 -1.6 : -1.0 Germany -0.2 -0.1 -1.0 -1.4 -1.9 -1.7 0.7 3.8 3.6 -2.2 -2.4 : -0.9 Ireland -1.7 -2.5 0.1 2.4 0.1 2.3 9.2 -2.9 0.5 -3.6 -3.4 : -2.0 Greece -0.8 -0.5 0.1 0.1 -2.3 0.5 0.3 2.0 0.8 -0.9 -0.5 : -1.3 Spain -0.6 -0.7 -1.2 -0.9 -0.8 0.5 2.0 0.0 0.4 -0.9 0.1 : -0.3 France -0.4 -0.2 -0.1 -0.3 -0.3 -0.7 0.3 0.6 -0.3 -0.7 -1.8 : -1.3 Italy -1.6 -1.2 0.4 0.6 0.3 -0.8 1.4 1.3 1.6 -0.8 -1.3 : -0.9 Cyprus : -1.1 0.6 -0.9 -2.3 -2.4 -1.8 -0.6 -0.2 1.2 -1.6 : -1.5 Luxembourg 0.1 0.7 -2.5 -2.4 -5.0 -1.4 1.7 3.4 7.3 -1.0 -3.7 : -2.5 Malta 1.2 -0.2 -1.1 -2.7 -1.7 -1.7 1.5 1.0 2.2 0.8 -0.6 : -1.1 Netherlands -0.4 -0.4 -0.6 -2.7 -1.1 0.5 0.2 4.5 6.2 -1.1 -0.8 : -2.2 Austria -0.3 -0.6 -0.9 -0.9 -0.7 -1.1 0.8 2.7 3.8 -0.4 -0.7 : -0.3 Portugal 0.6 0.2 -0.4 0.8 -1.5 -1.5 1.5 -0.5 4.9 0.7 0.4 : -0.6 Slovenia : -1.0 -0.8 -0.7 -1.0 -1.5 2.1 -0.9 4.9 -0.4 -2.7 : -1.1 Slovakia : -0.3 -0.7 1.9 -1.4 -0.5 2.2 2.2 3.1 1.5 -1.0 : -0.6 Finland -2.8 -1.3 0.3 1.9 -1.6 -1.7 4.1 3.9 5.6 0.9 -2.1 : -1.1 Euro area -0.6 -0.5 -0.6 -0.8 -1.0 -0.8 1.1 1.9 2.1 -1.1 -1.5 : -1.0 Bulgaria : -1.7 -2.1 -1.3 -3.8 5.9 4.3 0.9 7.9 0.2 0.3 : 0.2 Czech Republic : 0.0 0.5 0.0 0.0 -0.4 3.2 2.6 2.1 0.3 -2.0 : -0.4 Denmark -0.8 0.3 -0.1 -0.7 0.3 2.2 3.0 2.6 4.5 -1.2 -1.8 : -1.2 Estonia : -2.2 0.2 -2.1 1.9 6.4 7.2 4.1 0.9 -5.1 -2.0 : -3.1 Latvia : -2.8 1.3 4.6 4.9 5.6 6.8 -2.4 -3.4 0.5 -4.8 : 0.1 Lithuania : -0.7 1.4 -0.6 3.4 -1.8 -0.3 -9.1 5.8 -5.4 -2.9 : -2.1 Hungary : -1.3 0.3 1.7 -2.4 -0.3 0.8 0.4 -1.5 0.7 -2.8 : -0.1 Poland : -0.4 -3.8 -2.3 -2.5 -1.3 3.8 0.5 -1.1 -1.7 -2.8 : -2.6 Romania -3.1 4.0 -3.4 8.4 -5.1 1.5 0.7 0.7 2.8 1.4 0.5 : -0.7 Sweden -0.6 0.7 -1.3 -0.8 -2.1 1.7 -0.5 2.1 1.5 -2.0 -3.3 : -1.8 United Kingdom -1.7 0.8 -0.5 0.1 -0.6 0.1 -0.4 1.6 2.9 -1.0 -2.2 : -0.3 EU : -0.3 -0.8 -0.6 -1.2 -0.6 0.8 1.8 2.2 -1.1 -1.6 : -1.0 USA -0.6 0.5 -0.8 -1.5 0.2 -0.2 -0.5 1.3 -2.4 -1.5 -2.1 : -0.8 Japan 0.1 -0.3 -1.4 -0.4 -0.3 -1.7 1.7 0.3 1.5 -0.5 -0.8 : 0.8
¹ Nominal unit labour costs divided by GDP price deflator.Note : See note 6 on concepts and sources where countries using full time equivalents are listed.

202
TABLE 29 : Nominal bilateral exchange rates against Ecu/euro (1992-2011) 22.10.20095-year averages 2009 2010 2011
1992-96 1997-01 2002-06 2005 2006 2007 2008 IV-2009 X-2009 IV-2009 X-2009 IV-2009 X-2009 Belgium 39.91 40.43 : : : : : : : : : : : Germany 1.93 1.96 : : : : : : : : : : : Ireland 0.79 0.78 : : : : : : : : : : : Greece 282.43 328.65 : : : : : : : : : : : Spain 152.86 166.45 : : : : : : : : : : : France 6.62 6.58 : : : : : : : : : : : Italy 1888.18 1936.35 : : : : : : : : : : : Cyprus 0.59 0.58 0.58 0.58 0.58 0.58 : : : : : : : Luxembourg 39.91 40.43 : : : : : : : : : : : Malta 0.45 0.42 0.42 0.43 0.43 0.43 : : : : : : : Netherlands 2.17 2.21 : : : : : : : : : : : Austria 13.60 13.79 : : : : : : : : : : : Portugal 190.37 200.35 : : : : : : : : : : : Slovenia 143.42 197.20 235.62 239.57 239.60 : : : : : : : : Slovakia : 41.54 40.01 38.60 37.23 33.77 31.24 : : : : : : Finland 6.05 5.94 : : : : : : : : : : : Euro area : : : : : : : : : : : : : Bulgaria 0.09 1.95 1.95 1.96 1.96 1.96 1.96 1.96 1.96 1.96 1.96 : 1.96 Czech Republic 34.86 35.71 30.53 29.78 28.34 27.77 24.95 26.92 26.40 26.69 25.79 : 25.79 Denmark 7.53 7.46 7.44 7.45 7.46 7.45 7.46 7.45 7.45 7.45 7.44 : 7.44 Estonia 15.36 15.68 15.65 15.65 15.65 15.65 15.65 15.65 15.65 15.65 15.65 : 15.65 Latvia 0.75 0.61 0.66 0.70 0.70 0.70 0.70 0.71 0.71 0.71 0.71 : 0.71 Lithuania 4.45 4.11 3.45 3.45 3.45 3.45 3.45 3.45 3.45 3.45 3.45 : 3.45 Hungary 152.74 244.33 252.11 248.05 264.26 251.35 251.51 294.06 279.71 293.95 268.36 : 268.36 Poland 2.88 3.91 4.14 4.02 3.90 3.78 3.51 4.43 4.34 4.40 4.22 : 4.22 Romania 0.20 1.61 3.62 3.62 3.53 3.34 3.68 4.20 4.24 4.18 4.28 : 4.28 Sweden 8.73 8.81 9.19 9.28 9.25 9.25 9.62 10.88 10.61 10.87 10.33 : 10.33 United Kingdom 0.79 0.65 0.67 0.68 0.68 0.68 0.80 0.90 0.90 0.90 0.92 : 0.92 EU : : : : : : : : : : : : : USA 1.25 1.03 1.16 1.24 1.26 1.37 1.47 1.32 1.39 1.33 1.48 : 1.48 Japan 135.36 122.59 133.27 136.85 146.02 161.25 152.45 129.82 130.20 132.52 132.82 : 132.82
TABLE 30 : Nominal effective exchange rates to rest of a group ¹ of industrialised countries (percentage change on preceding year, 1992-2011)5-year averages 2009 2010 2011
1997-01 2002-06 2005 2006 2007 2008 IV-2009 X-2009 IV-2009 X-2009 IV-2009 X-2009 Belgium -1.1 1.4 -0.3 0.4 1.2 2.0 0.8 1.1 0.0 0.7 : 0.0 Germany -1.0 1.8 -0.6 0.5 1.8 1.9 0.8 1.2 0.1 0.8 : 0.0 Ireland -1.8 2.4 -0.1 0.6 2.6 4.0 -0.1 0.8 0.1 1.7 : 0.0 Greece 0.3 1.7 -0.8 0.6 0.9 2.2 1.7 2.0 0.0 0.6 : 0.0 Spain -1.1 1.4 -0.4 0.4 1.3 2.1 1.0 1.3 0.0 0.7 : 0.0 France -1.0 1.7 -0.3 0.6 1.6 2.2 0.5 0.9 0.1 0.9 : 0.0 Italy 0.1 1.9 -0.6 0.6 1.6 2.0 0.5 0.9 0.1 0.8 : 0.0 Cyprus 5.0 1.6 0.7 0.6 -0.3 2.6 2.1 2.1 0.0 0.7 : 0.0 Luxembourg -1.1 1.4 -0.3 0.4 1.2 2.0 0.8 1.1 0.0 0.7 : 0.0 Malta 0.4 1.3 -0.4 1.0 3.1 2.2 -2.0 -1.2 0.3 1.5 : 0.0 Netherlands -1.0 1.2 -0.3 0.3 1.1 2.1 1.3 1.5 0.0 0.6 : 0.0 Austria -0.1 1.1 -0.7 0.3 1.0 1.1 0.9 1.1 0.0 0.4 : 0.0 Portugal -1.1 1.1 -0.2 0.3 1.1 1.9 0.5 0.9 0.0 0.7 : 0.0 Slovenia -3.9 -1.1 -1.1 0.2 0.3 0.6 1.8 1.8 0.0 0.1 : 0.0 Slovakia -1.3 3.6 2.4 3.7 10.4 8.5 6.6 6.4 -0.1 0.0 : 0.0 Finland -1.0 1.7 -0.4 0.5 1.6 2.1 1.5 1.6 0.1 0.5 : 0.0 Euro area -1.7 3.6 -1.0 1.2 3.5 4.4 2.0 2.7 0.1 1.6 : 0.0 Bulgaria -32.2 1.7 -1.2 0.8 0.6 1.9 2.1 2.4 0.0 0.5 : 0.0 Czech Republic 0.8 4.5 6.2 5.2 2.3 12.2 -5.4 -3.6 0.8 2.6 : 0.0 Denmark -1.0 1.4 -0.5 0.3 1.4 2.3 2.2 2.2 0.0 0.3 : 0.0 Estonia -0.4 1.0 -0.1 0.2 1.1 1.5 1.8 1.8 0.0 0.2 : 0.0 Latvia 4.4 -3.4 -5.0 0.0 0.0 1.1 2.0 2.1 -0.1 -0.3 : 0.0 Lithuania 8.3 2.1 -0.6 0.1 0.8 1.2 2.6 2.5 0.0 0.2 : 0.0 Hungary -4.7 0.3 0.7 -6.1 5.4 0.9 -12.9 -8.3 0.0 4.6 : 0.0 Poland -1.1 -0.5 12.1 3.5 3.4 9.2 -19.5 -18.0 0.5 3.1 : 0.0 Romania -30.1 -4.7 11.2 3.6 6.2 -8.1 -10.7 -11.5 0.5 -0.6 : 0.0 Sweden -2.5 1.8 -2.4 0.8 1.7 -1.6 -11.2 -8.6 0.2 3.4 : 0.0 United Kingdom 4.8 0.2 -1.2 1.0 1.9 -12.9 -13.1 -11.9 0.5 -2.2 : 0.0 EU -0.8 5.2 -0.8 2.8 6.6 1.5 -7.5 -5.4 0.5 2.3 : 0.0 USA 5.0 -3.9 -2.0 -0.8 -5.0 -4.2 12.3 6.3 -0.4 -5.9 : 0.0 Japan 1.5 -2.4 -2.4 -5.8 -5.9 11.4 14.1 15.7 -2.0 0.0 : 0.0
¹ 35 countries : EUR26 (excl. LU), TR, CH, NO, US, CA, JP, AU, MX and NZ.

203
TABLE 31 : Relative unit labour costs, to rest of a group ¹ of industrialised countries (nat. curr.) (percentage change on preceding year, 1992-2011) 22.10.20095-year averages 2009 2010 2011
1997-01 2002-06 2005 2006 2007 2008 IV-2009 X-2009 IV-2009 X-2009 IV-2009 X-2009 Belgium -0.7 -0.4 0.2 0.4 0.2 0.6 1.1 -0.3 0.7 0.5 : : Germany -2.8 -1.9 -2.6 -3.3 -2.3 -1.5 2.0 1.7 -1.8 -1.3 : : Ireland 0.3 1.6 3.5 1.8 1.5 4.9 -7.1 -4.4 -3.7 -3.4 : : Greece -1.8 1.0 1.0 -1.1 0.5 -0.5 0.6 -1.1 1.2 1.0 : : Spain -0.3 1.1 1.7 1.7 1.7 1.2 -2.0 -2.7 0.7 1.2 : : France -1.7 0.3 0.3 0.5 -0.3 -0.6 -1.3 -1.5 0.5 0.1 : : Italy -2.0 1.3 1.1 0.6 -0.7 0.7 0.0 1.1 0.8 1.3 : : Cyprus -6.4 1.5 -0.4 -1.0 -1.5 -0.5 1.3 -0.9 3.3 1.9 : : Luxembourg : : : : : : : : : : : : Malta -0.1 0.2 -1.5 -0.3 -0.5 1.0 0.2 1.7 2.9 2.8 : : Netherlands 0.6 0.2 -1.6 -0.5 0.1 -0.4 2.8 4.1 0.2 1.0 : : Austria -2.5 -0.8 0.0 0.0 -1.0 -0.6 0.4 2.0 0.7 1.0 : : Portugal 1.7 0.7 1.7 -0.6 -0.9 0.1 -1.2 2.9 2.2 1.7 : : Slovenia 3.2 1.7 -0.5 -0.1 0.5 2.2 -2.6 4.4 1.6 -1.1 : : Slovakia 2.9 2.0 3.4 0.7 -1.5 1.4 2.0 3.9 5.2 2.7 : : Finland -1.7 -0.5 1.0 -1.8 -1.1 2.2 2.3 4.6 2.8 0.2 : : Euro area -3.7 -0.5 -0.9 -1.6 -1.7 -0.5 1.0 1.8 -0.3 0.1 : : Bulgaria 58.3 -0.6 0.3 2.5 10.8 11.2 2.4 8.5 2.7 2.1 : : Czech Republic 2.9 1.1 -1.3 0.4 1.0 1.5 0.4 -0.3 1.8 0.1 : : Denmark 0.1 0.8 1.0 0.9 1.8 3.5 0.6 2.0 0.4 0.1 : : Estonia 1.6 3.3 1.2 7.6 13.0 8.9 1.0 -2.7 -5.7 -3.7 : : Latvia -1.8 6.5 13.5 13.1 23.1 17.7 -7.2 -8.9 -2.4 -8.5 : : Lithuania -1.9 2.4 3.8 7.7 2.2 3.8 -9.8 1.6 -6.2 -2.9 : : Hungary 7.1 3.6 2.5 0.4 3.3 0.7 1.2 -1.5 3.9 0.2 : : Poland 5.2 -3.2 -0.9 -2.3 0.3 3.1 -1.2 -1.1 -0.1 -0.7 : : Romania 61.7 10.3 19.6 3.2 12.4 10.4 6.9 6.4 7.8 6.0 : : Sweden -0.6 -1.6 -1.5 -2.3 2.1 -1.2 0.2 1.6 -1.2 -0.5 : : United Kingdom 0.5 0.6 0.7 0.4 0.9 -0.8 -0.7 1.5 0.8 0.4 : : EU -3.2 -0.4 -0.4 -1.9 -0.2 0.3 1.0 2.9 0.2 0.1 : : USA -0.7 0.2 0.5 1.2 0.7 -1.8 -0.8 -5.2 -1.9 -1.6 : : Japan -3.4 -4.4 -3.3 -3.6 -4.4 -2.1 -1.8 0.6 -0.6 -0.7 : :
¹ 35 countries : EUR26 (excl. LU), TR, CH, NO, US, CA, JP, AU, MX and NZ.Note : See note 6 on concepts and sources where countries using full time equivalents are listed.
TABLE 32 : Real effective exchange rate : ulc relative to rest of a group ¹ of industrialised countries (usd) (% change on preceding year, 1992-2011)5-year averages 2009 2010 2011
1997-01 2002-06 2005 2006 2007 2008 IV-2009 X-2009 IV-2009 X-2009 IV-2009 X-2009 Belgium -1.9 1.0 -0.1 0.8 1.4 2.7 1.9 0.7 0.7 1.2 : : Germany -3.9 -0.1 -3.2 -2.8 -0.5 0.4 2.8 2.9 -1.7 -0.4 : : Ireland -1.5 4.0 3.4 2.4 4.1 9.1 -7.2 -3.6 -3.5 -1.7 : : Greece -1.6 2.7 0.2 -0.5 1.3 1.7 2.3 0.9 1.2 1.6 : : Spain -1.3 2.5 1.3 2.1 3.0 3.3 -1.1 -1.4 0.8 1.9 : : France -2.7 2.0 0.0 1.1 1.3 1.5 -0.7 -0.6 0.6 1.0 : : Italy -1.9 3.2 0.5 1.2 0.9 2.7 0.5 2.0 0.8 2.1 : : Cyprus -1.7 3.2 0.3 -0.4 -1.8 2.1 3.4 1.2 3.3 2.7 : : Luxembourg : : : : : : : : : : : : Malta 0.3 1.5 -1.9 0.7 2.6 3.2 -1.8 0.4 3.2 4.3 : : Netherlands -0.4 1.3 -1.9 -0.2 1.2 1.7 4.1 5.7 0.2 1.7 : : Austria -2.6 0.2 -0.7 0.3 0.0 0.4 1.3 3.0 0.7 1.4 : : Portugal 0.6 1.8 1.5 -0.3 0.2 2.0 -0.7 3.7 2.2 2.4 : : Slovenia -0.8 0.5 -1.6 0.1 0.8 2.8 -0.8 6.2 1.6 -0.9 : : Slovakia 1.5 5.7 5.9 4.4 8.8 10.0 8.7 10.6 5.2 2.7 : : Finland -2.7 1.2 0.6 -1.3 0.4 4.4 3.8 6.2 2.9 0.7 : : Euro area -5.3 3.0 -2.0 -0.4 1.8 3.9 3.1 4.5 -0.1 1.7 : : Bulgaria 7.3 1.1 -1.0 3.3 11.5 13.3 4.6 11.1 2.7 2.5 : : Czech Republic 3.7 5.7 4.8 5.6 3.4 13.8 -5.0 -3.9 2.7 2.6 : : Denmark -0.8 2.2 0.5 1.2 3.2 5.9 2.9 4.2 0.4 0.4 : : Estonia 1.2 4.3 1.1 7.8 14.2 10.5 2.9 -0.9 -5.6 -3.5 : : Latvia 2.4 2.8 7.8 13.2 23.0 19.1 -5.3 -7.0 -2.5 -8.8 : : Lithuania 6.3 4.5 3.2 7.8 3.0 5.1 -7.4 4.1 -6.2 -2.7 : : Hungary 2.0 3.9 3.1 -5.7 8.9 1.7 -11.8 -9.7 3.9 4.8 : : Poland 4.1 -3.7 11.0 1.1 3.7 12.5 -20.5 -18.9 0.4 2.3 : : Romania 13.0 5.1 33.0 6.9 19.3 1.5 -4.5 -5.8 8.3 5.3 : : Sweden -3.1 0.2 -3.8 -1.5 3.9 -2.7 -11.0 -7.2 -1.0 2.9 : : United Kingdom 5.3 0.8 -0.5 1.5 2.9 -13.6 -13.6 -10.5 1.3 -1.8 : : EU -4.0 4.8 -1.1 0.8 6.4 1.8 -6.5 -2.6 0.7 2.4 : : USA 4.3 -3.7 -1.5 0.4 -4.3 -5.9 11.4 0.8 -2.2 -7.4 : : Japan -2.0 -6.7 -5.6 -9.2 -10.1 9.1 12.1 16.3 -2.6 -0.6 : :
¹ 35 countries : EUR26 (excl. LU), TR, CH, NO, US, CA, JP, AU, MX and NZ.Note : See note 6 on concepts and sources where countries using full time equivalents are listed.

204
TABLE 33 : Short term interest rates (1992-2009) 22.10.20095-year averages
1992-96 1997-01 2002-06 2000 2001 2002 2003 2004 2005 2006 2007 2008 2009 Belgium 6.2 3.7 2.6 4.4 4.3 3.3 2.3 2.1 2.2 3.1 4.3 4.6 1.3 Germany 6.0 3.7 2.6 4.4 4.3 3.3 2.3 2.1 2.2 3.1 4.3 4.6 1.3 Ireland 7.8 4.6 2.6 4.4 4.3 3.3 2.3 2.1 2.2 3.1 4.3 4.6 1.3 Greece 20.3 9.8 2.6 7.7 4.3 3.3 2.3 2.1 2.2 3.1 4.3 4.6 1.3 Spain 10.0 4.2 2.6 4.4 4.3 3.3 2.3 2.1 2.2 3.1 4.3 4.6 1.3 France 7.1 3.7 2.6 4.4 4.3 3.3 2.3 2.1 2.2 3.1 4.3 4.6 1.3 Italy 10.3 4.7 2.6 4.4 4.3 3.3 2.3 2.1 2.2 3.1 4.3 4.6 1.3 Cyprus : : 4.1 6.4 5.9 4.4 3.9 4.7 4.3 3.4 4.2 4.6 1.3 Luxembourg : : : : : : : : : : 4.3 4.6 1.3 Malta : 5.1 3.4 4.9 4.9 4.0 3.3 2.9 3.2 3.5 4.3 4.6 1.3 Netherlands 5.7 3.7 2.6 4.4 4.3 3.3 2.3 2.1 2.2 3.1 4.3 4.6 1.3 Austria 5.9 3.7 2.6 4.4 4.3 3.3 2.3 2.1 2.2 3.1 4.3 4.6 1.3 Portugal 11.5 4.3 2.6 4.4 4.3 3.3 2.3 2.1 2.2 3.1 4.3 4.6 1.3 Slovenia : : 5.4 10.9 10.9 8.0 6.8 4.7 4.0 3.6 4.3 4.6 1.3 Slovakia : 15.0 5.2 8.6 7.8 7.8 6.2 4.7 2.9 4.3 4.3 4.6 1.3 Finland 7.1 3.7 2.6 4.4 4.3 3.3 2.3 2.1 2.2 3.1 4.3 4.6 1.3 Euro area 7.9 4.1 2.6 4.5 4.3 3.4 2.4 2.2 2.2 3.1 4.3 4.6 1.3 Bulgaria : : 3.9 4.6 5.1 4.9 3.7 3.7 3.6 3.7 4.9 7.1 5.9 Czech Republic : 9.5 2.5 5.4 5.2 3.5 2.3 2.4 2.0 2.3 3.1 4.0 2.2 Denmark 7.8 4.2 2.7 5.0 4.7 3.5 2.4 2.2 2.2 3.2 4.4 5.3 2.5 Estonia : 8.3 3.0 5.7 5.3 3.9 2.9 2.5 2.4 3.2 4.9 6.7 6.2 Latvia : 7.0 4.0 5.4 6.9 4.4 3.8 4.2 3.1 4.4 8.7 8.0 13.2 Lithuania : : 3.0 8.6 5.9 3.7 2.8 2.7 2.4 3.1 5.1 6.0 7.5 Hungary : 15.1 8.6 11.4 10.9 9.2 8.5 11.5 6.7 7.2 7.9 8.8 9.1 Poland : 18.7 6.1 18.8 16.1 9.0 5.7 6.2 5.3 4.2 4.7 6.4 4.4 Romania : 64.4 16.1 50.7 41.3 27.3 17.7 19.1 8.4 8.1 7.2 12.3 11.1 Sweden 8.9 4.1 2.9 4.1 4.1 4.3 3.2 2.3 1.9 2.6 3.9 4.7 0.9 United Kingdom 6.8 6.2 4.4 6.2 5.0 4.1 3.7 4.6 4.8 4.9 6.0 5.5 1.2 EU : 8.9 3.3 5.9 5.4 4.1 3.0 3.1 2.9 3.5 4.6 5.1 1.6 USA 4.7 5.4 2.7 6.5 3.8 1.8 1.2 1.6 3.6 5.2 5.3 2.9 0.7 Japan 2.3 0.4 0.1 0.3 0.2 0.1 0.1 0.1 0.1 0.3 0.8 0.9 0.5
TABLE 34 : Long term interest rates (1992-2009)5-year averages
1992-96 1997-01 2002-06 2000 2001 2002 2003 2004 2005 2006 2007 2008 2009 Belgium 7.5 5.2 4.1 5.6 5.1 5.0 4.2 4.2 3.4 3.8 4.3 4.4 3.9 Germany 6.9 5.0 4.0 5.3 4.8 4.8 4.1 4.0 3.4 3.8 4.2 4.0 3.2 Ireland 8.0 5.3 4.1 5.5 5.0 5.0 4.1 4.1 3.3 3.8 4.3 4.5 5.2 Greece 19.9 7.2 4.3 6.1 5.3 5.1 4.3 4.3 3.6 4.1 4.5 4.8 5.1 Spain 10.4 5.3 4.1 5.5 5.1 5.0 4.1 4.1 3.4 3.8 4.3 4.4 4.0 France 7.3 5.0 4.1 5.4 4.9 4.9 4.1 4.1 3.4 3.8 4.3 4.2 3.7 Italy 11.3 5.4 4.2 5.6 5.2 5.0 4.3 4.3 3.6 4.1 4.5 4.7 4.3 Cyprus : 7.2 5.1 7.6 7.6 5.7 4.7 5.8 5.2 4.1 4.5 4.6 4.6 Luxembourg 7.0 5.1 4.0 5.5 4.9 4.7 4.0 4.2 3.4 3.9 4.6 4.6 4.2 Malta : : 4.9 5.8 6.2 5.8 5.0 4.7 4.6 4.3 4.7 4.8 4.6 Netherlands 6.9 5.0 4.1 5.4 5.0 4.9 4.1 4.1 3.4 3.8 4.3 4.2 3.7 Austria 7.1 5.1 4.1 5.6 5.1 5.0 4.2 4.2 3.4 3.8 4.3 4.3 3.8 Portugal 10.8 5.4 4.1 5.6 5.2 5.0 4.2 4.1 3.4 3.9 4.4 4.5 4.2 Slovenia : : 5.5 : : 8.7 6.4 4.7 3.8 3.9 4.5 4.6 4.4 Slovakia : : 5.0 8.3 8.0 6.9 5.0 5.0 3.5 4.4 4.5 4.7 4.8 Finland 9.1 5.2 4.1 5.5 5.0 5.0 4.1 4.1 3.4 3.8 4.3 4.3 3.8 Euro area 8.6 5.2 4.1 5.4 5.0 4.9 4.2 4.1 3.4 3.8 4.3 4.3 3.2 Bulgaria : : 5.6 : : 8.3 6.5 5.4 3.9 4.2 4.5 5.4 7.3 Czech Republic : : 4.2 : 6.3 4.9 4.1 4.8 3.5 3.8 4.3 4.6 4.9 Denmark 7.9 5.4 4.2 5.6 5.1 5.1 4.3 4.3 3.4 3.8 4.3 4.3 3.6 Estonia : : 5.4 10.5 10.2 8.4 5.3 4.4 4.2 5.0 6.1 8.2 7.9 Latvia : : 4.6 : 7.6 5.4 4.9 4.9 3.9 4.1 5.3 6.4 12.3 Lithuania : : 4.7 : 8.2 6.1 5.3 4.5 3.7 4.1 4.6 5.6 14.5 Hungary : : 7.2 8.6 8.0 7.1 6.8 8.2 6.6 7.1 6.7 8.2 9.1 Poland : : 6.1 11.8 10.7 7.4 5.8 6.9 5.2 5.2 5.5 6.1 6.1 Romania : : : : : : : : : 7.2 7.1 7.7 10.3 Sweden 9.3 5.4 4.3 5.4 5.1 5.3 4.6 4.4 3.4 3.7 4.2 3.9 3.2 United Kingdom 8.2 5.6 4.7 5.3 5.0 4.9 4.6 4.9 4.5 4.4 5.1 4.5 3.4 EU : : : : : : : : : 4.1 4.6 4.5 4.0 USA 6.7 5.7 4.4 6.0 5.0 4.6 4.0 4.3 4.3 4.8 4.6 3.7 3.2 Japan 4.0 1.7 1.4 1.8 1.3 1.3 1.0 1.5 1.4 1.7 1.7 1.5 1.4

205
TABLE 35 : Total expenditure, general government (as a percentage of GDP, 1992-2011) ¹ 22.10.20095-year averages 2009 2010 2011
1992-96 1997-01 2002-06 2005 2006 2007 2008 IV-2009 X-2009 IV-2009 X-2009 IV-2009 X-2009 Belgium 52.8 50.0 50.1 52.1 48.5 48.4 50.0 52.9 53.6 54.3 53.8 : 54.0 Germany 47.8 47.4 47.2 46.8 45.3 43.7 43.7 48.2 48.0 49.0 48.3 : 47.5 Ireland 39.4 34.0 33.6 33.7 34.2 36.2 42.0 45.8 46.9 49.1 49.1 : 48.4 Greece 43.4 45.1 44.3 43.7 42.6 44.1 48.3 45.3 50.0 45.2 49.4 : 49.8 Spain 44.6 40.0 38.6 38.4 38.4 39.2 41.1 45.2 45.2 47.1 45.6 : 45.3 France 53.3 52.5 53.0 53.3 52.7 52.3 52.7 55.6 55.2 56.4 55.1 : 54.8 Italy 53.2 48.3 48.0 48.1 48.7 47.9 48.8 51.2 51.6 51.1 50.8 : 50.5 Cyprus : 37.0 43.0 43.6 43.4 42.2 42.6 44.4 44.4 45.0 47.8 : 48.0 Luxembourg : 39.3 41.1 41.5 38.3 36.2 37.7 44.2 43.3 45.7 43.9 : 43.6 Malta : 42.6 45.0 44.9 43.7 42.5 45.0 44.4 45.7 44.8 46.3 : 46.4 Netherlands 52.0 45.9 45.9 44.8 45.5 45.5 45.9 48.3 49.5 50.2 50.9 : 50.7 Austria 53.7 52.9 51.1 50.0 49.5 48.7 48.9 51.6 52.3 52.1 52.6 : 52.4 Portugal 41.4 43.3 46.0 47.7 46.3 45.7 45.9 48.9 51.6 48.7 51.5 : 52.0 Slovenia : 46.1 45.7 45.2 44.5 42.4 44.2 47.7 49.5 48.6 50.2 : 49.9 Slovakia : 47.9 39.5 38.0 36.9 34.4 34.8 38.3 37.5 39.4 37.5 : 36.9 Finland 59.8 51.3 49.5 50.1 48.6 47.3 48.9 52.8 54.3 54.3 55.0 : 55.0 Euro area 50.1 47.7 47.4 47.3 46.6 46.0 46.8 50.1 50.4 51.0 50.5 : 50.2 Bulgaria : : 39.2 39.3 36.5 41.5 37.3 39.5 39.5 39.3 39.5 : 38.7 Czech Republic : 43.0 45.5 45.0 43.8 42.6 43.0 45.9 46.9 47.6 46.5 : 46.6 Denmark 59.0 55.1 53.6 52.6 51.5 50.9 51.9 55.0 55.9 57.0 57.6 : 56.4 Estonia : 37.5 34.4 33.6 34.0 34.8 39.9 45.0 44.8 47.3 46.7 : 45.4 Latvia : 38.0 36.0 35.5 38.2 35.8 38.8 46.8 43.8 49.8 45.7 : 45.1 Lithuania : 41.1 33.6 33.3 33.6 34.8 37.4 39.5 45.9 42.7 46.0 : 46.0 Hungary : 49.1 50.3 50.1 51.9 49.8 49.3 50.8 50.0 52.0 49.4 : 49.0 Poland : 43.7 43.8 43.4 43.9 42.2 43.3 46.1 44.0 46.8 46.1 : 45.9 Romania : 36.8 34.1 33.5 35.3 36.0 38.4 38.5 39.4 38.9 38.6 : 37.9 Sweden 64.4 57.9 55.5 55.0 54.0 52.5 53.1 56.6 55.9 57.3 55.6 : 54.6 United Kingdom 42.2 39.1 42.8 44.1 44.0 44.0 47.3 50.5 51.2 52.4 52.1 : 50.7 EU : 46.7 46.7 46.8 46.3 45.7 46.8 50.1 50.4 51.1 50.6 : 50.1 USA 36.5 34.6 36.1 36.3 36.0 36.7 38.8 42.2 39.8 43.7 41.2 : 41.7 Japan : 38.9 37.8 38.4 36.2 36.0 37.2 44.2 42.8 46.7 44.0 : 44.7
¹ ESA 79 up to 1994, ESA 95 from 1995 onwards.
TABLE 36 : Total revenue, general government (as a percentage of GDP, 1992-2011) ¹5-year averages 2009 2010 2011
1992-96 1997-01 2002-06 2005 2006 2007 2008 IV-2009 X-2009 IV-2009 X-2009 IV-2009 X-2009 Belgium 47.5 49.3 49.6 49.4 48.7 48.2 48.8 48.4 47.7 48.2 48.0 : 48.2 Germany 44.8 45.9 43.9 43.5 43.7 43.9 43.7 44.3 44.6 43.0 43.3 : 42.9 Ireland 37.7 36.4 34.9 35.4 37.2 36.5 34.9 33.7 34.4 33.5 34.4 : 33.8 Greece 33.8 40.9 39.1 38.5 39.7 40.4 40.6 40.2 37.3 39.5 37.2 : 37.0 Spain 39.1 38.1 39.0 39.4 40.4 41.1 37.0 36.6 34.0 37.3 35.6 : 36.0 France 48.4 50.4 49.8 50.4 50.4 49.6 49.3 49.0 47.0 49.3 46.8 : 47.1 Italy 44.9 46.1 44.5 43.8 45.4 46.4 46.0 46.7 46.3 46.3 45.5 : 45.4 Cyprus : 33.3 39.3 41.2 42.2 45.5 43.5 42.5 40.9 42.4 42.1 : 42.1 Luxembourg : 43.8 41.7 41.5 39.7 39.9 40.2 42.7 41.1 42.9 39.7 : 39.4 Malta : 35.0 39.9 42.0 41.2 40.4 40.3 40.8 41.2 41.6 41.9 : 42.1 Netherlands 48.7 46.0 44.6 44.5 46.1 45.7 46.6 44.9 44.8 44.1 44.8 : 45.1 Austria 49.6 51.2 49.2 48.4 47.9 48.1 48.4 47.4 47.9 46.7 47.1 : 47.1 Portugal 36.7 40.0 42.2 41.6 42.3 43.2 43.2 42.4 43.7 42.0 43.5 : 43.3 Slovenia : 43.2 43.6 43.8 43.2 42.4 42.4 42.2 43.2 42.1 43.2 : 42.9 Slovakia : 40.3 35.6 35.2 33.5 32.5 32.5 33.6 31.3 34.1 31.4 : 31.4 Finland 54.0 54.0 52.6 52.9 52.6 52.5 53.4 52.0 51.5 51.5 50.5 : 50.6 Euro area 45.1 46.0 44.9 44.8 45.3 45.4 44.8 44.8 44.0 44.4 43.7 : 43.7 Bulgaria : : 40.3 41.2 39.5 41.5 39.1 39.0 38.7 39.0 38.4 : 38.4 Czech Republic : 38.6 41.0 41.4 41.1 41.9 40.9 41.6 40.3 42.7 41.0 : 40.9 Denmark 56.5 56.1 56.1 57.8 56.6 55.4 55.3 53.4 53.9 53.1 52.8 : 53.0 Estonia : 37.1 35.9 35.2 36.3 37.4 37.1 42.0 41.9 43.4 43.5 : 42.4 Latvia : 36.5 34.8 35.1 37.7 35.5 34.6 35.7 34.9 36.2 33.4 : 32.9 Lithuania : 36.2 32.5 32.8 33.1 33.8 34.2 34.1 36.1 34.8 36.8 : 36.3 Hungary : 43.8 42.3 42.2 42.6 44.8 45.5 47.4 45.9 48.1 45.1 : 45.1 Poland : 39.8 38.8 39.4 40.2 40.3 39.6 39.5 37.6 39.5 38.6 : 38.3 Romania : 32.7 32.5 32.3 33.1 33.5 32.8 33.4 31.6 33.3 31.8 : 32.0 Sweden 56.7 59.1 56.2 57.2 56.5 56.3 55.6 54.0 53.8 53.4 52.3 : 52.0 United Kingdom 36.2 39.7 39.8 40.7 41.3 41.4 42.3 38.9 39.1 38.7 39.2 : 39.6 EU : 45.3 44.3 44.4 44.8 44.9 44.6 44.1 43.4 43.8 43.2 : 43.2 USA 32.3 34.9 32.4 33.1 33.9 34.0 32.4 30.1 28.6 29.5 28.2 : 28.6 Japan : 31.6 31.7 31.7 34.5 33.5 33.3 37.6 34.8 38.0 35.1 : 35.7
¹ ESA 79 up to 1994, ESA 95 from 1995 onwards.
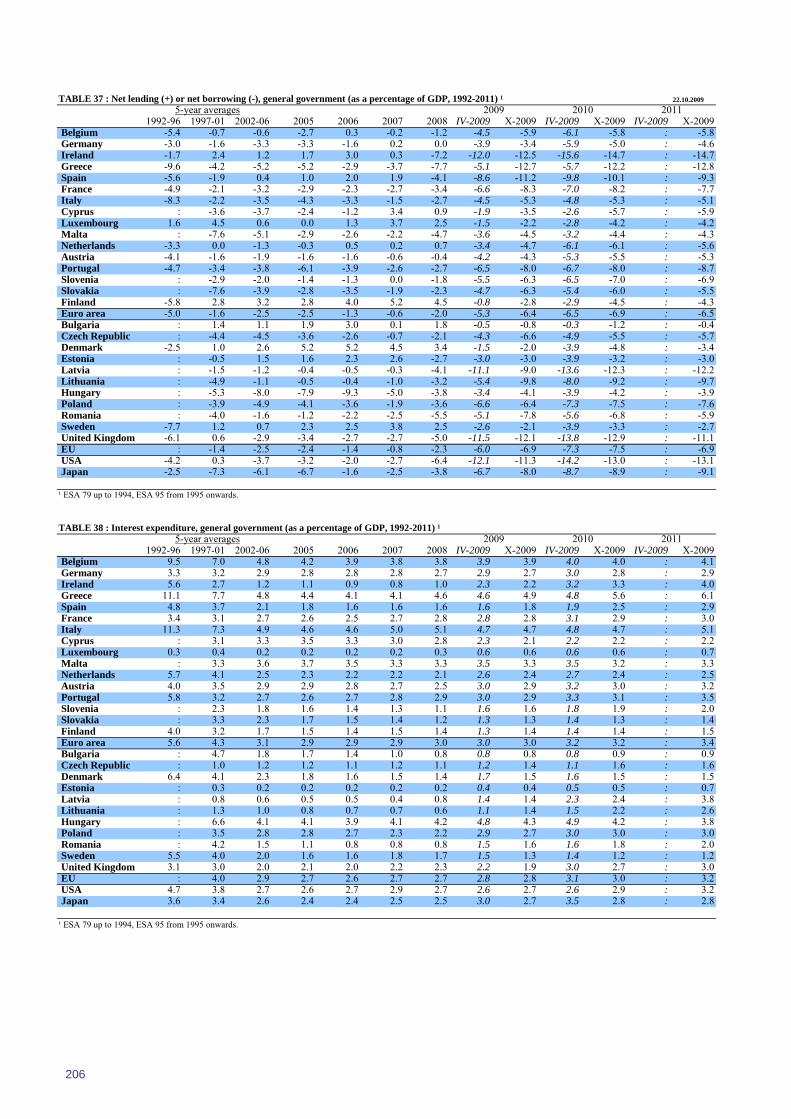
206
TABLE 37 : Net lending (+) or net borrowing (-), general government (as a percentage of GDP, 1992-2011) ¹ 22.10.20095-year averages 2009 2010 2011
1992-96 1997-01 2002-06 2005 2006 2007 2008 IV-2009 X-2009 IV-2009 X-2009 IV-2009 X-2009 Belgium -5.4 -0.7 -0.6 -2.7 0.3 -0.2 -1.2 -4.5 -5.9 -6.1 -5.8 : -5.8 Germany -3.0 -1.6 -3.3 -3.3 -1.6 0.2 0.0 -3.9 -3.4 -5.9 -5.0 : -4.6 Ireland -1.7 2.4 1.2 1.7 3.0 0.3 -7.2 -12.0 -12.5 -15.6 -14.7 : -14.7 Greece -9.6 -4.2 -5.2 -5.2 -2.9 -3.7 -7.7 -5.1 -12.7 -5.7 -12.2 : -12.8 Spain -5.6 -1.9 0.4 1.0 2.0 1.9 -4.1 -8.6 -11.2 -9.8 -10.1 : -9.3 France -4.9 -2.1 -3.2 -2.9 -2.3 -2.7 -3.4 -6.6 -8.3 -7.0 -8.2 : -7.7 Italy -8.3 -2.2 -3.5 -4.3 -3.3 -1.5 -2.7 -4.5 -5.3 -4.8 -5.3 : -5.1 Cyprus : -3.6 -3.7 -2.4 -1.2 3.4 0.9 -1.9 -3.5 -2.6 -5.7 : -5.9 Luxembourg 1.6 4.5 0.6 0.0 1.3 3.7 2.5 -1.5 -2.2 -2.8 -4.2 : -4.2 Malta : -7.6 -5.1 -2.9 -2.6 -2.2 -4.7 -3.6 -4.5 -3.2 -4.4 : -4.3 Netherlands -3.3 0.0 -1.3 -0.3 0.5 0.2 0.7 -3.4 -4.7 -6.1 -6.1 : -5.6 Austria -4.1 -1.6 -1.9 -1.6 -1.6 -0.6 -0.4 -4.2 -4.3 -5.3 -5.5 : -5.3 Portugal -4.7 -3.4 -3.8 -6.1 -3.9 -2.6 -2.7 -6.5 -8.0 -6.7 -8.0 : -8.7 Slovenia : -2.9 -2.0 -1.4 -1.3 0.0 -1.8 -5.5 -6.3 -6.5 -7.0 : -6.9 Slovakia : -7.6 -3.9 -2.8 -3.5 -1.9 -2.3 -4.7 -6.3 -5.4 -6.0 : -5.5 Finland -5.8 2.8 3.2 2.8 4.0 5.2 4.5 -0.8 -2.8 -2.9 -4.5 : -4.3 Euro area -5.0 -1.6 -2.5 -2.5 -1.3 -0.6 -2.0 -5.3 -6.4 -6.5 -6.9 : -6.5 Bulgaria : 1.4 1.1 1.9 3.0 0.1 1.8 -0.5 -0.8 -0.3 -1.2 : -0.4 Czech Republic : -4.4 -4.5 -3.6 -2.6 -0.7 -2.1 -4.3 -6.6 -4.9 -5.5 : -5.7 Denmark -2.5 1.0 2.6 5.2 5.2 4.5 3.4 -1.5 -2.0 -3.9 -4.8 : -3.4 Estonia : -0.5 1.5 1.6 2.3 2.6 -2.7 -3.0 -3.0 -3.9 -3.2 : -3.0 Latvia : -1.5 -1.2 -0.4 -0.5 -0.3 -4.1 -11.1 -9.0 -13.6 -12.3 : -12.2 Lithuania : -4.9 -1.1 -0.5 -0.4 -1.0 -3.2 -5.4 -9.8 -8.0 -9.2 : -9.7 Hungary : -5.3 -8.0 -7.9 -9.3 -5.0 -3.8 -3.4 -4.1 -3.9 -4.2 : -3.9 Poland : -3.9 -4.9 -4.1 -3.6 -1.9 -3.6 -6.6 -6.4 -7.3 -7.5 : -7.6 Romania : -4.0 -1.6 -1.2 -2.2 -2.5 -5.5 -5.1 -7.8 -5.6 -6.8 : -5.9 Sweden -7.7 1.2 0.7 2.3 2.5 3.8 2.5 -2.6 -2.1 -3.9 -3.3 : -2.7 United Kingdom -6.1 0.6 -2.9 -3.4 -2.7 -2.7 -5.0 -11.5 -12.1 -13.8 -12.9 : -11.1 EU : -1.4 -2.5 -2.4 -1.4 -0.8 -2.3 -6.0 -6.9 -7.3 -7.5 : -6.9 USA -4.2 0.3 -3.7 -3.2 -2.0 -2.7 -6.4 -12.1 -11.3 -14.2 -13.0 : -13.1 Japan -2.5 -7.3 -6.1 -6.7 -1.6 -2.5 -3.8 -6.7 -8.0 -8.7 -8.9 : -9.1
¹ ESA 79 up to 1994, ESA 95 from 1995 onwards.
TABLE 38 : Interest expenditure, general government (as a percentage of GDP, 1992-2011) ¹5-year averages 2009 2010 2011
1992-96 1997-01 2002-06 2005 2006 2007 2008 IV-2009 X-2009 IV-2009 X-2009 IV-2009 X-2009 Belgium 9.5 7.0 4.8 4.2 3.9 3.8 3.8 3.9 3.9 4.0 4.0 : 4.1 Germany 3.3 3.2 2.9 2.8 2.8 2.8 2.7 2.9 2.7 3.0 2.8 : 2.9 Ireland 5.6 2.7 1.2 1.1 0.9 0.8 1.0 2.3 2.2 3.2 3.3 : 4.0 Greece 11.1 7.7 4.8 4.4 4.1 4.1 4.6 4.6 4.9 4.8 5.6 : 6.1 Spain 4.8 3.7 2.1 1.8 1.6 1.6 1.6 1.6 1.8 1.9 2.5 : 2.9 France 3.4 3.1 2.7 2.6 2.5 2.7 2.8 2.8 2.8 3.1 2.9 : 3.0 Italy 11.3 7.3 4.9 4.6 4.6 5.0 5.1 4.7 4.7 4.8 4.7 : 5.1 Cyprus : 3.1 3.3 3.5 3.3 3.0 2.8 2.3 2.1 2.2 2.2 : 2.2 Luxembourg 0.3 0.4 0.2 0.2 0.2 0.2 0.3 0.6 0.6 0.6 0.6 : 0.7 Malta : 3.3 3.6 3.7 3.5 3.3 3.3 3.5 3.3 3.5 3.2 : 3.3 Netherlands 5.7 4.1 2.5 2.3 2.2 2.2 2.1 2.6 2.4 2.7 2.4 : 2.5 Austria 4.0 3.5 2.9 2.9 2.8 2.7 2.5 3.0 2.9 3.2 3.0 : 3.2 Portugal 5.8 3.2 2.7 2.6 2.7 2.8 2.9 3.0 2.9 3.3 3.1 : 3.5 Slovenia : 2.3 1.8 1.6 1.4 1.3 1.1 1.6 1.6 1.8 1.9 : 2.0 Slovakia : 3.3 2.3 1.7 1.5 1.4 1.2 1.3 1.3 1.4 1.3 : 1.4 Finland 4.0 3.2 1.7 1.5 1.4 1.5 1.4 1.3 1.4 1.4 1.4 : 1.5 Euro area 5.6 4.3 3.1 2.9 2.9 2.9 3.0 3.0 3.0 3.2 3.2 : 3.4 Bulgaria : 4.7 1.8 1.7 1.4 1.0 0.8 0.8 0.8 0.8 0.9 : 0.9 Czech Republic : 1.0 1.2 1.2 1.1 1.2 1.1 1.2 1.4 1.1 1.6 : 1.6 Denmark 6.4 4.1 2.3 1.8 1.6 1.5 1.4 1.7 1.5 1.6 1.5 : 1.5 Estonia : 0.3 0.2 0.2 0.2 0.2 0.2 0.4 0.4 0.5 0.5 : 0.7 Latvia : 0.8 0.6 0.5 0.5 0.4 0.8 1.4 1.4 2.3 2.4 : 3.8 Lithuania : 1.3 1.0 0.8 0.7 0.7 0.6 1.1 1.4 1.5 2.2 : 2.6 Hungary : 6.6 4.1 4.1 3.9 4.1 4.2 4.8 4.3 4.9 4.2 : 3.8 Poland : 3.5 2.8 2.8 2.7 2.3 2.2 2.9 2.7 3.0 3.0 : 3.0 Romania : 4.2 1.5 1.1 0.8 0.8 0.8 1.5 1.6 1.6 1.8 : 2.0 Sweden 5.5 4.0 2.0 1.6 1.6 1.8 1.7 1.5 1.3 1.4 1.2 : 1.2 United Kingdom 3.1 3.0 2.0 2.1 2.0 2.2 2.3 2.2 1.9 3.0 2.7 : 3.0 EU : 4.0 2.9 2.7 2.6 2.7 2.7 2.8 2.8 3.1 3.0 : 3.2 USA 4.7 3.8 2.7 2.6 2.7 2.9 2.7 2.6 2.7 2.6 2.9 : 3.2 Japan 3.6 3.4 2.6 2.4 2.4 2.5 2.5 3.0 2.7 3.5 2.8 : 2.8
¹ ESA 79 up to 1994, ESA 95 from 1995 onwards.

207
TABLE 39 : Primary balance, general government (as a percentage of GDP, 1992-2011) ¹ ² 22.10.20095-year averages 2009 2010 2011
1992-96 1997-01 2002-06 2005 2006 2007 2008 IV-2009 X-2009 IV-2009 X-2009 IV-2009 X-2009 Belgium 4.1 6.3 4.2 1.5 4.2 3.6 2.6 -0.6 -2.0 -2.1 -1.8 : -1.7 Germany 0.3 1.7 -0.4 -0.5 1.2 3.0 2.7 -1.0 -0.6 -2.9 -2.2 : -1.7 Ireland 4.0 5.0 2.4 2.7 3.9 1.1 -6.1 -9.8 -10.2 -12.5 -11.3 : -10.6 Greece 1.6 3.5 -0.4 -0.7 1.2 0.5 -3.2 -0.5 -7.7 -0.9 -6.6 : -6.7 Spain -0.8 1.8 2.5 2.8 3.7 3.5 -2.5 -6.9 -9.4 -7.8 -7.6 : -6.3 France -1.5 1.0 -0.5 -0.3 0.3 0.0 -0.6 -3.8 -5.5 -4.0 -5.4 : -4.7 Italy 3.0 5.1 1.4 0.3 1.3 3.5 2.4 0.2 -0.5 0.1 -0.6 : 0.1 Cyprus : -0.5 -0.4 1.1 2.1 6.4 3.7 0.4 -1.4 -0.4 -3.6 : -3.7 Luxembourg 1.9 4.9 0.8 0.2 1.5 3.9 2.7 -0.9 -1.6 -2.2 -3.6 : -3.6 Malta : -4.3 -1.5 0.8 1.0 1.2 -1.4 -0.2 -1.2 0.4 -1.2 : -1.0 Netherlands 2.4 4.1 1.1 2.1 2.7 2.4 2.8 -0.8 -2.3 -3.4 -3.7 : -3.1 Austria -0.1 1.9 1.0 1.3 1.1 2.2 2.1 -1.1 -1.4 -2.1 -2.5 : -2.1 Portugal 1.1 -0.1 -1.1 -3.5 -1.2 0.2 0.2 -3.6 -5.0 -3.4 -4.9 : -5.2 Slovenia : -0.6 -0.3 0.1 0.1 1.3 -0.7 -3.9 -4.8 -4.7 -5.1 : -4.9 Slovakia : -4.3 -1.6 -1.1 -2.0 -0.5 -1.1 -3.3 -5.0 -4.0 -4.7 : -4.1 Finland -1.8 6.0 4.8 4.3 5.4 6.7 5.9 0.5 -1.4 -1.5 -3.1 : -2.9 Euro area 0.6 2.6 0.7 0.4 1.6 2.4 1.0 -2.3 -3.4 -3.3 -3.7 : -3.1 Bulgaria : 6.1 2.9 3.6 4.4 1.1 2.7 0.3 0.0 0.4 -0.3 : 0.5 Czech Republic : -3.3 -3.3 -2.4 -1.5 0.5 -1.0 -3.2 -5.2 -3.7 -3.9 : -4.1 Denmark 3.9 5.1 4.8 7.1 6.8 6.1 4.8 0.1 -0.5 -2.3 -3.3 : -1.9 Estonia : -0.2 1.7 1.8 2.5 2.8 -2.5 -2.7 -2.6 -3.4 -2.6 : -2.3 Latvia : -0.7 -0.5 0.1 0.0 0.1 -3.4 -9.7 -7.6 -11.3 -9.9 : -8.3 Lithuania : -3.6 -0.1 0.3 0.3 -0.3 -2.6 -4.3 -8.4 -6.5 -7.0 : -7.1 Hungary : 1.3 -3.9 -3.8 -5.4 -0.9 0.4 1.4 0.2 1.0 -0.1 : -0.2 Poland : -0.3 -2.1 -1.3 -1.0 0.4 -1.4 -3.7 -3.8 -4.3 -4.6 : -4.6 Romania : 0.1 -0.1 -0.1 -1.3 -1.8 -4.8 -3.6 -6.2 -4.0 -5.0 : -3.9 Sweden -2.2 5.3 2.6 3.9 4.2 5.6 4.2 -1.2 -0.8 -2.5 -2.1 : -1.4 United Kingdom -2.9 3.5 -0.9 -1.3 -0.6 -0.5 -2.7 -9.4 -10.2 -10.8 -10.3 : -8.1 EU : 2.6 0.4 0.3 1.2 1.9 0.4 -3.2 -4.2 -4.3 -4.5 : -3.7 USA 0.5 4.1 -1.0 -0.6 0.7 0.2 -3.7 -9.5 -8.6 -11.6 -10.1 : -10.0 Japan 1.1 -3.9 -3.5 -4.3 0.8 0.0 -1.3 -3.6 -5.3 -5.2 -6.1 : -6.2
¹ ESA 79 up to 1994, ESA 95 from 1995 onwards.² Net lending/borrowing excluding interest expenditure.
TABLE 40 : Cyclically adjusted net lending (+) or net borrowing (-), general government (as a percentage of GDP, 1992-2011)5-year averages 2009 2010 2011
1992-96 1997-01 2002-06 2005 2006 2007 2008 IV-2009 X-2009 IV-2009 X-2009 IV-2009 X-2009 Belgium -4.9 -0.9 -0.7 -3.0 -0.5 -1.5 -2.1 -3.1 -4.6 -4.0 -4.3 : -4.5 Germany -3.1 -1.6 -3.1 -2.8 -2.2 -1.2 -1.5 -2.3 -1.9 -4.0 -3.6 : -3.5 Ireland -0.4 1.4 0.3 0.8 1.9 -1.7 -7.1 -9.2 -9.6 -12.2 -11.5 : -12.5 Greece -8.9 -3.8 -5.9 -5.7 -3.8 -5.1 -8.9 -4.9 -12.6 -4.7 -11.3 : -11.6 Spain -4.6 -2.0 0.4 1.1 1.7 1.2 -4.4 -7.5 -10.0 -8.2 -8.5 : -8.1 France -3.9 -2.2 -3.6 -3.4 -2.9 -3.6 -3.8 -5.5 -7.0 -5.5 -7.0 : -6.5 Italy -7.5 -2.1 -3.9 -4.5 -4.3 -2.9 -3.4 -2.6 -3.5 -2.7 -3.7 : -3.8 Cyprus : -3.7 -3.8 -2.3 -1.4 2.6 -0.2 -2.1 -3.4 -2.1 -5.2 : -5.6 Luxembourg : 4.5 0.3 -0.4 0.0 1.0 1.6 0.6 -0.3 0.1 -2.0 : -1.8 Malta : -8.2 -4.4 -2.2 -2.5 -2.6 -5.4 -3.6 -4.2 -2.8 -4.1 : -4.4 Netherlands -2.7 -0.6 -0.9 0.2 0.1 -1.3 -1.0 -2.3 -3.2 -4.3 -4.4 : -4.3 Austria -3.9 -2.0 -1.6 -1.1 -1.9 -1.7 -1.8 -3.2 -3.3 -3.8 -4.3 : -4.0 Portugal -4.4 -4.0 -3.5 -5.6 -3.6 -2.8 -2.6 -5.3 -6.6 -5.1 -6.7 : -7.5 Slovenia : -3.0 -2.0 -1.5 -2.3 -2.6 -4.5 -4.9 -4.8 -5.2 -5.4 : -5.6 Slovakia : -7.0 -3.7 -2.7 -4.2 -4.0 -5.0 -4.9 -6.0 -4.7 -5.4 : -4.6 Finland -3.6 1.9 3.1 2.8 2.7 2.9 2.7 0.8 -0.5 -0.9 -2.3 : -2.4 Euro area -4.4 -1.8 -2.6 -2.5 -1.9 -1.8 -2.9 -3.9 -5.0 -4.7 -5.4 : -5.3 Bulgaria : : -0.1 0.6 1.4 -1.8 -0.3 0.3 0.3 1.6 1.0 : 1.5 Czech Republic : -3.5 -4.4 -4.0 -4.2 -3.1 -4.1 -4.0 -6.0 -3.7 -4.5 : -4.8 Denmark -1.8 0.2 2.3 4.6 3.5 2.9 3.4 1.1 1.3 -1.0 -2.1 : -1.3 Estonia : -0.1 0.5 0.3 -0.2 -0.7 -4.2 -0.4 -0.1 -0.7 -0.4 : -1.3 Latvia : -1.0 -2.0 -1.6 -3.4 -4.8 -6.7 -9.0 -6.4 -10.7 -9.3 : -10.2 Lithuania : -3.7 -2.1 -2.0 -2.4 -4.2 -6.4 -3.8 -7.6 -4.8 -6.3 : -7.5 Hungary : -4.9 -8.6 -8.7 -10.9 -6.4 -5.1 -1.7 -2.2 -2.0 -2.1 : -3.0 Poland : -4.1 -4.8 -4.0 -4.1 -2.9 -4.7 -6.0 -6.3 -5.8 -6.6 : -6.7 Romania : : -2.4 -2.4 -4.4 -5.1 -8.5 -5.2 -7.1 -4.7 -5.5 : -4.6 Sweden -5.7 1.6 0.2 1.3 0.7 2.0 1.9 -0.4 0.5 -1.9 -1.0 : -0.7 United Kingdom -5.4 0.3 -3.4 -3.9 -3.5 -3.8 -5.7 -10.2 -10.5 -12.2 -11.4 : -9.9 EU : -1.5 -2.6 -2.6 -2.2 -2.1 -3.2 -4.6 -5.5 -5.6 -6.0 : -5.7

208
TABLE 41 : Cyclically adjusted primary balance, general government (as a percentage of GDP, 1992-2011) 22.10.20095-year averages 2009 2010 2011
1992-96 1997-01 2002-06 2005 2006 2007 2008 IV-2009 X-2009 IV-2009 X-2009 IV-2009 X-2009 Belgium 4.6 6.1 4.1 1.2 3.5 2.3 1.7 0.8 -0.7 0.0 -0.3 : -0.4 Germany 0.2 1.6 -0.2 0.0 0.6 1.6 1.2 0.6 0.8 -1.0 -0.8 : -0.6 Ireland 5.3 4.1 1.5 1.9 2.8 -0.9 -6.1 -6.9 -7.4 -9.0 -8.2 : -8.5 Greece 2.3 3.9 -1.1 -1.3 0.3 -1.0 -4.4 -0.3 -7.7 0.1 -5.7 : -5.5 Spain 0.2 1.7 2.5 2.9 3.3 2.8 -2.8 -5.9 -8.2 -6.3 -6.1 : -5.2 France -0.6 1.0 -0.9 -0.7 -0.4 -1.0 -1.0 -2.7 -4.2 -2.5 -4.1 : -3.5 Italy 3.7 5.2 1.1 0.1 0.3 2.1 1.7 2.0 1.3 2.1 1.0 : 1.3 Cyprus : -0.6 -0.4 1.2 1.9 5.7 2.6 0.2 -1.4 0.1 -3.1 : -3.3 Luxembourg : 4.8 0.5 -0.2 0.2 1.3 1.9 1.2 0.3 0.7 -1.4 : -1.1 Malta : -4.9 -0.9 1.6 1.1 0.7 -2.1 -0.1 -0.8 0.7 -0.9 : -1.0 Netherlands 3.0 3.6 1.6 2.5 2.3 0.9 1.1 0.3 -0.8 -1.6 -2.0 : -1.8 Austria 0.2 1.5 1.4 1.8 0.8 1.0 0.8 -0.1 -0.4 -0.6 -1.3 : -0.8 Portugal 1.4 -0.7 -0.8 -3.0 -0.9 0.0 0.3 -2.4 -3.7 -1.8 -3.6 : -4.1 Slovenia : -0.7 -0.2 0.1 -0.9 -1.3 -3.3 -3.3 -3.2 -3.4 -3.6 : -3.6 Slovakia : -3.7 -1.4 -1.0 -2.7 -2.7 -3.7 -3.6 -4.7 -3.3 -4.1 : -3.3 Finland 0.4 5.1 4.8 4.3 4.1 4.4 4.1 2.1 0.8 0.5 -0.9 : -0.9 Euro area 1.2 2.5 0.6 0.5 0.9 1.1 0.1 -0.9 -2.0 -1.5 -2.2 : -1.9 Bulgaria : : 1.8 2.2 2.8 -0.8 0.5 1.1 1.1 2.4 1.9 : 2.4 Czech Republic : -2.4 -3.3 -2.8 -3.1 -1.9 -3.0 -2.9 -4.6 -2.5 -2.9 : -3.2 Denmark 4.6 4.3 4.6 6.5 5.2 4.5 4.9 2.7 2.8 0.6 -0.6 : 0.2 Estonia : 0.2 0.8 0.5 0.0 -0.6 -4.0 0.0 0.2 -0.2 0.1 : -0.7 Latvia : -0.2 -1.3 -1.1 -2.9 -4.4 -5.9 -7.5 -5.1 -8.4 -6.9 : -6.4 Lithuania : -2.4 -1.0 -1.1 -1.7 -3.5 -5.7 -2.7 -6.2 -3.3 -4.1 : -4.9 Hungary : 1.7 -4.5 -4.6 -7.0 -2.4 -0.9 3.1 2.1 2.9 2.1 : 0.7 Poland : -0.5 -2.0 -1.2 -1.4 -0.6 -2.5 -3.1 -3.6 -2.8 -3.7 : -3.7 Romania : : -0.9 -1.3 -3.6 -4.4 -7.8 -3.7 -5.5 -3.1 -3.7 : -2.6 Sweden -0.1 5.6 2.1 3.0 2.4 3.8 3.6 1.1 1.8 -0.5 0.3 : 0.5 United Kingdom -2.3 3.3 -1.4 -1.8 -1.5 -1.6 -3.4 -8.0 -8.6 -9.2 -8.7 : -6.8 EU : 2.5 0.2 0.2 0.4 0.6 -0.5 -1.8 -2.7 -2.5 -3.0 : -2.5
TABLE 42 : Gross debt, general government (as a percentage of GDP, 2002-2011) 2009 2010 2011
2002 2003 2004 2005 2006 2007 2008 IV-2009 X-2009 IV-2009 X-2009 IV-2009 X-2009 Belgium 103.2 98.3 93.9 92.1 88.1 84.2 89.8 95.7 97.2 100.9 101.2 : 104.0 Germany 60.3 63.8 65.6 68.0 67.6 65.0 65.9 73.4 73.1 78.7 76.7 : 79.7 Ireland 32.2 31.0 29.4 27.6 25.0 25.1 44.1 61.2 65.8 79.7 82.9 : 96.2 Greece 101.5 97.3 98.6 100.0 97.1 95.6 99.2 103.4 112.6 108.0 124.9 : 135.4 Spain 52.5 48.7 46.2 43.0 39.6 36.1 39.7 50.8 54.3 62.3 66.3 : 74.0 France 58.8 62.9 64.9 66.4 63.7 63.8 67.4 79.7 76.1 86.0 82.5 : 87.6 Italy 105.7 104.4 103.8 105.8 106.5 103.5 105.8 113.0 114.6 116.1 116.7 : 117.8 Cyprus 64.6 68.9 70.2 69.1 64.6 58.3 48.4 47.5 53.2 47.9 58.6 : 63.4 Luxembourg 6.5 6.2 6.3 6.1 6.6 6.6 13.5 16.0 15.0 16.4 16.4 : 17.7 Malta 60.1 69.3 72.5 70.2 63.6 62.0 63.8 67.0 68.5 68.9 70.9 : 72.5 Netherlands 50.5 52.0 52.4 51.8 47.4 45.5 58.2 57.0 59.8 63.1 65.6 : 69.7 Austria 66.4 65.4 64.8 63.9 62.2 59.5 62.6 70.4 69.1 75.2 73.9 : 77.0 Portugal 55.5 56.9 58.3 63.6 64.7 63.6 66.3 75.4 77.4 81.5 84.6 : 91.1 Slovenia 28.1 27.5 27.2 27.0 26.7 23.3 22.5 29.3 35.1 34.9 42.8 : 48.2 Slovakia 43.4 42.4 41.4 34.2 30.5 29.3 27.7 32.2 34.6 36.3 39.2 : 42.7 Finland 41.3 44.4 44.2 41.8 39.3 35.2 34.1 39.7 41.3 45.7 47.4 : 52.7 Euro area 68.0 69.1 69.5 70.1 68.3 66.0 69.3 77.7 78.2 83.8 84.0 : 88.2 Bulgaria 53.6 45.9 37.9 29.2 22.7 18.2 14.1 16.0 15.1 17.3 16.2 : 15.7 Czech Republic 28.5 30.1 30.4 29.7 29.4 29.0 30.0 33.7 36.5 37.9 40.6 : 44.0 Denmark 46.8 45.8 44.5 37.1 31.3 26.8 33.5 32.5 33.7 33.7 35.3 : 35.2 Estonia 5.6 5.5 5.0 4.6 4.5 3.8 4.6 6.8 7.4 7.8 10.9 : 13.2 Latvia 13.5 14.6 14.9 12.4 10.7 9.0 19.5 34.1 33.2 50.1 48.6 : 60.4 Lithuania 22.3 21.1 19.4 18.4 18.0 16.9 15.6 22.6 29.9 31.9 40.7 : 49.3 Hungary 55.6 58.4 59.1 61.8 65.6 65.9 72.9 80.8 79.1 82.3 79.8 : 79.1 Poland 42.2 47.1 45.7 47.1 47.7 45.0 47.2 53.6 51.7 59.7 57.0 : 61.3 Romania 24.9 21.5 18.7 15.8 12.4 12.6 13.6 18.2 21.8 22.7 27.4 : 31.3 Sweden 52.6 52.3 51.2 51.0 45.9 40.5 38.0 44.0 42.1 47.2 43.6 : 44.1 United Kingdom 37.5 38.7 40.6 42.2 43.2 44.2 52.0 68.4 68.6 81.7 80.3 : 88.2 EU 60.3 61.7 62.1 62.7 61.3 58.7 61.5 72.6 73.0 79.4 79.3 : 83.7

209
TABLE 43 : Gross national saving (as a percentage of GDP, 1992-2011) 22.10.20095-year averages 2009 2010 2011
1992-96 1997-01 2002-06 2005 2006 2007 2008 IV-2009 X-2009 IV-2009 X-2009 IV-2009 X-2009 Belgium 24.8 25.9 25.2 25.0 25.8 26.7 24.2 21.0 22.5 20.6 22.3 : 22.4 Germany 21.2 20.3 21.4 22.1 24.3 26.3 25.8 21.6 21.5 21.3 21.8 : 22.1 Ireland 18.6 23.6 23.1 23.6 24.6 21.6 16.9 14.9 12.4 13.9 11.4 : 11.9 Greece 18.5 14.0 10.5 9.3 8.9 7.5 7.2 6.8 7.7 6.5 7.9 : 8.2 Spain 20.6 22.3 22.5 22.0 22.0 21.0 19.8 18.5 19.1 17.2 17.7 : 17.6 France 18.9 21.1 19.1 18.5 19.3 19.9 18.9 16.3 17.1 15.8 17.5 : 17.9 Italy 20.6 21.3 20.0 19.5 19.6 20.0 18.2 16.0 16.7 15.8 16.8 : 17.2 Cyprus : 13.8 14.7 14.1 13.8 10.4 6.3 8.7 7.7 9.0 8.4 : 10.1 Luxembourg 35.0 33.4 32.1 33.5 30.5 29.8 25.5 24.9 26.9 24.1 28.5 : 29.4 Malta : 14.2 13.1 11.6 13.0 15.7 12.4 13.3 10.9 13.4 11.6 : 12.2 Netherlands 25.9 27.1 26.9 26.5 29.0 28.2 24.7 25.0 21.6 23.7 20.9 : 21.6 Austria 22.1 23.1 24.9 24.7 25.4 26.1 26.4 24.3 23.7 23.8 23.6 : 24.3 Portugal 19.3 18.4 14.6 12.8 11.7 12.4 10.2 9.6 8.1 8.8 7.5 : 7.6 Slovenia 23.5 24.3 25.2 25.5 26.5 27.1 26.1 23.8 22.1 23.1 22.5 : 22.3 Slovakia : 23.9 20.1 20.2 20.4 22.8 22.0 20.4 19.1 20.3 19.9 : 20.1 Finland 18.0 26.9 26.3 25.4 26.6 27.1 24.6 21.9 20.7 20.9 20.5 : 20.8 Euro area 20.9 21.6 21.2 21.0 22.0 22.5 21.2 18.7 18.8 18.1 18.7 : 19.0 Bulgaria : : 15.8 16.5 13.1 14.3 15.4 14.4 15.0 14.8 16.3 : 18.0 Czech Republic 28.1 24.9 22.7 23.9 24.7 24.4 22.0 20.9 18.4 20.6 20.1 : 21.2 Denmark 19.9 22.0 23.9 25.2 25.2 23.6 24.1 21.2 20.6 20.0 20.1 : 20.8 Estonia : 21.8 22.4 23.6 22.7 21.2 19.7 21.5 22.5 19.7 21.6 : 21.1 Latvia 31.2 16.6 20.0 21.9 17.2 17.9 18.5 27.4 25.7 25.1 25.5 : 24.6 Lithuania : 12.6 15.7 16.8 16.0 15.3 14.6 19.8 10.5 21.5 12.1 : 12.3 Hungary : 20.3 16.9 15.8 16.5 17.0 16.8 16.9 18.8 16.6 19.3 : 20.0 Poland 17.2 19.9 17.1 18.0 18.1 19.3 18.6 18.2 18.8 18.7 18.3 : 18.8 Romania 22.9 13.6 17.2 14.4 15.9 17.3 19.2 22.6 23.1 24.1 23.7 : 24.7 Sweden 17.5 21.9 23.8 23.4 26.8 28.7 28.0 24.3 24.0 24.3 24.1 : 24.8 United Kingdom 15.2 16.2 14.8 14.4 14.2 15.6 15.2 11.5 11.2 11.6 12.0 : 13.3 EU : 20.9 20.1 19.9 20.7 21.4 20.4 17.7 17.7 17.3 17.8 : 18.3 USA 15.0 17.7 14.5 14.6 15.8 14.0 12.1 12.4 12.2 12.9 13.2 : 14.0 Japan 31.6 28.5 26.7 27.2 27.7 28.9 26.7 24.2 23.0 24.0 22.8 : 21.7
TABLE 44 : Gross saving, private sector (as a percentage of GDP, 1992-2011) ¹5-year averages 2009 2010 2011
1992-96 1997-01 2002-06 2005 2006 2007 2008 IV-2009 X-2009 IV-2009 X-2009 IV-2009 X-2009 Belgium 28.0 24.1 23.6 23.3 23.7 24.8 23.3 23.3 25.8 24.4 26.0 : 25.9 Germany 20.8 19.6 22.2 23.0 23.7 23.9 23.4 22.6 22.1 24.5 23.9 : 24.3 Ireland 18.6 18.2 18.5 18.6 18.2 17.1 18.2 22.8 20.5 24.9 21.7 : 22.6 Greece 24.6 14.5 12.4 11.6 10.3 9.6 10.8 10.0 16.4 10.4 17.2 : 18.1 Spain 21.8 20.1 17.8 16.9 15.6 14.2 18.7 21.6 24.8 22.4 23.1 : 22.5 France 20.0 19.7 18.9 18.2 18.0 18.8 18.4 18.6 21.2 18.6 21.7 : 21.6 Italy 25.6 20.5 20.0 20.1 18.2 17.7 17.4 16.6 18.3 17.0 18.5 : 18.8 Cyprus : 14.0 14.9 13.9 11.3 3.4 1.9 7.1 7.7 8.1 10.1 : 11.9 Luxembourg : 24.4 25.9 27.8 24.1 21.8 18.4 20.8 23.8 20.8 27.2 : 28.2 Malta : 17.9 14.9 13.2 14.3 15.3 14.5 15.1 13.1 14.9 13.5 : 14.0 Netherlands 26.4 24.1 24.8 23.7 25.5 24.8 20.3 24.6 22.3 26.0 22.9 : 23.1 Austria 21.6 21.2 23.0 23.1 23.9 23.5 23.9 25.5 24.8 26.3 25.9 : 26.4 Portugal 20.5 17.7 16.4 16.0 13.4 12.4 11.1 13.7 13.4 13.2 13.0 : 13.8 Slovenia : 22.9 23.0 23.0 23.7 22.4 22.5 24.1 23.1 24.4 23.8 : 23.6 Slovakia : 23.7 20.2 19.3 20.9 22.1 21.0 21.9 22.2 23.4 22.7 : 22.2 Finland 20.0 21.3 20.6 20.1 20.4 19.5 17.7 19.9 20.7 21.0 22.3 : 22.5 Euro area 22.2 20.2 20.4 20.3 20.0 19.8 19.7 20.3 21.4 21.1 22.0 : 22.1 Bulgaria : : 10.4 9.8 5.6 6.7 8.4 8.9 9.6 9.1 11.4 : 12.5 Czech Republic : 21.5 19.8 20.4 21.0 19.7 18.4 18.9 18.6 19.0 19.3 : 20.6 Denmark 20.5 19.3 19.9 18.5 18.5 17.6 18.6 21.0 20.8 21.1 21.9 : 21.4 Estonia : 17.7 16.6 18.3 16.1 13.4 16.4 19.1 20.5 17.8 18.5 : 18.0 Latvia : 15.6 17.2 18.4 11.7 12.1 18.8 32.7 33.0 33.1 35.4 : 34.2 Lithuania : 11.3 13.5 14.4 12.9 11.7 13.5 21.4 17.5 25.3 18.9 : 20.0 Hungary : 19.9 19.3 19.0 20.5 17.3 17.1 17.2 20.3 16.8 20.9 : 21.4 Poland : 19.6 17.8 18.3 17.4 16.8 17.3 19.2 20.0 19.9 20.4 : 21.2 Romania : 14.1 13.9 11.0 11.6 13.1 17.8 20.1 24.0 21.7 23.6 : 23.7 Sweden 21.3 17.8 20.1 18.0 21.1 21.7 22.3 23.3 22.7 24.4 23.9 : 23.9 United Kingdom 18.6 14.5 15.6 15.6 14.4 15.9 16.8 19.6 19.0 22.1 21.3 : 21.4 EU : 19.4 19.5 19.3 18.9 18.9 19.2 20.0 20.8 21.0 21.6 : 21.8 USA 17.1 15.3 15.7 15.3 15.6 14.2 15.4 18.2 19.3 21.4 21.4 : 22.4 Japan 26.6 27.7 28.4 28.6 27.6 28.7 28.1 28.3 27.7 30.2 28.0 : 27.3
¹ ESA 79 up to 1994, ESA 95 from 1995 onwards.

210
TABLE 45 : Gross saving, general government (as a percentage of GDP, 1992-2011) ¹ 22.10.20095-year averages 2009 2010 2011
1992-96 1997-01 2002-06 2005 2006 2007 2008 IV-2009 X-2009 IV-2009 X-2009 IV-2009 X-2009 Belgium -3.3 1.8 1.5 1.7 2.1 1.9 0.9 -2.3 -3.3 -3.9 -3.6 : -3.5 Germany 0.4 0.7 -0.7 -0.9 0.6 2.4 2.4 -1.1 -0.6 -3.1 -2.2 : -2.2 Ireland 0.0 5.4 4.7 5.0 6.3 4.5 -1.3 -7.9 -8.2 -11.0 -10.3 : -10.7 Greece -6.1 -0.5 -1.9 -2.3 -1.5 -2.1 -3.7 -3.2 -8.7 -3.8 -9.3 : -9.9 Spain -1.1 2.1 4.7 5.1 6.4 6.9 1.1 -3.1 -5.7 -5.3 -5.3 : -4.9 France -1.1 1.5 0.2 0.3 1.3 1.1 0.5 -2.4 -4.1 -2.8 -4.2 : -3.7 Italy -5.0 0.8 0.0 -0.6 1.4 2.3 0.8 -0.6 -1.7 -1.2 -1.7 : -1.6 Cyprus : -0.2 -0.3 0.2 2.5 7.0 4.4 1.6 0.0 0.9 -1.7 : -1.9 Luxembourg : 9.0 6.2 5.7 6.4 8.1 7.0 4.1 3.1 3.3 1.3 : 1.3 Malta : -3.7 -1.8 -1.6 -1.3 0.4 -2.1 -1.9 -2.2 -1.4 -1.9 : -1.8 Netherlands -0.4 3.0 2.0 2.8 3.5 3.4 4.3 0.4 -0.8 -2.2 -2.1 : -1.5 Austria 0.5 1.9 1.8 1.6 1.5 2.6 2.5 -1.3 -1.1 -2.5 -2.2 : -2.1 Portugal -1.2 0.6 -1.8 -3.2 -1.6 0.0 -0.9 -4.1 -5.3 -4.4 -5.5 : -6.2 Slovenia : 1.4 2.1 2.5 2.8 4.7 3.6 -0.3 -1.0 -1.3 -1.3 : -1.2 Slovakia : 0.2 -0.2 1.0 -0.5 0.6 1.0 -1.5 -3.1 -3.0 -2.7 : -2.1 Finland -2.0 5.6 5.7 5.3 6.2 7.7 6.9 2.0 0.0 -0.1 -1.8 : -1.7 Euro area -1.4 1.4 0.7 0.7 2.0 2.7 1.5 -1.6 -2.7 -3.0 -3.3 : -3.1 Bulgaria : 5.4 5.4 6.6 7.5 7.6 7.0 5.6 5.4 5.7 5.0 : 5.5 Czech Republic : 3.3 2.9 3.5 3.7 4.7 3.6 2.0 -0.3 1.5 0.8 : 0.6 Denmark -0.6 2.6 4.1 6.7 6.7 6.0 5.5 0.2 -0.2 -1.1 -1.8 : -0.6 Estonia : 4.0 5.7 5.3 6.6 7.8 3.3 2.4 2.0 1.9 3.1 : 3.1 Latvia : 1.0 2.8 3.5 5.5 5.7 -0.3 -5.4 -7.3 -8.0 -9.9 : -9.6 Lithuania : 1.4 2.2 2.4 3.0 3.6 1.1 -1.6 -7.0 -3.8 -6.8 : -7.7 Hungary : 0.4 -2.4 -3.2 -4.0 -0.4 -0.3 -0.3 -1.5 -0.2 -1.6 : -1.4 Poland : 0.3 -0.7 -0.2 0.7 2.5 1.3 -0.9 -1.2 -1.2 -2.1 : -2.4 Romania : -0.5 3.4 3.4 4.3 4.2 1.3 2.5 -0.9 2.4 0.1 : 1.0 Sweden -3.8 4.1 3.7 5.4 5.7 7.0 5.7 1.0 1.3 -0.1 0.2 : 0.8 United Kingdom -3.4 1.7 -0.8 -1.1 -0.2 -0.3 -1.6 -8.1 -7.8 -10.5 -9.3 : -8.1 EU : 1.6 0.6 0.6 1.8 2.4 1.2 -2.2 -3.1 -3.7 -3.8 : -3.5 USA -2.0 2.4 -1.3 -0.7 0.2 -0.1 -3.4 -5.8 -7.1 -8.5 -8.2 : -8.4 Japan 5.0 0.8 -1.7 -1.4 0.1 0.2 -1.3 -4.1 -4.8 -6.1 -5.2 : -5.6
¹ ESA 79 up to 1994, ESA 95 from 1995 onwards.
TABLE 46 : Exports of goods and services, volume (percentage change on preceding year, 1992-2011)5-year averages 2009 2010 2011
1992-96 1997-01 2002-06 2005 2006 2007 2008 IV-2009 X-2009 IV-2009 X-2009 IV-2009 X-2009 Belgium 4.0 6.7 3.9 4.6 5.0 4.5 1.5 -12.8 -15.7 -1.0 1.4 : 2.8 Germany 2.8 9.1 7.5 7.7 13.0 7.5 2.9 -16.1 -15.4 -0.4 2.6 : 4.7 Ireland 14.2 16.9 4.7 5.2 5.1 8.6 -1.0 -8.9 -3.4 -0.2 1.2 : 3.7 Greece 4.2 11.2 3.6 2.4 5.3 5.8 4.0 -7.3 -11.8 0.8 2.7 : 3.1 Spain 10.3 8.9 3.8 2.5 6.7 6.6 -1.0 -10.2 -13.0 0.1 1.3 : 3.3 France 5.2 8.1 2.4 3.1 4.8 2.6 -0.2 -11.7 -10.9 -1.0 2.8 : 3.4 Italy 7.7 4.3 1.4 1.1 6.2 4.6 -3.7 -15.6 -20.2 0.1 1.6 : 3.7 Cyprus : 6.0 1.6 4.7 3.9 7.2 1.1 -6.2 -15.0 0.2 0.7 : 3.4 Luxembourg 4.4 10.7 7.5 4.5 13.3 8.8 1.5 -6.3 -10.0 -1.0 1.8 : 3.2 Malta : 4.8 3.0 0.6 10.5 2.7 -5.4 -7.8 -12.3 -1.3 1.6 : 2.8 Netherlands 5.8 8.3 4.7 6.0 7.3 6.7 2.7 -10.7 -10.8 -0.3 1.9 : 4.1 Austria 3.2 9.1 6.0 7.4 7.5 9.4 0.8 -10.9 -13.7 0.4 2.1 : 3.5 Portugal 7.2 5.5 4.0 2.0 8.7 7.8 -0.5 -11.7 -14.0 -0.1 0.7 : 3.3 Slovenia -2.1 7.9 9.0 10.6 12.5 13.7 2.9 -11.8 -18.5 -0.3 2.4 : 4.0 Slovakia : 10.8 11.8 10.0 21.0 13.8 3.2 -10.2 -15.7 0.2 2.4 : 5.0 Finland 10.7 10.6 5.6 7.0 11.8 8.1 7.3 -18.3 -25.3 1.2 4.6 : 4.8 Euro area 5.8 8.2 4.8 5.1 8.5 6.3 1.0 -13.2 -14.2 -0.3 2.1 : 3.9 Bulgaria : 5.5 9.2 8.5 8.7 5.2 2.9 -11.1 -13.3 2.2 2.3 : 4.5 Czech Republic 9.7 10.3 11.3 11.6 15.8 15.0 6.0 -11.6 -16.5 0.7 2.1 : 5.8 Denmark 3.4 7.2 4.6 8.0 9.1 2.2 2.2 -10.7 -10.3 -0.1 2.1 : 4.4 Estonia : 13.0 10.5 18.6 14.0 0.0 -0.7 -14.1 -15.2 0.4 1.6 : 5.8 Latvia : 5.8 9.2 20.2 6.5 10.0 -1.3 -12.9 -17.5 0.5 1.5 : 5.0 Lithuania : 6.7 11.9 17.7 12.0 3.0 12.2 -15.1 -20.6 -0.2 1.3 : 3.9 Hungary 11.7 16.3 10.9 11.3 18.6 16.2 5.6 -11.9 -13.1 0.8 3.6 : 6.0 Poland 12.2 9.7 11.0 8.0 14.6 9.1 7.1 -11.0 -11.2 0.2 2.9 : 5.7 Romania 10.4 10.8 11.6 7.6 10.4 7.8 19.4 -16.9 -8.9 0.6 3.1 : 5.0 Sweden 7.7 8.2 6.3 6.6 8.9 5.8 1.8 -9.4 -14.4 1.1 1.9 : 7.1 United Kingdom 7.2 5.4 5.3 7.9 11.3 -2.8 1.0 -10.5 -11.5 -0.9 1.8 : 4.6 EU 6.9 8.0 5.3 5.9 9.3 5.5 1.6 -12.6 -13.8 -0.2 2.1 : 4.2 USA 7.4 4.1 4.9 6.7 9.0 8.7 5.4 -14.0 -10.9 0.5 7.7 : 8.4 Japan 3.7 2.9 9.4 7.0 9.7 8.4 1.8 -18.4 -26.6 1.9 7.9 : 3.1

211
TABLE 47 : Imports of goods and services, volume (percentage change on preceding year, 1992-2011) 22.10.20095-year averages 2009 2010 2011
1992-96 1997-01 2002-06 2005 2006 2007 2008 IV-2009 X-2009 IV-2009 X-2009 IV-2009 X-2009 Belgium 4.0 6.1 3.7 5.9 4.7 4.7 3.1 -11.0 -14.8 -0.9 0.8 : 2.9 Germany 3.2 7.5 5.9 6.7 11.9 4.8 4.3 -10.8 -9.5 -1.7 2.0 : 4.3 Ireland 12.0 16.8 4.9 8.4 6.5 5.6 -2.1 -12.5 -8.5 -2.5 -1.0 : 3.7 Greece 3.8 10.8 3.1 -0.3 9.0 7.1 0.2 -6.0 -20.3 0.9 -3.1 : 1.9 Spain 6.4 11.4 7.5 7.7 10.2 8.0 -4.9 -14.5 -20.0 -2.4 -2.7 : 2.2 France 3.2 8.6 4.3 5.9 5.6 5.4 0.8 -6.9 -9.5 0.0 2.2 : 3.7 Italy 2.1 7.0 2.7 2.1 5.9 3.8 -4.5 -12.8 -15.7 0.2 2.0 : 3.9 Cyprus : 4.8 3.4 3.1 6.6 12.5 9.9 -3.1 -15.9 1.3 -1.5 : 2.4 Luxembourg 3.6 11.1 7.2 4.2 12.9 8.3 3.3 -6.3 -11.5 -0.9 1.9 : 3.5 Malta : 2.4 3.7 3.2 9.5 1.2 -6.0 -5.4 -13.7 0.1 1.9 : 2.5 Netherlands 5.5 8.9 4.4 5.4 8.8 5.1 3.7 -9.3 -10.6 -0.4 0.5 : 2.9 Austria 3.3 6.7 5.1 6.4 5.3 7.3 -0.7 -9.5 -9.8 1.1 1.6 : 3.1 Portugal 6.8 7.7 2.7 3.5 5.1 6.1 2.7 -10.0 -13.7 -2.3 -0.2 : 2.2 Slovenia 3.1 7.7 8.7 6.6 12.2 16.3 2.9 -12.0 -21.0 -0.6 0.5 : 3.5 Slovakia : 9.6 10.0 12.4 17.7 8.9 3.3 -7.6 -13.5 0.3 2.4 : 4.9 Finland 5.7 8.7 6.6 11.8 7.8 6.5 7.0 -15.7 -22.1 1.9 3.8 : 4.2 Euro area 3.9 8.3 4.9 5.8 8.5 5.5 1.1 -10.5 -12.5 -0.8 1.1 : 3.6 Bulgaria : 13.1 12.7 13.1 14.0 9.9 4.9 -11.3 -19.9 1.1 -2.8 : 2.3 Czech Republic 20.1 9.8 9.9 5.0 14.3 14.3 4.7 -10.4 -17.0 0.6 1.8 : 5.9 Denmark 4.3 7.2 7.6 11.1 13.9 2.8 3.4 -9.3 -13.2 0.8 2.0 : 4.1 Estonia : 12.5 14.1 17.5 22.9 4.7 -8.7 -16.0 -29.7 -0.5 0.8 : 5.5 Latvia : 7.3 13.6 14.8 19.4 14.7 -13.6 -27.7 -35.0 -7.0 -9.7 : 2.6 Lithuania : 7.5 14.6 16.4 13.7 10.7 10.5 -23.8 -35.2 -3.7 -0.5 : 3.2 Hungary 12.0 16.9 10.3 7.0 14.8 13.3 5.7 -12.3 -16.2 0.5 2.5 : 6.2 Poland 15.3 9.7 9.9 4.7 17.3 13.7 8.0 -10.8 -14.1 -1.5 3.3 : 6.7 Romania 8.1 12.3 17.8 16.0 22.6 27.3 17.5 -17.3 -20.8 -0.5 5.0 : 7.5 Sweden 4.4 7.6 4.9 7.0 8.7 9.4 3.0 -11.3 -15.9 -0.6 1.3 : 7.0 United Kingdom 6.2 8.1 5.9 7.1 8.8 -0.7 -0.8 -13.0 -13.7 -2.0 0.1 : 3.0 EU 5.3 8.4 5.6 6.3 9.2 5.5 1.4 -11.0 -13.3 -0.9 1.1 : 3.8 USA 8.8 9.2 6.2 6.1 6.1 2.0 -3.2 -10.7 -14.9 1.5 7.5 : 5.7 Japan 6.5 1.3 4.6 5.8 4.2 1.5 0.9 -15.1 -16.7 -1.4 2.9 : 7.6
TABLE 48 : Merchandise trade balance (fob-fob, as a percentage of GDP, 1992-2011)5-year averages 2009 2010 2011
1992-96 1997-01 2002-06 2005 2006 2007 2008 IV-2009 X-2009 IV-2009 X-2009 IV-2009 X-2009 Belgium 3.1 3.0 3.4 2.1 1.9 1.6 -1.6 -2.3 -1.0 -2.4 -0.7 : -1.0 Germany 2.2 3.6 6.7 7.1 7.0 8.2 7.3 4.8 4.7 5.1 4.7 : 4.7 Ireland 16.5 23.9 20.7 17.2 13.3 10.4 13.1 17.9 20.5 18.8 22.5 : 22.2 Greece -12.0 -15.4 -17.6 -16.3 -17.1 -17.7 -16.6 -14.8 -11.0 -15.0 -10.3 : -10.5 Spain -3.3 -4.6 -6.5 -7.5 -8.4 -8.6 -7.9 -5.3 -3.9 -4.8 -3.2 : -3.2 France 0.6 1.0 -0.5 -1.3 -1.5 -2.0 -2.7 -3.1 -1.5 -3.4 -1.4 : -1.4 Italy 2.7 2.1 0.4 0.0 -0.7 0.2 0.0 0.9 0.3 0.8 0.2 : 0.2 Cyprus : -24.6 -25.8 -25.0 -27.2 -30.2 -32.7 -27.4 -24.2 -27.6 -23.6 : -24.1 Luxembourg -10.2 -12.7 -10.4 -11.9 -9.3 -8.6 -10.4 -7.5 -8.4 -7.8 -8.6 : -8.1 Malta -22.4 -17.6 -14.8 -18.9 -18.9 -18.0 -20.5 -18.9 -15.6 -19.6 -15.4 : -15.7 Netherlands 5.0 5.3 7.2 7.9 7.7 8.0 7.4 5.8 6.0 5.5 6.2 : 6.8 Austria -4.2 -2.2 -0.1 -0.4 0.3 0.7 0.1 -0.2 -2.2 -0.6 -2.4 : -2.1 Portugal -9.8 -10.6 -9.6 -10.3 -10.1 -10.1 -12.1 -9.7 -9.5 -9.1 -9.7 : -9.7 Slovenia -1.1 -4.4 -2.9 -3.6 -3.8 -4.9 -7.2 -5.9 -1.8 -5.7 -1.3 : -1.5 Slovakia : -8.6 -5.2 -5.4 -5.2 -1.7 -1.7 -2.8 -1.0 -2.1 -0.5 : -0.1 Finland 7.5 10.0 6.9 4.9 5.5 4.9 3.2 2.1 2.0 1.6 1.9 : 1.9 Euro area 1.1 1.5 1.5 1.1 0.7 1.0 0.4 0.1 0.6 0.1 0.8 : 0.8 Euro area, adjusted ¹ : 0.5 0.1 0.5 -0.1 -0.4 0.2 -0.3 0.3 : 0.4 Bulgaria -2.6 -5.6 -16.4 -20.2 -22.0 -25.5 -25.8 -19.9 -15.7 -19.2 -12.9 : -11.7 Czech Republic -5.2 -5.3 -0.4 2.0 2.0 3.4 2.7 1.7 3.2 1.7 3.5 : 3.6 Denmark 3.8 2.7 2.6 2.3 0.4 -0.8 -1.1 -1.0 0.0 -1.3 0.2 : 0.5 Estonia : -16.6 -15.8 -14.0 -18.1 -17.8 -11.7 -8.4 -3.5 -9.6 -5.4 : -5.5 Latvia -7.0 -14.8 -19.7 -18.9 -25.6 -23.9 -17.0 -10.5 -7.4 -9.7 -4.6 : -4.3 Lithuania : -11.3 -10.8 -11.3 -13.9 -15.0 -12.0 -2.8 -1.1 -1.2 -0.1 : 0.1 Hungary -5.6 -4.4 -3.1 -2.5 -2.3 0.2 -0.1 1.0 2.7 1.2 3.0 : 2.3 Poland -0.1 -6.4 -2.3 -0.9 -2.0 -4.0 -4.9 -4.6 -2.8 -3.9 -3.1 : -3.4 Romania -7.3 -6.5 -8.8 -9.8 -12.0 -14.3 -13.3 -9.1 -6.2 -8.0 -6.2 : -6.5 Sweden 5.0 6.9 6.2 5.8 5.6 4.6 4.0 4.9 5.3 5.1 5.7 : 6.0 United Kingdom -1.8 -2.9 -5.0 -5.5 -5.8 -6.4 -6.5 -6.1 -5.8 -6.0 -5.5 : -5.2 EU -0.4 0.7 0.3 -0.1 -0.6 -0.6 -1.0 -0.9 -0.3 -0.8 -0.1 : 0.0 EU, adjusted ¹ : -0.8 -1.4 -1.3 -1.6 -1.6 -1.0 -1.6 -0.8 : -0.7 USA -2.1 -3.6 -5.7 -6.4 -6.5 -6.1 -6.0 -4.6 -3.7 -4.7 -4.2 : -4.2 Japan 2.7 2.5 2.3 2.1 1.9 2.4 0.8 1.7 0.6 2.2 0.9 : 0.5
¹ See note 8 on concepts and sources.

212
TABLE 49 : Current account balance (as a percentage of GDP, 1992-2011) 22.10.20095-year averages 2009 2010 2011
1992-96 1997-01 2002-06 2005 2006 2007 2008 IV-2009 X-2009 IV-2009 X-2009 IV-2009 X-2009 Belgium 4.3 4.5 4.5 3.2 3.3 3.8 0.2 -2.0 0.6 -2.2 0.9 : 0.8 Germany -1.1 -0.8 4.2 5.2 6.6 7.9 6.6 3.6 4.0 3.4 3.8 : 3.7 Ireland 2.5 0.5 -1.4 -3.3 -4.1 -5.3 -5.1 -1.8 -3.1 -0.4 -1.8 : -1.5 Greece -0.5 -6.7 -11.8 -11.0 -12.8 -14.7 -13.8 -11.5 -8.8 -11.9 -7.9 : -7.7 Spain -1.4 -2.4 -6.0 -7.5 -9.0 -10.0 -9.5 -6.9 -5.4 -6.3 -4.6 : -4.2 France 0.5 1.9 -0.6 -1.8 -1.8 -2.3 -3.3 -4.3 -2.3 -4.6 -2.2 : -2.4 Italy 1.0 1.2 -1.0 -1.2 -2.0 -1.8 -3.0 -2.6 -2.4 -2.7 -2.4 : -2.4 Cyprus : -4.3 -4.8 -5.9 -7.0 -12.0 -18.0 -13.9 -11.6 -13.5 -9.0 : -7.7 Luxembourg 12.8 10.0 10.4 11.0 10.3 9.7 5.5 6.1 9.4 5.6 11.2 : 12.2 Malta : -6.4 -4.9 -8.8 -9.2 -7.0 -5.6 -7.6 -3.2 -7.8 -2.8 : -2.5 Netherlands 4.6 4.8 7.5 7.5 9.0 8.5 4.2 5.7 3.1 5.0 3.1 : 3.9 Austria -2.5 -1.4 2.4 2.2 3.0 3.4 3.6 2.7 1.5 2.4 1.4 : 1.8 Portugal -5.4 -8.7 -8.6 -9.8 -10.4 -9.8 -12.1 -9.8 -10.2 -9.5 -10.2 : -10.2 Slovenia 2.5 -1.8 -1.4 -1.8 -2.4 -4.5 -6.1 -4.6 -0.8 -4.4 -0.2 : -0.6 Slovakia : -6.4 -7.3 -8.6 -7.4 -5.1 -6.8 -7.5 -5.8 -7.1 -5.3 : -5.0 Finland 0.7 7.2 5.9 3.9 4.9 4.0 2.6 1.4 1.1 1.0 1.2 : 1.3 Euro area 0.2 0.4 0.5 0.2 0.3 0.4 -0.8 -1.4 -0.7 -1.5 -0.5 : -0.5 Euro area, adjusted ¹ : 0.1 -0.1 0.1 -1.1 -1.2 -1.0 -1.3 -0.8 : -0.7 Bulgaria -4.3 -2.7 -9.0 -11.5 -18.6 -22.5 -22.9 -18.8 -13.7 -17.2 -9.8 : -7.9 Czech Republic -2.1 -4.1 -4.4 -1.7 -2.1 -2.6 -3.3 -3.2 -2.5 -3.3 -1.4 : -0.8 Denmark 1.8 1.2 3.2 4.3 2.9 0.7 2.2 0.4 1.9 -0.6 2.2 : 2.9 Estonia : -7.4 -12.0 -10.2 -17.0 -17.9 -9.1 -1.1 3.9 -3.1 1.3 : -0.3 Latvia 6.0 -7.3 -12.5 -12.5 -22.5 -22.5 -13.0 -1.5 6.8 -1.9 5.4 : 3.4 Lithuania : -8.5 -7.4 -7.1 -10.4 -15.0 -12.4 -1.9 0.1 0.7 0.3 : -0.4 Hungary : -7.8 -8.0 -8.1 -7.5 -6.5 -6.6 -5.0 -1.3 -4.8 -1.7 : -1.8 Poland 0.6 -4.0 -2.4 -1.2 -3.0 -5.2 -5.1 -4.7 -1.9 -3.7 -2.8 : -3.2 Romania : -5.4 -6.3 -8.9 -10.6 -13.6 -12.3 -7.4 -5.5 -6.1 -5.5 : -5.7 Sweden 1.3 4.6 6.7 6.1 8.5 9.0 8.3 7.0 7.8 7.4 7.9 : 8.3 United Kingdom -1.4 -1.5 -2.3 -2.6 -3.3 -2.7 -1.6 -2.8 -2.4 -2.8 -1.6 : -0.9 EU -0.2 0.0 0.0 -0.3 -0.4 -0.4 -1.1 -1.5 -0.7 -1.6 -0.5 : -0.4 EU, adjusted ¹ : -0.7 -1.2 -1.1 -2.0 -1.9 -1.7 -2.0 -1.5 : -1.3 USA -1.3 -3.0 -5.2 -5.9 -6.0 -5.2 -4.9 -3.5 -2.9 -3.7 -3.4 : -3.3 Japan 2.4 2.5 3.5 3.6 3.9 4.8 3.2 3.7 1.8 3.8 2.0 : 1.0
¹ See note 8 on concepts and sources.
TABLE 50 : Net lending (+) or net borrowing (-) of the nation (as a percentage of GDP, 1992-2011)5-year averages 2009 2010 2011
1992-96 1997-01 2002-06 2005 2006 2007 2008 IV-2009 X-2009 IV-2009 X-2009 IV-2009 X-2009 Belgium 4.1 4.5 4.4 3.1 3.3 3.5 -0.2 -2.5 0.1 -2.6 0.4 : 0.3 Germany -1.1 -0.7 4.2 5.2 6.6 7.9 6.6 3.6 4.0 3.4 3.8 : 3.7 Ireland 3.7 1.4 -1.2 -3.2 -4.0 -5.3 -5.1 -1.8 -3.1 -0.4 -1.8 : -1.4 Greece : -5.0 -10.3 -9.7 -10.5 -12.5 -12.4 -9.8 -7.5 -10.2 -6.8 : -6.7 Spain -0.7 -1.4 -5.1 -6.5 -8.4 -9.6 -9.1 -5.8 -4.5 -5.1 -3.7 : -3.3 France 0.5 2.0 -0.7 -1.8 -1.8 -2.2 -3.3 -4.4 -2.3 -4.7 -2.3 : -2.3 Italy 1.1 1.4 -0.9 -1.1 -1.9 -1.7 -2.9 -2.4 -2.3 -2.4 -2.3 : -2.3 Cyprus : -4.3 -4.3 -5.3 -6.8 -11.9 -17.9 -13.7 -11.5 -13.3 -8.8 : -7.5 Luxembourg : : 10.1 13.9 9.4 9.3 4.9 6.1 9.4 5.6 11.2 : 12.2 Malta : -6.0 -3.3 -5.5 -6.2 -6.0 -5.1 -6.0 -2.4 -5.9 -1.8 : -1.4 Netherlands 4.2 4.6 7.2 7.1 8.7 8.1 3.9 5.1 2.7 4.3 2.7 : 3.6 Austria -2.6 -1.5 2.2 2.1 2.7 3.3 3.6 2.7 1.4 2.4 1.3 : 1.7 Portugal -2.7 -6.4 -6.9 -8.3 -9.3 -8.5 -10.3 -7.5 -8.5 -7.4 -8.6 : -8.6 Slovenia 2.4 -1.7 -1.8 -2.1 -2.8 -4.6 -6.0 -4.6 -0.7 -4.4 -0.1 : -0.5 Slovakia : -6.5 -7.7 -9.0 -7.0 -4.7 -5.6 -7.6 -4.8 -6.2 -4.3 : -4.2 Finland 0.8 7.5 7.1 5.0 6.0 4.9 3.0 1.5 1.1 1.1 1.2 : 1.3 Euro area 0.3 0.7 0.7 0.4 0.5 0.6 -0.6 -1.1 -0.5 -1.3 -0.4 : -0.3 Euro area, adjusted ¹ : 0.3 0.1 0.4 -0.9 -0.9 -0.7 -1.2 -0.7 : -0.6 Bulgaria -4.6 -2.5 -8.6 -10.6 -17.9 -21.3 -22.1 -17.7 -12.8 -15.7 -8.7 : -6.7 Czech Republic -3.0 -4.0 -4.1 -2.3 -1.7 -1.9 -2.2 -1.8 -1.5 -1.4 -0.7 : -0.4 Denmark 1.8 1.4 3.3 4.5 2.9 0.7 2.2 0.4 2.0 -0.6 0.5 : 1.0 Estonia : -7.0 -11.1 -9.4 -15.0 -16.9 -8.2 1.0 6.3 -0.7 3.7 : 2.4 Latvia 11.9 -7.0 -11.6 -11.2 -21.3 -20.6 -11.5 0.7 8.9 0.8 8.0 : 6.1 Lithuania : -8.5 -6.6 -6.1 -8.9 -13.1 -10.6 0.3 3.3 3.5 4.8 : 4.3 Hungary : -7.5 -7.6 -7.5 -6.9 -5.5 -5.6 -3.1 0.5 -2.8 0.3 : 0.4 Poland 2.4 -4.0 -2.2 -0.9 -2.1 -4.1 -4.0 -3.1 -0.2 -2.2 -0.3 : -0.7 Romania -3.8 -5.3 -5.7 -7.9 -10.4 -13.1 -11.8 -6.4 -5.0 -5.1 -5.1 : -5.2 Sweden 0.9 4.3 6.6 6.2 7.9 8.9 8.1 6.8 7.6 7.2 7.7 : 8.1 United Kingdom -1.3 -1.4 -2.2 -2.5 -3.2 -2.5 -1.4 -2.7 -2.2 -2.6 -1.4 : -0.7 EU -0.6 -0.6 -0.8 -1.4 -2.1 -2.5 -3.0 -2.5 -1.6 -1.3 -0.3 : -0.2 EU, adjusted ¹ : -1.8 -2.9 -3.1 -3.9 -2.9 -2.5 -1.7 -1.3 : -1.1 USA -2.6 -2.1 -4.7 -5.2 -4.3 -5.1 -5.6 -3.5 -3.0 -3.7 -3.4 : -3.3 Japan 2.4 2.3 3.4 3.5 3.8 4.7 3.1 3.5 1.7 3.7 1.9 : 0.9
¹ See note 8 on concepts and sources.

213
TABLE 51 : Merchandise trade balance (fob-fob, in billions of Ecu/euro, 2003-2011) 22.10.2009 2009 2010 2011
2003 2004 2005 2006 2007 2008 IV-2009 X-2009 IV-2009 X-2009 IV-2009 X-2009 Belgium 12.3 10.2 6.4 6.2 5.3 -5.4 -7.7 -3.5 -8.3 -2.4 : -3.4 Germany 131.9 154.0 158.7 162.0 199.1 181.3 114.0 113.4 122.0 114.6 : 117.1 Ireland 33.1 32.0 27.9 23.5 19.8 23.8 29.9 33.7 30.6 36.0 : 37.0 Greece -30.9 -32.3 -31.9 -35.9 -40.0 -39.7 -36.3 -26.5 -37.9 -25.1 : -26.2 Spain -40.2 -53.2 -67.9 -82.5 -90.8 -86.4 -56.4 -40.9 -52.1 -33.9 : -34.1 France 2.4 -5.1 -21.6 -27.1 -38.8 -53.1 -60.5 -29.9 -65.0 -28.8 : -28.1 Italy 9.5 8.8 0.4 -10.2 3.2 0.2 14.1 4.0 13.2 3.9 : 3.9 Cyprus -2.8 -3.3 -3.4 -4.0 -4.7 -5.5 -4.9 -4.2 -5.1 -4.2 : -4.5 Luxembourg -2.7 -2.7 -3.6 -3.2 -3.2 -4.1 -2.7 -3.2 -2.9 -3.4 : -3.3 Malta -0.6 -0.7 -0.9 -1.0 -1.0 -1.2 -1.1 -0.9 -1.1 -0.9 : -1.0 Netherlands 31.0 35.4 40.7 41.5 45.6 44.3 33.5 34.7 32.0 36.2 : 40.9 Austria -1.5 -0.6 -1.0 0.7 1.9 0.2 -0.6 -6.0 -1.7 -6.6 : -6.2 Portugal -11.2 -13.7 -15.4 -15.7 -16.4 -20.2 -15.8 -15.5 -15.0 -15.9 : -16.4 Slovenia -0.6 -1.0 -1.0 -1.2 -1.7 -2.7 -2.2 -0.6 -2.2 -0.5 : -0.6 Slovakia -0.7 -1.3 -2.1 -2.3 -0.9 -1.1 -1.9 -0.7 -1.5 -0.3 : -0.1 Finland 11.4 10.2 7.7 9.2 8.7 5.9 3.8 3.4 3.0 3.5 : 3.4 Euro area 140.5 136.9 92.9 60.0 86.1 36.2 5.3 57.4 7.9 72.3 : 78.6 Euro area, adjusted ¹ 98.8 94.3 43.7 12.3 46.4 -6.0 -33.9 15.2 -31.2 30.1 : 36.4 Bulgaria -2.4 -3.0 -4.4 -5.6 -7.4 -8.8 -7.0 -5.2 -6.9 -4.4 : -4.2 Czech Republic -2.2 -0.4 2.0 2.3 4.3 4.0 2.3 4.4 2.4 4.9 : 5.3 Denmark 7.0 5.3 4.7 1.0 -1.7 -2.5 -2.3 -0.1 -2.9 0.5 : 1.2 Estonia -1.4 -1.6 -1.6 -2.4 -2.8 -1.9 -1.2 -0.5 -1.3 -0.7 : -0.8 Latvia -1.8 -2.3 -2.5 -4.1 -5.1 -3.9 -2.0 -1.4 -1.8 -0.8 : -0.7 Lithuania -1.5 -1.9 -2.4 -3.3 -4.3 -3.9 -0.8 -0.3 -0.3 0.0 : 0.0 Hungary -2.9 -2.9 -2.2 -2.1 0.2 -0.1 0.8 2.5 1.1 3.0 : 2.4 Poland -5.1 -4.6 -2.2 -5.5 -12.3 -17.8 -13.4 -8.7 -11.6 -10.2 : -11.7 Romania -4.0 -5.3 -7.8 -11.8 -17.9 -18.1 -11.5 -7.2 -10.9 -7.7 : -8.6 Sweden 17.5 19.7 17.1 17.6 15.1 13.2 13.9 15.5 14.7 17.8 : 19.6 United Kingdom -70.3 -89.8 -100.3 -111.9 -131.2 -117.5 -95.2 -90.1 -94.1 -85.4 : -84.6 EU 73.5 50.3 -6.7 -65.9 -76.7 -120.8 -111.2 -33.6 -103.8 -10.8 : -3.6 EU, adjusted ¹ : -43.1 -96.0 -165.0 -160.1 -206.3 -205.1 -119.1 -197.7 -96.3 : -89.1 USA -497.9 -551.0 -644.8 -685.6 -619.4 -586.2 -485.0 -377.0 -505.1 -411.5 : -421.0 Japan 91.5 103.5 75.5 64.8 76.4 26.6 64.9 21.6 79.0 34.2 : 17.8
¹ See note 8 on concepts and sources.
TABLE 52 : Current account balance (in billions of Ecu/euro, 2003-2011) 2009 2010 2011 2003 2004 2005 2006 2007 2008 IV-2009 X-2009 IV-2009 X-2009 IV-2009 X-2009
Belgium 15.4 13.0 9.6 10.5 12.8 0.7 -6.9 2.1 -7.5 3.1 : 2.7 Germany 44.4 106.5 117.3 154.2 192.1 165.8 85.9 94.8 82.6 92.7 : 92.6 Ireland 1.2 -0.2 -5.4 -7.3 -10.1 -9.3 -3.0 -5.2 -0.7 -2.9 : -2.6 Greece -21.1 -19.1 -21.5 -26.9 -33.4 -32.9 -28.2 -21.2 -29.9 -19.3 : -19.3 Spain -31.6 -49.5 -67.8 -88.6 -105.1 -103.9 -74.5 -56.2 -67.9 -47.8 : -44.5 France 3.9 -9.7 -30.8 -33.0 -43.0 -64.7 -83.0 -44.0 -89.6 -44.4 : -48.4 Italy -12.0 -7.6 -17.1 -29.6 -27.7 -47.0 -39.2 -37.2 -41.8 -37.0 : -38.6 Cyprus -0.3 -0.6 -0.8 -1.0 -1.9 -3.1 -2.5 -2.0 -2.5 -1.6 : -1.4 Luxembourg 2.1 3.3 3.3 3.5 3.6 4.7 2.2 3.5 2.1 4.4 : 5.0 Malta -0.1 -0.3 -0.4 -0.5 -0.4 -0.3 -0.4 -0.2 -0.5 -0.2 : -0.1 Netherlands 29.2 42.2 38.4 48.7 48.6 25.2 33.5 17.9 29.1 17.9 : 23.6 Austria 3.9 5.2 5.3 7.6 9.1 10.2 7.5 4.0 6.6 3.9 : 5.3 Portugal -8.9 -11.3 -14.6 -16.2 -16.0 -20.1 -16.0 -16.6 -15.6 -16.8 : -17.1 Slovenia -0.2 -0.7 -0.5 -0.7 -1.6 -2.3 -1.7 -0.3 -1.7 -0.1 : -0.2 Slovakia -1.9 -2.3 -3.3 -3.3 -2.8 -4.4 -5.1 -3.9 -5.0 -3.7 : -3.7 Finland 8.0 10.2 6.1 8.2 7.3 4.8 2.6 1.9 1.8 2.2 : 2.4 Euro area 32.0 79.1 17.7 25.6 31.5 -76.7 -128.7 -62.4 -140.5 -49.5 : -44.4 Euro area, adjusted ¹ 20.7 60.6 9.2 -10.5 11.1 -101.0 -111.3 -86.6 -123.0 -73.8 : -68.7 Bulgaria -1.0 -1.3 -2.5 -4.7 -6.5 -8.6 -6.6 -4.6 -6.2 -3.3 : -2.8 Czech Republic -5.3 -4.8 -1.7 -2.4 -3.3 -5.1 -4.3 -3.4 -4.6 -1.9 : -1.1 Denmark 6.5 5.9 9.0 6.3 1.6 5.4 0.9 4.2 -1.4 5.0 : 6.9 Estonia -1.0 -1.1 -1.1 -2.2 -2.8 -1.5 -0.2 0.5 -0.4 0.2 : 0.0 Latvia -0.8 -1.4 -1.6 -3.6 -4.8 -3.0 -0.3 1.3 -0.3 0.9 : 0.6 Lithuania -1.1 -1.4 -1.5 -2.5 -4.3 -4.0 -0.6 0.0 0.2 0.1 : -0.1 Hungary -6.2 -7.6 -7.2 -6.8 -6.6 -7.6 -4.4 -1.2 -4.4 -1.6 : -1.8 Poland -3.3 -8.4 -3.0 -8.1 -16.1 -18.5 -13.4 -5.7 -11.0 -9.2 : -11.0 Romania -2.6 -3.5 -7.1 -10.4 -17.0 -16.8 -9.4 -6.4 -8.2 -6.8 : -7.5 Sweden 18.9 19.2 18.1 26.7 29.8 27.6 19.7 22.8 21.3 24.7 : 27.1 United Kingdom -26.5 -36.7 -48.0 -64.3 -55.1 -26.1 -44.2 -37.9 -44.8 -25.2 : -14.4 EU 9.7 37.9 -29.1 -46.3 -53.5 -134.9 -191.5 -92.8 -200.5 -66.8 : -48.7 EU, adjusted ¹ : -37.2 -83.8 -148.5 -140.4 -255.0 -241.3 -212.9 -250.3 -186.9 : -168.8 USA -456.9 -502.7 -595.4 -636.1 -529.1 -482.4 -374.5 -301.6 -395.1 -330.4 : -329.6 Japan 120.5 138.6 133.4 136.0 153.8 107.6 137.6 66.8 139.7 71.4 : 36.0
¹ See note 8 on concepts and sources.

214
TABLE 53 : Export markets (a) (percentage change on preceding year, 2003-2011) 22.10.2009 2009 2010 2011 2003 2004 2005 2006 2007 2008 IV-2009 X-2009 IV-2009 X-2009 IV-2009 X-2009
Belgium : : 6.1 8.8 5.3 2.1 -9.9 -11.8 -0.2 2.0 : 4.0 Germany : : 6.2 8.7 6.8 2.2 -10.7 -13.3 0.4 2.2 : 4.1 Ireland : : 5.7 8.3 4.1 1.2 -10.9 -13.1 -0.1 2.4 : 4.1 Greece : : 6.5 8.7 5.7 1.7 -10.5 -13.4 0.4 2.5 : 4.2 Spain : : 5.6 8.3 5.0 1.9 -10.0 -11.9 -0.1 2.0 : 3.8 France : : 6.0 8.6 5.9 1.8 -10.5 -12.8 0.0 1.9 : 4.0 Italy : : 6.7 9.2 6.6 2.7 -10.0 -12.4 0.2 2.1 : 4.0 Cyprus : : 8.3 10.8 6.7 2.2 -11.5 -15.5 0.0 1.2 : 3.5 Luxembourg (b) : : 5.3 7.9 4.9 1.6 -10.8 -12.5 -0.5 1.6 : 3.9 Malta : : 6.4 8.6 5.2 1.8 -10.6 -12.7 0.2 2.1 : 4.1 Netherlands : : 5.8 8.8 5.5 2.3 -10.7 -12.6 -0.3 1.9 : 4.0 Austria : : 6.0 10.0 6.8 2.8 -11.0 -12.8 -0.2 2.2 : 4.3 Portugal : : 6.2 8.7 5.5 0.9 -11.1 -13.8 -0.6 1.1 : 3.6 Slovenia : : 5.5 9.3 7.3 2.7 -10.7 -13.8 0.3 2.1 : 4.0 Slovakia : : 5.9 10.8 8.3 3.2 -11.2 -13.7 -0.2 2.0 : 4.5 Finland : : 8.4 10.6 8.7 3.6 -11.7 -13.8 0.4 2.2 : 4.4 Euro area (c) : : 6.1 8.8 6.1 2.2 -10.5 -12.8 0.1 2.1 : 4.0 Bulgaria : : 6.6 9.4 8.5 2.4 -11.4 -15.1 0.8 1.9 : 4.1 Czech Republic : : 6.5 10.8 7.0 3.2 -10.8 -12.6 -0.4 2.0 : 4.3 Denmark : : 7.0 8.8 6.4 2.4 -11.0 -12.8 0.2 2.3 : 4.6 Estonia : : 9.7 10.0 9.3 1.8 -14.9 -18.6 0.1 1.6 : 4.2 Latvia : : 9.1 11.8 8.9 3.8 -14.7 -19.1 -0.2 1.7 : 4.1 Lithuania : : 10.2 12.0 11.1 2.5 -14.7 -17.5 -0.1 1.2 : 4.0 Hungary : : 6.2 10.2 7.8 3.5 -11.1 -13.2 -0.2 2.1 : 4.3 Poland : : 7.3 10.5 8.0 3.5 -11.8 -13.7 -0.2 1.9 : 4.1 Romania : : 5.6 8.4 7.0 1.7 -10.8 -13.3 0.4 2.0 : 4.1 Sweden : : 7.5 9.0 5.9 2.3 -10.8 -12.6 0.6 2.4 : 4.1 United Kingdom : : 6.5 7.8 6.2 1.6 -10.1 -12.2 0.4 2.5 : 4.3 EU (c) : : 6.3 8.8 6.2 2.2 -10.6 -12.8 0.1 2.1 : 4.1 USA : : 6.7 8.2 7.2 3.5 -11.0 -13.1 1.0 3.8 : 5.1 Japan : : 7.2 8.8 7.7 3.7 -9.8 -12.3 2.0 4.1 : 4.7
(a) Imports of goods and services to the various markets (incl. EU-markets) weighted according to their share in country's exports of goods and services.(b) Included in the figures for Belgium up to 2003.(c) Intra- and extra-EU trade.
TABLE 54 : Export performance (a) (percentage change on preceding year, 2003-2011) 2009 2010 2011 2003 2004 2005 2006 2007 2008 IV-2009 X-2009 IV-2009 X-2009 IV-2009 X-2009
Belgium : : -1.4 -3.5 -0.8 -0.6 -3.2 -4.4 -0.8 -0.6 : -1.2 Germany : : 1.4 3.9 0.7 0.7 -6.0 -2.4 -0.8 0.4 : 0.6 Ireland : : -0.5 -3.0 4.3 -2.2 2.1 11.2 -0.1 -1.2 : -0.4 Greece : : -3.8 -3.1 0.1 2.2 3.6 1.8 0.4 0.2 : -1.1 Spain : : -2.9 -1.5 1.6 -2.8 -0.2 -1.2 0.2 -0.7 : -0.5 France : : -2.7 -3.5 -3.2 -2.0 -1.3 2.2 -1.0 0.8 : -0.6 Italy : : -5.3 -2.7 -1.9 -6.2 -6.1 -8.9 -0.1 -0.5 : -0.3 Cyprus : : -3.4 -6.3 0.4 -1.1 6.0 0.6 0.2 -0.5 : -0.1 Luxembourg (b) : : -0.8 5.0 3.8 -0.1 5.0 2.9 -0.5 0.2 : -0.7 Malta : : -5.5 1.7 -2.4 -7.1 3.1 0.5 -1.5 -0.5 : -1.2 Netherlands : : 0.2 -1.4 1.1 0.4 0.0 2.1 0.0 0.0 : 0.1 Austria : : 1.3 -2.3 2.4 -2.0 0.1 -1.0 0.6 -0.1 : -0.8 Portugal : : -4.0 0.0 2.2 -1.4 -0.7 -0.2 0.5 -0.4 : -0.3 Slovenia : : 4.8 3.0 5.9 0.2 -1.2 -5.5 -0.6 0.3 : 0.0 Slovakia : : 3.8 9.2 5.1 0.0 1.1 -2.3 0.4 0.4 : 0.5 Finland : : -1.3 1.1 -0.6 3.6 -7.6 -13.5 0.8 2.3 : 0.4 Euro area (c) : : -1.0 -0.3 0.2 -1.1 -3.0 -1.6 -0.4 0.1 : -0.1 Bulgaria : : 1.8 -0.6 -3.1 0.5 0.2 2.0 1.4 0.5 : 0.4 Czech Republic : : 4.8 4.5 7.5 2.7 -0.9 -4.6 1.1 0.1 : 1.4 Denmark : : 1.0 0.3 -4.0 -0.2 0.3 2.9 -0.3 -0.2 : -0.2 Estonia : : 8.1 3.6 -8.5 -2.4 0.9 4.2 0.3 0.0 : 1.5 Latvia : : 10.2 -4.7 1.0 -4.9 2.1 2.0 0.7 -0.2 : 0.9 Lithuania : : 6.8 0.0 -7.3 9.4 -0.2 -3.8 0.0 0.1 : -0.1 Hungary : : 4.8 7.7 7.8 2.0 -1.0 0.1 1.0 1.5 : 1.6 Poland : : 0.6 3.7 1.0 3.4 0.9 2.9 0.3 1.0 : 1.5 Romania : : 1.9 1.9 0.8 17.4 -6.8 5.1 0.2 1.1 : 0.9 Sweden : : -0.8 -0.1 -0.1 -0.4 1.6 -2.1 0.5 -0.5 : 2.9 United Kingdom : : 1.3 3.2 -8.5 -0.6 -0.4 0.8 -1.3 -0.7 : 0.3 EU (c) : : -0.4 0.5 -0.7 -0.6 -2.3 -1.1 -0.3 0.1 : 0.1 USA : : 0.0 0.7 1.4 1.8 -3.4 2.5 -0.5 3.8 : 3.1 Japan : : -0.2 0.8 0.7 -1.8 -9.5 -16.3 -0.1 3.7 : -1.5
(a) Index for exports of goods and services divided by an index for growth of markets.(b) Included in the figures for Belgium up to 2003.(c) Intra- and extra-EU trade.

215
TABLE 55 : World GDP, volume (percentage change on preceding year, 2004-2011) 22.10.2009 2009 2010 2011 ( a ) 2004 2005 2006 2007 2008 IV-2009 X-2009 IV-2009 X-2009 IV-2009 X-2009
EU 22.3 2.5 2.0 3.2 2.9 0.8 -4.0 -4.1 -0.1 0.7 : 1.6 Euro area 15.9 2.2 1.7 3.0 2.8 0.6 -4.0 -4.0 -0.1 0.7 : 1.5 Belgium 0.6 3.2 1.8 2.8 2.9 1.0 -3.5 -2.9 -0.2 0.6 : 1.5 Bulgaria 0.1 6.6 6.2 6.3 6.2 6.0 -1.6 -5.9 -0.1 -1.1 : 3.1 Czech Republic 0.3 4.5 6.3 6.8 6.1 2.5 -2.7 -4.8 0.3 0.8 : 2.3 Denmark 0.4 2.3 2.4 3.3 1.6 -1.2 -3.3 -4.5 0.3 1.5 : 1.8 Germany 4.4 1.2 0.8 3.2 2.5 1.3 -5.4 -5.0 0.3 1.2 : 1.7 Estonia 0.0 7.2 9.4 10.0 7.2 -3.6 -10.3 -13.7 -0.8 -0.1 : 4.2 Ireland 0.3 4.6 6.2 5.4 6.0 -3.0 -9.0 -7.5 -2.6 -1.4 : 2.6 Greece 0.4 4.6 2.2 4.5 4.5 2.0 -0.9 -1.1 0.1 -0.3 : 0.7 Spain 1.9 3.3 3.6 4.0 3.6 0.9 -3.2 -3.7 -1.0 -0.8 : 1.0 France 3.5 2.5 1.9 2.2 2.3 0.4 -3.0 -2.2 -0.2 1.2 : 1.5 Italy 2.8 1.5 0.7 2.0 1.6 -1.0 -4.4 -4.7 0.1 0.7 : 1.4 Cyprus 0.0 4.2 3.9 4.1 4.4 3.7 0.3 -0.7 0.7 0.1 : 1.3 Latvia 0.0 8.7 10.6 12.2 10.0 -4.6 -13.1 -18.0 -3.2 -4.0 : 2.0 Lithuania 0.1 7.4 7.8 7.8 9.8 2.8 -11.0 -18.1 -4.7 -3.9 : 2.5 Luxembourg 0.1 4.4 5.4 5.6 6.5 0.0 -3.0 -3.6 0.1 1.1 : 1.8 Hungary 0.2 4.9 3.5 4.0 1.0 0.6 -6.3 -6.5 -0.3 -0.5 : 3.1 Malta 0.0 0.4 4.1 3.8 3.7 2.1 -0.9 -2.2 0.2 0.7 : 1.6 Netherlands 1.1 2.2 2.0 3.4 3.6 2.0 -3.5 -4.5 -0.4 0.3 : 1.6 Austria 0.5 2.5 2.5 3.5 3.5 2.0 -4.0 -3.7 -0.1 1.1 : 1.5 Poland 0.6 5.3 3.6 6.2 6.8 5.0 -1.4 1.2 0.8 1.8 : 3.2 Portugal 0.3 1.5 0.9 1.4 1.9 0.0 -3.7 -2.9 -0.8 0.3 : 1.0 Romania 0.2 8.5 4.2 7.9 6.3 6.2 -4.0 -8.0 0.0 0.5 : 2.6 Slovenia 0.1 4.3 4.5 5.8 6.8 3.5 -3.4 -7.4 0.7 1.3 : 2.0 Slovakia 0.1 5.2 6.5 8.5 10.4 6.4 -2.6 -5.8 0.7 1.9 : 2.6 Finland 0.3 3.7 2.8 4.9 4.2 1.0 -4.7 -6.9 0.2 0.9 : 1.6 Sweden 0.6 4.1 3.3 4.2 2.6 -0.2 -4.0 -4.6 0.8 1.4 : 2.1 United Kingdom 3.2 3.0 2.2 2.9 2.6 0.6 -3.8 -4.6 0.1 0.9 : 1.9 Candidate Countries 1.5 8.8 8.0 6.7 4.8 1.1 -3.6 -5.7 2.1 2.6 : 3.5 - Croatia 0.1 4.2 4.2 4.7 5.5 2.4 -3.0 -5.8 1.5 0.2 : 2.2 - Turkey 1.3 9.4 8.4 6.9 4.7 0.9 -3.7 -5.8 2.2 2.8 : 3.6 - The former Yugoslav Republic of Macedonia 0.0 4.1 4.1 4.0 5.9 4.9 -0.3 -2.0 1.5 1.5 : 2.5 Potential Candidates 0.1 6.9 5.1 5.7 6.6 5.7 2.5 -3.8 3.7 1.4 : 2.5 USA 20.8 3.6 3.1 2.7 2.1 0.4 -2.9 -2.5 0.9 2.2 : 2.0 Japan 6.4 2.7 1.9 2.0 2.3 -0.7 -5.3 -5.9 0.1 1.1 : 0.4 Canada 1.9 3.1 2.9 3.1 2.7 0.4 -2.6 -2.6 1.7 2.1 : 2.4 Norway 0.4 3.9 2.7 2.3 3.1 2.1 -3.4 -2.2 0.2 0.6 : 2.0 Switzerland 0.5 2.5 2.6 3.6 3.6 1.8 -3.2 -2.4 -0.5 -0.1 : 1.1 Iceland 0.0 7.7 7.5 4.3 5.6 1.3 -11.6 -9.8 1.8 1.9 : 2.9 Australia 1.2 2.8 3.0 3.3 3.7 3.0 -0.5 1.0 1.3 2.7 : 3.4 New Zealand 0.2 3.8 3.0 1.8 3.1 -1.0 -2.5 -0.3 0.7 2.1 : 2.5 Industrialised countries 55.1 3.2 2.6 2.9 2.6 0.5 -3.6 -3.6 0.5 1.5 : 1.7 Others 44.9 7.5 7.0 7.8 8.2 6.3 1.4 1.7 3.8 5.2 : 5.7 CIS 4.6 8.2 6.7 8.3 8.4 6.2 -3.8 -6.8 1.4 2.3 : 3.1 - Russia 3.3 7.2 6.4 7.7 8.1 5.6 -3.8 -7.2 1.5 2.3 : 2.7 - Other 1.3 10.8 7.4 9.9 9.3 7.6 -3.9 -5.9 1.0 2.4 : 4.4 MENA 4.8 8.3 5.3 5.7 6.1 6.0 1.5 1.4 1.6 4.1 : 5.3 Other emerging markets 35.4 7.3 7.2 8.1 8.5 6.3 2.0 2.9 4.5 5.7 : 6.1 Asia 24.4 8.0 8.3 9.1 9.7 7.2 3.3 4.9 5.6 6.8 : 7.3 - China 11.5 10.1 10.4 11.6 13.0 9.7 6.1 8.7 7.8 9.6 : 9.5 - India 4.8 7.5 9.5 9.8 9.0 6.7 4.3 5.7 5.0 6.4 : 7.4 - Hong Kong 0.5 8.5 7.1 7.0 6.4 2.4 -3.3 -3.6 2.8 2.9 : 3.9 - Korea 1.9 4.7 4.2 5.1 5.0 2.6 -3.9 -1.3 1.8 2.1 : 2.0 - Indonesia 1.3 5.0 5.7 5.5 6.3 6.1 3.0 4.1 4.5 5.1 : 5.6 Latin America 8.7 6.0 4.7 5.6 5.7 4.1 -1.6 -2.5 1.6 3.1 : 3.4 - Brazil 2.9 5.7 3.2 4.0 5.7 5.1 -1.4 -0.4 2.2 4.2 : 4.2 - Mexico 2.3 4.0 3.3 5.0 3.4 1.3 -3.7 -7.3 1.0 3.1 : 3.3 Sub-Saharan Africa 2.4 6.0 5.5 6.4 6.5 5.7 2.5 1.0 3.5 4.0 : 4.5 World 100.0 5.1 4.6 5.1 5.1 3.1 -1.4 -1.2 1.9 3.1 : 3.5 World excluding EU 77.7 5.9 5.3 5.7 5.8 3.8 -0.7 -0.4 2.5 3.8 : 4.1 World excluding euro area 84.1 5.7 5.1 5.6 5.6 3.6 -0.9 -0.6 2.3 3.6 : 3.9(a) Relative weights, based on GDP (at constant prices and pps) in 2008.

216
TABLE 56 : World exports of goods and services, volume (percentage change on preceding year, 2004-2011) 22.10.2009 2009 2010 2011 ( a ) 2004 2005 2006 2007 2008 IV-2009 X-2009 IV-2009 X-2009 IV-2009 X-2009
EU (b) 39.1 7.6 5.9 9.3 5.5 1.6 -12.7 -13.8 -0.2 2.2 : 4.2 Euro area (b) 29.4 7.4 5.1 8.5 6.3 1.0 -13.2 -14.2 -0.3 2.2 : 3.9 Candidate Countries 1.1 10.3 7.3 6.6 6.8 2.2 -6.5 -10.9 1.8 1.8 : 3.7 - Croatia 0.2 5.4 3.7 6.5 4.3 1.7 -5.2 -13.4 1.1 1.0 : 1.1 - Turkey 0.9 11.2 7.9 6.6 7.3 2.3 -6.7 -10.4 1.9 1.9 : 4.1 - The former Yugoslav Republic of Macedonia 0.0 12.9 11.2 8.4 14.3 -4.3 -13.3 -25.0 2.4 1.6 : 4.6 USA 9.5 9.5 6.7 9.0 8.7 5.4 -14.0 -10.9 0.5 7.7 : 8.4 Japan 4.4 13.9 7.0 9.7 8.4 1.8 -18.4 -26.6 1.9 7.9 : 3.1 Canada 2.7 5.0 1.8 0.6 1.0 -4.4 -10.4 -14.8 1.2 5.0 : 5.6 Norway 1.1 1.1 1.1 0.0 2.5 1.4 -7.6 -8.3 0.0 0.6 : 3.8 Switzerland 1.5 7.9 7.8 10.3 9.5 2.9 -9.0 -9.3 -1.8 0.8 : 2.1 Iceland 0.0 8.4 7.5 -4.6 17.7 7.1 -8.1 1.4 1.9 1.9 : 2.9 Australia 1.2 2.8 3.1 2.6 4.9 4.8 -7.3 2.4 3.1 5.1 : 7.0 New Zealand 0.2 5.4 -1.2 2.6 3.3 -0.7 -8.7 -0.5 0.8 3.3 : 4.0 Industrialised countries 60.9 8.1 5.8 8.5 6.0 2.0 -12.8 -13.7 0.2 3.6 : 4.9 Others 39.1 17.6 11.3 10.7 10.9 9.4 -9.4 -11.6 1.6 4.0 : 5.0 CIS 3.9 13.2 4.6 6.0 6.9 1.5 -7.8 -11.8 3.0 3.0 : 2.5 - Russia 2.7 11.8 6.5 7.3 6.3 0.5 -8.0 -11.6 3.0 3.0 : 2.5 - Other 1.2 16.4 0.4 3.1 8.2 3.7 -7.4 -12.4 3.0 3.0 : 2.5 MENA 5.9 18.3 13.8 9.6 -6.0 30.0 -8.3 -6.7 -5.3 2.5 : 5.0 Other emerging markets 29.2 18.0 11.7 11.5 14.8 6.3 -9.8 -12.5 2.7 4.4 : 5.3 Asia 22.1 19.7 11.6 12.4 18.2 6.7 -9.6 -12.4 2.9 4.3 : 5.5 - China 8.2 23.3 15.1 17.1 34.3 8.2 -8.0 -11.4 3.8 4.5 : 5.1 - India 1.5 24.4 20.3 20.4 4.8 15.3 -8.5 -6.8 3.1 3.8 : 7.2 - Hong Kong 2.4 16.1 10.9 9.4 8.1 0.9 -9.4 -10.3 3.0 3.4 : 3.9 - Korea 2.6 21.0 7.7 11.9 11.8 10.0 -9.4 -13.4 2.1 8.2 : 7.7 - Indonesia 0.8 12.4 59.5 6.8 7.2 15.3 -10.7 -12.1 2.0 2.5 : 5.8 Latin America 5.2 14.3 9.9 11.6 3.3 1.4 -11.0 -13.2 1.7 4.8 : 4.5 - Brazil 1.2 15.7 4.2 6.1 8.5 2.0 -9.0 -11.8 1.8 3.7 : 4.3 - Mexico 1.6 7.2 9.6 11.0 5.7 -1.5 -11.7 -15.9 1.3 7.0 : 4.9 Sub-Saharan Africa 1.9 8.8 18.7 1.4 7.3 14.8 -9.2 -12.2 1.9 4.0 : 4.5 World 100.0 11.8 8.0 9.4 7.9 4.9 -11.5 -12.9 0.7 3.7 : 4.9 World excluding EU 60.9 14.5 9.3 9.4 9.5 7.0 -10.8 -12.3 1.3 4.7 : 5.3 World excluding euro area 70.6 13.8 9.2 9.8 8.7 6.5 -10.8 -12.3 1.1 4.4 : 5.3(a) Relative weights, based on exports of goods and services (at current prices and current exchange rates) in 2008.(b) Intra- and extra-EU trade.
TABLE 57 : Export shares in EU trade (goods only - 2008)Other Sub
Candidate Industr. Rest Latin SaharanEU Countries USA Japan Canada Countries CIS MENA Asia America Africa World
EU 68.5 1.7 6.3 1.1 0.7 4.3 3.7 4.0 6.0 2.1 1.4 100 Belgium 76.9 1.1 5.4 0.8 0.7 2.7 1.5 3.2 5.0 1.4 1.3 100 Bulgaria 64.3 14.7 2.3 0.2 0.4 0.9 7.0 4.2 4.0 1.5 0.5 100 Czech Republic 85.4 1.1 1.8 0.4 0.1 2.2 4.1 1.6 2.2 0.7 0.4 100 Denmark 70.8 0.7 5.7 1.9 0.9 8.0 2.6 2.0 5.3 1.5 0.6 100 Germany 64.5 1.8 7.2 1.3 0.7 5.3 4.5 3.2 7.9 2.3 1.1 100 Estonia 69.0 1.3 3.9 0.5 0.8 4.0 12.8 1.3 2.3 0.5 3.4 100 Ireland 64.0 0.5 17.0 2.0 0.4 5.5 0.5 1.7 6.2 1.4 0.9 100 Greece 70.6 6.6 4.2 0.8 0.5 1.5 3.9 6.3 2.9 1.3 1.4 100 Spain 72.7 1.7 3.9 0.7 0.4 2.9 1.6 5.7 3.4 5.6 1.3 100 France 65.5 1.4 6.0 1.5 0.7 3.8 2.2 6.6 7.5 2.5 2.4 100 Italy 60.6 2.8 6.4 1.2 0.8 5.2 4.1 7.8 6.4 3.4 1.3 100 Cyprus 60.0 0.3 0.6 1.5 0.3 1.2 3.6 11.0 19.3 0.1 2.2 100 Latvia 71.2 0.1 1.3 0.5 0.3 3.7 19.7 1.4 1.1 0.5 0.2 100 Lithuania 62.4 0.8 2.4 0.1 0.4 3.3 27.2 1.2 1.4 0.4 0.4 100 Luxembourg 88.5 1.9 1.7 0.2 0.4 1.5 1.3 1.0 2.5 0.8 0.3 100 Hungary 80.0 3.1 2.2 0.4 0.2 1.6 6.5 2.4 2.4 0.5 0.8 100 Malta 47.7 0.4 10.5 4.8 0.5 0.9 0.3 5.3 26.9 1.1 1.8 100 Netherlands 78.7 1.1 4.1 0.7 0.4 2.5 2.6 2.7 4.3 1.5 1.5 100 Austria 73.0 2.2 4.6 0.9 0.7 5.5 4.1 2.3 4.4 1.4 0.9 100 Poland 78.5 1.5 1.4 0.2 0.4 2.8 11.0 1.3 1.7 0.9 0.5 100 Portugal 76.8 0.6 4.7 0.8 0.4 1.3 0.6 2.0 4.4 2.1 6.3 100 Romania 72.8 7.4 1.9 0.3 0.1 1.9 6.5 5.0 2.5 1.1 0.4 100 Slovenia 74.9 10.1 1.6 0.1 0.2 1.4 7.4 2.5 1.2 0.4 0.2 100 Slovakia 87.1 1.5 2.3 0.2 0.2 1.3 4.5 0.7 1.5 0.5 0.2 100 Finland 55.7 1.0 5.9 1.8 0.8 5.0 13.1 5.3 7.9 2.1 1.5 100 Sweden 60.9 0.9 7.1 1.2 1.0 12.3 3.0 3.2 6.5 2.4 1.5 100 United Kingdom 57.5 1.1 13.6 1.7 1.5 4.6 2.0 5.1 8.8 1.8 2.2 100

217
TABLE 58 : World imports of goods and services, volume (percentage change on preceding year, 2004-2011) 22.10.2009 2009 2010 2011 ( a ) 2004 2005 2006 2007 2008 IV-2009 X-2009 IV-2009 X-2009 IV-2009 X-2009
EU (b) 39.5 7.6 6.3 9.2 5.5 1.4 -11.1 -13.4 -0.9 1.2 : 3.8 Euro area (b) 29.2 7.0 5.8 8.5 5.5 1.1 -10.5 -12.5 -0.8 1.1 : 3.6 Candidate Countries 1.3 18.6 11.0 7.0 10.1 -2.7 -14.5 -19.8 4.1 4.5 : 6.0 - Croatia 0.2 4.7 3.9 7.4 6.5 3.6 -6.1 -21.5 2.6 2.5 : 2.5 - Turkey 1.1 20.8 12.2 6.9 10.7 -3.8 -15.9 -19.6 4.4 4.8 : 6.5 - The former Yugoslav Republic of Macedonia 0.0 16.7 6.2 10.9 17.4 5.8 -9.0 -19.7 5.6 1.4 : 2.8 USA 13.4 11.0 6.1 6.1 2.0 -3.2 -10.7 -14.9 1.5 7.5 : 5.7 Japan 4.5 8.1 5.8 4.2 1.5 0.9 -15.1 -16.7 -1.4 2.9 : 7.6 Canada 2.7 8.0 7.1 4.6 5.5 1.3 -12.8 -16.1 0.9 7.1 : 7.8 Norway 0.7 8.8 8.7 8.4 7.5 4.4 -9.8 -6.1 2.8 1.5 : 3.7 Switzerland 1.2 7.3 6.6 6.5 6.0 0.4 -11.1 -7.7 -0.6 -0.6 : 2.6 Iceland 0.0 14.5 29.3 10.4 -0.7 -18.3 -21.8 -15.5 3.7 3.7 : 4.7 Australia 1.3 13.3 7.6 7.3 10.3 11.1 -2.7 -6.2 3.4 4.8 : 7.0 New Zealand 0.2 13.0 5.9 1.2 5.9 4.0 -13.5 -11.0 1.0 4.1 : 5.3 Industrialised countries 64.8 8.8 6.4 7.9 4.7 0.6 -11.3 -13.9 -0.1 3.0 : 4.7 Others 35.2 12.6 12.1 11.6 10.6 8.5 -9.2 -11.1 2.8 3.7 : 4.2 CIS 3.2 19.1 9.8 15.1 21.2 13.3 -18.0 -18.6 2.4 2.5 : 3.0 - Russia 1.9 23.3 16.6 21.3 26.5 15.0 -20.0 -20.0 2.0 2.0 : 3.0 - Other 1.3 12.6 -0.8 5.5 13.1 10.5 -14.9 -16.5 3.0 3.4 : 2.9 MENA 4.1 6.7 15.3 11.8 12.2 17.1 1.8 0.9 2.2 2.3 : 3.1 Other emerging markets 27.9 12.7 11.9 11.1 9.2 6.7 -9.9 -12.1 2.9 4.1 : 4.6 Asia 20.8 13.9 12.8 11.3 8.1 7.2 -9.5 -11.7 3.2 3.8 : 4.6 - China 6.5 14.1 14.8 16.4 11.7 6.5 -7.8 -6.8 5.7 5.9 : 5.1 - India 2.0 14.9 48.5 22.7 15.9 25.1 -6.7 -10.3 1.6 2.6 : 3.3 - Hong Kong 2.3 14.6 7.6 9.2 8.3 0.9 -9.3 -10.3 1.9 1.8 : 2.0 - Korea 2.7 12.3 5.8 9.5 9.9 3.0 -14.1 -16.6 0.9 6.5 : 7.4 - Indonesia 0.8 12.0 25.7 -3.3 7.5 9.5 -11.8 -12.6 1.3 1.3 : 5.2 Latin America 5.3 9.5 7.0 11.6 12.7 4.3 -12.4 -14.1 2.6 5.4 : 4.7 - Brazil 1.2 7.3 -5.5 6.3 14.9 2.1 -14.0 -12.1 5.0 5.9 : 5.5 - Mexico 1.8 6.8 10.9 12.4 7.0 1.8 -13.8 -18.0 1.5 7.6 : 5.6 Sub-Saharan Africa 1.9 8.8 15.9 8.1 10.5 7.9 -7.3 -9.7 1.2 3.5 : 3.9 World 100.0 10.1 8.4 9.2 6.8 3.4 -10.6 -12.9 0.9 3.2 : 4.6 World excluding EU 60.5 11.7 9.8 9.1 7.6 4.6 -10.2 -12.6 2.1 4.6 : 5.0 World excluding euro area 70.8 11.5 9.5 9.6 7.4 4.3 -10.5 -13.0 1.6 4.1 : 5.0(a) Relative weights, based on imports of goods and services (at current prices and current exchange rates) in 2008.(b) Intra- and extra-EU trade.
TABLE 59 : Import shares in EU trade (goods only - 2008)Other Sub
Candidate Industr. Rest Latin SaharanEU Countries USA Japan Canada Countries CIS MENA Asia America Africa World
EU 65.6 1.4 4.3 1.9 0.6 4.6 5.3 3.6 9.3 2.2 1.2 100 Belgium 72.2 0.5 6.3 2.0 0.7 2.3 1.1 3.4 7.7 2.5 1.2 100 Bulgaria 53.8 9.5 1.0 0.5 0.1 1.2 24.5 0.8 4.7 3.5 0.3 100 Czech Republic 80.6 0.7 1.1 2.3 0.2 2.4 5.7 0.3 6.5 0.2 0.1 100 Denmark 74.7 1.2 3.0 0.8 0.4 7.0 1.7 0.5 8.9 1.4 0.4 100 Germany 67.4 1.4 4.7 2.2 0.4 5.6 3.9 1.7 9.9 1.9 1.0 100 Estonia 74.4 0.5 1.4 0.8 0.2 1.4 14.4 0.2 6.4 0.4 0.1 100 Ireland 70.9 0.8 9.6 1.8 0.4 4.3 0.7 0.5 9.8 0.9 0.4 100 Greece 62.2 3.8 2.7 1.7 0.2 2.4 6.4 9.2 9.3 1.6 0.4 100 Spain 66.5 1.4 2.5 1.5 0.3 2.9 1.8 7.5 8.4 4.4 2.8 100 France 71.2 1.1 4.2 1.3 0.5 4.5 2.3 5.0 6.8 1.5 1.7 100 Italy 58.5 2.1 2.6 1.3 0.5 4.2 8.0 10.8 8.2 2.7 1.1 100 Cyprus 39.8 0.1 0.9 4.0 0.1 0.7 33.1 5.9 12.5 2.8 0.1 100 Latvia 64.8 0.6 1.9 0.5 0.2 2.1 24.2 0.3 5.3 0.1 0.0 100 Lithuania 63.4 1.1 2.9 0.4 0.2 1.6 24.5 0.5 4.9 0.5 0.1 100 Luxembourg 82.7 0.3 3.7 0.7 0.9 1.3 0.9 0.3 8.9 0.2 0.1 100 Hungary 71.2 1.2 1.3 2.6 0.2 1.2 10.1 0.4 11.4 0.2 0.1 100 Malta 52.6 11.1 2.4 2.3 0.1 1.7 7.8 1.8 19.7 0.3 0.1 100 Netherlands 48.0 0.7 6.0 3.5 0.7 4.6 11.0 4.1 15.3 4.5 1.6 100 Austria 83.3 1.1 2.0 0.8 0.3 3.8 3.2 2.1 2.9 0.3 0.2 100 Poland 73.4 1.0 1.7 0.9 0.2 2.1 11.6 0.4 7.5 0.9 0.4 100 Portugal 72.6 0.8 2.9 1.0 0.2 2.5 3.3 4.7 4.9 3.7 3.5 100 Romania 70.4 6.4 1.0 0.4 0.2 1.4 10.8 2.0 6.0 1.0 0.2 100 Slovenia 81.4 5.9 1.0 0.7 0.3 1.4 1.4 1.1 5.2 1.2 0.2 100 Slovakia 75.8 0.6 1.1 0.7 0.2 1.0 11.8 0.1 8.6 0.0 0.0 100 Finland 58.7 0.5 3.3 2.7 0.8 4.3 14.6 0.3 12.6 1.9 0.4 100 Sweden 75.6 0.8 2.9 1.3 0.4 8.0 2.7 0.4 6.1 1.4 0.4 100 United Kingdom 57.0 1.5 7.7 2.6 1.9 9.1 2.5 2.3 12.3 1.7 1.4 100

218
TABLE 60 : World merchandise trade balances (fob-fob, bn. US dollars, 2003-2011) 22.10.2009 2009 2010 2011 2003 2004 2005 2006 2007 2008 IV-2009 X-2009 IV-2009 X-2009 IV-2009 X-2009
EU 83.0 62.5 -8.3 -82.7 -105.0 -177.2 -146.7 -46.8 -138.0 -16.0 : -5.3 EU, adjusted ¹ : -53.6 -119.4 -207.1 -219.3 -302.5 -270.7 -165.6 -263.0 -142.5 : -131.8 Euro area 158.7 170.1 115.5 75.2 118.0 53.1 7.0 79.8 10.6 106.9 : 116.3 Euro area, adjusted ¹ 111.6 117.2 54.3 15.4 63.5 -8.8 -44.7 21.1 -41.6 44.5 : 53.8 Candidate Countries -13.5 -23.7 -32.3 -39.8 -47.3 -72.7 -33.0 -34.6 -42.6 -44.5 : -53.0 USA -562.5 -684.7 -801.9 -860.5 -848.3 -859.6 -640.2 -524.0 -671.7 -609.1 : -623.0 Japan 103.4 128.6 93.9 81.4 104.7 39.1 85.6 30.1 105.1 50.6 : 26.4 Canada 40.3 50.6 51.4 43.6 44.8 44.1 6.2 -1.9 5.0 9.4 : 3.8 Norway 27.0 32.4 46.8 55.9 54.6 79.8 18.7 27.8 27.0 48.0 : 54.7 Switzerland 3.2 5.4 2.4 4.0 7.8 13.9 21.5 19.7 19.5 25.6 : 26.0 Iceland -0.2 -0.5 -1.5 -2.2 -1.4 -0.1 0.7 1.9 0.5 1.4 : 1.8 Australia -15.3 -18.1 -13.4 -9.6 -15.0 -4.1 -75.7 -8.4 -79.5 -1.9 : -1.2 New Zealand -0.5 -1.4 -2.6 -2.0 -1.8 -2.4 2.2 0.9 1.9 0.7 : 0.3 Industrialised countries -335.2 -449.0 -665.4 -812.0 -806.9 -939.2 -760.6 -535.3 -773.0 -535.6 : -569.6 Others 375.3 503.2 757.1 1004.3 931.4 986.3 622.1 704.2 677.1 733.5 : 816.4 CIS 62.1 93.2 129.4 150.5 136.8 184.4 59.9 70.7 96.7 103.7 : 125.6 MENA 113.9 188.5 309.5 422.1 296.5 379.1 52.3 185.4 64.5 240.0 : 271.2 Other emerging markets 199.3 221.5 318.2 431.8 498.1 422.8 510.0 448.1 515.9 389.8 : 419.6 Asia 144.0 140.4 199.0 292.8 388.0 313.9 489.0 404.3 479.7 344.9 : 374.5 Latin America 43.2 58.9 81.3 100.6 72.2 42.8 -3.4 16.5 9.2 18.3 : 16.5 Sub-Saharan Africa 12.1 22.2 37.9 38.4 38.0 66.1 24.4 27.3 27.0 26.5 : 28.6 World 40.1 54.3 91.7 192.3 124.5 47.2 -138.4 168.9 -95.9 197.9 : 246.8¹ See note 8 on concepts and sources.
TABLE 61 : World current account balances (bn. US dollars, 2003-2011) 2009 2010 2011 2003 2004 2005 2006 2007 2008 IV-2009 X-2009 IV-2009 X-2009 IV-2009 X-2009
EU 10.9 47.1 -36.1 -58.2 -73.3 -197.8 -252.8 -128.9 -266.7 -98.8 : -72.1 EU, adjusted ¹ : -46.2 -104.2 -186.4 -192.3 -374.0 -318.5 -295.9 -332.9 -276.6 : -249.8 Euro area 36.2 98.2 22.1 32.1 43.2 -112.5 -169.9 -86.7 -186.8 -73.3 : -65.7 Euro area, adjusted ¹ 23.4 75.3 11.4 -13.2 15.2 -148.1 -146.9 -120.4 -163.6 -109.2 : -101.6 Candidate Countries -7.5 -14.4 -22.1 -32.1 -38.2 -50.3 -15.0 -17.3 -23.8 -25.2 : -34.4 USA -516.1 -624.6 -740.5 -798.3 -724.6 -707.4 -494.4 -419.3 -525.5 -488.9 : -487.9 Japan 136.1 172.2 165.9 170.6 210.7 157.8 181.7 92.9 185.7 105.6 : 53.2 Canada 12.0 22.1 20.8 19.4 7.1 8.6 -20.4 -32.3 -22.5 -21.1 : -27.0 Norway 27.7 32.9 49.1 58.1 61.9 87.9 23.0 35.1 30.5 58.4 : 65.0 Switzerland 39.0 41.6 51.9 50.4 38.5 45.2 75.7 36.2 71.0 36.8 : 37.0 Iceland -0.5 -1.3 -2.7 -4.3 -4.1 -6.4 -0.2 -0.2 -0.7 -0.3 : -0.2 Australia -28.7 -38.9 -41.0 -41.5 -57.6 -44.0 -24.1 -34.4 -28.7 -28.0 : -28.0 New Zealand -3.5 -6.3 -9.3 -9.3 -10.6 -10.5 -5.7 -7.5 -6.0 -7.8 : -8.2 Industrialised countries -330.6 -369.6 -564.0 -645.1 -590.2 -716.8 -532.1 -475.8 -586.6 -469.3 : -502.5 Others 293.8 425.8 657.7 910.5 855.0 943.1 436.3 511.3 389.8 488.4 : 541.4 CIS 36.1 63.5 87.7 93.2 65.2 97.8 -15.6 10.7 15.0 37.4 : 57.2 MENA 88.9 168.5 291.0 402.1 272.5 351.5 53.0 139.6 -18.6 136.4 : 142.8 Other emerging markets 168.8 193.8 279.0 415.2 517.3 493.8 398.8 361.0 393.4 314.5 : 341.4 Asia 164.1 168.9 234.1 360.6 510.0 488.5 492.4 418.0 473.3 379.0 : 411.2 Latin America 10.1 23.0 37.8 51.7 18.0 -13.4 -75.7 -46.2 -65.7 -50.8 : -56.1 Sub-Saharan Africa -5.4 2.0 7.1 2.9 -10.7 18.7 -17.9 -10.8 -14.1 -13.7 : -13.8 World -36.8 56.2 93.7 265.4 264.8 226.4 -95.8 35.5 -196.9 19.1 : 38.9¹ See note 8 on concepts and sources.
TABLE 62 : Primary commodity prices (in US dollars, percentage change on preceding year, 2003-2011)SITC 2009 2010 2011Classification 2003 2004 2005 2006 2007 2008 IV-2009 X-2009 IV-2009 X-2009 IV-2009 X-2009Food (0 + 1) 3.1 12.4 4.2 11.4 9.2 20.7 -8.1 -10.3 2.1 4.0 : 1.1Basic materials (2 + 4) 7.5 17.0 6.9 31.7 13.4 8.7 -26.2 -26.1 -0.1 7.4 : 0.7- of which : Agricultures non-food 6.0 6.7 -4.5 7.4 16.8 10.9 -8.6 -17.9 -0.9 6.0 : 1.1 - of which : Wood and pulp 7.1 13.5 3.3 8.5 0.6 3.2 -0.7 -8.5 0.1 4.3 : 2.9 Minerals and metals 9.7 32.5 20.4 54.7 11.1 7.1 -35.3 -31.9 0.6 8.6 : 0.4Fuel products (3) 13.4 32.3 44.0 19.7 9.0 36.4 -44.6 -37.1 19.0 24.1 : 5.4- of which : Crude petroleum 13.9 33.4 44.7 20.2 9.5 35.9 -46.3 -37.8 20.0 24.8 : 5.1Primary commodities- Total excluding fuels 5.5 14.9 5.7 22.9 11.7 13.3 -20.6 -19.6 0.7 5.8 : 0.9- Total including fuels 11.9 27.7 35.9 20.2 9.5 32.2 -40.4 -34.5 14.8 20.8 : 4.7
Crude petroleum - price per barrelBrent (usd) 28.5 38.0 55.1 66.2 72.5 98.5 52.9 61.3 63.5 76.5 : 80.5Brent (euro) 25.2 30.6 44.3 52.7 52.9 67.2 40.1 44.1 47.7 51.7 : 54.4

219
Note on concepts and sources
1. The directorate general for economic and financial affairs (DG 8. EU and euro-area data are aggregated using exchange rates. ECFIN) produces, under its own responsibility, short-term fully- World GDP is aggregated using Purchasing Power Standards (PPS). fledged economic forecasts twice a year : in the spring and in In the tables on world trade and international payments, the the autumn. These forecasts cover the principal macroeconomic aggregation is carried out on the basis of current exchange rates. aggregates for the Member States, the Candidate Countries, Tables 48 - 52, 60 and 61 show also EU and euro-area "adjusted" the European Union as a whole, the euro area and the balances. Theoretically, balances of EU and euro area vis-à-vis international environment. Interim forecasts, updating the outlook third countries should be identical to the sum of the balances of the for the seven largest Member States, EU and the euro area, individual countries in the EU or the euro area. However, intra-EU are presented in between the fully-fledged forecasts. or intra-euro-area balances are non-zero because of reporting errors. The creation of the internal market in 1993 reduced border controls2. Data for 2009, 2010 and 2011 are forecasts. and formalities, and accordingly the scope and precision of intra-EU The sources for all tables are the Commission services, trade coverage. Typically, intra-EU imports are underestimated unless otherwise stated. compared to intra-EU exports, leading to an overestimation of the Historical data for the Member States are based on the European surplus. For the past the "adjusted" balances are Eurostat estimates System of Accounting (ESA 1995). Most Member States have for EU and ECB estimates for the euro area. For the future, they now introduced chain-linking in their national accounts to measure are ECFIN's forecasts based on the extrapolation of the discrepancies the development of economic aggregates in volume terms. observed in 2008. For the USA and Japan the definitions are as in the SNA.
9. With respect to the 12 RAMS (recently-acceded Member States),3. Tables 5 and 6 on domestic demand and final demand respectively, which are currently in a transition phase, the quality of statistical present data including inventories. data may not always be directly comparable to most EU15 Member
States.4. In Tables 16 and 17, the data are based on the national index for USA and Japan, and for EU Member States and aggregates prior to 1996. 10. Geographical zones are defined as follows :
Euro area : 5. The potential output gap is calculated with reference to potential EA16 (BE,DE,IE,EL,ES,FR,IT,CY,LU,MT,NL,AT,PT,SI,SK,FI) output as estimated via a production function, where the increase in Candidate countries : the capital stock and the difference between actual unemployment Croatia, Turkey and former Yugoslav Republic of Macedonia. and the NAWRU play a key role. Potential Candidates : Albania, Bosnia-Herzegovina, Kosovo, Montenegro and Serbia. 6. Employment data used in tables 21-25, 27 and 31-32 are based on Industrialised Countries : full-time-equivalents (FTEs), where available. Currently, Germany, EU, Candidate Countries, USA, Japan, Canada, Norway, Estonia, Spain, France, Italy, Hungary and the Netherlands Switzerland, Iceland, Australia and New Zealand. report FTE data (taken together, these countries represent MENA (Middle East and Northern Africa) : over 80% of euro-area GDP and more than 60% of EU GDP). In the Algeria, Bahrain, Egypt, Iran, Iraq, Israel, Jordan, Kuwait, absence of FTE data, employment is based on numbers of persons. Lebanon, Libya, Morocco, Oman, Qatar, Saudi Arabia, Syria, In the calculation of EU and euro-area aggregates, priority is given to Tunisia, and the United Arab Emirates. FTE data, as this is regarded as more representative of diverse Asia : patterns of working time. All countries except Japan and the Asian MENA countries.
Latin America :7. The nominal short term interest rates are defined as the 3-month All countries. inter-bank rates. The nominal long term interest rates are defined Sub-Saharan Africa : as the yield on the central government benchmark 10-year bond. All countries except the African MENA countries. For Estonia, where no appropriate benchmark government bond is available, the indicator provided in Table 34 is a weighted average of MFI interest rates for new EEK-denominated loans to households and non-financial businesses.

220