european economy. occasional papers. 6/2004. economic...
TRANSCRIPT

EUROPEAN
ECONOMY
EUROPEAN COMMISSION
DIRECTORATE-GENERAL FOR ECONOMIC AND FINANCIAL AFFAIRS
OCCASIONAL PAPERS
ISSN 1725-3209
N° 6 March 2004 Economic Review of
EU Mediterranean Partners by
Directorate General for Economic and Financial Affairs
http://europa.eu.int/comm/economy_finance/index_en.htm

Occasional Papers are written by the Staff of the Directorate-General for Economic and Financial Affairs, or by experts working in association with them. The “Papers” are intended to increase awareness of the technical work being done by the staff and cover a wide spectrum of subjects. Comments and enquiries should be addressed to the: European Commission Directorate-General for Economic and Financial Affairs Publications BU1 B – 1049 Brussels, Belgium KC-AH-04-006-EN-C ISBN 92-894-7102-6 ECFIN/124/04-EN This paper exists in English and French. © European Communities, 2004

Foreword This is the second issue of the “Economic Review of EU Mediterranean Partners", which reflects ongoing work within the Unit “Economic affairs of Mediterranean and Western Balkan non-member countries” in the European Commission’s Directorate General for Economic and Financial Affairs – Directorate for International Matters.1 The main purpose of this publication is to give an overview of recent macroeconomic and structural developments in Mediterranean countries which are partners of the EU in the Euro-Mediterranean Partnership. The structure of this second issue is as follows: • A broad overview of macroeconomic developments in the region as a whole. • A section that attempts to assess the fiscal performance of Mediterranean partner countries,
both in terms of fiscal outcomes and quality of public finances. • A section on the state of play of financial sector development, bank and non-bank finance in
Mediterranean partner countries. • Country specific sections on macroeconomic developments, structural reforms and
international relations for each of the Mediterranean Partner countries. The paper has been prepared by a staff team led by B. Kauffmann including M. Dodini (fiscal issues article, Egypt, Israel, Syria), I. Hoskins (financial sector article, Jordan, Lebanon, West Bank and Gaza) and G. Krause (macroeconomic overview article, Algeria, Morocco, Tunisia). The authors are grateful to A. Italianer, C. de la Rochefordière, P. Blanco Rodriguez (DG ECFIN), M. Berti Palazzi, J. Duynhouwer (DG AIDCO), and to B. Martens, B. Philippe, C. Heiberg, P. Frisch, M. Calderone, A. Mogni (DG RELEX) for useful comments and suggestions as well as to R. Torres Ruiz for editorial support. Special thanks are also owed to A. Becerra (Delegation Algeria), A. Cortezon and M. Gassend (Delegation Egypt), E. Inbar (Delegation Israel), P. Balacs (Delegation Jordan), M. Laurent (Delegation Morocco), J. Cassiers and F. Ferrandes (Delegation Syria), B. Brunet and P. Mathieu (Delegation Tunisia) as well as N. Karkutli and R. Guilford (EU Representation Office in West Bank and Gaza) for their comments and suggestions. Finally, the authors are also grateful to P. Alba (World Bank) and his colleagues for useful comments, as well as to Mr E. Mottu (IMF). Corresponding editor: Gerhard Krause European Commission BU-1 00/30 B - 1049 Brussels Tel: +32 2 299 18 63 Fax: +32 2 295 76 19 E-mail: [email protected], [email protected]
1 The previous issue is available on the Europa website at: http://europa.eu.int/comm/economy_finance/publications/occasional_papers/occasionalpapers2_en.htm

Contents Page Foreword .................................................................................................................................... iii Contents ....................................................................................................................................... v List of abbreviations ................................................................................................................. vii Part A. Regional overview Overview of economic developments in the Mediterranean region ....................................... 1 Fiscal consolidation in MED partner countries and selected structural issues ................. 12 Financial system development in Mediterranean partner countries ................................... 33 Part B. Country analysis Algeria........................................................................................................................................ 49 Egypt .......................................................................................................................................... 60 Israel .......................................................................................................................................... 71 Jordan ........................................................................................................................................ 82 Lebanon ..................................................................................................................................... 92 Morocco ................................................................................................................................... 101 Syria ......................................................................................................................................... 112 Tunisia ..................................................................................................................................... 123 West Bank and Gaza .............................................................................................................. 134 References................................................................................................................................ 143 List of tables, boxes and charts.............................................................................................. 148


List of abbreviations AA Association Agreement EFF Extended Fund Facility EFTA European Free Trade Association CPI Consumer Price Indicator DZA Algerian Dinar EC European Community ECB European Central Bank EdL Electricity of Lebanon EGP Egyptian Pound EIA Extended Impact Assessment EIB European Investment Bank FDI Foreign Direct Investment FEMIP Facility for Euro-Mediterranean Investment and Partnership FTA Free Trade Agreement GAFTA Great Arab Free Trade Area GDP Gross Domestic Product GFS Government Finance Statistics GNI Gross National Income GST General Sales Tax IBRD International Bank for Reconstruction and Development IFC International Finance Corporation JOD Jordanian Dinar MAD Moroccan Dirham MED Mediterranean Countries MEDA EU’s financial instrument for the Euro-Mediterranean Partnership MENA Middle East and North African region NIB National Investment Bank NIP National Indicative Program (European Commission) NIS New Israel Shekel OECD Organisation for Economic Cooperation and Development PA Palestinian Authority PMA Palestine Monetary Authority PMI Programme de Modernisation Industrielle (Tunisia) PSET Plan for Social and Economic Transformation (Jordan) PSF Price Stabilisation Fund PSRL Public Sector Reform Loans SAF Structural Adjustment Facility SDR Special Drawing Right SMEs Small and Medium Enterprises SYP Syrian Pound TUD Tunisian Dinar UNDP United Nations Development Program VAT Value Added Tax WB World Bank WB&G West Bank and Gaza WDI World Development Indicators WTO World Trade Organisation


Part A
Regional overview

Overview of economic developments in the Mediterranean region2
• In 2003, most Mediterranean countries experienced a moderate resumption in growth,
resulting in a doubling of the regional growth rate to 3.5%, up from 1.6% in 2002.3 However, the recovery remained constrained by low external demand from the EU, regional security concerns and a variety of domestic factors.
• The average regional inflation rate receded in 2003 to about 2.1%, as price pressures
softened throughout the region, in particular in Israel. In 2002, a variety of one-off factors, rather than demand-pull price pressures, had led to an average inflation rate of 3.3% for the region (1.9% in 2001).
• A number of MED countries faced difficulties in meeting their fiscal targets for 2002
and 2003 and the average regional balance deteriorated further to around 6% in 2003. In most of the countries concerned, there have been no clear signs pointing to a resumption of the fiscal consolidation process.
• Reform progress could be observed in selected areas, notably trade liberalisation, fiscal
management, privatisation and labour market policies. However, the worsening security situation, the slowdown in economic growth and a variety of domestic causes seem to have affected the reform momentum in the region since 2000.
Real sector developments In 2002, the average regional growth rate declined to 1.6%, marking together with the 2% growth rate in 2001 the weakest economic performance of the region since the beginning of the 1990's. Sluggish international demand for MED goods and services, stemming from the economic slowdown in the EU and the US resulted in a visible deceleration of MED exports. In addition, the events of September 11th affected growth in most MED countries via several channels. In particular, the impact on tourism and related economic activities was felt in Morocco, Tunisia and Egypt, where growth rates decreased noticeably. As in 2001, in Israel and the West Bank and Gaza, economic activities remained severely affected by the difficult domestic security situation, leading to a further reduction in their income level. On the contrary, Algeria, owing to favourable oil price developments and related robust investment activity, and Jordan, due to a strong export performance towards the USA, countered these negative developments and showed a moderate increase in their growth rates in 2002. In 2003, economic growth strengthened and most countries showed a remarkable resilience towards the Iraq crisis. The regional growth rate increased to 3.5% (Chart 1, table 1), albeit with wide differences within the Mediterranean region. GDP growth in the Maghreb countries was expected to accelerate by 6% in 2003, profiting in particular from a good harvest season and, in
2 The terms Mediterranean countries or MED countries in this paper refer, if not stated otherwise, to the Mediterranean countries participating in the Euro-Mediterranean Partnership. These are Algeria, Egypt, Israel, Jordan, Lebanon, Morocco, Syria, Tunisia and West Bank and Gaza. Although the term West Bank and Gaza is used on an equal footing with other country names, West Bank and Gaza has the status of a "territory". Turkey, which is a recognised EU candidate, and Cyprus and Malta, which are accession countries, are not covered in this paper. 3 If not otherwise stated, all the regional and/or aggregated data is weighted by nominal GDP.
- 1 -

the case of Algeria, favourable oil prices. These conditions have stimulated domestic demand in Algeria and Morocco, in particular investment. Growth in Algeria and Tunisia has also been supported by buoyant export activity. In contrast, the increase in economic activity in the Mashrek countries was more moderate, 2.8% in 2003 after 2.2% in 2002, partly reflecting the effects of the conflict in Iraq, as well as the continued unfavourable security situation in Israel and West Bank and Gaza.4 Close economic links with Iraq and their dependence on cheap oil delivery weighed on Jordan's and Syria's growth prospects, while the adverse affects of the regional security situation appeared to be less negative for Egypt (lower tourism but also higher Suez Canal transit). Finally, Israel's real GDP grew in 2003 for the first time in two years, although by a modest 1.0%, as the domestic security uncertainty has continued to restrain domestic demand.
-2
0
2
4
6
8
10
1996 1997 1998 1999 2000 2001 2002 2003
MaghrebMashrekIsraelMED Countries
Source: IFS, national statistical offices
Chart 1: Real economic developments in the MED regionin %, yoy
Mild upswing
MED Algeria Egypt Israel Jordan Lebanon Morocco Syria Tunisia WB & G.1995 5.0 3.8 7.1 8.7 6.4 6.5 -6.6 5.8 2.4 -1.51996 5.9 4.1 5.1 4.7 2.1 4.0 12.2 9.8 7.1 -0.11997 3.3 1.1 5.5 3.3 3.1 4.0 -2.2 5.0 5.4 12.21998 4.9 5.1 6.0 3.0 2.9 3.0 6.8 6.8 4.8 11.81999 3.1 3.2 5.7 2.6 3.1 1.0 -0.7 -3.6 6.1 8.92000 4.3 2.2 4.3 7.4 4.2 -0.5 2.4 0.6 4.7 -5.42001 2.0 2.6 2.7 -0.9 4.2 2.0 6.5 3.4 5.0 -15.02002 1.6 4.1 2.2 -1.0 5.1 2.0 3.2 3.2 1.7 -14.52003 3.5 6.8 3.0 1.0 3.0 2.2 5.5 2.0 5.7 4.5
Source: IFS, DRI-WEFA, National Authorities
Table 1: Real GDP growth in MED countries
During 2002, some inflationary pressures emerged in most Mediterranean countries, which may be mainly attributed to a variety of one-off factors rather than demand-pull price pressures. The average inflation rate for the MED countries climbed to 3.3% in 2002, and the increase was particularly marked in Israel and West Bank and Gaza, associated with the sharp depreciation of the New Israeli Shekel (NIS) at the beginning of the year, which fed into domestic prices. Inflation also increased in Lebanon, mainly due to the imposition of VAT on a broad range of
4 IMF, “World Economic Outlook 2003”, Washington, September 2003.
- 2 -
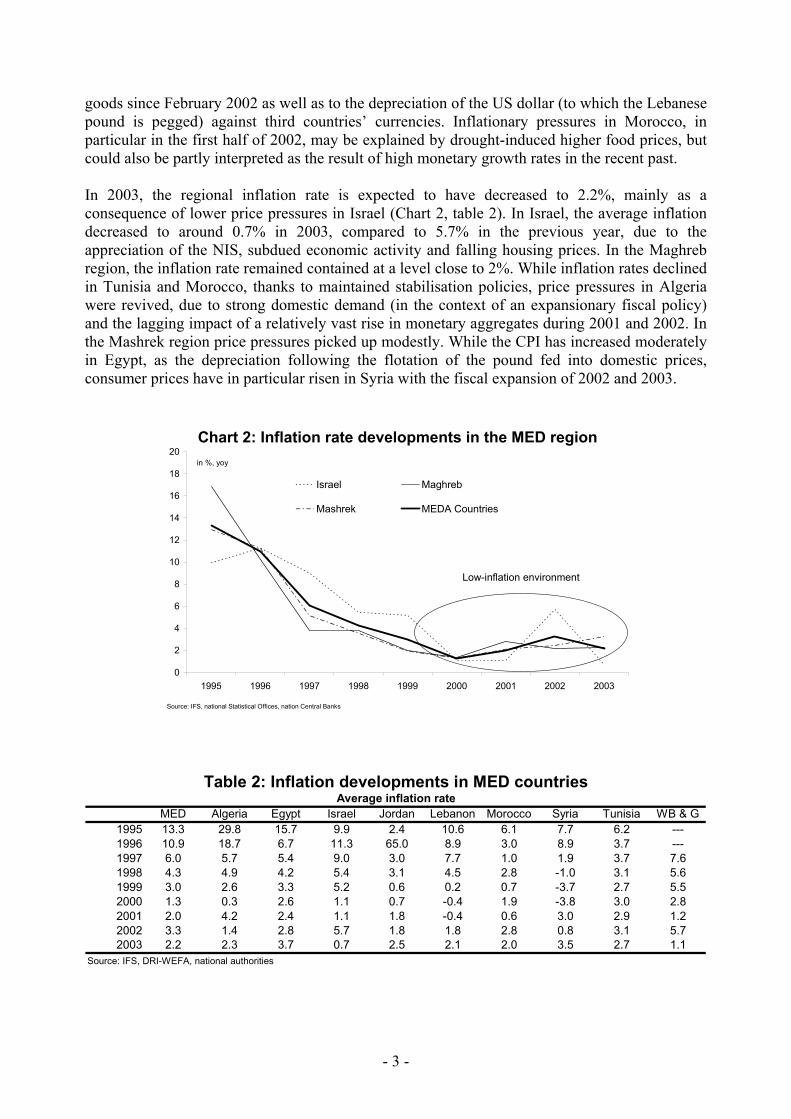
goods since February 2002 as well as to the depreciation of the US dollar (to which the Lebanese pound is pegged) against third countries’ currencies. Inflationary pressures in Morocco, in particular in the first half of 2002, may be explained by drought-induced higher food prices, but could also be partly interpreted as the result of high monetary growth rates in the recent past. In 2003, the regional inflation rate is expected to have decreased to 2.2%, mainly as a consequence of lower price pressures in Israel (Chart 2, table 2). In Israel, the average inflation decreased to around 0.7% in 2003, compared to 5.7% in the previous year, due to the appreciation of the NIS, subdued economic activity and falling housing prices. In the Maghreb region, the inflation rate remained contained at a level close to 2%. While inflation rates declined in Tunisia and Morocco, thanks to maintained stabilisation policies, price pressures in Algeria were revived, due to strong domestic demand (in the context of an expansionary fiscal policy) and the lagging impact of a relatively vast rise in monetary aggregates during 2001 and 2002. In the Mashrek region price pressures picked up modestly. While the CPI has increased moderately in Egypt, as the depreciation following the flotation of the pound fed into domestic prices, consumer prices have in particular risen in Syria with the fiscal expansion of 2002 and 2003.
0
2
4
6
8
10
12
14
16
18
20
1995 1996 1997 1998 1999 2000 2001 2002 2003
Israel Maghreb
Mashrek MEDA Countries
Source: IFS, national Statistical Offices, nation Central Banks
Chart 2: Inflation rate developments in the MED regionin %, yoy
Low-inflation environment
MED Algeria Egypt Israel Jordan Lebanon Morocco Syria Tunisia WB & G1995 13.3 29.8 15.7 9.9 2.4 10.6 6.1 7.7 6.2 ---1996 10.9 18.7 6.7 11.3 65.0 8.9 3.0 8.9 3.7 ---1997 6.0 5.7 5.4 9.0 3.0 7.7 1.0 1.9 3.7 7.61998 4.3 4.9 4.2 5.4 3.1 4.5 2.8 -1.0 3.1 5.61999 3.0 2.6 3.3 5.2 0.6 0.2 0.7 -3.7 2.7 5.52000 1.3 0.3 2.6 1.1 0.7 -0.4 1.9 -3.8 3.0 2.82001 2.0 4.2 2.4 1.1 1.8 -0.4 0.6 3.0 2.9 1.22002 3.3 1.4 2.8 5.7 1.8 1.8 2.8 0.8 3.1 5.72003 2.2 2.3 3.7 0.7 2.5 2.1 2.0 3.5 2.7 1.1
Source: IFS, DRI-WEFA, national authorities
Table 2: Inflation developments in MED countriesAverage inflation rate
- 3 -
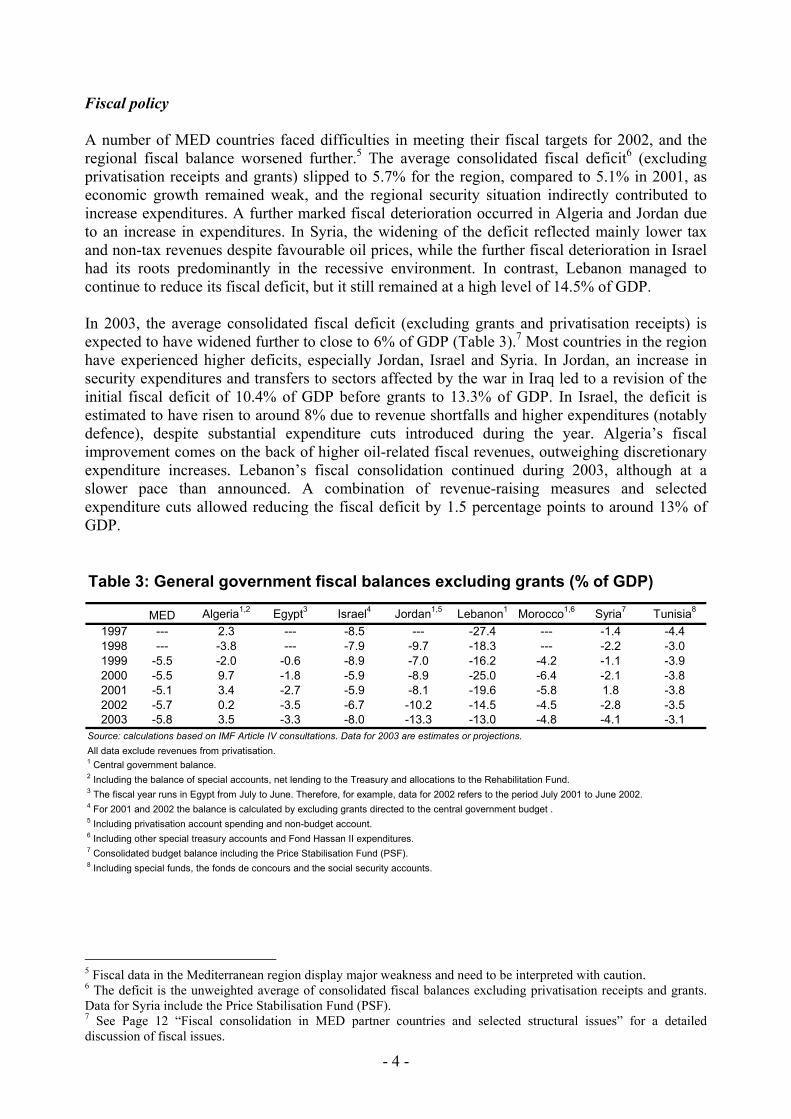
Fiscal policy A number of MED countries faced difficulties in meeting their fiscal targets for 2002, and the regional fiscal balance worsened further.5 The average consolidated fiscal deficit6 (excluding privatisation receipts and grants) slipped to 5.7% for the region, compared to 5.1% in 2001, as economic growth remained weak, and the regional security situation indirectly contributed to increase expenditures. A further marked fiscal deterioration occurred in Algeria and Jordan due to an increase in expenditures. In Syria, the widening of the deficit reflected mainly lower tax and non-tax revenues despite favourable oil prices, while the further fiscal deterioration in Israel had its roots predominantly in the recessive environment. In contrast, Lebanon managed to continue to reduce its fiscal deficit, but it still remained at a high level of 14.5% of GDP. In 2003, the average consolidated fiscal deficit (excluding grants and privatisation receipts) is expected to have widened further to close to 6% of GDP (Table 3).7 Most countries in the region have experienced higher deficits, especially Jordan, Israel and Syria. In Jordan, an increase in security expenditures and transfers to sectors affected by the war in Iraq led to a revision of the initial fiscal deficit of 10.4% of GDP before grants to 13.3% of GDP. In Israel, the deficit is estimated to have risen to around 8% due to revenue shortfalls and higher expenditures (notably defence), despite substantial expenditure cuts introduced during the year. Algeria’s fiscal improvement comes on the back of higher oil-related fiscal revenues, outweighing discretionary expenditure increases. Lebanon’s fiscal consolidation continued during 2003, although at a slower pace than announced. A combination of revenue-raising measures and selected expenditure cuts allowed reducing the fiscal deficit by 1.5 percentage points to around 13% of GDP.
MED Algeria1,2 Egypt3 Israel4 Jordan1,5 Lebanon1 Morocco1,6 Syria7 Tunisia8
1997 --- 2.3 --- -8.5 --- -27.4 --- -1.4 -4.41998 --- -3.8 --- -7.9 -9.7 -18.3 --- -2.2 -3.01999 -5.5 -2.0 -0.6 -8.9 -7.0 -16.2 -4.2 -1.1 -3.92000 -5.5 9.7 -1.8 -5.9 -8.9 -25.0 -6.4 -2.1 -3.82001 -5.1 3.4 -2.7 -5.9 -8.1 -19.6 -5.8 1.8 -3.82002 -5.7 0.2 -3.5 -6.7 -10.2 -14.5 -4.5 -2.8 -3.52003 -5.8 3.5 -3.3 -8.0 -13.3 -13.0 -4.8 -4.1 -3.1
Source: calculations based on IMF Article IV consultations. Data for 2003 are estimates or projections.All data exclude revenues from privatisation.1 Central government balance.2 Including the balance of special accounts, net lending to the Treasury and allocations to the Rehabilitation Fund.3 The fiscal year runs in Egypt from July to June. Therefore, for example, data for 2002 refers to the period July 2001 to June 2002.4 For 2001 and 2002 the balance is calculated by excluding grants directed to the central government budget .5 Including privatisation account spending and non-budget account.6 Including other special treasury accounts and Fond Hassan II expenditures.7 Consolidated budget balance including the Price Stabilisation Fund (PSF).8 Including special funds, the fonds de concours and the social security accounts.
Table 3: General government fiscal balances excluding grants (% of GDP)
5 Fiscal data in the Mediterranean region display major weakness and need to be interpreted with caution. 6 The deficit is the unweighted average of consolidated fiscal balances excluding privatisation receipts and grants. Data for Syria include the Price Stabilisation Fund (PSF). 7 See Page 12 “Fiscal consolidation in MED partner countries and selected structural issues” for a detailed discussion of fiscal issues.
- 4 -
Exchange rate and monetary policy Some exchange rate regimes were recently modified towards a higher, albeit incomplete, degree of flexibility, and further changes are expected. In 2002, Israel continued to widen the exchange rate band in which the shekel is traded. This measure was accompanied by the full liberalisation of capital flows by the beginning of 2003. Egypt abandoned - under market pressure - its exchange rate band around the US dollar in early 2003 and officially moved to a floating regime8. However, due to continuous government intervention, it appears closer to a soft peg or a strongly managed floating regime. In 2001, Morocco increased the weight of the euro in its reference basket. This was combined with a small devaluation of the dirham. Pressures for further adaptations in the medium to long term in the Mediterranean region stem from the capital liberalisation process, as well as from some countries’ unsustainable combination of fixed exchange rate regime and large fiscal deficits. Despite a general trend towards higher flexibility of exchange rate regimes in the past few years, the management of the exchange rate regime has continued to play a vital part in the monetary policy framework of Mediterranean countries, as most of them are relatively open economies (average trade to GDP ratio of 66%). As of December 2003 exchange rate regimes could be classified into three categories; soft pegs9 (Jordan, Lebanon, Morocco and Syria), exchange rate bands (Israel), managed floating exchange rates (Algeria, Tunisia, Egypt). De facto, the Israeli exchange rate regime can be perceived as a free floating regime, due to the width of the exchange rate band (currently around 50%), while the Egyptian exchange rate regime, though classified officially as a floating regime since the beginning of 2003,10 appears to be much closer to a soft peg or a strongly managed floating regime, as already mentioned above. Moreover, most exchange rate regimes are still supported by substantial restrictions on capital flows, except in Lebanon and Israel. External sector developments In 2002, merchandise trade of the Mediterranean region was affected by the global downturn, as well as by domestic factors. Average export growth11 of goods declined by around 1% (2001: -5%), as lower export activity in the largest economies of the region (Israel, Egypt and Algeria) outweighed double-digit export increases by other economies. Import growth11 displayed a moderate growth rate, of around 3% (2001: -2.1%), reflecting subdued but slowly recovering domestic demand across the region. These trends resulted in a worsening of the aggregated trade balance in the region12 from -2.9% of GDP in 2001 to -4% of GDP in 2002. Nevertheless, thanks to significant private remittances, positive balances of services and official transfers, the current account balances12 continued to show a brighter picture compared to trade balances. The regional current account balance deteriorated more modestly to 0.8% of GDP, compared to a surplus of 0.9% of GDP in 2001.
8 See country section on Egypt for a detailed discussion of the change of the exchange rate regime. 9 Pegs other than currency boards. 10 IMF (various years), Annual Report on Exchange Arrangements and Exchange Restrictions, Washington. 11 Export and import growth rates refer to USD nominal values. Volume data is incomplete. 12 This balance is calculated as the average of the individual MED countries balances and does not correct for intra-regional trade.
- 5 -

-10%
-5%
0%
5%
10%
15%
20%
25%
30%
1990 1991 1992 1993 1994 1995 1996 1997 1998 1999 2000 2001 2002 2003
Exports Imports
Source: DRI-WEFA
Chart 3: Export and import developments
% change of nominal values
Exceptional increase in Algeria
Pick up of export growth
In 2003, a pick up in export growth in combination with a more moderate resumption of imports led to a mild improvement in some countries’ external accounts (Chart 3). Overall, the regional aggregate trade deficit12 is estimated to have improved somewhat to 3.4% of GDP in 2003, while the current account balance should have advanced to around 2% of GDP (Chart 4). The regained export dynamics appears to have been widespread throughout the region, except in Morocco and, to a lesser extent, in Jordan and Syria, stemming predominantly from continued favourable oil exporting conditions and a real depreciation of exchange rates in 2002. The strongest export increase is expected to have been achieved in Algeria (around 25%), based on favourable oil price developments, as well as on the activation of new oil production capacities. In contrast, the export performance of Jordan and Syria was held back by the crisis in Iraq, their biggest trading partner, while Morocco appears to have been particularly affected by low EU demand. Despite some progress, Lebanon’s trade and current account deficit situation, amounting to 29% and 15.1% of GDP in 2003, respectively, continues to appear critical.
-8.2
-26.0-28.5
-10.0
2.40.4 1.8
-13.9
16.6
-2.4
-9.2
6.8
11.5
7.0
-15.1
-2.9
3.9
-40
-30
-20
-10
0
10
20
Algeria Egypt Israel Jordan Lebanon Morocco Syria Tunisia WB&Gaza
Trade balanceCurrent account balance
Chart 4: MED external account balances in 2003 (est.) in % of GDP
Source: National Statistical Offices, national Central Banks. 2002/03 data for Egypt.
-76.2%
- 6 -
Foreign direct investments strongly decreased in 2002, in the aftermath of September 11th and the deterioration of the security situation in the region, but some improvement can be witnessed since the second quarter of 2003. FDI flows to Mediterranean countries have more than halved in 2002 (USD 4.1 billion, 1% of GDP) compared to 2001 (USD 8.3 billion, 2.1% of GDP).13 While the decrease in Morocco rather reflects a reversal of an exceptional situation in 2001, with the partial sale of Maroc Telecom in 2001, the decline in Israel from USD 3.5 billion to USD 1.6 billion in 2001 is due to the worsening of the security situation and, hence, of the business climate, as well as to the crisis of the high-tech sector. Since the second quarter of 2003, after the end of major hostilities in Iraq, a mild resumption of FDI flows appeared to be under way, making overall direct foreign investments of 1.5% of GDP for the region possible for 2003. Structural reforms Some progress in selected reform areas could be noted in the Mediterranean region in the period 2002-03. With regard to trade liberalisation, particular progress could be observed in Morocco14 and Tunisia, while Lebanon advanced on negotiating the terms of its accession to the WTO, expected to be concluded in 2004. In the fiscal area, the most noteworthy measures taken relate to the introduction of the VAT in Lebanon, the public administration reform in Morocco and Jordan, and the establishment in the West Bank and Gaza of a Single Treasury Account that now channels all revenue transfers to the Ministry of Finance. The privatisation process yielded mixed results, however with a number of successful operations in particular in Jordan, Morocco, and, more recently, in Israel. Finally, labour market regulations changed for the better in Egypt and Morocco through the adoption of a “Unified Labour Law” and the “Labour Code”, respectively, providing a comprehensive framework for the functioning of both the labour market and labour relations.
-1.0
-0.8
-0.6
-0.4
-0.2
0.0
0.2
0.4
0.6
0.8
1.0
Israel Maghreb Mashrek MED Accession countries*
1996 1998 2000 2002
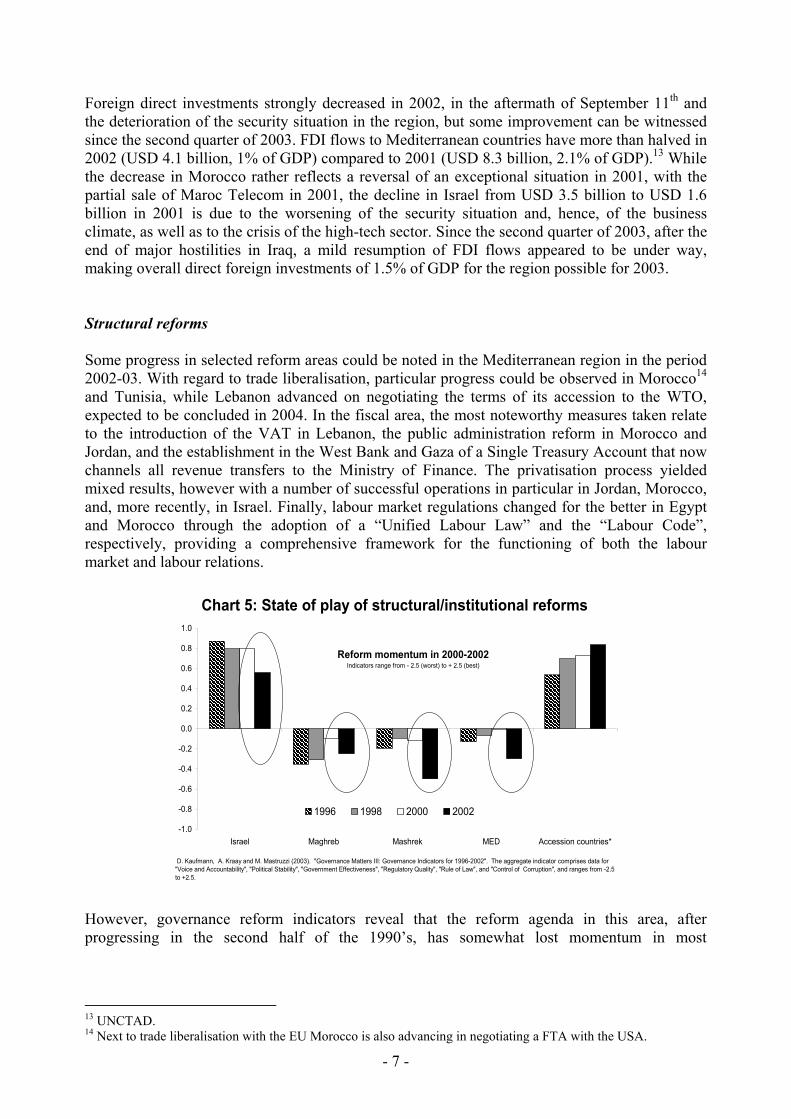
Chart 5: State of play of structural/institutional reforms
Reform momentum in 2000-2002Indicators range from - 2.5 (worst) to + 2.5 (best)
D. Kaufmann, A. Kraay and M. Mastruzzi (2003). "Governance Matters III: Governance Indicators for 1996-2002". The aggregate indicator comprises data for "Voice and Accountability", "Political Stability", "Government Effectiveness", "Regulatory Quality", "Rule of Law", and "Control of Corruption", and ranges from -2.5 to +2.5.
However, governance reform indicators reveal that the reform agenda in this area, after progressing in the second half of the 1990’s, has somewhat lost momentum in most
13 UNCTAD. 14 Next to trade liberalisation with the EU Morocco is also advancing in negotiating a FTA with the USA.
- 7 -
Mediterranean countries since 2000 (Chart 5).15 The aggregate governance reform index fell from around 0 in 2000 to -0.3 (on a scale ranging from -2.5 to + 2.5) in 2002, as the worsening security situation, the slowdown in economic growth and various domestic factors reduced governments' willingness to reform. This evolution compares negatively with developments in accession countries, where progress with the reform agenda continued. Out of the nine MED Partners, only Algeria (improvement in the regulatory and legal framework, measures related to accountability) and Syria (progress in controlling corruption and government effectiveness) managed to score better results in 2002 compared to 2000. Despite some structural reform efforts and successes during the last decade, economic activity seems to be still constrained by numerous factors, and further reforms need to be implemented. Most Mediterranean countries display unsupportive business environments, large and dominating governments and underdeveloped financial sectors. As for the latter, the countries of the region should work on improving the access to finance for small and medium sized enterprises, promoting competition in the banking sector, and enabling the development of more competitive financial intermediation. In general, efforts need to be intensified to turn the Mediterranean countries into efficient and well-functioning market economies, driven by the private sector, and supported by an efficient public administration. Particularly, further improvement is important regarding reinforcing legal frameworks and promoting good governance and the reform of the role of the state as well as of public administration. Finally, Mediterranean countries need to close a growing “knowledge gap” by investing heavily in education and raising its quality, promoting open inquiry and encouraging interaction with other cultures.16 Trade liberalisation is another key factor where the reform momentum needs to be maintained. So far, Association Agreements for the establishment of a free trade area as a key objective have been signed with almost all Mediterranean countries. In this context, Tariff liberalisation is advancing, and has particularly moved forward in Tunisia and Morocco. However, intra-regional trade remains still limited, with the trade turnover conducted between MED countries amounting to around 5% of the total turnover. The current South-South integration process is slower that originally anticipated but might get some stimulus from the Agadir Agreement signed on February 25, 2003. Despite similar specialisation pattern at first glance, a detailed analysis reveals some scope for further trade in some countries in the region, as different structures of comparative advantages appear to exist.17 The establishment of a regional free trade area, as well as the development of key infrastructures, such as regional transport and energy networks, are crucial to establish an integrated economic space, which in turn represents an important stimulus to attract FDI to the Mediterranean region. International relations Relations between the Mediterranean partners and the EU are governed by the Euro-Mediterranean Partnership,18 of which the Association Agreements (AA) are a vital feature
15 D. Kaufmann, A. Kraay and M. Mastruzzi (2003). "Governance Matters III: Governance Indicators for 1996-2002". The indicator comprises data for "Voice and Accountability", "Pol. Stability", "Gov. Effectiveness", "Regulatory Quality", "Rule of Law", and "Control of Corruption". 16 UNDP, “Arab Human Development Report”, New York, October 2003. 17 Krause G., “Export competition between Morocco and accession countries: some stylised facts”, Brussels, forthcoming. 18 The Euro-Mediterranean partnership was established in December 1995 on the basis of the "Barcelona Declaration".
- 8 -
(Table 4).19 The Partnership (also known as the “Barcelona process”) provides a comprehensive framework for Euro-Mediterranean relations structured along three pillars: a political and security partnership, an economic and financial partnership, and a partnership in social, cultural and human affairs. The economic and financial Partnership’s goal is to create an area of shared prosperity through the progressive establishment of a Euro-Mediterranean Free Trade Area, with the financial support provided by the MEDA financial instrument of the EU. The completion of a Free Trade Area rests on the conclusion of bilateral AA between the EU and each Mediterranean partner. Besides free trade, these Agreements provide also the institutional framework for bilateral relations in the political, economic, social and cultural fields.
Partner Conclusions of Signature of Entry intonegotiations agreement force
Tunisia Jun-95 Jul-95 Mar-98Israel Sep-95 Nov-95 Jun-00Morocco Nov-95 Feb-96 Mar-00WB&G Dec-96 Feb-97 July-97 (Interim A.)Jordan Apr-97 Nov-97 May-02Egypt Jun-99 Jun-01 Jan-04 (Interim A.)Algeria Dec-01 Apr-02Lebanon Jan-02 May-02 Mar-03 (Interim A.)Syria techn. agreem. Dec-03Source: EU Commission
Table 4: EU-Mediterranean Association Agreements
An essential part of the Euro-Mediterranean partnership is the financial support from the EU MEDA instrument. MEDA was devised to accompany and support economic and social adjustments needed by Mediterranean partners, notably as they open their economies to trade with the EU. Under MEDA II, running from 2000 until 2006 with a budget of EUR 5.35 billion, free trade and economic reforms remain at the core of Community financial support. The main priorities of MEDA II are to assist the Mediterranean partners in implementing free trade with the EU, and to achieve sustainable economic growth through macro-economic and structural reforms. MEDA resources are also targeted at alleviating the negative effects which this process may have on the poorest groups of the society. The grants from the MEDA Community budget are complemented by lending operations from the European Investment Bank (EIB). The Bank is very active in the region, where it has a lending portfolio of about EUR 10 billion. A Euro-Mediterranean Investment Facility (FEMIP) was recently set up within the EIB, grouping all its operations with Mediterranean Partners. It started to operate in September 2002, already committed EUR 1.8 billion of new loans, and plans to increase lending to the region to about EUR 2 billion annually by 2006. The Facility has a special mandate to promote private sector development, given its crucial role in reaching sustained growth rates. Out of the EUR 1.8 billion loans committed during the first year of life of the Facility, some 60% supported private sector projects. The Bank also manages MEDA-funded risk capital and technical assistance to support investment projects. Box 1: Review of FEMIP In March 2002, the Ecofin and the European Council decided to enhance the EIB’s existing activities in the region through the creation of the Facility for the Euro-Mediterranean Investment and Partnership (FEMIP). FEMIP was officially launched at a meeting held in Barcelona on 18 October 2002. At the time
19 http://europa.eu.int/comm/external_relations/euromed/index.htm
- 9 -

of creation, it was agreed that the incorporation of this facility into an EIB subsidiary should be examined after one year. To facilitate the requested review, the Commission launched an Extended Impact Assessment (EIA) exercise20, which concluded that, while keeping FEMIP is very cost effective, a subsidiary would be more efficient in meeting the instrument's private sector development mandate21. Taking the EIA findings into account, the Commission adopted a Communication22 favouring FEMIP's incorporation into a subsidiary, which would be more tailor-made to private sector needs and, thus, more effective, and which would also ensure a high degree of visibility and ownership of the instrument. The Commission, however, noted that the two options were not exclusive, and that FEMIP could be developed as a first stage, and incorporated as a second stage. The review requested by the Council in March 2002 took place at the Ecofin Council on 25 November 2003. The Council agreed, on the basis of FEMIP’s experience, and following a consultation of Mediterranean Partners, to develop this instrument further, and to reinforce FEMIP within the Bank. The “reinforced” FEMIP will include a number of features in support of private sector development. Council conclusions also foresee that the incorporation of an EIB majority-owned subsidiary dedicated to the Mediterranean Partners will be fully reassessed in December 2006. Relations between the EU and the Mediterranean partner countries should be intensified further in the context of the European Neighbourhood Policy launched in 2003. The policy was designed as a new framework of relations with the EU eastern and southern neighbours in the wake of enlargement. Building on existing relations and reciprocal engagements (notably the Euro-Mediterranean partnership), the European Neighbourhood Policy aims to develop a zone of prosperity and friendly neighbourhood, a “ring of friends” with whom the EU enjoys close, peaceful and co-operative relations. In the economic domain, this is to be achieved through additional trade and market opening, the prospect of a stake in the EU’s Internal Market by the neighbours, and enhanced financial and technical assistance. The provision of these incentives will be linked to concrete progress demonstrating shared values and effective political, economic and institutional reforms by the neighbours. On the basis of an assessment of the current state of the EU neighbours and their relations with the EU, Action Plans will be negotiated and agreed with those participating in the process in 2004, detailing the EU incentives as well as the steps to be taken in order to benefit from them. The IMF actively supports the adoption of sound economic policies and reforms in Mediterranean countries. IMF interventions predominantly take the form of policy discussions and advice, as well as technical assistance, especially regarding public sector reform, transparency issues, financial market development, integration with the global economy, reform of exchange rate regimes and assistance in post-conflict situations.23 Its lending activities are limited to Jordan, which is the only country to have a formal programme with the Fund so far, i.e. early 2004. In July 2002, a two-year stand-by credit of about USD 113 million was approved, offering continued support to Jordan’s economic program, including extensive structural reforms.24Although the IMF has no formal relations with West Bank and Gaza, given their status of ‘territories’, a resident representative plays an important advising role in the fiscal area, as well as on overall economic reforms in the context of conditions for receiving donor assistance.
20 Impact assessments are used by the Commission as a tool to improve the policy development process and are to be carried out for all major initiatives. See Communication of the Commission on Impact Assessment, dated 5.6.2002 COM(2002) 276. 21 “Shaping support for private sector development in the Mediterranean”, 15.10.2003, SEC(2003) 1110. 22 The Commission Communication was adopted on 15 October 2003. ”Shaping support for private sector development in the Mediterranean”, 15.10.2003, COM(2003)587final. 23 IMF, “The IMF and the Middle East and North Africa”, an Issues Brief, Washington, August 2003. 24 Jordan completed a three-year, SDR 127.88 million (about USD 160 million) Extended Fund Facility (EFF) arrangement in May 2002.
- 10 -

The World Bank maintains a strong presence in the region with a large variety of activities, including in particular direct lending operations. As of December 2003, the World Bank portfolio in the Mediterranean region consisted of 109 active projects amounting to around USD 4.2 billion.25 Projects in the Mediterranean aim at strengthening the momentum for building a climate for investment, job creation and sustainable growth, and at empowering the poor with the knowledge and skills required to enable them to build sustainable livelihoods. Against this background, the World Bank’s regional MENA26 strategy highlights five priorities for countries in the region: education for a global world, sustainable water resource management, gender, public sector efficiency and governance, and knowledge and partnership.
25 Source: World Bank, http://www.worldbank.org/html/extdr/regions.htm#m 26 The MENA region includes MED countries plus, Djibouti, Iran, Iraq, Yemen, Bahrain, Kuwait, Libya, Malta, Oman, Qatar, Saudi Arabia, and the United Arab Emirates.
- 11 -

Fiscal consolidation in MED partner countries and selected structural issues27
• Fiscal positions improved markedly in all Mediterranean countries during the 1980s and 1990s, although in recent years they deteriorated in some of them. The fiscal positions of most Mediterranean countries still display some elements of structural fragility.
• Weak economic growth since 2001 in most of the region, in particular in the private
sector, has called into question the benefits of maintaining substantial public involvement in the economy. It also highlighted the need to rationalise and raise the effectiveness of public expenditures and improve the budgetary process.
• Tax reforms are on the agenda of all Mediterranean countries. Trade liberalisation
under the Euro-Mediterranean Association Agreements has raised the need to strengthen alternative sources of revenues to compensate for the loss of customs receipts. In some countries, fiscal reforms benefit from financial support from the EU and other donors.
1. Introduction This section attempts to assess the fiscal performance of Mediterranean partner countries, both in terms of fiscal outcomes and quality of public finances. It begins by reviewing progress towards fiscal consolidation undertaken by countries in the region since the 1980s and their fiscal performance. It then assesses the evolution and composition of public expenditures and revenues, and outlines recent and ongoing structural reforms on the expenditure and revenue sides. It concludes with some considerations on the possible future size and role of the state in the region's economies, as well as highlighting issues related to the improvement of the efficiency and effectiveness of public finances. Fiscal information for the Mediterranean countries is generally fragmented. As a reflection of this, data sources used in this paper are multiple. The main ones are the Government Finance Statistics (GFS) database of the IMF and IMF Article IV consultations. These have been completed by national sources and the World Development Indicators (WDI) database of the World Bank. The cross-country and time comparability of the different data sets is complicated by presentation of data at different levels of aggregation, sudden changes in classification, interruptions in the time series, extra-budgetary accounts and, sometimes, missing information for specific budget items or recent years.28
27 This section is based on a background paper prepared for the Second Euro-Mediterranean Regional Economic Dialogue in Rome on 20 October 2003. The link to the dialogue’s site is: http://europa.eu.int/comm/external_relations/euromed/etn/red/agenda.htm. 28 For each country, data at the widest possible level of aggregation was used, conditional upon the need to carry out cross-country comparisons and historical analyses. Data from Article IV consultations (at the level of general government, unless otherwise indicated) was used in section 2 and parts of sections 5 and 6. On the other hand, GFS data (at the level of consolidated central government, unless otherwise indicated) was the main source used in section 3 and parts of sections 5 and 6. The WDI database was used to check MED fiscal data against comparator countries. In general, due to data limitations, comparisons and interpretations need to be made with caution.
- 12 -
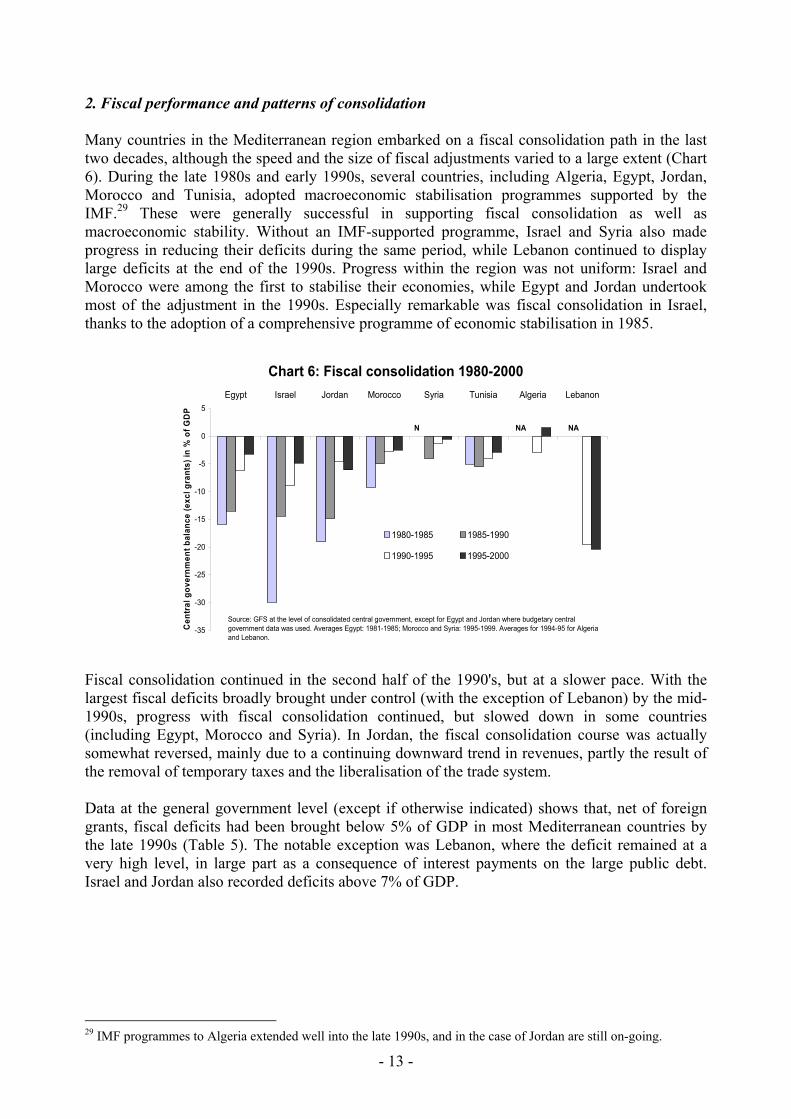
2. Fiscal performance and patterns of consolidation Many countries in the Mediterranean region embarked on a fiscal consolidation path in the last two decades, although the speed and the size of fiscal adjustments varied to a large extent (Chart 6). During the late 1980s and early 1990s, several countries, including Algeria, Egypt, Jordan, Morocco and Tunisia, adopted macroeconomic stabilisation programmes supported by the IMF.29 These were generally successful in supporting fiscal consolidation as well as macroeconomic stability. Without an IMF-supported programme, Israel and Syria also made progress in reducing their deficits during the same period, while Lebanon continued to display large deficits at the end of the 1990s. Progress within the region was not uniform: Israel and Morocco were among the first to stabilise their economies, while Egypt and Jordan undertook most of the adjustment in the 1990s. Especially remarkable was fiscal consolidation in Israel, thanks to the adoption of a comprehensive programme of economic stabilisation in 1985.
Chart 6: Fiscal consolidation 1980-2000
-35
-30
-25
-20
-15
-10
-5
0
5Egypt Israel Jordan Morocco Syria Tunisia Algeria Lebanon
Cen
tral
gov
ernm
ent b
alan
ce (e
xcl g
rant
s) in
% o
f GD
P
1980-1985 1985-1990
1990-1995 1995-2000
Source: GFS at the level of consolidated central government, except for Egypt and Jordan where budgetary central government data was used. Averages Egypt: 1981-1985; Morocco and Syria: 1995-1999. Averages for 1994-95 for Algeria and Lebanon.
N NNA A
Fiscal consolidation continued in the second half of the 1990's, but at a slower pace. With the largest fiscal deficits broadly brought under control (with the exception of Lebanon) by the mid-1990s, progress with fiscal consolidation continued, but slowed down in some countries (including Egypt, Morocco and Syria). In Jordan, the fiscal consolidation course was actually somewhat reversed, mainly due to a continuing downward trend in revenues, partly the result of the removal of temporary taxes and the liberalisation of the trade system. Data at the general government level (except if otherwise indicated) shows that, net of foreign grants, fiscal deficits had been brought below 5% of GDP in most Mediterranean countries by the late 1990s (Table 5). The notable exception was Lebanon, where the deficit remained at a very high level, in large part as a consequence of interest payments on the large public debt. Israel and Jordan also recorded deficits above 7% of GDP.
29 IMF programmes to Algeria extended well into the late 1990s, and in the case of Jordan are still on-going.
- 13 -

MED Algeria1,2 Egypt3 Israel4 Jordan1,5 Lebanon1 Morocco1,6 Syria7 Tunisia8
1997 --- 2.3 --- -8.5 --- -27.4 --- -1.4 -4.41998 --- -3.8 --- -7.9 -9.7 -18.3 --- -2.2 -3.01999 -5.5 -2.0 -0.6 -8.9 -7.0 -16.2 -4.2 -1.1 -3.92000 -5.5 9.7 -1.8 -5.9 -8.9 -25.0 -6.4 -2.1 -3.82001 -5.1 3.4 -2.7 -5.9 -8.1 -19.6 -5.8 1.8 -3.82002 -5.7 0.2 -3.5 -6.7 -10.2 -14.5 -4.5 -2.8 -3.52003 -5.8 3.5 -3.3 -8.0 -13.3 -13.0 -4.8 -4.1 -3.1
Source: calculations based on IMF Article IV consultations. Data for 2003 are estimates or projections.All data exclude revenues from privatisation.1 Central government balance.2 Including the balance of special accounts, net lending to the Treasury and allocations to the Rehabilitation Fund.3 The fiscal year runs in Egypt from July to June. Therefore, for example, data for 2002 refers to the period July 2001 to June 2002.4 For 2001 and 2002 the balance is calculated by excluding grants directed to the central government budget .5 Including privatisation account spending and non-budget account.6 Including other special treasury accounts and Fond Hassan II expenditures.7 Consolidated budget balance including the Price Stabilisation Fund (PSF).8 Including special funds, the fonds de concours and the social security accounts.
Table 5: General government fiscal balances excluding grants (% of GDP)
Fiscal performance has recently deteriorated in a number of MED countries as a result of lower than expected growth and depressed revenues, but also due to higher expenditures in some cases. Egypt’s general government deficit has widened markedly since 2001 on account of declining revenues and rising expenditures. A sharp fiscal deterioration has taken place in Israel during 2002 and 2003 due to lower revenues linked to the economic slowdown and higher defence expenditures since the eruption of the second intifada. Fiscal performance has also worsened in Jordan because of a shortfall in receipts associated with the difficult regional situation, which was not fully compensated for by lower expenditures. Syria's fiscal position worsened in 2002 and 2003 on account of lower revenues (including lost imports of cheap oil from Iraq in 2003) and higher expenditures. In contrast, Lebanon and Tunisia have managed to continue fiscal consolidation in 2002-2003 despite the weak external environment. Tax revenues increased markedly in Lebanon thanks to the introduction of VAT in 2002, and were accompanied by reduced capital expenditures. Tunisia recorded an increase in revenues from income taxation and compressed capital expenditures in 2002, while current expenditures, notably on salaries, continued to increase. In Morocco, the fiscal position improved in 2001 and 2002, but fiscal consolidation seems to have halted in 2003, as high privatisation revenues have possibly contributed to temper the perceived urgency for fiscal discipline. Box 2: Patterns of fiscal consolidation While all Mediterranean countries saw an improvement in their fiscal position during the 1980s and 1990s, the composition of the adjustment differed (Chart 7). A rough definition of "good quality" fiscal adjustments is when the adjustment mostly relied on the control of current expenditures, notably politically sensitive expenditures on public wages, social security and transfers, rather than increases in the tax burden or cuts in public investment.30
30 This assumes that key development needs in areas such as health, education and R&D are already adequately and efficiently catered for. It was not possible to isolate from available fiscal figures growth enhancing expenditures other than capital expenditures. A finer judgement of the quality of the adjustment would also require an analysis of the evolution of the different categories of current expenditures and revenues.
- 14 -
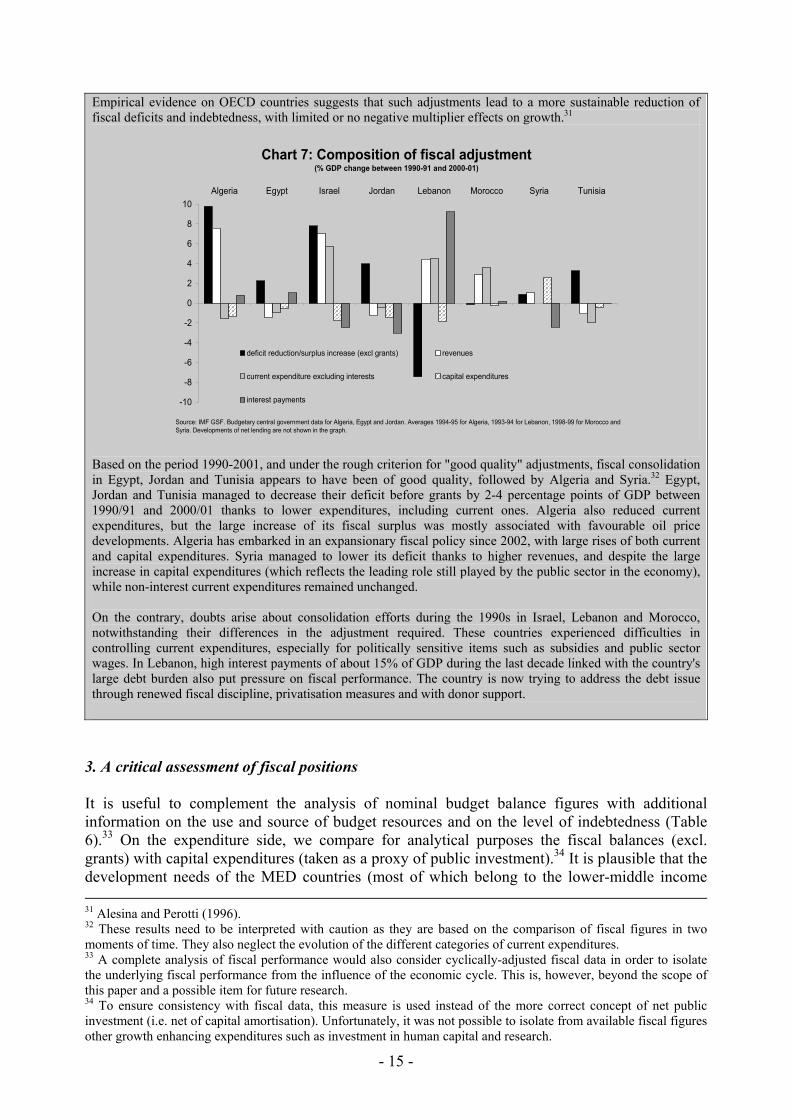
Empirical evidence on OECD countries suggests that such adjustments lead to a more sustainable reduction of fiscal deficits and indebtedness, with limited or no negative multiplier effects on growth.31
-10
-8
-6
-4
-2
0
2
4
6
8
10Algeria Egypt Israel Jordan Lebanon Morocco Syria Tunisia
deficit reduction/surplus increase (excl grants) revenues
current expenditure excluding interests capital expenditures
interest payments
Source: IMF GSF. Budgetary central government data for Algeria, Egypt and Jordan. Averages 1994-95 for Algeria, 1993-94 for Lebanon, 1998-99 for Morocco and Syria. Developments of net lending are not shown in the graph.
Chart 7: Composition of fiscal adjustment (% GDP change between 1990-91 and 2000-01)
Based on the period 1990-2001, and under the rough criterion for "good quality" adjustments, fiscal consolidation in Egypt, Jordan and Tunisia appears to have been of good quality, followed by Algeria and Syria.32 Egypt, Jordan and Tunisia managed to decrease their deficit before grants by 2-4 percentage points of GDP between 1990/91 and 2000/01 thanks to lower expenditures, including current ones. Algeria also reduced current expenditures, but the large increase of its fiscal surplus was mostly associated with favourable oil price developments. Algeria has embarked in an expansionary fiscal policy since 2002, with large rises of both current and capital expenditures. Syria managed to lower its deficit thanks to higher revenues, and despite the large increase in capital expenditures (which reflects the leading role still played by the public sector in the economy), while non-interest current expenditures remained unchanged. On the contrary, doubts arise about consolidation efforts during the 1990s in Israel, Lebanon and Morocco, notwithstanding their differences in the adjustment required. These countries experienced difficulties in controlling current expenditures, especially for politically sensitive items such as subsidies and public sector wages. In Lebanon, high interest payments of about 15% of GDP during the last decade linked with the country's large debt burden also put pressure on fiscal performance. The country is now trying to address the debt issue through renewed fiscal discipline, privatisation measures and with donor support.
3. A critical assessment of fiscal positions It is useful to complement the analysis of nominal budget balance figures with additional information on the use and source of budget resources and on the level of indebtedness (Table 6).33 On the expenditure side, we compare for analytical purposes the fiscal balances (excl. grants) with capital expenditures (taken as a proxy of public investment).34 It is plausible that the development needs of the MED countries (most of which belong to the lower-middle income 31 Alesina and Perotti (1996). 32 These results need to be interpreted with caution as they are based on the comparison of fiscal figures in two moments of time. They also neglect the evolution of the different categories of current expenditures. 33 A complete analysis of fiscal performance would also consider cyclically-adjusted fiscal data in order to isolate the underlying fiscal performance from the influence of the economic cycle. This is, however, beyond the scope of this paper and a possible item for future research. 34 To ensure consistency with fiscal data, this measure is used instead of the more correct concept of net public investment (i.e. net of capital amortisation). Unfortunately, it was not possible to isolate from available fiscal figures other growth enhancing expenditures such as investment in human capital and research.
- 15 -
group of countries) require higher level of expenditures compared to developed countries on items such as infrastructure and policies to improve human capital. For reasons of inter-generational equity, the burden of such projects could arguably be shared between current and future generations, provided debt sustainability is ensured.35
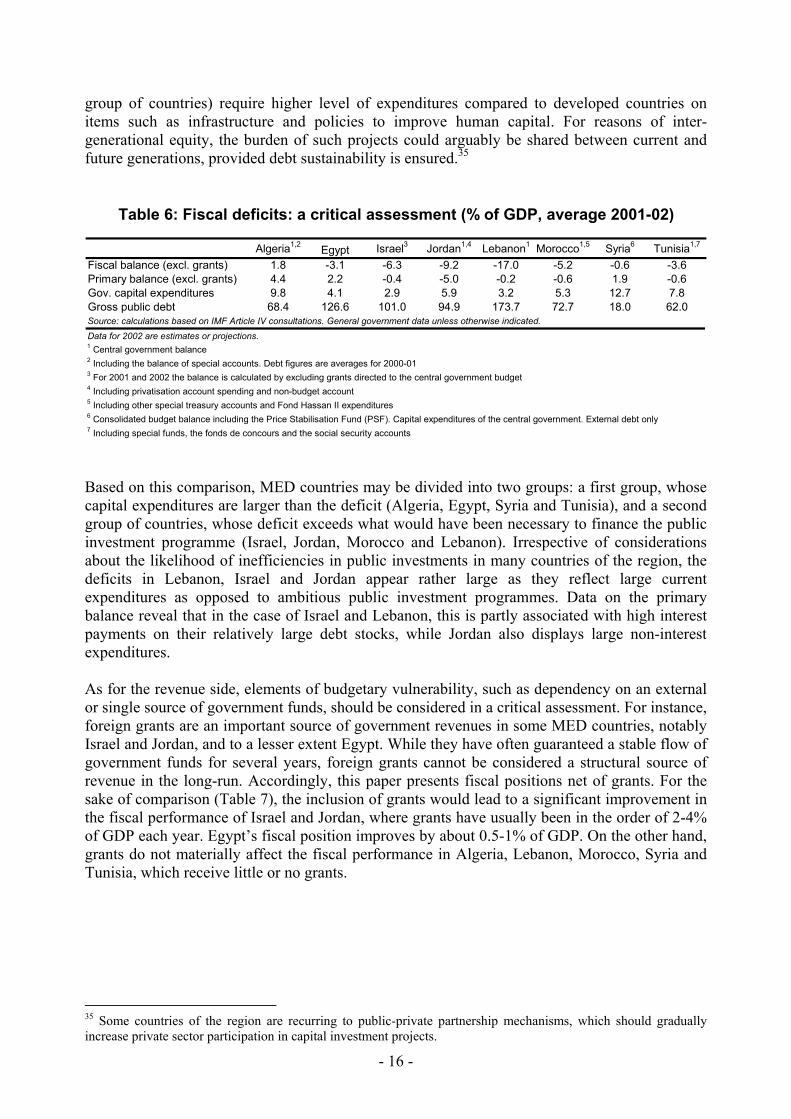
Algeria1,2 Egypt Israel3 Jordan1,4 Lebanon1 Morocco1,5 Syria6 Tunisia1,7
Fiscal balance (excl. grants) 1.8 -3.1 -6.3 -9.2 -17.0 -5.2 -0.6 -3.6Primary balance (excl. grants) 4.4 2.2 -0.4 -5.0 -0.2 -0.6 1.9 -0.6Gov. capital expenditures 9.8 4.1 2.9 5.9 3.2 5.3 12.7 7.8Gross public debt 68.4 126.6 101.0 94.9 173.7 72.7 18.0 62.0Source: calculations based on IMF Article IV consultations. General government data unless otherwise indicated.
Data for 2002 are estimates or projections.1 Central government balance2 Including the balance of special accounts. Debt figures are averages for 2000-013 For 2001 and 2002 the balance is calculated by excluding grants directed to the central government budget 4 Including privatisation account spending and non-budget account5 Including other special treasury accounts and Fond Hassan II expenditures6 Consolidated budget balance including the Price Stabilisation Fund (PSF). Capital expenditures of the central government. External debt only7 Including special funds, the fonds de concours and the social security accounts
Table 6: Fiscal deficits: a critical assessment (% of GDP, average 2001-02)
Based on this comparison, MED countries may be divided into two groups: a first group, whose capital expenditures are larger than the deficit (Algeria, Egypt, Syria and Tunisia), and a second group of countries, whose deficit exceeds what would have been necessary to finance the public investment programme (Israel, Jordan, Morocco and Lebanon). Irrespective of considerations about the likelihood of inefficiencies in public investments in many countries of the region, the deficits in Lebanon, Israel and Jordan appear rather large as they reflect large current expenditures as opposed to ambitious public investment programmes. Data on the primary balance reveal that in the case of Israel and Lebanon, this is partly associated with high interest payments on their relatively large debt stocks, while Jordan also displays large non-interest expenditures. As for the revenue side, elements of budgetary vulnerability, such as dependency on an external or single source of government funds, should be considered in a critical assessment. For instance, foreign grants are an important source of government revenues in some MED countries, notably Israel and Jordan, and to a lesser extent Egypt. While they have often guaranteed a stable flow of government funds for several years, foreign grants cannot be considered a structural source of revenue in the long-run. Accordingly, this paper presents fiscal positions net of grants. For the sake of comparison (Table 7), the inclusion of grants would lead to a significant improvement in the fiscal performance of Israel and Jordan, where grants have usually been in the order of 2-4% of GDP each year. Egypt’s fiscal position improves by about 0.5-1% of GDP. On the other hand, grants do not materially affect the fiscal performance in Algeria, Lebanon, Morocco, Syria and Tunisia, which receive little or no grants.
35 Some countries of the region are recurring to public-private partnership mechanisms, which should gradually increase private sector participation in capital investment projects.
- 16 -
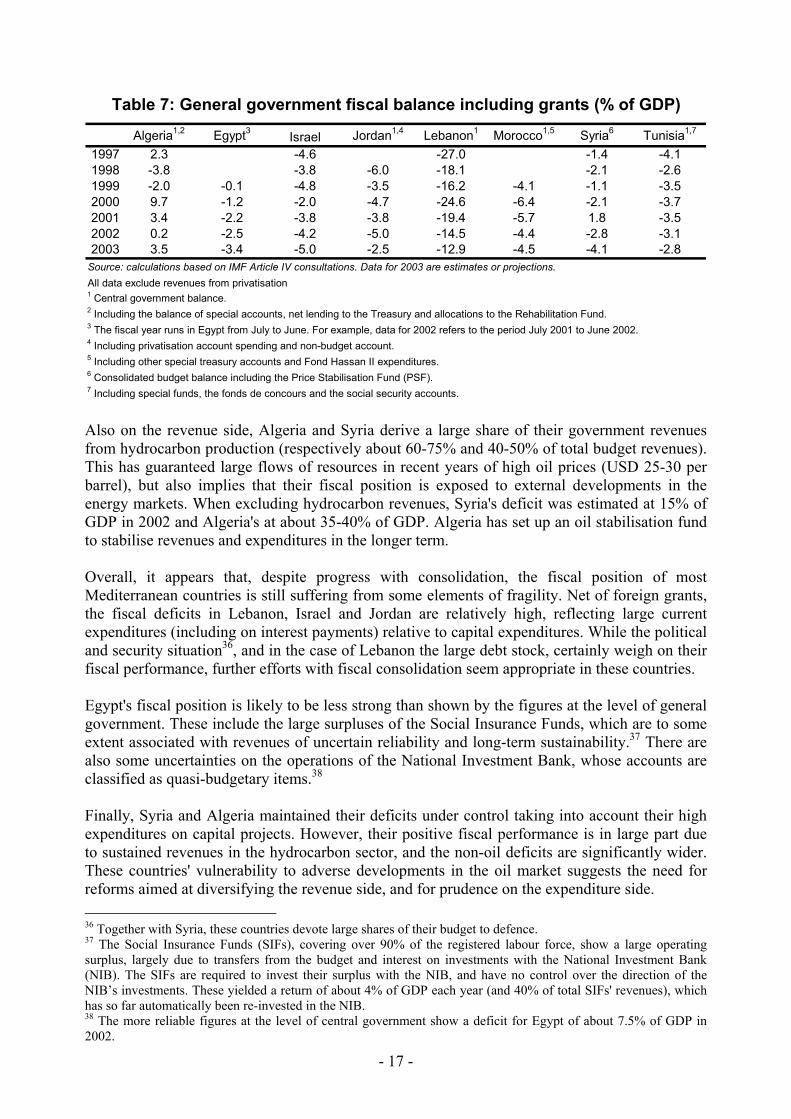
Algeria1,2 Egypt3 Israel Jordan1,4 Lebanon1 Morocco1,5 Syria6 Tunisia1,7
1997 2.3 -4.6 -27.0 -1.4 -4.11998 -3.8 -3.8 -6.0 -18.1 -2.1 -2.61999 -2.0 -0.1 -4.8 -3.5 -16.2 -4.1 -1.1 -3.52000 9.7 -1.2 -2.0 -4.7 -24.6 -6.4 -2.1 -3.72001 3.4 -2.2 -3.8 -3.8 -19.4 -5.7 1.8 -3.52002 0.2 -2.5 -4.2 -5.0 -14.5 -4.4 -2.8 -3.12003 3.5 -3.4 -5.0 -2.5 -12.9 -4.5 -4.1 -2.8
Source: calculations based on IMF Article IV consultations. Data for 2003 are estimates or projections.All data exclude revenues from privatisation1 Central government balance.2 Including the balance of special accounts, net lending to the Treasury and allocations to the Rehabilitation Fund.3 The fiscal year runs in Egypt from July to June. For example, data for 2002 refers to the period July 2001 to June 2002.4 Including privatisation account spending and non-budget account.5 Including other special treasury accounts and Fond Hassan II expenditures.6 Consolidated budget balance including the Price Stabilisation Fund (PSF).7 Including special funds, the fonds de concours and the social security accounts.
Table 7: General government fiscal balance including grants (% of GDP)
Also on the revenue side, Algeria and Syria derive a large share of their government revenues from hydrocarbon production (respectively about 60-75% and 40-50% of total budget revenues). This has guaranteed large flows of resources in recent years of high oil prices (USD 25-30 per barrel), but also implies that their fiscal position is exposed to external developments in the energy markets. When excluding hydrocarbon revenues, Syria's deficit was estimated at 15% of GDP in 2002 and Algeria's at about 35-40% of GDP. Algeria has set up an oil stabilisation fund to stabilise revenues and expenditures in the longer term. Overall, it appears that, despite progress with consolidation, the fiscal position of most Mediterranean countries is still suffering from some elements of fragility. Net of foreign grants, the fiscal deficits in Lebanon, Israel and Jordan are relatively high, reflecting large current expenditures (including on interest payments) relative to capital expenditures. While the political and security situation36, and in the case of Lebanon the large debt stock, certainly weigh on their fiscal performance, further efforts with fiscal consolidation seem appropriate in these countries. Egypt's fiscal position is likely to be less strong than shown by the figures at the level of general government. These include the large surpluses of the Social Insurance Funds, which are to some extent associated with revenues of uncertain reliability and long-term sustainability.37 There are also some uncertainties on the operations of the National Investment Bank, whose accounts are classified as quasi-budgetary items.38 Finally, Syria and Algeria maintained their deficits under control taking into account their high expenditures on capital projects. However, their positive fiscal performance is in large part due to sustained revenues in the hydrocarbon sector, and the non-oil deficits are significantly wider. These countries' vulnerability to adverse developments in the oil market suggests the need for reforms aimed at diversifying the revenue side, and for prudence on the expenditure side. 36 Together with Syria, these countries devote large shares of their budget to defence. 37 The Social Insurance Funds (SIFs), covering over 90% of the registered labour force, show a large operating surplus, largely due to transfers from the budget and interest on investments with the National Investment Bank (NIB). The SIFs are required to invest their surplus with the NIB, and have no control over the direction of the NIB’s investments. These yielded a return of about 4% of GDP each year (and 40% of total SIFs' revenues), which has so far automatically been re-invested in the NIB. 38 The more reliable figures at the level of central government show a deficit for Egypt of about 7.5% of GDP in 2002.
- 17 -
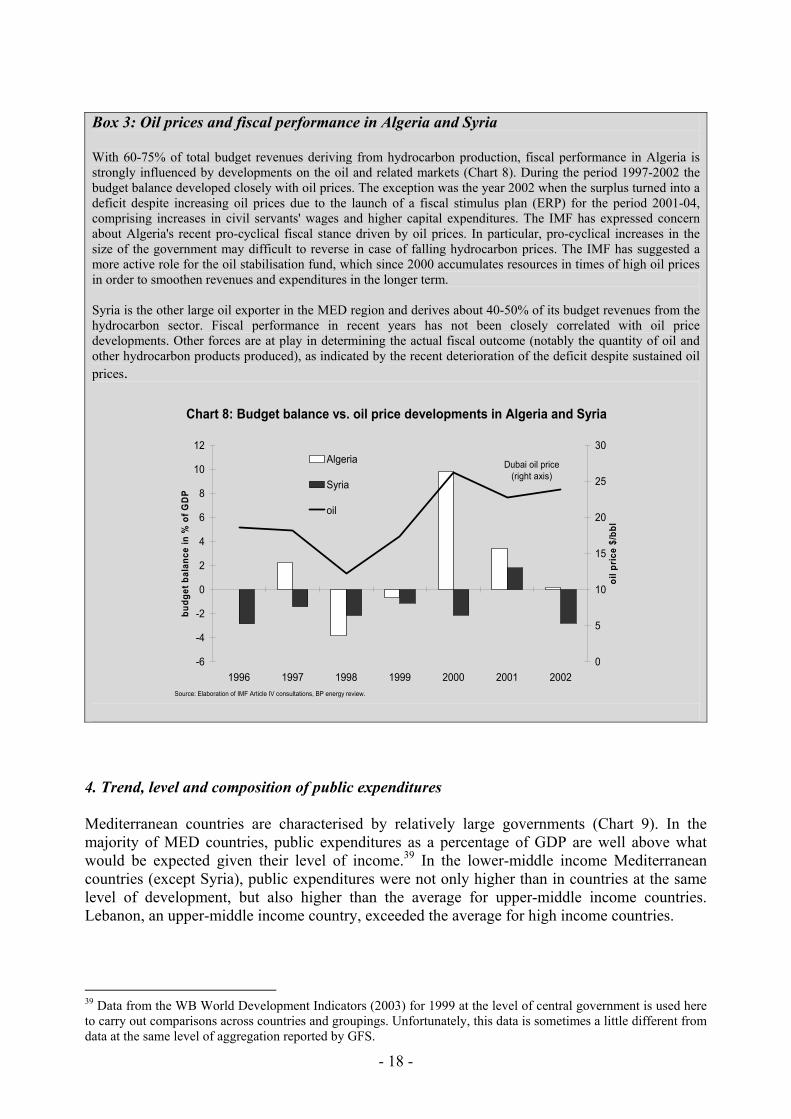
Box 3: Oil prices and fiscal performance in Algeria and Syria With 60-75% of total budget revenues deriving from hydrocarbon production, fiscal performance in Algeria is strongly influenced by developments on the oil and related markets (Chart 8). During the period 1997-2002 the budget balance developed closely with oil prices. The exception was the year 2002 when the surplus turned into a deficit despite increasing oil prices due to the launch of a fiscal stimulus plan (ERP) for the period 2001-04, comprising increases in civil servants' wages and higher capital expenditures. The IMF has expressed concern about Algeria's recent pro-cyclical fiscal stance driven by oil prices. In particular, pro-cyclical increases in the size of the government may difficult to reverse in case of falling hydrocarbon prices. The IMF has suggested a more active role for the oil stabilisation fund, which since 2000 accumulates resources in times of high oil prices in order to smoothen revenues and expenditures in the longer term. Syria is the other large oil exporter in the MED region and derives about 40-50% of its budget revenues from the hydrocarbon sector. Fiscal performance in recent years has not been closely correlated with oil price developments. Other forces are at play in determining the actual fiscal outcome (notably the quantity of oil and other hydrocarbon products produced), as indicated by the recent deterioration of the deficit despite sustained oil prices.
-6
-4
-2
0
2
4
6
8
10
12
1996 1997 1998 1999 2000 2001 2002
budg
et b
alan
ce in
% o
f GD
P
0
5
10
15
20
25
30
oil p
rice
$/bb
l
Algeria
Syria
oil
Dubai oil price (right axis)
Source: Elaboration of IMF Article IV consultations, BP energy review.
Chart 8: Budget balance vs. oil price developments in Algeria and Syria
4. Trend, level and composition of public expenditures Mediterranean countries are characterised by relatively large governments (Chart 9). In the majority of MED countries, public expenditures as a percentage of GDP are well above what would be expected given their level of income.39 In the lower-middle income Mediterranean countries (except Syria), public expenditures were not only higher than in countries at the same level of development, but also higher than the average for upper-middle income countries. Lebanon, an upper-middle income country, exceeded the average for high income countries.
39 Data from the WB World Development Indicators (2003) for 1999 at the level of central government is used here to carry out comparisons across countries and groupings. Unfortunately, this data is sometimes a little different from data at the same level of aggregation reported by GFS.
- 18 -

0
10
20
30
40
50
Algeria Egypt Jordan Morocco Syria Tunisia Lowermiddleincomeaverage
Lebanon Uppermiddleincomeaverage
Israel Highincomeaverage
AverageMED
lower-middle income
upper middle income
high income
Source: WB WDI 2003. 1999 data except Egypt (1997)
Chart 9: Government size: central government expenditures
% of GDP
Large governments in the Mediterranean reflect the still significant public sector role in both the economy and society. In most countries of the region, the state plays a strong redistributive function, directly through extensive subsidies and transfer schemes, and indirectly through the provision of public employment (including in the army). This is reflected in relatively high levels of current expenditures (Chart 10). Large governments also partly reflect the heritage of inward-oriented development strategies that many Mediterranean countries pursued from the 1940s to the 1970s, when governments became directly involved in nearly all sectors of the economy. Syria and Algeria and, to a lesser extent, Tunisia have large budgets devoted to capital expenditures. In some cases, high expenditures are also associated with large spending on defence and interest payments on debt.
Chart 10: Composition of government expenditures
0
5
10
15
20
25
30
35
40
45
50
Algeria Egypt Israel Jordan Lebanon Morocco Syria Tunisia
in %
of G
DP
other net lendingcapital expenditureCurrent expenditure
Source: calculations from IMF Article IV country consultations. Central government, arythmetical average for 2001-02.Morocco: includes the road fund
Expenditures (excl. net lending) remained roughly unchanged during the 1990s, at about 36.5% of GDP in 1990 compared to 36% of GDP in 2001 (weighted average). This, however, masks considerable differences across the region: while there was no clear decreasing trend in Israel, in both the Maghreb and the Mashrek, expenditures increased at the beginning of the 1990s and fell afterwards. The largest reductions were achieved in Jordan and Tunisia, while in Lebanon,
- 19 -

expenditures rose due to higher interest rate payments on public debt and other current expenditures. 4.1 Current expenditures Within current expenditures, public wages and salaries are a relatively important expenditure item for MED countries (Chart 11).40 This holds particularly true for Morocco and Tunisia, where they accounted for about 12% of GDP and 40% of total expenditures in 2001/02. High figures for Morocco and Tunisia are likely to be associated in part with the inclusion of wages for military staff among total public sector wages (a breakdown for defence expenditures is not available). Indeed, in Israel, Jordan and Syria salaries and wages for defence staff are included in defence spending, pushing up real wage figures for these countries as a % of GDP. Public sector employment in the MED region has traditionally been a means of redistributing revenues and limiting social tensions, i.e. an essential element of the social contract. In some countries, workers' preference for government jobs (evidenced by queuing for public jobs) is due to higher wages relative to the private sector. In other cases, it is due to non-wage factors such as job security, significant non-wage compensation and lower required work effort. The large non-wage benefits contribute to the segmentation of the labour market along public-private lines, and to high unemployment rates for young new entrants in the labour market with intermediate or higher education. According to the Arab Competitiveness Report 2002-2003 on the MENA region, the large size of the civil service has also tended to act as a brake on structural reforms.41
Chart 11: Current expenditures and their breakdown
0 10 20 30 40 5
Algeria
Egypt
Israel
Jordan
Lebanon
Morocco
Syria
Tunisia
in % of GDP
0
wages and salaries purchases of goods and servicesinterest paymentssubsidies and current transfersdefenseother current expenditures
Source: calculations from IMF Article IV country consultations. Central government, arythmetical average for 2001-02.Defence data not available for Algeria, Morocco and Tunisia. It includes defence-related wages and salaries in Israel and Syria.Subsidies and transfers include transfers to local authorities in Israel and Morocco. Includes transfers to Electricité du Liban in Lebanon.
Governments in MED countries also have an important distributive function through extensive subsidies and transfers (social and to local authorities). In 2001/02, this was the largest item of spending in Israel (about 15% of GDP) and Algeria (over 10% of GDP). Subsidies and transfers were, on the contrary, rather low in Lebanon at 2% of GDP in the same year, probably reflecting the large role played by the private sector in the provision of many social services (including health and education) since the civil conflict. Available data on the breakdown of subsidies and 40 The arithmetical average for 2001-02 of IMF data at the level of central government is used in this and the following section for cross-country comparisons. These include preliminary data for 2002 for Israel, Jordan and Lebanon, estimates for Egypt, Morocco, projections for Algeria and Syria. 41 World Economic Forum, “Arab World Competitiveness Report 2002-2003”, Geneva, September 2002.
- 20 -
transfers in the Mediterranean, though scarce and fragmented, shows that social transfers to families are the largest component of the total.42 Transfers to local authorities represent a small share, reflecting the rather centralised nature of governments in the region. For instance, in Israel and Algeria local transfers represented about 2% of GDP. Box 4: Price subsidies in the Mediterranean region Several Mediterranean countries maintain extensive price subsidy schemes as a key element of their safety nets. Although the number of subsidised commodities has decreased significantly in Egypt, these still include a number of basic goods (bread, sugar and edible oil, accounting for about 5.5% of government expenditure) and services (such as electricity). The General Authority for Supply Commodities (GASC) is charged with purchasing imports on the international market and re-selling them at subsidised prices. In 2003 the government increased the allocation for food subsidies to counter the negative effects of the depreciation of the Egyptian pound. Political pressure to maintain subsidies, particularly on bread, is very strong given the country's current social and economic difficulties. About 20% of prices are administered in Tunisia, and the share has not changed since the late 1990s.43 However, the cost to the budget is relatively small, estimated at 0.8% of GDP. In Morocco, food subsides are estimated to have accounted for about 1% of GDP in 2002. In Syria, a Price Stabilisation Fund (PSF) administers price controls and subsidies over food items, and has incurred yearly losses of about 1.5-3% of GDP in the past few years. The sale of some petroleum products (such as gas oil and fuel oil) and basic utilities (electricity, water) is also subsidised. Key crops (wheat, cotton) are bought by the government at prices well above international levels. Despite recent reforms44, interest rates are still set administratively and, in some cases, credit provision is de facto subsidised. Jordan made progress in recent years in eliminating a system of extensive subsidies, notably for petroleum products, and gradually bringing prices to market levels. Besides their impact on the budget, consumption subsidies are usually a rather inefficient instrument of social support, as they are usually available to the whole population rather than only the most vulnerable. Subsidies and controlled prices also act to distort market signals, which are an essential element of functioning market economies. These considerations have prompted MED countries to gradually replace blanket price subsidies with the setting up of comprehensive safety nets. However, for those MED countries with underdeveloped social assistance and ineffective bureaucracies, consumption subsidies (particularly for food items such as bread) may be, in a transition phase, a cost-effective way of assisting the poor. For instance, in Egypt, the food subsidies are estimated to lift 900,000 people out of poverty, with the bread subsidy having by far the largest impact.45 Still, there is likely to be room for a much better targeting of the subsidy schemes to make them more cost effective.
Interest payments represent a significant burden in some MED countries, weighing on fiscal balances. Interest payments on Lebanon's large public debt absorbed 40% of the country's expenditures in 2001/02, equivalent to over 17% of GDP. While a reflection of the country's civil conflict and past expenditure policies, the large debt burden absorbs significant resources at the expense of more productive or welfare improving uses of public money. In terms of debt service burden, Israel and Egypt followed with interest payments of over 5% of GDP. Likewise, Mediterranean countries devote a considerable share of their budget to defence expenditures, reflecting the protracted regional instability, in addition to domestic security concerns. Defence expenditures are particularly high in Middle East MED countries, notably Israel and Jordan, where they accounted for 10% and 8% of GDP respectively, or about 25% of
42 Source: GFS. 43 IMF Article IV consultation 2002. 44 In June 2003 the Credit and Monetary Council lowered interest rates applied by state-owned banks, which had been fixed for the last 22 years. 45 Identification mission report on poverty reduction in Egypt (February 2003).
- 21 -
total expenditures.46 Syria and Lebanon also channel significant resources to defence and military spending, at about 4-5% of GDP. Military expenditures are comparatively lower, although still in the order of 2-4% of GDP, in countries of the Maghreb.47 The importance of the defence sector for countries of the Middle East is also apparent from its contribution to employment: in 1999, the armed forces employed 6-7% of the labour force in Israel, Jordan and Syria.48 In some cases, recruitment in the army serves as a means to alleviate unemployment pressures. In general, all MED countries devote a considerable share of their current spending to non discretionary expenditures (e.g. public wages, social transfers and, for some countries, interest payments on debt). These would be difficult to compress in case of a sudden decline in revenues or the need for fiscal consolidation. A recent and exceptional example is that of Israel, where the unpopular cuts in public wages and social security transfers of 2002 and 2003 have been possible only thanks to the presence of a fiscally committed government benefiting from large political support, and in the context of an unprecedented economic crisis. 4.2 Capital expenditures Capital expenditures are a very large item of spending for some MED countries, notably Syria (12% of GDP and 40% of total expenditures in 2001/02), Algeria (10% of GDP and 30% of total) and, to a lesser extent, Tunisia (8% of GDP and 25% of total). While oil-related capital investments probably explain the very large figures of the first two countries, most of the other MED countries also devote relatively high shares of their expenditures to capital projects, when compared to countries of similar levels of income.49 For many of them, public investment in infrastructure and other capital projects (e.g. housing and building construction) has been at the core of their development and employment strategy. Relatively high levels of capital investment by the public sector have generally not been accompanied by corresponding high investments by the private sector. For MED countries for which data is available, the split of public and private investment reveals that public sector investment continues to account for about one third of total investment.50 Private contribution to total investment has been lower than in other regions of the world, due to the often unfavourable business climate and widespread government intervention in the economy. Relatively low levels of business investments in the Mediterranean are often cited as one of the factors contributing to the region's weak productivity and recent weak growth performance. In addition, public investments in the Mediterranean have sometimes suffered from low productivity and efficiency. For example, although overall considerable improvements were made in providing essential infrastructure, its quality varies significantly across countries and sectors.51
46 In Jordan, a large defence force is combined with a relatively early retirement age and generous pension benefits. This has the effect of increasing both present and future expenditures, a problem which Jordan is now addressing through the reform of its pension system. 47 This assessment is based on 2001 data from the WDI 2003 data base. 48 Source: WDI 2002. 49 Based on 1999 data on the share of capital expenditures over total public expenditures from the WDI 2003 database. 50 2003 IFC data for Egypt, Morocco and Tunisia. 51 For instance, electricity production in most countries of the region is above the income group average, but so are also energy transmission and distribution losses. Kilometres of paved roads as a % of total roads are above average, but most MED countries perform worse than average in terms of number of telephone lines and connection waiting times etc. WDI 2003.
- 22 -
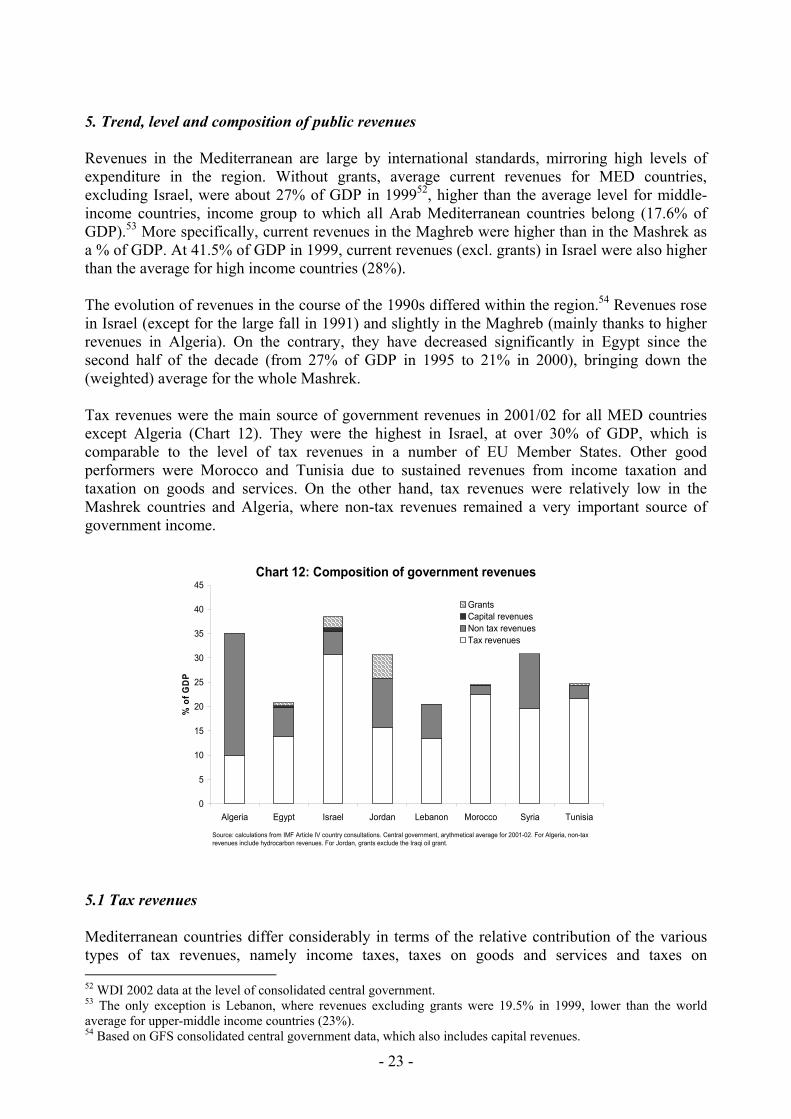
5. Trend, level and composition of public revenues Revenues in the Mediterranean are large by international standards, mirroring high levels of expenditure in the region. Without grants, average current revenues for MED countries, excluding Israel, were about 27% of GDP in 199952, higher than the average level for middle-income countries, income group to which all Arab Mediterranean countries belong (17.6% of GDP).53 More specifically, current revenues in the Maghreb were higher than in the Mashrek as a % of GDP. At 41.5% of GDP in 1999, current revenues (excl. grants) in Israel were also higher than the average for high income countries (28%). The evolution of revenues in the course of the 1990s differed within the region.54 Revenues rose in Israel (except for the large fall in 1991) and slightly in the Maghreb (mainly thanks to higher revenues in Algeria). On the contrary, they have decreased significantly in Egypt since the second half of the decade (from 27% of GDP in 1995 to 21% in 2000), bringing down the (weighted) average for the whole Mashrek. Tax revenues were the main source of government revenues in 2001/02 for all MED countries except Algeria (Chart 12). They were the highest in Israel, at over 30% of GDP, which is comparable to the level of tax revenues in a number of EU Member States. Other good performers were Morocco and Tunisia due to sustained revenues from income taxation and taxation on goods and services. On the other hand, tax revenues were relatively low in the Mashrek countries and Algeria, where non-tax revenues remained a very important source of government income.
Chart 12: Composition of government revenues
0
5
10
15
20
25
30
35
40
45
Algeria Egypt Israel Jordan Lebanon Morocco Syria Tunisia
% o
f GD
P
GrantsCapital revenuesNon tax revenuesTax revenues
Source: calculations from IMF Article IV country consultations. Central government, arythmetical average for 2001-02. For Algeria, non-tax revenues include hydrocarbon revenues. For Jordan, grants exclude the Iraqi oil grant.
5.1 Tax revenues Mediterranean countries differ considerably in terms of the relative contribution of the various types of tax revenues, namely income taxes, taxes on goods and services and taxes on 52 WDI 2002 data at the level of consolidated central government. 53 The only exception is Lebanon, where revenues excluding grants were 19.5% in 1999, lower than the world average for upper-middle income countries (23%). 54 Based on GFS consolidated central government data, which also includes capital revenues.
- 23 -

international trade (Chart 13). In 2001/02, some countries relied on direct taxation on individuals and corporations as their main source of revenues (Syria, Israel and, by a smaller margin, Egypt), while others mainly derived their revenues from indirect taxation (Morocco, Jordan, Algeria and, to a lesser extent, Tunisia) or custom duties (Lebanon). Comparisons should be made with care, as in some countries (Syria and Egypt) data on income taxes include taxation of profits of state-owned companies, including the oil sector.55 The weight of the different income tax categories varies between the countries, and is substantially influenced by the respective size of tax bases. Israel, Morocco and Tunisia derive most income taxes from taxes on personal income, while Algeria and most of the Mashrek countries rely relatively more on corporate taxation.56 However, when excluding taxes on state-owned companies, corporate taxation revenues in the Mashrek countries are also lower than in the Maghreb and other middle-income countries. The result for the Mashrek countries arises from the very narrow base of personal taxation and the use of exemptions, together with large informal sector and widespread evasion.57 Sometimes, very generous investment laws have eroded the tax base. Several countries (including Egypt, Syria, Jordan, Tunisia) have, for example, set up free zones where businesses enjoy full relief from income taxes. In the absence of measures to improve the business environment, tax relief may not be an effective means to promote investment, while carrying the risk of costly tax competition among countries that use them.
Chart 13: Breakdown of tax revenues (2001/02)
0% 20% 40% 60% 80% 100%
Algeria
Egypt
Israel
Jordan
Lebanon
Morocco
Syria
Tunisia
Income tax
Goods andservices tax
International trade
Other taxrevenues
Source: calculations from IMF Article IV country consultations. Central government. Arythmetical average for 2001-02.Goods and services tax: excluding taxes on hydrocarbon revenues in Algeria; GST in Jordan; indirect taxes in Morocco; includes surcharges and excises in Syria. International trade taxes: custom duties in Algeria, import taxes in Israel and Morocco, custom duties and f i t d t i S i
Taxes on the sale of goods and services increased in most MED countries following the introduction of VAT or General Sales Taxes (GST). In Algeria, Jordan, Morocco and Tunisia, the introduction of GST/VAT has been particularly successful, and the goods and services' tax was the main source of tax revenue in 2001/02. Revenues from indirect taxation also rose quickly in Lebanon which, with the assistance of the EU, introduced VAT in 2002 as a compensatory measure for loss of custom revenues from gradual trade liberalisation. Egypt is considering moving from its current GST to a full VAT, although no specific timetable has been 55 In Syria, almost half of the income tax revenues derive from the profit taxes on the Syrian Petroleum Company. In Egypt, over 30% of income taxes are associated with profits of state-owned companies (petroleum, Suez Canal) and the Bank of Egypt. On the other hand, in Algeria, hydrocarbon revenues were included among non-tax revenues and it was not possible to isolate the taxation component. 56 No data for Lebanon were available. 57 See Nashashibi (2002). Data on marginal tax rates for MED countries were not available.
- 24 -

proposed. The introduction of a GST is envisaged also by Syria to accompany planned tariff reductions. However, in some MED countries (such as Morocco58 and Jordan), multiple GST/VAT rates and substantial exemptions have kept indirect tax revenues below potential.59 Tax revenues related to international trade are declining in most of the region as a result of multilateral and regional trade liberalisation, but remain an important source of revenues for all Arab Mediterranean countries. In Lebanon, international trade taxes accounted for over 6% of GDP in 2001/02 (30% of total revenues), and in the other Arab countries, they ranged between 1.5-3.5% of GDP60. High trade taxes may result from high custom tariffs or large traded volumes, or both. Despite progress with trade liberalisation, most MED countries continue to display high levels of tariff protection. Agricultural imports are the most heavily taxed. Within the MED region, currently only in Israel and Lebanon have tariffs been brought down to levels comparable to the EU. 5.2 Non-tax revenues Non-tax revenues continue to play a very important role in Algeria and the Mashrek countries (particularly Jordan and Syria). The share of non-tax revenues over total revenues has generally remained rather stable over the 1990s, with some exceptions (in Tunisia they witnessed a declining trend, while they rose in Syria). The large size of non-tax revenues in several MED countries provides evidence of the continuing large presence of the state in the economy. Non-tax revenues include income from state enterprises, mineral and other rents, and proceeds from sales of assets, together with fees and charges. Algeria, Egypt and Syria derive significant revenues from the government-controlled hydrocarbon sector, and Jordan from the production of phosphates. Transfers from state monopolies in the utility sector and other state-owned enterprises are also important sources of revenue for some of these countries. Non-tax revenues in South Mediterranean countries are expected to decline in the medium-long term, reflecting a combination of exogenous and endogenous factors. These include the gradual depletion of mineral resources, possibly lower oil and phosphates prices, and reforms aimed at reducing the public sector and increasing competition.61 For instance, privatisation, while providing sales’ proceeds, is expected to reduce the direct stream of revenues from state-owned companies. This should be compensated in the medium and long-term by higher income tax revenues, thanks to greater competitiveness and profitability of the privatised companies. At the same time, there appears to be scope for raising non-tax revenues by broadening and adjusting some non-tax revenue fees and user charges for government services, including higher education and some health services. 5.3 Grants Foreign grants are a significant source of government revenues in Jordan and Israel and, to a lesser extent, Egypt. The majority of foreign grants to Jordan (at about 4% of GDP, and a record 10% in 2003) are from the USA in the form of economic and military assistance. In addition,
58 According to the latest Article IV consultation for Morocco (2003) VAT is overly complex, with too many rates, limited coverage and widespread exemptions. 59 Nashashibi (2002). 60 The corresponding figure for Israel was 0.3% of GDP. 61 Egypt and Tunisia have become net importers of oil and Syria is expected to follow soon. However, many of these countries are now developing their natural gas sector.
- 25 -
until the outbreak of the war in Iraq in early 2003, Jordan used to receive a sizeable implicit "oil grant" from Iraq. Petroleum imports from Iraq had an implicit grant element equivalent to half the market cost of the oil up to a maximum of JOD 192 million (2.8% of GDP). The remainder of the oil imports was provided at discounted prices. Until the outbreak of the conflict in Iraq, Syria is also widely believed to have benefited from an implicit "oil grant" from Iraq, with a favourable impact on state oil earnings and overall fiscal deficit. Israel's state budget receives grants of about 2-3% of GDP annually from the USA, the main part of which is defence-related.62 In addition, Israel receives significant amounts through private philanthropy. Egypt is also a major beneficiary of US economic and military assistance. 6. The role and size of MED governments Weak economic growth since 2001, in particular in the private sector, has called into question the benefits of maintaining large and dominant governments in most countries of the Mediterranean region. As MED countries, though at different levels and speeds, make progress towards becoming functioning market economies, a reflection on the extent and means of public intervention in the economy is warranted. While the optimal size of a government may reflect political preferences, the important role of the state is often perceived as a drag in most economies of the region.63 Public sector is viewed as having generally low productivity and limited inherent potential for productivity gains. Moreover, a large public sector can impose costs on the economy by crowding out private sector demand for credit, and through the distortions ensuing from excessive taxation. For instance, the first Arab Competitiveness Report 2002-2003 emphasised the need for smaller governments in the Middle East and North African (MENA) region. According to the report, lower taxes and less government presence in the economy would contribute to higher growth in the region, by freeing the private sector. The majority of Mediterranean governments have started to re-examine and reduce their direct involvement in many economic and some social sectors. As the result of a comprehensive reflection on the respective roles of the public and private sectors, governments may decide to refocus their direct involvement on selected economic and social sectors. All countries of the Mediterranean region, with the notable exception of Syria, have undertaken privatisation during the 1990s. This included divestments from directly productive sectors, including agriculture, manufacturing and services, as a means of fiscal consolidation as well as of reducing public ownership when this was not conducive to economic development. At the same time, however, a stronger role for the public sector is necessary to establish the conditions for higher and sustainable levels of growth and socio-economic development. From a purveyor of employment of first resort, the state is called to evolve into a provider of effective social services (notably education, health and social security) and sound physical and institutional infrastructure.64 The UNDP also pointed to the need for an increased role of the state to support the development of the knowledge based economy in the region.65 There should also be room to streamline the size of the civil service. This is one of the main items of spending in the region, and it generally suffers from problems of overstaffing and hidden unemployment. The dominant role of the government as employer has led to distortion of incentives in the labour market. However, sufficient employment opportunities need to be
62 Other types of economic support from the USA include loans and loan guarantees. 63 Abed and Davoodi (2003), Keller and Nabli (2002), Rupper Bulmer (2000), Bennet (2003). 64 Garner (2003). 65 UNDP 2002.
- 26 -
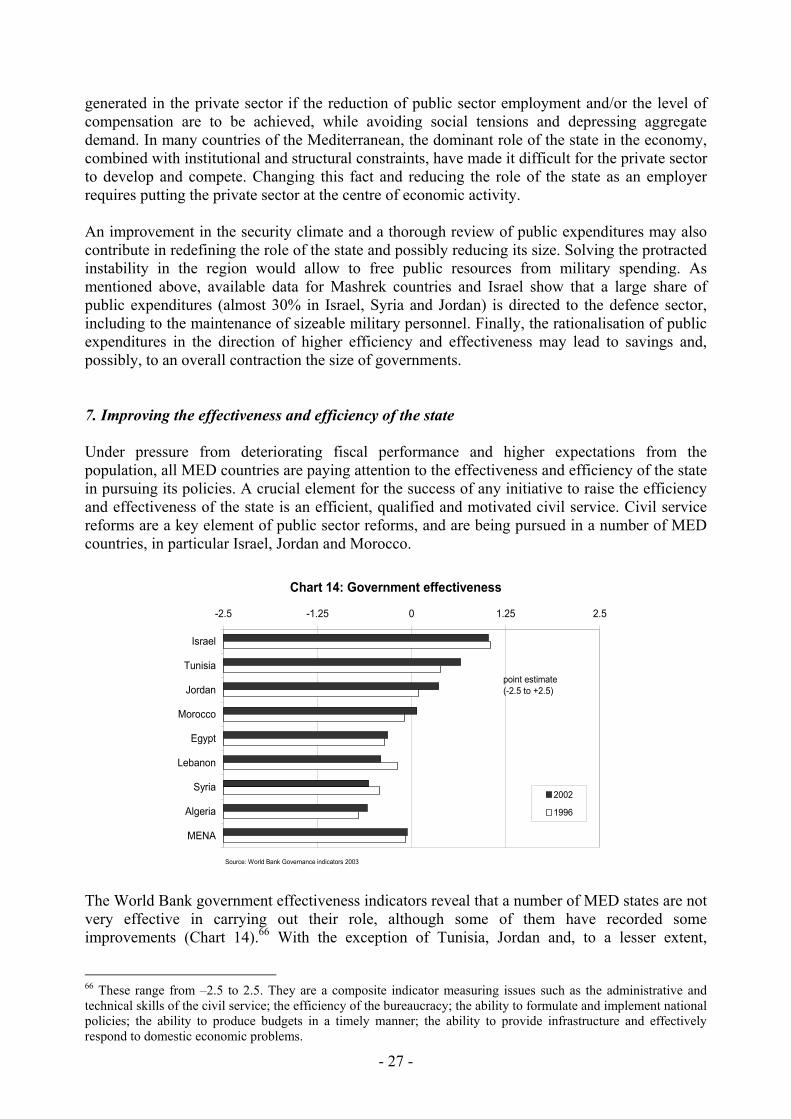
generated in the private sector if the reduction of public sector employment and/or the level of compensation are to be achieved, while avoiding social tensions and depressing aggregate demand. In many countries of the Mediterranean, the dominant role of the state in the economy, combined with institutional and structural constraints, have made it difficult for the private sector to develop and compete. Changing this fact and reducing the role of the state as an employer requires putting the private sector at the centre of economic activity. An improvement in the security climate and a thorough review of public expenditures may also contribute in redefining the role of the state and possibly reducing its size. Solving the protracted instability in the region would allow to free public resources from military spending. As mentioned above, available data for Mashrek countries and Israel show that a large share of public expenditures (almost 30% in Israel, Syria and Jordan) is directed to the defence sector, including to the maintenance of sizeable military personnel. Finally, the rationalisation of public expenditures in the direction of higher efficiency and effectiveness may lead to savings and, possibly, to an overall contraction the size of governments. 7. Improving the effectiveness and efficiency of the state Under pressure from deteriorating fiscal performance and higher expectations from the population, all MED countries are paying attention to the effectiveness and efficiency of the state in pursuing its policies. A crucial element for the success of any initiative to raise the efficiency and effectiveness of the state is an efficient, qualified and motivated civil service. Civil service reforms are a key element of public sector reforms, and are being pursued in a number of MED countries, in particular Israel, Jordan and Morocco.
Chart 14: Government effectiveness
-2.5 -1.25 0 1.25 2.5
Israel
Tunisia
Jordan
Morocco
Egypt
Lebanon
Syria
Algeria
MENA
2002
1996
Source: World Bank Governance indicators 2003
point estimate (-2.5 to +2.5)
The World Bank government effectiveness indicators reveal that a number of MED states are not very effective in carrying out their role, although some of them have recorded some improvements (Chart 14).66 With the exception of Tunisia, Jordan and, to a lesser extent,
66 These range from –2.5 to 2.5. They are a composite indicator measuring issues such as the administrative and technical skills of the civil service; the efficiency of the bureaucracy; the ability to formulate and implement national policies; the ability to produce budgets in a timely manner; the ability to provide infrastructure and effectively respond to domestic economic problems.
- 27 -
Morocco, whose performance is both in the positive range and above the average of their income group, MED governments perform worse than what would be expected from their level of income.67 For instance, the score for Israel (1.02) is below the high income countries' average (1.48), and even more so is Lebanon's (-0.41) compared to the average for upper middle income countries (0.31). A similar picture emerges from the other indicators of governance developed by the World Bank, such as on regulatory quality, rule of law and the control of corruption. According to this data, only Tunisia, Jordan and Morocco consistently perform above the average of their income group.68 The Arab Human Development Report by the UNDP covering the MENA region also highlights weaknesses in the efficiency and effectiveness of public expenditure.69 The report finds that, despite higher public spending compared to other developing regions, MENA governments have been unable to respond to human development needs in key areas such as health, education and social safety nets. These considerations are relevant also for a number of Mediterranean countries. For instance, health indicators for 1990-9970 show that, in most Mediterranean countries, health services are below the average for countries at similar levels of development.71 In education, sustained high public expenditures, compared to countries with the same level of development, have brought about great improvements in terms of universal coverage and reduction of illiteracy. However, in most MED countries, the educational systems have not been capable of providing students with the skills and abilities required by the business sector and the economy, as indicated by high and resistant unemployment levels, particularly among the young holders of diploma.72 Still, according to the UNDP report, the improvement of safety nets is another key public policy area. Since the level of transfers and subsidies is rather high in most Mediterranean countries, the issue seems more one of improving their quality and effectiveness in reaching the most vulnerable sections of the population rather than one of increased spending. Public employment has also been an inefficient instrument of social support, since most of the benefits have gone to educated workers, who are underrepresented among the poor.73 Box 5: Expenditure reforms in the Mediterranean Some countries of the region have undertaken Public Expenditure Reviews with the WB or initiatives of similar nature to raise the efficiency and effectiveness of their expenditures.74 Morocco's finances were subject to a comprehensive public expenditure review (PER) by the World Bank in 2002. This allowed identifying expenditure priorities and enhancing, in particular, the effectiveness of spending in education and health. Morocco, with the joint support of the European Commission and the World Bank, is now undertaking a public sector reform aimed at improving the efficiency of the public administration, which, in
67 -0.37 for lower middle income countries. 68 Egypt also performs above the average of lower middle income countries in terms of rule of law and, although to a lesser extent, control of corruption. 69 UNDP, 2002. 70 WDI 2002. 71 Physicians and hospital beds per 1,000 people (WDI, 2002). 72 An extreme example is that of Syria, where the progress between 1970 and 2000 in raising educational attainment and the quality of its human capital was to a large extent not translated into productivity gains. Labour productivity growth was low, and actually negative, during the 1980s. 73 World Bank 2003. 74 The World Bank’s Public Expenditure Reviews are comprehensive instruments to analyse public sector issues in general, and public expenditure issues in particular. Their goal is to assist countries establish effective and transparent mechanisms to allocate and use available public resources in a manner that promotes economic growth and helps reducing poverty.
- 28 -

turn, will help mastering the weight of the public sector wage bill. In Jordan, the Plan for Social and Economic Transformation (PSET) adopted in 2001 has been an important instrument of social and economic development, but has also served as a model of expenditure rationalisation and control.75 With the help of the World Bank, all PSET projects are prioritised based on a number of social and economic criteria. The World Bank also completed a PER in 2000. In the framework of the IMF programme, Jordan also started to reform its system of civil and military pensions, which are a heavy burden on the budget and a risk to the success of fiscal consolidation. Pension reforms are also among the conditions for the release of funds within a SAF operation under MEDA. Egypt started introducing elements of performance-based management and budget formulation with World Bank assistance. Moreover, in late 2001, the National Investment Bank (NIB) was removed from the supervision of the Ministry of Planning to be put under the responsibility of the Ministry of Finance, which should increase the control over public investment. There are also plans to review the social insurance system with a view to identify reforms needed to ensure medium-term fiscal sustainability. In 2002, Tunisia launched a review of its social security system with World Bank assistance to identify measures to ensure its long-term viability.76 These mainly involve reforms in the areas of health insurance and retirement pensions. The authorities have reduced public recruitment, but at the same time have raised the level of remuneration, so that the overall wage costs have not declined.
The budgetary process is an important institutional element determining how resources are allocated among policy objectives, thus ultimately affecting the efficiency and effectiveness of public expenditures. In some MED countries, budget planning and implementation display problems of prioritisation, comprehensiveness, transparency and accountability. For instance, the budget process in Egypt does not encourage the prioritisation of expenditures as, in the absence of an overall budget envelope, line ministries prepare unconstrained budgets based on perceived needs, and usually exceeding the previous year's allocations.77 Recently, the Egyptian government started requesting that line ministries submit feasibility studies backing their requests for budgetary allocation. There is scope for improving the coverage of the budget in some countries. For instance, until recently, in Israel, small groups of Members of Parliament were able to pass bills with direct budgetary implications on the current budget, i.e. introduce new expenditure items outside the normal budget process.78 In many MED countries, including Algeria, Morocco, Syria and Tunisia, sizeable government activities take place outside the budget, through ad hoc funds and institutions. While expenditures previously kept separate from the budget are gradually being consolidated in the budget, sometimes with the help of international institutions such as the IMF, reporting problems subsist, which also limit the quality of the analysis. The budget process could benefit from higher transparency as well. For example, in Egypt, public access to the budget, even after the approval by the People's Assembly, is limited on a "need to know" basis. Upon completion, expenditure data is made available in a much aggregated form and with big delays, limiting the accountability of the different spending units and the ability to monitor their efficiency and effectiveness. In some countries, specific assistance is being provided to improve the budgetary process and financial management. For example, in Jordan, the World Bank has extended two Public Sector Reform Loans (PSRL) aimed at supporting the Government of Jordan in boosting the efficiency
75 The PSET mainly finances activities in the areas of education, health care, water, construction and infrastructure, rural and social development. 76 Art IV 2002. 77 World Bank (2001) 78 The right to issue such “private bills” was temporary suspended in 2001, one of the measures taken by the government to contain the deficit.
- 29 -
of the public sector, including in the area of budgetary and financial management. The latest loan, (PSRL II, USD120 million) approved in 2002, will in particular support the government in strengthening the link between sector policies, ministries’ expenditure programs and budget allocation. An aid and investment project database will be developed to raise the efficiency of investments. The loan also seeks to promote a performance-orientation in ministries’ budgetary and financial management to boost services. Although at a different pace, all MED countries have also embarked on reforms of the fiscal revenues. The challenge for MED countries is to improve their capacity to raise fiscal revenues in a manner which limits the distortions to the economy and the external borrowing requirements, and that is sustainable and equitable at the same time. In particular, in a market economy, the tax system needs to provide correct incentives to save, work and invest, thus laying the foundations of sustainable growth.79 An additional incentive for fiscal reforms on the revenue side has come from the trade liberalisation commitments under the Euro-Mediterranean Association Agreements and other regional or multilateral agreements, which have implied in some cases the need to strengthen alternative sources of revenues to compensate for the loss of tariff receipts.80 Box 6: Fiscal revenue reforms in the Mediterranean Reforms on the revenue side of fiscal balance are on the agenda of all MED countries, as a means of fiscal consolidation as well as of reducing economic distortions and improving fairness and equity in the distribution of the tax burden. The scope and ambitiousness of the reforms in the region vary according to specific country circumstances and the level of political support. Most countries have introduced VAT or a GST and reformed custom tariffs. On the other hand, reforms of income taxes have proved slower and more controversial. Income tax systems in many countries still suffer from problems of opacity, inefficient tax administration, poor collection and abuse. In some Mediterranean countries, including Lebanon, Jordan and Egypt, fiscal revenue reforms have received specific financial support from the MEDA financial instrument of the European Community, notably in the form of Structural Adjustment Facility (SAF) operations.81 Tunisia has been active with tax reforms since the late 1980s, including the introduction of VAT in 1988, which have improved fiscal revenues. In 2002, a new Fiscal Code was introduced to further strengthen compliance and collection. Morocco introduced the VAT in 1986. The IMF has recently recommended a reform of the VAT, notably in view of revenue losses associated with the gradual tariff dismantling since 2000 in the framework of the Association Agreement with the EU. The IMF also suggests the gradual elimination of tax holidays and exemptions that erode the corporate income base. Algeria recently reformed the custom tariff system, notably reducing the dispersion of rates in view of the conclusion of the Association Agreement with the EU and of its bid to WTO membership.82 Some reforms of tax administration were also introduced. Egypt has taken some first steps to tackle the decline in government revenues, which is undermining fiscal sustainability. It extended the application of the GST to the wholesale and retail sectors (2001), and is now considering moving towards a full VAT. It also launched a one-stop-shop tax and customs centre, and began
79 "Good practice" tax reforms typically include increasing the reliance on a broad-based consumption tax (such as VAT), lowering import tariffs, simplifying and increasing the equity of personal income and corporate taxation (by limiting exemptions and having moderate top marginal rates), and improving tax collection and administration. 80 The final net effect of tariff dismantling on total fiscal revenues is expected to vary from country to country and does not need to be substantial. On the one hand, lower custom duties might be compensated by higher volume of imports – in the case of high import elasticities – and increased spending by consumers thanks to the positive wealth effects. On the other hand, tariff revenues may actually increase if trade liberalisation entails the elimination of tariff exemptions and the tariffication of non-tariff barriers. 81 These take the form of direct budget support operations, whereby the funds are disbursed in tranches that depend on the respect of the reform conditions attached to the operation, taking into account the country's macroeconomic framework. 82 Maximum tariff rates were also reduced, but a temporary additional duty – to be phased out by 2006 - was introduced to continue protecting local industries.
- 30 -
reforms of customs administration and tariffs, benefiting from EC financial support under the Trade Enhancement Programme approved in 2002. The system of direct taxation is under review, although actual implementation depends on the timing of presentation and approval by the Parliament. In Jordan, the reform of the tax system and tax administration is one of the elements of the government strategy of fiscal consolidation. In late 2002, a SAF operation was agreed to support the improvement of the coverage and the administration of the GST.83 According to the IMF, there is large scope for improvement in income taxation in Jordan. Lebanon successfully introduced VAT in early 2002 as an accompanying measure to trade liberalisation, and this is now estimated to yield revenues of about 3% of GDP. Reforms of direct taxation are also envisaged, but have so far been more limited. Lebanon registered improvements in tax administration and collection, which contributed to higher income taxes. The introduction of the VAT and of income taxation was supported by the EC through a Structural Adjustment Facility (SAF) worth EUR 50 million approved under MEDA I. Syria appears to have started a reflection on the need for tax reforms, but progress is rather slow. In view of the conclusion of an Association Agreement with the EU, and taking into account the gradual unification of the exchange rate regime, the authorities have been busy reforming the tariff system since 2000. A new tariff schedule has been released in mid-2003 and will form the basis of negotiations for tariff dismantling and reduction in the number of tariff lines (there are about 24 different import tariffs ranging from 1% to 255%). The introduction of a GST is also being considered. A fiscal reform law was apparently submitted to the Parliament in mid 2003, but the text is not yet available. In Israel, recent tax reforms have aimed at introducing more equity in the tax system while reducing the disincentives to work. These reforms include, on the one hand, the introduction of taxation on capital gains and on income of residents generated outside Israel and, on the other hand, the gradual lowering since January 2003 of the marginal rate on labour income.
8. Conclusions Fiscal positions improved markedly in all Mediterranean countries during the 1980s and 1990s. In 2001-2002, however, the majority of them experienced a deterioration of their fiscal performance, due to lower than expected growth and depressed revenues, but in some cases also because of higher expenditures. Despite progress made, the fiscal position of most Mediterranean countries still displays some elements of structural fragility. These vary from country to country and include large, and in some cases rising current expenditures on items that may be difficult to compress in case of a need for fiscal consolidation; for the hydrocarbon producers, strong dependency on volatile oil revenues, and for some others heavy reliance on foreign aid as a source of revenues. Mediterranean countries ought to continue remaining vigilant about preserving or making further progress towards sustainable fiscal balances. Recent weak economic growth, in particular in the private sector, has called into question the benefits of maintaining large and dominant governments. While the role of the state as a provider of employment of first resort has shown its limits, a stronger government role is called for in establishing the conditions for higher and sustainable growth and socio-economic development. Solving the protracted instability in the region would allow to free public resources from military spending. Streamlining the civil service also needs to be part of most countries’ expenditure reform strategies. The increasing attention being paid to raising the effectiveness and efficiency of the state in pursuing its policies is a welcomed development. A number of Mediterranean countries display higher public spending compared to other developing regions, but have been unable to respond to human development needs in key areas such as health, education and social safety nets. Some countries in the region have undertaken Public Expenditure Reviews or initiatives of similar 83 The authorities have recently gradually extended the application of the GST, but according to the IMF, the system remains rather complex which makes administration difficult and reduces compliance.
- 31 -
nature to improve the use of public resources. Progress in strengthening the budgetary process and financial management is also needed in many countries. Although at a different pace, all MED countries have embarked on reforms of the fiscal revenues, stimulated by the trade liberalisation commitments under the Euro-Mediterranean Association Agreements. Efforts to strengthen the quality and sustainability of public revenues are also a welcomed development. The analysis of the fiscal situation of the region would benefit from improved fiscal reporting. Fiscal information for the Mediterranean countries is rather fragmented. The cross-country and time comparability of the different data sets is complicated by reporting at different levels of aggregation, changes in classification, extra-budgetary accounts and, sometimes missing information for specific budget items or years. Fiscal data is generally available for the central government level, but is scarcer with respect to the general government (including also local governments and state-owned enterprises).
- 32 -

Financial sector development in Mediterranean partner countries84
• Over the last few decades, and particularly since the 1990s, Mediterranean Partners
have made progress in financial sector reforms, with financial aggregates showing a positive trend of financial sector deepening across all countries.
• However, financial systems are still dominated by banking sectors, foreign ownership
tends to be low, and heavy state involvement combined with weak institutions, tends to prevent financial sectors in the region efficiently intermediating financial resources.
• Some countries have redefined the role of the state in financial sectors while others need
to make more progress. For most countries, the institutional and regulatory environment needs to be further improved.
• The EU is supporting financial sector reforms in several countries (in particular with
financial sector adjustment facilities in Morocco and Tunisia) and various technical assistance programmes. Under the Mediterranean Investment Facility (FEMIP), the EIB channels loans and EC risk capital funds through local domestic banks.
1. Introduction Financial sector development is considered to be important for economic development and economic growth. Financial markets can pool savings and allocate resources between individuals and companies over time. More developed financial sectors can be better at spreading and pooling risks, leading to increased liquidity, which can promote savings, longer term investments, and the development of the private sector. Financial markets are believed to be more efficient at collecting and using information to monitor firms in which investments have been made, which allows for more efficient use of financial resources in terms of supply, allocation and monitoring. This can encourage higher levels of investment. Empirical studies on industrial and emerging market economies suggest that efficient financial markets can have a positive effect on growth. However, it is not always clear which way causality runs, and the view that economic development leads and facilitates financial market development still has some support. Overall, governments around the world attach a high priority to strengthening and developing efficient financial sectors. Financial sector development has many facets and requires a range of policy reforms across many complementary areas. Key aspects include a stable macroeconomic environment, effective regulation and supervision, a supportive legal and institutional framework, and competition. Competitive financial markets require government liberalisation of, for example, interest rates, credit allocation, market entry and other unnecessary restrictions on markets, as well as strengthened regulation and supervision. Privatisation and foreign entry can be drivers facilitating the removal of other government restrictions within financial markets. Recent evidence85 suggests that countries that have begun to reform their financial sectors have been more likely to undertake
84 This section is based upon a background paper prepared for the "Second Euro-Mediterranean Regional Economic Dialogue" (Rome, 20 October, 2003), http://europa.eu.int/comm/external_relations/euromed/etn/red/agenda.htm. 85 IMF, Abiad and Mody, “Financial Reform: What shakes it? What shapes it?”, WP/03/70.
- 33 -

further reforms, since initial reforms build their own momentum.86 Those countries with repressed financial sectors in the initial stage are more likely to stay that way. The first part of this section provides a general overview of financial system development in the Mediterranean partner countries using recent evidence and traditional financial aggregates.87 The second part examines banking sector issues in more detail, while the third part briefly examines non-bank finance, in particular, equity markets. Part four highlights some factors influencing financial sector developments in the region, and the final part briefly summarises and draws-out some policy issues going forward. 2. Overview of financial systems in the Mediterranean Over the last few decades, governments in the Mediterranean partner region have been trying, to varying degrees and at varying speeds, to create the right conditions to allow financial markets to play a more active role in the economy. Mediterranean partner financial systems have been gradually reformed, although most countries only began serious reforms in the 1990s. There are significant variations between countries, and the overall pace of reform lags behind reforms in many other regions. While reforms in some areas have proceeded apace, the overall speed of financial sector development has been hindered by lack of progress in others, for example, the institutional and regulatory environment. The region is still at an early stage in the process. A recent IMF study88 uses a detailed set of quantitative and qualitative indicators on the MENA89 region to produce an overall financial sector index which classifies countries by their level of financial development. Six themes are used including: monetary policy; banking sector size, structure and efficiency; quality of regulation and supervision; development of the non-bank financial sector; openness of the financial system and the institutional environment. Six indices, each composed of up to nine indicators, are created to reflect the level of development within these themes. Based upon this IMF study, the following relative ranking of Mediterranean partner countries emerges (Table 8).
Table 8: Level of Financial Development
HIGH MEDIUM LOW Lebanon Tunisia SyriaJordan Morocco
Egypt Algeria
Source: IMF Of Mediterranean partner countries, Jordan and Lebanon have relatively highly developed financial systems, while Algeria, Egypt and Morocco fall into the ‘medium’ category, and Syria figures as the most underdeveloped. Other Mediterranean partner countries were not classified. Several common trends and weaknesses emerge from this cross-country analysis. The institutional environment is generally poor in the MENA region, including the legal and judicial
86 Both because initial reforms strengthen the position of those who benefit from (and lobbied for) reforms relative to those who opposed them, and because initial reforms and liberalisation may necessitate further reforms. 87 MED countries are defined here as Egypt, Jordan, Lebanon, Algeria, Morocco, Tunisia, Israel, Syria. West Bank and Gaza is not covered due to lack of comparable data. 88 “Financial Development in the Middle East and North Africa”, Creane, Goyal, Mobarak, Sab, IMF 2003. 89 The MENA region includes MED countries plus, Djibouti, Iran, Iraq, Yemen, Bahrain, Kuwait, Libya, Malta, Oman, Qatar, Saudi Arabia, and the United Arab Emirates.
- 34 -

system, which makes it difficult to enforce financial contracts and recover assets. Only in one half of the countries are banking systems well-developed and in many the public sector still dominates, making market entry difficult. Involvement in credit decision is common, resulting consequently in high levels of non-performing loans (6-20% of the total). The study also finds that bank supervision and regulation needs to be improved, although Lebanon and Jordan receive particularly high marks for regulation, supervision and financial openness, and Tunisia and Morocco have also improved in this area in recent years. Those countries at the ‘high’ level of financial development tended to have less public ownership and to outperform other countries across all six categories. Israel, not being part of the MENA region, has not been ranked, although it has a relatively high level of financial development. It has a well developed open market economy, and a large efficient banking sector with good quality regulation and supervision. The non-bank financial sector is also relatively well developed. In what follows, some conventional financial aggregates and ratios are used to analyse the development and current status of financial systems, followed by a more specific focus on banking systems and non-bank finance. It should be noted, however, that since banking systems dominate financial sectors in Mediterranean partner countries, many of the monetary aggregates presented below largely reflect the operations of the monetary authorities and commercial banks. Also, conventional monetary and financial aggregates cannot provide a comprehensive picture of financial sector development, as they do not directly capture qualitative issues such as those discussed above (institutional strength, openness and quality of regulation, etc).90 Bearing these limitations in mind, including the specific country context, these aggregates can highlight broad trends. Qualitative information will be discussed when appropriate, although, by its nature, it is more difficult to obtain without more detailed evidence. M2/GDP developments
On the liabilities side, the ratio M2 to GDP can provide a crude measure of the size and depth of the financial sector and financial development.91 The ratio tends to rise as financial systems develop, the range of savings instruments spreads and liquidity increases, but then tends to fall again as other non-deposit based forms of savings instruments develop. Table 9 below shows the evolution of the ratio for selected MED countries since the 1970s.
1970 1975 1980 1985 1990 1995 2000Algeria 57% 55% 58% 77% 62% 40% 41%Egypt 35% 50% 67% 82% 86% 80% 77%Israel 51% 34% 22% 96% 70% 75% 94%Jordan 61% 77% 85% 93% 131% 102% 112%Morocco 30% 39% 40% 44% 54% 66% 83%Syria 37% 36% 46% 76% 54% 55% 63%Tunisia 33% 38% 41% 45% 51% 46% 55%Source: IMF IFS, Money supply equalls Money plus Quasi-Money
Table 9: Ratio of Money Supply (M2) to GDP
The data suggests that Israel and Jordan have relatively deep financial sectors. The ratio has risen over the last decade in Morocco, Tunisia and Syria, indicating greater access to banking systems. 90 Data limitations (particularly national accounts data) are also a factor. 91 The M2 monetary aggregate is usually defined as narrow money (M1), comprising transferable deposits and currency outside deposit money banks, plus quasi-money, comprising time, savings and foreign currency deposits of deposit money banks.
- 35 -
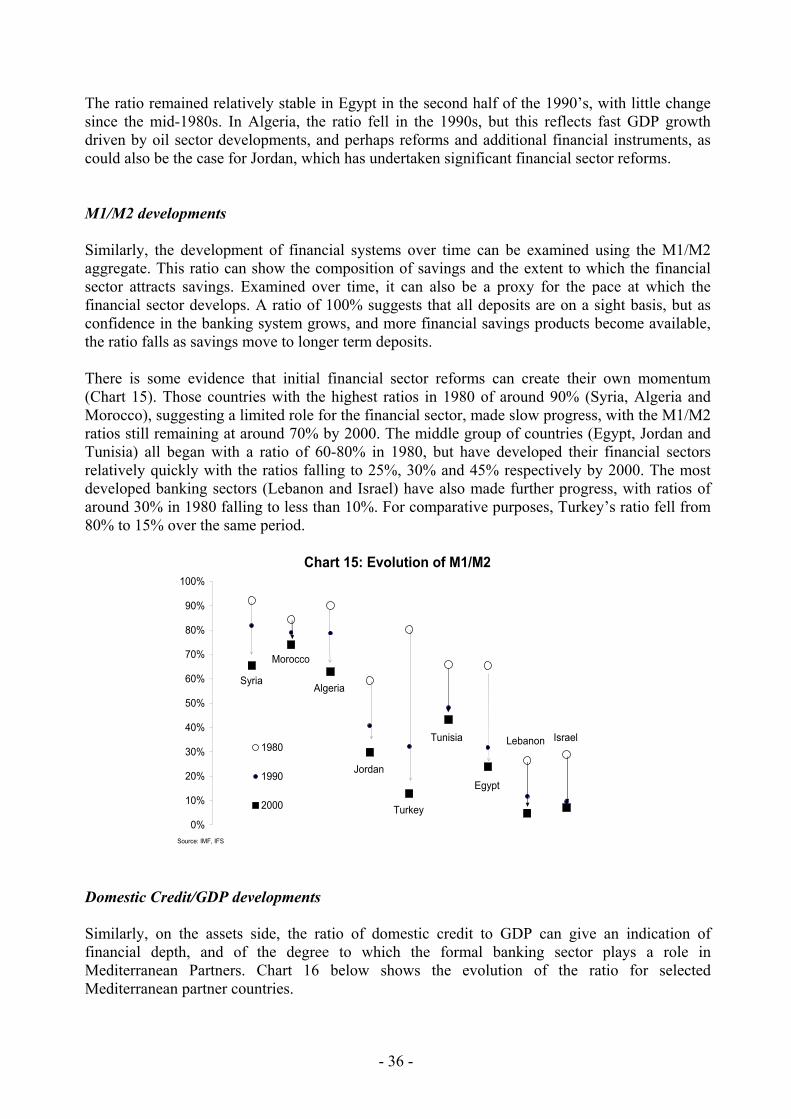
The ratio remained relatively stable in Egypt in the second half of the 1990’s, with little change since the mid-1980s. In Algeria, the ratio fell in the 1990s, but this reflects fast GDP growth driven by oil sector developments, and perhaps reforms and additional financial instruments, as could also be the case for Jordan, which has undertaken significant financial sector reforms. M1/M2 developments Similarly, the development of financial systems over time can be examined using the M1/M2 aggregate. This ratio can show the composition of savings and the extent to which the financial sector attracts savings. Examined over time, it can also be a proxy for the pace at which the financial sector develops. A ratio of 100% suggests that all deposits are on a sight basis, but as confidence in the banking system grows, and more financial savings products become available, the ratio falls as savings move to longer term deposits. There is some evidence that initial financial sector reforms can create their own momentum (Chart 15). Those countries with the highest ratios in 1980 of around 90% (Syria, Algeria and Morocco), suggesting a limited role for the financial sector, made slow progress, with the M1/M2 ratios still remaining at around 70% by 2000. The middle group of countries (Egypt, Jordan and Tunisia) all began with a ratio of 60-80% in 1980, but have developed their financial sectors relatively quickly with the ratios falling to 25%, 30% and 45% respectively by 2000. The most developed banking sectors (Lebanon and Israel) have also made further progress, with ratios of around 30% in 1980 falling to less than 10%. For comparative purposes, Turkey’s ratio fell from 80% to 15% over the same period.
0%
10%
20%
30%
40%
50%
60%
70%
80%
90%
100%
1980
1990
2000
Chart 15: Evolution of M1/M2
Source: IMF, IFS
Syria
Morocco
Algeria
Jordan
Turkey
Tunisia
Egypt
Lebanon Israel
Domestic Credit/GDP developments Similarly, on the assets side, the ratio of domestic credit to GDP can give an indication of financial depth, and of the degree to which the formal banking sector plays a role in Mediterranean Partners. Chart 16 below shows the evolution of the ratio for selected Mediterranean partner countries.
- 36 -

The evolution of domestic credit to GDP points to some deepening of the financial sector in the last decade, though this result needs to be interpreted cautiously. The ratio has been increasing in some countries, with particularly large increases in Morocco over the 1990s. However, in Algeria the ratio has fallen, especially in the 1990s. A closer look at the data shows that, although domestic credit increased fairly rapidly in absolute terms in the 1990s, this was driven by increased claims on the government by commercial banks, and was offset by oil-driven GDP growth, growing broadly twice as fast as domestic credit. In Israel, although domestic credit has been falling in proportion to GDP since 1980, private sector credit has remained fairly constant. The overall reduction has been mainly driven by constantly decreasing claims on the government, in line with declining fiscal deficits. These cases highlight the fact that the simple measure of domestic credit to GDP may not give a complete indication of financial sector development.
0%
20%
40%
60%
80%
100%
120%
140%
160%
Turkey Israel Jordan Syria Egypt Algeria Morocco Tunisia
1980 1990 2000
Source: IMF, IFS
Chart 16: Domestic Credit to GDP (%)
A decomposition of domestic credit into private and public sector components reveals a still strong role of the state in many countries. State involvement is high in Algeria, where less than 20% of credit is typically allocated to the private sector due to the risky investment climate and the reluctance of banks to lend given the already large non-performing loans to public enterprises of the banking system. Similarly, in state-dominated Syria, the ratio of private credit to total domestic credit is around 30% (around 10% of GDP). Nevertheless, in those countries that have undertaken financial sector reforms, such as Egypt and Morocco, the ratio of private sector credit to total credit has risen over the 1990s. In Egypt, the ratio increased from 30% of domestic credit to the private sector at the beginning of the 1990s to 60% at the end, while in Morocco the ratio rose from 34% to 60%. Monetary policy and interest rate liberalisation In the 1990s, most countries initiated reforms of monetary policy instruments and procedures. Mediterranean countries have gradually moved towards indirect instruments of monetary policy. Open-market operation techniques have been revised, even if their broad use is often hindered by the limited development or non-existence of secondary markets for government securities. In many cases the Central Bank’s independence from the government has been strengthened.92 This
92 Monetary Policies in the Arab Countries, Aly Tawfik Al-Sadek, Ma’bad Al-Garhi and Nabeel Latif (Editors), The Arab Monetary Fund, May 1996.
- 37 -
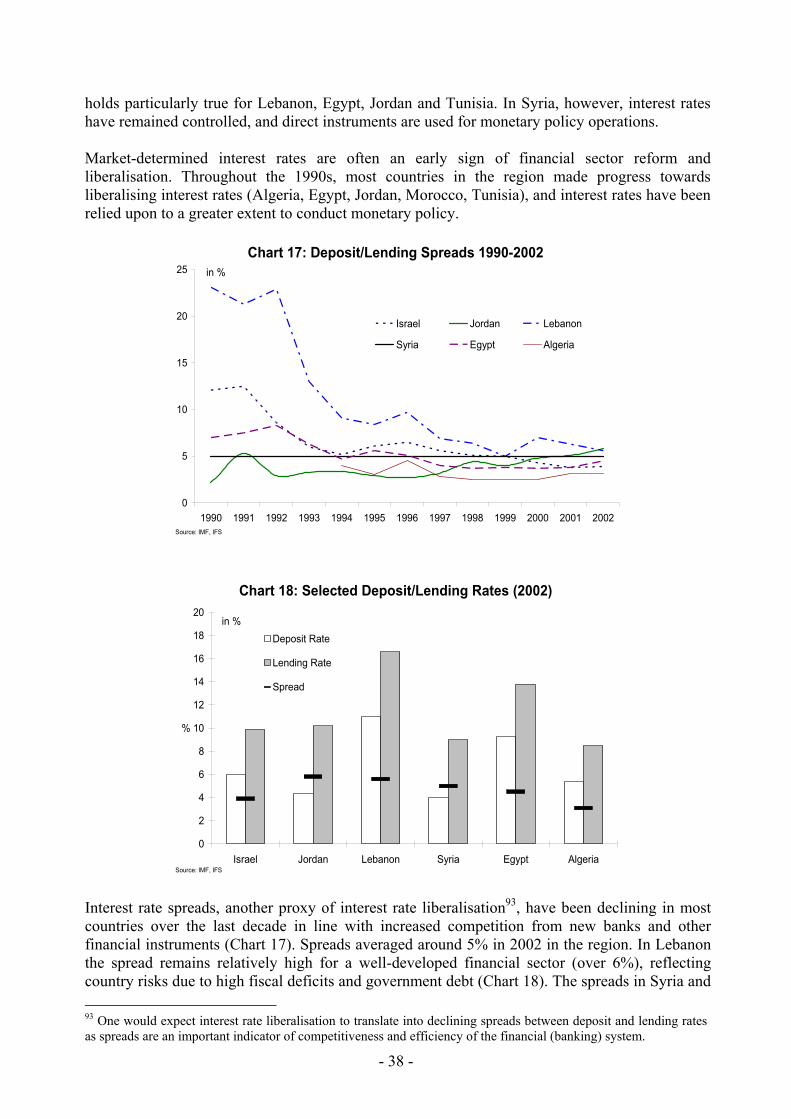
holds particularly true for Lebanon, Egypt, Jordan and Tunisia. In Syria, however, interest rates have remained controlled, and direct instruments are used for monetary policy operations. Market-determined interest rates are often an early sign of financial sector reform and liberalisation. Throughout the 1990s, most countries in the region made progress towards liberalising interest rates (Algeria, Egypt, Jordan, Morocco, Tunisia), and interest rates have been relied upon to a greater extent to conduct monetary policy.
0
5
10
15
20
25
1990 1991 1992 1993 1994 1995 1996 1997 1998 1999 2000 2001 2002
Israel Jordan Lebanon
Syria Egypt Algeria
Source: IMF, IFS
Chart 17: Deposit/Lending Spreads 1990-2002in %
0
2
4
6
8
10
12
14
16
18
20
Israel Jordan Lebanon Syria Egypt Algeria
%
Deposit Rate
Lending Rate
Spread
Chart 18: Selected Deposit/Lending Rates (2002)
Source: IMF, IFS
in %
Interest rate spreads, another proxy of interest rate liberalisation93, have been declining in most countries over the last decade in line with increased competition from new banks and other financial instruments (Chart 17). Spreads averaged around 5% in 2002 in the region. In Lebanon the spread remains relatively high for a well-developed financial sector (over 6%), reflecting country risks due to high fiscal deficits and government debt (Chart 18). The spreads in Syria and 93 One would expect interest rate liberalisation to translate into declining spreads between deposit and lending rates as spreads are an important indicator of competitiveness and efficiency of the financial (banking) system.
- 38 -
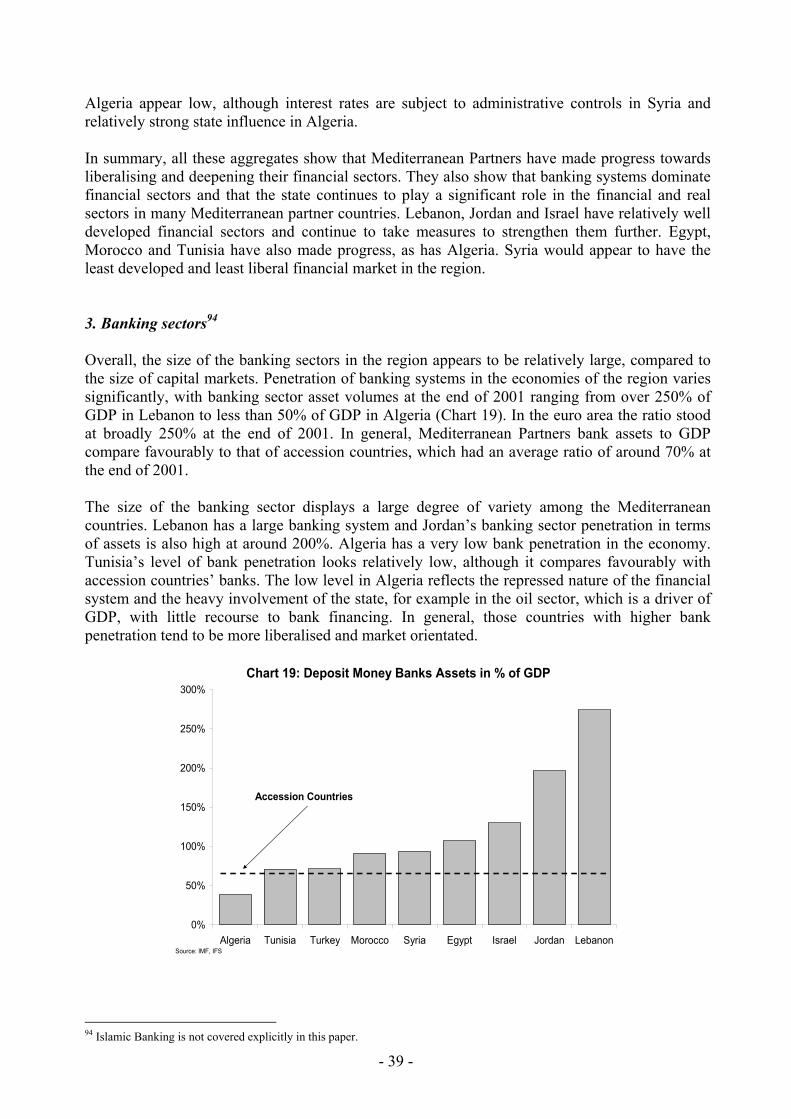
Algeria appear low, although interest rates are subject to administrative controls in Syria and relatively strong state influence in Algeria. In summary, all these aggregates show that Mediterranean Partners have made progress towards liberalising and deepening their financial sectors. They also show that banking systems dominate financial sectors and that the state continues to play a significant role in the financial and real sectors in many Mediterranean partner countries. Lebanon, Jordan and Israel have relatively well developed financial sectors and continue to take measures to strengthen them further. Egypt, Morocco and Tunisia have also made progress, as has Algeria. Syria would appear to have the least developed and least liberal financial market in the region. 3. Banking sectors94 Overall, the size of the banking sectors in the region appears to be relatively large, compared to the size of capital markets. Penetration of banking systems in the economies of the region varies significantly, with banking sector asset volumes at the end of 2001 ranging from over 250% of GDP in Lebanon to less than 50% of GDP in Algeria (Chart 19). In the euro area the ratio stood at broadly 250% at the end of 2001. In general, Mediterranean Partners bank assets to GDP compare favourably to that of accession countries, which had an average ratio of around 70% at the end of 2001. The size of the banking sector displays a large degree of variety among the Mediterranean countries. Lebanon has a large banking system and Jordan’s banking sector penetration in terms of assets is also high at around 200%. Algeria has a very low bank penetration in the economy. Tunisia’s level of bank penetration looks relatively low, although it compares favourably with accession countries’ banks. The low level in Algeria reflects the repressed nature of the financial system and the heavy involvement of the state, for example in the oil sector, which is a driver of GDP, with little recourse to bank financing. In general, those countries with higher bank penetration tend to be more liberalised and market orientated.
Chart 19: Deposit Money Banks Assets in % of GDP
0%
50%
100%
150%
200%
250%
300%
Algeria Tunisia Turkey Morocco Syria Egypt Israel Jordan LebanonSource: IMF, IFS
Accession Countries
94 Islamic Banking is not covered explicitly in this paper.
- 39 -

Disaggregated data on banking sector assets reveal some interesting features with regard to the role of the private and public sectors (Chart 20). The distribution of bank lending is particularly revealing in terms of the economic structure of Mediterranean partner economies and the heavy involvement of the state sector in many. Bank lending to central and local government is highest in Lebanon and Algeria, while public enterprises are particularly prevalent in Syria, Algeria and Egypt. In Jordan and Tunisia, the presence of the private sector is highest. More specifically, in Lebanon, even though the financial system is well developed, a large share of bank assets (broadly one-third) are holdings of government debt to finance large fiscal deficits, against the background of high real interest rates (>15% in 2001), which has crowded-out private sector finance (also accounting for one-third of assets). In Algeria, around 70% of banking sector assets are claims on the central government, but also on public enterprises, reflecting the important role of the state both in the financial and real sectors of the economy. In Syria’s case, while a large share of assets are on public enterprises, reflecting the predominant role of the state in the economy, over 50% of assets are foreign. In Jordan, on the other hand, another country with high banking sector penetration, nearly 40% of claims are on the private sector, with claims on the public sector at less than 10%. Similarly, in Tunisia, 85% of total assets are private sector claims.
0%
10%
20%
30%
40%
50%
60%
70%
80%
90%
100%
Turkey Israel Jordan Lebanon Syria Egypt Algeria Morocco Tunisia
Claims on Public Enterprises Claims on Central and Local GovernmentClaims on Private Sector Claims on Financial InstitutionsReserves Foreign Assets
Source: IMF, IFS
Chart 20: Deposit Money Bank Assets Composition in % of total (2002)
The quality of bank assets differs significantly from one country to another. While non-performing loans as a proportion of total loans for reporting commercial banks in the region amount broadly to 7%, there are important inter-country differences.95 In many countries non-performing loans represent a large proportion of total loans (30% in Lebanon, 16% in Egypt), while in some the proportion is less than 10%. It should also be recognised that, due to weak reporting and classification of loans, it is difficult to provide a full and reliable picture. The liability side of the banking sectors balance sheet appears to be dominated by demand deposits and other financial instruments having a rather short-term maturity. Demand deposits account for a relatively large proportion of total liabilities in Morocco (52%), Algeria (32%), Tunisia (20%), and Syria (19%), which is consistent with less developed banking sectors and, perhaps, lower confidence. However, even in countries with a large proportion of longer-term
95 BankScope 2003.
- 40 -

savings deposits the maturity structure remains relatively short term. For example, in Jordan, deposits with a maturity of less than one-year account for 90% of the total, and in Lebanon, over 60% of deposits have a maturity of less than 30 days.
0
10
20
30
40
50
60
LebanonEgypt
AlgeriaTunisia
MoroccoJordan
Syria
State-owned
Private
Source: IMF, IFS
Chart 21: Ownership structure by number of banks (2002)
An analysis of the ownership structure of commercial banks in terms of absolute number of banks (Chart 21) and in terms of ownership of equity capital (Chart 22) reaffirms the relatively strong role for the public sector. The equity share of the state is 100% in Syria, and 64% in Algeria, with no fully state-owned commercial banks in Jordan and Lebanon. The importance of state-owned banks in the Mediterranean region is also reflected in the proportion of bank assets held by the public sector. In Syria, all bank assets are owned by the state, with the state also dominating in Algeria. In Egypt, the state owns broadly 60% of total bank assets, and in Morocco and Tunisia, the proportion is over 40%.96 Despite a general trend among developing countries to open up their financial markets to domestic private and foreign competition, it appears to have happened at a much slower pace in Mediterranean partner countries.
0%
10%
20%
30%
40%
50%
60%
70%
80%
90%
100%
Jordan Lebanon Egypt Algeria Syria
Private domestic State-owned Foreign-owned
Chart 22: Ownership structure by equity ownership
Source: IMF, IFS 96 National central banks as well as IFS data.
- 41 -

The overall level of foreign ownership in Mediterranean banking sectors reveals further scope for progress in a number of countries. In terms of foreign ownership, Lebanon (25% of equity) stands out, while in Jordan, Egypt and Tunisia around 15% of equity capital is owned by foreigners. The low level of foreign participation in some Mediterranean partner countries appears to be related to the presence of state-owned banks, which gives an incentive to maintain protection and restrict entry. However, it should also be noted that, although some countries have liberalised their banking systems and allowed foreign entry, restrictions often remain on the maximum percentage of capital that can be held by a single owner, which effectively limits foreign control (Egypt). Regulations not only often prohibit the acquisition of domestic banks by foreign banks, but they often also constrain the services foreign banks can offer in the home markets. As a result, Mediterranean partner foreign banks tend to be small compared to their international peers. Also, while it is true that foreign-owned banks can also provide another source of finance to domestic firms, they typically supply capital to foreign-owned corporates. Privatisation of state-owned banks would facilitate increased liberalisation and competition. This is supported by a World Bank study97, which finds that for MENA countries, the higher the level of privatisation and foreign bank entry, the better the overall banking sector performance, profitability and soundness will be. In line with increased banking system development in the region, it is also true that regulation and supervision have improved, particularly in Lebanon and Jordan, but also in Tunisia and Morocco. These countries regularly collect banking system data for prudential purposes and are moving towards Basle standards. However, the level of non-performing loans in the region remains relatively high, and contract enforcement and the institutional and legal environment98 are generally unsupportive of deeper financial sector development. The enforcement of property rights remains weak, which constrains bank lending to SMEs and companies without long borrowing records or political connections. As a result, lending is biased towards short-term, trade-related projects with little long-term productive lending, which would be needed by start-ups and SMEs. 4. Non-bank finance While Mediterranean partner countries have undertaken financial market reforms, particularly since the 1990s, the pace and depth of reform has varied. Reforms have largely been concentrated on the banking sector, and this has been a factor in the slow development of capital markets. Equity markets are generally underdeveloped and lack innovation. The trading volume of stock markets is low, and bond markets are dominated by governments. Insurance, pension and investment fund markets also remain limited and underdeveloped. Equity markets There is a relatively large number of stock markets in the Mediterranean partner region. Some of them have a long history, such as the markets in Lebanon and Morocco, operating since the 1920s, and the market in Egypt, a very active market in the 1940s. Reforms to the legal and regulatory frameworks and improvements in technology in the 1990s have also improved the environment for equity markets to develop. Privatisation of state owned companies has also
97 Financial Liberalisation and Foreign Bank Entry in MENA, Jong-Kun Lee, May 2002. 98 For example, see Governance Matters III: Governance Indicators for 1996–2002, by D. Kaufmann, A. Kraay, and M. Mastruzzi (2003). Draft, June 30th.
- 42 -
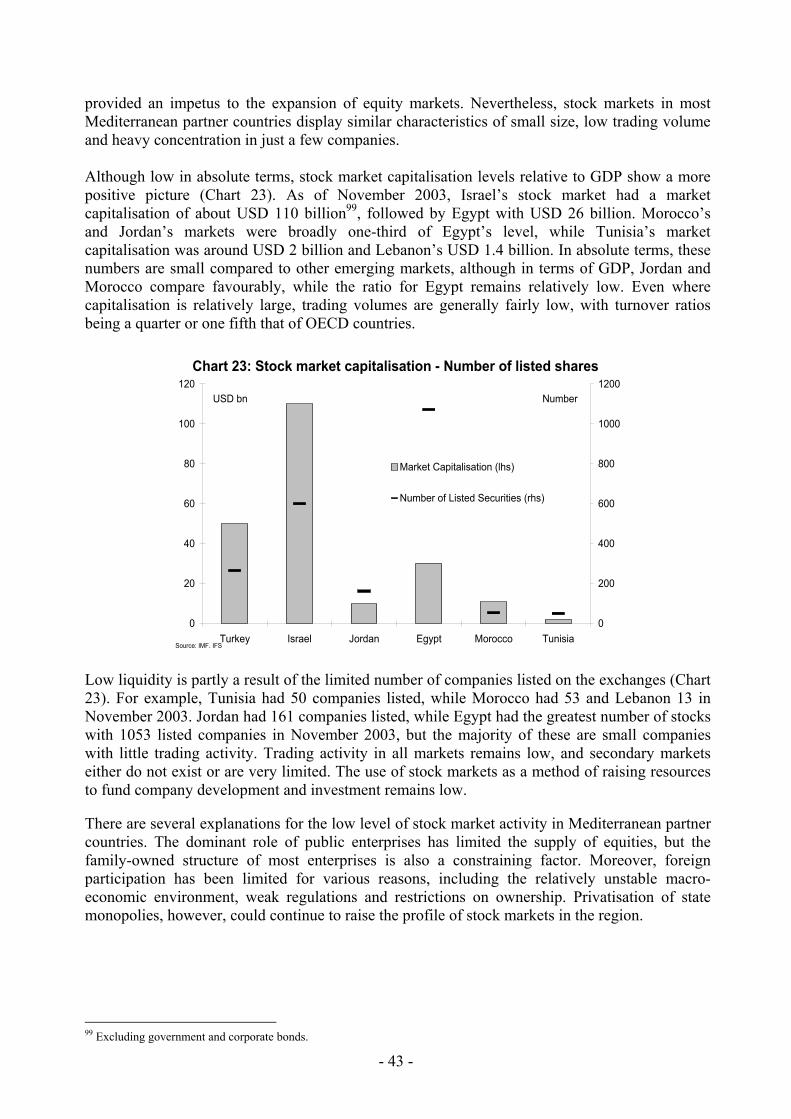
provided an impetus to the expansion of equity markets. Nevertheless, stock markets in most Mediterranean partner countries display similar characteristics of small size, low trading volume and heavy concentration in just a few companies. Although low in absolute terms, stock market capitalisation levels relative to GDP show a more positive picture (Chart 23). As of November 2003, Israel’s stock market had a market capitalisation of about USD 110 billion99, followed by Egypt with USD 26 billion. Morocco’s and Jordan’s markets were broadly one-third of Egypt’s level, while Tunisia’s market capitalisation was around USD 2 billion and Lebanon’s USD 1.4 billion. In absolute terms, these numbers are small compared to other emerging markets, although in terms of GDP, Jordan and Morocco compare favourably, while the ratio for Egypt remains relatively low. Even where capitalisation is relatively large, trading volumes are generally fairly low, with turnover ratios being a quarter or one fifth that of OECD countries.
0
20
40
60
80
100
120
Turkey Israel Jordan Egypt Morocco Tunisia0
200
400
600
800
1000
1200
Market Capitalisation (lhs)
Number of Listed Securities (rhs)
Chart 23: Stock market capitalisation - Number of listed shares
Source: IMF, IFS
USD bn Number
Low liquidity is partly a result of the limited number of companies listed on the exchanges (Chart 23). For example, Tunisia had 50 companies listed, while Morocco had 53 and Lebanon 13 in November 2003. Jordan had 161 companies listed, while Egypt had the greatest number of stocks with 1053 listed companies in November 2003, but the majority of these are small companies with little trading activity. Trading activity in all markets remains low, and secondary markets either do not exist or are very limited. The use of stock markets as a method of raising resources to fund company development and investment remains low. There are several explanations for the low level of stock market activity in Mediterranean partner countries. The dominant role of public enterprises has limited the supply of equities, but the family-owned structure of most enterprises is also a constraining factor. Moreover, foreign participation has been limited for various reasons, including the relatively unstable macro-economic environment, weak regulations and restrictions on ownership. Privatisation of state monopolies, however, could continue to raise the profile of stock markets in the region.
99 Excluding government and corporate bonds.
- 43 -
Government and corporate bond markets Government bond markets have become more sophisticated over the past few years. The development of markets for government debt is closely linked to the fiscal stances of Mediterranean partners and the need for public sectors to find new ways of financing public deficits and debt. In Lebanon, large fiscal deficits have led to the emergence of a deep domestic currency government bond market. Domestic debt is equivalent to over 100% of GDP and commercial banks hold over 60% of the total stock of T-bills and bonds. The maturity of these bonds ranges from less than 12 months (around a quarter of the total) to 24 and 36 months (majority of the rest). In Egypt, government securities include bills and standard, housing and special bonds. The latter are issued to raise capital for state-owned banks. The government bond market is also well developed in Israel. Nevertheless, overall secondary markets remain fairly limited with most bonds not actively traded. In terms of international bond issues, sovereign debt issues of Mediterranean partners have remained low as a share of emerging market issues. Lebanon is the main issuer in the region, given the need to finance large fiscal deficits and the recent policy of shifting to less expensive foreign currency debt, part of its strategy to improve the sustainability of the public finances. Egypt and Tunisia have also issued international bonds over the last few years and Morocco was an occasional issuer in the 1990s. However, access to international debt markets is still limited as a result of high economic and political risks reflected in credit ratings. Consequently, the MENA regions’ gross international bond issues has only averaged USD 3.5 billion, or 5.5% of the developing countries’ total, over the last three years.100 Israel is an exception and a regular issuer on the international debt markets, in order to fund fiscal deficits for refinancing and for debt management. It is expected to issue around USD 9 billion of bonds in the next few years. Although well functioning government debt markets can facilitate the development of private sector debt markets, and provide information about market expectations, this has not been the case in the Mediterranean partners. Corporate bond markets are still very limited, with very few issuances, and thus, their secondary market is not liquid. The fact that many large companies are either public or in the hands of politically well connected individuals has led to low repayment rates on such bonds in the past, which is likely to be another factor impeding the development of efficient bond markets. Compared to bank financing, equity and bonds markets are undeveloped in the Mediterranean partners for a number of reasons. Generally, in small economies with emerging financial systems, equity and bonds are not always a viable alternative to bank financing, given weakness in regulation and contractual enforcement mechanisms. Small investors tend to avoid equity investment and use bank deposits as their main savings vehicle. Furthermore, the lack of a sufficiently large number of adequately sized corporations in the private sector in the Mediterranean partners renders debt and equity issue relatively less cost efficient than, for example, syndicated bank loans. Insurance, pension and mutual funds, and other markets The development of insurance markets, pensions and mutual funds remains rather limited, as would be expected in countries at a relatively early stage of financial development. However, reforms to pension systems in some countries, for example Jordan, and a move towards funded rather than pay-as-you-go schemes should provide an impetus for the development of these 100 Source: World Bank, “Global Development Finance”, 2003.
- 44 -
markets. Venture capital funds also remain limited, although the EC, through the EIB, is providing funds for risk capital operations to help develop domestic financial sectors. Housing finance is an area that is relatively well developed in the Mediterranean partner countries, although such finance is often provided by specialised state-owned institutions, which has lead to subsidised credits and, therefore, market distortions.
Box 7: European Community support for financial sector reforms The MEDA programme is the principal instrument for financial support to Mediterranean Partner countries.Almost all operations are implemented under the MEDA II regulation1 covering the period 2000-2006, with totalavailable resources of EUR 5.4 billion. Two structural adjustment facilities (SAF) are currently operating in Morocco and Tunisia, focussing on financialsector reform. These aim to open up financial intermediation activities to competition and to scale down publicsector involvement in this field. At the same time, they try to reinforce monitoring and supervision of the bankingsector. Funds allocated to these two operations amount to EUR 52 million and EUR 80 million, respectively. Other programmes are delivered through various technical assistance programmes. In Syria, a banking sectorsupport programme is foreseen under MEDA II, following-up an earlier project targeting both the CommercialBank of Syria and the Central Bank. In Egypt, a financial investment sector project is planned (1st phase EUR 27million, 2nd phase: EUR 25 million). Other programmes in this area are "Support for the Financial Sector" inAlgeria and a "Support for Guarantee Funds for SMEs" in Morocco. In addition, the European Investment Bank (EIB), through FEMIP, manages EIB’s own resources and channelsEC budget funds in the framework of the Euro-Mediterranean Partnership. The latter include risk capitaloperations facilitated through local domestic banks, which are intended to support private sector development, butalso to strengthen the financial sector of the Partner countries. Financial sector reforms and support are also relevant to the EU's new neighbourhood initiative "Wider Europe",which will give a further impetus to the Euro-Mediterranean Partnership. This new strategy2 intends to strengthenrelations with EU neighbours and includes, in the economic domain, “the prospect of a stake in the EU’s InternalMarket”. This means further integration and further regulatory convergence between the EU and itsMediterranean Partners in many areas, one of which will be the financial services sector. 1 COM (2003) 587, 15 October 2003; 2 COM (2003) 104, 11 March 2003, COM (2003) 393, 1 July 2003
4. Factors affecting financial sector development There are several reasons explaining the features of financial systems in the region. Most importantly, the region suffers from economic and political instability, partly caused by the difficult security situation. The uncertainty created by this environment reduces domestic and external confidence, which reduces lending and investment. These risks are reflected in the low level of sovereign credit ratings for countries in the region (Table 10), high interest rate spreads, the predominance of short-term financial instruments and the relatively large degree of dollarisation.
Algeria Egypt Israel Lebanon Morocco Tunisia Jordan Syria TurkeyNot rated Baa1 A2 B3 Ba1 Baa2 Baa3 Not rated B3Not rated BBB- A+ B- BBB A BBB Not rated BSource: Moody's, Standard & Poor's
Table 10: Local Currency Credit Ratings for the Mediterranean PartnersOctober 2003
- 45 -
The slow development of the banking and financial sector has been also partly due to the availability of other sources of finance. For example, large capital inflows and export revenues into the oil exporting economies limited the development of banking sectors. In other countries, large remittances have been the main source of finance for economic development. In 2000, workers from the Mediterranean region sent home over EUR 18 billion, a large share of which comes from the EU countries.101 These flows form a substantial part of GDP, especially in Jordan and Lebanon, which receive the largest part of transfers from workers in the Gulf States and the US. Remittances to the Maghreb countries contribute up to 5% of GDP. In addition, heavy state involvement in financial sectors (particularly in Syria, Algeria and Egypt) prevents the development of competitive and efficient markets. Governments have traditionally set interest rates on deposits and lending, and credit has been directed towards state-owned companies or used to finance government deficits. This has led to high levels of non-performing loans and/or to the crowding-out of private sector finance. Furthermore, competition has been limited in many countries by restrictions on entry for new local and foreign banks. A lack of competition leads to a low degree of innovation and weak and inefficient transformation of short-term liabilities into long term assets. Banks tend to lend short term and focus on large companies. The low intensity of competition is reflected in the relatively large interest rate spreads, high bank concentration ratios and the relatively low level of foreign ownership. The quality of governance at the bank and economy levels is also an important factor. At the bank level, state involvement and lack of competition prevents innovation in lending practices and reduces incentives to improve skills in credit and risk assessment, thereby limiting the ability to seek out profitable opportunities. Weak judicial systems make it difficult to enforce creditors’ rights through, for example, the recovery of collateral, which discourages bank lending. Banking sector regulation and supervision does not generally reach international standards in the region either, which increases risks for savers in terms of bank quality and performance. Accounting standards are generally poor, with many companies (even those quoted on stock markets) not issuing quarterly data or publishing audited accounts on a regular basis. Israel is an exception, reaching international standards in most areas. 6. Conclusions While financial systems in Mediterranean partner countries are diverse and at different stages of development, in general banking systems dominate financial system activity and foreign ownership tends to be low. Heavy state involvement in many countries biases the allocation of financial resources and, combined with generally weak institutional environments, prevents financial sectors in the region from efficiently intermediating financial resources. Nevertheless, over the last few decades, Mediterranean partner countries have been liberalising and reforming their economies. The financial sector is no exception and much progress has been made, with many countries beginning comprehensive reforms at the beginning of the 1990s. Financial aggregates show the positive trend of financial sector deepening across all countries, with Israel, Lebanon and Jordan having the most developed financial sectors in the Mediterranean region, while Syria’s remains the least developed. 101 ECB, " Financial and economic links between the Mediterranean region and the euro area: an overview" unpublished, Frankfurt, October 2003.
- 46 -
Apart from Syria, interest rates have been liberalised and monetary policy now uses more market based instruments. In general, financial systems have become more efficient with credit decisions taken more on the basis of the quality of projects rather than the nature of the borrower or political connections. However, while the state has been withdrawing from the financial sectors in many countries, with little or no state involvement in Jordan and Lebanon, the financial systems in Syria and Algeria remain largely state-dominated. Connected lending still remains an issue in many countries, adversely affecting the quality of banks’ balance sheets and the role of the state in financial systems in many countries needs to be redefined. Allowing foreign banks to enter with no restrictions on their operations would bring increased competition and innovation. For many years, financial institutions have not been granted full responsibility for their credit allocation and investment decisions. In many countries, further progress critically depends on definitively severing the link between public banks and the large loss-making public enterprises. This would insulate credit decisions from political and administrative interference, and create an appropriate environment for the privatisation of banks. A revision of the role and size of the state presence in the financial sector is needed. Non-bank capital markets and finance in the region remain undeveloped and this may reflect the overall level of economic development. Although the importance of bank versus non-bank finance can be debated, there may be a case for measures to deepen the role of non-bank finance in the economy in order to offer alternatives to bank finance, which dominates financial systems. Recent evidence102 indicates that the institutional environment in most Mediterranean partner countries needs to become friendlier towards the private sector. Weak judicial and legal systems make it difficult for financial institutions to enforce contracts. This includes weak bankruptcy laws and procedures, unclear land and collateral ownership rights, as well as difficulties in recovering collateral when necessary. As markets are liberalised and private ownership increases, supervision and regulation needs to be strengthened to monitor and influence system stability. This will increase confidence in financial systems. Improvements in these areas will also facilitate the development of deeper capital markets, which at present remain undeveloped. In summary, Mediterranean partners have made progress in developing financial sectors, particularly over the last decade. However, more needs to be done in order to make financial systems more efficient and competitive, allowing them to play a more active role in economic development. In particular, the role of the state in financial systems and the need to improve the institutional environment appear to be key issues going forward.
102 Source: World Bank Governance Indicators.
- 47 -

Part B
Country Analysis
- 48 -
ALGERIA • During 2003, economic growth accelerated significantly to 6.8% from 4.1% the
previous year, mainly on the back of a strong recovery in the agriculture sector and a surge in hydrocarbon revenues. The earthquake of 21 May had only a limited impact on growth, as reconstruction activities appeared to more than offset its effect on output.
• After recording a budget surplus of 3.4% of GDP in 2001, the consolidated fiscal
surplus shrunk close to balance in 2002, but recorded again a sizable surplus in 2003 (3.5% of GDP), mainly as a consequence of substantial increases hydrocarbon revenues.
• In 2003, Algeria witnessed again a substantial current account and trade surplus of
around 12% and 16% respectively, driven by volume increases of hydrocarbon exports, as well as favourable oil price developments.
• In April 2002, the European Union and Algeria signed the EU-Algeria Euro-
Mediterranean Association Agreement in Valencia following the conclusion of negotiations in December 2001, which remains to be fully ratified.
1. Macroeconomic developments Real sector developments In 2002, GDP growth accelerated to 4.1%, compared to 2.6% in 2001, with the stimulus coming mainly from domestic and foreign direct investment activity. In 2002, the "Economic Recovery Plan" (table 11) promoted several power, water and infrastructure projects, making gross fixed investments the most dynamic GDP component with a growth rate of 12.3%. Overall, the government has pledged USD 3 billion (around 5% of GDP) to infrastructure development projects for 2002-04. Although the expansion of the hydrocarbon sector was weaker (3.7%) than the government had anticipated (6.7%), it contributed to raising the growth rate of industrial production to 1.4% in 2002, after a decline in 2001. Despite the mild upswing, no significant improvement in labour market conditions could be recorded, as reflected in a chronically high unemployment rate. The official unemployment rate recovered only slightly to 26.7% in 2002, compared to 27.3% in 2000. According to some estimates, the actual unemployment rate is as high as 50% for young people.103 In 2003, economic growth accelerated significantly to around 7%, mainly on the back of a strong recovery in the agriculture sector, a surge in hydrocarbon revenues and a large fiscal stimulus. Cereal output expanded by more than 20% this year, owing to better meteorological conditions, but also to government financial assistance and higher investments in the agricultural sector. The strongest contribution to growth came from the hydrocarbon sector. Crude oil production amounted to an average 1.11 billion barrels/day, some 43% over its OPEC quota.104 Exports advanced strongly in the first eight months of 2003, reaching USD 15.2 billion, up 30% compared to the same period a year earlier, and easily offsetting the impact of weak manufacturing output on overall growth. The earthquake of May 2003 had only a limited impact 103 Economist Intelligence Unit, "Country Forecast: Algeria", 11 September 2003. 104 International Energy Agency.
- 49 -

on growth. The destruction of capital and its dampening effect on private consumption should be more than offset by the upswing in activity - particularly in the construction and civil engineering sector – triggered by the budgetary momentum and by government actions to address the critical housing shortage.
2001 2002 2003 2004 2001-04Direct support to agricultural 10.6 20.3 22.5 12.0 65.4 production and fishingLocal development 32.4 42.9 35.7 3.0 114.0Public works 93.0 77.9 37.6 2.0 210.5 Water management 5.4 15.8 10.1 0.0 31.3 Railways 9.7 28.9 16.0 0.0 54.6 Roads 24.5 5.8 0.6 0.0 30.9Human resources development 39.4 29.9 17.4 3.5 90.2Other reforms 30.0 15.0 0.0 0.0 45.0Total (in DZA billion) 205.4 185.9 113.2 20.5 525.0Total (in % of GDP) 4.7 4.0 2.2 0.4 2.8Source: Algerian authorities
* planned expenditures
Table 11: The Economic Recovery Plan 2001-04*
Annual average consumer price inflation decelerated dramatically in 2002, as one-off supply-side factors offset price pressures emanating from high growth rates in monetary aggregates. Monthly price decreases during most of the year pushed the annual inflation rate down to -1.6% in December compared to an inflation level of 6-6.5% at the beginning of the year. This disinflation process may be attributed, first, to a relative abundance of agricultural products following the removal of some production constraints through the National Program for the Development of Agriculture. Its implementation facilitated the decline of food and non-alcoholic beverage prices by 2.1% (CPI weighting: 44%). Secondly, the reduction in trade barriers, predominantly the abolishment of minimum duty values and the streamlining of the tariff system to four rates, allowed to lower import prices and stimulated competition with local production. These exceptional circumstances have led to price stability in the presence of strongly growing monetary aggregates, as liquidity increased due to the acquisition of foreign assets stemming from hydrocarbon export receipts. In 2003, inflation picked up on the back of stronger domestic demand and, possibly, the lagged effects of excess money balances. The mild deflationary process reversed in Q2 2003, and the annual inflation rate rose steeply to a level of close to 5% in September. Cumulative inflation in the first nine months of 2003 stood at 1.8%, down from 2.1% during the same period last year, nurturing expectations that the annual average inflation for 2003 would amount to around 2.3%. Increasing prices coincides with the upswing in domestic demand, driven by oil exports and the expansionary fiscal stance, but may also reflect an adjustment to rapidly growing monetary aggregates in 2001 and 2002, which increased by around 25% in each of these years. This argument is supported by an IMF study that evidences a stable and long-term money demand function. 105 Fiscal policy As for fiscal policies, Algeria maintained an expansionary stance in 2002, reflecting predominantly higher spending and a relative decline in hydrocarbon revenues. According to 105 IMF, “Money Demand and Monetary Policy: Evidences from Algeria", forthcoming.
- 50 -

preliminary data, the overall fiscal balance recorded a deficit of 0.2% of GDP after surpluses of 9.7% and 3.4% of GDP in 2000 and 2001, respectively. The non-hydrocarbon balance deteriorated to close to 33% of non-hydrocarbon GDP (2001: -31% of GDP). Total expenditures increased by about 24%, fuelled by rises in the public sector wage bill, public consumption and public investment activities. Revenues progressed at a slower pace, increasing by 13.5% during 2002. This outcome was in particular influenced by a relatively poor performance of petroleum revenues, which declined slightly as a consequence of weak oil prices in the first half of 2002. The authorities took steps to counter the decrease in oil-related revenues by putting in place tax measures (including intensified collection and enforcement efforts for the VAT, a widening of the tax base for custom duties, and a 10% property tax). In 2003, unexpected reconstruction costs following the earthquake were outpaced by stronger-than-expected oil revenues, which led to a budget surplus of around 3.5% of GDP (Chart 24). Following the earthquake in May, the parliament approved a supplementary budget, allowing for a spending increase of 3.5% of GDP to provide for the construction of housing and assistance to the affected population. Reconstruction financing is expected to have led to a small budgetary deficit (-0.4% of GDP in 2003) despite higher than expected oil revenues, associated with strong oil and gas prices and higher output. Fiscal receipts from the state-owned hydrocarbon company Sonatrach totalled DZA 879.3 billion in the first eight months of 2003, compared with a target of DZA 836.3 billion for the year as a whole. The overall evolution points to a surplus of around 3.5% of GDP, but has to be taken with caution. Evolutions of expenditures and revenues in Algeria are highly volatile and there seems to be a tendency to engage in unprogrammed expenditures in the run-up to the 2004 presidential election, as indicated by the recent 25% increase in the minimum wage.
Chart 24: Algeria - Consolidated budget balance
-6
-4
-2
0
2
4
6
8
10
12
1996 1997 1998 1999 2000 2001 2002 (est.) 2003 (for.)0
5
10
15
20
25
30
35in % of GDP
Source: Ministry of Finance, IMF
Oil price (right scale
in USD
Consolidated budget balance (left scale)
Monetary and exchange rate policy The rapid expansion of hard currency reserves thanks to higher oil-export proceeds, combined with an accommodative monetary stance, prepared the ground for another rapid increase in Algeria's main monetary aggregates in 2002. Only since May-June 2003, this expansion appears to have slowed down somewhat. M2 increased by 25% in 2002, as components of quasi money (DZA time deposits and foreign currency) grew rapidly due to increased revenues and savings by enterprises of the hydrocarbon sector. The rise of monetary aggregates was also reflected in the
- 51 -

significant growth of net foreign assets in the banking system. The Central Bank's international reserves increased more than fivefold since the end of 1999 and reached USD 30 billion in September 2003. Excess liquidity seems to have been sterilised only partially, creating a potential source for future inflationary pressure, despite the rise of minimum reserve requirements, and the introduction of negative liquidity auctions to withdraw the excess liquidity in the banking sector accumulated since mid-2002. The Central Bank of Algeria has continued to rely on a rather tightly managed exchange rate regime against the US dollar, and has managed to slow the Algerian dinar’s nominal depreciation path of the recent past. The use of the US dollar as the reference currency reflects Algeria’s almost exclusive dependence on a single export commodity. However, owing to capital controls and other financial market rigidities, such as the absence of a fully functioning foreign exchange market, the impact of market forces as well as interest rate changes by the US Federal Reserve, effects on the exchange rate have so far been limited, and a relative degree of monetary policy independence could be kept. As for the nominal exchange rate, its depreciation against the US dollar slowed in 2002, and a slight appreciation since Q2 2003 could be recorded. In contrast to this, the real effective exchange rate has been depreciating starkly since the beginning of 2002, around 25% up to June 2003, as a consequence of both the weakening of the US dollar against the euro since the beginning of 2002 and deflationary tendencies in Algeria (Chart 25).
70
80
90
100
110
120
130
140
150
Jun-92 Dec-93 Jun-95 Dec-96 Jun-98 Dec-99 Jun-01 Dec-02Source: IFS
Chart 25: Algeria - Real effective exchange rate developments
Index: upward movement = appreciation
Real depreciation due to USD weakness and favourable price developments
The independence of the Central Bank appears to have weakened following the adoption, in H2 2003, of a presidential decree amending the Money and Credit Law of 1990.106 The changes refer to the regulation of relations between the Central Bank and the government, requiring the Central Bank to submit to the government monthly reports on its monetary policy, debt-management developments, and level and composition of foreign currency reserves. The decree also increases the importance of the Money and Credit Council vis-à-vis that of the Central Bank governor and strengthens the role of the two “censors”. The move comes in the wake of two major banking scandals, and was justified by the Minister of Finance on the grounds of “insufficient consultations” from the side of the Central Bank.107 Although the overall impact can not yet be assessed fully, market participants have interpreted this action negatively.108 106 Ordonnance N° 03-11 du 26 août 2003 relative à la monnaie et au crédit. 107 Speech by Mr. Abdellatif Benachenhou, Minister of Finance, mid-October 2003. 108 Economist Intelligence Unit - Business Middle East, "Regulatory Watchlist: Algeria", 1 November 2003, Number 1350-7354.
- 52 -
External sector developments The balance of payments’ situation remained strong in 2002, but weakened somewhat in comparison with the period 2000-01. Weaker oil exports and stronger imports caused Algeria’s trade surplus to decrease by around one fourth to a surplus of USD 6.7 billion in 2002, equivalent to 13.4% of GDP. Exports dropped 3.72%, to USD 18.42 billion, as state-run Sonatrach exported USD 18 billion worth of oil and gas in 2002, 2.7% below the level of the previous year, reflecting mainly weaker oil prices. Nevertheless, oil and gas export revenues accounted for more than 97% of total export revenues in 2002. A pickup in domestic demand translated into higher imports in 2002, up 18.2% to USD 11.75 billion. As a consequence of these trends, the current account surplus narrowed to USD 4.4 billion, or 8% of GDP. Some of the oil revenues were used to reduce Algeria’s foreign debt level to around USD 23 billion (40% of GDP) in December 2002, while the debt-servicing ratio remained at a moderate level of around 23% of total exports receipts. Foreign exchange reserves rose to more than USD 23 billion in December 2002, covering almost two years of imports, thus comforting the strong external position of the country. In 2003, the current account strengthened on the back of a relatively strong exports performance. According to customs data, Algeria’s exports performed well in the first nine months of 2003, and were up 28% over the same period a year earlier, amounting to USD 16.85 billion. This was mostly due to a surge in hydrocarbon exports, coupled with favourable oil price developments, while non-oil exports dropped by 10.7%. The Ourhoud oil field began producing in early 2003, and reached its plateau of 230,000 barrels per day in April 2003, making it possible for Algeria to increase the volume of its exports by around 8%. Imports rose 7.1% to USD 9.5 billion in the first nine months of 2003, an increase associated with higher imports of intermediary and capital goods. Food imports fell to USD 1.9 billion in the same period, thanks to a good cereal output this year. Subsequently, the trade surplus stood at USD 7.3 billion up to the end of September, and increased to around 16% of GDP for 2003 as a whole, while the current account strengthened to around 11.5% of GDP. The significant influx of oil-related revenues bolstered Algeria's international reserves further, increasing them to USD 31.5 billion at the end of December 2003 (23 months of imports). The capital and financial account balance recorded overall outward flows of USD 0.7 billion in both 2002 and 2003, respectively, in line with the small deficits recorded in the previous years. In general, repayments on foreign debt - average net amortisation amounted to roughly USD 1.6 billion in the last 5 years - represent the main factor behind the capital account deficit. Loan amortisation payments are only partly compensated by net foreign direct investment flows, whose annual average has been USD 0.9 billion over the past five years. In general, FDI flows are expected to remain steady, as the attractiveness of the hydrocarbon sector - where most foreign investment is concentrated - still appears to outweigh risks associated to the ongoing problems related to Middle East Peace Process. According to the IMF, FDI rose to USD 1.1 billion in 2003, comparing favourably with the inflows of recent years. Short-term capital flows remain virtually absent again in 2003, and have not played a significant role since 1999, when short-term outflows amounted to roughly USD 1 billion. External debt indicators have continued to improve in 2003 thanks to debt repayments allowed by high oil-related export revenues. The external debt level decreased from USD 28.3 billion at the end of 1999 to an estimated level of USD 23 billion at the end of 2002 - equivalent to 40.5% of GDP -, and was expected to further decline further to around 33% of GDP by the end of 2003. Moreover, the favourable composition of the maturity structure of foreign debt - 99.3 % of the
- 53 -
debt is medium- and long term debt - softens Algeria's immediate vulnerability, in particular given the presence of strongly increasing foreign exchange reserves (USD 31.5 billion). However, Algeria remains economically and financially vulnerable vis-à-vis a long-lasting decline in oil prices, as hydrocarbon revenues currently account for 97% of export revenues and 60% of budgetary revenues. 2. Structural reforms Trade liberalisation The Association Agreement with the EU, signed in April 2002 (ratification is pending), is supporting the reduction of trade barriers over the medium term, and is expected to facilitate Algeria's desired entry into the World Trade Organisation (WTO). The EU-Algeria Association Agreement foresees the creation of a free trade zone between Algeria and the EU by 2014. Upon ratification, the Agreement provides for the gradual removal of import duties on imports of EU industrial products during a transitional period of 12 years (25% tariff reduction following ratification of the agreement, 40% after a seven-year period, and the remaining tariff obstacles should be abolished after 12 years). Steps to meet WTO accession requirements, for which negotiations have started in 1995 and are ongoing, will further bolster trade liberalisation efforts. The 2001-02 tariff reform seems to be heading in the right direction, although protectionist temptations diluted somewhat the overall outcome. Following strong pressure from the IMF and the EU, Algeria streamlined the tariff system by replacing it at the beginning of 2002 with a system based on three categories (raw materials and equipment goods, intermediate products, and final products), and unified tariff rates for each of them (5, 15 and 30% respectively). However, in order to continue to protect local enterprises, the government imposed simultaneously a "temporary additional duty" of 60% on a list of goods. Although the temporary additional duty has been progressively reduced to 36% at the beginning of 2003 (to be phased out by 2006), it shows that the system may still be revised in an ad hoc manner, often in response to "vested interests". Fiscal and public administration reforms There is no single general tax code in Algeria, but five different codes of taxes. From 1992, the tax system has been undergoing reforms in order to introduce the VAT, the corporate tax and the income tax. The system is marked by a weak revenue-earning capacity except for the hydrocarbon sector, which has generated an increasing amount of revenues in recent years, but still not enough to cover the current expenditure needs of the state. Although the ordinary taxation is 15-17% of GDP (excluding the hydrocarbon sector), the fiscal burden is perceived as high by the population, partly due to the use of special levies and of some anti-economic taxes (like the tax on professional activity, based on the turnover, or the flat-rate fee, based on salaries). Recent tax reforms have included the simplification of VAT and the reduction of corporate tax rates to 30%. The tax on professional activity and the flat rate fee are also being phased out, and have equalled 1.25% and 3% respectively for 2003. Significant progress remains to be made concerning the rights of taxpayers and the treatment of fiscal litigations (still very slow in case of default). Following the launch of a public administration reform in 2000, an ad-hoc Committee was created. It recommended in 2001 to President Bouteflika, who had initiated this reform, further
- 54 -
decentralization (creation of regions and local finance, and redefinition of the role of the central administration) and improvement of governance and management of state owned companies and assets by involving the private sector in the management of infrastructures. Some recommendations have already started to be implemented, especially the ones concerning the involvement of the private sector in infrastructures, with the creation of regulatory authorities. Privatisation, enterprise restructuring and business environment Resistance to privatisation is strong, mainly concentrated in the energy trade unions as well as parts of the public sector elite, and is reflected in the privatisation results for 2002-03. The government announced in February 2002 that it would privatise, either fully or partially, 100 state-owned firms during the course of the year. These mostly comprised small companies in areas ranging from hotels to food processing, although they also included the shipping firm SNTM and three medium-sized cement plants. Yet by September 2003 no single enterprise had been sold, reminding of a previous privatisation attempt in 1998, when the government failed to sell any of 89 state-owned companies that it had foreseen to privatise. The process stalled as a result of strong opposition by powerful trade unions and an unclear distribution of responsibilities with regard to the privatisation process. Furthermore, a cabinet reshuffle at the beginning of 2003, demoting the privatisation ministry (Ministry of Participation and Investment Promotion) to the status of ministry-delegate reporting to the Prime Minister, seems to have undermined prospects of a more decisive process. The reorganisation of the hydrocarbon sector has also stalled after the freezing of the hydrocarbons bill in December 2002, with negative implications for the overall economic reform process. Following the nationalisation of the oil industry in 1971, Sonatrach, the main producing company, has been operating both as a regulator (overseeing the operations of the sector, including those of foreign firms) and as a market participant, actively pursuing its own development and extraction opportunities. In order to tackle this conflict of interest, the Ministry of Energy proposed a new three-tier regulatory structure, implying a higher degree of competition in each part of the energy sector and forcing Sonatrach to restructure its activities. The new system was also aimed at speeding up bidding procedures and improving transparency through the non-discriminatory awarding of contracts, which has contributed to the declining interest of foreign investor since the mid-1990s. The reform finally stalled after concerns about the associated job losses, but possibly also due to vested interests given the dominant economic role of the hydrocarbon sector. In contrast, the liberalisation process of the electricity and gas sector appears to have moved forward. In January 2002, the parliament passed an electricity and gas law, ending the monopoly of Sonelgaz over the domestic electricity and gas markets, and clearing the way for the liberalisation of the sector by 2005. The bill foresees the opening of electricity generation to full private competition and the establishment of a new regulatory body, the Commission for Regulating Electricity and Gas (CREG), which will act as the authority responsible for enforcing technical, environmental and economic regulations. It will also ensure transparency and fair competition between all participants, and will be responsible for setting transmission prices. Furthermore, Sonelgaz will be restructured by establishing two new subsidiaries, one for the transmission of electricity and one for gas. In addition to that, the responsibility of ensuring that supply and demand is matched will be handed over to a private firm. Finally, the law also provides for a gradual opening of the retail market to private competition (30% opening within three years), allowing consumers to choose their own supplier.
- 55 -
Despite some legislative intentions in the railway area, slow progress in implementation has not allowed to tackle the substantial shortcoming of the railway sector. In 2001, the government presented to the parliament's economic-committee a draft legislation to open the rail network to private business, operating on a franchise basis. Under the terms of the draft bill, the state would lease out franchises to the private sector for running rolling stock and commercial management, and maintaining and running signalling and safety systems. However, by September 2003, there had been no progress in this plan despite the apparent shortcomings in this sector. Like the rest of the transport network, the railway system has been neglected since independence. Passenger service is depleted, and the national railway company transports mainly cargo. Most of the network is narrow-gauge track, rolling stock needs replacement, and the track and signalling infrastructure require upgrading. Financial sector reforms Monetary policy setting and implementation, a vital ingredient for the financial sector environment, appears still hampered by numerous factors.109 The strong dependence of the economy on hydrocarbons revenues and the resulting swings in bank liquidity hamper monetary management. The market in Treasury securities is constraint by a lack of marketable government securities in the portfolio of the Banque d’Algerie. The financial market, in general, displays weaknesses and the strong public presence in the banking sector implies a low degree of competition among banks. Furthermore, the monetary transmission channel is obstructed by the lack of sensitivity of non-financial public enterprises to interest rate variations. Finally, the absence of formal liquidity forecasts for the fiscal sector and the weaknesses of the statistics and payments systems are weakening the monetary framework. The financial sector continues to suffer from serious weakness and does not appear to respond adequately to the needs of private sector enterprises. The domination of the financial sector by the state banks (they account for over 90% of total bank assets) severely impedes the credit allocation process. Without taking into account risk considerations, banks have tended to lend to unprofitable public companies. Moreover, the allocation of credit remains distorted by state interventions with regard to the interest rate setting process. As a consequence, bank loans to the public sector represent substantial contingent liabilities, damaging the solvency and profitability of the banking sectors. The crowding-out effect on private sector activities can be perceived from the low share of private credits, amounting to slightly above 8% of total credits according to June 2003 IFS data. Banking sector reform is not only imperative to improve resource allocation and boost private-sector development, but is also a prerequisite for exchange-rate liberalisation. Labour market and education reforms Unemployment remains a key challenge to deal with. Significant divergences exist concerning the quantification of unemployment, although local economists generally accept that unemployment has not increased in the last 10 years and has even decreased during the last 2 years. Against the background of relatively weak economic growth, an average rate of 2% has been observed in the last 10 years, this evolution might be explained by the increasing informal sector, whose size is estimated at 25%-30% of the official economy. Tackling the mismatch between education/training and the needs of the economy, as indicated by relatively high unemployment of young educated people in the presence of shortages in certain sectors, would
109 IMF, "Algeria: 2002 Article IV Consultation", Staff Report, Washington DC, March 2003.
- 56 -
be conducive to soften further labour market pressures. To solve this, the government has recently started the setup of a partnership between the institutions of the education system and representants of different economic sectors. Furthermore, it created a fund for financing continuous learning. The Algerian education sector displays some scope for improvement in all ranges of ages (primary, secondary and University). It has one of the highest enrolment rates of children at school of all Maghreb countries, but adult illiteracy remains very high, and so are failure rates in schools. The government has attempted to implement some measures to reform the sector without much success. Teachers are still poorly paid and show little motivation, facilities are overcrowded (especially at University). Strikes of teachers (especially of secondary school) have been held regularly during the last years. Concerning the access to education, there are no significant gender disparities, particularly in urban areas. According to the most recent census (1998), the rate of schooling for girls in urban areas is 87.4 % compared with 88.7 % for boys. In the remote rural areas, this rate drops to 60.5 % for girls and 74.3 % for boys. Authorities aim to tackle the efficiency of public expenditures in education. In May 2000, the government appointed a National Commission to explore reform alternatives that would strengthen and expand the education system, while ensuring that it remains financially sustainable. The key reforms across education levels that are being considered are the following: (i) reviewing current human resources policies for basic education (remuneration, evaluation, promotion, deployment and training of teachers to improve quality and internal efficiency); (ii) reviewing current financing mechanisms in higher education to reduce the share of public subsidies, particularly those related to student subsistence expenditures (“Oeuvres Universitaires”); and (iii) developing continuous vocational training programs based on the findings of an evaluation of current programs. 3. Relation with the EU and IFIs Co-operation between the EU and Algeria is being re-orientated in light of the Association Agreement (AA) that was signed in April 2002.110 However, this agreement still needs to be ratified before being implemented, and this process may last several years. Similarly to the other Euro-Mediterranean Association Agreements, the main elements of the agreement with regard to strengthening economic co-operation are: the gradual establishment of a free trade area for a specified number of products, in line with WTO rules, clauses on freedom of establishment, liberalisation of services, free movement of capital, regular economic dialogue and the partial application of Community rules on competition. Contrasting with the standard procedure with other countries, Algeria has declined to sign an Interim Agreement that would allow the immediate implementation of the trade provisions of the AA. Future financial co-operation priorities under MEDA are to contribute to the transition towards a market economy, develop the private sector, and strengthen the socio-economic and social balance in the country. In the period 1996-2000, EUR 254 million were committed for 10 programmes, of which one was a Structural Adjustment Facility (SAF) that amounted to EUR 125 million. The National Indicative Programme (NIP) for the 2002-2004 period (EUR 150 million) focused on supporting economic reforms and strengthening market economy institutions, developing infrastructure, developing human resources and improving the legal
110 See: http://europa.eu.int/comm/external_relations/algeria/intro/index.htm
- 57 -
framework and good governance. The new National Indicative Programme for 2005-2006 (EUR 106 million) broadly targets the same areas as the previous NIP. Following four years of stand-by and extended arrangements from 1994 to 1998, Algeria currently does not have an IMF programme. Algeria's last transaction with the Fund dates from May 1999, when the IMF Executive Board approved a request for a SDR 223.5 million purchase under the Compensatory and Contingency Financing Facility (CFFF). Regular surveillance takes place via annual Article IV consultations. The World Bank recently made substantial progress in strengthening its relations with Algeria. Currently, efforts are predominantly focusing on the elaboration of a selected number of sectoral strategies, resulting in 13 active projects of USD 630.3 million of total commitments.111 Lending activities are concentrated on operations aimed at strengthening the country's infrastructure and attending the most pressing needs of the poor and most vulnerable population, including a water supply project (USD 110 million) and an emergency earthquake recovery project (USD 84 million). Preparations for a municipal waste management project (USD 25 million) and an ICT development support project (USD 22.5 million) appear to be well advanced. The World Bank has finalised a new Country Assistance Strategy (CAS). Priorities for new assistance are focussed on private sector development, infrastructure development, strengthened support to safety nets, the social sectors and poverty reduction; and institutional development. 4. Concluding remarks Algeria experienced a moderate resumption of growth in the second half of the 1990's, which may be attributed to the successful 1994 stabilisation programme (fiscal adjustment; tight monetary policy; active exchange rate policy; price liberalisation, debt rescheduling agreements) as well as to an increased hydrocarbon production and, recently, higher petroleum prices. Indeed, the real growth rate amounted to an average of around 5.5% in 2002-03, accompanied by substantial trade and current account deficits. However, in order to tackle unemployment and poverty via sustained high growth rates Algeria needs to move towards a fully-fledged market economy, entailing a further reduction of the relative size of the public sector, creating room and incentives for private entrepreneurship and advancing with trade liberalisation. Opening up the hydrocarbon sector - generating 60% of the economy’s value added and accounting for more than 90% of exports is particularly important. Removing bottlenecks in access to finance and industrial land, an adequate, cost-effective transportation and communications services, a general strengthening of the commercial legal framework and higher political stability would be crucial to encouraging private sector development and FDI inflows. As regards macroeconomic management a strengthening of the fiscal framework (a multi-year, integrated fiscal framework, with the aim of de-linking expenditures from the volatile hydrocarbon revenues) would soften the impact from volatile hydrocarbon fiscal revenues and secure fiscal sustainability in the face of expenditure pressures.
111 Source: World Bank's Internet site: http://www.worldbank.org/html/extdr/regions.htm#m
- 58 -

ALGERIA
Main economic indicatorsprel. for.
1996 1997 1998 1999 2000 2001 2002 2003Real sector Real GDP growth (% yoy, avg) 4.1 1.1 5.1 3.2 2.2 2.6 4.1 6.8 Inflation CPI avg, % yoy 18.7 5.7 4.9 2.6 0.3 4.2 1.4 2.3 Unemployment rate1, % yoy 28.0 28.0 28.0 29.2 29.5 27.3 26.7 26.0 GDP per capita, in USD 1622 1632 1590 1576 1737 1660 1680 1850
Fiscal Sector Total revenues2, % of GDP 32.2 33.5 27.6 29.9 38.5 34.9 36.0 38.4 Total expenditure3, % of GDP 29.3 31.2 31.2 31.8 28.7 31.1 34.8 34.2 Budget balance4, % of GDP 2.9 2.4 -3.8 -2.0 9.7 3.4 0.2 3.5 Government debt5, % of GDP 85.8 75.1 75.2 82.3 63.6 57.0 48.1 ---
Monetary sector Reserve money (M0), % yoy 19.9 16.6 13.1 11.4 22.4 41.4 25.5 25.0 Broad money (M3), % yoy 14.4 18.6 18.9 13.7 13.2 24.8 24.3 12.5 Credit to the private sector, % of GDP 5.5 3.9 4.6 5.5 6.1 7.2 8.0 --- Degree of Monetisation (M2/GDP) 40.2 35.7 39.3 46.4 46.3 41.3 49.1 56.7
External sector Current account balance, % of GDP 2.5 5.8 -1.9 0.0 16.9 12.9 8.0 11.5 Trade balance, % of GDP 9.3 10.5 0.5 5.9 22.6 16.8 13.5 16.6 Foreign direct investment flows, % of GDP 0.6 0.5 1.1 1.0 0.8 2.2 1.6 1.9 Import cover (months) 4.5 8.9 6.8 4.6 12.2 18.1 19.1 22.8
External Vulnerability External Debt, % of GDP 71.8 65.2 64.3 58.0 46.4 41.1 40.5 32.9 Debt-to-Export Ratio 249.6 227.5 303.1 225.8 116.3 118.0 125.3 81.3 Debt Service Ratio 42.3 29.3 46.3 40.3 20.3 22.8 22.6 17.1 Reserves/M2 26.0 43.3 32.0 21.4 54.5 67.9 71.9 78.6
Financial sector Short-term interest rate6 18.47 11.8 10.4 10.43 6.77 3.35 4.2 3.7 Exchange rate (per USD, eop) 56.2 58.4 60.4 69.3 75.3 77.8 79.7 76.0 Exchange rate (per EUR, eop) 44.8 52.9 51.7 69.0 81.0 88.3 76.0 67.3 Real effective exchange rate (1995=100) 105.9 119.6 114.0 109.3 102.9 113.1 94.6 82.0
Source: Algerian Ministry of Finance, Central Bank of Algeria, Eurostat, IMF, IIF, DRI-Wefa1 Unemployed in % of labour market force.2 Central government revenues.3 Central government expenditure including and net lending, special accounts and allocation to the Rehabilitation fund.4 Consolidated central government balance excluding grants and privatisation receipts.5 External and domestic debt.
- 59 -
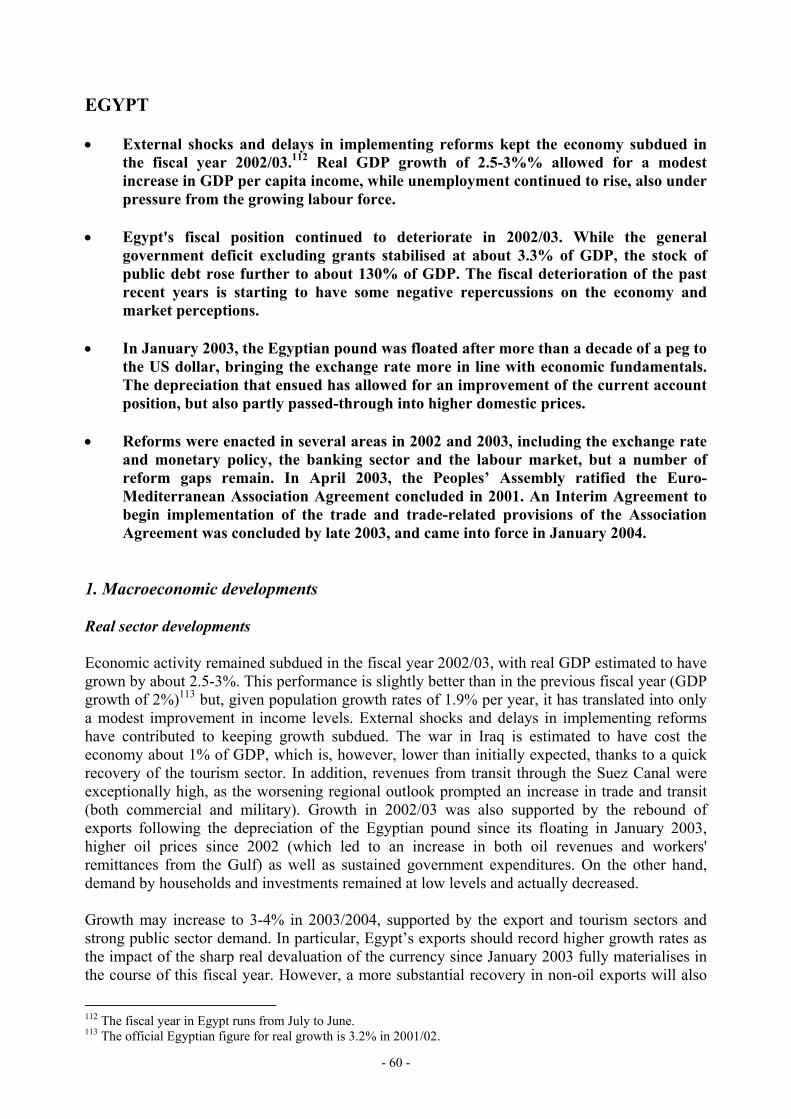
EGYPT • External shocks and delays in implementing reforms kept the economy subdued in
the fiscal year 2002/03.112 Real GDP growth of 2.5-3%% allowed for a modest increase in GDP per capita income, while unemployment continued to rise, also under pressure from the growing labour force.
• Egypt's fiscal position continued to deteriorate in 2002/03. While the general
government deficit excluding grants stabilised at about 3.3% of GDP, the stock of public debt rose further to about 130% of GDP. The fiscal deterioration of the past recent years is starting to have some negative repercussions on the economy and market perceptions.
• In January 2003, the Egyptian pound was floated after more than a decade of a peg to
the US dollar, bringing the exchange rate more in line with economic fundamentals. The depreciation that ensued has allowed for an improvement of the current account position, but also partly passed-through into higher domestic prices.
• Reforms were enacted in several areas in 2002 and 2003, including the exchange rate
and monetary policy, the banking sector and the labour market, but a number of reform gaps remain. In April 2003, the Peoples’ Assembly ratified the Euro-Mediterranean Association Agreement concluded in 2001. An Interim Agreement to begin implementation of the trade and trade-related provisions of the Association Agreement was concluded by late 2003, and came into force in January 2004.
1. Macroeconomic developments Real sector developments Economic activity remained subdued in the fiscal year 2002/03, with real GDP estimated to have grown by about 2.5-3%. This performance is slightly better than in the previous fiscal year (GDP growth of 2%)113 but, given population growth rates of 1.9% per year, it has translated into only a modest improvement in income levels. External shocks and delays in implementing reforms have contributed to keeping growth subdued. The war in Iraq is estimated to have cost the economy about 1% of GDP, which is, however, lower than initially expected, thanks to a quick recovery of the tourism sector. In addition, revenues from transit through the Suez Canal were exceptionally high, as the worsening regional outlook prompted an increase in trade and transit (both commercial and military). Growth in 2002/03 was also supported by the rebound of exports following the depreciation of the Egyptian pound since its floating in January 2003, higher oil prices since 2002 (which led to an increase in both oil revenues and workers' remittances from the Gulf) as well as sustained government expenditures. On the other hand, demand by households and investments remained at low levels and actually decreased. Growth may increase to 3-4% in 2003/2004, supported by the export and tourism sectors and strong public sector demand. In particular, Egypt’s exports should record higher growth rates as the impact of the sharp real devaluation of the currency since January 2003 fully materialises in the course of this fiscal year. However, a more substantial recovery in non-oil exports will also
112 The fiscal year in Egypt runs from July to June. 113 The official Egyptian figure for real growth is 3.2% in 2001/02.
- 60 -
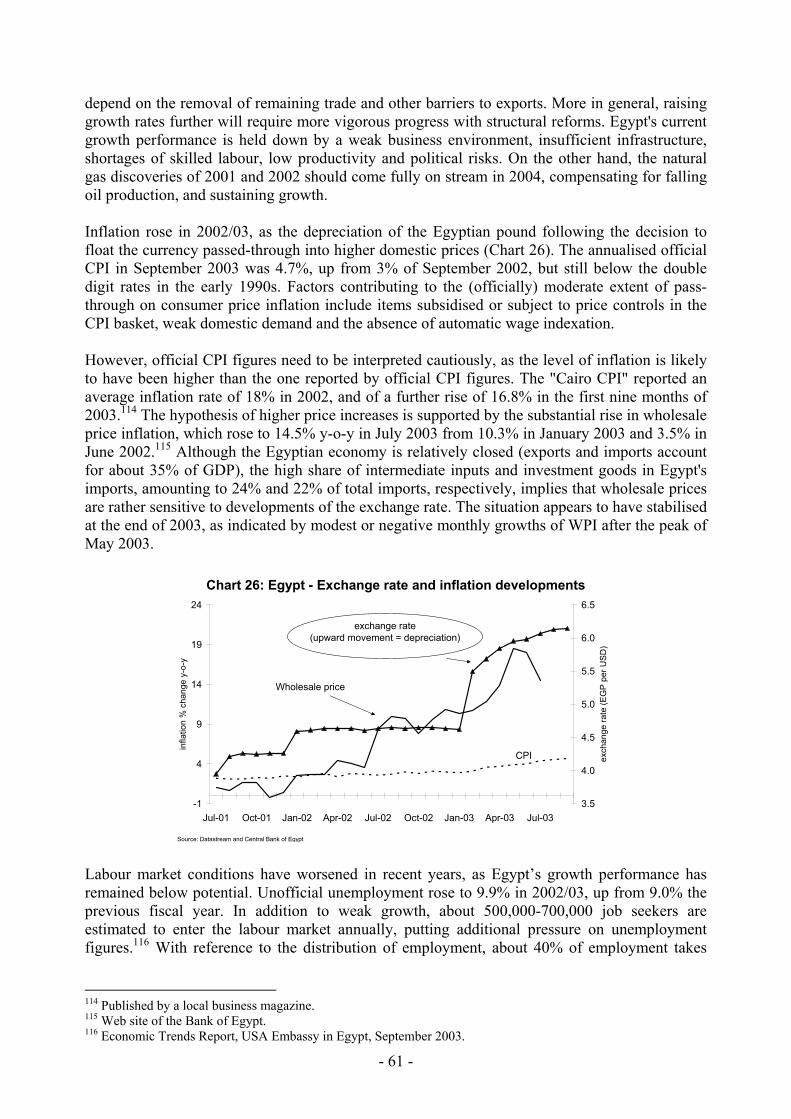
depend on the removal of remaining trade and other barriers to exports. More in general, raising growth rates further will require more vigorous progress with structural reforms. Egypt's current growth performance is held down by a weak business environment, insufficient infrastructure, shortages of skilled labour, low productivity and political risks. On the other hand, the natural gas discoveries of 2001 and 2002 should come fully on stream in 2004, compensating for falling oil production, and sustaining growth. Inflation rose in 2002/03, as the depreciation of the Egyptian pound following the decision to float the currency passed-through into higher domestic prices (Chart 26). The annualised official CPI in September 2003 was 4.7%, up from 3% of September 2002, but still below the double digit rates in the early 1990s. Factors contributing to the (officially) moderate extent of pass-through on consumer price inflation include items subsidised or subject to price controls in the CPI basket, weak domestic demand and the absence of automatic wage indexation. However, official CPI figures need to be interpreted cautiously, as the level of inflation is likely to have been higher than the one reported by official CPI figures. The "Cairo CPI" reported an average inflation rate of 18% in 2002, and of a further rise of 16.8% in the first nine months of 2003.114 The hypothesis of higher price increases is supported by the substantial rise in wholesale price inflation, which rose to 14.5% y-o-y in July 2003 from 10.3% in January 2003 and 3.5% in June 2002.115 Although the Egyptian economy is relatively closed (exports and imports account for about 35% of GDP), the high share of intermediate inputs and investment goods in Egypt's imports, amounting to 24% and 22% of total imports, respectively, implies that wholesale prices are rather sensitive to developments of the exchange rate. The situation appears to have stabilised at the end of 2003, as indicated by modest or negative monthly growths of WPI after the peak of May 2003.
-1
4
9
14
19
24
Jul-01 Oct-01 Jan-02 Apr-02 Jul-02 Oct-02 Jan-03 Apr-03 Jul-03
infla
tion
% c
hang
e y-
o-y
3.5
4.0
4.5
5.0
5.5
6.0
6.5ex
chan
ge ra
te (E
GP
per
USD
)
Wholesale price i fl i
CPI
exchange rate(upward movement = depreciation)
Source: Datastream and Central Bank of Egypt
Chart 26: Egypt - Exchange rate and inflation developments
Labour market conditions have worsened in recent years, as Egypt’s growth performance has remained below potential. Unofficial unemployment rose to 9.9% in 2002/03, up from 9.0% the previous fiscal year. In addition to weak growth, about 500,000-700,000 job seekers are estimated to enter the labour market annually, putting additional pressure on unemployment figures.116 With reference to the distribution of employment, about 40% of employment takes
114 Published by a local business magazine. 115 Web site of the Bank of Egypt. 116 Economic Trends Report, USA Embassy in Egypt, September 2003.
- 61 -
place in the informal sector against 30% in the formal private sector and 30% in the public sector (incl. state-owned companies).117 Fiscal policy During the last 5 years Egypt's fiscal position continuously deteriorated, although the pace of deterioration slowed down recently (Chart 27). From a small deficit of 0.6% of GDP in 1998/99 (excl. grants), the general government deficit widened to 3.3% in in 2002/03. Although Egypt's large development needs weigh heavily on its fiscal performance (e.g. annual capital investments have been in the order of 4% of GDP)118, the size of the imbalance is becoming a source of concern, particularly as the general government balance is calculated including the large surpluses of the Social Insurance Funds (SIFs, about 5% of GDP), which are to some extent associated with revenues of uncertain reliability and long-term sustainability.119 The more reliable figures at the level of the central budget reveal a similar trend of deterioration of the deficit (excl. grants) to over 7% in the last fiscal year 2002/03, from 6.8% the previous year. Higher expenditures on public wages and interest payments on debt (the latter due to the currency depreciation) are mainly responsible for such dynamic in 2002/03. Revenues were expected to rise in 2002/03 thanks to higher indirect tax revenues (mainly customs) and non-tax revenues, interrupting the trend of declining revenues in recent years, but they were still expected to be lower than budgeted.
Chart 27: Egypt - Evolution of fiscal deficits (excl. grants) 1999/00 2003/04 budget 2000/01 2001/02 prel. 2002/03 est.
0
-1
-2
-3 general government
-4
-5
% of GDP -6 budget sector
-7 Source: IMF, Central Bank of Egypt. As the Egyptian fiscal year runs from July to June, figures for 2001 refer to the period July 2000-June 2001.
The budget for 2003/04, approved in June 2003, is expansionary, with a central government budget deficit target of 7.6% (excl. grants, corresponding to 4.6% of GDP at the level of general government), based on the assumption of a real GDP growth rate of 3%. This deficit projection is substantially larger than a deficit level of 5% of GDP or less that the IMF considers compatible with strengthening fiscal performance and reducing debt levels. The 2003/04 budget foresees higher expenditures on public sector wages, interest payments on debt and subsidies on
117 Government data. 118 Taken here as a rough proxy of development expenditures. We abstract from considerations about the effectiveness of such high levels of public investments. 119 Despite the currently still favourable demographic profile, benefit payments from the SIFs already exceed social security contributions, and are expected to come under increasing pressure with the ageing of the population.
- 62 -

basic food imports. According to the authorities, these spending increases will be paid for through measures to improve tax collection and planned reforms of direct and indirect taxation. The recent fiscal deterioration and little indications of consolidation are having some negative effects on the economy and market perceptions. Egypt’s expansionary fiscal policy over recent years responds to some extent to the operation of automatic stabilisers, and to the need to cushion the effects of the economic slowdown, particularly on the lower classes, through higher subsidies. However, continuous fiscal deterioration risks distorting credit markets and constraining the conduct of monetary policy. Notably, deficit financing is estimated to have absorbed about 75% of new bank credit in 2002/03. The projected deterioration of the budget deficit is among the factors that have led Standard & Poor’s to lower Egypt's long-term local currency credit rating to BBB- in mid 2003.120 The widening budget deficit, together with insufficient hard currency earnings from exports, is also believed to have contributed to the continuous depreciation of the Egyptian Pound since it was floated in late January 2003. Widening fiscal deficits, together with the effects of the currency depreciation on foreign debt, have been mirrored in rising levels of public debt. Total public debt (domestic and foreign) in gross terms increased to over 130% of GDP in 2002/03 compared to 120% the previous years, corresponding to an increase in net terms from 61% of GDP to 68% . Under current budgetary projections, the debt stock is expected to rise further in 2003/04, and may reach in net terms over 70% of GDP in June 2004. Monetary and exchange rate policy In January 2003, Egypt decided to adopt a free float exchange rate regime after more than a decade of pegged policy to the US dollar. The decision was welcomed by international observers, including the IMF and credit rating agencies, and the local business community, as highlighted by the rebound of the stock exchange following the announcement of the float. Policy inconsistencies that led to the real appreciation of the Egyptian pound (by about 70% between 1991 and mid-2000)121 were among the main determinants of the country's late weak economic performance, while the peg limited the ability to react to external shocks. In addition, frequent revisions of the peg undermined confidence in economic policy. The Egyptian pound depreciated by about 14% in the first day of trading and, as of December 2003, has lost about 35% of its value against the euro and over 25% against the US dollar since the beginning of the year. The depreciation of the real exchange rate is expected to have contributed to the improvement of the country's economic international competitiveness, provided that inflationary pressures are kept under control, and structural reforms are speeded up. While formally the pound floated freely in 2003, the authorities have de facto continued to intervene in the foreign exchange market. Intervention has taken place in the form of a number of administrative measures to support the value of the pound and ease access to foreign exchange, as well as of moral suasion. Notably, under a foreign exchange surrender requirement established in March 2003 (retroactive from January 2003), companies that engage in foreign-exchange generating activities are required to convert at the commercial bank rate at least 75% of their foreign currency earnings within a week of receipt. In addition, while banks have in principle been free to set exchange rates, they have in practice avoided large exchange rates movements. This may be linked to the requirement to report them to the Central Bank 120 Although the move did not have a direct effect on Egypt’s foreign debt, it added to the already pessimistic market perception of Egypt's economic prospects. 121 IMF 2002 Article IV.
- 63 -

throughout the day, and the dominant influence of the government through its four large state-owned banks.122 Consequently, the de facto exchange rate regime appears to be closer to a managed floating regime. Problems in gaining access to foreign exchange subsist, as indicated by the persistence of a parallel market. Despite some initial improvements in liquidity, the supply of foreign exchange on the official market is insufficient to accommodate demand. The parallel market has thus continued to operate despite government’s efforts to restrict its operation. By June 2003 it seemed as if the official and parallel market rates were about to converge (with a gap of only 2.5%). However, the rate subsequently diverged, with a gap of about 10% in October 2003, despite favourable current account developments Moreover, the lack of market-clearing rates has undermined the credibility of the new exchange rate system, as indicated by the increase in dollarisation to about 27% of total liquidity in 2002/03, up from 23% the previous fiscal year. The progressive recovery of foreign currency revenues from exports and tourism, provided that the situation in the Middle East stabilises, should contribute to the further convergence of rates in the two markets. Important reforms to the framework for monetary policy were introduced. With the abandonment of the exchange rate peg policy, inflation targeting was set as the anchor for future monetary policy (in the transition phase, until the necessary instruments and capacity are in place, the monetary aggregate M2 growth rate has formally been set as the target). Deposit auctions have been introduced to allow the Central Bank to influence liquidity conditions. In addition, the new Unified Banking Law of June 2003 strengthened the independence of the Central Bank of Egypt (which now reports directly to the President of the State) and gave responsibility for surveillance of the banking sector and the payment system. The Law also established a Monetary Policy Committee in charge of setting the goals for monetary policy, together with a Monetary Policy Unit with more technical responsibilities. Transparency has been strengthened, as the chosen inflation target will be reported to the parliament. External sector developments Egypt's external position has remained rather solid, as the current account balance has continued to improve. Provisional balance of payments data from the Central Bank reveal that the trade deficit narrowed in 2002/03 (to 8.2% of GDP, against 8.5% the previous fiscal year) on account of higher exports in the oil sector (owing to higher oil prices) and, to a lesser extent, in the non-oil sector. With reference to the latter, the effects of the exchange rate depreciation are also beginning to be felt. Imports have increased only slightly in nominal terms owing to subdued domestic demand and the imposition of administrative restrictions on public sector imports. The service balance reported an improvement associated with higher receipts from tourism, although still below the levels prior September 11th 2001, and record high Suez Canal operations. This has contributed to a current account surplus of 2.4% of GDP for 2002/03, more than double that in 2001/02 and comparing very favourably with the small current account deficits or balances generally recorded in previous years. The capital and financial account displayed a deficit in 2002/03, mirroring the current account surplus. This is mainly associated with outflows of unspecified capital investments, which may signal capital flight in the presence of regional security concerns. Net FDI reached USD 0.7 122 Furthermore, to be able to operate, foreign exchange bureaux are required to enter in an agreement with a specific bank, and trade at the exchange rate set by this bank. The agreements between the foreign exchange bureaux and banks have to be approved by the Central Bank of Egypt.
- 64 -
billion, while portfolio inflows were negative and low. With errors and omissions in the order of USD 1.4 billion, the overall balance of payments for 2002/03 reported a small surplus, the first since 1997. Foreign reserves have remained stable at about USD 14.8 billion (June 2003), corresponding to eight months of goods and services’ imports. Despite Egypt’s rather strong current account and external debt position, the perception of its creditworthiness worsened recently. In 2002/03 the stock of public external debt increased to about 42% of GDP from 34% the previous fiscal year, mainly on account of the depreciation of the exchange rate. From the total amount of external debt, 90% is guaranteed, concessional and of long-term maturity. The debt service ratio remained at a comfortable level, and increased to about 10% of goods and services exports for 2002/03, up from 9.5% the previous fiscal year. During 2003, the rating agency S&P’s changed its outlook on Egypt’s BB+ foreign currency rating from neutral to negative. This move, which could be followed by a possible rating downgrade, reflects the increased risk perception of economic policies, notably the absence of timely fiscal adjustment measures and the slow pace of structural reforms. 2. Structural reforms Several economic reform measures were taken along 2002 and 2003, but a number of reform gaps remain. Reforms were adopted in several areas, including monetary policy and the foreign exchange rate market, the banking sector and labour. In April 2003, the People’s Assembly ratified the Euro-Mediterranean Association Agreement concluded in 2001. Pending the completion of the ratification process by all EU Member States, the trade and trade-related provisions of the Agreement came into force in January 2004 on a provisional basis. On the other hand, a reform gap remains in the areas of trade, customs, taxation, public finances and the business environment. Trade liberalisation Progress in trade liberalisation has been mixed. In addition to ratifying the Association Agreement with the EU in 2003, whose trade and trade-related provisions entered into force on a provisional basis in January 2004, Egypt has continued to pursue regional trade integration initiatives. In January 2003, it initialled the Agadir Agreement, which foresees the establishment of a free trade area with Morocco, Jordan and Tunisia, but the Agreement still has to be signed. In April 2003, Egypt joined the WTO Information Technology Agreement, whereby Egypt will remove tariff and non-tariff barriers on IT products from other WTO members. On the other hand, some measures seem to account somewhat for a setback in the progress of trade liberalisation. In March 2003, in order to preserve foreign exchange reserves, the authorities enacted a three-month suspension of state imports (state imports are the largest share of Egypt’s total imports), excluding strategic commodities.123 Furthermore, as pointed out above, companies that engage in foreign-exchange generating activities are required to convert at the commercial bank rate at least 75% of their foreign currency earnings within a week of receipt. The Egyptian authorities also approved some subsidy measures to promote exports, including an 80% subsidy of Suez Canal fees (covered by the Export Development Fund) for ships carrying exclusively Egyptian exports, and a 50% reduction of loading charges at Egyptian ports.
123 Such as wheat and medicines.
- 65 -

Fiscal reforms and public administration reform The authorities have recognised the need to strengthen fiscal performance in the face of recent continuous fiscal deterioration, but actual reforms have been slow. Little progress has been made in improving the targeting of consumption subsidies since the ruling National Democratic Party’s statements in this respect in September 2002. Consumption subsidies have been actually raised to compensate for the impact of the currency depreciation on consumer prices. In particular, indirect subsidies on petroleum and electricity remain problematic, both in terms of their cost to the budget and distortion of consumption patterns. Also, no measures appear to be envisaged to rationalise the system of public employment, which absorbs about 30% of the budget (over 7% of GDP), and whose cost has been constantly rising in recent years. Capital expenditures are at a high 15% of total expenditures and 4% of GDP, but no assessment has been made of their effectiveness. Recently, the government has started requesting line ministries to submit feasibility studies to back their requests for budgetary allocation. Pilot projects of performance-based management have also been launched, but no progress seems to have been made on the conduct of a public expenditures review despite government announcements in early 2002. On the revenue side, plans for reforms are proceeding, but more slowly than anticipated and there are problems with respect to the budgetary process. Reforms of the system of personal and corporate income tax were planned for fiscal year 2002/03 (including the reduction of the corporate tax rate from over 40% to 30%), but have been postponed to the 2003/04 parliamentary session. Reforms of customs and tariffs had also been announced for late 2003 but are still at the very early stages. The implementation of trade liberalisation in the framework of the EU-Egypt Association Agreement (whose trade and trade related provisions entered into force in January 2004) will require measures to compensate for the loss of customs revenues (which account for about 3% of GDP). The transparency of the budgetary process also remains problematic. In May 2003, the Central Auditing Agency severely criticised the government for its fiscal management, particularly its failure to report the results of the budget to the People’s Assembly. In addition, the budget drafted by the government and approved by Parliament still does not correspond to the three-tiered classification developed with the assistance of the IMF124, hampering budget transparency and international comparability. Indicators by the World Bank reveal weaknesses with respect to governance. According to these indicators, Egypt performs below the average of both low-middle income countries and the MENA region in terms of government accountability and quality of regulation. The performance for government effectiveness is slightly higher than the income group average, but still negative and below the average for the MENA. On the other hand, according to these indicators, Egypt performs above average with respect of the rule of law. Privatisation, enterprise restructuring and business environment The pace of privatisation remained slow during 2002 and 2003, following the trend of slow privatisation since mid-2000. Only 10 operations valued EGP 346 million were completed in 2002, compared to an annual average of 25-30 transactions worth EGP 2.5-2.3 billion from 1996 to 2000. A few companies were put for sale in the 2003. On the one hand, difficult market
124 Whereby the first level presents the central government budget; the second includes revenues and expenditures from the National Investment Bank and the General Authority for Supply of Commodities (GASC); and the third adds the operations of the Social Insurance Funds (SIFs). The deficit figure is the highest at the second level and the lowest at the third.
- 66 -

conditions in the presence of the Iraqi crisis, political sensitivity to job losses, the nature of the companies left for privatisation (e.g. in the utility and banking/insurance sectors) and, in some cases, their weak financial position weighed on privatisation results. On the other hand, the float and subsequent devaluation of the Egyptian pound have provided significant incentive for investment in Egyptian assets. The authorities have continued to emphasise their commitment to advance in the privatisation process. They also announced that they would favour participation of private investors in the capital increases in state-owned companies to be privatised. In 2003, the ministerial Privatisation Committee approved a FY 2003/2004 Privatization Plan. With the exception of the Suez Canal Authority and the Egyptian General Petroleum Corporation (EGPC), most state-owned companies are loss-making and in need of restructuring. Those under the jurisdiction of the Ministry of Public Enterprises are estimated to be loosing EGP 1.8 billion each year. The authorities have been seeking a solution to settle the debts of the commercial and industrial state-owned companies, which are conservatively estimated at EGP 27 billion (the actual figure may be closer to EGP 40 billion or around 10% of GDP). Progress in improving the business operating environment has been mixed. An Intellectual Property Rights law was adopted in 2002, and its implementing regulations were issued in mid 2003. The telecom law of February 2003 expanded the powers of the telecom regulatory authority, in line with plans to end Egypt Telecom’s monopoly on fixed-line services by the end of 2005. The authority will oversee the application of universal service obligations, and will also take on regulatory responsibilities in the radio, television and internet sectors. On the other hand, the approval of the draft competition law that was foreseen for the 2002/03 Parliamentary session has again been postponed. Progress in implementing the mortgage law passed in 2001 has been slow, despite the adoption of the related implementing regulations and the setting up of a mortgage authority. Financial sector reforms Several measures were implemented during 2002 and 2003 to strengthen the banking sector. The banking sector, and particularly the four dominant state-owned banks, was still burdened by a substantial portion of non-performing loans, officially estimated at 16% of the total loan portfolio. Measures adopted in 2002 included an improved management of state-owned banks and stricter prudential regulation (such as the increase of the capital adequacy ratio from 8% to 10% in order to meet the Basel II requirements, higher minimum capital requirements, and tighter prudential rules on connected lending and retail credit). Besides strengthening the position of individual banks, these changes are expected to foster consolidation in the sector. The government has also continued to seek a solution to the large portion of debt owed by state-owned companies to the state-owned banks, but progress has been slow. The Unified Banking law of June 2003 also foresees the sale of public stakes to joint venture banks and privatisation. Efforts continue to bring the capital market in line with international standards. Companies traded on the Cairo and Alexandria Stock Exchange (CASE) are required to apply international standards for accounting and disclosure procedures. The time to settle transactions has been reduced, and stocks are supposed to be de-listed if not traded for six months. A decision to establish a primary dealer market for government securities was taken in 2002, which should lead to the development of a secondary market for these securities. The Minister of Finance has already licensed 12 local and resident foreign banks, and the system was expected to start operating in December 2003.
- 67 -
Labour market reforms A Unified Labour Law was enacted in April 2003, providing a comprehensive framework for the functioning of the labour market and labour relations. The project of a labour law had been in the hands of the People’s Assembly for about a decade. Among others, the law introduces higher flexibility in the recruitment and dismissal of workers, establishes a limited right to strike, provides rules for collective bargaining, and imposes a number of reporting, management and security requirements on the part of the employers. The law also creates a national council in charge of defining a national minimum wage policy. 3. Relations with the EU and IFIs The EU-Egypt Association Agreement was signed in June 2001 and ratified by the Egyptian Peoples’ Assembly in April 2003. The Agreement provides for the progressive dismantling of tariffs over 15 years. The Agreement will come into force once ratification by all EU Member States signatories is completed. Pending this entry into force, an Interim Agreement to begin implementation of the trade and trade-related provisions of the Association Agreement was concluded by late 2003, and came into force in January 2004. Still on trade, a dispute between Egypt and the EU over steel exports was resolved in March 2003, averting the imposition of antidumping duties on Egyptian exports to Europe. Egypt is one of the main beneficiaries of EC financial assistance. Support under MEDA I (1995-1999) consisted of projects worth EUR 686 million to support economic transition and maintain the socio-economic balance. For the MEDA II programming period 2002-2004 an additional EUR 351 million is allocated to projects covering industrial, financial and institutional modernisation and socio-economic development, as well as to activities in support of the implementation of the Association Agreement. Projects worth EUR 75 million were approved in 2002 in the fields of vocational training and trade. In 2003, EUR 127 million have been committed to projects in the areas of education, civil society, trade and financial sector. In particular, in 2003, a first structural adjustment facility (SAF) operation has been approved under MEDA II in the form of a Trade Enhancement Programme. This consists of a EUR 40 million budget to support reforms in the areas of export promotion and customs administration. Still in 2003, as front-loading to help alleviate the negative social and economic consequences of the conflict in Iraq, the Commission has decided to reallocate EUR 175 million to budget support under an existing Industrial Modernisation Programme. Egypt has also been one of the main beneficiaries of financial support from the EIB, whose lending portfolio amounts to almost EUR 1 billion for the period between 1998 and 2003. Projects supported in 2002 and 2003 mainly concern infrastructure utilities and business sector development. A regional office of the EIB’s Euro-Mediterranean Investment Facility was set up in Cairo in July 2003. Egypt currently has no programme with the IMF. A two-year stand-by arrangement with the IMF was completed in 1998 and, due to lower than expected shortfall in the balance of payments in 2001/02, Egypt decided not to pursue disbursement of an IMF USD 500 million loan for balance of payments support agreed in early 2002, in the aftermath of the September 11th events. The IMF conducts regular Article IV consultations on Egypt. The 2003 one has actually been delayed to early 2004. In 2002, the IMF assisted Egypt in the development of a plan for a comprehensive
- 68 -

“Tariff policy and customs administration reform” that is currently being carried out with the support of various donors, including the EC and the USAID. The World Bank has been traditionally very active in Egypt. As of November 2003, the WB portfolio consisted of 18 active projects worth over USD 1 billion, including a large Private Sector and Agricultural Development Project (USD 300 million of loans). The objective of the WB Country Assistance Strategy for Egypt is to reduce poverty and unemployment focusing in three main areas: targeted interventions for poverty reduction (e.g. basic education, social protection, social safety net, etc), interventions with indirect impact on poverty reduction (developing poor areas, building effective institutions, higher education, skills development, etc.) and interventions to support higher and sustained growth (support for macroeconomic stability, restructuring of the banking and corporate sectors, gradual integration of Egypt into global markets, particularly in the context of the Association Agreement with the EU). The IFC is also active in Egypt with about 20 operations in its portfolio. Current lending totals USD 330 million on the IFC’s own account. The IFC established a regional office in Egypt in 2002. On the other hand, the release of a USD 500 million policy-based loan by the World Bank has been frozen, in agreement with the Egyptian authorities. Originally approved in February 2002 as part of a 1 USD billion loan co-financed by the African Development Bank to buffer the expected consequences of the September 11th events, discussions on the loan have resumed in 2003, in order to help the authorities deal with the economic impact of the conflict in Iraq. Pending agreement with the authorities on the policy-based conditionalities (including on trade liberalisation, fiscal reforms and reforms of the safety nets, business environment and bank privatisation) the loan was frozen, as the impact of the conflict in Iraq turned out to be lower than expected. 4. Concluding remarks External shocks and delays in implementing reforms have resulted in keeping growth subdued at about 2.5-3% in fiscal year 2002/03, allowing for a modest improvement in income levels. Macroeconomic policy was dominated by the decision to adopt a free float exchange rate regime after more than a decade of pegged policy to the US dollar. The depreciation of the Egyptian pound which ensued gave a boost to the export sector, but also passed-through into higher domestic prices, affecting purchasing powers. Moreover, problems in gaining access to foreign currency have continued after the float, as indicated by the persistence of a parallel market. In 2002/03 the fiscal performance continued to deteriorate, particularly with respect to debt figures. 2002 and 2003 have witnessed the intensification of the process of structural reforms through the issue of several legal and regulatory measures, although a number of reform gaps remain. The main challenges for Egypt are to ensure a stability-oriented macroeconomic framework, which would support the decision to float the currency and maintain inflation under control, and intensify efforts for the creation of a conducive business environment, to lift domestic demand and investments from their current low levels. More specifically, on the fiscal side measures are called for to reduce deficit and debt levels, as well as improve the efficiency and quality of public spending. The implementation of trade liberalisation in the framework of the EU-Egypt Association Agreement may require measures to compensate for the loss of customs revenues. On the monetary side, the challenge will be putting in place the announced inflation targeting framework and restore confidence in exchange rate management. Progress with structural reforms ought to be consolidated and enhanced, particularly with respect to trade, customs, taxation, public finances and the business environment.
- 69 -

EGYPT
Main economic indicatorsprel. for.
1996/97 1997/98 1998/99 1999/00 2000/01 2001/02 2002/03 2003/04Real sector Real GDP growth (% yoy, avg) 5.3 5.7 6.3 5.1 3.5 2.0 2.5 3.6 Inflation CPI avg, % yoy 6.2 4.7 3.8 2.8 2.4 2.5 3.2 4.2 Unemployment rate, % 8.4 8.2 8.1 9.0 9.2 9.0 9.9 --- GDP per capita, in USD 1100 1200 1280 1380 1490 1384 1276 ---
Fiscal Sector1
Total revenues2, % of GDP --- --- 29.8 28.3 27.5 26.4 27.6 27.7 Total expenditure3, % of GDP --- --- 30.5 30.1 30.2 29.9 30.9 32.3 Consol. budget balance4, % of GDP --- --- -0.6 -1.8 -2.7 -3.5 -3.3 -4.6 Central government balance4, % of GDP --- --- -4.3 -4.4 -6.0 -6.8 -7.1 -7.7 Gross government debt, % of GDP --- --- --- 100.5 109.6 120.1 133.0 ---
56.0Monetary sector Reserve money, % change yoy --- --- 10.5 6.2 6.6 5.4 13.9 --- Broad money (M2)5, % change yoy --- --- 11.5 8.8 11.6 15.6 16.7 --- Credit to the private sector, % of GDP5 --- --- 44.9 49.5 50.6 53.1 53.8 --- Degree of Monetisation (M2/GDP) --- --- --- --- 78.6 85.8 95.1 ---
External sector Current account balance, % of GDP 0.2 -2.9 -1.9 -1.2 0.0 0.7 2.4 2.0 Trade balance, % of GDP -14.2 -11.6 -9.7 -8.8 -8.2 --- Foreign direct investment, % of GDP --- 1.3 0.7 1.6 0.5 0.5 0.9 --- Import cover (months) --- 10.8 9.8 7.7 7.6 8.3 8.1 ---
External Vulnerability External Debt, % of GDP 36.7 --- --- 28.3 28.5 33.7 42.4 --- Debt-to-Export Ratio --- --- --- --- --- --- --- --- Debt Service Ratio6 8.2 8.5 7.2 8.0 7.4 9.5 10.5 --- Reserves/M2 32.7 30.6 33.9 25.9 18.4 18.8 21.6 ---
Financial sector Short-term interest rate (eop i.e. June )7 8.9 8.8 8.8 9.0 9.1 7.2 10.3 6.9 Discount rate (eop i.e. June)8 12.3 12.3 12.0 12.0 11.0 11.0 10.0 10.0 Exchange rate (per USD, eop)9 3.4 3.4 3.4 3.5 3.9 4.6 6.1 6.1 Exchange rate (per EUR, eop)9 --- --- 3.6 3.3 3.3 4.4 7.0 7.7 Real effec. exchange rate (1994/95=100) 114.9 124.7 127.0 134.2 123.1 104.6 --- ---
Source: IMF, Eurostat, IIF, DRI-Wefa, Egyptian Ministry of Foreign Trade, EIU1 Figures for 2002/03 are calculated on a growth assumption of 3.7%.2 Excluding grants.3 Total expenditure and net lending.4 Excl. grants and privatisations.5 Excluding exchange rate revaluation effects.6 Total debt service in % of current account receipts.7 3-months T-bill, up to October 20038 Up to October 20039 Up to January 2004
- 70 -
ISRAEL • After two years of recession, the Israeli economy has been recovering slightly in 2003,
with real GDP expected to grow by about 1%. Growth rates remain well below potential and could not prevent a further deterioration in per capita incomes and overall living standards.
• In 2003, the authorities have struggled to keep the fiscal situation under control.
Despite the fiscal measures introduced in the course of the year, the deficit for 2003 is estimated to have risen to 5.5-6% of GDP (about 8% excluding grants), above the deficit target of 3% of GDP. The high and rising level of public debt (expected to have risen to 106% of GDP at the end of 2003) remains an element of fragility for the economy.
• In the course of 2003, the New Israeli Shekel strengthened against the US dollar-
dominated reference currency basket, compared to a 12% depreciation in the previous year. Such strengthening contributed to the moderation of inflationary pressures, with CPI actually falling by about 2% y-o-y in December 2003, and has allowed the resumption of gradual monetary easing.
• Efforts in the area of structural reforms have intensified in 2003 as a means to promote
growth and competitiveness. Reforms of the welfare state, public employment and more recent proposals on pensions’ reform have generated public discontent and tensions with the trade unions. The Association Agreement with the EU has been in force since 2000. Concerns remain about the implementation by Israel of the rules of origin provisions of the Agreement, while negotiations for new agricultural concessions have been concluded in 2003.
1. Macroeconomic developments Real sector developments In 2002, Israel experienced a second year of recession, with real GDP contracting by 1% (-0.9% the previous year). Economic performance suffered from continuous hostility with the Palestinians (estimated to have cost the Israeli economy 3-4% of GDP in 2002)125, the slow recovery of the high-tech sector (accounting for 30% of total Israeli exports and manufacturing production) on the back of subdued global economy and trade, and high real interest rates (see below). During 2002, these factors spilled into all aggregate demand components and all industries, including those not directly affected by the security situation and the crisis of the high-tech sector, leading to a further worsening of the performance compared to 2001. Private consumption fell by 0.5 percent in real terms in 2002, with a particularly large decline in purchases of durable goods. Gross fixed capital formation decreased by a large 10.2%. The Israeli economy recovered slightly in 2003, with real GDP expected to have grown by about 1% (Chart 28). Although the main causes of the recent recession have not yet disappeared, economic prospects have slightly improved owing to a somewhat better global outlook and lower political, economic and security uncertainty. Important factors in this context included the
125 Estimates by the Bank of Israel of the direct effects only, i.e. excluding side effects such as the increased risk of financial crisis, possible downgrading of Israel's credit rating, rises in insurance premia and cost of raising capital.
- 71 -
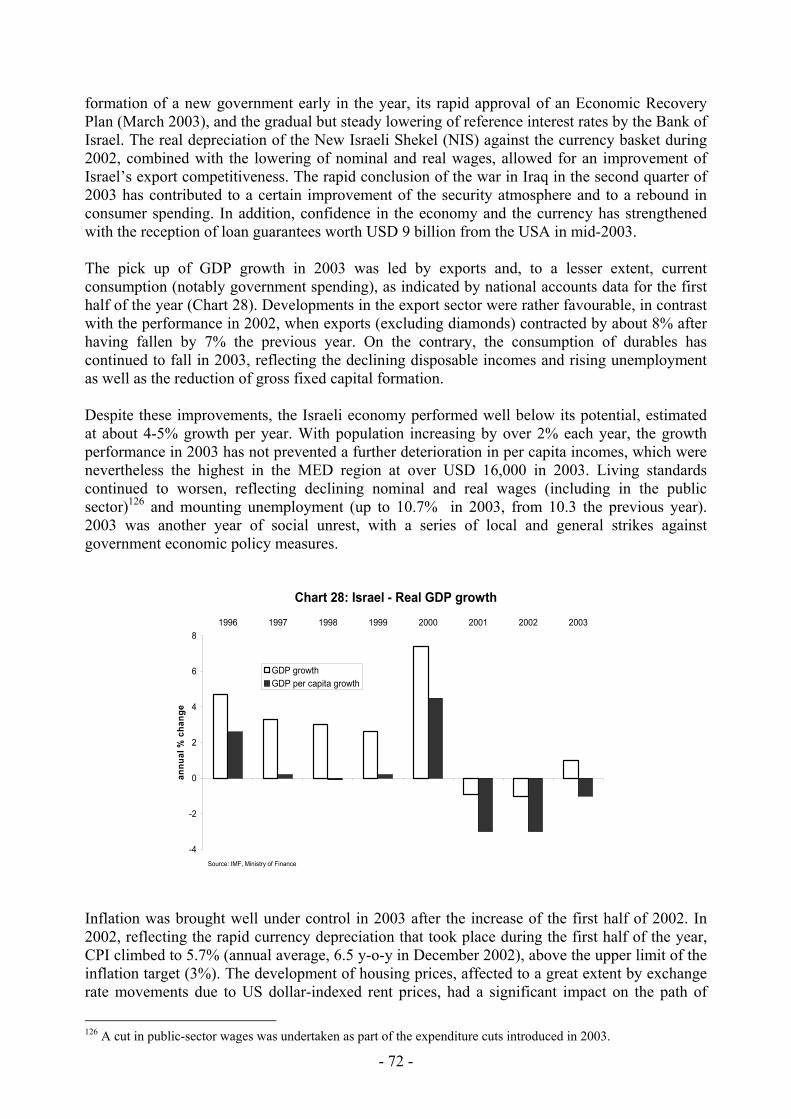
formation of a new government early in the year, its rapid approval of an Economic Recovery Plan (March 2003), and the gradual but steady lowering of reference interest rates by the Bank of Israel. The real depreciation of the New Israeli Shekel (NIS) against the currency basket during 2002, combined with the lowering of nominal and real wages, allowed for an improvement of Israel’s export competitiveness. The rapid conclusion of the war in Iraq in the second quarter of 2003 has contributed to a certain improvement of the security atmosphere and to a rebound in consumer spending. In addition, confidence in the economy and the currency has strengthened with the reception of loan guarantees worth USD 9 billion from the USA in mid-2003. The pick up of GDP growth in 2003 was led by exports and, to a lesser extent, current consumption (notably government spending), as indicated by national accounts data for the first half of the year (Chart 28). Developments in the export sector were rather favourable, in contrast with the performance in 2002, when exports (excluding diamonds) contracted by about 8% after having fallen by 7% the previous year. On the contrary, the consumption of durables has continued to fall in 2003, reflecting the declining disposable incomes and rising unemployment as well as the reduction of gross fixed capital formation. Despite these improvements, the Israeli economy performed well below its potential, estimated at about 4-5% growth per year. With population increasing by over 2% each year, the growth performance in 2003 has not prevented a further deterioration in per capita incomes, which were nevertheless the highest in the MED region at over USD 16,000 in 2003. Living standards continued to worsen, reflecting declining nominal and real wages (including in the public sector)126 and mounting unemployment (up to 10.7% in 2003, from 10.3 the previous year). 2003 was another year of social unrest, with a series of local and general strikes against government economic policy measures.
Chart 28: Israel - Real GDP growth
-4
-2
0
2
4
6
81996 1997 1998 1999 2000 2001 2002 2003
annu
al %
cha
nge
GDP growthGDP per capita growth
Source: IMF, Ministry of Finance Inflation was brought well under control in 2003 after the increase of the first half of 2002. In 2002, reflecting the rapid currency depreciation that took place during the first half of the year, CPI climbed to 5.7% (annual average, 6.5 y-o-y in December 2002), above the upper limit of the inflation target (3%). The development of housing prices, affected to a great extent by exchange rate movements due to US dollar-indexed rent prices, had a significant impact on the path of
126 A cut in public-sector wages was undertaken as part of the expenditure cuts introduced in 2003.
- 72 -

CPI. Subsequent rises in the interest rates, as well as measures to control the deficit, led to a reversal in the trend and expectations of inflation. The appreciation of the NIS during the second quarter of the year and continuous subdued economic activity have also contributed to dampening the inflation environment in 2003. The cumulative CPI is estimated at 0.7% (-2% y-o-y in December 2003), mainly due to falling US dollar-indexed housing prices (excluding housing prices, y-o-y inflation in December is estimated at -0.5%). Fiscal policy In 2002, the central government budget deficit was about 4% of GDP, close to the amended target of 3.9%.127 This corresponds to about 6.4% of GDP if foreign grants and privatisation receipts are excluded, and 6.7% of GDP if measured at the level of consolidated general government. The deficit was kept under control thanks to strong fiscal measures implemented at various stages during the year in the face of falling tax revenues. Nevertheless, despite the budget cuts (including to the welfare system), public expenditures expanded by 2.4% in real terms.128 This was mainly driven by higher public consumption (including defence), while payments to households remained stable in real terms (after growing by 9.3% in 2001 and 6.6% on average during 1996-2000). Numerous payments were reportedly deferred until 2003, formally allowing the government to nearly achieve its target. In 2003, the Israeli authorities continued to struggle to keep the fiscal situation under control. Initially, the 2003 budget approved by the Knesset in late 2002 (at the price of the dissolution of the government coalition) entailed some expenditure reductions compared to 2002. However, the continuous shortfall in revenues and the increase in some expenditure items (notably defence) prompted revisions in January 2003 and mid 2003, as the insufficiency of the earlier package to prevent a budgetary slippage became obvious. Efforts to compress expenditures included further cuts in the budget of civilian government, as well as a reduction in public employment, public wages and welfare transfers (on the contrary, public investments in physical infrastructure have increased as part of a plan of infrastructure construction, and defence spending has also continued to rise). A series of local and general strikes against government economic policy measures took place during 2003, rendering it another year of social unrest. These revisions, and a slight improvement in tax revenues in the second half of the year, allowed containing the extent of the slippage. Nevertheless, the central government deficit for 2003 is estimated to have risen to 5.5-6% of GDP (about 8% excluding grants), against a deficit target of 3% of GDP. The 2004 budget, approved by the Government in September 2003, was passed in January 2004 by the Knesset. It foresees a central government deficit of about 4% of GDP (including grants), to be achieved through further expenditure reductions, including to social security. Trade unions had organised strikes in protest against the proposed changes to pension rights. It should be noted that the deficit target for 2004 is based on a scenario of 2.5% growth, and does not correspond to the 3% deficit to which Israel has committed in order to benefit from loan guarantees from the USA. The Bank of Israel has continued to exert pressure on the government to reduce budget expenditures and control the deficit, as this is crucial to containing inflationary expectations and allow a more decisive monetary easing. Some of the leading international credit agencies have welcomed the government’s fiscal measures (notably, in December 2003, Fitch revised its 127 During 2002, the central government deficit target was first increased from 2.4% to 3%, and then to 3.9% of GDP, mainly mirroring the downward revision of the growth assumptions for that year. 128 1.7% excluding interest payments, defence imports and capital transfers abroad.
- 73 -
outlook on long-term foreign currency from negative to stable129), although they remain worried about the credibility of the fiscal policy.130 The high and rising level of debt is an additional element of fragility. At the end of 2003, gross debt has already reached 106% of GDP, compared to 102% the previous year. In 2002, government borrowing requirements associated with the increasing budget deficit were mostly satisfied on the domestic market due to the difficulty in raising money abroad in this period. Consequently, external debt remained broadly stable at about 25% of GDP, and revenues from privatisation were low (NIS 0.4 billion). The government was thus keen to increase its borrowing abroad. In June 2003, it successfully completed a USD 750 million bond issue in Wall Street, without US loan guarantees. This was USD 250 million more than planned due to excess demand for Israeli bonds.131 Borrowing abroad should be even easier in the framework of the US government guarantees. Monetary and exchange rate policy The framework for monetary policy is gradually evolving into a full-fledged inflation targeting approach. Although formally committed to maintaining a soft peg to a USD-dominated basket,132 monetary policy has de facto evolved into an inflation targeting approach and, since the early 1990’s, the Bank of Israel regularly announces inflation targets. In December 2002, with the abolition of the last ceiling on foreign investments by institutional investors (set at 20% of their total assets), the process of liberalising currency market was completed, and the NIS was made freely convertible. As of late 2003, there was no clear progress with plans to definitively eliminate the exchange rate band, which had been announced as part of a three-stage economic recovery plan approved in March 2003.133 The elimination of the band would remove the potential for inconsistencies between monetary and exchange rate policies. A recent modification (the elimination of the slope of the lower boundary of the exchange rate band in December 2001134) reduced this potential, but it has not disappeared. The exchange rate exhibited considerable volatility in recent years. During the first half of 2002, the NIS depreciated markedly (about 12% against the currency basket), prompted by an unexpected 2% interest rate cut in December 2001 and uncertainty about government commitment to fiscal discipline. In the second half of the year, the currency stabilised against the basket, as the Bank of Israel reacted to the depreciation, increasing inflation by raising the discount rate by 5.3 percentage points between March and July 2002, and keeping it at a high 9.1% until the end of the year. In this period, the NIS recorded an even larger depreciation by 20% against the euro, as the euro strengthened at the same time against the USD-dominated currency basket.
129 Fitch and S&P had a negative outlook on Israel foreign currency rating in 2002. As of the end of 2003, Israel's long term foreign currency debt has been rated as A2 by Moody's and A- by Fitch and S&P. 130 At the same time Fitch decided to retain its negative outlook on the local currency rating reflecting a further increase in public debt and the possibility of further increase in 2004. 131 The issue was Israel’s largest ever in the global financial markets, and the first after three-years of absence. The interest rate on the 10-year bonds was 4.73%, with a spread of 1.53% over US government bonds. 132 A peg to a USD-dominated basket with wide and asymmetric fluctuation bands was adopted in 1991 to limit exchange rate volatility. The euro accounts for about 22% of the basket. 133 Which also foresees budgetary consolidation and the gradual reduction in interest rates 134 Until then the nominal exchange rate had to depreciate by the same inclination of the lowest level of the band (2% a year) in order not to reach the most appreciated level of the band.
- 74 -
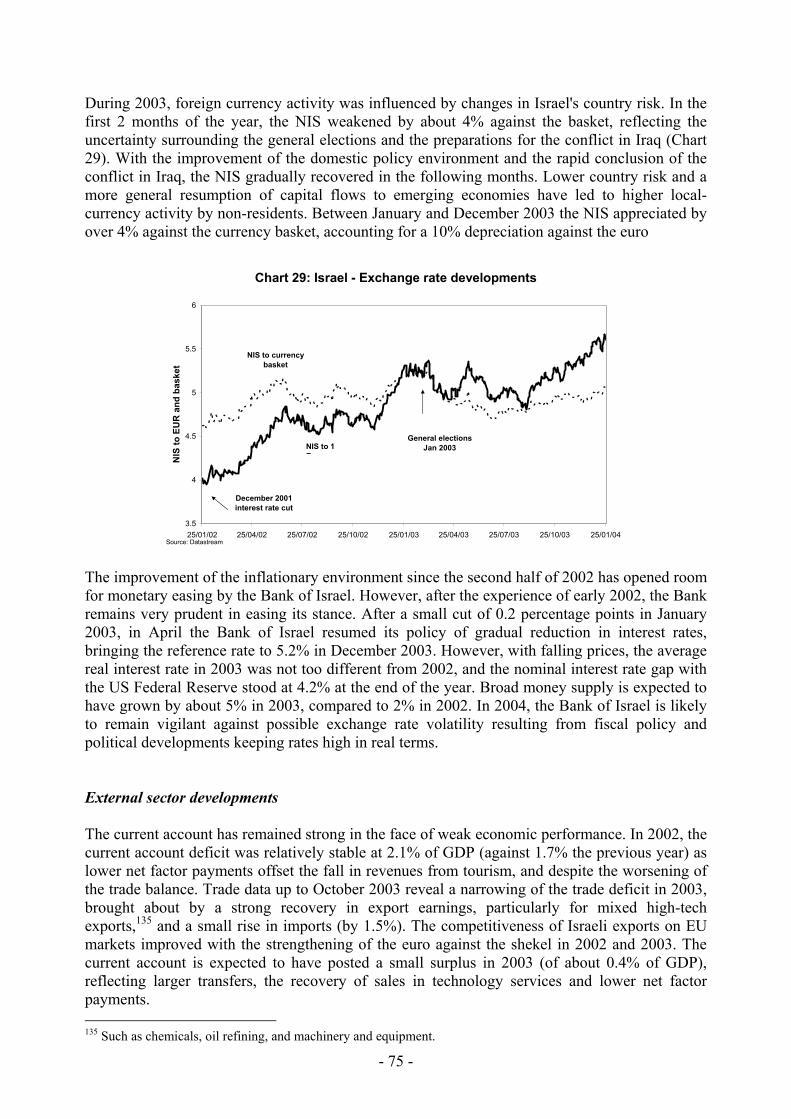
During 2003, foreign currency activity was influenced by changes in Israel's country risk. In the first 2 months of the year, the NIS weakened by about 4% against the basket, reflecting the uncertainty surrounding the general elections and the preparations for the conflict in Iraq (Chart 29). With the improvement of the domestic policy environment and the rapid conclusion of the conflict in Iraq, the NIS gradually recovered in the following months. Lower country risk and a more general resumption of capital flows to emerging economies have led to higher local-currency activity by non-residents. Between January and December 2003 the NIS appreciated by over 4% against the currency basket, accounting for a 10% depreciation against the euro
Chart 29: Israel - Exchange rate developments
3.5
4
4.5
5
5.5
6
25/01/02 25/04/02 25/07/02 25/10/02 25/01/03 25/04/03 25/07/03 25/10/03 25/01/04
NIS
to E
UR
and
bas
ket
December 2001 interest rate cut
General elections Jan 2003NIS to 1
E
NIS to currency basket
Source: Datastream The improvement of the inflationary environment since the second half of 2002 has opened room for monetary easing by the Bank of Israel. However, after the experience of early 2002, the Bank remains very prudent in easing its stance. After a small cut of 0.2 percentage points in January 2003, in April the Bank of Israel resumed its policy of gradual reduction in interest rates, bringing the reference rate to 5.2% in December 2003. However, with falling prices, the average real interest rate in 2003 was not too different from 2002, and the nominal interest rate gap with the US Federal Reserve stood at 4.2% at the end of the year. Broad money supply is expected to have grown by about 5% in 2003, compared to 2% in 2002. In 2004, the Bank of Israel is likely to remain vigilant against possible exchange rate volatility resulting from fiscal policy and political developments keeping rates high in real terms. External sector developments The current account has remained strong in the face of weak economic performance. In 2002, the current account deficit was relatively stable at 2.1% of GDP (against 1.7% the previous year) as lower net factor payments offset the fall in revenues from tourism, and despite the worsening of the trade balance. Trade data up to October 2003 reveal a narrowing of the trade deficit in 2003, brought about by a strong recovery in export earnings, particularly for mixed high-tech exports,135 and a small rise in imports (by 1.5%). The competitiveness of Israeli exports on EU markets improved with the strengthening of the euro against the shekel in 2002 and 2003. The current account is expected to have posted a small surplus in 2003 (of about 0.4% of GDP), reflecting larger transfers, the recovery of sales in technology services and lower net factor payments. 135 Such as chemicals, oil refining, and machinery and equipment.
- 75 -
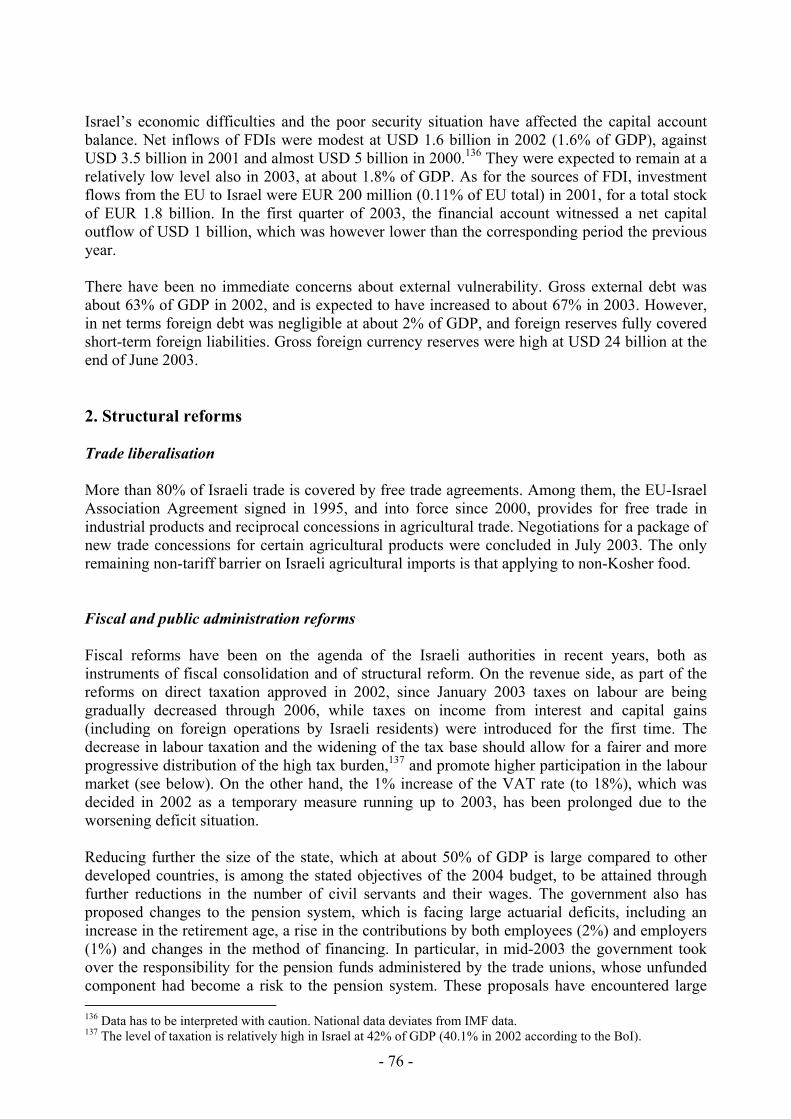
Israel’s economic difficulties and the poor security situation have affected the capital account balance. Net inflows of FDIs were modest at USD 1.6 billion in 2002 (1.6% of GDP), against USD 3.5 billion in 2001 and almost USD 5 billion in 2000.136 They were expected to remain at a relatively low level also in 2003, at about 1.8% of GDP. As for the sources of FDI, investment flows from the EU to Israel were EUR 200 million (0.11% of EU total) in 2001, for a total stock of EUR 1.8 billion. In the first quarter of 2003, the financial account witnessed a net capital outflow of USD 1 billion, which was however lower than the corresponding period the previous year. There have been no immediate concerns about external vulnerability. Gross external debt was about 63% of GDP in 2002, and is expected to have increased to about 67% in 2003. However, in net terms foreign debt was negligible at about 2% of GDP, and foreign reserves fully covered short-term foreign liabilities. Gross foreign currency reserves were high at USD 24 billion at the end of June 2003. 2. Structural reforms Trade liberalisation More than 80% of Israeli trade is covered by free trade agreements. Among them, the EU-Israel Association Agreement signed in 1995, and into force since 2000, provides for free trade in industrial products and reciprocal concessions in agricultural trade. Negotiations for a package of new trade concessions for certain agricultural products were concluded in July 2003. The only remaining non-tariff barrier on Israeli agricultural imports is that applying to non-Kosher food. Fiscal and public administration reforms Fiscal reforms have been on the agenda of the Israeli authorities in recent years, both as instruments of fiscal consolidation and of structural reform. On the revenue side, as part of the reforms on direct taxation approved in 2002, since January 2003 taxes on labour are being gradually decreased through 2006, while taxes on income from interest and capital gains (including on foreign operations by Israeli residents) were introduced for the first time. The decrease in labour taxation and the widening of the tax base should allow for a fairer and more progressive distribution of the high tax burden,137 and promote higher participation in the labour market (see below). On the other hand, the 1% increase of the VAT rate (to 18%), which was decided in 2002 as a temporary measure running up to 2003, has been prolonged due to the worsening deficit situation. Reducing further the size of the state, which at about 50% of GDP is large compared to other developed countries, is among the stated objectives of the 2004 budget, to be attained through further reductions in the number of civil servants and their wages. The government also has proposed changes to the pension system, which is facing large actuarial deficits, including an increase in the retirement age, a rise in the contributions by both employees (2%) and employers (1%) and changes in the method of financing. In particular, in mid-2003 the government took over the responsibility for the pension funds administered by the trade unions, whose unfunded component had become a risk to the pension system. These proposals have encountered large 136 Data has to be interpreted with caution. National data deviates from IMF data. 137 The level of taxation is relatively high in Israel at 42% of GDP (40.1% in 2002 according to the BoI).
- 76 -
hostility by the trade unions. Criticisms to the reforms mainly relate to the prospect of future privatisation of such funds in the absence of government guarantees and supervision. On the positive side, the reforms open the possibility to create an universal pension system (currently the pension system is not compulsory, and as a result a large share of the population does not receive pension benefits). Some steps have been taken to strengthen budget management in recent years. In 2001, the government had suspended the possibility for small groups of Members of Parliament to pass bills with direct budgetary implications outside the normal budget process. This possibility was a major weakness in the budgetary process and limited the ability of the government to effectively control expenditures. As of 2003, there were plans to introduce stricter rules on the approval of such bills (such as requiring a special government approval, or a special quorum of at least 55 members of the Knesset), but no plans yet for the outright removal of this possibility. The World Bank 2003 governance indicators reveal weaknesses in Israel’s government effectiveness and regulatory quality (Chart 30). When comparing its performance to the average for developed countries, Israel's performance in terms of rule of law, control of corruption, voice and accountability is below international average. The frequent changes in economic policy in recent years have also severely harmed public confidence in the government. Among other measures taken, the Economic recovery plan of March 2003 aims at improving the efficiency of the public administration and the quality of services it offers, while reducing operating costs. Other measures planned include the computerisation and the reduction of bureaucracy in a number of administrations, and the consolidation of smaller local authorities and municipalities.
Chart 30: Israel - Governance indicators0 0.5 1 1.5 2
Israel
High income
Israel
High income
Israel
High income
Israel
High income
Israel
High income
government effectiveness
regulatory quality
rule of law
2.5
corruption
voice and accountability
point estimate (-2.5 to +2.5)
Source: WB Governance indicators 2003 Privatisation, enterprise restructuring and business environment After limited progress in 2002, privatisation picked up in 2003. It is identified as one of the priorities of the new government as means to raise funds to cover the mounting deficit, remove national monopolies and instil more competition in the markets, as well as to develop the capital market. The national airline El Al was privatised in June 2003 through the issue of all the company shares on the Tel-Aviv Stock Exchange (TASE). There are plans to privatise companies in the banking sector, electricity, shipping and oil refining.
- 77 -

The new government has expressed its commitment to increasing competition in the markets by breaking up monopolies, including utilities and infrastructure monopolies (e.g. water, ports,138 mail services). This should improve the operating environment for businesses. Other measures envisaged to improve the business environment include granting tax incentives for investments in peripheral regions, and reducing some transaction taxes. Regulatory reforms during the 1980s and the 1990s have contributed to the creation of a generally enabling and non-discriminatory business environment139. Nevertheless, in an examination of Israel’s investment policies in 2002 the OECD encouraged the Israeli authorities to dismantle market access barriers and simplify administrative procedures. Administrative simplification is among the objectives of the 2003 Economic Recovery Plan. Industrial policy, in the form of financial incentives (including reduced tax rates, tax exemptions for the initial period, accelerated depreciation) are widely used to promote capital investments in areas of national priority or in the high-tech sector. Investment incentives are being revised in order to avoid market distortions. Also concerning the business environment, while progress continues to be made, there remain problems with the effective enforcement of intellectual property rights. Finally, domestic producers often benefit from price and other preferences in public procurement. Financial sector reforms The financial sector is highly developed by regional and international standards. The banking sector is rather concentrated, with three institutions accounting for about 80% of the banking assets. The state still holds high shares in two of the largest banks but does not exercise management control and is planning to sell its participation. Financial intermediation appears relatively efficient, as indicated by low and declining interest rate spreads between average lending and deposit rates. The continuation of recession in 2002 and the only modest pick up in 2003 have led to a worsening of the credit quality and to a rise in problem loans. However, bank supervision reacted quickly, and supplementary credit provisions as well as on-site examinations were successful in containing problem loans at a low level (3.5% of total credit in 2000-2002). Consequently, there are no immediate threats to the banking system or to financial stability. An IMF Financial Sector Stability Assessment was conducted in 2000-2001. Among the recommendations made was the introduction of a deposit insurance scheme, which appears particularly important in light of the declining profitability of banks. Labour market reforms Tackling labour market rigidities and raising the rate of participation in the labour market have been among the main priorities of structural reforms. Tighter eligibility criteria for income support and unemployment benefits were introduced in 2002 as part of the fiscal adjustment program. The reduction of the tax rate on labour in 2003 is expected to contribute to increasing the rate of participation of the workforce. The government has toughened its stance towards foreign workers without work permits through deportation140, and through the imposition of levies on the employment of foreign workers. Possibly as a result of these measures and the continuous deterioration of living standards, the rate of participation of the labour force rose somewhat in the first quarter of 2003 (from 54.2 to 54.6%), but remained low by international 138 These proposals have been met by heavy strikes in the port industry. 139 OECD. 140 By late 2002, foreign workers represented about 11% of the total workforce.
- 78 -
standards. Also, despite rising unemployment, the claims for unemployment benefits decreased, possibly reflecting stricter criteria to obtain these benefits. Measures foreseen for 2004 include stricter controls on welfare recipients, initiatives to encourage the participation of inactive people in the labour market, improvements in the field of education, and further reductions in the number of foreign workers. Recent developments indicate a relatively high degree of real wage flexibility. In 2002 and 2003 real wages declined, reflecting cuts in nominal wages after years of rises, as well as the increase in inflation in 2002. At the same time real wages fell both in the private and the public sector. Regarding the latter, a cut in public-sector wages was included in the economic measures package whereby, under a collective agreement valid between May 2003 and June 2005, salaries of all public-sector employees are temporarily reduced by specified rates (up to about 11% for higher income brackets). 3. Relations with the EU and IFIs Israel is among the frontrunners in the Euro-Mediterranean Partnership, although some pending issues persist with respect to the rules of origin. The Association Agreement with the EU was concluded in 1995 and entered into force in 2000. Negotiations for a package of new trade concessions for agricultural products were concluded in July 2003. Nevertheless, concerns remain on the EU side about the implementation by Israel of the rules of origin provisions of the Association Agreement with respect to import of goods manufactured in Israeli settlements located in the West Bank and the Gaza Strip. Since the publication in 2001 of a Notice to importers, custom authorities of EU Member States have checked the origin of imports declared as coming from Israel, and decided to seek guarantees from importers in case of doubt about origin. Pending clarification on the origin by the Israeli authorities, from the beginning of 2003, EU Member States have started recovering permanent duties on a number of products presented as coming from Israel, but probably originating from the occupied territories. The European Commission is also seeking a technical arrangement consistent with the terms of the Association Agreement. Given its high level of economic development, Israel does not benefit from bilateral aid from the EU, with the exception of some financial support to organisations working in the field of human rights and the peace process, and the participation in some Euro-Med regional programmes. Israeli research entities are, on the other hand, fully associated to the 5th Framework Programme of EC for RTD activities, with a status equivalent to that of Member State of the Community (including contribution to the research budget). In June 2003, The European Union renewed its agreement on scientific and technological co-operation with Israel. The new agreement covers Israeli participation from the outset of the 6th EU Research Framework Programme (FP6 2003-2006). Israel does not receive financial assistance from the Bretton Woods institutions. The IMF conducts regular economic reviews in the framework of Article IV consultations. 4. Concluding remarks Among its Mediterranean neighbours Israel stands out economically in terms of its high income level (GDP per capita in PPP terms amounted to 84% of the EU level in 2001), its high degree of openness and the strong technology base of its industry. After two years of recession, the Israeli
- 79 -
economy recovered slightly in 2003 owing to a better global outlook, as well as lower political, economic and security uncertainty. The macroeconomic management, which displayed some uncertain reaction by policy makers at the beginning of the economic slow down, responded strongly in 2003. Inflation was brought under control in 2003 after the flare of 2002 (brought about by a substantial currency depreciation of the New Israeli Shekel) by a strategy based on high real interest rates and more vigorous budgetary measures, notably expenditure cuts. Nevertheless, the deficit for 2003 is estimated to have risen to 5.5-6% of GDP (about 8% excluding grants), and the high and rising level of public debt (106% of GDP) is an element of fragility. The external position remains relatively strong, as the depreciation of the currency in 2002 together with larger transfers allowed the current account to end with a small surplus in 2003. The main challenge for Israel is restoring growth to its potential level. The implementation of sound macroeconomic policies and the continuation of structural reforms are expected to support this process. On the macroeconomic front, efforts to control the deficit and reduce the debt stock are appropriate and ought to be continued and intensified. On the structural side, further progress may be required to improve the business environment. Care also ought to be made to protect the most vulnerable segments of the population and rise labour participation rates. A solution of the hostilities with the Palestinians would bring about a significant improvement in growth prospects.
- 80 -

ISRAEL
Main economic indicatorsprel.
1996 1997 1998 1999 2000 2001 2002 2003Real sector Real GDP growth (% yoy, avg) 4.7 3.3 3.0 2.6 7.4 -0.9 -1.0 1.2 Inflation CPI avg, % yoy 11.3 9.0 5.4 5.2 1.1 1.1 5.7 0.7 Unemployment rate, % yoy 6.7 7.7 8.6 8.9 8.8 9.4 10.3 10.7 GDP per capita, in USD 17,468 17,709 17,325 16,940 18,256 17,505 15,773 16,400
Fiscal Sector Total revenues, % of GDP1 45.4 45.5 46.1 44.8 47.0 --- --- --- Foreign grants, % of GDP 4.0 3.9 4.1 4.1 3.8 2.1 2.5 --- Total expenditure, % of GDP 55.4 54.0 54.0 53.7 52.8 --- --- --- Consol. budget balance, % of GDP2 -10.0 -8.5 -7.9 -8.9 -5.9 -5.9 -6.7 --- Central gov. balance, % of GDP2 -7.8 -5.9 -5.5 -5.1 -3.2 -6.6 -6.4 -8.0 Domestic debt, % of GDP3 107.9 105.0 108.0 101.9 92.8 98.1 102.0 106.0
Monetary sector Base money (M0), % yoy4 --- --- 14.4 21.7 0.6 0.7 -15.8 -21.5 Broad money (M2), % yoy 5 --- --- --- 18.7 7.8 14.4 -2.1 2.7 Credit to the private sector, % of GDP 69.7 71.6 77.2 80.9 83.5 92.6 97.8 --- Degree of Monetisation (M2/GDP)4 --- --- 32.2 42.1 42.5 48.4 47.7 47.9
External sector Current account balance, % of GDP -5.5 -3.9 -1.3 -3.2 -1.7 -1.7 -2.1 0.4 Trade balance, % of GDP -7.2 -5.1 -3.2 -4.3 -2.7 -2.9 -3.4 -2.4 Foreign direct investment flows, % of GDP 1.4 1.6 1.7 3.0 4.3 3.1 1.6 1.8 Import cover (months) 3.7 6.6 7.6 6.7 6.4 6.7 6.5 ---
External Vulnerability External Debt, % of GDP 51.6 53.6 56.4 59.8 55.8 57.6 63.2 67.0 Debt-to-Export Ratio 173.9 177.8 178.8 166.4 137.7 162.3 179.8 --- Debt Service Ratio 6 --- --- --- --- --- --- --- --- Reserves/M2 37.6 57.5 57.4 48.0 44.0 41.0 47.0 47.0
Financial sector Short-term interest rate (eop) 15.3 13.4 12.4 10.1 7.8 5.0 7.9 5.4 Exchange rate (per USD, eop) 3.2 3.5 4.2 4.2 4.0 4.4 4.7 4.4 Exchange rate (per EUR, eop) 4.1 3.9 4.9 4.2 3.8 3.9 5.0 5.4 Real effective exchange rate (1995=100) 105.9 113.3 109.9 105.7 114.2 113.8 102.5 95.0
Source: Central Bank of Israel, Ministry of Finance, IMF, Eurostat, IIF, DRI-Wefa1 Excluding grants.2 excluding grants3 Gross debt.4 reserve money, 2003 up to November5 2003 up to October6 Public external debt service in % of exports of goods and nonfactor services.
- 81 -

JORDAN • Despite the extremely adverse regional environment, growth performance has been
relatively strong (around 3% in 2003), and the Jordanian economy appears more resilient to external shocks. However, social pressures, as a result of poverty, unemployment, and increasing income disparities remain.
• Fiscal deficit reduction slowed down and reversed in 2003 (reaching 13.3% of GDP)
due to the difficult regional environment. There is a need for further fiscal consolidation and reforms, as large grants (at a record high 10% of GDP in 2003) still continue to provide significant financial support.
• Progress on structural reforms, particularly privatisation, has been noteworthy, and
the authorities remain committed to the process through continuing reforms to military and civil service pension schemes, as well as reforms in the financial sector.
• The EU Association Agreement with Jordan was signed in November 1997 and entered
into force in May 2002, following ratification by Parliaments. It foresees gradual tariff dismantlement with a view to creating a free trade area between the EU and Jordan over a period of 12 years.
1. Macroeconomic developments Real sector developments In the context of formal programmes with the IMF, growth averaged broadly 3% over the period 1997-1999, but then accelerated to just over 4% in 2000 and 2001. In 2002, growth strengthened further to nearly 5% despite the continuing Intifada and uncertainty surrounding the possibility of military conflict in Iraq. The export sector has been driving the improved growth performance over recent years and, in 2002, exports in value terms increased by 20% compared to their level in 2001, with exports to the United States increasing 76% as a result of the Qualifying Industrial Zones and the U.S.-Jordan free trade agreement. Looking at the production side, the manufacturing, construction, transport and communication, and phosphate production sectors have registered strong increases. In 2003, the war in Iraq had a negative impact upon growth performance through several channels. Firstly, the war weighed heavily on domestic confidence and domestic demand. Secondly, during the period of the war, exports to Iraq, which account for around 20% of total exports, collapsed and imports of subsidised Iraqi oil came to a halt. The tourism and transportation sectors, which account for around one-quarter of GDP were badly affected. The industrial production index fell by 18% over the first quarter of 2003 (a fall of 14% compared to the same period in 2002), but subsequently recovered to increase by 17% in the year to August. After the war, the transport sector, tourism and exports to Iraq recovered with the aid effort and resumption of business links. Domestic demand also recovered, although violence in the West Bank and Gaza continued to dampen confidence. During the third quarter, indicators showed that a recovery was underway, with growth expected to have reached 3% for 2003 as a whole (Chart 31).
- 82 -

0
2
4
6
8
10
1996 1997 1998 1999 2000 2001 2002 2003
Jordan Maghreb Mashrek
Source: IFS, national statistical offices
Chart 31: Jordan - Real economic growthin %
Unemployment remains a problem in Jordan in the context of a rapidly growing labour force. Despite relatively strong and improving growth performance, unemployment remained at around 15% (higher at 27% according to unofficial estimates) in 2003. The main causes of the high levels of unemployment have been identified in the inability of the economy to absorb the increasing number of entrants in the labour market (working age population is estimated to be growing at around 3% per year up to 2010), the rigidity of the labour market and the mismatch between the skills thought at school and those needed in the economy. Employment growth needs to be to close to 5% per year if the government is to achieve its target of a 6% unemployment rate by 2010. Inflation in Jordan remained low in 2002, with consumer prices increasing by 1.8% per year on average. The steady real appreciation of the exchange rate and the reductions in tariffs kept inflation in check. Furthermore, depressed global economic conditions helped dampen the inflationary effects of higher oil prices in 2002. High unemployment also limits wage pressures. In 2003 average inflation is estimated to have risen to about 2.5%, due to increases in goods and services taxes and increased money supply. Fiscal policy Deficits before grants remain large and, while some progress has been made, deficit reduction slowed down and reversed due to the difficult regional environment (see chart below). In 2002, the deficit target (4.1% of GDP incl. grants) was missed despite efforts of the authorities to contain expenditures in the face of lower than expected revenues and grants. Grants were 1% of GDP lower than envisaged, and weak domestic demand and imports resulted in overestimates for the planned amounts to be collected from the general sales tax. Increased tensions in the build up to the war in Iraq also led to additional expenditures, for example to build-up oil supplies and on security. The central government deficit rose to 10.2% of GDP (5% after grants) in 2002, as revenues fell by around one percentage point of GDP compared to 2001, reaching 25% , and expenditures increased by around one percentage point of GDP to 35%. In the context of the difficult regional environment, the initial 2003 budget aimed for a deficit for the year of 10.2% of GDP (5% after grants). The budget foresaw that expenditure levels would remain broadly the same as in 2002 at 35.2% of GDP, revenues would fall to 24.8% of GDP and
- 83 -
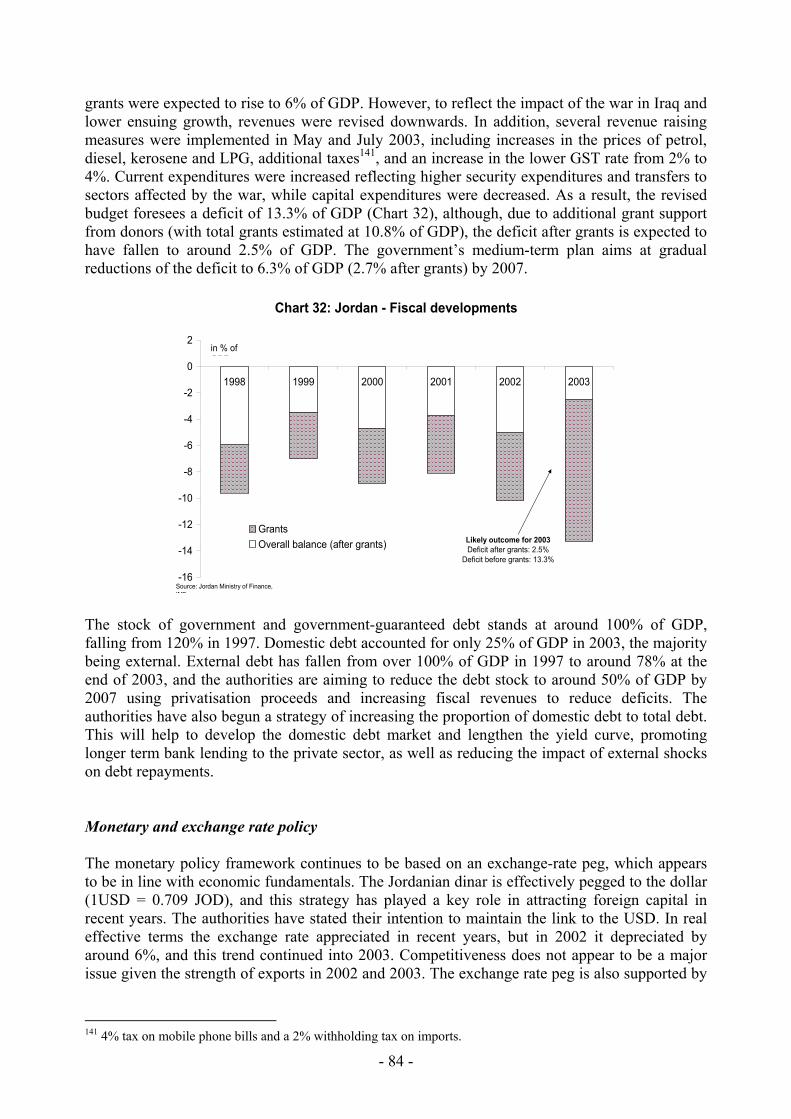
grants were expected to rise to 6% of GDP. However, to reflect the impact of the war in Iraq and lower ensuing growth, revenues were revised downwards. In addition, several revenue raising measures were implemented in May and July 2003, including increases in the prices of petrol, diesel, kerosene and LPG, additional taxes141, and an increase in the lower GST rate from 2% to 4%. Current expenditures were increased reflecting higher security expenditures and transfers to sectors affected by the war, while capital expenditures were decreased. As a result, the revised budget foresees a deficit of 13.3% of GDP (Chart 32), although, due to additional grant support from donors (with total grants estimated at 10.8% of GDP), the deficit after grants is expected to have fallen to around 2.5% of GDP. The government’s medium-term plan aims at gradual reductions of the deficit to 6.3% of GDP (2.7% after grants) by 2007.
-16
-14
-12
-10
-8
-6
-4
-2
0
2
1998 1999 2000 2001 2002 2003
GrantsOverall balance (after grants)
Chart 32: Jordan - Fiscal developments
in % of GDP
Likely outcome for 2003Deficit after grants: 2.5%
Deficit before grants: 13.3%
Source: Jordan Ministry of Finance, IMF
The stock of government and government-guaranteed debt stands at around 100% of GDP, falling from 120% in 1997. Domestic debt accounted for only 25% of GDP in 2003, the majority being external. External debt has fallen from over 100% of GDP in 1997 to around 78% at the end of 2003, and the authorities are aiming to reduce the debt stock to around 50% of GDP by 2007 using privatisation proceeds and increasing fiscal revenues to reduce deficits. The authorities have also begun a strategy of increasing the proportion of domestic debt to total debt. This will help to develop the domestic debt market and lengthen the yield curve, promoting longer term bank lending to the private sector, as well as reducing the impact of external shocks on debt repayments. Monetary and exchange rate policy The monetary policy framework continues to be based on an exchange-rate peg, which appears to be in line with economic fundamentals. The Jordanian dinar is effectively pegged to the dollar (1USD = 0.709 JOD), and this strategy has played a key role in attracting foreign capital in recent years. The authorities have stated their intention to maintain the link to the USD. In real effective terms the exchange rate appreciated in recent years, but in 2002 it depreciated by around 6%, and this trend continued into 2003. Competitiveness does not appear to be a major issue given the strength of exports in 2002 and 2003. The exchange rate peg is also supported by
141 4% tax on mobile phone bills and a 2% withholding tax on imports.
- 84 -
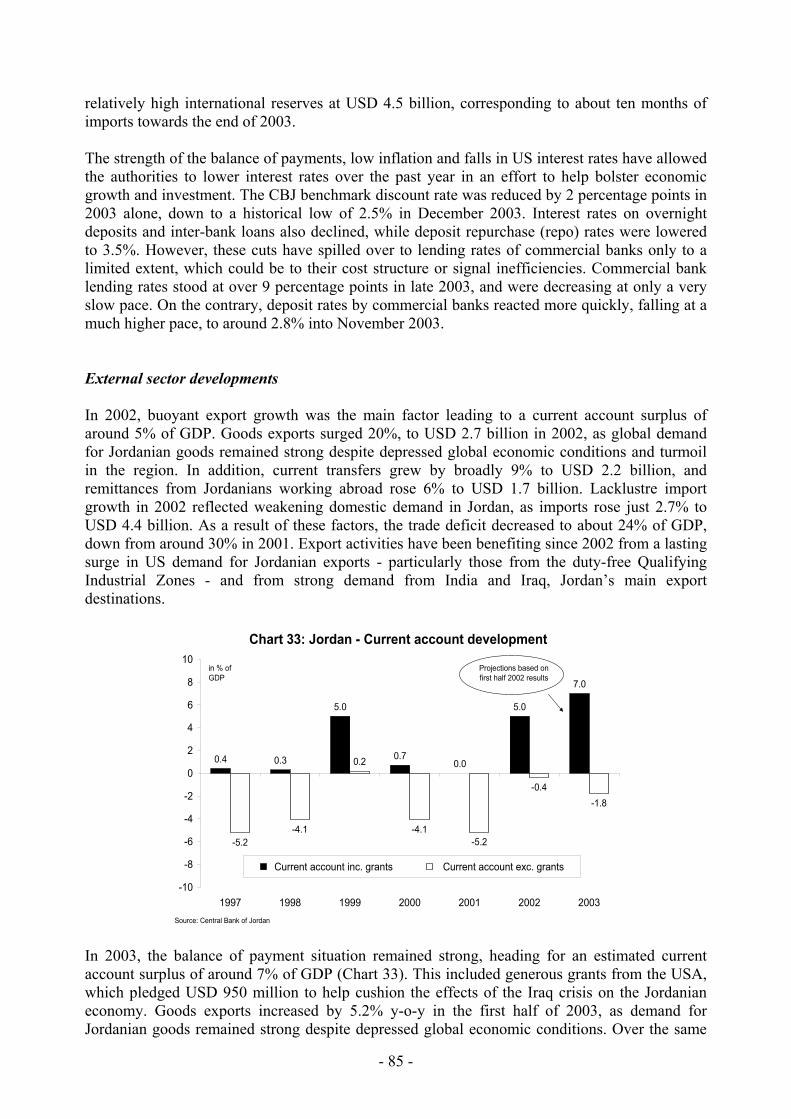
relatively high international reserves at USD 4.5 billion, corresponding to about ten months of imports towards the end of 2003. The strength of the balance of payments, low inflation and falls in US interest rates have allowed the authorities to lower interest rates over the past year in an effort to help bolster economic growth and investment. The CBJ benchmark discount rate was reduced by 2 percentage points in 2003 alone, down to a historical low of 2.5% in December 2003. Interest rates on overnight deposits and inter-bank loans also declined, while deposit repurchase (repo) rates were lowered to 3.5%. However, these cuts have spilled over to lending rates of commercial banks only to a limited extent, which could be to their cost structure or signal inefficiencies. Commercial bank lending rates stood at over 9 percentage points in late 2003, and were decreasing at only a very slow pace. On the contrary, deposit rates by commercial banks reacted more quickly, falling at a much higher pace, to around 2.8% into November 2003. External sector developments In 2002, buoyant export growth was the main factor leading to a current account surplus of around 5% of GDP. Goods exports surged 20%, to USD 2.7 billion in 2002, as global demand for Jordanian goods remained strong despite depressed global economic conditions and turmoil in the region. In addition, current transfers grew by broadly 9% to USD 2.2 billion, and remittances from Jordanians working abroad rose 6% to USD 1.7 billion. Lacklustre import growth in 2002 reflected weakening domestic demand in Jordan, as imports rose just 2.7% to USD 4.4 billion. As a result of these factors, the trade deficit decreased to about 24% of GDP, down from around 30% in 2001. Export activities have been benefiting since 2002 from a lasting surge in US demand for Jordanian exports - particularly those from the duty-free Qualifying Industrial Zones - and from strong demand from India and Iraq, Jordan’s main export destinations.
0.4 0.3
5.0
0.70.0
5.0
7.0
-5.2-4.1
0.2
-4.1-5.2
-0.4-1.8
-10
-8
-6
-4
-2
0
2
4
6
8
10
1997 1998 1999 2000 2001 2002 2003
Current account inc. grants Current account exc. grants
Source: Central Bank of Jordan
Chart 33: Jordan - Current account development
Projections based on first half 2002 results
in % of GDP
In 2003, the balance of payment situation remained strong, heading for an estimated current account surplus of around 7% of GDP (Chart 33). This included generous grants from the USA, which pledged USD 950 million to help cushion the effects of the Iraq crisis on the Jordanian economy. Goods exports increased by 5.2% y-o-y in the first half of 2003, as demand for Jordanian goods remained strong despite depressed global economic conditions. Over the same
- 85 -
period, goods imports grew 15.1% y-o-y due to preparations for the war in Iraq and higher oil imports since the flow of discounted Iraqi crude oil was halted. As a result of these developments, the trade deficit is expected to have widened to about 26% of GDP. Despite regional uncertainties, Jordan's external vulnerability has been lowered in recent years, although its debt level can be still regarded as high. Public external debt has decreased to around 78% of GDP and the debt-to-export ratio has fallen to around 180%. Most of the debt reduction has been achieved through the use of privatisation proceeds, debt swaps and buy-back operations. The debt service ratio (at around 20% in 2003) is expected to improve further due to the July 2002 agreement with the Paris Club of creditor nations. Under this ”exit rescheduling” arrangement, approximately USD 1.2 billion in payments are to be rescheduled out of around USD 2 billion originally due between 1st July 2002 and 31st December 2007. The net effect is that some 16% of repayments due during 2002, and 33% due during 2003, have been rescheduled to 2007 and beyond. 2. Structural reforms The Government is focussed on the challenge of restoring the country to a high and sustainable growth path supportive of job creation. Determined actions are being taken in the areas of privatisation, several key economic laws have been passed, tariffs have been further reduced, and increased efforts are being made towards fulfilling requirements of accession to World Trade Organisation. Public sector reforms are also high on the reform agenda. The Plan for Social and Economic Transformation (PSET), launched November 2001, is a key instrument to raise Jordan's growth potential and overall living standards. It covers the areas of privatisation and a private sector-led investment, human resource development, rural development, improvements in health care, and poverty alleviation. Trade liberalisation During the past several years, Jordan has reformed its legislative and regulatory framework with the aim of achieving greater integration into the global economy. The process has resulted in its accession to the WTO in 2000, a bilateral free trade agreement with the USA in 2001, and the ratification of an Association Agreement with the EU in 2002. Since 1998 it has also been a member of the Greater Arab Free Trade Area (GAFTA) and has signed bilateral free trade agreements with most countries of the region and with EFTA (2001). Most recently, Jordan, together with Morocco, Tunisia and Egypt, concluded and initialled in Amman in January 2003 the Agadir Agreement, providing for the establishment of the Mediterranean Free Trade Area, under which mutual free trade should be achieved by 2006. Taxes on foreign trade have fallen as a proportion of GDP from 6.4% on average in 1992-95 to 3.3% in 2002. They are budgeted to fall further to 2.5% of GDP in 2003. Fiscal and public administration reforms Jordan’s fiscal reform objectives for over a decade have aimed at remedying a number of weaknesses stemming from a combination of growing budget deficits and an unsustainable debt burden. Initiatives on the revenue side included the introduction of a general sales tax (GST) of 13% in 1999. GST is a large revenue contributor to the Jordanian treasury, and has helped to offset declining revenues from foreign trade. Nevertheless, Jordan’s fiscal position remains
- 86 -

highly dependent on foreign grants as a source of revenues. In May 2003, the Government implemented a number of revenue measures to partly offset the adverse fiscal impact of the conflict in Iraq (estimated at some 5% of GDP), aimed at raising around 2% of GDP on an annualised basis. The Government envisages further reforms of the tax system, including the broadening of the GST and income tax bases. Building on current improvements in tax administration,142 the Government has plans to integrate the GST and Income Tax Departments. Government spending has averaged around 35% of GDP over the last decade, down from around 50% of GDP in 1992, at the time of the Gulf War. However, while interest payments have fallen, spending on wages, pensions and defence and security increased from 16.9% to 22.3% of GDP in 2002.143 The authorities are focussing on containing expenditures through reforms to the public (military and civil service) pensions, with the overall aim of reducing their generosity and, hence, the net consolidated public sector deficit.144 Reforms of the military pension system began in 2002, with all new military recruits being enrolled in a new contributory scheme. On the contrary, civil service pension reforms are progressing more slowly than envisaged. The government has also set itself strict limits on borrowing and on corresponding budget deficit targets, with the aim of reducing the total stock and external stock of public debt to 73% and 51% of GDP respectively by end-2007. Jordan’s public administration reform strategy covers three main areas. The first area encompasses public sector reform, including civil service reform, government restructuring, and reforms to ensure better quality of service and improved access. The second reform pillar refers to an e-government initiative to improve communications within the government and between government, businesses and citizens, while the third pillar contains judicial reform. In May 2002, the Government adopted a new civil service by-law containing a code of ethics for public employees, provisions for a more meritocratic selection of senior managers, regular and more transparent evaluation and promotion of personnel, and greater scope for dealing with unsatisfactory staff. The Government has also finalised the job descriptions (duties, reporting arrangements and qualifications) for fifty-eight public departments. The Government established an e-Government Programme Management Unit in the Ministry of Information and Communications Technology to promote the use of information technology within the administration. The Government's approach to judicial system reform includes improved working conditions (e.g., pay, training, buildings, and equipment) and computerisation. Privatisation, enterprise restructuring and business environment Since the start of asset sales in 1998, proceeds from privatisation have amounted to around USD 1 billion. The bulk of this (USD 659 million) is attributable to the phased sale of the Government’s stake in the Jordan Telecommunications Corporation, the most recent stage of which took place in October 2002. Other substantial divestitures included sales of stakes in the 142 The Sales Tax Department has substantially reduced the proportion of non-filers (to below the target of 10%) and successfully introduced (as from January 2003) a risk-based audit plan to ensure, inter alia, appropriate coverage of GST tax-payers. Computerised tax-payer data is up-to-date and will be extended to control all refund claims. The Income Tax Department is implementing strengthened arrangements for collecting arrears. 143 Of these the largest increase has been in pensions, from 2.9% to 7.7% of GDP, corresponding to a growth of outlays of 10% p.a. in real terms. 144 The reform agenda comprises numerous elements, including increasing length-of-service requirements, establishing minimum retirement ages, reducing disability awards and, generally, rationalizing benefit formulae.
- 87 -
Social Security Corporation in 2002 (USD 41.3 million equivalent), as well as the sale of some of Royal Jordanian Airlines’ non-core businesses (USD 106.2 million).145 In addition, the Government’s shares in 47 companies in the Jordan Investment Corporation’s portfolio were sold, generating USD 150 million. Although at a slower pace due to the war in Iraq, progress with privatisation continued in 2003, notably with the sale of half of the government 52% share in the Arab Potash Company raising USD 173 million. The Government plans to sell 55.4% of its shares in the Irbid District Electricity Company. The Government may also sell a further portion of its shares in the Jordan Telecommunications Corporation. It will continue to look for a strategic investor in Royal Jordanian Airlines (which was transformed into a public shareholding company in 2000), and preparations are being made to privatise the country’s three airports (Queen Alia International, Marka and Aqaba). The government has also started to tackle the energy sector and has started respective restructuring activities. The National Electricity Power Company (NEPCO) has been separated into generation (CEGCO), transmission (NEPCO) and distribution (EDCO) companies, and a regulatory body for the industry was established in 2001. It was planned that these companies (CEGCO and EDCO) would be privatised (60% and 100% stakes, respectively) possibly before the end of 2003. In parallel with the privatisation programme, the Government passed legislation to abolish remaining controls on the foreign ownership of property and land, to strengthen regulatory agencies, to encourage and regulate leasing activities, and to strengthen corporate disclosure requirements. Moreover, most economic laws were revised in the last three years to provide a more conducive regulatory environment in support of private sector development. Jordan ranks above the average for its income and regional grouping in terms of the World Bank index for regulatory quality (0.1 against -0.4 for lower-middle income countries and -0.2 for MENA countries). However the index is still low compared to that of more developed countries. Although steps have been taken to strengthen the independence of the judiciary and rise its performance, there appears to be still some degree of political interference in the judicial process. Jordan performs commendably in terms of combating corruption. It ranks quite high, forty-third out of 133 countries, in Transparency International’s ranking for 2003, standing higher than all but two of the MEDA countries (Israel and Tunisia) and most of the accession countries. The relatively good position of Jordan is confirmed by the World Bank governance indicators and the respective sub-index for corruption, indicating that Jordan occupies the third position in the region. Financial sector The banking sector in Jordan is characterised by conservatism, high liquidity, and market fragmentation. Obtaining money for start-ups is difficult, and lending is essentially asset-based. The Central Bank has been keen to attract more foreign banks into the market, both as a sign of confidence in the sector and as a way of transferring technology. Two new foreign banks were granted licences to operate in 2003, the National Bank of Kuwait and the Lebanese Banque de Liban et d’Outre Mer. 145 These include RJ’s Catering Division (USD 20 million), Flight Training Centre (USD 18 million), Duty-free Shops, August 2000 (USD 60 million), and Air Academy, January 2003 (USD 8.2 million).
- 88 -
Regulatory standards were tightened over the past few years, and a new banking law in 2000 strengthened the supervisory role of the Central Bank. Measures included a reduction of the rating period on non-performing loans from 120 to 90 days. Following the setting up in 2000 of an insurance scheme for deposits of up to JOD 10,000, the Deposit Insurance Corporation was established in September 2002, financed by the Central Bank and nineteen other banks. At the same time, the Central Bank raised the risk-weighted capital adequacy ratio from 10% to 12% and the reserve requirement of investment banks to 14% (the same as for commercial banks). A serious embezzlement problem in 2002 prompted the Central Bank to introduce tighter regulations, intensifying on-site auditing and ensuring that no bank lends more than 25% of its capital to a single person or group. The Central Bank is also planning further measures, including an increase in commercial banks’ minimum capital requirements by JOD 20 million phased over four years, and the strengthening banks’ reporting requirements. Labour markets Despite higher growth rates in recent years, unemployment remains stubbornly high at an officially estimated 16.5%. Unemployment among women is even higher, at more than 22%. However, unemployment among the 15-24 year age group is still higher, running at some 31% and accounting for more than half of total unemployment. At the same time, Jordan's labour market is characterised by a relatively low rate of participation. The government’s attempt to reduce unemployment through increased growth and structural reforms is reflected in its broad-ranging structural reform agenda. In particular, the economic dimension of the Programme for Socio-Economic Transformation beginning in 2001 aims to enhance private investment, especially in infrastructure projects, and improve the environment for private investment. However, one of the reasons for the high unemployment figures is the rigidity of the labour market. Legislation needs to be revised to improve labour mobility. Investors have indicated that the rules and restrictions on the termination of employment contracts are outdated and burdensome and, more generally, revisions to other labour rules including, for example, severance payments, discipline of employees and employee liability for damages, among others, would improve the flexibility of the labour market. 3. Relations with the EU and IFIs The Euro-Mediterranean Association Agreement with Jordan was signed in November 1997, and entered into force in May 2002. The indicative budget for the EC National Indicative Programme (NIP) covering the period 2002 – 2004 amounts to EUR 142 million. It includes a Structural Adjustment Facility for EUR 60 million, which was signed in October 2002, providing budget support subject to the fulfilment of conditions related to fiscal and pension reforms. Other priorities include support for the implementation of the EU Association Agreement and support for regional development. The 2003 National Financing Plan takes the Iraqi war into account by bringing forward a budgetary aid of EUR 35 million in the form of direct budget support designed to offset the negative effects of the war and help maintain the country's economic stability. To assist private sector development, the Commission also plans to allocate an additional EUR 5 million to the Industrial Modernisation Programme, designed to organise and support the development of a national assistance programme for SMEs. This 2003 National Financing Plan represents a
- 89 -
financial allocation of EUR 42 million, bringing total MEDA allocations to Jordan to EUR 423 million. In the last five years, the EIB has provided over EUR 230 million in loans, with EUR 40 million provided in the first eleven months of 2003. At the end of 2003, Jordan is the only country in the region to have a formal programme with the IMF. In July 2002, the Executive Board of the IMF approved a two-year stand-by credit of SDR 85.28 million (about USD 113 million) for Jordan to offer continued support to its economic program, including extensive structural reforms. Jordan successfully completed a three-year, SDR 127.88 million (about USD 160 million) Extended Fund Facility (EFF) arrangement in May 2002. The arrangement was extended to allow time to incorporate the new PSET in the economic program. The new World Bank Country Assistance Strategy (CAS) for Jordan will run from July 2003-June 2005. It aims to support Jordan’s program of institutional reforms, and will focus on the five key areas of human development, governance, private sector led growth, water management and gender inclusion. A range of instruments will be used including lending, technical assistance and risk guarantees. IBRD lending over the three years to mid-2005 is expected to range between USD 305 and USD 380 million in the areas of Public Sector Reform, Road Management and Tourism, among others. The IFC is also actively supporting the private sector with a portfolio of around USD100 million. 4. Concluding remarks Supported by macroeconomic stabilisation efforts, wide ranging structural reforms as well as substantial donors’ financial and technical support, Jordan has displayed a good economic performance since the 1990s and remarkable resilience in the face of several economic shocks. Despite the adverse impact of the conflict in Iraq, real GDP growth was around 3% in 2003, inflation remained under control at about 2.5% and the current account balance continued to improve, also thanks to record high foreign grants. On the other hand, fiscal deficits before grants remained large (2003: over 13% of GDP) and represent, with the large public debt stock (around 100% of GDP), an element of fragility, calling for increased efforts towards fiscal consolidation. In particular the large, albeit declining, level of external debt (around 78% of GDP) makes the economy vulnerable to the risk of a depreciation of the Jordanian dinar. Aware of this risk, the authorities aim at reducing external debt further by reducing deficits and channelling privatisation proceeds only to debt reduction. Stepping up the reform of the pension system and the civil service would also be appropriate in this context. On the structural front, led by an active private sector and with the state retreating from economic activities, Jordan is making rapid progress towards becoming a functioning market economy. Trade liberalisation, privatisation and the removal of barriers to foreign investments have exposed the Jordanian economy to high degrees of competition. However, the business sector is still somewhat constrained by an imperfect judicial system and inefficient banking sector, and further improvement of the regulatory framework for business activity would be recommended. Continuous actions in the social area are also called for, given Jordan’s problems of poverty and unemployment. Measures to raise labour participation rates, increase labour market flexibility and enhance the quality of education would be appropriate.
- 90 -
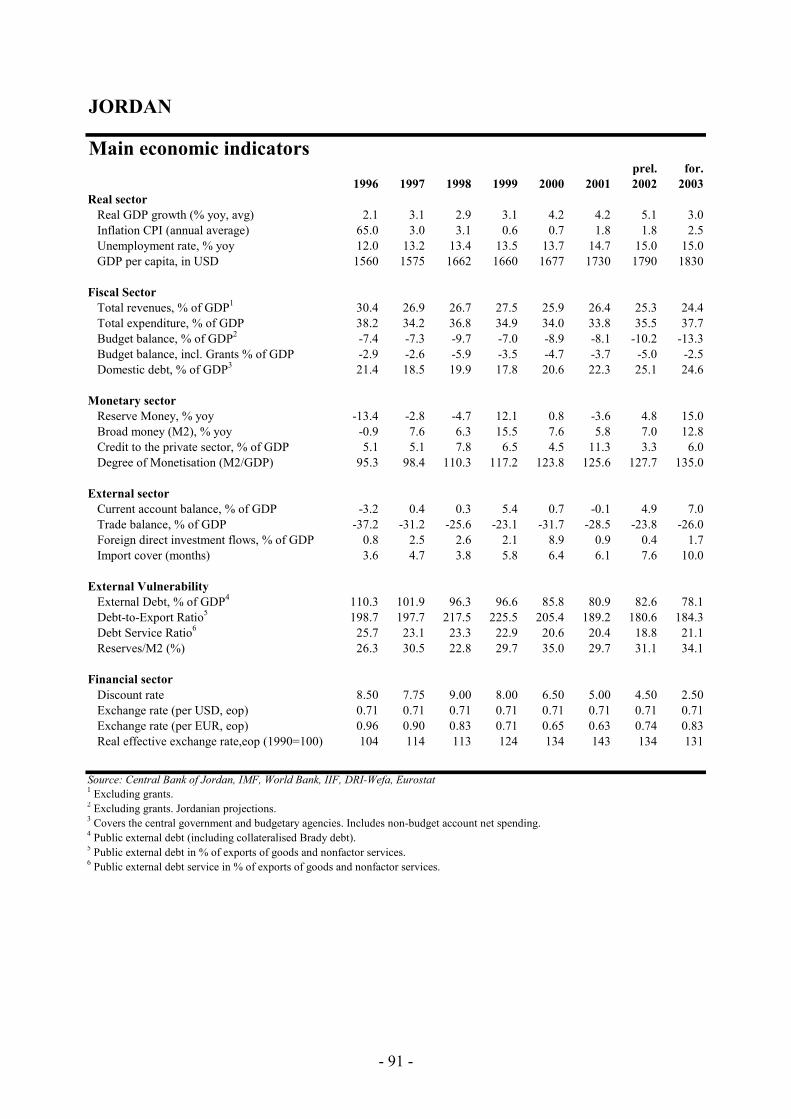
JORDAN
Main economic indicatorsprel. for.
1996 1997 1998 1999 2000 2001 2002 2003Real sector Real GDP growth (% yoy, avg) 2.1 3.1 2.9 3.1 4.2 4.2 5.1 3.0 Inflation CPI (annual average) 65.0 3.0 3.1 0.6 0.7 1.8 1.8 2.5 Unemployment rate, % yoy 12.0 13.2 13.4 13.5 13.7 14.7 15.0 15.0 GDP per capita, in USD 1560 1575 1662 1660 1677 1730 1790 1830
Fiscal Sector Total revenues, % of GDP1 30.4 26.9 26.7 27.5 25.9 26.4 25.3 24.4 Total expenditure, % of GDP 38.2 34.2 36.8 34.9 34.0 33.8 35.5 37.7 Budget balance, % of GDP2 -7.4 -7.3 -9.7 -7.0 -8.9 -8.1 -10.2 -13.3 Budget balance, incl. Grants % of GDP -2.9 -2.6 -5.9 -3.5 -4.7 -3.7 -5.0 -2.5 Domestic debt, % of GDP3 21.4 18.5 19.9 17.8 20.6 22.3 25.1 24.6
Monetary sector Reserve Money, % yoy -13.4 -2.8 -4.7 12.1 0.8 -3.6 4.8 15.0 Broad money (M2), % yoy -0.9 7.6 6.3 15.5 7.6 5.8 7.0 12.8 Credit to the private sector, % of GDP 5.1 5.1 7.8 6.5 4.5 11.3 3.3 6.0 Degree of Monetisation (M2/GDP) 95.3 98.4 110.3 117.2 123.8 125.6 127.7 135.0
External sector Current account balance, % of GDP -3.2 0.4 0.3 5.4 0.7 -0.1 4.9 7.0 Trade balance, % of GDP -37.2 -31.2 -25.6 -23.1 -31.7 -28.5 -23.8 -26.0 Foreign direct investment flows, % of GDP 0.8 2.5 2.6 2.1 8.9 0.9 0.4 1.7 Import cover (months) 3.6 4.7 3.8 5.8 6.4 6.1 7.6 10.0
External Vulnerability External Debt, % of GDP4 110.3 101.9 96.3 96.6 85.8 80.9 82.6 78.1 Debt-to-Export Ratio5 198.7 197.7 217.5 225.5 205.4 189.2 180.6 184.3 Debt Service Ratio6 25.7 23.1 23.3 22.9 20.6 20.4 18.8 21.1 Reserves/M2 (%) 26.3 30.5 22.8 29.7 35.0 29.7 31.1 34.1
Financial sector Discount rate 8.50 7.75 9.00 8.00 6.50 5.00 4.50 2.50 Exchange rate (per USD, eop) 0.71 0.71 0.71 0.71 0.71 0.71 0.71 0.71 Exchange rate (per EUR, eop) 0.96 0.90 0.83 0.71 0.65 0.63 0.74 0.83 Real effective exchange rate,eop (1990=100) 104 114 113 124 134 143 134 131
Source: Central Bank of Jordan, IMF, World Bank, IIF, DRI-Wefa, Eurostat1 Excluding grants.2 Excluding grants. Jordanian projections.3 Covers the central government and budgetary agencies. Includes non-budget account net spending.4 Public external debt (including collateralised Brady debt).5 Public external debt in % of exports of goods and nonfactor services.6 Public external debt service in % of exports of goods and nonfactor services.
- 91 -
LEBANON •
•
•
•
Real GDP growth remained relatively subdued at around 2% in 2002. A more favourable regional environment and lower real interest rates have implied a mild acceleration of economic growth in the second half of 2003, lifting GDP growth to about 2-3% for the year as a whole.
Substantial donor support of over EUR 3 billion (plus EUR 1.3 billion in projects) at the end of 2002 at the Paris II donor conference was accompanied by a significant fiscal adjustment in that year of five percentage points of GDP, bringing the deficit down to 14.5% of GDP, with the primary balance moving into surplus.
Commitments made towards further fiscal consolidation in 2003-04 appear to be out of reach and, despite being a key element of the government’s stabilisation strategy, privatisation has proceeded more slowly than anticipated in 2002-03. Progress is vital to address imbalances reflected in the large public sector debt stock and interest burden.
The Association Agreement with the EU was signed in May 2002, and an interim agreement covering trade issues entered into force in March 2003. The agreement foresees a gradual reduction in tariffs on industrial goods over 12 years, with a 5-year grace period.
1. Macroeconomic developments Real sector developments Overall, Lebanon’s growth performance has remained relatively subdued since 2000 at a level of around 2%. Despite the absence of official GDP data, it is estimated that growth picked-up in 2001 to 2% from –0.5% the year before.146 This was driven by Arab investment in the construction sector and strong export growth. In 2002, the economy grew again at a rate of 2% in real terms. Domestic demand remained weak in the context of the large fiscal adjustment, which has impacted government investment and consumption. However, this was offset by a strong export growth of 18%. In terms of sectors, 2002 was a favourable year for tourism, with receipts up broadly 60% compared to 2001, as well as for construction activity, which also remained strong. The war in Iraq in early 2003 had negative impacts on tourism and conference activity, particularly from the Gulf region, and exports to Iraq also ceased during the period of the war. However, the impact of the conflict appears to have been relatively short-lived, with the Bank of Lebanon’s coincident indicator increasing by about 4% y-o-y in November 2003 (from about 3% the previous year). Figures on cement deliveries and construction permits indicate a recovery of construction activities in the second quarter of 2003, after the fall earlier in the year Overall, in 2003 stronger growth should be supported by a number of factors, including lower real interest rates as a result of donor support, a more favourable regional environment, and some depreciation of the real effective exchange rate. These factors are expected to have supported a growth rate of about 2-3% in 2003.
146 According to the Lebanese Ministry of Finance no official GDP calculations have been made since 1997. Lebanon is aiming to produce more reliable national accounts statistics in 2003.
- 92 -

The anchor of the Lebanese pound to the US dollar and very high real interest rates in the context of large fiscal imbalances and the open nature of the Lebanese economy have been key factors in the strong disinflationary trend witnessed over recent years.147 After a minor fall in the annual average CPI in 2000 and 2001 of 0.4% due to weak domestic demand, tariff reductions and a real appreciation of the currency, inflation rose again in 2002 by 1.8%. This was largely due to the introduction of VAT at the beginning of the year, but also to higher fuel prices leading to price pressure in various product and service categories. With the removal of these one-off factors, consumer prices rose 1.1% between January and September 2003. In 2003, as a whole, the CPI (annual average) is expected to have increased by around 2%, as domestic demand strengthened slightly and non-US import prices picked up in the context of currency depreciation (Chart 34).
-2
0
2
4
6
8
10
1996 1997 1998 1999 2000 2001 2002 f2003
Real GDP growth (% change)
Inflation CPI (period average)
Chart 34: Lebanon - Inflation and growth developments
Source, DRI-Wefa, EIU Fiscal policy Large fiscal deficits (averaging 21% of GDP between 1995 and 2000) and rapidly growing public debt stock (reaching over 140% of GDP in 2000) resulted in an unsustainable fiscal position. Since 2000, when the fiscal deficit reached 24.6% of GDP (financed largely by the banking system, including the Central Bank (BdL), the government has made efforts to reduce the deficit.148 The government adopted a three-pronged strategy in 2002 based on strong fiscal measures, faster privatisation and international support. External assistance was forthcoming at the Paris II donor conference in November 2002 in the form of longer term, low interest loans and guarantees worth some EUR 3 billion, as well as project financing worth around EUR 1.3 billion. In addition to external support, the Central Bank retired and rescheduled its holdings of government Treasury Bills and Eurobonds (USD 3.7 billion), reducing the government’s public debt stock by around 10% of GDP with substantial interest savings. Furthermore, the government was able to retire additional maturing debt in a deal with commercial banks, whereby banks subscribed to two-year, interest free government paper worth around USD 3.6 billion, saving over USD 330 million in interest payments. The benefits of this strategy, together with further expenditure cuts and revenue raising measures, have begun to bear fruit. In 2002, the overall fiscal deficit was further reduced to
147 DRI-Wefa. 148 Lebanese Ministry of Finance, “Yearly Report 2001: Fiscal, Trade, and Structural Developments”, Beirut 2001.
- 93 -

14.5% of GDP, better than the budgeted 17% (Chart 35). In addition to interest rate reductions at the end of the year facilitated by Paris II windfalls, the government reduced capital expenditures, introduced VAT and improved tax collection. Significantly, a positive primary balance of 3.2% of GDP was achieved, the first time since the end of the war in 1990. The deficit was financed exceptionally by debt cancellation and debt swaps by the Central Bank and commercial banks, as well through external Paris II finance.149 However, the situation remained critical and required further and continued adjustment measures to bring the fiscal accounts to a more sustainable position.
-35
-25
-15
-5
5
15
25
35
1996 1997 1998 1999 2000 2001 2002 f200360
80
100
120
140
160
180
200
Central govt. overall balance (left scale)
Central govt. primary balance (left scale)
Gross Public Debt (right scale)
Source: Ministry of Finance, IMF
Chart 35: Lebanon - Fiscal developmentsin % of GDP
in % of GDP
The 2003 budget showed further commitment towards fiscal consolidation through a combination of revenue raising measures (new withholding tax on interest, and better VAT and income tax collection) and some cuts to primary expenditures (particularly for capital projects). The fiscal performance up to October 2003 shows total receipts up by broadly 14% compared to the same period the previous year, and an increase in total expenditures of nearly 5%, leading to a 13% fall in the budget deficit for the period January-October 2003. However, although the fiscal deficit is expected have to registered a further fall from the 2002 outturn, perhaps reaching broadly 13% of GDP in 2003 (a primary surplus of around 5.5%), this is still higher than the 12% foreseen earlier in the year, and higher than the commitment of an overall deficit of 8.4% for 2003 at the time of Paris II. This is in part due to the fact that the third pillar of the government’s reform strategy, privatisation, is proceeding more slowly than originally envisaged, meaning interest payments remain high (see section on structural reforms below), but it is also due to higher than anticipated subsidies to the electricity company (EdL), and higher aid to the regions in the first half of the year. On the other hand, personnel costs remained relatively stable. Despite progress made, further efforts in fiscal consolidation are needed to restore fiscal sustainability. Donor support and domestic refinancing operations since Paris II have helped to alleviate the immediate financing constraints, but the success of the strategy in the medium-term depends upon continued fiscal improvement through continuous primary surpluses and the realisation of substantial sums from privatisation and securitisation. The draft 2004 budget implies that the authorities are aiming for a primary surplus of around 4.7% and an overall deficit
149 Lebanese government, “Lebanon: Paris II meeting”, November 23, 2002.
- 94 -

of around 9%. This does not appear to rely on privatisation revenues, significant reforms to taxes or administration that might increase yields, or expenditure measures. This suggests a smaller primary balance than in 2003 and than the one pledged at Paris II (7.4%). Against this background, S&P downgraded its outlook for Lebanon from positive to stable (B-) at the end of 2003. The total stock of gross debt remains very high and has continued to increase in 2003, although at a slower pace, reaching about 180% of GDP at the end of 2003. Based upon Paris II commitments it was expected to have fallen to around 150% of GDP. The debt stock is only expected to fall gradually, even under a scenario of consistent and effective policy performance. Gross financing needs are also likely to remain high at over 50% of GDP over the period 2003-2006. Monetary and exchange rate policy Monetary policy continues to be centred on maintaining the de facto exchange rate peg, which came under pressure in 2001-02. Pegging the exchange rate150 to the US dollar at a rate of 1507.5 Lebanese pounds per dollar has had a positive long-term impact on confidence, and has been effective in reducing the inflation rate to a low level. However, throughout 2001 and most of 2002, credibility of the regime weakened on the back of an unsustainable fiscal position. Pressure on the peg increased, as market participants switched away from pound-denominated assets, resulting in large reserve losses. Against this background, private sector credit growth and the growth of monetary aggregates was weak. Dollarisation (Chart 36) of bank deposits increased, and was on a rising trend since the beginning of 2000, moving from 55% to over 70% by the end of 2002, but has fallen since the Paris II donor meeting indicating higher confidence in the domestic currency.
45
50
55
60
65
70
75
80
85
Jan-93 Jan-94 Jan-95 Jan-96 Jan-97 Jan-98 Jan-99 Jan-00 Jan-01 Jan-02 Jan-03Source: Banque du Liban, DG ECFIN staff calculations
Chart 36: Lebanon - Dollarisation
Foreign currency deposits in % of total deposits
Outbreak of the intifada
Start of the Asian currency crisis
Paris II conference
The Paris II agreement and debt swap deals with the Central Bank and commercial banks, together with improved fiscal performance, eased the pressure on the currency market considerably. Confidence grew in early 2003, with the pound strengthening despite reductions in
150 Monetary policy continues to be conditional to the maintenance of a peg to the US dollar, having ± 6.5% fluctuation band. The central rate has been set at Lebanese Pounds 1.508 to the US dollar since 1999.
- 95 -
interest rates and instability in the region, and trading above the mid-point of its band. Deposits to the banking system also grew rapidly, and by November 2003 interest rates (2-year Treasury Bills) had fallen by about six hundred basis points to 8%. Furthermore, the Central Bank has been able to build reserves, which had reached, on a gross basis excl. gold, USD 12 billion by the end of 2003, compared to a level of USD 5.1 billion at the end of 2002. Dollarisation declined to around 65% (Chart 36). External developments151 Lebanon’s service-based economy and heavy reliance on imports of goods results in large trade deficits, feeding into high current account deficits. These improved somewhat in 2002, when the current account deficit narrowed to broadly 15% of GDP (compared to 21% of GDP in 2001), with the overall surplus on the services, income and transfers accounts of about 15% of GDP. Exports picked up following liberalisation and deregulation measures, bilateral and regional trade agreements, and the depreciation of the real effective exchange rate, while weaker imports reflected the overall subdued economic activity. Tourism revenues were also strong, thanks to government efforts to promote tourism to Arab visitors after September 11th 2001. In 2003, current account developments are likely to have mirrored those of 2002, with an expected deficit of around 15% of GDP. On the trade account, exports have grown rapidly, with an estimated 30% increase for the year, while imports are also expected to grow, though at a slower rate. Data for the first half of the year shows that the trade balance improved by around 4.5 percent compared to the same period in 2002. The depreciation of the US dollar against the euro has contributed to significantly increase exports to the EU during most of 2003 compared to the year before. The structure of the capital and financial accounts has changed in 2002 and 2003 due to the reception of the exceptional Paris II donor financing. External borrowing declined sharply in 2002, mainly due to the fall in non-residents’ purchases of sovereign Eurobonds, as Eurobond spreads increased in line with higher government risk. Weak portfolio flows reflected the difficult economic situation, although these have picked up in 2003 with increased confidence following Paris II. External public sector debt represents broadly 40% of GDP in 2003, with a debt service ratio of 17%. External public debt is equivalent to 25% of gross public debt, while foreign currency debt represents around 48% of the total. With large government financing needs, the balance of payments remains vulnerable to possible capital outflows, which could lead to pressures on the exchange rate. 2. Structural reforms The new government, which came to power at the end of 2000, has adopted a pro-growth strategy, which includes deregulation and liberalisation measures aimed at improving the business environment. These include tariff reductions, an open sky policy, trade facilitation, subsidies to SMEs and actions to speed up progress on the privatisation programme, although this latter has suffered delays.
151 There are large weaknesses in balance of payments data. Exports are likely to be underreported, while service transactions and capital and financial account data reporting is incomplete.
- 96 -

Trade liberalisation The Association Agreement with the EU was signed in May 2002, and an interim agreement covering trade issues entered into force in March 2003. The agreement foresees a gradual reduction in tariffs on industrial goods over 12 years with a five year grace period. In addition, Lebanon has signed several bilateral agreements in the region with Egypt and Syria and, in 2002, a FTA with Iraq. Other agreements signed in 2002, but not yet ratified, include those with Jordan and Croatia. Talks on other trade agreements have recently intensified on several fronts. Negotiations with EFTA (Iceland, Liechtenstein, Norway and Switzerland) aim to gradually establish a free trade area building on existing co-operation. Lebanon has also signed up for the Greater Arab Free Trade Area (GAFTA), although progress has been slow, with most countries facing difficulties in implementing the provisions of the agreement. Finally, Lebanon has been working on the terms for its accession to the WTO, and is currently in the negotiating phase with the possibility of joining in 2004. Lebanon is also interested in the possibility of joining the “Agadir process”, which also aims to promote free trade among southern Mediterranean partners. Fiscal and public administration reform In the context of its debt reduction strategy, the government has been undertaking several measures to increase fiscal revenues. The government introduced a flat rate VAT of 10% in February 2002, which has been very successful. Other measures include the introduction of a 5% tax on interest income and the implementation of the professional tax. On the administrative side, tax collection rates have improved thanks to better assessment and auditing within the Large Taxpayers Unit, as well as the modernisation of certain tax administration systems. The Ministry of Finance is currently pursuing several reform avenues, in particular it is trying to improve revenue collection and expenditure management through the modernisation of IT systems, reforms to budget management and treasury management, and a project examining the rationalisation of social expenditures. On the revenue side, it is making progress on an income tax law and examining ways to simplify and modernise the tax system. On the expenditure side, privatisations are key to improve efficiency and to reduce government payments to loss making state enterprises (for instance to the electricity company). Additional structural reforms are being considered, for example, reforming the civil service, the social security and the public pensions systems, in order to reduce expenditures over the longer term. Privatisation, enterprise reform and business environment The government was not able to achieve its target of USD 5 billion proceeds from privatisation and securitisation in 2003. With most of Paris-II pledges and commercial banks’ contributions already disbursed, the pursuit of the financial recovery is increasingly depending on the success of the privatisation plan. But authorities have not been able so far to formulate any commitment on a comprehensive timetable, and there have been difficulties in announced auctions. Several companies will either be privatised, managed by the private sector, or their revenues securitised. These include the mobile and fixed telecoms companies, the electricity company, the water company, Middle East Airlines, two ports and the tobacco company. Bringing the telecom companies to the market is progressing slowly. The current economic and political environment, as well as the fact that many of these companies are loss making and in need of restructuring, is
- 97 -

likely to limit the sums to be raised from their sale. Although progress has been limited in privatisation, preparations have been continuing. The sale of two mobile phone operating licences was planned for the first quarter of 2003, but the list of qualified participants was only announced in May 2003, and differences of opinion within the government as well as difficulties with the auctions have led to further delays. Fixed line telecom operations were expected to be transferred to a new commercial corporation (Liban-Telecom) in the second half of 2003, once the regulatory agency was operating. The plan for this public corporation is to allow it to operate a mobile telecom licence in addition to fixed line services, and to sell 40% share up front to a strategic investor, with additional sales of shares once a track record has been established. The electricity company (EdL) and the water sector need major restructuring before privatisation. This has already begun with EdL being put under new management, which has improved collection rates, although they still remain very low. The company, however, remains bedevilled by difficulties. Recently, higher costs of fuel supplies early in 2003, due to the war in Iraq, resulted in a need to raise prices, cut supplies or borrow money. Eventually, the Central Bank provided some financing, but the company continues to make losses, making the prospect of a successful privatisation in the near future more unlikely. Financial sector reform The Lebanese financial sector is highly developed compared to other countries in the region, as shown by aggregates such as M2/GDP (78% in 2000) and M1/M2 (5% in 2000). The banking sector is well developed, with over 50 private institutions. It is liquid, well capitalised and well hedged against several sources of risk. The size of the banking sector is an outstanding feature of the Lebanese economy, with deposit money banks assets equivalent to over 250% of GDP, equivalent to the EU average level. Previously identified weaknesses in banking prudential supervision have been remedied through an overhaul of prudential regulation. Tighter controls on money laundering were implemented and, in mid-2002, Lebanon was removed from the Financial Action Task Force (FATF) list of non-cooperating countries However, the weak macro environment weighs heavily on the banking sector. The banking system is highly exposed to government debt, which is a source of weakness. In 2002, bank profitability fell with the reduction of banks’ holdings of T-bills and, in early 2003, in the context of Paris II and government debt restructuring, commercial banks had to subscribe to zero interest government paper. The costs of this operation was offset to some extent by increasing margins and T-bill swap operations in 2002, when the government offered a premium of 2% to ensure refinancing. Non-performing loans are a concern, and they stood at around 30% of total loans in the second quarter of 2003. 3. Relations with the EU and IFIs The EU-Lebanon Association Agreement and the interim agreement on trade issues were signed in June 2002. The Lebanese Parliament ratified the Association Agreement in December 2002, although EU Member States still need to complete their ratification procedures before it enters into force. An interim agreement on trade entered into force in March 2003, whereby tariffs on EU industrial goods imports to Lebanon will be phased out over 12 years, with a 5-year grace period.
- 98 -
Total programmed resources under MEDA, available under the 2002-2004 National Indicative Programme for Lebanon, are tentatively set at EUR 80 million (EUR 25-30 million per annum). The 2003 National Financing Plan represents a financial allocation of EUR 43 million, bringing total MEDA allocations to Lebanon to EUR 237 million. This includes support for the implementation of the Association Agreement, support to private sector SMEs to meet the demands of greater competition, establishment of a standards and certification facility, a programme for rural and social development targeted primarily at the agricultural sector, environmental improvements, higher education, and support for human rights and civil society actions. Following a first tranche of EUR 30 million, a EUR 12.25 million grant from an earlier Structural Adjustment Facility was paid in 2003 based upon progress made in fulfilling the outstanding conditions. In the last five years, the EIB has provided over EUR 100 million in financing for infrastructure projects in Lebanon, as well as for managing risk capital and interest rate subsidy operations, financed through the Community budget. Lebanon has no formal arrangement with the IMF, although Fund surveillance has continued in the context of regular Article IV consultations and the Paris II donor conference. The IMF is actively engaged with the Lebanese authorities to provide advice on dealing with fiscal and other issues. In this respect, an IMF Deputy Managing Director visited Lebanon in December 2003. Technical assistance has also been provided in the financial sector and statistical areas. The World Bank is currently updating its 1997 Country Assistance Strategy (CAS), its key document for analytical work, lending operations and development assistance. The current World Bank strategy is aimed at improving growth performance and the fiscal situation and, more recently, at enhanced poverty focus. The portfolio includes nearly one USD billion in commitments consisting of projects in the areas of emergency reconstruction and rehabilitation; municipal development and infrastructure; and revenue enhancement, among others. 4. Concluding remarks Lebanon’s economic performance has been relatively mixed in recent years. Its growth performance has remained relatively subdued since 2000, while large fiscal deficits and rapidly growing public debt stock have resulted in an unsustainable fiscal position. In order to address the adverse fiscal dynamics, the government adopted a three-pronged strategy in 2002 based on strong fiscal measures, faster privatisation and international support, including the external assistance forthcoming at the Paris II donor conference in November 2002. In 2003, although the fiscal deficit is expected to have registered a further fall to 13% of GDP from the 2002 outturn (14.5% of GDP), it is still higher than the level foreseen earlier in the year, and higher than the commitment at the time of Paris II. This is in part due to the fact that the third pillar of the government’s reform strategy, privatisation, is proceeding more slowly than originally envisaged. Fiscal consolidation in the medium and long term however depends upon continued fiscal improvement, in particular primary surpluses, and the realisation of substantial proceeds from privatisation and securitisation, which the government should pursue further. The government should also reinforce its pro-growth strategy (adopted at the end of 2000), which includes deregulation, and liberalisation measures aimed at improving the business environment. These include tariff reductions, an open sky policy, trade facilitation, subsidies to SMEs and actions to speed up progress on the privatisation programme. As for trade liberalisation, the Association Agreement signed with the EU should help Lebanon to realise its export potential.
- 99 -

LEBANON
Main economic indicatorsprel. proj.
1996 1997 1998 1999 2000 2001 2002 2003Real sector Real GDP growth (% change) 4.0 4.0 3.0 1.0 -0.5 2.0 2.0 2.2 Inflation CPI (period average) 8.9 7.7 4.5 0.2 -0.4 -0.4 1.8 2.1 Unemployment --- --- --- --- --- --- --- --- GDP per capita, in USD 3998 4493 4940 4990 4810 4660 4930 4960
Fiscal Sector Total revenues, % of GDP 17.3 16.4 18.1 19.5 19.2 18.5 22.4 24.8 Total expenditure, % of GDP 37.9 43.8 36.3 35.7 44.2 38.1 36.9 37.8 Central govt. balance, % of GDP -20.6 -27.4 -18.2 -16.2 -25.0 -19.6 -14.5 -13.0 Gross Public Debt, % of GDP 98.9 102.7 113.6 135.2 152.3 169.7 177.8 180.0
Monetary sector Base money, % yoy --- --- -0.1 0.3 -7.0 -7.1 19.6 24.0 Broad money (M3), % yoy 27.8 19.3 16.1 11.1 9.6 7.4 7.6 9.4 Private Sector Credit (% change) 24.8 23.1 20.5 11.6 6.0 -0.4 2.5 6.0 Degree of Monetisation (M3/GDP, %) 143.2 152.5 164.4 180.4 199.4 210.7 218.5 229.7
External sector Current account balance, % of GDP -37.1 -29.4 -27.1 -20.0 -18.7 -20.7 -14.5 -15.1 Trade balance, % of GDP 47.7 42.2 -36.1 -30.7 -31.0 -35.5 -28.6 -28.5 Foreign direct investment flows, % of GDP 19.6 12.1 12.0 8.5 6.3 10.2 13.0 11.0 Import cover (months) 13.6 12.7 13.8 13.1 9.8 6.5 8.0 14.0
External Vulnerability External Public Debt, % of GDP 15.9 18.0 15.7 24.2 29.0 24.4 32.2 43.4 Debt Service Ratio1 4.8 19.0 12.0 11.4 12.7 13.3 12.8 17.2 Gross reserves (excl. gold, USD billions) 9.3 8.6 6.5 7.7 5.9 4.4 5.1 9.5 Reserves/M3 49.3 37.6 34.0 25.9 18.0 12.5 13.5 22.2
Financial sector Short-term interest rate 25.2 20.3 --- 19.5 15.2 13.2 16.6 14.7 Exchange rate (per USD, eop) 1552 1527 1508 1508 1508 1508 1508 1508 Exchange rate (per EUR, eop) 1925 1685 1773 1521 1402 1341 1580 1764 Real effective exchange rate (1992=100) 159.8 190.3 193.2 201.8 211.5 213.9 215.9 208.2
Source: Banque du Liban, Ministry of Finance, IMF, IIF, DRI-Wefa, Eurostat1 in percent of current receipts.
- 100 -
MOROCCO • In 2003, average GDP growth improved to some 5.5% from 3.2% in 2002, mainly as a
consequence of increases in agricultural output, stronger investment activity and sustained private consumption.
• In 2002, the fiscal deficit (excl. grants and privatisation revenues) narrowed to 4.5% of
GDP after fiscal deficits of around 6% in 2000 and 2001. However, the fiscal consolidation process appears to have halted in 2003.
• Morocco recorded another current account surplus in 2003, although declining from its
2002 level (3% of GDP). Excess liquidity resulting from these surpluses has been successfully sterilised by the Central Bank.
• A further round of tariff reductions in the context of the Association Agreement was
implemented in March 2003, exposing for the first time certain domestic goods to competition from EU producers.
1. Macroeconomic developments Real sector developments Economic growth weakened in 2002, predominantly as a consequence of a combination of domestic factors and low external demand in the euro area. GDP growth slowed in 2002 to an estimated 3.2%, compared to 6.5% in 2001 (Chart 37). Agricultural output grew by 5.6% in 2002, but fell short from its 2001 performance, when good climate conditions resulted in an increase of close to 30%. Consequently, its net contribution to GDP growth shrank to 0.8 percentage points, compared to 3.1 percentage points in 2001. Non-agricultural GDP growth decelerated to 2.8% (3.6% in 2001). The service sector improved to around 3.3%, up from 2.2% in 2002, due to robust trade and transport and communication sectors.152 As for the demand side, gross fixed investment was the most dynamic component, augmenting by 6.8% on the back of low interest rates and lively activity in the housing and industrial sectors. Exports declined slightly, as weak external demand was only partly compensated by gains in competitiveness (lower prices for industrial goods) and favourable exchange rate developments. In 2003, economic growth is expected to have expanded by 5.5% (compared to the official forecast of 4.5% in the Finance Law), largely thanks to better than expected agricultural output. Based on indicators for the first eight months, agricultural output expanded by about 20% in 2003, helped by favourable climatic conditions. On the demand side, private consumption capitalised on two consecutive years of gains in agricultural income, higher public servants’ wages (expanding an estimated 5%), and a reduction in the unemployment rate. Positive momentum for investments carried over into 2003, as indicated by the 10% increase in imports of industrial equipment goods in the first part of 2003, bringing a sizeable contribution to growth. Potential downside risks to growth, relating mainly to the uncertain indirect spill-over effects of the terrorist attacks on 16 May 2003 in Casablanca to consumer and investor sentiment, are limited. 152 Institut National d'Analyse de la Conjuncture, "Note de Conjuncture" Rabat, June 2003.
- 101 -

-8
-6
-4
-2
0
2
4
6
8
10
12
14
16
1995 1996 1997 1998 1999 2000 2001 2002 est 2003f
Morocco MED
Chart 37: Morocco - Economic growth
%, yoy
Sources: Direction de la Statistique, IFS
Consumer prices - though increasing to 2.8% in 2002 and exceeding the official government target of 2% - remained broadly under control and in line with past successful macroeconomic stabilisation efforts (Chart 38). The rise in the prices of non-food products and services, which are less sensitive to cyclical fluctuations, actually slowed down to 1.6% in 2002. The annual inflation rate reached a peak in May with an increase of 4.6%, driven mainly by high food prices (erratic climatic conditions) and the increase of items related to leisure and culture, before falling in the second half of 2002. This decline was made possible by an appreciating currency, weakening oil prices, and moderate import price strengthening. Finally, the monetary authorities actively supported price stability by sterilising up excess liquidity throughout 2002, while maintaining an accommodative monetary policy stance.
-10
-5
0
5
10
15
Jan-91 Jan-92 Jan-93 Jan-94 Jan-95 Jan-96 Jan-97 Jan-98 Jan-99 Jan-00 Jan-01 Jan-02 Jan-03
CPI Real effective exchange rate
Chart 38: Morocco - CPI and real exchange rate developments
5% devaluation in April 2001
Source: IFS
% annual change
In 2003, the government has succeeded in maintaining the inflation at its target level of 2%, supported by favourable domestic and international developments. The annual inflation rate declined to -1.3% in May 2003, but increased above the 3% level by September. Improved agricultural production has led to reduced foodstuff prices, which still represent 45% of the CPI basket, while non-food prices displayed a more regular pattern. Furthermore, weak international
- 102 -

demand appears to have contained inflationary pressures also in 2003. Although the partial removal of government fuel and agriculture subsidies in the second half of the year is a source of inflationary pressure, the average inflation rate is expected to remain below 2% in 2003, and below the 3% level in the medium term, based on the assumption that domestic demand shows no signs of overheating in the foreseeable future and assumes no major shift in monetary and fiscal policies. Fiscal policy Fiscal accounts improved significantly in 2002, reflecting a combination of permanent and one-off factors, predominantly on the expenditure side, but the fiscal stance continued to be expansionary. The central government deficit (excl. privatisation receipts) narrowed by 1.2 percentage points to 4.5% of GDP, with about 80% of the improvement stemming from lower expenditures (Chart 39). In particular, current expenditures remained close to their pre-year level due to a much smaller than forecasted increase in public sector wages costs. The wage bill declined slightly from 12.5% of GDP in 2001 to 12.1% of GDP. Moreover, food subsidies were lowered, and external debt service costs declined. On the revenue side, almost all tax revenues categories performed better than stipulated in the budget law, despite relatively sluggish domestic demand. This holds true particularly for direct transfers from the Central Bank, Maroc Telecom and the Caisse de Dépôt et de Gestion. Customs duties registered a slight decrease (about 1%) with the implementation of tariff reductions in the framework of the Association Agreement and the slow down of goods’ imports.
-11
-9
-7
-5
-3
-1
1
3
5
1998/99 1999/00 H2 2000 2000 2001 2002 2003
Consolidated deficit
Consolidated deficit, incl. grants and privat. receipts
Primary balance
Chart 39: Morocco - Fiscal developments
Source: IMF, Moroccon Ministry of Finance
in % of GDP
Authorities estimates
However, Morocco's fiscal consolidation process seems to have halted in 2003, despite being one of the most pressing macroeconomic challenges. Although the initial fiscal deficit (excl. privatisation receipts) of 6.5% was revised downwards to 4.8% of GDP after the revision of revenue forecasts for 2003 and the decision to freeze public employment in net terms, the current fiscal deficit is expected to be higher than the 2002 fiscal outcome. Over the 10 first months of 2003, although revenues increased by 5%, expenditure growth reached 9.1% (2002: -1.4%), mainly caused by salary increases. The IMF has called for further spending cuts - particularly lower consumption subsidies and reduced allocation for contingency spending - in order to
- 103 -

maintain fiscal consolidation on course. However, the deficit for 2003 (excl. privatisation revenues) is expected to have remained above last year's level, due to the salary increase negotiated in the context of the social dialogue and to additional expenditures associated with the terrorist attacks in May. High privatisation revenues might also have contributed to lifting the perceived urgency for fiscal discipline. Financing of the fiscal deficit has been primarily conducted on the domestic debt market. Payment arrears to finance the deficit played a role only in the first half of 2002. Monetary and exchange rate policy In 2002, the authorities maintained their accommodative monetary policy stance, though being vigilant against inflationary risks. In March 2002, the Central Bank further eased monetary conditions by reducing its two repo rates by additional 50 basis points, bringing the weekly repo down to 3.75% and the five-day repo to 4.75%. As remittances from abroad still resulted in a structural liquidity surplus throughout the year, the Bank Al-Maghrib regulated the money market chiefly by liquidity-withdrawal operations.153 In order to freeze such surpluses, the Central Bank decided, in December 2002, to raise the monetary reserve ratio from 10% to 14%. However, by coupling this measure with the lowering of the key rates, authorities signalled that they considered stimulating non-agricultural growth and tackling downside risks for the real economy as an important policy goal next to price stability. In 2003, no major changes have occurred with regard to monetary policy, which has remained accommodative throughout the year. The Central Bank 7.5-8.5% target growth rate of M1 seems reachable, given weaker-than-expected tourism receipts and workers’ remittances. The monetary reserve ratio was raised further to 16.5% in September to withdraw liquidity resulting, in particular, from the foreign exchange inflow following the privatisation of the Tobacco company “Régie des Tabacs”. Indeed, after being outside of the 7.5-8.5% corridor for the first five months of 2003, the annual M1 growth rate declined continuously since March 2003 to a level of 7% in November 2003. This corridor, the potentially higher than official forecasted real GDP growth rate, and an official inflation target of 2.5%, reflect a relatively neutral monetary policy stance. While short term-interest rates have bottomed out in early 2003, long-term interest rates (government bond yields and lending rates) have continued to decline by around 50 - 100 basis points over the second half of the year. Morocco maintains its policy of pegging the dirham to an undisclosed basket of euro and US dollar.154 However, discussions on a higher degree of flexibility have continued, nurtured by the growing integration of Morocco into the world economy (liberalising capital and financial account flows). An important consideration in this context is that a higher degree of exchange rate flexibility allows for more effective monetary policy actions, while better deterring speculative and volatile short-term capital movements. The IMF also pointed out that a flexible exchange rate would allow compensating for short-term competitiveness losses due to trade liberalisation, as productivity increases would likely materialise only in the medium term.155
153 Measures included the maintenance of 10% of banks' liabilities at the Central Bank, the non-allocation of funds during repurchase auctions for more than seven months, and the partial transfer of privatisation revenues to the HASSAN II Fund for Economic and Social Development. 154 Results of a number of empirical estimations point to the euro as the dominant currency (weight of 75-77% since April 2001), gaining by 20% since 2002, while the USD accounts for 23-25%. 155 IMF, "Morocco: Staff Report for the 2003 Article IV Consultation", Washington, April 2003.
- 104 -
External sector developments In 2002, the current account recorded another surplus of around 2.9% of GDP, declining from its 2001 level of close to 5% of GDP. The surplus of the service balance diminished by around 25% compared to 2001, as tourism revenues and other non-factor service were impacted negatively by the September 11th events. Furthermore, transfers from non-residents declined in 2002, dropping by around 5%, as the exceptional impact of the introduction of euro banknotes and coins faded, and EU growth remained sluggish. In contrast, the trade deficit improved to 8% of GDP from 8.9% of GDP in 2002. Nominal imports increased by 2.5%, being held down by weak domestic demand, lower agricultural imports and lower oil prices. At the same time, nominal exports increased by 5.3%, favoured by a real depreciation and by an increase in external demand for intermediary and equipment goods. In 2002, the capital and financial account situation normalised, as FDI flows subsided substantially. FDI flows declined to 0.8% of GDP, down from 5.9% of GDP in 2001, when the partial privatisation of Maroc Telecom triggered exceptional inflows of USD 2.1 billion. Other investments emerged again as the most important financing component of the capital and financial account, while the medium and long-term public loan component continued to be characterised by outflows. These outflows resulted from Morocco's strategy of shifting from external debt to domestic debt. Indeed, external central government debt decreased by around 6 percentage points to 22.7% of GDP, while domestic debt rose by 2 percentage points to close to 48% of GDP. Finally, thanks to surpluses of both the capital and financial account and the current account, official foreign currency reserves increased to USD 10.1 billion at the end of 2002 (2001: USD 4.8 billion) and raised the coverage of imports to 8.5 months (7.6 months at the end of 2001). In 2003, the current account surplus has shrunk further to below 2% of GDP, owing to a widening trade deficit and remote service related inflows. Latest data indicate that weak EU demand dampened exports from Morocco, and that the depreciation effect (against the USD) has run out of steam. Nominal exports dropped by 5.3% in the first 11 months of 2003, particularly of foodstuff, raw minerals and energy products. The latter plunged by 66%, caused by lower refined petroleum products following the fire at the Samir refinery. Import growth, at 1.9%, was mostly held up by investment-related imports of equipment, energy products, and semi-finished products. Consequently, the trade deficit rose by 16.2% in the first 11 months of 2003, around 10% of GDP. Despite the Iraq crisis and the May suicide bombings, tourism receipts rose 1.4% in the first half of 2003. Travel revenues declined only 0.3% over the first 11 months of 2003 compared to the same period in 2002, leading to a moderate reduction in the surplus on the service balance. Transfers from Moroccan residents abroad rose 6.4 % over last year up to November, reaching the equivalent EUR 3 billions. In 2003, the capital and financial account was - as in 2001 - characterised by large FDI inflows. The selling of an 80% stake in the tobacco company "Regie des Tabacs" has resulted in FDI inflows of EUR 1.3 billion in the first quarter of the year, exceeding the expectations of the government and the IMF, and making it the most important financing component of the capital and financial account. Morocco's EUR 400 million five-year Eurobond (launched in June) is earmarked for repaying some of its multilateral loans carrying a high interest. Taking into account this repayment strategy, as well as economic factors, Moody's improved in June 2003 the outlook on Morocco’s long-term sovereign risk rating to stable (Ba1, one notch below
- 105 -

investment grade).156 Overall, however, transactions in the capital and financial account remain at a rather low level in absolute terms, as a consequence of significant restrictions on many forms of financial flows. 2. Structural reforms Trade liberalisation Tariff reductions in the context of the EU Association Agreement remain on the Moroccan agenda. After a gradual reduction of import duties, trade in raw materials and goods and equipments not produced locally has been fully liberalised in 2003. Most noteworthy, a reduction in custom duties of around 10% on EU goods that compete with domestic goods was implemented in March 2003. This step is in line with the objective to reach free trade in this product category, except non-agricultural goods, by reducing custom duties by 10% per year. In addition, authorities have eliminated the use of reference prices, as recommended by the WTO. Negotiations for a free trade agreement (FTA) between Morocco and the USA are advancing, and were expected to be completed by end-2003. FTA negotiations are being conducted in twelve working groups, including agriculture. The fourth round of FTA negotiations between the USA and Morocco took place in July 2003 in Washington. To date, Morocco exports goods worth around EUR 430 million (5.7% of total exports) to the USA, while it imports EUR 570 million (5.7% of total imports). Currently, US products entering Morocco face an average tariff of over 20 %, while Moroccan products are subject to an average tariff of 4% as they enter the USA.157 Upon the successful completion of the negotiations, Morocco would become the second Arab country to have a FTA with the US, the first one being Jordan. The WTO sees further scope for liberalisation, in particular in the service sector, and related welfare gains for Morocco.158 A report published in June 2003 states that, by expanding its multilateral commitments to the services sector (60 % of GDP), Morocco could reinforce the predictability of its trade regime, make its economy more attractive for foreign capital, and consolidate reforms in areas such as tourism and others in which the country has comparative advantages. The report also mentions that liberalisation of the agricultural sector and simplification of customs tariffs would improve economic efficiency and enhance Morocco’s adherence to the WTO principles. Such reforms could include the abolition of variable custom duties and a reduction in the number and levels of tariff rates. Fiscal and public administration reform In 2002, indirect taxes, mainly VAT, declined in relative importance, reflecting both the impact of trade liberalisation and an increased number of exemptions. For example, several new VAT exemptions and special treatments for specific sectors were introduced: a) the exemption of international transport and related services of VAT; b) the deductibility of VAT on diesel fuel for public transport companies and enterprises providing their own transport services; c) reduced VAT rates for pharmaceutical products, their production inputs, and their packaging material. In
156 www.moodys.com 157 www.menareport.com. 158 WTO Secretariat, "Report on the trade policies and practices of Morocco", June 2003, Geneva. This report, along with the policy statement by the Moroccan Government, served as a basis for the third Trade Policy Review (TPR) of Morocco by the Trade Policy Review Body (WTO) from June 16-18.
- 106 -

the context of the EU cooperation with Morocco, a program support for a fiscal reform will be designed in the course of the next two to three years. The new government has sent some encouraging signs in the area of public administration reform, as indicated by recent measures. Growth in the wage bill already slowed significantly in 2002, reaching 1.3% after a 14.2% jump in the previous year, and decreasing the public sector wage bill (from 12.5% of GDP in 2001 to 12.1% of GDP in 2002). However, latest data indicate a level of about 12.5% of GDP for 2003. The objective was to reduce its level by about 2% points of GDP in the medium term to 10.9% by 2007.159 Moreover, the government has decided to limit new hires in 2003 to replacement only (no creation in net terms), and to alter promotion and compensation policies. However, the measures resulting from the social dialogue are expected to be phased in over the coming three to four years. In order to contribute to the wage bill stabilisation in the medium term, the government recently proposed an early retirement scheme for 60,000 public sector employees on a voluntary basis during 2004-06, with 20,000 targeted in the first phase (2004). The first phase is estimated to reduce somewhat the public sector wage bill share in GDP, but will cause the budget deficit to rise to a small extent. A net positive impact of the early retirement scheme is expected in the medium term. Otherwise, contingent liabilities outside the budget remain high, notably related to non-performing public banks and public enterprises, as well as the retirement system. The Government has undertaken a reform of the administration covering two major components, the budget system and the human resource management in the context of the “deconcentration” framework. The full fledge reform should be implemented over a three to four years period with the support of the World Bank and the EU. These changes are expected to help rationalize public expenditures and achieve a higher degree of accountability of the administration, more efficiency at the regional level and lower costs. The reform of the human resource management aims at putting in place a performance based system. In addition, within the framework of the modernisation of public administrative management, and in parallel with the adoption of the budget laws since 2002, new budgetary measures have been introduced progressively in order to streamline deconcentrated administrated public services. Privatisation, enterprise restructuring and business environment The government's privatisation efforts have stepped up momentum since the beginning of 2003. After low privatisation activities in 2002, an 80% stake in the tobacco company Regie des Tabacs was sold for EUR 1.3 billion in the first quarter of 2003, exceeding the targeted privatisation receipts for the whole year. The European company Altadis acquired the 80% stake, offering twice the minimum price asked by the Finance and Privatisation Ministry, and 40% more than the second best offer, made by British American Tobacco. Moreover, Renault acquired an additional 26% stake in car assembler Somaca by the end of September 2003, to be followed by an additional 12% stake in October 2005 (totalling EUR 8.7 million). Other privatisation projects refer to the sale of another 15% of Maroc Telecom, 90% of the sugar firms (Surac, Sunabel), 20% of Banque Centrale Populaire and a printing plant (Sonir). Morocco has renewed its efforts to upgrade the overall business environment in 2003. The authorities have taken some steps to create a level-playing field and to remove obstacles to the creation of new enterprises. These comprise measures to implement the competition law and the 159 However, the government appears no longer to stick to a more reasonable 10% of GDP target as announced in its 2002-04 Plan.
- 107 -
establishment of one-stop investment windows at the regional level. Furthermore, a working group comprising representatives of the enterprise sector and government authorities has been established, and its proposals to enhance the competitiveness of the economy have been partly taken up in the 2004 budget law. These measures complement steps already taken in 2002 - the launch of the new decentralised investment scheme and the opening of regional investment centres - in order to attract foreign direct investments. Legal insecurity and a weak regulatory environment still remain serious obstacles for market access and the business environment in general. The regulation on public service concessions is not yet ready, although a draft decree is in preparation. An inter-ministerial subcommittee has been working on the subject since 1998, but differences of opinion between the concerned ministers appear to slow down progress. Moreover, the decrees with regard to the application of the law protecting industrial property have not been adopted so far, consequently rendering this bill inapplicable. In addition to that, the land property regime has not been consolidated, and continues to constitute a major barrier for investors. The project of creating a "land agency", often put forward by the Moroccan authorities, has not been filled up with live, although a transfer of competencies in this area is foreseen and could constitute a sensible progress. Finally, the Competition Council, established in 2001, has not started operating so far. Financial sector reforms The legal and regulatory framework of the financial sector continues being adapted to current international standards. The new banking law is now in the Parliament, reflecting the determination of the authorities to modernise the sector. Moreover, the status of the Central Bank has also been transmitted to the Parliament in 2003 and aims at increasing its independence and strengthening its supervisory role. Other texts already transmitted to the Parliament concern the strengthening of the supervisory body of the financial market (“le Conseil déontologique en valeur mobilières”) and the reinforcement of the supervision of collective placement schemes (“Organisme de Placement Collectif en Valeur Mobilières”). Regarding the banking sector, public specialized banks still represent the most vulnerable segment of the sector in 2003, with very large non-performing portfolios and relatively low compliance with banking prudential regulations and provisions. The situation seems to be the result of weak governance and a lack of adequate action by the authorities, which have not taken strong and timely measures to halt the deterioration until recently. In the second half of 2003, the problem has been addressed, but urgent measures are still pending. The situation in this area is much sounder in the private banking segment, although there is a slight deterioration in the portfolios of commercial banks, which could be attributed to stricter prudential regulation and the overall weak economic situation. Otherwise, the configuration of the banking sector is changing, encouraged by the Central Bank, with a major merger initiated (at the end of 2003) between two large private banks (BCM160 and Wafabank). The new group will take the first place in terms of credit and the second in terms of deposits. Labour market reforms Major progress is noted with regard to labour market reforms, as the parliament has adopted the long-awaited labour code (published in December 2003, scheduled to come into effect in 2004).
160 Banque commerciale du Maroc.
- 108 -
The new labour code reflects international standard and practices of modern economies. It respects also the international conventions regarding the protection of children, women, handicapped people, workers and unions’ rights, with the details of labour strike rights yet to be spelled out. The various decrees for the application of the code are now under review by the Unions, and should be finalized during the course of 2004 to make the code effective. An intensive communication and assistance program will have to be carried out to insure an efficient implementation of the new code. Major progresses has been achieved in this new code. These improvements refer to a clear definition of the rights and obligations of employers and employees, a better definition of the role and responsibility of the state (focussing on regulation and the legal enforcement) and a strengthening of the role and participation of employees. Furthermore, unions in the enterprise (of over 50 employees) as well as “collective conventions”, strengthening the dialogue between the representatives of unions, the employees and the employers, are institutionalised. Labour market flexibility appears to have increased with the new Labour Code, while measures are foreseen to alleviate social pressures stemming from dismissing workers. Firing rules (or other disciplinary measures) have been made clearer and more balanced. The right of defence of the employee has been introduced with the participation of the employee or a Union’s representative, in accordance with the ILO conventions. Indemnities for abusive firing (or other disciplinary measures) are expected to be regulated through a predefined scale to insure predictability in the sanctions. In case conciliation could not be reached with the labour inspector, a judicial procedure is foreseen. Indemnities for economic dismissal remain, and will be managed by the national social security organization. Moreover, the code institutes the creation of a “guaranty fund” dedicated to the indemnities for job loss for economic reasons. Finally, the code legalizes also the existence of private temporary employment agencies. 3. Relations with the EU and IFIs The Euro-Mediterranean Association Agreement with Morocco was signed in February 1996, and entered into force in March 2000.161 All provisions regarding the tariff dismantling side are being enforced. Starting from March 2003, a number of basic industrial goods originating in the European Community are allowed entry into Morocco free of customs duties, while dismantling for all the other industrial goods has started by a 10 % reduction. An agreement for additional reciprocal concessions in the agricultural sector between Morocco and the European Community has entered into force on 1 January 2004. In the recent past, Morocco continued to be an important beneficiary of EC aid programmes, including structural adjustment facilities (SAF). Since end-1995 a total of EUR 917 million has been engaged in favour of Morocco, of which EUR 342 million have been devoted to SAF operations. While one SAF operation has already been completed under the MEDA I regulation four other sectoral SAFs were being implemented at the end of 2003. Current SAF operations target reforms in the financial sector (EUR 52 million, EUR 25 million disbursed at the end of 2001), the health insurance system (EUR 50 million, EUR 25 million disbursed end 2002), water management (EUR 120 million, EUR 59.7 million disbursed end 2002), and the transport sector (EUR 96 million, starting end 2003). One additional SAF operations was under preparation, focussing on public administration reform (2004, EUR 79 million).
161 http://europa.eu.int/comm/external_relations/morocco/intro/index.htm
- 109 -
In the last five years, the EIB provided around EUR 950 million in financing for infrastructure projects in Morocco (close to EUR 200 in 2003), as well as managing risk capital and interest rate subsidy operations financed through the Community budget. There is currently no IMF programme for Morocco in place, and the last programmes (three stand-by arrangements) date back to the beginning of the 1990's. The World Bank Group’s co-operation strategy in Morocco focuses especially on actions aimed at reducing poverty, inequality and exclusion, with an increased emphasis on capacity building and institutional reform.162 As of December 2003, the World Bank portfolio in Morocco consists of 19 active projects (USD 437 million), including the following projects: Health financing and management project (USD 66 million), railway restructuring project (USD 85 million) and a basic education project (USD 54 million). The preparation for a public administration reform loan project (USD 1 billion) and an educational reform project (USD 50 million) are under way.
4. Concluding remarks Morocco achieved macroeconomic stability in the 1990’s, lowering substantially fiscal deficits and the inflation rate. Progress with structural reforms in recent years includes, among others, the modernisation of the customs administration, the privatisation of public enterprises, telecommunications reform, and trade liberalisation in accordance with the Association Agreement with the EU. However, Morocco’s growth performance has been disappointing over the last decade and, therefore, the economy could not alleviate pressures stemming from the rapidly growing labour force, resulting in persistent high unemployment and stagnant income levels. Economic growth, and in particular private sector activity, still appears to be restrained by a combination of different structural barriers, such as relatively high regulatory burden for new and existing enterprises, a weak enforcement of basic legal regulation and a strong degree of concentration in most sectors. Furthermore, various forms of government interventions and market distortions, as well as a lack of access to financial funds, impede higher output rates. As regards macroeconomic policy, a tightening of fiscal policy, in the context of a medium-term strategy, is of utmost priority.
162 Source: World Bank's Internet site: http://www.worldbank.org/html/extdr/regions.htm#m
- 110 -

MOROCCO
Main economic indicatorsprel. for.
1996 1997 1998 1999 2000 2001 2002 2003Real sector Real GDP growth (% yoy, avg) 12.2 -2.2 6.8 -0.7 2.4 6.5 3.2 5.5 Inflation CPI avg, % yoy 3.0 1.0 2.8 0.7 1.9 0.6 2.8 2.0 Unemployment rate, % yoy 18.1 16.0 15.0 13.9 13.7 12.5 11.6 11.1 GDP per capita, in USD 1365 1224 1289 1248 1217 1215 1300 1530
Fiscal Sector Total revenues1, % of GDP 24.6 25.4 27.2 26.9 26.2 24.9 24.0 23.2 Total expenditure2, % of GDP --- --- 29.8 31.4 32.4 31.1 29.1 28.0 Consol. budget balance3, % of GDP -3.4 -3.4 -2.6 -4.5 -6.4 -5.7 -4.5 -4.8 Domestic debt4, % of GDP --- --- 38.1 41.3 42.2 45.9 47.9 49.4
Monetary sector Money (M1), % yoy --- 7.7 6.7 11.5 8.2 15.9 9.0 8.0 Broad money (M3), % yoy --- 9.2 6.0 10.2 8.4 14.1 6.4 6.2 Credit to the private sector, % of GDP 31.2 48.1 50.0 54.2 58.7 54.5 52.9 52.8 Degree of Monetisation (M3/GDP) 66.2 72.6 71.2 78.1 82.7 87.2 86.8 86.6
External sector Current account balance, % of GDP 0.1 -0.3 -0.4 -0.5 -1.4 4.8 2.9 1.8 Trade balance, % of GDP -6.0 -5.6 -6.5 -6.9 -9.7 -8.9 -8.0 -10.0 Foreign direct investment flows, % of GDP 0.1 0.0 0.0 0.0 -0.1 5.9 0.8 3.0 Import cover (months) 3.7 4.0 4.2 5.2 4.2 7.6 8.5 7.5
External Vulnerability External Debt, % of GDP 59.7 60.4 57.3 54.4 53.9 46.9 43.7 36.1 Debt-to-Export Ratio 317.9 286.9 287.3 255.6 241.9 222.6 180.6 124.4 Debt Service Ratio5 34.1 32.5 29.7 27.6 24.0 23.8 23.0 --- Reserves/M3 15.8 16.8 16.8 21.3 17.5 29.3 22.7 16.9
Financial sector Short-term interest rate6 8.42 7.89 6.3 5.64 5.41 4.44 2.99 3.50 Exchange rate (per USD, eop) 8.80 9.71 9.26 10.09 10.62 11.56 10.17 9.8 Exchange rate (per EUR, eop) 11.03 10.73 10.80 10.13 9.88 10.19 10.66 10.75 Real effective exchange rate (1995=100) 100.8 101.7 104.2 105.2 108.2 103.7 103.4 ---
Source: Morocco Ministry for Economic Development, Central Bank of Morocco, Eurostat, IMF, IIF, DRI-Wefa1 Excluding GSM license receipts in 1999/2000.2 Total expenditure and net lending.3 Consolidated government balance excluding grants and privatisation receipts.4 Domestic public debt.5 Total debt service in % of exports goods, services & income.6 Data refer to the average money market rate.
- 111 -
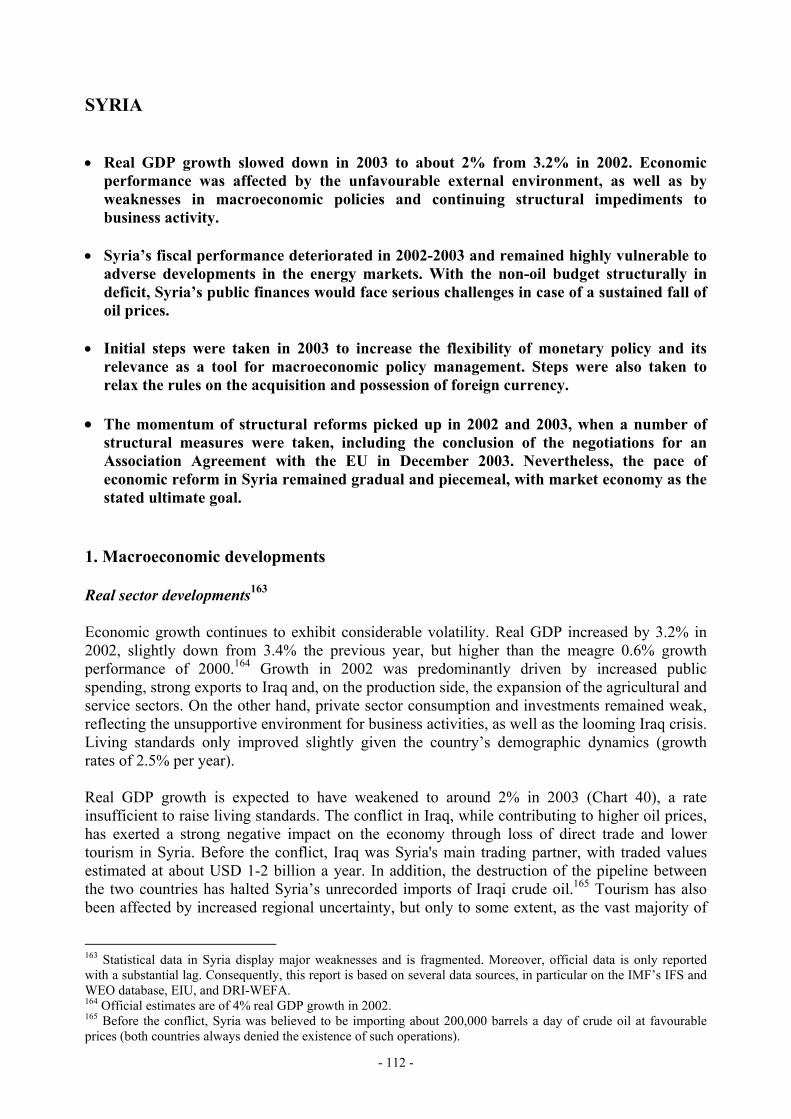
SYRIA • Real GDP growth slowed down in 2003 to about 2% from 3.2% in 2002. Economic
performance was affected by the unfavourable external environment, as well as by weaknesses in macroeconomic policies and continuing structural impediments to business activity.
• Syria’s fiscal performance deteriorated in 2002-2003 and remained highly vulnerable to
adverse developments in the energy markets. With the non-oil budget structurally in deficit, Syria’s public finances would face serious challenges in case of a sustained fall of oil prices.
• Initial steps were taken in 2003 to increase the flexibility of monetary policy and its
relevance as a tool for macroeconomic policy management. Steps were also taken to relax the rules on the acquisition and possession of foreign currency.
• The momentum of structural reforms picked up in 2002 and 2003, when a number of
structural measures were taken, including the conclusion of the negotiations for an Association Agreement with the EU in December 2003. Nevertheless, the pace of economic reform in Syria remained gradual and piecemeal, with market economy as the stated ultimate goal.
1. Macroeconomic developments Real sector developments163 Economic growth continues to exhibit considerable volatility. Real GDP increased by 3.2% in 2002, slightly down from 3.4% the previous year, but higher than the meagre 0.6% growth performance of 2000.164 Growth in 2002 was predominantly driven by increased public spending, strong exports to Iraq and, on the production side, the expansion of the agricultural and service sectors. On the other hand, private sector consumption and investments remained weak, reflecting the unsupportive environment for business activities, as well as the looming Iraq crisis. Living standards only improved slightly given the country’s demographic dynamics (growth rates of 2.5% per year). Real GDP growth is expected to have weakened to around 2% in 2003 (Chart 40), a rate insufficient to raise living standards. The conflict in Iraq, while contributing to higher oil prices, has exerted a strong negative impact on the economy through loss of direct trade and lower tourism in Syria. Before the conflict, Iraq was Syria's main trading partner, with traded values estimated at about USD 1-2 billion a year. In addition, the destruction of the pipeline between the two countries has halted Syria’s unrecorded imports of Iraqi crude oil.165 Tourism has also been affected by increased regional uncertainty, but only to some extent, as the vast majority of
163 Statistical data in Syria display major weaknesses and is fragmented. Moreover, official data is only reported with a substantial lag. Consequently, this report is based on several data sources, in particular on the IMF’s IFS and WEO database, EIU, and DRI-WEFA. 164 Official estimates are of 4% real GDP growth in 2002. 165 Before the conflict, Syria was believed to be importing about 200,000 barrels a day of crude oil at favourable prices (both countries always denied the existence of such operations).
- 112 -

tourists to Syria come from neighbouring countries. A significant rise in government current expenditures, the favourable agricultural season and higher oil prices were the main drivers of growth in 2003, and have contributed to maintaining it into positive territory.
Chart 40: Syria - Real GDP growth and inflation
-6
-4
-2
0
2
4
6
8
10
12
1996 1997 1998 1999 2000 2001 2002 2003real
GD
P gr
owth
% c
hang
e
-6
-4
-2
0
2
4
6
8
10
CPI
% c
hang
e
CPI inflationReal GDP growth
Source: IMF, national authorities
Price increases have tended to mirror economic performance. After a modest increase in 2002, the CPI witnessed some rise in 2003 owing to higher public expenditures and some progress with the liberalisation of exchange rate controls in late 2002. This, however, has been mitigated by weak domestic demand, large food stocks and continuous subsidies of key consumption items (such as bread and sugar). Overall, the average inflation rate is expected to rise by over 3.5% in 2003, compared to 1% in 2002. Labour market conditions remain difficult. Official figures for unemployment are in the order of 15% of the labour force in 2003, but local sources suggest that actual unemployment might be higher at about 22%. In 2000, a United Nations report estimated that 29% of workers aged 15 to 24 was unemployed. Additional pressures to the labour market come from the rapid growth of the labour force (4-4.5% per year). The structure of employment reveals a number of weaknesses in the allocation of resources in the economy and productivity performance: about 12% of the workforce was employed in manufacturing in 2001, which contributed to only 2% of GDP, compared to 30% from the oil sector. Agriculture employed about 30% of the workforce and generated 28% of GDP, while over 20% of the workforce was employed in the government. Fiscal policy Syria’s fiscal deficits have widened in recent years, although by less than what originally expected, owing to the compression of capital expenditures. The consolidated fiscal deficit is expected to have widened to about 3% GDP in 2002, compared to a 1.8% surplus the previous year. This figure includes large losses of the Price Stabilisation Fund (PSF), which administers consumption subsides (see below), and whose operating deficit is estimated at 1% of GDP. The widening of the deficit excluding the PSF in 2002 was mainly the result of lower oil-related proceeds associated with lower produced quantities and despite higher oil prices, a 40% rise in wage expenditures, and a 25% increase in capital expenditures. At 14% of GDP, capital
- 113 -
expenditures accounted for around half of the expenditures, but were lower than the 18% of GDP level foreseen in the original 2002 budget. The fiscal position is estimated to have worsened further in 2003 on account of domestic and external developments (Chart 41). While formally the budget should be in balance (which is standard practice in Syria as loans are included in revenues), the actual 2003 consolidated budget deficit seems to have widened to over 4% of GDP due to higher public expenditures, and despite high oil-related proceeds. In particular, current expenditures are estimated to have risen in 2003 on account of higher spending on wages and salaries, defence, transfers and debt interest rate payments. Although lower than budgeted, actual capital expenditures are again expected to account for about 14% of GDP and 50% of expenditures, with projects focusing on the social, infrastructure and agricultural sectors.
Chart 41: Syria - Fiscal and oil price development
-5
-4
-3
-2
-1
0
1
2
31996 1997 1998 1999 2000 2001 2002 2003
cons
olid
ated
def
icit
% G
DP
0
5
10
15
20
25
30
oil e
xpor
t pric
e (U
SD b
arre
ll)
Consol. budget balance, incl. PSF, % of GDP
oil prices
Source: IMF, own calculations
Syria’s fiscal position remains highly vulnerable to adverse developments in the energy markets. A large share of Syria’s government revenues derive from hydrocarbon production (about 40-50% of total budget revenues in 2002/03). When excluding revenues from hydrocarbons, Syria's deficit is estimated at 15% of GDP in 2002. In 2002 and 2003, the authorities appear to have matched favourable oil prices by raising expenditures, with the effect of increasing the vulnerability to a sustained fall of oil prices. The domestic banking system would not be in the position to finance large fiscal deficits without consequences on the level of prices and the exchange rate. On the other hand, high and increasing foreign exchange reserves may provide some cushion in the future in case of a drop in oil prices. Monetary and exchange rate policy Initial steps have been taken to increase the flexibility of monetary policy and its relevance as a tool for macroeconomic policy management, but the impact on the real sector is expected to be limited. In May 2003, the Credit and Monetary Council lowered interest rates on deposits and lending applied by state-owned banks by 1 and 1.5 percentage points, respectively. Additional interest rates reductions on deposits were introduced in January 2004. The modification of interest rates, which had been fixed for the previous 22 years, has been presented as a first step in
- 114 -
giving interest rates a more prominent role in monetary policy making.166 In the absence of an effective monetary policy, allocation of credit has been managed centrally through an annual credit plan, and fiscal policy has been the main determinant of monetary supply and exchange rate developments. Given the predominance of the public sector both in banking and in the market for credit, the recent changes are likely to have only a very limited effect on business investment decisions, which remain constrained by a difficult operating environment. Additional interest rate cuts are expected over the next years. The exchange rate system is being liberalised progressively, but the Syrian pound (SYP) is not yet convertible. In June 2002, the authorities announced the unification, at the "neighbouring countries rate" of SYP 46.00-46.50 per USD, of the three exchange rates for custom valuation, used for calculating customs tariffs and customs fees. They also reduced the surrender requirement (from 25% to 10% of export revenues), and introduced a new official rate for non-commercial transactions whose movements are tied to the free market. In January 2004, the exchange rate used for budget calculations was unified with the one used for other public sector operations, which was at the same time devalued from SYP 46.5 to SYP 48.5 per USD. More flexibility was also introduced in the fixation of the private sector “free” exchange rate quoted by the Commercial Bank of Syria. Despite continuous progress with simplification, several exchange rates continue to co-exist, with currency trading taking place on separate markets.167 Most private foreign exchange transactions still occur on the parallel unofficial markets of Lebanon and Jordan, fed by Syrian workers’ remittances, tourism and private sector exports. The black market rate remained remarkably stable during 2002 and 2003, staying most of the time at a level of 52.5 - 53.0 SYP per USD. In recent years, a number of steps have been taken to relax the rules on the acquisition and possession of foreign currency. In 2002, the government legalised the opening of foreign currency accounts and the conduct of foreign currency transfers. Since 2002, the Commercial Bank of Syria is also authorised to sell limited amounts of foreign currency for specific non-commercial purposes (such as medical treatment abroad and travel). The Commercial Bank was also charged with setting the exchange rate based on the “neighbouring country” rates for the Syrian pound. In July 2003, the sanctions for infringements of foreign exchange regulations (concerning foreign exchange rate and capital exports) were reduced from a prison sentence to an administrative fine. Although the possession and exchange of foreign currency remains heavily restricted, this measure has had a positive psychological effect. The authorities have announced that their final aim is to unify the exchange rate, whenever conditions allow it. The complex exchange rate system is a major constraint on business sector activity. However, the authorities are concerned about the potentially substantial currency depreciation to which the unification of the exchange rate could lead, and insist that the private sector should balance its import and export operations prior to unification, which may delay indefinitely this measure. Syria’s fears occur against a background of relatively high foreign reserves (USD 4 billion at the end of 2002, 22% of GDP and 8 months of imports) although the Central Bank of Syria has not intervened in foreign currency markets for over a decade.
166 It is unclear whether these revised fixed rates will also apply to private banks, which are expected to enter the market shortly for the first time, or whether they will have more flexibility in setting rates. 167 As of early 2004 an official rate for public sector imports and exports (SYP 48.5/USD) and an official floating rate applying to most private sector “free” imports and the “export proceeds” market (at around SYP 51-52/USD). In addition, a rate of 11-12 SYP/USD is applied to certain administrative transactions, and the calculation of the value of certain foreign debts, and a rate of about 57 SYP/USD is used on the export market (which should finance the import of certain goods).
- 115 -
External sector developments Syria’s external balance deteriorated in 2003, but remains strong, mainly thanks to oil exports. The interruption of trade with Iraq, including in oil, has put some pressure on the trade balance, mitigated however by higher oil prices and lower imports compared to 2002.168 In 2003 the trade balance is expected to post a large surplus of about 7% of GDP, considerably lower than the one of the previous year (11% of GDP). The service balance is also projected to have deteriorated, partly due to lower tourism flows. As a result, the surplus on the current account should have narrowed in 2003 to some 3.9% of GDP from 7% of GDP in 2002. Foreign direct investment remains at a very low level, at about USD 200 million both in 2002 and 2003. The oil sector has been the main recipient of foreign capital. The slow pace of reforms and the unfavourable business environment, aggravated by Syria's multiple exchange rate system, continue to discourage more significant inflows, including from the substantial Syrian funds thought to be outside the country. At the end of 2002, FDI stocks were about USD 2 billion, or about 10% of GDP. A positive development in the promotion of FDI has been Syria’s adhesion to the Multilateral Investment Guarantee Agency (MIGA) in mid-2002. Syria’s officially acknowledged external debt was about 18% of GDP in 2002, and is expected to decline slightly to 17% in 2003. About 80% of the debt consists of medium and long-term debt owed to official creditors, with a ratio of debt service to export of about 20%. Debt figures would be much higher (at 120% of GDP in 2001) if disputed military debt and obligations in roubles to the Russian Federation were included. In recent years, Syria has successfully pursued the reduction of its external arrears, especially with its European creditors (notably Germany) and the World Bank. Foreign reserves are high and increasing, owing to continued high unrecorded capital inflows. Continuing the rising trend since the late 1990s, gross official reserves are expected to have increased from USD 3.5 billion in 2001, to just over USD 4 billion at the end of 2002 (corresponding to 8 months of imports), and to almost USD 5 billion by the end of 2003 (over 9 months of imports).
2. Structural reforms The reform momentum picked up in 2002 and 2003, but actual implementation remains gradual and piecemeal, and has not brought about a marked improvement of the business environment. A number of measures have been taken, though, in anticipation of the conclusion of the Association Agreement with the EU. During 2002 and 2003, the Government has drafted a comprehensive economic reform programme with the aim to gradually raise growth to 6% per year.169 The financial sector and public finances have been identified as priority sectors, but reforms are also envisaged in the public administration, business environment and the judicial and legal systems.170
168 The interruption of oil imports from Iraq is estimated to have led the Syrian state oil company to cut its own oil exports by 30–50% in 2003. 169 However, the final text has not yet been made public. 170 The programme, for instance, calls for an end to the special economic security courts, which work outside the normal judiciary system and impose very harsh sanctions with no right of appeal, and for the strengthening, instead, of the normal judicial systems and courts.
- 116 -
Trade liberalisation Syria’s trade regime has remained very restrictive, due to protective tariff rates and pervasive non-tariff barriers, as well as the complex exchange rate system.171 In addition to tariff peaks of up to 200 per cent, about 50% of trade is still conducted through the state-owned Foreign Trade Establishments, responsible for trading those products for which business trading is prohibited. Importers need to obtain a licence to carry out non-prohibited imports, while exporters are required to surrender 10% of their export proceeds to the Commercial Bank of Syria (this was reduced from 25% in 2002). Foreign trade liberalisation measures have been taken in 2002 and 2003. In the framework of the Association Agreement negotiations with the EU, concluded just in December 2003, Syria has completed the revision of its custom tariffs and proceeded with the tariffication of a number of previously non-tariff barriers. Syria has also started trade liberalisation discussions with Turkey and Iran, and pursued tariff dismantling within the GAFTA. Additional trade measures include the unification of some customs regulations and procedures, and the abolition of the monopoly of import agents. Traders possessing the required import licences will be allowed to import goods directly from foreign operators, without recourse to a local agent. An important measure introduced in 2003 is the termination of the requirement to finance imports with currency revenues from exports. The government has also implemented some measures to stimulate Syria’s export sector. In 2002, in addition to reducing the foreign currency surrender requirement, the government removed the need for export licenses, as well as the tax on export revenues, and set up a new foreign exchange credit facility (worth USD 1.5 billion). In 2003, the has government implemented some reforms of the 1972 law on Free Trade Zones (FTZ), whereby investments within the FTZ will now be possible in all types of services, and not only in industrial and trading activities. Private FTZ and private Free Trade Points may be established (although only in “strategic” sectors).172 Companies established in FTZ have also been authorised to sell up to 25% of their exports to the domestic market. Fiscal and public administration reforms Syria’s fiscal performance continues to display several elements of structural vulnerability. In addition to the exposure to developments in the hydrocarbon markets, Syria’s revenue base is weakened by widespread exemptions. According to a draft government economic reform programme, a general income tax should be applied starting from 2005 to all private and public sector wage earners, as well as private companies. A general sales tax is also foreseen, which should gradually replace income from customs duties and trade taxes as a key source of revenues, in anticipation of the trade agreement with the EU and membership of the World Trade Organisation. Fiscal transparency is hampered by substantial off-budget operations and indirect subsidy schemes. The Price Stabilisation Fund is in charge of administering price controls and subsidies over food items. A number of petroleum products (such as gas oil and fuel oil) and basic utilities (electricity, water) are sold below market prices, while key crops (such as wheat, cotton) are bought by the government at prices well above international levels. Indirect subsidies are also 171 It is ranked 10 according to the IMF Trade restrictiveness index. 172 These investments should bring a significant added value to the economy or use the country's natural resources (such as investment in ICT, in the cement, steel, phosphate, oil and gas industry).
- 117 -

present in the credit market, where, despite recent reforms, interest rates are still set administratively and, in some cases, credit provision is de facto subsidised. In addition to affecting fiscal transparency, the recourse to subsidies distorts the efficient allocation of production factors. In 2002, the government implemented some reductions of selected price subsidies. The reform of the public administration has been identified as the priority of the new government appointed in September 2003. Administrative reform is presented as a precondition to reform in all the other domains, given the widespread government intervention in the economy. First steps include the restructuring and merging of some ministries. In line with the administrative reform programme, the number of ministries in the new government appointed in 2003 was reduced from 35 to 30 and the four positions of deputy prime minister were eliminated. The reduction of bureaucracy and some devolution of power to local administrations are also foreseen. The Ministry for Administrative Reform has prepared a broad strategy for civil service reform, including training of civil servants. Privatisation, enterprise restructuring and business environment Syria maintains a sizeable public enterprise sector and, as of late 2003, there are no plans for privatisation. The state continues to maintain a monopoly in a number of sectors, including oil and natural gas production, utilities and infrastructure, and some strategic sectors in agriculture and manufacturing (e.g. cotton marketing and processing, cement, ceramics etc.). Available figures reveal that the public sector generated around 31% of GDP, with a leading role in oil extraction and financial services, and employed over 20% of the total workforce. As of late 2003, the authorities continued to exclude privatisation, but rather sought to improve the operational efficiency of state-owned companies, notably through investments in technology and the separation of ownership from management. Nevertheless, the Ministry of agriculture is apparently envisaging the partial privatisation of certain agricultural companies (mixed companies). A notable development in 2003 was the decision by the government to suspend some provisions from state-owned companies and to stop subsidising the losses of some companies in which the government is a stakeholder. Syria’s business environment has been gradually improved, but remains rather restrictive. Businesses remain confronted with a heavy bureaucracy and an antiquated legal system, in addition to a complex exchange rate and foreign trade system, and a non-performing financial sector. Several measures have been introduced since 2001 to improve the business environment, particularly on issues related to foreign trade, banking and foreign exchange. The government has also taken steps to reduce red tape and improve the judicial system. Investment offices have been set up at the provincial level, in order to speed up the processing of licences. Moreover, the government has recently given its approval to a revised commercial code, which had not been changed since 1949. However, the enactment of the new text through the Parliament might take some time. The authorities have maintained a very prudent and gradual approach to reforms, which they consider appropriate to Syria’s political and social system. The 9th five-year plan (2001-2005), approved by the Parliament in October 2002, contains many references to reforms needed to revive economic growth, including improving the investment environment, notably on the administrative and taxation fronts. Promoting the role of the private sector as an engine of economic development has been identified as one of the key objectives in the government economic reform programme (ERP), and has officially become one of the priorities of the new
- 118 -

government. At the same time, however, the new government has assigned a leading role to public investment, expected to drive growth and to represent about two-times private investment. Financial sector reforms The financial sector remains underdeveloped, offering very limited financial services to private businesses. The large majority of loans is short-term (82% of total in 2001) and mainly devoted to trade financing, while medium and long-term loans for investment are not very developed (10% and 8% of total) and mainly directed to the agricultural sector (97% of total long-term loans in 2001). Deposit and loan data confirm the underdevelopment of the banking sector. Loans increased only by 22% in nominal terms between 1995-2002, and 30% of them were directed to the private sector against 70% to the public sector (including state-owned companies). At the same time, high real interest rates on deposits led to a surge in deposits in Syrian banks, including from Lebanese depositors, with deposits growing by 265% between 1995 and 2001. The rise of the volume of deposits combined with a less proportional rise of loans reveals the scarcity of profitable investment opportunities, and exercises some pressure on banks' profitability. Strict rules on banking specialisation also impose constraints on the use of the resources collected. The slowness and inefficiency of the judicial system prevents banks from exerting effective pressure to recover credits. The financial sector is being progressively liberalised, notably by opening the banking sector to private initiative. After about 40 years of state monopoly in banking, the authorities finally approved in 2003 the entry of private banks in Syria. In May 2003, the government completed the process of awarding licences to three new private banks and, in June 2003, the government also gave its initial approval to the opening of a fourth private bank. Two of these new banks have started operating at the beginning of 2004. These authorisations come two years after the decision by the Baath ruling party to authorise private banks, which was formalised in 2001 following measures to allow private foreign banking in the Free Trade Zones.173 Foreign shareholders will be able to own up to 49% of the shares of the new private banks, the rest having to remain in the hands of Syrian private investors.174 The establishment of private banks is expected to stimulate reforms of the state-owned banks. There are presently six state-owned banks in the country. Reforms of state-owned banks include efforts of informatisation, the setting up of a banking training centre in 2003, as well as plans to transform specialized state banks (Industrial Bank, Agricultural Bank, Real Estate Bank) into universal ones. With the formation of a new government, the banking sector has been put under the responsibility of the Ministry of Finance instead of the Ministry of Trade. There are also plans to strengthen the role and independence of the Central Bank. However, given the current state of these state-owned banks, their reform is expected to require several years. 173 The processing of banking applications had to wait the establishment of the Monetary and Credit Council (under a law of March 2002), whose responsibilities include examining requests to operate in the financial sector. Further delays were caused by the lack of preparation of the Central Bank to exercise supervisory functions, and by pressures to give state-owned banks more time to get ready for the new competitive environment. 174 The new banking law allows Syrian individuals and institutions to establish 100% privately-owned banks. Arab and foreign investors are also allowed to set up banks with up to a 49% stake, in association with the Syrian private or public sector. A private bank’s capital should not be less than USD 30m, and no single individual may own more than 5% of a bank’s shares. Banking profits will be subject to a flat tax of 25%. It seems that the new banks will be allowed to offer the full range of basic banking services (deposits and individual and commercial laws).
- 119 -
Labour market reforms The labour market displays some elements of rigidity. These include limiting the employers’ right to lay off workers for economic reasons, detailed regulations on minimum wages across sectors, and large non-wage benefits in the public sector that discourage mobility. The government is aware of the challenges on the labour market, notably high youth unemployment and the pressures from a growing labour force. Job creation, education and training have been identified as key strategies of the new government that come into power in 2003. As of late 2003, a new labour law is apparently in the Parliament for approval. 3. Relation with the EU and IFIs During the 12th negotiating session in December 2003, the European Union and Syria have reached an agreement at the technical level on remaining issues in the negotiations of an EU-Syria Association Agreement, which had started in 1998. Under the terms of the Agreement, upon entry into force Syria will gradually remove all its tariffs on imports of industrial and agricultural goods from the EU during a period of 12 years, and will in return get additional trade concessions on agricultural exports to the EU. In addition, the Agreement provides for national treatment of European investors established in Syria, and for the opening of almost all sectors to EU investment, with the exception of some currently reserved for government monopolies. The Agreement also foresees future liberalization of cross-border provision of services. The Agreement will help to create a more transparent and open investment framework and a basis for further liberalization. Syria has so far been one of the smallest recipients of EU assistance under MEDA. Financial assistance under MEDA I (1995-1999) consisted of projects worth over EUR 99 million, mainly in support to economic transition, infrastructure development and education. However, due to Syria’s late ratification of the MEDA framework agreement, actual financial disbursements began only in 2000. Projects worth EUR 46 million were approved under MEDA II during 2000 and 2001. For the programming period 2002-2004, additional EUR 63 million have been allocated to projects of industrial, financial and institutional modernisation, and social development. The EIB has stepped up operations in Syria, and its lending portfolio was around EUR 300 million between 1998 and 2003. Traditionally, projects have focused on the infrastructure sector, but activities in the health sector and for private sector development have been financed more recently. Notably, the EIB launched in 2003 a EUR 40 million credit facility for Syrian SMEs. This will be managed by a SME unit set up within the Ministry of Trade. Syria does not receive any macro-financial support from the International Financial Institutions. The IMF conducts regular economic reviews in the framework of Article IV consultations. World Bank activities currently consist of one project worth USD 1.4 million, as well as technical assistance activities. 4. Concluding remarks Economic growth has remained subdued in recent years. After real GDP of 3.2% in 2002, growth is estimated to have declined to about 2% in 2003, a rate insufficient to raise living standards. Vulnerability to external developments (notably oil prices and the regional
- 120 -
environment), as well as weaknesses in macroeconomic policies, structural impediments to business activity and strong reliance on public spending, as opposed to private sector consumption and investments, have constrained the prospects for sustainable and high rates of growth. A stronger and sustained growth performance requires a comprehensive strategy based on sound macroeconomic policies and rapid progress with structural reforms. While initial steps have been taken to increase the flexibility of monetary policy, high real interest rates discourage borrowing and investment. The fiscal position has deteriorated and remains highly vulnerable to adverse developments in the energy markets. On the structural front, the pace of reforms has intensified in 2002 and 2003, but business sector activity remains constrained by an unfavourable operating environment including, among others, a cumbersome regulatory framework, price distortions, an underdeveloped financial system and widespread state intervention in the economy.
- 121 -
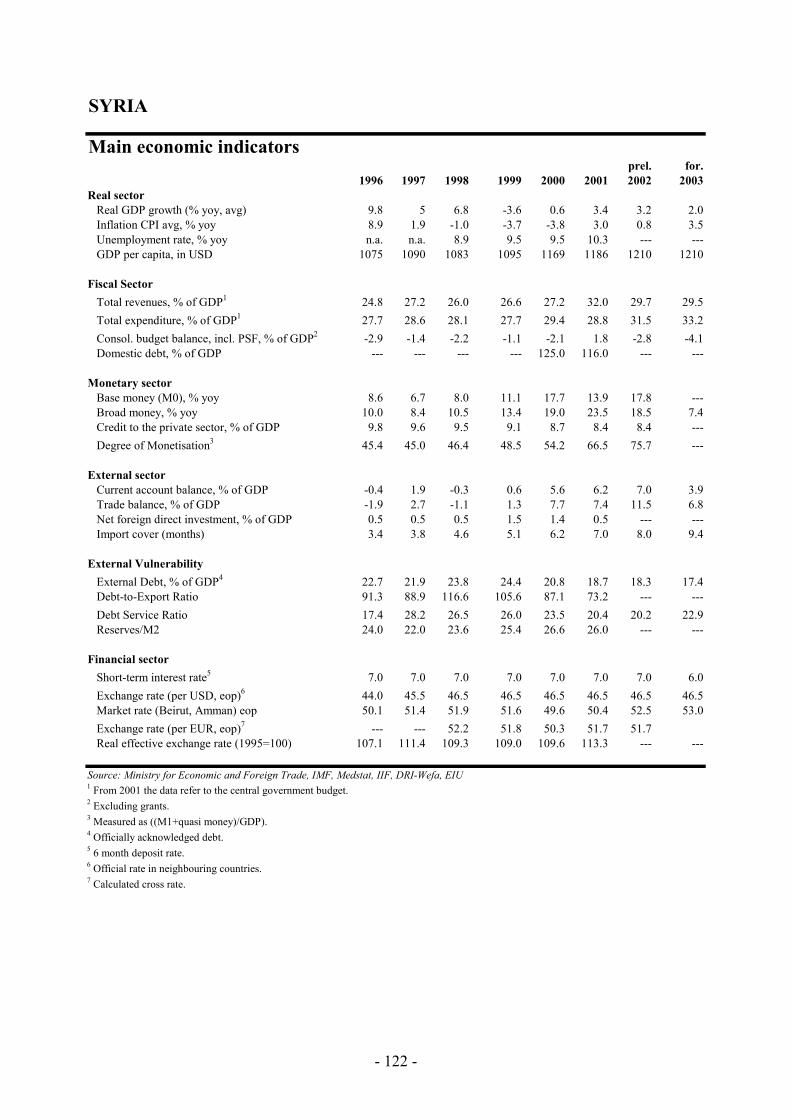
SYRIA
Main economic indicatorsprel. for.
1996 1997 1998 1999 2000 2001 2002 2003Real sector Real GDP growth (% yoy, avg) 9.8 5 6.8 -3.6 0.6 3.4 3.2 2.0 Inflation CPI avg, % yoy 8.9 1.9 -1.0 -3.7 -3.8 3.0 0.8 3.5 Unemployment rate, % yoy n.a. n.a. 8.9 9.5 9.5 10.3 --- --- GDP per capita, in USD 1075 1090 1083 1095 1169 1186 1210 1210
Fiscal Sector Total revenues, % of GDP1 24.8 27.2 26.0 26.6 27.2 32.0 29.7 29.5 Total expenditure, % of GDP1 27.7 28.6 28.1 27.7 29.4 28.8 31.5 33.2 Consol. budget balance, incl. PSF, % of GDP2 -2.9 -1.4 -2.2 -1.1 -2.1 1.8 -2.8 -4.1 Domestic debt, % of GDP --- --- --- --- 125.0 116.0 --- ---
Monetary sector Base money (M0), % yoy 8.6 6.7 8.0 11.1 17.7 13.9 17.8 --- Broad money, % yoy 10.0 8.4 10.5 13.4 19.0 23.5 18.5 7.4 Credit to the private sector, % of GDP 9.8 9.6 9.5 9.1 8.7 8.4 8.4 --- Degree of Monetisation3 45.4 45.0 46.4 48.5 54.2 66.5 75.7 ---
External sector Current account balance, % of GDP -0.4 1.9 -0.3 0.6 5.6 6.2 7.0 3.9 Trade balance, % of GDP -1.9 2.7 -1.1 1.3 7.7 7.4 11.5 6.8 Net foreign direct investment, % of GDP 0.5 0.5 0.5 1.5 1.4 0.5 --- --- Import cover (months) 3.4 3.8 4.6 5.1 6.2 7.0 8.0 9.4
External Vulnerability External Debt, % of GDP4 22.7 21.9 23.8 24.4 20.8 18.7 18.3 17.4 Debt-to-Export Ratio 91.3 88.9 116.6 105.6 87.1 73.2 --- --- Debt Service Ratio 17.4 28.2 26.5 26.0 23.5 20.4 20.2 22.9 Reserves/M2 24.0 22.0 23.6 25.4 26.6 26.0 --- ---
Financial sector Short-term interest rate5 7.0 7.0 7.0 7.0 7.0 7.0 7.0 6.0 Exchange rate (per USD, eop)6 44.0 45.5 46.5 46.5 46.5 46.5 46.5 46.5 Market rate (Beirut, Amman) eop 50.1 51.4 51.9 51.6 49.6 50.4 52.5 53.0 Exchange rate (per EUR, eop)7 --- --- 52.2 51.8 50.3 51.7 51.7 Real effective exchange rate (1995=100) 107.1 111.4 109.3 109.0 109.6 113.3 --- ---
Source: Ministry for Economic and Foreign Trade, IMF, Medstat, IIF, DRI-Wefa, EIU1 From 2001 the data refer to the central government budget.2 Excluding grants.3 Measured as ((M1+quasi money)/GDP).4 Officially acknowledged debt.5 6 month deposit rate.6 Official rate in neighbouring countries.7 Calculated cross rate.
- 122 -
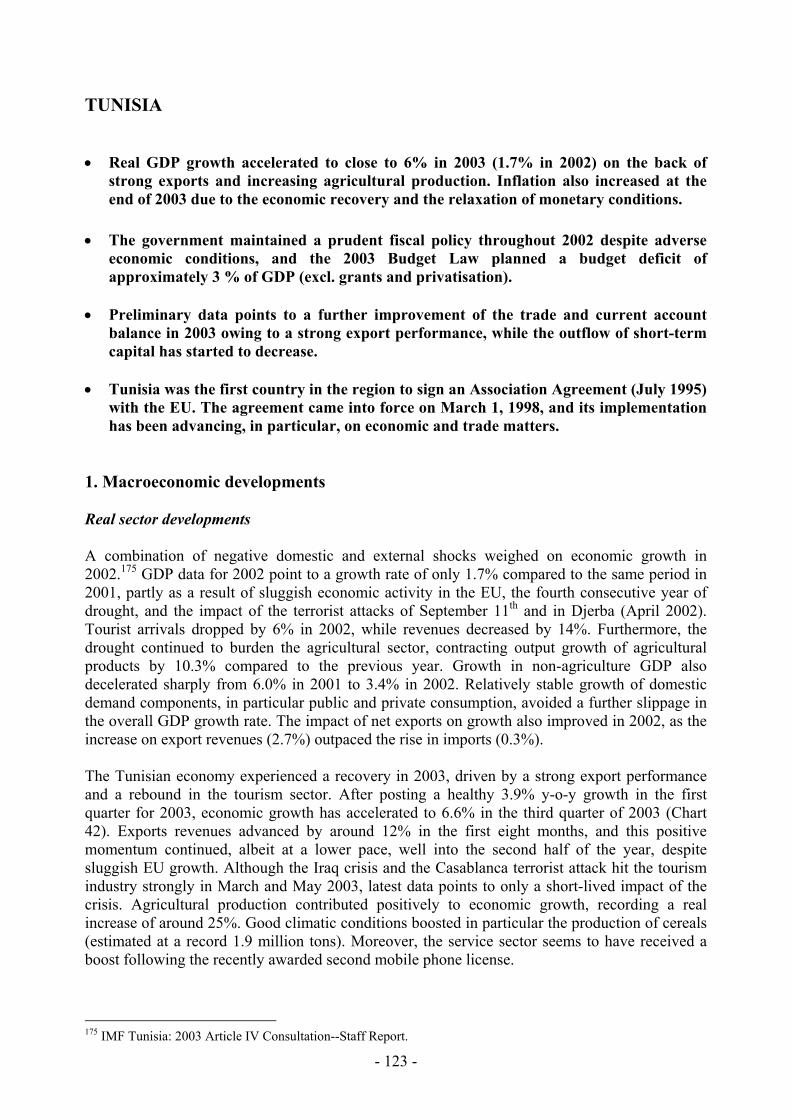
TUNISIA • Real GDP growth accelerated to close to 6% in 2003 (1.7% in 2002) on the back of
strong exports and increasing agricultural production. Inflation also increased at the end of 2003 due to the economic recovery and the relaxation of monetary conditions.
• The government maintained a prudent fiscal policy throughout 2002 despite adverse
economic conditions, and the 2003 Budget Law planned a budget deficit of approximately 3 % of GDP (excl. grants and privatisation).
• Preliminary data points to a further improvement of the trade and current account
balance in 2003 owing to a strong export performance, while the outflow of short-term capital has started to decrease.
• Tunisia was the first country in the region to sign an Association Agreement (July 1995)
with the EU. The agreement came into force on March 1, 1998, and its implementation has been advancing, in particular, on economic and trade matters.
1. Macroeconomic developments Real sector developments A combination of negative domestic and external shocks weighed on economic growth in 2002.175 GDP data for 2002 point to a growth rate of only 1.7% compared to the same period in 2001, partly as a result of sluggish economic activity in the EU, the fourth consecutive year of drought, and the impact of the terrorist attacks of September 11th and in Djerba (April 2002). Tourist arrivals dropped by 6% in 2002, while revenues decreased by 14%. Furthermore, the drought continued to burden the agricultural sector, contracting output growth of agricultural products by 10.3% compared to the previous year. Growth in non-agriculture GDP also decelerated sharply from 6.0% in 2001 to 3.4% in 2002. Relatively stable growth of domestic demand components, in particular public and private consumption, avoided a further slippage in the overall GDP growth rate. The impact of net exports on growth also improved in 2002, as the increase on export revenues (2.7%) outpaced the rise in imports (0.3%). The Tunisian economy experienced a recovery in 2003, driven by a strong export performance and a rebound in the tourism sector. After posting a healthy 3.9% y-o-y growth in the first quarter for 2003, economic growth has accelerated to 6.6% in the third quarter of 2003 (Chart 42). Exports revenues advanced by around 12% in the first eight months, and this positive momentum continued, albeit at a lower pace, well into the second half of the year, despite sluggish EU growth. Although the Iraq crisis and the Casablanca terrorist attack hit the tourism industry strongly in March and May 2003, latest data points to only a short-lived impact of the crisis. Agricultural production contributed positively to economic growth, recording a real increase of around 25%. Good climatic conditions boosted in particular the production of cereals (estimated at a record 1.9 million tons). Moreover, the service sector seems to have received a boost following the recently awarded second mobile phone license.
175 IMF Tunisia: 2003 Article IV Consultation--Staff Report.
- 123 -
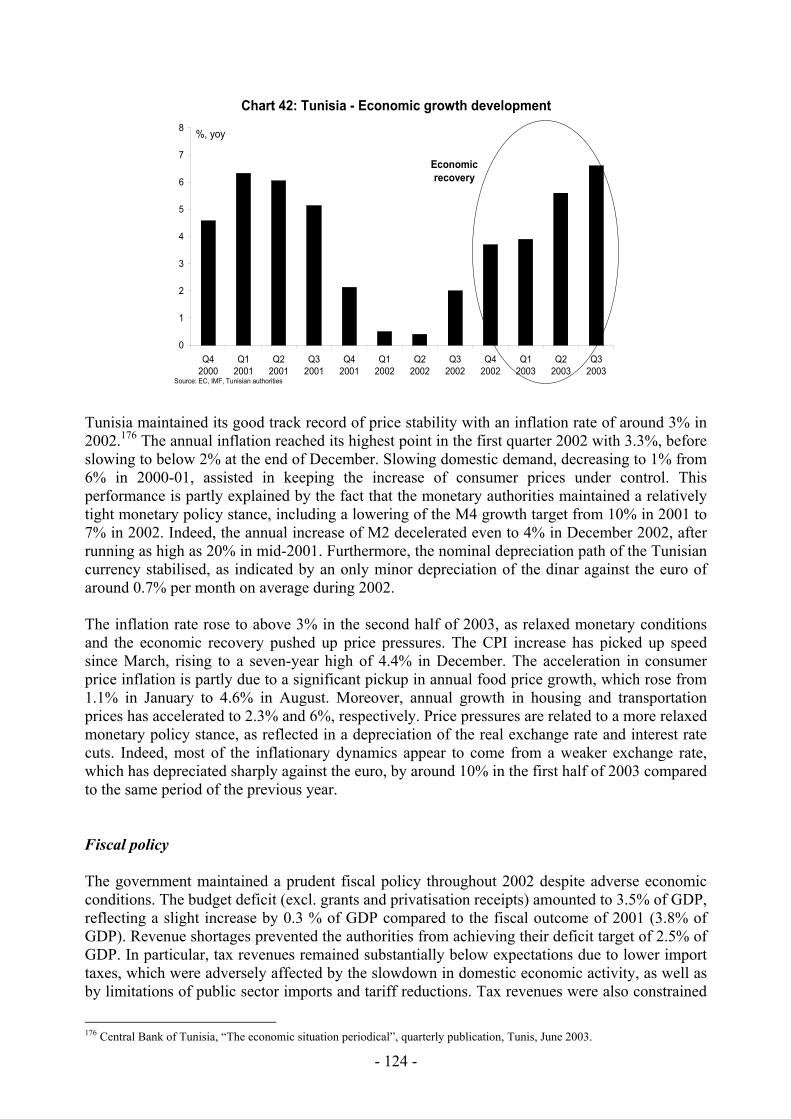
0
1
2
3
4
5
6
7
8
Q42000
Q12001
Q22001
Q32001
Q42001
Q12002
Q22002
Q32002
Q42002
Q12003
Q22003
Q32003
Economic recovery
Chart 42: Tunisia - Economic growth development
Source: EC, IMF, Tunisian authorities
%, yoy
Tunisia maintained its good track record of price stability with an inflation rate of around 3% in 2002.176 The annual inflation reached its highest point in the first quarter 2002 with 3.3%, before slowing to below 2% at the end of December. Slowing domestic demand, decreasing to 1% from 6% in 2000-01, assisted in keeping the increase of consumer prices under control. This performance is partly explained by the fact that the monetary authorities maintained a relatively tight monetary policy stance, including a lowering of the M4 growth target from 10% in 2001 to 7% in 2002. Indeed, the annual increase of M2 decelerated even to 4% in December 2002, after running as high as 20% in mid-2001. Furthermore, the nominal depreciation path of the Tunisian currency stabilised, as indicated by an only minor depreciation of the dinar against the euro of around 0.7% per month on average during 2002. The inflation rate rose to above 3% in the second half of 2003, as relaxed monetary conditions and the economic recovery pushed up price pressures. The CPI increase has picked up speed since March, rising to a seven-year high of 4.4% in December. The acceleration in consumer price inflation is partly due to a significant pickup in annual food price growth, which rose from 1.1% in January to 4.6% in August. Moreover, annual growth in housing and transportation prices has accelerated to 2.3% and 6%, respectively. Price pressures are related to a more relaxed monetary policy stance, as reflected in a depreciation of the real exchange rate and interest rate cuts. Indeed, most of the inflationary dynamics appear to come from a weaker exchange rate, which has depreciated sharply against the euro, by around 10% in the first half of 2003 compared to the same period of the previous year. Fiscal policy The government maintained a prudent fiscal policy throughout 2002 despite adverse economic conditions. The budget deficit (excl. grants and privatisation receipts) amounted to 3.5% of GDP, reflecting a slight increase by 0.3 % of GDP compared to the fiscal outcome of 2001 (3.8% of GDP). Revenue shortages prevented the authorities from achieving their deficit target of 2.5% of GDP. In particular, tax revenues remained substantially below expectations due to lower import taxes, which were adversely affected by the slowdown in domestic economic activity, as well as by limitations of public sector imports and tariff reductions. Tax revenues were also constrained
176 Central Bank of Tunisia, “The economic situation periodical”, quarterly publication, Tunis, June 2003.
- 124 -

by lower value-added tax revenues as a result of weaker growth, and by the failure to extend the VAT to the telecommunications sector. The shortfall in revenues prompted the authorities to take additional measures on the expenditure side, whereby savings came primarily from cuts in capital expenditure. Fiscal operations in 2002 pointed to the government's limited room for manoeuvre to tackle adequately external shocks with the fiscal instrument. In an attempt to meet its budget deficit target, the government failed to reduce public-sector wage growth, preferring to cut capital spending and implement a squeeze on imports of public-sector goods. In addition, a wage hike, stemming in part from the triennial wage negotiations, was accepted. In turn, the reduction in investment inputs contributed to dampening GDP growth and, hence, the government's tax revenues. The effect of the import squeeze on customs revenues seems, however, to have been more than offset by lower spending. The 2003 Budget Law planned a deficit of approximately 3 % of GDP (excl. grants and privatisation).177 During the year, the authorities became more optimistic concerning the fiscal situation, based on a good agricultural season and stronger external demand. In spite of the need to limit the growth in public-sector wages, the budget contains additional employment and wage rises, contributing to a 6.5% increase in recurrent (operating) expenditure. Capital spending is expected to have increased by a more modest 3.9%, and from a much lower base. On the financing side, the budget law envisioned total financing needs of USD 506 million, of which roughly two thirds were expected to be financed from domestic sources. According to a recent estimate from the Ministry of economic development, the budget deficit for the first half of 2003 was 2.5% of GDP. Monetary and exchange rate policy The Tunisian monetary policy framework has remained broadly unchanged in recent years, but a revision of the current strategy has been ongoing. Targeting growth of broad money – besides pursuing a tightly managed exchange rate regime – still represents the core of the monetary policy framework. Continued extensive restrictions on capital flows enable the monetary authorities to pursue such an independent monetary policy, while managing the exchange rate intensively. The Central Bank of Tunisia uses the expansion of credit to the economy as an intermediate target for growth in broad money, whereby in the recent past the target rate has been set in line with the expected expansion of nominal GDP growth. Recognising the challenge of deeper integration and capital and financial account liberalisation the authorities have started to explore in 2002 alternatives to their current macroeconomic framework, such as a move to an inflation targeting regime. Since the end of 2002, there have been clear signals that a more accommodative monetary stance has been adopted in order to provide a stimulus for economic growth. The stringent approach of the Central Bank of Tunisia towards liquidity management loosened slightly in 2003, as reflected in the Central Bank’s previous monetary programme. Broad money is expected to have risen by 8%, representing an increase in the growth rate compared to 2002, when this monetary aggregate grew by around 5%. In March 2003 the Central Bank of Tunisia already started to lower its minimum bid rate to 5.5% from 5.875 % (also as a reaction to the Iraq crisis), representing the first reduction since 1998. It further reduced its refinancing rate on June 18, when it cut the
177 “2003 budget” Ministry of Finance. DRI-Wefa.
- 125 -

refinancing tender minimum bid rate by 50 basis points, to 5.0%, in a bid to stimulate credit growth. However, the most evident indication of more relaxed monetary conditions came from the exchange rate side. The real effective exchange rate continued to depreciate in 2002 after having been lowered by 0.6 and 2.5% in 2000 and 2001, respectively. This depreciating trend appears to have strengthened in the first six months of 2003 (Chart 43). Correspondingly, the nominal value of the Tunisian dinar has decreased significantly against the euro, around 7%, when compared to the third quarter of 2002, while strengthening around 4% against the US dollar. The latter movement can be explained by the swift appreciation of the euro against the US dollar. Finally, the higher volatility against the US dollar clearly indicates the euro’s predominance as reference currency for the Tunisian dinar.
Chart 43: Tunisia - Real effective exchange rate development 115
Inex level, a downward trend indicates a depreciation
105
95
85 Potential policy shift away from targeting a stable real effective
exchange rate
75 Jan-90 Jan-92 Jan-02 Jan-94 Jan-96 Jan-98 Jan-00
Source: IFS External sector developments In 2002, the current account deficit improved, but still recorded a deficit of around 3.5% of GDP, whereby the underlying dynamics changed significantly.178 Regarding trade activities, available data indicate that both export and import growth cooled-off in 2002. Exports grew by a mere 2.7%, reflecting low demand from Tunisia’s main trading partners, while imports in nominal terms declined slightly as a consequence of the economic slowdown and curtailed public sector goods imports. These developments translated into a narrowing of the trade deficit to 10.1% of GDP in 2002, compared to 12.0% in 2001. The terrorist attacks of September 11th and those in Djerba had a strong impact on tourism receipts – lower by around 13% – and on the transport sector. However, current transfers, especially by Tunisians working abroad, have contributed to compensating for the loss in the service balance and to lowering the current account deficit to 3.5% in 2002, compared to 4.3% in the previous year. The contribution of the capital and financial account components to the coverage of the current account deficit remained relatively unchanged in 2002. Foreign direct investment (FDI) rose in 2002 to 3.8% of GDP, compared to 2.2% in 2001, despite the global slowdown and poor
- 126 -
178 EIU, “Tunisia: Country outlook”, London, 17 October 2003.
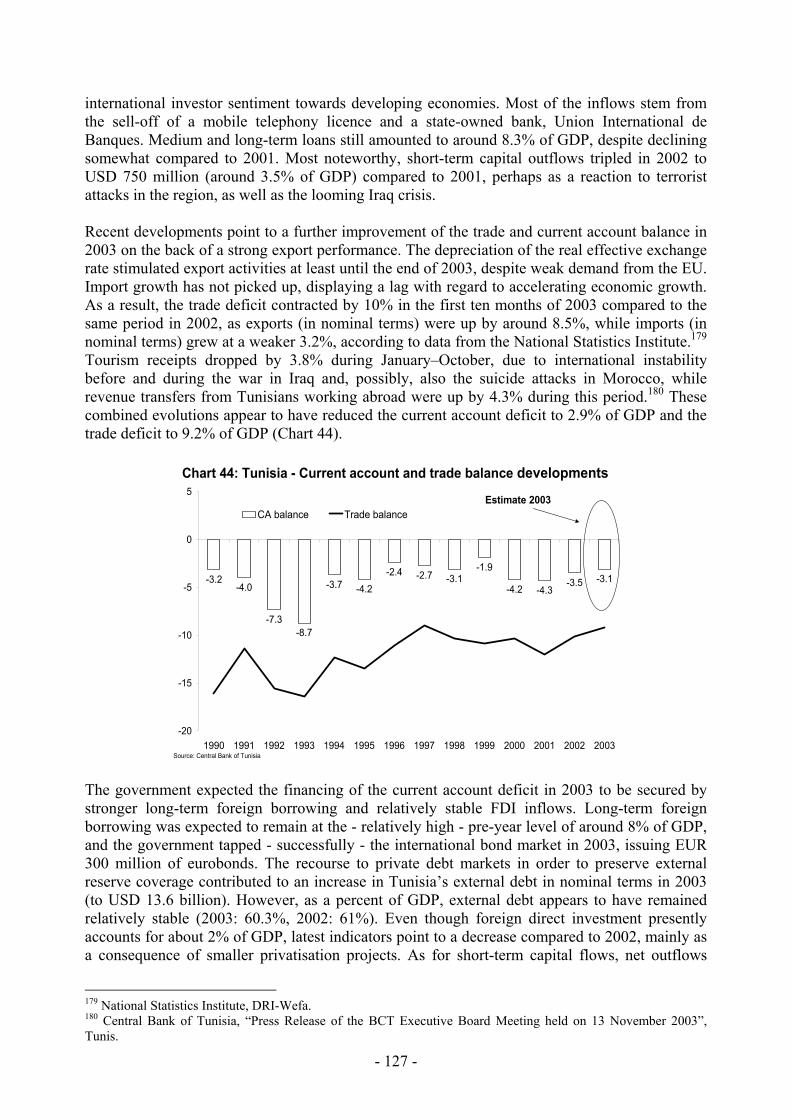
international investor sentiment towards developing economies. Most of the inflows stem from the sell-off of a mobile telephony licence and a state-owned bank, Union International de Banques. Medium and long-term loans still amounted to around 8.3% of GDP, despite declining somewhat compared to 2001. Most noteworthy, short-term capital outflows tripled in 2002 to USD 750 million (around 3.5% of GDP) compared to 2001, perhaps as a reaction to terrorist attacks in the region, as well as the looming Iraq crisis. Recent developments point to a further improvement of the trade and current account balance in 2003 on the back of a strong export performance. The depreciation of the real effective exchange rate stimulated export activities at least until the end of 2003, despite weak demand from the EU. Import growth has not picked up, displaying a lag with regard to accelerating economic growth. As a result, the trade deficit contracted by 10% in the first ten months of 2003 compared to the same period in 2002, as exports (in nominal terms) were up by around 8.5%, while imports (in nominal terms) grew at a weaker 3.2%, according to data from the National Statistics Institute.179 Tourism receipts dropped by 3.8% during January–October, due to international instability before and during the war in Iraq and, possibly, also the suicide attacks in Morocco, while revenue transfers from Tunisians working abroad were up by 4.3% during this period.180 These combined evolutions appear to have reduced the current account deficit to 2.9% of GDP and the trade deficit to 9.2% of GDP (Chart 44).
-3.2-4.0
-7.3-8.7
-3.7 -4.2
-2.4 -2.7 -3.1-1.9
-4.2 -4.3-3.5 -3.1
-20
-15
-10
-5
0
5
1990 1991 1992 1993 1994 1995 1996 1997 1998 1999 2000 2001 2002 2003
CA balance Trade balance
Chart 44: Tunisia - Current account and trade balance developments
Source: Central Bank of Tunisia
Estimate 2003
The government expected the financing of the current account deficit in 2003 to be secured by stronger long-term foreign borrowing and relatively stable FDI inflows. Long-term foreign borrowing was expected to remain at the - relatively high - pre-year level of around 8% of GDP, and the government tapped - successfully - the international bond market in 2003, issuing EUR 300 million of eurobonds. The recourse to private debt markets in order to preserve external reserve coverage contributed to an increase in Tunisia’s external debt in nominal terms in 2003 (to USD 13.6 billion). However, as a percent of GDP, external debt appears to have remained relatively stable (2003: 60.3%, 2002: 61%). Even though foreign direct investment presently accounts for about 2% of GDP, latest indicators point to a decrease compared to 2002, mainly as a consequence of smaller privatisation projects. As for short-term capital flows, net outflows
179 National Statistics Institute, DRI-Wefa. 180 Central Bank of Tunisia, “Press Release of the BCT Executive Board Meeting held on 13 November 2003”, Tunis.
- 127 -
started to subside in the first two quarters, and for the whole year, a close-to-balance result for portfolio flows is expected. 2. Structural reforms181 Trade liberalisation Overall, Tunisia’s trade regime appears to be relatively restrictive, as indicated by the ranking of eight (out of ten) in the IMF’s trade restrictiveness index.182 This negative score is associated with a large number of tariffs (52 rates), various forms of non-tariff barriers, and relatively high average tariff rates. For some product categories, excessive tariff peaks - up to 215% - could be identified. However, this figure is likely to overstate the problem, since the index has been calculated with unweighted tariffs, which do not capture the fact that more than 70% of Tunisia’s imports come from Europe and are thereby subjected to the low tariff rates under the Association Agreement (AA). Trade of goods with the EU is being liberalised, and tariffs have been progressively reduced according to the provision of the AA. Since 1 January 2003, imports of manufactured goods that compete with local production (together with the other products covered by Annex 5 of the AA), have been subjected to new tariff rates amounting to 44% of their 1995 level. Trade liberalisation with the EU would benefit from additional clarification to allow for a more rigorous application of the provisions of the AA, namely through deregulating access and operations in a number of industrial and services sectors or activities (transformed agricultural products and other food products), as well as from catching up with the delay incurred during negotiations with regard to trade in services and the right of establishment. Trade in services is not subject to additional commitments, reflecting also limited offers from Tunisia in the GATS (telecommunications, financial services, tourism) framework. Finally, several GATS commitments deadlines have not been respected. For example, Tunisia committed to sell at least 10% of Tunisia Telecom to foreign shareholders before the end of 2000, which had not been achieved at the end of 2003. Fiscal and public administration reform The execution of the budgets for 2002 and 2003 (7 months) have been facilitated by an increasing tax collection capacity, assisting in the effective replacement of decreasing customs revenues with higher revenues from direct taxation. Customs revenues decreased by 5.4 % over the first seven months of 2003 compared to the first seven months of 2002. At the same time, direct tax revenues (income tax revenues and profit revenue from companies) grew by 6.9 % (7 months, 2003), while VAT revenues were up by 2.8 % in the first seven months of 2003, after a 4.1 % drop in 2002. The extension of the VAT to retail trade has been a success so far, and was accompanied by measures designated to avoid discriminations that could nurture informal trading activities, such as increasing the tax base of certain import product categories by 25%.183 The most important reform in the fiscal area was the announcement by the Minister of Finance in April 2003 of a new “organic” law governing the preparation of Budget Laws. This law envisages the implementation of a budget process characterised by objectives and results (and is based on the model of countries such as the UK, Australia, Sweden, USA, New Zealand etc.). 181 The drafting of this part has been partly done by the EC Delegation in Tunis. 182 IMF, “Article IV consultation”, August 2003. 183 Article 52 of the Budget Law of 2003.
- 128 -

The new budget law is expected to be prepared in 2004, approved in 2005, and implemented in 2006. It is also expected to trigger reforms of the public administration, prompting also an evaluation of the role of the state in the society and economy. The mechanism of a budget management by results will imply a more decentralised budgetary execution and expenditure management. Budget accountability should be strengthened as a result. Privatisation, enterprise restructuring and business environment In 2002-03, the privatisation process has been moving forward slowly, although official privatisation targets have not been achieved. Privatisation revenues in 2003 were budgeted at TUD 50 million (from 1/01/1988 to 31/08/2003 total privatisation proceeds amounted to TUD 2.4 billion or TUD 12.5 million per month). The government aimed at selling 22 companies in 2003, with a combined asset value of around 0.2 % of GDP altogether. Positive privatisation results so far include the privatisation of the UIB bank and the start of the procedure for the disposal of the minority stake held by the public sector in Banque du Sud. Overall, however, the opening of new sectors of the economy to private investment in the framework of the Xth Plan (2002-2006) remained slow and was characterised by some reticence. This holds in particular true for the transport sector (despite the recent launch of international tenders for the development, through private participation in public infrastructures, of two new terminals for containers and cruise ships) the waste-management, water and communication sectors. The slow disengagement of the state and opening of certain sectors to private participants has been also retarding the restructuring of the public-sector (notably in the areas of the financial sector and public services providers). However, some progress can be observed in the energy sector, where British Gas has been authorised to set up a power station with a capacity of 500 MW (representing a derogation of the current regulatory framework, which limits private participation at 40 MW). The current system of water production and distribution, which is entirely public, is not profitable. Water management is administrated by "Société Nationale d'Exploitation et de Distribution de l'Eau" (SONEDE). 80% of the water used in Tunisia is devoted to the agricultural sector through a subsidy system, which allows only a minor part of the costs to be covered. Private sector participation in this area (recycling, production, distribution) is envisaged, but such a move requires legal and regulatory changes, which are slowly advancing: a law is being prepared to provide a general framework for the long term lease of public infrastructures to private operators, but the monopolistic empowerment of ONAS, SONEDE and ANPE will require other legal changes before embarking on ambitious private participations (other than mere short-term subcontracting). A prerequisite is to set up independent sectoral regulation authorities, with full responsibility to settle disputes or difficulties between private concessionaires and authorities in matters of pricing, universal service, competition issues etc..." The national programme of industrial upgrading ("mise à niveau") is increasingly reaching its operational limits. Its focus on supporting physical equipment modernisation becomes less relevant as Tunisian companies are confronted with a more competitive environment, which requires that all aspects of competitiveness (including such immaterial aspects as marketing, distribution, packaging, etc.) are addressed by companies. Private sector companies complain that the programme might have even become counter-productive by a disproportionate allocation of resources to public sector or semi-public sector enterprises rather than small and medium-sized enterprises. Indeed, public enterprises and private firms in sectors such as tourism and textile exports absorb the bulk of subsidised credits and aid provided, while SMEs do not seem
- 129 -

to benefit proportionately from the scheme. Moreover, SMEs face several difficulties in financing the approved investments due to the delay in the disbursement of the grants allowed by the national programme of industrial upgrading. In general, private sector activities continue to be unnecessarily impeded by a high degree of bureaucracy. The Cato Institute184 downgraded Tunisia in July 2003 within its classification of the countries regarding economic liberties. Tunisia, having a value of 6.1, was classified as number 73 out of 123 countries, below the world average (6.4). A noteworthy example in this respect is the Starlinger/Cofisac affair, in which certain norms regarding the usage of packaging material were retained for the sake of safeguarding one local producer against foreign competition. Financial sector reforms The soundness of the banking sector deteriorated at the end of 2002 compared to the end of 2001. The worsening of the situation was reflected in the increased ratio of doubtful credits to overall credits to 20.7% at the end of 2002 (compared to 19.2% at the end of 2001). Private banks experienced an increase of non-performing loans to 17.9% (2001: 16.1%) of overall credits, while the respective ratio of public banks deteriorated to 24.1% (2001: 22.8%) in 2002. The authorities attributed this deterioration to the drop in tourism and the economic downturn, underlining that this deviation from the long term goal of strengthening the banking sector was expected to remain short-lived. Provisioning ratios also weakened during 2002, declining to 41.5% of non-performing loans (2001: 47.4%) due to the over-reliance on collateral, which is, however, difficult to recover. Against this background, the IMF recommended to expedite the realisation of collateral by reforming the judicial process, to allow the provisioning of funds to be tax-deducted and to further reduce government ownership in the financial sector.185 Some reform momentum, both in the banking and the insurance sector, could be observed in 2003. The achieved privatisation of UIB and the ongoing privatisation of the Banque du Sud should contribute to increased competition in the banking sector. Furthermore, the new banking law permits "bank insurance" activities, reducing market entry barriers for the two activities. Measures to reform the insurance sector include the increase of tariffs on automobile insurance and improved prudential surveillance and regulation. Furthermore, the regulatory framework was modernised, and the control capacity of the supervisory body (the “Comité Général des Assurances” created in 2001) was significantly strengthened. In general, the opening of the financial sector to international competition remains essential for its modernisation and, especially, for an improvement of the financial intermediation process as a whole, notably in view of the planned gradual liberalisation of capital movements. Labour market and education reform The labour market has not been in a position to cope with a high number of new entrants, whose peak is expected to be reached in 2003 and 2004. The Labour Code introduced in 1993 improved and increased flexibility by introducing limited contracts and part-time work, as well as by allowing for extra hours. However, the modalities of termination of the existing employment contracts are still very strict. Collective protection nets, as well as the overall welfare system, are also characterised by some deficiencies. For instance, the integration and re-integration of the 184 Gwartney J., Lawson R., "Economic Freedom of the World: 2003 Annual Report", Washington DC, July 2003. 185 IMF, "Tunisia: 2003 Article IV Consultation", Staff Report, Washington DC, August 2003.
- 130 -

unemployed are run by a number of uncoordinated state mechanisms, which benefit only a small number of the unemployed and seem to be missing coherence and efficiency. The EC-supported reforms in the area of the Primary Education have been implemented by the government, whose main objectives are exposed in the law n°2002 80. In this respect, the progress of some indicators (for example in terms of school enrolment rates, school facilities, and number and qualifications of teachers) can be noticed. However, persistent unemployment amongst young secondary education graduates points to a mismatch between the skills acquired at school and those sought by employers. Moreover, women have not yet been able to benefit fully from their skills acquired in the education system. For example, in 2001, the labour force participation rate was 76% for men and just 26% for women. An international study conducted in 1999 with Grade 8 students in mathematics and science suggested that learning achievement needs to improve markedly if Tunisia is to develop the skills it needs to compete in the international marketplace. Against this background, EC-supported reforms in the area of secondary and of higher education are in the agenda of the Government for implementation scheduled in 2004-2006. 3. Relations with the EU and IFIs Tunisia was the first country in the region to sign an Association Agreement with the European Union, in July 1995. The agreement came into force on 1 March 1998186. However, Tunisia already started to apply unilaterally the agreed tariff dismantling scheme from 1st January 1996. As a result, dismantling regarding imports originating in the EU is well advanced in Tunisia. By 2002, around 40% of imports from the EU were allowed into Tunisia free of customs duties, while most of the others were benefiting either from rates reduced to 44% of the basic rate or, for the most sensitive products, from a rate reduced to 66% of the basic duty. As for Community financial co-operation under MEDA II during the period 2000-02, four SAF operations were envisaged. Three out of these four SAF operations have already been implemented (a multi-sector SAF targeting the financial and the telecommunication sectors, as well as SAFs focusing on private sector development, support to basic education, and support to ports modernisation) and partially/fully released (EUR 54.3 million, EUR 39.6 million and EUR 9.5 million, respectively). However, the SAF supporting the modernisation of the medical insurance scheme has not been implemented so far. The National Indicative Programme (NIP) for 2002-04 provides for EUR 248.7 million, and focuses on three priority areas: strengthening governance and institutions, further liberalisation of the economy, and enhancing employability and job creation for young people. Under the NIP 2002-04 framework, a SAF IV operation is planned for an amount of EUR 78 million and is expected to be implemented in 2004. Finally, the new National Indicative Programme (NIP) for 2005-06 provides for EUR 144 million distributed in three areas: strengthening institutions (via a SAF operation), enhancing human resources, and improving economic infrastructure. In the last five years, the EIB has provided around EUR 980 million in financing for infrastructure projects in Tunisia (around EUR 350 in 2003), as well as for managing risk capital and for interest rate subsidy operations, financed through the Community budget. There is currently no IMF programme in place. The last programme (EFF) dates back to the beginning of the 1990s.
186 http://europa.eu.int/comm/external_relations/tunisia/intro/index.htm
- 131 -
As of December 2003, the World Bank portfolio in Tunisia consisted of 18 active projects amounting to USD 983 million, supporting its three pillar co-operation strategy.187 First, the Bank's programmes focus on activities related to human resources development, natural resources management and infrastructure development. Secondly, resources are devoted to support economic reforms to enhance competitiveness, foster private sector development and increase employment, while minimising the transitional costs of adjustment. In this respect, the World Bank approved in December 2001 a USD 250 million loan to Tunisia, the third in a series of policy reform initiatives (Economic Competitiveness Adjustment Loan, ECAL III). Finally, new initiatives target the strengthening of educational institutions and the support of the export sector. 4. Concluding remarks Tunisia’s good economic performance, with average real GDP increases of 4.7% per year during 1996-2002, was made possible by a series of economic adjustment programmes in the late 1980’s, followed by an Association Agreement with the EU (1995). Prudent macroeconomic management has resulted in low inflation and a sustainable external account situation with moderate current account deficits. The authorities have made significant progress in privatising state enterprises, strengthening the banking sector, improving the investment climate, opening the economy and enhancing the competitiveness of domestic industry. Despite numerous successfully implemented structural reforms in the past years, strengthened efforts are needed to boost productivity, facilitate private sector activity, and create an environment more attractive to foreign investment. This implies, in particular, tackling the remaining trade protection, a heavily-regulated onshore sector, state control over a large part of the economy, in particular the financial sector, labour market rigidities and weakness of the regulatory and legal framework. With regard to the macroeconomic front, authorities are encouraged to continue pursuing a sound fiscal policy, as well as to establish and implement a strategy that lowers public debt in the medium term.
187 Source: World Bank's Internet site: http://www.worldbank.org/html/extdr/regions.htm#m
- 132 -
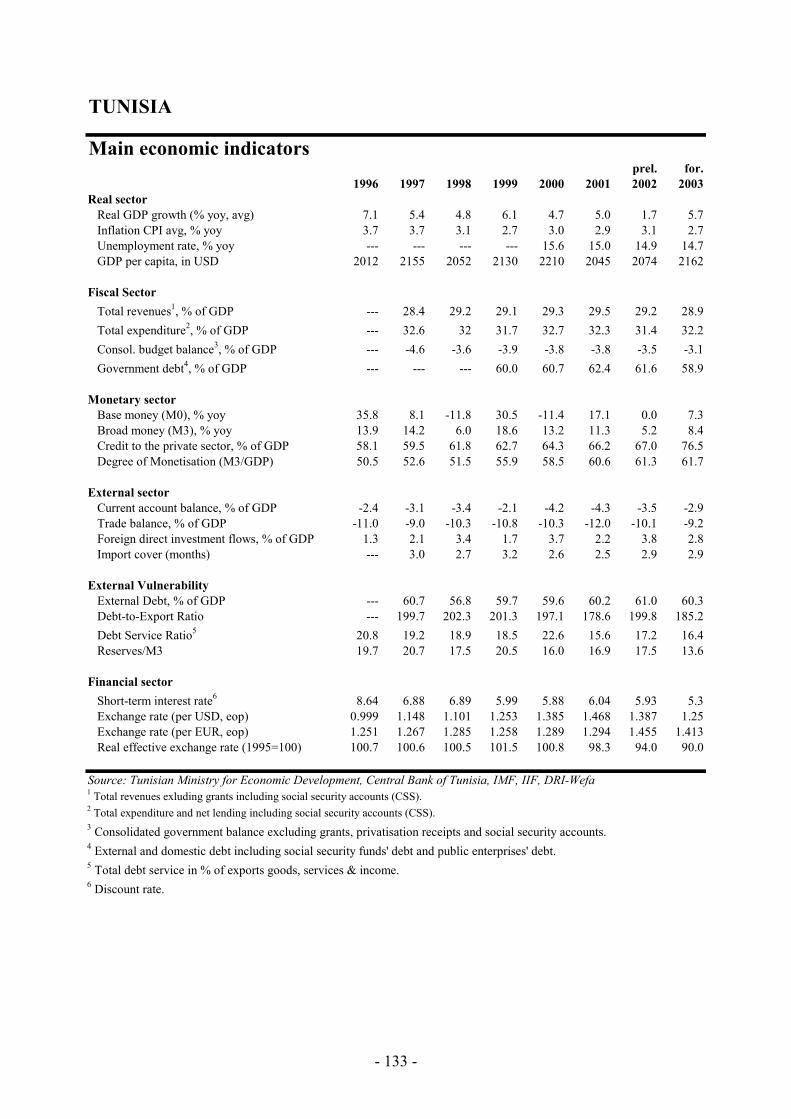
TUNISIA
Main economic indicatorsprel. for.
1996 1997 1998 1999 2000 2001 2002 2003Real sector Real GDP growth (% yoy, avg) 7.1 5.4 4.8 6.1 4.7 5.0 1.7 5.7 Inflation CPI avg, % yoy 3.7 3.7 3.1 2.7 3.0 2.9 3.1 2.7 Unemployment rate, % yoy --- --- --- --- 15.6 15.0 14.9 14.7 GDP per capita, in USD 2012 2155 2052 2130 2210 2045 2074 2162
Fiscal Sector Total revenues1, % of GDP --- 28.4 29.2 29.1 29.3 29.5 29.2 28.9 Total expenditure2, % of GDP --- 32.6 32 31.7 32.7 32.3 31.4 32.2 Consol. budget balance3, % of GDP --- -4.6 -3.6 -3.9 -3.8 -3.8 -3.5 -3.1 Government debt4, % of GDP --- --- --- 60.0 60.7 62.4 61.6 58.9
Monetary sector Base money (M0), % yoy 35.8 8.1 -11.8 30.5 -11.4 17.1 0.0 7.3 Broad money (M3), % yoy 13.9 14.2 6.0 18.6 13.2 11.3 5.2 8.4 Credit to the private sector, % of GDP 58.1 59.5 61.8 62.7 64.3 66.2 67.0 76.5 Degree of Monetisation (M3/GDP) 50.5 52.6 51.5 55.9 58.5 60.6 61.3 61.7
External sector Current account balance, % of GDP -2.4 -3.1 -3.4 -2.1 -4.2 -4.3 -3.5 -2.9 Trade balance, % of GDP -11.0 -9.0 -10.3 -10.8 -10.3 -12.0 -10.1 -9.2 Foreign direct investment flows, % of GDP 1.3 2.1 3.4 1.7 3.7 2.2 3.8 2.8 Import cover (months) --- 3.0 2.7 3.2 2.6 2.5 2.9 2.9
External Vulnerability External Debt, % of GDP --- 60.7 56.8 59.7 59.6 60.2 61.0 60.3 Debt-to-Export Ratio --- 199.7 202.3 201.3 197.1 178.6 199.8 185.2 Debt Service Ratio5 20.8 19.2 18.9 18.5 22.6 15.6 17.2 16.4 Reserves/M3 19.7 20.7 17.5 20.5 16.0 16.9 17.5 13.6
Financial sector Short-term interest rate6 8.64 6.88 6.89 5.99 5.88 6.04 5.93 5.3 Exchange rate (per USD, eop) 0.999 1.148 1.101 1.253 1.385 1.468 1.387 1.25 Exchange rate (per EUR, eop) 1.251 1.267 1.285 1.258 1.289 1.294 1.455 1.413 Real effective exchange rate (1995=100) 100.7 100.6 100.5 101.5 100.8 98.3 94.0 90.0
Source: Tunisian Ministry for Economic Development, Central Bank of Tunisia, IMF, IIF, DRI-Wefa1 Total revenues exluding grants including social security accounts (CSS).2 Total expenditure and net lending including social security accounts (CSS).3 Consolidated government balance excluding grants, privatisation receipts and social security accounts.4 External and domestic debt including social security funds' debt and public enterprises' debt.5 Total debt service in % of exports goods, services & income.6 Discount rate.
- 133 -
WEST BANK and GAZA • West Bank and Gaza has experienced an unprecedented decline in national income
and a massive deterioration of living standards since the end of 2000, with the beginning of the second Intifada, and continuing into 2001 and 2002. Unemployment has increased significantly, with poverty affecting 60% of the population in 2003.
• Fiscal accounts have been severely affected by the erosion of the Palestinian
Authority’s tax collection capacity and loss of tax transfers from Israel since the end of 2000, although Israel resumed its payments on a regular basis from the beginning of 2003 and also arrears started to be paid.
• In June 2002, the Palestinian Authority (PA) announced reforms in five domains, the
“100 Days Plan”, most of which have been implemented or initiated. In 2003, they formulated a Socio-Economic Stabilisation Plan, 2004-2005, which sets out emergency and medium-term financing needs, incorporating the 2004 budget.
• An interim Association Agreement on Trade and Cooperation was signed in February
1997 and came into force in July of the same year, although progress on implementation has been difficult since the outbreak of the second Intifada. An EU-PA meeting in Ramallah in June 2003 examined ways to fully implement the agreement.
1. Macroeconomic developments Real sector developments Since the beginning of the Intifada at the end of 2000, the Palestinian economy has gone into severe decline. This principally stems from the Israeli closure188 policy, which hit the Palestine economy through several channels. These include the collapse of tourism, the inability of Palestinian workers to work in Israel, and the inability of Palestinians within the territories to undertake basic economic activities, which has increased transactions costs189 significantly. Lower incomes have also forced the population to use savings to finance daily expenditures, thereby negatively impacting upon the level of investment. All these factors have had a negative impact on domestic demand, with estimates of the decline in real income ranging from 30-50% over three years to the end of 2003. In 2002, real GDP was estimated to have fallen by around 15%, with consumption down by around 8% in real terms, investment down by over 30%, and exports falling by over 20%.190 In 2003, the economy stabilised somewhat and a modest pick up in economic activity could be recorded due to several positive factors. The closures eased after operation Defensive Shield in 2002, allowing a recovery of the number of Palestine workers in Israel. The launching of the Roadmap for peace improved the political situation, and violence diminished in the first part of 2003. In addition, Israel began to repay arrears on tax revenues (clearance) collected on behalf of the PA, providing a 188 “Closures” refer to the restrictions on movement of people and goods externally, between the West Bank and Gaza and Israel, and internally within the territories. 189 The already high costs of transporting goods have doubled since lorries have to take longer routes along poor quality roads and tracks to get to their destinations. 190 World Bank, “27 months of Intifada, Closures and Palestinian Economic Crisis - An Assessment”, July 2003.
- 134 -

stimulus for domestic demand. Despite some deterioration in the second half of 2003, these factors are likely to have led to a positive real growth of around 4.5% in 2003, albeit from a low base. As a result of the external closure policy, the loss of employment opportunities in Israel and the significant negative effects on the domestic economy from the Intifada, the unemployment rate increased significantly up to the end of 2002. Pre-Intifada, around 150,000 Palestinians commuted to Israel to work, but at the beginning of 2003, this figure was down to around 50,000 workers. The annual average unemployment rate rose from 14% in 2000 to 36% in the third quarter of 2002. However, in the fourth quarter of 2002 and into 2003, unemployment fell back to broadly 30% of the labour force, as closures were eased somewhat, more Palestinians worked in Israel, and employment in agriculture and other sectors increased. Pressures on the labour market have softened further during 2003, with the unemployment rate declining to 26% at the end of 2003.191
50
60
70
80
90
100
110
1995 1996 1997 1998 1999 2000 2001 2002 2003
GDP per capita
GNI per capita
Source: World Bank Estimates, EIU
Chart 45: West Bank and Gaza - GDP and GNI per capita developments
Index: 100 = 1995
The standard of living of a large proportion of the population has fallen dramatically (Chart 45). GNI per capita (which includes workers remittances) fell by around 26% in 2002, and poverty levels increased dramatically, with those living on less than USD 2 per day tripling to 60% of the population since the beginning of the Intifada. This per capita level has improved only slightly during 2003 despite positive growth developments, since the population has grown by around 4%, leaving the proportion of the population in poverty unchanged. Health and food consumption indicators have also declined. Worst affected have been remoter villages, which have lost contact with Israeli and WBGS goods and labour markets. The close monetary and economic ties, particularly trade links, between West Bank and Gaza, and Israel mean that overall price movements are highly correlated, and tend to be linked to shekel/US dollar rate movements. However, recent price developments in Gaza and in the West Bank have shown different trends due to the different impact of the Intifada and closure policy, particularly in 2002 with operations Defensive Shield and Determined Path. For example, in Gaza, the recession has been much more pronounced than in the West Bank, and domestic demand has been more subdued. In addition, the tighter closure policy in the West Bank has had a much greater impact upon transportation costs, which has to a large extent offset the
191 IMF, “Macroeconomic Developments, Outlook, and Reform in the West Bank and Gaza”, AHLC Meeting, Rome, December 10-11, 2003
- 135 -
dampening effect of the recession. As a result, price increases in the West Bank in 2002 reached around 6%, compared to 2.7% in the Gaza strip, broadly 5.7% overall. In 2003, prices are expected to have risen by around 1.1% in the West Bank and Gaza. Fiscal policy Since the beginning of the Intifada, the PA budget has been in crisis. The ongoing security situation has continued to affect PA’s capacity to collect revenues, with Israeli transfer payments remaining largely unpaid, and with increased needs for emergency expenditure. Revenues collapsed as Israeli transfer payments, accounting for broadly two-thirds of the PA’s pre-intifada revenues (derived mainly from indirect taxes, VAT, import taxes, and excise taxes), were stopped at the beginning of the Intifada, and only resumed on a regular basis in 2003. Against this background, the PA has implemented a series of austerity expenditure plans to limit spending and allocating resources to areas that are crucial to maintain the viability of the Palestinian Authority. In 2002, domestically collected revenues reached USD 225 million, with some clearance payments made by Israel totalling USD 29 million. With expenditures limited to USD 90 million per month, there was a financing gap of USD 773 million for the whole year. This was filled through external donor support (mainly EU and Arab funds, USD 465 million), some domestic bank financing and through arrears accumulation. By the end of 2002, total gross revenues withheld by Israel amounted to over USD 700 million or USD 450 million, netting out PA payments due to Israel for electricity, water and other services. During 2003, there have been some positive developments as the Roadmap process began, Israeli transfer payments resumed and Israeli arrears related to earlier transfers were paid. The 2003 budget maintained a tight expenditure stance of broadly USD 90 million per month, assuming continued donor support around the same level as in 2002. With Israel also making payments from the stock of withheld transfer payments, the PA intended to use these to clear its own domestic arrears to the private sector and to clear bank debt. However, although domestic revenues increased in 2003, as a result of transfer revenues received from Israel (USD 35 million per month from January to November), external donor support and Israeli transfers from the stock of arrears were less than expected. This means that expenditures had to be compressed relative to the budgeted amount. This reduction has mainly fallen on non-wage expenditures, but the budget still remains under pressure. Although the PA was able to clear virtually all of its arrears to the private sector (unpaid bills to suppliers and refunds for VAT), which has been important in providing much needed liquidity to the economy, it was not able to reduce its bank debt, with bank financing having increased up to USD 160 million during the year 2003. The breakdown in the Roadmap process has postponed the prospect of any significant economic recovery in the short-term. The budgetary situation will remain very difficult until the economy recovers significantly. Until then, substantial donor support will continue to be necessary to allow the PA carry out its basic functions without running up further arrears and/or large debts. An Ad-Hoc Liaison Committee (AHLC) donor meeting in Rome in December 2003 discussed the Medium-Term Plan, 2004-2005 of the PA and possible financing needs.
- 136 -

Monetary and exchange rate policy The Palestine Monetary Authority (PMA), established in 1994, has only limited functions. It is responsible for licensing, supervising and inspecting banks; determining the liquidity requirements on all deposits held by banks operating in the self-rule areas; and managing foreign exchange reserves and foreign currency transactions. The PMA also has the power to regulate and supervise capital activities in the self-rule areas, including the licensing of capital market institutions, finance companies and investment funds. In any future Palestinian state, the PMA would be expected to become the Central Bank. The PMA does not have the right to issue currency or to conduct independent monetary and exchange rate policies. Without a national currency, the PA is not able to use monetary and exchange rate policy instruments to address economic imbalances. The Israeli and Jordanian currencies are valid legal tender, while the US dollar remains an important currency for business transactions and as a reserve asset. Despite the stresses caused by the Intifada, the financial system continues to function, and provides basic services to the population. This is to a large extent due to rapid growth in bank deposits between the mid-1990s and the second Intifada, which have been mostly re-invested overseas. Furthermore, the banks have adopted a cautious lending policy due to the risky political and security environment, as well as the difficulty in enforcing contracts. Nevertheless, during the period of the Intifada, non-performing loans have increased from around 8% to around 30% in 2002, although, given the nature of banks’ balance sheets, this represents less than 10% of assets. Surprisingly, the deposit base has remained fairly stable during the Intifada. External sector developments Despite trade and co-operation agreements with Jordan, Egypt, Saudi Arabia, the European Union, the United States and others, which all provide preferential access for WBG exports, there has been almost no geographical diversification of trade. West Bank and Gaza trade remains dominated by Israel. Broadly 80% of all raw materials, essential commodities, services and finished goods originated in Israel, and Israel is the destination for 95% of Palestinian exports, according to data from 1999. Imports account for around 85% of GDP, while exports account for around 15% of GDP. Palestine’s chronic trade deficit (60-75% of GDP) reflects this trade orientation towards Israel, a narrow export base and the substantial import dependence of the domestic economy.192 Furthermore, the disadvantage of narrow industrial and agricultural production bases has been exacerbated by Israeli restrictions on the use of natural resources, as well as occasional border closures. Although earnings by Palestinian workers in Israel and remittances from abroad partly offset the large trade deficits, resulting in current account deficits of around 30% of GDP, international donor support has been needed to meet the remaining financing requirement. In 2002-03, these financial assistance flows have allowed to compress the current account deficit below 20% despite an increase of the trade deficit to close to 80% of GDP. The widespread closures of the Palestinian territories since the outbreak of the unrest have severely reduced trade activities.193 According to World Bank data, exports declined by around 30% in value terms between the beginning of the Intifada and the end of 2002, while imports fell by around 36% over the same period. This was particularly the case after operation Defensive 192 UNCTAD, ‘Report on UNCTAD’s assistance to the Palestine people’, 18 November 2002. 193 Trade data has to be analysed with caution because of the lack of custom stations between the West Bank and Israel.
- 137 -
Shield, when transaction costs increased (transport and administrative) for both exports and imports, as the free movement of labour and goods was restricted. 2. Structural reforms In June 2002, the PA released a new reform agenda, in which it expressed its commitment to a broad programme of reforms. Although a substantial part of the envisaged measures will be implemented in the mid to long term, the whole reform agenda has been named the “100 Days Plan”, as a critical mass of reforms was planned to be undertaken within 100 days.194 This agenda has two main planks: the promotion of transparency and accountability in the public sector, and the creation of a supportive environment for private sector development. Much progress was made with many reforms having been either completed or initiated. Towards the end of 2003, the PA formulated a Medium Term Plan setting out the financing needs for the Palestinian economy in 2004 and 2005.195 Trade liberalisation The current trade regime was defined under the Paris Protocol.196 In the medium to long term, boosting exports will mean increased trade with Israel and other countries. For such a strategy to succeed, the West Bank and Gaza will have to become more competitive. The Ministry of National Economy has undertaken a series of programs, on its own and with the help of various international donors, to develop its capacity, which should help it to build a harmonised and coherent policy on trade. Such programmes have included the Commercial Diplomacy Program,197 the Economic Policy Program,198 and the development of a public-private dialogue covering also national trade and economic matters. Looking forward, other trade policy management issues that need to be addressed include further strengthening of staff capabilities to make full use of bilateral and multilateral/regional trade agreements, and an overarching review of the Paris Protocol to define the most appropriate trade regime199, based on a clear economic vision and permanent economic arrangements with Israel and in the context of any Permanent Status Agreement. Fiscal and public administration reform Since the beginning of the Intifada, several reforms have been implemented to improve effectiveness, efficiency and transparency in the context of EU and other donor budget support operations. On the revenue side, all revenues are now transferred to the Single Treasury Account (STA) at the Ministry of Finance, including the transfer of income from PA commercial activities. After an independent evaluation, PA assets have been transferred into the newly created Palestinian Investment Fund (PIF), with consideration now being given to privatisation of those assets. 194 Palestine Authority, “100 Days Plan of the Palestinian Government”, 23 June 2002. 195 Palestine Authority, “Socio-Economic Stabilisation Plan, 2004-2005”, 10 December 2003. 196 Next to trade relations, the Paris Protocol also covers fiscal, labour and monetary relations. 197 UNCTAD. 198 Funded by DFID and focusing on WTO accession standards and legislation. 199 Based also on the Free Trade Area/Custom Union/Non Discriminatory Trade Regime options currently under study.
- 138 -

On the expenditure side, control has been improved through various measures. PA employment is more tightly controlled after the transfer of the payroll in August 2002 to the Ministry of Finance. While this has had a very positive effect, PA employment levels continued to increase. The move in 2003 from cash to bank account payments for security service personnel has been a step towards further tightening in this area by, allowing for greater control through a full data base. Other measures have included the development of modern and effective internal and external audit services. While the systems are now in place, they need to be effectively implemented. In order to improve transparency, extensive budget data is now published on a regular basis, and the 2003 budget is much more comprehensive than in previous years, including on the macroeconomic framework, comparisons with previous years outturns, information on employment, PIF activities and bank borrowing. Progress has been made on establishing modern internal and external audit capabilities within the administration. Public administration reform, including that of the civil service, is central to improve governance of the PA, as it addresses horizontal issues affecting public institutions in various sectors of the Palestinian reform agenda. A long-awaited action plan dealing with these issues was finally released as a Ministerial Cabinet paper in the first quarter of 2003.200 Five Ministries were selected as pilot institutions for restructuring.201 The process intends: first, to build up a personnel registry for each Ministry, addressing the issue of positions and job description, and identifying the appropriate candidates; second, to improve administrative and work procedures. Based on the experiences and results of the work with the five pilot Ministries, this will be rolled-out across all Ministries under a longer-term reform plan. Improving cooperation between the three economic line ministries is also a priority. In addition to the above reform measures, internal rules and procedures for the conduct of the Ministerial Cabinet affairs have been approved and adopted. However, some PA institutions crucial to civil service reform, as well as quasi-governmental institutions, remain outside the authority and control of the Cabinet. This is hampering the reform in the domain of civil service. It is therefore recommended to reinforce the authority of the Cabinet over these institutions in order to ensure that they act according to the Cabinet’s general policy guidelines. In the last few years, but particularly in 2003, reform of the pension system was examined with assistance from international financial organisations, including steps to unify pensions schemes and including security staff within the scheme, while putting it on a more sustainable footing. It is expected that this issues will be addressed in 2004-05, as laid out in the third annex of the Socio-Economic Stabilisation Plan, 2004-2005 Privatisation, enterprise reform and business environment Assisted with donor funds, a three-year initiative is under way to stabilize existing enterprises, revitalise languishing businesses and stimulate the creation of new businesses to contribute to economic growth and job creation. The initiative is expected to target medium size enterprises not benefiting from micro enterprise support programs, and yet not enjoying the limited
200 Addressing other sectors of reform as well, such as that of the judiciary, public financial management, the development of a sound economic and business environment. 201 Culture, Local Government, Social Affairs, Labour and Planning.
- 139 -

privileged access to traditional bank financing.202 In addition to firm level technical assistance focusing on enterprise diagnostics, turnaround and crisis management, the financial facilitation component is expected to leverage a minimum of USD 50 million in domestic and international financing. In addition, a pilot emergency-lending program, specifically aimed at SME debt restructuring, has been launched funded by donors with USD 2 million in 2003. The need for restructuring Palestinian enterprises remains high, and such issues are also addressed within a wider Economic Recovery Strategy203 for the PA. The PA is also considering the preparation and implementation of an Industrial Modernization Program for Palestine, for which donor support is likely to be requested. The legislative/regulatory agenda on economic reforms needs to be advanced through the Palestinian Legislative Council (PLC) and the Executive. Key laws include the Capital Markets Authority Law, the Income Tax Law amendments, the Competition Law, the Foreign Trade Act, the Intellectual Property Law and revisions to the Customs Law and tariffs. In terms of direct support to the private sector, the EC has allocated EUR 30 million for emergency support to SME's of East Jerusalem and West Bank & Gaza. The funds are managed by the Palestinian Development Fund (Palestinian Banking Corporation groups) to provide financial relief and working capital assistance to SMEs in Gaza and the West Bank/East Jerusalem. At the end of 2003, further reforms covering a comprehensive short, medium and long term strategy for the private sector were being considered, including the completion of the legislative reform process, the strengthening of institutions and trade policy management. 3. Relations with the EU and IFIs The Interim Association Agreement on trade and co-operation between the European Community and the Palestine Liberation Organisation (PLO) was signed on 24 February 1997 for the benefit of the Palestinian Authority. Its main objective is to create a free-trade area between the European Union and the West Bank and Gaza, and to establish a comprehensive framework for political, trade, economic and financial co-operation. The Agreement entered into force on 1 July 1997. The first Joint Committee pursuant to this Interim Association Agreement was held on 23 May 2000 in Brussels. To date, the implementation of the agreement has been very slow, and the sensitive political situation has not yet allowed negotiations for a full Association Agreement. An EU-PA meeting in Ramallah in June 2003 examined ways to fully implement the agreement. In order to preserve some degree of social stability, service delivery, basic health conditions, law and order and a governance structure for the future, the EU (and other donors) has sought to provide the Palestinian people with a safety net during the crisis since the end of 2000.204 The
202 A cooperation has been established between the US contractor and the EC emergency lending programme for WBG SME's. 203 Under preparation by the World Bank with local EC support. 204 Before the outbreak of the second Intifada, the European Community had committed EUR 731 million to West Bank and Gaza from 1994 to 1999. EUR 498.85 million in grants from the Community budget, EUR 215 million worth of EIB loans and another EUR 17.25 million EIB interest rate subsidies provided by the European Community budget.
- 140 -
EC has responded with increased financial support and rapid disbursement through: a continuous budgetary support of EUR 10 million per month up to the end of 2002; humanitarian aid; and increased aid to UNRWA and Middle East peace projects. EUR 20 million was also allocated to the World Bank Emergency Services Support Programme to support non-wage operational costs in the health sector and for municipalities. In 2003, a reform support instrument worth EUR 80 million to help clear PA arrears to the private was implemented, with EUR 40 million paid in the first half of the year, and the remaining EUR 40 million envisaged towards the end of the year. In terms of direct support to the private sector, the EC has allocated EUR 30 million for emergency support to SME's of East Jerusalem and West Bank & Gaza. The IMF has no formal relations with West Bank and Gaza given their status as ‘territories’. However, a resident representative of the IMF provides an important reporting role on budgetary revenues and expenditures, and reforms in the context of conditions relating to EC and other donor assistance. In 2002, the World Bank activated two projects (the Emergency Services Support Programme and the Integrated Community Development Project) financed with other donors, aimed at mitigating the deterioration of basic social and municipal services resulting from the ongoing conflict. In 2003, the Bank launched a USD 20 million Emergency Municipal Services Rehabilitation Project in close collaboration with the EC and Belgium, and approved an Emergency Water Project. The Bank has also undertaken much analytical work during the course of the Intifada, and plays an important role in donor coordination, as hair of the Consultative Group process and secretariat for the Ad-Hoc Liaison Committee. 4. Concluding remarks Over nearly three years since the outbreak of the Intifada, most economic and social indicators in the West Bank and Gaza have shown steep declines. The income level has declined by around 40% since 2000, and poverty205 affects about 60% of the Palestinian population. The implementation of the Roadmap for Peace in the Middle East and significant progress towards a political settlement to the conflict are crucial elements for a resumption in economic activity. With regard to structural reforms, the PA has achieved significant progress in establishing a transparent and improved revenue and expenditure system, strengthening financial control, restructuring the largest monopoly (petroleum) and starting with a public administration and pension reform. However, further legislative reform is necessary, a basic regulatory framework needs to be implemented, and the capacity of the Ministry of Economy and other relevant agencies need to be strengthened. The PA is also encouraged to develop trade relations with the European Community, and to strengthen regional cooperation with Israel and neighbouring countries.
205 Poverty is defined as those living with less than USD 2 per day.
- 141 -
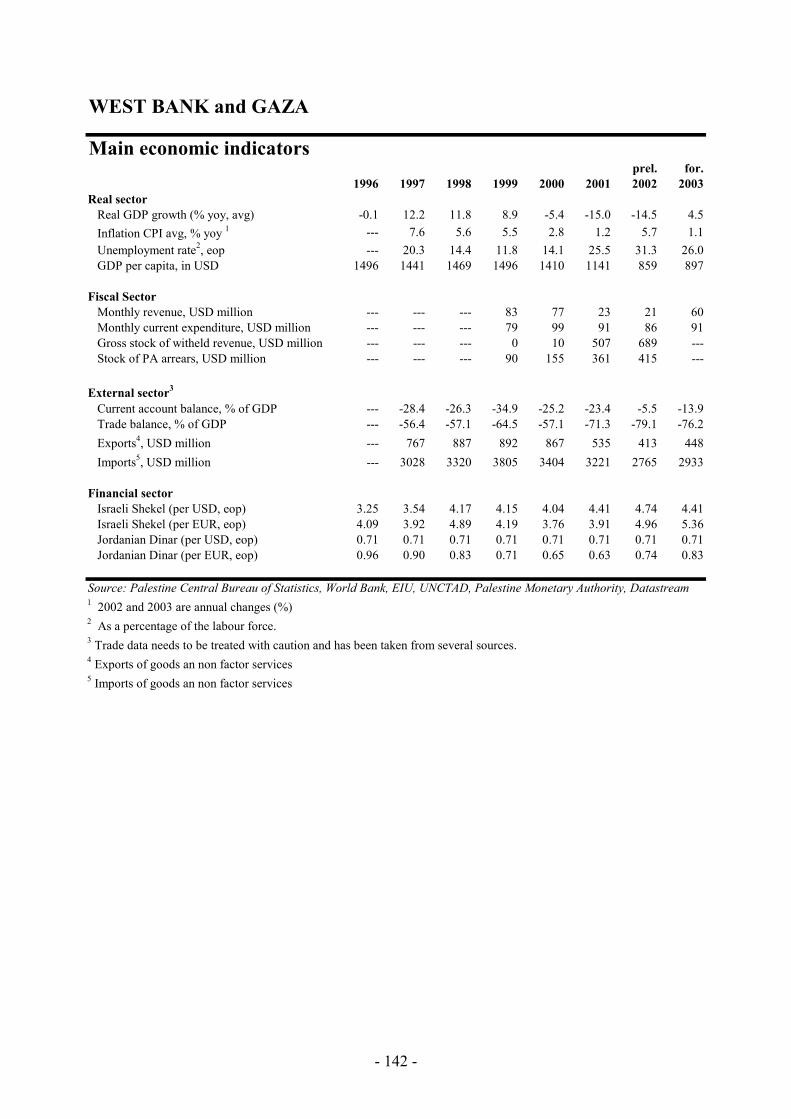
WEST BANK and GAZA
Main economic indicatorsprel. for.
1996 1997 1998 1999 2000 2001 2002 2003Real sector Real GDP growth (% yoy, avg) -0.1 12.2 11.8 8.9 -5.4 -15.0 -14.5 4.5 Inflation CPI avg, % yoy 1 --- 7.6 5.6 5.5 2.8 1.2 5.7 1.1 Unemployment rate2, eop --- 20.3 14.4 11.8 14.1 25.5 31.3 26.0 GDP per capita, in USD 1496 1441 1469 1496 1410 1141 859 897
Fiscal Sector Monthly revenue, USD million --- --- --- 83 77 23 21 6 Monthly current expenditure, USD million --- --- --- 79 99 91 86 91 Gross stock of witheld revenue, USD million --- --- --- 0 10 507 689 --- Stock of PA arrears, USD million --- --- --- 90 155 361 415 ---
External sector3
Current account balance, % of GDP --- -28.4 -26.3 -34.9 -25.2 -23.4 -5.5 -13.9 Trade balance, % of GDP --- -56.4 -57.1 -64.5 -57.1 -71.3 -79.1 -76.2 Exports4, USD million --- 767 887 892 867 535 413 448 Imports5, USD million --- 3028 3320 3805 3404 3221 2765 2933
Financial sector Israeli Shekel (per USD, eop) 3.25 3.54 4.17 4.15 4.04 4.41 4.74 4.41 Israeli Shekel (per EUR, eop) 4.09 3.92 4.89 4.19 3.76 3.91 4.96 5.36 Jordanian Dinar (per USD, eop) 0.71 0.71 0.71 0.71 0.71 0.71 0.71 0.71 Jordanian Dinar (per EUR, eop) 0.96 0.90 0.83 0.71 0.65 0.63 0.74 0.83
Source: Palestine Central Bureau of Statistics, World Bank, EIU, UNCTAD, Palestine Monetary Authority, Datastream1 2002 and 2003 are annual changes (%)2 As a percentage of the labour force.3 Trade data needs to be treated with caution and has been taken from several sources. 4 Exports of goods an non factor services5 Imports of goods an non factor services
0
- 142 -

REFERENCES Abed G. "Trade liberalisation and tax reform in the Southern Mediterranean region", IMF WP/98/49, Washington, April 1998. Abed G., IMF (Director of the Middle East department), Press statement at the G7 meeting in Dubai, September 2003. Abed G. "Unfulfilled promise", Finance and Development, IMF Bennet A. "Failed legacies", Finance and Development, IMF 2003. Abed G., Davoodi H. "Challenges of growth and globalisation in the Middle East and North Africa", IMF, September 2003. Abiad A. and Mody A., 2003, “Financial Reform: What Shakes It?”, IMF Working Paper 2003/70, April 2003. Alesina A., Perotti R. "Fiscal adjustments in OECD countries: composition and macroeconomic effects", NBER WP 5730, August 1996. Aly Tawfik Al-Sadek, Ma’bad Al-Garhi and Nabeel Latif (Editors), “Monetary Policies in the Arab Countries”, The Arab Monetary Fund, May 1996. Arab Monetary Fund, “Annual Report 2002”, Abu Dhabi, 2002. Balassa S., "The Purchasing Power Parity Doctrine: A Reappraisal, "Journal of Political Economy 72 (December 1964), pp. 584 - 596. BankScope Database, 2003. Benachenhou A. Minister of Finance, Algeria, Speech, , mid-October 2003. Bennet A. "Failed legacies", Finance and Development, IMF (March 2003). Bossone B. and Lee Jong-Kun, 2002, “In Finance, Size Matters”, IMF Working Paper 2002/113. Creane S., Goyal R., Mushfiq Mobarak A. and R. Sab, 2003, “Banking on Development – Why Financial Sector Development is Crucial, in Finance and Development”, IMF, Washington DC, March 2003. Dasgupta D., Keller J., Srinivasan T.G., "Reform and elusive growth in the Middle-East - What has happened in the 1990's?", World Bank (MENA) Working Paper 25, 2002. Dhonte P., Bhattacharya R., Yousef T., "Demographic Transition in the Middle East: Implications for Growth, Employment, and Housing", IMF Working Paper 41, 2001. ECB, " Financial and economic links between the Mediterranean region and the euro area: an overview" unpublished, Frankfurt, October 2003. ECB, 2002, “Financial Sectors in EU Accession Countries”, Frankfurt, October 2002.
- 143 -

Economic Research Forum, 2002, ‘Economic Trends in the MENA Region, 2002’ Chapter Two, Financial and Capital Markets, Privatisation and FDI, ERF, Cairo, 2002. Economist Intelligence Unit, "Country Forecast: Algeria", 11 September 2003. Economist Intelligence Unit, "Country Report: Algeria" 3 November 2003. Economist Intelligence Unit - Business Middle East, "Regulatory Watchlist: Algeria", 1 November 2003, Number 1350-7354. Economist Intelligence Unit “Syria country report”, April 2003. EIB, "Opportunities and Constraints for Private Sector Development in Mediterranean Countries". Luxembourg, September 2002. EIU, “Tunisia: Country outlook”, London, 17 October 2003. Eken S., Helbling T and Mazarei A., "Fiscal policy and growth in the Middle East and North Africa Region, IMF WP/97/101, August 1997. Eken, S., Robalino D., Scheiber G. "Living better" Finance and Development, IMF, March 2003. European Commission No 2698/2000 of 27 November 2000 amending Regulation (EC) No 1488/96 on financial and technical measures to accompany (MEDA) the reform of economic and social structures in the framework of the Euro-Mediterranean partnership. European Commission, unpublished identification mission report on poverty reduction in Egypt, February 2003. European Commission Occasional Papers, 2003, “Economic Review of EU Mediterranean Partners”, No. 2 - January 2003. European Commission, COM(2003) 104 “Wider Europe – Neighbourhood: A New Framework for Relations with our Eastern and Southern Neighbours”. European Commission, COM(2003) 393 final. Communication from the Commission “Paving the way for a New Neighbourhood Instrument”. European Commission, COM (2003) 587 Communication from the Commission to the Council “Shaping Support for Private Sector Development in the Mediterranean”. European Commission, COM(2002) 276 Communication from the Commission on Impact Assessment, dated 5.6.2002. European Commission Delegation in Syria, various reports, 2003. Fanizza D., Laframboise N., Martin E., Sab R., Karpowicz I., "Tunisia's Experience with real exchange rate targeting and the transition to a flexible exchange rate regime", IMF Working Paper 190, 2002.
- 144 -
FEMISE, "Economic transition process and the implementation of the Euro-Mediterranean Partnership", FEMISE Report September 2001. FEMISE, "The evolution of the structure of trade and investments between the European Union and its Mediterranean Partners", report presented at the Euro-Mediterranean ministerial meeting in Toledo, March 2002. Friedmann E. and others, "Dodging the Grabbing Hand: The Determinants of Unofficial Activity in 69 Countries", Journal of Public Economics, June 2000. Garner E., "Wanted: more jobs", Finance and Development, IMF, March 2003. Gelbard E. A. and Pereira Leite S., 1999, “Measuring Financial Development in Sub-Saharan Africa”, IMF Working Paper 99/105, August 1999. Gupta S., Clemens B., Baldacci E. and Mulas-Granados C, "Expenditure composition, fiscal adjustment and growth in low-income countries", IMF WP/02/77, April 2002. Gwartney J., Lawson R., Park W, Wagh S., Edwards C., de Rugy V, "Economic Freedom of the World: 2002 Annual Report", Vancouver: The Fraser Institute, 2002. Data retrieved from www.freetheworld.com Gwartney J., Lawson R., "Economic Freedom of the World: 2003 Annual Report", Washington DC, July 2003. Heritage Foundation , "2002 Index of Economic Freedom". IMF, “Capital Markets and Financial Intermediation in the Baltic States”, IMF Country Report No. 03/115, August 2003. IMF "Fiscal reforms in low-income countries", staff team led by G. Abed, IMF Occasional Paper 160, March 1998. IMF, “Investment, growth in the Middle East and North Africa”, WP/96/124. IMF, “Money Demand and Monetary Policy: Evidences from Algeria", forthcoming IMF, “The IMF and the Middle East and North Africa”, an IMF Issues Brief, Washington, August 2003. IMF, International Financial Statistics, Internet Database 2003. IMF, various Country Reports, Financial Sector Assessment Program. IMF Regular Staff Reports on individual Mediterranean countries. IMF, Direction of Trade Statistics, 2002. IMF (various years), Annual Report on Exchange Arrangements and Exchange Restrictions, Washington.
- 145 -
IMF, "World Economic Outlook 2002", Washington, 2002. IMF, "World Economic Outlook 2003", Dubai/Washigton, September 2003. IMF, “Macroeconomic Developments, Outlook, and Reform in the West Bank and Gaza”, AHLC Meeting, Rome, December 10-11, 2003. International Energy Agency, various Oil Market Reports, 2003. Institut National d'Analyse de la Conjuncture, "Note de Conjuncture" Rabat, June 2003. Iqbal, Z., "Macroeconomic Issues and Policies in the Middle East and North Africa, IMF, Washington, 2001. Kaufmann D., Kraay A., Zoido- Lobatón "Governance Matters (World Bank Policy Research Working Paper 2196)", October 1999. Kaufmann D., Kraay A., Zoido- Lobatón, "Governance Matters II: Updated Indicators for 2000–01", January 2001. Kaufmann D., Kraay A. and Mastruzzi M., "Governance Matters III: Governance Indicators for 1996-2002". Kahn M. S., Senhadji A. S., "Financial Development and Economic Growth: An Overview", IMF Working Paper 00/209, Washington D.C., September 2003. Keller J., Nabli M. "The macroeconomics of labour outcomes in the MENA over the 1990s: why growth has failed to keep pace with a burgeoning labour market", paper presented to the EC Network of Euro-Med experts in transition economies, 2002. Krause G., “Export competition between Morocco and accession countries: some stylised facts”, Brussels, forthcoming. Lee Jong-Kun, “Financial Liberalisation and Foreign Bank Entry in MENA”, World Bank (Financial Sector Strategy and Policy), May 2002. Middle East Review World of Information, p. 1, 2 October 2002. Mussa M. and others, "Exchange Rate Regimes in an Increasingly Integrated World Economy" IMF Occasional Paper 193, Washington, 2000. Nashashibi, K., "Fiscal Revenues in South Mediterranean Arab Countries: Vulnerabilities and Growth Potential", April 2002. Nashashibi K., Gupta S., Liuksila C., Lorie H., Mahler W. "The fiscal dimensions of adjustment in low-income countries", IMF Occasional Paper, April 1992. Nashashibi K., Elhage M., Fedelino A., “Financial Liberalisation in Arab Countries”, in Macroeconomic Issues and Policies in the Middle East and North Africa, IMF, ed. Zubair Iqbal, 2001.
- 146 -
Palestine Authority, “100 Days Plan of the Palestinian Government”, 23 June 2002. Palestine Authority, “Socio-Economic Stabilisation Plan, 2004-2005”, 10 December 2003. Reiffers, J.L and Aubert, J.E. "The development of knowledge-based economies in the Middle East and North Africa - key factors", paper presented at the conference on "Knowledge for development" by the World Bank, Marseilles, 12 September 2002. Rupper Bulmer E. "Rationalising public sector employment in the MENA region", World Bank WP 19, December 2000. Sala-I-Martin X., Artadi E. V., "Economic Growth and Investment in the Arabic World" in "Arab Competitiveness Report 2002", World Economic Forum, 2002. Tunisian Ministry of Finance, “2003 budget”. Tunisian Central Bank, “The economic situation periodical”, quarterly publication, Tunis, June 2003. Tunisian Central Bank, “Press Release of the BCT Executive Board Meeting held on 13 November 2003”, Tunis. UNCTAD, ‘Report on UNCTAD’s assistance to the Palestine people’, 18 November 2002. UNDP Arab Human development report (2002). UNDP Arab Human development report (2003). USA Embassy in Egypt, “Economic Trends Report”, September 2003. World Bank "Egypt social and structural review, chapter IV: Towards a more result oriented budget process", 2001. World Economic Forum "Arab Competitiveness Report 2002-2003", Geneva, 2002. World Bank "Unlocking the employment potential in the Middle East and North Africa", WB 2003. World Bank, "World Development Indicators, 2001." World Bank, "World Development Indicators, 2002." World Bank, “World Development Indicators, 2003.” World Bank, “Global Development Finance”, 2003. World Bank, “27 months of Intifada, Closures and Palestinian Economic Crisis - An Assessment”, July 2003. World Economic Forum, "Arab Competitiveness Report 2002", 2002. WTO Secretariat, "Report on the trade policies and practices of Morocco", Geneva, June 2003.
- 147 -
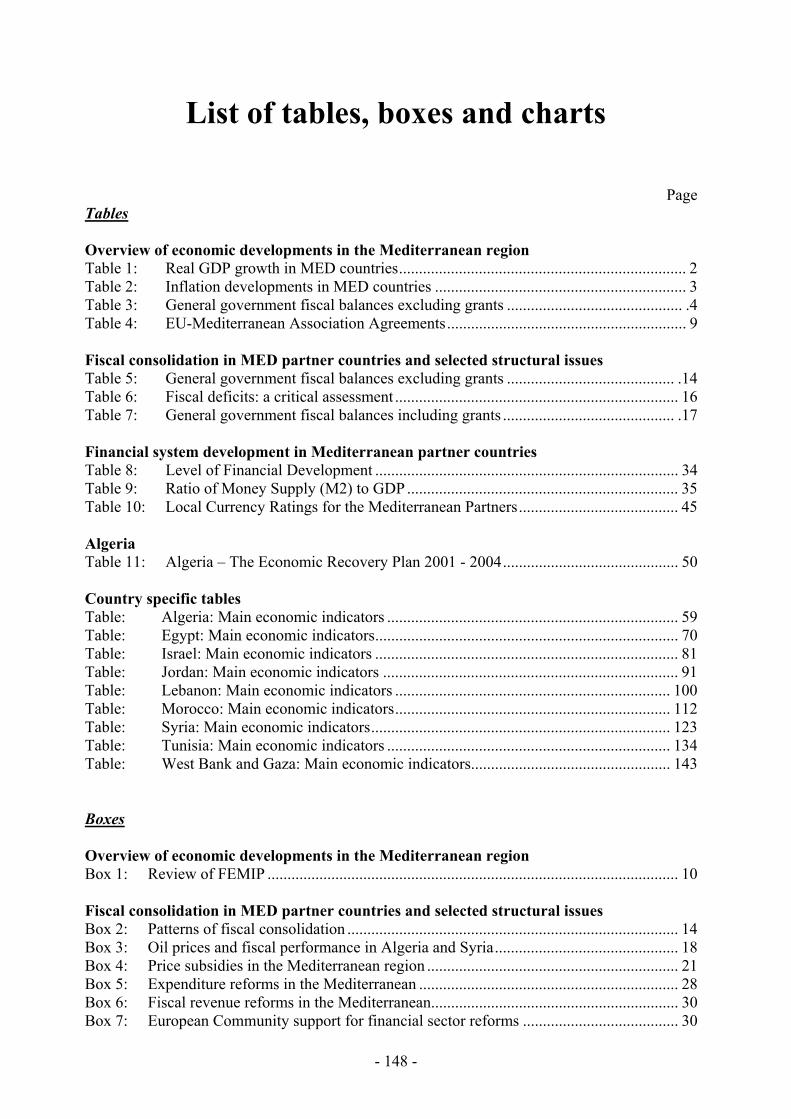
List of tables, boxes and charts Page Tables Overview of economic developments in the Mediterranean region Table 1: Real GDP growth in MED countries........................................................................ 2 Table 2: Inflation developments in MED countries ............................................................... 3 Table 3: General government fiscal balances excluding grants ............................................ .4 Table 4: EU-Mediterranean Association Agreements............................................................ 9 Fiscal consolidation in MED partner countries and selected structural issues Table 5: General government fiscal balances excluding grants .......................................... .14 Table 6: Fiscal deficits: a critical assessment ....................................................................... 16 Table 7: General government fiscal balances including grants ........................................... .17 Financial system development in Mediterranean partner countries Table 8: Level of Financial Development ............................................................................ 34 Table 9: Ratio of Money Supply (M2) to GDP .................................................................... 35 Table 10: Local Currency Ratings for the Mediterranean Partners........................................ 45 Algeria Table 11: Algeria – The Economic Recovery Plan 2001 - 2004............................................ 50 Country specific tables Table: Algeria: Main economic indicators ......................................................................... 59 Table: Egypt: Main economic indicators............................................................................ 70 Table: Israel: Main economic indicators ............................................................................ 81 Table: Jordan: Main economic indicators .......................................................................... 91 Table: Lebanon: Main economic indicators ..................................................................... 100 Table: Morocco: Main economic indicators..................................................................... 112 Table: Syria: Main economic indicators........................................................................... 123 Table: Tunisia: Main economic indicators ....................................................................... 134 Table: West Bank and Gaza: Main economic indicators.................................................. 143 Boxes Overview of economic developments in the Mediterranean region Box 1: Review of FEMIP ....................................................................................................... 10 Fiscal consolidation in MED partner countries and selected structural issues Box 2: Patterns of fiscal consolidation ................................................................................... 14 Box 3: Oil prices and fiscal performance in Algeria and Syria.............................................. 18 Box 4: Price subsidies in the Mediterranean region ............................................................... 21 Box 5: Expenditure reforms in the Mediterranean ................................................................. 28 Box 6: Fiscal revenue reforms in the Mediterranean.............................................................. 30 Box 7: European Community support for financial sector reforms ....................................... 30
- 148 -

Charts Overview of economic developments in the Mediterranean region Chart 1: Real economic developments in the MED region .................................................... 2 Chart 2: Inflation rate developments in MED countries......................................................... 3 Chart 3: Export and import developments.............................................................................. 6 Chart 4: MED external account balances in 2003 .................................................................. 6 Chart 5: State of play of structural/institutional reforms ........................................................ 7 Fiscal consolidation in MED partner countries and selected structural issues Chart 6: Fiscal consolidation 1980 - 2000............................................................................ 13 Chart 7: Composition of fiscal adjustment ........................................................................... 15 Chart 8: Budget balance vs. oil price developments in Algeria and Syria ........................... 18 Chart 9: Government size: central government expenditure ................................................ 19 Chart 10: Composition of government expenditures (2001-02)............................................. 19 Chart 11: Current expenditures and their breakdown (2001-02)............................................ 20 Chart 12: Composition of government revenues (2001-02) ................................................... 23 Chart 13: Breakdown of tax revenues .................................................................................... 24 Chart 14: Government effectiveness (2002)........................................................................... 27 Financial system development in Mediterranean partner countries Chart 15: Evolution of M1/M2............................................................................................... 36 Chart 16: Domestic Credit to GDP......................................................................................... 37 Chart 17: Deposit/Lending Spreads 1990 - 2002 ................................................................... 38 Chart 18: Selected Deposit/Lending Spreads (2002) ............................................................. 38 Chart 19: Deposit Money Bank Assets in % of GDP, 2001................................................... 39 Chart 20: Deposit Money Bank Assets Composition............................................................. 40 Chart 21: Ownership structure by number of banks (2002) ................................................... 41 Chart 22: Ownership structure by equity ownership .............................................................. 41 Chart 23: Stock market capitalisation – Number of listed shares........................................... 42 Algeria Chart 24: Algeria – Algeria - Consolidated budget balance..................................................... 51 Chart 25: Algeria – Real effective exchange rate developments.............................................. 52 Egypt Chart 26: Egypt – Exchange rate and inflation developments ................................................ 61 Chart 27: Egypt – Evolution of fiscal deficits (excl. grants) ................................................... 62 Israel Chart 28: Israel – Real GDP growth........................................................................................ 72 Chart 29: Israel – Exchange rate developments ...................................................................... 75 Chart 30: Israel – Governance indicators ................................................................................ 77 Jordan Chart 31: Jordan – Real economic growth .............................................................................. 83 Chart 32: Jordan – Fiscal developments.................................................................................. 84 Chart 33: Jordan – Current account developments.................................................................. 85
- 149 -
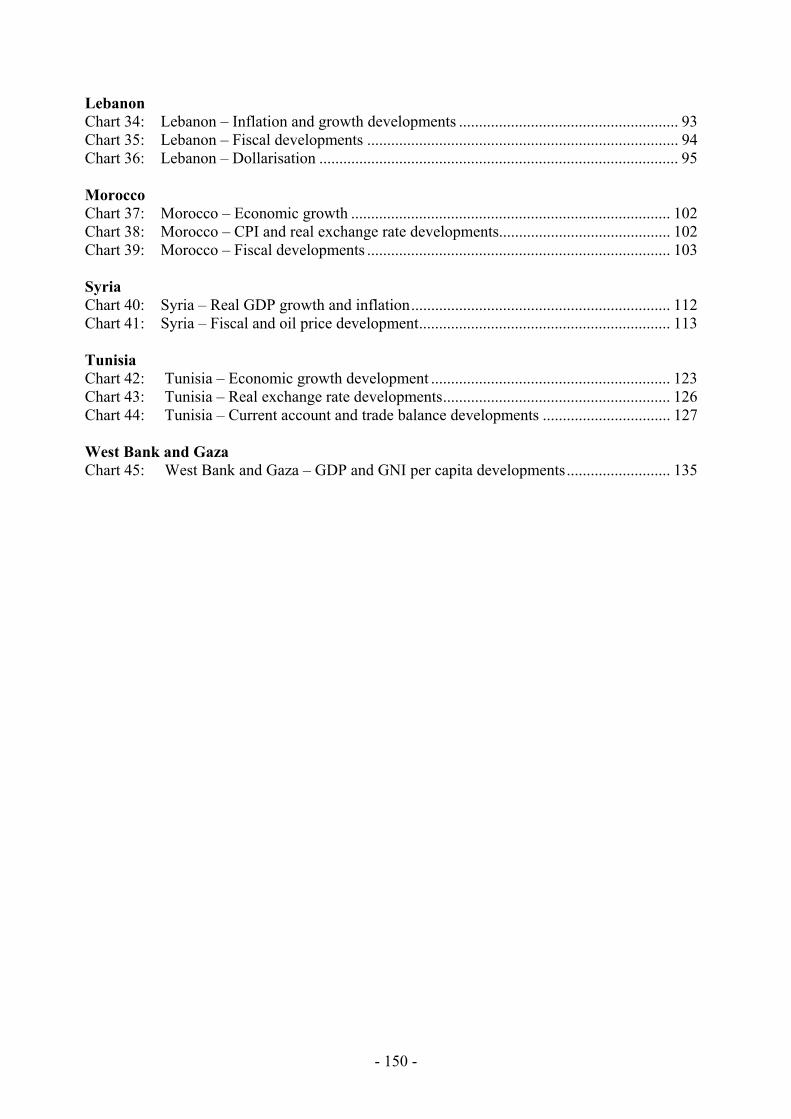
- 150 -
Lebanon Chart 34: Lebanon – Inflation and growth developments ....................................................... 93 Chart 35: Lebanon – Fiscal developments .............................................................................. 94 Chart 36: Lebanon – Dollarisation .......................................................................................... 95 Morocco Chart 37: Morocco – Economic growth ................................................................................ 102 Chart 38: Morocco – CPI and real exchange rate developments........................................... 102 Chart 39: Morocco – Fiscal developments ............................................................................ 103 Syria Chart 40: Syria – Real GDP growth and inflation................................................................. 112 Chart 41: Syria – Fiscal and oil price development............................................................... 113 Tunisia Chart 42: Tunisia – Economic growth development ............................................................ 123 Chart 43: Tunisia – Real exchange rate developments......................................................... 126 Chart 44: Tunisia – Current account and trade balance developments ................................ 127 West Bank and Gaza Chart 45: West Bank and Gaza – GDP and GNI per capita developments.......................... 135