european economic forecast
TRANSCRIPT
Economic and Financial Affairs
Autumn 2021Autumn 2021
ISSN 2443-8014 (online)
European Economic Forecast
INSTITUTIONAL PAPER 160 | NOVEMBER 2021
EUROPEAN ECONOMY

European Economy Institutional Papers are important reports analysing the economic situation and economic developments prepared by the European Commission's Directorate-General for Economic and Financial Affairs, which serve to underpin economic policy-making by the European Commission, the Council of the European Union and the European Parliament.
DISCLAIMER The views expressed in unofficial documents do not necessarily represent the views of the European Commission.
LEGAL NOTICE Neither the European Commission nor any person acting on behalf of the European Commission is responsible for the use that might be made of the information contained in this publication. This paper exists in English only and can be downloaded from https://ec.europa.eu/info/publications/economic-and-financial-affairs-publications_en. Luxembourg: Publications Office of the European Union, 2021 PDF ISBN 978-92-76-29731-4 ISSN 2443-8014 doi:10.2765/199989 KC-BC-21-017-EN-N
© European Union, 2021 Reuse is authorised provided the source is acknowledged. The reuse policy of European Commission documents is regulated by Decision 2011/833/EU (OJ L 330, 14.12.2011, p. 39). For any use or reproduction of material that is not under the EU copyright, permission must be sought directly from the copyright holders. CREDIT Cover photography: © iStock.com/kwasny221

European Commission Directorate-General for Economic and Financial Affairs
European Economic Forecast Autumn 2021
EUROPEAN ECONOMY Institutional Paper 160

ABBREVIATIONS
iii
Countries and regions
EU European Union
EA Euro area
BE Belgium
BG Bulgaria
CZ Czechia
DK Denmark
DE Germany
EE Estonia
IE Ireland
EL Greece
ES Spain
FR France
HR Croatia
IT Italy
CY Cyprus
LV Latvia
LT Lithuania
LU Luxembourg
HU Hungary
MT Malta
NL The Netherlands
AT Austria
PL Poland
PT Portugal
RO Romania
SI Slovenia
SK Slovakia
FI Finland
SE Sweden
UK United Kingdom
CN China
JP Japan
US United States of America
CIS Commonwealth of Independent States
EFTA European Free Trade Association
EME Emerging markets economy
EMU Economic and Monetary Union
MENA Middle East and North Africa
ROW Rest of the World
Economic variables and institutions
ACEA European Automobile Manufacturers' Association
CPI Consumer price index
ECB European Central Bank
ELB Effective lower bound
ESI Economic Sentiment Indicator
GDP Gross Domestic Product
GNI Gross National Income
HICP Harmonised Index of Consumer Prices
IMF International Monetary Fund

iv
OECD Organisation for Economic Cooperation and Development
OPEC Organization of the Petroleum Exporting Countries
PMI Purchasing Managers’ Index
PPP Purchasing power parity
Other abbreviations
APP Asset Purchase Programme
BCS Joint Harmonised EU Programme of Business and Consumer Surveys
COVID-19 Coronavirus disease 2019
EU-SILC European Union Statistics on Income and Living Conditions
FIGARO Full international and global accounts for research in input-output analysis
GM European Commission's Global Multi-country model
HEM Hypothetical extraction method
NACE Statistical classification of economic activities in the European Community
NGEU Next Generation EU
NLG Natural Liquefied Gas
PEPP Pandemic Emergency Purchase Programme
RRF Recovery and Resilience Facility
RRP Recovery and Resilience Plan
SME Small and medium-sized enterprise
SURE European instrument for temporary Support to mitigate Unemployment Risks in an
Emergency
TLTRO III Targeted longer-term refinancing operations
VAT Value-added tax
Graphs/Tables/Units
bbl Barrel
bn Billion
bp. /bps. Basis point / points
euro/MWh Euro per megawatt hour
lhs Left hand scale
mn Million
pp. / pps. Percentage point / points
pt. / pts. Point / points
Q Quarter
q-o-q% Quarter-on-quarter percentage change
rhs Right hand scale
tr Trillions
y-o-y% Year-on-year percentage change
Currencies
EUR Euro
ECU European currency unit
BGN Bulgarian lev
CNY Chinese yuan, Renminbi
CZK Czech koruna
DKK Danish krone
GBP Pound sterling
HUF Hungarian forint
HRK Croatian kuna
ISK Icelandic krona
MKD Macedonian denar
NOK Norwegian krone

v
PLN Polish zloty
RON New Romanian leu
RSD Serbian dinar
SEK Swedish krona
CHF Swiss franc
JPY Japanese yen
RMB Renminbi
TRY Turkish lira
USD US dollar

CONTENTS
vii
Executive Summary 1
PART I: Economic outlook for EA and EU 5
1. Setting the scene 7
1.1. The EU economy in autumn 2021 7
1.2. Key questions for the outlook 7
2. Economic outlook 11
2.1. International environment 11
2.2. Financial conditions 14
2.3. The growth outlook 17
2.4. Labour market 27
2.5. Inflation 30
2.6. Current account 33
2.7. Public finances and policy stance 34
3. Risks 39
4. Special issues 41
4.1. Supply side bottlenecks 41
4.2. Energy prices 49
4.3. Labour market: slack or tight? 52
4.4. Housing market 57
5. Boxes 61
PART II: Prospects by individual economy 63
Euro Area Member States 65
1. Belgium 66
2. Germany 68
3. Estonia 70
4. Ireland 72
5. Greece 74
6. Spain 76
7. France 78
8. Italy 80
9. Cyprus 82
10. Latvia 84
11. Lithuania 86
12. Luxembourg 88
13. Malta 90
14. The Netherlands 92
15. Austria 94
16. Portugal 96
17. Slovenia 98
18. Slovakia 100
19. Finland 102
viii
Non-EA Member States 105
20. Bulgaria 106
21. Czechia 108
22. Denmark 110
23. Croatia 112
24. Hungary 114
25. Poland 116
26. Romania 118
27. Sweden 120
Candidate Countries 123
28. Albania 124
29. Montenegro 126
30. North Macedonia 128
31. Serbia 130
32. Turkey 132
Other non-EU Countries 135
33. The United Kingdom 136
34. The United States 138
35. Japan 140
36. China 142
37. EFTA 144
38. Russian Federation 147
Statistical Annex 151
LIST OF TABLES
1. Overview - the autumn 2021 forecast 1
I.2.1. International environment 12
I.2.2. Composition of growth - EU 18
I.2.3. Composition of growth - euro area 20
I.2.4. Labour market outlook - euro area and EU 28
I.2.5. Inflation outlook - euro area and EU 32
I.2.6. General Government budgetary position - euro area and EU 36
I.4.1. Results from model simulation: deviations from Spring
forecast 2021, euro area 51
LIST OF GRAPHS
I.2.1. Growth in global GDP and global PMIs 11
I.2.2. Contributions to global non-EU GDP growth 12
I.2.3. World excluding EU, import volumes 13
I.2.4. Oil price assumptions 13
I.2.5. World Commodity indices 13
I.2.6. Central bank policy rate changes, G20 countries 14
I.2.7. Drivers of financial conditions 15
I.2.8. Benchmark 10-year government bond yields and implied
inflation expectations 16

ix
I.2.9. Stock market performance 16
I.2.10. Euro area interest rates 16
I.2.11. GDP demand-side components, EU 17
I.2.12. Gross value added in main sectors, EU 18
I.2.13. Composite credit cost indicators 18
I.2.14. Factors limiting production, EU 19
I.2.15. ESI and PMI, euro area 21
I.2.16. Google mobility report, EU 21
I.2.17. Vaccination and death rates, EU 21
I.2.18. Real GDP growth path, EU 24
I.2.19. Real gross disposable income and components, EU 25
I.2.20. Investment breakdown and investment rates since 2019, EU
excluding IE 26
I.2.21. Exports and external demand breakdown 26
I.2.22. GDP levels compared to 2019-Q4 27
I.2.23. Dispersion of GDP per capita at PPP, EU 27
I.2.24. Headcount employment in the EU 28
I.2.25. Employment change by sector in the EU 28
I.2.26. Unemployment rates 29
I.2.27. Inflation breakdown, EU 30
I.2.28. Breakdown of HICP inflation, euro area 31
I.2.29. Inflation expectations derived from implied forward inflation-
linked swap rates 33
I.2.30. Current-account balance, EU 34
I.2.31. Budget balance in EU countries: 2021-2023 34
I.2.32. General government balance change: breakdown of the
drivers 35
I.2.33. Public investment in the EU, in 2019 and in 2022 35
I.2.34. Growth of nationally-financed current expenditure in excess
of medium-term potential growth 36
I.2.35. General Government debt developments 36
I.2.36. Fiscal stance in the EU and the euro area 36
I.4.1. Quarterly real GDP and import volume growth rates in
advanced economies 41
I.4.2. Spot rates for container shipping 42
I.4.3. Global semiconductor sales 42
I.4.4. Gap between ordering a chip and delivery 43
I.4.5. Metal prices 44
I.4.6. Factors limiting production in EU industry 44
I.4.7. Pervasiveness of supply-side shortages in the EU in October
2021 45
I.4.8. Shortages vs. change in industrial output 45
I.4.9. Heatmap of shortages in manufacturing based on the
October 2021 BCS 45
I.4.10. Shortages vs. selling price expectations October 2021 BCS 46
I.4.11. Severity of shortages vs. annual HICP inflation 46
I.4.12. Simulated reduction in value added due to a 10% fall in
intermediate consumption of sectors most severely affected
by shortages 47
I.4.13. Spot and futures for natural gas and electricity 49
I.4.14. Labour market slack, EU 52
I.4.15. Beveridge curve, EU 53
I.4.16. Employment and gross value added evolution 54

x
I.4.17. Vacancies and unemployment, change between 2019-Q4
and 2021-Q2 54
I.4.18. Vacancies and unemployment rate, 2021-Q2 54
I.4.19. Labour shortages in industry 55
I.4.20. Labour shortages in services 55
I.4.21. Labour shortages in construction 55
I.4.22. House prices' growth before and during the pandemic 57
I.4.23. EU Building permits 57
I.4.24. Overvaluation metrics 2020 58
I.4.25. Bank loan flows to households & NPISH 59
LIST OF BOXES
I.2.1. New survey-based measures of economic uncertainty 22
I.5.1. Some technical elements behind the forecast 61
FOREWORD
xi
As vaccination campaigns progressed and restrictions started to be lifted, the EU economy rebounded
vigorously in spring and continued riding the re-opening wave over the summer. Labour market
conditions improved markedly in the second quarter, with the creation of about 1.5 million jobs and a
swift rebound in hours worked, as many workers exited job retention schemes. In the third quarter, output
and unemployment in the EU as a whole were virtually back to their pre-crisis levels, although the pace of
recovery is uneven across countries. Thanks to the strong and well-coordinated EU crisis response, the
damage to the EU economy appears considerably less than feared at the outset of the COVID-19
pandemic.
However, the revival of demand – in the EU, but also in most advanced economies – has been so strong
that supply is struggling to keep up. Logistics logjams, strained supply chains and shortages of raw
materials and intermediate inputs like microchips weigh on production and delivery times. Surging
energy prices, most notably for natural gas and electricity, are also constraining growth and fuelling
inflationary pressures. Labour supply shortages are emerging, at least in some sectors, as another
important factor limiting production.
These growth impediments and the current elevated price pressures are carefully analysed in this edition
of the forecast. They are to a large extent linked to the post-pandemic adjustment and can be expected to
be mostly transitory – though stronger and longer-lasting than previously expected. The EU economy is
thus projected to keep expanding and inflation to gradually decline. As the propelling forces of the re-
opening fade out, on the one hand, and supply bottlenecks loosen and energy prices abate, on the other,
growth will be supported by an improving labour market, favourable financing conditions and the full
deployment of the Recovery and Resilience Facility (RRF). As a result, real GDP in the EU is expected to
converge to the steady growth path the economy was set to follow before the pandemic by early 2023.
The level of uncertainty however is still high. The recent surge in COVID-19 cases across Europe came
as a stark reminder that COVID-19 has not been defeated yet, and that further increases in vaccination
rates – in and outside the EU – are crucial for a sustained recovery.
Director General
Economic and Financial Affairs

FROM RECOVERY TO EXPANSION,
AMID HEADWINDS
EXECUTIVE SUMMARY
1
The EU economy is rebounding from the pandemic recession faster than
expected. Households responded to the improving epidemiological situation
and the gradual relaxation of containment measures with a spending spree
that propelled EU private consumption growth to 3.3% q-o-q (3.5% in the
euro area) in the second quarter of 2021. The rebound of economic activity
was broad-based, with all components of domestic demand contributing
positively to the 2.0% q-o-q rebound in GDP (2.1% in the euro area).
Economic indicators suggest that growth continued unabated in the summer,
also underpinned by a revival of intra-EU travel that benefited in particular
EU touristic regions. The projected growth rate of 2.1% for the third quarter –
corroborated by Eurostat’s preliminary flash estimate released after the cut-
off date – allowed the EU as a whole to virtually close the gap with its pre-
pandemic output level and move from recovery into expansion.
The supply side of the economy struggles to keep pace with the abrupt
swings in the level and composition of global demand. This affects several
key industries, including global logistics and the production of raw materials
and microprocessors. Sporadic localised pandemic-related lockdowns
together with emerging labour shortages add to the disruptions.
Spring brought a
positive growth
surprise…
…and in summer the
EU economy regained
its pre-pandemic
output level.
New headwinds to the
economic outlook are
mounting…
rate
2021 2022 2023 2021 2022 2023 2021 2022 2023 2021 2022 2023 2021 2022 2023
Belgium 6.0 2.6 1.9 2.7 2.3 1.6 6.2 6.3 5.8 0.8 0.3 0.0 -7.8 -5.1 -4.9
Germany 2.7 4.6 1.7 3.1 2.2 1.7 3.6 3.4 3.2 6.7 6.8 6.9 -6.5 -2.5 -0.5
Estonia 9.0 3.7 3.5 4.0 3.9 2.1 6.8 5.7 5.2 -1.1 0.2 0.5 -3.1 -2.5 -2.2
Ireland 14.6 5.1 4.1 2.3 3.1 1.5 7.5 6.8 6.2 15.4 14.4 14.6 -3.2 -1.7 -0.3
Greece 7.1 5.2 3.6 0.1 1.0 0.4 15.3 15.0 14.5 -6.3 -4.0 -2.8 -9.9 -3.9 -1.1
Spain 4.6 5.5 4.4 2.8 2.1 0.7 15.2 14.3 13.9 0.3 0.8 1.0 -8.1 -5.2 -4.2
France 6.5 3.8 2.3 1.9 2.1 1.4 8.0 8.0 7.9 -2.4 -2.2 -1.0 -8.1 -5.3 -3.5
Italy 6.2 4.3 2.3 1.8 2.1 1.4 9.8 9.3 9.2 3.5 2.7 2.7 -9.4 -5.8 -4.3
Cyprus 5.4 4.2 3.5 1.9 1.7 1.2 7.5 7.1 6.6 -9.1 -7.3 -5.7 -4.9 -1.4 -0.9
Latvia 4.7 5.0 4.0 3.1 3.6 0.8 7.3 6.9 6.6 1.1 -0.2 -1.1 -9.5 -4.2 -2.0
Lithuania 5.0 3.6 3.4 3.8 3.1 2.0 7.1 6.3 6.0 2.6 1.9 1.2 -4.1 -3.1 -1.1
Luxembourg 5.8 3.7 2.7 3.2 2.2 1.8 6.1 5.8 5.7 5.5 5.2 5.2 -0.2 0.2 0.3
Malta 5.0 6.2 4.8 1.1 1.6 1.5 4.0 3.8 3.7 0.4 1.8 1.9 -11.1 -5.8 -4.7
Netherlands 4.0 3.3 1.6 2.1 2.2 1.5 3.5 3.6 3.6 8.4 9.0 8.9 -5.3 -2.1 -1.0
Austria 4.4 4.9 1.9 2.7 2.5 2.0 5.0 4.6 4.5 -0.1 -0.2 -0.5 -5.9 -2.3 -1.3
Portugal 4.5 5.3 2.4 0.8 1.7 1.2 6.7 6.5 6.4 -0.9 -0.4 -0.4 -4.5 -3.4 -2.8
Slovenia 6.4 4.2 3.5 1.7 2.1 1.7 4.6 4.5 4.4 5.4 4.8 4.8 -7.2 -5.2 -4.4
Slovakia 3.8 5.3 4.3 2.8 4.3 2.2 6.8 6.4 5.6 -1.7 -1.0 -1.1 -7.3 -4.2 -3.2
Finland 3.4 2.8 2.0 1.8 1.9 1.9 7.7 6.9 6.5 1.2 1.2 1.5 -3.8 -2.4 -1.1
Euro area 5.0 4.3 2.4 2.4 2.2 1.4 7.9 7.5 7.3 3.1 3.2 3.4 -7.1 -3.9 -2.4
Bulgaria 3.8 4.1 3.5 2.4 2.9 1.8 5.1 4.6 4.4 0.4 1.2 2.7 -3.6 -2.8 -2.1
Czechia 3.0 4.4 3.2 3.3 3.4 2.3 2.7 2.6 2.4 -1.2 -2.5 -1.7 -7.0 -4.3 -3.9
Denmark 4.3 2.7 2.4 1.7 1.9 1.6 4.8 4.5 4.3 7.4 7.3 7.1 -0.9 1.3 1.4
Croatia 8.1 5.6 3.4 2.2 2.0 1.5 6.7 6.2 5.8 0.8 0.8 0.3 -4.1 -2.9 -2.1
Hungary 7.4 5.4 3.2 5.1 4.8 3.4 4.1 3.1 2.9 -1.1 -2.4 -1.9 -7.5 -5.7 -3.8
Poland 4.9 5.2 4.4 5.0 5.2 2.6 3.3 3.1 3.0 2.6 2.6 2.9 -3.3 -1.8 -2.1
Romania 7.0 5.1 5.2 4.0 4.0 2.8 5.0 4.8 4.5 -6.5 -6.3 -6.1 -8.0 -6.9 -6.3
Sweden 3.9 3.5 1.7 2.4 1.9 1.1 8.2 7.1 6.7 5.1 4.8 5.0 -0.9 0.3 0.9
EU 5.0 4.3 2.5 2.6 2.5 1.6 7.1 6.7 6.5 3.0 3.0 3.2 -6.6 -3.6 -2.3
United Kingdom 6.9 4.8 1.7 2.4 3.2 2.2 4.9 4.7 4.4 -2.8 -3.0 -3.4 -10.1 -5.5 -4.5
China 7.9 5.3 5.3 : : : : : : 2.1 1.6 1.1 : : :
Japan 2.4 2.3 1.1 -0.5 0.2 0.4 2.8 2.6 2.4 3.5 3.4 3.3 -9.1 -5.0 -3.9
United States 5.8 4.5 2.4 4.3 3.3 2.2 5.5 4.2 4.0 -3.6 -3.6 -3.5 -11.4 -7.9 -6.8
World 5.7 4.5 3.5 : : : : : : : : : : : :
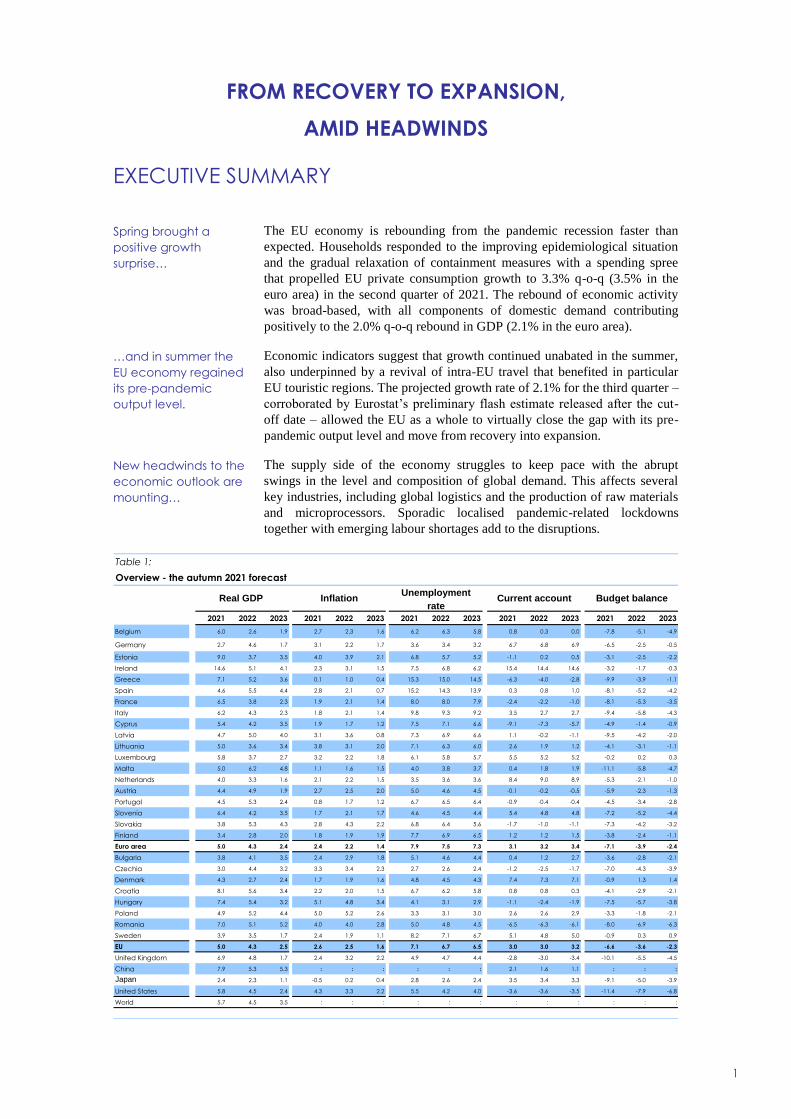
Table 1:
Overview - the autumn 2021 forecast
Real GDP InflationUnemployment
Current account Budget balance

European Economic Forecast, Autumn 2021
2
Surging energy prices, most notably for natural gas and electricity, are also
expected to dampen the growth momentum in the short term. After falling
sharply in 2020, energy prices have increased at a tumultuous pace over the
last month and are now above pre-pandemic levels. High wholesale energy
prices are making their way to retail prices for households and producers,
though at a varying degree and pace across countries, with potential knock on
effects on consumption and business investment.
Despite these headwinds, the EU is projected to keep expanding over the
remainder of the year, achieving a growth rate of 5.0% for 2021 as a whole
(as in the euro area), 0.2 pps. higher than expected in the previous forecast in
the summer. In 2022, the propelling forces of the re-opening are set to fade
out, while supply bottlenecks loosen and energy prices abate. Growth is
expected to be supported by an improving labour market, still high savings,
favourable financing conditions and the full deployment of the Recovery and
Resilience Facility (RRF). Economic activity in the EU is thus projected to
expand by a solid 4.3% (same as in the euro area) in 2022, before
decelerating to 2.5% (2.4% in the euro area) in 2023. Importantly, although
the pace of growth is projected to remain uneven across countries and
sectors, the EU is set to return onto its path of economic convergence. By
early 2023, moreover, real GDP is expected to converge to the steady growth
path that the economy was set to follow before the pandemic.
Labour market conditions also improved markedly in the second quarter, with
the creation of about 1.5 million jobs and a swift rebound in hours worked,
also as many workers exited job retention schemes. Yet, employment in the
EU remained shy of its pre-pandemic level, and the amount of labour market
slack had not yet been fully re-absorbed, on account of a still high number of
unemployed people and inactive people who are available to work but not
actively seeking.
Since then, however, unemployment has declined further. At 6.8% of the
labour force, the EU unemployment rate in August stood just above the rate
recorded at the end of 2019. Data released after the cut-off date of the
forecast reveal that it declined slightly further in September. What is more,
pockets of labour market shortages are emerging, particularly in sectors
where activity is surging most.
As the economy expands, the labour market is forecast to complete its
recovery next year. An estimated 3.4 million jobs are projected to be created
in 2022 and 2023, bringing the unemployment rate in the EU down to 6.5%
in 2023. RRF-financed investments and accompanying structural reforms are
expected to push productivity growth to a strong pace of 2.9% next year and
1.6% in 2023.
The EU current account surplus is projected to increase over the forecast
horizon, from 2.7% in 2020 to 3.2% in 2023, above the pre-pandemic level of
3.0%. This largely reflects the waning of the disruptions generated by the
COVID-19 shock. In particular, the current account balance is expected to be
driven higher by the rise in the services trade surplus, mainly on the back of
the recovery in international tourism. The merchandise trade surplus is set to
decline over 2021-2022, also due to a high energy bill. In 2023, positive
terms of trade developments and an improving export performance will raise
the goods trade balance. Additionally, the narrowing of the joint deficit of
…and surging energy
prices weigh on
consumption and
investment.
Growth in the EU is
expected at 5%, 4.3%
and 2.5% in 2021, 2022
and 2023,
respectively.
Labour market
conditions are
improving…
…and pockets of
labour shortages are
emerging.
The labour market
completes its recovery
in 2022.
EU current account
surplus is expected to
rise as the pandemic
shock wanes.

Executive Summary
3
current income and transfers adds to the projected widening of the current
account surplus over the forecast horizon.
Following a collapse by 2.9% in 2020, the global economy (excl. EU) is
projected to recover by a strong 5.8% in 2021, amid a rebound in goods trade
and the reopening of domestic services. Global real GDP growth is forecast
to moderate to 4.5% and 3.7% in 2022 and 2023, respectively, as the cyclical
recovery gradually peters out and supportive macroeconomic policies are
scaled back in many countries. This aggregate picture, however, masks a
differentiated picture both between and across advanced and emerging
market economies, also reflecting differences in the pace of vaccination
rollout. In China, economic activity is set to slow down amid an excessively
leveraged corporate sector, weaker infrastructure investments and a
tightening of the regulatory framework.
Following several years of low inflation, the strong resumption of economic
activity has been accompanied by a pick-up in inflationary pressures, which
exceeded expectations. Annual HICP inflation in the euro area hit a ten-year
high of 3.4% in September, and Eurostat’s flash estimate for October,
released after the cut-off date of the forecast, stood even higher, at 4.1%. This
swift increase reflects to a large extent strong base effects, as factors that
dragged down prices during the pandemic in 2020 are ceasing to play a role
this year. In recent months, increases in energy prices well above the pre-
pandemic levels have fuelled new inflationary pressures and price increases
have become broad-based, also under the impact of supply disruptions. As a
result, core inflation (headline inflation excluding energy and unprocessed
food) reached 1.9% in September (flash estimate of 2.1% in October), the
highest rate since 2012. Inflation in the euro area is set to peak at 3.7% in the
last quarter of the year and continue recording high prints in the first half of
2022.
Being to a large extent linked to the post-pandemic re-opening and ensuing
economic adjustment, the current elevated price pressures are still expected to
be largely transitory. After reaching 2.4% in 2021, inflation in the euro area
is forecast to decline to 2.2% in 2022 and 1.4% in 2023, as energy prices are
set to gradually level out as from the second half of next year and the
imbalances between supply and demand solve. In the EU, inflation is
expected to be a notch higher, at 2.6% in 2021, 2.5% in 2022 and 1.6% in
2023.
The EU aggregate general government deficit is forecast to narrow only
marginally in 2021, to 6.6% of GDP, on the back of the still high level of
support provided to households and firms. As the economy moves from
recovery to expansion, the unwinding of the emergency support measures and
the rebound in revenues are forecast to roughly halve the aggregate budget
deficit to around 3.6 % of GDP in 2022, and to reduce it further to 2.3% in
2023. However, nationally-financed current expenditure is expected to
increase in 2022, signalling that governments have increased expenditure
over and above the temporary emergency support deployed to tackle the
COVID-19 crisis. After reaching around 92% in the EU (99% in the euro
area), the aggregate debt-to-GDP ratio is projected to broadly stabilise this
year, and start declining in 2022, reaching 89% of GDP in 2023 (97% in the
euro area).
Global economy to
expand robustly amid
rising divergences.
Inflation in the euro
area is set to peak in
the fourth quarter of
this year…
…and decline over
the course of 2022
before stabilising in
2023.
Large government
deficits declining in
2022 and 2023.
European Economic Forecast, Autumn 2021
4
Although the impact of the pandemic on economic activity has weakened
considerably, COVID-19 has not yet been defeated and the recovery is
heavily dependent on its evolution, both within and outside the EU. The
recent surge of cases in many countries may lead to the reintroduction of
restrictions with impact on economic activity. In the EU, this risk is
particularly relevant in Member States with relatively low vaccination rates.
As suggested by the new Commission’s survey-based measure, in September
uncertainty was significantly lower than the peak achieved during the first
wave of infections, but remained above pre-pandemic levels. Besides the
risks around the evolution of the pandemic, economic risks also relate to the
potential protracted impact of the current supply constraints and bottlenecks.
The main upside risk to the growth outlook is related to potential strong
efficiency gains and durable productivity advances triggered by the
pandemic-induced structural changes. Investments fostered by the RRF and
the accompanying structural reforms will be instrumental in this respect.
Inflation may turn out higher than forecast if supply constraints are more
persistent and above-productivity wage increases are passed on to consumer
prices.
The recent surge in
COVID-19 infections
tilts the balance of
risks to the downside...
…and uncertainty
and risks surrounding
the forecast remain
high.

PART I Economic outlook for EA and EU


1. SETTING THE SCENE
7
1.1. THE EU ECONOMY IN AUTUMN 2021
The EU is enjoying a strong economic
recovery…
The EU economy is rebounding vigorously from
the pandemic recession. As vaccination campaigns
progressed and restrictions started to be gradually
lifted, economic growth resumed in spring. At
almost 14% in annual terms, the rate of GDP
growth recorded in the EU in the second quarter of
2021 is the highest reading in the history of the
time series – exactly as high as the unprecedented
GDP downfall in the same period last year, during
the first wave of the pandemic. On a quarter-on-
quarter basis, economic growth in the second
quarter was also very strong, and exceeded
expectations.
As the EU economy continues to benefit from the
reopening momentum in the second half of the
year, output was in the third quarter just a notch
below its pre-pandemic level. For all Member
States, pre-pandemic output levels are within
reach, though the recovery is set to remain uneven
across countries and sectors.
…propelled by strong demand…
The main growth drivers are set to be on the
domestic demand side. An improving labour
market situation should continue supporting
consumer confidence, and reduce household
preferences for savings, which should contribute to
sustaining consumer spending. In addition,
investment is expected to benefit from strong
demand and favourable financing conditions.
Accommodative monetary and fiscal policies
throughout the forecast years, and the impulse
from NGEU/RRF, are expected to further support
the expansionary phase.
…but facing headwinds on the supply side.
While the conditions for a continuation of strong
demand growth are met, new headwinds to the
economic outlook have emerged on the supply
side. Bottlenecks and disruptions in global supply
have been increasingly weighing on activity in the
EU, in particular in its highly integrated
manufacturing sector. These include shortages of
raw materials and intermediary components,
notably semiconductors. In addition, firms have
been increasingly reporting that labour shortages
constrain production, although to a varying extent
across Member States and sectors. Moreover, a
sharp increase in energy prices, particularly for
natural gas, has added to the list of headwinds to
the economic outlook. In addition to weighing on
economic activity, supply chain disruptions and
bottlenecks, as well as surging energy prices, are
exacerbating the price pressures that were already
generated by strong demand.
1.2. KEY QUESTIONS FOR THE OUTLOOK
Each forecast comes with new topics that deserve
attention as they have the potential to make the
difference from the previous forecast round. Often
the topics are not entirely new, but new
developments and data releases shed new light
onto them. This applies to the pandemic, which
despite rising vaccination rates, has not been
defeated yet and its evolution – both within and
outside the EU – remains a key issue for this
forecast. The assessment of the strength of demand
going forward remains a challenge.
As the EU economy moves from recovery into
expansion, new questions are also coming to the
fore. Recent developments shift the focus of
attention to the supply side, with questions on the
extent and duration of bottlenecks and labour
market shortages, and on surging energy and non-
energy commodity prices. The impact of these new
headwinds is set to vary significantly across
countries, sectors, and socio-economic groups.
How will the health situation impact on
economic activity?
The COVID-19 pandemic remains a global health
threat. In the EU, the vaccination campaigns are
delivering tangible results and have significantly
limited the impact of the Delta variant. Until
October, the number of infections and especially
the numbers of severe cases and deaths had come
down significantly since spring, though with
differences across countries. As a result, the
average stringency of government-mandated
restrictions in the EU was in mid-October at its

European Economic Forecast, Autumn 2021
8
lowest since autumn last year and the Google
mobility index was virtually back to the levels
recorded before the crisis. Overall, increasing
vaccination rates and adaptation of firms and
households to living with the remaining
restrictions have lowered the impact of the
pandemic on economic activity. The assumption in
this forecast is that the pandemic will not cause
any major economic disruptions in the EU
throughout the forecast years.
Outside the EU, however, the health situation
remains highly differentiated, with vaccination
progress representing a fault line along which the
speed of the global recovery splits into two groups
of countries. With low vaccination rates, most
emerging economies remain vulnerable to
lockdowns. At the same time, China is pursuing a
zero-COVID policy that continues to prompt
localised interruptions in economic activity.
Disruptions, especially in the Asia-Pacific region,
matter for the EU economy through its
international production linkages.
How will supply-side disruptions affect output
and prices?
The consequences of the COVID-19 pandemic on
global logistics and supply chains are beginning to
show. Unusually for the EU economy, the surge in
demand is not met by sufficient supply in several
sectors, especially in the production of durable and
investment goods.
As the pandemic containment strategy shifted
demand away from services towards goods,
demand for maritime freight shipments (where
spare capacity was already low at the outset of the
pandemic) increased. At the same time, availability
of alternative air freight services collapsed on
account of travel bans. Port congestion and
pandemic-related closures only compounded these
problems, pushing freight costs to historic highs.
Raw materials are also in high demand. The metal
market is under strain, reflecting global logistics
constraints, cost increases, lockdowns in major
resource countries, and metals’ crucial role as
inputs in a number of highly demanded products,
e.g. in the electronic industry. Reports from
construction companies indicate that dwindling
supplies of key building materials such as roof
tiles, cement and timber are weighing on
construction activity, with prices and price
expectations increasing sharply for several
materials. This is partly driven by production
slowdowns due to lockdown periods across the
globe, but also by a surge in construction activity,
compounded by the shipping issues mentioned
above. As NGEU investment plans start being
implemented, the demand for construction
materials could further increase.
The accelerated digitalisation of the economy,
induced by the pandemic, triggered an
unprecedented surge in demand for computers and
electronic products, for which demand had already
increased due to important technological
advancements, including 5G technology. In
particular, the shift to working from home coupled
with shifts in consumption patterns has triggered
an unprecedented surge in demand for chip-
intensive durable goods. Already before the
pandemic, semiconductor producers were working
at almost full capacity and, due to the long and
complex process needed to expand production
capacity, the supply of semiconductors is less
elastic than needed to meet surging demand. A
global semiconductor shortage is adversely
affecting a large variety of industries, from
carmakers to consumer electronics and home
appliances.
It remains uncertain how quickly bottlenecks will
be resolved, and the time needed for supply to
fully adjust to demand is expected to vary across
sectors. Moderation of demand, and its rebalancing
over goods and services in advanced economies
can be expected to provide some relief, but
capacity constraints can hold back the response of
supply to demand.
How will the EU cope with high energy prices?
Recent weeks have seen rapid increases in
wholesale prices, most notably of natural gas and
electricity, but also of oil and more recently coal.
The factors that have contributed to the
outstanding surge in gas prices in Europe include
strong demand as the economies reopened,
reduced stocks after a cold winter, limited supply
from Russia and exceptionally weak wind- and
hydropower-generated electricity, and to a lesser
extent the impact of rising carbon emission prices.
Importantly, high natural gas prices have ripple
effects on electricity markets, pushing prices of
electricity up (see special issue on energy prices
and bottlenecks in this document).

Economic outlook for EA and EU
9
Higher wholesale energy costs are set to make
their way to retail prices for households and
producers, though at a varying degree and pace
across countries. This will weigh on households’
purchasing power and producers’ profit margins,
with potential knock on effects on consumption
and business investment. While a temporary spike
in energy prices might have a limited impact on
the economic outlook, a longer lasting period of
elevated prices would have more substantial
effects on economic activity.
Is there labour market slack, tightness, or both?
The COVID-19 crisis generated considerable
labour market slack across the EU, mostly visible
in the collapse of hours worked, but also in the
decline in employment and activity. While
employment growth is gradually resuming as the
economy recovers, in the second quarter the
number of employed people in the EU remained
about 1% below its pre-pandemic level. Yet, the
Commission’s business surveys show that pockets
of labour shortages are emerging not only in
Member States that have been less affected by the
pandemic, but – in some sectors – also in countries
having recorded larger employment losses (see
special issue in this document).
Labour shortages may be related to mismatch
between labour demand and supply in sectors
where activity is surging most. They could also
result from skills mismatches stemming from the
transformations induced by the pandemic
(digitalisation). This can be explained by both a
slow adjustment process following the severe crisis
and by structural changes triggered by the
pandemic. The longer it lasts, the higher the risk of
wage pressures feeding into inflation and
dampening demand.
Will transitory price pressures become more
persistent?
After years of very low inflation, a string of high
inflation readings has led many observers to re-
assess the nature of current inflationary pressures.
While the narrative of strong, though temporary
upward price pressures remains broadly
unchanged, uncertainty on their size and duration
has increased.
Bottlenecks combine with strong base effects and
demand pressures to push prices up. Examples of
strong price swings are seen for oil, but also for
services that have been reactivated only recently
after being subject to restrictions. In both cases,
after falling last year, prices have continued rising.
The temporary changes in indirect taxes (e.g. the
VAT cut in Germany) or the postponement of
summer sales (e.g. in France and Italy)
implemented in 2020 have created similar base
effects. Longer delivery times and scarcity of some
inputs in a context of sustained demand are
nevertheless broadening price pressures across the
inflation baskets.
If the labour market tightens further, temporary
price shocks will eventually translate into wage
pressures, as employees will seek to compensate
the losses in their purchasing power. Whereas
wage growth has been subdued so far, the
emerging pressures on the labour market may
increase further.
The recent pick-up in inflation has given more
prominence to scenarios under which inflation
could remain high for longer. Climate change (e.g.
effects on available agricultural land and food
production) and mitigation policies (e.g. taxes on
carbon emissions) are set to affect relative prices
and therefore matter for inflation both in the short
and longer term. Extreme weather phenomena are
already having an impact on food production and
prices. In addition, globalisation and cross-border
fragmentation of production – which may have
curbed inflation in past years – may be
decelerating or even reversing. This may come
with higher costs and prices.
How strong will domestic demand be after the
re-opening phase?
As the current ‘reopening wave’ fades and the
economy moves towards some type of ‘new
normalcy’, the pace of economic growth will
mainly depend on the strength that domestic
demand will be able to achieve.
Private consumption is expected to remain the key
driver of the rebound, even after the initial re-
opening spending spree. Households should have
the financial capacity to keep up spending,
reflecting inter alia the improvements in the labour
market. The reduction of record-high savings from
the lockdown periods is also set to sustain demand
over the medium term. Survey data point to only
small declines in consumers’ intentions to save.
This suggests room for a slow but steady decline in
savings and saving rates, with positive impulses to

European Economic Forecast, Autumn 2021
10
private consumption throughout the forecast
horizon. Significant increases in the value of
financial and real assets and dissipating uncertainty
may also imprint an acceleration in the
normalisation of saving attitudes. Still, the
concentration of excess savings and financial/real
assets in the upper part of the income distribution
might temper the impact on consumption (see the
analysis in the Spring Forecast).
Business investment is expected to expand in the
context of strong demand and favourable financing
conditions. The acceleration of digitalisation
triggered by the pandemic and new environment
requirements may also lead to higher investment
by firms, also supported by the NGEU/RRF. At the
same time, high corporate debt levels accumulated
during the crisis are a possible headwind.
However, the risk of a significant surge in
insolvencies could be smaller than initially
thought, thanks to the policy support put in place
to protect companies (e.g. direct liquidity relief,
government loan guarantees, and debt moratoria).
Construction investment, both public and private,
is set to expand, benefitting in the near term from
the NGEU/RRF. Strong private housing demand is
pushing up housing prices with negative impact on
housing affordability. Residential construction
investment, however, is set to continue being
restrained by a number of supply and regulatory
constraints (see the Special Issue on housing
markets in Chapter 4).
Different patterns of heterogeneity have come
to the fore.
As a common shock, the pandemic affected all
European citizens, but its economic impact has not
been uniform across countries, sectors, and socio-
economic groups. In previous forecasts,
differences in the pandemic impact on health and
economic activity and structures, and in policy
responses were identified as key elements to
explain differences. For example, the share of
high-contact services and the size of countries’
tourism sectors (and the impact of international
travel bans) had been related to the depth of
downturns in output and employment. Now, the
expected variety of answers to some of the
questions raised above suggests that new reasons
for cross-country differences in the pace of
achieving pre-crisis levels and trend growth have
come to the fore.
Supply-side disruptions matter most for regions
and countries that have either a high degree of
openness (trade exposure) or a relatively large
manufacturing sector, in particular large gross
value added in the car industry.
Structural and regulatory differences across
Member States make the link between wholesale
and retail energy prices highly country-specific.
Labour market slack that co-exists with tightness
in some sectors hints at differences in the
employment rebound across sectors and
economies, but also for people with different
educational attainment, age and/or by gender. In
particular, young people have been
disproportionally affected compared to older
workers. Due to the correlation of education, age
and gender with labour incomes, the pandemic
could have increased differences across social
groups, for example in terms of income inequality.
In taking into account differences in the pandemic
impact across and within countries, the
NGEU/RRF is set to play an important role. Its
aim of particularly supporting the most severely
affected Member States has also a bearing on
social, economic and territorial cohesion. It should
supplement national efforts targeted at those most
affected by the pandemic, which remains
important to prevent scarring.
2. ECONOMIC OUTLOOK
11
2.1. INTERNATIONAL ENVIRONMENT
The global recovery entered a softer patch in
the summer
Advanced economies picked up momentum in the
second quarter of 2021 as contact-intensive service
activities resumed. This contrasts with the
recovery in emerging market economies – bar
China –, which took a hit amid renewed virus
outbreaks. Over the summer, global economic
activity seems to have softened. Services activity
was held back where COVID-19 infections rose
(e.g. US, UK) or where vaccination rates remain
low (notably Asia). The strong rebound in
manufacturing and goods trade also lost
momentum as pandemic-related output losses have
largely been recovered. At the same time, supply-
side disruptions intensified, as evidenced by a
lengthening of supply delivery times, dampening
manufacturing activity, notably in advanced
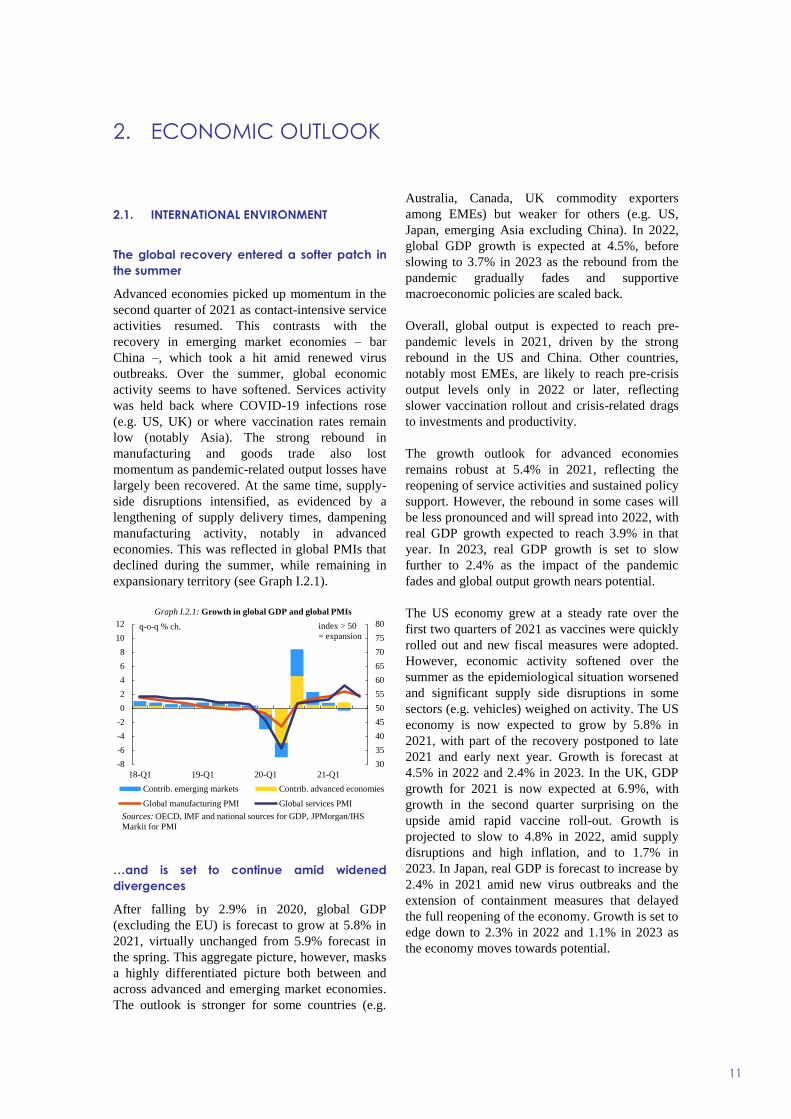
economies. This was reflected in global PMIs that
declined during the summer, while remaining in
expansionary territory (see Graph I.2.1).
…and is set to continue amid widened
divergences
After falling by 2.9% in 2020, global GDP
(excluding the EU) is forecast to grow at 5.8% in
2021, virtually unchanged from 5.9% forecast in
the spring. This aggregate picture, however, masks
a highly differentiated picture both between and
across advanced and emerging market economies.
The outlook is stronger for some countries (e.g.
Australia, Canada, UK commodity exporters
among EMEs) but weaker for others (e.g. US,
Japan, emerging Asia excluding China). In 2022,
global GDP growth is expected at 4.5%, before
slowing to 3.7% in 2023 as the rebound from the
pandemic gradually fades and supportive
macroeconomic policies are scaled back.
Overall, global output is expected to reach pre-
pandemic levels in 2021, driven by the strong
rebound in the US and China. Other countries,
notably most EMEs, are likely to reach pre-crisis
output levels only in 2022 or later, reflecting
slower vaccination rollout and crisis-related drags
to investments and productivity.
The growth outlook for advanced economies
remains robust at 5.4% in 2021, reflecting the
reopening of service activities and sustained policy
support. However, the rebound in some cases will
be less pronounced and will spread into 2022, with
real GDP growth expected to reach 3.9% in that
year. In 2023, real GDP growth is set to slow
further to 2.4% as the impact of the pandemic
fades and global output growth nears potential.
The US economy grew at a steady rate over the
first two quarters of 2021 as vaccines were quickly
rolled out and new fiscal measures were adopted.
However, economic activity softened over the
summer as the epidemiological situation worsened
and significant supply side disruptions in some
sectors (e.g. vehicles) weighed on activity. The US
economy is now expected to grow by 5.8% in
2021, with part of the recovery postponed to late
2021 and early next year. Growth is forecast at
4.5% in 2022 and 2.4% in 2023. In the UK, GDP
growth for 2021 is now expected at 6.9%, with
growth in the second quarter surprising on the
upside amid rapid vaccine roll-out. Growth is
projected to slow to 4.8% in 2022, amid supply
disruptions and high inflation, and to 1.7% in
2023. In Japan, real GDP is forecast to increase by
2.4% in 2021 amid new virus outbreaks and the
extension of containment measures that delayed
the full reopening of the economy. Growth is set to
edge down to 2.3% in 2022 and 1.1% in 2023 as
the economy moves towards potential.
30
35
40
45
50
55
60
65
70
75
80
-8
-6
-4
-2
0
2
4
6
8
10
12
18-Q1 19-Q1 20-Q1 21-Q1
q-o-q % ch.
Graph I.2.1: Growth in global GDP and global PMIs
Contrib. emerging markets Contrib. advanced economies
Global manufacturing PMI Global services PMI
Sources: OECD, IMF and national sources for GDP, JPMorgan/IHS
Markit for PMI
index > 50
= expansion

European Economic Forecast, Autumn 2021
12
Emerging market economies are projected to grow
by 6% in 2021 and 4.8% in 2022 before slowing to
4.4% in 2023. In China, real GDP growth in 2021
is forecast at 7.9%, despite the expected slowdown
in the second half of 2021 due to declining
productivity growth, an excessively leveraged
corporate sector, geopolitical tensions and the de-
emphasising of short-term growth as the primary
policy objective. Growth should moderate
markedly in 2022 and 2023, only gradually falling
back towards its pre-pandemic trend (around
5¼%). After contracting in the second quarter of
2021 due to an COVID-19 outbreak, the Indian
economy should rebound in the second half as
domestic demand recovers towards pre-crisis
levels and supported by a strong export
performance.
The growth outlook in emerging Asia (excluding
China and India) for 2021 has weakened as the
spread of the Delta variant throughout Southeast
Asia has led to new mobility restrictions.
At the same time, commodity exporters in MENA,
Latin America, Sub-Saharan Africa and Russia are
expected to benefit from strong demand for and
rising prices of many energy and non-energy
commodities. Robust demand for goods in the
advanced economies is set to fuel growth in
several export oriented EMEs (e.g. Turkey).
Strong rebound in global trade driven by
goods
After reaching pre-pandemic levels in the last
quarter of 2020, global trade in goods continued to
grow faster than expected in the first half of 2021,
with consumer demand for goods holding up as
pandemic restrictions limited the scope for
spending on services. Recent data suggest a slow-
down in merchandise trade growth, hampered by
transport and supply-chain disruptions and a re-
orientation of spending towards services. In
addition, shipping costs surged on the back of
strong demand and pandemic-related closures of
factories, ports and labour shortages (see Special
Issue 1 in Chapter 4).
3.82.9
-2.9
5.8
4.53.7
-5
-4
-3
-2
-1
0
1
2
3
4
5
6
7
18 19 20 21 22 23
pps., %
Other emerging and developing (CIS, MENA and SSA)Latin AmericaOther emerging and developing AsiaChinaAdvanced economies excl. EUWorld excluding EU (y-o-y %)
forecast
Graph I.2.2: Contributions to global non-EU GDP growth
( a ) 2018 2019 2020 2021 2022 2023 2020 2021 2022
Japan 4.0 0.6 0.3 -4.8 2.4 2.3 1.1 -4.8 3.1 2.5
United Kingdom 2.2 1.7 1.7 -9.7 6.9 4.8 1.7 -9.8 5.0 5.3
United States 15.8 2.9 2.3 -3.4 5.8 4.5 2.4 -3.5 6.3 3.8
Emerging and developing Asia 33.1 6.3 5.3 -1.2 7.2 5.8 5.3 -1.2 7.8 5.6
- China 18.3 6.7 6.0 2.3 7.9 5.3 5.3 2.3 7.9 5.4
- India 6.8 7.3 4.8 -7.0 9.0 7.8 6.0 -6.9 10.5 6.5
Latin America 7.3 1.0 -0.3 -7.3 5.2 2.5 2.3 -7.0 4.1 2.4
- Brazil 2.4 1.8 1.4 -4.1 4.9 2.1 2.3 -4.1 3.4 1.8
MENA 5.6 1.9 0.6 -3.8 3.1 3.5 2.9 -3.4 3.3 2.8
CIS 4.6 3.2 2.7 -2.9 4.2 3.0 2.6 -3.0 3.2 2.8
- Russia 3.1 2.8 2.0 -3.0 3.9 2.6 2.2 -3.0 2.7 2.3
Sub-Saharan Africa 3.4 2.9 2.6 -2.0 3.1 3.3 3.4 -2.4 2.7 3.0
Candidate Countries 2.1 3.1 1.1 1.3 8.6 4.1 4.0 1.3 5.2 4.3
World excluding EU 84.9 3.8 2.9 -2.9 5.8 4.5 3.7 -2.9 5.9 4.2
World excluding EU, import 4.2 -0.8 -8.9 9.3 6.1 4.5 -9.3 9.0 5.7
EU export market growth 4.0 2.4 -8.8 8.9 6.8 4.7 -10.4 5.8 4.4
Real GDP growth
Trade of goods and services, volumes
(a) Relative weights in %, based on GDP (at constant prices and PPS) in 2020.(b) Imports of goods and services to the various markets (incl. EU-markets) weighted according to
their share in country's exports of goods and services.
Table I.2.1:
International environment
(Annual percentage change) Autumn 2021 Spring 2021
forecast forecast
Economic outlook for EA and EU
13
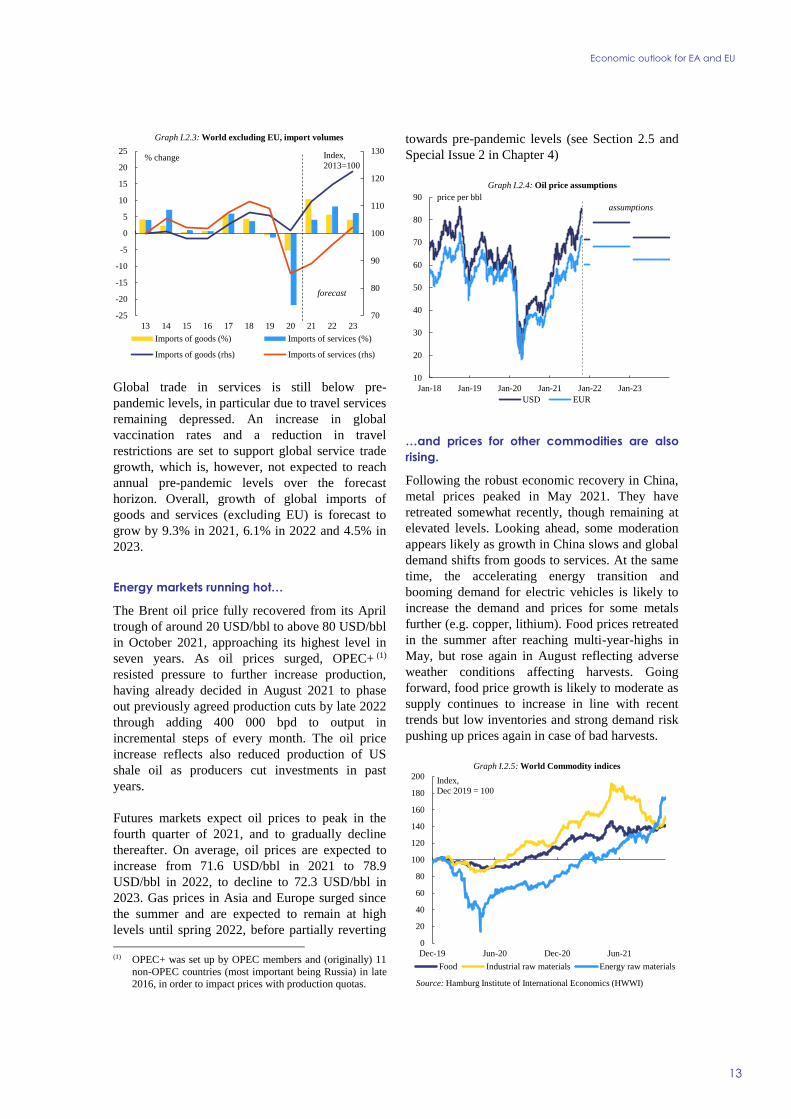
Global trade in services is still below pre-
pandemic levels, in particular due to travel services
remaining depressed. An increase in global
vaccination rates and a reduction in travel
restrictions are set to support global service trade
growth, which is, however, not expected to reach
annual pre-pandemic levels over the forecast
horizon. Overall, growth of global imports of
goods and services (excluding EU) is forecast to
grow by 9.3% in 2021, 6.1% in 2022 and 4.5% in
2023.
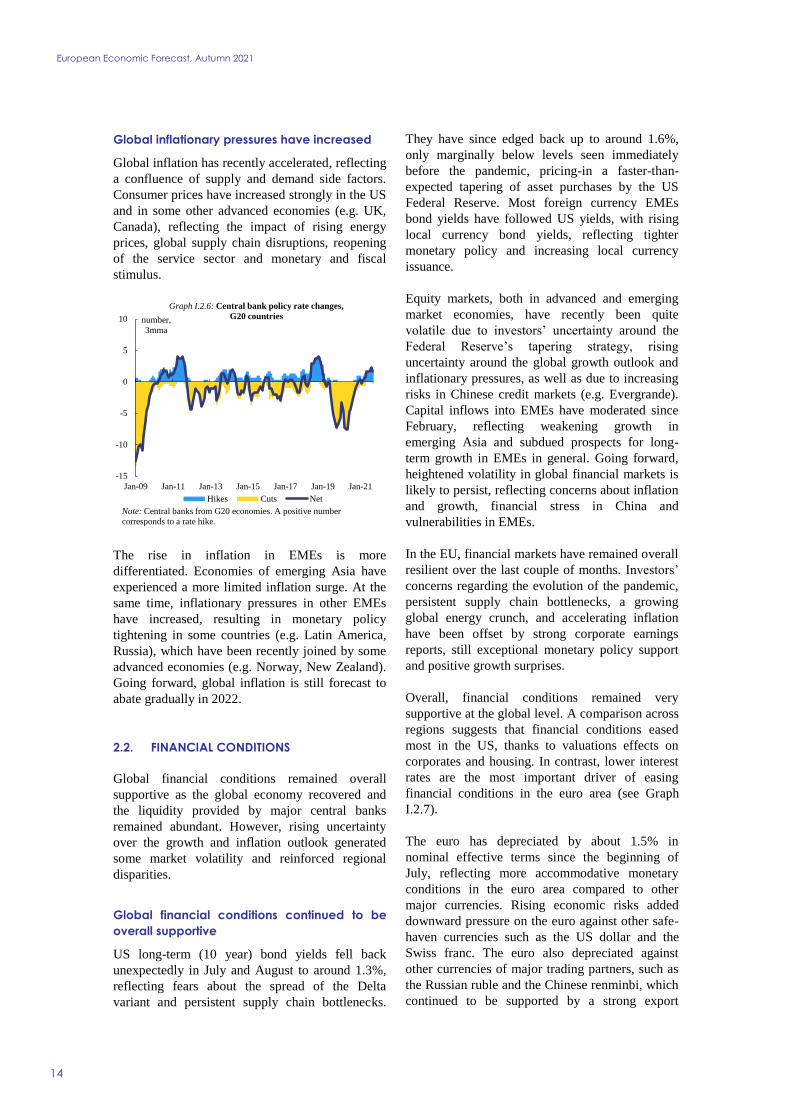
Energy markets running hot…
The Brent oil price fully recovered from its April
trough of around 20 USD/bbl to above 80 USD/bbl
in October 2021, approaching its highest level in
seven years. As oil prices surged, OPEC+ (1)
resisted pressure to further increase production,
having already decided in August 2021 to phase
out previously agreed production cuts by late 2022
through adding 400 000 bpd to output in
incremental steps of every month. The oil price
increase reflects also reduced production of US
shale oil as producers cut investments in past
years.
Futures markets expect oil prices to peak in the
fourth quarter of 2021, and to gradually decline
thereafter. On average, oil prices are expected to
increase from 71.6 USD/bbl in 2021 to 78.9
USD/bbl in 2022, to decline to 72.3 USD/bbl in
2023. Gas prices in Asia and Europe surged since
the summer and are expected to remain at high
levels until spring 2022, before partially reverting
(1) OPEC+ was set up by OPEC members and (originally) 11
non-OPEC countries (most important being Russia) in late 2016, in order to impact prices with production quotas.
towards pre-pandemic levels (see Section 2.5 and
Special Issue 2 in Chapter 4)
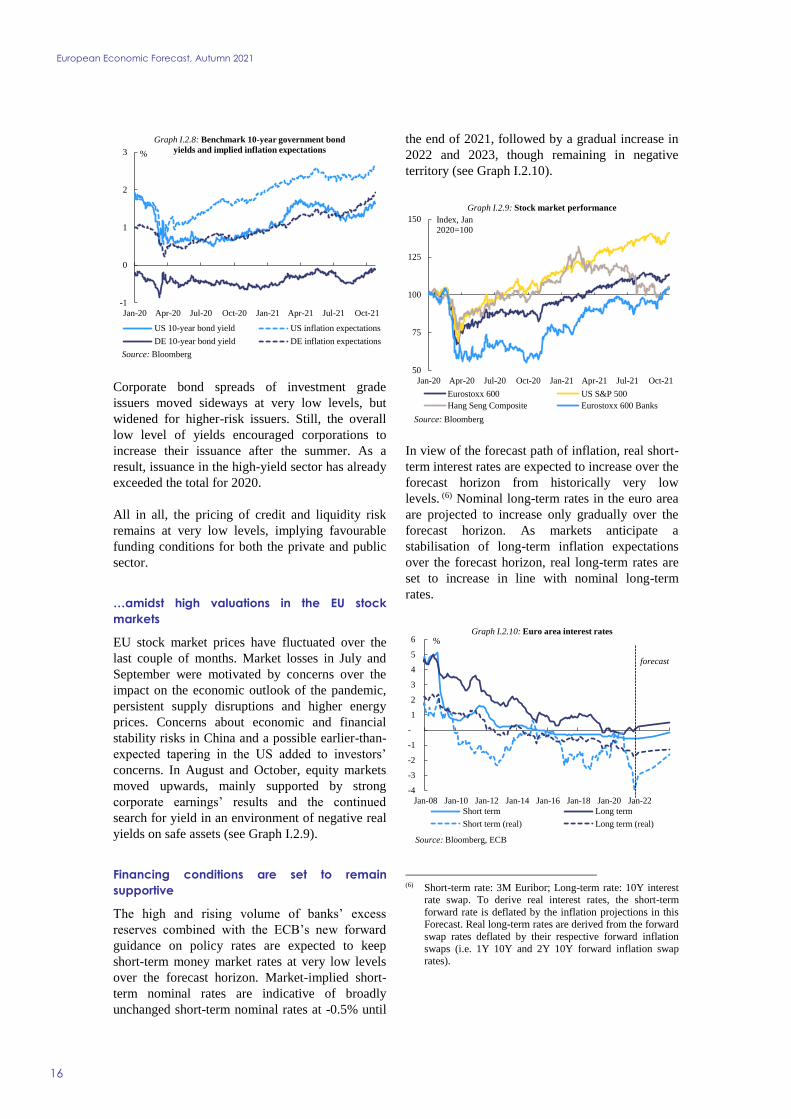
…and prices for other commodities are also
rising.
Following the robust economic recovery in China,
metal prices peaked in May 2021. They have
retreated somewhat recently, though remaining at
elevated levels. Looking ahead, some moderation
appears likely as growth in China slows and global
demand shifts from goods to services. At the same
time, the accelerating energy transition and
booming demand for electric vehicles is likely to
increase the demand and prices for some metals
further (e.g. copper, lithium). Food prices retreated
in the summer after reaching multi-year-highs in
May, but rose again in August reflecting adverse
weather conditions affecting harvests. Going
forward, food price growth is likely to moderate as
supply continues to increase in line with recent
trends but low inventories and strong demand risk
pushing up prices again in case of bad harvests.
70
80
90
100
110
120
130
-25
-20
-15
-10
-5
0
5
10
15
20
25
13 14 15 16 17 18 19 20 21 22 23
Graph I.2.3: World excluding EU, import volumes
Imports of goods (%) Imports of services (%)
Imports of goods (rhs) Imports of services (rhs)
% change
forecast
Index,
2013=100
10
20
30
40
50
60
70
80
90
Jan-18 Jan-19 Jan-20 Jan-21 Jan-22 Jan-23
price per bbl
Graph I.2.4: Oil price assumptions
USD EUR
assumptions
0
20
40
60
80
100
120
140
160
180
200
Dec-19 Jun-20 Dec-20 Jun-21
Graph I.2.5: World Commodity indices
Food Industrial raw materials Energy raw materials
Index,
Dec 2019 = 100
Source: Hamburg Institute of International Economics (HWWI)
European Economic Forecast, Autumn 2021
14
Global inflationary pressures have increased
Global inflation has recently accelerated, reflecting
a confluence of supply and demand side factors.
Consumer prices have increased strongly in the US
and in some other advanced economies (e.g. UK,
Canada), reflecting the impact of rising energy
prices, global supply chain disruptions, reopening
of the service sector and monetary and fiscal
stimulus.
The rise in inflation in EMEs is more
differentiated. Economies of emerging Asia have
experienced a more limited inflation surge. At the
same time, inflationary pressures in other EMEs
have increased, resulting in monetary policy
tightening in some countries (e.g. Latin America,
Russia), which have been recently joined by some
advanced economies (e.g. Norway, New Zealand).
Going forward, global inflation is still forecast to
abate gradually in 2022.
2.2. FINANCIAL CONDITIONS
Global financial conditions remained overall
supportive as the global economy recovered and
the liquidity provided by major central banks
remained abundant. However, rising uncertainty
over the growth and inflation outlook generated
some market volatility and reinforced regional
disparities.
Global financial conditions continued to be
overall supportive
US long-term (10 year) bond yields fell back
unexpectedly in July and August to around 1.3%,
reflecting fears about the spread of the Delta
variant and persistent supply chain bottlenecks.
They have since edged back up to around 1.6%,
only marginally below levels seen immediately
before the pandemic, pricing-in a faster-than-
expected tapering of asset purchases by the US
Federal Reserve. Most foreign currency EMEs
bond yields have followed US yields, with rising
local currency bond yields, reflecting tighter
monetary policy and increasing local currency
issuance.
Equity markets, both in advanced and emerging
market economies, have recently been quite
volatile due to investors’ uncertainty around the
Federal Reserve’s tapering strategy, rising
uncertainty around the global growth outlook and
inflationary pressures, as well as due to increasing
risks in Chinese credit markets (e.g. Evergrande).
Capital inflows into EMEs have moderated since
February, reflecting weakening growth in
emerging Asia and subdued prospects for long-
term growth in EMEs in general. Going forward,
heightened volatility in global financial markets is
likely to persist, reflecting concerns about inflation
and growth, financial stress in China and
vulnerabilities in EMEs.
In the EU, financial markets have remained overall
resilient over the last couple of months. Investors’
concerns regarding the evolution of the pandemic,
persistent supply chain bottlenecks, a growing
global energy crunch, and accelerating inflation
have been offset by strong corporate earnings
reports, still exceptional monetary policy support
and positive growth surprises.
Overall, financial conditions remained very
supportive at the global level. A comparison across
regions suggests that financial conditions eased
most in the US, thanks to valuations effects on
corporates and housing. In contrast, lower interest
rates are the most important driver of easing
financial conditions in the euro area (see Graph
I.2.7).
The euro has depreciated by about 1.5% in
nominal effective terms since the beginning of
July, reflecting more accommodative monetary
conditions in the euro area compared to other
major currencies. Rising economic risks added
downward pressure on the euro against other safe-
haven currencies such as the US dollar and the
Swiss franc. The euro also depreciated against
other currencies of major trading partners, such as
the Russian ruble and the Chinese renminbi, which
continued to be supported by a strong export
-15
-10
-5
0
5
10
Jan-09 Jan-11 Jan-13 Jan-15 Jan-17 Jan-19 Jan-21
number,
3mma
Graph I.2.6: Central bank policy rate changes,
G20 countries
Hikes Cuts Net
Note: Central banks from G20 economies. A positive number
corresponds to a rate hike.

Economic outlook for EA and EU
15
performance. The depreciation of the euro in
nominal effective terms masks however some
strengthening against the currencies of some EU
Member States (e.g. the Hungarian forint and the
Polish zloty) and against the currencies of some
other emerging countries (e.g. the Brazilian real
and the Turkish lira) that have experienced
significant increases in inflation in recent months.
Monetary policy in the EU remained
supportive…
The ECB has maintained an accommodative
monetary policy stance in recent months in order
to preserve favourable financing conditions for the
real economy. In July, the ECB revised its forward
guidance on policy rates in light of its new
monetary policy strategy adopted the same
month. (2) The revised forward guidance indicates
in particular that the ECB will keep its main
interest rates at their present level or lower until it
sees inflation reaching 2% well ahead of the end of
its projection horizon and judges that
developments in underlying inflation are consistent
with inflation stabilising at 2% over the medium
term.
In September, the ECB left its main monetary
policy instruments unchanged but the Governing
Council judged that favourable financing
conditions could be maintained with a moderately
lower pace of net asset purchases under the
pandemic emergency purchase programme (PEPP)
(2) The key element of the new monetary policy strategy is the
adoption of a symmetric inflation target of 2% over the medium term. The ECB also committed to forceful or
persistent monetary policy measures when the economy is
close to the lower bound in order to avoid that persistent negative deviations from the inflation target become
entrenched.
than during the previous two quarters. (3) The ECB
confirmed that it would continue its asset
purchases under the PEPP until at least the end of
March 2022. (4) Net purchases under the asset
purchase programme (APP) will also continue at a
monthly pace of €20 billion. Refinancing
operations, notably the third series of the targeted
longer-term refinancing operations (TLTRO III),
will continue to provide liquidity to euro area
banks to support the flow of credit to households
and firms. The ECB confirmed these policies at its
latest meeting on 28 October. (5)
Elsewhere in the EU, a number of central banks
(i.e. Poland, Hungary, Czechia and Romania)
started to raise their policy rates in response to
strong inflationary pressures and mounting risks of
above target inflation. By contrast, the Swedish
and Danish central banks continued to maintain an
accommodative monetary policy stance.
…keeping long term bond yields low…
The German Bund yield curve flattened over
summer but steepened again over the last couple of
months, with the 10-year yield at around -0.12% at
the end October. In particular, longer-term yields
declined in the summer, driven by supply
constraints on the economic outlook, but also by
sustained asset purchases by the ECB combined
with relatively limited new issuance over summer.
Since the end of August, however, benchmark
nominal yields have faced upward pressure on the
back of higher market-implied measures of
inflation expectations. EA sovereign bond spreads
remained broadly unchanged over the summer
while non-EA spreads (PL, CZ, HU and RO)
widened amid mounting inflation risks, and
changes in their monetary policy stance. As
market-implied inflation expectations for the EA
have moved up since July, in particular for the
short term horizon (2 years), real sovereign bond
yields hit new all-time lows (see Graph I.2.8).
(3) The monthly pace of net asset purchases under the PEPP
averaged €62bn in Q1, €80bn in Q2 and €76bn in Q3. (4) The PEPP has a total envelope of €1.85 trillion of which
€1.41 trillion had been spent by the end of September
2021. (5) The meeting took place after the cut-off date and was thus
not considered in this forecast. However, the ECB announced no policy changes and is therefore fully aligned
with the forecast assumptions.
-2
-1
0
1
2
3
20-Q1 21-Q1 20-Q1 21-Q1 20-Q1 21-Q1 20-Q1 21-Q1 20-Q1 21-Q1
Graph I.2.7: Drivers of financial conditions
Interest rates House prices Corporate valuations
EM external costs Index
Source: IMF
USEA Other
advanced
China Other EM
Standard deviation
from mean
European Economic Forecast, Autumn 2021
16
Corporate bond spreads of investment grade
issuers moved sideways at very low levels, but
widened for higher-risk issuers. Still, the overall
low level of yields encouraged corporations to
increase their issuance after the summer. As a
result, issuance in the high-yield sector has already
exceeded the total for 2020.
All in all, the pricing of credit and liquidity risk
remains at very low levels, implying favourable
funding conditions for both the private and public
sector.
…amidst high valuations in the EU stock
markets
EU stock market prices have fluctuated over the
last couple of months. Market losses in July and
September were motivated by concerns over the
impact on the economic outlook of the pandemic,
persistent supply disruptions and higher energy
prices. Concerns about economic and financial
stability risks in China and a possible earlier-than-
expected tapering in the US added to investors’
concerns. In August and October, equity markets
moved upwards, mainly supported by strong
corporate earnings’ results and the continued
search for yield in an environment of negative real
yields on safe assets (see Graph I.2.9).
Financing conditions are set to remain
supportive
The high and rising volume of banks’ excess
reserves combined with the ECB’s new forward
guidance on policy rates are expected to keep
short-term money market rates at very low levels
over the forecast horizon. Market-implied short-
term nominal rates are indicative of broadly
unchanged short-term nominal rates at -0.5% until
the end of 2021, followed by a gradual increase in
2022 and 2023, though remaining in negative
territory (see Graph I.2.10).
In view of the forecast path of inflation, real short-
term interest rates are expected to increase over the
forecast horizon from historically very low
levels. (6) Nominal long-term rates in the euro area
are projected to increase only gradually over the
forecast horizon. As markets anticipate a
stabilisation of long-term inflation expectations
over the forecast horizon, real long-term rates are
set to increase in line with nominal long-term
rates.
(6) Short-term rate: 3M Euribor; Long-term rate: 10Y interest
rate swap. To derive real interest rates, the short-term
forward rate is deflated by the inflation projections in this Forecast. Real long-term rates are derived from the forward
swap rates deflated by their respective forward inflation
swaps (i.e. 1Y 10Y and 2Y 10Y forward inflation swap rates).
-1
0
1
2
3
Jan-20 Apr-20 Jul-20 Oct-20 Jan-21 Apr-21 Jul-21 Oct-21
Graph I.2.8: Benchmark 10-year government bond
yields and implied inflation expectations
US 10-year bond yield US inflation expectations
DE 10-year bond yield DE inflation expectations
%
Source: Bloomberg
50
75
100
125
150
Jan-20 Apr-20 Jul-20 Oct-20 Jan-21 Apr-21 Jul-21 Oct-21
Graph I.2.9: Stock market performance
Eurostoxx 600 US S&P 500
Hang Seng Composite Eurostoxx 600 Banks
Index, Jan
2020=100
Source: Bloomberg
-4
-3
-2
-1
-
1
2
3
4
5
6
Jan-08 Jan-10 Jan-12 Jan-14 Jan-16 Jan-18 Jan-20 Jan-22
%Graph I.2.10: Euro area interest rates
Short term Long term
Short term (real) Long term (real)
Source: Bloomberg, ECB
forecast

Economic outlook for EA and EU
17
2.3. THE GROWTH OUTLOOK
Spring brought a positive growth surprise
In the second quarter of 2021, the European
economy returned to a recovery path, fuelled by
the improving health situation, progress of
vaccination, the gradual easing of containment
measures, and possibly better adaptation of firms
and households to existing restrictions. (7)
GDP in the EU rebounded by 2.0% compared to
the first quarter (2.1% in the euro area). This
outcome more than offset the contraction in the
two previous quarters and exceeded expectations
of most forecasts, (8) including the Commission
Summer Interim Forecast. The latter projected a
1.3% quarter-on-quarter growth in both the EU and
the euro area. At almost 14% in annual terms, the
rate of GDP growth was also the highest reading in
the history of the time series and as high as the
GDP downfall in the same period last year. Data
revisions for growth in 2020 also imply a slightly
higher statistical carry-over effect into 2021 (at
2.3% instead of the previously estimated 2.2%).
Overall, the reported real GDP growth up the
second quarter of 2021 narrows to 2.3% (2.7% in
the euro area) the gap to the pre-pandemic output
level in the fourth quarter of 2019.
Real GDP increased in all countries except for
Bulgaria, Croatia, Luxembourg and Malta.
Looking at the demand composition, the easing of
restrictions since mid-May unleashed a vigorous
spending spree by consumers (see Graph I.2.11).
In the EU, private consumption increased by 3.3%
(quarter-on-quarter), reflecting a surge in the
purchase of services (4.8%, compared to 2.5% for
overall goods) and a substantial decline in the
savings rate. Investment spending expanded more
modestly, by 1.0%, posting a fourth consecutive
quarter of expansion. After a slight contraction in
the first quarter, government consumption
increased by 1.2%. On the external side, the
contribution of net trade was broadly neutral
(-0.1 pps.), with the pick-up in exports (2.2% after
1.0%) largely compensating for an increase in
(7) The stringency of restrictions as measured by the Oxford
Stringency Index for the EU (GDP-weighted average), stood at 74 in 2021-Q1 and dropped to 66 in Q2 and 53 in
Q3, which is close to the 51 observed in 2020-Q3. (8) In 16 out of 23 Member States for which the Commission’s
quarterly forecasts are available.
imports (2.7% after 1.0%). (9) The rundown of
inventories acted as a growth drag.
While private consumption still stood about 5¾%
lower than before the crisis (fourth quarter of
2019), the gap of investment spending (excluding
Ireland (10)) closed. Dragged down by shortfalls in
services (around -14%), overall export volumes
remained 1% below their pre-crisis level. The only
component posting an overall increase was
government consumption (about 4%).
Contact-intensive sectors benefited strongly from
the easing of health-related restrictions in the
second quarter (see Graph I.2.12), rebounding by
4.1% (quarter-on-quarter), but value added in those
sectors remained 10½% below the pre-pandemic
level (2019-Q4). (11) Industry and construction,
which were already threading around pre-crisis
levels, also contributed positively to growth, albeit
to a lesser extent.
(9) EU export volumes rose on the back of a strengthening of
both exports of goods (from 1.8% to 1.9% quarter-on-quarter) and services (3.1% after -0.9% quarter-on-quarter),
which benefited most from the loosening of restrictions.
This quarterly increase is the result of a strong carry-over effect from the month of March 2021. Monthly
international trade data on euro area export volumes, however, shows that exports fell each month during the
second quarter, hit by disruptions to manufacturing supply
chains (e.g. shortage of inputs, shipping freight
restrictions). (10) To look through the short-term volatility induced by
activities of multinational firms in Ireland, data from the
country is excluded in the analysis of investment. (11) Contact-intensive sectors include: arts, entertainment and
recreation as well as wholesale and retail trade, transport,
accommodation and food service activities. These are sectors with non-teleworkable occupations, reliant on
teamwork or face-to-face customer interaction, which have
been particularly affected by containment measures.
70
75
80
85
90
95
100
105
110
19
-Q4
20
-Q4
21
-Q2
19
-Q4
20
-Q4
21
-Q2
19
-Q4
20
-Q4
21
-Q2
Graph I.2.11: GDP demand-side components, EU
Total Services
Construction Machinery & equipment
Goods
Private
consumptionInvestment Exports
Index,
2019-Q4 = 100
European Economic Forecast, Autumn 2021
18
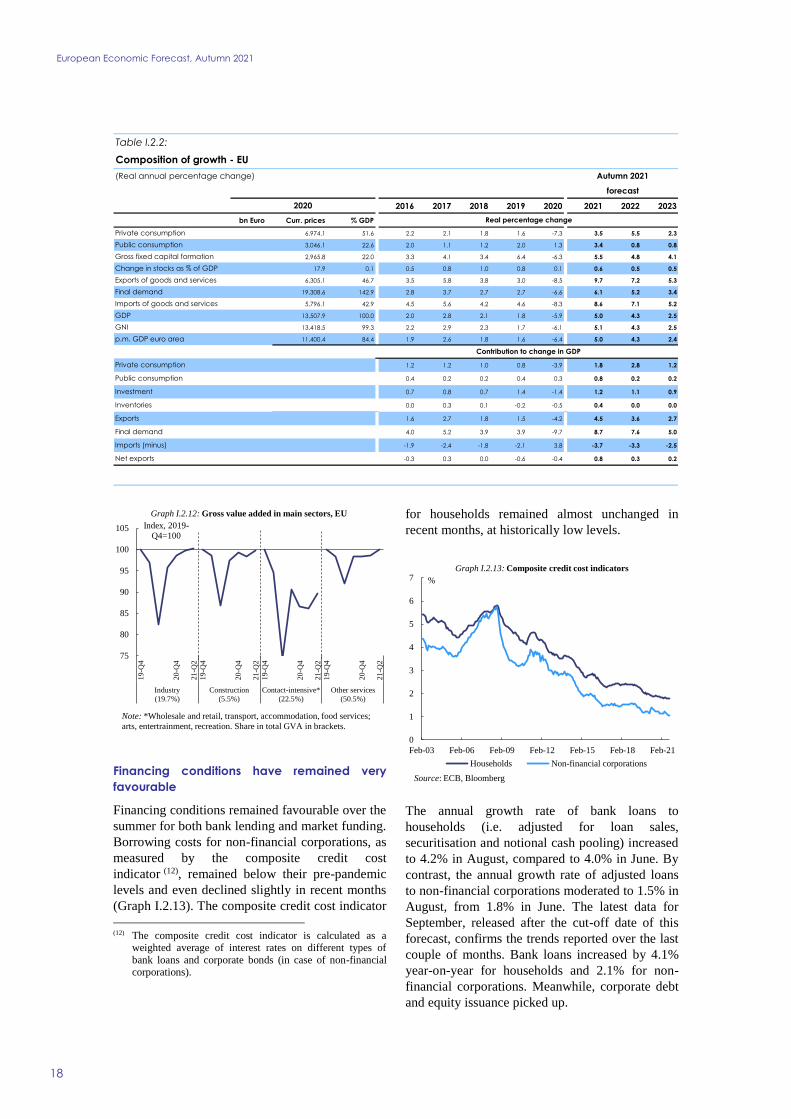
Financing conditions have remained very
favourable
Financing conditions remained favourable over the
summer for both bank lending and market funding.
Borrowing costs for non-financial corporations, as
measured by the composite credit cost
indicator (12), remained below their pre-pandemic
levels and even declined slightly in recent months
(Graph I.2.13). The composite credit cost indicator
(12) The composite credit cost indicator is calculated as a
weighted average of interest rates on different types of
bank loans and corporate bonds (in case of non-financial corporations).
for households remained almost unchanged in
recent months, at historically low levels.
The annual growth rate of bank loans to
households (i.e. adjusted for loan sales,
securitisation and notional cash pooling) increased
to 4.2% in August, compared to 4.0% in June. By
contrast, the annual growth rate of adjusted loans
to non-financial corporations moderated to 1.5% in
August, from 1.8% in June. The latest data for
September, released after the cut-off date of this
forecast, confirms the trends reported over the last
couple of months. Bank loans increased by 4.1%
year-on-year for households and 2.1% for non-
financial corporations. Meanwhile, corporate debt
and equity issuance picked up.
75
80
85
90
95
100
105
19
-Q4
20-Q
4
21
-Q2
19
-Q4
20
-Q4
21
-Q2
19-Q
4
20
-Q4
21
-Q2
19
-Q4
20
-Q4
21
-Q2
Industry
(19.7%)
Construction
(5.5%)
Contact-intensive*
(22.5%)
Other services
(50.5%)
Index, 2019-
Q4=100
Graph I.2.12: Gross value added in main sectors, EU
Note: *Wholesale and retail, transport, accommodation, food services;
arts, entertrainment, recreation. Share in total GVA in brackets.
0
1
2
3
4
5
6
7
Feb-03 Feb-06 Feb-09 Feb-12 Feb-15 Feb-18 Feb-21
Graph I.2.13: Composite credit cost indicators
Households Non-financial corporations
%
Source: ECB, Bloomberg
2016 2017 2018 2019 2020 2021 2022 2023
bn Euro Curr. prices % GDP
6,974.1 51.6 2.2 2.1 1.8 1.6 -7.3 3.5 5.5 2.3
3,046.1 22.6 2.0 1.1 1.2 2.0 1.3 3.4 0.8 0.8
2,965.8 22.0 3.3 4.1 3.4 6.4 -6.3 5.5 4.8 4.1
17.9 0.1 0.5 0.8 1.0 0.8 0.1 0.6 0.5 0.5
6,305.1 46.7 3.5 5.8 3.8 3.0 -8.5 9.7 7.2 5.3
19,308.6 142.9 2.8 3.7 2.7 2.7 -6.6 6.1 5.2 3.4
5,796.1 42.9 4.5 5.6 4.2 4.6 -8.3 8.6 7.1 5.2
13,507.9 100.0 2.0 2.8 2.1 1.8 -5.9 5.0 4.3 2.5
13,418.5 99.3 2.2 2.9 2.3 1.7 -6.1 5.1 4.3 2.5
11,400.4 84.4 1.9 2.6 1.8 1.6 -6.4 5.0 4.3 2.4
1.2 1.2 1.0 0.8 -3.9 1.8 2.8 1.2
0.4 0.2 0.2 0.4 0.3 0.8 0.2 0.2
0.7 0.8 0.7 1.4 -1.4 1.2 1.1 0.9
0.0 0.3 0.1 -0.2 -0.5 0.4 0.0 0.0
1.6 2.7 1.8 1.5 -4.2 4.5 3.6 2.7
4.0 5.2 3.9 3.9 -9.7 8.7 7.6 5.0
-1.9 -2.4 -1.8 -2.1 3.8 -3.7 -3.3 -2.5
-0.3 0.3 0.0 -0.6 -0.4 0.8 0.3 0.2
p.m. GDP euro area
Final demand
Imports (minus)
Net exports
Contribution to change in GDP
Private consumption
Public consumption
Investment
Inventories
Exports
GNI
Exports of goods and services
Table I.2.2:
Composition of growth - EU
(Real annual percentage change) Autumn 2021
forecast
2020
Real percentage change
Private consumption
Public consumption
Gross fixed capital formation
Change in stocks as % of GDP
Final demand
Imports of goods and services
GDP
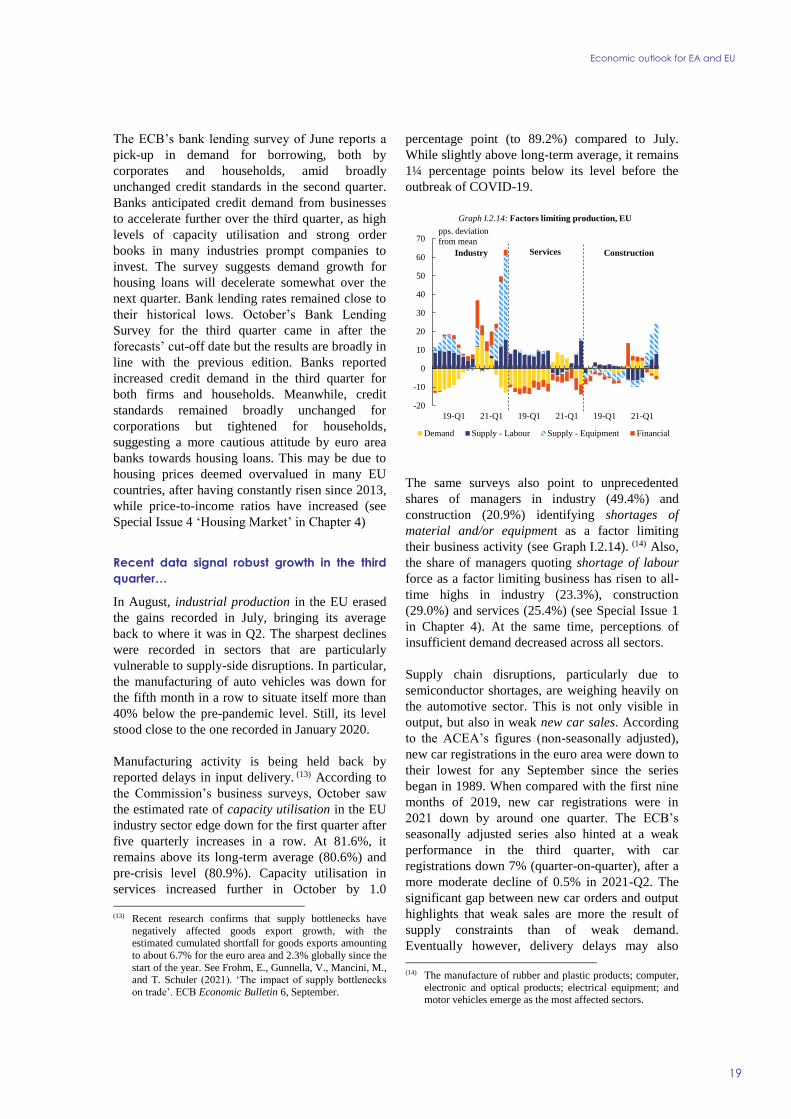
Economic outlook for EA and EU
19
The ECB’s bank lending survey of June reports a
pick-up in demand for borrowing, both by
corporates and households, amid broadly
unchanged credit standards in the second quarter.
Banks anticipated credit demand from businesses
to accelerate further over the third quarter, as high
levels of capacity utilisation and strong order
books in many industries prompt companies to
invest. The survey suggests demand growth for
housing loans will decelerate somewhat over the
next quarter. Bank lending rates remained close to
their historical lows. October’s Bank Lending
Survey for the third quarter came in after the
forecasts’ cut-off date but the results are broadly in
line with the previous edition. Banks reported
increased credit demand in the third quarter for
both firms and households. Meanwhile, credit
standards remained broadly unchanged for
corporations but tightened for households,
suggesting a more cautious attitude by euro area
banks towards housing loans. This may be due to
housing prices deemed overvalued in many EU
countries, after having constantly risen since 2013,
while price-to-income ratios have increased (see
Special Issue 4 ‘Housing Market’ in Chapter 4)
Recent data signal robust growth in the third
quarter…
In August, industrial production in the EU erased
the gains recorded in July, bringing its average
back to where it was in Q2. The sharpest declines
were recorded in sectors that are particularly
vulnerable to supply-side disruptions. In particular,
the manufacturing of auto vehicles was down for
the fifth month in a row to situate itself more than
40% below the pre-pandemic level. Still, its level
stood close to the one recorded in January 2020.
Manufacturing activity is being held back by
reported delays in input delivery. (13) According to
the Commission’s business surveys, October saw
the estimated rate of capacity utilisation in the EU
industry sector edge down for the first quarter after
five quarterly increases in a row. At 81.6%, it
remains above its long-term average (80.6%) and
pre-crisis level (80.9%). Capacity utilisation in
services increased further in October by 1.0
(13) Recent research confirms that supply bottlenecks have
negatively affected goods export growth, with the estimated cumulated shortfall for goods exports amounting
to about 6.7% for the euro area and 2.3% globally since the
start of the year. See Frohm, E., Gunnella, V., Mancini, M., and T. Schuler (2021). ‘The impact of supply bottlenecks
on trade’. ECB Economic Bulletin 6, September.
percentage point (to 89.2%) compared to July.
While slightly above long-term average, it remains
1¼ percentage points below its level before the
outbreak of COVID-19.
The same surveys also point to unprecedented
shares of managers in industry (49.4%) and
construction (20.9%) identifying shortages of
material and/or equipment as a factor limiting
their business activity (see Graph I.2.14). (14) Also,
the share of managers quoting shortage of labour
force as a factor limiting business has risen to all-
time highs in industry (23.3%), construction
(29.0%) and services (25.4%) (see Special Issue 1
in Chapter 4). At the same time, perceptions of
insufficient demand decreased across all sectors.
Supply chain disruptions, particularly due to
semiconductor shortages, are weighing heavily on
the automotive sector. This is not only visible in
output, but also in weak new car sales. According
to the ACEA’s figures (non-seasonally adjusted),
new car registrations in the euro area were down to
their lowest for any September since the series
began in 1989. When compared with the first nine
months of 2019, new car registrations were in
2021 down by around one quarter. The ECB’s
seasonally adjusted series also hinted at a weak
performance in the third quarter, with car
registrations down 7% (quarter-on-quarter), after a
more moderate decline of 0.5% in 2021-Q2. The
significant gap between new car orders and output
highlights that weak sales are more the result of
supply constraints than of weak demand.
Eventually however, delivery delays may also
(14) The manufacture of rubber and plastic products; computer,
electronic and optical products; electrical equipment; and motor vehicles emerge as the most affected sectors.
-20
-10
0
10
20
30
40
50
60
70
19-Q1 21-Q1 19-Q1 21-Q1 19-Q1 21-Q1
Graph I.2.14: Factors limiting production, EU
Demand Supply - Labour Supply - Equipment Financial
pps. deviation
from mean
Industry Services Construction

European Economic Forecast, Autumn 2021
20
deter car buyers from ordering, thus reducing
demand.
The headwinds faced by the manufacturing sector
are expected to have persisted in September, as
shown by the weak outturns from German truck
mileage data, a high frequency indicator seen as a
reliable proxy of industrial activity in the country,
and are also reflected in a fall of exports according
to the Kiel Institute’s Trade Indicator.
Production in construction dropped further below
its pre-crisis levels as supply-side constraints hit
the sector. After a marginal increase in July (0.1%
month-on-month), construction volumes declined
by 1.8% in August. However, consumers’
intentions to purchase or build a home within the
next 12 months, or to perform home
improvements, are at their highest since the early
2000’s, and construction firms’ assessments of
their overall order books in September were
broadly back to pre-pandemic levels. This is likely
to ensure that the current weakness is only
temporary.
In August, retail trade volumes moved up only
marginally after a strong fall in July. This drop had
more than reversed growth reported in June, so
that the level of retail trade remained close to the
second quarter average. However, sales remained
around 3½% above pre-crisis levels.
With the level of restrictions in the EU at its lowest
in one year, the revival of tourism is set to have
significantly supported growth in the summer,
especially in EU economies that typically register
large inflows of foreign EU tourists. Overall nights
spent in the EU in July 2021 exceeded July 2020
data by 15%, but remained 30% lower than in July
2019. High-frequency data suggest somewhat
higher growth in August and September. Traffic
statistics of big airports in Europe seem to
corroborate this suggestion. (15)
For the economy as a whole, survey data point to
some softening of the pace of growth in the
summer (see Graph I.2.15). While Markit’s
Composite Output PMI for the euro area rose in
the third quarter to its highest average since
2006-Q2, it fell in both August and September.
Moderation was recorded for both the
manufacturing output and services activity indices,
which nevertheless remained in expansionary
territory. The Commission’s Economic Sentiment
Indicator remained stable in the EU in September,
at 116.6, well above its long term average. After
peaking in July at exceptionally high levels on
(15) EU flights in July and August 2021 were 52% higher than
in the period Jul-Aug 2020, but still 32% below the equivalent 2019 outturns. For an assessment of travel
receipts see Le Gallo, F. and K. Schmitt (2021). ‘Summer 2021: France’s international trade in travel picks up’.
Banque de France Eco Notepad 231, October.
2016 2017 2018 2019 2020 2021 2022 2023
bn Euro Curr. prices % GDP
5,902.0 51.8 2.0 1.8 1.5 1.3 -7.9 3.2 5.5 2.2
2,573.5 22.6 1.9 1.1 1.1 1.8 1.3 3.6 0.9 0.8
2,494.9 21.9 4.0 3.9 3.1 6.7 -7.0 5.2 4.4 3.9
10.7 0.1 0.4 0.7 0.9 0.7 0.1 0.5 0.5 0.4
5,173.4 45.4 3.0 5.6 3.6 2.7 -9.1 9.7 7.3 5.2
16,154.4 141.7 2.6 3.4 2.4 2.5 -7.2 6.0 5.2 3.2
4,749.4 41.7 4.3 5.2 3.8 4.7 -9.1 8.2 7.2 5.1
11,400.4 100.0 1.9 2.6 1.8 1.6 -6.4 5.0 4.3 2.4
11,434.1 100.3 2.1 2.7 2.1 1.4 -6.7 5.1 4.3 2.4
13,507.9 118.5 2.0 2.8 2.1 1.8 -5.9 5.0 4.3 2.5
1.1 1.0 0.8 0.7 -4.2 1.7 2.8 1.1
0.4 0.2 0.2 0.4 0.3 0.8 0.2 0.2
0.8 0.8 0.6 1.4 -1.6 1.1 1.0 0.9
0.0 0.3 0.1 -0.2 -0.5 0.4 0.0 0.0
1.4 2.6 1.7 1.3 -4.4 4.4 3.5 2.6
3.7 4.8 3.4 3.6 -10.4 8.4 7.5 4.8
-1.8 -2.1 -1.6 -2.1 4.1 -3.4 -3.2 -2.4
-0.4 0.4 0.1 -0.8 -0.3 1.0 0.3 0.3
Private consumption
Public consumption
Investment
Inventories
Exports
Final demand
Imports (minus)
Net exports
Contribution to change in GDP
Real percentage change
Private consumption
Public consumption
Gross fixed capital formation
Change in stocks as % of GDP
Exports of goods and services
Final demand
Imports of goods and services
GDP
GNI
p.m. GDP EU
2020
Table I.2.3:
Composition of growth - euro area
(Real annual percentage change) Autumn 2021
forecast
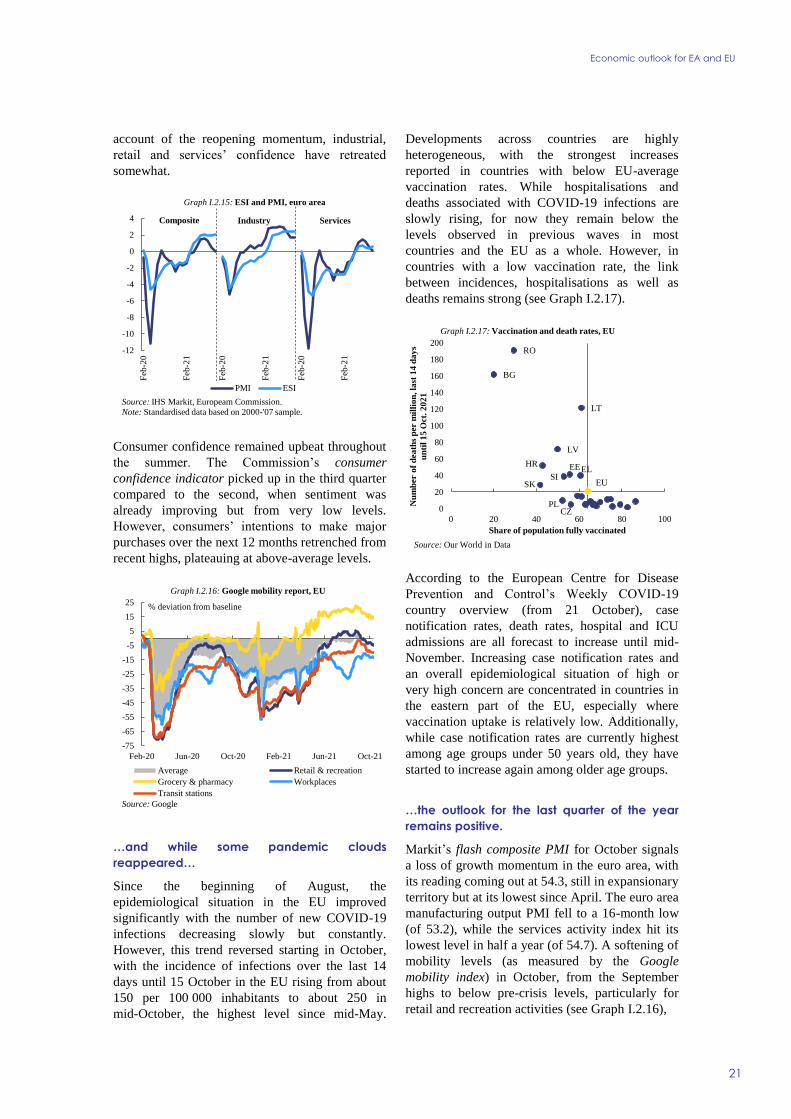
Economic outlook for EA and EU
21
account of the reopening momentum, industrial,
retail and services’ confidence have retreated
somewhat.
Consumer confidence remained upbeat throughout
the summer. The Commission’s consumer
confidence indicator picked up in the third quarter
compared to the second, when sentiment was
already improving but from very low levels.
However, consumers’ intentions to make major
purchases over the next 12 months retrenched from
recent highs, plateauing at above-average levels.
…and while some pandemic clouds
reappeared…
Since the beginning of August, the
epidemiological situation in the EU improved
significantly with the number of new COVID-19
infections decreasing slowly but constantly.
However, this trend reversed starting in October,
with the incidence of infections over the last 14
days until 15 October in the EU rising from about
150 per 100 000 inhabitants to about 250 in
mid-October, the highest level since mid-May.
Developments across countries are highly
heterogeneous, with the strongest increases
reported in countries with below EU-average
vaccination rates. While hospitalisations and
deaths associated with COVID-19 infections are
slowly rising, for now they remain below the
levels observed in previous waves in most
countries and the EU as a whole. However, in
countries with a low vaccination rate, the link
between incidences, hospitalisations as well as
deaths remains strong (see Graph I.2.17).
According to the European Centre for Disease
Prevention and Control’s Weekly COVID-19
country overview (from 21 October), case
notification rates, death rates, hospital and ICU
admissions are all forecast to increase until mid-
November. Increasing case notification rates and
an overall epidemiological situation of high or
very high concern are concentrated in countries in
the eastern part of the EU, especially where
vaccination uptake is relatively low. Additionally,
while case notification rates are currently highest
among age groups under 50 years old, they have
started to increase again among older age groups.
…the outlook for the last quarter of the year
remains positive.
Markit’s flash composite PMI for October signals
a loss of growth momentum in the euro area, with
its reading coming out at 54.3, still in expansionary
territory but at its lowest since April. The euro area
manufacturing output PMI fell to a 16-month low
(of 53.2), while the services activity index hit its
lowest level in half a year (of 54.7). A softening of
mobility levels (as measured by the Google
mobility index) in October, from the September
highs to below pre-crisis levels, particularly for
retail and recreation activities (see Graph I.2.16),
-12
-10
-8
-6
-4
-2
0
2
4
Feb
-20
Feb
-21
Feb
-20
Feb
-21
Feb
-20
Feb
-21
Graph I.2.15: ESI and PMI, euro area
PMI ESI
Composite Industry Services
Source: IHS Markit, Europeam Commission.
Note: Standardised data based on 2000-'07 sample.
-75
-65
-55
-45
-35
-25
-15
-5
5
15
25
Feb-20 Jun-20 Oct-20 Feb-21 Jun-21 Oct-21
Average Retail & recreation
Grocery & pharmacy Workplaces
Transit stations
% deviation from baseline
Graph I.2.16: Google mobility report, EU
Source: Google
BG
CZ
EEELHR
LT
LV
PL
RO
SISK EU
0
20
40
60
80
100
120
140
160
180
200
0 20 40 60 80 100
Nu
mb
er o
f d
ea
ths
per m
illi
on
, la
st 1
4 d
ay
s
un
til
15
Oct
. 2
02
1
Share of population fully vaccinated
Graph I.2.17: Vaccination and death rates, EU
Source: Our World in Data

European Economic Forecast, Autumn 2021
22
(Continued on the next page)
Box I.2.1: New survey-based measures of economic uncertainty
Starting with the Great Financial Crisis of 2007-
2009 and reinforced by the ongoing COVID-19
crisis, the concept of economic ‘uncertainty’ has
received increased attention from economic
analysts and policy makers. Given its dampening
effect on firms’ investment and hiring decisions, as
well as consumer spending, (1) it is a key variable
for explaining and forecasting economic growth.
As uncertainty is not directly observable,
economists have so far resorted to different proxies
to measure it, the most popular ones including
measures of dispersion of economic agents’ views
on the economic outlook, (2) indicators based on
forecast errors, and indicators tracking uncertainty
by text mining news articles in the press (e.g. the
World Uncertainty Index or the Economic Policy
Uncertainty Index). (3)
The European Commission has enriched the
toolbox available to policy makers for monitoring
economic uncertainty by embedding a new, direct
measure of uncertainty in its Joint Harmonised EU
Programme of Business and Consumer Surveys
(BCS) on a regular monthly basis, starting from
May 2021. Data for previous months is available
for some Member States and sectors from a testing
phase, allowing for the calculation of an EU
uncertainty index as from April 2019.
The new survey question asks managers and
consumers to indicate how difficult it is to make
(1) See e.g. the discussion in Bloom, N., Bond, S., and
Van Reenen, J. (2007), “Uncertainty and investment dynamics”, Review of Economic Studies, Vol. 74,
No 2, pp. 391-415; Meinen P., Roehe O. (2017): “On
measuring uncertainty and its impact on investment: cross-country evidence from the Euro area”, Eur
Econ Rev 92, pp. 161–179, Bloom, N. (2009), “The
Impact of Uncertainty Shocks”, Econometrica, 77(3), pp. 623-685; Gieseck, A. and Largent, Y. (2016),
“The Impact of Macroeconomic Uncertainty on
Activity in the Euro Area”, Review of Economics, vol. 67, no. 1, pp. 25-52; Ghirelli, C., Gil, M., Pérez,
J.J. et al. (2021), “Measuring economic and economic policy uncertainty and their macroeconomic effects:
the case of Spain”, Empirical Economics 60, pp.
869–892. (2) Bachmann, R., Elstner, S., and Sims, E. R. (2013)
“Uncertainty and economic activity: evidence from
business survey data”, American Economic Journal: Macroeconomics, 5, 217–49.
(3) Baker, S. R., Bloom, N., and Davis, S. J. (2016),
“Measuring economic policy uncertainty. The
Quarterly Journal of Economics”, 131(4): pp. 1593–
1636.
predictions about their business situation or
household finances, respectively. Enquiring the
deviation of possible economic outcomes around a
central expectation, this new measure of
uncertainty is conceptually different from the
existing composite indicators of ‘sentiment’ and
‘confidence’ which are derived from survey results,
and which aim to capture the central expectation
itself.
Preliminary results show that the new uncertainty
measure evolved broadly in line with the stringency
of the government-mandated restrictions to activity
put in place to contain the spread of the COVID
pandemic (see Graph 1). It peaked at the height of
the first wave of the pandemic, when
unprecedented lockdown measures were enacted.
The second wave of the pandemic in autumn/winter
2020 created a smaller increase in uncertainty than
the first one, as the containment measures enacted
were no longer unprecedented, and managers and
consumers had gained some “experience” living
with them. What is more, the breakthrough
development of vaccines in late 2020 and the
prospect of mass vaccination campaigns served to
anchor managers’ and consumers’ expectations
about the outlook.
In spite of its gradual decrease over the last 1½
years, uncertainty remained, in September, above
pre-pandemic levels. This seems plausible, taking
into account that the pandemic health threat is still
lingering, on the continent but also beyond,
especially where vaccination rates have remained
low so far. Moreover, the long-term impact of the
pandemic crisis on the economy is still difficult to
gauge.
0
5
10
15
20
25
30
35
40
45
0
10
20
30
40
50
60
70
80
90
100
Jan-20 Jul-20 Jan-21 Jul-21
Graph 1: EU uncertainty and Oxford stringency indices
DE stringency FR stringency
IT stringency New uncertainty index (rhs)
Source: European Commission, University of Oxford

Economic outlook for EA and EU
23
confirms moderation of activity in the fourth
quarter.
However, economic sentiment, as reported in the
Commission business and consumer surveys,
remains upbeat. According to the flash estimate,
consumer confidence dropped in October, but only
moderately so, leaving it well above its pre-crisis
level. By contrast, economic sentiment by business
managers improved slightly in October, driven by
improving confidence in services, construction
and, to a lesser extent, retail trade. Confidence
remained virtually unchanged in industry. Unlike
the PMI indicators, which focus on activity in the
month preceding the survey, the Commission
indicators of economic sentiment are largely
forward looking. They reflect, inter alia, expected
demand, based on assessments of order books and
the scarcity of stocks, which are currently at record
high levels.
Overall, recent data (as well as Eurostat’s
preliminary flash estimate released after the cut-off
date) is still consistent with another quarter of solid
GDP growth in the third quarter. The fine print is
set to come in lower than previously anticipated, at
2.1% in quarterly terms, as the strong growth in
the second quarter would have advanced some of
the rebound that was expected in the summer.
Moreover, disruptions in the flow of raw material
and intermediary goods and firms struggling to fill
vacancies in several sectors seem to have started
dampening production.
The EU economy is set to be virtually back to its
pre-pandemic output level (2019-Q4) in the third
quarter of this year – one quarter earlier than
previously expected. It will then move onto an
expansionary path in the fourth quarter, as activity
in contact-intensive service sectors recovers
further.
Box (continued)
Since 2019, uncertainty has been negatively
correlated to developments in ‘confidence’ (see
Graph 2). Thus, rising uncertainty has generally
coincided with negative developments in
confidence/the economy. However, the new
survey-based measure of uncertainty is more than a
simple mirror image of the existing indicators of
confidence. This can be illustrated by the fact that
by summer 2021, confidence in all surveyed
business sectors had strongly rebounded to levels
significantly above those in spring/summer
2019. (4) By contrast, uncertainty in summer 2021
remained well above its level two years ago.
(4) Average confidence in the EU in the period April-
August 2019 was -4.7 in industry and 11.1 in
services. In May-September 2021 it was up to 11.8
and 16.1, respectively.
The sectoral breakdown of the new indicator points
to intuitive cross-sector and cross-branch
differences: services and retail trade experienced
stronger increases and more protracted uncertainty
than industry, and uncertainty in consumer-facing
services has been dissipating at a much slower pace
than in activities fit for ‘home-officing’, such as
computer programming, consultancy and related
activities.
From a conceptual point of view, the new survey-
based indicator has the advantage that it is based on
answers of firms and consumers about the
foreseeability of future economic developments,
and is thus a genuine and direct measure of
perceived uncertainty. A comparison with a
selection of existing measures of uncertainty in
European Commission (2021) (5) suggests that the
new indicator follows broadly the same trend but is
less volatile and identifies changes in economic
uncertainty at an early stage.
The new measure has the additional advantage that
it can provide for a breakdown of business
uncertainty by sectors and branches, or, for
consumers, by socio-economic groups. It will be
key in monitoring the vulnerability of the EU
economies to future economic shocks.
(5) European Commission, European Business Cycle
Indicators, 3rd quarter 2021, Special topic: New
survey-based measures of economic uncertainty.
0
10
20
30
40
50
-50
-40
-30
-20
-10
0
10
20
30
Apr-19 Oct-19 Apr-20 Oct-20 Apr-21
Graph 2: EU confidence versus uncertainty
Industry confidence Services confidenceavg. Apr-Aug 2019 avg. Mai-Sep 2021New uncertainty index (rhs)
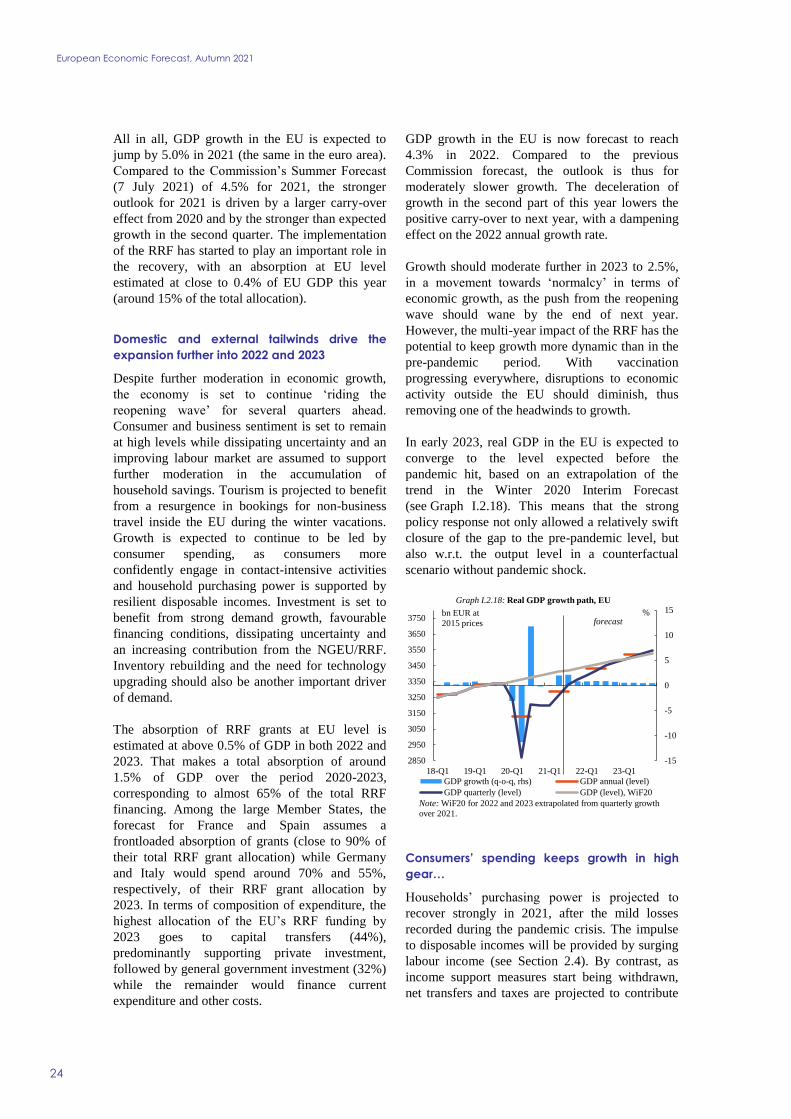
European Economic Forecast, Autumn 2021
24
All in all, GDP growth in the EU is expected to
jump by 5.0% in 2021 (the same in the euro area).
Compared to the Commission’s Summer Forecast
(7 July 2021) of 4.5% for 2021, the stronger
outlook for 2021 is driven by a larger carry-over
effect from 2020 and by the stronger than expected
growth in the second quarter. The implementation
of the RRF has started to play an important role in
the recovery, with an absorption at EU level
estimated at close to 0.4% of EU GDP this year
(around 15% of the total allocation).
Domestic and external tailwinds drive the
expansion further into 2022 and 2023
Despite further moderation in economic growth,
the economy is set to continue ‘riding the
reopening wave’ for several quarters ahead.
Consumer and business sentiment is set to remain
at high levels while dissipating uncertainty and an
improving labour market are assumed to support
further moderation in the accumulation of
household savings. Tourism is projected to benefit
from a resurgence in bookings for non-business
travel inside the EU during the winter vacations.
Growth is expected to continue to be led by
consumer spending, as consumers more
confidently engage in contact-intensive activities
and household purchasing power is supported by
resilient disposable incomes. Investment is set to
benefit from strong demand growth, favourable
financing conditions, dissipating uncertainty and
an increasing contribution from the NGEU/RRF.
Inventory rebuilding and the need for technology
upgrading should also be another important driver
of demand.
The absorption of RRF grants at EU level is
estimated at above 0.5% of GDP in both 2022 and
2023. That makes a total absorption of around
1.5% of GDP over the period 2020-2023,
corresponding to almost 65% of the total RRF
financing. Among the large Member States, the
forecast for France and Spain assumes a
frontloaded absorption of grants (close to 90% of
their total RRF grant allocation) while Germany
and Italy would spend around 70% and 55%,
respectively, of their RRF grant allocation by
2023. In terms of composition of expenditure, the
highest allocation of the EU’s RRF funding by
2023 goes to capital transfers (44%),
predominantly supporting private investment,
followed by general government investment (32%)
while the remainder would finance current
expenditure and other costs.
GDP growth in the EU is now forecast to reach
4.3% in 2022. Compared to the previous
Commission forecast, the outlook is thus for
moderately slower growth. The deceleration of
growth in the second part of this year lowers the
positive carry-over to next year, with a dampening
effect on the 2022 annual growth rate.
Growth should moderate further in 2023 to 2.5%,
in a movement towards ‘normalcy’ in terms of
economic growth, as the push from the reopening
wave should wane by the end of next year.
However, the multi-year impact of the RRF has the
potential to keep growth more dynamic than in the
pre-pandemic period. With vaccination
progressing everywhere, disruptions to economic
activity outside the EU should diminish, thus
removing one of the headwinds to growth.
In early 2023, real GDP in the EU is expected to
converge to the level expected before the
pandemic hit, based on an extrapolation of the
trend in the Winter 2020 Interim Forecast
(see Graph I.2.18). This means that the strong
policy response not only allowed a relatively swift
closure of the gap to the pre-pandemic level, but
also w.r.t. the output level in a counterfactual
scenario without pandemic shock.
Consumers’ spending keeps growth in high
gear…
Households’ purchasing power is projected to
recover strongly in 2021, after the mild losses
recorded during the pandemic crisis. The impulse
to disposable incomes will be provided by surging
labour income (see Section 2.4). By contrast, as
income support measures start being withdrawn,
net transfers and taxes are projected to contribute
2850
2950
3050
3150
3250
3350
3450
3550
3650
3750
18-Q1 19-Q1 20-Q1 21-Q1 22-Q1 23-Q1
-15
-10
-5
0
5
10
15Graph I.2.18: Real GDP growth path, EU
GDP growth (q-o-q, rhs) GDP annual (level)
GDP quarterly (level) GDP (level), WiF20
%bn EUR at
2015 prices forecast
Note: WiF20 for 2022 and 2023 extrapolated from quarterly growth
over 2021.
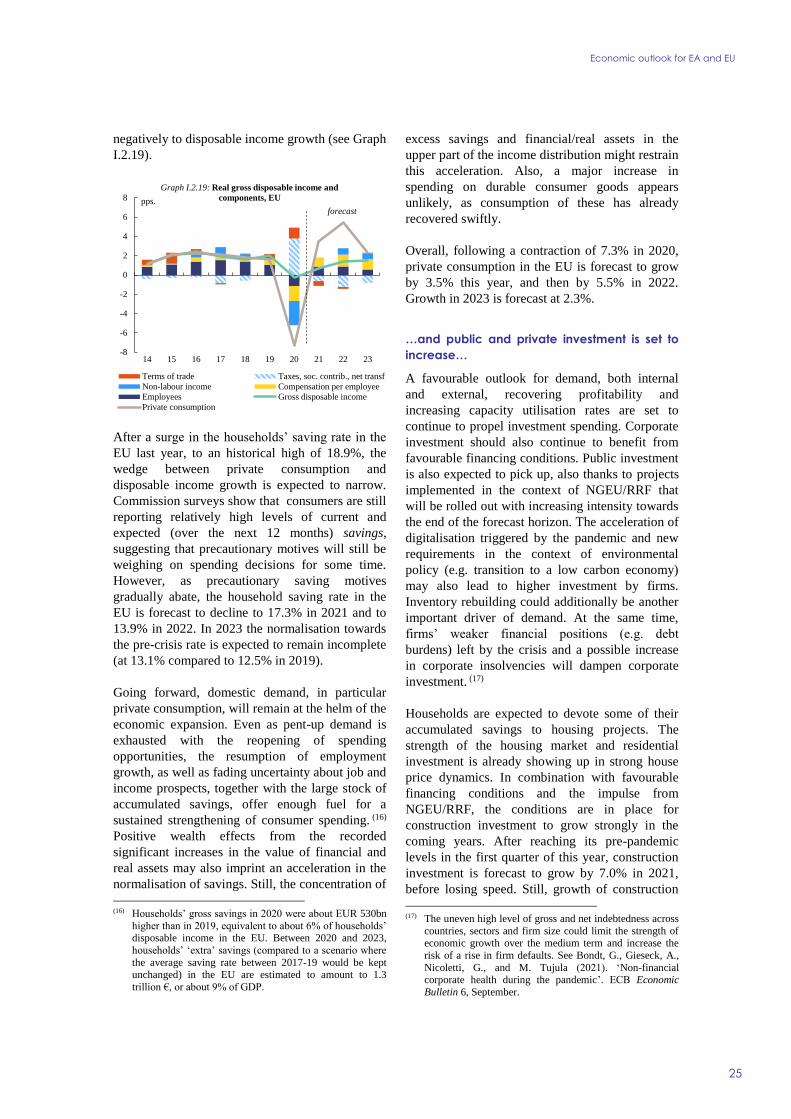
Economic outlook for EA and EU
25
negatively to disposable income growth (see Graph
I.2.19).
After a surge in the households’ saving rate in the
EU last year, to an historical high of 18.9%, the
wedge between private consumption and
disposable income growth is expected to narrow.
Commission surveys show that consumers are still
reporting relatively high levels of current and
expected (over the next 12 months) savings,
suggesting that precautionary motives will still be
weighing on spending decisions for some time.
However, as precautionary saving motives
gradually abate, the household saving rate in the
EU is forecast to decline to 17.3% in 2021 and to
13.9% in 2022. In 2023 the normalisation towards
the pre-crisis rate is expected to remain incomplete
(at 13.1% compared to 12.5% in 2019).
Going forward, domestic demand, in particular
private consumption, will remain at the helm of the
economic expansion. Even as pent-up demand is
exhausted with the reopening of spending
opportunities, the resumption of employment
growth, as well as fading uncertainty about job and
income prospects, together with the large stock of
accumulated savings, offer enough fuel for a
sustained strengthening of consumer spending. (16)
Positive wealth effects from the recorded
significant increases in the value of financial and
real assets may also imprint an acceleration in the
normalisation of savings. Still, the concentration of
(16) Households’ gross savings in 2020 were about EUR 530bn
higher than in 2019, equivalent to about 6% of households’ disposable income in the EU. Between 2020 and 2023,
households’ ‘extra’ savings (compared to a scenario where
the average saving rate between 2017-19 would be kept unchanged) in the EU are estimated to amount to 1.3
trillion €, or about 9% of GDP.
excess savings and financial/real assets in the
upper part of the income distribution might restrain
this acceleration. Also, a major increase in
spending on durable consumer goods appears
unlikely, as consumption of these has already
recovered swiftly.
Overall, following a contraction of 7.3% in 2020,
private consumption in the EU is forecast to grow
by 3.5% this year, and then by 5.5% in 2022.
Growth in 2023 is forecast at 2.3%.
…and public and private investment is set to
increase…
A favourable outlook for demand, both internal
and external, recovering profitability and
increasing capacity utilisation rates are set to
continue to propel investment spending. Corporate
investment should also continue to benefit from
favourable financing conditions. Public investment
is also expected to pick up, also thanks to projects
implemented in the context of NGEU/RRF that
will be rolled out with increasing intensity towards
the end of the forecast horizon. The acceleration of
digitalisation triggered by the pandemic and new
requirements in the context of environmental
policy (e.g. transition to a low carbon economy)
may also lead to higher investment by firms.
Inventory rebuilding could additionally be another
important driver of demand. At the same time,
firms’ weaker financial positions (e.g. debt
burdens) left by the crisis and a possible increase
in corporate insolvencies will dampen corporate
investment. (17)
Households are expected to devote some of their
accumulated savings to housing projects. The
strength of the housing market and residential
investment is already showing up in strong house
price dynamics. In combination with favourable
financing conditions and the impulse from
NGEU/RRF, the conditions are in place for
construction investment to grow strongly in the
coming years. After reaching its pre-pandemic
levels in the first quarter of this year, construction
investment is forecast to grow by 7.0% in 2021,
before losing speed. Still, growth of construction
(17) The uneven high level of gross and net indebtedness across
countries, sectors and firm size could limit the strength of economic growth over the medium term and increase the
risk of a rise in firm defaults. See Bondt, G., Gieseck, A.,
Nicoletti, G., and M. Tujula (2021). ‘Non-financial corporate health during the pandemic’. ECB Economic
Bulletin 6, September.
-8
-6
-4
-2
0
2
4
6
8
14 15 16 17 18 19 20 21 22 23
Terms of trade Taxes, soc. contrib., net transf
Non-labour income Compensation per employee
Employees Gross disposable income
Private consumption
forecastpps.
Graph I.2.19: Real gross disposable income and
components, EU
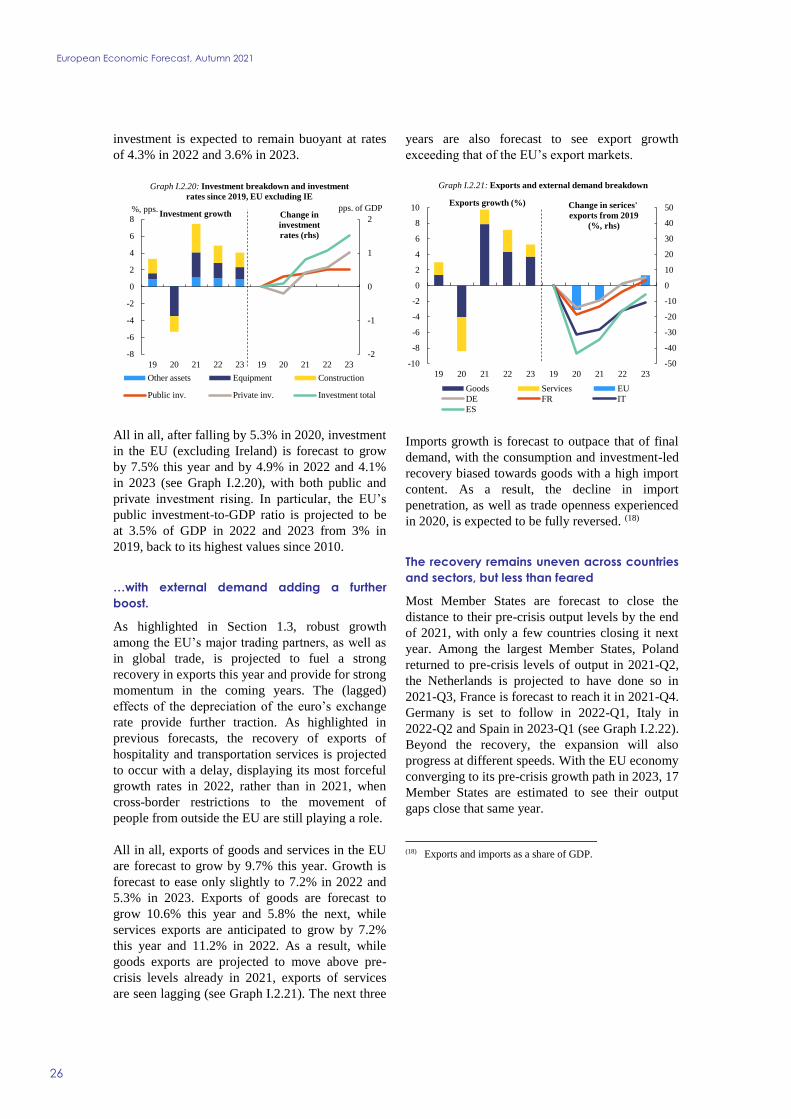
European Economic Forecast, Autumn 2021
26
investment is expected to remain buoyant at rates
of 4.3% in 2022 and 3.6% in 2023.
All in all, after falling by 5.3% in 2020, investment
in the EU (excluding Ireland) is forecast to grow
by 7.5% this year and by 4.9% in 2022 and 4.1%
in 2023 (see Graph I.2.20), with both public and
private investment rising. In particular, the EU’s
public investment-to-GDP ratio is projected to be
at 3.5% of GDP in 2022 and 2023 from 3% in
2019, back to its highest values since 2010.
…with external demand adding a further
boost.
As highlighted in Section 1.3, robust growth
among the EU’s major trading partners, as well as
in global trade, is projected to fuel a strong
recovery in exports this year and provide for strong
momentum in the coming years. The (lagged)
effects of the depreciation of the euro’s exchange
rate provide further traction. As highlighted in
previous forecasts, the recovery of exports of
hospitality and transportation services is projected
to occur with a delay, displaying its most forceful
growth rates in 2022, rather than in 2021, when
cross-border restrictions to the movement of
people from outside the EU are still playing a role.
All in all, exports of goods and services in the EU
are forecast to grow by 9.7% this year. Growth is
forecast to ease only slightly to 7.2% in 2022 and
5.3% in 2023. Exports of goods are forecast to
grow 10.6% this year and 5.8% the next, while
services exports are anticipated to grow by 7.2%
this year and 11.2% in 2022. As a result, while
goods exports are projected to move above pre-
crisis levels already in 2021, exports of services
are seen lagging (see Graph I.2.21). The next three
years are also forecast to see export growth
exceeding that of the EU’s export markets.
Imports growth is forecast to outpace that of final
demand, with the consumption and investment-led
recovery biased towards goods with a high import
content. As a result, the decline in import
penetration, as well as trade openness experienced
in 2020, is expected to be fully reversed. (18)
The recovery remains uneven across countries
and sectors, but less than feared
Most Member States are forecast to close the
distance to their pre-crisis output levels by the end
of 2021, with only a few countries closing it next
year. Among the largest Member States, Poland
returned to pre-crisis levels of output in 2021-Q2,
the Netherlands is projected to have done so in
2021-Q3, France is forecast to reach it in 2021-Q4.
Germany is set to follow in 2022-Q1, Italy in
2022-Q2 and Spain in 2023-Q1 (see Graph I.2.22).
Beyond the recovery, the expansion will also
progress at different speeds. With the EU economy
converging to its pre-crisis growth path in 2023, 17
Member States are estimated to see their output
gaps close that same year.
(18) Exports and imports as a share of GDP.
-2
-1
0
1
2
-8
-6
-4
-2
0
2
4
6
8
19 20 21 22 23 19 20 21 22 23
pps. of GDP %, pps.
Graph I.2.20: Investment breakdown and investment
rates since 2019, EU excluding IE
Other assets Equipment Construction
Public inv. Private inv. Investment total
Investment growth Change in
investment
rates (rhs)
-50
-40
-30
-20
-10
0
10
20
30
40
50
-10
-8
-6
-4
-2
0
2
4
6
8
10
19 20 21 22 23 19 20 21 22 23
Graph I.2.21: Exports and external demand breakdown
Goods Services EU
DE FR IT
ES
Exports growth (%) Change in serices'
exports from 2019
(%, rhs)
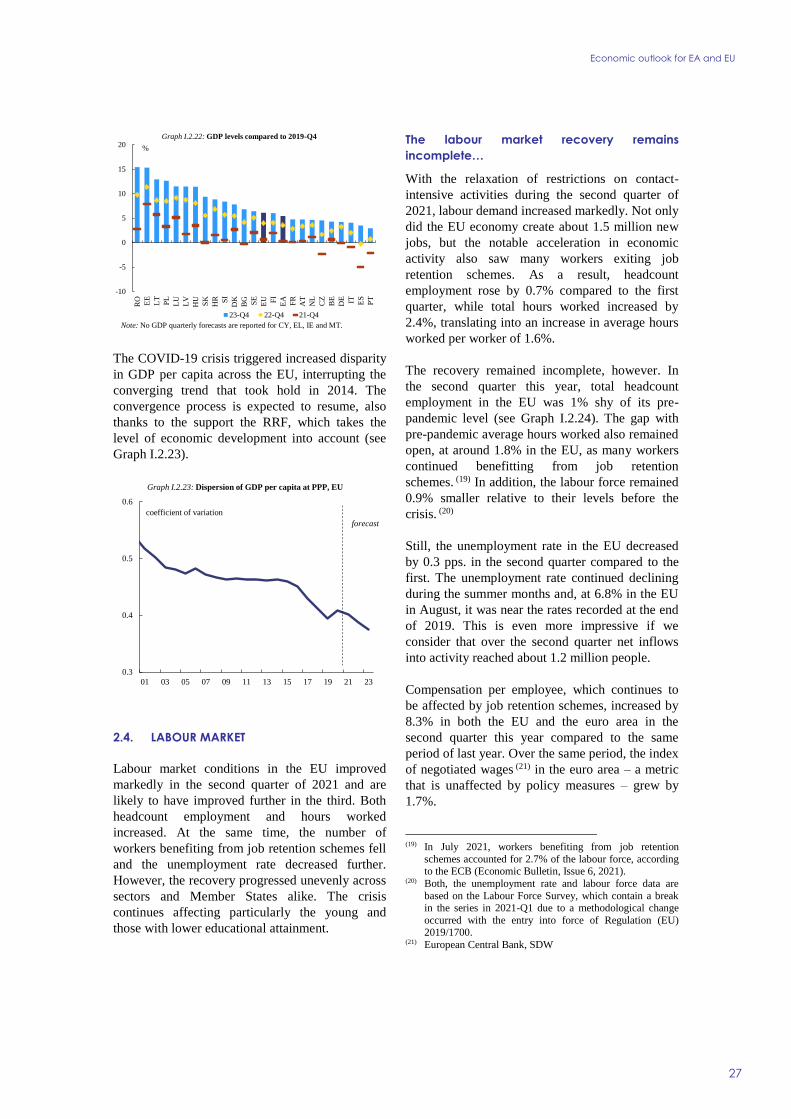
Economic outlook for EA and EU
27
The COVID-19 crisis triggered increased disparity
in GDP per capita across the EU, interrupting the
converging trend that took hold in 2014. The
convergence process is expected to resume, also
thanks to the support the RRF, which takes the
level of economic development into account (see
Graph I.2.23).
2.4. LABOUR MARKET
Labour market conditions in the EU improved
markedly in the second quarter of 2021 and are
likely to have improved further in the third. Both
headcount employment and hours worked
increased. At the same time, the number of
workers benefiting from job retention schemes fell
and the unemployment rate decreased further.
However, the recovery progressed unevenly across
sectors and Member States alike. The crisis
continues affecting particularly the young and
those with lower educational attainment.
The labour market recovery remains
incomplete…
With the relaxation of restrictions on contact-
intensive activities during the second quarter of
2021, labour demand increased markedly. Not only
did the EU economy create about 1.5 million new
jobs, but the notable acceleration in economic
activity also saw many workers exiting job
retention schemes. As a result, headcount
employment rose by 0.7% compared to the first
quarter, while total hours worked increased by
2.4%, translating into an increase in average hours
worked per worker of 1.6%.
The recovery remained incomplete, however. In
the second quarter this year, total headcount
employment in the EU was 1% shy of its pre-
pandemic level (see Graph I.2.24). The gap with
pre-pandemic average hours worked also remained
open, at around 1.8% in the EU, as many workers
continued benefitting from job retention
schemes. (19) In addition, the labour force remained
0.9% smaller relative to their levels before the
crisis. (20)
Still, the unemployment rate in the EU decreased
by 0.3 pps. in the second quarter compared to the
first. The unemployment rate continued declining
during the summer months and, at 6.8% in the EU
in August, it was near the rates recorded at the end
of 2019. This is even more impressive if we
consider that over the second quarter net inflows
into activity reached about 1.2 million people.
Compensation per employee, which continues to
be affected by job retention schemes, increased by
8.3% in both the EU and the euro area in the
second quarter this year compared to the same
period of last year. Over the same period, the index
of negotiated wages (21) in the euro area – a metric
that is unaffected by policy measures – grew by
1.7%.
(19) In July 2021, workers benefiting from job retention
schemes accounted for 2.7% of the labour force, according to the ECB (Economic Bulletin, Issue 6, 2021).
(20) Both, the unemployment rate and labour force data are
based on the Labour Force Survey, which contain a break in the series in 2021-Q1 due to a methodological change
occurred with the entry into force of Regulation (EU) 2019/1700.
(21) European Central Bank, SDW
-10
-5
0
5
10
15
20
RO
EE
LT
PL
LU
LV
HU
SK
HR SI
DK
BG SE
EU FI
EA
FR
AT
NL
CZ
BE
DE IT ES
PT
%
Graph I.2.22: GDP levels compared to 2019-Q4
23-Q4 22-Q4 21-Q4
Note: No GDP quarterly forecasts are reported for CY, EL, IE and MT.
0.3
0.4
0.5
0.6
01 03 05 07 09 11 13 15 17 19 21 23
Graph I.2.23: Dispersion of GDP per capita at PPP, EU
forecast
coefficient of variation
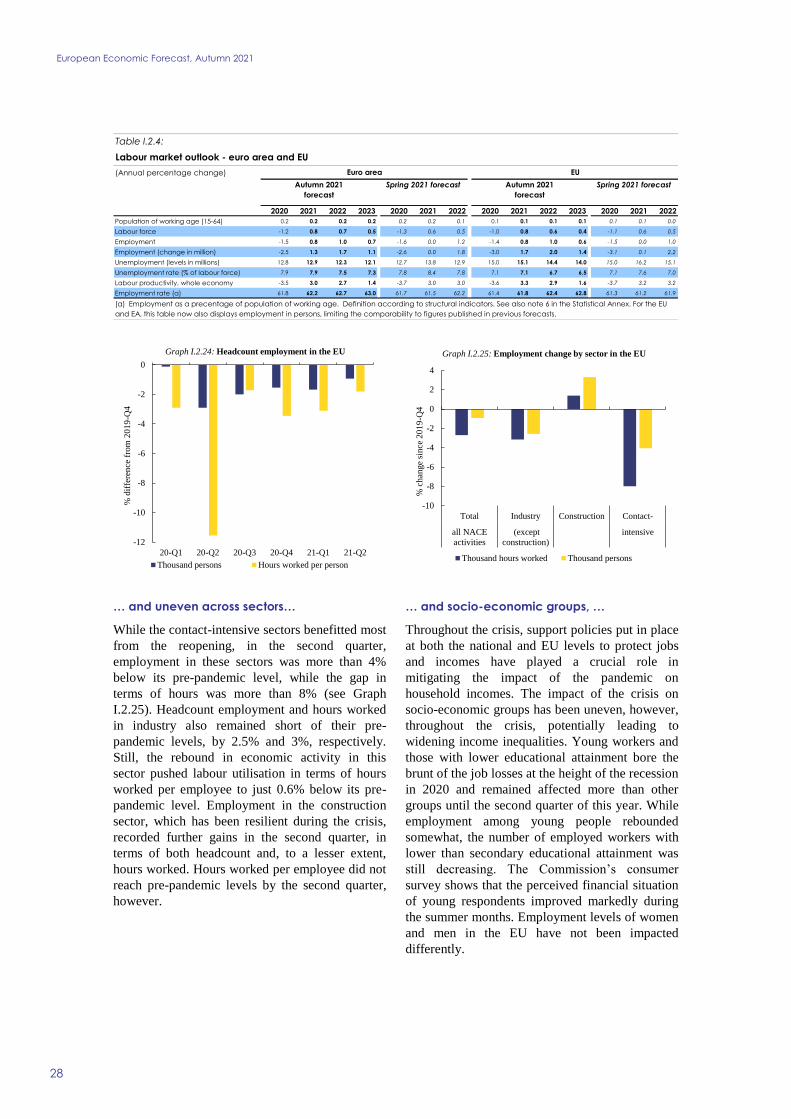
European Economic Forecast, Autumn 2021
28
… and uneven across sectors…
While the contact-intensive sectors benefitted most
from the reopening, in the second quarter,
employment in these sectors was more than 4%
below its pre-pandemic level, while the gap in
terms of hours was more than 8% (see Graph
I.2.25). Headcount employment and hours worked
in industry also remained short of their pre-
pandemic levels, by 2.5% and 3%, respectively.
Still, the rebound in economic activity in this
sector pushed labour utilisation in terms of hours
worked per employee to just 0.6% below its pre-
pandemic level. Employment in the construction
sector, which has been resilient during the crisis,
recorded further gains in the second quarter, in
terms of both headcount and, to a lesser extent,
hours worked. Hours worked per employee did not
reach pre-pandemic levels by the second quarter,
however.
… and socio-economic groups, …
Throughout the crisis, support policies put in place
at both the national and EU levels to protect jobs
and incomes have played a crucial role in
mitigating the impact of the pandemic on
household incomes. The impact of the crisis on
socio-economic groups has been uneven, however,
throughout the crisis, potentially leading to
widening income inequalities. Young workers and
those with lower educational attainment bore the
brunt of the job losses at the height of the recession
in 2020 and remained affected more than other
groups until the second quarter of this year. While
employment among young people rebounded
somewhat, the number of employed workers with
lower than secondary educational attainment was
still decreasing. The Commission’s consumer
survey shows that the perceived financial situation
of young respondents improved markedly during
the summer months. Employment levels of women
and men in the EU have not been impacted
differently.
-12
-10
-8
-6
-4
-2
0
20-Q1 20-Q2 20-Q3 20-Q4 21-Q1 21-Q2
Graph I.2.24: Headcount employment in the EU
Thousand persons Hours worked per person
% d
iffe
ren
ce f
rom
20
19
-Q4
-10
-8
-6
-4
-2
0
2
4
Total Industry Construction Contact-
all NACE
activities
(except
construction)
intensive
Graph I.2.25: Employment change by sector in the EU
Thousand hours worked Thousand persons
% c
han
ge
sin
ce 2
01
9-Q
4
(Annual percentage change)
2020 2021 2022 2023 2020 2021 2022 2020 2021 2022 2023 2020 2021 2022
Population of working age (15-64) 0.2 0.2 0.2 0.2 0.2 0.2 0.1 0.1 0.1 0.1 0.1 0.1 0.1 0.0
Labour force -1.2 0.8 0.7 0.5 -1.3 0.6 0.5 -1.0 0.8 0.6 0.4 -1.1 0.6 0.5
Employment -1.5 0.8 1.0 0.7 -1.6 0.0 1.2 -1.4 0.8 1.0 0.6 -1.5 0.0 1.0
Employment (change in million) -2.5 1.3 1.7 1.1 -2.6 0.0 1.8 -3.0 1.7 2.0 1.4 -3.1 0.1 2.2
Unemployment (levels in millions) 12.8 12.9 12.3 12.1 12.7 13.8 12.9 15.0 15.1 14.4 14.0 15.0 16.2 15.1
Unemployment rate (% of labour force) 7.9 7.9 7.5 7.3 7.8 8.4 7.8 7.1 7.1 6.7 6.5 7.1 7.6 7.0
Labour productivity, whole economy -3.5 3.0 2.7 1.4 -3.7 3.0 3.0 -3.6 3.3 2.9 1.6 -3.7 3.2 3.2
Employment rate (a) 61.8 62.2 62.7 63.0 61.7 61.5 62.2 61.4 61.8 62.4 62.8 61.3 61.2 61.9
(a) Employment as a precentage of population of working age. Definition according to structural indicators. See also note 6 in the Statistical Annex. For the EU
and EA, this table now also displays employment in persons, limiting the comparability to figures published in previous forecasts.
Table I.2.4:
Labour market outlook - euro area and EU
Euro area EU
Autumn 2021
forecast
Spring 2021 forecast Autumn 2021
forecast
Spring 2021 forecast
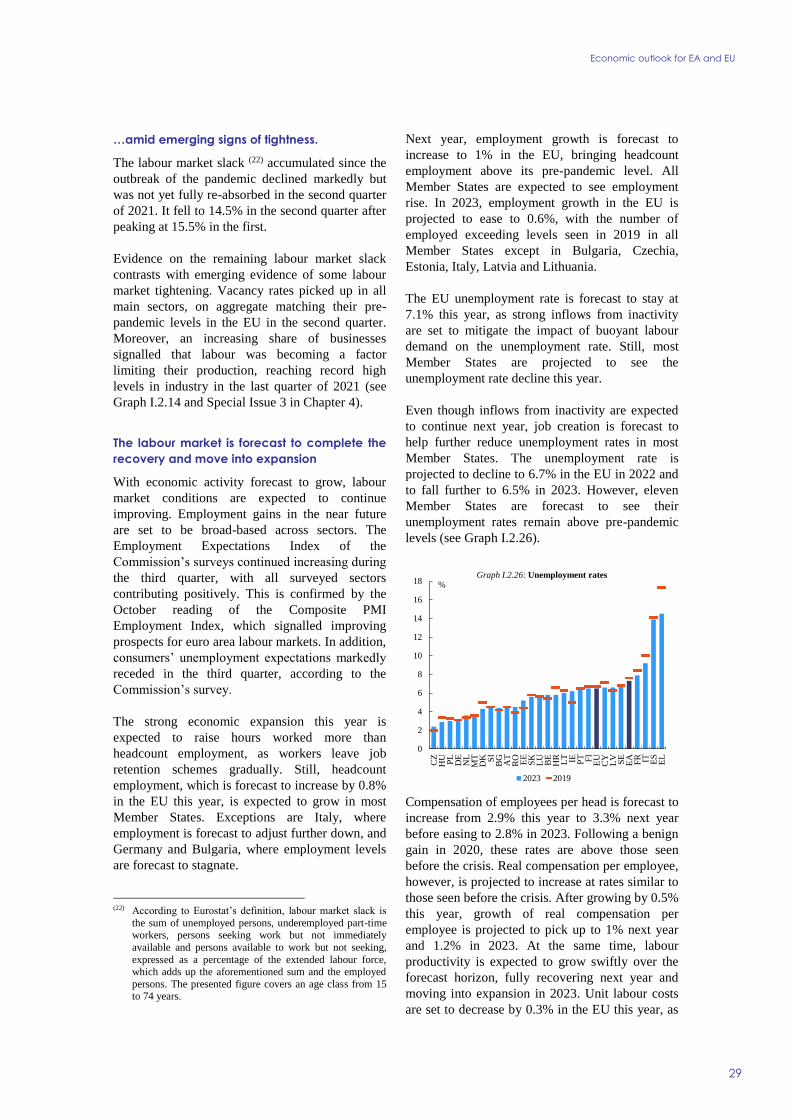
Economic outlook for EA and EU
29
…amid emerging signs of tightness.
The labour market slack (22) accumulated since the
outbreak of the pandemic declined markedly but
was not yet fully re-absorbed in the second quarter
of 2021. It fell to 14.5% in the second quarter after
peaking at 15.5% in the first.
Evidence on the remaining labour market slack
contrasts with emerging evidence of some labour
market tightening. Vacancy rates picked up in all
main sectors, on aggregate matching their pre-
pandemic levels in the EU in the second quarter.
Moreover, an increasing share of businesses
signalled that labour was becoming a factor
limiting their production, reaching record high
levels in industry in the last quarter of 2021 (see
Graph I.2.14 and Special Issue 3 in Chapter 4).
The labour market is forecast to complete the
recovery and move into expansion
With economic activity forecast to grow, labour
market conditions are expected to continue
improving. Employment gains in the near future
are set to be broad-based across sectors. The
Employment Expectations Index of the
Commission’s surveys continued increasing during
the third quarter, with all surveyed sectors
contributing positively. This is confirmed by the
October reading of the Composite PMI
Employment Index, which signalled improving
prospects for euro area labour markets. In addition,
consumers’ unemployment expectations markedly
receded in the third quarter, according to the
Commission’s survey.
The strong economic expansion this year is
expected to raise hours worked more than
headcount employment, as workers leave job
retention schemes gradually. Still, headcount
employment, which is forecast to increase by 0.8%
in the EU this year, is expected to grow in most
Member States. Exceptions are Italy, where
employment is forecast to adjust further down, and
Germany and Bulgaria, where employment levels
are forecast to stagnate.
(22) According to Eurostat’s definition, labour market slack is
the sum of unemployed persons, underemployed part-time workers, persons seeking work but not immediately
available and persons available to work but not seeking,
expressed as a percentage of the extended labour force, which adds up the aforementioned sum and the employed
persons. The presented figure covers an age class from 15 to 74 years.
Next year, employment growth is forecast to
increase to 1% in the EU, bringing headcount
employment above its pre-pandemic level. All
Member States are expected to see employment
rise. In 2023, employment growth in the EU is
projected to ease to 0.6%, with the number of
employed exceeding levels seen in 2019 in all
Member States except in Bulgaria, Czechia,
Estonia, Italy, Latvia and Lithuania.
The EU unemployment rate is forecast to stay at
7.1% this year, as strong inflows from inactivity
are set to mitigate the impact of buoyant labour
demand on the unemployment rate. Still, most
Member States are projected to see the
unemployment rate decline this year.
Even though inflows from inactivity are expected
to continue next year, job creation is forecast to
help further reduce unemployment rates in most
Member States. The unemployment rate is
projected to decline to 6.7% in the EU in 2022 and
to fall further to 6.5% in 2023. However, eleven
Member States are forecast to see their
unemployment rates remain above pre-pandemic
levels (see Graph I.2.26).
Compensation of employees per head is forecast to
increase from 2.9% this year to 3.3% next year
before easing to 2.8% in 2023. Following a benign
gain in 2020, these rates are above those seen
before the crisis. Real compensation per employee,
however, is projected to increase at rates similar to
those seen before the crisis. After growing by 0.5%
this year, growth of real compensation per
employee is projected to pick up to 1% next year
and 1.2% in 2023. At the same time, labour
productivity is expected to grow swiftly over the
forecast horizon, fully recovering next year and
moving into expansion in 2023. Unit labour costs
are set to decrease by 0.3% in the EU this year, as
0
2
4
6
8
10
12
14
16
18
CZ
HU PL
DE
NL
MT
DK SI
BG
AT
RO
EE
SK
LU
BE
HR
LT IE PT FI
EU
CY
LV SE
EA
FR IT ES
EL
Graph I.2.26: Unemployment rates
2023 2019
%

European Economic Forecast, Autumn 2021
30
labour productivity growth is expected to outpace
growth in compensation per employee. Unit labour
costs are forecast to increase by 0.4% and 1.2%
next year and in 2023, respectively, as growth of
compensation outpaces labour productivity gains.
2.5. INFLATION
Following several years of low inflation, the strong
resumption of economic activity in the EU has
been accompanied by a swift pick-up in inflation.
While an increase was expected, recent inflation
prints have repeatedly exceeded expectations.
Annual HICP inflation in the euro area hit a ten-
year high of 3.4% in September. It rose from a
negative -0.3% on average in the last quarter of
2020, to 1.8% and 2.8% in the second and third
quarters of 2021, respectively. The third quarter
reading therefore came in higher than the 2.4%
projected in the summer forecast. Some EU
countries both within and outside the euro area
recorded very strong upticks, with September
inflation rates reaching highs of 6.4% in Estonia
and Lithuania, and 5.5% and 5.6% in Hungary and
Poland, respectively.
Swings in energy prices have been strongly
influencing the profile of headline inflation since
the outset of the pandemic. Throughout most of
2020, energy prices have pulled the inflation rate
down. They have been pushing it back up during
the second quarter of 2021. In September 2021
alone, energy inflation topped 17.6% y-o-y, the
highest on record since 1997, while the October
reading – which came in after the cut-off date for
this forecast – marked a new record at almost 24%.
The strong increases in the energy component of
the HICP are largely linked to the increase in
energy commodity prices, most notably of natural
gas and electricity, but also of oil and, more
recently, coal (see Chapter 4). Compared to pre-
pandemic levels, the natural gas price in Europe
surged dramatically. It started to tick gradually
higher in the summer of last year and has
accelerated markedly since August this year. Oil
prices also increased, but not to the same extent:
Brent oil hovered just above 80 US dollars per
barrel in October, almost double that of October
last year, and from around 60 pre-pandemic.
Whereas increases in energy prices largely
dominated the dynamics of headline inflation,
annual price increases have become broad-based in
recent months, with non-energy industrial goods
(2.1%, y-o-y), food (2.0%, y-o-y) and services
(1.7%, y-o-y) adding 0.6 pps., 0.4 pps and 0.7 pps.
to the euro area September headline figure,
respectively. Core inflation (headline inflation
excluding energy and unprocessed food) thus
increased to 1.9% in September, the highest rate
since 2012.
Base effects are playing a prominent role in
2021
The strong pick-up in inflation since early 2021 is
to some extent a mechanical response to the fading
out of the deflationary forces that pushed inflation
down during the early stages of the pandemic. At
the current juncture, however, prices are not just
-2
-1
0
1
2
3
4
5
15 16 17 18 19 20 21 22 23
Graph I.2.27: Inflation breakdown, EU
Energy and unprocessed food (pps.)
Other components (core inflation) (pps.)
HICP, all items
y-o-y % forecast
(Annual percentage change)
2020 2021 2022 2023 2020 2021 2022 2020 2021 2022 2023 2020 2021 2022
Private consumption deflator 0.5 2.2 2.0 1.5 0.5 1.6 1.3 0.7 2.4 2.3 1.6 0.7 1.8 1.5
GDP deflator 1.6 1.6 1.9 1.5 1.5 1.2 1.4 1.9 1.9 2.1 1.7 1.8 1.4 1.5
HICP 0.3 2.4 2.2 1.4 0.3 1.7 1.3 0.7 2.6 2.5 1.6 0.7 1.9 1.5
Compensation per employee 0.6 2.6 2.9 2.4 0.6 2.2 2.4 0.8 2.9 3.3 2.8 0.9 2.5 2.7
Unit labour costs 4.3 -0.4 0.2 1.0 4.4 -0.7 -0.6 4.5 -0.3 0.4 1.2 4.7 -0.7 -0.5
Import prices of goods -3.8 7.0 3.7 1.1 -3.8 3.0 1.1 -3.4 6.9 3.7 1.2 -3.4 2.8 1.3
Table I.2.5:
Inflation outlook - euro area and EU
Euro area EU
Autumn 2021
forecast
Spring 2021 forecast Autumn 2021
forecast
Spring 2021 forecast
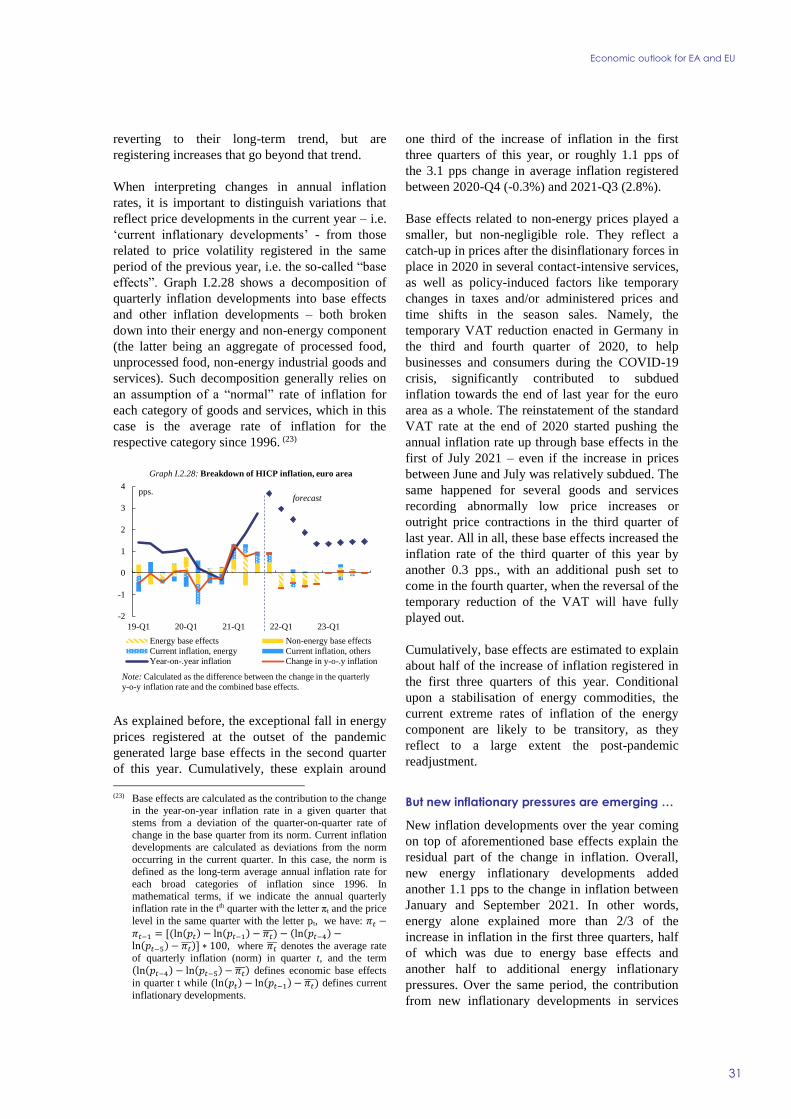
Economic outlook for EA and EU
31
reverting to their long-term trend, but are
registering increases that go beyond that trend.
When interpreting changes in annual inflation
rates, it is important to distinguish variations that
reflect price developments in the current year – i.e.
‘current inflationary developments’ - from those
related to price volatility registered in the same
period of the previous year, i.e. the so-called “base
effects”. Graph I.2.28 shows a decomposition of
quarterly inflation developments into base effects
and other inflation developments – both broken
down into their energy and non-energy component
(the latter being an aggregate of processed food,
unprocessed food, non-energy industrial goods and
services). Such decomposition generally relies on
an assumption of a “normal” rate of inflation for
each category of goods and services, which in this
case is the average rate of inflation for the
respective category since 1996. (23)
As explained before, the exceptional fall in energy
prices registered at the outset of the pandemic
generated large base effects in the second quarter
of this year. Cumulatively, these explain around
(23) Base effects are calculated as the contribution to the change
in the year-on-year inflation rate in a given quarter that
stems from a deviation of the quarter-on-quarter rate of change in the base quarter from its norm. Current inflation
developments are calculated as deviations from the norm
occurring in the current quarter. In this case, the norm is defined as the long-term average annual inflation rate for
each broad categories of inflation since 1996. In mathematical terms, if we indicate the annual quarterly
inflation rate in the tth quarter with the letter πt and the price
level in the same quarter with the letter pt, we have: 𝜋𝑡 −𝜋𝑡−1 = [(ln(𝑝𝑡) − ln(𝑝𝑡−1) − 𝜋𝑡̅̅̅) − (ln(𝑝𝑡−4) −ln(𝑝𝑡−5) − 𝜋𝑡̅̅̅)] ∗ 100, where 𝜋𝑡̅̅̅ denotes the average rate
of quarterly inflation (norm) in quarter t, and the term (ln(𝑝𝑡−4) − ln(𝑝𝑡−5) − 𝜋𝑡̅̅̅) defines economic base effects
in quarter t while (ln(𝑝𝑡) − ln(𝑝𝑡−1) − 𝜋𝑡̅̅̅) defines current
inflationary developments.
one third of the increase of inflation in the first
three quarters of this year, or roughly 1.1 pps of
the 3.1 pps change in average inflation registered
between 2020-Q4 (-0.3%) and 2021-Q3 (2.8%).
Base effects related to non-energy prices played a
smaller, but non-negligible role. They reflect a
catch-up in prices after the disinflationary forces in
place in 2020 in several contact-intensive services,
as well as policy-induced factors like temporary
changes in taxes and/or administered prices and
time shifts in the season sales. Namely, the
temporary VAT reduction enacted in Germany in
the third and fourth quarter of 2020, to help
businesses and consumers during the COVID-19
crisis, significantly contributed to subdued
inflation towards the end of last year for the euro
area as a whole. The reinstatement of the standard
VAT rate at the end of 2020 started pushing the
annual inflation rate up through base effects in the
first of July 2021 – even if the increase in prices
between June and July was relatively subdued. The
same happened for several goods and services
recording abnormally low price increases or
outright price contractions in the third quarter of
last year. All in all, these base effects increased the
inflation rate of the third quarter of this year by
another 0.3 pps., with an additional push set to
come in the fourth quarter, when the reversal of the
temporary reduction of the VAT will have fully
played out.
Cumulatively, base effects are estimated to explain
about half of the increase of inflation registered in
the first three quarters of this year. Conditional
upon a stabilisation of energy commodities, the
current extreme rates of inflation of the energy
component are likely to be transitory, as they
reflect to a large extent the post-pandemic
readjustment.
But new inflationary pressures are emerging …
New inflation developments over the year coming
on top of aforementioned base effects explain the
residual part of the change in inflation. Overall,
new energy inflationary developments added
another 1.1 pps to the change in inflation between
January and September 2021. In other words,
energy alone explained more than 2/3 of the
increase in inflation in the first three quarters, half
of which was due to energy base effects and
another half to additional energy inflationary
pressures. Over the same period, the contribution
from new inflationary developments in services
-2
-1
0
1
2
3
4
19-Q1 20-Q1 21-Q1 22-Q1 23-Q1
Graph I.2.28: Breakdown of HICP inflation, euro area
Energy base effects Non-energy base effects
Current inflation, energy Current inflation, others
Year-on-.year inflation Change in y-o-.y inflation
pps.
Note: Calculated as the difference between the change in the quarterly
y-o-y inflation rate and the combined base effects.
forecast

European Economic Forecast, Autumn 2021
32
and non-energy goods stood at a more modest 0.6
pps.
… with pipeline pressures are running high
Strong rises in producer prices, as well as the surge
in selling price expectations reported by business
managers in Commission surveys, signal that
pipeline price pressures are building up, reflecting
e.g. the shortage of material/equipment, increasing
capacity utilisation and orders (see Section 2.3).
Industrial producer price inflation on the domestic
market increased steeply this year and reached
13.4% year-on-year in September, a historical peak
for this series (starting in 1996). Clearly, energy
prices contributed the most to this increase, but the
non-energy component also stood at a historical
high. Concomitantly, industrial import prices
progressed to a growth rate of 15.2% y-o-y in
September, driven most notably by energy imports
(81%) but also intermediate goods (17.6%).
Selling price expectations in all business sectors
surveyed by the European Commission (i.e.
industry, services, retail trade and construction)
continued their steep increase observed since the
beginning of the year and reached new all-time
highs in October.
Inflation expected to decline over the course
of 2022 before stabilising in 2023.
According to the technical assumption
underpinning this forecast, oil prices are set to
come down gradually from a high expected to be
reached in 2021-Q4. By contrast, according to
futures contracts, wholesale gas and electricity
prices are expected to stay high until spring, before
abating but remaining above pre-crisis levels.
Notwithstanding large variation across countries in
the pace and size of the transmission to
households’ retail electricity and gas prices,
increasing energy prices are set to add further price
pressures in the fourth quarter of this year, adding
0.4 pps to the headline inflation rate attained in
2021-Q3.
This is expected to be compounded by continued
positive base effects mainly related to non-energy
goods and services (including as a result of the
above-mentioned reinstatement of the standard
VAT rate in Germany), which should add a further
additional 0.5 pps to inflation in the fourth quarter.
Altogether, the inflation rate is expected to
increase from 2.8% in 2021-Q3 to 3.7% in 2021-
Q4.
In 2022 and to a lesser extent in 2023, the energy
component of the HICP is set to continue to
dominate headline inflation dynamics. As of the
second quarter of 2022, however, the forces that
have pushed inflation up in the second half of this
year, are set to revert, leading to negative
(inflation-reducing) base effects. Between the last
quarter of 2021 (3.7%) and the last quarter of 2022
(1.3%), inflation is set to decrease by some 2.3 pps
in the EA – with around 1.5 pps explained by
negative energy base effects. Base effects related
to non-energy goods and services are expected to
detract another 0.6 pps from inflation. By 2023,
base effects related to pandemic deflationary
pressures first and energy reflationary pressure
later are expected to have fully played out, and no
new significant inflationary pressures are expected.
The annual inflation rate for the EA in 2023 is
projected to maintain a broadly flat quarterly
profile at around 1.4% - largely corresponding to
the forecast core inflation. On a yearly basis,
inflation in the euro area is therefore set to peak at
2.4% this year and then decrease to 2.2% in 2022
and 1.4% in 2023.
This inflation forecast reflects a limited reaction of
wages to current inflation. Nominal compensation
per employee in 2022 and 2023 in the EA is
expected to exceed the headline inflation rate,
marking an increase in real compensation growth,
following the slowdown in 2020 and 2021.
However wage growth is set to remain subdued,
reflecting residual slack on the labour market.
The inflation dynamics in the EU aggregate are
forecast to broadly mirror the developments
described above for the EA – especially as
concerns the role of energy prices. Somewhat
stronger wage growth in non-euro area economies
coupled with more pronounced increases in energy
prices (also due to an unfavourable energy mix in
some countries) is expected to push inflation in the
EU slightly above the rates projected for the euro
area. HICP inflation in the EU is forecast to rise to
2.6% in 2021 and decline to 2.5% and 1.6% in
2022 and 2023, respectively.

Economic outlook for EA and EU
33
Market inflation expectations increase but
remain anchored below 2%
Market-based medium and longer-term inflation
expectations increased further since summer but
overall they remained below current readings, still
suggesting that markets interpret the current
elevated inflation rates as largely transitory. The
longer-term (5y-5y) expectations reversed the
declines of the past ten years and stood at 1.9% by
the cut-off date of this forecast. The mean market
forecast for euro area inflation calculated by
Consensus Economics stood in October at 2.3% in
2021 and 2% in 2022, up from 1.9% and 1.4% in
July.
2.6. CURRENT ACCOUNT
After unusual fluctuations, the return towards
some type of ‘economic normalcy’ is set to push
the EU current account and its sub-accounts closer
to the underlying trends observed before the
pandemic.
The EU current account surplus is projected to
increase markedly over the forecast horizon...
Between 2020 and 2023, the current account
surplus in the EU is forecast to expand much faster
than nominal GDP. As a percentage of GDP, it is
forecast to rise from 2.7% to 3.2%, which is
closely linked to the fading away of the multiple
disruptions generated by the COVID-19 shock.
…as pandemic-related effects that have held
back service and merchandise trade
diminish…
Up to this year, the services account was affected
by the lower surplus in travel, as due to travel bans
many international visitors were unable to visit EU
destinations. With tourism recovering, the services
account is set to exhibit higher surpluses in the
forecast years (from 0.7% of GDP in 2020 to 1.5%
of GDP in 2023).
The fall in global demand after the pandemic
outbreak also affected negatively EU goods
exports. Imports, however, fell by an even higher
rate. Moreover, import prices also fell last year,
especially for crude oil, contributing to a higher
surplus in the goods account. Amid rising import
prices for intermediate goods and commodities,
including prices for crude oil and natural gas,
nominal imports are projected to grow stronger
than exports this year and next, which lowers the
goods account surpluses in both years. The surplus
in the merchandise trade balance is expected to
stand in the three forecast years close to 2½% of
GDP, which is lower than the surplus in 2020
(3.1% of GDP) but close to the levels registered in
the years before the pandemic.
After the outbreak of the pandemic, the EU's
surplus on primary income declined substantially,
mainly on account of lower earnings from EU
investment abroad. As the ongoing global recovery
is expected to raise global earnings, the net
primary surplus is set to increase. The deficit in the
balance of primary income and current transfers is
projected to decline slightly in the forecast years
(from -1.2% of GDP in 2020 to -1.0% in 2023).
All in all, the current account balance is set to
show widening surpluses between 2020 and 2023
(see Graph I.2.30).
These developments in the EU current account
balance mirror the dynamics of aggregate saving
and investment. Although investment in the EU
fell last year, gross national saving fell to an even
larger extent, concealing heterogeneous changes in
the net lending position of households, non-
financial corporations and the public sector. While
savings of private households went up (by about
50% in 2020), and savings of non-financial
corporations remained almost unchanged, the
general government deficit increased significantly
from a historical low reached before the pandemic
(see Section 2.7). Going forward, gross national
saving as a percentage of GDP is expected to
0.0
0.5
1.0
1.5
2.0
2.5
3.0
Jan-12 Jan-15 Jan-18 Jan-21
%
Maturity date
Graph I.2.29: Inflation expectations derived from
implied forward inflation-linked swap rates
5 years forward 5 years ahead 3 years forward 3 years ahead
1 year forward 1 year ahead
SSource: Bloomberg
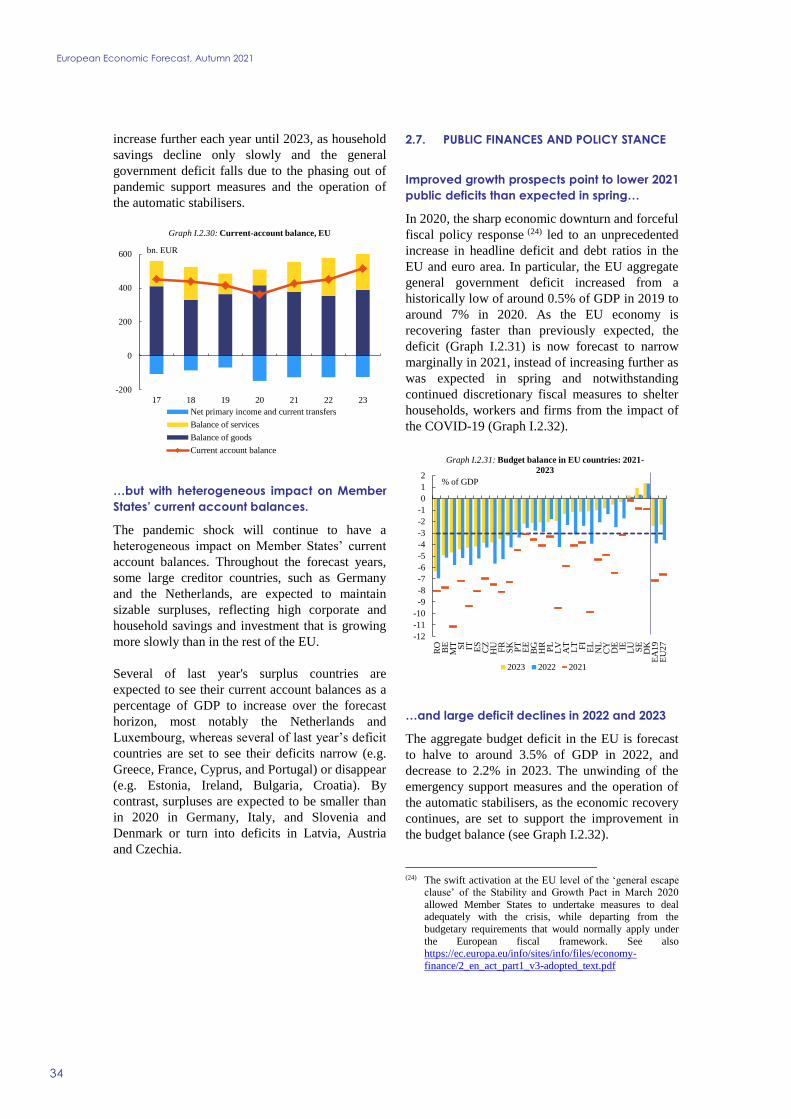
European Economic Forecast, Autumn 2021
34
increase further each year until 2023, as household
savings decline only slowly and the general
government deficit falls due to the phasing out of
pandemic support measures and the operation of
the automatic stabilisers.
…but with heterogeneous impact on Member
States’ current account balances.
The pandemic shock will continue to have a
heterogeneous impact on Member States’ current
account balances. Throughout the forecast years,
some large creditor countries, such as Germany
and the Netherlands, are expected to maintain
sizable surpluses, reflecting high corporate and
household savings and investment that is growing
more slowly than in the rest of the EU.
Several of last year's surplus countries are
expected to see their current account balances as a
percentage of GDP to increase over the forecast
horizon, most notably the Netherlands and
Luxembourg, whereas several of last year’s deficit
countries are set to see their deficits narrow (e.g.
Greece, France, Cyprus, and Portugal) or disappear
(e.g. Estonia, Ireland, Bulgaria, Croatia). By
contrast, surpluses are expected to be smaller than
in 2020 in Germany, Italy, and Slovenia and
Denmark or turn into deficits in Latvia, Austria
and Czechia.
2.7. PUBLIC FINANCES AND POLICY STANCE
Improved growth prospects point to lower 2021
public deficits than expected in spring…
In 2020, the sharp economic downturn and forceful
fiscal policy response (24) led to an unprecedented
increase in headline deficit and debt ratios in the
EU and euro area. In particular, the EU aggregate
general government deficit increased from a
historically low of around 0.5% of GDP in 2019 to
around 7% in 2020. As the EU economy is
recovering faster than previously expected, the
deficit (Graph I.2.31) is now forecast to narrow
marginally in 2021, instead of increasing further as
was expected in spring and notwithstanding
continued discretionary fiscal measures to shelter
households, workers and firms from the impact of
the COVID-19 (Graph I.2.32).
…and large deficit declines in 2022 and 2023
The aggregate budget deficit in the EU is forecast
to halve to around 3.5% of GDP in 2022, and
decrease to 2.2% in 2023. The unwinding of the
emergency support measures and the operation of
the automatic stabilisers, as the economic recovery
continues, are set to support the improvement in
the budget balance (see Graph I.2.32).
(24) The swift activation at the EU level of the ‘general escape
clause’ of the Stability and Growth Pact in March 2020
allowed Member States to undertake measures to deal adequately with the crisis, while departing from the
budgetary requirements that would normally apply under
the European fiscal framework. See also https://ec.europa.eu/info/sites/info/files/economy-
finance/2_en_act_part1_v3-adopted_text.pdf
-200
0
200
400
600
17 18 19 20 21 22 23
Graph I.2.30: Current-account balance, EU
Net primary income and current transfers
Balance of services
Balance of goods
Current account balance
bn. EUR
-12
-11
-10
-9
-8
-7
-6
-5
-4
-3
-2
-1
0
1
2
RO
BE
MT SI
IT ES
CZ
HU
FR
SK PT
EE
BG
HR
PL
LV
AT
LT FI
EL
NL
CY
DE IE LU SE
DK
EA
19
EU
27
% of GDP
Graph I.2.31: Budget balance in EU countries: 2021-
2023
2023 2022 2021
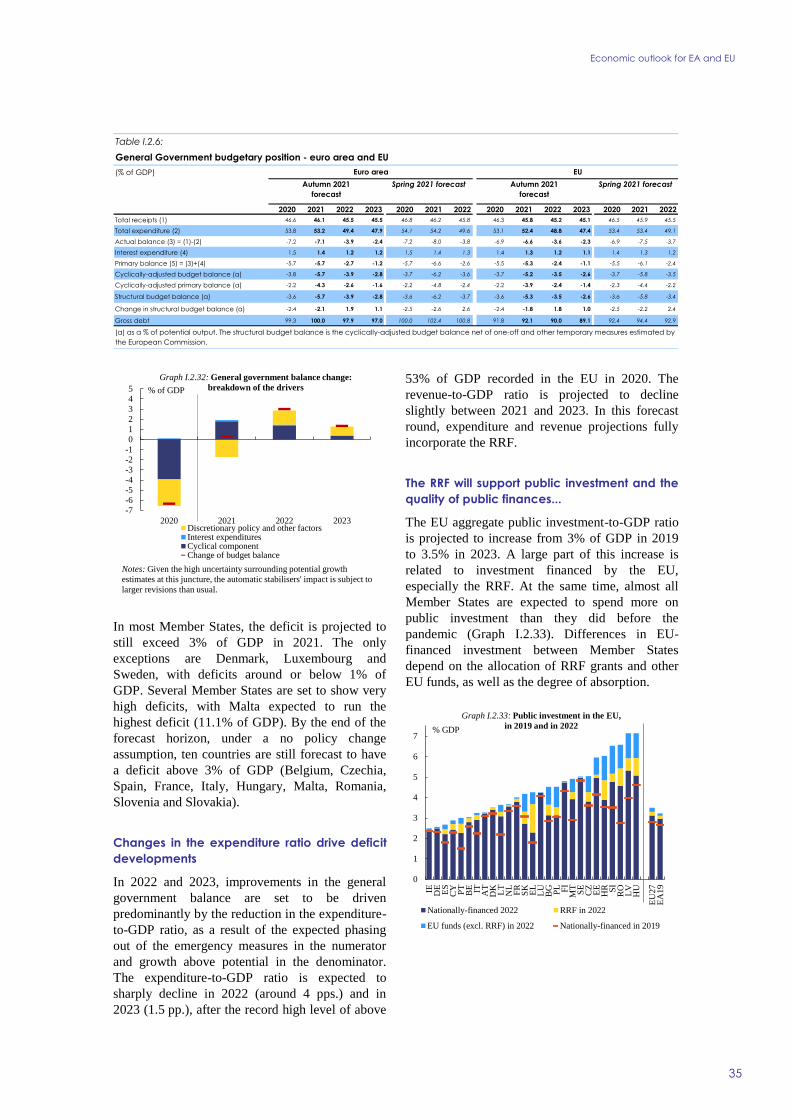
Economic outlook for EA and EU
35
In most Member States, the deficit is projected to
still exceed 3% of GDP in 2021. The only
exceptions are Denmark, Luxembourg and
Sweden, with deficits around or below 1% of
GDP. Several Member States are set to show very
high deficits, with Malta expected to run the
highest deficit (11.1% of GDP). By the end of the
forecast horizon, under a no policy change
assumption, ten countries are still forecast to have
a deficit above 3% of GDP (Belgium, Czechia,
Spain, France, Italy, Hungary, Malta, Romania,
Slovenia and Slovakia).
Changes in the expenditure ratio drive deficit
developments
In 2022 and 2023, improvements in the general
government balance are set to be driven
predominantly by the reduction in the expenditure-
to-GDP ratio, as a result of the expected phasing
out of the emergency measures in the numerator
and growth above potential in the denominator.
The expenditure-to-GDP ratio is expected to
sharply decline in 2022 (around 4 pps.) and in
2023 (1.5 pp.), after the record high level of above
53% of GDP recorded in the EU in 2020. The
revenue-to-GDP ratio is projected to decline
slightly between 2021 and 2023. In this forecast
round, expenditure and revenue projections fully
incorporate the RRF.
The RRF will support public investment and the
quality of public finances...
The EU aggregate public investment-to-GDP ratio
is projected to increase from 3% of GDP in 2019
to 3.5% in 2023. A large part of this increase is
related to investment financed by the EU,
especially the RRF. At the same time, almost all
Member States are expected to spend more on
public investment than they did before the
pandemic (Graph I.2.33). Differences in EU-
financed investment between Member States
depend on the allocation of RRF grants and other
EU funds, as well as the degree of absorption.
-7
-6-5-4-3
-2
-1
0
1
2
3
4
5
2020 2021 2022 2023
Graph I.2.32: General government balance change:
breakdown of the drivers
Discretionary policy and other factorsInterest expendituresCyclical componentChange of budget balance
% of GDP
Notes: Given the high uncertainty surrounding potential growth
estimates at this juncture, the automatic stabilisers' impact is subject to
larger revisions than usual.
0
1
2
3
4
5
6
7
IE DE
ES
CY PT
BE IT AT
DK
LT
NL
FR
SK
EL
LU
BG PL FI
MT
SE
CZ
EE
HR SI
RO
LV
HU
EU
27
EA
19
Nationally-financed 2022 RRF in 2022
EU funds (excl. RRF) in 2022 Nationally-financed in 2019
Graph I.2.33: Public investment in the EU,
in 2019 and in 2022% GDP
(% of GDP)
2020 2021 2022 2023 2020 2021 2022 2020 2021 2022 2023 2020 2021 2022
Total receipts (1) 46.6 46.1 45.5 45.5 46.8 46.2 45.8 46.3 45.8 45.2 45.1 46.5 45.9 45.5
Total expenditure (2) 53.8 53.2 49.4 47.9 54.1 54.2 49.6 53.1 52.4 48.8 47.4 53.4 53.4 49.1
Actual balance (3) = (1)-(2) -7.2 -7.1 -3.9 -2.4 -7.2 -8.0 -3.8 -6.9 -6.6 -3.6 -2.3 -6.9 -7.5 -3.7
Interest expenditure (4) 1.5 1.4 1.2 1.2 1.5 1.4 1.3 1.4 1.3 1.2 1.1 1.4 1.3 1.2
Primary balance (5) = (3)+(4) -5.7 -5.7 -2.7 -1.2 -5.7 -6.6 -2.6 -5.5 -5.3 -2.4 -1.1 -5.5 -6.1 -2.4
Cyclically-adjusted budget balance (a) -3.8 -5.7 -3.9 -2.8 -3.7 -6.2 -3.6 -3.7 -5.2 -3.5 -2.6 -3.7 -5.8 -3.5
Cyclically-adjusted primary balance (a) -2.2 -4.3 -2.6 -1.6 -2.2 -4.8 -2.4 -2.2 -3.9 -2.4 -1.4 -2.3 -4.4 -2.2
Structural budget balance (a) -3.6 -5.7 -3.9 -2.8 -3.6 -6.2 -3.7 -3.6 -5.3 -3.5 -2.6 -3.6 -5.8 -3.4
Change in structural budget balance (a) -2.4 -2.1 1.9 1.1 -2.5 -2.6 2.6 -2.4 -1.8 1.8 1.0 -2.5 -2.2 2.4
Gross debt 99.3 100.0 97.9 97.0 100.0 102.4 100.8 91.8 92.1 90.0 89.1 92.4 94.4 92.9
(a) as a % of potential output. The structural budget balance is the cyclically-adjusted budget balance net of one-off and other temporary measures estimated by
the European Commission.
Table I.2.6:
General Government budgetary position - euro area and EU
Euro area EU
Autumn 2021
forecast
Spring 2021 forecast Autumn 2021
forecast
Spring 2021 forecast
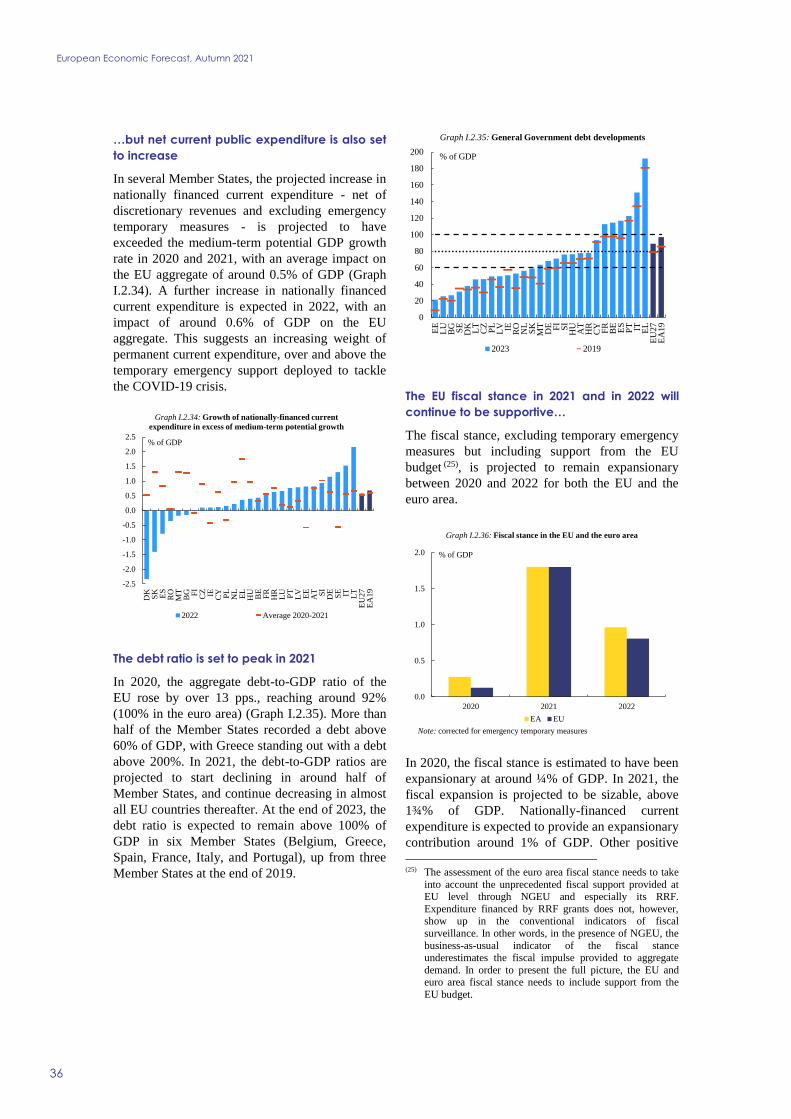
European Economic Forecast, Autumn 2021
36
…but net current public expenditure is also set
to increase
In several Member States, the projected increase in
nationally financed current expenditure - net of
discretionary revenues and excluding emergency
temporary measures - is projected to have
exceeded the medium-term potential GDP growth
rate in 2020 and 2021, with an average impact on
the EU aggregate of around 0.5% of GDP (Graph
I.2.34). A further increase in nationally financed
current expenditure is expected in 2022, with an
impact of around 0.6% of GDP on the EU
aggregate. This suggests an increasing weight of
permanent current expenditure, over and above the
temporary emergency support deployed to tackle
the COVID-19 crisis.
The debt ratio is set to peak in 2021
In 2020, the aggregate debt-to-GDP ratio of the
EU rose by over 13 pps., reaching around 92%
(100% in the euro area) (Graph I.2.35). More than
half of the Member States recorded a debt above
60% of GDP, with Greece standing out with a debt
above 200%. In 2021, the debt-to-GDP ratios are
projected to start declining in around half of
Member States, and continue decreasing in almost
all EU countries thereafter. At the end of 2023, the
debt ratio is expected to remain above 100% of
GDP in six Member States (Belgium, Greece,
Spain, France, Italy, and Portugal), up from three
Member States at the end of 2019.
The EU fiscal stance in 2021 and in 2022 will
continue to be supportive…
The fiscal stance, excluding temporary emergency
measures but including support from the EU
budget (25), is projected to remain expansionary
between 2020 and 2022 for both the EU and the
euro area.
In 2020, the fiscal stance is estimated to have been
expansionary at around ¼% of GDP. In 2021, the
fiscal expansion is projected to be sizable, above
1¾% of GDP. Nationally-financed current
expenditure is expected to provide an expansionary
contribution around 1% of GDP. Other positive
(25) The assessment of the euro area fiscal stance needs to take
into account the unprecedented fiscal support provided at EU level through NGEU and especially its RRF.
Expenditure financed by RRF grants does not, however, show up in the conventional indicators of fiscal
surveillance. In other words, in the presence of NGEU, the
business-as-usual indicator of the fiscal stance underestimates the fiscal impulse provided to aggregate
demand. In order to present the full picture, the EU and euro area fiscal stance needs to include support from the
EU budget.
-2.5
-2.0
-1.5
-1.0
-0.5
0.0
0.5
1.0
1.5
2.0
2.5
DK
SK ES
RO
MT
BG FI
CZ IE CY PL
NL
EL
HU
BE
FR
HR
LU PT
LV
EE
AT SI
DE
SE IT LT
EU
27
EA
19
Graph I.2.34: Growth of nationally-financed current
expenditure in excess of medium-term potential growth
2022 Average 2020-2021
% of GDP
0
20
40
60
80
100
120
140
160
180
200
EE
LU
BG SE
DK
LT
CZ
PL
LV IE RO
NL
SK
MT
DE FI
SI
HU
AT
HR
CY
FR
BE
ES
PT IT EL
EU
27
EA
19
% of GDP
Graph I.2.35: General Government debt developments
2023 2019
0.0
0.5
1.0
1.5
2.0
2020 2021 2022
Graph I.2.36: Fiscal stance in the EU and the euro area
EA EU
Note: corrected for emergency temporary measures
% of GDP
Economic outlook for EA and EU
37
contributions will come from public investment
and other capital spending financed by the national
and the EU budgets. A further fiscal expansion
close to 1% of GDP is forecast for 2022.
…reinforced by the accommodative monetary
policy
The mutually-reinforcing benefits of fiscal and
monetary policies have limited the economic
damage of the pandemic. Monetary policy
conducted during the crisis has helped easing
financing conditions and preserving financial
stability, hence contributing to a more effective
transmission of fiscal policy to the economy. At
the same time, the transmission of the
accommodative monetary policy stance has been
facilitated by a supportive fiscal stance. These
benefits are set to continue in 2021 and 2022 given
ECB’s forward guidance and the support to
aggregate demand provided by both national
budgets and the Recovery and Resilience Facility.
The strong complementarity between fiscal and
monetary policies remains essential for the
recovery to maintain traction in the near term.


3. RISKS
39
Uncertainty and risks surrounding the growth
outlook remain high, and in a context of
deteriorating epidemiological situation, the balance
of risks has tilted to the downside.
COVID-19 has not yet been defeated and the
recovery is heavily dependent on its evolution,
both within and outside the EU. Economic risks
also relate to the potential protracted impact of the
current supply constraints and bottlenecks. The
main upside risk to the growth outlook is related to
potential efficiency gains and durable productivity
advances triggered by the pandemic-induced
structural changes.
Inflation may turn out higher than forecast, if
supply constraints are more persistent and cost and
wage pressures are passed on to consumer prices
more strongly than assumed.
The main unknown remains on the
epidemiological front…
Since spring, fast progress in vaccination in the EU
and some adaptation of firms and households to
the remaining restrictions have significantly
weakened the relationship between the
epidemiological situation and economic outcomes.
However, the persisting health risk posed by the
pandemic could still hold back the recovery. The
recent surge of cases in many countries may lead
to the reintroduction of restrictions with impact on
economic activity. In the EU, this risk is
particularly relevant in Member States with
relatively low vaccination rates. In other words,
the assumption underlying this forecast that the
pandemic will not cause any major economic
disruptions in the EU over the forecast horizon
may prove too benign. Outside the EU, the risk of
new waves of the pandemic is even greater, as
large parts of the population in emerging markets
are still waiting for their first vaccine dose.
…and new headwinds to the EU’s growth
momentum may strengthen
Global supply bottlenecks may persist for longer
than assumed in this forecast, while new
COVID-19 outbreaks (both in the EU and
abroad), structural impediments or geopolitical
tensions may exacerbate material and labour
shortages and push energy commodity prices
further up, or hinder their normalisation. This
would further hamper activity in the affected
markets and sectors, weigh on sentiment and
increase production costs. Persisting cost pressures
would eventually weigh on business investment
and/or consumption if passed on to consumer
prices.
Further risks from the external side come from the
ongoing debt crisis in China’s real estate sector,
which primarily risks undermining the growth
outlook in China, but with potential spill-overs to
the rest of the world.
Extreme weather events related to climate change
and the deterioration of the environment may be
occurring at a frequency and scope that takes on
macroeconomic relevance.
Domestic demand could be more vigorous
than projected …
The strength of demand could still surprise on the
upside, as it has done in the past two quarters. This
could be the case if households replace more of
their savings with consumption. Furthermore, the
investments fostered by the RRF could generate a
stronger impulse to activity through e.g. stronger
cross-sector and cross-country spillovers.
Decarbonisation along with broader pandemic-
induced structural shifts favouring the digital
transformation, could also lead to a faster
reallocation of resources, spurring durable
efficiency gains and productivity advances and
resilience.
…while longer-than-expected supply-side
disruptions could keep inflation at high levels
Inflation may turn out higher than expected if cost
pressures resulting from supply-side disruptions
persist and are eventually passed on from producer
to consumer prices, especially in the context of
still buoyant demand. Similarly, prices of energy
could rise further, or remain at elevated levels for
longer than currently assumed. This could push
retail prices for both producers and consumers up
more strongly and durably than projected,
weighing on domestic demand (business
investment or household consumption). Finally,
high inflation may generate second-round effects
through above-productivity wage increases.
European Economic Forecast, Autumn 2021
40
Global inflationary pressures risk bringing
forward central banks tightening cycle.
The recent acceleration of global inflation and
inflationary pressures is already forcing central
banks in some advanced and emerging economies
to tighten monetary policy. In view of the strong
increase of consumer prices in the US, the Federal
Reserve may follow suit with a faster-than-
expected tightening of its monetary policy. This
would increase pressures on EMEs exchange rates
and financing conditions, notably among
heavily-indebted EMEs with large foreign
currency exposure, resulting in reduced policy
support and dampening growth.
At the same time, a less buoyant and synchronous
recovery could help alleviate some of the current
bottlenecks, including in transport and commodity
markets, and ease the elevated price pressures,
laying the ground for a more harmonious and
longer global expansion phase.
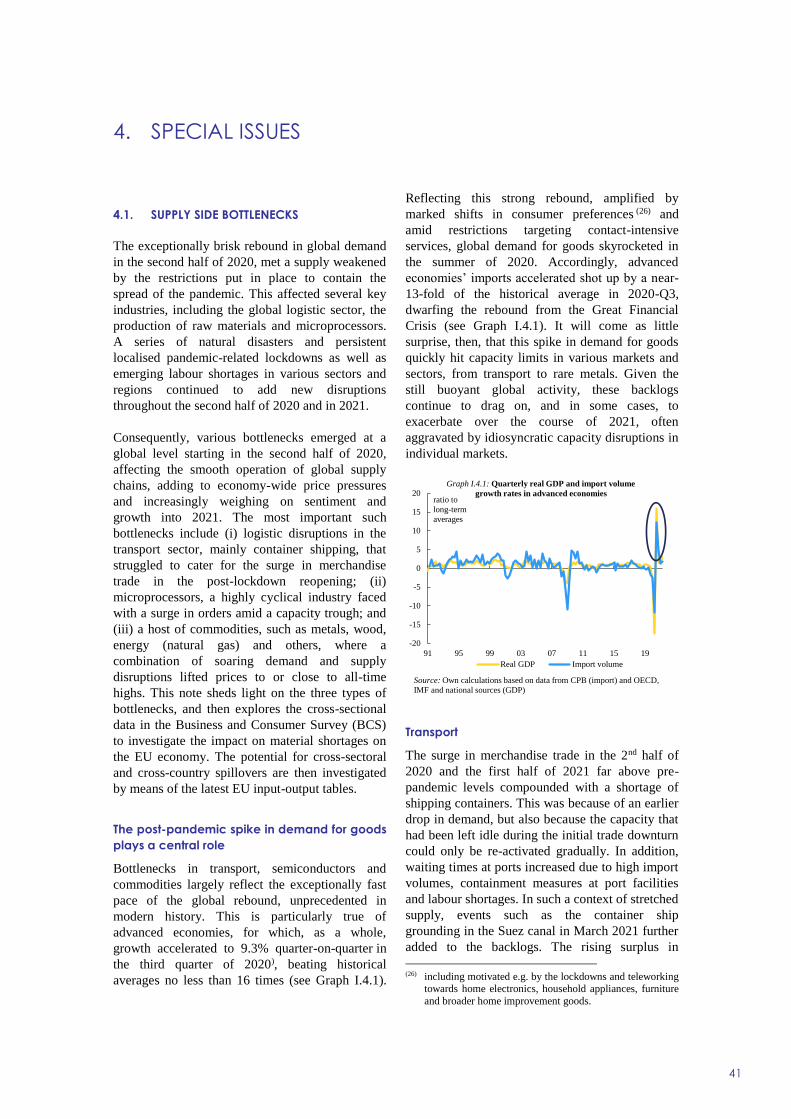
4. SPECIAL ISSUES
41
4.1. SUPPLY SIDE BOTTLENECKS
The exceptionally brisk rebound in global demand
in the second half of 2020, met a supply weakened
by the restrictions put in place to contain the
spread of the pandemic. This affected several key
industries, including the global logistic sector, the
production of raw materials and microprocessors.
A series of natural disasters and persistent
localised pandemic-related lockdowns as well as
emerging labour shortages in various sectors and
regions continued to add new disruptions
throughout the second half of 2020 and in 2021.
Consequently, various bottlenecks emerged at a
global level starting in the second half of 2020,
affecting the smooth operation of global supply
chains, adding to economy-wide price pressures
and increasingly weighing on sentiment and
growth into 2021. The most important such
bottlenecks include (i) logistic disruptions in the
transport sector, mainly container shipping, that
struggled to cater for the surge in merchandise
trade in the post-lockdown reopening; (ii)
microprocessors, a highly cyclical industry faced
with a surge in orders amid a capacity trough; and
(iii) a host of commodities, such as metals, wood,
energy (natural gas) and others, where a
combination of soaring demand and supply
disruptions lifted prices to or close to all-time
highs. This note sheds light on the three types of
bottlenecks, and then explores the cross-sectional
data in the Business and Consumer Survey (BCS)
to investigate the impact on material shortages on
the EU economy. The potential for cross-sectoral
and cross-country spillovers are then investigated
by means of the latest EU input-output tables.
The post-pandemic spike in demand for goods
plays a central role
Bottlenecks in transport, semiconductors and
commodities largely reflect the exceptionally fast
pace of the global rebound, unprecedented in
modern history. This is particularly true of
advanced economies, for which, as a whole,
growth accelerated to 9.3% quarter-on-quarter in
the third quarter of 2020), beating historical
averages no less than 16 times (see Graph I.4.1).
Reflecting this strong rebound, amplified by
marked shifts in consumer preferences (26) and
amid restrictions targeting contact-intensive
services, global demand for goods skyrocketed in
the summer of 2020. Accordingly, advanced
economies’ imports accelerated shot up by a near-
13-fold of the historical average in 2020-Q3,
dwarfing the rebound from the Great Financial
Crisis (see Graph I.4.1). It will come as little
surprise, then, that this spike in demand for goods
quickly hit capacity limits in various markets and
sectors, from transport to rare metals. Given the
still buoyant global activity, these backlogs
continue to drag on, and in some cases, to
exacerbate over the course of 2021, often
aggravated by idiosyncratic capacity disruptions in
individual markets.
Transport
The surge in merchandise trade in the 2nd half of
2020 and the first half of 2021 far above pre-
pandemic levels compounded with a shortage of
shipping containers. This was because of an earlier
drop in demand, but also because the capacity that
had been left idle during the initial trade downturn
could only be re-activated gradually. In addition,
waiting times at ports increased due to high import
volumes, containment measures at port facilities
and labour shortages. In such a context of stretched
supply, events such as the container ship
grounding in the Suez canal in March 2021 further
added to the backlogs. The rising surplus in
(26) including motivated e.g. by the lockdowns and teleworking
towards home electronics, household appliances, furniture
and broader home improvement goods.
-20
-15
-10
-5
0
5
10
15
20
91 95 99 03 07 11 15 19
Graph I.4.1: Quarterly real GDP and import volume
growth rates in advanced economies
Real GDP Import volume
Source: Own calculations based on data from CPB (import) and OECD,
IMF and national sources (GDP)
ratio to
long-term
averages

European Economic Forecast, Autumn 2021
42
Chinese trade with advanced economies
additionally complicated the normal functioning of
transport chains as containers had to be shipped
back empty to Asia to be available for further
exports. Moreover, the reduction in passenger
flights during the pandemic reduced air freight
capacity, increasing pressure on maritime
transport. As a consequence, shipping transit times
lengthened (27), and transport costs surged during
the past year, attaining, at the cut-off date of this
forecast, a spot price up to five times higher than
before the pandemic (see Graph I.4.2).
While there are indications that the stress on global
transport logistics is going to ease, developments
are highly dependent on the evolution of the
pandemic. Having reached pre-pandemic levels
already in late 2020, global trade in goods has
started losing momentum, reducing demand for
goods transports. Moreover, the re-pivoting of
consumption towards services is likely to
contribute to a further softening in demand for
maritime transport services. Likewise, global air
passenger numbers are gradually increasing,
expanding belly capacity for air freight. Going
forward, fewer pandemic-related restrictions,
organisational adjustments in ports and supply
chains, as well as a large projected increase in
new-built ships in 2023 (28) should further help
alleviating the capacity constraints. Some global
transport indicators, such as the Freightos Baltic
Index, have recently indicated a levelling out of
container shipping transport costs in September
and October. Prices are thus expected to ease into
2022. However, they are likely to remain higher
than their very low pre-pandemic levels, in view of
the ongoing consolidation of the shipping
market (29) and higher expected energy costs.
(27) https://www.freightos.com/freight-resources/transit-time-
calculator/#:~:text=Freight%20shipping%20transit%20time%20is%20impacted%20by%20factors,Shipping%20Trans
it%20Time%20%26%20Sea%20Freight%20Transit%20Ti
mes (28) https://www.bimco.org/news/market_analysis/2021/
20210826-container_ship_orders_due_for_delivery (29) https://www.ti-insight.com/briefs/consolidation-in-the-
container-shipping-market/
Semiconductors
The shift to remote working during the pandemic
increased the demand for electronic equipment
(work-related as well as for home appliances),
further pushing up the demand for semiconductors,
already growing strongly on the back of roll-out of
new technologies (e.g. 5G, Internet of Things). At
the same time, because of the faltering demand for
cars during the pandemic, the automotive
producers cut their semiconductor orders in 2020.
As producers of semiconductors redirected
production capacities to booming sectors, the
automotive sector was left with reduced access to
microprocessors when demand for cars picked up
at the end of 2020. (30) Semiconductor shortages
were also exacerbated by corporations building up
higher inventory levels (31) amid fears of increased
scarcity ahead.
Just like in the case of containers, the surge in
demand for semiconductors also came on top of an
(30) https://www.mckinsey.com/industries/automotive-and-
assembly/our-insights/coping-with-the-auto-
semiconductor-shortage-strategies-for-success (31) https://spectrum.ieee.org/chip-shortage
0
2,000
4,000
6,000
8,000
10,000
12,000
Sep-19 Mar-20 Sep-20 Mar-21 Sep-21
Graph I.4.2: Spot rates for container shipping
World Container Index Freightos Baltic Index
Sources: Bloomberg, Freightos.
USD per 40ft
container
-50
-25
0
25
50
75
100
-30
-20
-10
0
10
20
30
12 13 14 15 16 17 18 19 20 21
Graph I.4.3: Global semiconductor sales
Semiconductor sales globally (lhs)
North America semiconductor equipment sales (rhs)
Europe semiconductor sales (lhs)
Source: Macrobond.
y-o-y % change
3m moving
average
Note: Nominal values in USD
y-o-y % change
3m moving
average
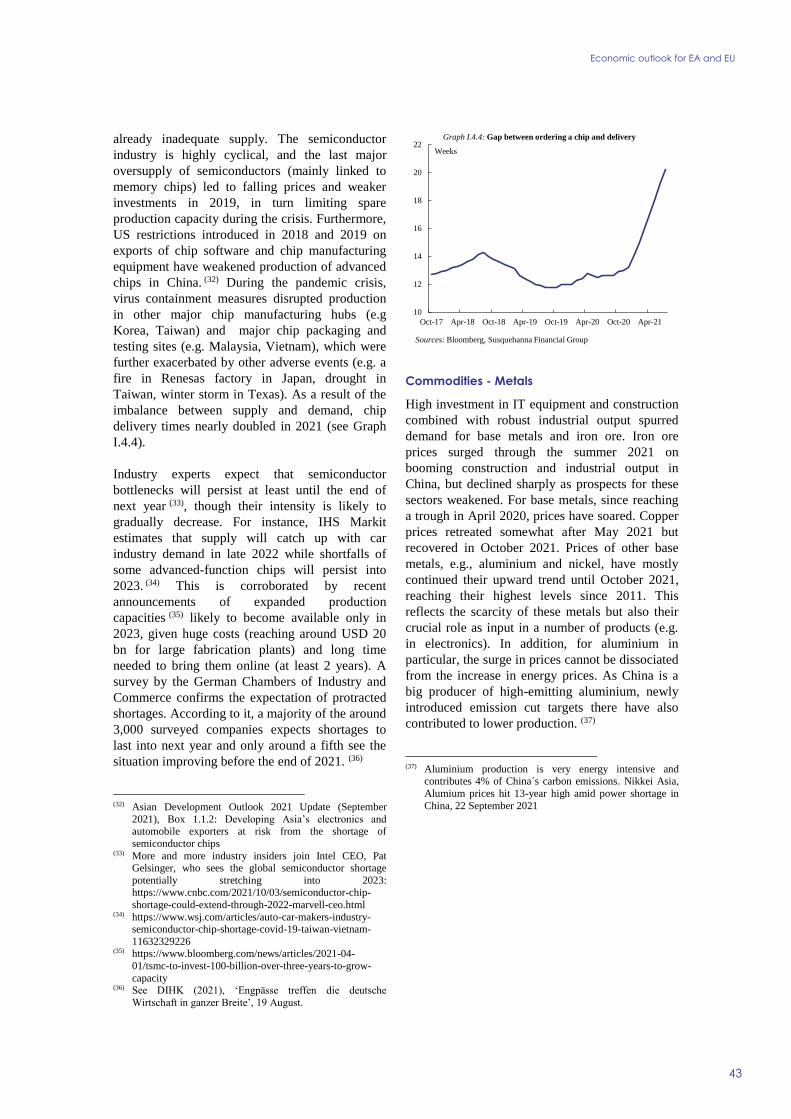
Economic outlook for EA and EU
43
already inadequate supply. The semiconductor
industry is highly cyclical, and the last major
oversupply of semiconductors (mainly linked to
memory chips) led to falling prices and weaker
investments in 2019, in turn limiting spare
production capacity during the crisis. Furthermore,
US restrictions introduced in 2018 and 2019 on
exports of chip software and chip manufacturing
equipment have weakened production of advanced
chips in China. (32) During the pandemic crisis,
virus containment measures disrupted production
in other major chip manufacturing hubs (e.g
Korea, Taiwan) and major chip packaging and
testing sites (e.g. Malaysia, Vietnam), which were
further exacerbated by other adverse events (e.g. a
fire in Renesas factory in Japan, drought in
Taiwan, winter storm in Texas). As a result of the
imbalance between supply and demand, chip
delivery times nearly doubled in 2021 (see Graph
I.4.4).
Industry experts expect that semiconductor
bottlenecks will persist at least until the end of
next year (33), though their intensity is likely to
gradually decrease. For instance, IHS Markit
estimates that supply will catch up with car
industry demand in late 2022 while shortfalls of
some advanced-function chips will persist into
2023. (34) This is corroborated by recent
announcements of expanded production
capacities (35) likely to become available only in
2023, given huge costs (reaching around USD 20
bn for large fabrication plants) and long time
needed to bring them online (at least 2 years). A
survey by the German Chambers of Industry and
Commerce confirms the expectation of protracted
shortages. According to it, a majority of the around
3,000 surveyed companies expects shortages to
last into next year and only around a fifth see the
situation improving before the end of 2021. (36)
(32) Asian Development Outlook 2021 Update (September
2021), Box 1.1.2: Developing Asia’s electronics and automobile exporters at risk from the shortage of
semiconductor chips (33) More and more industry insiders join Intel CEO, Pat
Gelsinger, who sees the global semiconductor shortage
potentially stretching into 2023: https://www.cnbc.com/2021/10/03/semiconductor-chip-
shortage-could-extend-through-2022-marvell-ceo.html (34) https://www.wsj.com/articles/auto-car-makers-industry-
semiconductor-chip-shortage-covid-19-taiwan-vietnam-
11632329226 (35) https://www.bloomberg.com/news/articles/2021-04-
01/tsmc-to-invest-100-billion-over-three-years-to-grow-
capacity (36) See DIHK (2021), ‘Engpässe treffen die deutsche
Wirtschaft in ganzer Breite’, 19 August.
Commodities - Metals
High investment in IT equipment and construction
combined with robust industrial output spurred
demand for base metals and iron ore. Iron ore
prices surged through the summer 2021 on
booming construction and industrial output in
China, but declined sharply as prospects for these
sectors weakened. For base metals, since reaching
a trough in April 2020, prices have soared. Copper
prices retreated somewhat after May 2021 but
recovered in October 2021. Prices of other base
metals, e.g., aluminium and nickel, have mostly
continued their upward trend until October 2021,
reaching their highest levels since 2011. This
reflects the scarcity of these metals but also their
crucial role as input in a number of products (e.g.
in electronics). In addition, for aluminium in
particular, the surge in prices cannot be dissociated
from the increase in energy prices. As China is a
big producer of high-emitting aluminium, newly
introduced emission cut targets there have also
contributed to lower production. (37)
(37) Aluminium production is very energy intensive and
contributes 4% of China´s carbon emissions. Nikkei Asia,
Alumium prices hit 13-year high amid power shortage in
China, 22 September 2021
10
12
14
16
18
20
22
Oct-17 Apr-18 Oct-18 Apr-19 Oct-19 Apr-20 Oct-20 Apr-21
Graph I.4.4: Gap between ordering a chip and delivery
Weeks
Sources: Bloomberg, Susquehanna Financial Group

European Economic Forecast, Autumn 2021
44
As China accounts for roughly half of global
demand for base metals, changes in Chinese
demand have a large impact on metal prices.
However, energy costs and the green transition add
to price pressures: high energy prices make the
production of, e.g. aluminium, more expensive;
caps on smelting capacity for environmental
reasons limit production of base metals; in some
cases, e.g. for nickel production in Brazil,
environmental regulations temporarily halted
mining.
Limited production capacity after years of under-
investment and strong demand are likely to keep
base metal prices relatively elevated in the near
term. Further ahead, the outlook is for a gradual
moderation. On the demand side, industrial
production and construction in China, both major
base metal consumers, are losing steam and are
thus expected to lower demand pressures.
Furthermore, easing of pandemic restrictions in
South-America, where important production sites
are located, is set to increase supply. Also, some
recent investments in South America should
additionally increase production. Therefore, supply
is likely to increase in the next few quarters. Over
the medium term, the energy transition will
continue to add to demand for metals like copper,
nickel and lithium, needed for electric vehicles.
The more electric vehicles replace conventional
cars, the more the demand for these metals is set to
rise, causing prices e.g. for copper likely to rise in
the medium-term.
Impact on the European economy
According to the EU Business and Consumer
Surveys (BCS), shortages of materials and/or
equipment rapidly grew in importance in the
course of 2021, replacing demand shortfall as the
most important factor limiting production in
industry (see Graph I.4.6) and coming second in
construction (behind labour shortage).
In terms of value added, severe shortages (38)
concerned in October 2021 roughly 43% (39) of the
EU manufacturing sector and 15% of the
construction sector, up from less than 1% in
October 2020 (Graph I.4.7). Shortages were
considerably less reported in services (40) with only
around 1% of EU-wide value added affected in
October, up from around 0.1% in October 2020.
(38) Severe shortages are defined as occurring in sectors where
the share of managers indicating that “shortage of material
and/or equipment” is a factor limiting production, exceeds
historical averages for that sector and country by at least two standard deviations. The approach is similar to that
taken by Kataryniuk I., A. del Rio and C. Santchez Carretero (2021). ‘Euro area manufacturing bottlenecks’
Quarterly report on the Spanish economy), but differs with
respect to certain parameters (number of standard deviations and country and sector specific reference
historical averages) (39) The sum of value added of sectors severely affected by
shortages across 27 Member States (total value added x
share of respondents pointing to the shortage as a factor
limiting production) (40) For services the question refers to space and/or equipment
and not material
40
60
80
100
120
140
160
180
200
220
240
Jan-18 Jul-18 Jan-19 Jul-19 Jan-20 Jul-20 Jan-21 Jul-21
Graph I.4.5: Metal prices
Copper Aluminum Nickel Lithium Zinc
Sources: LME, Nyse Arca and China Iron and Steel Association.
Index,
1 Jan 2018=100
0
10
20
30
40
50
60
70
95 97 99 01 03 05 07 09 11 13 15 17 19 21
Graph I.4.6: Factors limiting production in EU industry
Demand
Labour
Shortage of material and/or equipment
share
of managers
pointing the factor
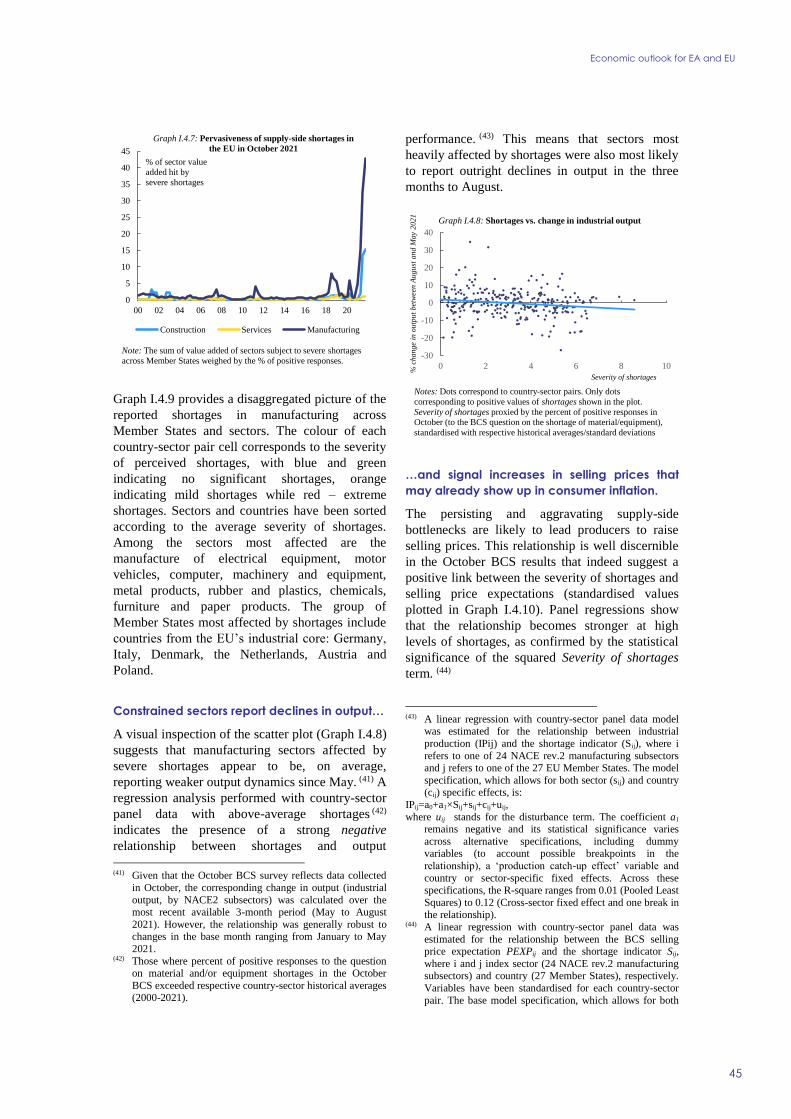
Economic outlook for EA and EU
45
Graph I.4.9 provides a disaggregated picture of the
reported shortages in manufacturing across
Member States and sectors. The colour of each
country-sector pair cell corresponds to the severity
of perceived shortages, with blue and green
indicating no significant shortages, orange
indicating mild shortages while red – extreme
shortages. Sectors and countries have been sorted
according to the average severity of shortages.
Among the sectors most affected are the
manufacture of electrical equipment, motor
vehicles, computer, machinery and equipment,
metal products, rubber and plastics, chemicals,
furniture and paper products. The group of
Member States most affected by shortages include
countries from the EU’s industrial core: Germany,
Italy, Denmark, the Netherlands, Austria and
Poland.
Constrained sectors report declines in output…
A visual inspection of the scatter plot (Graph I.4.8)
suggests that manufacturing sectors affected by
severe shortages appear to be, on average,
reporting weaker output dynamics since May. (41) A
regression analysis performed with country-sector
panel data with above-average shortages (42)
indicates the presence of a strong negative
relationship between shortages and output
(41) Given that the October BCS survey reflects data collected
in October, the corresponding change in output (industrial
output, by NACE2 subsectors) was calculated over the most recent available 3-month period (May to August
2021). However, the relationship was generally robust to changes in the base month ranging from January to May
2021. (42) Those where percent of positive responses to the question
on material and/or equipment shortages in the October
BCS exceeded respective country-sector historical averages (2000-2021).
performance. (43) This means that sectors most
heavily affected by shortages were also most likely
to report outright declines in output in the three
months to August.
…and signal increases in selling prices that
may already show up in consumer inflation.
The persisting and aggravating supply-side
bottlenecks are likely to lead producers to raise
selling prices. This relationship is well discernible
in the October BCS results that indeed suggest a
positive link between the severity of shortages and
selling price expectations (standardised values
plotted in Graph I.4.10). Panel regressions show
that the relationship becomes stronger at high
levels of shortages, as confirmed by the statistical
significance of the squared Severity of shortages
term. (44)
(43) A linear regression with country-sector panel data model
was estimated for the relationship between industrial
production (IPij) and the shortage indicator (Sij), where i
refers to one of 24 NACE rev.2 manufacturing subsectors and j refers to one of the 27 EU Member States. The model
specification, which allows for both sector (sij) and country (cij) specific effects, is:
IPij=a0+a1×Sij+sij+cij+uij,
where uij stands for the disturbance term. The coefficient a1 remains negative and its statistical significance varies
across alternative specifications, including dummy variables (to account possible breakpoints in the
relationship), a ‘production catch-up effect’ variable and
country or sector-specific fixed effects. Across these specifications, the R-square ranges from 0.01 (Pooled Least
Squares) to 0.12 (Cross-sector fixed effect and one break in the relationship).
(44) A linear regression with country-sector panel data was
estimated for the relationship between the BCS selling price expectation PEXPij and the shortage indicator Sij,
where i and j index sector (24 NACE rev.2 manufacturing subsectors) and country (27 Member States), respectively.
Variables have been standardised for each country-sector
pair. The base model specification, which allows for both
0
5
10
15
20
25
30
35
40
45
00 02 04 06 08 10 12 14 16 18 20
Graph I.4.7: Pervasiveness of supply-side shortages in
the EU in October 2021
Construction Services Manufacturing
Note: The sum of value added of sectors subject to severe shortages
across Member States weighed by the % of positive responses.
% of sector value
added hit by
severe shortages
-30
-20
-10
0
10
20
30
40
0 2 4 6 8 10
% c
ha
ng
e in
ou
tpu
t b
etw
een
Au
gu
st a
nd
Ma
y2
02
1
Graph I.4.8: Shortages vs. change in industrial output
Severity of shortages
Notes: Dots correspond to country-sector pairs. Only dots
corresponding to positive values of shortages shown in the plot.
Severity of shortages proxied by the percent of positive responses in October (to the BCS question on the shortage of material/equipment),
standardised with respective historical averages/standard deviations
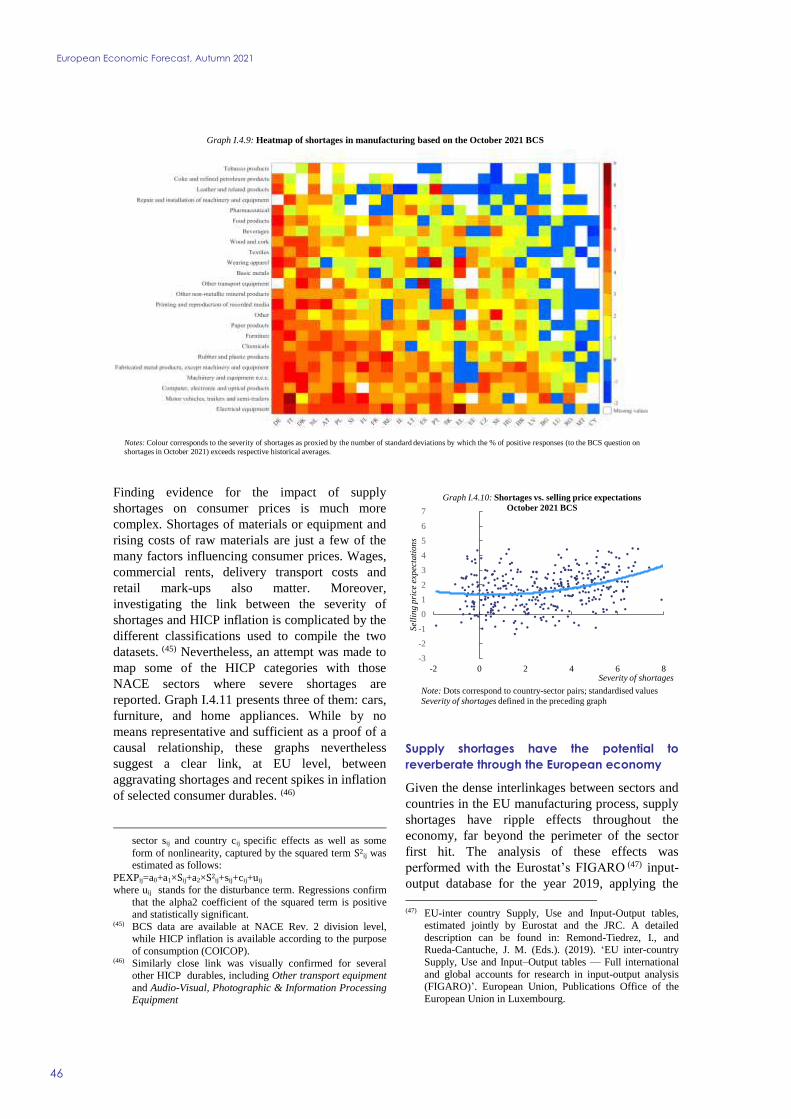
European Economic Forecast, Autumn 2021
46
Finding evidence for the impact of supply
shortages on consumer prices is much more
complex. Shortages of materials or equipment and
rising costs of raw materials are just a few of the
many factors influencing consumer prices. Wages,
commercial rents, delivery transport costs and
retail mark-ups also matter. Moreover,
investigating the link between the severity of
shortages and HICP inflation is complicated by the
different classifications used to compile the two
datasets. (45) Nevertheless, an attempt was made to
map some of the HICP categories with those
NACE sectors where severe shortages are
reported. Graph I.4.11 presents three of them: cars,
furniture, and home appliances. While by no
means representative and sufficient as a proof of a
causal relationship, these graphs nevertheless
suggest a clear link, at EU level, between
aggravating shortages and recent spikes in inflation
of selected consumer durables. (46)
sector sij and country cij specific effects as well as some
form of nonlinearity, captured by the squared term S2ij was estimated as follows:
PEXPij=a0+a1×Sij+a2×S2ij+sij+cij+uij
where uij stands for the disturbance term. Regressions confirm
that the alpha2 coefficient of the squared term is positive and statistically significant.
(45) BCS data are available at NACE Rev. 2 division level, while HICP inflation is available according to the purpose
of consumption (COICOP). (46) Similarly close link was visually confirmed for several
other HICP durables, including Other transport equipment
and Audio-Visual, Photographic & Information Processing Equipment
Supply shortages have the potential to
reverberate through the European economy
Given the dense interlinkages between sectors and
countries in the EU manufacturing process, supply
shortages have ripple effects throughout the
economy, far beyond the perimeter of the sector
first hit. The analysis of these effects was
performed with the Eurostat’s FIGARO (47) input-
output database for the year 2019, applying the
(47) EU-inter country Supply, Use and Input-Output tables,
estimated jointly by Eurostat and the JRC. A detailed
description can be found in: Remond-Tiedrez, I., and Rueda-Cantuche, J. M. (Eds.). (2019). ‘EU inter-country
Supply, Use and Input–Output tables — Full international
and global accounts for research in input-output analysis (FIGARO)’. European Union, Publications Office of the
European Union in Luxembourg.
-3
-2
-1
0
1
2
3
4
5
6
7
-2 0 2 4 6 8
Sel
lin
g p
rice
exp
ecta
tion
s
Severity of shortages
Graph I.4.10: Shortages vs. selling price expectations
October 2021 BCS
Note: Dots correspond to country-sector pairs; standardised values
Severity of shortages defined in the preceding graph
0
0.2
0.4
0.6
0.8
1
1.2
Graph I.4.9: Heatmap of shortages in manufacturing based on the October 2021 BCS
Notes: Colour corresponds to the severity of shortages as proxied by the number of standard deviations by which the % of positive responses (to the BCS question on
shortages in October 2021) exceeds respective historical averages.

Economic outlook for EA and EU
47
partial hypothetical extraction method. (48) This
method allows for the estimation of spillovers
across sectors and countries following a supply
shortage. For illustration purposes, a supply
shortage shock modelled as a 10% fall of
intermediate inputs (either domestically produced
or imported) was applied to 10 sectors previously
identified as most affected by shortages. (49)
The simulations show that this shock entails a
decline in EU value added of 1.5%, with a highly
differentiated impact across Member States.
Countries reporting the highest loss in value added,
exceeding 2%, include Slovakia, Czechia,
Slovenia, Poland and Germany. Importantly, cross-
border spillover effects explain broadly one-fifth
of the value added loss, highlighting the
importance of intra-EU linkages in magnifying the
shock.
Graph I.4.12 offers additional insights into sectoral
composition of the spillovers effects. The shock to
intermediate consumption in the 10 affected
sectors would lead to a loss of value added of 7.5%
in the manufacture of basic metals, mainly due to
lower orders placed in the sector of metal products,
machinery and equipment and motor vehicles.
Similar effects can be observed in the sector of
fabricated metal products, which suffers an
estimated loss of 6.3%. Importantly, value added
losses in the affected sectors come largely from
order cuts outside of their own sectors. The
exception is the manufacture of motor vehicles,
(48) The hypothetical extraction method (HEM), widely used to
measure inter-industry interconnectedness, consists of
estimating the impact of a hypothetical (full or partial) loss of interlinkages of a particular sector (or a set of industries)
with the remaining sectors of the economy. Dietzenbacher,
E., van Burken, B. and Y. Kondo (2019). ‘Hypothetical extractions from a global perspective’. Economic Systems
Research, 31(4), 505-519 (49) Wood, Chemicals, Rubber and plastic, Non-metallic
mineral, Metal Products, Computer, Electrical equipment,
Machinery, Motor vehicles and Furniture.
which contributes significantly to losses in other
sectors, but reports a loss of 3.4% mainly due to
cuts within its own sector. (50)
(50) This sector also includes for motor vehicles the
manufacture of bodies (coachwork); parts and accessories;
electrical and electronic equipment; and other parts and accessories not elsewhere included.
-2
-1
0
1
2
3
4
5
6
7
-2
-1
0
1
2
3
4
5
6
7
11 12 13 14 15 16 17 18 19 20 21
Graph I.4.11: Severity of shortages vs. annual HICP inflation
Severity of shortages (lhs) HICP y-o-y% change (rhs)
Cars
-0.5
0.0
0.5
1.0
1.5
2.0
2.5
3.0
3.5
4.0
4.5
-1
0
1
2
3
4
5
6
7
11 12 13 14 15 16 17 18 19 20 21
Furniture
-2.0
-1.5
-1.0
-0.5
0.0
0.5
1.0
1.5
-2
-1
0
1
2
3
4
5
6
11 12 13 14 15 16 17 18 19 20 21
Household appliances

European Economic Forecast, Autumn 2021
48
Graph I.4.12: Simulated reduction in value added due to a 10% fall in intermediate consumption of sectors most
severely affected by shortages
WoodChemicals Rubber and
plastic
Non-metallic mineral
Metal products
ComputerElectrical equipment
Machinery and
equipment
Motor vehicles
Furniture
Manufacture of basic metals
7.5%
Wood Chemicals Rubber and plastic
Non-metallic mineral
Metal products
Computer
Electrical equipment
Machinery and
equipment
Motor vehicles
Furniture
Metal products
6.3%
Wood Chemicals
Rubber and plastic
Non-metallic mineral
Metal products
ComputerElectrical equipment
Machinery and
equipment
Motor vehicles
Furniture
Rubber and platic products
5.3%
Wood
Chemicals
Rubber and plastic
Non-metallic mineral
Metal products
Computer
Electrical equipment
Machinery and
equipment
Motor vehicles
Furniture
Wood
5.1%
Wood
Chemicals
Rubber and plastic
Non-metallic mineral
Metal products
Computer
Electrical equipment
Machinery and
equipment
Motor vehicles
Furniture
Chemical products
4.5%
Wood
ChemicalsRubber and
plasticNon-metallic
mineralMetal
products
Computer
Electrical equipment
Machinery and
equipment
Motor vehicles
Furniture
Motor vehicles
3.4%
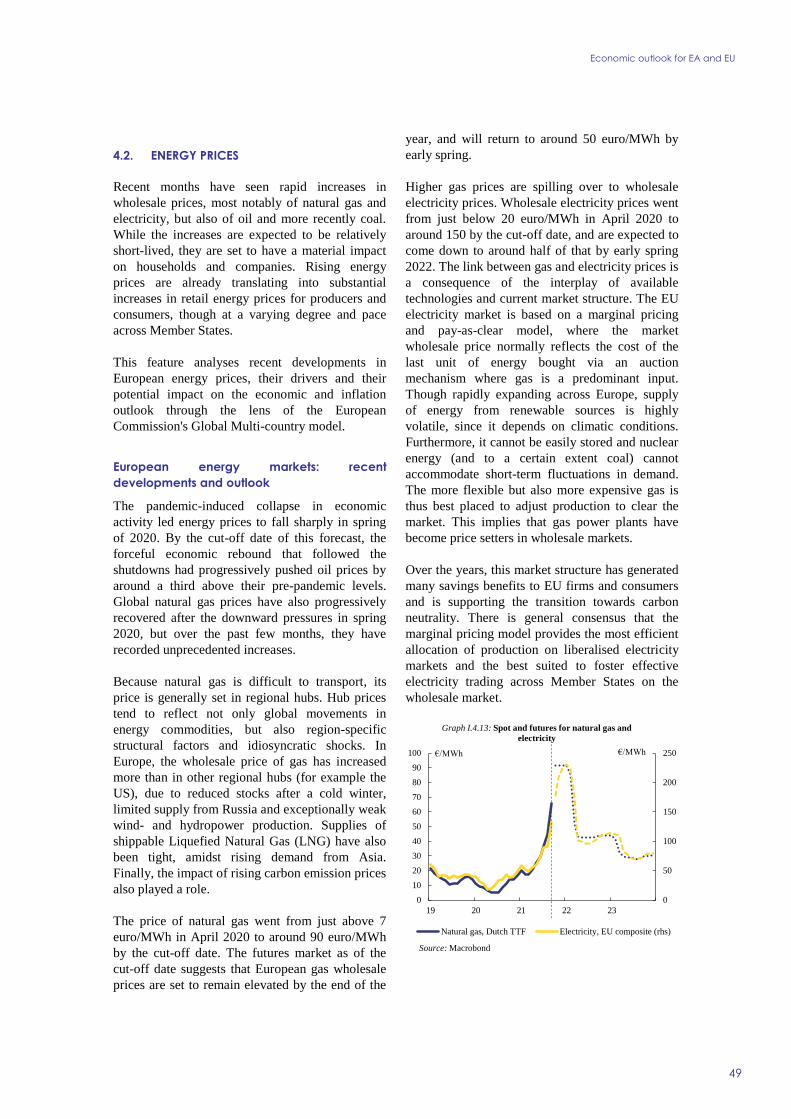
Economic outlook for EA and EU
49
4.2. ENERGY PRICES
Recent months have seen rapid increases in
wholesale prices, most notably of natural gas and
electricity, but also of oil and more recently coal.
While the increases are expected to be relatively
short-lived, they are set to have a material impact
on households and companies. Rising energy
prices are already translating into substantial
increases in retail energy prices for producers and
consumers, though at a varying degree and pace
across Member States.
This feature analyses recent developments in
European energy prices, their drivers and their
potential impact on the economic and inflation
outlook through the lens of the European
Commission's Global Multi-country model.
European energy markets: recent
developments and outlook
The pandemic-induced collapse in economic
activity led energy prices to fall sharply in spring
of 2020. By the cut-off date of this forecast, the
forceful economic rebound that followed the
shutdowns had progressively pushed oil prices by
around a third above their pre-pandemic levels.
Global natural gas prices have also progressively
recovered after the downward pressures in spring
2020, but over the past few months, they have
recorded unprecedented increases.
Because natural gas is difficult to transport, its
price is generally set in regional hubs. Hub prices
tend to reflect not only global movements in
energy commodities, but also region-specific
structural factors and idiosyncratic shocks. In
Europe, the wholesale price of gas has increased
more than in other regional hubs (for example the
US), due to reduced stocks after a cold winter,
limited supply from Russia and exceptionally weak
wind- and hydropower production. Supplies of
shippable Liquefied Natural Gas (LNG) have also
been tight, amidst rising demand from Asia.
Finally, the impact of rising carbon emission prices
also played a role.
The price of natural gas went from just above 7
euro/MWh in April 2020 to around 90 euro/MWh
by the cut-off date. The futures market as of the
cut-off date suggests that European gas wholesale
prices are set to remain elevated by the end of the
year, and will return to around 50 euro/MWh by
early spring.
Higher gas prices are spilling over to wholesale
electricity prices. Wholesale electricity prices went
from just below 20 euro/MWh in April 2020 to
around 150 by the cut-off date, and are expected to
come down to around half of that by early spring
2022. The link between gas and electricity prices is
a consequence of the interplay of available
technologies and current market structure. The EU
electricity market is based on a marginal pricing
and pay-as-clear model, where the market
wholesale price normally reflects the cost of the
last unit of energy bought via an auction
mechanism where gas is a predominant input.
Though rapidly expanding across Europe, supply
of energy from renewable sources is highly
volatile, since it depends on climatic conditions.
Furthermore, it cannot be easily stored and nuclear
energy (and to a certain extent coal) cannot
accommodate short-term fluctuations in demand.
The more flexible but also more expensive gas is
thus best placed to adjust production to clear the
market. This implies that gas power plants have
become price setters in wholesale markets.
Over the years, this market structure has generated
many savings benefits to EU firms and consumers
and is supporting the transition towards carbon
neutrality. There is general consensus that the
marginal pricing model provides the most efficient
allocation of production on liberalised electricity
markets and the best suited to foster effective
electricity trading across Member States on the
wholesale market.
0
50
100
150
200
250
0
10
20
30
40
50
60
70
80
90
100
19 20 21 22 23
Graph I.4.13: Spot and futures for natural gas and
electricity
Natural gas, Dutch TTF Electricity, EU composite (rhs)
€/MWh €/MWh
Source: Macrobond

European Economic Forecast, Autumn 2021
50
A model-based assessment of the recent
increases in prices of energy commodities
Futures markets expect oil prices to peak in the
first quarter of 2022, and to gradually decline
thereafter before stabilising in 2023. On average,
oil prices are expected to increase from 71.6
USD/bbl in 2021 to 78.9 USD/bbl in 2022, and
decline to 72.3 USD/bbl in 2023. Gas prices in
Europe are expected to remain at high levels until
spring 2022, before partially reverting towards pre-
pandemic levels. As expected, electricity
wholesale prices are projected to follow the same
dynamics (see Graph I.4.13).
Whereas the increase in energy commodity prices
is expected to be temporary, it is set to have a
material impact on output and prices. The impact
on the euro area is assessed using the European
Commission's Global Multi-country model. (51)
The analysis proceeds in two steps. First, a
composite energy price index is constructed for
current and expected prices, based on information
from spot and futures markets for a broad range of
energy commodities (oil, coal, gas and electricity).
To provide a baseline against which the impact is
compared, the same index is constructed for the
market prices in 2021-22 expected at the time of
the Spring 2021 forecast. The difference between
both indices corresponds to the simulated price
shock. Overall, in the model, the shock’s
magnitude implies an increase in import prices of
energy commodities of 33% in 2021 and 18% in
2022, compared to the Spring forecast.
In the second step, the new price path is fed into
the model as an exogenous adverse supply shock.
In explaining the model’s transmission
mechanism, it is important to keep in mind the
following features. Because of adjustment frictions
(51) The European Commission's Global Multi-country model
(GM) is an estimated structural model jointly developed by DG ECFIN and the JRC. A detailed description of the
GM model can be found in: Albonico, A., L. Calès,
R. Cardani, O. Croitorov, F. Di Dio, F. Ferroni, M. Giovannini, S. Hohberger, B. Pataracchia, F.
Pericoli, P. Pfeiffer, R. Raciborski, M. Ratto, W. Roeger
and L. Vogel (2019). ‘The Global Multi-Country Model
(GM): an Estimated DSGE Model for the Euro Area
Countries’. ECFIN Discussion Paper No. 102. European Commission. For a GM-based analysis of commodity
prices and global macroeconomic conditions, see also M. Giovannini., S. Hohberger, R. Kollmann, M. Ratto, W.
Roeger and L. Vogel (2019). ‘U.S. and Euro Area External
Adjustment: The Role of Commodity Prices and Emerging Market Shocks.’ Journal of International Money and
Finance, vol.94, pp.183-205.
and the limited substitutability of energy
commodities as intermediate inputs, the model
predicts demand for energy commodities to adjust
sluggishly. Rising energy costs would thus lead to
rising production costs, which are directly and
indirectly passed on to final consumers via
increased retail prices, though only partly. Lower
expected profits reduce business investment, while
higher inflation weighs on the disposable income
of households, dampening consumption demand.
Importantly, the modelling approach assumes that
monetary policy will keep nominal interest rates
constant in response to the shock. (52) This
assumption differs from the ‘standard’ approaches
in which (sustained) higher inflation triggers an
endogenous monetary tightening. (53) In particular,
higher inflation weighs on the real disposable
income of households, which dampens
consumption demand, while lower expected profits
reduce business investment.
Table I.4.1 shows that rising commodity prices are
likely to drag GDP growth and increase consumer
prices significantly compared to what was
expected in Spring 2021. (54) Rising energy prices
alone imply that 2021 consumer price inflation in
the euro area could be around 0.9 pps. higher than
expected in Spring. The impact in 2022 is slightly
larger (1ppt.) in light of the persistent energy price
inflation and the adjustment frictions described
above. Furthermore, the simulated energy price
shock reduces real GDP growth by around 0.3 pps
and 0.5 pps. in 2021 and 2022, respectively,
compared to the Spring forecast baseline. This
cumulates to a real GDP loss in the euro area of
0.8 pps. over 2021-22. The trade balance of the
euro area deteriorates by 0.4 pps. in 2021 and 0.5
pps. in 2022 compared to the Spring 2021 forecast
in light of the higher commodity import bill.
(52) Put differently, the negative supply shock and the
associated inflation pressure are not big enough to move target interest rates away from the effective lower bound.
(53) On the macroeconomic transmission of commodity price
shocks at the effective lower bound, see also Bodenstein, M., Guerrieri, L. and Gust, C.., 2013. ‘Oil shocks and the
zero bound on nominal interest rates,’ Journal of International Money and Finance, vol. 32(C), 941-967.
(54) All variables are expressed in deviation from the Spring
forecast 2021.

Economic outlook for EA and EU
51
As explained above, an important caveat in these
simulations is that the increase in the prices of
energy commodities is assumed to be fully
exogenous. If energy prices had instead been
modelled as a consequence of stronger global
demand, this would have partially offset the
reduction in euro area output growth through
higher export demand. (55)
Furthermore, the model does not take into account
government measures intervened to shelter
households and producers from the unexpected
surge in energy prices.
(55) See also Kilian, L. 2009. ‘Not All Oil Price Shocks Are
Alike: Disentangling Demand and Supply Shocks in the Crude Oil Market.’ American Economic Review, 99 (3):
1053-69.
2021 2022
Commodity price inflation (annual) 32.5 18.3
Commodity imports (volume) -5.8 -10.9
Trade-balance-to-GDP ratio -0.4 -0.5
Real investment growth -1.9 -3.4
Real consumption growth -0.3 -0.4
HICP inflation (annual) 0.9 1.0
Real GDP growth -0.3 -0.5
Results from model simulation: deviations from Spring
forecast 2021, euro area
Notes: Results are expressed as percentage points; except commodity imports,
which are expressed in percentage deviation from the Spring 2021 forecast.
Table I.4.1:

European Economic Forecast, Autumn 2021
52
4.3. LABOUR MARKET: SLACK OR TIGHT?
Although labour markets have not yet fully
recovered, reports of labour shortages are starting
to emerge. In the second quarter of this year, total
employment in the EU remained about 2 million
persons, or 1%, below its pre-crisis level. At the
same time, fresher data on job vacancy rates in the
EU reached and increased above pre-pandemic
levels in some countries. As labour demand is
expected to continue growing in line with
economic activity, signs of tightening so early in
the recovery could weigh on the current
expansionary cycle.
This Special Issue looks at the available evidence
to assess the amount of slack in the labour market,
and its potential implications for growth and
inflation.
Labour market slack remained above pre-
pandemic levels…
While hours worked contracted to a similar extent
as value added during the crisis, the impact on
headcount employment, though significant, was
mild in comparison, partly due to the widespread
use of job retention schemes that kept many
employees attached to their jobs. As a result, the
increase in unemployment remained significantly
below what could be expected based on the
historical relationship between GDP and
unemployment (‘Okun’s law’). (56) At the same
time, there was a significant increase in the
number of people available to work but not
seeking a job. (57) This can also partly explain why
activity rates dropped, in contrast with the
aftermath of the 2008 financial crisis. Eurostat’s
labour market slack indicator stood at 14.5% of the
extended labour force in the EU in the second
quarter of this year, down from its peak at around
16% in the previous quarter, but still above the
pre-pandemic level of about 13% (see Graph
I.4.14). (58)
(56) European Commission (2020): Labour market and wage
developments in Europe: Annual Review 2020. DG Employment, Social Affairs, and Inclusion. Available
online at
https://ec.europa.eu/social/main.jsp?langId=en&catId=791&furtherNews=yes&newsId=9873
(57) These people count as inactive according to the ILO definition.
(58) Eurostat’s labour market slack indicator allows provides a
broader definition of labour underutilisation than the
In particular, the number of persons available to
work but not seeking and unemployed remained
relatively high. Developments in both groups have
broadly followed the evolution of the pandemic:
both saw an uptick in in the first quarter of this
year after improvements at the end of 2020. (59) In
the second quarter, a large number of persons that
were available to work but not seeking in the first
quarter returned to the labour force reducing the
slack by 0.6 pps.. The decrease in the
unemployment rate detracted another -0.2 pps.
from the slack rate. Many workers who became
jobless during the pandemic returned to work as
the health situation improved. In particular, about
10.5 million people returned to the labour force
from inactivity, 6 million of them as employed. On
the other hand, nearly 9 million people left the
labour force, more than 5 million were previously
employed.
Monthly unemployment figures show that the
improvements of the labour market continued in
the third quarter. In particular, the unemployment
rate, at 6.8% in the EU in August, decreased by 0.5
pps. as compared to the second quarter average
and was only marginally above its pre-pandemic
level.
unemployment rate. Besides the unemployed, it also
includes the underemployed (persons in part-time jobs that
would like to work more hours) and two categories of
inactive individuals: those that are available for work but
not seeking a job and those seeking a job but not available to work. The size of these groups is expressed as a
percentage of the “extended labour force”, which comprises the unemployed, the employed and the two
categories of inactive individuals referred to above. (59) A methodological change in labour market statistics is
likely to have contributed to the uptick in the first quarter
as some workers absent from their jobs for some time were counted as non-employed.
0
2
4
6
8
10
12
14
16
18
20
09
-Q1
10
-Q1
11
-Q1
12
-Q1
13
-Q1
14
-Q1
15
-Q1
16
-Q1
17
-Q1
18
-Q1
19
-Q1
20
-Q1
21
-Q1
Graph I.4.14: Labour market slack, EU
Available, not seeking Seeking, not available
Underemployed Unemployed
Total slack
%
Note: Seasonally adjusted data, reflects age group 15-74, and are
expressed as % of the extended labour force.

Economic outlook for EA and EU
53
… amid rising labour demand, but no
evidence of a deterioration of labour market
matching…
The Beveridge curve, a negative empirical relation
between vacancy and unemployment rates,
provides an indication of the efficiency of
matching of labour supply and demand. (60)
Negative shocks to labour demand lead to a
reduction in the number of vacancies and a higher
unemployment rate. However, while vacancies
generally react fast, it takes longer for
unemployment to adjust. This is particularly
evident during the COVID-19 recession (see
Graph I.4.15). (61)
In the aftermath of the 2008 financial crisis, the
Beveridge curve showed a clear ‘outward shift’,
highlighting increased mismatch between supply
and demand. Such pattern is not seen this time, as
latest observations are still below the Beveridge
curve observed between 2013 and 2018 (see Graph
I.4.15). In the second quarter of 2021, vacancy
rates, as well as indicators of labour shortages (at
least in industry), were close to their pre-pandemic
levels, but still below the peaks observed at similar
levels of unemployment in 2018. Thus, there is not
yet evidence that the efficiency of labour market
matching has deteriorated as compared to the
previous business cycle.
(60) An upward shift in the Beveridge curve suggests a
worsening of job matching efficiency. (61) Vacancies in Graph I.4.2 are approximated by the share of
managers reporting labour shortages as a factor limiting production in the manufacturing sector from the EU
Business and Consumer Survey (see note to Graph I.4.2).
…or wage pressures so far.
Furthermore, the index of negotiated wages does
not indicate mounting pressures in the labour
market. Data on negotiated wages (62) provide more
accurate information on underlying wage
developments during the pandemic. In contrast to
other indicators, it is not biased by developments
in hours worked and policy measures. (63) In the
second quarter of this year, negotiated wages in the
euro area grew at a rate below 2%, more
moderately than in the period before the
COVID-19 recession, at comparable rates of
unemployment. The fact that there were no
apparent wage pressures in the data by 2021-Q2
can be explained by the fact that wage setting
tends to react with a lag to changing labour market
conditions due to the staggered nature of wage
contracts. In addition, the pandemic crisis may also
have led to a reduction in the number of wage
agreements being concluded, which may have kept
some contractual wages unchanged.
Labour market conditions vary greatly across
countries
With labour market slack ranging from under 5%
of the extended labour force in the Czech Republic
to over 25% in Spain in the second quarter, labour
market conditions vary greatly across EU
countries. Unemployment was higher than before
the pandemic in most of the countries (see Graph
I.4.16). However, vacancy rates returned to or
surpassed pre-pandemic levels in a majority of
countries. In particular, they were at pre-pandemic
levels in four countries with increased
unemployment in 2021-Q2 (ES, IE, HR, PT) while
in ten countries both unemployment and vacancy
rates in 2021-Q2 were higher than before the
pandemic (AT, BE, CY, FI, IT, LT, NL, PL, SI,
SE).
(62) SDW, European Central Bank (63) The index of negotiated wages has also some caveats,
including methodology harmonisation and coverage across
countries.
00-Q12006-Q1
08-Q4
10-Q4 12-Q4
14-Q4
16-Q4
18-Q4
20-Q1 21-Q2
0
2
4
6
8
10
12
14
16
18
20
6 7 8 9 10 11 12
Vac
ancy
rat
e
Unemployment rate
Graph I.4.15: Beveridge curve, EU
2000-Q1 to 2007-Q4
2008-Q1 to 2019-Q4
2020-Q1 to 2021-Q2
Note: To cover a long period, the share of manufacturing firms indicating
labour as a factor limiting production proxied the vacancy rate.
%
%

European Economic Forecast, Autumn 2021
54
There is also a negative relationship between
unemployment (slack) and vacancy rates (see
Graph I.4.17). Based on these indicators, labour
markets in countries such as Czechia and the
Netherlands appear tight (with low unemployment
and a high vacancy rate), (64) while labour markets
in countries such as Greece and Spain seem slack
(with high unemployment and a low vacancy rate).
(64) Labour market slack appears somewhat larger in the
Netherlands on account of the comparatively large share of
“underemployed”, part-time workers who would like to
work more hours.
COVID-19 has had differentiated impact on
employment across sectors
The COVID-19 crisis has had diverse impacts
across sectors. By the second quarter of 2021,
employment had recovered in the IT sector, the
public sector, finance and real estate, and for
construction and professional and business
services. It remained subdued in trade and tourism
(NACE sectors G-I, -4%) and arts and
entertainment and other service activities (NACE
sectors R-U, -3%), and it is also somewhat below
pre-pandemic levels in industry (see Graph I.4.16).
Sectoral developments show clear heterogeneity
across countries. Industrial employment has
returned to previous levels (or remained stable) in
more than half of the Member States. At the same
time, in some countries, both industrial production
and employment remain below pre-pandemic
levels (BG, CZ, DE, ES, FR, RO). In contrast to
industry, there are only a few Member States in
AT
BE
BG
CY
CZ
DEEEEL
ESF HR
HU IE
ITLT
LU
LV
MT
NL
PLPT
RO
SE
SI
SK
-1.5
-1.0
-0.5
0.0
0.5
1.0
-1 0 1 2 3
Ch
an
ge i
n j
ob
va
ca
ncy
ra
te, (p
ps)
Change in unemployment rate, age group 15-74, (pps.)
Graph I.4.17: Vacancies and unemployment, change
between 2019-Q4 and 2021-Q2
Notes: Vacancy rates cover sectors NACE B-S. Seasonally adjusted data.
No data are for FR, DK. For IE, the vacancy rate for 21-Q1 was used.
AT
BE
BG
CY
CZ
DE
EE
ELES
FI
HR
HU
IE
ITLTLU
LV
MT
NL
PLPT
RO
SESI
SK
0
1
2
3
4
5
0 4 8 12 16 20
Jo
b v
aca
ncy
ra
te
Unemployment rate, age group 15-74
Graph I.4.18: Vacancies and unemployment rate,
2021-Q2
Note: Vacancy rates cover sectors NACE B-S. Seasonally adjusted
data. No vacancy data are avaialble for FR and DK.
%
%
Graph I.4.16: Employment and gross value added evolution
Total
Notes: Index, 2019-Q4=100

Economic outlook for EA and EU
55
which output or employment have fully recovered
in trade and hospitality. Output in trade, transport,
food and accommodation services remains below
pre-pandemic levels in almost all Member States.
A full recovery in services employment can be
observed only in a few Member States (including
Lithuania, Romania and Slovakia).
Indicators of labour market shortages also vary
considerably across sectors
Reported labour shortages in the Commission
surveys also reveal pronounced sectoral
differences. Labour market shortages reported by
employers have increased in particular in industry
in recent months, and are in the EU average above
the pre-pandemic level, while this is not the case in
services (see Graphs I.4.19, I.4.20 and I.4.21).
After an initial drop in the first half of 2020,
reported shortages started to rise again in 2020-Q4
and have shown dynamic increases in almost all
countries in the third quarter of 2021 after more
modest increases in the previous quarter. (65) In
industry, the proportion of firms reporting that
labour is a factor constraining their production was
higher in 2021-Q3 than before the pandemic in
about half of the Member States as well as in the
EU average. At the same time, reported shortages
in industry were below their pre-pandemic level in
some Central and Eastern European Member
States (including BG, CZ, HR, HU, PL), most of
which had a high level of reported shortages pre-
pandemic. By contrast, reported labour shortages
in services in the third quarter 2021 were below
pre-pandemic levels in most countries as well as
the EU average. Higher labour shortages were
recorded in Belgium, Denmark, Ireland and Malta.
Finally, in construction, labour shortages have by
now returned to their pre-pandemic level in the EU
and the euro area.
(65) As reported shortages are a survey-based indicator, it is
available earlier than labour market statistics.
Sectoral mismatches could be on the rise
By the second quarter of 2021, long-term
unemployment significantly increased among
people previously working in sectors most affected
by containment measures. Some of the workers
laid off in hospitality and other affected activities
may return to employment as their sectors reopen.
Other sectors such as corporate travel may not
0
10
20
30
40
50
60
CY
EL IT ES
PT
FR
RO FI
BE
AT
SE
LU
HR
LV
SK
LT
NL
CZ
DE
EE
BG
DK PL SI
HU IE
MT
EA
19
EU
27
Graph I.4.19: Labour shortages in industry
21-Q3 19-Q3
%
Notes: The data show the proportion of firms reporting that labour is a
factor limiting their production.
0
10
20
30
40
50
60
CY ES
PT
RO IT EL
HR
FR
LV
BG
LT
CZ
NL
HU PL
SK
AT
DK SE
DE SI
BE
EE IE FI
MT
EA
19
EU
27
Graph I.4.20: Labour shortages in services
21-Q3 19-Q3
Notes: The data show the proportion of firms reporting that labour is a
factor limiting their production.
%
-10
0
10
20
30
40
50
60
70
CY
BE
EL
ES IT RO SE
PT
EE
LV
NL
SK FI
DE
LT
AT SI
PL
FR
DK
BG
HR
CZ
MT
LU
HU IE
EA
19
EU
27
Graph I.4.21: Labour shortages in construction
Aug-21 Aug-19
%
Notes: The data show the proportion of firms reporting that labour is a
factor limiting their production.
European Economic Forecast, Autumn 2021
56
return to pre-crisis activity rates, but workers are
likely to find work in growing service sectors
demanding similar skills profiles. In a third group
of activities, for instance in manufacturing, the
pandemic may have reinforced and accelerated
structural shifts away from routine-intensive jobs.
While employment losses in manufacturing were
much more muted in this crisis than after 2008,
some of the job losses in routine-intensive
occupations may prove persistent, based on the
experience of previous recessions.
Conclusions and outlook
There are a number of possible explanations for
the apparent coexistence of labour market slack
and growing labour shortages.
First, vacancy rates typically respond faster
than unemployment rates over the business
cycle, as filling open positions takes time.
Second, while containment measures and
policy support have helped to weather the
health and economic crisis, they may have also
temporarily reduced the incentives to search for
a job, resulting in higher vacancy rates.
Third, with restrictions easing and economic
activity strongly rebounding, labour demand is
swiftly growing while the labour force is less
reactive than usual. In particular, health risk
concerns may keep some people from returning
to work, while labour mobility, both within
countries and across borders, may have been
hampered.
Fourth, structural labour market mismatch
might be on the rise, linked to the sectoral
reallocation of labour and an acceleration of
changes in the relative skills demand triggered
by the COVID-19 shock. The assessment of
this hypothesis will require tracking the future
evolution of Beveridge curves and other
mismatch indicators.
Developments in labour market slack and
shortages will also depend on the strength of the
recovery and the future course of policy support.
New data and information on the labour market
will help assess the relative importance of these
explanations.
In the near term, managers expect labour demand
to continue growing, according to the
Commission’s Employment Expectations Index.
Also, the Indeed job posting indicator (66) shows an
increasing trend throughout the third quarter and at
the beginning of the fourth for Germany and
France albeit at slowing growth rates. As economic
conditions are promptly improving, it is reasonable
to expect the remaining pandemic-induced slack to
be re-absorbed into the labour market as suggested
by the developments in the second quarter.
Policy support continues to affect labour markets.
An estimated 2.7% of the euro area workforce
benefited from short-time work schemes in July
2021, against an average of 6.2% in the first five
months of the year. (67) These figures indicate that
the upper bound of possible job losses associated
with the future withdrawal of job retention
schemes remains sizeable but is shrinking over
time. As the gradual exit of these workers from
short-time work schemes is expected to continue in
a context of strong economic growth, the number
of possible layoffs is expected to be moderate.
This view is supported by the experience of the
recent period: despite the ongoing withdrawal of
short-time work schemes over recent months, the
latest monthly unemployment data show a
declining trend in joblessness in most EU Member
States.
(66) Daily job posting data from the Indeed platform provides a
timely indicator of labour demand, though the representativeness of the sample is likely to be skewed
towards white-collar jobs. (67) ECB, Economic Bulletin, Issue 6, 2021

Economic outlook for EA and EU
57
4.4. HOUSING MARKET
Housing prices in the European Union continued
their dynamic upward trend despite the deep
recession caused by the COVID-19 shock. This
special topic looks at the EU housing price
increases since 2013, identifies some of its key
drivers and sheds some light on the
macroeconomic and social implications for the
economy going forward. While prices look
overvalued in many countries, significant price
corrections are unlikely due to strong demand and
constrained supply. What’s more, a possible
downturn in prices would have limited impact on
financial stability and economic activity because of
the moderate credit cycle and subdued construction
activity during this cycle. However, housing
affordability has deteriorated with macroeconomic
implications such as the need for higher savings
and a lower share of income devoted to
consumption.
EU house prices have been trending up since 2013,
and grew at their fastest pace in the second quarter
of this year. Following the resumption of economic
growth in 2013, house prices have been rising in
most Member States. By 2021-Q2, house prices in
the EU were around 38% higher compared with
the same quarter in 2013 (see Graph I.4.22). This
represents an average annual rate of growth of 4%.
Among large EU Member States, German prices in
2021Q2 were 62% above their mid-2013 values,
compared to 40% for Poland, 37% for Spain, and
18% for France. By contrast, over this 8-year
period, prices decreased in Italy (-7%), and
remained broadly stable in Greece and Cyprus.
This year has seen a marked acceleration in prices.
In 2021Q2, EU aggregate residential property
prices grew by 7.3% year-on-year. This means that
of the total increase in prices that occurred since
2013, nearly a fifth has taken place in the last 12
months alone.
The recent price increase was broad-based across
Member States, and exceeded the previous trend
growth in most of them. Over the past year, prices
have increased in all countries except Cyprus, and
have accelerated relative to the post 2013 trend in
twenty of them. Eleven Member States reported
year-on-year growth exceeding 10%. The largest
increases were observed in Estonia, Denmark,
Luxembourg, Czechia, Lithuania and the
Netherlands (see Graph I.4.22).
Drivers of house price growth
The recent growth of house prices has been driven
by a variety of factors fuelling demand and
constraining supply. Although housing markets
differ strongly across Member States, supply-side
constraints have been present across the board.
With sustained demand backed by economic
growth, historically high household savings and
low interest rates, the result has been an upward
trend in house prices.
Limited construction activity has been acting as a
brake on the supply of housing for a number of
years. Member States currently have stricter
zoning and building regulations than in previous
decades. Furthermore, building permits have
remained at low levels in recent years (see Graph
I.4.23).
The pandemic may have exacerbated supply
constraints, but overcoming these will take more
than just the recovery. While lockdowns
exacerbated the supply-side constraints
temporarily, there is little perspective at present for
-20
0
20
40
60
80
100
120
140
EU
27
EA
19 IT EL
CY FI
FR
BE
HR
RO SI
ES
MT
PL
BG
DK
SK
DE
LV
AT
SE
NL
LT
PT
CZ
EE
LU IE
HU
%Graph I.4.22: House prices' growth before and
during the pandemic
13-Q2 to 20-Q2 20-Q2 to 21-Q2
0
50
100
150
200
250
300
350
05 08 11 14 17 20
Graph I.4.23: EU Building permits
Germany France Italy Spain Rest of EA Non-EA MS
Index,
2015=100

European Economic Forecast, Autumn 2021
58
the pre-existing constraints to materially ease.
Building permits typically take time to react to the
increase in house prices, and while there has been
a recovery of permits in recent months, residential
investment will need time to materialise.
Demand for housing has been sustained in recent
years, and continued during the pandemic. In
several EU countries, favourable funding
conditions and growing household disposable
incomes have been supporting demand for
residential space, particularly in urban and
suburban areas, even before the pandemic. During
the pandemic, a resilient labour market, income
support measures and curtailed spending
opportunities pushed up the stock of savings, part
of which households are likely to devote to
residential investment. These accumulated savings
and demand for increasing living space to
accommodate new working habits such as
teleworking should continue to support housing
demand.
House prices in perspective
House prices currently seem overvalued in around
half of EU countries. House prices can be
compared to their fundamental drivers in order to
gauge whether they are at a plausible level. These
fundamental drivers commonly include population,
income, interest rates and housing investment, all
of which are found to affect house prices in the
EU. Estimating the long-term relationship among
these indicators allows for estimating an
‘equilibrium level’ of house prices, to which the
actual level can be compared to. This approach is
accompanied by a comparison of price-to-income
and price-to-rent ratios to their long-term averages.
The results of this analysis suggest that house
prices are currently overvalued in around half of
EU countries (see Graph I.4.24). (68)
(68) The over/under valuation gap is computed as the average of
three benchmarks: (i) price-to-income deviation with respect to its long-term average; (ii) price-to-rent deviation
from its long-term average; (iii) deviation from
regressions-based benchmarks taking into account demand
and supply economic fundamentals. None of these
methodologies is perfect, but they provide an overview of recent house price developments compared with the past.
Despite the high and increasing price level, there
do not seem to be substantial risks to macro-
financial stability. Though a house price correction
triggered by a rise in interest rates cannot be ruled
out, the price adjustments are likely to be muted in
view of the strong fundamentals behind demand
and existing supply side restrictions to the housing
stock. The existence of biting supply-side
constraints therefore mitigates the risks for
aggregate financial stability as EU house prices are
unlikely to quickly decline below current levels(69).
House price dynamics also poses limited risk to
economic activity. As the house price surges in
recent years added little to economic activity by
way of residential investment, a downturn in
housing prices, should it materialise, would also
have limited spillovers to economic activity.
Therefore, even in case of a house price correction,
the macroeconomic implications would likely be
more limited than those observed in the aftermath
of the global financial crisis. At the time, the
correction in house prices proved extremely
damaging to economic activity, particularly in
those countries where the bust in prices trigged an
important re-allocation of resources away from a
bloated construction sector.
Moreover, since 2013, mortgage credit has been
more subdued than in previous phases of rapid
price increase. House prices have increased faster
than mortgage credit which can be related to low
household residential investment in new dwellings
which typically relies more on credit than the
purchase of existing dwellings. In addition, the
introduction of macro-prudential tools has
constrained the amount of credit households can
(69) This does not rule out financial stability concerns in
particular areas or Member States that are subject to particularly fast credit growth.
-20
-10
0
10
20
30
40
50
IE LT
RO IT PL
CY FI
EE
HR
BG
EL SI
MT
ES
LV
DK
NL
HU
SK
CZ
BE
PT
FR
DE
AT
SE
LU
%Graph I.4.24: Overvaluation metrics 2020
ECFIN average overvaluation gap ECB average overvaluation gap
Source: ECB, own calculations

Economic outlook for EA and EU
59
access. All that led to a more limited and less risky
exposure of EU banks to the housing markets since
2013. In 2021, mortgage credit growth has
accelerated, but still lags behind house price
growth. In the euro area, the increase has mainly
been driven by Germany and France (see Graph
I.4.25 below).
The house price dynamics since 2013 differ from
the property booms of the 2000s. The sustained
and synchronized house price increases over the
past eight years may recall the price surges
recorded in several Member States before 2008.
However, in contrast to the situation today, in the
early 2000s, house price increases were
accompanied by rapid credit expansion and
substantial residential over-investment. This was
particularly the case for some countries such as
Spain and Ireland, which accounted for the bulk of
household mortgage credit and where sharp
corrections in the housing markets spilled over to
the real economy. In contrast, over the recent years
credit growth remained moderate and residential
investment fell short of demand. These differences
moderate the macroeconomic stability risks going
forward.
Housing affordability and its economic
implications
Housing affordability is for now the main issue
emerging from the recent acceleration in house
prices. Recent home-buyers, who acquired
mortgages at a time of high prices, may be faced
with debt repayment risks, particularly in the event
of a reversal in interest rates. Worsening housing
affordability has significant macroeconomic and
distributional implications such as hampering
consumption, and hitting low-income groups
especially hard. At the same time, home owners
are enjoying positive wealth effects although
evidence suggest a limited positive impact on
consumption.
Rising price-to-income ratios across the EU render
home-buying difficult. Between 2013 and 2021-
Q2, growth of house prices exceeded growth of
household income in 21 Member States and by
more than 20 percentage points in 11 Member
States. The largest increase was observed in
Luxembourg (+57%) where a household needs
roughly 14 years of income to purchase a 100m2
dwelling. In Ireland, Austria, Portugal, Hungary,
Germany, the Netherlands, and Sweden, price
growth since 2013 exceeded cumulated household
income growth by more than 30%. (70) These
figures relate national average house prices to
average income growth, and it is important to note
that price-to-income ratios increase faster for
certain population groups or cities within a
country.
Rising house prices imply that home buyers will
have to take out larger mortgages for longer
periods of time, although at present the increase in
monthly payments for households is mostly
neutralised by declining interest rates.
Furthermore, high prices entail a larger required
equity portion to purchase a home, resulting in
difficulties for lower income/wealth households to
secure a mortgage. While the share of EU
household income spent on housing costs remained
broadly stable, on average, at ca. 20% during the
first decade of this century, (71) new homeowners,
especially those with low income, are likely to
have to cope with a much higher share. The
alternative of relying on the rental market is often
complicated by the inefficiency and/or limited
availability of rental properties in many Member
States, where house ownership is the norm. The
impact of rising house prices is thus likely salient
for poor households who cannot secure a
mortgage. (72)
(70) Note that price data expressed in years of income is
tentative for the following countries, and might be revised substantially: IE, LU, FI, EL, CY. Data is not available for
SK, CZ, RO. (71) Data source: Eurostat EU-SILC. The definition of housing
cost in this case includes the payment of interest, but not
the repayment of borrowed capital. (72) Data source: Eurostat EU-SILC. Note that among Member
States, only LU has recorded a strong increase in housing
expenditure during 2015-2020. Moreover, EU-SILC survey data suggests that 4% of euro-area home owners with a
mortgage were overburdened by their housing cost in 2019, down from 8% in 2010. In contrast, 24% of renters were
exposed to housing cost overburden in 2019, up from 22%
-1
1
3
5
7
9
11
Jan-05 Jan-08 Jan-11 Jan-14 Jan-17 Jan-20
Graph I.4.25: Bank loan flows to households & NPISH
Germany France
Italy Rest of euro area
Spain EA total (changing comp.)
Note: Flows over last 12 month as % of EA loan stockSource: ECB
%

European Economic Forecast, Autumn 2021
60
Worsening housing affordability has also
macroeconomic implications. Besides the
distributional implications, households having to
devote an increasing share of their income to
housing costs will need to adjust their consumption
patterns. Insofar as these households are younger
and resource constrained, they are more likely to
have higher propensity to consume, adding
economic significance to their actions. Finally,
housing affordability and more in general income
and generational inequality represent a potential
threat to social cohesion.
in 2010. The housing cost overburden rate is the percentage
of the population living in households where the total housing costs represent more than 40 % of disposable
income, 'net' of housing allowances.
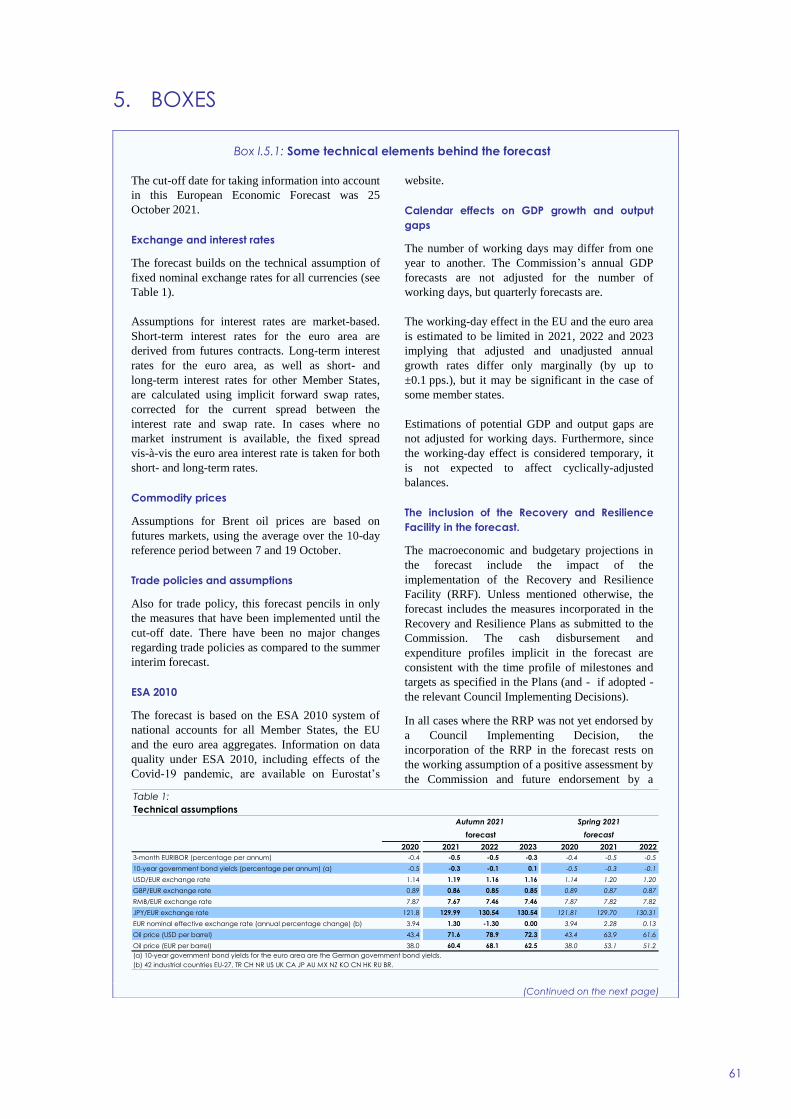
5. BOXES
61
(Continued on the next page)
Box I.5.1: Some technical elements behind the forecast
The cut-off date for taking information into account
in this European Economic Forecast was 25
October 2021.
Exchange and interest rates
The forecast builds on the technical assumption of
fixed nominal exchange rates for all currencies (see
Table 1).
Assumptions for interest rates are market-based.
Short-term interest rates for the euro area are
derived from futures contracts. Long-term interest
rates for the euro area, as well as short- and
long-term interest rates for other Member States,
are calculated using implicit forward swap rates,
corrected for the current spread between the
interest rate and swap rate. In cases where no
market instrument is available, the fixed spread
vis-à-vis the euro area interest rate is taken for both
short- and long-term rates.
Commodity prices
Assumptions for Brent oil prices are based on
futures markets, using the average over the 10-day
reference period between 7 and 19 October.
Trade policies and assumptions
Also for trade policy, this forecast pencils in only
the measures that have been implemented until the
cut-off date. There have been no major changes
regarding trade policies as compared to the summer
interim forecast.
ESA 2010
The forecast is based on the ESA 2010 system of
national accounts for all Member States, the EU
and the euro area aggregates. Information on data
quality under ESA 2010, including effects of the
Covid-19 pandemic, are available on Eurostat’s
website.
Calendar effects on GDP growth and output
gaps
The number of working days may differ from one
year to another. The Commission’s annual GDP
forecasts are not adjusted for the number of
working days, but quarterly forecasts are.
The working-day effect in the EU and the euro area
is estimated to be limited in 2021, 2022 and 2023
implying that adjusted and unadjusted annual
growth rates differ only marginally (by up to
±0.1 pps.), but it may be significant in the case of
some member states.
Estimations of potential GDP and output gaps are
not adjusted for working days. Furthermore, since
the working-day effect is considered temporary, it
is not expected to affect cyclically-adjusted
balances.
The inclusion of the Recovery and Resilience
Facility in the forecast.
The macroeconomic and budgetary projections in
the forecast include the impact of the
implementation of the Recovery and Resilience
Facility (RRF). Unless mentioned otherwise, the
forecast includes the measures incorporated in the
Recovery and Resilience Plans as submitted to the
Commission. The cash disbursement and
expenditure profiles implicit in the forecast are
consistent with the time profile of milestones and
targets as specified in the Plans (and - if adopted -
the relevant Council Implementing Decisions).
In all cases where the RRP was not yet endorsed by
a Council Implementing Decision, the
incorporation of the RRP in the forecast rests on
the working assumption of a positive assessment by
the Commission and future endorsement by a
Table 1:
Technical assumptions
2020 2021 2022 2023 2020 2021 2022
3-month EURIBOR (percentage per annum) -0.4 -0.5 -0.5 -0.3 -0.4 -0.5 -0.5
10-year government bond yields (percentage per annum) (a) -0.5 -0.3 -0.1 0.1 -0.5 -0.3 -0.1
USD/EUR exchange rate 1.14 1.19 1.16 1.16 1.14 1.20 1.20
GBP/EUR exchange rate 0.89 0.86 0.85 0.85 0.89 0.87 0.87
RMB/EUR exchange rate 7.87 7.67 7.46 7.46 7.87 7.82 7.82
JPY/EUR exchange rate 121.8 129.99 130.54 130.54 121.81 129.70 130.31
EUR nominal effective exchange rate (annual percentage change) (b) 3.94 1.30 -1.30 0.00 3.94 2.28 0.13
Oil price (USD per barrel) 43.4 71.6 78.9 72.3 43.4 63.9 61.6
Oil price (EUR per barrel) 38.0 60.4 68.1 62.5 38.0 53.1 51.2
(a) 10-year government bond yields for the euro area are the German government bond yields.
(b) 42 industrial countries EU-27, TR CH NR US UK CA JP AU MX NZ KO CN HK RU BR.
Spring 2021
forecast
Autumn 2021
forecast

European Economic Forecast, Autumn 2021
62
Box (continued)
Council Implementing Decision. The inclusion of
transfers from the EU in revenue projections and
the time profiles of cash disbursements included in
the forecast is based on the assumption of a timely
completion of milestones and targets. The working
assumptions in the forecast do not pre-judge the
outcomes of future Commission and Council
decisions.
Transactions related to the RRF in the forecast are
recorded in line with Eurostat’s ‘Guidance note on
the statistical recording of the Recovery and
Resilience Facility’ of 7 October 2021. In
particular, this implies that, except for 2020, the
budgetary impact any expenditure or other costs
financed with non-reimbursable transfers (‘grants’)
from the RRF is neutralised in revenue projections
by matching transfers received from the EU (in
2020, expenditure and other costs retroactively
financed by RRF grants are offset by transfers from
the EU in the year of adoption of the Council
Implementing Decision). Expenditures financed by
loans from the RRF increase the deficit, while the
actual loans by the RRF are recorded as Member
States’ debt towards the EU.
Budgetary data and forecasts
The forecast incorporates validated public finance
data up to 2020 as published in Eurostat’s news
release 119/2021 of 21 October 2021.
Eurostat is withdrawing the reservation on the
quality of the data reported by Luxembourg for the
year 2020. The Luxembourgish statistical
authorities have provided the missing information
on the tax revenue deferred in the context of the
COVID-19 pandemic.
The public finance forecast is made under the ‘no-
policy-change’ assumption, which extrapolates past
revenue and expenditure trends and relationships in
line with past policy orientations. This may also
include the adoption of working assumptions, in
particular to deal with structural breaks caused by
the COVID-19 pandemic. The no-policy-change
forecast includes all fiscal policy measures that
imply a change to past policy orientations on the
condition that they are sufficiently detailed as well
as adopted or at least credibly announced. For
2022, draft budgets are taken into consideration.
The short-term emergency measures taken in
response to COVID-19 crisis adopted in 2020 and
2021 are not treated as one-off and are thus
reflected in the estimation of the structural budget
balance.
In line with Eurostat’s press release, EU and euro
area aggregates for general government balance
and debt are based exclusively on the Member
States’ balances and debt. For debt, whereas
Eurostat publishes the consolidated figures
(corrected for intergovernmental loans, including
those made through the European Financial
Stability Facility), the projections in the forecast
years 2021, 2022 and 2023 are published on a non-
consolidated basis. To ensure consistency in the
time series, historical data are also published on the
same basis. For 2020, this implies an aggregate
debt-to-GDP ratio that is somewhat higher than the
consolidated general government debt ratio
published by Eurostat in its news release 119/2021
of 21 October 2021 (by 2.0 pps. in the EA and by
1.7 pps. in the EU).

PART II Prospects by individual economy


Euro Area Member States
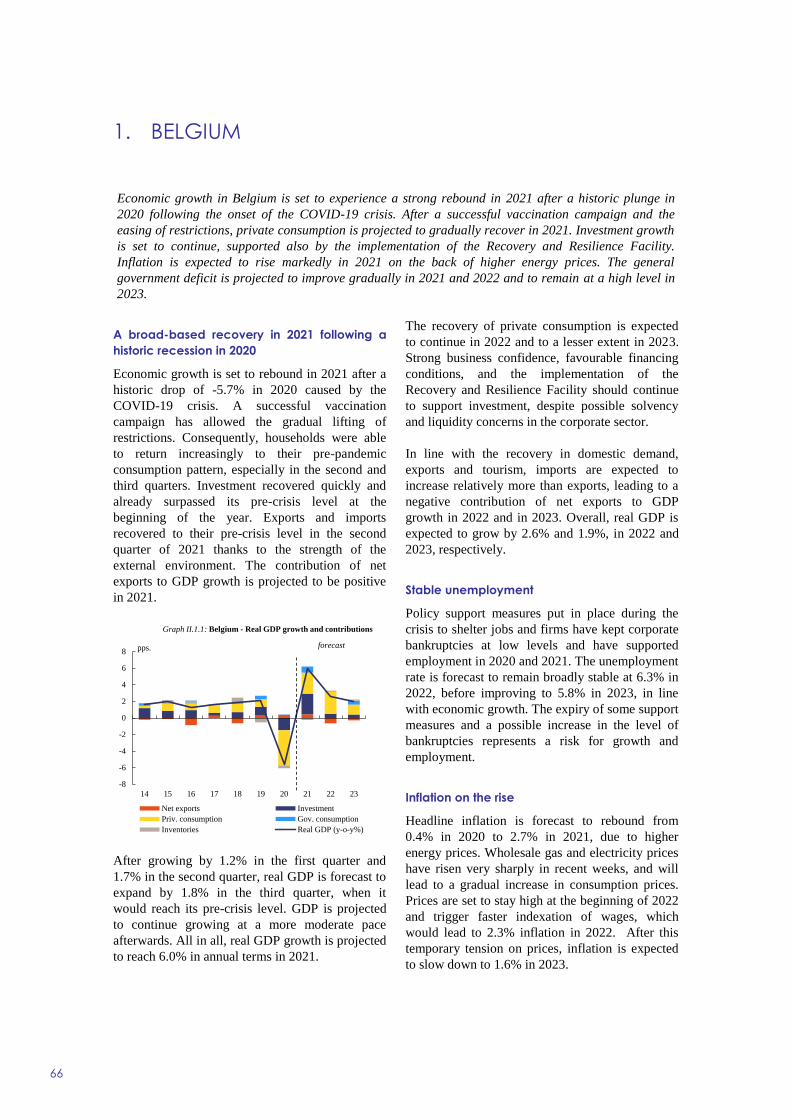
1. BELGIUM
66
A broad-based recovery in 2021 following a
historic recession in 2020
Economic growth is set to rebound in 2021 after a
historic drop of -5.7% in 2020 caused by the
COVID-19 crisis. A successful vaccination
campaign has allowed the gradual lifting of
restrictions. Consequently, households were able
to return increasingly to their pre-pandemic
consumption pattern, especially in the second and
third quarters. Investment recovered quickly and
already surpassed its pre-crisis level at the
beginning of the year. Exports and imports
recovered to their pre-crisis level in the second
quarter of 2021 thanks to the strength of the
external environment. The contribution of net
exports to GDP growth is projected to be positive
in 2021.
After growing by 1.2% in the first quarter and
1.7% in the second quarter, real GDP is forecast to
expand by 1.8% in the third quarter, when it
would reach its pre-crisis level. GDP is projected
to continue growing at a more moderate pace
afterwards. All in all, real GDP growth is projected
to reach 6.0% in annual terms in 2021.
The recovery of private consumption is expected
to continue in 2022 and to a lesser extent in 2023.
Strong business confidence, favourable financing
conditions, and the implementation of the
Recovery and Resilience Facility should continue
to support investment, despite possible solvency
and liquidity concerns in the corporate sector.
In line with the recovery in domestic demand,
exports and tourism, imports are expected to
increase relatively more than exports, leading to a
negative contribution of net exports to GDP
growth in 2022 and in 2023. Overall, real GDP is
expected to grow by 2.6% and 1.9%, in 2022 and
2023, respectively.
Stable unemployment
Policy support measures put in place during the
crisis to shelter jobs and firms have kept corporate
bankruptcies at low levels and have supported
employment in 2020 and 2021. The unemployment
rate is forecast to remain broadly stable at 6.3% in
2022, before improving to 5.8% in 2023, in line
with economic growth. The expiry of some support
measures and a possible increase in the level of
bankruptcies represents a risk for growth and
employment.
Inflation on the rise
Headline inflation is forecast to rebound from
0.4% in 2020 to 2.7% in 2021, due to higher
energy prices. Wholesale gas and electricity prices
have risen very sharply in recent weeks, and will
lead to a gradual increase in consumption prices.
Prices are set to stay high at the beginning of 2022
and trigger faster indexation of wages, which
would lead to 2.3% inflation in 2022. After this
temporary tension on prices, inflation is expected
to slow down to 1.6% in 2023.
-8
-6
-4
-2
0
2
4
6
8
14 15 16 17 18 19 20 21 22 23
Graph II.1.1: Belgium - Real GDP growth and contributions
Net exports Investment
Priv. consumption Gov. consumption
Inventories Real GDP (y-o-y%)
forecastpps.
Economic growth in Belgium is set to experience a strong rebound in 2021 after a historic plunge in
2020 following the onset of the COVID-19 crisis. After a successful vaccination campaign and the
easing of restrictions, private consumption is projected to gradually recover in 2021. Investment growth
is set to continue, supported also by the implementation of the Recovery and Resilience Facility.
Inflation is expected to rise markedly in 2021 on the back of higher energy prices. The general
government deficit is projected to improve gradually in 2021 and 2022 and to remain at a high level in
2023.

Euro Area Member States, Belgium
67
Government deficit to stabilise in 2022-2023,
but at a high level
The general government headline deficit is
projected to decrease to 7.8% of GDP in 2021 and
5.1% in 2022, broadly stabilising at 4.9% in 2023.
This improvement is driven by the progressive
phasing-out of crisis measures and by higher
revenue, which are set to rise above pre-crisis
levels in nominal terms in 2021, and to continue
increasing thereafter, in line with the economic
recovery.
In 2021, public finances continued to be affected
by crisis-related measures, including the cost of
health measures, various regional schemes to
compensate businesses for reduced turnover, and
temporary unemployment schemes. The budgetary
impact of these measures has decreased
considerably in the second part of 2021, notably
due to a significantly lower take-up of temporary
unemployment schemes.
Despite the expected phasing-out of most crisis-
related measures by the end of 2021, public
expenditure is projected to decrease only slightly
in nominal terms in 2022 and to increase again in
2023. This partly reflects the growth in non-crisis
social expenditure, which is projected to accelerate
in 2022-2023 because of higher spending on health
and pensions due to population ageing. The
increase in minimum pensions and a permanent
rise of wages in the health-sector are projected to
weigh further on expenditure in 2022-2023. Two
successive automatic indexations (due to rising
consumer prices) are expected to drive up public
wages and social benefit spending in 2022.
Public expenditure in 2022-2023 is further driven
by one-off emergency and reconstruction
expenditures triggered by the floods in July 2021,
for an estimated 1/4% of GDP both in 2021 and
2022. It also accounts for RRF-financed
expenditure, additional public investment plans at
federal and regional levels in 2021-2023, and
recent measures to reduce the cost of energy bills
that were adopted in response to the rising energy
prices for an expected amount of 0.1% of GDP in
2022.
The rebound in GDP growth and the decline in the
government deficit are expected to stabilise the
debt-to-GDP ratio at around 113% in 2021 and
2022, before it increases again to 115% in 2023
due to a persistent government deficit.
bn EUR Curr. prices % GDP 02-17 2018 2019 2020 2021 2022 2023
456.9 100.0 1.6 1.8 2.1 -5.7 6.0 2.6 1.9
227.0 49.7 1.4 1.9 1.8 -8.2 5.1 5.3 2.4
113.1 24.8 1.2 1.3 1.7 0.2 3.0 0.1 2.0
109.3 23.9 2.0 3.0 4.5 -6.2 10.5 2.0 1.6
33.8 7.4 1.1 1.8 3.1 -5.4 10.3 2.1 2.1
365.6 80.0 3.3 0.6 2.0 -5.5 9.9 3.7 2.7
359.2 78.6 3.4 1.4 1.6 -5.9 9.5 4.5 3.1
461.7 101.1 1.5 1.8 2.2 -5.6 5.9 2.6 1.9
1.4 2.0 2.4 -5.7 5.8 3.2 2.1
0.1 0.4 -0.5 -0.3 -0.2 0.1 0.2
0.0 -0.6 0.3 0.4 0.4 -0.6 -0.3
0.8 1.5 1.6 0.0 0.9 0.4 1.2
7.9 6.0 5.4 5.6 6.2 6.3 5.8
2.2 1.8 2.0 -1.5 3.6 5.1 2.0
1.4 1.5 1.5 4.4 -1.4 2.9 1.2
-0.3 0.0 -0.3 3.1 -3.3 0.6 -0.4
15.5 11.6 12.4 20.2 17.1 12.7 12.2
1.7 1.5 1.8 1.3 2.0 2.3 1.6
1.9 2.3 1.2 0.4 2.7 2.3 1.6
-0.2 -1.0 0.9 0.7 -0.6 0.2 0.1
1.0 -0.4 0.6 1.0 0.9 0.8 0.8
2.7 -0.8 0.1 0.8 0.8 0.3 0.0
2.6 -0.7 0.3 0.8 0.8 0.3 0.0
-2.2 -0.8 -1.9 -9.1 -7.8 -5.1 -4.9
-2.2 -1.4 -2.8 -5.7 -7.0 -5.0 -4.9
-2.4 -1.9 -3.0 -5.8 -6.9 -4.9 -4.9
100.3 99.9 97.7 112.8 112.7 113.1 114.6
General government balance (c)
Cyclically-adjusted budget balance (d)
Structural budget balance (d)
General government gross debt (c)
(a) Eurostat definition. (b) gross saving divided by adjusted gross disposable income. (c) as a % of GDP. (d) as a % of potential GDP.
Net lending (+) or borrowing (-) vis-a-vis ROW (c)
Employment
Unemployment rate (a)
Compensation of employees / head
Unit labour costs whole economy
Real unit labour cost
Saving rate of households (b)
GDP deflator
Harmonised index of consumer prices
Terms of trade goods
Trade balance (goods) (c)
Current-account balance (c)
Contribution to GDP growth: Domestic demand
Inventories
Net exports
GNI (GDP deflator)
Table II.1.1:
Main features of country forecast - BELGIUM
2020 Annual percentage change
GDP
Private Consumption
Public Consumption
Gross fixed capital formation
of which: equipment
Exports (goods and services)
Imports (goods and services)

2. GERMANY
68
A mild rebound as restrictions ease
After declining by 2% quarter-on-quarter in Q1-
2021, real GDP bounced back by 1.6% in Q2-
2021. With the gradual relaxation of containment
measures, private consumption partly recouped the
losses of the winter months. Investment and export
growth were, however, restrained by shortages of
raw materials and intermediate goods, in particular
semiconductors for auto- and equipment builders,
lumber for the construction sector.
Lingering bottlenecks delay recovery
In Q3-2021, growth in services is expected to have
benefited from rising vaccination rates and further
easing of restrictions. Improvements in the
accessibility of contact-intensive services are
assumed to continue driving the recovery in
consumption. On the other hand, despite strong
demand, manufacturing and construction are still
struggling with supply shortages, and exports and
investment are likely to remain depressed for a few
more months. Surveys suggest that supply
bottlenecks in manufacturing could persist, while
those in construction seem to be easing. Both
sectors have significant order backlogs and their
unwinding - subject to the easing of bottlenecks -
is expected to translate to brisk export, investment
and consumption growth in the course of 2022.
Investment will also be supported by the
implementation of the Recovery and Resilience
Plan.
Overall, real GDP is projected to rebound by 2.7%
in 2021. In 2022, the level of activity is forecast to
be 4.6% higher than the year before, as all final
demand components regain pre-crisis levels. In
2023, GDP is expected to grow by 1.7%, assuming
a normalisation of supply and demand dynamics.
Employment on the mend
At 44.8 million in Q1-2021, employment was still
1.2% below the level of Q4-2019. After peaking at
4.1% in late 2020, the unemployment rate declined
to 3.6% by August 2021. The number of
employees on short-time work is estimated to have
dropped to 610,000 in September, after having
risen to 3.3 million in February 2021 (just over
half of the peak reached in April 2020). Hiring
expectations and the percentage of businesses
reporting labour shortages are currently close to or
higher than the pre-crisis level. This sets the stage
for a resumption of employment and wage growth.
While recent wage settlements in industry and
construction have proved moderate so far, actual
wages will also be driven by the return to normal
work intensity as activity across sectors recovers.
With aggregate household disposable income
remaining relatively stable and consumption
limited by restrictions, the gross household saving
rate increased to just above 23% in 2020 and is
expected to remain there in 2021. On top of
growing earnings, accumulated savings are
expected to support the recovery in spending as
supply shortages dissipate even if inflation runs
higher than the subdued rate observed since 2013
(1.1% on average). The saving rate is expected to
come down but not go below its pre-pandemic
level of 18.4% as the spending affected by the
restrictions can only be made up for to a limited
extent.
-6
-4
-2
0
2
4
6
14 15 16 17 18 19 20 21 22 23
Graph II.2.1: Germany - Real GDP growth and
contributions
Net exports Investment
Priv. consumption Gov. consumption
Inventories Real GDP (y-o-y%)
pps. forecast
pps. pps. forecast
pps.
Easing of containment measures has spurred spending on services in recent months; however, supply
bottlenecks are slowing down manufacturing and putting a lid on the rebound of exports and investment.
Shortage of materials is also likely to add to inflation pressures over upcoming months, together with
base effects and higher energy prices. Still, the economy and the labour market are well set to recover.
The fiscal deficit is projected to narrow in 2022 and 2023, as policy support is withdrawn and the
economy moves from recovery into expansion.

Euro Area Member States, Germany
69
Germany’s current account surplus is set to narrow
this year (to below 7% of GDP), due to the soft
patch in exports in the second half, the resumption
of foreign travel and more expensive imports. Over
2022-23, the surplus is expected to edge up again
as pent-up export demand unravels, before
resuming its trend of a gradual decline.
Inflation to increase temporarily
In 2021, the reinstatement of regular VAT rates,
increased carbon taxes and rising commodity and
energy prices, reinforced by strong demand are
forecast to push inflation to 3.1% from just 0.3% a
year before. Lingering supply bottlenecks and
elevated energy prices are expected to keep
inflation above 2% in 2022. Even if tightening, the
labour market is not expected to generate
significant additional price pressures. In 2023
inflation is then expected to slow to below 2%.
Deficit reaching a peak in 2021
With the bulk of the public support measures to
counter the COVID-19 pandemic being paid out
this year the government headline deficit is
expected to peak at 6.5% of GDP. The phasing out
of measures towards the end of this year is set to
noticeably reduce the deficit thereafter to 2.5% in
2022 and 0.5% in 2023.
The extension of pandemic support measures
comprises mostly subsidies to companies,
prolongation of the short-time work scheme and
increased healthcare spending for vaccination and
testing. The reduction in government tax revenues
due to the partial abolishment of the solidarity levy
and increase in child allowances and other tax
reliefs is to some extent compensated by the
phasing in of a levy on CO2 emissions that will
gradually increase over the coming years.
The bulk of COVID-19 measures of this year will
only lead to a slight increase of the debt ratio to a
peak above 71% of GDP in 2021. In line with the
decreasing deficit in 2022 and 2023, the debt ratio
is set to decline to 69% and 68% of GDP
respectively. With the ending of the pandemic
support measures at the end of this year, Germany
can be expected to return to the debt reduction path
seen before the outbreak of the pandemic.
bn EUR Curr. prices % GDP 02-17 2018 2019 2020 2021 2022 2023
3367.6 100.0 1.3 1.1 1.1 -4.6 2.7 4.6 1.7
1708.0 50.7 0.8 1.4 1.6 -5.9 0.0 6.7 1.6
754.6 22.4 1.7 1.0 3.0 3.5 3.0 0.7 0.5
735.9 21.9 1.1 3.4 1.8 -2.2 2.4 3.5 3.1
216.9 6.4 1.8 4.4 1.0 -11.2 5.4 5.6 4.7
1462.1 43.4 4.6 2.3 1.1 -9.3 7.8 7.9 5.4
1269.3 37.7 4.2 3.9 2.9 -8.6 8.6 8.1 5.8
3461.3 102.8 1.5 1.9 1.1 -5.0 2.9 4.5 1.7
1.0 1.6 1.8 -2.8 1.2 4.3 1.6
-0.1 -0.1 -0.1 -0.9 1.4 0.0 0.0
0.4 -0.5 -0.7 -0.8 0.2 0.3 0.1
0.7 1.4 0.9 -0.8 0.0 0.9 0.4
7.3 3.4 3.1 3.8 3.6 3.4 3.2
1.8 2.9 3.4 0.4 3.1 3.3 2.9
1.2 3.2 3.2 4.3 0.4 -0.3 1.6
-0.1 1.2 1.2 2.7 -2.2 -2.7 -0.2
17.1 18.7 18.4 23.3 23.4 19.3 18.8
1.3 2.0 2.1 1.6 2.6 2.4 1.8
1.5 1.9 1.4 0.4 3.1 2.2 1.7
0.4 -1.0 1.1 2.9 -3.2 -0.7 0.2
7.0 6.7 6.2 5.6 5.1 5.3 5.6
6.0 8.1 7.6 7.1 6.7 6.8 6.9
5.9 7.9 7.5 6.7 6.3 6.4 6.5
-1.3 1.9 1.5 -4.3 -6.5 -2.5 -0.5
-1.1 1.3 0.9 -2.1 -5.0 -2.6 -0.8
1.0 1.4 0.9 -2.1 -5.0 -2.6 -0.8
70.5 61.3 58.9 68.7 71.4 69.2 68.1
GNI (GDP deflator)
Table II.2.1:
Main features of country forecast - GERMANY
2020 Annual percentage change
GDP
Private Consumption
Public Consumption
Gross fixed capital formation
of which: equipment
Exports (goods and services)
Imports (goods and services)
Contribution to GDP growth: Domestic demand
Inventories
Net exports
Net lending (+) or borrowing (-) vis-a-vis ROW (c)
Employment
Unemployment rate (a)
Compensation of employees / head
Unit labour costs whole economy
Real unit labour cost
Saving rate of households (b)
GDP deflator
Harmonised index of consumer prices
Terms of trade goods
Trade balance (goods) (c)
Current-account balance (c)
General government balance (c)
Cyclically-adjusted budget balance (d)
Structural budget balance (d)
General government gross debt (c)
(a) Eurostat definition. (b) gross saving divided by adjusted gross disposable income. (c) as a % of GDP. (d) as a % of potential GDP.

3. ESTONIA
70
Growth rebounds strongly
After dropping by 3% in 2020, real GDP is
forecast to grow by 9% this year, driven by private
consumption and investment. Output returned to
its pre-crisis level in the first quarter of 2021. The
expected sizeable increase in household
consumption is driven by several factors: the
removal of COVID-19 restrictions, some persisting
fiscal support measures and the early withdrawal
of assets from the second pillar of the pension
system for a net amount of around 4% of GDP,
about half of which are expected to lift
consumption. Investment was pushed up in late
2020 and early 2021 by a single large foreign
investment in intangible assets, likely to be one-
off. Gross fixed capital formation is set to continue
expanding at a vigorous pace this year.
Going forward, economic activity is forecast to
return to more moderate, although still solid,
growth rates of 3.7% in 2022 and 3.5% in 2023,
with positive contributions in particular from
private consumption and, in 2022, from net
exports. Household consumption is expected to
continue rising in 2022-23, thanks to brighter
employment prospects and sustained wage
increases. Investment growth is predicted to slow
down in 2022 and pick up again in 2023, with
faster rises in investment in equipment and non-
residential construction, supported by the inflow of
EU funds.
Stimulated by the swell in domestic demand,
imports are forecast to rise substantially this year,
compounding the escalation in energy prices. This
is set to weigh on the trade balance, despite some
projected gains in export shares, mainly of
services. The rate of increase of both exports and
imports is projected to remain robust in 2022-23,
albeit going down to single-digit figures, on the
back of a higher anticipated foreign demand for the
goods and services that Estonia increasingly
exports, particularly in the ICT sector.
Any possible further restrictions in Estonia or
neighbouring countries linked to the COVID-19
pandemic represent a negative risk to short-term
economic growth.
Imported inflation spreads to domestic sectors
Consumer price growth accelerated into the third
quarter of 2021 and is estimated to remain elevated
for the following three quarters. Annual HICP
inflation is forecast at 4.0% this year, 3.9% in
2022, and 2.1% in 2023. The recent energy price
hikes and global supply bottlenecks are bound to
raise manufacturing, transport and delivery costs,
affecting price developments in a significant
portion of the economy, fading away only
gradually. By 2023, labour shortages, notably for
skilled labour, are expected to translate into wage
pressures in various domestic sectors, pushing core
inflation up.
Steady wage rise accompanies employment
recovery
Labour losses that occurred at the beginning of the
COVID-19 crisis started being reabsorbed in the
last quarter of 2020. This early recovery stopped in
the face of renewed restrictions, albeit mitigated by
a new short-term unemployment benefit scheme,
supported by the EU, launched in March 2021.
-8
-6
-4
-2
0
2
4
6
8
10
14 15 16 17 18 19 20 21 22 23
Graph II.3.1: Estonia - Real GDP growth and contributions
Net exports Investment
Priv. consumption Gov. consumption
Inventories Real GDP (y-o-y%)
pps. forecast
pps. pps. pps.
Following a moderate contraction in 2020, Estonia’s GDP is forecast to increase by 9% in real terms in
2021, driven by private demand, government stimulus and buoyant exports. Growth is expected to
remain strong in 2022-23 supported by a recovery in employment, sustained wage growth and dynamic
foreign demand. Inflation is set to surge this year, fuelled by the transitory increases in imported energy
prices gradually passing through to other goods and services. The government deficit is projected to
narrow to 2.2% of GDP in 2023, with public debt remaining the lowest in the EU.
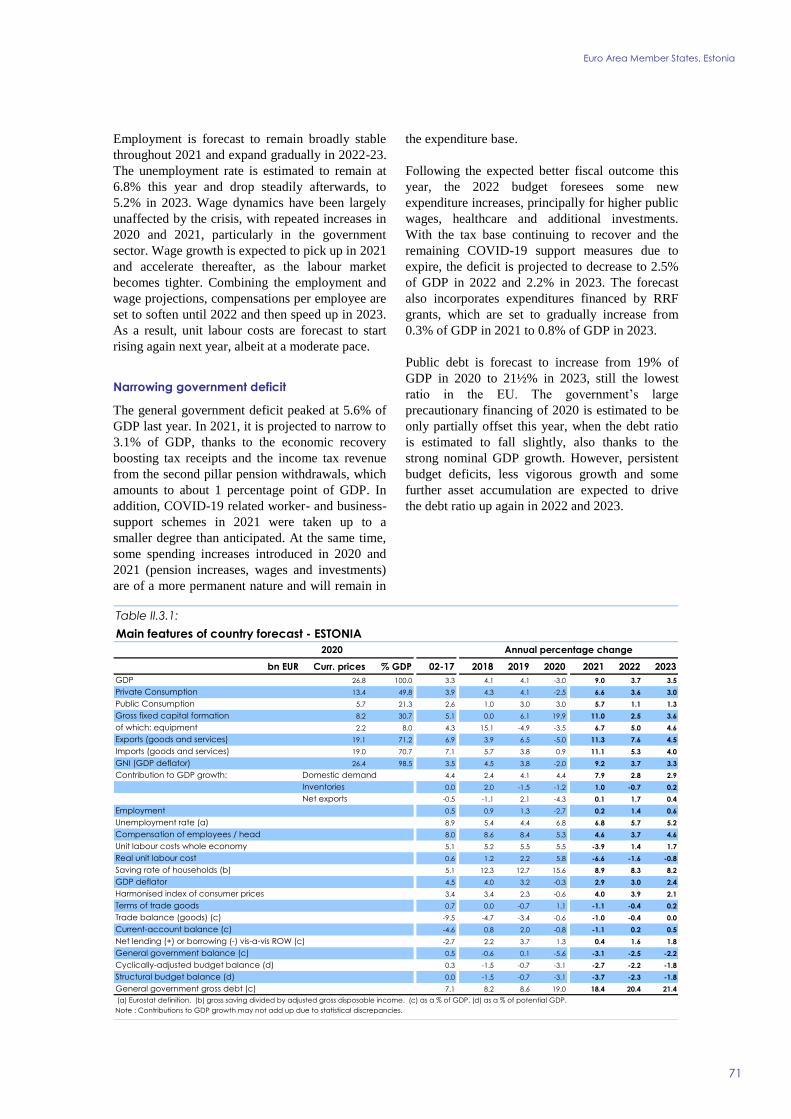
Euro Area Member States, Estonia
71
Employment is forecast to remain broadly stable
throughout 2021 and expand gradually in 2022-23.
The unemployment rate is estimated to remain at
6.8% this year and drop steadily afterwards, to
5.2% in 2023. Wage dynamics have been largely
unaffected by the crisis, with repeated increases in
2020 and 2021, particularly in the government
sector. Wage growth is expected to pick up in 2021
and accelerate thereafter, as the labour market
becomes tighter. Combining the employment and
wage projections, compensations per employee are
set to soften until 2022 and then speed up in 2023.
As a result, unit labour costs are forecast to start
rising again next year, albeit at a moderate pace.
Narrowing government deficit
The general government deficit peaked at 5.6% of
GDP last year. In 2021, it is projected to narrow to
3.1% of GDP, thanks to the economic recovery
boosting tax receipts and the income tax revenue
from the second pillar pension withdrawals, which
amounts to about 1 percentage point of GDP. In
addition, COVID-19 related worker- and business-
support schemes in 2021 were taken up to a
smaller degree than anticipated. At the same time,
some spending increases introduced in 2020 and
2021 (pension increases, wages and investments)
are of a more permanent nature and will remain in
the expenditure base.
Following the expected better fiscal outcome this
year, the 2022 budget foresees some new
expenditure increases, principally for higher public
wages, healthcare and additional investments.
With the tax base continuing to recover and the
remaining COVID-19 support measures due to
expire, the deficit is projected to decrease to 2.5%
of GDP in 2022 and 2.2% in 2023. The forecast
also incorporates expenditures financed by RRF
grants, which are set to gradually increase from
0.3% of GDP in 2021 to 0.8% of GDP in 2023.
Public debt is forecast to increase from 19% of
GDP in 2020 to 21½% in 2023, still the lowest
ratio in the EU. The government’s large
precautionary financing of 2020 is estimated to be
only partially offset this year, when the debt ratio
is estimated to fall slightly, also thanks to the
strong nominal GDP growth. However, persistent
budget deficits, less vigorous growth and some
further asset accumulation are expected to drive
the debt ratio up again in 2022 and 2023.
bn EUR Curr. prices % GDP 02-17 2018 2019 2020 2021 2022 2023
26.8 100.0 3.3 4.1 4.1 -3.0 9.0 3.7 3.5
13.4 49.8 3.9 4.3 4.1 -2.5 6.6 3.6 3.0
5.7 21.3 2.6 1.0 3.0 3.0 5.7 1.1 1.3
8.2 30.7 5.1 0.0 6.1 19.9 11.0 2.5 3.6
2.2 8.0 4.3 15.1 -4.9 -3.5 6.7 5.0 4.6
19.1 71.2 6.9 3.9 6.5 -5.0 11.3 7.6 4.5
19.0 70.7 7.1 5.7 3.8 0.9 11.1 5.3 4.0
26.4 98.5 3.5 4.5 3.8 -2.0 9.2 3.7 3.3
4.4 2.4 4.1 4.4 7.9 2.8 2.9
0.0 2.0 -1.5 -1.2 1.0 -0.7 0.2
-0.5 -1.1 2.1 -4.3 0.1 1.7 0.4
0.5 0.9 1.3 -2.7 0.2 1.4 0.6
8.9 5.4 4.4 6.8 6.8 5.7 5.2
8.0 8.6 8.4 5.3 4.6 3.7 4.6
5.1 5.2 5.5 5.5 -3.9 1.4 1.7
0.6 1.2 2.2 5.8 -6.6 -1.6 -0.8
5.1 12.3 12.7 15.6 8.9 8.3 8.2
4.5 4.0 3.2 -0.3 2.9 3.0 2.4
3.4 3.4 2.3 -0.6 4.0 3.9 2.1
0.7 0.0 -0.7 1.1 -1.1 -0.4 0.2
-9.5 -4.7 -3.4 -0.6 -1.0 -0.4 0.0
-4.6 0.8 2.0 -0.8 -1.1 0.2 0.5
-2.7 2.2 3.7 1.3 0.4 1.6 1.8
0.5 -0.6 0.1 -5.6 -3.1 -2.5 -2.2
0.3 -1.5 -0.7 -3.1 -2.7 -2.2 -1.8
0.0 -1.5 -0.7 -3.1 -3.7 -2.3 -1.8
7.1 8.2 8.6 19.0 18.4 20.4 21.4
General government balance (c)
Cyclically-adjusted budget balance (d)
Structural budget balance (d)
General government gross debt (c)
(a) Eurostat definition. (b) gross saving divided by adjusted gross disposable income. (c) as a % of GDP. (d) as a % of potential GDP.
Note : Contributions to GDP growth may not add up due to statistical discrepancies.
Net lending (+) or borrowing (-) vis-a-vis ROW (c)
Employment
Unemployment rate (a)
Compensation of employees / head
Unit labour costs whole economy
Real unit labour cost
Saving rate of households (b)
GDP deflator
Harmonised index of consumer prices
Terms of trade goods
Trade balance (goods) (c)
Current-account balance (c)
Contribution to GDP growth: Domestic demand
Inventories
Net exports
GNI (GDP deflator)
Table II.3.1:
Main features of country forecast - ESTONIA
2020 Annual percentage change
GDP
Private Consumption
Public Consumption
Gross fixed capital formation
of which: equipment
Exports (goods and services)
Imports (goods and services)
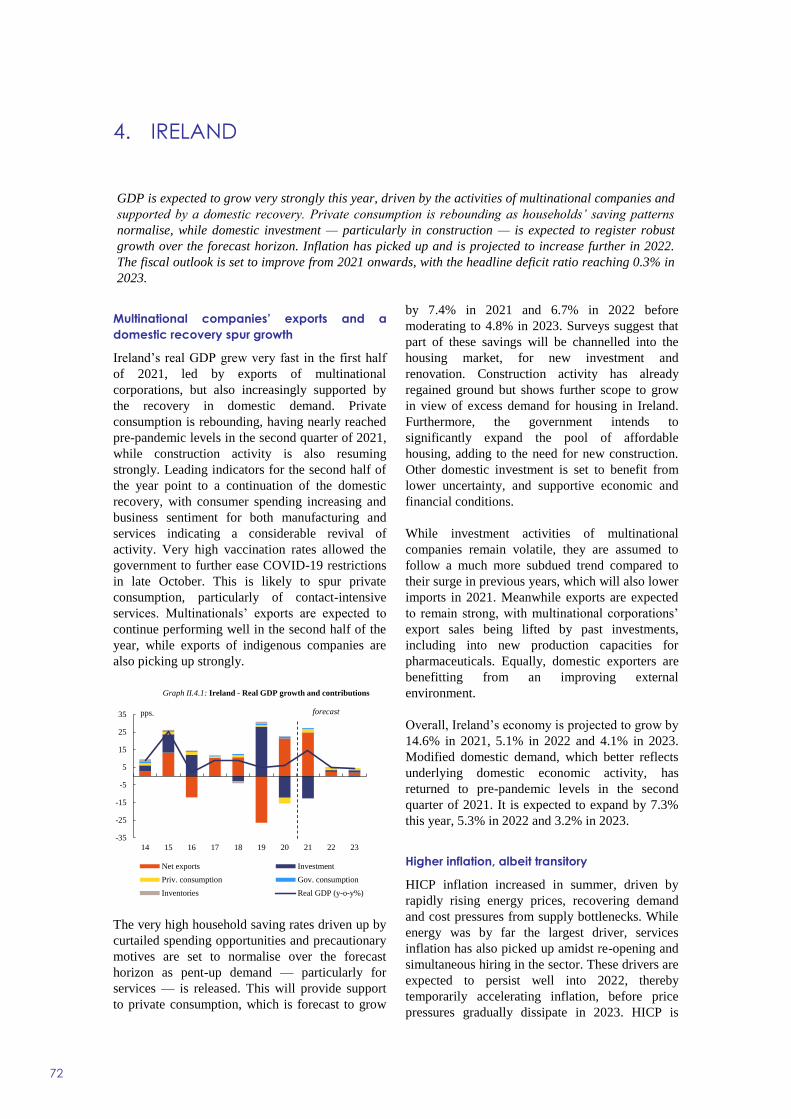
4. IRELAND
72
Multinational companies’ exports and a
domestic recovery spur growth
Ireland’s real GDP grew very fast in the first half
of 2021, led by exports of multinational
corporations, but also increasingly supported by
the recovery in domestic demand. Private
consumption is rebounding, having nearly reached
pre-pandemic levels in the second quarter of 2021,
while construction activity is also resuming
strongly. Leading indicators for the second half of
the year point to a continuation of the domestic
recovery, with consumer spending increasing and
business sentiment for both manufacturing and
services indicating a considerable revival of
activity. Very high vaccination rates allowed the
government to further ease COVID-19 restrictions
in late October. This is likely to spur private
consumption, particularly of contact-intensive
services. Multinationals’ exports are expected to
continue performing well in the second half of the
year, while exports of indigenous companies are
also picking up strongly.
The very high household saving rates driven up by
curtailed spending opportunities and precautionary
motives are set to normalise over the forecast
horizon as pent-up demand — particularly for
services — is released. This will provide support
to private consumption, which is forecast to grow
by 7.4% in 2021 and 6.7% in 2022 before
moderating to 4.8% in 2023. Surveys suggest that
part of these savings will be channelled into the
housing market, for new investment and
renovation. Construction activity has already
regained ground but shows further scope to grow
in view of excess demand for housing in Ireland.
Furthermore, the government intends to
significantly expand the pool of affordable
housing, adding to the need for new construction.
Other domestic investment is set to benefit from
lower uncertainty, and supportive economic and
financial conditions.
While investment activities of multinational
companies remain volatile, they are assumed to
follow a much more subdued trend compared to
their surge in previous years, which will also lower
imports in 2021. Meanwhile exports are expected
to remain strong, with multinational corporations’
export sales being lifted by past investments,
including into new production capacities for
pharmaceuticals. Equally, domestic exporters are
benefitting from an improving external
environment.
Overall, Ireland’s economy is projected to grow by
14.6% in 2021, 5.1% in 2022 and 4.1% in 2023.
Modified domestic demand, which better reflects
underlying domestic economic activity, has
returned to pre-pandemic levels in the second
quarter of 2021. It is expected to expand by 7.3%
this year, 5.3% in 2022 and 3.2% in 2023.
Higher inflation, albeit transitory
HICP inflation increased in summer, driven by
rapidly rising energy prices, recovering demand
and cost pressures from supply bottlenecks. While
energy was by far the largest driver, services
inflation has also picked up amidst re-opening and
simultaneous hiring in the sector. These drivers are
expected to persist well into 2022, thereby
temporarily accelerating inflation, before price
pressures gradually dissipate in 2023. HICP is
-35
-25
-15
-5
5
15
25
35
14 15 16 17 18 19 20 21 22 23
Graph II.4.1: Ireland - Real GDP growth and contributions
Net exports Investment
Priv. consumption Gov. consumption
Inventories Real GDP (y-o-y%)
forecastpps.
GDP is expected to grow very strongly this year, driven by the activities of multinational companies and
supported by a domestic recovery. Private consumption is rebounding as households’ saving patterns
normalise, while domestic investment — particularly in construction — is expected to register robust
growth over the forecast horizon. Inflation has picked up and is projected to increase further in 2022.
The fiscal outlook is set to improve from 2021 onwards, with the headline deficit ratio reaching 0.3% in
2023.

Euro Area Member States, Ireland
73
projected at 2.3% in 2021, 3.1% in 2022 and 1.5%
in 2023.
Labour market recovers
The Irish labour market still benefits from public
support, though the schemes are being gradually
wound down via tightened eligibility and reduced
payment rates. The reopening of the labour-
intensive services sector helped to reignite
employment, with October’s ending of most
pandemic restrictions providing another boost.
Employment expectations are positive overall.
However, the unemployment rate remains above
pre-crisis levels and is expected to decline
moderately over the forecast horizon. This reflects
the uneven impact of the pandemic on different
sectors, with some sectors now needing less
employees and others running into capacity
constraints due to the lack of workers with the
right skills and a reduced net inflow of foreign
workers.
Deficit starts decreasing as of 2021
Ireland’s general government deficit is forecast to
decrease to 3.2% of GDP in 2021 from 4.9% in
2020. Revenue growth is expected to be
broad-based amidst a positive surprise in corporate
income tax receipts as of September 2021. On the
expenditure side, an undershoot in government
investment in 2021 is projected to also contribute
to a lower deficit. A positive denominator effect
from strong nominal GDP growth also supports the
reduction in the deficit ratio.
In 2022, the deficit is forecast to further decrease
to 1.7% of GDP as the effect of pandemic response
measures fades. According to Budget 2022,
income support measures have been extended until
April 2022. An almost-balanced budget is
expected by 2023, at 0.3% of GDP, under the
assumption that support measures to fight the
pandemic are withdrawn as planned.
The general government debt-to-GDP ratio is
projected to decrease to 55.6% in 2021, 52.3% in
2022 and 51.1% in 2023. Risks to the fiscal
outlook include the actual impact of upcoming
changes in international corporate taxation.
bn EUR Curr. prices % GDP 02-17 2018 2019 2020 2021 2022 2023
372.9 100.0 4.2 9.0 4.9 5.9 14.6 5.1 4.1
93.4 25.1 2.3 3.7 3.2 -11.1 7.4 6.7 4.8
47.2 12.6 2.1 5.3 6.8 9.4 4.2 0.0 -3.9
147.9 39.7 6.9 -8.9 99.5 -22.9 -31.8 4.1 5.4
17.8 4.8 7.7 19.1 -5.8 -28.3 15.2 10.3 7.4
488.9 131.1 6.6 11.5 10.4 9.5 15.2 5.9 5.1
405.8 108.8 6.0 3.3 41.7 -7.4 -4.5 5.8 5.0
283.4 76.0 3.8 8.0 3.2 4.0 15.5 3.8 4.1
3.1 -1.1 29.9 -14.4 -10.3 2.6 2.1
0.2 -1.1 1.0 0.2 0.0 0.0 0.0
1.7 10.7 -26.5 21.4 24.8 2.5 2.0
1.3 3.2 2.9 -1.5 3.0 1.7 1.7
9.0 5.8 5.0 5.7 7.5 6.8 6.2
2.5 2.5 3.4 2.4 4.2 5.0 6.1
-0.4 -3.0 1.4 -4.7 -6.3 1.6 3.7
-1.8 -3.7 -2.8 -3.5 -6.1 -0.4 2.2
10.0 11.6 12.2 25.2 18.5 14.6 13.9
1.4 0.7 4.2 -1.2 -0.2 2.0 1.4
1.4 0.7 0.9 -0.5 2.3 3.1 1.5
-0.1 -6.4 4.9 -1.8 -1.6 -0.5 -0.1
24.3 33.6 33.1 38.9 40.0 39.8 39.6
-1.8 6.0 -11.3 -2.8 15.4 14.4 14.6
-2.6 -9.9 -21.2 -6.9 11.1 9.9 9.9
-5.2 0.1 0.5 -4.9 -3.2 -1.7 -0.3
-5.2 0.0 2.3 -2.4 -4.7 -3.1 -1.2
-3.0 0.0 2.3 -2.4 -4.7 -3.1 -1.2
64.1 63.1 57.2 58.4 55.6 52.3 51.1
GNI (GDP deflator)
Table II.4.1:
Main features of country forecast - IRELAND
2020 Annual percentage change
GDP
Private Consumption
Public Consumption
Gross fixed capital formation
of which: equipment
Exports (goods and services)
Imports (goods and services)
Contribution to GDP growth: Domestic demand
Inventories
Net exports
Net lending (+) or borrowing (-) vis-a-vis ROW (c)
Employment
Unemployment rate (a)
Compensation of employees / head
Unit labour costs whole economy
Real unit labour cost
Saving rate of households (b)
GDP deflator
Harmonised index of consumer prices
Terms of trade goods
Trade balance (goods) (c)
Current-account balance (c)
General government balance (c)
Cyclically-adjusted budget balance (d)
Structural budget balance (d)
General government gross debt (c)
(a) Eurostat definition. (b) gross saving divided by adjusted gross disposable income. (c) as a % of GDP. (d) as a % of potential GDP.

5. GREECE
74
Recovery gains momentum in 2021
Greece’s economy rebounded strongly in the
second quarter of 2021, by 3.4% compared with
the previous quarter. Real GDP reached its pre-
pandemic level in the second quarter of 2021. The
recovery was driven by domestic demand, in
particular investment, and by the accumulation of
inventories, while the ongoing fiscal stimulus
provided a crucial role in supporting the economy.
The authorities continue to provide targeted and
temporary support to the economy, notably
towards sustaining employment. The
unemployment rate decreased over the summer,
also supported by more hirings in tourism sector.
Recovery and Resilience Plan and external
sector to bolster recovery
While part of the high growth that is forecast for
2021 reflects the depth of the recession in 2020,
the improving sanitary situation, in terms of both
vaccination rates, and total number of severe cases,
has allowed for an easing of containment
measures. This is expected to continue enabling
the realisation of deferred purchases, further
contributing to private consumption growth,
especially in 2022. The economic activity in the
second half of 2021 is also expected to be
supported by the launch of the implementation of
projects presented in Greece’s RRF. Overall, GDP
is forecast to rebound by 7.1% in 2021, and to
grow by 5.2% and 3.6% in 2022 and 2023,
respectively. Growth in 2022 and 2023 is expected
to be driven by public and private investment, as
the roll-out of projects under the Recovery and
Resilience Plan is expected to sustain momentum.
The forecast assumes a cumulative amount of
3.6% of 2019 GDP for expenditures financed by
RRF grants over the forecast horizon.
In terms of the external sector, the reopening of
tourism earlier in May, later supported by the
lifting of mobility restrictions across the EU during
the summer, has managed to buttress exports in
services. Along with the market share gains for
Greek goods’ exports, the external sector is
expected to continue providing support to growth
going forward.
Job support measures are expected to continue
assisting employment in vulnerable sectors, while
the recovery of the economy is set to accelerate job
creation. The unemployment rate is forecast to go
down to 15.3% in 2021 and continue its decline to
15.0% and 14.5% in 2022 and 2023 respectively.
Despite the current hike in energy prices, overall
inflation is likely to remain only mildly positive in
2021, largely on account of the weak demand
during the first half of the year. Inflation is
expected to peak in 2022, reaching 1.0%, also
driven by the projected strengthening of the
demand for services. As the transitory effects of
the energy prices peter out, inflation is forecast to
ease to 0.4% in 2023.
The forecast remains subject to risks, particularly
in relation to the uncertain development of the
pandemic, and its potential repercussions in the
tourism sector, or the possible cliff effects from the
large amount of emergency support measures
extended to the private sector. This also concerns
the pace at which the employment support
schemes are phased out. External geopolitical
factors remain a source of uncertainty.
-12
-8
-4
0
4
8
12
14 15 16 17 18 19 20 21 22 23
Graph II.5.1: Greece - Real GDP growth and
contributions
Net exports Investment
Priv. consumption Gov. consumption
Inventories Real GDP (y-o-y%)
forecastpps.
The recovery of the Greek economy is gaining traction, primarily driven by domestic demand and the
better-than-expected tourist season. The impact of the pandemic is expected to gradually soften, while
the accommodative fiscal and monetary policy, coupled with the strong boost from the Recovery and
Resilience Plan, are set to sustain the momentum going forward. Emergency support measures are
being adapted to the evolving needs of the economy, and expected to be largely phased out by the end of
2021, supporting the reduction of the general government deficit.

Euro Area Member States, Greece
75
General government deficit to narrow by 2023
Greece’s general government deficit is expected at
9.9% of GDP in 2021 due to the budgetary
implications of the economic downturn and the
cost of the measures adopted to address the
coronavirus outbreak. The budgetary impact of the
measures is expected to reach 6.5% of GDP in
2021 and most of them are expected to phase out
by the end of the year. The cost of the relief and
support measures taken in response to the
extensive forest fires in August contributes further
to the deficit. The government also announced
measures to counteract the impact of the soaring
energy prices, which will be fully matched with
increased revenues of the emissions trading system
account earmarked to energy-related spending.
The general government deficit is expected to
decrease to 3.9% of GDP in 2022. The
improvement is driven mainly by the economic
rebound and is reinforced by the phasing out of
most of the emergency measures. The fiscal impact
of the support measures adopted in 2021 that have
been prolonged to 2022 is 1.5% of GDP, namely:
lower social security contributions, suspension of
the social solidarity tax in the private sector,
extension of the recruitment subsidy programme
and reduced VAT rates for transport, beverages
and cinema tickets until mid-2022. The forecast
takes into account the additional package of tax
relief measures announced by the government with
an expected annual cost of around 0.1% of GDP.
The decision of the government to frontload part of
the deliveries of the defence-spending programme
from the period 2023-2025 to 2022 has also a
balance deteriorating impact of 0.1% of GDP in
2022. The economic recovery and the expiry of the
emergency measures are expected to further reduce
the headline deficit to 1.1% of GDP in 2023.
Public debt is expected to decrease to 203% of
GDP in 2021 and decline further to around 197%
in 2023, supported by the economic recovery.
Fiscal risks remain substantial. The possible
activation of state guarantees issued as part of the
support measures could lead to increased fiscal
costs. The litigation cases against the Public Real
Estate Company and the pending ruling of the
Council of State on the retroactive compensation
for cuts in the supplementary pensions and
seasonal bonuses pose additional risks. Further
risks relate to the statistical classification of recent
or planned financial policy arrangements,
including the sale and lease-back scheme for
properties owned by vulnerable debtors.
bn EUR Curr. prices % GDP 02-17 2018 2019 2020 2021 2022 2023
165.3 100.0 -0.4 1.7 1.8 -9.0 7.1 5.2 3.6
115.5 69.8 -0.1 1.7 1.8 -7.9 3.3 2.5 2.1
37.6 22.8 0.1 -3.5 1.7 2.6 4.4 -3.5 -2.2
19.3 11.7 -3.7 -4.3 -3.3 -0.3 15.3 13.4 8.2
8.5 5.2 -1.4 -0.4 3.0 -4.8 22.4 16.3 8.9
52.9 32.0 2.5 9.1 4.9 -21.5 16.2 15.0 9.2
65.5 39.6 0.9 8.1 3.1 -7.6 8.1 6.9 5.2
164.6 99.6 -0.5 1.1 2.0 -8.6 7.1 5.0 3.4
-0.5 0.0 1.2 -4.9 5.1 2.6 2.1
-0.1 1.4 0.0 1.4 0.0 0.0 0.0
0.3 0.2 0.6 -5.5 2.0 2.6 1.5
0.2 4.6 0.9 -1.2 1.1 1.1 1.0
15.9 19.3 17.3 16.3 15.3 15.0 14.5
1.1 -3.8 0.6 -0.7 0.0 0.6 1.5
1.6 -1.0 -0.3 7.8 -5.6 -3.3 -1.0
0.3 -0.8 -0.5 8.7 -5.6 -4.2 -1.4
: : : : : : :
1.3 -0.2 0.2 -0.8 -0.1 0.9 0.4
2.0 0.8 0.5 -1.3 0.1 1.0 0.4
-0.3 -1.2 -1.4 -4.1 -1.8 -1.0 -1.0
-13.8 -12.6 -13.0 -11.8 -12.7 -13.4 -14.2
-7.9 -3.5 -2.4 -7.9 -6.3 -4.0 -2.8
-6.2 -2.3 -1.1 -5.8 -4.1 -1.7 -0.4
-7.5 0.9 1.1 -10.1 -9.9 -3.9 -1.1
-4.9 4.0 2.8 -4.5 -7.4 -3.6 -1.9
4.3 4.6 1.7 -5.1 -7.9 -3.5 -1.9
140.0 186.4 180.7 206.3 202.9 196.9 192.1
General government balance (c)
Cyclically-adjusted budget balance (d)
Structural budget balance (d)
General government gross debt (c)
(a) Eurostat definition. (b) gross saving divided by adjusted gross disposable income. (c) as a % of GDP. (d) as a % of potential GDP.
Net lending (+) or borrowing (-) vis-a-vis ROW (c)
Employment
Unemployment rate (a)
Compensation of employees / head
Unit labour costs whole economy
Real unit labour cost
Saving rate of households (b)
GDP deflator
Harmonised index of consumer prices
Terms of trade goods
Trade balance (goods) (c)
Current-account balance (c)
Contribution to GDP growth: Domestic demand
Inventories
Net exports
GNI (GDP deflator)
Table II.5.1:
Main features of country forecast - GREECE
2020 Annual percentage change
GDP
Private Consumption
Public Consumption
Gross fixed capital formation
of which: equipment
Exports (goods and services)
Imports (goods and services)

6. SPAIN
76
Recovery is gaining traction in the second half
of 2021
The containment measures still in force dragged
down economic activity in the first half of 2021,
with a moderate GDP contraction in the first
quarter (-0.6%) followed by a softer-than-expected
rebound in the second quarter (1.1%). Since the
lifting of the state of emergency in mid-May,
backed by the success of the vaccination
campaign, the Spanish economy has entered into a
steady recovery. The service sector, including
leisure and tourism-related activities, is finally
supporting the recovery. Job creation has
accelerated in recent months and confidence
indicators remain very high for both manufacturing
and services. In this context, real GDP is set to
speed up in the second half of the year and achieve
an annual growth rate of 4.6% in 2021, with
private consumption as its main driver.
The RRP will boost economic growth over the
forecast horizon
Following the rebound in the second half of 2021,
the Spanish economy is set to continue to grow in
2022 and close the gap with its pre-pandemic level
of GDP by 2023-Q1. Private consumption growth
is projected to remain strong with the impulse of
savings accumulated during the pandemic and the
recovery of employment. Meanwhile, the
implementation of the Recovery and Resilience
Plan (RRP) will gain traction, thereby spurring
public and private investment. The forecast
incorporates expenditures financed by RRF grants
for a cumulative amount of 5.0% of 2019 GDP
over the forecast horizon. The external sector is
also expected to contribute positively to GDP
growth throughout the forecast horizon, thanks to
the gradual normalisation of international tourism.
Economic activity is forecast to continue to expand
in 2023, still under the impulse of the RRP-
financed expenditure and reforms, although
quarterly growth rates are set to moderate as the
output gap turns positive.
Overall, real GDP is projected to grow by 5.5% in
2022 and by 4.4% in 2023. While uncertainty has
decreased significantly thanks to the control of the
health situation at national level, there are still
several risks to the outlook. The persistence or
resurgence of the pandemic in other countries
could weigh on economic growth, notably by
delaying a full recovery in the tourism sector.
Supply-side bottlenecks and energy and transport
prices could delay the recovery in the short-term,
while labour market mismatches could affect the
implementation of green and digital investments
connected to the RRP. By contrast, the
implementation of the RRP could lead to more
powerful crowding-in effects and a stronger impact
of key reforms on potential growth.
Inflation to remain high in the short term
Headline inflation reached 2% in April and 4% in
September, due to the surge of gas and electricity
prices. These are expected to remain at record
levels until 2022-Q2, despite some measures
adopted by the government to contain them,
including reduced VAT rates. In addition,
pensions’ indexation will put some upward
pressure on core inflation. However, the remaining
-12
-10
-8
-6
-4
-2
0
2
4
6
8
14 15 16 17 18 19 20 21 22 23
Graph II.6.1: Spain - Real GDP growth and contributions
Net exports Investment
Priv. consumption Gov. consumption
Inventories Real GDP (y-o-y%)
forecastpps.
After recording the deepest contraction in the EU in 2020, the economic recovery is gaining traction in
Spain. The implementation of the Recovery and Resilience Plan will sustain the economic momentum
over the forecast horizon and spur public and private investment. The labour market has shown
remarkable resilience compared to previous crises and the unemployment rate is expected to fall below
its pre-crisis level by 2023. Inflation has risen in 2021 and is projected to remain high until mid-2022.
The general government deficit is set to improve to 5.2% in 2022 and 4.2% in 2023 due to a good
revenue performance and the supportive macroeconomic scenario.
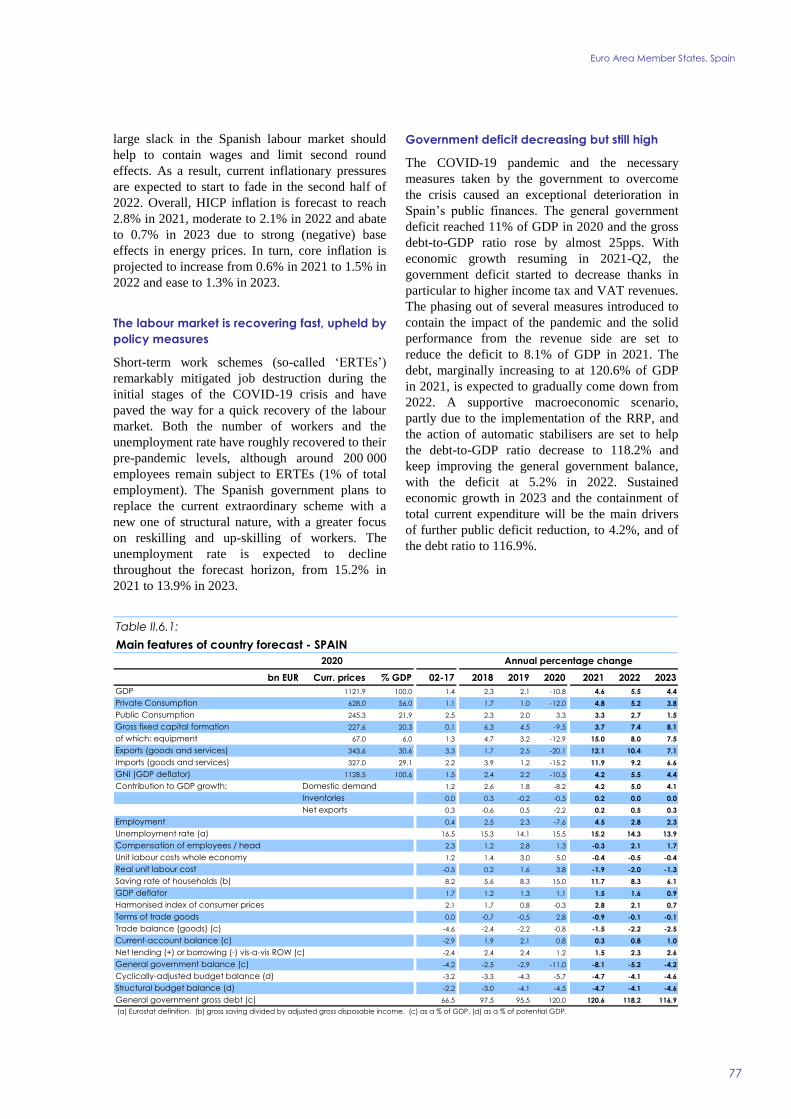
Euro Area Member States, Spain
77
large slack in the Spanish labour market should
help to contain wages and limit second round
effects. As a result, current inflationary pressures
are expected to start to fade in the second half of
2022. Overall, HICP inflation is forecast to reach
2.8% in 2021, moderate to 2.1% in 2022 and abate
to 0.7% in 2023 due to strong (negative) base
effects in energy prices. In turn, core inflation is
projected to increase from 0.6% in 2021 to 1.5% in
2022 and ease to 1.3% in 2023.
The labour market is recovering fast, upheld by
policy measures
Short-term work schemes (so-called ‘ERTEs’)
remarkably mitigated job destruction during the
initial stages of the COVID-19 crisis and have
paved the way for a quick recovery of the labour
market. Both the number of workers and the
unemployment rate have roughly recovered to their
pre-pandemic levels, although around 200 000
employees remain subject to ERTEs (1% of total
employment). The Spanish government plans to
replace the current extraordinary scheme with a
new one of structural nature, with a greater focus
on reskilling and up-skilling of workers. The
unemployment rate is expected to decline
throughout the forecast horizon, from 15.2% in
2021 to 13.9% in 2023.
Government deficit decreasing but still high
The COVID-19 pandemic and the necessary
measures taken by the government to overcome
the crisis caused an exceptional deterioration in
Spain’s public finances. The general government
deficit reached 11% of GDP in 2020 and the gross
debt-to-GDP ratio rose by almost 25pps. With
economic growth resuming in 2021-Q2, the
government deficit started to decrease thanks in
particular to higher income tax and VAT revenues.
The phasing out of several measures introduced to
contain the impact of the pandemic and the solid
performance from the revenue side are set to
reduce the deficit to 8.1% of GDP in 2021. The
debt, marginally increasing to at 120.6% of GDP
in 2021, is expected to gradually come down from
2022. A supportive macroeconomic scenario,
partly due to the implementation of the RRP, and
the action of automatic stabilisers are set to help
the debt-to-GDP ratio decrease to 118.2% and
keep improving the general government balance,
with the deficit at 5.2% in 2022. Sustained
economic growth in 2023 and the containment of
total current expenditure will be the main drivers
of further public deficit reduction, to 4.2%, and of
the debt ratio to 116.9%.
bn EUR Curr. prices % GDP 02-17 2018 2019 2020 2021 2022 2023
1121.9 100.0 1.4 2.3 2.1 -10.8 4.6 5.5 4.4
628.0 56.0 1.1 1.7 1.0 -12.0 4.8 5.2 3.8
245.3 21.9 2.5 2.3 2.0 3.3 3.3 2.7 1.5
227.6 20.3 0.1 6.3 4.5 -9.5 3.7 7.4 8.1
67.0 6.0 1.3 4.7 3.2 -12.9 15.0 8.0 7.5
343.6 30.6 3.3 1.7 2.5 -20.1 12.1 10.4 7.1
327.0 29.1 2.2 3.9 1.2 -15.2 11.9 9.2 6.6
1128.5 100.6 1.5 2.4 2.2 -10.5 4.2 5.5 4.4
1.2 2.6 1.8 -8.2 4.2 5.0 4.1
0.0 0.3 -0.2 -0.5 0.2 0.0 0.0
0.3 -0.6 0.5 -2.2 0.2 0.5 0.3
0.4 2.5 2.3 -7.6 4.5 2.8 2.3
16.5 15.3 14.1 15.5 15.2 14.3 13.9
2.3 1.2 2.8 1.3 -0.3 2.1 1.7
1.2 1.4 3.0 5.0 -0.4 -0.5 -0.4
-0.5 0.2 1.6 3.8 -1.9 -2.0 -1.3
8.2 5.6 8.3 15.0 11.7 8.3 6.1
1.7 1.2 1.3 1.1 1.5 1.6 0.9
2.1 1.7 0.8 -0.3 2.8 2.1 0.7
0.0 -0.7 -0.5 2.8 -0.9 -0.1 -0.1
-4.6 -2.4 -2.2 -0.8 -1.5 -2.2 -2.5
-2.9 1.9 2.1 0.8 0.3 0.8 1.0
-2.4 2.4 2.4 1.2 1.5 2.3 2.6
-4.2 -2.5 -2.9 -11.0 -8.1 -5.2 -4.2
-3.2 -3.3 -4.3 -5.7 -4.7 -4.1 -4.6
-2.2 -3.0 -4.1 -4.5 -4.7 -4.1 -4.6
66.5 97.5 95.5 120.0 120.6 118.2 116.9
General government balance (c)
Cyclically-adjusted budget balance (d)
Structural budget balance (d)
General government gross debt (c)
(a) Eurostat definition. (b) gross saving divided by adjusted gross disposable income. (c) as a % of GDP. (d) as a % of potential GDP.
Net lending (+) or borrowing (-) vis-a-vis ROW (c)
Employment
Unemployment rate (a)
Compensation of employees / head
Unit labour costs whole economy
Real unit labour cost
Saving rate of households (b)
GDP deflator
Harmonised index of consumer prices
Terms of trade goods
Trade balance (goods) (c)
Current-account balance (c)
Contribution to GDP growth: Domestic demand
Inventories
Net exports
GNI (GDP deflator)
Table II.6.1:
Main features of country forecast - SPAIN
2020 Annual percentage change
GDP
Private Consumption
Public Consumption
Gross fixed capital formation
of which: equipment
Exports (goods and services)
Imports (goods and services)
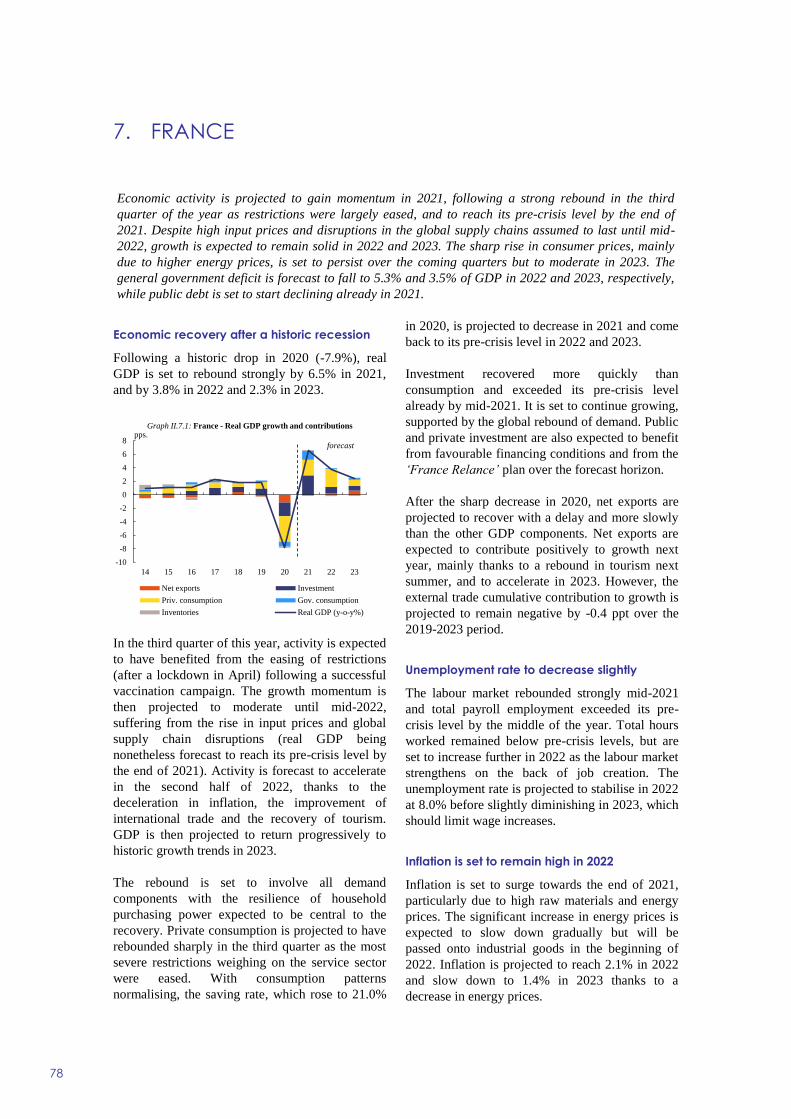
7. FRANCE
78
Economic recovery after a historic recession
Following a historic drop in 2020 (-7.9%), real
GDP is set to rebound strongly by 6.5% in 2021,
and by 3.8% in 2022 and 2.3% in 2023.
In the third quarter of this year, activity is expected
to have benefited from the easing of restrictions
(after a lockdown in April) following a successful
vaccination campaign. The growth momentum is
then projected to moderate until mid-2022,
suffering from the rise in input prices and global
supply chain disruptions (real GDP being
nonetheless forecast to reach its pre-crisis level by
the end of 2021). Activity is forecast to accelerate
in the second half of 2022, thanks to the
deceleration in inflation, the improvement of
international trade and the recovery of tourism.
GDP is then projected to return progressively to
historic growth trends in 2023.
The rebound is set to involve all demand
components with the resilience of household
purchasing power expected to be central to the
recovery. Private consumption is projected to have
rebounded sharply in the third quarter as the most
severe restrictions weighing on the service sector
were eased. With consumption patterns
normalising, the saving rate, which rose to 21.0%
in 2020, is projected to decrease in 2021 and come
back to its pre-crisis level in 2022 and 2023.
Investment recovered more quickly than
consumption and exceeded its pre-crisis level
already by mid-2021. It is set to continue growing,
supported by the global rebound of demand. Public
and private investment are also expected to benefit
from favourable financing conditions and from the
‘France Relance’ plan over the forecast horizon.
After the sharp decrease in 2020, net exports are
projected to recover with a delay and more slowly
than the other GDP components. Net exports are
expected to contribute positively to growth next
year, mainly thanks to a rebound in tourism next
summer, and to accelerate in 2023. However, the
external trade cumulative contribution to growth is
projected to remain negative by -0.4 ppt over the
2019-2023 period.
Unemployment rate to decrease slightly
The labour market rebounded strongly mid-2021
and total payroll employment exceeded its pre-
crisis level by the middle of the year. Total hours
worked remained below pre-crisis levels, but are
set to increase further in 2022 as the labour market
strengthens on the back of job creation. The
unemployment rate is projected to stabilise in 2022
at 8.0% before slightly diminishing in 2023, which
should limit wage increases.
Inflation is set to remain high in 2022
Inflation is set to surge towards the end of 2021,
particularly due to high raw materials and energy
prices. The significant increase in energy prices is
expected to slow down gradually but will be
passed onto industrial goods in the beginning of
2022. Inflation is projected to reach 2.1% in 2022
and slow down to 1.4% in 2023 thanks to a
decrease in energy prices.
-10
-8
-6
-4
-2
0
2
4
6
8
14 15 16 17 18 19 20 21 22 23
Graph II.7.1: France - Real GDP growth and contributions
Net exports Investment
Priv. consumption Gov. consumption
Inventories Real GDP (y-o-y%)
forecast
pps.
Economic activity is projected to gain momentum in 2021, following a strong rebound in the third
quarter of the year as restrictions were largely eased, and to reach its pre-crisis level by the end of
2021. Despite high input prices and disruptions in the global supply chains assumed to last until mid-
2022, growth is expected to remain solid in 2022 and 2023. The sharp rise in consumer prices, mainly
due to higher energy prices, is set to persist over the coming quarters but to moderate in 2023. The
general government deficit is forecast to fall to 5.3% and 3.5% of GDP in 2022 and 2023, respectively,
while public debt is set to start declining already in 2021.

Euro Area Member States, France
79
Public debt expected to decline as of 2021
The general government deficit is set to narrow to
8.1% of GDP in 2021 from 9.1% in 2020. This is
mainly due to the improvement of the
macroeconomic situation and the dynamism of tax
revenues, including those linked to the housing
market. These were offset in part by the extension
of some emergency measures, such as the partial
activity scheme and direct subsidies via the
solidarity fund, as well as those recovery measures
included in the French recovery plan France
Relance but not financed by the e Recovery and
Resilience Facility (RRF) and the subsidies to
assuage the rise in energy prices. The RRF is
expected to partly finance recovery expenditure
measures worth €16.5 billion (0.7% of GDP). The
revenue-to-GDP ratio is set to dwindle by around
½ pp., due to the permanent cut in production taxes
under France Relance, and low corporate profits in
2020. Moreover, by cushioning the shock on
government revenues in 2020, income support
schemes are set to lead to a lower-than-one
elasticity of some tax revenues in 2021. In turn, the
expenditure ratio is expected to shrink by 1½ pps.,
to 60.1%. A downward risk to these projections,
presented by the possibility of public guarantees
being called, appears limited.
The general government deficit is set to decrease
to 5.3% of GDP in 2022, mainly due to the
unwinding of most emergency measures and to
lower recovery measures under France Relance
than in 2021. This forecast incorporates RRF
financing worth 0.4% of GDP and an annual
estimate of the budgetary impact of the investment
plan France 2030 of 0.1% of GDP as of 2022. The
revenue ratio is expected to further narrow, by ¾
pp. of GDP, due to the withdrawal of the housing
tax, the cut of the corporate income tax rate, the
reduction in electricity taxes and lower RRF
grants. In turn, the expenditure ratio is set to
decline by 3¾ pps.
For 2023, the government deficit is set to narrow
further to 3.5% of GDP. While the revenue ratio is
expected to increase only slightly mainly due to
the unwinding of the cut in electricity taxes, the
expenditure ratio is projected to decline by 1½ pps.
Public debt is forecast to display a downward trend
over the whole forecast horizon. From 115% of
GDP in 2020, it is set to decline to 114.6% already
in 2021 due to the dynamic growth and relatively
high inflation. Public debt is then expected to fall
to 113.7% in 2022 and to around 113% in 2023.
bn EUR Curr. prices % GDP 02-17 2018 2019 2020 2021 2022 2023
2302.9 100.0 1.2 1.9 1.8 -7.9 6.5 3.8 2.3
1223.7 53.1 1.4 1.0 1.8 -7.1 4.4 5.1 1.7
577.3 25.1 1.5 0.8 1.0 -3.2 5.4 0.4 1.2
528.8 23.0 1.2 3.3 4.0 -8.6 12.5 3.9 2.8
114.6 5.0 1.1 2.6 3.0 -10.6 11.3 2.8 2.4
641.9 27.9 2.6 4.5 1.6 -15.8 8.4 8.7 7.5
688.4 29.9 3.3 3.1 2.3 -11.9 8.2 7.4 5.1
2339.2 101.6 1.2 1.8 1.7 -8.3 6.8 4.0 2.6
1.4 1.5 2.1 -6.5 6.5 3.7 1.9
0.0 0.0 0.0 -0.2 0.1 -0.2 -0.2
-0.2 0.4 -0.3 -1.1 -0.1 0.2 0.6
0.4 1.0 1.3 -0.9 1.4 0.6 0.5
9.1 9.0 8.4 8.0 8.0 8.0 7.9
2.3 1.7 -0.2 -3.0 4.3 3.1 2.3
1.5 0.8 -0.7 4.3 -0.7 0.0 0.4
0.2 -0.2 -2.0 1.8 -1.5 -1.3 -1.0
14.5 14.1 14.6 21.0 18.6 15.2 14.8
1.3 1.0 1.3 2.5 0.8 1.4 1.4
1.5 2.1 1.3 0.5 1.9 2.1 1.4
0.3 -1.5 1.3 1.1 -1.5 -0.9 0.6
-1.4 -1.7 -1.4 -2.1 -2.9 -2.7 -1.9
-0.3 -0.9 -0.8 -2.6 -2.4 -2.2 -1.0
-0.3 -0.8 -0.8 -2.5 -2.0 -1.7 -0.6
-4.1 -2.3 -3.1 -9.1 -8.1 -5.3 -3.5
-3.9 -2.8 -4.2 -4.7 -6.8 -5.3 -4.0
-2.7 -2.8 -3.3 -4.6 -6.7 -5.2 -3.9
80.2 97.8 97.5 115.0 114.6 113.7 112.9
GNI (GDP deflator)
Table II.7.1:
Main features of country forecast - FRANCE
2020 Annual percentage change
GDP
Private Consumption
Public Consumption
Gross fixed capital formation
of which: equipment
Exports (goods and services)
Imports (goods and services)
Contribution to GDP growth: Domestic demand
Inventories
Net exports
Net lending (+) or borrowing (-) vis-a-vis ROW (c)
Employment
Unemployment rate (a)
Compensation of employees / head
Unit labour costs whole economy
Real unit labour cost
Saving rate of households (b)
GDP deflator
Harmonised index of consumer prices
Terms of trade goods
Trade balance (goods) (c)
Current-account balance (c)
General government balance (c)
Cyclically-adjusted budget balance (d)
Structural budget balance (d)
General government gross debt (c)
(a) Eurostat definition. (b) gross saving divided by adjusted gross disposable income. (c) as a % of GDP. (d) as a % of potential GDP.

8. ITALY
80
Economy set to bounce back strongly in 2021
amid signs of emerging headwinds
The retreat of COVID-19 in spring, notably helped
by rising vaccination rates, and the associated
gradual lifting of most business and mobility
restrictions since May have allowed Italy’s
economy to make significant headway. With the
driving force of GDP growth shifting from
construction and manufacturing to services,
consumer services led the rebound in the second
quarter of this year. The economy is estimated to
have continued on its expansion path in Q3-2021,
while rising input prices and supply disruptions
facing manufacturing firms are likely to weigh on
the short-term outlook. However, the Italian
economy is expected to embark on a stable and
sustained expansion path next year, thanks to
easing supply shortages, national budgetary
support and in particular unfolding Recovery and
Resilience Facility (RRF)-financed investment.
Real GDP is projected to rebound by 6.2% this
year, before growth moderates to 4.3% in 2022 and
the economy returns to pre-crisis output levels by
mid next year. In 2023, economic activity is set to
expand by 2.3%, a growth rate still sizeably above
the long-term average, while the output gap is set
to turn positive. The outlook remains subject to
pandemic-related downside risks, including the
potential entrenchment of flagging labour force
participation.
Domestic demand remains main growth pillar
After the strong 2021 rebound following the lifting
of containment measures, private consumption
growth is forecast to moderate over the forecast
horizon. Moderate wage and employment growth
is set to support consumer spending, which is
expected to be partly dented by rising inflation
weighing on real disposable incomes. The
concentration of accumulated savings among
higher-income households with a lower propensity
to consume is likely to restrain a more sustained
rebound in private consumption. The household
saving rate is projected to decrease over the next
two years towards its long-run average.
Investment spending is set to rise strongly, thanks
to an improved demand outlook, favourable
financing conditions and RRF support. Exports,
especially of goods, are forecast to regain some
market shares in 2021 and to grow in line with
world trade thereafter. Services exports are likely
to be affected by the more gradual recovery in
tourist flows, which are not assumed to regain pre-
crisis levels prior to 2023.
Skill mismatch set to slow job growth
The end of pandemic-relief measures such as the
general dismissal ban and the wide-ranging access
to job retention schemes for workers in the
manufacturing and construction sector at the end
of June, has not so far led to substantial job losses.
However, employment growth is expected to lag
behind output growth, as labour shortages in
specific sectors, partly related to skill mismatch, is
set to hamper job growth despite labour market
slack. The unemployment rate is set to fall to 9.2%
by 2023, amid a gradual rise in labour supply.
Rising commodity prices fuel inflation
The repercussions of soaring energy prices are set
to keep HICP inflation above 2% throughout most
-10
-8
-6
-4
-2
0
2
4
6
8
14 15 16 17 18 19 20 21 22 23
Graph II.8.1: Italy - Real GDP growth and contributions
Net exports Investment
Priv. consumption Gov. consumption
Inventories Real GDP (y-o-y%)
forecastpps.
Following the rebound in the first half of 2021, real GDP is set to continue expanding, albeit
encountering some headwinds in the near term. Domestic demand, notably buoyant investment
spending, is expected to underpin growth. Government deficit and debt are projected to decline as a
share of GDP thanks to the economic recovery. Commodity price pressures are set to push inflation
above 2% next year.

Euro Area Member States, Italy
81
of 2022. Subsequently, negative base effects due to
abating price pressures on energy markets are
partly offset by a gradual pick-up in wage growth.
HICP inflation is projected to slow to 1.4% in
2023. By contrast, core inflation is forecast to rise
gradually over the forecast horizon.
Public finances recuperate with the economic
recovery
After widening to 9.6% of GDP in 2020, the
government headline deficit is expected to
marginally decrease to 9.4% of GDP in 2021.
Following the measures included in the 2021
budget, with a deficit-increasing impact of around
1.4% of GDP in 2021, several additional fiscal
packages were adopted this year, overall
amounting to around 4% of GDP. Main measures
include the prolongation of emergency job
retention schemes, financial support to the
corporate sector, as well as compensations for the
increase in energy prices. The rebound in
economic activity is expected to have boosted
government revenues, broadly compensating the
spending increase related to the policy measures.
The general government deficit is projected to
decline to 5.8% of GDP in 2022, driven by the
economic recovery and the gradual phasing out of
government’s emergency fiscal measures. At the
same time, new measures announced in the 2022
draft budgetary plan are expected to weigh on the
government deficit. Overall, they amount to 1.2%
of GDP and include resources for a reduction of
personal income taxes, renewed tax incentives for
business investment, public contributions
compensating for the increase of energy bills.
Additional funds are allocated to healthcare,
including for the purchase of COVID-19 vaccines,
and for public investments. The measures include
also an increase of the coverage of short-term work
schemes, increased flexibility for early retirement,
and additional resources for the reform of the
citizenship income. In 2023, the government
deficit is forecast to narrow to 4.3% of GDP. The
government primary balance is projected to remain
negative over 2021-2023, while interest
expenditure is set to steadily decline as a share of
GDP in light of favourable financing conditions.
The forecast also incorporates expenditures
financed by RRF grants, set to gradually increase
from 0.3% of GDP in 2021 to 1% of GDP in 2023.
The government debt-to-GDP ratio is set to decline
from 155.6% in 2020 to 151.0% in 2023, thanks to
the economic recovery and a favourable stock-flow
adjustment.
bn EUR Curr. prices % GDP 02-17 2018 2019 2020 2021 2022 2023
1653.6 100.0 0.0 0.9 0.4 -8.9 6.2 4.3 2.3
956.4 57.8 0.2 0.9 0.2 -10.7 5.3 4.8 2.0
345.4 20.9 0.0 0.1 -0.5 1.9 1.3 1.2 1.0
293.8 17.8 -0.9 3.1 0.7 -9.2 15.8 5.9 5.6
105.1 6.4 -0.1 4.5 -0.9 -15.1 15.8 5.4 5.2
485.9 29.4 1.8 2.1 1.6 -14.0 12.8 7.5 5.1
424.9 25.7 1.5 3.4 -0.6 -12.9 13.7 8.5 5.9
1673.9 101.2 0.1 1.5 0.2 -8.6 6.2 4.2 2.3
-0.1 1.1 0.2 -7.7 6.2 4.2 2.4
0.0 0.1 -0.4 -0.4 -0.2 0.2 0.0
0.1 -0.3 0.7 -0.8 0.2 -0.1 -0.1
0.0 0.8 0.1 -10.3 5.9 4.0 2.0
9.3 10.6 10.0 9.2 9.8 9.3 9.2
2.0 2.0 1.8 2.8 0.7 1.5 1.1
2.0 1.8 1.5 1.3 0.3 1.2 0.8
0.2 0.8 0.6 0.1 -0.8 -0.2 -0.6
12.5 10.1 10.0 17.4 15.2 11.4 10.1
1.8 1.1 0.9 1.2 1.1 1.5 1.4
1.8 1.2 0.6 -0.1 1.8 2.1 1.4
0.0 -1.2 1.5 4.6 -3.2 -2.0 0.5
1.0 2.6 3.4 4.1 3.7 2.6 2.5
-0.4 2.5 3.2 3.8 3.5 2.7 2.7
-0.4 2.5 3.1 3.7 3.4 2.7 2.7
-3.1 -2.2 -1.5 -9.6 -9.4 -5.8 -4.3
-2.8 -2.3 -1.9 -4.9 -7.6 -5.6 -4.7
-1.2 -2.4 -2.0 -5.0 -8.0 -5.9 -4.9
118.4 134.4 134.3 155.6 154.4 151.4 151.0
General government balance (c)
Cyclically-adjusted budget balance (d)
Structural budget balance (d)
General government gross debt (c)
(a) Eurostat definition. (b) gross saving divided by adjusted gross disposable income. (c) as a % of GDP. (d) as a % of potential GDP.
Net lending (+) or borrowing (-) vis-a-vis ROW (c)
Employment
Unemployment rate (a)
Compensation of employees / head
Unit labour costs whole economy
Real unit labour cost
Saving rate of households (b)
GDP deflator
Harmonised index of consumer prices
Terms of trade goods
Trade balance (goods) (c)
Current-account balance (c)
Contribution to GDP growth: Domestic demand
Inventories
Net exports
GNI (GDP deflator)
Table II.8.1:
Main features of country forecast - ITALY
2020 Annual percentage change
GDP
Private Consumption
Public Consumption
Gross fixed capital formation
of which: equipment
Exports (goods and services)
Imports (goods and services)
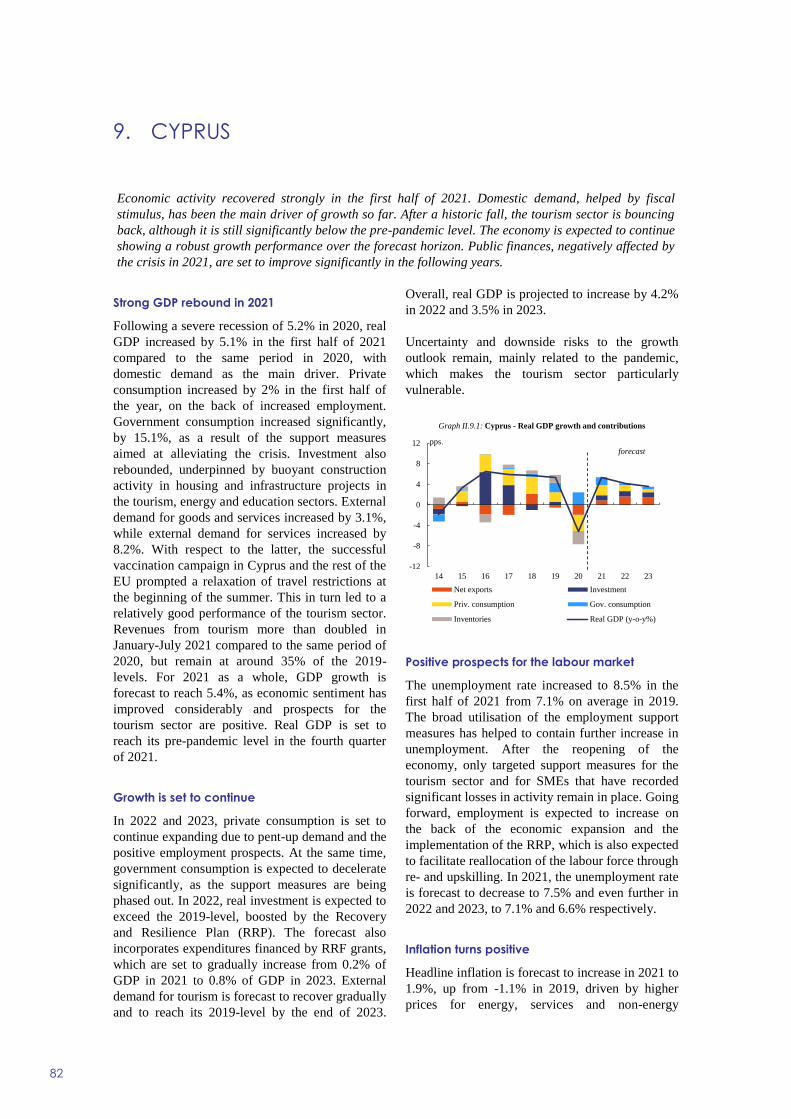
9. CYPRUS
82
Strong GDP rebound in 2021
Following a severe recession of 5.2% in 2020, real
GDP increased by 5.1% in the first half of 2021
compared to the same period in 2020, with
domestic demand as the main driver. Private
consumption increased by 2% in the first half of
the year, on the back of increased employment.
Government consumption increased significantly,
by 15.1%, as a result of the support measures
aimed at alleviating the crisis. Investment also
rebounded, underpinned by buoyant construction
activity in housing and infrastructure projects in
the tourism, energy and education sectors. External
demand for goods and services increased by 3.1%,
while external demand for services increased by
8.2%. With respect to the latter, the successful
vaccination campaign in Cyprus and the rest of the
EU prompted a relaxation of travel restrictions at
the beginning of the summer. This in turn led to a
relatively good performance of the tourism sector.
Revenues from tourism more than doubled in
January-July 2021 compared to the same period of
2020, but remain at around 35% of the 2019-
levels. For 2021 as a whole, GDP growth is
forecast to reach 5.4%, as economic sentiment has
improved considerably and prospects for the
tourism sector are positive. Real GDP is set to
reach its pre-pandemic level in the fourth quarter
of 2021.
Growth is set to continue
In 2022 and 2023, private consumption is set to
continue expanding due to pent-up demand and the
positive employment prospects. At the same time,
government consumption is expected to decelerate
significantly, as the support measures are being
phased out. In 2022, real investment is expected to
exceed the 2019-level, boosted by the Recovery
and Resilience Plan (RRP). The forecast also
incorporates expenditures financed by RRF grants,
which are set to gradually increase from 0.2% of
GDP in 2021 to 0.8% of GDP in 2023. External
demand for tourism is forecast to recover gradually
and to reach its 2019-level by the end of 2023.
Overall, real GDP is projected to increase by 4.2%
in 2022 and 3.5% in 2023.
Uncertainty and downside risks to the growth
outlook remain, mainly related to the pandemic,
which makes the tourism sector particularly
vulnerable.
Positive prospects for the labour market
The unemployment rate increased to 8.5% in the
first half of 2021 from 7.1% on average in 2019.
The broad utilisation of the employment support
measures has helped to contain further increase in
unemployment. After the reopening of the
economy, only targeted support measures for the
tourism sector and for SMEs that have recorded
significant losses in activity remain in place. Going
forward, employment is expected to increase on
the back of the economic expansion and the
implementation of the RRP, which is also expected
to facilitate reallocation of the labour force through
re- and upskilling. In 2021, the unemployment rate
is forecast to decrease to 7.5% and even further in
2022 and 2023, to 7.1% and 6.6% respectively.
Inflation turns positive
Headline inflation is forecast to increase in 2021 to
1.9%, up from -1.1% in 2019, driven by higher
prices for energy, services and non-energy
-12
-8
-4
0
4
8
12
14 15 16 17 18 19 20 21 22 23
Graph II.9.1: Cyprus - Real GDP growth and contributions
Net exports Investment
Priv. consumption Gov. consumption
Inventories Real GDP (y-o-y%)
forecast
pps.
Economic activity recovered strongly in the first half of 2021. Domestic demand, helped by fiscal
stimulus, has been the main driver of growth so far. After a historic fall, the tourism sector is bouncing
back, although it is still significantly below the pre-pandemic level. The economy is expected to continue
showing a robust growth performance over the forecast horizon. Public finances, negatively affected by
the crisis in 2021, are set to improve significantly in the following years.

Euro Area Member States, Cyprus
83
industrial goods. Inflation is expected to slightly
decelerate in 2022 to 1.7% and to subside to 1.2%
in 2023 mainly due to the expected normalisation
of energy prices.
Government deficit and public debt to decline
The general government deficit is expected to
decrease to 4.9% in 2021. Government expenditure
is forecast to grow by 7.4% in 2021. This is mainly
driven by the increased social payments related to
the roll-out of the second phase of the National
Health System (NHS) reform. In addition, three
supplementary budgets have been approved in the
second half of the year, which include among
others the extension of COVID-19 measures, such
as support schemes related to the health sector,
wage subsidisation and liquidity support to
businesses. These effects are projected to be more
than offset by a revenue growth of 9.6% in 2021,
mainly on the back of higher revenue from taxes
driven by the economic recovery, and increased
social contributions resulting from higher
contribution rates in the context of NHS. The
deficit is forecast to decline to 1.4% of GDP in
2022 and 0.9% in 2023, helped by the continuing
economic expansion and the withdrawal of
COVID-19 measures. In particular, government
revenue is expected to continue to increase by
4.5% in 2022 and 3.7% in 2023.
The realisation of contingent liabilities, the fiscal
sustainability of the NHS, as well as the fiscal
impact of the envisaged expansion of KEDIPES,
the state-owned asset management company,
represent the main risks to the fiscal outlook.
After reaching a peak of 115.3% of GDP in 2020,
public debt is set to decrease to 104.1% of GDP
this year on the back of high nominal GDP growth
and of the use of cash reserves accumulated in the
previous year. The debt-to-GDP ratio is projected
to decline further to 97.6% and 93.4% in 2022 and
2023, respectively.
mio EUR Curr. prices % GDP 02-17 2018 2019 2020 2021 2022 2023
21548.4 100.0 2.1 5.7 5.3 -5.2 5.4 4.2 3.5
13725.1 63.7 2.4 5.1 3.0 -5.0 3.1 1.9 1.0
4303.8 20.0 1.6 3.6 12.7 15.0 7.6 1.6 2.4
4308.3 20.0 2.6 -4.9 2.9 0.0 5.2 4.9 4.8
1204.8 5.6 4.6 -37.1 -15.4 15.4 4.6 6.3 7.0
16382.2 76.0 3.0 7.3 7.5 -5.1 6.2 7.4 6.8
16927.8 78.6 3.5 4.3 8.3 -2.5 4.9 5.1 4.9
20267.1 94.1 2.3 5.0 4.1 -6.5 6.4 4.7 3.7
2.5 2.9 4.3 -0.7 4.5 2.6 2.1
0.1 0.7 1.5 -2.6 0.0 0.0 0.0
-0.4 2.2 -0.5 -1.9 0.8 1.6 1.4
1.5 5.3 3.8 -0.6 1.2 2.2 2.3
8.3 8.4 7.1 7.6 7.5 7.1 6.6
1.9 1.5 4.4 -3.1 2.5 2.7 2.4
1.3 1.1 2.9 1.6 -1.6 0.8 1.2
-0.2 0.1 1.8 2.9 -3.9 -0.8 0.2
3.5 3.3 5.7 8.0 7.1 6.8 8.1
1.6 1.0 1.1 -1.2 2.4 1.6 1.0
1.7 0.8 0.5 -1.1 1.9 1.7 1.2
0.6 -1.4 -0.3 -0.8 0.0 0.0 0.0
-22.9 -21.0 -20.1 -19.3 -20.9 -22.4 -24.0
-8.5 -3.9 -5.7 -10.1 -9.1 -7.3 -5.7
-8.1 -3.3 -5.6 -10.0 -9.1 -7.2 -5.6
-3.0 -3.5 1.3 -5.7 -4.9 -1.4 -0.9
-2.8 -5.3 -1.6 -4.4 -4.7 -1.8 -1.5
2.5 2.5 -0.3 -4.4 -4.8 -1.8 -1.5
74.0 98.4 91.1 115.3 104.1 97.6 93.4
General government balance (c)
Cyclically-adjusted budget balance (d)
Structural budget balance (d)
General government gross debt (c)
(a) Eurostat definition. (b) gross saving divided by adjusted gross disposable income. (c) as a % of GDP. (d) as a % of potential GDP.
Net lending (+) or borrowing (-) vis-a-vis ROW (c)
Employment
Unemployment rate (a)
Compensation of employees / head
Unit labour costs whole economy
Real unit labour cost
Saving rate of households (b)
GDP deflator
Harmonised index of consumer prices
Terms of trade goods
Trade balance (goods) (c)
Current-account balance (c)
Contribution to GDP growth: Domestic demand
Inventories
Net exports
GNI (GDP deflator)
Table II.9.1:
Main features of country forecast - CYPRUS
2020 Annual percentage change
GDP
Private Consumption
Public Consumption
Gross fixed capital formation
of which: equipment
Exports (goods and services)
Imports (goods and services)
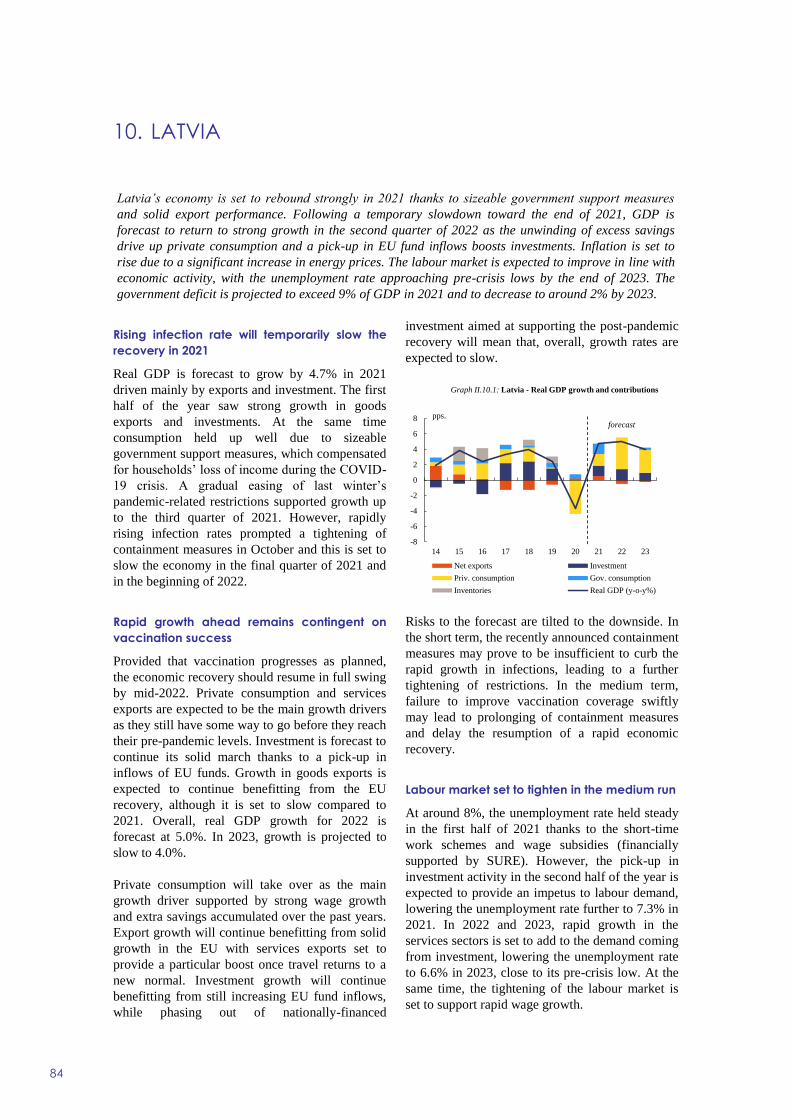
10. LATVIA
84
Rising infection rate will temporarily slow the
recovery in 2021
Real GDP is forecast to grow by 4.7% in 2021
driven mainly by exports and investment. The first
half of the year saw strong growth in goods
exports and investments. At the same time
consumption held up well due to sizeable
government support measures, which compensated
for households’ loss of income during the COVID-
19 crisis. A gradual easing of last winter’s
pandemic-related restrictions supported growth up
to the third quarter of 2021. However, rapidly
rising infection rates prompted a tightening of
containment measures in October and this is set to
slow the economy in the final quarter of 2021 and
in the beginning of 2022.
Rapid growth ahead remains contingent on
vaccination success
Provided that vaccination progresses as planned,
the economic recovery should resume in full swing
by mid-2022. Private consumption and services
exports are expected to be the main growth drivers
as they still have some way to go before they reach
their pre-pandemic levels. Investment is forecast to
continue its solid march thanks to a pick-up in
inflows of EU funds. Growth in goods exports is
expected to continue benefitting from the EU
recovery, although it is set to slow compared to
2021. Overall, real GDP growth for 2022 is
forecast at 5.0%. In 2023, growth is projected to
slow to 4.0%.
Private consumption will take over as the main
growth driver supported by strong wage growth
and extra savings accumulated over the past years.
Export growth will continue benefitting from solid
growth in the EU with services exports set to
provide a particular boost once travel returns to a
new normal. Investment growth will continue
benefitting from still increasing EU fund inflows,
while phasing out of nationally-financed
investment aimed at supporting the post-pandemic
recovery will mean that, overall, growth rates are
expected to slow.
Risks to the forecast are tilted to the downside. In
the short term, the recently announced containment
measures may prove to be insufficient to curb the
rapid growth in infections, leading to a further
tightening of restrictions. In the medium term,
failure to improve vaccination coverage swiftly
may lead to prolonging of containment measures
and delay the resumption of a rapid economic
recovery.
Labour market set to tighten in the medium run
At around 8%, the unemployment rate held steady
in the first half of 2021 thanks to the short-time
work schemes and wage subsidies (financially
supported by SURE). However, the pick-up in
investment activity in the second half of the year is
expected to provide an impetus to labour demand,
lowering the unemployment rate further to 7.3% in
2021. In 2022 and 2023, rapid growth in the
services sectors is set to add to the demand coming
from investment, lowering the unemployment rate
to 6.6% in 2023, close to its pre-crisis low. At the
same time, the tightening of the labour market is
set to support rapid wage growth.
-8
-6
-4
-2
0
2
4
6
8
14 15 16 17 18 19 20 21 22 23
Graph II.10.1: Latvia - Real GDP growth and contributions
Net exports Investment
Priv. consumption Gov. consumption
Inventories Real GDP (y-o-y%)
forecastpps.
Latvia’s economy is set to rebound strongly in 2021 thanks to sizeable government support measures
and solid export performance. Following a temporary slowdown toward the end of 2021, GDP is
forecast to return to strong growth in the second quarter of 2022 as the unwinding of excess savings
drive up private consumption and a pick-up in EU fund inflows boosts investments. Inflation is set to
rise due to a significant increase in energy prices. The labour market is expected to improve in line with
economic activity, with the unemployment rate approaching pre-crisis lows by the end of 2023. The
government deficit is projected to exceed 9% of GDP in 2021 and to decrease to around 2% by 2023.

Euro Area Member States, Latvia
85
Inflation expected to pick-up considerably
Consumer price inflation is set to reach 3.1% in
2021, driven by rapid energy price increases. The
spike in energy prices in the second half of 2021 is
set to carry over to next year, translating into 3.6%
growth in the HICP in 2022. In 2023, inflation is
forecast to slow to around 1% as energy prices
reverse.
Fiscal support continues in 2022
In 2021, the government deficit is projected to
reach 9.5% of GDP, mostly as a result of sizeable
support measures of close to 5% of GDP. The first
round of support measures was adopted in late
2020 and most of them expired by June 2021. The
second round of support measures was adopted in
October 2021 in response to the re-introduction of
pandemic restrictions. The measures included
income support to the households and businesses
most severely affected by restrictions, a step-up in
public investment, as well as an increase in
spending in the healthcare sector.
In 2022, the deficit is projected to decrease to
4.2% of GDP. While the bulk of the temporary
support introduced in 2020 and 2021 is set to end,
the 2022 budget includes additional measures
amounting to around 2% of GDP. The main
measures for 2022 are an increase in non-taxable
income tax allowance and increases in wages to
healthcare and social workers as well as teachers.
The budget also contains a sizeable investment
package aimed at supporting the economic
recovery. In 2023, the budget is forecast to reach
balance under the no-policy-change scenario
thanks to solid growth in tax revenue and the
expiry of the support measures adopted for 2022.
The forecast also incorporates expenditures
financed by RRF grants, which are set to gradually
increase from 0.1% of GDP in 2021 to 0.8% of
GDP in 2023. The total EU fund inflows are
expected to peak in 2023 at 3.3% of GDP.
The government debt-to-GDP ratio is expected to
reach 48.2% in 2021 and to increase further to
50.7% in 2022 before declining in 2023.
mio EUR Curr. prices % GDP 02-17 2018 2019 2020 2021 2022 2023
29511.0 100.0 3.4 4.0 2.5 -3.6 4.7 5.0 4.0
16597.0 56.2 3.7 3.0 0.2 -7.6 2.7 7.5 5.2
5970.7 20.2 1.4 1.7 3.4 2.6 6.6 -0.6 1.5
7217.0 24.5 2.5 11.8 6.9 0.2 5.5 5.8 3.8
2680.3 9.1 2.2 3.9 14.5 -2.0 6.9 4.3 4.4
17803.2 60.3 6.8 4.5 2.1 -2.2 6.6 4.9 3.8
17457.2 59.2 5.7 6.4 3.0 -2.5 5.8 5.5 4.1
29503.6 100.0 3.3 2.6 2.6 -2.2 3.6 4.9 3.9
3.7 4.5 2.3 -3.8 4.2 5.4 4.2
0.3 0.7 0.8 0.0 0.0 0.0 0.0
-0.4 -1.3 -0.6 0.2 0.5 -0.4 -0.2
-0.4 1.5 -0.1 -2.3 1.2 0.5 0.3
11.6 7.4 6.3 8.1 7.3 6.9 6.6
9.5 8.1 7.8 5.5 7.1 5.0 6.7
5.6 5.4 5.1 6.9 3.4 0.4 2.9
0.7 1.5 2.5 7.0 -0.1 -2.4 0.8
3.6 6.8 8.9 17.0 20.9 14.8 14.7
4.8 3.9 2.6 -0.1 3.5 2.9 2.0
3.8 2.6 2.7 0.1 3.1 3.6 0.8
0.9 1.6 0.9 3.2 -1.8 -1.9 -1.4
-15.0 -8.6 -8.6 -5.0 -5.8 -7.3 -8.5
-5.8 -0.2 -0.7 2.9 1.1 -0.2 -1.1
-4.0 1.6 0.8 4.7 3.2 2.5 1.9
-2.5 -0.8 -0.6 -4.5 -9.5 -4.2 -2.0
-2.5 -2.0 -1.4 -3.0 -8.6 -4.0 -2.1
-1.3 -2.0 -1.4 -3.1 -8.6 -4.0 -2.1
28.8 37.1 36.7 43.2 48.2 50.7 49.8
General government balance (c)
Cyclically-adjusted budget balance (d)
Structural budget balance (d)
General government gross debt (c)
(a) Eurostat definition. (b) gross saving divided by adjusted gross disposable income. (c) as a % of GDP. (d) as a % of potential GDP.
Net lending (+) or borrowing (-) vis-a-vis ROW (c)
Employment
Unemployment rate (a)
Compensation of employees / head
Unit labour costs whole economy
Real unit labour cost
Saving rate of households (b)
GDP deflator
Harmonised index of consumer prices
Terms of trade goods
Trade balance (goods) (c)
Current-account balance (c)
Contribution to GDP growth: Domestic demand
Inventories
Net exports
GNI (GDP deflator)
Table II.10.1:
Main features of country forecast - LATVIA
2020 Annual percentage change
GDP
Private Consumption
Public Consumption
Gross fixed capital formation
of which: equipment
Exports (goods and services)
Imports (goods and services)
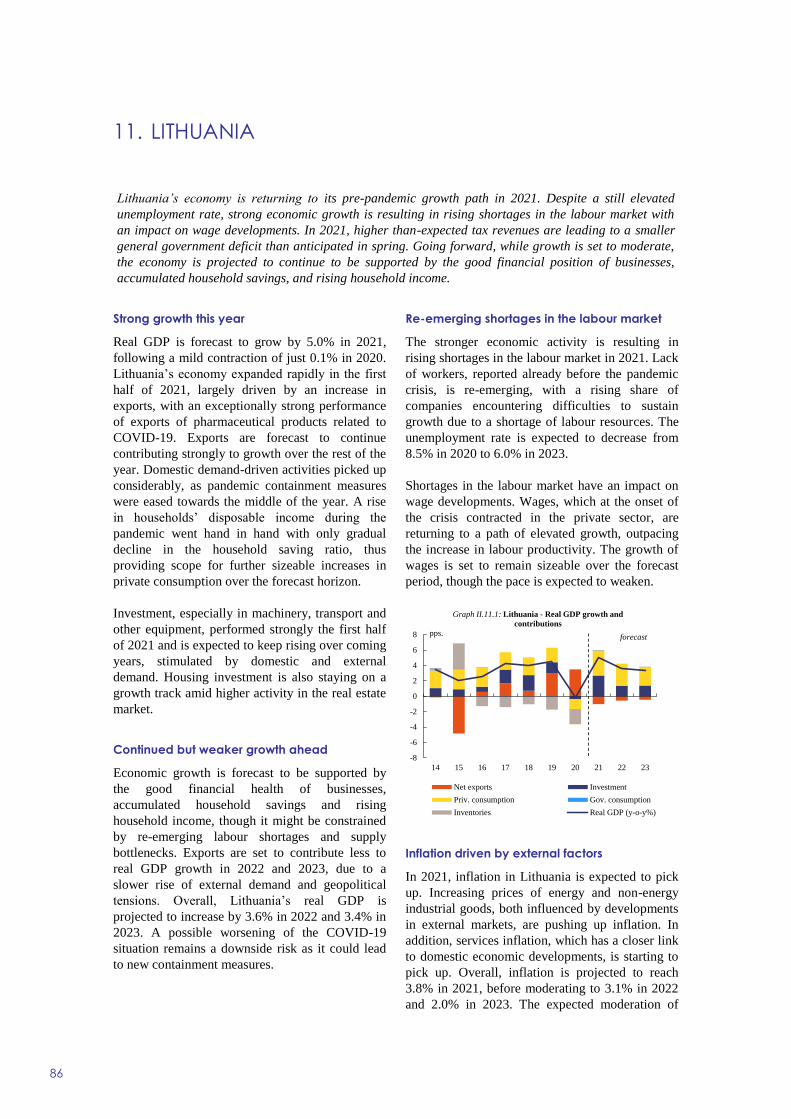
11. LITHUANIA
86
Strong growth this year
Real GDP is forecast to grow by 5.0% in 2021,
following a mild contraction of just 0.1% in 2020.
Lithuania’s economy expanded rapidly in the first
half of 2021, largely driven by an increase in
exports, with an exceptionally strong performance
of exports of pharmaceutical products related to
COVID-19. Exports are forecast to continue
contributing strongly to growth over the rest of the
year. Domestic demand-driven activities picked up
considerably, as pandemic containment measures
were eased towards the middle of the year. A rise
in households’ disposable income during the
pandemic went hand in hand with only gradual
decline in the household saving ratio, thus
providing scope for further sizeable increases in
private consumption over the forecast horizon.
Investment, especially in machinery, transport and
other equipment, performed strongly the first half
of 2021 and is expected to keep rising over coming
years, stimulated by domestic and external
demand. Housing investment is also staying on a
growth track amid higher activity in the real estate
market.
Continued but weaker growth ahead
Economic growth is forecast to be supported by
the good financial health of businesses,
accumulated household savings and rising
household income, though it might be constrained
by re-emerging labour shortages and supply
bottlenecks. Exports are set to contribute less to
real GDP growth in 2022 and 2023, due to a
slower rise of external demand and geopolitical
tensions. Overall, Lithuania’s real GDP is
projected to increase by 3.6% in 2022 and 3.4% in
2023. A possible worsening of the COVID-19
situation remains a downside risk as it could lead
to new containment measures.
Re-emerging shortages in the labour market
The stronger economic activity is resulting in
rising shortages in the labour market in 2021. Lack
of workers, reported already before the pandemic
crisis, is re-emerging, with a rising share of
companies encountering difficulties to sustain
growth due to a shortage of labour resources. The
unemployment rate is expected to decrease from
8.5% in 2020 to 6.0% in 2023.
Shortages in the labour market have an impact on
wage developments. Wages, which at the onset of
the crisis contracted in the private sector, are
returning to a path of elevated growth, outpacing
the increase in labour productivity. The growth of
wages is set to remain sizeable over the forecast
period, though the pace is expected to weaken.
Inflation driven by external factors
In 2021, inflation in Lithuania is expected to pick
up. Increasing prices of energy and non-energy
industrial goods, both influenced by developments
in external markets, are pushing up inflation. In
addition, services inflation, which has a closer link
to domestic economic developments, is starting to
pick up. Overall, inflation is projected to reach
3.8% in 2021, before moderating to 3.1% in 2022
and 2.0% in 2023. The expected moderation of
-8
-6
-4
-2
0
2
4
6
8
14 15 16 17 18 19 20 21 22 23
Graph II.11.1: Lithuania - Real GDP growth and
contributions
Net exports Investment
Priv. consumption Gov. consumption
Inventories Real GDP (y-o-y%)
forecastpps.
Lithuania’s economy is returning to its pre-pandemic growth path in 2021. Despite a still elevated
unemployment rate, strong economic growth is resulting in rising shortages in the labour market with
an impact on wage developments. In 2021, higher than-expected tax revenues are leading to a smaller
general government deficit than anticipated in spring. Going forward, while growth is set to moderate,
the economy is projected to continue to be supported by the good financial position of businesses,
accumulated household savings, and rising household income.
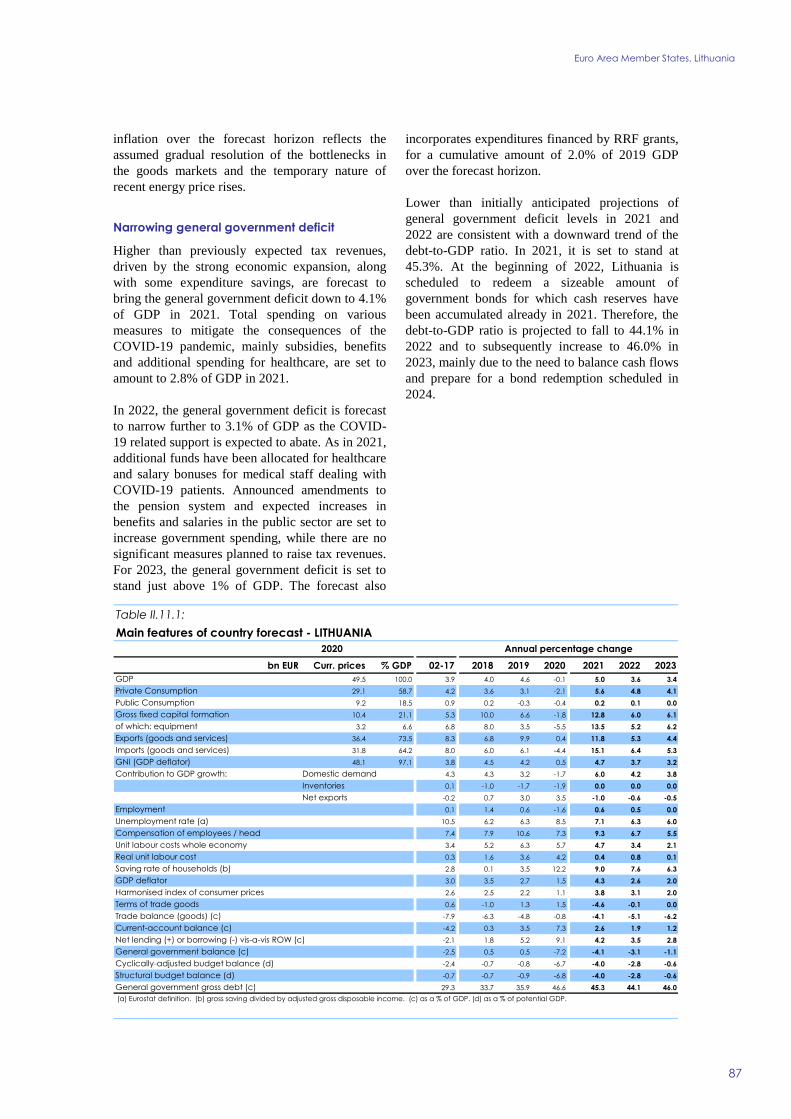
Euro Area Member States, Lithuania
87
inflation over the forecast horizon reflects the
assumed gradual resolution of the bottlenecks in
the goods markets and the temporary nature of
recent energy price rises.
Narrowing general government deficit
Higher than previously expected tax revenues,
driven by the strong economic expansion, along
with some expenditure savings, are forecast to
bring the general government deficit down to 4.1%
of GDP in 2021. Total spending on various
measures to mitigate the consequences of the
COVID-19 pandemic, mainly subsidies, benefits
and additional spending for healthcare, are set to
amount to 2.8% of GDP in 2021.
In 2022, the general government deficit is forecast
to narrow further to 3.1% of GDP as the COVID-
19 related support is expected to abate. As in 2021,
additional funds have been allocated for healthcare
and salary bonuses for medical staff dealing with
COVID-19 patients. Announced amendments to
the pension system and expected increases in
benefits and salaries in the public sector are set to
increase government spending, while there are no
significant measures planned to raise tax revenues.
For 2023, the general government deficit is set to
stand just above 1% of GDP. The forecast also
incorporates expenditures financed by RRF grants,
for a cumulative amount of 2.0% of 2019 GDP
over the forecast horizon.
Lower than initially anticipated projections of
general government deficit levels in 2021 and
2022 are consistent with a downward trend of the
debt-to-GDP ratio. In 2021, it is set to stand at
45.3%. At the beginning of 2022, Lithuania is
scheduled to redeem a sizeable amount of
government bonds for which cash reserves have
been accumulated already in 2021. Therefore, the
debt-to-GDP ratio is projected to fall to 44.1% in
2022 and to subsequently increase to 46.0% in
2023, mainly due to the need to balance cash flows
and prepare for a bond redemption scheduled in
2024.
bn EUR Curr. prices % GDP 02-17 2018 2019 2020 2021 2022 2023
49.5 100.0 3.9 4.0 4.6 -0.1 5.0 3.6 3.4
29.1 58.7 4.2 3.6 3.1 -2.1 5.6 4.8 4.1
9.2 18.5 0.9 0.2 -0.3 -0.4 0.2 0.1 0.0
10.4 21.1 5.3 10.0 6.6 -1.8 12.8 6.0 6.1
3.2 6.6 6.8 8.0 3.5 -5.5 13.5 5.2 6.2
36.4 73.5 8.3 6.8 9.9 0.4 11.8 5.3 4.4
31.8 64.2 8.0 6.0 6.1 -4.4 15.1 6.4 5.3
48.1 97.1 3.8 4.5 4.2 0.5 4.7 3.7 3.2
4.3 4.3 3.2 -1.7 6.0 4.2 3.8
0.1 -1.0 -1.7 -1.9 0.0 0.0 0.0
-0.2 0.7 3.0 3.5 -1.0 -0.6 -0.5
0.1 1.4 0.6 -1.6 0.6 0.5 0.0
10.5 6.2 6.3 8.5 7.1 6.3 6.0
7.4 7.9 10.6 7.3 9.3 6.7 5.5
3.4 5.2 6.3 5.7 4.7 3.4 2.1
0.3 1.6 3.6 4.2 0.4 0.8 0.1
2.8 0.1 3.5 12.2 9.0 7.6 6.3
3.0 3.5 2.7 1.5 4.3 2.6 2.0
2.6 2.5 2.2 1.1 3.8 3.1 2.0
0.6 -1.0 1.3 1.5 -4.6 -0.1 0.0
-7.9 -6.3 -4.8 -0.8 -4.1 -5.1 -6.2
-4.2 0.3 3.5 7.3 2.6 1.9 1.2
-2.1 1.8 5.2 9.1 4.2 3.5 2.8
-2.5 0.5 0.5 -7.2 -4.1 -3.1 -1.1
-2.4 -0.7 -0.8 -6.7 -4.0 -2.8 -0.6
-0.7 -0.7 -0.9 -6.8 -4.0 -2.8 -0.6
29.3 33.7 35.9 46.6 45.3 44.1 46.0
General government balance (c)
Cyclically-adjusted budget balance (d)
Structural budget balance (d)
General government gross debt (c)
(a) Eurostat definition. (b) gross saving divided by adjusted gross disposable income. (c) as a % of GDP. (d) as a % of potential GDP.
Net lending (+) or borrowing (-) vis-a-vis ROW (c)
Employment
Unemployment rate (a)
Compensation of employees / head
Unit labour costs whole economy
Real unit labour cost
Saving rate of households (b)
GDP deflator
Harmonised index of consumer prices
Terms of trade goods
Trade balance (goods) (c)
Current-account balance (c)
Contribution to GDP growth: Domestic demand
Inventories
Net exports
GNI (GDP deflator)
Table II.11.1:
Main features of country forecast - LITHUANIA
2020 Annual percentage change
GDP
Private Consumption
Public Consumption
Gross fixed capital formation
of which: equipment
Exports (goods and services)
Imports (goods and services)
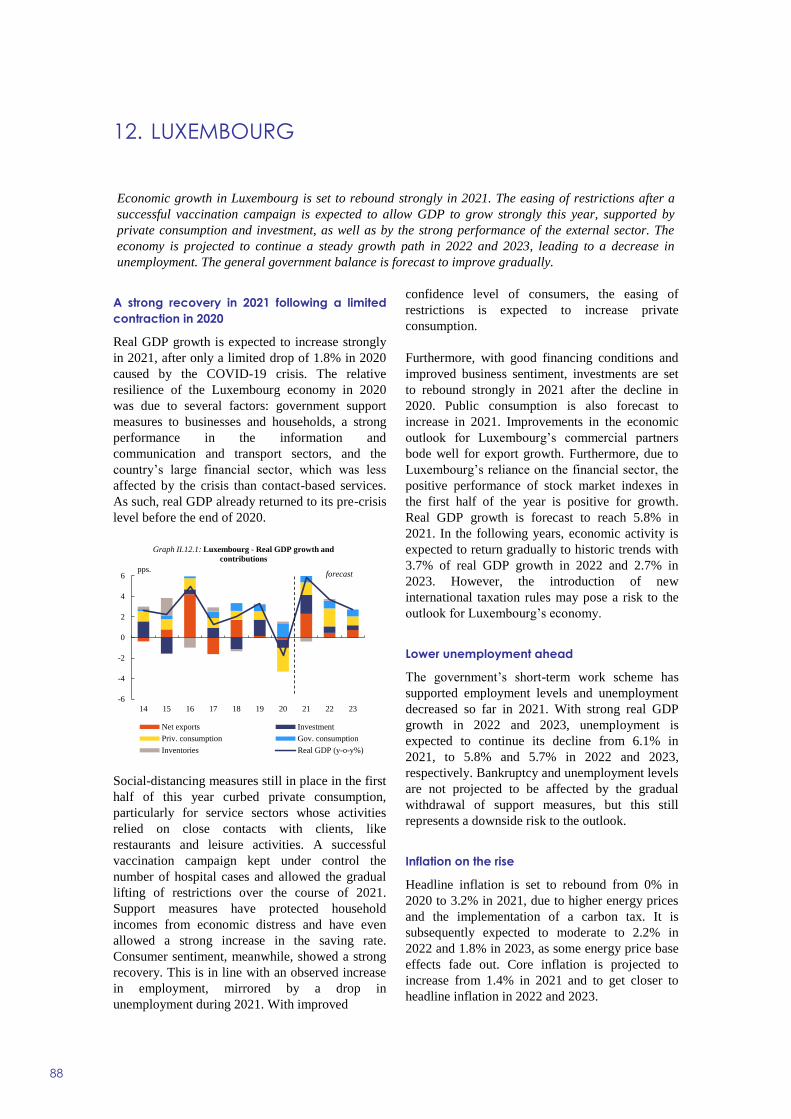
12. LUXEMBOURG
88
A strong recovery in 2021 following a limited
contraction in 2020
Real GDP growth is expected to increase strongly
in 2021, after only a limited drop of 1.8% in 2020
caused by the COVID-19 crisis. The relative
resilience of the Luxembourg economy in 2020
was due to several factors: government support
measures to businesses and households, a strong
performance in the information and
communication and transport sectors, and the
country’s large financial sector, which was less
affected by the crisis than contact-based services.
As such, real GDP already returned to its pre-crisis
level before the end of 2020.
Social-distancing measures still in place in the first
half of this year curbed private consumption,
particularly for service sectors whose activities
relied on close contacts with clients, like
restaurants and leisure activities. A successful
vaccination campaign kept under control the
number of hospital cases and allowed the gradual
lifting of restrictions over the course of 2021.
Support measures have protected household
incomes from economic distress and have even
allowed a strong increase in the saving rate.
Consumer sentiment, meanwhile, showed a strong
recovery. This is in line with an observed increase
in employment, mirrored by a drop in
unemployment during 2021. With improved
confidence level of consumers, the easing of
restrictions is expected to increase private
consumption.
Furthermore, with good financing conditions and
improved business sentiment, investments are set
to rebound strongly in 2021 after the decline in
2020. Public consumption is also forecast to
increase in 2021. Improvements in the economic
outlook for Luxembourg’s commercial partners
bode well for export growth. Furthermore, due to
Luxembourg’s reliance on the financial sector, the
positive performance of stock market indexes in
the first half of the year is positive for growth.
Real GDP growth is forecast to reach 5.8% in
2021. In the following years, economic activity is
expected to return gradually to historic trends with
3.7% of real GDP growth in 2022 and 2.7% in
2023. However, the introduction of new
international taxation rules may pose a risk to the
outlook for Luxembourg’s economy.
Lower unemployment ahead
The government’s short-term work scheme has
supported employment levels and unemployment
decreased so far in 2021. With strong real GDP
growth in 2022 and 2023, unemployment is
expected to continue its decline from 6.1% in
2021, to 5.8% and 5.7% in 2022 and 2023,
respectively. Bankruptcy and unemployment levels
are not projected to be affected by the gradual
withdrawal of support measures, but this still
represents a downside risk to the outlook.
Inflation on the rise
Headline inflation is set to rebound from 0% in
2020 to 3.2% in 2021, due to higher energy prices
and the implementation of a carbon tax. It is
subsequently expected to moderate to 2.2% in
2022 and 1.8% in 2023, as some energy price base
effects fade out. Core inflation is projected to
increase from 1.4% in 2021 and to get closer to
headline inflation in 2022 and 2023.
-6
-4
-2
0
2
4
6
14 15 16 17 18 19 20 21 22 23
Graph II.12.1: Luxembourg - Real GDP growth and
contributions
Net exports Investment
Priv. consumption Gov. consumption
Inventories Real GDP (y-o-y%)
forecastpps.
Economic growth in Luxembourg is set to rebound strongly in 2021. The easing of restrictions after a
successful vaccination campaign is expected to allow GDP to grow strongly this year, supported by
private consumption and investment, as well as by the strong performance of the external sector. The
economy is projected to continue a steady growth path in 2022 and 2023, leading to a decrease in
unemployment. The general government balance is forecast to improve gradually.
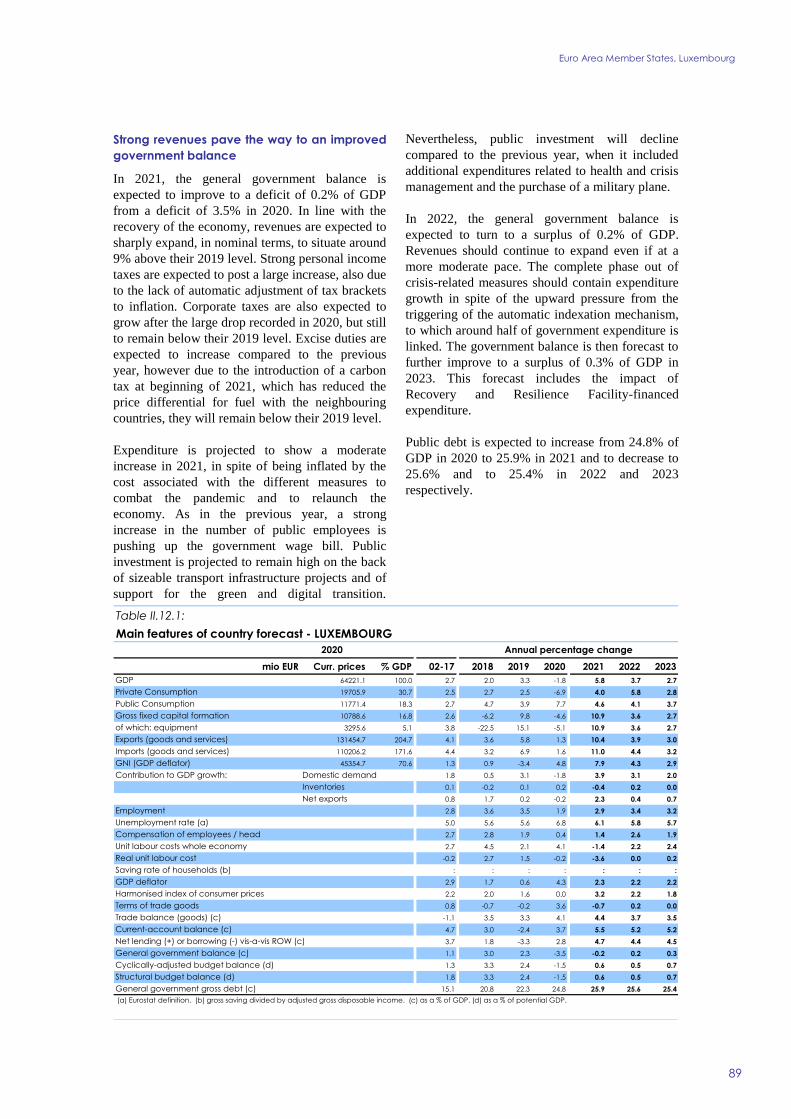
Euro Area Member States, Luxembourg
89
Strong revenues pave the way to an improved
government balance
In 2021, the general government balance is
expected to improve to a deficit of 0.2% of GDP
from a deficit of 3.5% in 2020. In line with the
recovery of the economy, revenues are expected to
sharply expand, in nominal terms, to situate around
9% above their 2019 level. Strong personal income
taxes are expected to post a large increase, also due
to the lack of automatic adjustment of tax brackets
to inflation. Corporate taxes are also expected to
grow after the large drop recorded in 2020, but still
to remain below their 2019 level. Excise duties are
expected to increase compared to the previous
year, however due to the introduction of a carbon
tax at beginning of 2021, which has reduced the
price differential for fuel with the neighbouring
countries, they will remain below their 2019 level.
Expenditure is projected to show a moderate
increase in 2021, in spite of being inflated by the
cost associated with the different measures to
combat the pandemic and to relaunch the
economy. As in the previous year, a strong
increase in the number of public employees is
pushing up the government wage bill. Public
investment is projected to remain high on the back
of sizeable transport infrastructure projects and of
support for the green and digital transition.
Nevertheless, public investment will decline
compared to the previous year, when it included
additional expenditures related to health and crisis
management and the purchase of a military plane.
In 2022, the general government balance is
expected to turn to a surplus of 0.2% of GDP.
Revenues should continue to expand even if at a
more moderate pace. The complete phase out of
crisis-related measures should contain expenditure
growth in spite of the upward pressure from the
triggering of the automatic indexation mechanism,
to which around half of government expenditure is
linked. The government balance is then forecast to
further improve to a surplus of 0.3% of GDP in
2023. This forecast includes the impact of
Recovery and Resilience Facility-financed
expenditure.
Public debt is expected to increase from 24.8% of
GDP in 2020 to 25.9% in 2021 and to decrease to
25.6% and to 25.4% in 2022 and 2023
respectively.
mio EUR Curr. prices % GDP 02-17 2018 2019 2020 2021 2022 2023
64221.1 100.0 2.7 2.0 3.3 -1.8 5.8 3.7 2.7
19705.9 30.7 2.5 2.7 2.5 -6.9 4.0 5.8 2.8
11771.4 18.3 2.7 4.7 3.9 7.7 4.6 4.1 3.7
10788.6 16.8 2.6 -6.2 9.8 -4.6 10.9 3.6 2.7
3295.6 5.1 3.8 -22.5 15.1 -5.1 10.9 3.6 2.7
131454.7 204.7 4.1 3.6 5.8 1.3 10.4 3.9 3.0
110206.2 171.6 4.4 3.2 6.9 1.6 11.0 4.4 3.2
45354.7 70.6 1.3 0.9 -3.4 4.8 7.9 4.3 2.9
1.8 0.5 3.1 -1.8 3.9 3.1 2.0
0.1 -0.2 0.1 0.2 -0.4 0.2 0.0
0.8 1.7 0.2 -0.2 2.3 0.4 0.7
2.8 3.6 3.5 1.9 2.9 3.4 3.2
5.0 5.6 5.6 6.8 6.1 5.8 5.7
2.7 2.8 1.9 0.4 1.4 2.6 1.9
2.7 4.5 2.1 4.1 -1.4 2.2 2.4
-0.2 2.7 1.5 -0.2 -3.6 0.0 0.2
: : : : : : :
2.9 1.7 0.6 4.3 2.3 2.2 2.2
2.2 2.0 1.6 0.0 3.2 2.2 1.8
0.8 -0.7 -0.2 3.6 -0.7 0.2 0.0
-1.1 3.5 3.3 4.1 4.4 3.7 3.5
4.7 3.0 -2.4 3.7 5.5 5.2 5.2
3.7 1.8 -3.3 2.8 4.7 4.4 4.5
1.1 3.0 2.3 -3.5 -0.2 0.2 0.3
1.3 3.3 2.4 -1.5 0.6 0.5 0.7
1.8 3.3 2.4 -1.5 0.6 0.5 0.7
15.1 20.8 22.3 24.8 25.9 25.6 25.4
GNI (GDP deflator)
Table II.12.1:
Main features of country forecast - LUXEMBOURG
2020 Annual percentage change
GDP
Private Consumption
Public Consumption
Gross fixed capital formation
of which: equipment
Exports (goods and services)
Imports (goods and services)
Contribution to GDP growth: Domestic demand
Inventories
Net exports
Net lending (+) or borrowing (-) vis-a-vis ROW (c)
Employment
Unemployment rate (a)
Compensation of employees / head
Unit labour costs whole economy
Real unit labour cost
Saving rate of households (b)
GDP deflator
Harmonised index of consumer prices
Terms of trade goods
Trade balance (goods) (c)
Current-account balance (c)
General government balance (c)
Cyclically-adjusted budget balance (d)
Structural budget balance (d)
General government gross debt (c)
(a) Eurostat definition. (b) gross saving divided by adjusted gross disposable income. (c) as a % of GDP. (d) as a % of potential GDP.

13. MALTA
90
Malta is on a path of robust recovery
After a deep fall in GDP in 2020 due to the
pressure of COVID-19 pandemic related
restrictions and to the drop in international
tourism, the Maltese economy is set to return on a
robust growth path.
In 2021, real GDP growth is forecast to reach
5.0%, mainly driven by domestic consumption and
investment. Tourism is set to gain some ground,
but to remain well below the 2019 level. Robust
government expenditure continues to support the
economy, including via public investment. In the
coming years, following the unfolding recovery in
the world economy, the growth contributions of
net exports and investment are projected to grow.
Growth is set to peak at 6.2% in 2022 when the
contribution of net exports is to become positive,
counting on further relaxation of international
travel requirements and a strong recovery in
tourism. The economy is projected to reach the
pre-crisis level in the second half of 2022. Further
on, growth is forecast to decrease to a still robust
4.8% in 2023.
With both exports and imports growing, the
current account balance is expected to remain
positive and increasing towards 2022 and 2023.
Potential consequences of the June 2021 decision
of the Financial Action Task Force (an inter-
governmental body against money laundering) to
add Malta to the list of jurisdictions under
increased monitoring represent a limited downside
risk.
The labour market further improves and labour
shortages emerge
The impact of the crisis on the labour market was
successfully countered by public support measures.
Employment grew by 2.7% in 2020, as the wage
support scheme also fostered regularisation in the
labour market. Employment is expected to
continue to increase over the forecast horizon,
although at a slower pace. The growth in
employment is most prominent in the public
sector, professional services, and construction.
This positive labour market dynamics have already
led to labour shortages being reported by firms in
the above and other sectors. However, shortages
are expected to relax gradually as of 2022, with
improving cross-border mobility. Malta’s
unemployment rate is set to gradually decrease
over the forecast horizon, from 4.3% in 2020 to
3.7% in 2023.
Inflation is expected to pick up moderately
HICP inflation is expected to reach 1.1% in 2021,
still being moderate and reflecting only to a limited
extent the recent increase in international energy
prices, given that large part of the country’s energy
purchases, such as natural gas for electricity
generation, are governed by medium-term
contracts. In 2022, inflation is set to rise to 1.6%
driven by growing domestic demand, demand for
tourism services and delayed effects of increased
energy prices that will start to materialise in the
second half of the year. As the pace of economic
growth persists into 2023, inflation is set to remain
broadly stable at about 1.5%.
-12
-8
-4
0
4
8
12
16
14 15 16 17 18 19 20 21 22 23
Graph II.13.1: Malta - Real GDP growth and contributions
Net exports Investment Priv. consumption
Gov. consumption Inventories Real GDP (y-o-y%)
forecastpps.
Malta’s economy is set to see a robust recovery in 2021 and to continue on a stable growth path in 2022
and 2023. Growth is expected to be driven by a recovery in domestic demand with the contribution of
net export turning positive in 2022 and 2023. Given the supportive fiscal policy stance, the general
government deficit is projected to widen further in 2021 before decreasing in the next two years
following robust economic growth and a winding-down of fiscal support measures.
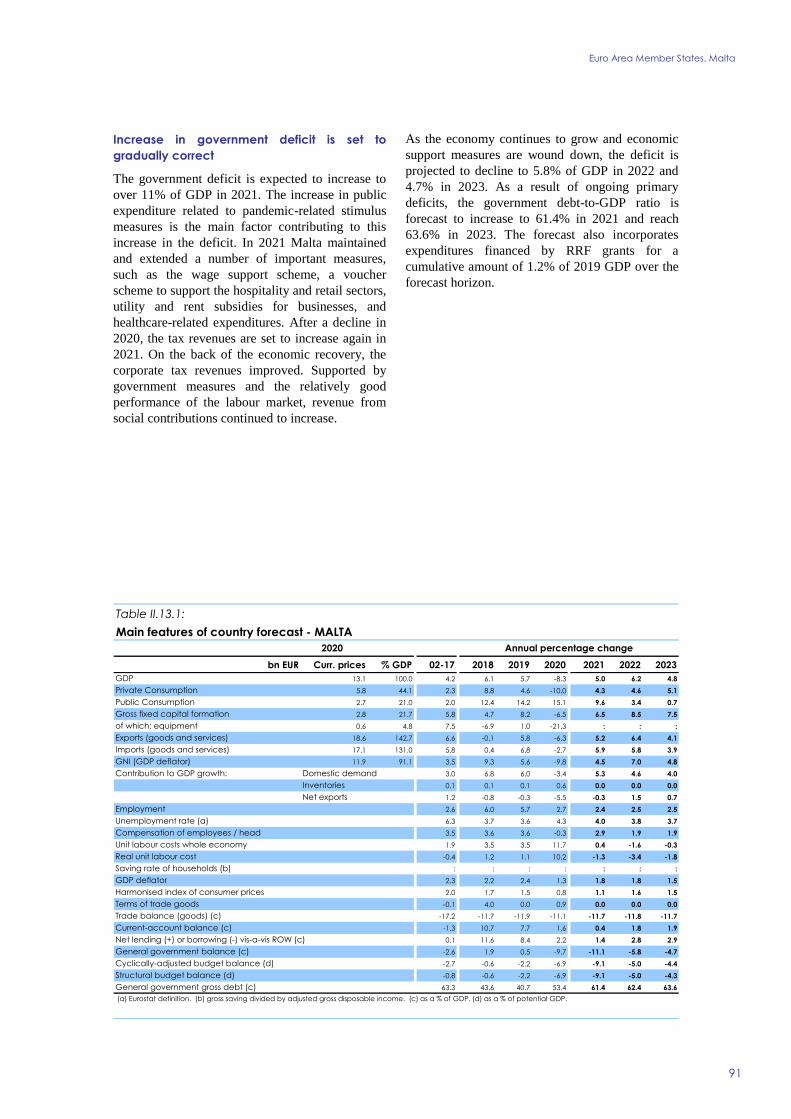
Euro Area Member States, Malta
91
Increase in government deficit is set to
gradually correct
The government deficit is expected to increase to
over 11% of GDP in 2021. The increase in public
expenditure related to pandemic-related stimulus
measures is the main factor contributing to this
increase in the deficit. In 2021 Malta maintained
and extended a number of important measures,
such as the wage support scheme, a voucher
scheme to support the hospitality and retail sectors,
utility and rent subsidies for businesses, and
healthcare-related expenditures. After a decline in
2020, the tax revenues are set to increase again in
2021. On the back of the economic recovery, the
corporate tax revenues improved. Supported by
government measures and the relatively good
performance of the labour market, revenue from
social contributions continued to increase.
As the economy continues to grow and economic
support measures are wound down, the deficit is
projected to decline to 5.8% of GDP in 2022 and
4.7% in 2023. As a result of ongoing primary
deficits, the government debt-to-GDP ratio is
forecast to increase to 61.4% in 2021 and reach
63.6% in 2023. The forecast also incorporates
expenditures financed by RRF grants for a
cumulative amount of 1.2% of 2019 GDP over the
forecast horizon.
bn EUR Curr. prices % GDP 02-17 2018 2019 2020 2021 2022 2023
13.1 100.0 4.2 6.1 5.7 -8.3 5.0 6.2 4.8
5.8 44.1 2.3 8.8 4.6 -10.0 4.3 4.6 5.1
2.7 21.0 2.0 12.4 14.2 15.1 9.6 3.4 0.7
2.8 21.7 5.8 4.7 8.2 -6.5 6.5 8.5 7.5
0.6 4.8 7.5 -6.9 1.0 -21.3 : : :
18.6 142.7 6.6 -0.1 5.8 -6.3 5.2 6.4 4.1
17.1 131.0 5.8 0.4 6.8 -2.7 5.9 5.8 3.9
11.9 91.1 3.5 9.3 5.6 -9.8 4.5 7.0 4.8
3.0 6.8 6.0 -3.4 5.3 4.6 4.0
0.1 0.1 0.1 0.6 0.0 0.0 0.0
1.2 -0.8 -0.3 -5.5 -0.3 1.5 0.7
2.6 6.0 5.7 2.7 2.4 2.5 2.5
6.3 3.7 3.6 4.3 4.0 3.8 3.7
3.5 3.6 3.6 -0.3 2.9 1.9 1.9
1.9 3.5 3.5 11.7 0.4 -1.6 -0.3
-0.4 1.2 1.1 10.2 -1.3 -3.4 -1.8
: : : : : : :
2.3 2.2 2.4 1.3 1.8 1.8 1.5
2.0 1.7 1.5 0.8 1.1 1.6 1.5
-0.1 4.0 0.0 0.9 0.0 0.0 0.0
-17.2 -11.7 -11.9 -11.1 -11.7 -11.8 -11.7
-1.3 10.7 7.7 1.6 0.4 1.8 1.9
0.1 11.6 8.4 2.2 1.4 2.8 2.9
-2.6 1.9 0.5 -9.7 -11.1 -5.8 -4.7
-2.7 -0.6 -2.2 -6.9 -9.1 -5.0 -4.4
-0.8 -0.6 -2.2 -6.9 -9.1 -5.0 -4.3
63.3 43.6 40.7 53.4 61.4 62.4 63.6
General government balance (c)
Cyclically-adjusted budget balance (d)
Structural budget balance (d)
General government gross debt (c)
(a) Eurostat definition. (b) gross saving divided by adjusted gross disposable income. (c) as a % of GDP. (d) as a % of potential GDP.
Net lending (+) or borrowing (-) vis-a-vis ROW (c)
Employment
Unemployment rate (a)
Compensation of employees / head
Unit labour costs whole economy
Real unit labour cost
Saving rate of households (b)
GDP deflator
Harmonised index of consumer prices
Terms of trade goods
Trade balance (goods) (c)
Current-account balance (c)
Contribution to GDP growth: Domestic demand
Inventories
Net exports
GNI (GDP deflator)
Table II.13.1:
Main features of country forecast - MALTA
2020 Annual percentage change
GDP
Private Consumption
Public Consumption
Gross fixed capital formation
of which: equipment
Exports (goods and services)
Imports (goods and services)

14. THE NETHERLANDS
92
A swift recovery
Containment measures dampened economic
activity at the start of 2021, with real GDP
contracting by 0.8% in the first quarter. The
gradual reopening of the economy, in the wake of
an improving health situation and increasing
vaccination rates, resulted in a strong rebound in
the second quarter with growth of 3.8% q-o-q. This
puts real GDP on track to reach the pre-pandemic
level in the third quarter. Growth is expected to
continue in the second half of the year, albeit at a
more moderate pace, leading to an annual real
GDP growth forecast of 4.0% in 2021. The
phasing out of government support measures as of
1 October is not expected to have a major effect on
the overall outlook.
The economic recovery in 2021 is forecast to be
broad-based, with private consumption,
investment, government consumption and net
exports all contributing to growth. Following a
strong second quarter, private consumption is
expected to converge to pre-pandemic levels in the
second half of the year, also thanks to the lifting of
the remaining containment measures. Investment
activity recovered strongly in late 2020 and early
2021 on the back of a vibrant housing market and
strong manufacturing sector. Though supply
bottlenecks are expected to slow down investment
over the course of 2021, the annual investment
growth rate is forecast to be high due to strong
carry-over effects. Finally, net trade is also
forecast to contribute substantially to GDP growth
in 2021, with especially strong exports of goods
while imports (especially of services) lag behind.
Economic growth is projected to remain robust in
2022 with a strong contribution from private
consumption. Government consumption growth is
expected to moderate following a decrease in
COVID-19-related expenditure on medical
equipment and testing, while the contribution from
external demand is set to turn broadly neutral. In
2023, growth is forecast to moderate to 1.6%,
reflecting the absence of further catch-up effects.
A tight labour market
With support measures still in place for a large part
of the year and economic activity rebounding, the
unemployment rate is expected to decrease to 3.5%
in 2021. Evidence of a tight labour market has
started to emerge, with the number of vacancies
surpassing the number of unemployed and several
sectors experiencing labour shortages. The phasing
out of support measures is set to increase
unemployment through a projected uptick in
bankruptcies (which are currently at historically
low levels). In addition, labour supply is projected
to increase in 2022 as those who temporarily left
the labour force due to the pandemic are set to
return to it. Given the tight labour market and the
strong economic recovery however, the increase in
the unemployment rate is expected to remain
limited at 3.6% in 2022. The unemployment rate is
forecast to remain stable in 2023.
Inflationary pressures from increasing gas
prices
HICP inflation is forecast to increase from 1.1% in
2020 to around 2.1% in 2021 and to 2.2% in 2022,
before decreasing again to 1.5% in 2023. The
-6
-4
-2
0
2
4
6
8
14 15 16 17 18 19 20 21 22 23
Graph II.14.1: The Netherlands - Real GDP growth and
contributions
Net exports Investment
Priv. consumption Gov. consumption
Inventories Real GDP (y-o-y%)
forecast
pps.
The Dutch economy rebounded strongly in the second quarter of 2021. Economic activity surged on the
back of the gradual opening up of the economy, a robust recovery in consumer demand and a
favourable external environment. With the lifting of most containment measures, the recovery is
expected to continue in the second half of the year. Economic activity is forecast to surpass pre-
pandemic levels in the third quarter. The government deficit is projected to increase further in 2021, due
to an increase in COVID-19 related expenditure, and to gradually decrease in 2022 and 2023.
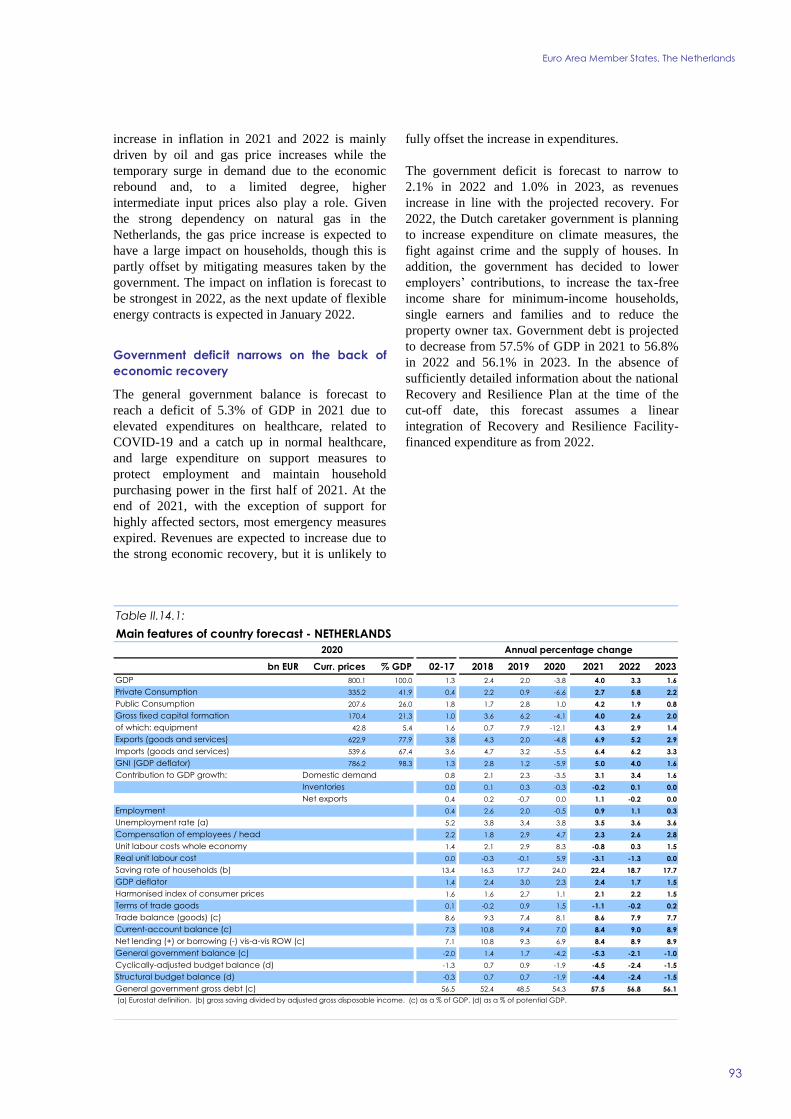
Euro Area Member States, The Netherlands
93
increase in inflation in 2021 and 2022 is mainly
driven by oil and gas price increases while the
temporary surge in demand due to the economic
rebound and, to a limited degree, higher
intermediate input prices also play a role. Given
the strong dependency on natural gas in the
Netherlands, the gas price increase is expected to
have a large impact on households, though this is
partly offset by mitigating measures taken by the
government. The impact on inflation is forecast to
be strongest in 2022, as the next update of flexible
energy contracts is expected in January 2022.
Government deficit narrows on the back of
economic recovery
The general government balance is forecast to
reach a deficit of 5.3% of GDP in 2021 due to
elevated expenditures on healthcare, related to
COVID-19 and a catch up in normal healthcare,
and large expenditure on support measures to
protect employment and maintain household
purchasing power in the first half of 2021. At the
end of 2021, with the exception of support for
highly affected sectors, most emergency measures
expired. Revenues are expected to increase due to
the strong economic recovery, but it is unlikely to
fully offset the increase in expenditures.
The government deficit is forecast to narrow to
2.1% in 2022 and 1.0% in 2023, as revenues
increase in line with the projected recovery. For
2022, the Dutch caretaker government is planning
to increase expenditure on climate measures, the
fight against crime and the supply of houses. In
addition, the government has decided to lower
employers’ contributions, to increase the tax-free
income share for minimum-income households,
single earners and families and to reduce the
property owner tax. Government debt is projected
to decrease from 57.5% of GDP in 2021 to 56.8%
in 2022 and 56.1% in 2023. In the absence of
sufficiently detailed information about the national
Recovery and Resilience Plan at the time of the
cut-off date, this forecast assumes a linear
integration of Recovery and Resilience Facility-
financed expenditure as from 2022.
bn EUR Curr. prices % GDP 02-17 2018 2019 2020 2021 2022 2023
800.1 100.0 1.3 2.4 2.0 -3.8 4.0 3.3 1.6
335.2 41.9 0.4 2.2 0.9 -6.6 2.7 5.8 2.2
207.6 26.0 1.8 1.7 2.8 1.0 4.2 1.9 0.8
170.4 21.3 1.0 3.6 6.2 -4.1 4.0 2.6 2.0
42.8 5.4 1.6 0.7 7.9 -12.1 4.3 2.9 1.4
622.9 77.9 3.8 4.3 2.0 -4.8 6.9 5.2 2.9
539.6 67.4 3.6 4.7 3.2 -5.5 6.4 6.2 3.3
786.2 98.3 1.3 2.8 1.2 -5.9 5.0 4.0 1.6
0.8 2.1 2.3 -3.5 3.1 3.4 1.6
0.0 0.1 0.3 -0.3 -0.2 0.1 0.0
0.4 0.2 -0.7 0.0 1.1 -0.2 0.0
0.4 2.6 2.0 -0.5 0.9 1.1 0.3
5.2 3.8 3.4 3.8 3.5 3.6 3.6
2.2 1.8 2.9 4.7 2.3 2.6 2.8
1.4 2.1 2.9 8.3 -0.8 0.3 1.5
0.0 -0.3 -0.1 5.9 -3.1 -1.3 0.0
13.4 16.3 17.7 24.0 22.4 18.7 17.7
1.4 2.4 3.0 2.3 2.4 1.7 1.5
1.6 1.6 2.7 1.1 2.1 2.2 1.5
0.1 -0.2 0.9 1.5 -1.1 -0.2 0.2
8.6 9.3 7.4 8.1 8.6 7.9 7.7
7.3 10.8 9.4 7.0 8.4 9.0 8.9
7.1 10.8 9.3 6.9 8.4 8.9 8.9
-2.0 1.4 1.7 -4.2 -5.3 -2.1 -1.0
-1.3 0.7 0.9 -1.9 -4.5 -2.4 -1.5
-0.3 0.7 0.7 -1.9 -4.4 -2.4 -1.5
56.5 52.4 48.5 54.3 57.5 56.8 56.1
General government balance (c)
Cyclically-adjusted budget balance (d)
Structural budget balance (d)
General government gross debt (c)
(a) Eurostat definition. (b) gross saving divided by adjusted gross disposable income. (c) as a % of GDP. (d) as a % of potential GDP.
Net lending (+) or borrowing (-) vis-a-vis ROW (c)
Employment
Unemployment rate (a)
Compensation of employees / head
Unit labour costs whole economy
Real unit labour cost
Saving rate of households (b)
GDP deflator
Harmonised index of consumer prices
Terms of trade goods
Trade balance (goods) (c)
Current-account balance (c)
Contribution to GDP growth: Domestic demand
Inventories
Net exports
GNI (GDP deflator)
Table II.14.1:
Main features of country forecast - NETHERLANDS
2020 Annual percentage change
GDP
Private Consumption
Public Consumption
Gross fixed capital formation
of which: equipment
Exports (goods and services)
Imports (goods and services)

15. AUSTRIA
94
A strong rebound in 2021
After the phasing out of containment measures and
the rollout of vaccinations, Austria’s economy
registered a strong rebound. Following a 0.5%
quarter-on-quarter drop in the first quarter of this
year, GDP increased by 4.0% in the second
quarter. With a continued but decreasing growth
momentum in the second half of the year, real
GDP growth in 2021 is expected to increase to
4.4%, following the sharp contraction of 6.7% in
2020. The economic rebound in 2021 is driven by
pent-up private consumption and considerable
increases in investment, notably equipment.
Economic sentiment indicators suggest that this
will continue in the second half of the year.
The easing of travel restrictions led to a recovery
in the economically important tourism sector.
Overnight stays in August surpassed the record
level from 2019, following a surge in German,
Dutch and domestic tourism. After a very strong
first half year of 2021, the Austrian export industry
is expected to face headwinds from supply
bottlenecks. The level of GDP is expected to return
to pre-crisis levels at the end of 2021.
Continued expansion in 2022 and 2023
The economic expansion is expected to accelerate
in the 2022 and to continue in 2023. It is set to be
mainly driven by domestic demand. Both pent-up
demand and the unleashing of precautionary
savings are expected to boost private consumption
over the forecast horizon, further supported by the
eco-social tax reform and the implementation of
the Austrian RRP. Business investment is also
projected to support the expansion, offsetting a
period of relatively low investments prior to the
pandemic. Winter tourism is forecast to recover
gradually, but remain below pre-crisis levels, due
to ongoing pandemic concerns. Overall, real GDP
is expected to grow by 4.9% in 2022 and 1.9% in
2023. Downside risks to the projections are linked
to the possibility of a lower-than-expected
expansion in the tourism sector and prolonged
supply bottlenecks, as well as to pandemic
developments in light of the relatively low
vaccination rates in Austria.
Labour markets weathered the crisis well
Despite the depth of the recession, the
unemployment rate increased by only 0.9 pps. to
5.4% in 2020. Short-time work schemes helped to
mitigate the effect of the economic downturn on
the labour market. The unemployment rate is
forecast to drop to 5.0% in 2021 and to stabilise at
pre-crisis levels from 2022 onwards. After
dropping by 1.6% in 2020, employment is
expected to grow again over the forecast horizon,
in line with the projected economic expansion.
This should also be reflected in a strong rebound in
the number of hours worked in 2021, as workers
gradually return to full-time work, as well as in a
decrease of the inactive population.
Energy prices drive inflation
Rising oil and gas prices drive the noticeable
increase of the HICP over the course of the year.
Energy inflation is expected to remain high over
the coming quarters, but to normalise as from the
second quarter of 2022 a base effects fade. A
further increase in inflation is set to be triggered by
the gradual phasing in of the CO2 price related to
the eco-social tax reform. Overall, after reaching
-8
-6
-4
-2
0
2
4
6
14 15 16 17 18 19 20 21 22 23
Graph II.15.1: Austria - Real GDP growth and contributions
Net exports Investment
Priv. consumption Gov. consumption
Inventories Real GDP (y-o-y%)
forecastpps.
The COVID-19 pandemic and related containment measures led to a strong economic contraction in
2020. In 2021, economic activity started to recover on the back of strong pent-up demand. The
economic expansion is expected to accelerate in 2022 and continue in 2023. Despite significant tax
relief, the general government deficit is set to decrease in 2022 with the gradual phase out of support
measures.

Euro Area Member States, Austria
95
1.4% in 2020, HICP inflation is expected to peak
at 2.7% in 2021 before gradually decreasing to
2.5% in 2022 and 2.0% in 2023.
Deficit and debt on a downward path
Austria’s public finances are set to improve
significantly over the forecast horizon on the back
of a strong economic recovery. Nevertheless, at -
5.9% of GDP in 2021, the government budget
balance is expected to remain largely determined
by the fiscal measures taken to mitigate the socio-
economic consequences of the pandemic and
related recession. The ‘COVID-19 crisis
management fund’ set up in March 2020 continues
to finance temporary support measures such as
fixed cost subsidies as well as various measures to
compensate for losses or shortfalls in sales during
the various lockdown periods. Additionally, short-
time work schemes, tax deferrals, reduced advance
payments and public guarantees for loans are still
in place to preserve employment and help
companies avoid liquidity constraints. Most of
these measures will end in 2021. Overall, revenues
are expected to grow by 7.1%, while expenditures
are expected to increase further by 2.4%. The
headline deficit is forecast to fall well below the
3% threshold over the forecast horizon. The deficit
is projected to decline to 2.3% of GDP in 2022 and
to narrow further to 1.3% of GDP in 2023. In
addition to the economic stimulus package adopted
in June 2020 and the Austrian RRP, the just-
adopted eco-social tax reform is set to provide a
significant tax relief for households and businesses
as of 2022.
Despite the still considerably negative headline
balance in 2021, the public debt ratio is expected
to decrease to 82.9% of GDP thanks to the
economic recovery and. In 2022, the reduction of
the debt-to-GDP ratio is projected to accelerate
due to robust nominal growth and further reduction
in the headline budget deficit. The public debt ratio
is expected to decline to 79.4% of GDP in 2022
and to 77.6% in 2023.
bn EUR Curr. prices % GDP 02-17 2018 2019 2020 2021 2022 2023
379.3 100.0 1.5 2.5 1.5 -6.7 4.4 4.9 1.9
190.1 50.1 1.2 1.1 0.7 -8.5 4.2 6.3 2.4
80.4 21.2 1.3 1.2 1.5 -0.5 3.4 -0.1 0.4
95.8 25.2 1.2 4.4 4.8 -5.2 8.3 4.2 2.3
29.5 7.8 1.6 1.3 4.3 -8.7 13.4 6.1 1.1
195.1 51.4 3.5 5.1 3.4 -10.8 8.4 9.0 5.4
184.2 48.6 3.2 5.3 2.0 -9.4 9.9 8.1 5.7
378.9 99.9 1.5 2.5 2.1 -6.5 4.0 4.8 1.7
1.2 1.8 1.8 -5.8 4.9 4.3 2.0
0.1 0.5 -1.2 0.1 0.0 0.0 0.0
0.2 0.1 0.9 -1.1 -0.5 0.6 -0.1
1.0 1.7 1.1 -1.6 1.7 1.9 0.6
5.1 4.9 4.5 5.4 5.0 4.6 4.5
2.2 2.9 2.8 1.7 2.1 2.3 3.1
1.7 2.1 2.5 7.3 -0.5 -0.7 1.8
-0.1 0.3 0.8 4.8 -2.3 -2.9 -0.3
14.6 13.1 13.9 19.7 14.7 12.2 12.0
1.8 1.8 1.6 2.3 1.8 2.2 2.1
1.9 2.1 1.5 1.4 2.7 2.5 2.0
-0.1 -0.6 -0.9 1.2 -2.1 -0.9 -0.2
0.1 0.3 1.0 0.8 0.2 -0.2 -0.2
2.4 1.0 2.2 1.9 -0.1 -0.2 -0.5
2.3 0.4 2.2 1.8 -0.2 -0.3 -0.6
-2.4 0.2 0.6 -8.3 -5.9 -2.3 -1.3
-2.2 -0.8 -0.5 -5.0 -4.2 -2.5 -1.7
-0.7 -0.8 -0.5 -5.0 -4.2 -2.5 -1.7
75.4 74.0 70.6 83.2 82.9 79.4 77.6
GNI (GDP deflator)
Table II.15.1:
Main features of country forecast - AUSTRIA
2020 Annual percentage change
GDP
Private Consumption
Public Consumption
Gross fixed capital formation
of which: equipment
Exports (goods and services)
Imports (goods and services)
Contribution to GDP growth: Domestic demand
Inventories
Net exports
Net lending (+) or borrowing (-) vis-a-vis ROW (c)
Employment
Unemployment rate (a)
Compensation of employees / head
Unit labour costs whole economy
Real unit labour cost
Saving rate of households (b)
GDP deflator
Harmonised index of consumer prices
Terms of trade goods
Trade balance (goods) (c)
Current-account balance (c)
General government balance (c)
Cyclically-adjusted budget balance (d)
Structural budget balance (d)
General government gross debt (c)
(a) Eurostat definition. (b) gross saving divided by adjusted gross disposable income. (c) as a % of GDP. (d) as a % of potential GDP.
Note : Contributions to GDP growth may not add up due to statistical discrepancies.
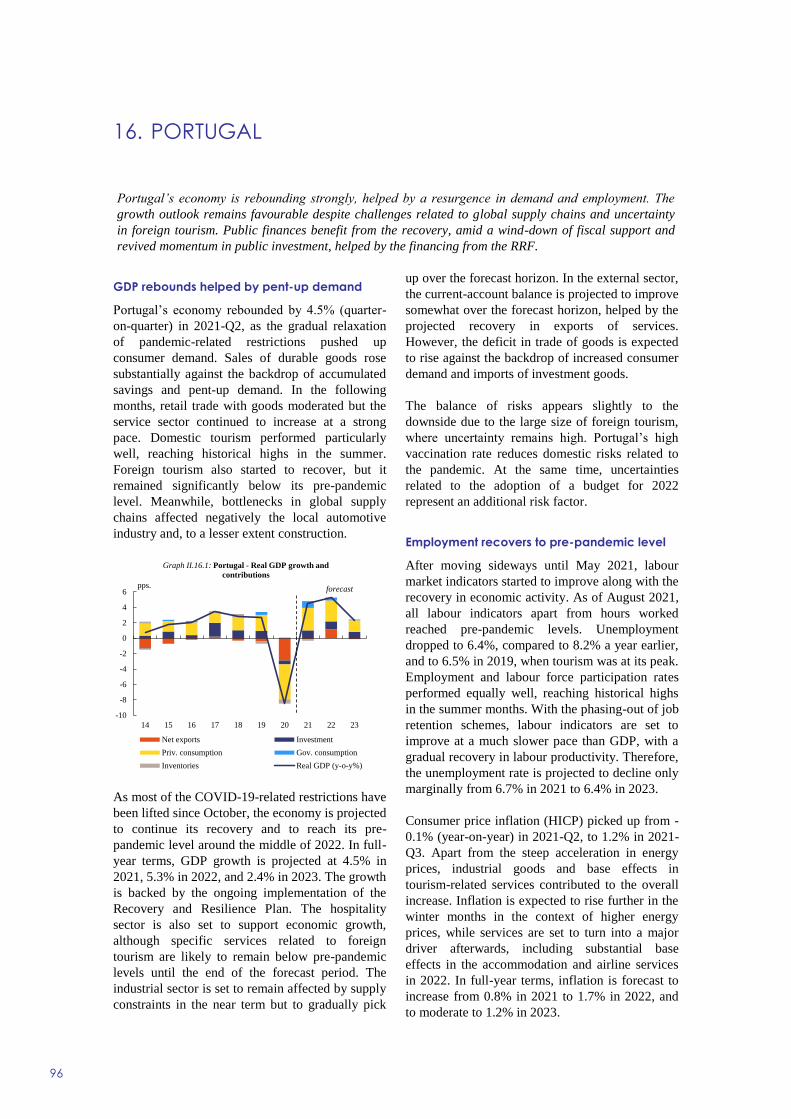
16. PORTUGAL
96
GDP rebounds helped by pent-up demand
Portugal’s economy rebounded by 4.5% (quarter-
on-quarter) in 2021-Q2, as the gradual relaxation
of pandemic-related restrictions pushed up
consumer demand. Sales of durable goods rose
substantially against the backdrop of accumulated
savings and pent-up demand. In the following
months, retail trade with goods moderated but the
service sector continued to increase at a strong
pace. Domestic tourism performed particularly
well, reaching historical highs in the summer.
Foreign tourism also started to recover, but it
remained significantly below its pre-pandemic
level. Meanwhile, bottlenecks in global supply
chains affected negatively the local automotive
industry and, to a lesser extent construction.
As most of the COVID-19-related restrictions have
been lifted since October, the economy is projected
to continue its recovery and to reach its pre-
pandemic level around the middle of 2022. In full-
year terms, GDP growth is projected at 4.5% in
2021, 5.3% in 2022, and 2.4% in 2023. The growth
is backed by the ongoing implementation of the
Recovery and Resilience Plan. The hospitality
sector is also set to support economic growth,
although specific services related to foreign
tourism are likely to remain below pre-pandemic
levels until the end of the forecast period. The
industrial sector is set to remain affected by supply
constraints in the near term but to gradually pick
up over the forecast horizon. In the external sector,
the current-account balance is projected to improve
somewhat over the forecast horizon, helped by the
projected recovery in exports of services.
However, the deficit in trade of goods is expected
to rise against the backdrop of increased consumer
demand and imports of investment goods.
The balance of risks appears slightly to the
downside due to the large size of foreign tourism,
where uncertainty remains high. Portugal’s high
vaccination rate reduces domestic risks related to
the pandemic. At the same time, uncertainties
related to the adoption of a budget for 2022
represent an additional risk factor.
Employment recovers to pre-pandemic level
After moving sideways until May 2021, labour
market indicators started to improve along with the
recovery in economic activity. As of August 2021,
all labour indicators apart from hours worked
reached pre-pandemic levels. Unemployment
dropped to 6.4%, compared to 8.2% a year earlier,
and to 6.5% in 2019, when tourism was at its peak.
Employment and labour force participation rates
performed equally well, reaching historical highs
in the summer months. With the phasing-out of job
retention schemes, labour indicators are set to
improve at a much slower pace than GDP, with a
gradual recovery in labour productivity. Therefore,
the unemployment rate is projected to decline only
marginally from 6.7% in 2021 to 6.4% in 2023.
Consumer price inflation (HICP) picked up from -
0.1% (year-on-year) in 2021-Q2, to 1.2% in 2021-
Q3. Apart from the steep acceleration in energy
prices, industrial goods and base effects in
tourism-related services contributed to the overall
increase. Inflation is expected to rise further in the
winter months in the context of higher energy
prices, while services are set to turn into a major
driver afterwards, including substantial base
effects in the accommodation and airline services
in 2022. In full-year terms, inflation is forecast to
increase from 0.8% in 2021 to 1.7% in 2022, and
to moderate to 1.2% in 2023.
-10
-8
-6
-4
-2
0
2
4
6
14 15 16 17 18 19 20 21 22 23
Graph II.16.1: Portugal - Real GDP growth and
contributions
Net exports Investment
Priv. consumption Gov. consumption
Inventories Real GDP (y-o-y%)
forecastpps.
Portugal’s economy is rebounding strongly, helped by a resurgence in demand and employment. The
growth outlook remains favourable despite challenges related to global supply chains and uncertainty
in foreign tourism. Public finances benefit from the recovery, amid a wind-down of fiscal support and
revived momentum in public investment, helped by the financing from the RRF.
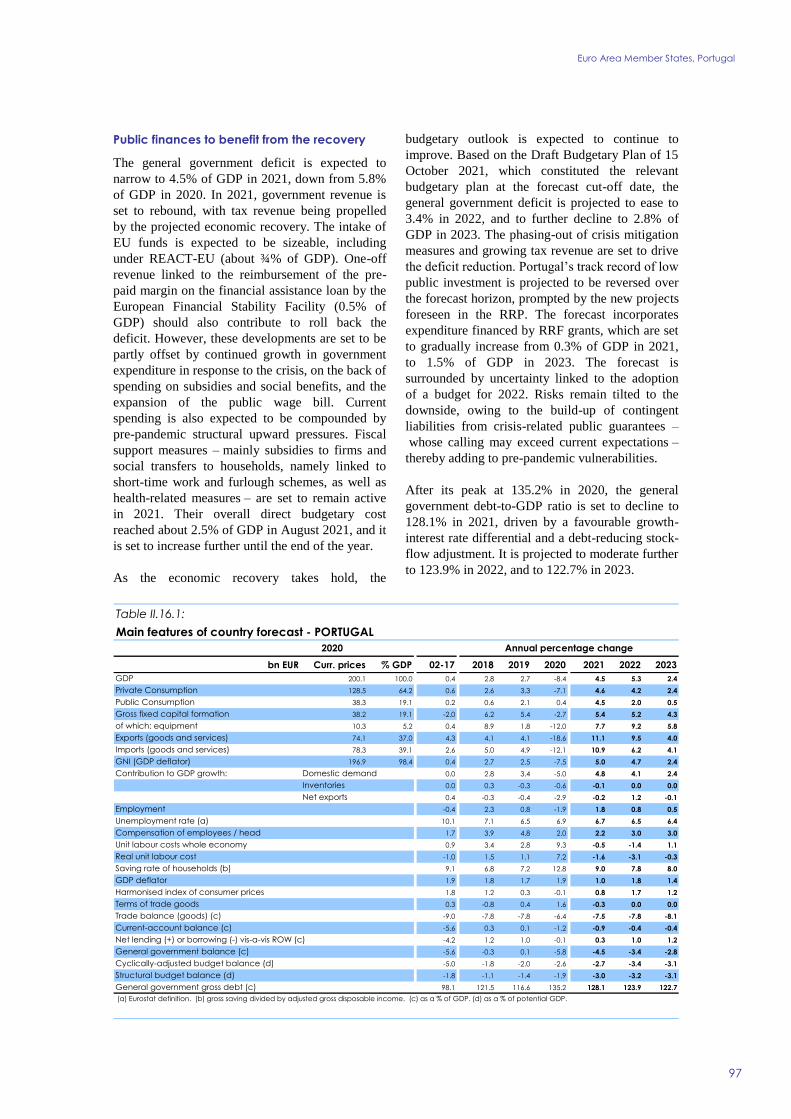
Euro Area Member States, Portugal
97
Public finances to benefit from the recovery
The general government deficit is expected to
narrow to 4.5% of GDP in 2021, down from 5.8%
of GDP in 2020. In 2021, government revenue is
set to rebound, with tax revenue being propelled
by the projected economic recovery. The intake of
EU funds is expected to be sizeable, including
under REACT-EU (about ¾% of GDP). One-off
revenue linked to the reimbursement of the pre-
paid margin on the financial assistance loan by the
European Financial Stability Facility (0.5% of
GDP) should also contribute to roll back the
deficit. However, these developments are set to be
partly offset by continued growth in government
expenditure in response to the crisis, on the back of
spending on subsidies and social benefits, and the
expansion of the public wage bill. Current
spending is also expected to be compounded by
pre-pandemic structural upward pressures. Fiscal
support measures – mainly subsidies to firms and
social transfers to households, namely linked to
short-time work and furlough schemes, as well as
health-related measures – are set to remain active
in 2021. Their overall direct budgetary cost
reached about 2.5% of GDP in August 2021, and it
is set to increase further until the end of the year.
As the economic recovery takes hold, the
budgetary outlook is expected to continue to
improve. Based on the Draft Budgetary Plan of 15
October 2021, which constituted the relevant
budgetary plan at the forecast cut-off date, the
general government deficit is projected to ease to
3.4% in 2022, and to further decline to 2.8% of
GDP in 2023. The phasing-out of crisis mitigation
measures and growing tax revenue are set to drive
the deficit reduction. Portugal’s track record of low
public investment is projected to be reversed over
the forecast horizon, prompted by the new projects
foreseen in the RRP. The forecast incorporates
expenditure financed by RRF grants, which are set
to gradually increase from 0.3% of GDP in 2021,
to 1.5% of GDP in 2023. The forecast is
surrounded by uncertainty linked to the adoption
of a budget for 2022. Risks remain tilted to the
downside, owing to the build-up of contingent
liabilities from crisis-related public guarantees –
whose calling may exceed current expectations –
thereby adding to pre-pandemic vulnerabilities.
After its peak at 135.2% in 2020, the general
government debt-to-GDP ratio is set to decline to
128.1% in 2021, driven by a favourable growth-
interest rate differential and a debt-reducing stock-
flow adjustment. It is projected to moderate further
to 123.9% in 2022, and to 122.7% in 2023.
bn EUR Curr. prices % GDP 02-17 2018 2019 2020 2021 2022 2023
200.1 100.0 0.4 2.8 2.7 -8.4 4.5 5.3 2.4
128.5 64.2 0.6 2.6 3.3 -7.1 4.6 4.2 2.4
38.3 19.1 0.2 0.6 2.1 0.4 4.5 2.0 0.5
38.2 19.1 -2.0 6.2 5.4 -2.7 5.4 5.2 4.3
10.3 5.2 0.4 8.9 1.8 -12.0 7.7 9.2 5.8
74.1 37.0 4.3 4.1 4.1 -18.6 11.1 9.5 4.0
78.3 39.1 2.6 5.0 4.9 -12.1 10.9 6.2 4.1
196.9 98.4 0.4 2.7 2.5 -7.5 5.0 4.7 2.4
0.0 2.8 3.4 -5.0 4.8 4.1 2.4
0.0 0.3 -0.3 -0.6 -0.1 0.0 0.0
0.4 -0.3 -0.4 -2.9 -0.2 1.2 -0.1
-0.4 2.3 0.8 -1.9 1.8 0.8 0.5
10.1 7.1 6.5 6.9 6.7 6.5 6.4
1.7 3.9 4.8 2.0 2.2 3.0 3.0
0.9 3.4 2.8 9.3 -0.5 -1.4 1.1
-1.0 1.5 1.1 7.2 -1.6 -3.1 -0.3
9.1 6.8 7.2 12.8 9.0 7.8 8.0
1.9 1.8 1.7 1.9 1.0 1.8 1.4
1.8 1.2 0.3 -0.1 0.8 1.7 1.2
0.3 -0.8 0.4 1.6 -0.3 0.0 0.0
-9.0 -7.8 -7.8 -6.4 -7.5 -7.8 -8.1
-5.6 0.3 0.1 -1.2 -0.9 -0.4 -0.4
-4.2 1.2 1.0 -0.1 0.3 1.0 1.2
-5.6 -0.3 0.1 -5.8 -4.5 -3.4 -2.8
-5.0 -1.8 -2.0 -2.6 -2.7 -3.4 -3.1
-1.8 -1.1 -1.4 -1.9 -3.0 -3.2 -3.1
98.1 121.5 116.6 135.2 128.1 123.9 122.7
General government balance (c)
Cyclically-adjusted budget balance (d)
Structural budget balance (d)
General government gross debt (c)
(a) Eurostat definition. (b) gross saving divided by adjusted gross disposable income. (c) as a % of GDP. (d) as a % of potential GDP.
Net lending (+) or borrowing (-) vis-a-vis ROW (c)
Employment
Unemployment rate (a)
Compensation of employees / head
Unit labour costs whole economy
Real unit labour cost
Saving rate of households (b)
GDP deflator
Harmonised index of consumer prices
Terms of trade goods
Trade balance (goods) (c)
Current-account balance (c)
Contribution to GDP growth: Domestic demand
Inventories
Net exports
GNI (GDP deflator)
Table II.16.1:
Main features of country forecast - PORTUGAL
2020 Annual percentage change
GDP
Private Consumption
Public Consumption
Gross fixed capital formation
of which: equipment
Exports (goods and services)
Imports (goods and services)
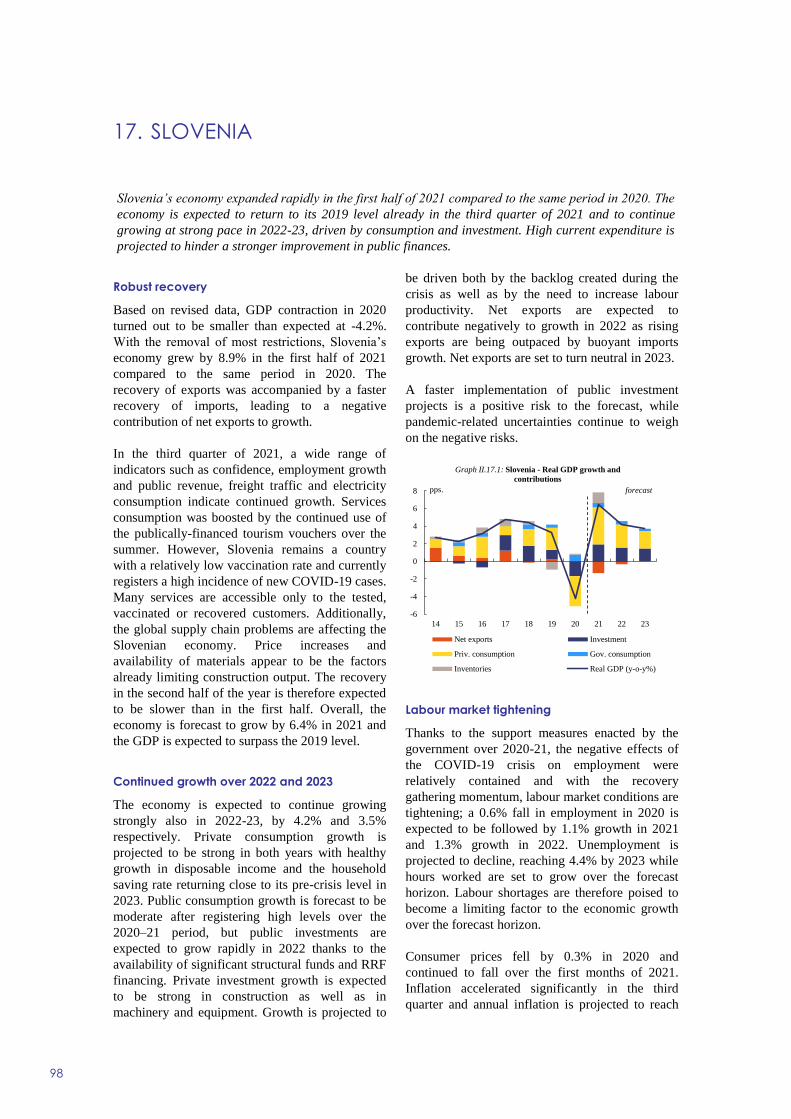
17. SLOVENIA
98
Robust recovery
Based on revised data, GDP contraction in 2020
turned out to be smaller than expected at -4.2%.
With the removal of most restrictions, Slovenia’s
economy grew by 8.9% in the first half of 2021
compared to the same period in 2020. The
recovery of exports was accompanied by a faster
recovery of imports, leading to a negative
contribution of net exports to growth.
In the third quarter of 2021, a wide range of
indicators such as confidence, employment growth
and public revenue, freight traffic and electricity
consumption indicate continued growth. Services
consumption was boosted by the continued use of
the publically-financed tourism vouchers over the
summer. However, Slovenia remains a country
with a relatively low vaccination rate and currently
registers a high incidence of new COVID-19 cases.
Many services are accessible only to the tested,
vaccinated or recovered customers. Additionally,
the global supply chain problems are affecting the
Slovenian economy. Price increases and
availability of materials appear to be the factors
already limiting construction output. The recovery
in the second half of the year is therefore expected
to be slower than in the first half. Overall, the
economy is forecast to grow by 6.4% in 2021 and
the GDP is expected to surpass the 2019 level.
Continued growth over 2022 and 2023
The economy is expected to continue growing
strongly also in 2022-23, by 4.2% and 3.5%
respectively. Private consumption growth is
projected to be strong in both years with healthy
growth in disposable income and the household
saving rate returning close to its pre-crisis level in
2023. Public consumption growth is forecast to be
moderate after registering high levels over the
2020–21 period, but public investments are
expected to grow rapidly in 2022 thanks to the
availability of significant structural funds and RRF
financing. Private investment growth is expected
to be strong in construction as well as in
machinery and equipment. Growth is projected to
be driven both by the backlog created during the
crisis as well as by the need to increase labour
productivity. Net exports are expected to
contribute negatively to growth in 2022 as rising
exports are being outpaced by buoyant imports
growth. Net exports are set to turn neutral in 2023.
A faster implementation of public investment
projects is a positive risk to the forecast, while
pandemic-related uncertainties continue to weigh
on the negative risks.
Labour market tightening
Thanks to the support measures enacted by the
government over 2020-21, the negative effects of
the COVID-19 crisis on employment were
relatively contained and with the recovery
gathering momentum, labour market conditions are
tightening; a 0.6% fall in employment in 2020 is
expected to be followed by 1.1% growth in 2021
and 1.3% growth in 2022. Unemployment is
projected to decline, reaching 4.4% by 2023 while
hours worked are set to grow over the forecast
horizon. Labour shortages are therefore poised to
become a limiting factor to the economic growth
over the forecast horizon.
Consumer prices fell by 0.3% in 2020 and
continued to fall over the first months of 2021.
Inflation accelerated significantly in the third
quarter and annual inflation is projected to reach
-6
-4
-2
0
2
4
6
8
14 15 16 17 18 19 20 21 22 23
Graph II.17.1: Slovenia - Real GDP growth and
contributions
Net exports Investment
Priv. consumption Gov. consumption
Inventories Real GDP (y-o-y%)
forecastpps.
Slovenia’s economy expanded rapidly in the first half of 2021 compared to the same period in 2020. The
economy is expected to return to its 2019 level already in the third quarter of 2021 and to continue
growing at strong pace in 2022-23, driven by consumption and investment. High current expenditure is
projected to hinder a stronger improvement in public finances.

Euro Area Member States, Slovenia
99
1.7% in 2021. The acceleration of inflation is
expected to continue in 2022, reaching 2.1%
before easing in 2023.
Public finances to improve slowly despite high
current expenditure
The general government deficit is forecast to
decrease from 7.7% of GDP in 2020 to 7.2% in
2021, mainly due to the rebound in economic
activity and the expiration of some measures
adopted to mitigate the economic and social
impact of the COVID-19 pandemic.
In 2022, the general government deficit is expected
to decline further to 5.2% of GDP. On the revenue
side, indirect taxes are projected to remain the
main contributor in 2022, while current taxes on
income and wealth are forecast to decrease by
some 2.5% as a result of the tax reform adopted by
the government. As most of the measures to
mitigate the impact of the COVID-19 crisis are
phased out this year, current expenditure in 2022 is
projected to decline by 2.4%. However, it is set to
still remain higher than in 2020 in nominal terms.
Despite past under-execution compared to the
budgets, investment is still expected to grow
strongly, at a similar pace as in 2021.
In 2023, the general government deficit is forecast
to decrease to 4.4% of GDP. Revenues from taxes
and social security contributions are expected to
grow strongly on the back of strong labour market
and continued expansion in domestic demand. On
the expenditure side, compensation of employees,
social transfers and to a lesser extent intermediate
consumption are forecast to be the main drivers of
current expenditure growth. Investment projections
have been revised downwards due to lower
expected absorption rate of EU funds in the
beginning of the new 2021-2027 programming
period. The forecast also incorporates expenditures
financed by RRF grants, which is set to gradually
increase from 0.3% of GDP in 2021 to 0.6% of
GDP in 2023.
Over the forecast horizon, the debt-to-GDP ratio is
expected to be mainly driven by the changes in the
headline deficit, the gradual reduction of the
precautionary cash buffers and the denominator
effect from higher nominal GDP. Thus, the debt-
to-GDP ratio is projected to decrease form 79.8%
in 2020 to 76.0% in 2023.
bn EUR Curr. prices % GDP 02-17 2018 2019 2020 2021 2022 2023
46.9 100.0 2.1 4.4 3.3 -4.2 6.4 4.2 3.5
23.6 50.2 1.8 3.6 4.8 -6.6 8.4 5.1 3.5
9.6 20.6 1.5 3.0 2.0 4.2 2.4 1.9 1.5
8.9 18.9 -0.2 9.7 5.5 -8.2 10.3 8.0 7.0
3.3 7.1 1.9 10.4 2.0 -14.0 20.2 7.7 4.8
36.5 77.9 6.0 6.2 4.5 -8.7 11.9 7.6 6.1
32.2 68.7 5.0 7.1 4.7 -9.6 15.5 8.9 6.7
46.6 99.2 2.0 4.8 3.2 -3.5 6.3 4.3 3.7
1.3 4.2 3.9 -4.3 6.6 4.6 3.5
0.1 0.4 -0.9 0.1 1.2 0.0 0.0
0.8 -0.1 0.3 -0.1 -1.4 -0.4 0.0
0.5 3.2 2.5 -0.6 1.1 1.3 1.4
7.2 5.1 4.5 5.0 4.6 4.5 4.4
4.0 3.9 5.0 3.5 3.4 1.2 3.6
2.3 2.7 4.2 7.4 -1.8 -1.6 1.6
-0.1 0.6 1.9 6.1 -3.3 -3.4 -0.1
13.5 13.7 13.7 22.6 18.7 14.4 14.1
2.4 2.1 2.2 1.2 1.5 1.8 1.7
2.6 1.9 1.7 -0.3 1.7 2.1 1.7
-0.2 -0.1 0.4 0.8 -0.7 -0.3 0.0
-0.9 2.8 2.7 5.0 2.8 1.7 1.2
0.1 6.1 6.1 7.6 5.4 4.8 4.8
0.2 5.7 5.8 7.1 5.0 4.4 4.4
-3.6 0.7 0.4 -7.7 -7.2 -5.2 -4.4
-3.4 -0.7 -1.3 -6.5 -7.6 -6.2 -5.5
-3.3 -0.7 -1.3 -6.4 -7.6 -6.2 -5.5
46.0 70.3 65.6 79.8 77.7 76.4 76.0
General government balance (c)
Cyclically-adjusted budget balance (d)
Structural budget balance (d)
General government gross debt (c)
(a) Eurostat definition. (b) gross saving divided by adjusted gross disposable income. (c) as a % of GDP. (d) as a % of potential GDP.
Net lending (+) or borrowing (-) vis-a-vis ROW (c)
Employment
Unemployment rate (a)
Compensation of employees / head
Unit labour costs whole economy
Real unit labour cost
Saving rate of households (b)
GDP deflator
Harmonised index of consumer prices
Terms of trade goods
Trade balance (goods) (c)
Current-account balance (c)
Contribution to GDP growth: Domestic demand
Inventories
Net exports
GNI (GDP deflator)
Table II.17.1:
Main features of country forecast - SLOVENIA
2020 Annual percentage change
GDP
Private Consumption
Public Consumption
Gross fixed capital formation
of which: equipment
Exports (goods and services)
Imports (goods and services)
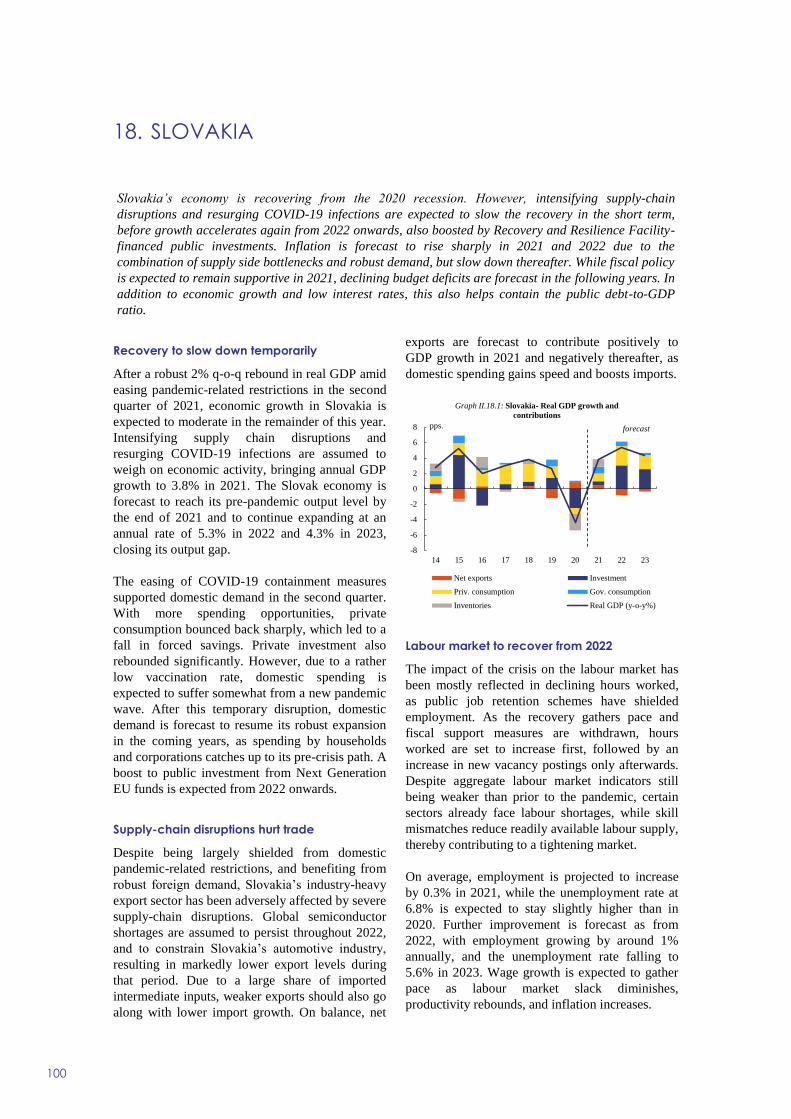
18. SLOVAKIA
100
Recovery to slow down temporarily
After a robust 2% q-o-q rebound in real GDP amid
easing pandemic-related restrictions in the second
quarter of 2021, economic growth in Slovakia is
expected to moderate in the remainder of this year.
Intensifying supply chain disruptions and
resurging COVID-19 infections are assumed to
weigh on economic activity, bringing annual GDP
growth to 3.8% in 2021. The Slovak economy is
forecast to reach its pre-pandemic output level by
the end of 2021 and to continue expanding at an
annual rate of 5.3% in 2022 and 4.3% in 2023,
closing its output gap.
The easing of COVID-19 containment measures
supported domestic demand in the second quarter.
With more spending opportunities, private
consumption bounced back sharply, which led to a
fall in forced savings. Private investment also
rebounded significantly. However, due to a rather
low vaccination rate, domestic spending is
expected to suffer somewhat from a new pandemic
wave. After this temporary disruption, domestic
demand is forecast to resume its robust expansion
in the coming years, as spending by households
and corporations catches up to its pre-crisis path. A
boost to public investment from Next Generation
EU funds is expected from 2022 onwards.
Supply-chain disruptions hurt trade
Despite being largely shielded from domestic
pandemic-related restrictions, and benefiting from
robust foreign demand, Slovakia’s industry-heavy
export sector has been adversely affected by severe
supply-chain disruptions. Global semiconductor
shortages are assumed to persist throughout 2022,
and to constrain Slovakia’s automotive industry,
resulting in markedly lower export levels during
that period. Due to a large share of imported
intermediate inputs, weaker exports should also go
along with lower import growth. On balance, net
exports are forecast to contribute positively to
GDP growth in 2021 and negatively thereafter, as
domestic spending gains speed and boosts imports.
Labour market to recover from 2022
The impact of the crisis on the labour market has
been mostly reflected in declining hours worked,
as public job retention schemes have shielded
employment. As the recovery gathers pace and
fiscal support measures are withdrawn, hours
worked are set to increase first, followed by an
increase in new vacancy postings only afterwards.
Despite aggregate labour market indicators still
being weaker than prior to the pandemic, certain
sectors already face labour shortages, while skill
mismatches reduce readily available labour supply,
thereby contributing to a tightening market.
On average, employment is projected to increase
by 0.3% in 2021, while the unemployment rate at
6.8% is expected to stay slightly higher than in
2020. Further improvement is forecast as from
2022, with employment growing by around 1%
annually, and the unemployment rate falling to
5.6% in 2023. Wage growth is expected to gather
pace as labour market slack diminishes,
productivity rebounds, and inflation increases.
-8
-6
-4
-2
0
2
4
6
8
14 15 16 17 18 19 20 21 22 23
Graph II.18.1: Slovakia- Real GDP growth and
contributions
Net exports Investment
Priv. consumption Gov. consumption
Inventories Real GDP (y-o-y%)
forecastpps.
Slovakia’s economy is recovering from the 2020 recession. However, intensifying supply-chain
disruptions and resurging COVID-19 infections are expected to slow the recovery in the short term,
before growth accelerates again from 2022 onwards, also boosted by Recovery and Resilience Facility-
financed public investments. Inflation is forecast to rise sharply in 2021 and 2022 due to the
combination of supply side bottlenecks and robust demand, but slow down thereafter. While fiscal policy
is expected to remain supportive in 2021, declining budget deficits are forecast in the following years. In
addition to economic growth and low interest rates, this also helps contain the public debt-to-GDP
ratio.
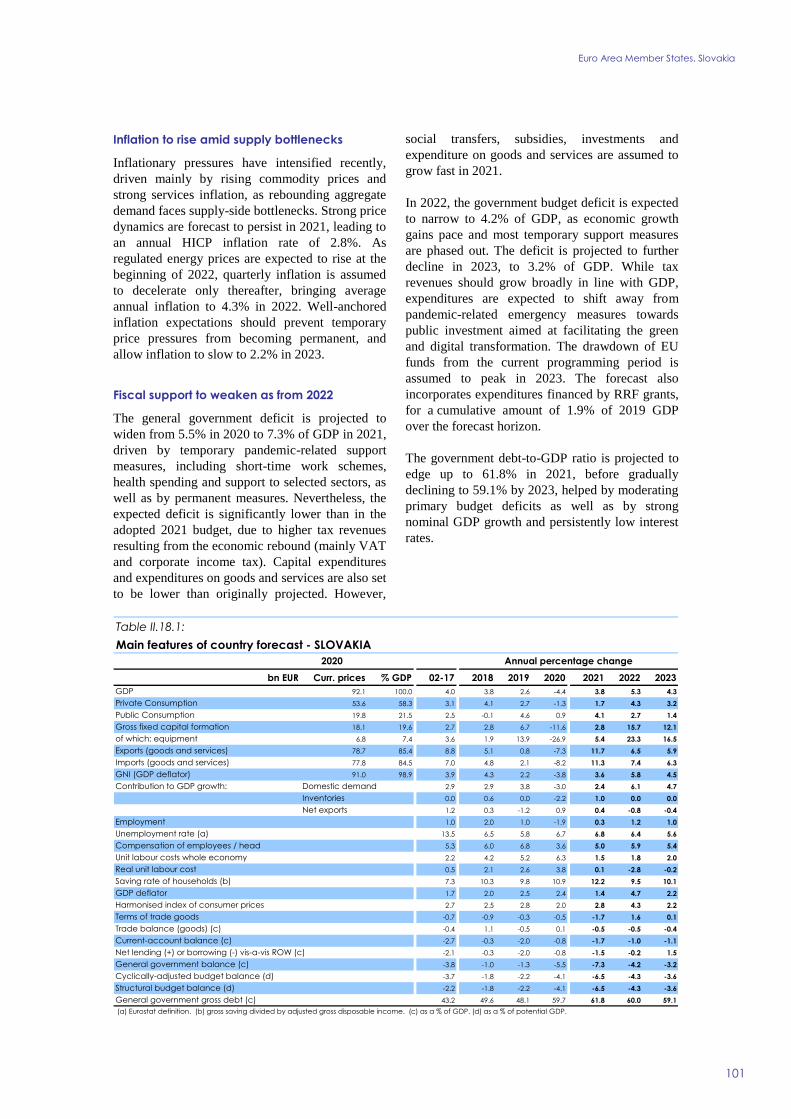
Euro Area Member States, Slovakia
101
Inflation to rise amid supply bottlenecks
Inflationary pressures have intensified recently,
driven mainly by rising commodity prices and
strong services inflation, as rebounding aggregate
demand faces supply-side bottlenecks. Strong price
dynamics are forecast to persist in 2021, leading to
an annual HICP inflation rate of 2.8%. As
regulated energy prices are expected to rise at the
beginning of 2022, quarterly inflation is assumed
to decelerate only thereafter, bringing average
annual inflation to 4.3% in 2022. Well-anchored
inflation expectations should prevent temporary
price pressures from becoming permanent, and
allow inflation to slow to 2.2% in 2023.
Fiscal support to weaken as from 2022
The general government deficit is projected to
widen from 5.5% in 2020 to 7.3% of GDP in 2021,
driven by temporary pandemic-related support
measures, including short-time work schemes,
health spending and support to selected sectors, as
well as by permanent measures. Nevertheless, the
expected deficit is significantly lower than in the
adopted 2021 budget, due to higher tax revenues
resulting from the economic rebound (mainly VAT
and corporate income tax). Capital expenditures
and expenditures on goods and services are also set
to be lower than originally projected. However,
social transfers, subsidies, investments and
expenditure on goods and services are assumed to
grow fast in 2021.
In 2022, the government budget deficit is expected
to narrow to 4.2% of GDP, as economic growth
gains pace and most temporary support measures
are phased out. The deficit is projected to further
decline in 2023, to 3.2% of GDP. While tax
revenues should grow broadly in line with GDP,
expenditures are expected to shift away from
pandemic-related emergency measures towards
public investment aimed at facilitating the green
and digital transformation. The drawdown of EU
funds from the current programming period is
assumed to peak in 2023. The forecast also
incorporates expenditures financed by RRF grants,
for a cumulative amount of 1.9% of 2019 GDP
over the forecast horizon.
The government debt-to-GDP ratio is projected to
edge up to 61.8% in 2021, before gradually
declining to 59.1% by 2023, helped by moderating
primary budget deficits as well as by strong
nominal GDP growth and persistently low interest
rates.
bn EUR Curr. prices % GDP 02-17 2018 2019 2020 2021 2022 2023
92.1 100.0 4.0 3.8 2.6 -4.4 3.8 5.3 4.3
53.6 58.3 3.1 4.1 2.7 -1.3 1.7 4.3 3.2
19.8 21.5 2.5 -0.1 4.6 0.9 4.1 2.7 1.4
18.1 19.6 2.7 2.8 6.7 -11.6 2.8 15.7 12.1
6.8 7.4 3.6 1.9 13.9 -26.9 5.4 23.3 16.5
78.7 85.4 8.8 5.1 0.8 -7.3 11.7 6.5 5.9
77.8 84.5 7.0 4.8 2.1 -8.2 11.3 7.4 6.3
91.0 98.9 3.9 4.3 2.2 -3.8 3.6 5.8 4.5
2.9 2.9 3.8 -3.0 2.4 6.1 4.7
0.0 0.6 0.0 -2.2 1.0 0.0 0.0
1.2 0.3 -1.2 0.9 0.4 -0.8 -0.4
1.0 2.0 1.0 -1.9 0.3 1.2 1.0
13.5 6.5 5.8 6.7 6.8 6.4 5.6
5.3 6.0 6.8 3.6 5.0 5.9 5.4
2.2 4.2 5.2 6.3 1.5 1.8 2.0
0.5 2.1 2.6 3.8 0.1 -2.8 -0.2
7.3 10.3 9.8 10.9 12.2 9.5 10.1
1.7 2.0 2.5 2.4 1.4 4.7 2.2
2.7 2.5 2.8 2.0 2.8 4.3 2.2
-0.7 -0.9 -0.3 -0.5 -1.7 1.6 0.1
-0.4 1.1 -0.5 0.1 -0.5 -0.5 -0.4
-2.7 -0.3 -2.0 -0.8 -1.7 -1.0 -1.1
-2.1 -0.3 -2.0 -0.8 -1.5 -0.2 1.5
-3.8 -1.0 -1.3 -5.5 -7.3 -4.2 -3.2
-3.7 -1.8 -2.2 -4.1 -6.5 -4.3 -3.6
-2.2 -1.8 -2.2 -4.1 -6.5 -4.3 -3.6
43.2 49.6 48.1 59.7 61.8 60.0 59.1
General government balance (c)
Cyclically-adjusted budget balance (d)
Structural budget balance (d)
General government gross debt (c)
(a) Eurostat definition. (b) gross saving divided by adjusted gross disposable income. (c) as a % of GDP. (d) as a % of potential GDP.
Net lending (+) or borrowing (-) vis-a-vis ROW (c)
Employment
Unemployment rate (a)
Compensation of employees / head
Unit labour costs whole economy
Real unit labour cost
Saving rate of households (b)
GDP deflator
Harmonised index of consumer prices
Terms of trade goods
Trade balance (goods) (c)
Current-account balance (c)
Contribution to GDP growth: Domestic demand
Inventories
Net exports
GNI (GDP deflator)
Table II.18.1:
Main features of country forecast - SLOVAKIA
2020 Annual percentage change
GDP
Private Consumption
Public Consumption
Gross fixed capital formation
of which: equipment
Exports (goods and services)
Imports (goods and services)

19. FINLAND
102
Recovery already in 2021
Finland’s economy grew strongly (2.2% quarter-
on-quarter) in the second quarter of 2021, after a
weak first quarter. All demand components
contributed to the result, with private consumption
clearly leading the pack. This is expected to
continue, albeit at a slower pace, with GDP
surpassing its 2019-level by the third quarter of
this year. Early high-frequency indicators point to
improved consumer and business outlook for the
second half of the year. The vaccination rate is
relatively high, providing another reassurance for
economic activity. Following a contraction of
2.9% in 2020, annual GDP is forecast to grow by
3.4% in 2021. While the economy has recovered
overall, the worst-hit sectors still need time to
recover fully, relying heavily on further
normalisation in the external environment.
Domestic demand to drive solid growth ahead
GDP is forecast to grow by 2.8% in 2022 when the
growth momentum is expected to take full effect,
with a normalisation of the services sector. In 2023
the economic cycle is projected to normalise
towards the long-term potential GDP growth rate
(1.2 - 1.4%), with an estimated 2.0% growth.
Domestic demand is set to drive GDP growth in
the medium term. Private consumption is forecast
to dominate, as consumers readjust their
consumption patterns and employment and wages
grow. In addition, the accumulated savings during
the crisis and favourable financing conditions
should further support private consumption. On the
other hand, public consumption, while strong
during the peak of the crisis and also in 2021, is
expected to stabilise and to subsequently gradually
decline, as the need for the extra spending
dissipates and economy grows.
Investment growth is forecast to gather pace on the
back of strengthening business confidence,
rekindled interest in the residential property, low
interest rates and buoyant demand. This is set to be
further strengthened by public investment plans,
which will be partly financed by the Recovery and
Resilience Facility (RRF), especially in the area of
the green transition. Exports are forecast to grow
in line with the global recovery, maintaining
Finland’s export market share.
The risks to the outlook are balanced. On the
downside, apart from lingering pandemic risks,
possible supply bottlenecks and a possible strong
acceleration in prices could hamper private
consumption and hence growth prospects. On the
upside, growth could be even stronger if
consumers markedly decrease their accumulated
savings.
Rising employment and the return of inflation
Employment is expected to continue growing
towards pre-pandemic levels, with crisis-hit sectors
expected to catch up substantially during 2022.
Wages are expected to rise moderately in 2022 and
2023.
Consumer prices are rising strongly in 2021
primarily because of a strong upswing in energy
prices. This factor is expected to fade away in
2022, but the recovery in the services’ sector,
general demand pressures and tightening labour
market are set to keep inflation over the forecast
horizon higher than in recent years.
-8
-6
-4
-2
0
2
4
6
14 15 16 17 18 19 20 21 22 23
Graph II.19.1: Finland - Real GDP growth and
contributions
Net exports Investment
Priv. consumption Gov. consumption
Inventories Real GDP (y-o-y%)
forecastpps.
Thanks to a strong GDP rebound in the second quarter of this year and a relatively mild economic
contraction last year, economic activity has already reached the pre-crisis level in mid-2021. Economic
growth is expected to continue over the forecast horizon, driven by private consumption and investment,
favourably impacting the labour market. Public finances are also improving on the back of the ongoing
recovery.

Euro Area Member States, Finland
103
The deficit gradually returns to the pre-crisis
trend
In 2021, the general government deficit is forecast
to narrow to 3¾% of GDP on the back of the
strong economic rebound and the reduction of
COVID-19 support measures. The strong recovery
of output, employment and domestic demand is
expected to boost tax and social contribution
revenues, while fewer lay-offs will ease the burden
of social expenditure. Fiscal measures related to
the pandemic are projected to amount to 1¾% of
GDP, consisting mainly of temporary health-
related expenditure and support measures for
companies.
In 2022, economic growth, recovery on the labour
market and the planned termination of the
pandemic-related measures are expected to lead to
a further improvement in public finances. The
general government deficit is projected to decline
to close to 2½% of GDP. This trend is forecast to
continue also in 2023. The planned withdrawal of
temporary fiscal measures stemming from the
government’s original programme adopted in 2019
it set to help improve the balance in 2023 by about
½% of GDP. In 2023, the General Government
deficit is forecast to shrink to 1% of GDP, close to
the pre-pandemic level. The RRF-financed
expenditure is projected to support the economic
growth in 2022 and 2023 with capital investments
and spending on human capital.
The public debt ratio, which increased some 10
pps. during the pandemic, is expected to stabilise.
It is forecast to reach 71% of GDP in 2021 and
remain at this level through 2023.
bn EUR Curr. prices % GDP 02-17 2018 2019 2020 2021 2022 2023
236.2 100.0 1.3 1.1 1.3 -2.9 3.4 2.8 2.0
120.7 51.1 1.9 1.7 0.7 -4.7 3.1 3.8 2.2
57.7 24.4 1.0 2.0 2.0 0.5 3.2 0.0 -1.0
57.1 24.2 1.2 3.6 -1.6 -0.7 3.1 3.6 3.8
12.0 5.1 1.8 -1.7 -4.9 -0.6 9.2 7.0 8.5
85.5 36.2 2.5 1.5 6.8 -6.8 8.1 6.6 4.7
84.7 35.8 3.4 5.7 2.3 -6.5 7.3 6.6 4.4
240.2 101.7 1.3 1.5 1.4 -1.7 3.5 2.9 2.1
1.5 2.2 0.4 -2.5 3.1 2.8 1.8
0.1 0.5 -0.8 -0.2 0.0 0.0 0.0
-0.2 -1.6 1.7 -0.1 0.3 0.0 0.2
0.6 2.5 1.8 -2.1 2.0 1.5 0.7
8.3 7.4 6.7 7.8 7.7 6.9 6.5
2.2 1.3 1.3 0.8 1.9 2.6 2.8
1.4 2.6 1.7 1.6 0.5 1.2 1.5
0.0 0.6 0.2 0.3 -1.4 -0.8 -0.8
7.8 7.2 8.7 12.8 9.7 7.9 7.0
1.5 2.0 1.5 1.3 1.9 2.0 2.3
1.6 1.2 1.1 0.4 1.8 1.9 1.9
-0.7 0.8 -0.9 1.4 -0.2 -0.1 0.1
4.6 0.1 1.0 1.2 1.8 2.0 2.2
1.6 -1.8 -0.3 0.8 1.2 1.2 1.5
1.7 -1.8 -0.2 0.9 1.3 1.3 1.6
0.4 -0.9 -0.9 -5.5 -3.8 -2.4 -1.1
0.8 -1.1 -1.1 -3.3 -2.8 -2.0 -1.1
-1.0 -1.0 -1.2 -3.3 -2.8 -2.0 -1.1
47.8 59.8 59.5 69.5 71.2 71.2 71.0
GNI (GDP deflator)
Table II.19.1:
Main features of country forecast - FINLAND
2020 Annual percentage change
GDP
Private Consumption
Public Consumption
Gross fixed capital formation
of which: equipment
Exports (goods and services)
Imports (goods and services)
Contribution to GDP growth: Domestic demand
Inventories
Net exports
Net lending (+) or borrowing (-) vis-a-vis ROW (c)
Employment
Unemployment rate (a)
Compensation of employees / head
Unit labour costs whole economy
Real unit labour cost
Saving rate of households (b)
GDP deflator
Harmonised index of consumer prices
Terms of trade goods
Trade balance (goods) (c)
Current-account balance (c)
General government balance (c)
Cyclically-adjusted budget balance (d)
Structural budget balance (d)
General government gross debt (c)
(a) Eurostat definition. (b) gross saving divided by adjusted gross disposable income. (c) as a % of GDP. (d) as a % of potential GDP.
Note : Contributions to GDP growth may not add up due to statistical discrepancies.


Non-EA Member States

20. BULGARIA
106
Recovery postponed
After the swift rebound in the third quarter of last
year, real GDP remained roughly unchanged until
mid-2021. Investment activity continued to
stagnate in the first half of the year, constrained by
still high uncertainty. Services exports regained
some ground but remained well below full
capacity. The short-term indicators point to some
40% fewer foreign tourist arrivals during the peak
July-August season. Although the accommodation
industry partially compensated for the shortfall in
foreign demand by attracting domestic visitors,
both the number of beds available and the
occupancy rate were well below normal levels.
On the positive side, private consumption
remained robust, underpinned by the expansion of
disposable income. Exports of goods recovered
swiftly, benefitting from the pick-up in external
demand. Following the supportive fiscal policy of
2020, government consumption continued to
contribute to aggregate demand in the first half of
2021.
In response to the rise in coronavirus cases, the
COVID-19 certificate was introduced for visitors
and workers in public places as of 21 October
2021. Given the low vaccination rates in the
country, these restrictions are set to weigh on
private consumption for several months, until
smooth operation of the new regime and higher
vaccination rates are achieved. Overall, real GDP
is forecast to grow by 3.8% in the current year.
In 2022, GDP growth is forecast to accelerate to
4.1% and remain strong at 3.5% in 2023. The
forecast incorporates expenditures financed by
RRF grants, for a cumulative amount of 4.3% of
2019 GDP over the forecast horizon. Recent hikes
in energy and food prices are set to erode the
purchasing power of low-income households.
However, increases in social transfers and
pensions in the current and next year should offset
the effect of higher prices on households’ budgets.
The expansion of consumer demand is set to
continue on the back of a tight labour market, high
consumer confidence and strong lending activity.
Goods exports are forecast to grow in parallel with
external demand, while services exports are
projected to recover more gradually.
The risks to the forecast are tilted to the downside.
The new introduction of the COVID-19 certificate
may prove insufficient to contain infection rates
and adjustment to the new normal may take longer.
In addition, the impact of higher energy prices on
headline inflation and consequently on private
consumption may be stronger than expected.
Labour market set to tighten gradually
After an initial surge at the onset of the COVID-19
pandemic, the seasonally adjusted unemployment
rate has stabilised at around 5.5% since June 2020.
In parallel, the labour market participation rate has
dropped on average by around 1 ppt since the
beginning of the crisis. The government’s job
retention schemes have played a significant role in
minimising job losses by allowing a temporary
transition towards short-time work schemes. In the
next two years, the favourable economic outlook is
set to tighten the labour market, with
-8
-6
-4
-2
0
2
4
6
14 15 16 17 18 19 20 21 22 23
Graph II.20.1: Bulgaria - Real GDP growth and
contributions
Net exports Investment
Priv. consumption Gov. consumption
Inventories Real GDP (y-o-y%)
forecastpps.
In the first half of 2021, the economic recovery in Bulgaria was held back by high economic uncertainty
and containment measures. Investment and services exports remained supressed, while domestic
consumption and goods exports contributed positively to aggregate demand. These two factors,
combined with the implementation of the Recovery and Resilience Plan, are set to boost economic
growth in the next two years. The fiscal stimulus remains strong in 2021. As of 2022, the budget deficit
is expected to narrow. Low vaccination rates and high energy prices present short-term challenges to
the recovery.

Non-EA Member States, Bulgaria
107
unemployment rates gradually declining to 4.6% in
2022 and 4.4% in 2023. At the same time, the
transition back to full-time work and a projected
increase in activity rates are forecast to partially
alleviate the pressure on the labour market and on
wages. Nevertheless, growth of wages is expected
to remain strong at 9% in 2022 and 7.9% in 2023.
Headline inflation to accelerate
HICP inflation accelerated sharply in the second
and third quarters of 2021 on account of higher
prices of energy and unprocessed food. The
seasonal price increases in tourism services have
been less pronounced, which helped contain
overall services inflation. Annual inflation is set to
accelerate to 2.4% in 2021 and 2.9% in 2022 on
the back of high energy prices and their second-
round effects. Inflation is then forecast to
decelerate to 1.8% in 2023 as these effects are
expected to dissipate.
Fiscal stimulus remained strong
The general government deficit is projected at
3.6% of GDP in 2021. The improvement from the
previous year’s deficit of 4% of GDP is mainly
due to statistical corrections in 2020 general
government accounts. The fiscal stimulus has
remained robust in 2021, as the government
extended the emergency support to households,
businesses and the health sector, and put in place
new measures to support vulnerable groups.
However, a recovery in tax revenues is set to
offsets the impact on the deficit of still strong
expenditure growth. The deficit is forecast to
decrease in 2022 as most of the emergency
measures are set to discontinue and larger receipts
from the EU, including the RRF, are planned to
finance most of the forecast increase in public
investment. General government debt is expected
to be around 26.7% of GDP in 2021 and remain
around that level thereafter.
bn BGN Curr. prices % GDP 02-17 2018 2019 2020 2021 2022 2023
120.0 100.0 3.4 2.7 4.0 -4.4 3.8 4.1 3.5
70.4 58.7 3.8 3.7 6.0 -0.4 6.0 3.0 3.4
23.4 19.5 1.6 5.3 2.0 8.3 -1.0 0.5 -0.9
23.0 19.2 4.0 5.4 4.5 0.6 -2.3 4.0 6.9
10.4 8.7 3.1 8.8 15.1 3.3 -8.6 2.7 7.7
66.4 55.3 7.6 1.7 4.0 -12.1 10.0 8.0 5.4
64.6 53.9 7.3 5.8 5.2 -5.4 8.0 5.9 5.0
115.8 96.6 3.5 -3.5 4.6 -3.6 3.9 3.5 3.4
3.8 4.1 4.7 1.3 2.9 2.6 3.1
0.0 1.1 0.0 -1.2 -0.3 0.0 0.0
-0.4 -2.4 -0.7 -4.4 1.2 1.5 0.4
0.6 -0.1 0.3 -2.3 0.0 0.9 0.6
10.2 5.2 4.2 5.1 5.1 4.6 4.4
8.1 9.7 6.9 7.2 9.7 9.0 7.9
5.2 6.7 3.1 9.5 5.7 5.6 4.9
0.9 2.4 -2.0 5.1 1.8 0.9 1.3
: : : : : : :
4.2 4.2 5.2 4.2 3.9 4.6 3.5
3.4 2.6 2.5 1.2 2.4 2.9 1.8
1.6 0.7 1.9 4.3 1.3 -1.9 1.0
-13.2 -4.8 -4.7 -3.2 -3.4 -3.4 -2.8
-5.2 1.0 1.9 -0.6 0.4 1.2 2.7
-4.1 2.0 3.3 0.9 2.4 3.7 5.0
-0.6 1.7 2.1 -4.0 -3.6 -2.8 -2.1
-0.7 1.5 1.3 -2.9 -3.1 -2.8 -2.5
-0.3 1.5 1.3 -2.9 -3.1 -2.8 -2.5
24.5 22.1 20.0 24.7 26.7 26.7 26.8
General government balance (c)
Cyclically-adjusted budget balance (d)
Structural budget balance (d)
General government gross debt (c)
(a) Eurostat definition. (b) gross saving divided by adjusted gross disposable income. (c) as a % of GDP. (d) as a % of potential GDP.
Note : Contributions to GDP growth may not add up due to statistical discrepancies.
Net lending (+) or borrowing (-) vis-a-vis ROW (c)
Employment
Unemployment rate (a)
Compensation of employees / head
Unit labour costs whole economy
Real unit labour cost
Saving rate of households (b)
GDP deflator
Harmonised index of consumer prices
Terms of trade goods
Trade balance (goods) (c)
Current-account balance (c)
Contribution to GDP growth: Domestic demand
Inventories
Net exports
GNI (GDP deflator)
Table II.20.1:
Main features of country forecast - BULGARIA
2020 Annual percentage change
GDP
Private Consumption
Public Consumption
Gross fixed capital formation
of which: equipment
Exports (goods and services)
Imports (goods and services)

21. CZECHIA
108
After the 1% quarter-on-quarter rebound in real
GDP amid easing pandemic-related restrictions in
the second quarter of 2021, economic growth in
Czechia is expected to moderate in the remainder
of this year. While domestic demand is forecast to
remain strong accompanied by surging imports,
supply chain disruptions are set to weigh on
production and exports, bringing annual GDP
growth to 3% in 2021. Economic growth is
projected to increase to 4.4% in 2022, before
returning close to average growth at 3.2% in 2023.
Therewith, the Czech economy is set to reach its
pre-pandemic output level in 2022-Q3.
Supported by increasing real disposable income,
private consumption bounced back sharply in
2021-Q2 and is expected to remain one of the main
growth drivers also for the rest of the year. While
the savings rate is set to remain high in 2021, it is
projected to start declining in 2022, given stable
economic conditions and more spending
opportunities. Private investment also rebounded
significantly and is expected to remain strong over
the forecast horizon, stimulated by external
demand and favourable financing conditions.
A boost to public investment by the EU funds is
forecast from 2022 onwards. Government
consumption is projected to grow at a sustained
pace in 2021, fuelled by pandemic-related
spending and an increase in the public sector
employment bill. In 2022, the growth of
government consumption is set to slow as
pandemic-related expenditure is phased-out.
Trade impacted by supply-chain challenges
Net exports are forecast to contribute negatively to
growth in 2021 due to the intensifying supply
chain disruptions. With this factor expected to
diminish in the course of 2022, net exports are
expected to restart its contribution to economic
growth in 2023. After being initially depleted
during the pandemic, inventories are also projected
to contribute significantly to GDP growth in 2021.
Labour market to remain robust
The unemployment rate is expected to remain low.
With its tight labour market and a low share of
temporary contracts, Czechia’s labour market was
in a good position to absorb the impact of the
crisis. The unemployment rate is set to increase
only slightly this year, to 2.7%. The accelerating
economic growth is expected to improve labour
market conditions over the forecast horizon, with
the unemployment rate decreasing to 2.6% in 2022
and 2.4% in 2023.
Inflation expected to rise
Inflationary pressures have intensified recently,
driven by rising production input prices and
increased consumer demand. Annual HICP growth
is thus expected to increase to 3.3% in 2021.
In response to mounting risks of above target
inflation the Czech National Bank recently raised
the policy rates. As regulated energy prices are set
to be raised at the beginning of 2022, inflation is
expected to peak at 3.4% in 2022. Well-anchored
inflation expectations are projected to prevent
temporary price pressures from becoming
-8
-6
-4
-2
0
2
4
6
8
14 15 16 17 18 19 20 21 22 23
Graph II.21.1: Czechia - Real GDP growth and
contributions
Net exports Investment
Priv. consumption Gov. consumption
Inventories Real GDP (y-o-y%)
forecastpps.
While recovering from the 2020 recession, the negative impact of supply-chain disruptions pose
headwinds for the Czech economy in 2021. Economic activity is forecast to accelerate in early 2022,
driven by both domestic and foreign demand, including public investment supported by the Recovery
and Resilience Facility. Inflation is projected to rise in 2021 and 2022 due to the combination of rising
energy prices, supply-side bottlenecks and robust demand, but to slow thereafter. While the government
budget deficit is set to start decreasing in 2022, permanent measures are expected to keep the deficit
above pre-pandemic levels. The government debt-to-GDP ratio remains low but is expected to increase.

Non-EA Member States, Czechia
109
permanent, allowing inflation to slow to 2.3%
in 2023.
Fiscal consolidation to start in 2022
The budget deficit is set to widen further in 2021
to 7.0% of GDP, compared to 5.6% in 2020. This
is driven by higher expenditure triggered by the
extensive fiscal stimulus including the support
measures to counter the COVID-19 pandemic,
a reduction in personal income taxes, and further
increases in pensions and public wages. The
expected recovery of private consumption and the
higher growth in salaries in 2021 leads to increases
in indirect taxes and social security contributions,
which are, however, not fully offsetting higher
government expenses.
The government deficit is set to decline to 4.3% of
GDP in 2022. The COVID-19 support measures
started to be withdrawn in the second half of 2021
and are not expected to impact public finances in
2022 anymore. However, some permanent
measures taken during the pandemic (e.g. the cut
in personal income taxes) will continue to affect
budget revenues. Accelerating inflation and higher
salaries will also put pressure on government
expenses (pension indexation linked to salaries and
inflation, higher intermediate consumption or
compensation of state employees), but will also
support growth of revenues. This trend is set to
continue in 2023 when revenues growth is forecast
only slightly higher than the growth in
expenditures. The headline general budget deficit
is expected to decrease further to 3.9%, but still
staying well above the levels before the start of the
pandemic. The composition of expenditures is
projected to shift towards investments. With the
support from the Recovery and Resilience Facility
(RRF) and other EU funds, public fixed capital
formation is set to surpass 5% of GDP for the first
time in the last 10 years. The forecast also
incorporates expenditures financed by RRF grants,
for a cumulative amount of 1.7% of 2019 GDP
over the forecast horizon.
While public debt is still low compared to other
EU Member States, the expected pace of its
growth in 2020-2023 is above the EU average. The
public debt-to-GDP ratio, which stood at 37.7% in
2020, is forecast to rise to 44.3% in 2022 and
46.3% in 2023, driven by the negative headline
balance, being only partly offset by nominal
GDP growth.
bn CZK Curr. prices % GDP 02-17 2018 2019 2020 2021 2022 2023
5694.6 100.0 2.8 3.2 3.0 -5.8 3.0 4.4 3.2
2595.7 45.6 2.5 3.5 2.7 -6.8 4.0 5.5 2.3
1232.4 21.6 1.5 3.8 2.5 3.4 1.5 0.7 1.5
1494.6 26.2 2.2 10.0 5.9 -7.2 6.4 10.7 4.3
545.5 9.6 2.9 8.9 2.6 -13.7 8.5 12.5 0.0
4042.5 71.0 7.9 3.7 1.5 -6.9 8.4 4.5 5.9
3653.5 64.2 7.2 5.8 1.5 -6.9 13.4 4.6 5.4
5496.1 96.5 2.6 3.4 2.4 -3.2 2.2 3.7 3.2
2.1 4.9 3.3 -4.5 3.8 5.6 2.6
0.1 -0.5 -0.3 -0.9 1.8 -1.3 0.0
0.7 -1.2 0.0 -0.5 -2.6 0.1 0.6
0.6 1.3 0.2 -1.7 0.5 0.5 0.4
6.3 2.2 2.0 2.6 2.7 2.6 2.4
4.3 8.1 7.2 3.2 6.0 6.9 4.9
2.0 6.1 4.3 7.7 3.4 2.9 2.0
0.5 3.5 0.4 3.2 -0.5 -0.1 -0.4
11.9 12.2 13.1 21.0 20.1 16.8 16.8
1.5 2.6 3.9 4.4 3.9 3.1 2.5
1.8 2.0 2.6 3.3 3.3 3.4 2.3
-0.1 -0.2 0.4 2.0 0.5 -0.8 0.6
1.2 3.7 4.1 5.0 2.5 1.4 2.1
-3.1 -0.6 -0.9 2.2 -1.2 -2.5 -1.7
-2.1 0.2 -0.4 3.5 0.0 -0.4 0.4
-2.6 0.9 0.3 -5.6 -7.0 -4.3 -3.9
-2.8 0.0 -0.8 -3.8 -5.7 -3.8 -3.8
0.1 0.0 -0.8 -3.8 -5.7 -3.8 -3.8
34.0 32.1 30.0 37.7 42.4 44.3 46.3
General government balance (c)
Cyclically-adjusted budget balance (d)
Structural budget balance (d)
General government gross debt (c)
(a) Eurostat definition. (b) gross saving divided by adjusted gross disposable income. (c) as a % of GDP. (d) as a % of potential GDP.
Net lending (+) or borrowing (-) vis-a-vis ROW (c)
Employment
Unemployment rate (a)
Compensation of employees / head
Unit labour costs whole economy
Real unit labour cost
Saving rate of households (b)
GDP deflator
Harmonised index of consumer prices
Terms of trade goods
Trade balance (goods) (c)
Current-account balance (c)
Contribution to GDP growth: Domestic demand
Inventories
Net exports
GNI (GDP deflator)
Table II.21.1:
Main features of country forecast - CZECHIA
2020 Annual percentage change
GDP
Private Consumption
Public Consumption
Gross fixed capital formation
of which: equipment
Exports (goods and services)
Imports (goods and services)
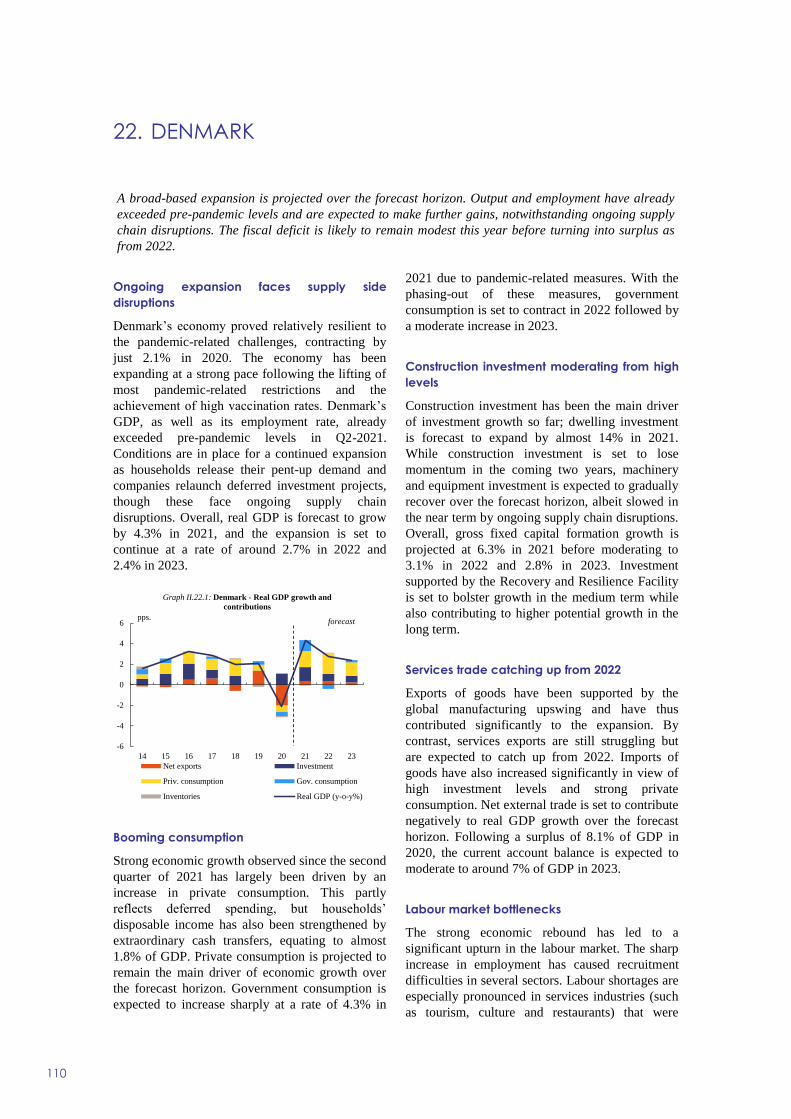
22. DENMARK
110
Ongoing expansion faces supply side
disruptions
Denmark’s economy proved relatively resilient to
the pandemic-related challenges, contracting by
just 2.1% in 2020. The economy has been
expanding at a strong pace following the lifting of
most pandemic-related restrictions and the
achievement of high vaccination rates. Denmark’s
GDP, as well as its employment rate, already
exceeded pre-pandemic levels in Q2-2021.
Conditions are in place for a continued expansion
as households release their pent-up demand and
companies relaunch deferred investment projects,
though these face ongoing supply chain
disruptions. Overall, real GDP is forecast to grow
by 4.3% in 2021, and the expansion is set to
continue at a rate of around 2.7% in 2022 and
2.4% in 2023.
Booming consumption
Strong economic growth observed since the second
quarter of 2021 has largely been driven by an
increase in private consumption. This partly
reflects deferred spending, but households’
disposable income has also been strengthened by
extraordinary cash transfers, equating to almost
1.8% of GDP. Private consumption is projected to
remain the main driver of economic growth over
the forecast horizon. Government consumption is
expected to increase sharply at a rate of 4.3% in
2021 due to pandemic-related measures. With the
phasing-out of these measures, government
consumption is set to contract in 2022 followed by
a moderate increase in 2023.
Construction investment moderating from high
levels
Construction investment has been the main driver
of investment growth so far; dwelling investment
is forecast to expand by almost 14% in 2021.
While construction investment is set to lose
momentum in the coming two years, machinery
and equipment investment is expected to gradually
recover over the forecast horizon, albeit slowed in
the near term by ongoing supply chain disruptions.
Overall, gross fixed capital formation growth is
projected at 6.3% in 2021 before moderating to
3.1% in 2022 and 2.8% in 2023. Investment
supported by the Recovery and Resilience Facility
is set to bolster growth in the medium term while
also contributing to higher potential growth in the
long term.
Services trade catching up from 2022
Exports of goods have been supported by the
global manufacturing upswing and have thus
contributed significantly to the expansion. By
contrast, services exports are still struggling but
are expected to catch up from 2022. Imports of
goods have also increased significantly in view of
high investment levels and strong private
consumption. Net external trade is set to contribute
negatively to real GDP growth over the forecast
horizon. Following a surplus of 8.1% of GDP in
2020, the current account balance is expected to
moderate to around 7% of GDP in 2023.
Labour market bottlenecks
The strong economic rebound has led to a
significant upturn in the labour market. The sharp
increase in employment has caused recruitment
difficulties in several sectors. Labour shortages are
especially pronounced in services industries (such
as tourism, culture and restaurants) that were
-6
-4
-2
0
2
4
6
14 15 16 17 18 19 20 21 22 23
Graph II.22.1: Denmark - Real GDP growth and
contributions
Net exports Investment
Priv. consumption Gov. consumption
Inventories Real GDP (y-o-y%)
forecastpps.
A broad-based expansion is projected over the forecast horizon. Output and employment have already
exceeded pre-pandemic levels and are expected to make further gains, notwithstanding ongoing supply
chain disruptions. The fiscal deficit is likely to remain modest this year before turning into surplus as
from 2022.
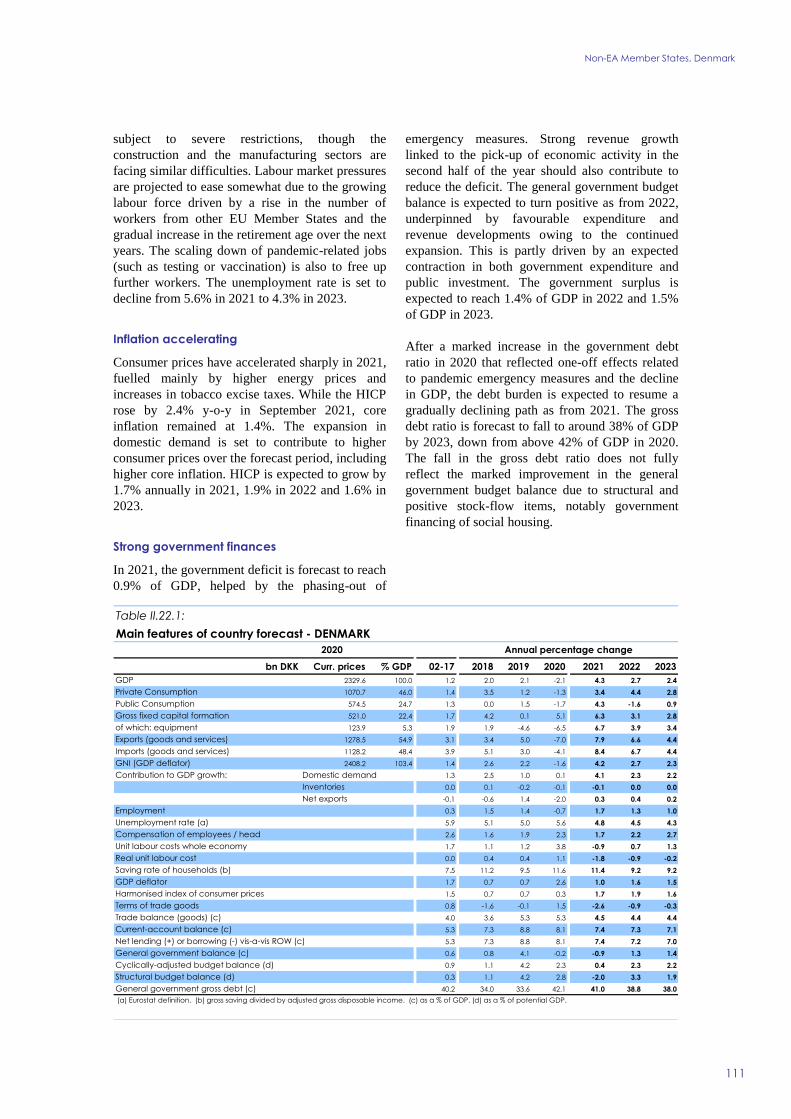
Non-EA Member States, Denmark
111
subject to severe restrictions, though the
construction and the manufacturing sectors are
facing similar difficulties. Labour market pressures
are projected to ease somewhat due to the growing
labour force driven by a rise in the number of
workers from other EU Member States and the
gradual increase in the retirement age over the next
years. The scaling down of pandemic-related jobs
(such as testing or vaccination) is also to free up
further workers. The unemployment rate is set to
decline from 5.6% in 2021 to 4.3% in 2023.
Inflation accelerating
Consumer prices have accelerated sharply in 2021,
fuelled mainly by higher energy prices and
increases in tobacco excise taxes. While the HICP
rose by 2.4% y-o-y in September 2021, core
inflation remained at 1.4%. The expansion in
domestic demand is set to contribute to higher
consumer prices over the forecast period, including
higher core inflation. HICP is expected to grow by
1.7% annually in 2021, 1.9% in 2022 and 1.6% in
2023.
Strong government finances
In 2021, the government deficit is forecast to reach
0.9% of GDP, helped by the phasing-out of
emergency measures. Strong revenue growth
linked to the pick-up of economic activity in the
second half of the year should also contribute to
reduce the deficit. The general government budget
balance is expected to turn positive as from 2022,
underpinned by favourable expenditure and
revenue developments owing to the continued
expansion. This is partly driven by an expected
contraction in both government expenditure and
public investment. The government surplus is
expected to reach 1.4% of GDP in 2022 and 1.5%
of GDP in 2023.
After a marked increase in the government debt
ratio in 2020 that reflected one-off effects related
to pandemic emergency measures and the decline
in GDP, the debt burden is expected to resume a
gradually declining path as from 2021. The gross
debt ratio is forecast to fall to around 38% of GDP
by 2023, down from above 42% of GDP in 2020.
The fall in the gross debt ratio does not fully
reflect the marked improvement in the general
government budget balance due to structural and
positive stock-flow items, notably government
financing of social housing.
bn DKK Curr. prices % GDP 02-17 2018 2019 2020 2021 2022 2023
2329.6 100.0 1.2 2.0 2.1 -2.1 4.3 2.7 2.4
1070.7 46.0 1.4 3.5 1.2 -1.3 3.4 4.4 2.8
574.5 24.7 1.3 0.0 1.5 -1.7 4.3 -1.6 0.9
521.0 22.4 1.7 4.2 0.1 5.1 6.3 3.1 2.8
123.9 5.3 1.9 1.9 -4.6 -6.5 6.7 3.9 3.4
1278.5 54.9 3.1 3.4 5.0 -7.0 7.9 6.6 4.4
1128.2 48.4 3.9 5.1 3.0 -4.1 8.4 6.7 4.4
2408.2 103.4 1.4 2.6 2.2 -1.6 4.2 2.7 2.3
1.3 2.5 1.0 0.1 4.1 2.3 2.2
0.0 0.1 -0.2 -0.1 -0.1 0.0 0.0
-0.1 -0.6 1.4 -2.0 0.3 0.4 0.2
0.3 1.5 1.4 -0.7 1.7 1.3 1.0
5.9 5.1 5.0 5.6 4.8 4.5 4.3
2.6 1.6 1.9 2.3 1.7 2.2 2.7
1.7 1.1 1.2 3.8 -0.9 0.7 1.3
0.0 0.4 0.4 1.1 -1.8 -0.9 -0.2
7.5 11.2 9.5 11.6 11.4 9.2 9.2
1.7 0.7 0.7 2.6 1.0 1.6 1.5
1.5 0.7 0.7 0.3 1.7 1.9 1.6
0.8 -1.6 -0.1 1.5 -2.6 -0.9 -0.3
4.0 3.6 5.3 5.3 4.5 4.4 4.4
5.3 7.3 8.8 8.1 7.4 7.3 7.1
5.3 7.3 8.8 8.1 7.4 7.2 7.0
0.6 0.8 4.1 -0.2 -0.9 1.3 1.4
0.9 1.1 4.2 2.3 0.4 2.3 2.2
0.3 1.1 4.2 2.8 -2.0 3.3 1.9
40.2 34.0 33.6 42.1 41.0 38.8 38.0
General government balance (c)
Cyclically-adjusted budget balance (d)
Structural budget balance (d)
General government gross debt (c)
(a) Eurostat definition. (b) gross saving divided by adjusted gross disposable income. (c) as a % of GDP. (d) as a % of potential GDP.
Net lending (+) or borrowing (-) vis-a-vis ROW (c)
Employment
Unemployment rate (a)
Compensation of employees / head
Unit labour costs whole economy
Real unit labour cost
Saving rate of households (b)
GDP deflator
Harmonised index of consumer prices
Terms of trade goods
Trade balance (goods) (c)
Current-account balance (c)
Contribution to GDP growth: Domestic demand
Inventories
Net exports
GNI (GDP deflator)
Table II.22.1:
Main features of country forecast - DENMARK
2020 Annual percentage change
GDP
Private Consumption
Public Consumption
Gross fixed capital formation
of which: equipment
Exports (goods and services)
Imports (goods and services)

23. CROATIA
112
Strong rebound in the first half of 2021
In the first half of 2021, Croatia’s economy
continued to rebound strongly from the significant
drop in output recorded in 2020. The recovery was
mostly driven by strong household consumption
growth, although other components also provided
support. Short-term indicators point to a
continuation of positive developments in the rest
of the year, with tourism and goods exports
showing notably strong performances.
Favourable outlook, but risks persist
Domestic demand should be the main engine of
growth throughout the forecast period. Household
consumption growth is expected to remain robust,
supported by favourable labour market
developments, high accumulated savings, and
growth in consumer loans. Government
consumption should also remain supportive of the
expansion although its contribution to growth is
expected to decline. Investment is expected to
accelerate, supported by the Recovery and
Resilience Facility (RRF), the previous and current
Multiannual Financial Frameworks and the
Solidarity fund disbursements to support post-
earthquake reconstruction. In particular, the RRF
total absorption in the period 2020-2023 is
expected to stand at 5.2% of 2019 GDP. With
time, these funds are likely to crowd-in additional
private investments, which should also continue to
be supported by favourable financing conditions.
Moreover, the reforms set to be implemented
under the Recovery and Resilience Plan (RRP) are
bound to sustain business confidence.
As for the external sector, goods exports should
rise in line with the improving economic
conditions in Croatia’s main trading partners. After
surprising positively in 2021, tourism-dominated
services exports should remain on a solid growth
path throughout the forecast horizon. The main
supportive factors should be favourable economic
conditions in main origin markets and the gradual
normalisation of travel. Despite the expected solid
performance of goods exports, the merchandise
trade balance is expected to gradually deteriorate
due to the pronounced import dependence of final
demand, while the current account balance should
record mild surpluses.
Overall, real GDP is forecast to grow by 8.1% in
2021, followed by 5.6% and 3.4% growth in 2022
and 2023. Consequently, the volume of GDP
should reach its 2019 level during 2022. Key
downside risks stem from Croatia’s relatively low
vaccination rates, which could lead to stricter
containment measures, and continued delays of the
earthquake-related reconstruction. On the upside,
potential entry into the Schengen area and euro
adoption towards the end of the forecast period
could benefit investment and trade.
Dynamic labour market
After reaching 7.5% in 2020, the unemployment
rate is expected to gradually decline throughout the
forecasting period. Employment is expected to
reach its pre-crisis level already in 2021, as
administrative data points to strong performance in
the first seven months of this year. In the forecast
horizon, labour market dynamics are expected to
be driven by the overall expansion of economic
activity, the expected acceleration of the
investment cycle and RRF-sponsored active labour
market policies.
-10
-8
-6
-4
-2
0
2
4
6
8
10
14 15 16 17 18 19 20 21 22 23
Graph II.23.1: Croatia - Real GDP growth and
contributions
Net exports Investment
Priv. consumption Gov. consumption
Inventories Real GDP (y-o-y%)
forecastpps.
The recovery of Croatia’s economy continued in 2021, mostly supported by strong private consumption
and a better-than-expected performance of the tourism sector. Favourable economic developments
spilled over to the labour market, which experienced strong employment dynamics. With the general
government deficit also improving after the deterioration in 2020, the debt is set to steadily decline.
Although the outlook is favourable, several risks could weigh on the growth trajectory.
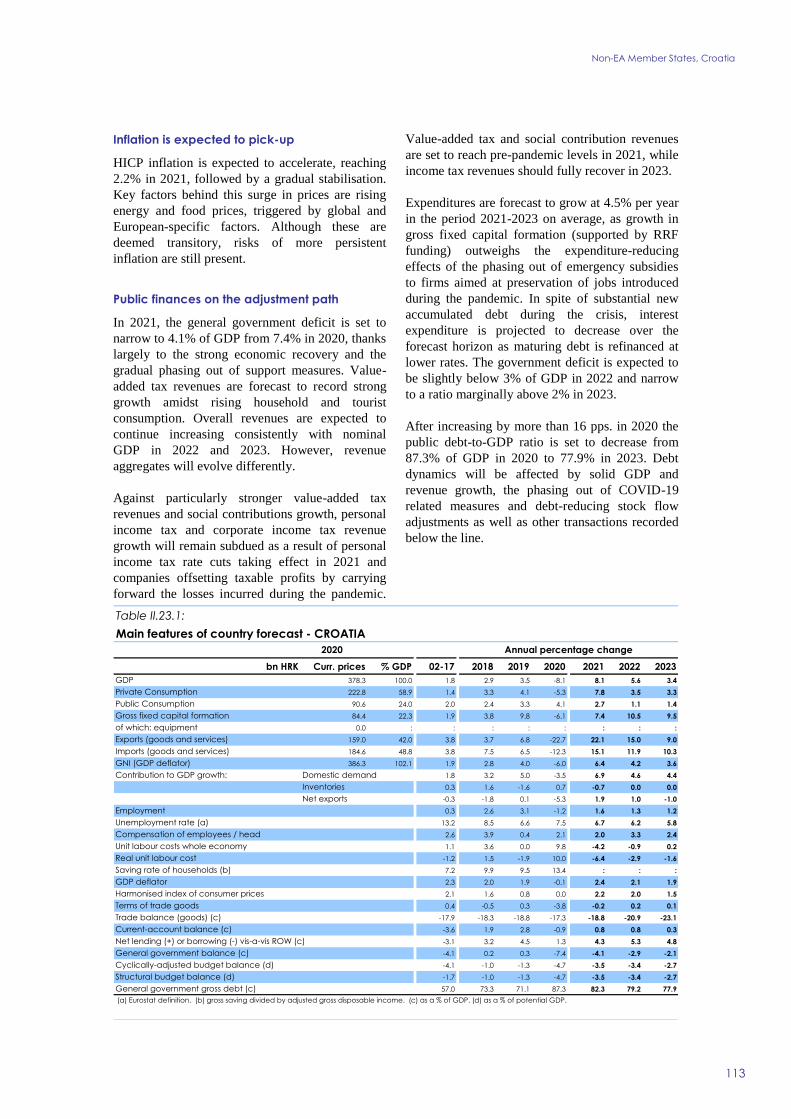
Non-EA Member States, Croatia
113
Inflation is expected to pick-up
HICP inflation is expected to accelerate, reaching
2.2% in 2021, followed by a gradual stabilisation.
Key factors behind this surge in prices are rising
energy and food prices, triggered by global and
European-specific factors. Although these are
deemed transitory, risks of more persistent
inflation are still present.
Public finances on the adjustment path
In 2021, the general government deficit is set to
narrow to 4.1% of GDP from 7.4% in 2020, thanks
largely to the strong economic recovery and the
gradual phasing out of support measures. Value-
added tax revenues are forecast to record strong
growth amidst rising household and tourist
consumption. Overall revenues are expected to
continue increasing consistently with nominal
GDP in 2022 and 2023. However, revenue
aggregates will evolve differently.
Against particularly stronger value-added tax
revenues and social contributions growth, personal
income tax and corporate income tax revenue
growth will remain subdued as a result of personal
income tax rate cuts taking effect in 2021 and
companies offsetting taxable profits by carrying
forward the losses incurred during the pandemic.
Value-added tax and social contribution revenues
are set to reach pre-pandemic levels in 2021, while
income tax revenues should fully recover in 2023.
Expenditures are forecast to grow at 4.5% per year
in the period 2021-2023 on average, as growth in
gross fixed capital formation (supported by RRF
funding) outweighs the expenditure-reducing
effects of the phasing out of emergency subsidies
to firms aimed at preservation of jobs introduced
during the pandemic. In spite of substantial new
accumulated debt during the crisis, interest
expenditure is projected to decrease over the
forecast horizon as maturing debt is refinanced at
lower rates. The government deficit is expected to
be slightly below 3% of GDP in 2022 and narrow
to a ratio marginally above 2% in 2023.
After increasing by more than 16 pps. in 2020 the
public debt-to-GDP ratio is set to decrease from
87.3% of GDP in 2020 to 77.9% in 2023. Debt
dynamics will be affected by solid GDP and
revenue growth, the phasing out of COVID-19
related measures and debt-reducing stock flow
adjustments as well as other transactions recorded
below the line.
bn HRK Curr. prices % GDP 02-17 2018 2019 2020 2021 2022 2023
378.3 100.0 1.8 2.9 3.5 -8.1 8.1 5.6 3.4
222.8 58.9 1.4 3.3 4.1 -5.3 7.8 3.5 3.3
90.6 24.0 2.0 2.4 3.3 4.1 2.7 1.1 1.4
84.4 22.3 1.9 3.8 9.8 -6.1 7.4 10.5 9.5
0.0 : : : : : : : :
159.0 42.0 3.8 3.7 6.8 -22.7 22.1 15.0 9.0
184.6 48.8 3.8 7.5 6.5 -12.3 15.1 11.9 10.3
386.3 102.1 1.9 2.8 4.0 -6.0 6.4 4.2 3.6
1.8 3.2 5.0 -3.5 6.9 4.6 4.4
0.3 1.6 -1.6 0.7 -0.7 0.0 0.0
-0.3 -1.8 0.1 -5.3 1.9 1.0 -1.0
0.3 2.6 3.1 -1.2 1.6 1.3 1.2
13.2 8.5 6.6 7.5 6.7 6.2 5.8
2.6 3.9 0.4 2.1 2.0 3.3 2.4
1.1 3.6 0.0 9.8 -4.2 -0.9 0.2
-1.2 1.5 -1.9 10.0 -6.4 -2.9 -1.6
7.2 9.9 9.5 13.4 : : :
2.3 2.0 1.9 -0.1 2.4 2.1 1.9
2.1 1.6 0.8 0.0 2.2 2.0 1.5
0.4 -0.5 0.3 -3.8 -0.2 0.2 0.1
-17.9 -18.3 -18.8 -17.3 -18.8 -20.9 -23.1
-3.6 1.9 2.8 -0.9 0.8 0.8 0.3
-3.1 3.2 4.5 1.3 4.3 5.3 4.8
-4.1 0.2 0.3 -7.4 -4.1 -2.9 -2.1
-4.1 -1.0 -1.3 -4.7 -3.5 -3.4 -2.7
-1.7 -1.0 -1.3 -4.7 -3.5 -3.4 -2.7
57.0 73.3 71.1 87.3 82.3 79.2 77.9
General government balance (c)
Cyclically-adjusted budget balance (d)
Structural budget balance (d)
General government gross debt (c)
(a) Eurostat definition. (b) gross saving divided by adjusted gross disposable income. (c) as a % of GDP. (d) as a % of potential GDP.
Net lending (+) or borrowing (-) vis-a-vis ROW (c)
Employment
Unemployment rate (a)
Compensation of employees / head
Unit labour costs whole economy
Real unit labour cost
Saving rate of households (b)
GDP deflator
Harmonised index of consumer prices
Terms of trade goods
Trade balance (goods) (c)
Current-account balance (c)
Contribution to GDP growth: Domestic demand
Inventories
Net exports
GNI (GDP deflator)
Table II.23.1:
Main features of country forecast - CROATIA
2020 Annual percentage change
GDP
Private Consumption
Public Consumption
Gross fixed capital formation
of which: equipment
Exports (goods and services)
Imports (goods and services)

24. HUNGARY
114
Fiscal stimulus offsets external headwinds
Hungary’s economy continued to grow robustly,
with GDP recovering to the pre-pandemic level in
the second quarter of 2021, despite temporary
restrictions on certain services to contain the
pandemic. While the services sector bounced back
in the summer, global supply chain disruptions are
set to dampen GDP growth in the second half of
the year. Annual GDP is projected to grow by
7.4% in 2021 following a 4.7% contraction in
2020. Economic growth is set to remain strong at
5.4% in 2022, boosted by continuing fiscal
stimulus. Growth is expected to slow to 3.2% in
2023 as output returns close to its potential and
policy support is gradually withdrawn.
Household consumption is forecast to benefit from
robust income gains, government support measures
and buoyant consumer confidence. Stimulus
measures aimed at boosting consumption in 2022
include a one-time income tax refund to families
with children, an income tax cut for workers under
age 25, the re-introduction of the 13th monthly
pension and administrative wage increases.
Investment is set to remain buoyant owing to the
improving economic outlook and to significant
policy support through grants and favourable
financing conditions. Public investment is also
expected to grow markedly in 2021-22. Capital
accumulation is set to slow down in 2023 after
public investment peaks and some support
schemes (i.e. the pre-natal loan and the home
renovation subsidy) are phased out.
The Hungarian economy is strongly integrated into
global value chains, making exports sensitive to
supply disruptions. As material shortages are
expected to abate from 2022, exports are projected
to remain dynamic despite slowing global demand.
At the same time, strong domestic demand is
forecast to fuel imports, while higher global energy
prices are set to worsen Hungary’s terms of trade.
The current account is thus forecast to deteriorate
in 2022, before improving again in 2023.
Uncertainty regarding consumer behaviour creates
symmetric risks to the outlook. Fiscal stimulus
may boost consumption even more than assumed,
but at the same time, higher than expected inflation
might impair households’ purchasing power.
Wage pressure is building up
Employment reached its pre-pandemic level in the
summer of 2021 and job creation is set to continue
as the economy grows. Unemployment is forecast
to fall to historic low levels. Wage growth is set to
remain robust amid emerging signs of labour
shortages. A 20% minimum wage hike and
sizeable salary increases in the public sector are
projected to add to wage pressures in 2022.
Rising production costs keep inflation high
HICP inflation is set to peak at 6.7% in Q4 2021,
on the back of price hikes after the reopening of
the economy, global increases in goods and
commodity prices and the pass-through of earlier
currency depreciation. Regulated prices for
residential energy partially shield households from
commodity price increases. Still, firms are
expected to pass their higher energy and wage
costs on to consumers, boosting non-energy
inflation. After averaging 5.1% in 2021, inflation
is forecast at 4.8% in 2022 and 3.4% in 2023.
-8
-6
-4
-2
0
2
4
6
8
10
14 15 16 17 18 19 20 21 22 23
Graph II.24.1: Hungary - Real GDP growth and
contributions
Net exports Investment
Priv. consumption Gov. consumption
Inventories Real GDP (y-o-y%)
forecastpps.
Policy stimulus is set to sustain Hungary’s economic expansion despite headwinds from global supply
chain disruptions. Economic growth is set to remain dynamic in 2022 but slow down in 2023 as policy
support is gradually withdrawn. Rising commodity prices and wage pressures contribute to persistently
high inflation. Despite a strong rebound in output, the government deficit and debt are projected to
decline only gradually.

Non-EA Member States, Hungary
115
Fiscal expansion in 2021 and 2022
In 2021, despite a strong rebound in economic
activity, the general government deficit is forecast
to remain high, reaching 7.5% of GDP. Over the
course of the year, stronger-than-expected revenue
growth was matched by new expansionary
measures. The budgetary impact of the planned
refund of income tax to families, which will take
place in early 2022, is of more than 1% of GDP,
but will have a deficit-increasing impact in 2021 in
line with accrual recording. Other discretionary
measures in 2021 include, among others, a
subsidised loan programme for SMEs, a temporary
reduction in the local business tax, support for
home buying and renovation and a reduced VAT
rate on newly built houses. Public investment is
also set to accelerate markedly.
In 2022, the deficit remains at 5.7% of GDP
despite strong economic GDP growth. The
additional fiscal space generated by a robust
growth in revenues is set to be utilised for new
expansionary measures addressed to various social
groups. Those include, among others, a full re-
introduction of the 13th monthly pension, the
abolition of the vocational training contribution, an
additional 2.5 pps. cut to employers’ social
contributions, a service benefit for military and law
enforcement employees brought forward to 2022,
and a reduction in personal income tax for
employees under the age of 25.
The headline deficit in 2023 is set to decrease to
3.8% of GDP against the background of continued
expansion and gradual reduction in discretionary
spending. Revenue growth is expected to remain
robust, while spending in some of the categories,
such as public investments, capital transfers and
purchases of goods and services, is projected to
slowly revert to the pre-crisis path.
Over the forecast horizon, the debt-to-GDP ratio is
projected to decrease from 80.1% of GDP in 2020
to 76.4% in 2023. Although the high gross
financing need is set to decrease and the low
maturity of debt has risen, these remain challenges
in the medium term.
In absence of a Council Implementing Decision
approving Hungary’s RRP, this forecast builds on
the technical assumptions laid out in Box I.5.1 and
includes expenditures financed by RRF grants
envisaged in the plan, which are set to increase
from 0.7% of GDP in 2021 to 1.1% in 2023.
bn HUF Curr. prices % GDP 02-17 2018 2019 2020 2021 2022 2023
47988.5 100.0 2.1 5.4 4.6 -4.7 7.4 5.4 3.2
23846.8 49.7 1.7 5.1 5.0 -1.4 3.6 7.1 3.7
10132.5 21.1 1.7 1.8 4.2 0.4 3.7 0.8 0.7
12857.0 26.8 2.2 16.3 12.8 -6.9 7.6 8.4 3.4
4842.2 10.1 3.9 12.9 12.4 -9.0 8.9 7.4 6.0
38141.2 79.5 7.3 5.0 5.4 -5.9 10.9 9.5 8.8
37324.6 77.8 6.5 7.0 8.2 -3.5 7.7 10.3 8.6
46698.7 97.3 2.2 5.5 6.0 -4.7 6.9 5.3 3.1
1.8 6.5 6.5 -2.5 4.6 5.9 2.9
-0.3 0.1 0.1 -0.1 0.1 0.0 0.0
0.6 -1.2 -2.0 -2.1 2.7 -0.4 0.3
0.6 2.3 1.1 -1.0 3.0 2.0 0.8
7.8 3.7 3.4 4.3 4.1 3.1 2.9
4.8 6.4 6.9 1.9 7.7 9.4 6.4
3.3 3.3 3.4 5.9 3.2 5.8 4.0
-0.5 -1.4 -1.3 0.0 -1.4 1.2 0.3
10.8 15.1 14.9 15.1 17.9 14.6 14.1
3.8 4.8 4.8 5.9 4.7 4.5 3.7
3.8 2.9 3.4 3.4 5.1 4.8 3.4
-0.3 -1.0 0.5 2.0 -1.9 -0.9 0.5
-0.1 -1.7 -2.5 -1.0 -0.7 -2.2 -2.2
-3.1 0.0 -0.8 -1.6 -1.1 -2.4 -1.9
-1.6 2.2 1.0 0.1 0.6 0.2 0.7
-4.8 -2.1 -2.1 -8.0 -7.5 -5.7 -3.8
-4.7 -3.6 -3.7 -5.8 -6.8 -5.7 -3.6
-2.6 -3.6 -3.5 -5.8 -6.8 -5.7 -3.6
70.5 69.1 65.5 80.1 79.2 77.2 76.4
General government balance (c)
Cyclically-adjusted budget balance (d)
Structural budget balance (d)
General government gross debt (c)
(a) Eurostat definition. (b) gross saving divided by adjusted gross disposable income. (c) as a % of GDP. (d) as a % of potential GDP.
Net lending (+) or borrowing (-) vis-a-vis ROW (c)
Employment
Unemployment rate (a)
Compensation of employees / head
Unit labour costs whole economy
Real unit labour cost
Saving rate of households (b)
GDP deflator
Harmonised index of consumer prices
Terms of trade goods
Trade balance (goods) (c)
Current-account balance (c)
Contribution to GDP growth: Domestic demand
Inventories
Net exports
GNI (GDP deflator)
Table II.24.1:
Main features of country forecast - HUNGARY
2020 Annual percentage change
GDP
Private Consumption
Public Consumption
Gross fixed capital formation
of which: equipment
Exports (goods and services)
Imports (goods and services)

25. POLAND
116
GDP back to pre-pandemic levels
The Polish economy recovered strongly in the first
half of 2021. Real GDP reached its pre-crisis
levels in the second quarter of 2021, driven by the
gradual easing of COVID-19 restrictions and
increased confidence of businesses and consumers.
Although supply disruptions and soaring
commodity prices are creating headwinds for
industry in the second half of the year, a strong
performance of the labour market and increased
spending opportunities for consumers should keep
boosting economic activity, leaving real GDP
growth at 4.9% in 2021.
Strong growth to continue in 2022 and 2023
Economic growth is expected to remain strong in
2022 and 2023. Increasing household incomes, a
gradual fall of the savings rate, and policy support
resulting from changes in the personal income tax
will likely propel private consumption growth in
2022 and, to a lesser extent, in 2023. Investment
growth is also set to remain dynamic on the back
of a favourable financial position of companies,
firms’ need to increase capacity, and low
borrowing costs, which are also expected to
support the recovery in the construction sector. On
the external side, exports will likely benefit from
the recovery of Poland’s main trading partners.
Nevertheless, the trade balance is expected to
contribute negatively to growth in 2021 and 2022
given the strong increase in domestic demand,
which is set to boost imports. All in all, real GDP
growth is projected to reach 5.2% in 2022 and to
decelerate to 4.4% in 2023.
Wage growth fuelled by labour shortages
The labour market has proved resilient to the
crisis, with employment levels surpassing pre-
crisis peaks in the second quarter of 2021. Job
creation is set to continue as the economy grows,
but emerging labour shortages will likely act as a
significant drag on employment growth.
Consequently, the unemployment rate is expected
to increase to 3.3% in 2021 and to fall only slightly
to 3.0% in 2023. Wage growth is projected to
continue gathering pace driven by the drying-out
of labour supply and a minimum wage hike in
2022.
HICP inflation to increase in 2021 and 2022
Rising commodity prices, booming demand and
supply-side bottlenecks have contributed to a
steady and strong rise in HICP inflation in recent
months, which reached 5.6% in September. Strong
price dynamics are forecast to persist in the
remainder of 2021 and 2022, mainly as a result of
an increase in energy prices and unit labour costs,
which are set to put upward pressure on service
price inflation. Furthermore, food prices are
expected to increase partly driven by rising energy
prices that are passed through to input prices for
agricultural production. Some of these inflationary
pressures prompted the central bank to tighten
monetary policy, including by raising the policy
rate. HICP inflation is thus expected to reach 5.0%
in 2021 and to accelerate to 5.2% in 2022.
Inflation expectations are however assumed to
remain broadly contained, thus preventing
temporary price pressures from becoming
permanent and allowing inflation to slow to 2.6%
in 2023.
-6
-4
-2
0
2
4
6
14 15 16 17 18 19 20 21 22 23
Graph II.25.1: Poland - Real GDP growth and contributions
Net exports Investment
Priv. consumption Gov. consumption
Inventories Real GDP (y-o-y%)
forecastpps.
The Polish economy rebounded strongly in the first half of 2021, reaching pre-pandemic levels of GDP
in the second quarter of the year. Economic growth is expected to remain dynamic despite supply
disruptions and soaring commodity prices, mainly driven by declining household savings and upbeat
investment growth. Inflation is set to be elevated in 2021 and 2022 due to rising energy prices and unit
labour costs, but will likely moderate in 2023. The general government deficit and the debt-to-GDP
ratio are set to decrease over the forecast horizon.
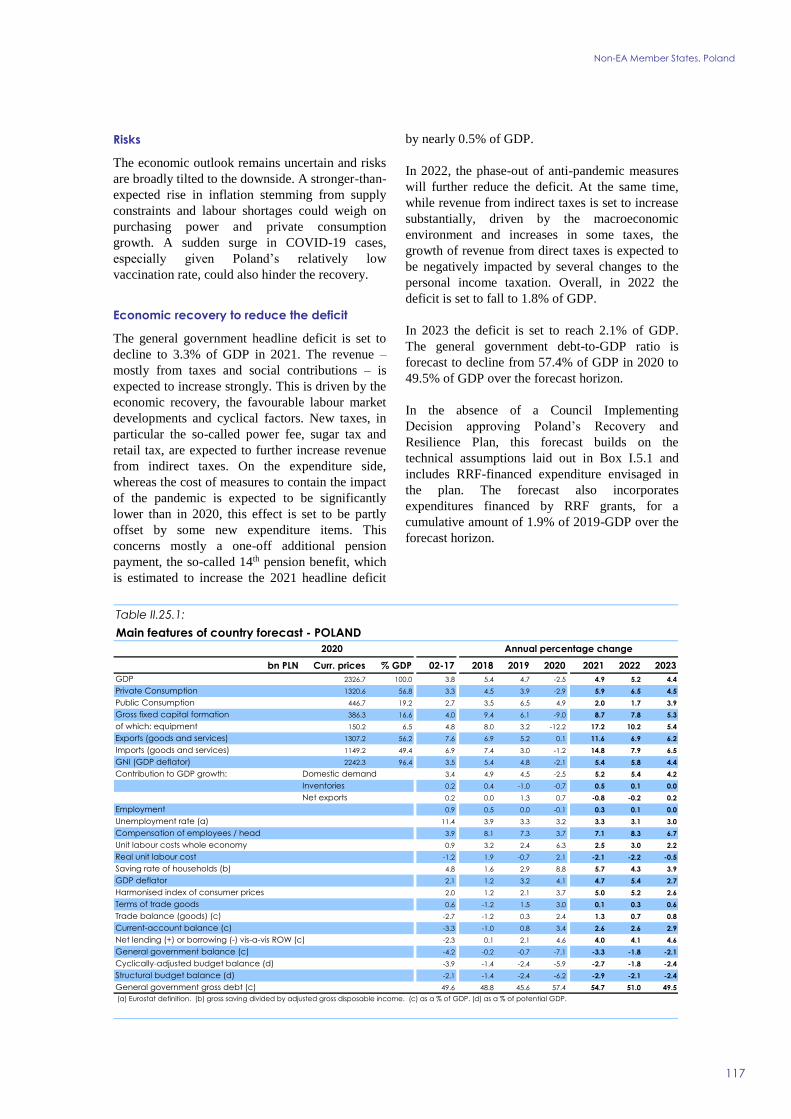
Non-EA Member States, Poland
117
Risks
The economic outlook remains uncertain and risks
are broadly tilted to the downside. A stronger-than-
expected rise in inflation stemming from supply
constraints and labour shortages could weigh on
purchasing power and private consumption
growth. A sudden surge in COVID-19 cases,
especially given Poland’s relatively low
vaccination rate, could also hinder the recovery.
Economic recovery to reduce the deficit
The general government headline deficit is set to
decline to 3.3% of GDP in 2021. The revenue –
mostly from taxes and social contributions – is
expected to increase strongly. This is driven by the
economic recovery, the favourable labour market
developments and cyclical factors. New taxes, in
particular the so-called power fee, sugar tax and
retail tax, are expected to further increase revenue
from indirect taxes. On the expenditure side,
whereas the cost of measures to contain the impact
of the pandemic is expected to be significantly
lower than in 2020, this effect is set to be partly
offset by some new expenditure items. This
concerns mostly a one-off additional pension
payment, the so-called 14th pension benefit, which
is estimated to increase the 2021 headline deficit
by nearly 0.5% of GDP.
In 2022, the phase-out of anti-pandemic measures
will further reduce the deficit. At the same time,
while revenue from indirect taxes is set to increase
substantially, driven by the macroeconomic
environment and increases in some taxes, the
growth of revenue from direct taxes is expected to
be negatively impacted by several changes to the
personal income taxation. Overall, in 2022 the
deficit is set to fall to 1.8% of GDP.
In 2023 the deficit is set to reach 2.1% of GDP.
The general government debt-to-GDP ratio is
forecast to decline from 57.4% of GDP in 2020 to
49.5% of GDP over the forecast horizon.
In the absence of a Council Implementing
Decision approving Poland’s Recovery and
Resilience Plan, this forecast builds on the
technical assumptions laid out in Box I.5.1 and
includes RRF-financed expenditure envisaged in
the plan. The forecast also incorporates
expenditures financed by RRF grants, for a
cumulative amount of 1.9% of 2019-GDP over the
forecast horizon.
bn PLN Curr. prices % GDP 02-17 2018 2019 2020 2021 2022 2023
2326.7 100.0 3.8 5.4 4.7 -2.5 4.9 5.2 4.4
1320.6 56.8 3.3 4.5 3.9 -2.9 5.9 6.5 4.5
446.7 19.2 2.7 3.5 6.5 4.9 2.0 1.7 3.9
386.3 16.6 4.0 9.4 6.1 -9.0 8.7 7.8 5.3
150.2 6.5 4.8 8.0 3.2 -12.2 17.2 10.2 5.4
1307.2 56.2 7.6 6.9 5.2 0.1 11.6 6.9 6.2
1149.2 49.4 6.9 7.4 3.0 -1.2 14.8 7.9 6.5
2242.3 96.4 3.5 5.4 4.8 -2.1 5.4 5.8 4.4
3.4 4.9 4.5 -2.5 5.2 5.4 4.2
0.2 0.4 -1.0 -0.7 0.5 0.1 0.0
0.2 0.0 1.3 0.7 -0.8 -0.2 0.2
0.9 0.5 0.0 -0.1 0.3 0.1 0.0
11.4 3.9 3.3 3.2 3.3 3.1 3.0
3.9 8.1 7.3 3.7 7.1 8.3 6.7
0.9 3.2 2.4 6.3 2.5 3.0 2.2
-1.2 1.9 -0.7 2.1 -2.1 -2.2 -0.5
4.8 1.6 2.9 8.8 5.7 4.3 3.9
2.1 1.2 3.2 4.1 4.7 5.4 2.7
2.0 1.2 2.1 3.7 5.0 5.2 2.6
0.6 -1.2 1.5 3.0 0.1 0.3 0.6
-2.7 -1.2 0.3 2.4 1.3 0.7 0.8
-3.3 -1.0 0.8 3.4 2.6 2.6 2.9
-2.3 0.1 2.1 4.6 4.0 4.1 4.6
-4.2 -0.2 -0.7 -7.1 -3.3 -1.8 -2.1
-3.9 -1.4 -2.4 -5.9 -2.7 -1.8 -2.4
-2.1 -1.4 -2.4 -6.2 -2.9 -2.1 -2.4
49.6 48.8 45.6 57.4 54.7 51.0 49.5
General government balance (c)
Cyclically-adjusted budget balance (d)
Structural budget balance (d)
General government gross debt (c)
(a) Eurostat definition. (b) gross saving divided by adjusted gross disposable income. (c) as a % of GDP. (d) as a % of potential GDP.
Net lending (+) or borrowing (-) vis-a-vis ROW (c)
Employment
Unemployment rate (a)
Compensation of employees / head
Unit labour costs whole economy
Real unit labour cost
Saving rate of households (b)
GDP deflator
Harmonised index of consumer prices
Terms of trade goods
Trade balance (goods) (c)
Current-account balance (c)
Contribution to GDP growth: Domestic demand
Inventories
Net exports
GNI (GDP deflator)
Table II.25.1:
Main features of country forecast - POLAND
2020 Annual percentage change
GDP
Private Consumption
Public Consumption
Gross fixed capital formation
of which: equipment
Exports (goods and services)
Imports (goods and services)
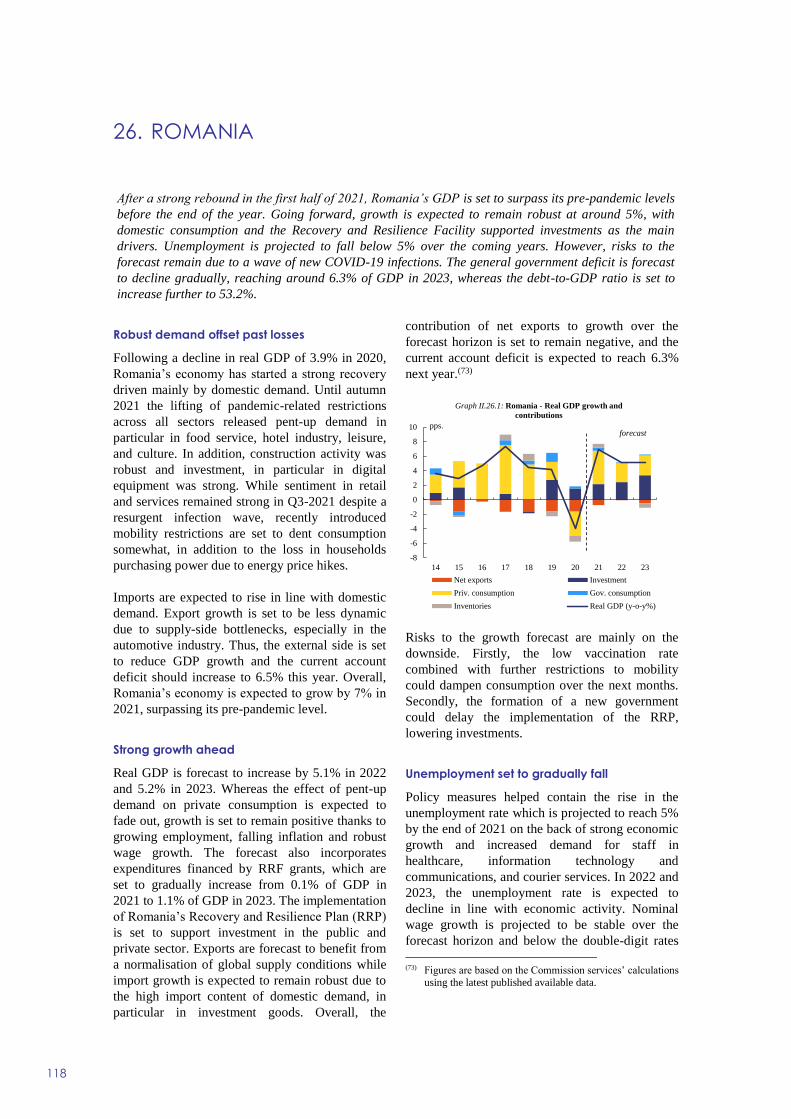
26. ROMANIA
118
Robust demand offset past losses
Following a decline in real GDP of 3.9% in 2020,
Romania’s economy has started a strong recovery
driven mainly by domestic demand. Until autumn
2021 the lifting of pandemic-related restrictions
across all sectors released pent-up demand in
particular in food service, hotel industry, leisure,
and culture. In addition, construction activity was
robust and investment, in particular in digital
equipment was strong. While sentiment in retail
and services remained strong in Q3-2021 despite a
resurgent infection wave, recently introduced
mobility restrictions are set to dent consumption
somewhat, in addition to the loss in households
purchasing power due to energy price hikes.
Imports are expected to rise in line with domestic
demand. Export growth is set to be less dynamic
due to supply-side bottlenecks, especially in the
automotive industry. Thus, the external side is set
to reduce GDP growth and the current account
deficit should increase to 6.5% this year. Overall,
Romania’s economy is expected to grow by 7% in
2021, surpassing its pre-pandemic level.
Strong growth ahead
Real GDP is forecast to increase by 5.1% in 2022
and 5.2% in 2023. Whereas the effect of pent-up
demand on private consumption is expected to
fade out, growth is set to remain positive thanks to
growing employment, falling inflation and robust
wage growth. The forecast also incorporates
expenditures financed by RRF grants, which are
set to gradually increase from 0.1% of GDP in
2021 to 1.1% of GDP in 2023. The implementation
of Romania’s Recovery and Resilience Plan (RRP)
is set to support investment in the public and
private sector. Exports are forecast to benefit from
a normalisation of global supply conditions while
import growth is expected to remain robust due to
the high import content of domestic demand, in
particular in investment goods. Overall, the
contribution of net exports to growth over the
forecast horizon is set to remain negative, and the
current account deficit is expected to reach 6.3%
next year.(73)
Risks to the growth forecast are mainly on the
downside. Firstly, the low vaccination rate
combined with further restrictions to mobility
could dampen consumption over the next months.
Secondly, the formation of a new government
could delay the implementation of the RRP,
lowering investments.
Unemployment set to gradually fall
Policy measures helped contain the rise in the
unemployment rate which is projected to reach 5%
by the end of 2021 on the back of strong economic
growth and increased demand for staff in
healthcare, information technology and
communications, and courier services. In 2022 and
2023, the unemployment rate is expected to
decline in line with economic activity. Nominal
wage growth is projected to be stable over the
forecast horizon and below the double-digit rates
(73) Figures are based on the Commission services’ calculations
using the latest published available data.
-8
-6
-4
-2
0
2
4
6
8
10
14 15 16 17 18 19 20 21 22 23
Graph II.26.1: Romania - Real GDP growth and
contributions
Net exports Investment
Priv. consumption Gov. consumption
Inventories Real GDP (y-o-y%)
forecastpps.
After a strong rebound in the first half of 2021, Romania’s GDP is set to surpass its pre-pandemic levels
before the end of the year. Going forward, growth is expected to remain robust at around 5%, with
domestic consumption and the Recovery and Resilience Facility supported investments as the main
drivers. Unemployment is projected to fall below 5% over the coming years. However, risks to the
forecast remain due to a wave of new COVID-19 infections. The general government deficit is forecast
to decline gradually, reaching around 6.3% of GDP in 2023, whereas the debt-to-GDP ratio is set to
increase further to 53.2%.

Non-EA Member States, Romania
119
seen in the pre-crisis period, while the rise in unit
labour cost is set to moderate.
Inflationary pressures
HICP inflation increased year-on-year to 4.3% in
the third quarter, largely on account of the sharp
increase in gas, energy, and oil prices, but also due
to higher food prices. Average annual HICP is
projected to to reach 4% by the end of 2021,
mainly as a result of the higher electricity and fuel
prices and is expected to stay at the same level in
2022. As the price shocks are expected to
gradually phase out over the forecast horizon, the
HICP is set to reach 2.9% in 2023.
High public deficit on a mild downward trend
Romania’s general government deficit is forecast
to decrease to around 8% of GDP in 2021, from
9.4% in 2020. While the strong economic recovery
supported government revenues throughout the
year, these gains were offset by expenditures
slippages, mainly related to the COVID-19 crisis
measures. Recently adopted measures to dampen
the energy prices shock are expected to cost in
total about 0.2% of GDP over 2021 and 2022.
The deficit is forecast to fall to around 6.9% of
GDP in 2022 before reaching 6.3% in 2023. This
improvement is mainly due to automatic stabilisers
as the economy is growing rapidly, the expiry of
some of the emergency health and labour market
measures, and the projected lower purchases of
(health) goods and services. Pension expenditure
for 2022 is set to grow at a slower pace than
nominal GDP, while capital expenditure is
expected to grow at a sustained pace due to the
implementation of the RRP. Revenues for 2022
and 2023 are projected to improve thanks to
economic growth and as the effects of the tax
administration reform on tax collection contained
in the RRP start materialising.
The general government debt is expected to rise to
49.3% of GDP in 2021, 51.8% in 2022 and 53.2%
in 2023, mainly due to high primary deficits.
Risks to the fiscal forecast are broadly balanced.
While in the short-term the risk of a delayed 2022
budget, and the risk of more waves of infection
and further restraining measures loom, in the
medium-term, the tax administration reform in the
RRP could have a larger-than-expected positive
impact on tax collection.
bn RON Curr. prices % GDP 02-17 2018 2019 2020 2021 2022 2023
1055.5 100.0 4.0 4.5 4.2 -3.9 7.0 5.1 5.2
645.0 61.1 5.8 7.7 3.9 -5.3 7.5 4.2 4.5
199.0 18.9 0.2 3.3 7.3 1.7 2.3 0.7 0.7
259.2 24.6 5.8 -1.1 12.9 6.8 8.8 9.5 12.5
85.1 8.1 3.2 11.6 5.3 1.9 9.2 7.8 17.4
393.3 37.3 10.8 5.3 5.4 -9.7 9.6 7.1 5.8
440.4 41.7 12.2 8.6 8.6 -5.1 10.3 6.3 6.1
1042.4 98.8 3.9 4.0 4.7 -3.8 7.3 5.4 5.5
5.7 5.1 6.5 -1.5 7.2 5.1 6.2
-0.3 1.0 -0.6 -0.8 0.5 0.0 -0.6
-1.3 -1.6 -1.6 -1.6 -0.7 -0.1 -0.5
-1.3 0.1 0.1 -1.8 1.1 0.6 0.5
6.9 4.2 3.9 5.0 5.0 4.8 4.5
11.7 12.9 10.9 7.0 6.8 7.5 9.9
6.0 8.2 6.6 9.3 0.9 2.9 5.1
-2.7 1.9 -0.2 5.4 -2.9 -1.4 0.9
: : : : : : :
8.9 6.2 6.8 3.8 3.9 4.4 4.1
6.3 4.1 3.9 2.3 4.0 4.0 2.8
2.1 0.6 2.1 3.4 -1.9 -0.5 0.5
-9.8 -7.5 -8.0 -8.8 -9.8 -10.0 -9.8
-5.5 -4.4 -5.3 -5.5 -6.5 -6.3 -6.1
-4.2 -3.2 -3.8 -3.8 -4.9 -4.7 -4.4
-3.1 -2.9 -4.4 -9.4 -8.0 -6.9 -6.3
-3.4 -3.5 -4.9 -7.5 -7.1 -6.4 -6.1
-1.5 -3.2 -4.8 -7.5 -7.1 -6.4 -6.1
26.8 34.7 35.3 47.4 49.3 51.8 53.2
General government balance (c)
Cyclically-adjusted budget balance (d)
Structural budget balance (d)
General government gross debt (c)
(a) Eurostat definition. (b) gross saving divided by adjusted gross disposable income. (c) as a % of GDP. (d) as a % of potential GDP.
Net lending (+) or borrowing (-) vis-a-vis ROW (c)
Employment
Unemployment rate (a)
Compensation of employees / head
Unit labour costs whole economy
Real unit labour cost
Saving rate of households (b)
GDP deflator
Harmonised index of consumer prices
Terms of trade goods
Trade balance (goods) (c)
Current-account balance (c)
Contribution to GDP growth: Domestic demand
Inventories
Net exports
GNI (GDP deflator)
Table II.26.1:
Main features of country forecast - ROMANIA
2020 Annual percentage change
GDP
Private Consumption
Public Consumption
Gross fixed capital formation
of which: equipment
Exports (goods and services)
Imports (goods and services)

27. SWEDEN
120
Recovery to gather pace despite short-term
supply disruptions
Sweden’s real GDP expanded in the first half of
2021, mainly driven by strong gains in private
consumption and investment. Sweden returned to
the pre-crisis output level in the second quarter of
2021. Growth is expected to stay strong in the
second half of the year, buoyed by domestic
demand. Demand picked up for contact-related
services such as restaurant and hotel services with
the lifting of restrictions facilitated by the progress
in vaccination. Supply chain disruptions and
related temporary plant closures are set to hold
back manufacturing production and prevent the
rapid replenishment of inventories, while the pick-
up in inflation dampens gains in disposable
income.
Real GDP growth is poised to moderate somewhat
yet maintain a healthy pace in 2022, as supply
constraints are overcome and private consumption
continues to expand vigorously over the forecast
period, supported by employment gains, gains in
financial wealth, and a decline in the savings ratio
to compensate for the involuntary savings accrued
in 2020. In 2021, government consumption is
forecast to be still boosted by the combination of
crisis-related expenditure and the recovery of
output volumes in health care that were negatively
affected by the crisis. With the expiration of fiscal
support measures in 2022, government
consumption is no longer to contribute to real GDP
growth.
Exports are projected to continue to expand at a
healthy pace in 2022 and 2023 in line with the
global economic expansion. Fixed capital
formation is set to remain strong over the forecast
period, spurred by major multi-year investment
projects, including in steel and battery production,
and favourable financing conditions. Overall, real
GDP is forecast to grow by around 4% in 2021 and
around 3½% in 2022, and then fall back to just
under 2% in 2023. Risks to the forecast are skewed
to the downside, reflecting higher inflation and the
risk of longer-lasting supply problems.
Labour market gains momentum
Although a data break in the Labour Force
Statistics (due to changes in the survey set-up),
cloud the picture, a range of indicators show that
employment growth has been strong in the first
part of 2021. In addition, companies’ recruitment
plans indicate a continuation of hiring. With a
relatively strong rebound in employment, the
unemployment rate is set to decrease from around
8½% in 2021 to close to 7% in 2022, with a
modest further fall in 2023. However, long-term
unemployment data point at a heightened risk of
persistent unemployment for those with weak links
to the labour market.
Energy prices drive up headline inflation
HICP inflation is expected to stay at a relatively
elevated rate towards the end of 2021, mainly due
to higher energy prices, in particular for electricity.
This partly mirrors trends in European electricity
wholesale markets and was reinforced by weather-
related factors such as low water levels in the
basins supplying Swedish hydro-electricity plants
-4
-3
-2
-1
0
1
2
3
4
5
6
14 15 16 17 18 19 20 21 22 23
Graph II.27.1: Sweden - Real GDP growth and
contributions
Net exports Investment
Priv. consumption Gov. consumption
Inventories Real GDP (y-o-y%)
forecastpps.
Despite supply chain disruptions, economic growth in Sweden is set to remain strong in the second half
of 2021, driven by private consumption and investment. Growth rates are projected to remain relatively
high in 2022 before moderating in 2023 as the impulses from the recovery fade. Inflation is forecast to
peak in 2021 at 2½% largely due to increases in energy prices before gradually moving back to around
1½% in 2023. Unemployment is set to fall to just below 7% by 2023. The general government balance is
expected to turn into a surplus after 2021, with the public debt-to-GDP ratio falling to around 31% of
GDP in 2023.

Non-EA Member States, Sweden
121
as well as unusually low generation of wind
power. Increases in freight rates and in the prices
of non-energy commodities and internationally
traded food products should largely be absorbed in
margins but are expected to have some limited
upward effect on inflation. Inflation is set to
moderate in 2022 and 2023 as the rise in energy
prices is forecast to end. There are no signs of a
significant increase in wage pressures given the
moderate central multi-year wage agreements.
HICP inflation is expected to average around 2½%
in 2021 and decrease to just above 1% on average
in 2023.
Modest 2022 expenditure increases as public
finances strengthen
COVID-19 measures are largely being phased out
during the autumn of 2021. Thus, the general
government balance is set to improve in 2022,
despite foreseen expenditure increases. The budget
balance is expected to turn from a deficit of around
1% of GDP in 2020 to a surplus of 0.3% of GDP
in 2022.
The general government 2022 budget proposal
includes measures amounting to around 1.5% of
GDP. The draft budget contains measures to
strengthen social benefits (notably during sickness
leave), increased grants to local governments and
regions (to cover pandemic-related costs),
strengthened active labour market policies
(focused on the young and the long-term
unemployed), and measures to strengthen law
enforcement.
In addition, it includes significant spending on
green and digital items financed by grants from the
Recovery and Resilience Facility, amounting to
0.2% of GDP. On the revenue side, the draft
budget entails a generalised income tax cut as well
as targeted reductions for people on sickness and
disability benefits. Nevertheless, tax receipts are
expected to be relatively strong, in line with
economic growth. The general government balance
is forecast to improve appreciably to reach a
surplus of close to 1% of GDP in 2023.
As of 2021, the public debt-to-GDP ratio is set to
resume its downward path and fall to just above
31% of GDP in 2023. This expected decrease
reflects the combination of sizeable nominal GDP
growth, the emergence of a budget surplus in 2022
and 2023, and the stepwise debt-reducing
repayment of a Riksbank loan for foreign currency
reserves over 2021-2023, equivalent to around
3½% of GDP.
bn SEK Curr. prices % GDP 02-17 2018 2019 2020 2021 2022 2023
4983.4 100.0 2.3 2.0 2.0 -2.8 3.9 3.5 1.7
2186.6 43.9 2.4 1.8 0.7 -4.7 3.7 3.5 2.0
1331.9 26.7 1.3 0.8 0.3 -0.6 2.5 -0.9 -0.7
1234.5 24.8 3.0 1.4 -0.3 -0.4 6.1 6.1 2.6
337.3 6.8 3.4 0.3 1.1 -9.0 10.0 10.0 2.5
2221.4 44.6 3.5 4.2 6.0 -4.6 6.4 4.7 3.6
1991.2 40.0 3.7 3.8 2.1 -5.7 7.3 4.1 3.2
5139.0 103.1 2.4 2.1 3.0 -2.6 3.9 3.4 1.7
2.2 1.4 0.3 -2.4 3.8 2.8 1.4
0.0 0.3 -0.1 -0.7 0.2 0.2 0.0
0.1 0.3 1.8 0.3 -0.1 0.5 0.3
0.8 1.6 0.6 -1.3 0.4 1.7 1.0
7.1 6.4 6.8 8.3 8.2 7.1 6.7
3.1 3.8 3.0 2.5 2.2 2.5 2.5
1.7 3.5 1.5 4.1 -1.2 0.6 1.7
0.0 1.1 -1.0 2.6 -3.2 -0.7 0.1
11.9 16.2 18.0 19.6 16.7 15.4 15.5
1.6 2.4 2.5 1.5 2.1 1.4 1.6
1.4 2.0 1.7 0.7 2.4 1.9 1.1
-0.1 -1.0 1.1 0.8 -1.4 -1.9 -0.1
4.9 2.5 3.9 4.8 3.9 3.3 3.2
5.3 2.5 5.2 5.6 5.1 4.8 5.0
5.2 2.6 5.2 5.7 5.2 4.8 5.1
0.2 0.8 0.6 -2.8 -0.9 0.3 0.9
0.4 0.6 0.4 -0.5 0.2 0.6 1.3
0.2 0.6 0.4 -0.5 0.2 0.6 1.3
42.6 38.9 34.9 39.7 37.3 34.2 31.2
General government balance (c)
Cyclically-adjusted budget balance (d)
Structural budget balance (d)
General government gross debt (c)
(a) Eurostat definition. (b) gross saving divided by adjusted gross disposable income. (c) as a % of GDP. (d) as a % of potential GDP.
Net lending (+) or borrowing (-) vis-a-vis ROW (c)
Employment
Unemployment rate (a)
Compensation of employees / head
Unit labour costs whole economy
Real unit labour cost
Saving rate of households (b)
GDP deflator
Harmonised index of consumer prices
Terms of trade goods
Trade balance (goods) (c)
Current-account balance (c)
Contribution to GDP growth: Domestic demand
Inventories
Net exports
GNI (GDP deflator)
Table II.27.1:
Main features of country forecast - SWEDEN
2020 Annual percentage change
GDP
Private Consumption
Public Consumption
Gross fixed capital formation
of which: equipment
Exports (goods and services)
Imports (goods and services)


Candidate Countries

28. ALBANIA
124
Strong recovery follows the 2020 contraction
The Albanian economy contracted by 4% in 2020
due to the impact of the COVID-19 pandemic on
tourism, services and manufacturing. The
moderate recovery, which began in the fourth
quarter of 2020, accelerated to a strong rebound in
the first half of 2021. The spring forecast for
economic growth in 2021 is revised from 4.1% to
6.9%, as most expenditure categories are
recovering to their 2019 levels earlier than
expected, investment and external demand being
the key drivers.
High public investment and a stable and liquid
financial sector support the recovery of
investment. While goods exports, mainly
electricity and construction material, have already
more than recovered the ground lost last year,
tourism exports, despite growing inbound tourism
from neighbouring countries, still remain below
their pre-crisis level. Private consumption is also
recovering earlier than expected, supported by
growing employment and increasing wages. While
overall imports, in particular goods in relation to
the high investment, are also growing strongly,
service imports remain subdued due to travel
restrictions limiting outbound tourism. This is
projected to lead to a growth contribution of net
exports in 2021.
On the production side, growth recovered across
all sectors, led by construction and industry, but
also services rebounded strongly, in particular
trade and hospitality services, although not yet
returning to 2019 levels.
Economic growth to normalise in 2022 and
2023
Following the early recovery of most expenditure
categories in 2021, economic activity is expected
to normalise gradually in 2022 and 2023. The
growth of private and public consumption as well
as investment is projected to moderate in 2022.
From 2022, public investment is set to be
gradually scaled back, while private investment
growth is expected to accelerate, supported by
strengthening foreign investment. This will also
support services exports and manufacturing to
exceed pre-crisis levels and a strong recovery of
services imports, which is projected to result in a
slightly negative contribution of net export.
Overall, growth is forecast to slow to 3.7% in 2022
and further to 3.6% in 2023. Supported by the
recovery, moderate employment growth is
expected to gradually reduce the unemployment
rate to just above 10% by 2023.
This outlook is subject to downside risks related to
the relatively low COVID-19 vaccination rate in
Albania and to the impact of a potentially long-
lasting energy price hike. A substantial increase of
fossil fuel prices could affect Albania negatively
mainly via higher prices for electricity imports.
Given that Albania produces all its electricity from
hydropower, this could be underscored in case of
insufficient rainfall.
-8
-6
-4
-2
0
2
4
6
8
14 15 16 17 18 19 20 21 22 23
Graph II.28.1: Albania - Real GDP growth and
contributions
Net exports Investment
Priv. consumption Gov. consumption
Inventories Real GDP (y-o-y%)
forecastpps.
A faster-than-expected economic recovery is driven by a strong rebound of tourism from neighbouring
countries, as well as high investment growth and a recovery of private consumption. These factors are
set to boost growth to close to 7% in 2021. An expected full recovery of tourism and manufacturing to
pre-crisis levels is forecast to keep growth at 3.7% in 2022 and 3.6% in 2023. Fiscal policy remains
very expansionary in 2021 and despite solid recovery of revenue growth, government finances will only
significantly improve in 2023.
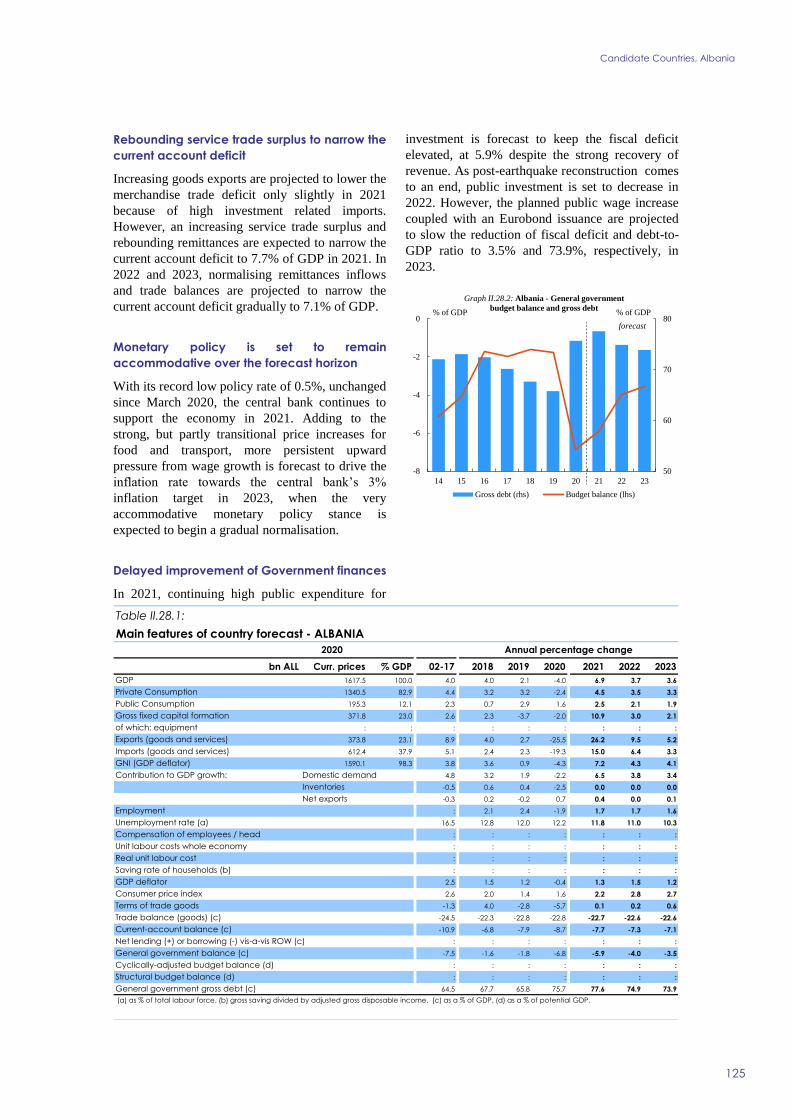
Candidate Countries, Albania
125
Rebounding service trade surplus to narrow the
current account deficit
Increasing goods exports are projected to lower the
merchandise trade deficit only slightly in 2021
because of high investment related imports.
However, an increasing service trade surplus and
rebounding remittances are expected to narrow the
current account deficit to 7.7% of GDP in 2021. In
2022 and 2023, normalising remittances inflows
and trade balances are projected to narrow the
current account deficit gradually to 7.1% of GDP.
Monetary policy is set to remain
accommodative over the forecast horizon
With its record low policy rate of 0.5%, unchanged
since March 2020, the central bank continues to
support the economy in 2021. Adding to the
strong, but partly transitional price increases for
food and transport, more persistent upward
pressure from wage growth is forecast to drive the
inflation rate towards the central bank’s 3%
inflation target in 2023, when the very
accommodative monetary policy stance is
expected to begin a gradual normalisation.
Delayed improvement of Government finances
In 2021, continuing high public expenditure for
investment is forecast to keep the fiscal deficit
elevated, at 5.9% despite the strong recovery of
revenue. As post-earthquake reconstruction comes
to an end, public investment is set to decrease in
2022. However, the planned public wage increase
coupled with an Eurobond issuance are projected
to slow the reduction of fiscal deficit and debt-to-
GDP ratio to 3.5% and 73.9%, respectively, in
2023.
50
60
70
80
-8
-6
-4
-2
0
14 15 16 17 18 19 20 21 22 23
% of GDP
Gross debt (rhs) Budget balance (lhs)
forecast
% of GDP
Graph II.28.2: Albania - General government
budget balance and gross debt
bn ALL Curr. prices % GDP 02-17 2018 2019 2020 2021 2022 2023
1617.5 100.0 4.0 4.0 2.1 -4.0 6.9 3.7 3.6
1340.5 82.9 4.4 3.2 3.2 -2.4 4.5 3.5 3.3
195.3 12.1 2.3 0.7 2.9 1.6 2.5 2.1 1.9
371.8 23.0 2.6 2.3 -3.7 -2.0 10.9 3.0 2.1
: : : : : : : : :
373.8 23.1 8.9 4.0 2.7 -25.5 26.2 9.5 5.2
612.4 37.9 5.1 2.4 2.3 -19.3 15.0 6.4 3.3
1590.1 98.3 3.8 3.6 0.9 -4.3 7.2 4.3 4.1
4.8 3.2 1.9 -2.2 6.5 3.8 3.4
-0.5 0.6 0.4 -2.5 0.0 0.0 0.0
-0.3 0.2 -0.2 0.7 0.4 0.0 0.1
: 2.1 2.4 -1.9 1.7 1.7 1.6
16.5 12.8 12.0 12.2 11.8 11.0 10.3
: : : : : : :
: : : : : : :
: : : : : : :
: : : : : : :
2.5 1.5 1.2 -0.4 1.3 1.5 1.2
2.6 2.0 1.4 1.6 2.2 2.8 2.7
-1.3 4.0 -2.8 -5.7 0.1 0.2 0.6
-24.5 -22.3 -22.8 -22.8 -22.7 -22.6 -22.6
-10.9 -6.8 -7.9 -8.7 -7.7 -7.3 -7.1
: : : : : : :
-7.5 -1.6 -1.8 -6.8 -5.9 -4.0 -3.5
: : : : : : :
: : : : : : :
64.5 67.7 65.8 75.7 77.6 74.9 73.9
GNI (GDP deflator)
Table II.28.1:
Main features of country forecast - ALBANIA
2020 Annual percentage change
GDP
Private Consumption
Public Consumption
Gross fixed capital formation
of which: equipment
Exports (goods and services)
Imports (goods and services)
Contribution to GDP growth: Domestic demand
Inventories
Net exports
Net lending (+) or borrowing (-) vis-a-vis ROW (c)
Employment
Unemployment rate (a)
Compensation of employees / head
Unit labour costs whole economy
Real unit labour cost
Saving rate of households (b)
GDP deflator
Consumer price index
Terms of trade goods
Trade balance (goods) (c)
Current-account balance (c)
General government balance (c)
Cyclically-adjusted budget balance (d)
Structural budget balance (d)
General government gross debt (c)
(a) as % of total labour force. (b) gross saving divided by adjusted gross disposable income. (c) as a % of GDP. (d) as a % of potential GDP.
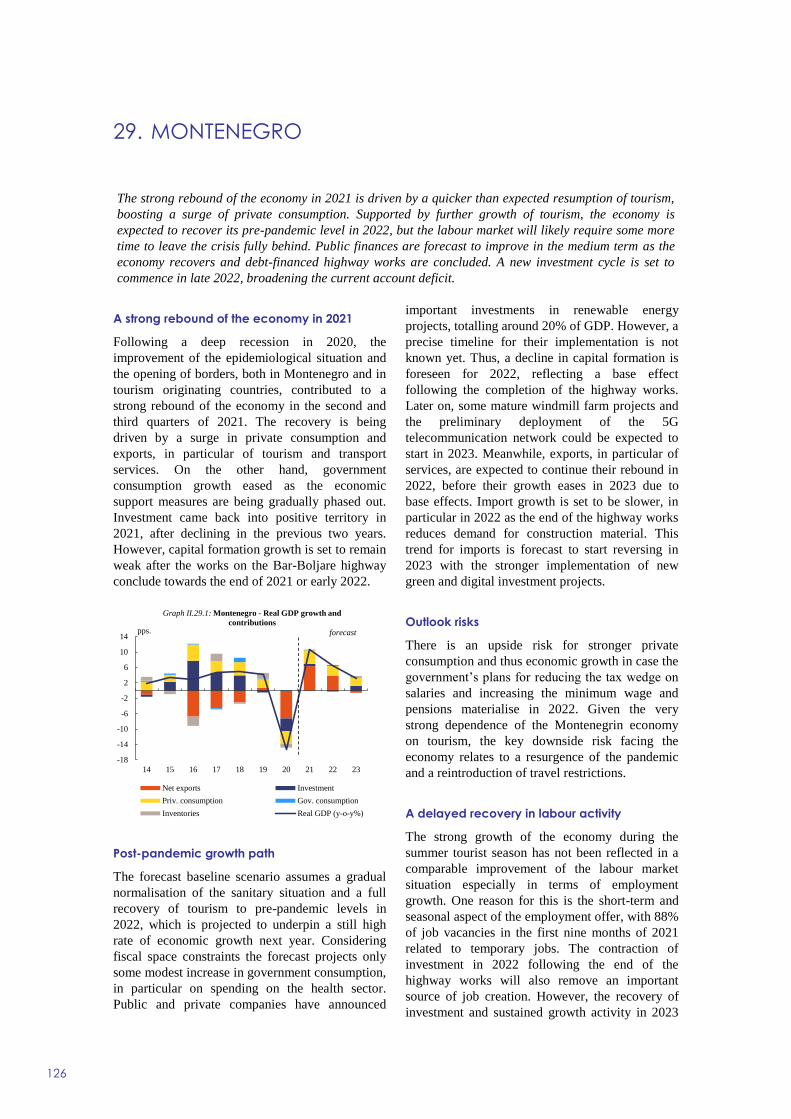
29. MONTENEGRO
126
A strong rebound of the economy in 2021
Following a deep recession in 2020, the
improvement of the epidemiological situation and
the opening of borders, both in Montenegro and in
tourism originating countries, contributed to a
strong rebound of the economy in the second and
third quarters of 2021. The recovery is being
driven by a surge in private consumption and
exports, in particular of tourism and transport
services. On the other hand, government
consumption growth eased as the economic
support measures are being gradually phased out.
Investment came back into positive territory in
2021, after declining in the previous two years.
However, capital formation growth is set to remain
weak after the works on the Bar-Boljare highway
conclude towards the end of 2021 or early 2022.
Post-pandemic growth path
The forecast baseline scenario assumes a gradual
normalisation of the sanitary situation and a full
recovery of tourism to pre-pandemic levels in
2022, which is projected to underpin a still high
rate of economic growth next year. Considering
fiscal space constraints the forecast projects only
some modest increase in government consumption,
in particular on spending on the health sector.
Public and private companies have announced
important investments in renewable energy
projects, totalling around 20% of GDP. However, a
precise timeline for their implementation is not
known yet. Thus, a decline in capital formation is
foreseen for 2022, reflecting a base effect
following the completion of the highway works.
Later on, some mature windmill farm projects and
the preliminary deployment of the 5G
telecommunication network could be expected to
start in 2023. Meanwhile, exports, in particular of
services, are expected to continue their rebound in
2022, before their growth eases in 2023 due to
base effects. Import growth is set to be slower, in
particular in 2022 as the end of the highway works
reduces demand for construction material. This
trend for imports is forecast to start reversing in
2023 with the stronger implementation of new
green and digital investment projects.
Outlook risks
There is an upside risk for stronger private
consumption and thus economic growth in case the
government’s plans for reducing the tax wedge on
salaries and increasing the minimum wage and
pensions materialise in 2022. Given the very
strong dependence of the Montenegrin economy
on tourism, the key downside risk facing the
economy relates to a resurgence of the pandemic
and a reintroduction of travel restrictions.
A delayed recovery in labour activity
The strong growth of the economy during the
summer tourist season has not been reflected in a
comparable improvement of the labour market
situation especially in terms of employment
growth. One reason for this is the short-term and
seasonal aspect of the employment offer, with 88%
of job vacancies in the first nine months of 2021
related to temporary jobs. The contraction of
investment in 2022 following the end of the
highway works will also remove an important
source of job creation. However, the recovery of
investment and sustained growth activity in 2023
-18
-14
-10
-6
-2
2
6
10
14
14 15 16 17 18 19 20 21 22 23
Graph II.29.1: Montenegro - Real GDP growth and
contributions
Net exports Investment
Priv. consumption Gov. consumption
Inventories Real GDP (y-o-y%)
forecastpps.
The strong rebound of the economy in 2021 is driven by a quicker than expected resumption of tourism,
boosting a surge of private consumption. Supported by further growth of tourism, the economy is
expected to recover its pre-pandemic level in 2022, but the labour market will likely require some more
time to leave the crisis fully behind. Public finances are forecast to improve in the medium term as the
economy recovers and debt-financed highway works are concluded. A new investment cycle is set to
commence in late 2022, broadening the current account deficit.
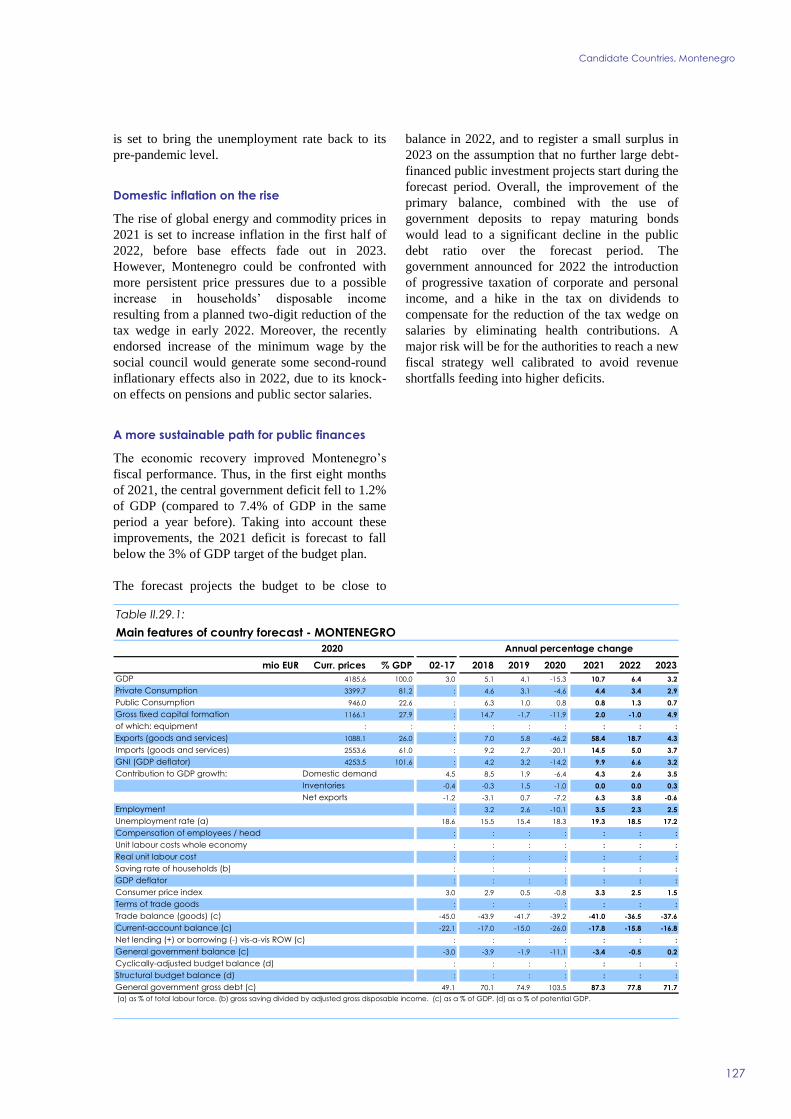
Candidate Countries, Montenegro
127
is set to bring the unemployment rate back to its
pre-pandemic level.
Domestic inflation on the rise
The rise of global energy and commodity prices in
2021 is set to increase inflation in the first half of
2022, before base effects fade out in 2023.
However, Montenegro could be confronted with
more persistent price pressures due to a possible
increase in households’ disposable income
resulting from a planned two-digit reduction of the
tax wedge in early 2022. Moreover, the recently
endorsed increase of the minimum wage by the
social council would generate some second-round
inflationary effects also in 2022, due to its knock-
on effects on pensions and public sector salaries.
A more sustainable path for public finances
The economic recovery improved Montenegro’s
fiscal performance. Thus, in the first eight months
of 2021, the central government deficit fell to 1.2%
of GDP (compared to 7.4% of GDP in the same
period a year before). Taking into account these
improvements, the 2021 deficit is forecast to fall
below the 3% of GDP target of the budget plan.
The forecast projects the budget to be close to
balance in 2022, and to register a small surplus in
2023 on the assumption that no further large debt-
financed public investment projects start during the
forecast period. Overall, the improvement of the
primary balance, combined with the use of
government deposits to repay maturing bonds
would lead to a significant decline in the public
debt ratio over the forecast period. The
government announced for 2022 the introduction
of progressive taxation of corporate and personal
income, and a hike in the tax on dividends to
compensate for the reduction of the tax wedge on
salaries by eliminating health contributions. A
major risk will be for the authorities to reach a new
fiscal strategy well calibrated to avoid revenue
shortfalls feeding into higher deficits.
mio EUR Curr. prices % GDP 02-17 2018 2019 2020 2021 2022 2023
4185.6 100.0 3.0 5.1 4.1 -15.3 10.7 6.4 3.2
3399.7 81.2 : 4.6 3.1 -4.6 4.4 3.4 2.9
946.0 22.6 : 6.3 1.0 0.8 0.8 1.3 0.7
1166.1 27.9 : 14.7 -1.7 -11.9 2.0 -1.0 4.9
: : : : : : : : :
1088.1 26.0 : 7.0 5.8 -46.2 58.4 18.7 4.3
2553.6 61.0 : 9.2 2.7 -20.1 14.5 5.0 3.7
4253.5 101.6 : 4.2 3.2 -14.2 9.9 6.6 3.2
4.5 8.5 1.9 -6.4 4.3 2.6 3.5
-0.4 -0.3 1.5 -1.0 0.0 0.0 0.3
-1.2 -3.1 0.7 -7.2 6.3 3.8 -0.6
: 3.2 2.6 -10.1 3.5 2.3 2.5
18.6 15.5 15.4 18.3 19.3 18.5 17.2
: : : : : : :
: : : : : : :
: : : : : : :
: : : : : : :
: : : : : : :
3.0 2.9 0.5 -0.8 3.3 2.5 1.5
: : : : : : :
-45.0 -43.9 -41.7 -39.2 -41.0 -36.5 -37.6
-22.1 -17.0 -15.0 -26.0 -17.8 -15.8 -16.8
: : : : : : :
-3.0 -3.9 -1.9 -11.1 -3.4 -0.5 0.2
: : : : : : :
: : : : : : :
49.1 70.1 74.9 103.5 87.3 77.8 71.7
GNI (GDP deflator)
Table II.29.1:
Main features of country forecast - MONTENEGRO
2020 Annual percentage change
GDP
Private Consumption
Public Consumption
Gross fixed capital formation
of which: equipment
Exports (goods and services)
Imports (goods and services)
Contribution to GDP growth: Domestic demand
Inventories
Net exports
Net lending (+) or borrowing (-) vis-a-vis ROW (c)
Employment
Unemployment rate (a)
Compensation of employees / head
Unit labour costs whole economy
Real unit labour cost
Saving rate of households (b)
GDP deflator
Consumer price index
Terms of trade goods
Trade balance (goods) (c)
Current-account balance (c)
General government balance (c)
Cyclically-adjusted budget balance (d)
Structural budget balance (d)
General government gross debt (c)
(a) as % of total labour force. (b) gross saving divided by adjusted gross disposable income. (c) as a % of GDP. (d) as a % of potential GDP.

30. NORTH MACEDONIA
128
The economic recovery has begun in 2021
After a major economic recession in 2020, real
output increased by 5.2% y-o-y in the first half of
2021. A buoyant second quarter followed onto a
contraction in the first three months, both largely
the result of base effects. Private consumption,
rose markedly in the second quarter. Inflows from
remittances were some 38% higher year-on-year,
bolstering household’s disposable incomes.
Investment was slightly above its level of one year
earlier, but remained below the outturn of the
second half of 2020. Both, exports, benefitting
from the recovery of foreign demand, and imports,
driven by firming domestic demand, surged. High
frequency data for Q3, when base effects were less
significant, point to a slight deceleration in annual
growth over the summer.
Firming domestic and external demand likely
to lead upswing onto firm ground
The recovery of domestic demand is expected to
become more entrenched over the forecast horizon.
Annual growth in household spending is expected
to accelerate further in 2022 and to remain robust
in 2023. With remittances recovering and some
remaining government support to employment and
wages at least throughout 2022, annual growth in
household spending is expected to accelerate
further in 2022 and to remain robust in 2023.
Private consumption is likely to be the main driver
of domestic demand. With the ongoing restoration
of global supply chains and recovery of demand
from the German automotive sector, export growth
is expected to accelerate sharply. However, net
exports are expected to detract from growth over
the forecast horizon, as a result of strong import
growth, reflecting rising domestic demand and
import-dependent export production. Yet, the
negative contribution from net exports would
gradually diminish, leading to a more balanced
growth composition. The deficit in merchandise
trade is expected to narrow, largely as a result of a
decrease in energy imports, as energy prices are
expected to drop, driving the projected
improvement in the current account balance.
Employment growth to accelerate
In line with the economic recovery, more workers
were employed in the second quarter than in the
first three months of the year. The labour force
also increased slightly, but was well below its
2020 level. However, the number of young
workers declined, compared to Q1-21, leading to a
rise in the unemployment rate for this age group.
Employment growth is expected to pick up over
the forecast horizon, given the firming recovery
and continued government support to employers.
Price pressures set to moderate
Inflation picked up gradually in 2021. Pressures
arose mainly from the supply side, given rising
global prices for energy and food, and global
supply chain disruptions, in particular in the
automotive industry. While global price pressures
are set to abate over the forecast horizon, firming
domestic demand is expected to maintain some
price pressure on individual sectors, but overall
inflation dynamics are projected to slow down.
-8
-6
-4
-2
0
2
4
6
8
14 15 16 17 18 19 20 21 22 23
Graph II.30.1: North Macedonia - Real GDP growth and
contributions
Net exports Investment
Priv. consumption Gov. consumption
Inventories Real GDP (y-o-y%)
forecastpps.
North Macedonia’s economic recovery is making good progress, as both, domestic and foreign demand
are strengthening. The upswing is expected to gradually solidify in 2022 and 2023, based on a further
firming of private consumption and foreign demand. Real GDP growth is projected to average 3.9% in
the period 2021 to 2023. The recovery in public finances is likely to be more protracted than anticipated
earlier. Financing needs for the government’s ambitious new public investment plans, and continued
implementation of anti-crisis measures are likely to entail sustained high fiscal deficit levels.
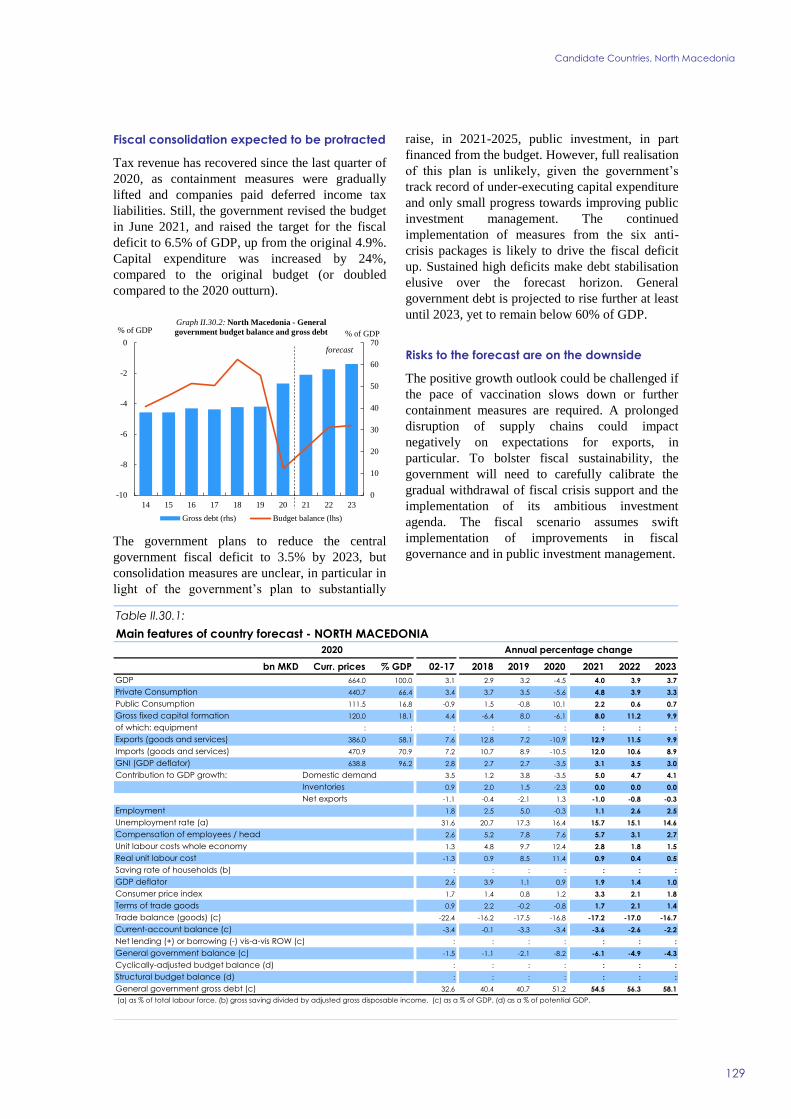
Candidate Countries, North Macedonia
129
Fiscal consolidation expected to be protracted
Tax revenue has recovered since the last quarter of
2020, as containment measures were gradually
lifted and companies paid deferred income tax
liabilities. Still, the government revised the budget
in June 2021, and raised the target for the fiscal
deficit to 6.5% of GDP, up from the original 4.9%.
Capital expenditure was increased by 24%,
compared to the original budget (or doubled
compared to the 2020 outturn).
The government plans to reduce the central
government fiscal deficit to 3.5% by 2023, but
consolidation measures are unclear, in particular in
light of the government’s plan to substantially
raise, in 2021-2025, public investment, in part
financed from the budget. However, full realisation
of this plan is unlikely, given the government’s
track record of under-executing capital expenditure
and only small progress towards improving public
investment management. The continued
implementation of measures from the six anti-
crisis packages is likely to drive the fiscal deficit
up. Sustained high deficits make debt stabilisation
elusive over the forecast horizon. General
government debt is projected to rise further at least
until 2023, yet to remain below 60% of GDP.
Risks to the forecast are on the downside
The positive growth outlook could be challenged if
the pace of vaccination slows down or further
containment measures are required. A prolonged
disruption of supply chains could impact
negatively on expectations for exports, in
particular. To bolster fiscal sustainability, the
government will need to carefully calibrate the
gradual withdrawal of fiscal crisis support and the
implementation of its ambitious investment
agenda. The fiscal scenario assumes swift
implementation of improvements in fiscal
governance and in public investment management.
0
10
20
30
40
50
60
70
-10
-8
-6
-4
-2
0
14 15 16 17 18 19 20 21 22 23
% of GDP
Gross debt (rhs) Budget balance (lhs)
forecast
% of GDP
Graph II.30.2: North Macedonia - General
government budget balance and gross debt
bn MKD Curr. prices % GDP 02-17 2018 2019 2020 2021 2022 2023
664.0 100.0 3.1 2.9 3.2 -4.5 4.0 3.9 3.7
440.7 66.4 3.4 3.7 3.5 -5.6 4.8 3.9 3.3
111.5 16.8 -0.9 1.5 -0.8 10.1 2.2 0.6 0.7
120.0 18.1 4.4 -6.4 8.0 -6.1 8.0 11.2 9.9
: : : : : : : : :
386.0 58.1 7.6 12.8 7.2 -10.9 12.9 11.5 9.9
470.9 70.9 7.2 10.7 8.9 -10.5 12.0 10.6 8.9
638.8 96.2 2.8 2.7 2.7 -3.5 3.1 3.5 3.0
3.5 1.2 3.8 -3.5 5.0 4.7 4.1
0.9 2.0 1.5 -2.3 0.0 0.0 0.0
-1.1 -0.4 -2.1 1.3 -1.0 -0.8 -0.3
1.8 2.5 5.0 -0.3 1.1 2.6 2.5
31.6 20.7 17.3 16.4 15.7 15.1 14.6
2.6 5.2 7.8 7.6 5.7 3.1 2.7
1.3 4.8 9.7 12.4 2.8 1.8 1.5
-1.3 0.9 8.5 11.4 0.9 0.4 0.5
: : : : : : :
2.6 3.9 1.1 0.9 1.9 1.4 1.0
1.7 1.4 0.8 1.2 3.3 2.1 1.8
0.9 2.2 -0.2 -0.8 1.7 2.1 1.4
-22.4 -16.2 -17.5 -16.8 -17.2 -17.0 -16.7
-3.4 -0.1 -3.3 -3.4 -3.6 -2.6 -2.2
: : : : : : :
-1.5 -1.1 -2.1 -8.2 -6.1 -4.9 -4.3
: : : : : : :
: : : : : : :
32.6 40.4 40.7 51.2 54.5 56.3 58.1
GNI (GDP deflator)
Table II.30.1:
Main features of country forecast - NORTH MACEDONIA
2020 Annual percentage change
GDP
Private Consumption
Public Consumption
Gross fixed capital formation
of which: equipment
Exports (goods and services)
Imports (goods and services)
Contribution to GDP growth: Domestic demand
Inventories
Net exports
Net lending (+) or borrowing (-) vis-a-vis ROW (c)
Employment
Unemployment rate (a)
Compensation of employees / head
Unit labour costs whole economy
Real unit labour cost
Saving rate of households (b)
GDP deflator
Consumer price index
Terms of trade goods
Trade balance (goods) (c)
Current-account balance (c)
General government balance (c)
Cyclically-adjusted budget balance (d)
Structural budget balance (d)
General government gross debt (c)
(a) as % of total labour force. (b) gross saving divided by adjusted gross disposable income. (c) as a % of GDP. (d) as a % of potential GDP.
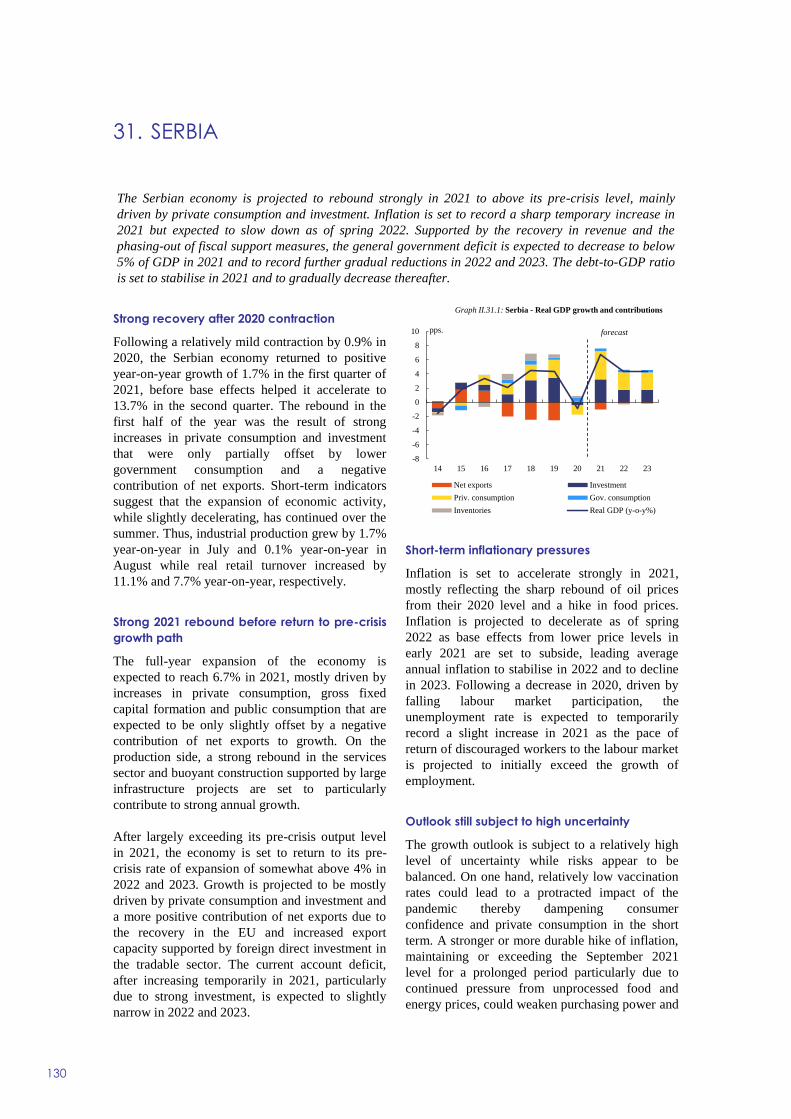
31. SERBIA
130
Strong recovery after 2020 contraction
Following a relatively mild contraction by 0.9% in
2020, the Serbian economy returned to positive
year-on-year growth of 1.7% in the first quarter of
2021, before base effects helped it accelerate to
13.7% in the second quarter. The rebound in the
first half of the year was the result of strong
increases in private consumption and investment
that were only partially offset by lower
government consumption and a negative
contribution of net exports. Short-term indicators
suggest that the expansion of economic activity,
while slightly decelerating, has continued over the
summer. Thus, industrial production grew by 1.7%
year-on-year in July and 0.1% year-on-year in
August while real retail turnover increased by
11.1% and 7.7% year-on-year, respectively.
Strong 2021 rebound before return to pre-crisis
growth path
The full-year expansion of the economy is
expected to reach 6.7% in 2021, mostly driven by
increases in private consumption, gross fixed
capital formation and public consumption that are
expected to be only slightly offset by a negative
contribution of net exports to growth. On the
production side, a strong rebound in the services
sector and buoyant construction supported by large
infrastructure projects are set to particularly
contribute to strong annual growth.
After largely exceeding its pre-crisis output level
in 2021, the economy is set to return to its pre-
crisis rate of expansion of somewhat above 4% in
2022 and 2023. Growth is projected to be mostly
driven by private consumption and investment and
a more positive contribution of net exports due to
the recovery in the EU and increased export
capacity supported by foreign direct investment in
the tradable sector. The current account deficit,
after increasing temporarily in 2021, particularly
due to strong investment, is expected to slightly
narrow in 2022 and 2023.
Short-term inflationary pressures
Inflation is set to accelerate strongly in 2021,
mostly reflecting the sharp rebound of oil prices
from their 2020 level and a hike in food prices.
Inflation is projected to decelerate as of spring
2022 as base effects from lower price levels in
early 2021 are set to subside, leading average
annual inflation to stabilise in 2022 and to decline
in 2023. Following a decrease in 2020, driven by
falling labour market participation, the
unemployment rate is expected to temporarily
record a slight increase in 2021 as the pace of
return of discouraged workers to the labour market
is projected to initially exceed the growth of
employment.
Outlook still subject to high uncertainty
The growth outlook is subject to a relatively high
level of uncertainty while risks appear to be
balanced. On one hand, relatively low vaccination
rates could lead to a protracted impact of the
pandemic thereby dampening consumer
confidence and private consumption in the short
term. A stronger or more durable hike of inflation,
maintaining or exceeding the September 2021
level for a prolonged period particularly due to
continued pressure from unprocessed food and
energy prices, could weaken purchasing power and
-8
-6
-4
-2
0
2
4
6
8
10
14 15 16 17 18 19 20 21 22 23
Graph II.31.1: Serbia - Real GDP growth and contributions
Net exports Investment
Priv. consumption Gov. consumption
Inventories Real GDP (y-o-y%)
forecastpps.
The Serbian economy is projected to rebound strongly in 2021 to above its pre-crisis level, mainly
driven by private consumption and investment. Inflation is set to record a sharp temporary increase in
2021 but expected to slow down as of spring 2022. Supported by the recovery in revenue and the
phasing-out of fiscal support measures, the general government deficit is expected to decrease to below
5% of GDP in 2021 and to record further gradual reductions in 2022 and 2023. The debt-to-GDP ratio
is set to stabilise in 2021 and to gradually decrease thereafter.
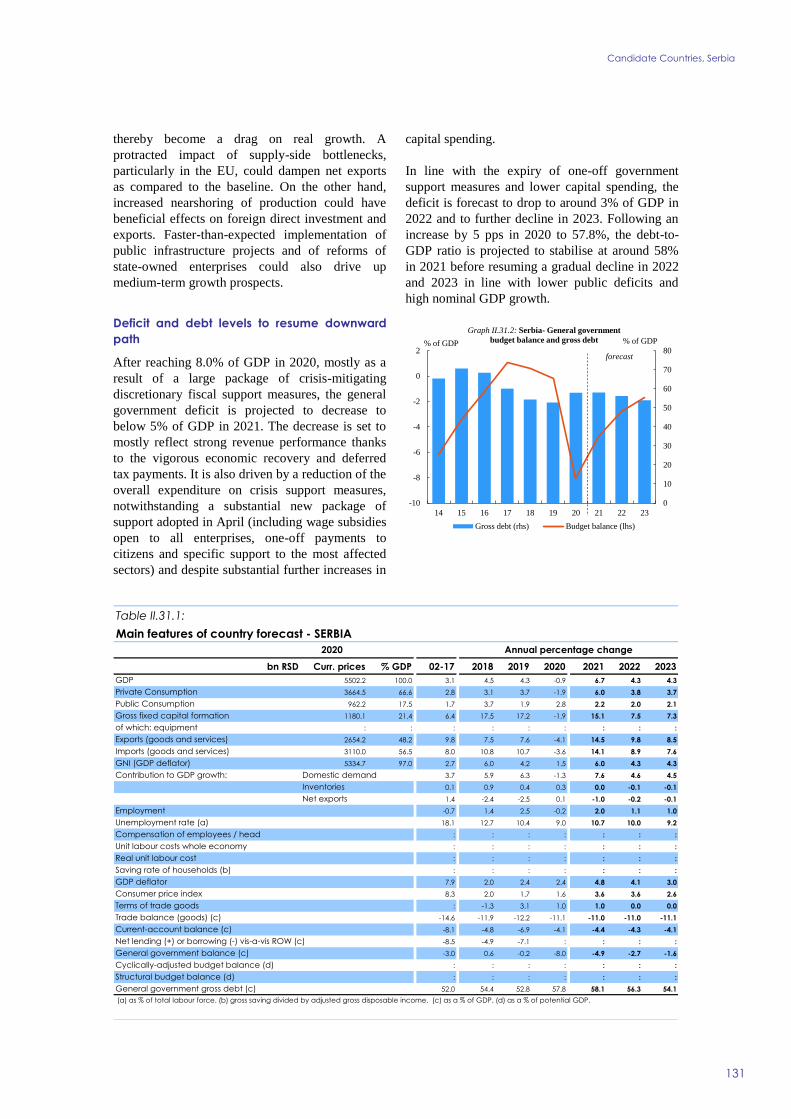
Candidate Countries, Serbia
131
thereby become a drag on real growth. A
protracted impact of supply-side bottlenecks,
particularly in the EU, could dampen net exports
as compared to the baseline. On the other hand,
increased nearshoring of production could have
beneficial effects on foreign direct investment and
exports. Faster-than-expected implementation of
public infrastructure projects and of reforms of
state-owned enterprises could also drive up
medium-term growth prospects.
Deficit and debt levels to resume downward
path
After reaching 8.0% of GDP in 2020, mostly as a
result of a large package of crisis-mitigating
discretionary fiscal support measures, the general
government deficit is projected to decrease to
below 5% of GDP in 2021. The decrease is set to
mostly reflect strong revenue performance thanks
to the vigorous economic recovery and deferred
tax payments. It is also driven by a reduction of the
overall expenditure on crisis support measures,
notwithstanding a substantial new package of
support adopted in April (including wage subsidies
open to all enterprises, one-off payments to
citizens and specific support to the most affected
sectors) and despite substantial further increases in
capital spending.
In line with the expiry of one-off government
support measures and lower capital spending, the
deficit is forecast to drop to around 3% of GDP in
2022 and to further decline in 2023. Following an
increase by 5 pps in 2020 to 57.8%, the debt-to-
GDP ratio is projected to stabilise at around 58%
in 2021 before resuming a gradual decline in 2022
and 2023 in line with lower public deficits and
high nominal GDP growth.
0
10
20
30
40
50
60
70
80
-10
-8
-6
-4
-2
0
2
14 15 16 17 18 19 20 21 22 23
% of GDP
Gross debt (rhs) Budget balance (lhs)
forecast
% of GDP
Graph II.31.2: Serbia- General government
budget balance and gross debt
bn RSD Curr. prices % GDP 02-17 2018 2019 2020 2021 2022 2023
5502.2 100.0 3.1 4.5 4.3 -0.9 6.7 4.3 4.3
3664.5 66.6 2.8 3.1 3.7 -1.9 6.0 3.8 3.7
962.2 17.5 1.7 3.7 1.9 2.8 2.2 2.0 2.1
1180.1 21.4 6.4 17.5 17.2 -1.9 15.1 7.5 7.3
: : : : : : : : :
2654.2 48.2 9.8 7.5 7.6 -4.1 14.5 9.8 8.5
3110.0 56.5 8.0 10.8 10.7 -3.6 14.1 8.9 7.6
5334.7 97.0 2.7 6.0 4.2 1.5 6.0 4.3 4.3
3.7 5.9 6.3 -1.3 7.6 4.6 4.5
0.1 0.9 0.4 0.3 0.0 -0.1 -0.1
1.4 -2.4 -2.5 0.1 -1.0 -0.2 -0.1
-0.7 1.4 2.5 -0.2 2.0 1.1 1.0
18.1 12.7 10.4 9.0 10.7 10.0 9.2
: : : : : : :
: : : : : : :
: : : : : : :
: : : : : : :
7.9 2.0 2.4 2.4 4.8 4.1 3.0
8.3 2.0 1.7 1.6 3.6 3.6 2.6
: -1.3 3.1 1.0 1.0 0.0 0.0
-14.6 -11.9 -12.2 -11.1 -11.0 -11.0 -11.1
-8.1 -4.8 -6.9 -4.1 -4.4 -4.3 -4.1
-8.5 -4.9 -7.1 : : : :
-3.0 0.6 -0.2 -8.0 -4.9 -2.7 -1.6
: : : : : : :
: : : : : : :
52.0 54.4 52.8 57.8 58.1 56.3 54.1
GNI (GDP deflator)
Table II.31.1:
Main features of country forecast - SERBIA
2020 Annual percentage change
GDP
Private Consumption
Public Consumption
Gross fixed capital formation
of which: equipment
Exports (goods and services)
Imports (goods and services)
Contribution to GDP growth: Domestic demand
Inventories
Net exports
Net lending (+) or borrowing (-) vis-a-vis ROW (c)
Employment
Unemployment rate (a)
Compensation of employees / head
Unit labour costs whole economy
Real unit labour cost
Saving rate of households (b)
GDP deflator
Consumer price index
Terms of trade goods
Trade balance (goods) (c)
Current-account balance (c)
General government balance (c)
Cyclically-adjusted budget balance (d)
Structural budget balance (d)
General government gross debt (c)
(a) as % of total labour force. (b) gross saving divided by adjusted gross disposable income. (c) as a % of GDP. (d) as a % of potential GDP.
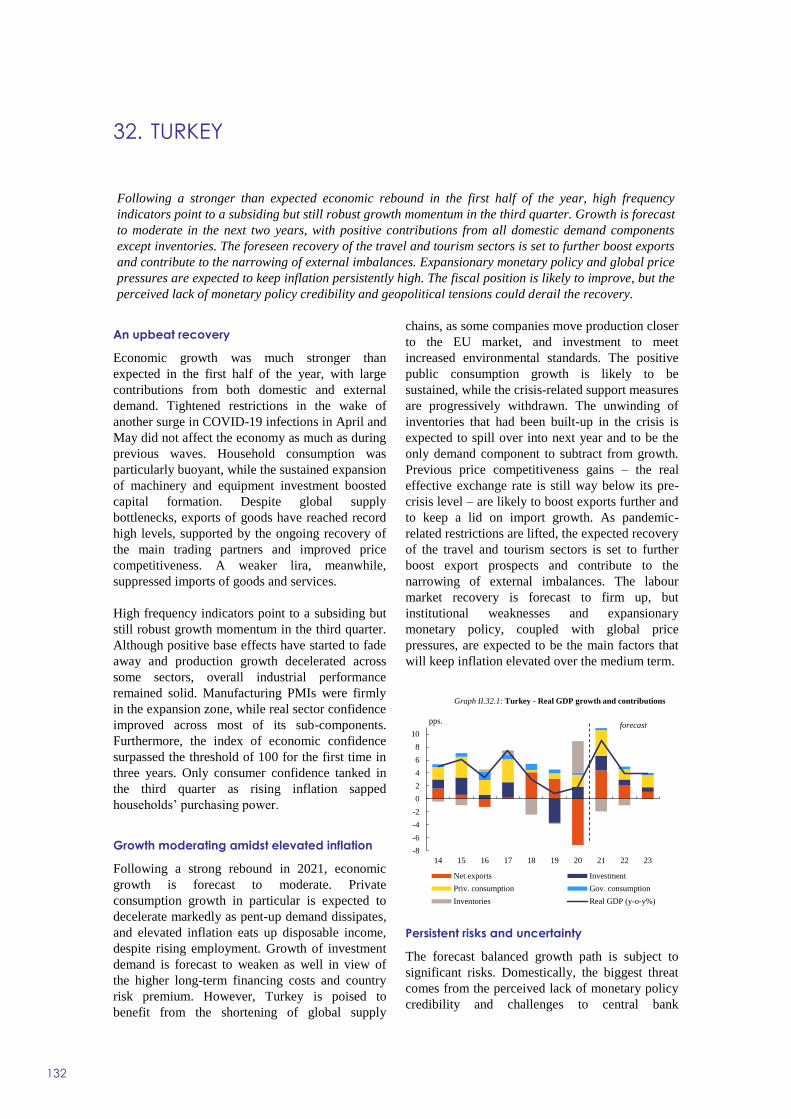
32. TURKEY
132
An upbeat recovery
Economic growth was much stronger than
expected in the first half of the year, with large
contributions from both domestic and external
demand. Tightened restrictions in the wake of
another surge in COVID-19 infections in April and
May did not affect the economy as much as during
previous waves. Household consumption was
particularly buoyant, while the sustained expansion
of machinery and equipment investment boosted
capital formation. Despite global supply
bottlenecks, exports of goods have reached record
high levels, supported by the ongoing recovery of
the main trading partners and improved price
competitiveness. A weaker lira, meanwhile,
suppressed imports of goods and services.
High frequency indicators point to a subsiding but
still robust growth momentum in the third quarter.
Although positive base effects have started to fade
away and production growth decelerated across
some sectors, overall industrial performance
remained solid. Manufacturing PMIs were firmly
in the expansion zone, while real sector confidence
improved across most of its sub-components.
Furthermore, the index of economic confidence
surpassed the threshold of 100 for the first time in
three years. Only consumer confidence tanked in
the third quarter as rising inflation sapped
households’ purchasing power.
Growth moderating amidst elevated inflation
Following a strong rebound in 2021, economic
growth is forecast to moderate. Private
consumption growth in particular is expected to
decelerate markedly as pent-up demand dissipates,
and elevated inflation eats up disposable income,
despite rising employment. Growth of investment
demand is forecast to weaken as well in view of
the higher long-term financing costs and country
risk premium. However, Turkey is poised to
benefit from the shortening of global supply
chains, as some companies move production closer
to the EU market, and investment to meet
increased environmental standards. The positive
public consumption growth is likely to be
sustained, while the crisis-related support measures
are progressively withdrawn. The unwinding of
inventories that had been built-up in the crisis is
expected to spill over into next year and to be the
only demand component to subtract from growth.
Previous price competitiveness gains – the real
effective exchange rate is still way below its pre-
crisis level – are likely to boost exports further and
to keep a lid on import growth. As pandemic-
related restrictions are lifted, the expected recovery
of the travel and tourism sectors is set to further
boost export prospects and contribute to the
narrowing of external imbalances. The labour
market recovery is forecast to firm up, but
institutional weaknesses and expansionary
monetary policy, coupled with global price
pressures, are expected to be the main factors that
will keep inflation elevated over the medium term.
Persistent risks and uncertainty
The forecast balanced growth path is subject to
significant risks. Domestically, the biggest threat
comes from the perceived lack of monetary policy
credibility and challenges to central bank
-8
-6
-4
-2
0
2
4
6
8
10
14 15 16 17 18 19 20 21 22 23
Graph II.32.1: Turkey - Real GDP growth and contributions
Net exports Investment
Priv. consumption Gov. consumption
Inventories Real GDP (y-o-y%)
forecastpps.
Following a stronger than expected economic rebound in the first half of the year, high frequency
indicators point to a subsiding but still robust growth momentum in the third quarter. Growth is forecast
to moderate in the next two years, with positive contributions from all domestic demand components
except inventories. The foreseen recovery of the travel and tourism sectors is set to further boost exports
and contribute to the narrowing of external imbalances. Expansionary monetary policy and global price
pressures are expected to keep inflation persistently high. The fiscal position is likely to improve, but the
perceived lack of monetary policy credibility and geopolitical tensions could derail the recovery.

Candidate Countries, Turkey
133
independence. Frequent dismissals at the helm of
the bank and persistent pressure to loosen
monetary policy could fuel even more exchange
rate volatility and dollarisation, further increase
inflation expectations, keeping uncertainty and the
country risk premium high. Although geopolitical
risks have abated somewhat recently, they are still
elevated and weigh heavily on the country risk
premium.
A solid fiscal performance but scars remain
The rather limited fiscal reaction to the pandemic
resulted in a muted expansion of the budget deficit
during the crisis. Tight control over primary
expenditure came at the cost of reduced public
investment, which remained far below its level a
few years ago. Nonetheless, government debt and
interest payments went up markedly in 2020,
affected by the large depreciation of the lira. As
economic activity rebounded in 2021, revenue
growth improved the budgetary performance
further. Thus, the revised government target of a
3.5% of GDP budget deficit seems achievable.
In the next two years, the budget deficit is
expected to decrease marginally. Risks, however,
loom large in view of sizeable contingent liabilities
and the political cycle.. Government debt-to-GDP
ratio is forecast to remain broadly stable, despite a
primary balance of close to zero or in surplus, and
a strong nominal GDP growth. Elevated interest
payments and valuation effects would remain
major debt-increasing factors.
0
10
20
-6
-4
-2
0
2
4
6
8
14 15 16 17 18 19 20 21 22 23
%
Unemployment rate Employment growth (lhs)
Real GDP growth
forecast
%
Graph II.32.2: Turkey- Labour market
bn TRY Curr. prices % GDP 02-17 2018 2019 2020 2021 2022 2023
5047.9 100.0 5.8 3.0 0.9 1.8 9.0 4.0 4.0
2864.0 56.7 5.3 0.6 1.5 3.2 7.0 3.0 3.5
766.0 15.2 5.2 6.5 4.1 2.2 2.1 2.7 2.8
1382.1 27.4 10.1 -0.2 -12.4 7.2 8.3 3.4 2.4
: : : : : : : : :
1446.7 28.7 5.9 8.8 4.6 -14.8 18.8 10.4 9.7
1639.0 32.5 8.1 -6.2 -5.4 7.6 3.1 4.5 7.0
4992.7 98.9 5.9 1.7 1.5 2.7 7.9 3.7 4.0
6.6 1.2 -2.2 4.0 6.5 2.9 2.9
0.0 -2.3 -0.2 4.9 -1.9 -1.0 0.0
-0.7 4.1 3.1 -7.1 4.4 2.0 1.1
: 1.9 -2.3 -4.8 6.7 4.6 3.1
9.9 10.9 13.7 13.1 12.7 12.6 12.2
: 17.0 22.7 15.0 17.9 24.1 23.3
: 15.8 18.9 7.6 15.4 24.8 22.2
: -0.6 4.4 -6.2 -4.0 5.6 4.5
: : : : : : :
10.8 16.5 13.9 14.8 20.2 18.3 17.0
11.2 16.3 15.2 12.3 17.8 17.7 15.4
: : : : : : :
-6.4 -5.5 -3.0 -6.3 -5.2 -5.5 -5.5
-4.0 -2.7 0.7 -4.9 -2.7 -2.2 -1.6
: : : : : : :
-0.8 -2.8 -4.4 -4.7 -3.6 -3.5 -3.1
: : : : : : :
: : : : : : :
41.2 30.4 32.6 39.7 39.1 38.9 38.7
GNI (GDP deflator)
Table II.32.1:
Main features of country forecast - TURKEY
2020 Annual percentage change
GDP
Private Consumption
Public Consumption
Gross fixed capital formation
of which: equipment
Exports (goods and services)
Imports (goods and services)
Contribution to GDP growth: Domestic demand
Inventories
Net exports
Net lending (+) or borrowing (-) vis-a-vis ROW (c)
Employment
Unemployment rate (a)
Compensation of employees / head
Unit labour costs whole economy
Real unit labour cost
Saving rate of households (b)
GDP deflator
Consumer price index
Terms of trade goods
Trade balance (goods) (c)
Current-account balance (c)
General government balance (c)
Cyclically-adjusted budget balance (d)
Structural budget balance (d)
General government gross debt (c)
(a) as % of total labour force. (b) gross saving divided by adjusted gross disposable income. (c) as a % of GDP. (d) as a % of potential GDP.


Other non-EU Countries

33. THE UNITED KINGDOM
136
Mixed picture for 2021
After falling by 9.7% in 2020, UK GDP further
declined by 1.4% in the first quarter of 2021, due
to a pandemic-related lockdown. As the
restrictions were gradually eased, GDP rebounded
quickly and grew by 5.5% in the second quarter of
2021, driven by private and public consumption.
GDP growth is expected to slow down
significantly over the second half of 2021.
Shortages in labour supply and other inputs has
slowed the rebound of the economy over the
summer and autumn, and are set to persist in
coming quarters. The end of the furlough scheme
in September is projected to temporarily increase
unemployment, with skills mismatches expected to
prevent a smooth return of furloughed workers into
the labour market in some cases. While no further
lockdowns are assumed over the forecast period,
relatively high case rates are expected to still
weigh on confidence over the next few quarters. In
addition, high inflation is set to negatively affect
household spending. Overall, GDP in 2021 is
forecast to grow by 6.9%.
Annual growth to slow down in 2022 and 2023
Private consumption is set to slow over the
forecast period as fiscal support is scaled back and
taxes and the National Insurance rate are set to
rise. While slowing down as compared to 2021,
government consumption is still projected to
contribute positively to growth over 2022 and
2023. Business investment is forecast to increase
strongly in 2022, as uncertainty related to the
pandemic dissipates and businesses invest
accumulated savings. The positive impact of the
‘super-deduction’, which allows businesses to
offset 130% of eligible investment spending, is
assumed to last until the end of the first quarter of
2023, when the deduction is set to expire and
business investment is projected to turn negative.
In addition, the increase in corporation tax planned
for April 2023 will weigh on investment.
With imports growing quicker than exports, net
exports are projected to be a drag on growth over
the forecast horizon. Following the change in
trading arrangements due to the UK leaving the
European Union, both exports and import levels
are projected to grow only slowly over the forecast
period. Overall, GDP is expected to increase by
4.8% in 2022 and by 1.7% in 2023. It is set to
reach pre-pandemic levels by the second quarter of
2022.
Risks to the forecast are tilted to the downside,
with a possibility that supply constraints could
prove longer lasting.
Unemployment set to rise before falling again
The furlough scheme, which supported employees
and self-employed since the start of the pandemic,
ran out in the end of September 2021. As there
were still more than 1 million people supported by
the scheme in August 2021 and not all are
expected to return to their jobs, unemployment is
forecast to rise in the last quarter of 2021. The
unemployment rate in 2021 is projected to increase
to 4.9% from 4.5% in 2020, before falling to 4.7%
in 2022 and 4.4% in 2023.
-12
-10
-8
-6
-4
-2
0
2
4
6
8
14 15 16 17 18 19 20 21 22 23
Graph II.33.1: The United Kingdom - Real GDP growth and
contributions
Net exports Investment
Priv. consumption Gov. consumption
Inventories Real GDP (y-o-y%)
forecastpps.
After falling in the first quarter of 2021 due a pandemic-related lockdown, UK GDP rebounded quickly
in the second quarter as the economy reopened. Growth is projected to slow over the next quarters due
to supply shortages, higher unemployment and an increase in inflation. These effects are expected to
ease over the forecast horizon, while the UK’s departure from the EU is expected to continue to weigh
on trade and growth. Real UK GDP is set to reach pre-pandemic levels by the second quarter of 2022.
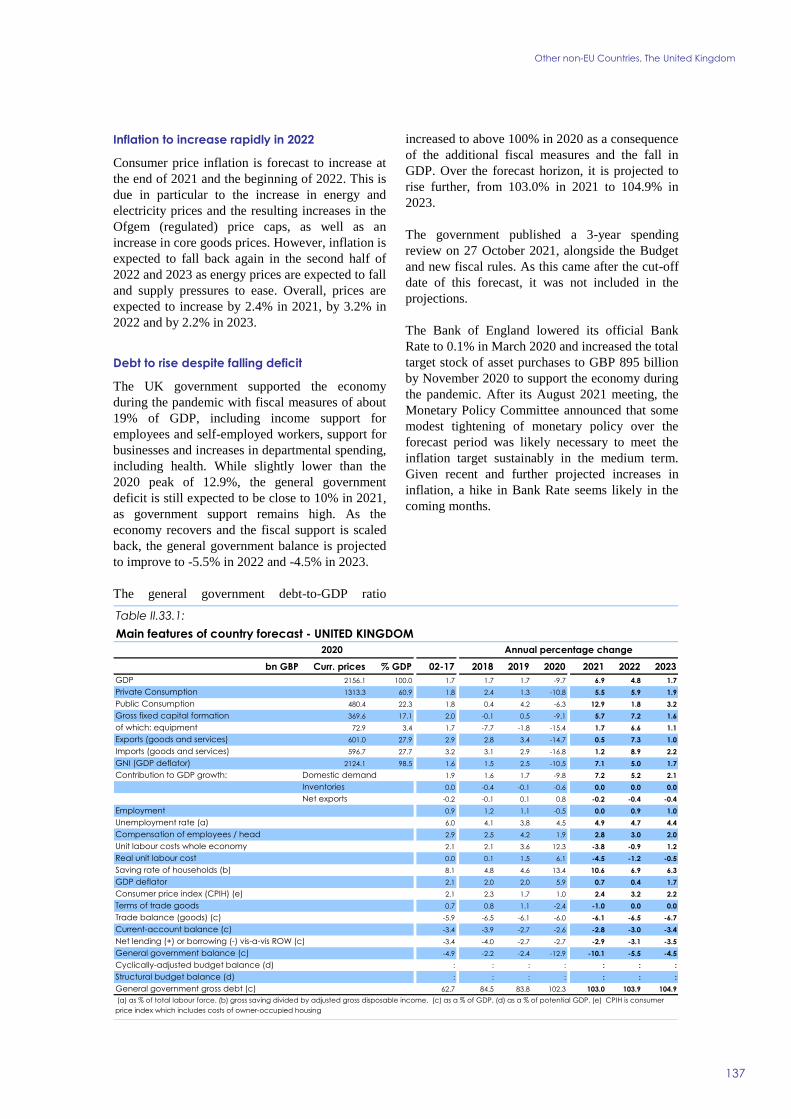
Other non-EU Countries, The United Kingdom
137
Inflation to increase rapidly in 2022
Consumer price inflation is forecast to increase at
the end of 2021 and the beginning of 2022. This is
due in particular to the increase in energy and
electricity prices and the resulting increases in the
Ofgem (regulated) price caps, as well as an
increase in core goods prices. However, inflation is
expected to fall back again in the second half of
2022 and 2023 as energy prices are expected to fall
and supply pressures to ease. Overall, prices are
expected to increase by 2.4% in 2021, by 3.2% in
2022 and by 2.2% in 2023.
Debt to rise despite falling deficit
The UK government supported the economy
during the pandemic with fiscal measures of about
19% of GDP, including income support for
employees and self-employed workers, support for
businesses and increases in departmental spending,
including health. While slightly lower than the
2020 peak of 12.9%, the general government
deficit is still expected to be close to 10% in 2021,
as government support remains high. As the
economy recovers and the fiscal support is scaled
back, the general government balance is projected
to improve to -5.5% in 2022 and -4.5% in 2023.
The general government debt-to-GDP ratio
increased to above 100% in 2020 as a consequence
of the additional fiscal measures and the fall in
GDP. Over the forecast horizon, it is projected to
rise further, from 103.0% in 2021 to 104.9% in
2023.
The government published a 3-year spending
review on 27 October 2021, alongside the Budget
and new fiscal rules. As this came after the cut-off
date of this forecast, it was not included in the
projections.
The Bank of England lowered its official Bank
Rate to 0.1% in March 2020 and increased the total
target stock of asset purchases to GBP 895 billion
by November 2020 to support the economy during
the pandemic. After its August 2021 meeting, the
Monetary Policy Committee announced that some
modest tightening of monetary policy over the
forecast period was likely necessary to meet the
inflation target sustainably in the medium term.
Given recent and further projected increases in
inflation, a hike in Bank Rate seems likely in the
coming months.
bn GBP Curr. prices % GDP 02-17 2018 2019 2020 2021 2022 2023
2156.1 100.0 1.7 1.7 1.7 -9.7 6.9 4.8 1.7
1313.3 60.9 1.8 2.4 1.3 -10.8 5.5 5.9 1.9
480.4 22.3 1.8 0.4 4.2 -6.3 12.9 1.8 3.2
369.6 17.1 2.0 -0.1 0.5 -9.1 5.7 7.2 1.6
72.9 3.4 1.7 -7.7 -1.8 -15.4 1.7 6.6 1.1
601.0 27.9 2.9 2.8 3.4 -14.7 0.5 7.3 1.0
596.7 27.7 3.2 3.1 2.9 -16.8 1.2 8.9 2.2
2124.1 98.5 1.6 1.5 2.5 -10.5 7.1 5.0 1.7
1.9 1.6 1.7 -9.8 7.2 5.2 2.1
0.0 -0.4 -0.1 -0.6 0.0 0.0 0.0
-0.2 -0.1 0.1 0.8 -0.2 -0.4 -0.4
0.9 1.2 1.1 -0.5 0.0 0.9 1.0
6.0 4.1 3.8 4.5 4.9 4.7 4.4
2.9 2.5 4.2 1.9 2.8 3.0 2.0
2.1 2.1 3.6 12.3 -3.8 -0.9 1.2
0.0 0.1 1.5 6.1 -4.5 -1.2 -0.5
8.1 4.8 4.6 13.4 10.6 6.9 6.3
2.1 2.0 2.0 5.9 0.7 0.4 1.7
2.1 2.3 1.7 1.0 2.4 3.2 2.2
0.7 0.8 1.1 -2.4 -1.0 0.0 0.0
-5.9 -6.5 -6.1 -6.0 -6.1 -6.5 -6.7
-3.4 -3.9 -2.7 -2.6 -2.8 -3.0 -3.4
-3.4 -4.0 -2.7 -2.7 -2.9 -3.1 -3.5
-4.9 -2.2 -2.4 -12.9 -10.1 -5.5 -4.5
: : : : : : :
: : : : : : :
62.7 84.5 83.8 102.3 103.0 103.9 104.9
GNI (GDP deflator)
Table II.33.1:
Main features of country forecast - UNITED KINGDOM
2020 Annual percentage change
GDP
Private Consumption
Public Consumption
Gross fixed capital formation
of which: equipment
Exports (goods and services)
Imports (goods and services)
Contribution to GDP growth: Domestic demand
Inventories
Net exports
Net lending (+) or borrowing (-) vis-a-vis ROW (c)
Employment
Unemployment rate (a)
Compensation of employees / head
Unit labour costs whole economy
Real unit labour cost
Saving rate of households (b)
GDP deflator
Consumer price index (CPIH) (e)
Terms of trade goods
Trade balance (goods) (c)
Current-account balance (c)
General government balance (c)
Cyclically-adjusted budget balance (d)
Structural budget balance (d)
General government gross debt (c)
(a) as % of total labour force. (b) gross saving divided by adjusted gross disposable income. (c) as a % of GDP. (d) as a % of potential GDP. (e) CPIH is consumer
price index which includes costs of owner-occupied housing
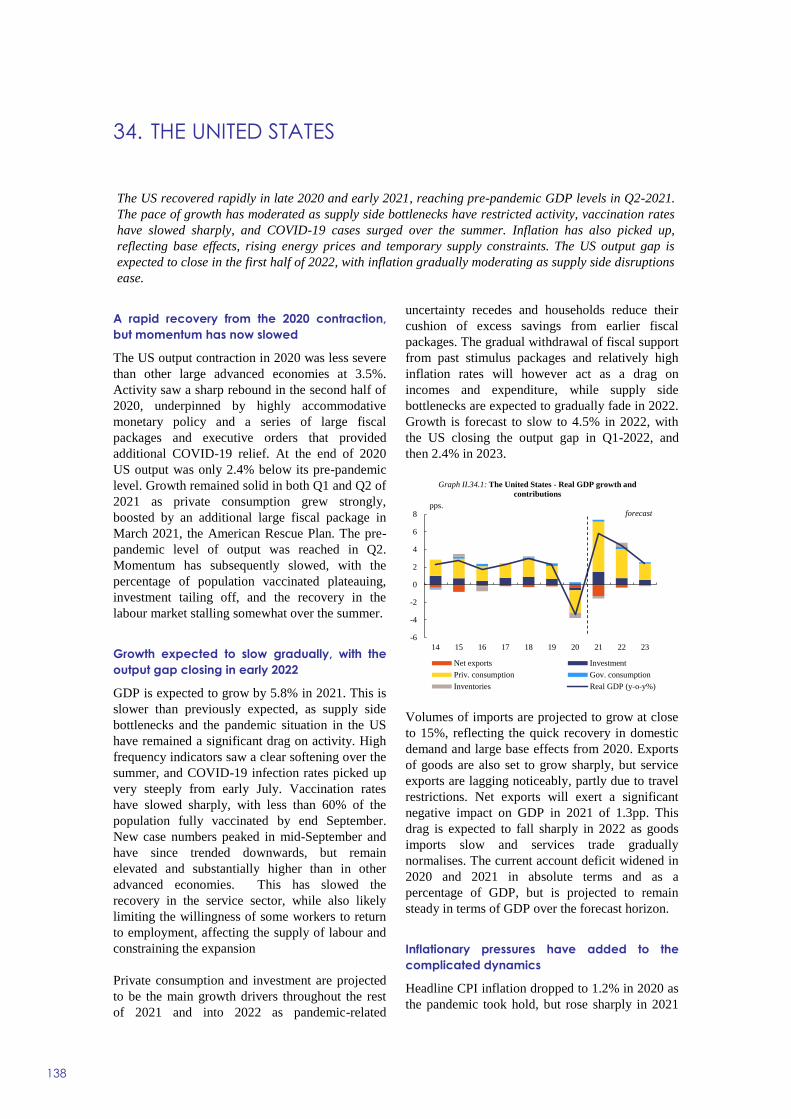
34. THE UNITED STATES
138
A rapid recovery from the 2020 contraction,
but momentum has now slowed
The US output contraction in 2020 was less severe
than other large advanced economies at 3.5%.
Activity saw a sharp rebound in the second half of
2020, underpinned by highly accommodative
monetary policy and a series of large fiscal
packages and executive orders that provided
additional COVID-19 relief. At the end of 2020
US output was only 2.4% below its pre-pandemic
level. Growth remained solid in both Q1 and Q2 of
2021 as private consumption grew strongly,
boosted by an additional large fiscal package in
March 2021, the American Rescue Plan. The pre-
pandemic level of output was reached in Q2.
Momentum has subsequently slowed, with the
percentage of population vaccinated plateauing,
investment tailing off, and the recovery in the
labour market stalling somewhat over the summer.
Growth expected to slow gradually, with the
output gap closing in early 2022
GDP is expected to grow by 5.8% in 2021. This is
slower than previously expected, as supply side
bottlenecks and the pandemic situation in the US
have remained a significant drag on activity. High
frequency indicators saw a clear softening over the
summer, and COVID-19 infection rates picked up
very steeply from early July. Vaccination rates
have slowed sharply, with less than 60% of the
population fully vaccinated by end September.
New case numbers peaked in mid-September and
have since trended downwards, but remain
elevated and substantially higher than in other
advanced economies. This has slowed the
recovery in the service sector, while also likely
limiting the willingness of some workers to return
to employment, affecting the supply of labour and
constraining the expansion
Private consumption and investment are projected
to be the main growth drivers throughout the rest
of 2021 and into 2022 as pandemic-related
uncertainty recedes and households reduce their
cushion of excess savings from earlier fiscal
packages. The gradual withdrawal of fiscal support
from past stimulus packages and relatively high
inflation rates will however act as a drag on
incomes and expenditure, while supply side
bottlenecks are expected to gradually fade in 2022.
Growth is forecast to slow to 4.5% in 2022, with
the US closing the output gap in Q1-2022, and
then 2.4% in 2023.
Volumes of imports are projected to grow at close
to 15%, reflecting the quick recovery in domestic
demand and large base effects from 2020. Exports
of goods are also set to grow sharply, but service
exports are lagging noticeably, partly due to travel
restrictions. Net exports will exert a significant
negative impact on GDP in 2021 of 1.3pp. This
drag is expected to fall sharply in 2022 as goods
imports slow and services trade gradually
normalises. The current account deficit widened in
2020 and 2021 in absolute terms and as a
percentage of GDP, but is projected to remain
steady in terms of GDP over the forecast horizon.
Inflationary pressures have added to the
complicated dynamics
Headline CPI inflation dropped to 1.2% in 2020 as
the pandemic took hold, but rose sharply in 2021
-6
-4
-2
0
2
4
6
8
14 15 16 17 18 19 20 21 22 23
Graph II.34.1: The United States - Real GDP growth and
contributions
Net exports Investment
Priv. consumption Gov. consumption
Inventories Real GDP (y-o-y%)
forecastpps.
The US recovered rapidly in late 2020 and early 2021, reaching pre-pandemic GDP levels in Q2-2021.
The pace of growth has moderated as supply side bottlenecks have restricted activity, vaccination rates
have slowed sharply, and COVID-19 cases surged over the summer. Inflation has also picked up,
reflecting base effects, rising energy prices and temporary supply constraints. The US output gap is
expected to close in the first half of 2022, with inflation gradually moderating as supply side disruptions
ease.

Other non-EU Countries, The United States
139
to reach around 5% in Q2 and Q3, influenced by
strong base effects, high energy prices, and supply
constraints. Both the CPI and PCE inflation are
expected to remain elevated in coming months,
and then moderate into 2022 as supply chain
constraints recede, with headline PCE falling back
towards the 2% target in 2023. Although there are
signs of wage pressure in some market segments,
labour market slack remains significant,
particularly in the service sectors. Jobs growth has
slowed sharply in recent months, though average
working hours have increased somewhat,
suggesting that temporary demand/supply
mismatches are playing a key role. The
unemployment rate is set to fall to around 4% in
late 2022 and remain at around that level in 2023
as the economy returns to trend growth.
Policy remains supportive, but is set to
gradually tighten
The Fed’s new monetary policy framework allows
for some temporary overshoot of the 2% PCE
inflation target, and the target Fed funds rate
remains at 0.25%, though the September FOMC
meeting indicated tapering of asset purchases is
likely to begin soon. Although recent high inflation
prints have pushed nominal long yields to almost
pre-pandemic levels, real interest rates remain
unusually low. On the fiscal front, the general
government deficit-to-GDP ratio is set to fall from
16% of GDP in 2020 to around 11% in 2021 and
then to around 7% in 2023. Some additional
spending from the new Infrastructure bill has been
factored in for 2022 and 2023. After a steep
increase of about 20 pps of GDP in 2020, general
government debt is set to reach 132% of GDP in
2021 and then fall slightly in 2022 and 2023.
Both downside and upside risks remain
On the downside, higher inflationary pressures
could erode consumer purchasing power, while
also entailing a further tightening of financing
conditions if data surprises lead markets to push
nominal yields significantly higher. Uncertainties
also exist in both directions as regards the pace of
labour market adjustment and resolution of supply
side disruptions. On the upside, the adoption of
further fiscal measures is a strong possibility,
which could imply some boost to growth in 2022
and 2023, while a faster-than-assumed release of
private savings could also accelerate consumption
growth in both 2022 and 2023.
bn USD Curr. prices % GDP 02-17 2018 2019 2020 2021 2022 2023
20893.7 100.0 2.0 2.9 2.3 -3.4 5.8 4.5 2.4
14047.6 67.2 2.2 2.9 2.2 -3.8 8.5 4.8 2.7
3078.0 14.7 0.8 1.2 2.0 2.0 1.5 1.7 1.1
4478.9 21.4 1.9 4.4 3.1 -1.6 6.8 3.5 2.5
1292.0 6.2 3.6 6.3 3.7 -7.0 12.9 4.7 2.6
2123.4 10.2 4.1 2.8 -0.1 -13.6 6.1 7.7 3.8
2774.6 13.3 3.5 4.1 1.2 -8.9 14.3 7.8 3.5
21116.1 101.1 2.0 2.8 2.1 -3.6 5.8 4.5 2.4
2.0 3.0 2.4 -2.6 7.4 4.3 2.6
0.0 0.2 0.0 -0.6 -0.3 0.5 -0.1
-0.1 -0.3 -0.2 -0.3 -1.3 -0.3 -0.1
0.6 1.7 1.2 -5.8 3.1 3.0 1.2
6.3 3.9 3.7 8.1 5.5 4.2 4.0
2.9 3.2 3.0 7.4 3.1 3.8 3.6
1.5 2.0 1.9 4.8 0.4 2.3 2.3
-0.4 -0.4 0.1 3.6 -3.1 -0.3 0.2
11.6 13.4 13.1 23.2 17.6 14.2 13.5
1.9 2.4 1.8 1.2 3.6 2.6 2.1
2.1 2.4 1.8 1.2 4.3 3.3 2.2
-0.2 0.8 0.6 -1.2 5.2 0.8 0.4
-4.9 -4.3 -4.1 -4.3 -4.9 -5.0 -5.0
-3.6 -2.1 -2.2 -2.8 -3.6 -3.6 -3.5
-3.6 -2.2 -2.3 -2.8 -3.6 -3.6 -3.5
-6.7 -6.2 -6.6 -15.8 -11.4 -7.9 -6.8
: : : : : : :
: : : : : : :
84.9 107.0 108.5 127.0 129.3 128.6 129.8
General government balance (c)
Cyclically-adjusted budget balance (d)
Structural budget balance (d)
General government gross debt (c)
(a) as % of total labour force. (b) gross saving divided by adjusted gross disposable income. (c) as a % of GDP. (d) as a % of potential GDP.
(*) Employment data from the BLS household survey.
Net lending (+) or borrowing (-) vis-a-vis ROW (c)
Employment
Unemployment rate (a)
Compensation of employees / head
Unit labour costs whole economy
Real unit labour cost
Saving rate of households (b)
GDP deflator
Consumer price index
Terms of trade goods
Trade balance (goods) (c)
Current-account balance (c)
Contribution to GDP growth: Domestic demand
Inventories
Net exports
GNI (GDP deflator)
Table II.34.1:
Main features of country forecast - UNITED STATES
2020 Annual percentage change
GDP
Private Consumption
Public Consumption
Gross fixed capital formation
of which: equipment
Exports (goods and services)
Imports (goods and services)
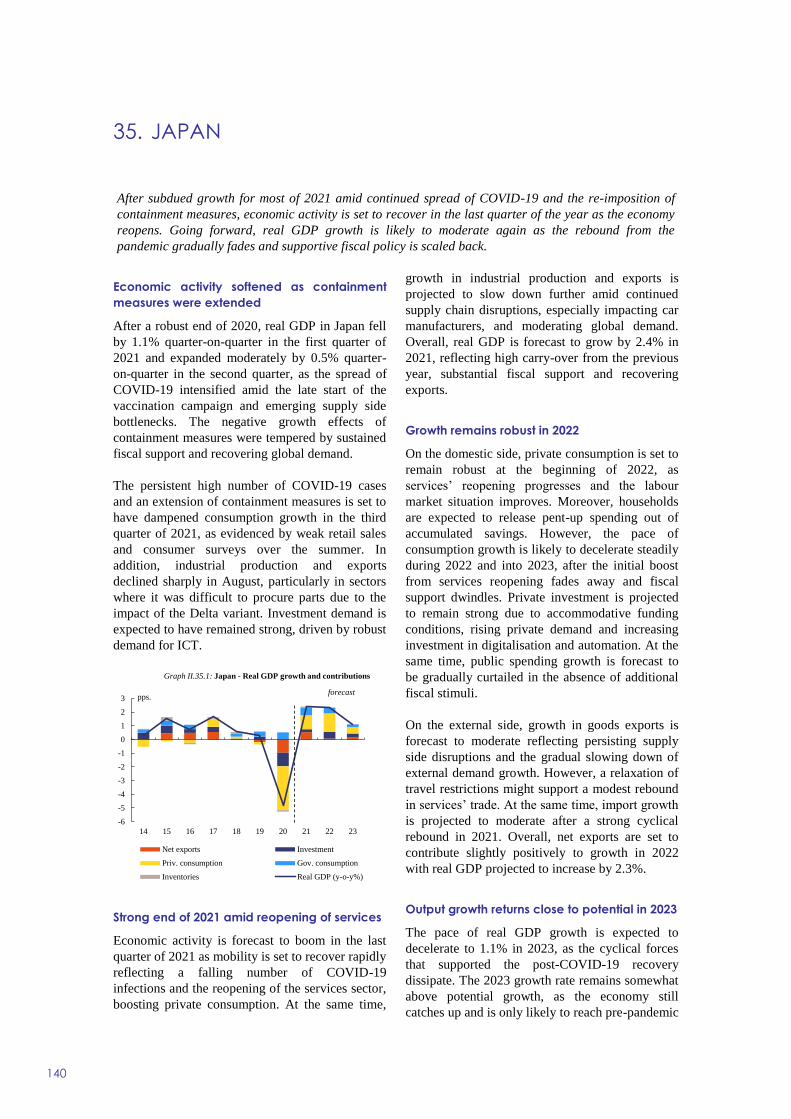
35. JAPAN
140
Economic activity softened as containment
measures were extended
After a robust end of 2020, real GDP in Japan fell
by 1.1% quarter-on-quarter in the first quarter of
2021 and expanded moderately by 0.5% quarter-
on-quarter in the second quarter, as the spread of
COVID-19 intensified amid the late start of the
vaccination campaign and emerging supply side
bottlenecks. The negative growth effects of
containment measures were tempered by sustained
fiscal support and recovering global demand.
The persistent high number of COVID-19 cases
and an extension of containment measures is set to
have dampened consumption growth in the third
quarter of 2021, as evidenced by weak retail sales
and consumer surveys over the summer. In
addition, industrial production and exports
declined sharply in August, particularly in sectors
where it was difficult to procure parts due to the
impact of the Delta variant. Investment demand is
expected to have remained strong, driven by robust
demand for ICT.
Strong end of 2021 amid reopening of services
Economic activity is forecast to boom in the last
quarter of 2021 as mobility is set to recover rapidly
reflecting a falling number of COVID-19
infections and the reopening of the services sector,
boosting private consumption. At the same time,
growth in industrial production and exports is
projected to slow down further amid continued
supply chain disruptions, especially impacting car
manufacturers, and moderating global demand.
Overall, real GDP is forecast to grow by 2.4% in
2021, reflecting high carry-over from the previous
year, substantial fiscal support and recovering
exports.
Growth remains robust in 2022
On the domestic side, private consumption is set to
remain robust at the beginning of 2022, as
services’ reopening progresses and the labour
market situation improves. Moreover, households
are expected to release pent-up spending out of
accumulated savings. However, the pace of
consumption growth is likely to decelerate steadily
during 2022 and into 2023, after the initial boost
from services reopening fades away and fiscal
support dwindles. Private investment is projected
to remain strong due to accommodative funding
conditions, rising private demand and increasing
investment in digitalisation and automation. At the
same time, public spending growth is forecast to
be gradually curtailed in the absence of additional
fiscal stimuli.
On the external side, growth in goods exports is
forecast to moderate reflecting persisting supply
side disruptions and the gradual slowing down of
external demand growth. However, a relaxation of
travel restrictions might support a modest rebound
in services’ trade. At the same time, import growth
is projected to moderate after a strong cyclical
rebound in 2021. Overall, net exports are set to
contribute slightly positively to growth in 2022
with real GDP projected to increase by 2.3%.
Output growth returns close to potential in 2023
The pace of real GDP growth is expected to
decelerate to 1.1% in 2023, as the cyclical forces
that supported the post-COVID-19 recovery
dissipate. The 2023 growth rate remains somewhat
above potential growth, as the economy still
catches up and is only likely to reach pre-pandemic
-6
-5
-4
-3
-2
-1
0
1
2
3
14 15 16 17 18 19 20 21 22 23
Graph II.35.1: Japan - Real GDP growth and contributions
Net exports Investment
Priv. consumption Gov. consumption
Inventories Real GDP (y-o-y%)
forecastpps.
After subdued growth for most of 2021 amid continued spread of COVID-19 and the re-imposition of
containment measures, economic activity is set to recover in the last quarter of the year as the economy
reopens. Going forward, real GDP growth is likely to moderate again as the rebound from the
pandemic gradually fades and supportive fiscal policy is scaled back.
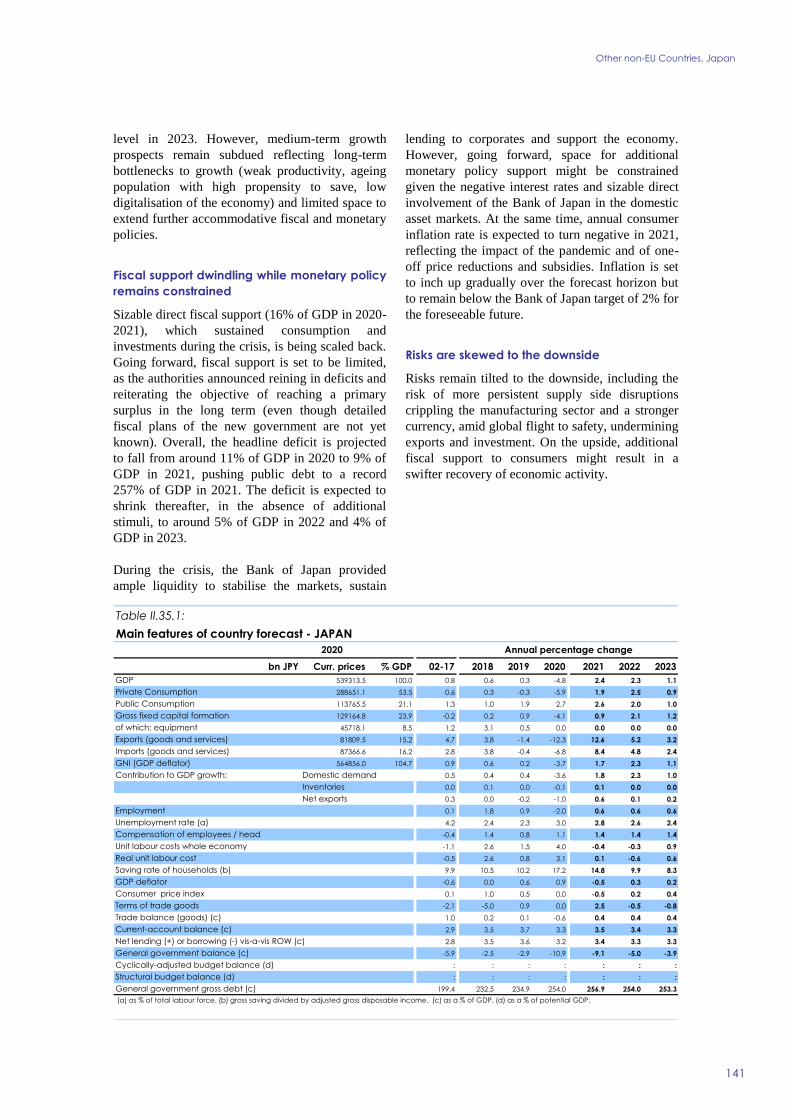
Other non-EU Countries, Japan
141
level in 2023. However, medium-term growth
prospects remain subdued reflecting long-term
bottlenecks to growth (weak productivity, ageing
population with high propensity to save, low
digitalisation of the economy) and limited space to
extend further accommodative fiscal and monetary
policies.
Fiscal support dwindling while monetary policy
remains constrained
Sizable direct fiscal support (16% of GDP in 2020-
2021), which sustained consumption and
investments during the crisis, is being scaled back.
Going forward, fiscal support is set to be limited,
as the authorities announced reining in deficits and
reiterating the objective of reaching a primary
surplus in the long term (even though detailed
fiscal plans of the new government are not yet
known). Overall, the headline deficit is projected
to fall from around 11% of GDP in 2020 to 9% of
GDP in 2021, pushing public debt to a record
257% of GDP in 2021. The deficit is expected to
shrink thereafter, in the absence of additional
stimuli, to around 5% of GDP in 2022 and 4% of
GDP in 2023.
During the crisis, the Bank of Japan provided
ample liquidity to stabilise the markets, sustain
lending to corporates and support the economy.
However, going forward, space for additional
monetary policy support might be constrained
given the negative interest rates and sizable direct
involvement of the Bank of Japan in the domestic
asset markets. At the same time, annual consumer
inflation rate is expected to turn negative in 2021,
reflecting the impact of the pandemic and of one-
off price reductions and subsidies. Inflation is set
to inch up gradually over the forecast horizon but
to remain below the Bank of Japan target of 2% for
the foreseeable future.
Risks are skewed to the downside
Risks remain tilted to the downside, including the
risk of more persistent supply side disruptions
crippling the manufacturing sector and a stronger
currency, amid global flight to safety, undermining
exports and investment. On the upside, additional
fiscal support to consumers might result in a
swifter recovery of economic activity.
bn JPY Curr. prices % GDP 02-17 2018 2019 2020 2021 2022 2023
539313.5 100.0 0.8 0.6 0.3 -4.8 2.4 2.3 1.1
288651.1 53.5 0.6 0.3 -0.3 -5.9 1.9 2.5 0.9
113765.5 21.1 1.3 1.0 1.9 2.7 2.6 2.0 1.0
129164.8 23.9 -0.2 0.2 0.9 -4.1 0.9 2.1 1.2
45718.1 8.5 1.2 3.1 0.5 0.0 0.0 0.0 0.0
81809.5 15.2 4.7 3.8 -1.4 -12.3 12.6 5.2 3.2
87366.6 16.2 2.8 3.8 -0.4 -6.8 8.4 4.8 2.4
564856.0 104.7 0.9 0.6 0.2 -3.7 1.7 2.3 1.1
0.5 0.4 0.4 -3.6 1.8 2.3 1.0
0.0 0.1 0.0 -0.1 0.1 0.0 0.0
0.3 0.0 -0.2 -1.0 0.6 0.1 0.2
0.1 1.8 0.9 -2.0 0.6 0.6 0.6
4.2 2.4 2.3 3.0 2.8 2.6 2.4
-0.4 1.4 0.8 1.1 1.4 1.4 1.4
-1.1 2.6 1.5 4.0 -0.4 -0.3 0.9
-0.5 2.6 0.8 3.1 0.1 -0.6 0.6
9.9 10.5 10.2 17.2 14.8 9.9 8.3
-0.6 0.0 0.6 0.9 -0.5 0.3 0.2
0.1 1.0 0.5 0.0 -0.5 0.2 0.4
-2.1 -5.0 0.9 0.0 2.5 -0.5 -0.8
1.0 0.2 0.1 -0.6 0.4 0.4 0.4
2.9 3.5 3.7 3.3 3.5 3.4 3.3
2.8 3.5 3.6 3.2 3.4 3.3 3.3
-5.9 -2.5 -2.9 -10.9 -9.1 -5.0 -3.9
: : : : : : : : :
: : : : : : : : :
199.4 232.5 234.9 254.0 256.9 254.0 253.3
GNI (GDP deflator)
Table II.35.1:
Main features of country forecast - JAPAN
2020 Annual percentage change
GDP
Private Consumption
Public Consumption
Gross fixed capital formation
of which: equipment
Exports (goods and services)
Imports (goods and services)
Contribution to GDP growth: Domestic demand
Inventories
Net exports
Net lending (+) or borrowing (-) vis-a-vis ROW (c)
Employment
Unemployment rate (a)
Compensation of employees / head
Unit labour costs whole economy
Real unit labour cost
Saving rate of households (b)
GDP deflator
Consumer price index
Terms of trade goods
Trade balance (goods) (c)
Current-account balance (c)
General government balance (c)
Cyclically-adjusted budget balance (d)
Structural budget balance (d)
General government gross debt (c)
(a) as % of total labour force. (b) gross saving divided by adjusted gross disposable income. (c) as a % of GDP. (d) as a % of potential GDP.

36. CHINA
142
Growth slowing down in the second half of
2021
Following record growth in Q1-2021 of 18.3%
year on year, the economy grew by 7.9% in the
second quarter of the year and more modestly by
4.9% in Q3, reflecting very strong base effects. In
the first nine months of 2021, GDP growth was
primarily driven by recovering consumption, but
has also been supported by investment and net
exports. However all three components showed
weakening momentum as the year went on.
Economic uncertainty due to local outbreaks of
COVID-19, followed by strict lockdown measures,
and recent electricity shortages are undermining
consumer confidence and weighing on households'
propensity to spend.
Investment is slowing down as local governments
rein in new borrowing for investment purposes,
and the real estate sector struggles under tighter
financing conditions. Transport and electricity
supply bottlenecks, and rising input prices are
starting to undermine export performance. While
the economy is set to continue losing momentum
in the fourth quarter, annual GDP growth is still
expected to reach a solid 7.9% in 2021, on the
back of an exceptionally strong carry-over effect.
Towards the pre-pandemic growth trend
Growth is expected to moderate to 5.3% in 2022
and 2023, in line with its pre pandemic trend,
weighed down by declining productivity growth,
an excessively leveraged corporate sector,
geopolitical tensions and the increasing policy
prioritisation of longer-term economic and social
objectives over short-term growth. Household
consumption is set to receive support from rising
incomes while high vaccination rates should help
contain new virus outbursts, despite lower reported
efficacy of Chinese vaccines.
Investment growth is projected to remain subdued
as both real estate and infrastructure investment
start to face strong headwinds. Recent turmoil in
the property sector demonstrates the
unsustainability of the prevalent business model,
based on high leverage and quick turnover.
Furthermore, housing demand is likely to
moderate, subdued by demographic changes,
tighter mortgage financing conditions and
exuberant housing prices in higher tier cities. A
slowdown in the property sector will impact local
government capacity to maintain high
infrastructure investment, as property sales account
for around one third of their revenue. On the other
hand, strategic industries (e.g., semiconductors)
will likely benefit from strong government
investment support, while access to finance could
ease for the previously crowded out, more
productive, private investment.
Export growth is forecast to moderate in 2022 and
2023 as global consumption patterns shift back
from goods to services. At the same time, imports
are set to receive support from domestic demand.
Overall, the current account surplus is expected to
remain sizeable but decline gradually throughout
2022-2023.
Policy focus remains on managing imbalances
China’s policy focus recently shifted towards
tighter managing of corporate indebtedness, in
-2
0
2
4
6
8
10
14 15 16 17 18 19 20 21 22 23
Graph II.36.1: China - Real GDP growth and contributions
Net exports Investment
Consumption Domestic demand
Real GDP (y-o-y%)
forecastpps.
China’s economy seems to be slowing, burdened by sluggish private consumption, weaker credit growth
and ongoing turmoil in the property sector. In the forecast horizon, China’s economy is expected to
slowly adjust away from the growth model based on debt-fuelled brick and mortar investment. Policy
priorities are changing from maintaining pre-set high levels of growth at all cost to managing China’s
lengthy list of economic and social imbalances. Short run risks arise in the domestic property, energy
and transport sectors, while geopolitical tensions are expected to dominate over the medium term.
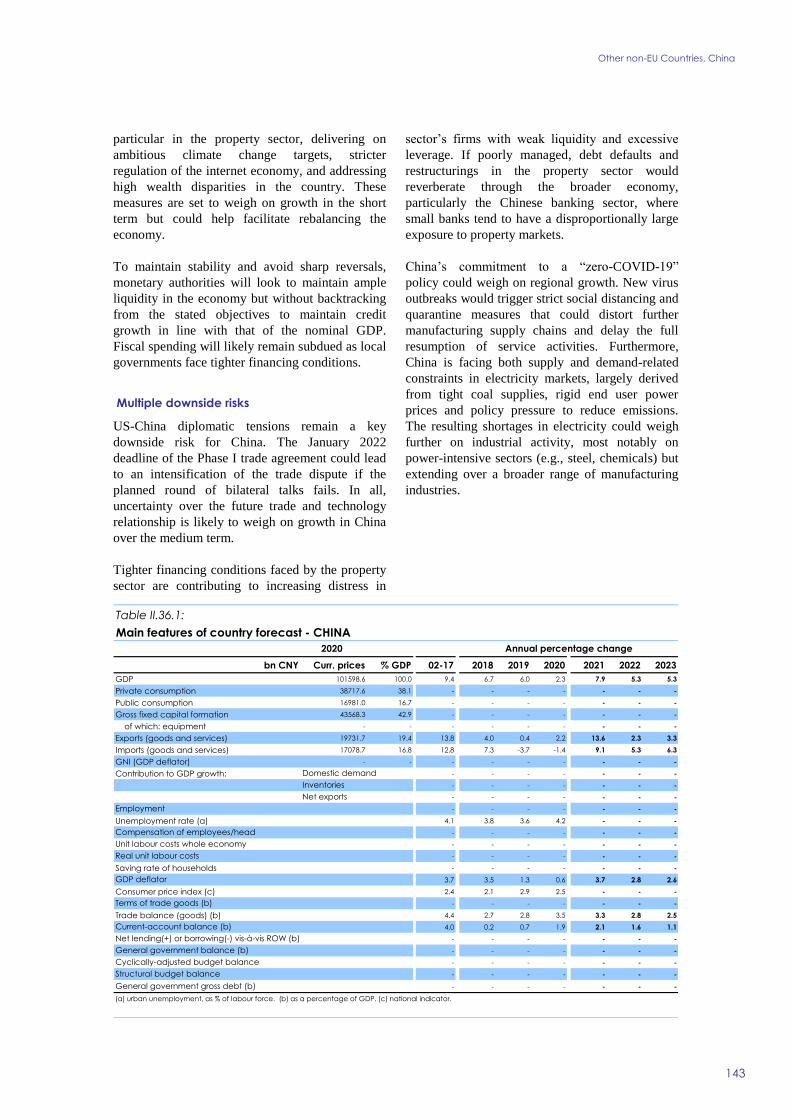
Other non-EU Countries, China
143
particular in the property sector, delivering on
ambitious climate change targets, stricter
regulation of the internet economy, and addressing
high wealth disparities in the country. These
measures are set to weigh on growth in the short
term but could help facilitate rebalancing the
economy.
To maintain stability and avoid sharp reversals,
monetary authorities will look to maintain ample
liquidity in the economy but without backtracking
from the stated objectives to maintain credit
growth in line with that of the nominal GDP.
Fiscal spending will likely remain subdued as local
governments face tighter financing conditions.
Multiple downside risks
US-China diplomatic tensions remain a key
downside risk for China. The January 2022
deadline of the Phase I trade agreement could lead
to an intensification of the trade dispute if the
planned round of bilateral talks fails. In all,
uncertainty over the future trade and technology
relationship is likely to weigh on growth in China
over the medium term.
Tighter financing conditions faced by the property
sector are contributing to increasing distress in
sector’s firms with weak liquidity and excessive
leverage. If poorly managed, debt defaults and
restructurings in the property sector would
reverberate through the broader economy,
particularly the Chinese banking sector, where
small banks tend to have a disproportionally large
exposure to property markets.
China’s commitment to a “zero-COVID-19”
policy could weigh on regional growth. New virus
outbreaks would trigger strict social distancing and
quarantine measures that could distort further
manufacturing supply chains and delay the full
resumption of service activities. Furthermore,
China is facing both supply and demand-related
constraints in electricity markets, largely derived
from tight coal supplies, rigid end user power
prices and policy pressure to reduce emissions.
The resulting shortages in electricity could weigh
further on industrial activity, most notably on
power-intensive sectors (e.g., steel, chemicals) but
extending over a broader range of manufacturing
industries.
Table II.36.1:
bn CNY Curr. prices % GDP 02-17 2018 2019 2020 2021 2022 2023
GDP 101598.6 100.0 9.4 6.7 6.0 2.3 7.9 5.3 5.3
Private consumption 38717.6 38.1 - - - - - - -
Public consumption 16981.0 16.7 - - - - - - -
Gross fixed capital formation 43568.3 42.9 - - - - - - -
of which: equipment - - - - - - - - -
Exports (goods and services) 19731.7 19.4 13.8 4.0 0.4 2.2 13.6 2.3 3.3
Imports (goods and services) 17078.7 16.8 12.8 7.3 -3.7 -1.4 9.1 5.3 6.3
GNI (GDP deflator) - - - - - - - - -
Contribution to GDP growth: - - - - - - -
- - - - - - -
- - - - - - -
- - - - - - -
Unemployment rate (a) 4.1 3.8 3.6 4.2 - - -
- - - - - - -
- - - - - - -
- - - - - - -
Saving rate of households - - - - - - -
3.7 3.5 1.3 0.6 3.7 2.8 2.6
Consumer price index (c) 2.4 2.1 2.9 2.5 - - -
- - - - - - -
Trade balance (goods) (b) 4.4 2.7 2.8 3.5 3.3 2.8 2.5
4.0 0.2 0.7 1.9 2.1 1.6 1.1
- - - - - - -
- - - - - - -
- - - - - - -
- - - - - - -
- - - - - - -
Structural budget balance
(a) urban unemployment, as % of labour force. (b) as a percentage of GDP. (c) national indicator.
Net lending(+) or borrowing(-) vis-à-vis ROW (b)
General government gross debt (b)
General government balance (b)
Cyclically-adjusted budget balance
Current-account balance (b)
Main features of country forecast - CHINA
2020 Annual percentage change
Inventories
Net exports
Compensation of employees/head
Unit labour costs whole economy
Real unit labour costs
Domestic demand
Employment
GDP deflator
Terms of trade goods (b)

37. EFTA
144
Switzerland
The Swiss economy weathered the COVID-19
crisis relatively well so far, with an output decline
of just 2.4% in 2020. The key drags on growth
were private consumption, dropping by 3.7% year-
on-year, lower equipment investment (-4.5%) and
lower exports (-6.0%). Nevertheless, exports
performed better than expected initially, partly
thanks to a solid performance of chemical and
pharmaceutical products. Unemployment rose, in
particular in tourism and construction. However,
thanks to short-time working schemes, the crisis’
overall impact on employment remained muted,
with an increase in the unemployment rate from
4.4% in 2019 to 4.8% in 2020. The government
adopted fiscal support measures amounting in total
to about 5¼% of GDP for 2020 and 2021, and
announced to spend more, if necessary.
The outlook is based on a supportive international
environment, although supply bottlenecks and a
resurgence of COVID-19 infections during the
winter season could push the rebound further back
into 2022. During the forecast period, the main
driver of growth is expected to be domestic
demand, in particular private consumption,
benefitting from pent-up demand, as well as
investment. Export growth is projected to recover
in 2021 from the COVID-19 trade shock and to
remain relatively strong in 2022 and 2023,
reflecting solid external demand. However, due to
strong import growth resulting from catching-up
consumption and investment, the growth
contribution of net exports is forecast to still
remain subdued in 2022 and 2023. Overall, output
is forecast to grow by nearly 3% in 2021 and to
slow down to 2½% and 2¼% in 2022 and 2023,
respectively.
In view of the muted labour market deterioration in
2020, reflecting governmental support measures,
also the post-pandemic pick-up of employment
will remain subdued, increasing by only about ¼%
in 2021 and slightly higher employment growth of
about 1% in 2022 and 2023. As a result of low
employment growth, the unemployment rate is
expected to increase to around 5% in 2021, but to
decline in the following years, benefitting from the
overall economic recovery. Consumer price
inflation is forecast to slightly accelerate during
2022 and 2023, reflecting higher international
price increases, in particular energy but also
commodities.
The fiscal costs of fighting the pandemic and its
economic implications will still be felt in the
coming years, impeding the country’s plans to
achieve fiscal surpluses still during the forecast
period. Nevertheless, thanks to low deficits and
solid economic growth, gross debt ratios as likely
to return to nearly pre-pandemic levels by 2023.
Country-specific risks to the outlook are largely on
both sides, related to key trading partners, such as
Germany, the USA and the United Kingdom,
where the recovery could be faster or slower than
expected. There is also a risk related to the Swiss
franc’s safe-haven status, which could lead to a
rapid appreciation, eroding the country’s price
competitiveness.
Norway
The acceleration of vaccinations, lower infection
rates and the gradual easing of COVID-19-related
restrictions prompted a sharp rise in economic
-5
-4
-3
-2
-1
0
1
2
3
4
5
6
14 15 16 17 18 19 20 21 22 23
Graph II.37.1: Switzerland - Real GDP growth and
contributions
Net exports Investment
Priv. consumption Gov. consumption
Inventories Real GDP (y-o-y%)
forecastpps.
All three EFTA countries are recovering from the COVID-19 crisis, which had hit their economies to
different extents, largely reflecting the relative importance of tourism and the size of the fiscal response.
The outlook is for a continued recovery during 2021-2023, benefitting from pent-up domestic and
external demand and fiscal support measures. The solid output growth will help to bring public finances
back towards more sustainable levels. However, significant uncertainties remain.
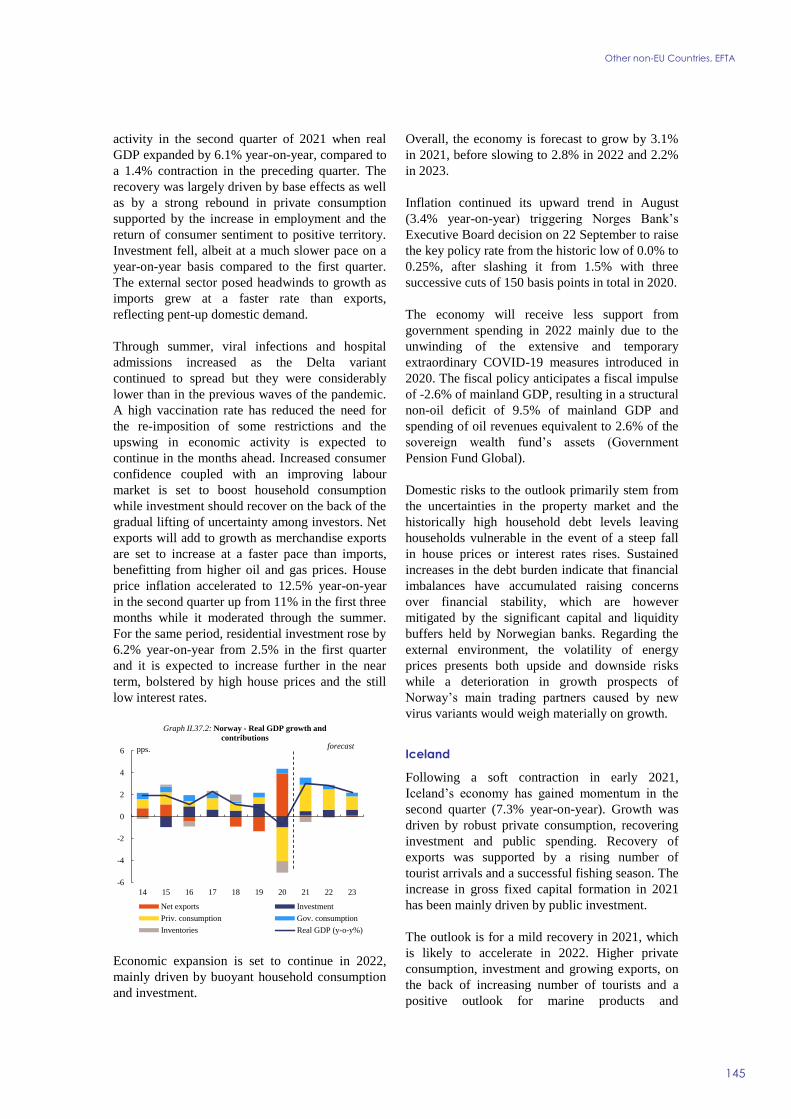
Other non-EU Countries, EFTA
145
activity in the second quarter of 2021 when real
GDP expanded by 6.1% year-on-year, compared to
a 1.4% contraction in the preceding quarter. The
recovery was largely driven by base effects as well
as by a strong rebound in private consumption
supported by the increase in employment and the
return of consumer sentiment to positive territory.
Investment fell, albeit at a much slower pace on a
year-on-year basis compared to the first quarter.
The external sector posed headwinds to growth as
imports grew at a faster rate than exports,
reflecting pent-up domestic demand.
Through summer, viral infections and hospital
admissions increased as the Delta variant
continued to spread but they were considerably
lower than in the previous waves of the pandemic.
A high vaccination rate has reduced the need for
the re-imposition of some restrictions and the
upswing in economic activity is expected to
continue in the months ahead. Increased consumer
confidence coupled with an improving labour
market is set to boost household consumption
while investment should recover on the back of the
gradual lifting of uncertainty among investors. Net
exports will add to growth as merchandise exports
are set to increase at a faster pace than imports,
benefitting from higher oil and gas prices. House
price inflation accelerated to 12.5% year-on-year
in the second quarter up from 11% in the first three
months while it moderated through the summer.
For the same period, residential investment rose by
6.2% year-on-year from 2.5% in the first quarter
and it is expected to increase further in the near
term, bolstered by high house prices and the still
low interest rates.
Economic expansion is set to continue in 2022,
mainly driven by buoyant household consumption
and investment.
Overall, the economy is forecast to grow by 3.1%
in 2021, before slowing to 2.8% in 2022 and 2.2%
in 2023.
Inflation continued its upward trend in August
(3.4% year-on-year) triggering Norges Bank’s
Executive Board decision on 22 September to raise
the key policy rate from the historic low of 0.0% to
0.25%, after slashing it from 1.5% with three
successive cuts of 150 basis points in total in 2020.
The economy will receive less support from
government spending in 2022 mainly due to the
unwinding of the extensive and temporary
extraordinary COVID-19 measures introduced in
2020. The fiscal policy anticipates a fiscal impulse
of -2.6% of mainland GDP, resulting in a structural
non-oil deficit of 9.5% of mainland GDP and
spending of oil revenues equivalent to 2.6% of the
sovereign wealth fund’s assets (Government
Pension Fund Global).
Domestic risks to the outlook primarily stem from
the uncertainties in the property market and the
historically high household debt levels leaving
households vulnerable in the event of a steep fall
in house prices or interest rates rises. Sustained
increases in the debt burden indicate that financial
imbalances have accumulated raising concerns
over financial stability, which are however
mitigated by the significant capital and liquidity
buffers held by Norwegian banks. Regarding the
external environment, the volatility of energy
prices presents both upside and downside risks
while a deterioration in growth prospects of
Norway’s main trading partners caused by new
virus variants would weigh materially on growth.
Iceland
Following a soft contraction in early 2021,
Iceland’s economy has gained momentum in the
second quarter (7.3% year-on-year). Growth was
driven by robust private consumption, recovering
investment and public spending. Recovery of
exports was supported by a rising number of
tourist arrivals and a successful fishing season. The
increase in gross fixed capital formation in 2021
has been mainly driven by public investment.
The outlook is for a mild recovery in 2021, which
is likely to accelerate in 2022. Higher private
consumption, investment and growing exports, on
the back of increasing number of tourists and a
positive outlook for marine products and
-6
-4
-2
0
2
4
6
14 15 16 17 18 19 20 21 22 23
Graph II.37.2: Norway - Real GDP growth and
contributions
Net exports Investment
Priv. consumption Gov. consumption
Inventories Real GDP (y-o-y%)
forecastpps.
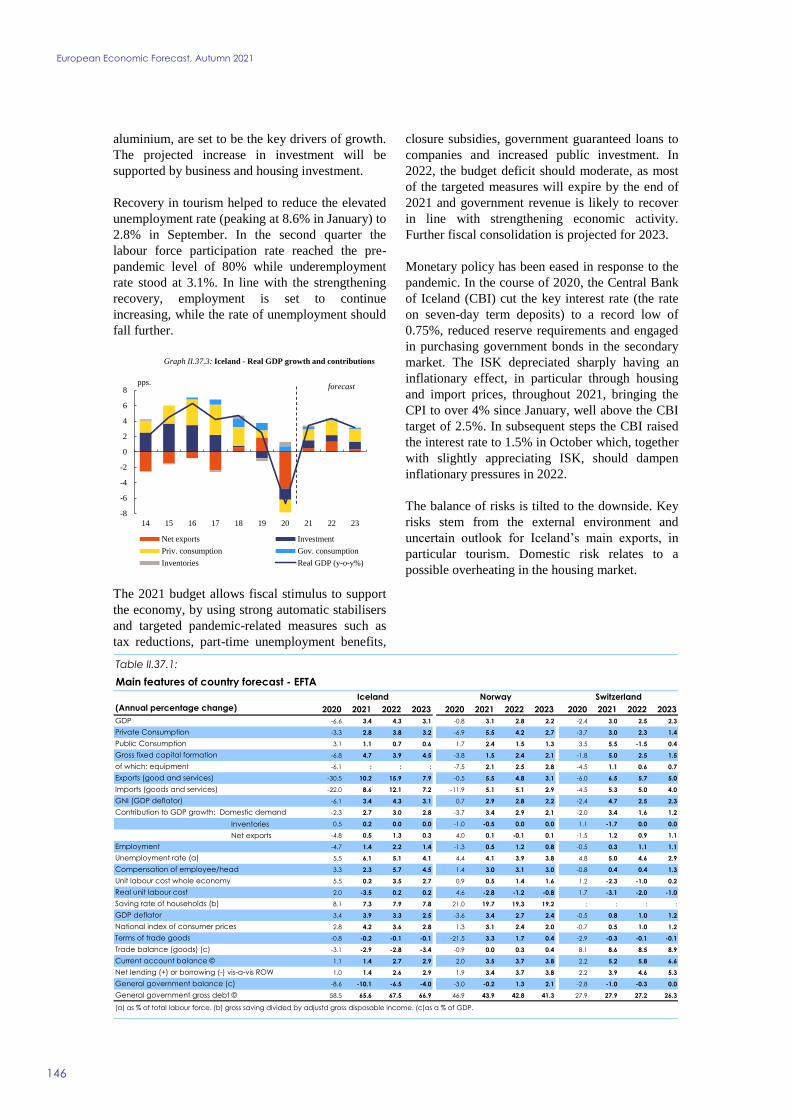
European Economic Forecast, Autumn 2021
146
aluminium, are set to be the key drivers of growth.
The projected increase in investment will be
supported by business and housing investment.
Recovery in tourism helped to reduce the elevated
unemployment rate (peaking at 8.6% in January) to
2.8% in September. In the second quarter the
labour force participation rate reached the pre-
pandemic level of 80% while underemployment
rate stood at 3.1%. In line with the strengthening
recovery, employment is set to continue
increasing, while the rate of unemployment should
fall further.
The 2021 budget allows fiscal stimulus to support
the economy, by using strong automatic stabilisers
and targeted pandemic-related measures such as
tax reductions, part-time unemployment benefits,
closure subsidies, government guaranteed loans to
companies and increased public investment. In
2022, the budget deficit should moderate, as most
of the targeted measures will expire by the end of
2021 and government revenue is likely to recover
in line with strengthening economic activity.
Further fiscal consolidation is projected for 2023.
Monetary policy has been eased in response to the
pandemic. In the course of 2020, the Central Bank
of Iceland (CBI) cut the key interest rate (the rate
on seven-day term deposits) to a record low of
0.75%, reduced reserve requirements and engaged
in purchasing government bonds in the secondary
market. The ISK depreciated sharply having an
inflationary effect, in particular through housing
and import prices, throughout 2021, bringing the
CPI to over 4% since January, well above the CBI
target of 2.5%. In subsequent steps the CBI raised
the interest rate to 1.5% in October which, together
with slightly appreciating ISK, should dampen
inflationary pressures in 2022.
The balance of risks is tilted to the downside. Key
risks stem from the external environment and
uncertain outlook for Iceland’s main exports, in
particular tourism. Domestic risk relates to a
possible overheating in the housing market.
-8
-6
-4
-2
0
2
4
6
8
14 15 16 17 18 19 20 21 22 23
Graph II.37.3: Iceland - Real GDP growth and contributions
Net exports Investment
Priv. consumption Gov. consumption
Inventories Real GDP (y-o-y%)
forecastpps.
Table II.37.1:
2020 2021 2022 2023 2020 2021 2022 2023 2020 2021 2022 2023
-6.6 3.4 4.3 3.1 -0.8 3.1 2.8 2.2 -2.4 3.0 2.5 2.3
-3.3 2.8 3.8 3.2 -6.9 5.5 4.2 2.7 -3.7 3.0 2.3 1.4
3.1 1.1 0.7 0.6 1.7 2.4 1.5 1.3 3.5 5.5 -1.5 0.4
-6.8 4.7 3.9 4.5 -3.8 1.5 2.4 2.1 -1.8 5.0 2.5 1.5
-6.1 : : : -7.5 2.1 2.5 2.8 -4.5 1.1 0.6 0.7
-30.5 10.2 15.9 7.9 -0.5 5.5 4.8 3.1 -6.0 6.5 5.7 5.0
-22.0 8.6 12.1 7.2 -11.9 5.1 5.1 2.9 -4.5 5.3 5.0 4.0
-6.1 3.4 4.3 3.1 0.7 2.9 2.8 2.2 -2.4 4.7 2.5 2.3
-2.3 2.7 3.0 2.8 -3.7 3.4 2.9 2.1 -2.0 3.4 1.6 1.2
Inventories 0.5 0.2 0.0 0.0 -1.0 -0.5 0.0 0.0 1.1 -1.7 0.0 0.0
Net exports -4.8 0.5 1.3 0.3 4.0 0.1 -0.1 0.1 -1.5 1.2 0.9 1.1
-4.7 1.4 2.2 1.4 -1.3 0.5 1.2 0.8 - -0.5 0.3 1.1 1.1
5.5 6.1 5.1 4.1 4.4 4.1 3.9 3.8 4.8 5.0 4.6 2.9
3.3 2.3 5.7 4.5 1.4 3.0 3.1 3.0 -0.8 0.4 0.4 1.3
5.5 0.2 3.5 2.7 0.9 0.5 1.4 1.6 1.2 -2.3 -1.0 0.2
2.0 -3.5 0.2 0.2 4.6 -2.8 -1.2 -0.8 1.7 -3.1 -2.0 -1.0
8.1 7.3 7.9 7.8 21.0 19.7 19.3 19.2 : : : :
3.4 3.9 3.3 2.5 -3.6 3.4 2.7 2.4 -0.5 0.8 1.0 1.2
2.8 4.2 3.6 2.8 1.3 3.1 2.4 2.0 -0.7 0.5 1.0 1.2
-0.8 -0.2 -0.1 -0.1 -21.5 3.3 1.7 0.4 -2.9 -0.3 -0.1 -0.1
-3.1 -2.9 -2.8 -3.4 -0.9 0.0 0.3 0.4 8.1 8.6 8.5 8.9
1.1 1.4 2.7 2.9 2.0 3.5 3.7 3.8 2.2 5.2 5.8 6.6
1.0 1.4 2.6 2.9 1.9 3.4 3.7 3.8 2.2 3.9 4.6 5.3
-8.6 -10.1 -6.5 -4.0 -3.0 -0.2 1.3 2.1 -2.8 -1.0 -0.3 0.0
58.5 65.6 67.5 66.9 46.9 43.9 42.8 41.3 27.9 27.9 27.2 26.3
Current account balance ©
Net lending (+) or borrowing (-) vis-a-vis ROW
General government balance (c)
General government gross debt ©
(a) as % of total labour force. (b) gross saving divided by adjustd gross disposable income. (c)as a % of GDP.
Trade balance (goods) (c)
GNI (GDP deflator)
Contribution to GDP growth: Domestic demand
Employment
Unemployment rate (a)
Compensation of employee/head
Unit labour cost whole economy
Real unit labour cost
Saving rate of households (b)
GDP deflator
National index of consumer prices
Terms of trade goods
Imports (goods and services)
Main features of country forecast - EFTA
Iceland Norway Switzerland
(Annual percentage change)
GDP
Private Consumption
Public Consumption
Gross fixed capital formation
of which: equipment
Exports (good and services)

38. RUSSIAN FEDERATION
147
Swift recovery from the crisis already in 2021
In 2021, in a mirror image of 2020, consumption is
set to recover strongly and imports are forecast to
bounce back. Public transfers, rising real wages
and spending out of savings accumulated in 2020
are expected to drive private consumption up,
which however is projected to remain below 2019
levels. Public consumption is likely to continue
growing as well, though rising oil and gas
revenues are not expected to lift public spending
this year as they are forecast to further increase
fiscal buffers. Imports are projected to grow
relatively strongly in 2021, as a slightly stronger
rouble and much better terms-of-trade raise their
affordability, but will likely remain significantly
below 2019 levels. Relatively strong non-oil
exports limited the export decline in 2020. They
will continue to grow in 2021, while the OPEC+
agreement still implies lower oil exports in 2021.
Investment is expected to bounce back only
moderately in 2021, reflecting long-standing
weaknesses in the business climate, some
reprioritisation of national infrastructure projects
resulting in further delays and some restraint
regarding new investment in fossil fuel projects
given the long-term muted price outlook.
The recovery is likely to lose steam going
forward
The purely compensatory element of the bounce-
back is likely to evaporate by late 2021. While
exports are set to benefit from the phasing out of
the OPEC+ production cut over 2022, imports of
goods are expected to grow more moderately as
purchasing power is likely to be negatively
affected by elevated inflation and investment is set
to grow only slowly. Services imports are forecast
to grow more strongly benefitting from less
COVID-19 related restrictions affecting outbound
tourism. As inflation is high and food price
inflation is approaching double-digit levels,
household purchasing power is expected to be
negatively affected, dampening the outlook for
consumption. Over the forecast horizon, household
income is projected to be hit by higher personal
income taxes. Higher income tax rates introduced
in late 2020 and strong nominal wage rises
conspire to increase the tax burden of households.
The outlook for capital expenditure remains
moderate as the business sentiment continues to be
negatively affected by the unfriendly investment
environment including property rights issues. It is
possible that public investments will rise
somewhat due to high commodity prices and rising
fiscal revenues. However, volatile commodity
prices, the uncertain long-term outlook for fossil
fuels and lack of access to credit among SMEs, in
particular in service sectors, hamper the outlook
for private investments.
For 2023, catch-up consumption and increased
public spending are expected to be less relevant as
a growth driver. Instead, the underlying lack of
dynamism and the limited growth potential are
expected to be again a more decisive factor
limiting growth.
Monetary policy has become more restrictive
Following a decline by a cumulative 500 basis
points to 4.25% in July 2020 amid contained
inflation, headline interest rates were raised by 325
basis points in incremental steps from March to
October 2021 as inflationary pressures intensified.
In September 2021, inflation hit 7.4% y-o-y and is
forecast to reach an average 6.2% in 2021, before
-10
-8
-6
-4
-2
0
2
4
6
8
14 15 16 17 18 19 20 21 22 23
Graph II.38.1: Russia - Real GDP growth and contributions
Net exports Investment
Priv. consumption Gov. consumption
Inventories Real GDP (y-o-y%)
forecastpps.
Despite a low vaccination rate and a high mortality from COVID-19 in the autumn of 2021, real GDP
in Russia has by now surpassed the pre-pandemic level. Going forward, growth is likely to benefit from
a decisive improvement of its terms-of-trade and rising fiscal revenues, which provide room for
additional transfers and spending, pushing consumption up.
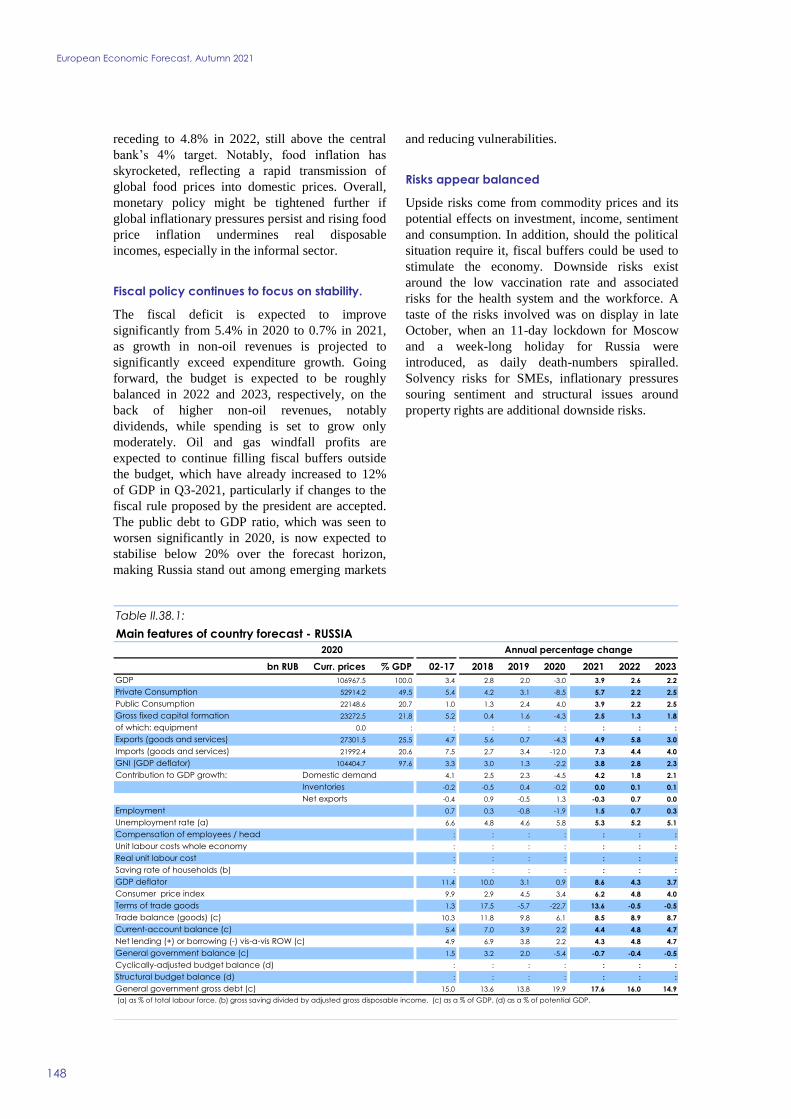
European Economic Forecast, Autumn 2021
148
receding to 4.8% in 2022, still above the central
bank’s 4% target. Notably, food inflation has
skyrocketed, reflecting a rapid transmission of
global food prices into domestic prices. Overall,
monetary policy might be tightened further if
global inflationary pressures persist and rising food
price inflation undermines real disposable
incomes, especially in the informal sector.
Fiscal policy continues to focus on stability.
The fiscal deficit is expected to improve
significantly from 5.4% in 2020 to 0.7% in 2021,
as growth in non-oil revenues is projected to
significantly exceed expenditure growth. Going
forward, the budget is expected to be roughly
balanced in 2022 and 2023, respectively, on the
back of higher non-oil revenues, notably
dividends, while spending is set to grow only
moderately. Oil and gas windfall profits are
expected to continue filling fiscal buffers outside
the budget, which have already increased to 12%
of GDP in Q3-2021, particularly if changes to the
fiscal rule proposed by the president are accepted.
The public debt to GDP ratio, which was seen to
worsen significantly in 2020, is now expected to
stabilise below 20% over the forecast horizon,
making Russia stand out among emerging markets
and reducing vulnerabilities.
Risks appear balanced
Upside risks come from commodity prices and its
potential effects on investment, income, sentiment
and consumption. In addition, should the political
situation require it, fiscal buffers could be used to
stimulate the economy. Downside risks exist
around the low vaccination rate and associated
risks for the health system and the workforce. A
taste of the risks involved was on display in late
October, when an 11-day lockdown for Moscow
and a week-long holiday for Russia were
introduced, as daily death-numbers spiralled.
Solvency risks for SMEs, inflationary pressures
souring sentiment and structural issues around
property rights are additional downside risks.
bn RUB Curr. prices % GDP 02-17 2018 2019 2020 2021 2022 2023
106967.5 100.0 3.4 2.8 2.0 -3.0 3.9 2.6 2.2
52914.2 49.5 5.4 4.2 3.1 -8.5 5.7 2.2 2.5
22148.6 20.7 1.0 1.3 2.4 4.0 3.9 2.2 2.5
23272.5 21.8 5.2 0.4 1.6 -4.3 2.5 1.3 1.8
0.0 : : : : : : : :
27301.5 25.5 4.7 5.6 0.7 -4.3 4.9 5.8 3.0
21992.4 20.6 7.5 2.7 3.4 -12.0 7.3 4.4 4.0
104404.7 97.6 3.3 3.0 1.3 -2.2 3.8 2.8 2.3
4.1 2.5 2.3 -4.5 4.2 1.8 2.1
-0.2 -0.5 0.4 -0.2 0.0 0.1 0.1
-0.4 0.9 -0.5 1.3 -0.3 0.7 0.0
0.7 0.3 -0.8 -1.9 1.5 0.7 0.3
6.6 4.8 4.6 5.8 5.3 5.2 5.1
: : : : : : :
: : : : : : :
: : : : : : :
: : : : : : :
11.4 10.0 3.1 0.9 8.6 4.3 3.7
9.9 2.9 4.5 3.4 6.2 4.8 4.0
1.3 17.5 -5.7 -22.7 13.6 -0.5 -0.5
10.3 11.8 9.8 6.1 8.5 8.9 8.7
5.4 7.0 3.9 2.2 4.4 4.8 4.7
4.9 6.9 3.8 2.2 4.3 4.8 4.7
1.5 3.2 2.0 -5.4 -0.7 -0.4 -0.5
: : : : : : :
: : : : : : :
15.0 13.6 13.8 19.9 17.6 16.0 14.9
GNI (GDP deflator)
Table II.38.1:
Main features of country forecast - RUSSIA
2020 Annual percentage change
GDP
Private Consumption
Public Consumption
Gross fixed capital formation
of which: equipment
Exports (goods and services)
Imports (goods and services)
Contribution to GDP growth: Domestic demand
Inventories
Net exports
Net lending (+) or borrowing (-) vis-a-vis ROW (c)
Employment
Unemployment rate (a)
Compensation of employees / head
Unit labour costs whole economy
Real unit labour cost
Saving rate of households (b)
GDP deflator
Consumer price index
Terms of trade goods
Trade balance (goods) (c)
Current-account balance (c)
General government balance (c)
Cyclically-adjusted budget balance (d)
Structural budget balance (d)
General government gross debt (c)
(a) as % of total labour force. (b) gross saving divided by adjusted gross disposable income. (c) as a % of GDP. (d) as a % of potential GDP.

ACKNOWLEDGEMENTS
149
This report was prepared in the Directorate-General for Economic and Financial Affairs under the
direction of Maarten Verwey – Director-General and Reinhard Felke – Director “Policy coordination,
economic forecasts and communication”. It has benefitted from the close collaboration with Directorate-
General for Financial Stability, Financial Services and Capital Markets Union.
Executive responsibilities were attached to Laura Bardone – Head of Unit “Economic situation, forecasts,
business and consumer surveys”, Kristian Orsini – Deputy Head of Unit “Economic situation, forecasts,
business and consumer surveys”, and the forecast coordinators – Reuben Borg and Alexandru Zeana.
The Executive Summary was prepared by Kristian Orsini. In the section on “Economic outlook for the
euro area and the EU”, Chapter 1 was prepared by Laura Bardone and Oliver Dieckmann. Chapter 2
“Economic outlook” was prepared under the responsibility of Laura Bardone and coordinated by João
Miguel Leal. This chapter benefited from contributions by Nicolas Bernier Abad, Piotr Bogumil, Reuben
Borg, Chris Bosma, Lucian Briciu, Alessandra Cepparulo, Guillaume Cousin, Oliver Dieckmann,
Christian Gayer, Jana Hoeffken, Susanne Hoffmann, Stefan Kramer, João Miguel Leal, Jakub Mazur,
Vito Ernesto Reitano, Adriana Reut, Milan Výškrabka, Rupert Willis, Przemysław Woźniak, Tomasz
Zdrodowski and Alexandru Zeana. Chapter 3 “Risks” was prepared by Przemysław Woźniak. In Chapter
4 “Special issues”, Special issue 1 “Supply-side bottlenecks” was prepared by Christos Axioglou, Piotr
Bogumił, Roberta Friz, Jan Hoeffken, Stefan Kramer, João Miguel Leal, Luis Pedauga (JRC), Jose-
Manuel Rueda Cantuche (JRC) and Przemysław Woźniak. Special issue 2 “Energy prices” was prepared
by Reuben Borg, Roberta Cardani, Lorenzo Frattarolo, João Miguel Leal, Beatrice Pataracchia, Philipp
Pfeiffer, Marco Ratto, Jan Teresinski, and Lukas Vogel. Special issue 3 “Labour market: slack or tight?”
was prepared by Áron Kiss, Maria Chiara Morandini, Anneleen Vandeplas and Milan Výškrabka. Special
issue 4 “Housing market” was prepared by Agnieszka Szczypinska, Borek Vasicek, Stefan Zeugner and
Alexandru Zeana. The Box I.2.1 “New survey-based measures of economic uncertainty” was prepared by
Christian Gayer, Fiona Morice and Andreas Reuter.
The sections on “Member States” were prepared under the supervision of Isabel Grilo, Massimo Suardi,
and Luc Tholoniat, Directors for the “Economies of the Member States”. These sections benefited from
contributions by Jakob Abou Zeid, Ronald Albers, Lucian Albulescu, Aurelija Anciūtė, Martin Åström,
Antonino Barbera Mazzola, Paolo Battaglia, Barbara Bernardi, David Berthier, Adrian Bodea, Joël
Boulanger, Tadej Breznik, Giuseppe Canzonieri, João Capella-Ramos, Francisco de Castro Fernández,
Lubomir Chaloupka, Alessandro Cisotta, Christos Daoulas, Milan Deskar-Škrbić, Angela Droussiotou,
Hugo Ferradáns Ramonde, Miriam Franzelin, Norbert Gaál, Carmine Gabriele, Daphne Gerard, Sotirios
Giannoulis, Oscar Gómez Lacalle, Karolina Gralek, András Hudecz, Zuzanna Iskierka, Dirk Kamps,
Szabolcs Klubuk, Willem Kooi, Daniel Kosicki, Radoslav Krastev, Milan Lisický, Ivan Lozev, Natalie
Lubenets, Ruslan Lukach, Andreea-Alexandra Maerean, Mart Maiväli, Janis Malzubris, Dorin Mantescu,
Robert Markiewicz, Fabrizio Melcarne, Gergő Motyovszki, Balázs Pálvölgyi, Mona Papadakou, Gábor
Márk Pellényi, Leonardo Pérez-Aranda Alonso, Arian Perić, Paulina Rogowska, Francesco Rossi-
Salvemini, Marie-Luise Rüd, Marie-Luise Schmitz, Sebastian Schmitz, Ana Seco Justo, Elisabetta Severi,
Michael Sket, Peeter Soidla, Matija Šušković, Gilles Thirion, Tsvetan Tsalinski, Daniel Vâlcu, Milda
Valentinaitė, Vasiliki Vasilopoulou, Michael Vedsø, Alberto Vidan Bermúdez, Ernestas Virbickas,
Martina von Terzi, Kai-Young Weißschädel, Bartłomiej Wiczewski, Rafał Wielądek, Christos Zavos,
Ingars Zustrups and Pieterjan van der Zwan.
The sections on “Candidate Countries” and “Other non-EU countries” were prepared under the
supervision of Annika Eriksgaard Melander, (acting) Director of the “International economic and
financial relations, global governance”. These sections, and forecasts for all other non-EU economies,
benefited from contributions by Juan José Almagro Herrador, Piotr Bogumił, Stefan Bohner, Bernhard
Böhm, Uwe Böwer, Maria Gerhardt, Nikolay Gertchev, Luigi Giamboni, Dalia Grigonytė, Marianne
Grima, Jana Hoeffken, Renata Hrůzová, Sarah Jurreit, Plamen Kaloyanchev, Stefan Kramer, Ivan Kušen,
European Economic Forecast, Autumn 2021
150
Mihai-Gheorghe Macovei, Maria Maierean, Alexandros Mouzakitis, Radostin Neykov, José Ramón
Perea, Jerzy Pieńkowski, Rafał Raciborski, Antonio Sánchez Pareja, Uwe Stamm, Barbara Stearns-
Bläsing, Vladimír Solanič, András Tari, Rupert Willis, Norbert Wunner and Marta Zakrzewska.
Support in editing the report by Clara Gonzalez Zunzarren, and for its communication and publication by
Nicolas Carpentiers, Manuel De La Red Carino, Robert Gangl, Olivier Glorieux, Tamas Nagy, Sarka
Novotna and Yasmina Quertinmont under the responsibility of Matthieu Hebert, is gratefully
acknowledged.
Follow-up calculations were performed by Francesca D’Auria, François Blondeau, Atanas Hristov,
Kieran Mc Morrow and Anna Thum-Thysen under the responsibility of Björn Döhring. Forecast
assumptions were prepared by Puck Boom, Paloma Cortés Payá and Vaclav Zdarek. Statistical support
for the production of the forecast was provided by Antonio Fuso, Daniel Grenouilleau, Susanne
Hoffmann, Ingo Kuhnert, David Zaitegui Perez and Tomasz Zdrodowski. Further statistical and layout
assistance was provided by Manfredi Danielis, Michel Gerday, Szabolcs Klubuk, Johann Korner, Anna
Chiara Küffel, Gianluca Papa, Jacek Szelożyński and Christos Zavos.
Valuable comments and suggestions by Laura Bardone, Gerrit Bethuyne, Reuben Borg, Stefan Ciobanu,
Angela D’Elia, Oliver Dieckmann, Björn Döhring, María José Doval Tedin, Patrick D’Souza, Christian
Gayer, Gabriele Giudice, Peter Grasmann, Joern Griesse, Valeska Gronert, Martin Hallet, Renata
Hruzova, João Miguel Leal, Zenon Kontolemis, Robert Kuenzel, Stefan Kuhnert, Paul Kutos, Júlia
Lendvai, Milan Lisicky, Maarten Masselink, Gilles Mourre, Moisés Orellana, Kristian Orsinin, Dino
Pinelli, Eric Ruscher, Matteo Salto, Dominique Simonis, Uwe Stamm, Michael Stierle, Andras Tari,
Michael Thiel, Alessandro Turrini, Anneleen Vandeplas, Valerie Vandermeulen, Charlotte Van
Hooydonk, Milan Výškrabka, Melanie Ward-Warmedinger, Florian Wöhlbier, Przemysław Woźniak,
Norbert Wunner, Javier Yaniz Igal, Vaclav Zdarek and Alexandru Zeana are gratefully acknowledged.
Secretarial support for the finalisation of this report was provided by Manuel Benítez Fernández and
Carlos Rodríguez del Río.
Comments on the report would be gratefully received and should be sent to:
Directorate-General for Economic and Financial Affairs
Unit A3: Economic situation, forecasts, business and consumer surveys
European Commission
B-1049 Brussels
E-mail: [email protected]

Statistical Annex European Economic Forecast – Autumn 2021
Contents
152
Output : GDP and its components
1. Gross domestic product 154
2. Profiles (q-o-q) of quarterly GDP 154
3. Profiles (y-o-y) of quarterly GDP 155
4. GDP per capita 155
5. Final domestic demand 156
6. Final demand 156
7. Private consumption expenditure 157
8. Government consumption expenditure 157
9. Total investment 158
10. Investment in construction 158
11. Investment in equipment 159
12. Public investment 159
13. Potential GDP 160
14. Output gap relative to potential GDP 160
Prices
15. Deflator of GDP 161
16. Deflator of private consumption 161
17. Harmonised consumer prices index 162
18. Harmonised consumer prices quarterly profiles 162
19. Deflator of exports of goods 163
20. Deflator of imports of goods 163
21. Terms of trade of goods 164
Wages, population and labour market
22. Total population 164
23. Total employment in persons 165
24. Total employment in full-time equivalents (ES, FR, IT, NL, EA and EU)165
25. Unemployment rate 166
26. Compensation of employees per head 166
27. Real compensation of employees per head 167
28. Labour productivity 167
29. Unit labour costs, whole economy 168
30. Real unit labour costs 168
Exchange rates
31. Nominal bilateral exchange rates 169
32. Nominal effective exchange rates 169
General Government
33. Total expenditure 170

Statistical Annex
153
34. Total revenue 170
35. Net lending (+) or net borrowing (-) 171
36. Interest expenditure 171
37. Primary balance 172
38. Cyclically-adjusted net lending (+) or net borrowing (-) 172
39. Cyclically-adjusted primary balance 173
40. Structural budget balance 173
41. Gross debt 174
Saving
42. Gross national saving 174
43. Gross saving of the private sector 175
44. Saving rate of households 175
45. Gross saving of general government 176
Trade and international payments
46. Exports of goods and services 176
47. Imports of goods and services 177
48. Merchandise trade balance (% of GDP) 177
49. Current-account balance (% of GDP) 178
50. Net lending (+) or net borrowing (-) 178
51. Current-account balance (bn EUR) 179
52. Export markets (goods and services) 179
53. Export performance (goods and services) 180
World economy
54. World GDP 181
55. World exports of goods and services 182
56. Export shares (goods) in EU trade 182
57. World imports of goods and services 183
58. Import shares (goods) in EU trade 183
59. World merchandise trade balances (bn USD) 184
60. World current-account balances (bn USD) 185
61. Crude oil prices 185

European Economic Forecast, Autumn 2021
154
Table 1: 25.10.2021
5-year
2003 - 07 2008 - 12 2013 - 17 2018 2019 2020 2021 2022 2023 2020 2021 2022
2.6 0.7 1.4 1.8 2.1 -5.7 6.0 2.6 1.9 -6.3 4.5 3.7
1.6 0.7 1.8 1.1 1.1 -4.6 2.7 4.6 1.7 -4.9 3.4 4.1
8.2 -1.7 3.0 4.1 4.1 -3.0 9.0 3.7 3.5 -2.9 2.8 5.0
5.2 -1.4 8.9 9.0 4.9 5.9 14.6 5.1 4.1 3.4 4.6 5.0
4.1 -5.5 -0.3 1.7 1.8 -9.0 7.1 5.2 3.6 -8.2 4.1 6.0
3.5 -1.3 1.9 2.3 2.1 -10.8 4.6 5.5 4.4 -10.8 5.9 6.8
2.0 0.4 1.2 1.9 1.8 -7.9 6.5 3.8 2.3 -8.1 5.7 4.2
1.1 -1.4 0.4 0.9 0.4 -8.9 6.2 4.3 2.3 -8.9 4.2 4.4
4.5 0.1 1.3 5.7 5.3 -5.2 5.4 4.2 3.5 -5.1 3.1 3.8
9.9 -2.7 2.7 4.0 2.5 -3.6 4.7 5.0 4.0 -3.6 3.5 6.0
Lithuania 8.7 -0.4 3.2 4.0 4.6 -0.1 5.0 3.6 3.4 -0.9 2.9 3.9
4.7 0.6 2.9 2.0 3.3 -1.8 5.8 3.7 2.7 -1.3 4.5 3.3
3.0 2.5 7.5 6.1 5.7 -8.3 5.0 6.2 4.8 -7.0 4.6 6.1
2.3 0.0 1.7 2.4 2.0 -3.8 4.0 3.3 1.6 -3.7 2.3 3.6
2.6 0.6 1.2 2.5 1.5 -6.7 4.4 4.9 1.9 -6.6 3.4 4.3
1.1 -1.4 1.4 2.8 2.7 -8.4 4.5 5.3 2.4 -7.6 3.9 5.1
4.8 -1.0 2.4 4.4 3.3 -4.2 6.4 4.2 3.5 -5.5 4.9 5.1
7.3 2.0 2.7 3.8 2.6 -4.4 3.8 5.3 4.3 -4.8 4.8 5.2
3.6 -0.7 1.0 1.1 1.3 -2.9 3.4 2.8 2.0 -2.8 2.7 2.8
2.2 -0.3 1.5 1.8 1.6 -6.4 5.0 4.3 2.4 -6.6 4.3 4.4
6.4 1.4 1.9 2.7 4.0 -4.4 3.8 4.1 3.5 -4.2 3.5 4.7
5.5 0.2 3.0 3.2 3.0 -5.8 3.0 4.4 3.2 -5.6 3.4 4.4
2.0 -0.4 2.2 2.0 2.1 -2.1 4.3 2.7 2.4 -2.7 2.9 3.5
4.8 -1.8 1.7 2.9 3.5 -8.1 8.1 5.6 3.4 -8.0 5.0 6.1
3.5 -0.8 3.2 5.4 4.6 -4.7 7.4 5.4 3.2 -5.0 5.0 5.5
5.0 3.4 3.3 5.4 4.7 -2.5 4.9 5.2 4.4 -2.7 4.0 5.4
6.5 0.6 4.5 4.5 4.2 -3.9 7.0 5.1 5.2 -3.9 5.1 4.9
3.5 0.7 2.6 2.0 2.0 -2.8 3.9 3.5 1.7 -2.8 4.4 3.3
2.4 -0.1 1.7 2.1 1.8 -5.9 5.0 4.3 2.5 -6.1 4.2 4.4
2.6 0.1 2.4 1.7 1.7 -9.7 6.9 4.8 1.7 -9.8 5.0 5.3
1.7 -0.3 1.3 0.6 0.3 -4.8 2.4 2.3 1.1 -4.8 3.1 2.5
3.0 0.8 2.2 2.9 2.3 -3.4 5.8 4.5 2.4 -3.5 6.3 3.8
Gross domestic product, volume (percentage change on preceding year, 2003-2023)
Autumn 2021 Spring 2021
averages forecast forecast
Malta
Belgium
Germany
Estonia
Ireland
Greece
Spain
France
Italy
Cyprus
Latvia
Luxembourg
Hungary
Netherlands
Austria
Portugal
Slovenia
Slovakia
Finland
Euro area
Bulgaria
Czechia
Denmark
Croatia
United States
Poland
Romania
Sweden
EU
United Kingdom
Japan
Incorrect slice name
Table 2: 25.10.2021
2021/1 2021/2 2021/3 2021/4 2022/1 2022/2 2022/3 2022/4 2023/1 2023/2 2023/3 2023/4
1.2 1.7 1.8 0.3 0.3 0.5 0.5 0.5 0.5 0.4 0.5 0.4
-2.0 1.6 1.9 1.3 1.0 1.0 0.9 0.5 0.2 0.2 0.2 0.2
3.9 4.3 0.9 0.3 0.8 0.8 0.8 0.8 0.9 0.9 0.9 0.9
8.7 6.3 : : : : : : : : : :
4.5 3.4 : : : : : : : : : :
-0.6 1.1 2.5 1.3 1.1 1.2 1.3 1.3 1.1 0.9 0.9 0.8
0.0 1.1 2.8 0.6 0.5 0.5 0.8 0.7 0.5 0.5 0.4 0.3
0.2 2.7 2.4 0.6 0.7 0.8 0.8 0.7 0.5 0.5 0.5 0.5
1.6 1.7 : : : : : : : : : :
0.5 2.6 1.0 -0.5 0.6 2.7 2.4 1.0 0.6 0.6 0.6 0.6
Lithuania 2.1 2.0 0.7 0.9 0.6 0.7 0.7 0.7 0.9 1.0 1.0 1.0
3.2 -0.5 0.8 0.6 0.9 1.0 1.0 0.9 0.5 0.5 0.5 0.5
1.9 -0.5 : : : : : : : : : :
-0.8 3.8 0.8 0.6 0.6 0.6 0.6 0.5 0.3 0.3 0.2 0.2
-0.5 4.0 2.6 0.6 0.5 1.5 0.7 0.4 0.4 0.4 0.3 0.3
-3.3 4.5 2.7 1.1 0.9 0.8 0.7 0.6 0.6 0.5 0.5 0.5
1.5 1.9 0.6 0.2 1.3 1.3 1.2 1.2 0.7 0.6 0.6 0.5
-1.4 2.0 1.5 0.7 1.2 1.7 1.3 1.2 0.9 0.9 0.9 0.8
0.1 2.2 1.0 0.4 0.6 0.6 0.5 0.5 0.5 0.5 0.5 0.4
-0.3 2.1 2.3 0.8 0.8 0.9 0.9 0.7 0.5 0.5 0.5 0.4
-0.1 -0.3 4.3 -0.2 0.7 1.2 1.2 1.2 0.6 0.6 0.6 0.7
-0.4 1.0 1.9 0.9 1.2 1.0 0.9 0.9 0.8 0.7 0.6 0.6
-0.4 2.8 0.6 0.2 0.7 0.7 0.6 0.6 0.6 0.6 0.5 0.5
5.4 -0.2 1.5 2.1 1.1 1.2 1.3 1.4 0.9 0.3 0.3 0.3
1.6 2.9 1.3 1.3 1.6 1.0 0.9 0.9 0.6 0.7 0.8 0.9
1.4 1.6 1.8 1.0 1.1 1.5 1.3 1.2 1.1 1.0 0.9 0.9
2.6 1.9 0.5 0.1 2.0 1.7 0.4 2.4 0.5 1.7 0.4 2.4
0.8 0.9 1.2 1.0 0.9 0.8 0.6 0.6 0.3 0.3 0.3 0.3
-0.1 2.0 2.1 0.8 0.8 0.9 0.9 0.7 0.5 0.5 0.5 0.5
-1.4 5.5 1.4 1.0 0.8 0.8 0.9 0.9 0.3 0.2 0.1 0.1
-1.1 0.5 0.4 1.2 0.6 0.4 0.4 0.3 0.3 0.3 0.2 0.2
1.5 1.6 1.1 1.2 1.1 1.1 0.7 0.7 0.5 0.5 0.5 0.5
Luxembourg
Profiles (qoq) of quarterly GDP, volume (percentage change from previous quarter, 2021-23)
Belgium
Germany
Estonia
Ireland
Greece
Spain
France
Italy
Cyprus
Latvia
Croatia
Malta
Netherlands
Austria
Portugal
Slovenia
Slovakia
Finland
Euro area
Bulgaria
Denmark
Czechia
Japan
United StatesNote: See note 10 for aggregation details for the EU and EA aggregates.
Hungary
Poland
Romania
Sweden
EU
United Kingdom
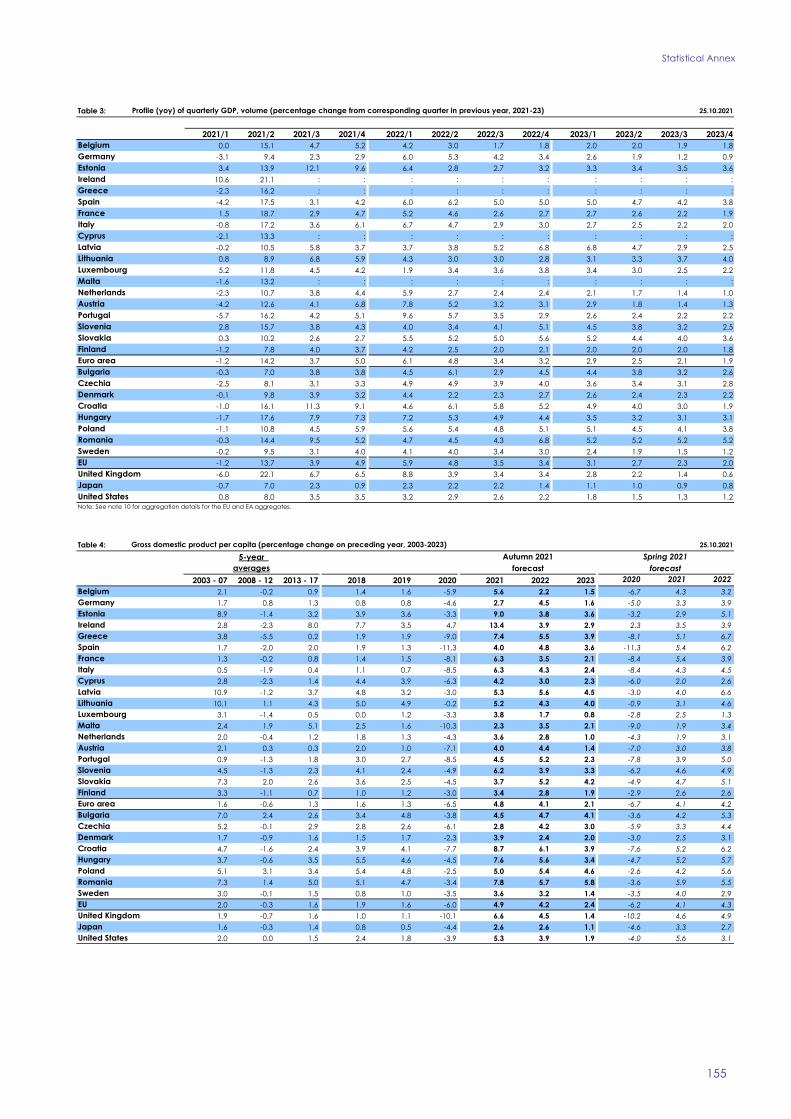
Statistical Annex
155
Incorrect slice name
Table 3: 25.10.2021
2021/1 2021/2 2021/3 2021/4 2022/1 2022/2 2022/3 2022/4 2023/1 2023/2 2023/3 2023/4
0.0 15.1 4.7 5.2 4.2 3.0 1.7 1.8 2.0 2.0 1.9 1.8
-3.1 9.4 2.3 2.9 6.0 5.3 4.2 3.4 2.6 1.9 1.2 0.9
3.4 13.9 12.1 9.6 6.4 2.8 2.7 3.2 3.3 3.4 3.5 3.6
10.6 21.1 : : : : : : : : : :
-2.3 16.2 : : : : : : : : : :
-4.2 17.5 3.1 4.2 6.0 6.2 5.0 5.0 5.0 4.7 4.2 3.8
1.5 18.7 2.9 4.7 5.2 4.6 2.6 2.7 2.7 2.6 2.2 1.9
-0.8 17.2 3.6 6.1 6.7 4.7 2.9 3.0 2.7 2.5 2.2 2.0
-2.1 13.3 : : : : : : : : : :
-0.2 10.5 5.8 3.7 3.7 3.8 5.2 6.8 6.8 4.7 2.9 2.5
Lithuania 0.8 8.9 6.8 5.9 4.3 3.0 3.0 2.8 3.1 3.3 3.7 4.0
5.2 11.8 4.5 4.2 1.9 3.4 3.6 3.8 3.4 3.0 2.5 2.2
-1.6 13.2 : : : : : : : : : :
-2.3 10.7 3.8 4.4 5.9 2.7 2.4 2.4 2.1 1.7 1.4 1.0
-4.2 12.6 4.1 6.8 7.8 5.2 3.2 3.1 2.9 1.8 1.4 1.3
-5.7 16.2 4.2 5.1 9.6 5.7 3.5 2.9 2.6 2.4 2.2 2.2
2.8 15.7 3.8 4.3 4.0 3.4 4.1 5.1 4.5 3.8 3.2 2.5
0.3 10.2 2.6 2.7 5.5 5.2 5.0 5.6 5.2 4.4 4.0 3.6
-1.2 7.8 4.0 3.7 4.2 2.5 2.0 2.1 2.0 2.0 2.0 1.8
-1.2 14.2 3.7 5.0 6.1 4.8 3.4 3.2 2.9 2.5 2.1 1.9
-0.3 7.0 3.8 3.8 4.5 6.1 2.9 4.5 4.4 3.8 3.2 2.6
-2.5 8.1 3.1 3.3 4.9 4.9 3.9 4.0 3.6 3.4 3.1 2.8
-0.1 9.8 3.9 3.2 4.4 2.2 2.3 2.7 2.6 2.4 2.3 2.2
-1.0 16.1 11.3 9.1 4.6 6.1 5.8 5.2 4.9 4.0 3.0 1.9
-1.7 17.6 7.9 7.3 7.2 5.3 4.9 4.4 3.5 3.2 3.1 3.1
-1.1 10.8 4.5 5.9 5.6 5.4 4.8 5.1 5.1 4.5 4.1 3.8
-0.3 14.4 9.5 5.2 4.7 4.5 4.3 6.8 5.2 5.2 5.2 5.2
-0.2 9.5 3.1 4.0 4.1 4.0 3.4 3.0 2.4 1.9 1.5 1.2
-1.2 13.7 3.9 4.9 5.9 4.8 3.5 3.4 3.1 2.7 2.3 2.0
-6.0 22.1 6.7 6.5 8.8 3.9 3.4 3.4 2.8 2.2 1.4 0.6
-0.7 7.0 2.3 0.9 2.3 2.2 2.2 1.4 1.1 1.0 0.9 0.8
0.8 8.0 3.5 3.5 3.2 2.9 2.6 2.2 1.8 1.5 1.3 1.2
Luxembourg
Profile (yoy) of quarterly GDP, volume (percentage change from corresponding quarter in previous year, 2021-23)
Belgium
Germany
Estonia
Ireland
Greece
Spain
France
Italy
Cyprus
Latvia
Croatia
Malta
Netherlands
Austria
Portugal
Slovenia
Slovakia
Finland
Euro area
Bulgaria
Denmark
Czechia
Japan
United StatesNote: See note 10 for aggregation details for the EU and EA aggregates.
Hungary
Poland
Romania
Sweden
EU
United Kingdom
Table 4: 25.10.2021
5-year
2003 - 07 2008 - 12 2013 - 17 2018 2019 2020 2021 2022 2023 2020 2021 2022
2.1 -0.2 0.9 1.4 1.6 -5.9 5.6 2.2 1.5 -6.7 4.3 3.2
1.7 0.8 1.3 0.8 0.8 -4.6 2.7 4.5 1.6 -5.0 3.3 3.9
8.9 -1.4 3.2 3.9 3.6 -3.3 9.0 3.8 3.6 -3.2 2.9 5.1
2.8 -2.3 8.0 7.7 3.5 4.7 13.4 3.9 2.9 2.3 3.5 3.9
3.8 -5.5 0.2 1.9 1.9 -9.0 7.4 5.5 3.9 -8.1 5.1 6.7
1.7 -2.0 2.0 1.9 1.3 -11.3 4.0 4.8 3.6 -11.3 5.4 6.2
1.3 -0.2 0.8 1.4 1.5 -8.1 6.3 3.5 2.1 -8.4 5.4 3.9
0.5 -1.9 0.4 1.1 0.7 -8.5 6.3 4.3 2.4 -8.4 4.3 4.5
2.8 -2.3 1.4 4.4 3.9 -6.3 4.2 3.0 2.3 -6.0 2.0 2.6
10.9 -1.2 3.7 4.8 3.2 -3.0 5.3 5.6 4.5 -3.0 4.0 6.6
Lithuania 10.1 1.1 4.3 5.0 4.9 -0.2 5.2 4.3 4.0 -0.9 3.1 4.6
3.1 -1.4 0.5 0.0 1.2 -3.3 3.8 1.7 0.8 -2.8 2.5 1.3
2.4 1.9 5.1 2.5 1.6 -10.3 2.3 3.5 2.1 -9.0 1.9 3.4
2.0 -0.4 1.2 1.8 1.3 -4.3 3.6 2.8 1.0 -4.3 1.9 3.1
2.1 0.3 0.3 2.0 1.0 -7.1 4.0 4.4 1.4 -7.0 3.0 3.8
0.9 -1.3 1.8 3.0 2.7 -8.5 4.5 5.2 2.3 -7.8 3.9 5.0
4.5 -1.3 2.3 4.1 2.4 -4.9 6.2 3.9 3.3 -6.2 4.6 4.9
7.3 2.0 2.6 3.6 2.5 -4.5 3.7 5.2 4.2 -4.9 4.7 5.1
3.3 -1.1 0.7 1.0 1.2 -3.0 3.4 2.8 1.9 -2.9 2.6 2.6
1.6 -0.6 1.3 1.6 1.3 -6.5 4.8 4.1 2.1 -6.7 4.1 4.2
7.0 2.4 2.6 3.4 4.8 -3.8 4.5 4.7 4.1 -3.6 4.2 5.3
5.2 -0.1 2.9 2.8 2.6 -6.1 2.8 4.2 3.0 -5.9 3.3 4.4
1.7 -0.9 1.6 1.5 1.7 -2.3 3.9 2.4 2.0 -3.0 2.5 3.1
4.7 -1.6 2.4 3.9 4.1 -7.7 8.7 6.1 3.9 -7.6 5.2 6.2
3.7 -0.6 3.5 5.5 4.6 -4.5 7.6 5.6 3.4 -4.7 5.2 5.7
5.1 3.1 3.4 5.4 4.8 -2.5 5.0 5.4 4.6 -2.6 4.2 5.6
7.3 1.4 5.0 5.1 4.7 -3.4 7.8 5.7 5.8 -3.6 5.9 5.5
3.0 -0.1 1.5 0.8 1.0 -3.5 3.6 3.2 1.4 -3.5 4.0 2.9
2.0 -0.3 1.6 1.9 1.6 -6.0 4.9 4.2 2.4 -6.2 4.1 4.3
1.9 -0.7 1.6 1.0 1.1 -10.1 6.6 4.5 1.4 -10.2 4.6 4.9
1.6 -0.3 1.4 0.8 0.5 -4.4 2.6 2.6 1.1 -4.6 3.3 2.7
2.0 0.0 1.5 2.4 1.8 -3.9 5.3 3.9 1.9 -4.0 5.6 3.1
Gross domestic product per capita (percentage change on preceding year, 2003-2023)
Autumn 2021 Spring 2021
averages forecast forecast
Malta
Belgium
Germany
Estonia
Ireland
Greece
Spain
France
Italy
Cyprus
Latvia
Luxembourg
Hungary
Netherlands
Austria
Portugal
Slovenia
Slovakia
Finland
Euro area
Bulgaria
Czechia
Denmark
Croatia
United States
Poland
Romania
Sweden
EU
United Kingdom
Japan

European Economic Forecast, Autumn 2021
156
Table 5: 25.10.2021
5-year
2003 - 07 2008 - 12 2013 - 17 2018 2019 2020 2021 2022 2023 2020 2021 2022
2.6 1.1 1.5 2.5 1.9 -6.1 5.6 3.3 2.2 -6.0 4.7 4.0
0.9 0.6 2.0 1.7 1.8 -4.0 2.7 4.5 1.7 -4.2 2.0 5.1
10.5 -3.1 3.2 4.5 2.7 3.3 8.8 2.0 3.0 2.4 -1.0 5.1
6.0 -2.8 8.5 -2.8 43.5 -14.8 -13.1 4.3 3.4 -17.9 4.9 6.4
4.6 -7.0 -0.4 1.4 1.1 -3.5 4.7 2.5 2.0 -2.4 3.4 3.4
4.5 -3.1 1.7 3.0 1.7 -8.9 4.4 5.1 4.2 -9.1 6.2 6.3
2.4 0.3 1.5 1.4 2.1 -6.7 6.5 3.5 1.7 -6.6 5.1 3.4
1.1 -2.0 0.4 1.3 -0.3 -8.4 6.2 4.5 2.5 -8.4 4.3 4.6
5.9 -0.6 1.5 3.5 5.9 -3.3 4.4 2.5 2.1 0.7 2.2 2.0
12.7 -5.2 2.2 5.2 3.0 -3.8 4.2 5.4 4.2 -3.9 5.7 5.9
Lithuania 10.9 -3.3 3.5 3.4 1.6 -3.8 6.6 4.4 4.0 -5.0 3.6 4.6
2.8 2.6 2.7 0.4 4.7 -2.3 5.3 5.0 3.0 -4.3 5.5 4.5
4.4 1.0 5.3 8.4 7.3 -3.3 6.0 5.2 4.5 -1.3 5.8 4.8
2.1 -0.8 1.5 2.4 3.0 -4.3 3.2 3.9 1.7 -3.7 1.9 4.0
2.3 0.6 1.3 2.4 0.6 -5.8 5.0 4.3 2.0 -6.3 3.6 3.8
1.1 -2.7 1.6 3.2 3.1 -5.6 4.6 4.0 2.4 -4.6 3.8 4.0
5.0 -2.5 1.6 5.0 3.3 -4.6 8.6 4.9 3.8 -6.5 4.5 5.5
5.4 -0.1 3.0 3.5 3.9 -5.2 3.4 6.1 4.7 -5.5 3.6 5.5
3.6 0.2 1.1 2.7 -0.4 -2.7 3.1 2.8 1.8 -2.7 3.0 2.3
2.2 -0.8 1.6 1.8 2.4 -6.2 4.2 4.2 2.2 -6.3 3.8 4.5
9.7 -0.8 1.1 5.4 4.8 0.1 2.7 2.7 3.2 -1.0 2.9 3.3
4.4 -0.7 2.8 4.8 3.2 -5.7 6.0 4.4 2.7 -5.7 3.0 4.6
3.1 -0.8 2.2 2.8 0.8 0.0 4.2 2.5 2.3 -0.7 2.9 3.1
5.3 -2.9 1.5 4.8 3.4 -2.8 5.8 4.4 4.3 -2.3 3.4 4.4
2.7 -2.5 3.3 7.1 6.8 -2.7 4.8 6.0 2.9 -3.0 4.0 5.0
5.5 2.5 3.0 5.6 3.6 -3.4 6.1 5.8 4.4 -3.7 3.9 5.6
11.2 -0.8 4.4 5.9 5.6 -2.2 7.4 4.9 5.3 -2.1 5.9 5.6
3.2 0.9 3.1 1.7 0.2 -3.2 4.2 3.2 1.5 -3.0 3.9 2.9
2.5 -0.6 1.8 2.1 2.5 -5.7 4.3 4.2 2.4 -5.8 3.8 4.5
2.7 0.0 2.8 1.2 1.6 -10.3 7.2 5.2 2.1 -10.5 7.2 5.3
1.0 -0.1 1.0 0.5 0.5 -3.8 1.8 2.3 1.0 -3.8 2.4 2.6
3.0 0.4 2.3 3.1 2.4 -3.1 6.9 4.7 2.4 -3.3 6.8 4.0
Domestic demand, volume (percentage change on preceding year, 2003-2023)
Autumn 2021 Spring 2021
averages forecast forecast
Malta
Belgium
Germany
Estonia
Ireland
Greece
Spain
France
Italy
Cyprus
Latvia
Luxembourg
Hungary
Netherlands
Austria
Portugal
Slovenia
Slovakia
Finland
Euro area
Bulgaria
Czechia
Denmark
Croatia
United States
Poland
Romania
Sweden
EU
United Kingdom
Japan
Table 6: 25.10.2021
5-year
2003 - 07 2008 - 12 2013 - 17 2018 2019 2020 2021 2022 2023 2020 2021 2022
3.6 0.9 2.7 1.6 1.9 -5.8 7.5 3.5 2.5 -5.4 5.2 4.0
2.9 1.1 2.5 1.9 1.6 -5.7 4.3 5.6 2.9 -5.9 4.7 5.0
11.7 0.4 3.0 4.2 4.4 -0.3 9.8 4.3 3.7 -1.0 1.7 5.3
5.5 -0.5 11.4 5.9 22.5 -0.9 4.6 5.4 4.5 -3.6 6.2 5.4
5.0 -6.1 0.8 3.4 2.2 -8.6 7.4 5.7 4.1 -7.8 4.7 6.2
4.5 -2.2 2.5 2.7 1.9 -11.9 6.3 6.4 5.0 -12.0 7.2 7.9
2.6 0.5 1.9 2.2 2.0 -8.8 6.9 4.6 3.0 -8.9 6.1 4.8
1.8 -1.7 1.0 1.5 0.2 -9.8 7.8 5.2 3.2 -9.7 5.7 5.4
4.5 0.0 3.5 5.1 6.6 -4.1 5.2 4.6 4.1 -4.7 3.4 4.2
12.6 -2.4 2.9 4.9 2.7 -3.2 5.1 5.2 4.1 -3.5 6.0 6.0
Lithuania 10.8 0.5 4.2 4.8 5.2 -1.9 9.0 4.8 4.2 -2.7 4.9 5.2
5.7 1.9 4.1 2.8 5.5 0.4 9.1 4.2 3.0 0.9 3.5 2.4
5.2 4.7 6.0 2.9 6.3 -5.2 5.5 5.9 4.3 -5.4 5.4 5.4
3.6 0.4 2.9 3.4 2.5 -4.5 4.9 4.6 2.3 -4.0 4.0 4.6
3.6 0.8 1.8 3.4 1.6 -7.6 6.2 6.0 3.2 -7.8 5.0 5.1
2.0 -1.7 2.9 3.5 3.4 -9.6 6.3 5.6 2.9 -8.9 5.5 5.3
7.2 -1.3 3.6 5.6 3.9 -6.5 10.1 6.2 4.9 -7.6 6.9 6.4
10.4 1.8 4.0 4.3 2.4 -6.2 7.3 6.3 5.3 -6.5 7.6 5.4
4.5 -0.3 1.4 2.4 1.6 -3.9 4.4 3.9 2.7 -3.8 3.6 3.6
3.2 -0.2 2.5 2.4 2.5 -7.2 6.0 5.2 3.2 -7.3 5.4 5.2
10.6 0.4 3.2 3.9 4.5 -4.8 5.3 4.8 4.1 -5.1 4.4 5.2
8.5 1.3 3.9 4.3 2.4 -6.2 7.1 4.5 4.1 -5.8 5.4 5.3
3.6 -0.1 2.6 3.0 2.4 -2.7 5.6 4.1 3.1 -3.4 3.8 4.2
5.5 -2.6 3.1 4.4 4.5 -9.5 10.4 7.7 5.8 -10.0 7.0 6.8
7.3 -0.4 4.7 6.1 6.2 -4.1 7.5 7.6 5.6 -4.7 6.8 6.8
6.8 3.2 4.6 6.1 4.2 -2.1 8.2 6.2 5.1 -2.4 5.7 6.1
11.5 0.8 6.4 5.8 5.5 -4.3 8.0 5.5 5.5 -4.3 6.9 6.5
4.4 0.8 3.1 2.5 2.0 -3.7 4.9 3.7 2.2 -3.7 5.1 3.4
3.5 0.0 2.7 2.7 2.7 -6.6 6.1 5.2 3.4 -6.8 5.4 5.2
3.1 0.2 2.7 2.0 2.0 -11.3 5.7 5.6 1.9 -11.7 5.9 5.4
2.0 -0.2 1.5 1.0 0.2 -5.1 3.3 2.8 1.3 -5.1 3.6 2.8
3.4 0.8 2.3 3.1 2.1 -4.2 6.8 5.0 2.6 -4.3 7.0 4.4
Final demand, volume (percentage change on preceding year, 2003-2023)
Autumn 2021 Spring 2021
averages forecast forecast
Malta
Belgium
Germany
Estonia
Ireland
Greece
Spain
France
Italy
Cyprus
Latvia
Luxembourg
Hungary
Netherlands
Austria
Portugal
Slovenia
Slovakia
Finland
Euro area
Bulgaria
Czechia
Denmark
Croatia
United States
Poland
Romania
Sweden
EU
United Kingdom
Japan
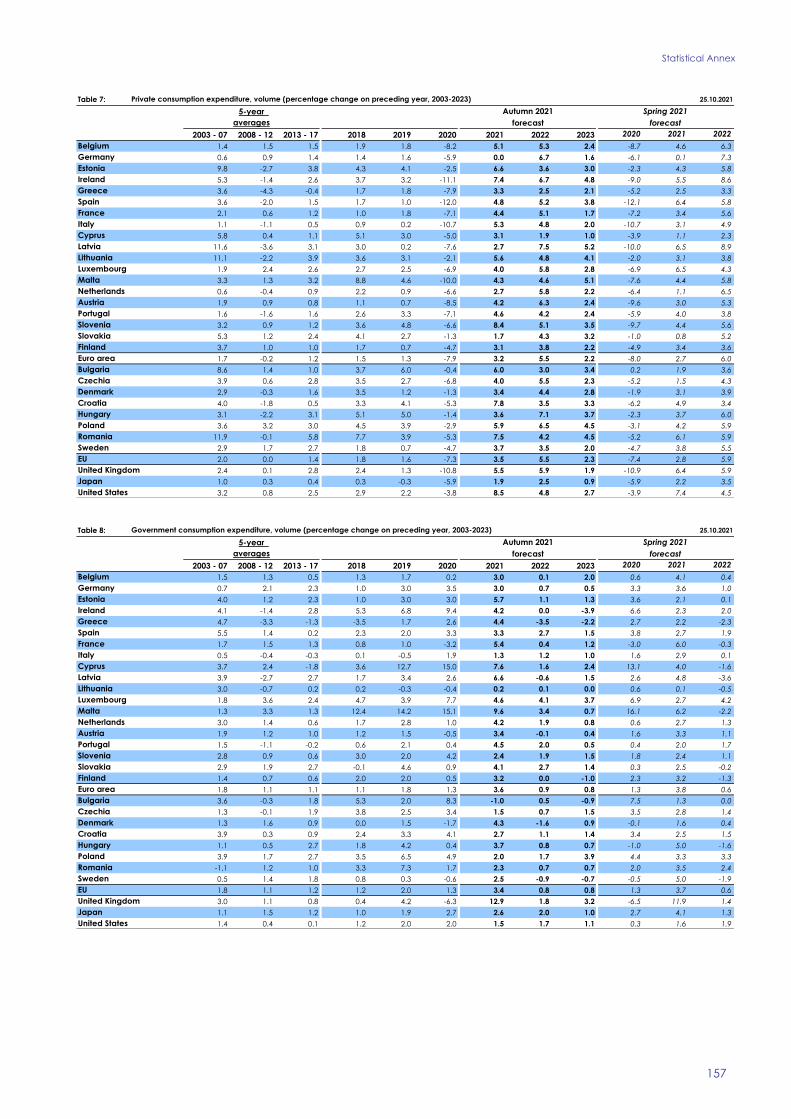
Statistical Annex
157
Table 7: 25.10.2021
5-year
2003 - 07 2008 - 12 2013 - 17 2018 2019 2020 2021 2022 2023 2020 2021 2022
1.4 1.5 1.5 1.9 1.8 -8.2 5.1 5.3 2.4 -8.7 4.6 6.3
0.6 0.9 1.4 1.4 1.6 -5.9 0.0 6.7 1.6 -6.1 0.1 7.3
9.8 -2.7 3.8 4.3 4.1 -2.5 6.6 3.6 3.0 -2.3 4.3 5.8
5.3 -1.4 2.6 3.7 3.2 -11.1 7.4 6.7 4.8 -9.0 5.5 8.6
3.6 -4.3 -0.4 1.7 1.8 -7.9 3.3 2.5 2.1 -5.2 2.5 3.3
3.6 -2.0 1.5 1.7 1.0 -12.0 4.8 5.2 3.8 -12.1 6.4 5.8
2.1 0.6 1.2 1.0 1.8 -7.1 4.4 5.1 1.7 -7.2 3.4 5.6
1.1 -1.1 0.5 0.9 0.2 -10.7 5.3 4.8 2.0 -10.7 3.1 4.9
5.8 0.4 1.1 5.1 3.0 -5.0 3.1 1.9 1.0 -3.9 1.1 2.3
11.6 -3.6 3.1 3.0 0.2 -7.6 2.7 7.5 5.2 -10.0 6.5 8.9
Lithuania 11.1 -2.2 3.9 3.6 3.1 -2.1 5.6 4.8 4.1 -2.0 3.1 3.8
1.9 2.4 2.6 2.7 2.5 -6.9 4.0 5.8 2.8 -6.9 6.5 4.3
3.3 1.3 3.2 8.8 4.6 -10.0 4.3 4.6 5.1 -7.6 4.4 5.8
0.6 -0.4 0.9 2.2 0.9 -6.6 2.7 5.8 2.2 -6.4 1.1 6.5
1.9 0.9 0.8 1.1 0.7 -8.5 4.2 6.3 2.4 -9.6 3.0 5.3
1.6 -1.6 1.6 2.6 3.3 -7.1 4.6 4.2 2.4 -5.9 4.0 3.8
3.2 0.9 1.2 3.6 4.8 -6.6 8.4 5.1 3.5 -9.7 4.4 5.6
5.3 1.2 2.4 4.1 2.7 -1.3 1.7 4.3 3.2 -1.0 0.8 5.2
3.7 1.0 1.0 1.7 0.7 -4.7 3.1 3.8 2.2 -4.9 3.4 3.6
1.7 -0.2 1.2 1.5 1.3 -7.9 3.2 5.5 2.2 -8.0 2.7 6.0
8.6 1.4 1.0 3.7 6.0 -0.4 6.0 3.0 3.4 0.2 1.9 3.6
3.9 0.6 2.8 3.5 2.7 -6.8 4.0 5.5 2.3 -5.2 1.5 4.3
2.9 -0.3 1.6 3.5 1.2 -1.3 3.4 4.4 2.8 -1.9 3.1 3.9
4.0 -1.8 0.5 3.3 4.1 -5.3 7.8 3.5 3.3 -6.2 4.9 3.4
3.1 -2.2 3.1 5.1 5.0 -1.4 3.6 7.1 3.7 -2.3 3.7 6.0
3.6 3.2 3.0 4.5 3.9 -2.9 5.9 6.5 4.5 -3.1 4.2 5.9
11.9 -0.1 5.8 7.7 3.9 -5.3 7.5 4.2 4.5 -5.2 6.1 5.9
2.9 1.7 2.7 1.8 0.7 -4.7 3.7 3.5 2.0 -4.7 3.8 5.5
2.0 0.0 1.4 1.8 1.6 -7.3 3.5 5.5 2.3 -7.4 2.8 5.9
2.4 0.1 2.8 2.4 1.3 -10.8 5.5 5.9 1.9 -10.9 6.4 5.9
1.0 0.3 0.4 0.3 -0.3 -5.9 1.9 2.5 0.9 -5.9 2.2 3.5
3.2 0.8 2.5 2.9 2.2 -3.8 8.5 4.8 2.7 -3.9 7.4 4.5
Private consumption expenditure, volume (percentage change on preceding year, 2003-2023)
Autumn 2021 Spring 2021
averages forecast forecast
Malta
Belgium
Germany
Estonia
Ireland
Greece
Spain
France
Italy
Cyprus
Latvia
Luxembourg
Hungary
Netherlands
Austria
Portugal
Slovenia
Slovakia
Finland
Euro area
Bulgaria
Czechia
Denmark
Croatia
United States
Poland
Romania
Sweden
EU
United Kingdom
Japan
Table 8: 25.10.2021
5-year
2003 - 07 2008 - 12 2013 - 17 2018 2019 2020 2021 2022 2023 2020 2021 2022
1.5 1.3 0.5 1.3 1.7 0.2 3.0 0.1 2.0 0.6 4.1 0.4
0.7 2.1 2.3 1.0 3.0 3.5 3.0 0.7 0.5 3.3 3.6 1.0
4.0 1.2 2.3 1.0 3.0 3.0 5.7 1.1 1.3 3.6 2.1 0.1
4.1 -1.4 2.8 5.3 6.8 9.4 4.2 0.0 -3.9 6.6 2.3 2.0
4.7 -3.3 -1.3 -3.5 1.7 2.6 4.4 -3.5 -2.2 2.7 2.2 -2.3
5.5 1.4 0.2 2.3 2.0 3.3 3.3 2.7 1.5 3.8 2.7 1.9
1.7 1.5 1.3 0.8 1.0 -3.2 5.4 0.4 1.2 -3.0 6.0 -0.3
0.5 -0.4 -0.3 0.1 -0.5 1.9 1.3 1.2 1.0 1.6 2.9 0.1
3.7 2.4 -1.8 3.6 12.7 15.0 7.6 1.6 2.4 13.1 4.0 -1.6
3.9 -2.7 2.7 1.7 3.4 2.6 6.6 -0.6 1.5 2.6 4.8 -3.6
Lithuania 3.0 -0.7 0.2 0.2 -0.3 -0.4 0.2 0.1 0.0 0.6 0.1 -0.5
1.8 3.6 2.4 4.7 3.9 7.7 4.6 4.1 3.7 6.9 2.7 4.2
1.3 3.3 1.3 12.4 14.2 15.1 9.6 3.4 0.7 16.1 6.2 -2.2
3.0 1.4 0.6 1.7 2.8 1.0 4.2 1.9 0.8 0.6 2.7 1.3
1.9 1.2 1.0 1.2 1.5 -0.5 3.4 -0.1 0.4 1.6 3.3 1.1
1.5 -1.1 -0.2 0.6 2.1 0.4 4.5 2.0 0.5 0.4 2.0 1.7
2.8 0.9 0.6 3.0 2.0 4.2 2.4 1.9 1.5 1.8 2.4 1.1
2.9 1.9 2.7 -0.1 4.6 0.9 4.1 2.7 1.4 0.3 2.5 -0.2
1.4 0.7 0.6 2.0 2.0 0.5 3.2 0.0 -1.0 2.3 3.2 -1.3
1.8 1.1 1.1 1.1 1.8 1.3 3.6 0.9 0.8 1.3 3.8 0.6
3.6 -0.3 1.8 5.3 2.0 8.3 -1.0 0.5 -0.9 7.5 1.3 0.0
1.3 -0.1 1.9 3.8 2.5 3.4 1.5 0.7 1.5 3.5 2.8 1.4
1.3 1.6 0.9 0.0 1.5 -1.7 4.3 -1.6 0.9 -0.1 1.6 0.4
3.9 0.3 0.9 2.4 3.3 4.1 2.7 1.1 1.4 3.4 2.5 1.5
1.1 0.5 2.7 1.8 4.2 0.4 3.7 0.8 0.7 -1.0 5.0 -1.6
3.9 1.7 2.7 3.5 6.5 4.9 2.0 1.7 3.9 4.4 3.3 3.3
-1.1 1.2 1.0 3.3 7.3 1.7 2.3 0.7 0.7 2.0 3.5 2.4
0.5 1.4 1.8 0.8 0.3 -0.6 2.5 -0.9 -0.7 -0.5 5.0 -1.9
1.8 1.1 1.2 1.2 2.0 1.3 3.4 0.8 0.8 1.3 3.7 0.6
3.0 1.1 0.8 0.4 4.2 -6.3 12.9 1.8 3.2 -6.5 11.9 1.4
1.1 1.5 1.2 1.0 1.9 2.7 2.6 2.0 1.0 2.7 4.1 1.3
1.4 0.4 0.1 1.2 2.0 2.0 1.5 1.7 1.1 0.3 1.6 1.9
Government consumption expenditure, volume (percentage change on preceding year, 2003-2023)
Autumn 2021 Spring 2021
averages forecast forecast
Malta
Belgium
Germany
Estonia
Ireland
Greece
Spain
France
Italy
Cyprus
Latvia
Luxembourg
Hungary
Netherlands
Austria
Portugal
Slovenia
Slovakia
Finland
Euro area
Bulgaria
Czechia
Denmark
Croatia
United States
Poland
Romania
Sweden
EU
United Kingdom
Japan

European Economic Forecast, Autumn 2021
158
Table 9: 25.10.2021
5-year
2003 - 07 2008 - 12 2013 - 17 2018 2019 2020 2021 2022 2023 2020 2021 2022
4.7 0.2 2.4 3.0 4.5 -6.2 10.5 2.0 1.6 -6.9 6.0 2.8
1.9 0.7 2.0 3.4 1.8 -2.2 2.4 3.5 3.1 -3.1 3.2 3.9
14.2 -4.1 2.7 0.0 6.1 19.9 11.0 2.5 3.6 18.4 -11.4 7.9
8.2 -6.3 20.6 -8.9 99.5 -22.9 -31.8 4.1 5.4 -32.3 6.5 6.6
7.6 -17.7 0.1 -4.3 -3.3 -0.3 15.3 13.4 8.2 -0.6 12.9 15.1
5.8 -8.5 2.8 6.3 4.5 -9.5 3.7 7.4 8.1 -11.4 9.6 12.7
3.5 -0.9 1.5 3.3 4.0 -8.6 12.5 3.9 2.8 -10.2 11.0 3.1
1.3 -4.9 0.0 3.1 0.7 -9.2 15.8 5.9 5.6 -9.1 9.9 8.4
8.3 -8.1 6.8 -4.9 2.9 0.0 5.2 4.9 4.8 -2.0 3.8 4.8
19.2 -6.9 -1.6 11.8 6.9 0.2 5.5 5.8 3.8 0.2 4.3 7.1
Lithuania 16.6 -6.8 6.2 10.0 6.6 -1.8 12.8 6.0 6.1 -0.2 6.2 9.1
3.9 2.8 1.7 -6.2 9.8 -4.6 10.9 3.6 2.7 -8.8 7.0 5.0
11.0 -1.3 13.3 4.7 8.2 -6.5 6.5 8.5 7.5 -4.5 8.5 10.1
4.5 -4.1 3.7 3.6 6.2 -4.1 4.0 2.6 2.0 -3.6 2.7 2.3
2.2 -0.2 2.4 4.4 4.8 -5.2 8.3 4.2 2.3 -4.9 4.8 3.3
-1.0 -7.7 3.4 6.2 5.4 -2.7 5.4 5.2 4.3 -1.9 4.6 6.9
7.4 -8.9 1.6 9.7 5.5 -8.2 10.3 8.0 7.0 -4.1 7.2 9.5
6.8 -1.5 3.4 2.8 6.7 -11.6 2.8 15.7 12.1 -12.0 8.6 12.5
4.4 -1.3 1.4 3.6 -1.6 -0.7 3.1 3.6 3.8 -3.1 2.1 3.4
3.4 -2.9 2.3 3.1 6.7 -7.0 5.2 4.4 3.9 -8.2 6.7 5.3
15.8 -4.2 0.6 5.4 4.5 0.6 -2.3 4.0 6.9 -5.1 3.4 6.1
6.2 -1.9 2.4 10.0 5.9 -7.2 6.4 10.7 4.3 -8.1 3.6 7.9
5.0 -3.6 4.6 4.2 0.1 5.1 6.3 3.1 2.8 2.1 3.4 4.2
7.8 -5.8 2.6 3.8 9.8 -6.1 7.4 10.5 9.5 -2.9 7.3 10.2
3.6 -4.4 6.7 16.3 12.8 -6.9 7.6 8.4 3.4 -7.3 3.8 8.4
10.0 2.5 2.0 9.4 6.1 -9.0 8.7 7.8 5.3 -9.6 3.7 7.2
20.8 -3.7 1.6 -1.1 12.9 6.8 8.8 9.5 12.5 6.8 5.8 7.4
6.0 -0.5 4.6 1.4 -0.3 -0.4 6.1 6.1 2.6 0.6 2.0 3.6
3.9 -2.7 2.5 3.4 6.4 -6.3 5.5 4.8 4.1 -7.4 6.2 5.4
3.3 -2.3 4.9 -0.1 0.5 -9.1 5.7 7.2 1.6 -8.8 3.8 8.3
0.2 -2.1 2.3 0.2 0.9 -4.1 0.9 2.1 1.2 -4.1 1.2 1.8
3.6 -0.9 3.7 4.4 3.1 -1.6 6.8 3.5 2.5 -0.8 8.2 3.8
Total investment, volume (percentage change on preceding year, 2003-2023)
Autumn 2021 Spring 2021
averages forecast forecast
Malta
Belgium
Germany
Estonia
Ireland
Greece
Spain
France
Italy
Cyprus
Latvia
Luxembourg
Hungary
Netherlands
Austria
Portugal
Slovenia
Slovakia
Finland
Euro area
Bulgaria
Czechia
Denmark
Croatia
United States
Poland
Romania
Sweden
EU
United Kingdom
Japan
Table 10: 25.10.2021
5-year
2003 - 07 2008 - 12 2013 - 17 2018 2019 2020 2021 2022 2023 2020 2021 2022
5.0 1.5 1.1 3.9 4.3 -6.4 10.5 1.8 1.3 -7.0 6.5 2.7
-1.1 1.4 0.8 2.6 1.1 2.5 1.4 2.4 2.2 1.9 0.0 3.0
14.4 -5.4 3.4 -9.6 12.8 -3.6 2.1 3.9 5.9 3.5 5.0 7.1
7.0 -18.3 10.3 10.6 5.6 -5.5 9.9 7.6 6.9 -9.1 3.2 8.2
6.6 -18.2 -6.5 -11.0 -15.0 3.7 14.6 16.2 10.5 10.7 20.6 22.6
5.1 -11.3 0.8 9.5 7.1 -9.6 -2.7 7.6 9.0 -14.0 8.4 11.8
4.0 -2.1 0.3 3.0 4.4 -12.0 15.1 3.3 2.0 -13.2 13.5 3.3
1.4 -6.1 -3.1 2.0 2.5 -6.7 21.4 6.2 5.0 -6.3 11.3 8.9
12.3 -10.2 -1.7 25.6 15.0 -5.7 6.6 5.2 4.7 -8.2 2.6 3.1
18.9 -6.4 -3.1 17.8 1.2 1.5 4.8 7.3 3.4 1.5 5.5 9.7
Lithuania 15.9 -8.4 3.8 10.8 9.8 -0.8 12.0 6.8 6.0 -0.4 4.2 4.2
2.5 0.1 2.8 1.1 9.1 -7.6 10.9 3.6 2.7 -4.2 6.1 6.4
3.9 -4.4 12.5 9.0 12.6 -3.2 7.0 10.1 9.5 0.4 9.9 10.0
2.4 -5.8 4.4 7.0 5.4 -1.4 3.0 2.7 2.7 -1.9 -2.3 1.6
1.4 -1.6 0.4 5.6 4.0 -3.7 6.0 2.9 2.7 -3.3 4.2 2.5
-3.4 -9.4 -0.1 4.7 7.5 1.3 4.3 3.3 3.3 4.6 4.3 3.3
5.9 -11.8 -1.4 9.9 9.1 -4.9 2.6 9.7 9.9 0.1 8.7 9.7
9.2 -5.3 2.1 2.5 -2.2 4.5 0.4 12.5 10.8 -5.4 8.2 9.2
5.0 -1.1 1.7 4.7 -1.4 -0.4 1.5 2.7 2.4 -1.5 1.8 2.7
2.6 -4.3 0.4 3.9 3.3 -4.6 7.4 3.9 3.5 -5.5 5.8 4.8
17.9 0.1 -2.8 0.8 -5.9 -0.1 -3.7 5.0 7.3 -6.7 4.7 7.3
4.8 -3.1 0.7 8.3 5.1 -2.4 5.8 10.4 6.4 -3.3 3.8 8.9
4.9 -5.8 4.4 3.4 2.1 10.4 10.0 2.9 2.3 7.6 3.6 3.9
: : : : : : : : : : : : :
0.2 -6.8 5.7 20.7 13.8 -4.3 7.1 9.2 2.4 7.1 -1.6 8.0
8.6 4.5 -1.0 10.9 7.5 -8.5 0.1 5.9 4.6 -9.1 -1.6 6.9
22.8 -3.4 6.2 -8.5 12.7 11.1 8.4 10.4 10.4 15.4 5.9 9.3
6.4 -2.4 6.1 1.9 0.0 -0.4 2.8 4.4 2.3 -0.2 -0.7 2.1
3.0 -4.0 0.8 4.1 3.6 -3.9 7.0 4.3 3.6 -4.6 5.1 5.0
3.1 -3.5 5.6 1.7 1.5 -10.4 9.5 7.6 2.5 -11.6 3.8 10.2
-3.7 -2.8 2.6 -1.7 1.2 0.0 : : : 0.0 0.0 0.0
0.6 -5.5 3.7 1.1 0.8 -0.8 1.4 1.7 2.3 3.2 7.0 3.8
Investment in construction, volume (percentage change on preceding year, 2003-2023)
Autumn 2021 Spring 2021
averages forecast forecast
Malta
Belgium
Germany
Estonia
Ireland
Greece
Spain
France
Italy
Cyprus
Latvia
Luxembourg
Hungary
Netherlands
Austria
Portugal
Slovenia
Slovakia
Finland
Euro area
Bulgaria
Czechia
Denmark
Croatia
United States
Poland
Romania
Sweden
EU
United Kingdom
Japan

Statistical Annex
159
Table 11: 25.10.2021
5-year
2003 - 07 2008 - 12 2013 - 17 2018 2019 2020 2021 2022 2023 2020 2021 2022
4.5 -3.2 3.4 1.8 3.1 -5.4 10.3 2.1 2.1 -6.2 5.0 3.0
5.9 -1.0 2.7 4.4 1.0 -11.2 5.4 5.6 4.7 -12.1 9.0 6.0
13.8 -4.2 0.3 15.1 -4.9 -3.5 6.7 5.0 4.6 -16.3 11.6 9.4
13.9 1.5 9.2 19.1 -5.8 -28.3 15.2 10.3 7.4 -25.2 2.2 8.1
9.5 -21.4 9.7 -0.4 3.0 -4.8 22.4 16.3 8.9 -7.1 13.4 14.6
7.0 -7.3 5.6 4.7 3.2 -12.9 15.0 8.0 7.5 -13.0 12.2 15.0
2.7 -1.0 2.5 2.6 3.0 -10.6 11.3 2.8 2.4 -13.6 10.7 3.3
1.9 -5.3 2.7 4.5 -0.9 -15.1 15.8 5.4 5.2 -15.2 12.4 8.8
0.8 -6.1 17.4 -37.1 -15.4 15.4 4.6 6.3 7.0 15.6 7.9 10.0
22.4 -9.3 -0.5 3.9 14.5 -2.0 6.9 4.3 4.4 -2.2 2.8 3.5
Lithuania 18.1 -7.0 9.9 8.0 3.5 -5.5 13.5 5.2 6.2 -5.1 7.9 9.8
7.0 6.7 0.1 -22.5 15.1 -5.1 10.9 3.6 2.7 -12.6 9.0 1.9
27.8 -0.1 13.2 -6.9 1.0 -21.3 : : : : -25.0 : :
3.8 -0.3 2.8 0.7 7.9 -12.1 4.3 2.9 1.4 -8.9 12.7 0.7
2.6 -0.6 4.1 1.3 4.3 -8.7 13.4 6.1 1.1 -11.1 6.4 4.3
3.2 -9.6 10.6 8.9 1.8 -12.0 7.7 9.2 5.8 -12.0 4.9 15.4
10.3 -8.3 5.4 10.4 2.0 -14.0 20.2 7.7 4.8 -11.1 7.0 11.5
3.6 4.1 3.4 1.9 13.9 -26.9 5.4 23.3 16.5 -19.2 9.6 16.5
4.0 -0.6 3.8 -1.7 -4.9 -0.6 9.2 7.0 8.5 -9.1 3.4 6.5
4.7 -3.0 3.5 3.8 1.8 -12.0 10.1 5.4 4.5 -12.8 9.7 6.7
14.8 -9.6 2.5 8.8 15.1 3.3 -8.6 2.7 7.7 -3.7 4.7 3.7
7.6 -1.5 3.0 8.9 2.6 -13.7 8.5 12.5 0.0 -15.0 3.2 7.2
5.8 -5.0 5.8 1.9 -4.6 -6.5 6.7 3.9 3.4 -7.0 4.1 6.1
: : : : : : : : : : : : :
7.0 -2.7 8.5 12.9 12.4 -9.0 8.9 7.4 6.0 -23.6 12.7 8.9
12.0 -0.4 5.5 8.0 3.2 -12.2 17.2 10.2 5.4 -11.8 11.1 8.4
19.7 -4.0 -5.1 11.6 5.3 1.9 9.2 7.8 17.4 -4.2 6.7 5.9
7.9 1.0 2.9 0.3 1.1 -9.0 10.0 10.0 2.5 -6.4 5.8 5.2
5.4 -2.8 3.4 4.2 2.0 -11.4 10.1 6.1 4.6 -12.4 9.3 6.8
3.4 -3.9 4.9 -7.7 -1.8 -15.4 1.7 6.6 1.1 -11.5 5.7 9.7
5.1 -1.9 2.4 3.1 0.5 0.0 : : : 0.0 0.0 0.0
7.3 2.4 2.7 6.3 3.7 -7.0 12.9 4.7 2.6 -4.1 12.0 3.8
Investment in equipment, volume (percentage change on preceding year, 2003-2023)
Autumn 2021 Spring 2021
averages forecast forecast
Malta
Belgium
Germany
Estonia
Ireland
Greece
Spain
France
Italy
Cyprus
Latvia
Luxembourg
Hungary
Netherlands
Austria
Portugal
Slovenia
Slovakia
Finland
Euro area
Bulgaria
Czechia
Denmark
Croatia
United States
Poland
Romania
Sweden
EU
United Kingdom
Japan
Table 12: 25.10.2021
5-year
2003 - 07 2008 - 12 2013 - 17 2018 2019 2020 2021 2022 2023 2020 2021 2022
2.0 2.3 2.4 2.6 2.6 2.7 2.9 3.0 3.1 2.8 3.0 2.9
2.0 2.3 2.2 2.4 2.4 2.6 2.6 2.6 2.6 2.7 2.8 2.8
5.1 5.7 5.2 5.3 5.0 5.8 5.9 6.0 6.0 5.7 6.3 6.2
3.8 3.4 2.0 2.1 2.4 2.4 2.2 2.5 2.8 2.7 2.9 3.0
5.3 4.0 3.8 3.2 2.5 3.1 3.1 4.3 4.1 3.0 4.9 5.8
4.3 4.2 2.2 2.2 2.1 2.6 2.7 2.7 2.6 2.5 2.5 2.4
4.0 4.1 3.6 3.4 3.7 3.7 4.0 4.0 4.0 3.8 3.9 3.9
3.2 3.1 2.3 2.1 2.3 2.6 2.8 3.2 3.2 2.7 2.9 3.2
3.6 3.7 2.3 4.9 2.5 2.8 2.9 2.9 3.0 2.9 3.5 3.5
4.2 5.2 4.5 5.6 5.1 5.7 6.1 7.1 6.1 5.7 6.2 6.1
Lithuania 4.0 4.7 3.4 3.2 3.1 4.1 3.5 3.6 3.5 4.1 3.9 3.9
4.6 4.1 3.8 3.9 4.1 4.8 4.3 4.3 4.3 5.0 4.3 4.2
4.1 2.7 3.1 3.2 3.8 4.5 4.7 4.9 4.8 4.5 5.6 5.3
3.9 4.1 3.5 3.4 3.4 3.6 3.6 3.7 3.7 3.4 3.9 3.7
2.7 3.2 3.0 3.1 3.1 3.3 3.3 3.3 3.2 3.4 3.6 3.5
3.9 3.8 1.9 1.8 1.8 2.2 2.5 3.0 3.5 2.2 2.5 3.2
4.1 4.6 4.1 3.7 3.8 4.1 5.2 6.5 6.1 4.2 5.8 5.8
3.3 3.6 4.1 3.7 3.6 3.5 3.6 4.2 5.7 3.5 3.8 3.7
3.6 3.8 4.1 4.3 4.4 4.9 4.9 4.8 4.5 4.6 4.6 4.3
3.2 3.3 2.7 2.7 2.8 3.0 3.1 3.2 3.2 3.1 3.3 3.3
3.9 4.4 4.2 3.1 3.3 3.8 3.9 4.5 4.8 4.5 4.2 4.2
5.6 5.0 3.9 4.1 4.4 4.9 4.8 5.1 5.1 4.9 5.2 5.3
2.8 3.3 3.7 3.4 3.2 3.6 3.6 3.5 3.5 3.6 3.7 3.7
6.3 4.7 3.4 3.5 4.3 5.6 5.5 6.0 6.3 5.6 6.3 7.4
4.2 3.4 4.8 5.8 6.2 6.4 6.5 7.1 6.6 6.4 6.4 6.6
3.4 5.2 4.1 4.7 4.3 4.5 4.5 4.5 4.4 4.4 4.7 4.9
4.1 5.7 4.0 2.7 3.5 4.6 5.5 6.6 7.1 4.6 5.0 5.2
4.1 4.4 4.4 4.9 4.9 5.1 5.0 5.0 5.0 5.1 5.0 5.0
3.3 3.5 2.9 2.9 3.0 3.3 3.4 3.5 3.5 3.3 3.5 3.5
2.2 3.0 2.6 2.6 2.8 3.0 3.3 3.4 3.4 3.1 3.5 3.5
3.8 3.7 3.8 3.7 3.9 4.2 4.2 4.1 4.1 4.2 4.3 4.2
3.8 3.9 3.2 3.2 3.3 3.6 3.3 3.3 3.3 3.6 3.4 3.4
Public investment (as a percentage of GDP, 2003-2023)
Autumn 2021 Spring 2021
averages forecast forecast
Malta
Belgium
Germany
Estonia
Ireland
Greece
Spain
France
Italy
Cyprus
Latvia
Luxembourg
Hungary
Netherlands
Austria
Portugal
Slovenia
Slovakia
Finland
Euro area
Bulgaria
Czechia
Denmark
Croatia
United States
Poland
Romania
Sweden
EU
United Kingdom
Japan
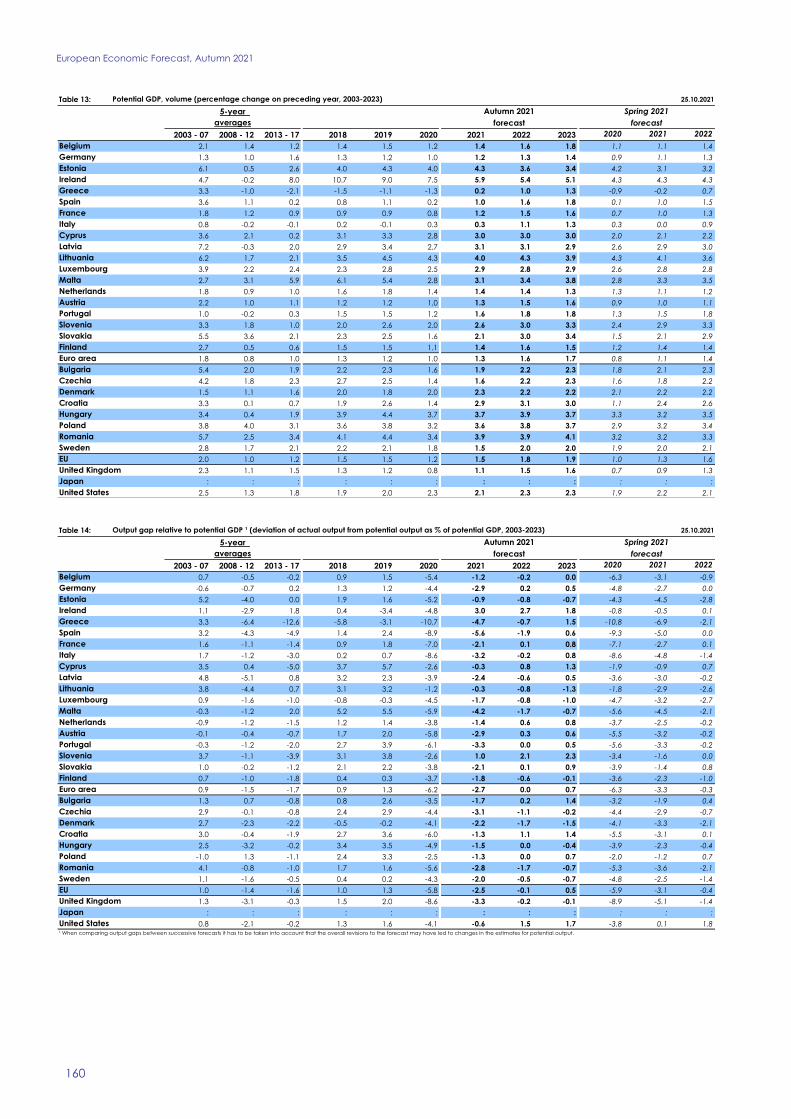
European Economic Forecast, Autumn 2021
160
Table 13: 25.10.2021
5-year
2003 - 07 2008 - 12 2013 - 17 2018 2019 2020 2021 2022 2023 2020 2021 2022
2.1 1.4 1.2 1.4 1.5 1.2 1.4 1.6 1.8 1.1 1.1 1.4
1.3 1.0 1.6 1.3 1.2 1.0 1.2 1.3 1.4 0.9 1.1 1.3
6.1 0.5 2.6 4.0 4.3 4.0 4.3 3.6 3.4 4.2 3.1 3.2
4.7 -0.2 8.0 10.7 9.0 7.5 5.9 5.4 5.1 4.3 4.3 4.3
3.3 -1.0 -2.1 -1.5 -1.1 -1.3 0.2 1.0 1.3 -0.9 -0.2 0.7
3.6 1.1 0.2 0.8 1.1 0.2 1.0 1.6 1.8 0.1 1.0 1.5
1.8 1.2 0.9 0.9 0.9 0.8 1.2 1.5 1.6 0.7 1.0 1.3
0.8 -0.2 -0.1 0.2 -0.1 0.3 0.3 1.1 1.3 0.3 0.0 0.9
3.6 2.1 0.2 3.1 3.3 2.8 3.0 3.0 3.0 2.0 2.1 2.2
7.2 -0.3 2.0 2.9 3.4 2.7 3.1 3.1 2.9 2.6 2.9 3.0
Lithuania 6.2 1.7 2.1 3.5 4.5 4.3 4.0 4.3 3.9 4.3 4.1 3.6
3.9 2.2 2.4 2.3 2.8 2.5 2.9 2.8 2.9 2.6 2.8 2.8
2.7 3.1 5.9 6.1 5.4 2.8 3.1 3.4 3.8 2.8 3.3 3.5
1.8 0.9 1.0 1.6 1.8 1.4 1.4 1.4 1.3 1.3 1.1 1.2
2.2 1.0 1.1 1.2 1.2 1.0 1.3 1.5 1.6 0.9 1.0 1.1
1.0 -0.2 0.3 1.5 1.5 1.2 1.6 1.8 1.8 1.3 1.5 1.8
3.3 1.8 1.0 2.0 2.6 2.0 2.6 3.0 3.3 2.4 2.9 3.3
5.5 3.6 2.1 2.3 2.5 1.6 2.1 3.0 3.4 1.5 2.1 2.9
2.7 0.5 0.6 1.5 1.5 1.1 1.4 1.6 1.5 1.2 1.4 1.4
1.8 0.8 1.0 1.3 1.2 1.0 1.3 1.6 1.7 0.8 1.1 1.4
5.4 2.0 1.9 2.2 2.3 1.6 1.9 2.2 2.3 1.8 2.1 2.3
4.2 1.8 2.3 2.7 2.5 1.4 1.6 2.2 2.3 1.6 1.8 2.2
1.5 1.1 1.6 2.0 1.8 2.0 2.3 2.2 2.2 2.1 2.2 2.2
3.3 0.1 0.7 1.9 2.6 1.4 2.9 3.1 3.0 1.1 2.4 2.6
3.4 0.4 1.9 3.9 4.4 3.7 3.7 3.9 3.7 3.3 3.2 3.5
3.8 4.0 3.1 3.6 3.8 3.2 3.6 3.8 3.7 2.9 3.2 3.4
5.7 2.5 3.4 4.1 4.4 3.4 3.9 3.9 4.1 3.2 3.2 3.3
2.8 1.7 2.1 2.2 2.1 1.8 1.5 2.0 2.0 1.9 2.0 2.1
2.0 1.0 1.2 1.5 1.5 1.2 1.5 1.8 1.9 1.0 1.3 1.6
2.3 1.1 1.5 1.3 1.2 0.8 1.1 1.5 1.6 0.7 0.9 1.3
: : : : : : : : : : : : :
2.5 1.3 1.8 1.9 2.0 2.3 2.1 2.3 2.3 1.9 2.2 2.1
Potential GDP, volume (percentage change on preceding year, 2003-2023)
Autumn 2021 Spring 2021
averages forecast forecast
Malta
Belgium
Germany
Estonia
Ireland
Greece
Spain
France
Italy
Cyprus
Latvia
Luxembourg
Hungary
Netherlands
Austria
Portugal
Slovenia
Slovakia
Finland
Euro area
Bulgaria
Czechia
Denmark
Croatia
United States
Poland
Romania
Sweden
EU
United Kingdom
Japan
Table 14: 25.10.2021
5-year
2003 - 07 2008 - 12 2013 - 17 2018 2019 2020 2021 2022 2023 2020 2021 2022
0.7 -0.5 -0.2 0.9 1.5 -5.4 -1.2 -0.2 0.0 -6.3 -3.1 -0.9
-0.6 -0.7 0.2 1.3 1.2 -4.4 -2.9 0.2 0.5 -4.8 -2.7 0.0
5.2 -4.0 0.0 1.9 1.6 -5.2 -0.9 -0.8 -0.7 -4.3 -4.5 -2.8
1.1 -2.9 1.8 0.4 -3.4 -4.8 3.0 2.7 1.8 -0.8 -0.5 0.1
3.3 -6.4 -12.6 -5.8 -3.1 -10.7 -4.7 -0.7 1.5 -10.8 -6.9 -2.1
3.2 -4.3 -4.9 1.4 2.4 -8.9 -5.6 -1.9 0.6 -9.3 -5.0 0.0
1.6 -1.1 -1.4 0.9 1.8 -7.0 -2.1 0.1 0.8 -7.1 -2.7 0.1
1.7 -1.2 -3.0 0.2 0.7 -8.6 -3.2 -0.2 0.8 -8.6 -4.8 -1.4
3.5 0.4 -5.0 3.7 5.7 -2.6 -0.3 0.8 1.3 -1.9 -0.9 0.7
4.8 -5.1 0.8 3.2 2.3 -3.9 -2.4 -0.6 0.5 -3.6 -3.0 -0.2
Lithuania 3.8 -4.4 0.7 3.1 3.2 -1.2 -0.3 -0.8 -1.3 -1.8 -2.9 -2.6
0.9 -1.6 -1.0 -0.8 -0.3 -4.5 -1.7 -0.8 -1.0 -4.7 -3.2 -2.7
-0.3 -1.2 2.0 5.2 5.5 -5.9 -4.2 -1.7 -0.7 -5.6 -4.5 -2.1
-0.9 -1.2 -1.5 1.2 1.4 -3.8 -1.4 0.6 0.8 -3.7 -2.5 -0.2
-0.1 -0.4 -0.7 1.7 2.0 -5.8 -2.9 0.3 0.6 -5.5 -3.2 -0.2
-0.3 -1.2 -2.0 2.7 3.9 -6.1 -3.3 0.0 0.5 -5.6 -3.3 -0.2
3.7 -1.1 -3.9 3.1 3.8 -2.6 1.0 2.1 2.3 -3.4 -1.6 0.0
1.0 -0.2 -1.2 2.1 2.2 -3.8 -2.1 0.1 0.9 -3.9 -1.4 0.8
0.7 -1.0 -1.8 0.4 0.3 -3.7 -1.8 -0.6 -0.1 -3.6 -2.3 -1.0
0.9 -1.5 -1.7 0.9 1.3 -6.2 -2.7 0.0 0.7 -6.3 -3.3 -0.3
1.3 0.7 -0.8 0.8 2.6 -3.5 -1.7 0.2 1.4 -3.2 -1.9 0.4
2.9 -0.1 -0.8 2.4 2.9 -4.4 -3.1 -1.1 -0.2 -4.4 -2.9 -0.7
2.7 -2.3 -2.2 -0.5 -0.2 -4.1 -2.2 -1.7 -1.5 -4.1 -3.3 -2.1
3.0 -0.4 -1.9 2.7 3.6 -6.0 -1.3 1.1 1.4 -5.5 -3.1 0.1
2.5 -3.2 -0.2 3.4 3.5 -4.9 -1.5 0.0 -0.4 -3.9 -2.3 -0.4
-1.0 1.3 -1.1 2.4 3.3 -2.5 -1.3 0.0 0.7 -2.0 -1.2 0.7
4.1 -0.8 -1.0 1.7 1.6 -5.6 -2.8 -1.7 -0.7 -5.3 -3.6 -2.1
1.1 -1.6 -0.5 0.4 0.2 -4.3 -2.0 -0.5 -0.7 -4.8 -2.5 -1.4
1.0 -1.4 -1.6 1.0 1.3 -5.8 -2.5 -0.1 0.5 -5.9 -3.1 -0.4
1.3 -3.1 -0.3 1.5 2.0 -8.6 -3.3 -0.2 -0.1 -8.9 -5.1 -1.4
: : : : : : : : : : : : :
0.8 -2.1 -0.2 1.3 1.6 -4.1 -0.6 1.5 1.7 -3.8 0.1 1.8
Output gap relative to potential GDP ¹ (deviation of actual output from potential output as % of potential GDP, 2003-2023)
Autumn 2021 Spring 2021
averages forecast forecast
Malta
Belgium
Germany
Estonia
Ireland
Greece
Spain
France
Italy
Cyprus
Latvia
Luxembourg
Hungary
Netherlands
Austria
Portugal
Slovenia
Slovakia
Finland
Euro area
Bulgaria
Czechia
Denmark
Croatia
United States¹ When comparing output gaps between successive forecasts it has to be taken into account that the overall revisions to the forecast may have led to changes in the estimates for potential output.
Poland
Romania
Sweden
EU
United Kingdom
Japan

Statistical Annex
161
Table 15: 25.10.2021
5-year
2003 - 07 2008 - 12 2013 - 17 2018 2019 2020 2021 2022 2023 2020 2021 2022
2.0 1.6 1.5 1.5 1.8 1.3 2.0 2.3 1.6 1.1 1.6 1.5
1.0 1.2 1.7 2.0 2.1 1.6 2.6 2.4 1.8 1.6 1.6 1.5
7.1 3.5 2.7 4.0 3.2 -0.3 2.9 3.0 2.4 -0.4 1.8 2.3
2.4 -0.9 2.0 0.7 4.2 -1.2 -0.2 2.0 1.4 -0.5 1.5 1.2
3.1 1.5 -0.9 -0.2 0.2 -0.8 -0.1 0.9 0.4 -1.5 -0.3 0.7
3.9 0.5 0.5 1.2 1.3 1.1 1.5 1.6 0.9 1.1 1.0 1.1
2.0 1.1 0.7 1.0 1.3 2.5 0.8 1.4 1.4 2.2 0.5 1.1
2.5 1.5 1.0 1.1 0.9 1.2 1.1 1.5 1.4 1.2 0.8 1.2
3.5 2.0 -0.5 1.0 1.1 -1.2 2.4 1.6 1.0 -1.5 1.4 1.2
11.0 2.1 1.5 3.9 2.6 -0.1 3.5 2.9 2.0 0.1 2.2 2.1
Lithuania 4.8 3.3 1.6 3.5 2.7 1.5 4.3 2.6 2.0 1.1 2.0 2.1
3.7 3.8 1.7 1.7 0.6 4.3 2.3 2.2 2.2 2.3 2.2 2.5
2.1 2.3 2.5 2.2 2.4 1.3 1.8 1.8 1.5 1.4 1.6 2.0
2.0 1.0 0.8 2.4 3.0 2.3 2.4 1.7 1.5 2.4 1.9 1.7
1.9 1.7 1.8 1.8 1.6 2.3 1.8 2.2 2.1 1.1 1.3 1.7
3.1 0.6 1.6 1.8 1.7 1.9 1.0 1.8 1.4 2.4 1.4 1.5
3.4 1.7 1.1 2.1 2.2 1.2 1.5 1.8 1.7 1.3 1.2 1.3
3.5 1.0 0.2 2.0 2.5 2.4 1.4 4.7 2.2 2.4 1.5 2.3
1.1 2.1 1.3 2.0 1.5 1.3 1.9 2.0 2.3 1.7 1.7 1.7
2.1 1.2 1.1 1.5 1.7 1.6 1.6 1.9 1.5 1.5 1.2 1.4
6.4 4.0 2.5 4.2 5.2 4.2 3.9 4.6 3.5 3.3 5.0 3.0
1.9 0.9 1.5 2.6 3.9 4.4 3.9 3.1 2.5 4.2 2.0 2.1
2.2 2.2 0.8 0.7 0.7 2.6 1.0 1.6 1.5 2.3 1.4 1.6
3.8 2.5 0.4 2.0 1.9 -0.1 2.4 2.1 1.9 0.4 1.7 1.7
4.4 3.3 2.9 4.8 4.8 5.9 4.7 4.5 3.7 5.7 3.7 3.7
2.7 3.0 0.8 1.2 3.2 4.1 4.7 5.4 2.7 4.1 2.8 2.5
15.3 6.1 3.1 6.2 6.8 3.8 3.9 4.4 4.1 3.8 3.2 2.7
1.5 1.7 1.7 2.4 2.5 1.5 2.1 1.4 1.6 1.4 1.6 1.8
2.2 1.4 1.2 1.6 1.9 1.9 1.9 2.1 1.7 1.8 1.4 1.5
2.8 2.0 1.6 2.0 2.0 5.9 0.7 0.4 1.7 5.6 0.8 -0.4
-1.1 -1.1 0.8 0.0 0.6 0.9 -0.5 0.3 0.2 0.9 -0.9 0.6
2.7 1.5 1.5 2.4 1.8 1.2 3.6 2.6 2.1 1.2 2.3 2.0
Deflator of gross domestic product (percentage change on preceding year, 2003-2023)
Autumn 2021 Spring 2021
averages forecast forecast
Malta
Belgium
Germany
Estonia
Ireland
Greece
Spain
France
Italy
Cyprus
Latvia
Luxembourg
Hungary
Netherlands
Austria
Portugal
Slovenia
Slovakia
Finland
Euro area
Bulgaria
Czechia
Denmark
Croatia
United States
Poland
Romania
Sweden
EU
United Kingdom
Japan
Table 16: 25.10.2021
5-year
2003 - 07 2008 - 12 2013 - 17 2018 2019 2020 2021 2022 2023 2020 2021 2022
2.5 1.8 1.2 2.0 1.4 0.6 2.1 2.3 1.7 0.7 1.8 1.5
1.4 1.4 1.0 1.5 1.3 0.6 3.1 2.1 1.7 0.7 2.3 1.4
4.5 3.9 1.7 3.7 2.5 -0.8 3.7 3.9 2.4 -0.7 1.8 2.4
2.5 -0.9 0.8 2.0 2.0 0.5 3.6 3.1 1.5 0.2 0.9 1.3
3.1 1.8 -1.2 0.1 0.0 -1.0 0.1 1.0 0.4 -1.3 -0.2 0.6
3.4 1.8 0.5 1.4 1.0 0.0 1.9 1.2 1.0 0.2 1.0 1.2
2.0 1.1 0.4 1.7 0.8 0.8 1.5 1.9 1.4 0.6 1.4 1.2
2.5 1.9 0.5 1.0 0.6 -0.3 1.8 2.1 1.4 -0.2 1.3 1.1
2.9 2.6 -0.9 1.3 1.1 -0.9 1.9 1.7 1.2 -0.9 1.7 1.1
8.6 3.2 1.1 3.0 3.0 0.7 3.1 3.8 2.3 0.8 1.8 2.1
Lithuania 2.2 4.8 0.9 2.6 2.1 0.8 3.8 3.1 2.0 0.8 1.9 1.9
2.5 1.8 1.2 1.9 1.7 0.7 2.1 1.9 1.7 1.0 1.7 1.7
2.1 2.6 1.1 0.8 1.9 1.2 1.6 2.1 1.6 1.2 1.6 2.1
2.1 1.1 1.0 2.2 2.6 1.5 2.2 2.2 1.5 1.4 1.6 1.4
2.1 1.9 1.8 2.1 1.8 1.4 2.9 3.1 2.2 1.1 1.6 1.6
3.3 1.2 0.9 1.6 0.8 0.7 1.2 1.8 1.4 0.9 1.2 1.6
3.4 2.3 0.5 2.0 1.3 -0.5 1.7 2.1 1.7 -0.6 1.1 1.7
4.8 2.6 0.4 2.3 2.7 2.2 2.8 4.0 2.0 2.2 1.5 1.9
1.1 2.6 1.1 1.3 1.0 0.5 1.8 1.9 1.9 0.4 1.2 1.2
2.2 1.5 0.7 1.5 1.1 0.5 2.2 2.0 1.5 0.5 1.6 1.3
4.3 3.0 1.7 2.4 2.0 -0.6 2.2 6.1 2.2 0.5 2.1 2.6
1.9 2.0 0.9 2.5 2.8 2.8 3.4 4.0 1.9 2.8 2.6 2.7
1.6 2.3 0.6 0.6 0.8 0.5 1.7 1.8 1.6 0.3 1.3 1.5
2.8 3.1 0.2 1.4 1.1 0.3 2.1 1.9 1.4 0.2 1.6 1.3
4.7 4.5 1.6 3.3 4.6 3.0 5.1 4.8 3.4 3.2 4.0 3.2
2.2 3.5 0.2 1.7 2.4 3.2 4.2 5.2 2.2 3.3 3.7 3.1
9.4 5.7 1.7 3.8 5.4 2.4 4.2 4.2 3.0 2.4 3.1 2.9
1.1 1.6 1.1 2.5 2.1 1.1 2.5 2.0 1.2 1.1 1.5 1.3
2.2 1.7 0.7 1.6 1.4 0.7 2.4 2.3 1.6 0.7 1.8 1.5
2.2 2.2 1.2 2.0 1.3 1.6 1.7 2.4 2.0 1.6 1.7 2.4
-0.6 -0.8 0.5 0.7 0.5 0.4 -0.4 0.4 0.4 0.4 0.4 0.8
2.6 1.8 1.2 2.1 1.5 1.2 3.3 2.5 2.0 1.2 2.0 2.0
Price deflator of private consumption (percentage change on preceding year, 2003-2023)
Autumn 2021 Spring 2021
averages forecast forecast
Malta
Belgium
Germany
Estonia
Ireland
Greece
Spain
France
Italy
Cyprus
Latvia
Luxembourg
Hungary
Netherlands
Austria
Portugal
Slovenia
Slovakia
Finland
Euro area
Bulgaria
Czechia
Denmark
Croatia
United States
Poland
Romania
Sweden
EU
United Kingdom
Japan
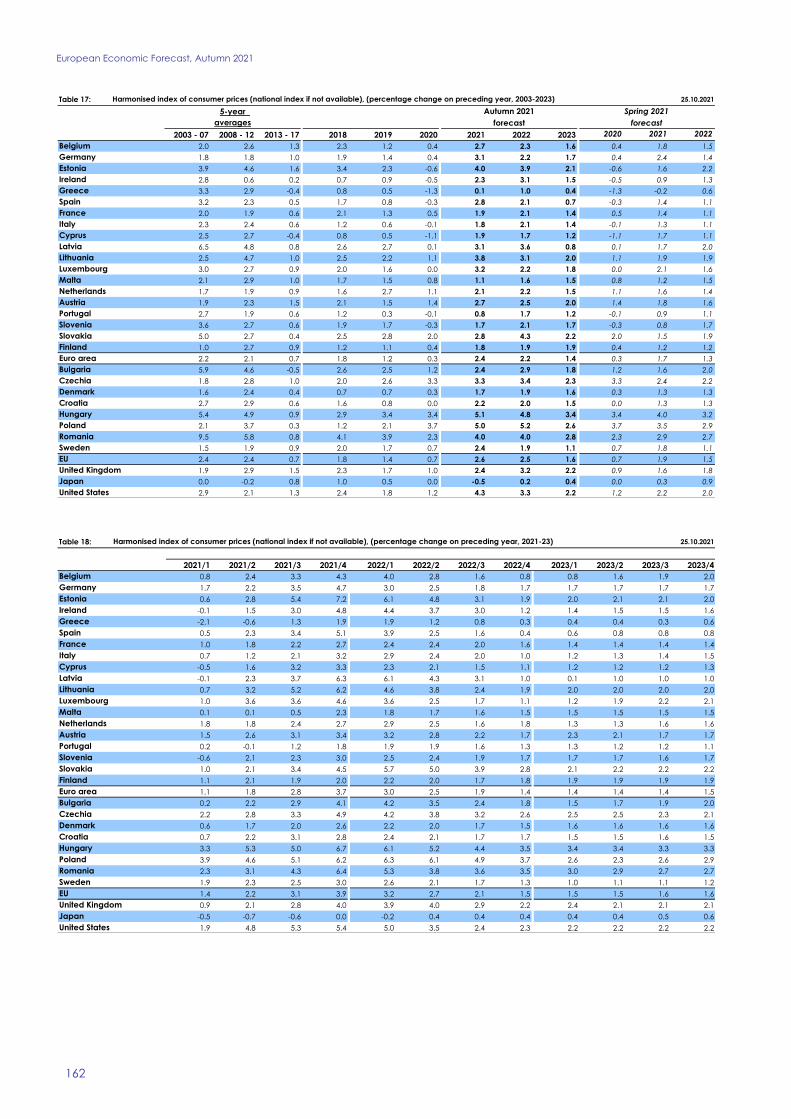
European Economic Forecast, Autumn 2021
162
Table 17: 25.10.2021
5-year
2003 - 07 2008 - 12 2013 - 17 2018 2019 2020 2021 2022 2023 2020 2021 2022
2.0 2.6 1.3 2.3 1.2 0.4 2.7 2.3 1.6 0.4 1.8 1.5
1.8 1.8 1.0 1.9 1.4 0.4 3.1 2.2 1.7 0.4 2.4 1.4
3.9 4.6 1.6 3.4 2.3 -0.6 4.0 3.9 2.1 -0.6 1.6 2.2
2.8 0.6 0.2 0.7 0.9 -0.5 2.3 3.1 1.5 -0.5 0.9 1.3
3.3 2.9 -0.4 0.8 0.5 -1.3 0.1 1.0 0.4 -1.3 -0.2 0.6
3.2 2.3 0.5 1.7 0.8 -0.3 2.8 2.1 0.7 -0.3 1.4 1.1
2.0 1.9 0.6 2.1 1.3 0.5 1.9 2.1 1.4 0.5 1.4 1.1
2.3 2.4 0.6 1.2 0.6 -0.1 1.8 2.1 1.4 -0.1 1.3 1.1
2.5 2.7 -0.4 0.8 0.5 -1.1 1.9 1.7 1.2 -1.1 1.7 1.1
6.5 4.8 0.8 2.6 2.7 0.1 3.1 3.6 0.8 0.1 1.7 2.0
Lithuania 2.5 4.7 1.0 2.5 2.2 1.1 3.8 3.1 2.0 1.1 1.9 1.9
3.0 2.7 0.9 2.0 1.6 0.0 3.2 2.2 1.8 0.0 2.1 1.6
2.1 2.9 1.0 1.7 1.5 0.8 1.1 1.6 1.5 0.8 1.2 1.5
1.7 1.9 0.9 1.6 2.7 1.1 2.1 2.2 1.5 1.1 1.6 1.4
1.9 2.3 1.5 2.1 1.5 1.4 2.7 2.5 2.0 1.4 1.8 1.6
2.7 1.9 0.6 1.2 0.3 -0.1 0.8 1.7 1.2 -0.1 0.9 1.1
3.6 2.7 0.6 1.9 1.7 -0.3 1.7 2.1 1.7 -0.3 0.8 1.7
5.0 2.7 0.4 2.5 2.8 2.0 2.8 4.3 2.2 2.0 1.5 1.9
1.0 2.7 0.9 1.2 1.1 0.4 1.8 1.9 1.9 0.4 1.2 1.2
2.2 2.1 0.7 1.8 1.2 0.3 2.4 2.2 1.4 0.3 1.7 1.3
5.9 4.6 -0.5 2.6 2.5 1.2 2.4 2.9 1.8 1.2 1.6 2.0
1.8 2.8 1.0 2.0 2.6 3.3 3.3 3.4 2.3 3.3 2.4 2.2
1.6 2.4 0.4 0.7 0.7 0.3 1.7 1.9 1.6 0.3 1.3 1.3
2.7 2.9 0.6 1.6 0.8 0.0 2.2 2.0 1.5 0.0 1.3 1.3
5.4 4.9 0.9 2.9 3.4 3.4 5.1 4.8 3.4 3.4 4.0 3.2
2.1 3.7 0.3 1.2 2.1 3.7 5.0 5.2 2.6 3.7 3.5 2.9
9.5 5.8 0.8 4.1 3.9 2.3 4.0 4.0 2.8 2.3 2.9 2.7
1.5 1.9 0.9 2.0 1.7 0.7 2.4 1.9 1.1 0.7 1.8 1.1
2.4 2.4 0.7 1.8 1.4 0.7 2.6 2.5 1.6 0.7 1.9 1.5
1.9 2.9 1.5 2.3 1.7 1.0 2.4 3.2 2.2 0.9 1.6 1.8
0.0 -0.2 0.8 1.0 0.5 0.0 -0.5 0.2 0.4 0.0 0.3 0.9
2.9 2.1 1.3 2.4 1.8 1.2 4.3 3.3 2.2 1.2 2.2 2.0
Harmonised index of consumer prices (national index if not available), (percentage change on preceding year, 2003-2023)
Autumn 2021 Spring 2021
averages forecast forecast
Malta
Belgium
Germany
Estonia
Ireland
Greece
Spain
France
Italy
Cyprus
Latvia
Luxembourg
Hungary
Netherlands
Austria
Portugal
Slovenia
Slovakia
Finland
Euro area
Bulgaria
Czechia
Denmark
Croatia
United States
Poland
Romania
Sweden
EU
United Kingdom
Japan
Incorrect slice name
Table 18: 25.10.2021
2021/1 2021/2 2021/3 2021/4 2022/1 2022/2 2022/3 2022/4 2023/1 2023/2 2023/3 2023/4
0.8 2.4 3.3 4.3 4.0 2.8 1.6 0.8 0.8 1.6 1.9 2.0
1.7 2.2 3.5 4.7 3.0 2.5 1.8 1.7 1.7 1.7 1.7 1.7
0.6 2.8 5.4 7.2 6.1 4.8 3.1 1.9 2.0 2.1 2.1 2.0
-0.1 1.5 3.0 4.8 4.4 3.7 3.0 1.2 1.4 1.5 1.5 1.6
-2.1 -0.6 1.3 1.9 1.9 1.2 0.8 0.3 0.4 0.4 0.3 0.6
0.5 2.3 3.4 5.1 3.9 2.5 1.6 0.4 0.6 0.8 0.8 0.8
1.0 1.8 2.2 2.7 2.4 2.4 2.0 1.6 1.4 1.4 1.4 1.4
0.7 1.2 2.1 3.2 2.9 2.4 2.0 1.0 1.2 1.3 1.4 1.5
-0.5 1.6 3.2 3.3 2.3 2.1 1.5 1.1 1.2 1.2 1.2 1.3
-0.1 2.3 3.7 6.3 6.1 4.3 3.1 1.0 0.1 1.0 1.0 1.0
Lithuania 0.7 3.2 5.2 6.2 4.6 3.8 2.4 1.9 2.0 2.0 2.0 2.0
1.0 3.6 3.6 4.6 3.6 2.5 1.7 1.1 1.2 1.9 2.2 2.1
0.1 0.1 0.5 2.3 1.8 1.7 1.6 1.5 1.5 1.5 1.5 1.5
1.8 1.8 2.4 2.7 2.9 2.5 1.6 1.8 1.3 1.3 1.6 1.6
1.5 2.6 3.1 3.4 3.2 2.8 2.2 1.7 2.3 2.1 1.7 1.7
0.2 -0.1 1.2 1.8 1.9 1.9 1.6 1.3 1.3 1.2 1.2 1.1
-0.6 2.1 2.3 3.0 2.5 2.4 1.9 1.7 1.7 1.7 1.6 1.7
1.0 2.1 3.4 4.5 5.7 5.0 3.9 2.8 2.1 2.2 2.2 2.2
1.1 2.1 1.9 2.0 2.2 2.0 1.7 1.8 1.9 1.9 1.9 1.9
1.1 1.8 2.8 3.7 3.0 2.5 1.9 1.4 1.4 1.4 1.4 1.5
0.2 2.2 2.9 4.1 4.2 3.5 2.4 1.8 1.5 1.7 1.9 2.0
2.2 2.8 3.3 4.9 4.2 3.8 3.2 2.6 2.5 2.5 2.3 2.1
0.6 1.7 2.0 2.6 2.2 2.0 1.7 1.5 1.6 1.6 1.6 1.6
0.7 2.2 3.1 2.8 2.4 2.1 1.7 1.7 1.5 1.5 1.6 1.5
3.3 5.3 5.0 6.7 6.1 5.2 4.4 3.5 3.4 3.4 3.3 3.3
3.9 4.6 5.1 6.2 6.3 6.1 4.9 3.7 2.6 2.3 2.6 2.9
2.3 3.1 4.3 6.4 5.3 3.8 3.6 3.5 3.0 2.9 2.7 2.7
1.9 2.3 2.5 3.0 2.6 2.1 1.7 1.3 1.0 1.1 1.1 1.2
1.4 2.2 3.1 3.9 3.2 2.7 2.1 1.5 1.5 1.5 1.6 1.6
0.9 2.1 2.8 4.0 3.9 4.0 2.9 2.2 2.4 2.1 2.1 2.1
-0.5 -0.7 -0.6 0.0 -0.2 0.4 0.4 0.4 0.4 0.4 0.5 0.6
1.9 4.8 5.3 5.4 5.0 3.5 2.4 2.3 2.2 2.2 2.2 2.2
Luxembourg
Harmonised index of consumer prices (national index if not available), (percentage change on preceding year, 2021-23)
Belgium
Germany
Estonia
Ireland
Greece
Spain
France
Italy
Cyprus
Latvia
Croatia
Malta
Netherlands
Austria
Portugal
Slovenia
Slovakia
Finland
Euro area
Bulgaria
Denmark
Czechia
Japan
United States
Hungary
Poland
Romania
Sweden
EU
United Kingdom

Statistical Annex
163
Table 19: 25.10.2021
5-year
2003 - 07 2008 - 12 2013 - 17 2018 2019 2020 2021 2022 2023 2020 2021 2022
1.8 2.1 -1.0 3.0 0.5 -2.2 7.2 1.2 1.1 -3.1 3.0 1.5
0.3 1.1 0.0 0.9 0.4 -0.7 4.2 5.1 1.4 -0.7 1.7 0.8
3.2 2.6 -0.2 2.4 -0.4 -2.0 4.6 3.2 1.9 -2.0 0.7 1.4
-1.0 0.5 0.1 -3.8 2.1 -7.0 -0.8 2.1 1.3 -6.5 0.9 1.3
2.1 1.2 -3.3 5.8 -0.5 -12.8 6.0 2.5 2.2 -13.1 6.0 2.0
2.2 2.0 -0.3 2.1 0.1 -1.2 7.0 2.5 1.5 -1.0 1.3 1.1
0.8 1.1 -0.3 0.7 1.1 -1.5 4.4 2.9 1.0 -1.7 2.7 0.8
1.4 1.7 0.0 2.0 0.6 -0.5 3.8 1.6 2.2 -0.5 1.6 1.5
3.2 1.8 0.8 0.6 0.7 -1.2 4.7 2.7 1.6 0.5 1.7 1.5
11.0 4.3 0.4 3.2 -0.2 -1.1 8.0 4.0 2.0 -1.1 1.3 1.9
Lithuania 5.2 4.5 -2.0 3.7 -0.1 -5.0 3.6 2.1 1.1 -5.0 2.5 1.0
4.5 3.2 0.5 2.6 -0.4 -0.2 5.0 1.2 1.0 -4.1 4.0 2.1
1.1 0.0 -0.6 3.1 1.1 -0.4 3.5 2.5 2.0 -0.7 1.0 1.0
1.5 2.1 -1.4 2.1 -0.2 -3.7 7.1 1.0 0.3 -3.7 1.2 1.6
1.4 1.4 -0.4 1.8 -1.0 -1.2 2.4 1.4 1.4 -0.9 0.3 1.1
1.4 1.6 -1.3 2.2 -0.3 -2.5 4.3 2.3 1.3 -2.2 1.1 1.2
2.4 1.2 -0.3 2.7 -0.6 -2.0 3.9 3.6 1.9 -2.0 0.7 1.5
1.6 0.6 -1.3 1.6 -0.3 -2.7 4.9 6.7 1.5 -2.7 0.5 1.0
0.3 0.3 -1.0 5.0 -0.9 -5.8 5.7 3.5 1.8 -6.1 1.4 1.6
1.0 1.4 -0.4 1.3 0.4 -2.0 4.6 3.0 1.3 -2.1 1.7 1.1
12.0 3.8 -0.6 2.8 1.7 -2.0 16.0 4.0 3.0 -1.7 3.0 3.0
-0.2 -0.4 0.0 -0.7 1.0 1.0 3.6 1.7 1.6 0.4 -1.6 0.5
2.2 2.5 -0.6 1.1 -0.2 -1.5 2.3 2.6 1.3 -1.5 1.2 1.5
3.4 3.1 -1.6 0.7 0.5 -4.1 3.2 1.9 1.4 -4.1 1.5 1.3
-0.2 2.2 0.2 2.9 1.7 4.7 4.5 1.0 1.0 4.8 3.5 1.0
3.4 4.6 0.8 1.6 3.2 2.6 8.9 5.4 2.7 2.0 2.5 2.5
9.3 8.4 -2.8 5.4 2.2 1.2 5.0 3.5 2.5 1.2 2.8 1.7
0.8 0.2 0.5 5.6 3.4 -4.6 3.0 1.4 1.6 -4.5 0.8 1.8
1.1 1.6 -0.3 1.5 0.7 -1.6 4.7 3.0 1.4 -1.7 1.7 1.2
1.4 5.1 0.2 3.6 2.0 -3.2 0.5 2.5 1.5 -3.3 0.5 1.0
0.2 -4.5 1.7 0.8 -3.8 -5.0 8.0 1.5 0.0 -5.0 3.0 2.0
2.9 1.9 -2.1 3.6 -1.6 -4.0 12.6 3.4 2.0 -4.3 2.5 2.0
Price deflator of exports of goods in national currency (percentage change on preceding year, 2003-2023)
Autumn 2021 Spring 2021
averages forecast forecast
Malta
Belgium
Germany
Estonia
Ireland
Greece
Spain
France
Italy
Cyprus
Latvia
Luxembourg
Hungary
Netherlands
Austria
Portugal
Slovenia
Slovakia
Finland
Euro area
Bulgaria
Czechia
Denmark
Croatia
United States
Poland
Romania
Sweden
EU
United Kingdom
Japan
Table 20: 25.10.2021
5-year
2003 - 07 2008 - 12 2013 - 17 2018 2019 2020 2021 2022 2023 2020 2021 2022
2.3 3.0 -1.7 4.0 -0.4 -2.9 7.8 1.0 0.9 -3.3 3.2 1.5
0.6 1.4 -1.4 1.9 -0.6 -3.5 7.7 5.9 1.2 -3.4 3.9 0.8
1.5 3.2 -0.8 2.4 0.2 -3.1 5.8 3.6 1.7 -3.1 1.0 1.5
0.5 0.3 0.1 2.7 -2.7 -5.3 0.8 2.6 1.4 -2.9 1.7 1.8
2.5 2.7 -4.0 7.2 0.9 -9.0 7.9 3.5 3.2 -10.5 7.0 2.9
2.0 3.0 -0.6 2.9 0.6 -3.9 8.0 2.6 1.6 -2.7 1.6 1.3
1.1 1.7 -1.7 2.3 -0.1 -2.6 5.9 3.9 0.3 -3.1 4.1 0.7
2.8 2.9 -2.2 3.2 -0.9 -4.9 7.2 3.7 1.7 -5.0 3.0 1.4
2.7 2.2 -1.5 2.1 1.0 -0.4 4.7 2.7 1.6 -1.9 1.7 1.5
8.4 4.7 -1.0 1.6 -1.1 -4.2 10.0 6.0 3.5 -4.2 2.1 1.8
Lithuania 3.8 4.8 -3.0 4.7 -1.4 -6.4 8.5 2.2 1.1 -6.4 4.0 1.8
3.3 2.8 -0.4 3.4 -0.2 -3.6 5.7 1.0 1.0 -3.7 4.0 2.2
0.7 1.2 -1.0 -0.9 1.1 -1.3 3.5 2.5 2.0 -1.0 0.5 0.8
1.4 2.8 -2.1 2.2 -1.1 -5.1 8.3 1.2 0.1 -5.3 1.5 1.5
1.7 2.2 -0.8 2.3 -0.1 -2.3 4.6 2.4 1.7 -2.1 1.1 0.9
1.6 1.7 -2.3 2.9 -0.7 -4.0 4.6 2.3 1.3 -4.3 2.0 1.0
3.1 2.4 -1.0 2.8 -1.0 -2.8 4.6 3.9 1.9 -3.1 0.2 1.8
2.1 2.0 -1.0 2.5 0.1 -2.3 6.7 5.1 1.4 -2.3 0.4 1.0
2.9 1.3 -2.0 4.1 0.0 -7.0 5.9 3.6 1.7 -7.3 1.6 1.4
1.6 2.2 -1.6 2.6 -0.5 -3.8 7.0 3.7 1.1 -3.8 3.0 1.1
6.8 3.5 -1.5 2.2 -0.1 -6.0 14.5 6.0 2.0 -5.9 3.8 2.4
0.3 0.5 -0.7 -0.6 0.6 -1.0 3.1 2.5 1.0 -1.3 -0.9 1.0
1.0 2.3 -1.3 2.8 -0.1 -2.9 5.0 3.5 1.6 -3.2 1.1 1.3
1.6 2.5 -0.5 1.1 0.2 -0.3 3.4 1.7 1.3 -0.3 2.0 1.3
0.8 2.8 -0.5 4.0 1.2 2.7 6.5 1.9 0.5 2.8 4.6 1.0
2.6 5.1 -0.8 2.9 1.7 -0.4 8.8 5.1 2.0 -0.6 3.5 3.6
2.6 8.5 -2.4 4.8 0.2 -2.2 7.0 4.0 2.0 -2.2 2.7 2.0
1.4 0.2 -0.1 6.7 2.3 -5.3 4.5 3.4 1.7 -5.2 0.9 1.3
1.5 2.3 -1.5 2.7 -0.2 -3.4 6.9 3.7 1.2 -3.4 2.8 1.3
0.5 4.4 -0.2 2.8 0.9 -0.9 1.5 2.5 1.5 -0.8 0.5 1.0
5.9 -1.3 -0.4 6.1 -4.7 -5.0 5.4 2.0 0.8 -5.0 4.0 1.5
4.1 2.3 -3.0 2.8 -2.1 -2.8 7.0 2.6 1.6 -2.7 1.8 2.0
Price deflator of imports of goods in national currency (percentage change on preceding year, 2003-2023)
Autumn 2021 Spring 2021
averages forecast forecast
Malta
Belgium
Germany
Estonia
Ireland
Greece
Spain
France
Italy
Cyprus
Latvia
Luxembourg
Hungary
Netherlands
Austria
Portugal
Slovenia
Slovakia
Finland
Euro area
Bulgaria
Czechia
Denmark
Croatia
United States
Poland
Romania
Sweden
EU
United Kingdom
Japan

European Economic Forecast, Autumn 2021
164
Table 21: 25.10.2021
5-year
2003 - 07 2008 - 12 2013 - 17 2018 2019 2020 2021 2022 2023 2020 2021 2022
-0.6 -0.9 0.7 -1.0 0.9 0.7 -0.6 0.2 0.1 0.2 -0.2 0.0
-0.3 -0.4 1.4 -1.0 1.1 2.9 -3.2 -0.7 0.2 2.9 -2.2 0.1
1.6 -0.6 0.7 0.0 -0.7 1.1 -1.1 -0.4 0.2 1.1 -0.3 -0.1
-1.6 0.2 0.0 -6.4 4.9 -1.8 -1.6 -0.5 -0.1 -3.7 -0.8 -0.5
-0.3 -1.5 0.8 -1.2 -1.4 -4.1 -1.8 -1.0 -1.0 -2.8 -0.9 -0.9
0.3 -1.0 0.3 -0.7 -0.5 2.8 -0.9 -0.1 -0.1 1.7 -0.3 -0.2
-0.3 -0.6 1.4 -1.5 1.3 1.1 -1.5 -0.9 0.6 1.4 -1.4 0.1
-1.4 -1.1 2.3 -1.2 1.5 4.6 -3.2 -2.0 0.5 4.7 -1.3 0.0
0.5 -0.4 2.3 -1.4 -0.3 -0.8 0.0 0.0 0.0 2.4 0.0 0.0
2.4 -0.4 1.4 1.6 0.9 3.2 -1.8 -1.9 -1.4 3.2 -0.8 0.1
Lithuania 1.4 -0.4 1.0 -1.0 1.3 1.5 -4.6 -0.1 0.0 1.5 -1.4 -0.8
1.1 0.4 0.9 -0.7 -0.2 3.6 -0.7 0.2 0.0 -0.4 0.0 -0.1
0.4 -1.2 0.3 4.0 0.0 0.9 0.0 0.0 0.0 0.3 0.5 0.2
0.1 -0.7 0.7 -0.2 0.9 1.5 -1.1 -0.2 0.2 1.7 -0.3 0.1
-0.3 -0.8 0.4 -0.6 -0.9 1.2 -2.1 -0.9 -0.2 1.3 -0.8 0.2
-0.2 0.0 1.0 -0.8 0.4 1.6 -0.3 0.0 0.0 2.1 -0.9 0.2
-0.7 -1.1 0.6 -0.1 0.4 0.8 -0.7 -0.3 0.0 1.2 0.5 -0.3
-0.5 -1.3 -0.3 -0.9 -0.3 -0.5 -1.7 1.6 0.1 -0.5 0.1 0.0
-2.5 -1.0 1.1 0.8 -0.9 1.4 -0.2 -0.1 0.1 1.2 -0.1 0.2
-0.6 -0.7 1.2 -1.3 0.9 1.8 -2.3 -0.6 0.2 1.7 -1.2 0.0
4.9 0.3 0.9 0.7 1.9 4.3 1.3 -1.9 1.0 4.4 -0.8 0.6
-0.5 -0.9 0.7 -0.2 0.4 2.0 0.5 -0.8 0.6 1.7 -0.7 -0.5
1.2 0.3 0.8 -1.6 -0.1 1.5 -2.6 -0.9 -0.3 1.7 0.1 0.2
1.8 0.6 -1.1 -0.5 0.3 -3.8 -0.2 0.2 0.1 -3.8 -0.5 0.0
-1.0 -0.6 0.7 -1.0 0.5 2.0 -1.9 -0.9 0.5 1.9 -1.1 0.0
0.8 -0.4 1.6 -1.2 1.5 3.0 0.1 0.3 0.6 2.6 -1.0 -1.1
6.6 -0.1 -0.3 0.6 2.1 3.4 -1.9 -0.5 0.5 3.4 0.1 -0.3
-0.5 0.0 0.6 -1.0 1.1 0.8 -1.4 -1.9 -0.1 0.8 -0.1 0.5
-0.4 -0.7 1.1 -1.2 0.9 1.8 -2.0 -0.6 0.2 1.8 -1.1 0.0
0.9 0.6 0.3 0.8 1.1 -2.4 -1.0 0.0 0.0 -2.6 0.0 0.0
-5.4 -3.3 2.1 -5.0 0.9 0.0 2.5 -0.5 -0.8 0.0 -1.0 0.5
-1.1 -0.4 1.0 0.8 0.6 -1.2 5.2 0.8 0.4 -1.6 0.6 0.0
Terms of trade of goods (percentage change on preceding year, 2003-2023)
Autumn 2021 Spring 2021
averages forecast forecast
Malta
Belgium
Germany
Estonia
Ireland
Greece
Spain
France
Italy
Cyprus
Latvia
Luxembourg
Hungary
Netherlands
Austria
Portugal
Slovenia
Slovakia
Finland
Euro area
Bulgaria
Czechia
Denmark
Croatia
United States
Poland
Romania
Sweden
EU
United Kingdom
Japan
Table 22: 25.10.2021
5-year
2003 - 07 2008 - 12 2013 - 17 2018 2019 2020 2021 2022 2023 2020 2021 2022
0.6 0.9 0.5 0.5 0.5 0.3 0.4 0.4 0.4 0.4 0.2 0.4
-0.1 -0.1 0.5 0.3 0.2 0.1 0.0 0.1 0.1 0.1 0.1 0.1
-0.6 -0.3 -0.1 0.3 0.4 0.3 0.0 -0.1 -0.1 0.3 0.0 -0.1
2.3 0.9 0.9 1.2 1.4 1.1 1.1 1.1 1.2 1.1 1.1 1.0
0.3 0.0 -0.5 -0.2 -0.1 0.0 -0.3 -0.3 -0.4 -0.1 -0.9 -0.7
1.8 0.7 -0.1 0.4 0.8 0.5 0.6 0.7 0.8 0.5 0.5 0.5
0.7 0.5 0.4 0.4 0.3 0.3 0.3 0.3 0.3 0.3 0.3 0.3
0.6 0.5 -0.1 -0.2 -0.2 -0.5 0.0 -0.1 -0.1 -0.5 0.0 -0.1
1.6 2.4 -0.1 1.2 1.4 1.1 1.1 1.1 1.1 1.0 1.1 1.1
-1.0 -1.6 -0.9 -0.8 -0.7 -0.6 -0.5 -0.5 -0.5 -0.6 -0.5 -0.5
Lithuania -1.3 -1.6 -1.1 -0.9 -0.3 0.0 -0.2 -0.6 -0.6 0.0 -0.2 -0.6
1.5 2.0 2.4 2.0 2.1 1.5 2.0 2.0 2.0 1.5 2.0 2.0
0.5 0.6 2.2 3.6 4.0 2.2 2.6 2.6 2.6 2.2 2.6 2.6
0.3 0.5 0.4 0.6 0.7 0.6 0.4 0.5 0.5 0.6 0.4 0.5
0.5 0.3 0.9 0.5 0.5 0.4 0.4 0.4 0.4 0.5 0.4 0.4
0.2 -0.1 -0.4 -0.2 0.0 0.1 0.1 0.1 0.1 0.2 0.1 0.1
0.2 0.4 0.1 0.3 0.8 0.7 0.2 0.2 0.2 0.7 0.2 0.2
0.1 0.0 0.1 0.1 0.1 0.1 0.1 0.1 0.1 0.1 0.1 0.1
0.3 0.5 0.3 0.1 0.1 0.2 0.1 0.1 0.1 0.2 0.1 0.1
0.5 0.3 0.2 0.2 0.3 0.1 0.2 0.2 0.2 0.1 0.2 0.2
-0.5 -0.9 -0.6 -0.7 -0.7 -0.6 -0.6 -0.6 -0.6 -0.6 -0.6 -0.6
0.2 0.4 0.2 0.3 0.4 0.3 0.2 0.2 0.2 0.3 0.1 0.0
0.3 0.5 0.6 0.5 0.4 0.2 0.3 0.4 0.4 0.2 0.4 0.4
0.0 -0.2 -0.7 -0.9 -0.6 -0.4 -0.5 -0.5 -0.5 -0.4 -0.2 -0.1
-0.2 -0.3 -0.3 -0.1 0.0 -0.2 -0.2 -0.2 -0.2 -0.2 -0.2 -0.2
-0.1 0.2 -0.1 0.0 -0.1 -0.1 -0.1 -0.1 -0.2 -0.1 -0.1 -0.2
-0.7 -0.8 -0.5 -0.6 -0.5 -0.6 -0.8 -0.6 -0.6 -0.2 -0.8 -0.6
0.5 0.8 1.1 1.2 1.0 0.7 0.3 0.3 0.3 0.7 0.4 0.4
0.4 0.2 0.2 0.2 0.2 0.1 0.1 0.1 0.1 0.1 0.1 0.1
0.6 0.8 0.7 0.6 0.5 0.4 0.3 0.3 0.3 0.4 0.4 0.4
0.1 -0.1 -0.1 -0.2 -0.2 -0.4 -0.2 -0.2 0.0 -0.2 -0.2 -0.2
0.9 0.8 0.7 0.5 0.5 0.5 0.5 0.5 0.5 0.5 0.7 0.7
Total population (percentage change on preceding year, 2003-2023)
Autumn 2021 Spring 2021
averages forecast forecast
Malta
Belgium
Germany
Estonia
Ireland
Greece
Spain
France
Italy
Cyprus
Latvia
Luxembourg
Hungary
Netherlands
Austria
Portugal
Slovenia
Slovakia
Finland
Euro area
Bulgaria
Czechia
Denmark
Croatia
United States
Poland
Romania
Sweden
EU
United Kingdom
Japan

Statistical Annex
165
Table 23: 25.10.2021
5-year
2003 - 07 2008 - 12 2013 - 17 2018 2019 2020 2021 2022 2023 2020 2021 2022
1.0 0.8 0.8 1.5 1.6 0.0 0.9 0.4 1.2 0.0 -0.6 0.8
0.3 0.9 1.0 1.4 0.9 -0.8 0.0 0.9 0.4 -1.1 -0.2 0.9
1.8 -1.4 1.6 0.9 1.3 -2.7 0.2 1.4 0.6 -2.7 -0.8 1.7
3.8 -3.0 3.2 3.2 2.9 -1.5 3.0 1.7 1.7 -1.5 -3.5 5.0
1.6 -2.0 0.6 4.6 0.9 -1.2 1.1 1.1 1.0 -1.3 0.4 0.7
3.7 -2.9 1.2 2.2 2.8 -4.1 2.3 1.7 1.4 -4.2 0.2 2.0
0.7 0.1 0.5 1.0 1.2 -0.9 1.4 0.6 0.5 -1.1 0.3 1.2
1.2 -0.4 0.3 0.9 0.5 -2.1 -0.3 1.0 0.7 -2.1 -0.3 0.9
3.5 0.2 0.8 5.3 3.8 -0.6 1.2 2.2 2.3 -0.6 0.6 1.0
2.3 -3.8 0.4 1.5 -0.1 -2.3 1.2 0.5 0.3 -2.3 0.1 1.8
Lithuania 0.7 -2.4 1.3 1.4 0.6 -1.6 0.6 0.5 0.0 -1.5 0.4 0.8
3.1 2.6 2.7 3.6 3.5 1.9 2.9 3.4 3.2 2.0 1.9 2.0
1.0 2.0 5.4 6.0 5.7 2.7 2.4 2.5 2.5 2.6 1.1 1.9
0.8 0.2 0.7 2.7 2.0 -0.5 0.9 1.1 0.3 -0.6 -0.2 0.2
1.2 0.9 1.0 1.7 1.1 -1.6 1.7 1.9 0.6 -1.7 1.2 1.3
-0.3 -2.0 1.0 2.3 0.8 -1.9 1.8 0.8 0.5 -1.7 1.0 1.2
0.9 -0.8 1.1 3.2 2.5 -0.6 1.1 1.3 1.4 -1.0 0.9 2.0
1.3 0.3 1.4 2.0 1.0 -1.9 0.3 1.2 1.0 -1.9 -0.6 0.8
1.3 0.3 0.0 2.5 1.8 -2.1 2.0 1.5 0.7 -1.5 0.9 1.1
1.2 -0.4 0.8 1.6 1.3 -1.5 0.8 1.0 0.7 -1.6 0.0 1.2
3.0 -1.6 0.5 -0.1 0.3 -2.3 0.0 0.9 0.6 -2.3 0.6 1.3
0.9 -0.1 1.1 1.3 0.2 -1.7 0.5 0.5 0.4 -1.5 -1.5 0.3
0.9 -1.0 1.1 1.5 1.4 -0.7 1.7 1.3 1.0 -0.7 0.6 0.9
2.0 -2.0 0.8 2.6 3.1 -1.2 1.6 1.3 1.2 -1.2 0.6 1.4
0.0 -0.7 2.7 2.3 1.1 -1.0 3.0 2.0 0.8 -2.2 1.2 1.3
2.0 0.4 1.1 0.5 0.0 -0.1 0.3 0.1 0.0 0.1 0.0 0.2
-0.2 -1.8 0.0 0.1 0.1 -1.8 1.1 0.6 0.5 -1.8 0.2 0.7
0.6 0.5 1.6 1.6 0.6 -1.3 0.4 1.7 1.0 -1.3 0.5 1.3
1.1 -0.4 0.9 1.5 1.1 -1.4 0.8 1.0 0.6 -1.5 0.0 1.0
1.0 0.2 1.5 1.2 1.1 -0.5 0.0 0.9 1.0 -0.3 -0.9 0.1
0.6 -0.5 0.6 1.8 0.9 -2.0 0.6 0.6 0.6 -2.0 0.6 0.6
1.0 -0.6 1.6 1.7 1.2 -5.8 3.1 3.0 1.2 -6.2 4.3 3.2
Total employment in persons (percentage change on preceding year, 2003-2023)
Autumn 2021 Spring 2021
averages forecast forecast
Malta
Belgium
Germany
Estonia
Ireland
Greece
Spain
France
Italy
Cyprus
Latvia
Luxembourg
Hungary
Netherlands
Austria
Portugal
Slovenia
Slovakia
Finland
Euro area
Bulgaria
Czechia
Denmark
Croatia
United StatesNote: For the countries publishing also employment in full-time equivalents (see note 6) as well as the EU and EA aggregates, this table now also displays employment in persons, limiting the comparability to figures published in
previous forecasts.
Poland
Romania
Sweden
EU
United Kingdom
Japan
Table 24: 25.10.2021
5-year
2003 - 07 2008 - 12 2013 - 17 2018 2019 2020 2021 2022 2023 2020 2021 2022
3.0 -3.4 1.3 2.5 2.3 -7.6 4.5 2.8 2.3 -7.5 4.5 2.0
0.8 0.0 0.5 1.0 1.3 -0.9 1.4 0.6 0.5 -1.0 0.1 1.2
0.8 -1.0 0.1 0.8 0.1 -10.3 5.9 4.0 2.0 -10.3 5.4 2.2
0.7 0.0 0.8 2.6 2.0 -0.5 0.9 1.1 0.3 -0.6 -0.2 0.2
Euro area 0.9 -0.6 0.8 1.6 1.2 -2.9 2.0 1.6 1.0 -3.0 1.3 1.4
0.8 -0.6 0.8 1.5 1.0 -2.5 1.7 1.4 0.9 -2.5 1.0 1.2
Italy
Netherlands
EU
Total employment in full-time equivalents (percentage change on preceding year, 2003-2023)
averages
Spring 2021
forecast
Autumn 2021
forecast
Spain
France
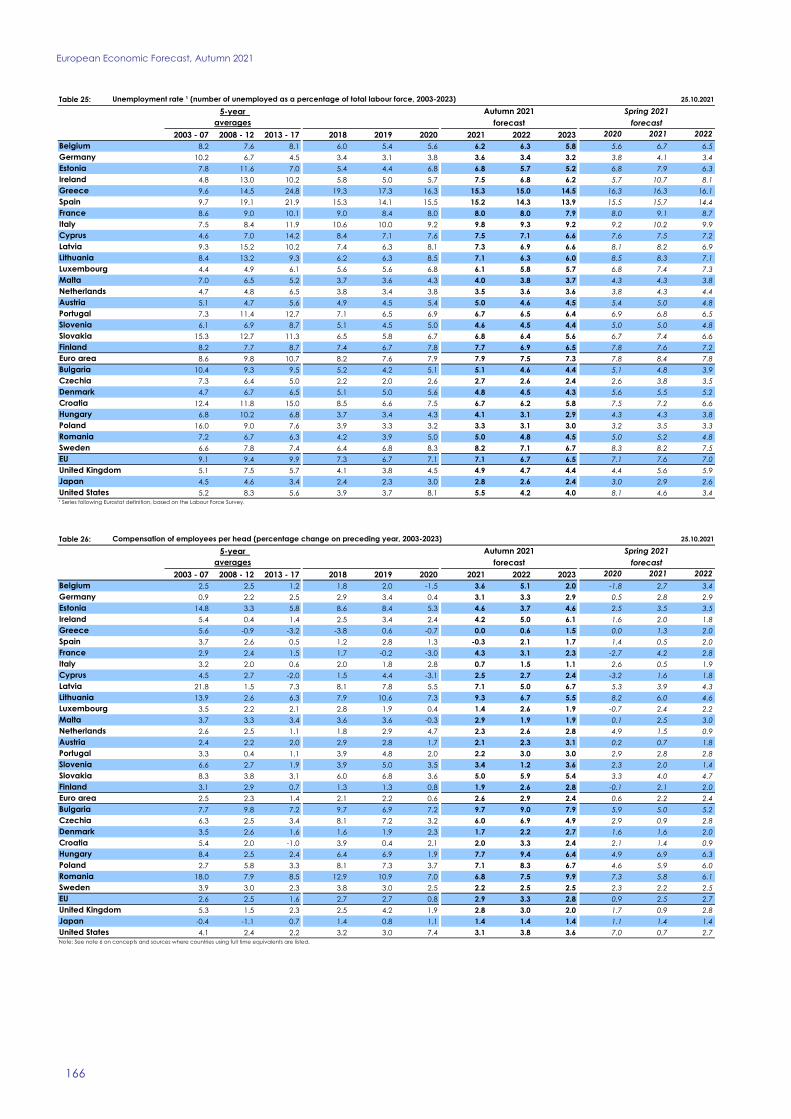
European Economic Forecast, Autumn 2021
166
Table 25: 25.10.2021
5-year
2003 - 07 2008 - 12 2013 - 17 2018 2019 2020 2021 2022 2023 2020 2021 2022
8.2 7.6 8.1 6.0 5.4 5.6 6.2 6.3 5.8 5.6 6.7 6.5
10.2 6.7 4.5 3.4 3.1 3.8 3.6 3.4 3.2 3.8 4.1 3.4
7.8 11.6 7.0 5.4 4.4 6.8 6.8 5.7 5.2 6.8 7.9 6.3
4.8 13.0 10.2 5.8 5.0 5.7 7.5 6.8 6.2 5.7 10.7 8.1
9.6 14.5 24.8 19.3 17.3 16.3 15.3 15.0 14.5 16.3 16.3 16.1
9.7 19.1 21.9 15.3 14.1 15.5 15.2 14.3 13.9 15.5 15.7 14.4
8.6 9.0 10.1 9.0 8.4 8.0 8.0 8.0 7.9 8.0 9.1 8.7
7.5 8.4 11.9 10.6 10.0 9.2 9.8 9.3 9.2 9.2 10.2 9.9
4.6 7.0 14.2 8.4 7.1 7.6 7.5 7.1 6.6 7.6 7.5 7.2
9.3 15.2 10.2 7.4 6.3 8.1 7.3 6.9 6.6 8.1 8.2 6.9
Lithuania 8.4 13.2 9.3 6.2 6.3 8.5 7.1 6.3 6.0 8.5 8.3 7.1
4.4 4.9 6.1 5.6 5.6 6.8 6.1 5.8 5.7 6.8 7.4 7.3
7.0 6.5 5.2 3.7 3.6 4.3 4.0 3.8 3.7 4.3 4.3 3.8
4.7 4.8 6.5 3.8 3.4 3.8 3.5 3.6 3.6 3.8 4.3 4.4
5.1 4.7 5.6 4.9 4.5 5.4 5.0 4.6 4.5 5.4 5.0 4.8
7.3 11.4 12.7 7.1 6.5 6.9 6.7 6.5 6.4 6.9 6.8 6.5
6.1 6.9 8.7 5.1 4.5 5.0 4.6 4.5 4.4 5.0 5.0 4.8
15.3 12.7 11.3 6.5 5.8 6.7 6.8 6.4 5.6 6.7 7.4 6.6
8.2 7.7 8.7 7.4 6.7 7.8 7.7 6.9 6.5 7.8 7.6 7.2
8.6 9.8 10.7 8.2 7.6 7.9 7.9 7.5 7.3 7.8 8.4 7.8
10.4 9.3 9.5 5.2 4.2 5.1 5.1 4.6 4.4 5.1 4.8 3.9
7.3 6.4 5.0 2.2 2.0 2.6 2.7 2.6 2.4 2.6 3.8 3.5
4.7 6.7 6.5 5.1 5.0 5.6 4.8 4.5 4.3 5.6 5.5 5.2
12.4 11.8 15.0 8.5 6.6 7.5 6.7 6.2 5.8 7.5 7.2 6.6
6.8 10.2 6.8 3.7 3.4 4.3 4.1 3.1 2.9 4.3 4.3 3.8
16.0 9.0 7.6 3.9 3.3 3.2 3.3 3.1 3.0 3.2 3.5 3.3
7.2 6.7 6.3 4.2 3.9 5.0 5.0 4.8 4.5 5.0 5.2 4.8
6.6 7.8 7.4 6.4 6.8 8.3 8.2 7.1 6.7 8.3 8.2 7.5
9.1 9.4 9.9 7.3 6.7 7.1 7.1 6.7 6.5 7.1 7.6 7.0
5.1 7.5 5.7 4.1 3.8 4.5 4.9 4.7 4.4 4.4 5.6 5.9
4.5 4.6 3.4 2.4 2.3 3.0 2.8 2.6 2.4 3.0 2.9 2.6
5.2 8.3 5.6 3.9 3.7 8.1 5.5 4.2 4.0 8.1 4.6 3.4
Unemployment rate ¹ (number of unemployed as a percentage of total labour force, 2003-2023)
Autumn 2021 Spring 2021
averages forecast forecast
Malta
Belgium
Germany
Estonia
Ireland
Greece
Spain
France
Italy
Cyprus
Latvia
Luxembourg
Hungary
Netherlands
Austria
Portugal
Slovenia
Slovakia
Finland
Euro area
Bulgaria
Czechia
Denmark
Croatia
United States¹ Series following Eurostat definition, based on the Labour Force Survey.
Poland
Romania
Sweden
EU
United Kingdom
Japan
Table 26: 25.10.2021
5-year
2003 - 07 2008 - 12 2013 - 17 2018 2019 2020 2021 2022 2023 2020 2021 2022
2.5 2.5 1.2 1.8 2.0 -1.5 3.6 5.1 2.0 -1.8 2.7 3.4
0.9 2.2 2.5 2.9 3.4 0.4 3.1 3.3 2.9 0.5 2.8 2.9
14.8 3.3 5.8 8.6 8.4 5.3 4.6 3.7 4.6 2.5 3.5 3.5
5.4 0.4 1.4 2.5 3.4 2.4 4.2 5.0 6.1 1.6 2.0 1.8
5.6 -0.9 -3.2 -3.8 0.6 -0.7 0.0 0.6 1.5 0.0 1.3 2.0
3.7 2.6 0.5 1.2 2.8 1.3 -0.3 2.1 1.7 1.4 0.5 2.0
2.9 2.4 1.5 1.7 -0.2 -3.0 4.3 3.1 2.3 -2.7 4.2 2.8
3.2 2.0 0.6 2.0 1.8 2.8 0.7 1.5 1.1 2.6 0.5 1.9
4.5 2.7 -2.0 1.5 4.4 -3.1 2.5 2.7 2.4 -3.2 1.6 1.8
21.8 1.5 7.3 8.1 7.8 5.5 7.1 5.0 6.7 5.3 3.9 4.3
Lithuania 13.9 2.6 6.3 7.9 10.6 7.3 9.3 6.7 5.5 8.2 6.0 4.6
3.5 2.2 2.1 2.8 1.9 0.4 1.4 2.6 1.9 -0.7 2.4 2.2
3.7 3.3 3.4 3.6 3.6 -0.3 2.9 1.9 1.9 0.1 2.5 3.0
2.6 2.5 1.1 1.8 2.9 4.7 2.3 2.6 2.8 4.9 1.5 0.9
2.4 2.2 2.0 2.9 2.8 1.7 2.1 2.3 3.1 0.2 0.7 1.8
3.3 0.4 1.1 3.9 4.8 2.0 2.2 3.0 3.0 2.9 2.8 2.8
6.6 2.7 1.9 3.9 5.0 3.5 3.4 1.2 3.6 2.3 2.0 1.4
8.3 3.8 3.1 6.0 6.8 3.6 5.0 5.9 5.4 3.3 4.0 4.7
3.1 2.9 0.7 1.3 1.3 0.8 1.9 2.6 2.8 -0.1 2.1 2.0
2.5 2.3 1.4 2.1 2.2 0.6 2.6 2.9 2.4 0.6 2.2 2.4
7.7 9.8 7.2 9.7 6.9 7.2 9.7 9.0 7.9 5.9 5.0 5.2
6.3 2.5 3.4 8.1 7.2 3.2 6.0 6.9 4.9 2.9 0.9 2.8
3.5 2.6 1.6 1.6 1.9 2.3 1.7 2.2 2.7 1.6 1.6 2.0
5.4 2.0 -1.0 3.9 0.4 2.1 2.0 3.3 2.4 2.1 1.4 0.9
8.4 2.5 2.4 6.4 6.9 1.9 7.7 9.4 6.4 4.9 6.9 6.3
2.7 5.8 3.3 8.1 7.3 3.7 7.1 8.3 6.7 4.6 5.9 6.0
18.0 7.9 8.5 12.9 10.9 7.0 6.8 7.5 9.9 7.3 5.8 6.1
3.9 3.0 2.3 3.8 3.0 2.5 2.2 2.5 2.5 2.3 2.2 2.5
2.6 2.5 1.6 2.7 2.7 0.8 2.9 3.3 2.8 0.9 2.5 2.7
5.3 1.5 2.3 2.5 4.2 1.9 2.8 3.0 2.0 1.7 0.9 2.8
-0.4 -1.1 0.7 1.4 0.8 1.1 1.4 1.4 1.4 1.1 1.4 1.4
4.1 2.4 2.2 3.2 3.0 7.4 3.1 3.8 3.6 7.0 0.7 2.7
Compensation of employees per head (percentage change on preceding year, 2003-2023)
Autumn 2021 Spring 2021
averages forecast forecast
Malta
Belgium
Germany
Estonia
Ireland
Greece
Spain
France
Italy
Cyprus
Latvia
Luxembourg
Hungary
Netherlands
Austria
Portugal
Slovenia
Slovakia
Finland
Euro area
Bulgaria
Czechia
Denmark
Croatia
United StatesNote: See note 6 on concepts and sources where countries using full time equivalents are listed.
Poland
Romania
Sweden
EU
United Kingdom
Japan
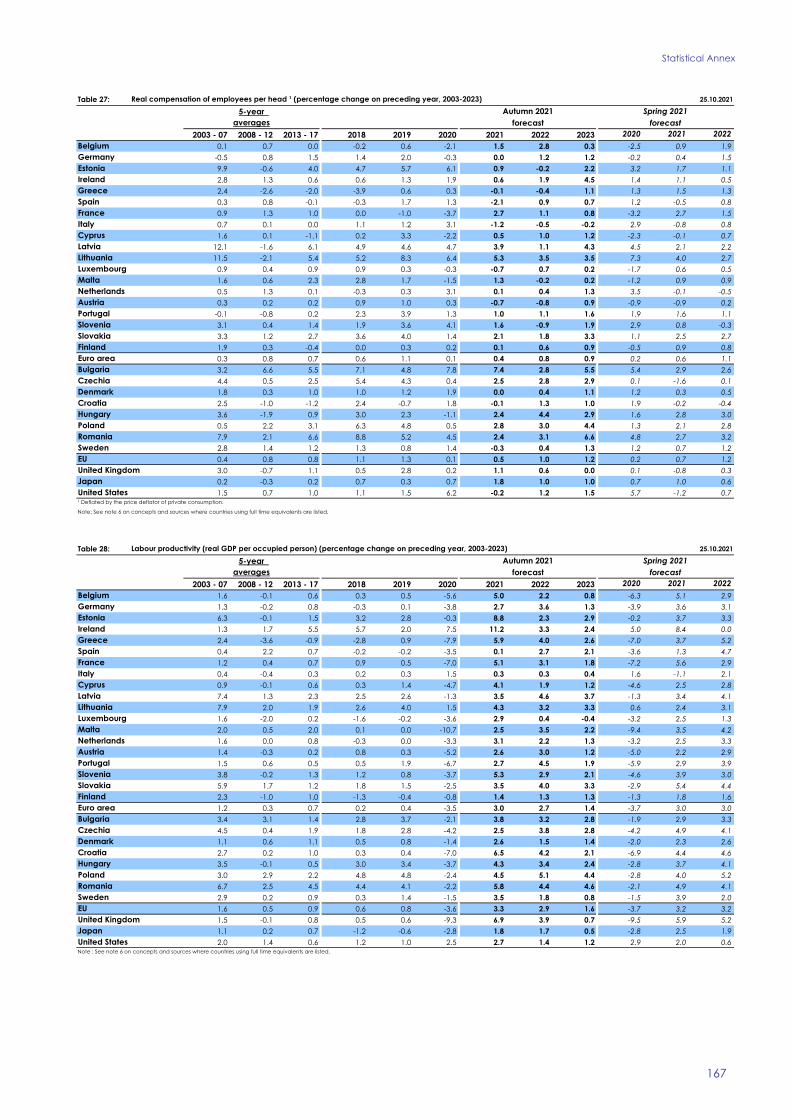
Statistical Annex
167
Table 27: 25.10.2021
5-year
2003 - 07 2008 - 12 2013 - 17 2018 2019 2020 2021 2022 2023 2020 2021 2022
0.1 0.7 0.0 -0.2 0.6 -2.1 1.5 2.8 0.3 -2.5 0.9 1.9
-0.5 0.8 1.5 1.4 2.0 -0.3 0.0 1.2 1.2 -0.2 0.4 1.5
9.9 -0.6 4.0 4.7 5.7 6.1 0.9 -0.2 2.2 3.2 1.7 1.1
2.8 1.3 0.6 0.6 1.3 1.9 0.6 1.9 4.5 1.4 1.1 0.5
2.4 -2.6 -2.0 -3.9 0.6 0.3 -0.1 -0.4 1.1 1.3 1.5 1.3
0.3 0.8 -0.1 -0.3 1.7 1.3 -2.1 0.9 0.7 1.2 -0.5 0.8
0.9 1.3 1.0 0.0 -1.0 -3.7 2.7 1.1 0.8 -3.2 2.7 1.5
0.7 0.1 0.0 1.1 1.2 3.1 -1.2 -0.5 -0.2 2.9 -0.8 0.8
1.6 0.1 -1.1 0.2 3.3 -2.2 0.5 1.0 1.2 -2.3 -0.1 0.7
12.1 -1.6 6.1 4.9 4.6 4.7 3.9 1.1 4.3 4.5 2.1 2.2
Lithuania 11.5 -2.1 5.4 5.2 8.3 6.4 5.3 3.5 3.5 7.3 4.0 2.7
0.9 0.4 0.9 0.9 0.3 -0.3 -0.7 0.7 0.2 -1.7 0.6 0.5
1.6 0.6 2.3 2.8 1.7 -1.5 1.3 -0.2 0.2 -1.2 0.9 0.9
0.5 1.3 0.1 -0.3 0.3 3.1 0.1 0.4 1.3 3.5 -0.1 -0.5
0.3 0.2 0.2 0.9 1.0 0.3 -0.7 -0.8 0.9 -0.9 -0.9 0.2
-0.1 -0.8 0.2 2.3 3.9 1.3 1.0 1.1 1.6 1.9 1.6 1.1
3.1 0.4 1.4 1.9 3.6 4.1 1.6 -0.9 1.9 2.9 0.8 -0.3
3.3 1.2 2.7 3.6 4.0 1.4 2.1 1.8 3.3 1.1 2.5 2.7
1.9 0.3 -0.4 0.0 0.3 0.2 0.1 0.6 0.9 -0.5 0.9 0.8
0.3 0.8 0.7 0.6 1.1 0.1 0.4 0.8 0.9 0.2 0.6 1.1
3.2 6.6 5.5 7.1 4.8 7.8 7.4 2.8 5.5 5.4 2.9 2.6
4.4 0.5 2.5 5.4 4.3 0.4 2.5 2.8 2.9 0.1 -1.6 0.1
1.8 0.3 1.0 1.0 1.2 1.9 0.0 0.4 1.1 1.2 0.3 0.5
2.5 -1.0 -1.2 2.4 -0.7 1.8 -0.1 1.3 1.0 1.9 -0.2 -0.4
3.6 -1.9 0.9 3.0 2.3 -1.1 2.4 4.4 2.9 1.6 2.8 3.0
0.5 2.2 3.1 6.3 4.8 0.5 2.8 3.0 4.4 1.3 2.1 2.8
7.9 2.1 6.6 8.8 5.2 4.5 2.4 3.1 6.6 4.8 2.7 3.2
2.8 1.4 1.2 1.3 0.8 1.4 -0.3 0.4 1.3 1.2 0.7 1.2
0.4 0.8 0.8 1.1 1.3 0.1 0.5 1.0 1.2 0.2 0.7 1.2
3.0 -0.7 1.1 0.5 2.8 0.2 1.1 0.6 0.0 0.1 -0.8 0.3
0.2 -0.3 0.2 0.7 0.3 0.7 1.8 1.0 1.0 0.7 1.0 0.6
1.5 0.7 1.0 1.1 1.5 6.2 -0.2 1.2 1.5 5.7 -1.2 0.7
Real compensation of employees per head ¹ (percentage change on preceding year, 2003-2023)
Autumn 2021 Spring 2021
averages forecast forecast
Malta
Belgium
Germany
Estonia
Ireland
Greece
Spain
France
Italy
Cyprus
Latvia
Luxembourg
Hungary
Netherlands
Austria
Portugal
Slovenia
Slovakia
Finland
Euro area
Bulgaria
Czechia
Denmark
Croatia
United States¹ Deflated by the price deflator of private consumption.
Note: See note 6 on concepts and sources where countries using full time equivalents are listed.
Poland
Romania
Sweden
EU
United Kingdom
Japan
Table 28: 25.10.2021
5-year
2003 - 07 2008 - 12 2013 - 17 2018 2019 2020 2021 2022 2023 2020 2021 2022
1.6 -0.1 0.6 0.3 0.5 -5.6 5.0 2.2 0.8 -6.3 5.1 2.9
1.3 -0.2 0.8 -0.3 0.1 -3.8 2.7 3.6 1.3 -3.9 3.6 3.1
6.3 -0.1 1.5 3.2 2.8 -0.3 8.8 2.3 2.9 -0.2 3.7 3.3
1.3 1.7 5.5 5.7 2.0 7.5 11.2 3.3 2.4 5.0 8.4 0.0
2.4 -3.6 -0.9 -2.8 0.9 -7.9 5.9 4.0 2.6 -7.0 3.7 5.2
0.4 2.2 0.7 -0.2 -0.2 -3.5 0.1 2.7 2.1 -3.6 1.3 4.7
1.2 0.4 0.7 0.9 0.5 -7.0 5.1 3.1 1.8 -7.2 5.6 2.9
0.4 -0.4 0.3 0.2 0.3 1.5 0.3 0.3 0.4 1.6 -1.1 2.1
0.9 -0.1 0.6 0.3 1.4 -4.7 4.1 1.9 1.2 -4.6 2.5 2.8
7.4 1.3 2.3 2.5 2.6 -1.3 3.5 4.6 3.7 -1.3 3.4 4.1
Lithuania 7.9 2.0 1.9 2.6 4.0 1.5 4.3 3.2 3.3 0.6 2.4 3.1
1.6 -2.0 0.2 -1.6 -0.2 -3.6 2.9 0.4 -0.4 -3.2 2.5 1.3
2.0 0.5 2.0 0.1 0.0 -10.7 2.5 3.5 2.2 -9.4 3.5 4.2
1.6 0.0 0.8 -0.3 0.0 -3.3 3.1 2.2 1.3 -3.2 2.5 3.3
1.4 -0.3 0.2 0.8 0.3 -5.2 2.6 3.0 1.2 -5.0 2.2 2.9
1.5 0.6 0.5 0.5 1.9 -6.7 2.7 4.5 1.9 -5.9 2.9 3.9
3.8 -0.2 1.3 1.2 0.8 -3.7 5.3 2.9 2.1 -4.6 3.9 3.0
5.9 1.7 1.2 1.8 1.5 -2.5 3.5 4.0 3.3 -2.9 5.4 4.4
2.3 -1.0 1.0 -1.3 -0.4 -0.8 1.4 1.3 1.3 -1.3 1.8 1.6
1.2 0.3 0.7 0.2 0.4 -3.5 3.0 2.7 1.4 -3.7 3.0 3.0
3.4 3.1 1.4 2.8 3.7 -2.1 3.8 3.2 2.8 -1.9 2.9 3.3
4.5 0.4 1.9 1.8 2.8 -4.2 2.5 3.8 2.8 -4.2 4.9 4.1
1.1 0.6 1.1 0.5 0.8 -1.4 2.6 1.5 1.4 -2.0 2.3 2.6
2.7 0.2 1.0 0.3 0.4 -7.0 6.5 4.2 2.1 -6.9 4.4 4.6
3.5 -0.1 0.5 3.0 3.4 -3.7 4.3 3.4 2.4 -2.8 3.7 4.1
3.0 2.9 2.2 4.8 4.8 -2.4 4.5 5.1 4.4 -2.8 4.0 5.2
6.7 2.5 4.5 4.4 4.1 -2.2 5.8 4.4 4.6 -2.1 4.9 4.1
2.9 0.2 0.9 0.3 1.4 -1.5 3.5 1.8 0.8 -1.5 3.9 2.0
1.6 0.5 0.9 0.6 0.8 -3.6 3.3 2.9 1.6 -3.7 3.2 3.2
1.5 -0.1 0.8 0.5 0.6 -9.3 6.9 3.9 0.7 -9.5 5.9 5.2
1.1 0.2 0.7 -1.2 -0.6 -2.8 1.8 1.7 0.5 -2.8 2.5 1.9
2.0 1.4 0.6 1.2 1.0 2.5 2.7 1.4 1.2 2.9 2.0 0.6
Labour productivity (real GDP per occupied person) (percentage change on preceding year, 2003-2023)
Autumn 2021 Spring 2021
averages forecast forecast
Malta
Belgium
Germany
Estonia
Ireland
Greece
Spain
France
Italy
Cyprus
Latvia
Luxembourg
Hungary
Netherlands
Austria
Portugal
Slovenia
Slovakia
Finland
Euro area
Bulgaria
Czechia
Denmark
Croatia
United StatesNote : See note 6 on concepts and sources where countries using full time equivalents are listed.
Poland
Romania
Sweden
EU
United Kingdom
Japan
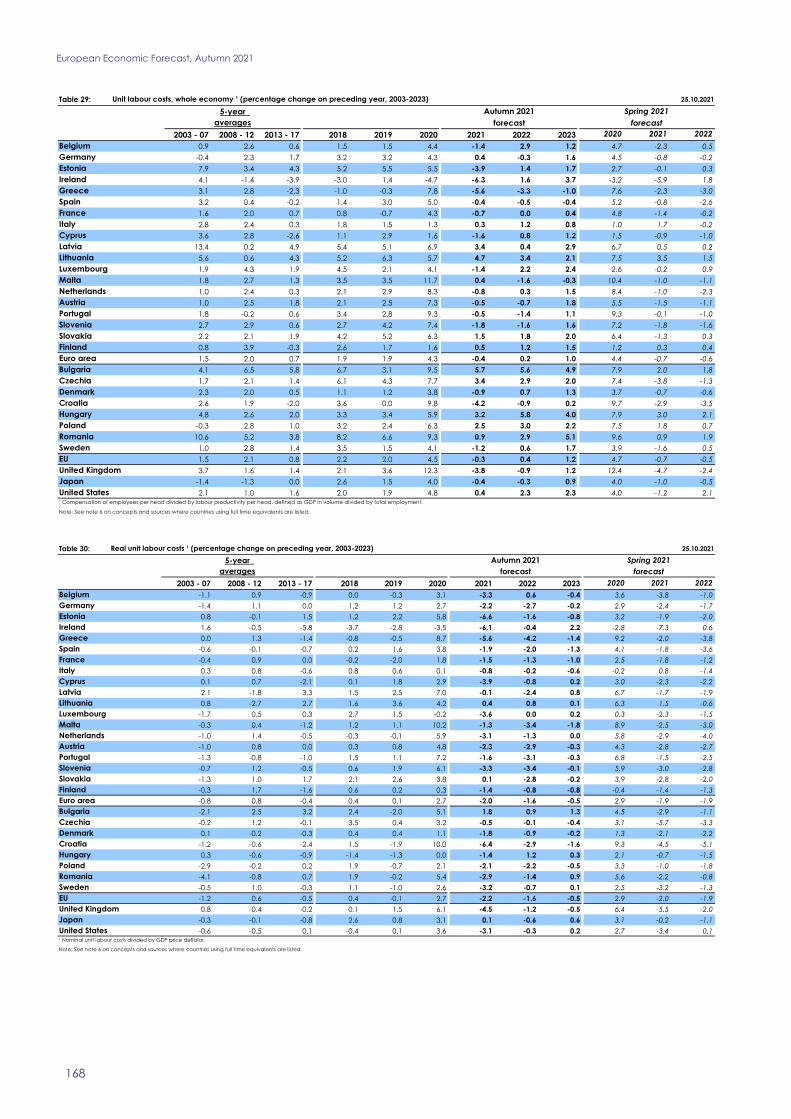
European Economic Forecast, Autumn 2021
168
Table 29: 25.10.2021
5-year
2003 - 07 2008 - 12 2013 - 17 2018 2019 2020 2021 2022 2023 2020 2021 2022
0.9 2.6 0.6 1.5 1.5 4.4 -1.4 2.9 1.2 4.7 -2.3 0.5
-0.4 2.3 1.7 3.2 3.2 4.3 0.4 -0.3 1.6 4.5 -0.8 -0.2
7.9 3.4 4.3 5.2 5.5 5.5 -3.9 1.4 1.7 2.7 -0.1 0.3
4.1 -1.4 -3.9 -3.0 1.4 -4.7 -6.3 1.6 3.7 -3.2 -5.9 1.8
3.1 2.8 -2.3 -1.0 -0.3 7.8 -5.6 -3.3 -1.0 7.6 -2.3 -3.0
3.2 0.4 -0.2 1.4 3.0 5.0 -0.4 -0.5 -0.4 5.2 -0.8 -2.6
1.6 2.0 0.7 0.8 -0.7 4.3 -0.7 0.0 0.4 4.8 -1.4 -0.2
2.8 2.4 0.3 1.8 1.5 1.3 0.3 1.2 0.8 1.0 1.7 -0.2
3.6 2.8 -2.6 1.1 2.9 1.6 -1.6 0.8 1.2 1.5 -0.9 -1.0
13.4 0.2 4.9 5.4 5.1 6.9 3.4 0.4 2.9 6.7 0.5 0.2
Lithuania 5.6 0.6 4.3 5.2 6.3 5.7 4.7 3.4 2.1 7.5 3.5 1.5
1.9 4.3 1.9 4.5 2.1 4.1 -1.4 2.2 2.4 2.6 -0.2 0.9
1.8 2.7 1.3 3.5 3.5 11.7 0.4 -1.6 -0.3 10.4 -1.0 -1.1
1.0 2.4 0.3 2.1 2.9 8.3 -0.8 0.3 1.5 8.4 -1.0 -2.3
1.0 2.5 1.8 2.1 2.5 7.3 -0.5 -0.7 1.8 5.5 -1.5 -1.1
1.8 -0.2 0.6 3.4 2.8 9.3 -0.5 -1.4 1.1 9.3 -0.1 -1.0
2.7 2.9 0.6 2.7 4.2 7.4 -1.8 -1.6 1.6 7.2 -1.8 -1.6
2.2 2.1 1.9 4.2 5.2 6.3 1.5 1.8 2.0 6.4 -1.3 0.3
0.8 3.9 -0.3 2.6 1.7 1.6 0.5 1.2 1.5 1.2 0.3 0.4
1.5 2.0 0.7 1.9 1.9 4.3 -0.4 0.2 1.0 4.4 -0.7 -0.6
4.1 6.5 5.8 6.7 3.1 9.5 5.7 5.6 4.9 7.9 2.0 1.8
1.7 2.1 1.4 6.1 4.3 7.7 3.4 2.9 2.0 7.4 -3.8 -1.3
2.3 2.0 0.5 1.1 1.2 3.8 -0.9 0.7 1.3 3.7 -0.7 -0.6
2.6 1.9 -2.0 3.6 0.0 9.8 -4.2 -0.9 0.2 9.7 -2.9 -3.5
4.8 2.6 2.0 3.3 3.4 5.9 3.2 5.8 4.0 7.9 3.0 2.1
-0.3 2.8 1.0 3.2 2.4 6.3 2.5 3.0 2.2 7.5 1.8 0.7
10.6 5.2 3.8 8.2 6.6 9.3 0.9 2.9 5.1 9.6 0.9 1.9
1.0 2.8 1.4 3.5 1.5 4.1 -1.2 0.6 1.7 3.9 -1.6 0.5
1.5 2.1 0.8 2.2 2.0 4.5 -0.3 0.4 1.2 4.7 -0.7 -0.5
3.7 1.6 1.4 2.1 3.6 12.3 -3.8 -0.9 1.2 12.4 -4.7 -2.4
-1.4 -1.3 0.0 2.6 1.5 4.0 -0.4 -0.3 0.9 4.0 -1.0 -0.5
2.1 1.0 1.6 2.0 1.9 4.8 0.4 2.3 2.3 4.0 -1.2 2.1
Unit labour costs, whole economy ¹ (percentage change on preceding year, 2003-2023)
Autumn 2021 Spring 2021
averages forecast forecast
Malta
Belgium
Germany
Estonia
Ireland
Greece
Spain
France
Italy
Cyprus
Latvia
Luxembourg
Hungary
Netherlands
Austria
Portugal
Slovenia
Slovakia
Finland
Euro area
Bulgaria
Czechia
Denmark
Croatia
United States¹ Compensation of employees per head divided by labour productivity per head, defined as GDP in volume divided by total employment.
Note: See note 6 on concepts and sources where countries using full time equivalents are listed.
Poland
Romania
Sweden
EU
United Kingdom
Japan
Table 30: 25.10.2021
5-year
2003 - 07 2008 - 12 2013 - 17 2018 2019 2020 2021 2022 2023 2020 2021 2022
-1.1 0.9 -0.9 0.0 -0.3 3.1 -3.3 0.6 -0.4 3.6 -3.8 -1.0
-1.4 1.1 0.0 1.2 1.2 2.7 -2.2 -2.7 -0.2 2.9 -2.4 -1.7
0.8 -0.1 1.5 1.2 2.2 5.8 -6.6 -1.6 -0.8 3.2 -1.9 -2.0
1.6 -0.5 -5.8 -3.7 -2.8 -3.5 -6.1 -0.4 2.2 -2.8 -7.3 0.6
0.0 1.3 -1.4 -0.8 -0.5 8.7 -5.6 -4.2 -1.4 9.2 -2.0 -3.8
-0.6 -0.1 -0.7 0.2 1.6 3.8 -1.9 -2.0 -1.3 4.1 -1.8 -3.6
-0.4 0.9 0.0 -0.2 -2.0 1.8 -1.5 -1.3 -1.0 2.5 -1.8 -1.2
0.3 0.8 -0.6 0.8 0.6 0.1 -0.8 -0.2 -0.6 -0.2 0.8 -1.4
0.1 0.7 -2.1 0.1 1.8 2.9 -3.9 -0.8 0.2 3.0 -2.3 -2.2
2.1 -1.8 3.3 1.5 2.5 7.0 -0.1 -2.4 0.8 6.7 -1.7 -1.9
Lithuania 0.8 -2.7 2.7 1.6 3.6 4.2 0.4 0.8 0.1 6.3 1.5 -0.6
-1.7 0.5 0.3 2.7 1.5 -0.2 -3.6 0.0 0.2 0.3 -2.3 -1.5
-0.3 0.4 -1.2 1.2 1.1 10.2 -1.3 -3.4 -1.8 8.9 -2.5 -3.0
-1.0 1.4 -0.5 -0.3 -0.1 5.9 -3.1 -1.3 0.0 5.8 -2.9 -4.0
-1.0 0.8 0.0 0.3 0.8 4.8 -2.3 -2.9 -0.3 4.3 -2.8 -2.7
-1.3 -0.8 -1.0 1.5 1.1 7.2 -1.6 -3.1 -0.3 6.8 -1.5 -2.5
-0.7 1.2 -0.5 0.6 1.9 6.1 -3.3 -3.4 -0.1 5.9 -3.0 -2.8
-1.3 1.0 1.7 2.1 2.6 3.8 0.1 -2.8 -0.2 3.9 -2.8 -2.0
-0.3 1.7 -1.6 0.6 0.2 0.3 -1.4 -0.8 -0.8 -0.4 -1.4 -1.3
-0.8 0.8 -0.4 0.4 0.1 2.7 -2.0 -1.6 -0.5 2.9 -1.9 -1.9
-2.1 2.5 3.2 2.4 -2.0 5.1 1.8 0.9 1.3 4.5 -2.9 -1.1
-0.2 1.2 -0.1 3.5 0.4 3.2 -0.5 -0.1 -0.4 3.1 -5.7 -3.3
0.1 -0.2 -0.3 0.4 0.4 1.1 -1.8 -0.9 -0.2 1.3 -2.1 -2.2
-1.2 -0.6 -2.4 1.5 -1.9 10.0 -6.4 -2.9 -1.6 9.3 -4.5 -5.1
0.3 -0.6 -0.9 -1.4 -1.3 0.0 -1.4 1.2 0.3 2.1 -0.7 -1.5
-2.9 -0.2 0.2 1.9 -0.7 2.1 -2.1 -2.2 -0.5 3.3 -1.0 -1.8
-4.1 -0.8 0.7 1.9 -0.2 5.4 -2.9 -1.4 0.9 5.6 -2.2 -0.8
-0.5 1.0 -0.3 1.1 -1.0 2.6 -3.2 -0.7 0.1 2.5 -3.2 -1.3
-1.2 0.6 -0.5 0.4 -0.1 2.7 -2.2 -1.6 -0.5 2.9 -2.0 -1.9
0.8 -0.4 -0.2 0.1 1.5 6.1 -4.5 -1.2 -0.5 6.4 -5.5 -2.0
-0.3 -0.1 -0.8 2.6 0.8 3.1 0.1 -0.6 0.6 3.1 -0.2 -1.1
-0.6 -0.5 0.1 -0.4 0.1 3.6 -3.1 -0.3 0.2 2.7 -3.4 0.1
Real unit labour costs ¹ (percentage change on preceding year, 2003-2023)
Autumn 2021 Spring 2021
averages forecast forecast
Malta
Belgium
Germany
Estonia
Ireland
Greece
Spain
France
Italy
Cyprus
Latvia
Luxembourg
Hungary
Netherlands
Austria
Portugal
Slovenia
Slovakia
Finland
Euro area
Bulgaria
Czechia
Denmark
Croatia
United States¹ Nominal unit labour costs divided by GDP price deflator.
Note: See note 6 on concepts and sources where countries using full time equivalents are listed.
Poland
Romania
Sweden
EU
United Kingdom
Japan

Statistical Annex
169
Table 31: 25.10.2021
5-year
2003 - 07 2008 - 12 2013 - 17 2018 2019 2020 2021 2022 2023 2020 2021 2022
: : : : : : : : : : : :
: : : : : : : : : : : :
: : : : : : : : : : : :
: : : : : : : : : : : :
: : : : : : : : : : : :
: : : : : : : : : : : :
: : : : : : : : : : : :
: : : : : : : : : : : :
: : : : : : : : : : : :
: : : : : : : : : : : :
Lithuania : : : : : : : : : : : :
: : : : : : : : : : : :
: : : : : : : : : : : :
: : : : : : : : : : : :
: : : : : : : : : : : :
: : : : : : : : : : : :
: : : : : : : : : : : :
: : : : : : : : : : : :
: : : : : : : : : : : :
: : : : : : : : : : : :
1.9539 1.9558 1.9558 1.9558 1.9558 1.9558 1.9558 1.9558 1.9558 1.9558 1.9558 1.9558
29.9139 25.2793 26.8296 25.6470 25.6705 26.4551 25.6512 25.3959 25.3959 26.4551 25.9383 25.8906
7.4464 7.4488 7.4511 7.4532 7.4661 7.4542 7.4377 7.4402 7.4402 7.4542 7.4367 7.4365
7.4257 7.3627 7.5647 7.4182 7.4180 7.5384 7.5274 7.5128 7.5128 7.5384 7.5695 7.5684
253.7460 274.9693 307.2067 318.8897 325.2967 351.2494 357.3237 359.5550 359.5550 351.2494 361.3937 361.5340
4.1254 4.0276 4.2372 4.2615 4.2976 4.4430 4.5565 4.5818 4.5818 4.4430 4.5539 4.5556
3.6573 4.1663 4.4735 4.6540 4.7453 4.8383 4.9210 4.9483 4.9483 4.8383 4.9140 4.9256
9.2070 9.4992 9.2410 10.2583 10.5891 10.4848 10.1397 10.0977 10.0977 10.4848 10.1307 10.1293
: : : : : : : : : : : : :
0.6841 0.8448 0.8155 0.8847 0.8778 0.8897 0.8598 0.8480 0.8480 0.8897 0.8684 0.8670
141.6677 121.8282 130.1375 130.3959 122.0058 121.8458 129.9894 130.5430 130.5430 121.8458 129.6960 130.3070
1.2490 1.3736 1.2005 1.1810 1.1195 1.1422 1.1865 1.1577 1.1577 1.1422 1.2028 1.2030United States
Poland
Romania
Sweden
EU
United Kingdom
Japan
Hungary
Netherlands
Austria
Portugal
Slovenia
Slovakia
Finland
Euro area
Bulgaria
Czechia
Denmark
Croatia
Malta
Belgium
Germany
Estonia
Ireland
Greece
Spain
France
Cyprus
Latvia
Luxembourg
Italy
Nominal bilateral exchange rates against ecu/euro (2003-2023)
Autumn 2021 Spring 2021
averages forecast forecast
Table 32:25.10.2021
5-year
2003 - 07 2008 - 12 2013 - 17 2018 2019 2020 2021 2022 2023 2020 2021 2022
1.4 -0.2 0.5 1.9 -0.6 1.2 0.6 -0.3 0.0 1.2 0.8 0.0
1.8 -0.5 0.6 2.5 -1.0 1.6 1.1 -0.5 0.0 1.6 1.4 0.1
1.1 -0.3 0.8 2.2 0.1 1.3 0.1 -0.3 0.0 1.3 0.2 0.0
2.5 -0.3 0.0 2.5 -2.0 1.3 1.1 -1.0 0.0 1.3 1.7 0.0
1.3 0.2 1.4 3.8 0.1 2.7 2.1 0.1 0.0 2.7 2.1 0.2
1.3 -0.1 0.6 2.2 -0.6 1.5 0.9 -0.3 0.0 1.5 1.0 0.1
1.7 -0.4 0.6 2.3 -1.0 1.4 1.0 -0.4 0.0 1.4 1.2 0.1
1.7 -0.4 0.6 2.6 -0.9 1.6 1.2 -0.4 0.0 1.6 1.5 0.1
1.2 0.0 0.5 2.8 -0.6 2.0 0.8 -0.4 0.0 2.0 0.9 0.1
-2.8 0.1 0.7 2.0 0.1 1.5 0.5 -0.2 0.0 1.5 0.6 0.1
Lithuania 1.3 0.0 0.7 2.1 -0.1 1.6 0.7 -0.2 0.0 1.6 0.8 0.1
0.8 0.0 0.5 1.3 -0.4 0.9 0.4 -0.2 0.0 0.9 0.6 0.0
1.7 -0.8 0.3 2.1 -1.2 1.1 1.2 -0.3 0.0 1.1 1.4 0.1
1.1 -0.1 0.5 1.7 -0.5 1.2 0.5 -0.3 0.0 1.2 0.7 0.0
1.0 -0.3 0.4 1.7 -0.6 1.2 0.7 -0.3 0.0 1.2 1.0 0.0
1.1 -0.1 0.4 1.5 -0.5 1.0 0.5 -0.3 0.0 1.0 0.7 0.0
-0.6 0.1 0.5 1.3 -0.1 1.2 0.6 -0.1 0.0 1.2 0.8 0.1
5.3 2.6 0.5 1.2 -0.1 1.3 0.5 -0.2 0.0 1.3 0.7 0.0
1.7 -0.6 0.9 2.5 -0.6 1.4 0.6 -0.4 0.0 1.4 0.8 0.0
1.7 -0.3 0.6 2.3 -0.9 1.5 0.9 -0.4 0.0 1.0 -2.7 0.1
1.2 0.6 1.3 3.9 0.6 2.9 2.2 0.3 0.0 2.9 2.1 0.2
2.7 2.2 -0.4 4.1 -0.2 -1.9 3.8 0.9 0.0 -1.9 2.7 0.2
1.4 -0.5 0.9 2.2 -0.7 1.6 0.4 -0.6 0.0 1.6 0.6 0.0
1.0 -0.6 0.8 2.5 -0.2 -0.2 1.1 0.1 0.0 -0.2 0.7 0.1
0.0 -2.6 -0.8 -1.6 -2.1 -6.3 -1.1 -0.7 0.0 -6.3 -2.1 0.0
1.3 -1.6 0.3 1.4 -1.0 -2.2 -2.2 -0.8 0.0 -2.2 -2.0 0.0
0.1 -5.3 0.4 0.2 -1.9 -0.3 -0.7 -0.6 0.0 -0.3 -0.5 -0.1
1.7 0.9 -1.2 -4.2 -3.7 2.8 3.7 -0.2 0.0 2.8 4.0 0.0
1.6 -0.4 0.5 2.0 -1.0 1.2 1.0 -0.4 0.0 1.5 -2.0 0.2
0.3 -4.1 -1.1 2.0 -0.4 0.2 5.1 0.9 0.0 0.2 4.3 0.3
-2.6 8.5 -3.8 0.6 4.6 2.0 -5.4 -1.5 0.0 2.0 -4.7 -0.5
-4.7 -0.4 5.3 -1.1 3.3 1.3 -3.9 1.9 0.0 1.3 -4.9 -0.1
Nominal effective exchange rates to rest of a group ¹ of industrialised countries (percentage change on preceding year, 2003-2023)
Autumn 2021 Spring 2021
averages forecast forecast
Malta
Belgium
Germany
Estonia
Ireland
Greece
Spain
France
Italy
Cyprus
Latvia
Luxembourg
Hungary
Netherlands
Austria
Portugal
Slovenia
Slovakia
Finland
Euro area
Bulgaria
Czechia
Denmark
Croatia
United States¹ 42 countries: EU-27, TR, CH, NO, US, UK, CA, JP, AU, MX, NZ, KO, CN, HK, RU and BR.
Poland
Romania
Sweden
EU
United Kingdom
Japan

European Economic Forecast, Autumn 2021
170
Table 33: 25.10.2021
5-year
2003 - 07 2008 - 12 2013 - 17 2018 2019 2020 2021 2022 2023 2020 2021 2022
49.9 54.2 54.1 52.2 51.8 59.2 56.7 54.2 53.8 60.0 57.6 54.7
46.1 46.1 44.4 44.3 45.0 50.8 52.3 47.4 46.0 51.1 53.5 48.3
34.0 40.4 38.9 39.4 39.4 45.9 43.5 42.6 42.1 45.1 46.7 42.8
33.5 48.6 32.3 25.3 24.2 27.4 25.0 22.9 21.4 28.4 28.0 25.7
46.4 53.9 53.2 48.5 47.9 59.8 57.9 50.8 48.3 60.7 59.2 52.2
38.7 45.7 43.7 41.7 42.1 52.4 50.9 47.2 44.9 52.3 49.2 46.2
53.0 56.1 56.9 55.6 55.4 61.6 60.1 56.4 54.7 62.1 60.6 56.2
47.2 49.7 50.0 48.4 48.5 57.1 56.2 52.7 51.0 57.3 58.7 52.6
38.9 41.3 41.4 42.7 38.4 45.1 44.9 40.9 40.0 46.3 47.4 43.8
34.9 42.1 38.4 39.3 38.2 43.1 47.6 43.0 40.6 43.6 46.9 41.7
Lithuania 34.3 40.8 34.6 34.0 34.8 42.9 41.1 40.9 39.1 43.5 44.2 42.4
41.4 41.2 40.7 42.1 42.9 47.2 44.6 44.1 44.1 47.8 44.0 43.3
42.5 41.5 38.0 35.7 35.9 45.9 47.2 42.4 41.3 46.6 48.7 42.4
43.1 46.5 44.6 42.2 42.0 48.0 48.2 45.0 43.7 48.1 48.4 43.9
51.2 51.8 50.9 48.7 48.6 57.1 55.0 50.8 50.0 57.9 56.0 51.3
45.6 49.3 48.0 43.2 42.5 49.3 49.1 46.6 45.6 48.4 48.2 45.8
45.8 49.0 50.0 43.5 43.3 51.3 50.9 48.7 47.3 52.0 51.5 47.7
38.6 41.3 42.8 39.8 40.7 45.6 47.6 43.9 44.6 48.0 48.2 45.7
48.4 53.0 56.0 53.3 53.2 57.3 56.9 54.3 52.9 56.7 56.3 53.6
46.7 49.6 48.5 46.9 46.9 53.8 53.2 49.4 47.9 54.1 54.2 49.6
36.9 36.1 38.2 36.9 35.5 41.8 42.2 41.8 41.4 42.9 41.6 40.2
43.1 43.3 41.2 40.6 41.1 47.2 47.3 44.5 43.9 47.5 47.9 44.7
51.5 55.6 53.7 50.5 49.5 53.4 52.2 48.6 47.3 54.0 53.3 50.4
47.3 48.1 47.4 45.5 46.0 54.5 51.2 49.7 49.5 55.4 54.2 53.0
49.7 49.2 48.8 46.1 45.7 51.6 48.5 48.1 46.4 51.6 49.1 46.5
44.1 44.5 41.9 41.5 41.8 48.7 45.1 42.9 42.5 48.7 46.0 43.3
35.0 38.8 35.0 34.9 36.3 42.3 41.3 40.5 39.9 42.4 41.1 40.3
51.8 50.7 50.1 49.8 49.1 52.5 51.0 49.4 48.8 52.9 53.1 50.6
46.8 49.3 48.1 46.5 46.5 53.1 52.4 48.8 47.4 53.4 53.4 49.1
40.5 46.2 42.1 40.5 40.6 51.4 47.0 42.1 41.2 51.6 49.8 43.6
34.7 39.2 39.2 38.3 38.5 46.0 43.5 41.8 41.0 46.0 43.7 41.1
37.0 41.6 38.3 38.0 38.3 48.1 44.2 41.4 40.3 48.2 47.5 38.5
Total expenditure, general government (as a percentage of GDP, 2003-2023)
Autumn 2021 Spring 2021
averages forecast forecast
Malta
Belgium
Germany
Estonia
Ireland
Greece
Spain
France
Italy
Cyprus
Latvia
Luxembourg
Hungary
Netherlands
Austria
Portugal
Slovenia
Slovakia
Finland
Euro area
Bulgaria
Czechia
Denmark
Croatia
United States
Poland
Romania
Sweden
EU
United Kingdom
Japan
Table 34: 25.10.2021
5-year
2003 - 07 2008 - 12 2013 - 17 2018 2019 2020 2021 2022 2023 2020 2021 2022
49.0 50.4 51.8 51.4 49.9 50.1 49.0 49.1 48.8 50.6 49.9 49.8
43.8 44.4 45.2 46.2 46.5 46.5 45.8 45.0 45.5 46.9 46.0 45.7
36.2 39.7 38.9 38.9 39.6 40.3 40.4 40.1 39.9 40.2 41.1 39.5
34.8 33.6 29.7 25.5 24.7 22.4 21.8 21.2 21.1 23.4 23.0 22.9
39.3 42.7 48.8 49.5 49.0 49.7 48.0 46.8 47.1 51.0 49.2 49.0
39.6 36.5 38.6 39.2 39.2 41.5 42.8 42.0 40.7 41.3 41.7 41.0
49.8 50.7 53.2 53.4 52.3 52.6 51.9 51.1 51.2 52.9 52.1 51.5
44.0 46.0 47.4 46.2 47.0 47.5 46.8 47.0 46.8 47.8 47.0 46.9
37.0 37.2 38.8 39.2 39.7 39.4 40.0 39.5 39.2 40.6 42.3 41.8
34.1 36.4 37.5 38.5 37.6 38.6 38.1 38.7 38.6 39.1 39.6 39.7
Lithuania 33.5 34.6 34.0 34.5 35.2 35.7 37.1 37.8 38.0 36.1 36.0 36.4
42.4 42.0 42.1 45.1 45.1 43.6 44.4 44.3 44.4 43.7 43.6 43.1
38.3 38.3 38.0 37.5 36.4 36.2 36.0 36.7 36.6 36.5 36.9 37.0
42.0 42.7 43.4 43.7 43.7 43.9 42.9 42.9 42.7 43.9 43.4 42.1
48.6 48.6 49.3 48.9 49.2 48.7 49.1 48.5 48.7 49.0 48.4 48.4
40.6 41.5 43.7 42.9 42.6 43.5 44.6 43.2 42.9 42.8 43.5 42.4
44.4 44.3 45.0 44.2 43.8 43.6 43.7 43.5 42.9 43.6 43.0 43.0
35.9 35.9 40.4 38.8 39.3 40.1 40.3 39.6 41.3 41.8 41.8 41.6
51.7 52.2 53.9 52.5 52.3 51.9 53.1 51.9 51.8 51.2 51.7 51.5
44.5 45.1 46.5 46.4 46.3 46.6 46.1 45.5 45.5 46.8 46.2 45.8
38.1 34.2 37.0 38.7 37.6 37.8 38.6 39.0 39.3 39.5 38.4 38.3
40.1 39.7 40.8 41.5 41.4 41.6 40.4 40.2 40.1 41.3 39.4 39.3
54.8 54.0 53.8 51.3 53.6 53.3 51.3 49.9 48.6 52.8 51.2 49.0
43.7 42.4 44.4 45.7 46.3 47.2 47.2 46.8 47.4 48.0 49.6 49.8
42.5 45.1 46.5 44.0 43.6 43.6 41.0 42.4 42.6 43.5 42.4 42.0
40.1 39.0 39.1 41.3 41.0 41.5 41.8 41.1 40.4 41.7 41.8 41.0
33.3 32.7 33.1 32.0 31.9 32.9 33.2 33.5 33.5 33.1 33.0 33.2
53.0 50.6 50.0 50.7 49.7 49.7 50.1 49.8 49.7 49.9 49.8 50.1
44.8 45.0 46.3 46.1 46.0 46.3 45.8 45.2 45.1 46.5 45.9 45.5
37.6 38.2 37.9 38.3 38.2 38.5 36.9 36.6 36.7 39.3 38.0 38.1
30.3 31.1 34.5 35.8 35.6 35.2 34.4 36.8 37.1 32.8 34.2 37.0
32.2 31.0 33.3 31.7 31.6 32.4 32.7 33.5 33.5 32.1 31.5 31.6
Total revenue, general government (as a percentage of GDP, 2003-2023)
Autumn 2021 Spring 2021
averages forecast forecast
Malta
Belgium
Germany
Estonia
Ireland
Greece
Spain
France
Italy
Cyprus
Latvia
Luxembourg
Hungary
Netherlands
Austria
Portugal
Slovenia
Slovakia
Finland
Euro area
Bulgaria
Czechia
Denmark
Croatia
United States
Poland
Romania
Sweden
EU
United Kingdom
Japan
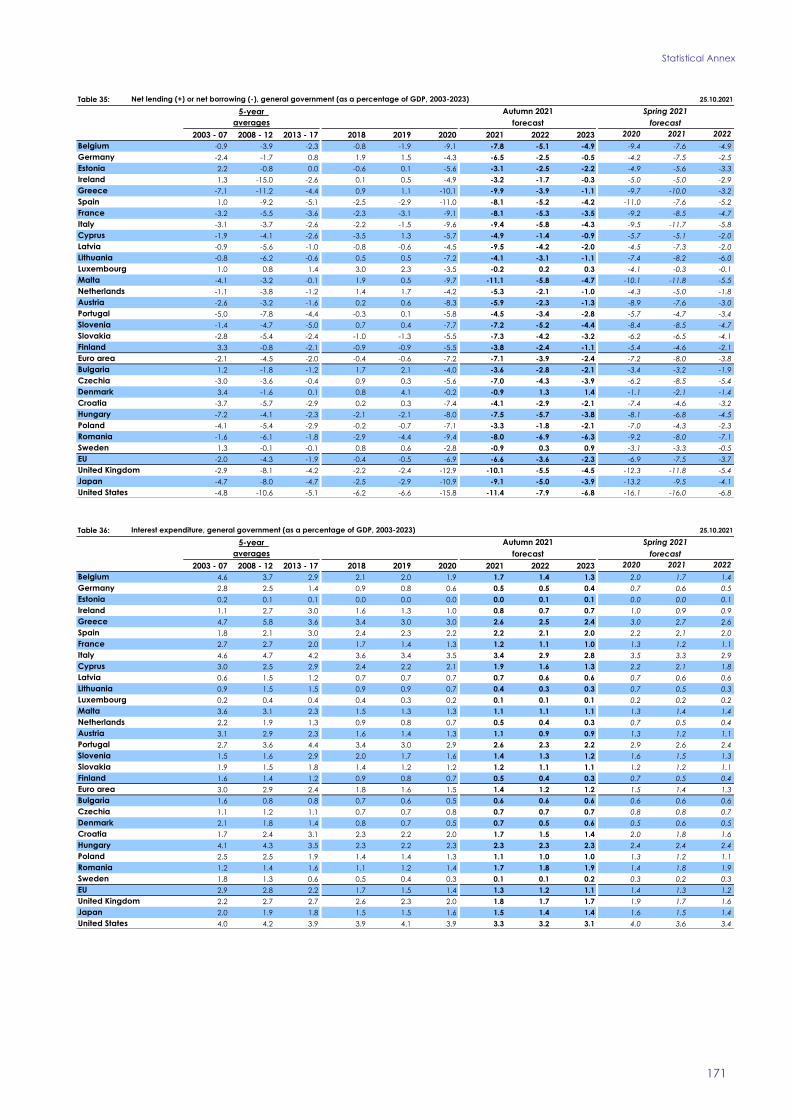
Statistical Annex
171
Table 35: 25.10.2021
5-year
2003 - 07 2008 - 12 2013 - 17 2018 2019 2020 2021 2022 2023 2020 2021 2022
-0.9 -3.9 -2.3 -0.8 -1.9 -9.1 -7.8 -5.1 -4.9 -9.4 -7.6 -4.9
-2.4 -1.7 0.8 1.9 1.5 -4.3 -6.5 -2.5 -0.5 -4.2 -7.5 -2.5
2.2 -0.8 0.0 -0.6 0.1 -5.6 -3.1 -2.5 -2.2 -4.9 -5.6 -3.3
1.3 -15.0 -2.6 0.1 0.5 -4.9 -3.2 -1.7 -0.3 -5.0 -5.0 -2.9
-7.1 -11.2 -4.4 0.9 1.1 -10.1 -9.9 -3.9 -1.1 -9.7 -10.0 -3.2
1.0 -9.2 -5.1 -2.5 -2.9 -11.0 -8.1 -5.2 -4.2 -11.0 -7.6 -5.2
-3.2 -5.5 -3.6 -2.3 -3.1 -9.1 -8.1 -5.3 -3.5 -9.2 -8.5 -4.7
-3.1 -3.7 -2.6 -2.2 -1.5 -9.6 -9.4 -5.8 -4.3 -9.5 -11.7 -5.8
-1.9 -4.1 -2.6 -3.5 1.3 -5.7 -4.9 -1.4 -0.9 -5.7 -5.1 -2.0
-0.9 -5.6 -1.0 -0.8 -0.6 -4.5 -9.5 -4.2 -2.0 -4.5 -7.3 -2.0
Lithuania -0.8 -6.2 -0.6 0.5 0.5 -7.2 -4.1 -3.1 -1.1 -7.4 -8.2 -6.0
1.0 0.8 1.4 3.0 2.3 -3.5 -0.2 0.2 0.3 -4.1 -0.3 -0.1
-4.1 -3.2 -0.1 1.9 0.5 -9.7 -11.1 -5.8 -4.7 -10.1 -11.8 -5.5
-1.1 -3.8 -1.2 1.4 1.7 -4.2 -5.3 -2.1 -1.0 -4.3 -5.0 -1.8
-2.6 -3.2 -1.6 0.2 0.6 -8.3 -5.9 -2.3 -1.3 -8.9 -7.6 -3.0
-5.0 -7.8 -4.4 -0.3 0.1 -5.8 -4.5 -3.4 -2.8 -5.7 -4.7 -3.4
-1.4 -4.7 -5.0 0.7 0.4 -7.7 -7.2 -5.2 -4.4 -8.4 -8.5 -4.7
-2.8 -5.4 -2.4 -1.0 -1.3 -5.5 -7.3 -4.2 -3.2 -6.2 -6.5 -4.1
3.3 -0.8 -2.1 -0.9 -0.9 -5.5 -3.8 -2.4 -1.1 -5.4 -4.6 -2.1
-2.1 -4.5 -2.0 -0.4 -0.6 -7.2 -7.1 -3.9 -2.4 -7.2 -8.0 -3.8
1.2 -1.8 -1.2 1.7 2.1 -4.0 -3.6 -2.8 -2.1 -3.4 -3.2 -1.9
-3.0 -3.6 -0.4 0.9 0.3 -5.6 -7.0 -4.3 -3.9 -6.2 -8.5 -5.4
3.4 -1.6 0.1 0.8 4.1 -0.2 -0.9 1.3 1.4 -1.1 -2.1 -1.4
-3.7 -5.7 -2.9 0.2 0.3 -7.4 -4.1 -2.9 -2.1 -7.4 -4.6 -3.2
-7.2 -4.1 -2.3 -2.1 -2.1 -8.0 -7.5 -5.7 -3.8 -8.1 -6.8 -4.5
-4.1 -5.4 -2.9 -0.2 -0.7 -7.1 -3.3 -1.8 -2.1 -7.0 -4.3 -2.3
-1.6 -6.1 -1.8 -2.9 -4.4 -9.4 -8.0 -6.9 -6.3 -9.2 -8.0 -7.1
1.3 -0.1 -0.1 0.8 0.6 -2.8 -0.9 0.3 0.9 -3.1 -3.3 -0.5
-2.0 -4.3 -1.9 -0.4 -0.5 -6.9 -6.6 -3.6 -2.3 -6.9 -7.5 -3.7
-2.9 -8.1 -4.2 -2.2 -2.4 -12.9 -10.1 -5.5 -4.5 -12.3 -11.8 -5.4
-4.7 -8.0 -4.7 -2.5 -2.9 -10.9 -9.1 -5.0 -3.9 -13.2 -9.5 -4.1
-4.8 -10.6 -5.1 -6.2 -6.6 -15.8 -11.4 -7.9 -6.8 -16.1 -16.0 -6.8
Net lending (+) or net borrowing (-), general government (as a percentage of GDP, 2003-2023)
Autumn 2021 Spring 2021
averages forecast forecast
Malta
Belgium
Germany
Estonia
Ireland
Greece
Spain
France
Italy
Cyprus
Latvia
Luxembourg
Hungary
Netherlands
Austria
Portugal
Slovenia
Slovakia
Finland
Euro area
Bulgaria
Czechia
Denmark
Croatia
United States
Poland
Romania
Sweden
EU
United Kingdom
Japan
Table 36: 25.10.2021
5-year
2003 - 07 2008 - 12 2013 - 17 2018 2019 2020 2021 2022 2023 2020 2021 2022
4.6 3.7 2.9 2.1 2.0 1.9 1.7 1.4 1.3 2.0 1.7 1.4
2.8 2.5 1.4 0.9 0.8 0.6 0.5 0.5 0.4 0.7 0.6 0.5
0.2 0.1 0.1 0.0 0.0 0.0 0.0 0.1 0.1 0.0 0.0 0.1
1.1 2.7 3.0 1.6 1.3 1.0 0.8 0.7 0.7 1.0 0.9 0.9
4.7 5.8 3.6 3.4 3.0 3.0 2.6 2.5 2.4 3.0 2.7 2.6
1.8 2.1 3.0 2.4 2.3 2.2 2.2 2.1 2.0 2.2 2.1 2.0
2.7 2.7 2.0 1.7 1.4 1.3 1.2 1.1 1.0 1.3 1.2 1.1
4.6 4.7 4.2 3.6 3.4 3.5 3.4 2.9 2.8 3.5 3.3 2.9
3.0 2.5 2.9 2.4 2.2 2.1 1.9 1.6 1.3 2.2 2.1 1.8
0.6 1.5 1.2 0.7 0.7 0.7 0.7 0.6 0.6 0.7 0.6 0.6
Lithuania 0.9 1.5 1.5 0.9 0.9 0.7 0.4 0.3 0.3 0.7 0.5 0.3
0.2 0.4 0.4 0.4 0.3 0.2 0.1 0.1 0.1 0.2 0.2 0.2
3.6 3.1 2.3 1.5 1.3 1.3 1.1 1.1 1.1 1.3 1.4 1.4
2.2 1.9 1.3 0.9 0.8 0.7 0.5 0.4 0.3 0.7 0.5 0.4
3.1 2.9 2.3 1.6 1.4 1.3 1.1 0.9 0.9 1.3 1.2 1.1
2.7 3.6 4.4 3.4 3.0 2.9 2.6 2.3 2.2 2.9 2.6 2.4
1.5 1.6 2.9 2.0 1.7 1.6 1.4 1.3 1.2 1.6 1.5 1.3
1.9 1.5 1.8 1.4 1.2 1.2 1.2 1.1 1.1 1.2 1.2 1.1
1.6 1.4 1.2 0.9 0.8 0.7 0.5 0.4 0.3 0.7 0.5 0.4
3.0 2.9 2.4 1.8 1.6 1.5 1.4 1.2 1.2 1.5 1.4 1.3
1.6 0.8 0.8 0.7 0.6 0.5 0.6 0.6 0.6 0.6 0.6 0.6
1.1 1.2 1.1 0.7 0.7 0.8 0.7 0.7 0.7 0.8 0.8 0.7
2.1 1.8 1.4 0.8 0.7 0.5 0.7 0.5 0.6 0.5 0.6 0.5
1.7 2.4 3.1 2.3 2.2 2.0 1.7 1.5 1.4 2.0 1.8 1.6
4.1 4.3 3.5 2.3 2.2 2.3 2.3 2.3 2.3 2.4 2.4 2.4
2.5 2.5 1.9 1.4 1.4 1.3 1.1 1.0 1.0 1.3 1.2 1.1
1.2 1.4 1.6 1.1 1.2 1.4 1.7 1.8 1.9 1.4 1.8 1.9
1.8 1.3 0.6 0.5 0.4 0.3 0.1 0.1 0.2 0.3 0.2 0.3
2.9 2.8 2.2 1.7 1.5 1.4 1.3 1.2 1.1 1.4 1.3 1.2
2.2 2.7 2.7 2.6 2.3 2.0 1.8 1.7 1.7 1.9 1.7 1.6
2.0 1.9 1.8 1.5 1.5 1.6 1.5 1.4 1.4 1.6 1.5 1.4
4.0 4.2 3.9 3.9 4.1 3.9 3.3 3.2 3.1 4.0 3.6 3.4
Interest expenditure, general government (as a percentage of GDP, 2003-2023)
Autumn 2021 Spring 2021
averages forecast forecast
Malta
Belgium
Germany
Estonia
Ireland
Greece
Spain
France
Italy
Cyprus
Latvia
Luxembourg
Hungary
Netherlands
Austria
Portugal
Slovenia
Slovakia
Finland
Euro area
Bulgaria
Czechia
Denmark
Croatia
United States
Poland
Romania
Sweden
EU
United Kingdom
Japan

European Economic Forecast, Autumn 2021
172
Table 37: 25.10.2021
5-year
2003 - 07 2008 - 12 2013 - 17 2018 2019 2020 2021 2022 2023 2020 2021 2022
3.7 -0.2 0.6 1.3 0.1 -7.1 -6.1 -3.7 -3.6 -7.4 -5.9 -3.5
0.4 0.8 2.2 2.8 2.3 -3.7 -5.9 -2.0 -0.1 -3.5 -7.0 -2.0
2.4 -0.6 0.1 -0.5 0.1 -5.6 -3.1 -2.5 -2.1 -4.9 -5.5 -3.2
2.3 -12.3 0.4 1.8 1.8 -3.9 -2.4 -1.0 0.4 -4.0 -4.1 -2.0
-2.4 -5.4 -0.8 4.3 4.1 -7.1 -7.3 -1.4 1.3 -6.7 -7.3 -0.6
2.8 -7.0 -2.1 -0.1 -0.6 -8.7 -5.9 -3.1 -2.1 -8.7 -5.5 -3.2
-0.5 -2.8 -1.6 -0.6 -1.6 -7.8 -6.9 -4.2 -2.5 -7.9 -7.3 -3.6
1.5 1.0 1.6 1.5 1.8 -6.1 -5.9 -2.9 -1.4 -6.0 -8.4 -2.8
1.1 -1.7 0.3 -1.1 3.5 -3.6 -3.0 0.2 0.4 -3.5 -3.0 -0.2
-0.3 -4.1 0.2 -0.1 0.1 -3.8 -8.9 -3.6 -1.4 -3.9 -6.7 -1.4
Lithuania 0.0 -4.7 0.9 1.4 1.3 -6.5 -3.7 -2.9 -0.9 -6.7 -7.7 -5.7
1.2 1.2 1.8 3.3 2.6 -3.3 0.0 0.3 0.4 -3.9 -0.2 0.1
-0.5 0.0 2.3 3.4 1.8 -8.4 -10.0 -4.7 -3.6 -8.8 -10.4 -4.1
1.1 -1.9 0.1 2.3 2.5 -3.5 -4.8 -1.7 -0.7 -3.6 -4.5 -1.3
0.5 -0.3 0.7 1.8 2.0 -7.0 -4.7 -1.4 -0.4 -7.5 -6.3 -1.9
-2.3 -4.1 0.1 3.0 3.1 -2.9 -1.9 -1.1 -0.5 -2.8 -2.1 -1.0
0.1 -3.1 -2.1 2.8 2.1 -6.1 -5.8 -3.9 -3.2 -6.8 -7.0 -3.4
-0.9 -3.9 -0.7 0.3 -0.1 -4.3 -6.1 -3.1 -2.1 -4.9 -5.3 -3.0
4.9 0.6 -0.9 0.0 -0.1 -4.8 -3.3 -2.0 -0.8 -4.8 -4.1 -1.7
0.8 -1.6 0.4 1.4 1.0 -5.7 -5.7 -2.7 -1.2 -5.7 -6.6 -2.6
2.8 -1.1 -0.4 2.4 2.7 -3.5 -3.0 -2.2 -1.5 -2.9 -2.6 -1.3
-2.0 -2.4 0.7 1.7 1.0 -4.8 -6.2 -3.5 -3.1 -5.4 -7.8 -4.6
5.5 0.2 1.4 1.6 4.8 0.4 -0.2 1.8 1.9 -0.6 -1.5 -0.9
-2.0 -3.3 0.2 2.5 2.5 -5.4 -2.4 -1.4 -0.7 -5.4 -2.8 -1.6
-3.1 0.2 1.2 0.2 0.1 -5.6 -5.1 -3.3 -1.5 -5.7 -4.3 -2.1
-1.5 -2.9 -1.0 1.2 0.6 -5.8 -2.2 -0.8 -1.1 -5.7 -3.1 -1.2
-0.5 -4.7 -0.3 -1.8 -3.2 -7.9 -6.4 -5.1 -4.4 -7.8 -6.3 -5.2
3.1 1.2 0.5 1.3 1.0 -2.5 -0.8 0.5 1.1 -2.8 -3.0 -0.3
0.9 -1.6 0.4 1.3 1.0 -5.5 -5.3 -2.4 -1.1 -5.5 -6.1 -2.4
-0.8 -5.3 -1.5 0.3 -0.2 -10.9 -8.3 -3.8 -2.8 -10.4 -10.1 -3.9
-2.7 -6.1 -2.9 -0.9 -1.4 -9.3 -7.6 -3.6 -2.6 -11.6 -8.0 -2.7
-0.8 -6.4 -1.2 -2.3 -2.6 -11.9 -8.1 -4.7 -3.6 -12.1 -12.4 -3.4
Primary balance, general government ¹ (as a percentage of GDP, 2003-2023)
Autumn 2021 Spring 2021
averages forecast forecast
Malta
Belgium
Germany
Estonia
Ireland
Greece
Spain
France
Italy
Cyprus
Latvia
Luxembourg
Hungary
Netherlands
Austria
Portugal
Slovenia
Slovakia
Finland
Euro area
Bulgaria
Czechia
Denmark
Croatia
United States¹ Net lending/borrowing excluding interest expenditure.
Poland
Romania
Sweden
EU
United Kingdom
Japan
Table 38: 25.10.2021
5-year
2003 - 07 2008 - 12 2013 - 17 2018 2019 2020 2021 2022 2023 2020 2021 2022
-1.3 -3.6 -2.2 -1.4 -2.8 -5.7 -7.0 -5.0 -4.9 -5.5 -5.7 -4.4
-2.1 -1.3 0.7 1.3 0.9 -2.1 -5.0 -2.6 -0.8 -1.8 -6.2 -2.5
-0.4 1.1 0.0 -1.5 -0.7 -3.1 -2.7 -2.2 -1.8 -2.8 -3.4 -1.9
0.7 -14.0 -3.6 0.0 2.3 -2.4 -4.7 -3.1 -1.2 -4.6 -4.7 -2.9
-8.8 -8.0 2.1 4.0 2.8 -4.5 -7.4 -3.6 -1.9 -4.1 -6.4 -2.1
-1.0 -6.6 -2.2 -3.3 -4.3 -5.7 -4.7 -4.1 -4.6 -5.4 -4.6 -5.2
-4.2 -4.8 -2.8 -2.8 -4.2 -4.7 -6.8 -5.3 -4.0 -4.8 -6.8 -4.8
-4.1 -3.0 -1.0 -2.3 -1.9 -4.9 -7.6 -5.6 -4.7 -4.8 -9.1 -5.0
-3.7 -4.4 -0.1 -5.3 -1.6 -4.4 -4.7 -1.8 -1.5 -4.7 -4.6 -2.4
-2.7 -3.7 -1.3 -2.0 -1.4 -3.0 -8.6 -4.0 -2.1 -3.2 -6.2 -1.9
Lithuania -2.3 -4.5 -0.9 -0.7 -0.8 -6.7 -4.0 -2.8 -0.6 -6.7 -7.0 -5.0
0.6 1.5 1.8 3.3 2.4 -1.5 0.6 0.5 0.7 -1.9 1.1 1.1
-4.0 -2.6 -1.0 -0.6 -2.2 -6.9 -9.1 -5.0 -4.4 -7.4 -9.7 -4.5
-0.6 -3.0 -0.3 0.7 0.9 -1.9 -4.5 -2.4 -1.5 -2.0 -3.5 -1.7
-2.5 -3.0 -1.2 -0.8 -0.5 -5.0 -4.2 -2.5 -1.7 -5.7 -5.7 -2.9
-4.8 -7.1 -3.3 -1.8 -2.0 -2.6 -2.7 -3.4 -3.1 -2.7 -2.9 -3.3
-3.1 -4.2 -3.2 -0.7 -1.3 -6.5 -7.6 -6.2 -5.5 -6.8 -7.7 -4.7
-3.2 -5.3 -2.0 -1.8 -2.2 -4.1 -6.5 -4.3 -3.6 -4.7 -6.0 -4.4
2.9 -0.2 -1.0 -1.1 -1.1 -3.3 -2.8 -2.0 -1.1 -3.4 -3.3 -1.5
-2.7 -3.7 -1.0 -1.0 -1.4 -3.8 -5.7 -3.9 -2.8 -3.7 -6.2 -3.6
0.8 -2.1 -1.0 1.5 1.3 -2.9 -3.1 -2.8 -2.5 -2.5 -2.6 -2.0
-4.2 -3.6 -0.1 0.0 -0.8 -3.8 -5.7 -3.8 -3.8 -4.4 -7.4 -5.1
1.8 -0.2 1.3 1.1 4.2 2.3 0.4 2.3 2.2 1.2 -0.1 -0.2
-5.0 -5.6 -2.1 -1.0 -1.3 -4.7 -3.5 -3.4 -2.7 -5.0 -3.2 -3.3
-8.3 -2.7 -2.2 -3.6 -3.7 -5.8 -6.8 -5.7 -3.6 -6.3 -5.7 -4.3
-3.6 -6.1 -2.3 -1.4 -2.4 -5.9 -2.7 -1.8 -2.4 -5.9 -3.7 -2.7
-3.0 -5.9 -1.5 -3.5 -4.9 -7.5 -7.1 -6.4 -6.1 -7.5 -6.9 -6.4
0.6 0.8 0.2 0.6 0.4 -0.5 0.2 0.6 1.3 -0.4 -1.9 0.2
-2.6 -3.6 -1.0 -0.9 -1.3 -3.7 -5.2 -3.5 -2.6 -3.7 -5.8 -3.5
Cyclically-adjusted net lending (+) or net borrowing (-), general government¹ (as a percentage of potential GDP, 2003-2023)
Autumn 2021 Spring 2021
averages forecast forecast
Malta
Belgium
Germany
Estonia
Ireland
Greece
Spain
France
Italy
Cyprus
Latvia
Luxembourg
Hungary
Netherlands
Austria
Portugal
Slovenia
Slovakia
Finland
Euro area
Bulgaria
Czechia
Denmark
Croatia
Poland
Romania
Sweden
EU¹ Cyclically-adjusted variables for Croatia are based on provisional values for fiscal semi-elasticities and subject to further revisions
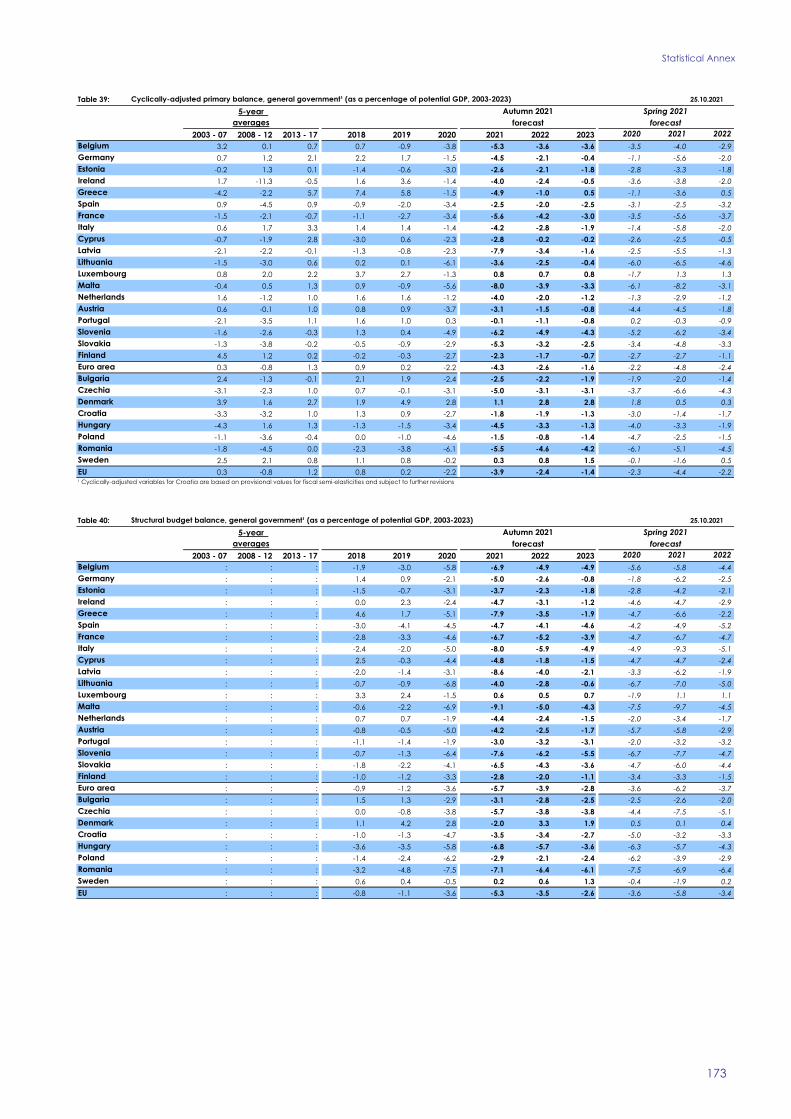
Statistical Annex
173
Table 39: 25.10.2021
5-year
2003 - 07 2008 - 12 2013 - 17 2018 2019 2020 2021 2022 2023 2020 2021 2022
3.2 0.1 0.7 0.7 -0.9 -3.8 -5.3 -3.6 -3.6 -3.5 -4.0 -2.9
0.7 1.2 2.1 2.2 1.7 -1.5 -4.5 -2.1 -0.4 -1.1 -5.6 -2.0
-0.2 1.3 0.1 -1.4 -0.6 -3.0 -2.6 -2.1 -1.8 -2.8 -3.3 -1.8
1.7 -11.3 -0.5 1.6 3.6 -1.4 -4.0 -2.4 -0.5 -3.6 -3.8 -2.0
-4.2 -2.2 5.7 7.4 5.8 -1.5 -4.9 -1.0 0.5 -1.1 -3.6 0.5
0.9 -4.5 0.9 -0.9 -2.0 -3.4 -2.5 -2.0 -2.5 -3.1 -2.5 -3.2
-1.5 -2.1 -0.7 -1.1 -2.7 -3.4 -5.6 -4.2 -3.0 -3.5 -5.6 -3.7
0.6 1.7 3.3 1.4 1.4 -1.4 -4.2 -2.8 -1.9 -1.4 -5.8 -2.0
-0.7 -1.9 2.8 -3.0 0.6 -2.3 -2.8 -0.2 -0.2 -2.6 -2.5 -0.5
-2.1 -2.2 -0.1 -1.3 -0.8 -2.3 -7.9 -3.4 -1.6 -2.5 -5.5 -1.3
Lithuania -1.5 -3.0 0.6 0.2 0.1 -6.1 -3.6 -2.5 -0.4 -6.0 -6.5 -4.6
0.8 2.0 2.2 3.7 2.7 -1.3 0.8 0.7 0.8 -1.7 1.3 1.3
-0.4 0.5 1.3 0.9 -0.9 -5.6 -8.0 -3.9 -3.3 -6.1 -8.2 -3.1
1.6 -1.2 1.0 1.6 1.6 -1.2 -4.0 -2.0 -1.2 -1.3 -2.9 -1.2
0.6 -0.1 1.0 0.8 0.9 -3.7 -3.1 -1.5 -0.8 -4.4 -4.5 -1.8
-2.1 -3.5 1.1 1.6 1.0 0.3 -0.1 -1.1 -0.8 0.2 -0.3 -0.9
-1.6 -2.6 -0.3 1.3 0.4 -4.9 -6.2 -4.9 -4.3 -5.2 -6.2 -3.4
-1.3 -3.8 -0.2 -0.5 -0.9 -2.9 -5.3 -3.2 -2.5 -3.4 -4.8 -3.3
4.5 1.2 0.2 -0.2 -0.3 -2.7 -2.3 -1.7 -0.7 -2.7 -2.7 -1.1
0.3 -0.8 1.3 0.9 0.2 -2.2 -4.3 -2.6 -1.6 -2.2 -4.8 -2.4
2.4 -1.3 -0.1 2.1 1.9 -2.4 -2.5 -2.2 -1.9 -1.9 -2.0 -1.4
-3.1 -2.3 1.0 0.7 -0.1 -3.1 -5.0 -3.1 -3.1 -3.7 -6.6 -4.3
3.9 1.6 2.7 1.9 4.9 2.8 1.1 2.8 2.8 1.8 0.5 0.3
-3.3 -3.2 1.0 1.3 0.9 -2.7 -1.8 -1.9 -1.3 -3.0 -1.4 -1.7
-4.3 1.6 1.3 -1.3 -1.5 -3.4 -4.5 -3.3 -1.3 -4.0 -3.3 -1.9
-1.1 -3.6 -0.4 0.0 -1.0 -4.6 -1.5 -0.8 -1.4 -4.7 -2.5 -1.5
-1.8 -4.5 0.0 -2.3 -3.8 -6.1 -5.5 -4.6 -4.2 -6.1 -5.1 -4.5
2.5 2.1 0.8 1.1 0.8 -0.2 0.3 0.8 1.5 -0.1 -1.6 0.5
0.3 -0.8 1.2 0.8 0.2 -2.2 -3.9 -2.4 -1.4 -2.3 -4.4 -2.2
Cyclically-adjusted primary balance, general government¹ (as a percentage of potential GDP, 2003-2023)
Autumn 2021 Spring 2021
averages forecast forecast
Malta
Belgium
Germany
Estonia
Ireland
Greece
Spain
France
Italy
Cyprus
Latvia
Luxembourg
Hungary
Netherlands
Austria
Portugal
Slovenia
Slovakia
Finland
Euro area
Bulgaria
Czechia
Denmark
Croatia
Poland
Romania
Sweden
EU¹ Cyclically-adjusted variables for Croatia are based on provisional values for fiscal semi-elasticities and subject to further revisions
Table 40: 25.10.2021
5-year
2003 - 07 2008 - 12 2013 - 17 2018 2019 2020 2021 2022 2023 2020 2021 2022
: : : -1.9 -3.0 -5.8 -6.9 -4.9 -4.9 -5.6 -5.8 -4.4
: : : 1.4 0.9 -2.1 -5.0 -2.6 -0.8 -1.8 -6.2 -2.5
: : : -1.5 -0.7 -3.1 -3.7 -2.3 -1.8 -2.8 -4.2 -2.1
: : : 0.0 2.3 -2.4 -4.7 -3.1 -1.2 -4.6 -4.7 -2.9
: : : 4.6 1.7 -5.1 -7.9 -3.5 -1.9 -4.7 -6.6 -2.2
: : : -3.0 -4.1 -4.5 -4.7 -4.1 -4.6 -4.2 -4.9 -5.2
: : : -2.8 -3.3 -4.6 -6.7 -5.2 -3.9 -4.7 -6.7 -4.7
: : : -2.4 -2.0 -5.0 -8.0 -5.9 -4.9 -4.9 -9.3 -5.1
: : : 2.5 -0.3 -4.4 -4.8 -1.8 -1.5 -4.7 -4.7 -2.4
: : : -2.0 -1.4 -3.1 -8.6 -4.0 -2.1 -3.3 -6.2 -1.9
Lithuania : : : -0.7 -0.9 -6.8 -4.0 -2.8 -0.6 -6.7 -7.0 -5.0
: : : 3.3 2.4 -1.5 0.6 0.5 0.7 -1.9 1.1 1.1
: : : -0.6 -2.2 -6.9 -9.1 -5.0 -4.3 -7.5 -9.7 -4.5
: : : 0.7 0.7 -1.9 -4.4 -2.4 -1.5 -2.0 -3.4 -1.7
: : : -0.8 -0.5 -5.0 -4.2 -2.5 -1.7 -5.7 -5.8 -2.9
: : : -1.1 -1.4 -1.9 -3.0 -3.2 -3.1 -2.0 -3.2 -3.2
: : : -0.7 -1.3 -6.4 -7.6 -6.2 -5.5 -6.7 -7.7 -4.7
: : : -1.8 -2.2 -4.1 -6.5 -4.3 -3.6 -4.7 -6.0 -4.4
: : : -1.0 -1.2 -3.3 -2.8 -2.0 -1.1 -3.4 -3.3 -1.5
: : : -0.9 -1.2 -3.6 -5.7 -3.9 -2.8 -3.6 -6.2 -3.7
: : : 1.5 1.3 -2.9 -3.1 -2.8 -2.5 -2.5 -2.6 -2.0
: : : 0.0 -0.8 -3.8 -5.7 -3.8 -3.8 -4.4 -7.5 -5.1
: : : 1.1 4.2 2.8 -2.0 3.3 1.9 0.5 0.1 0.4
: : : -1.0 -1.3 -4.7 -3.5 -3.4 -2.7 -5.0 -3.2 -3.3
: : : -3.6 -3.5 -5.8 -6.8 -5.7 -3.6 -6.3 -5.7 -4.3
: : : -1.4 -2.4 -6.2 -2.9 -2.1 -2.4 -6.2 -3.9 -2.9
: : : -3.2 -4.8 -7.5 -7.1 -6.4 -6.1 -7.5 -6.9 -6.4
: : : 0.6 0.4 -0.5 0.2 0.6 1.3 -0.4 -1.9 0.2
: : : -0.8 -1.1 -3.6 -5.3 -3.5 -2.6 -3.6 -5.8 -3.4
Structural budget balance, general government¹ (as a percentage of potential GDP, 2003-2023)
Autumn 2021 Spring 2021
averages forecast forecast
Croatia
Malta
Belgium
Germany
Estonia
Ireland
Greece
Spain
France
Italy
Cyprus
Latvia
Luxembourg
Finland
Euro area
Bulgaria
Czechia
Denmark
Netherlands
Austria
Portugal
Slovenia
Slovakia
Poland
Romania
Sweden
EU
Hungary
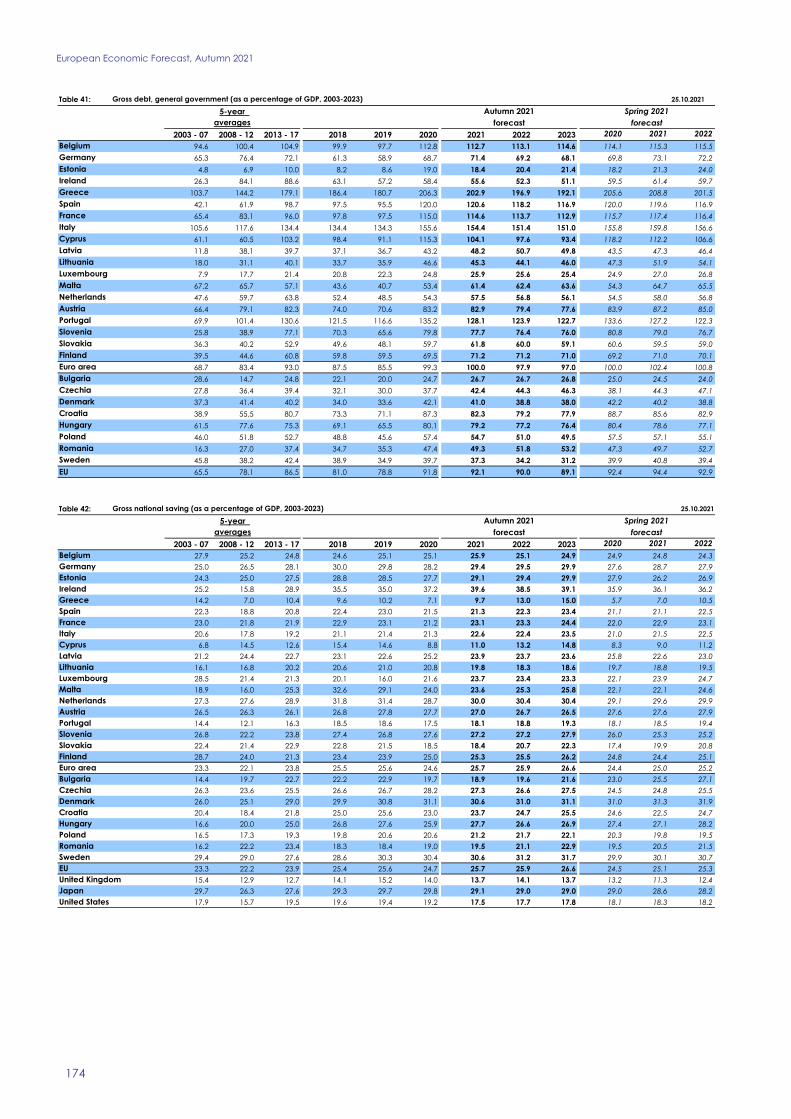
European Economic Forecast, Autumn 2021
174
Table 41: 25.10.2021
5-year
2003 - 07 2008 - 12 2013 - 17 2018 2019 2020 2021 2022 2023 2020 2021 2022
94.6 100.4 104.9 99.9 97.7 112.8 112.7 113.1 114.6 114.1 115.3 115.5
65.3 76.4 72.1 61.3 58.9 68.7 71.4 69.2 68.1 69.8 73.1 72.2
4.8 6.9 10.0 8.2 8.6 19.0 18.4 20.4 21.4 18.2 21.3 24.0
26.3 84.1 88.6 63.1 57.2 58.4 55.6 52.3 51.1 59.5 61.4 59.7
103.7 144.2 179.1 186.4 180.7 206.3 202.9 196.9 192.1 205.6 208.8 201.5
42.1 61.9 98.7 97.5 95.5 120.0 120.6 118.2 116.9 120.0 119.6 116.9
65.4 83.1 96.0 97.8 97.5 115.0 114.6 113.7 112.9 115.7 117.4 116.4
105.6 117.6 134.4 134.4 134.3 155.6 154.4 151.4 151.0 155.8 159.8 156.6
61.1 60.5 103.2 98.4 91.1 115.3 104.1 97.6 93.4 118.2 112.2 106.6
11.8 38.1 39.7 37.1 36.7 43.2 48.2 50.7 49.8 43.5 47.3 46.4
Lithuania 18.0 31.1 40.1 33.7 35.9 46.6 45.3 44.1 46.0 47.3 51.9 54.1
7.9 17.7 21.4 20.8 22.3 24.8 25.9 25.6 25.4 24.9 27.0 26.8
67.2 65.7 57.1 43.6 40.7 53.4 61.4 62.4 63.6 54.3 64.7 65.5
47.6 59.7 63.8 52.4 48.5 54.3 57.5 56.8 56.1 54.5 58.0 56.8
66.4 79.1 82.3 74.0 70.6 83.2 82.9 79.4 77.6 83.9 87.2 85.0
69.9 101.4 130.6 121.5 116.6 135.2 128.1 123.9 122.7 133.6 127.2 122.3
25.8 38.9 77.1 70.3 65.6 79.8 77.7 76.4 76.0 80.8 79.0 76.7
36.3 40.2 52.9 49.6 48.1 59.7 61.8 60.0 59.1 60.6 59.5 59.0
39.5 44.6 60.8 59.8 59.5 69.5 71.2 71.2 71.0 69.2 71.0 70.1
68.7 83.4 93.0 87.5 85.5 99.3 100.0 97.9 97.0 100.0 102.4 100.8
28.6 14.7 24.8 22.1 20.0 24.7 26.7 26.7 26.8 25.0 24.5 24.0
27.8 36.4 39.4 32.1 30.0 37.7 42.4 44.3 46.3 38.1 44.3 47.1
37.3 41.4 40.2 34.0 33.6 42.1 41.0 38.8 38.0 42.2 40.2 38.8
38.9 55.5 80.7 73.3 71.1 87.3 82.3 79.2 77.9 88.7 85.6 82.9
61.5 77.6 75.3 69.1 65.5 80.1 79.2 77.2 76.4 80.4 78.6 77.1
46.0 51.8 52.7 48.8 45.6 57.4 54.7 51.0 49.5 57.5 57.1 55.1
16.3 27.0 37.4 34.7 35.3 47.4 49.3 51.8 53.2 47.3 49.7 52.7
45.8 38.2 42.4 38.9 34.9 39.7 37.3 34.2 31.2 39.9 40.8 39.4
65.5 78.1 86.5 81.0 78.8 91.8 92.1 90.0 89.1 92.4 94.4 92.9
Gross debt, general government (as a percentage of GDP, 2003-2023)
Autumn 2021 Spring 2021
averages forecast forecast
Croatia
Malta
Belgium
Germany
Estonia
Ireland
Greece
Spain
France
Italy
Cyprus
Latvia
Luxembourg
Finland
Euro area
Bulgaria
Czechia
Denmark
Netherlands
Austria
Portugal
Slovenia
Slovakia
Poland
Romania
Sweden
EU
Hungary
Table 42: 25.10.2021
5-year
2003 - 07 2008 - 12 2013 - 17 2018 2019 2020 2021 2022 2023 2020 2021 2022
27.9 25.2 24.8 24.6 25.1 25.1 25.9 25.1 24.9 24.9 24.8 24.3
25.0 26.5 28.1 30.0 29.8 28.2 29.4 29.5 29.9 27.6 28.7 27.9
24.3 25.0 27.5 28.8 28.5 27.7 29.1 29.4 29.9 27.9 26.2 26.9
25.2 15.8 28.9 35.5 35.0 37.2 39.6 38.5 39.1 35.9 36.1 36.2
14.2 7.0 10.4 9.6 10.2 7.1 9.7 13.0 15.0 5.7 7.0 10.5
22.3 18.8 20.8 22.4 23.0 21.5 21.3 22.3 23.4 21.1 21.1 22.5
23.0 21.8 21.9 22.9 23.1 21.2 23.1 23.3 24.4 22.0 22.9 23.1
20.6 17.8 19.2 21.1 21.4 21.3 22.6 22.4 23.5 21.0 21.5 22.5
6.8 14.5 12.6 15.4 14.6 8.8 11.0 13.2 14.8 8.3 9.0 11.2
21.2 24.4 22.7 23.1 22.6 25.2 23.9 23.7 23.6 25.8 22.6 23.0
Lithuania 16.1 16.8 20.2 20.6 21.0 20.8 19.8 18.3 18.6 19.7 18.8 19.5
28.5 21.4 21.3 20.1 16.0 21.6 23.7 23.4 23.3 22.1 23.9 24.7
18.9 16.0 25.3 32.6 29.1 24.0 23.6 25.3 25.8 22.1 22.1 24.6
27.3 27.6 28.9 31.8 31.4 28.7 30.0 30.4 30.4 29.1 29.6 29.9
26.5 26.3 26.1 26.8 27.8 27.7 27.0 26.7 26.5 27.6 27.6 27.9
14.4 12.1 16.3 18.5 18.6 17.5 18.1 18.8 19.3 18.1 18.5 19.4
26.8 22.2 23.8 27.4 26.8 27.6 27.2 27.2 27.9 26.0 25.3 25.2
22.4 21.4 22.9 22.8 21.5 18.5 18.4 20.7 22.3 17.4 19.9 20.8
28.7 24.0 21.3 23.4 23.9 25.0 25.3 25.5 26.2 24.8 24.4 25.1
23.3 22.1 23.8 25.5 25.6 24.6 25.7 25.9 26.6 24.4 25.0 25.2
14.4 19.7 22.7 22.2 22.9 19.7 18.9 19.6 21.6 23.0 25.5 27.1
26.3 23.6 25.5 26.6 26.7 28.2 27.3 26.6 27.5 24.5 24.8 25.5
26.0 25.1 29.0 29.9 30.8 31.1 30.6 31.0 31.1 31.0 31.3 31.9
20.4 18.4 21.8 25.0 25.6 23.0 23.7 24.7 25.5 24.6 22.5 24.7
16.6 20.0 25.0 26.8 27.6 25.9 27.7 26.6 26.9 27.4 27.1 28.2
16.5 17.3 19.3 19.8 20.6 20.6 21.2 21.7 22.1 20.3 19.8 19.5
16.2 22.2 23.4 18.3 18.4 19.0 19.5 21.1 22.9 19.5 20.5 21.5
29.4 29.0 27.6 28.6 30.3 30.4 30.6 31.2 31.7 29.9 30.1 30.7
23.3 22.2 23.9 25.4 25.6 24.7 25.7 25.9 26.6 24.5 25.1 25.3
15.4 12.9 12.7 14.1 15.2 14.0 13.7 14.1 13.7 13.2 11.3 12.4
29.7 26.3 27.6 29.3 29.7 29.8 29.1 29.0 29.0 29.0 28.6 28.2
17.9 15.7 19.5 19.6 19.4 19.2 17.5 17.7 17.8 18.1 18.3 18.2
Gross national saving (as a percentage of GDP, 2003-2023)
Autumn 2021 Spring 2021
averages forecast forecast
Malta
Belgium
Germany
Estonia
Ireland
Greece
Spain
France
Italy
Cyprus
Latvia
Luxembourg
Hungary
Netherlands
Austria
Portugal
Slovenia
Slovakia
Finland
Euro area
Bulgaria
Czechia
Denmark
Croatia
United States
Poland
Romania
Sweden
EU
United Kingdom
Japan
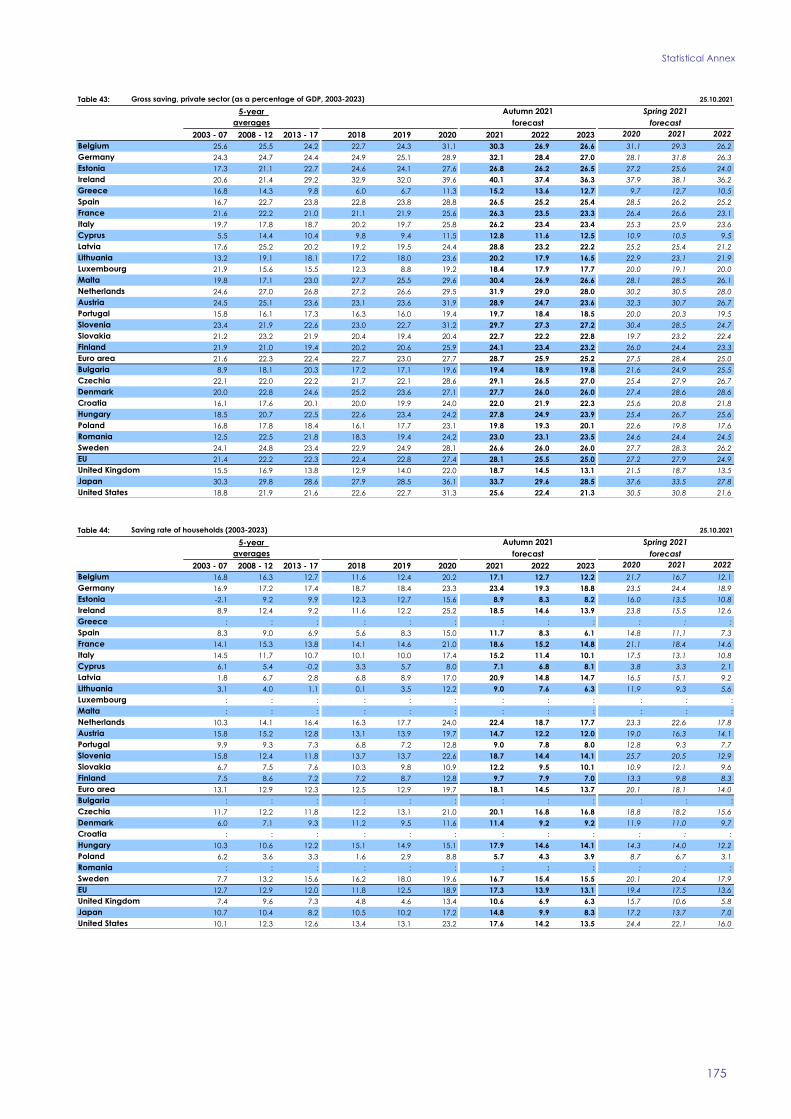
Statistical Annex
175
Table 43: 25.10.2021
5-year
2003 - 07 2008 - 12 2013 - 17 2018 2019 2020 2021 2022 2023 2020 2021 2022
25.6 25.5 24.2 22.7 24.3 31.1 30.3 26.9 26.6 31.1 29.3 26.2
24.3 24.7 24.4 24.9 25.1 28.9 32.1 28.4 27.0 28.1 31.8 26.3
17.3 21.1 22.7 24.6 24.1 27.6 26.8 26.2 26.5 27.2 25.6 24.0
20.6 21.4 29.2 32.9 32.0 39.6 40.1 37.4 36.3 37.9 38.1 36.2
16.8 14.3 9.8 6.0 6.7 11.3 15.2 13.6 12.7 9.7 12.7 10.5
16.7 22.7 23.8 22.8 23.8 28.8 26.5 25.2 25.4 28.5 26.2 25.2
21.6 22.2 21.0 21.1 21.9 25.6 26.3 23.5 23.3 26.4 26.6 23.1
19.7 17.8 18.7 20.2 19.7 25.8 26.2 23.4 23.4 25.3 25.9 23.6
5.5 14.4 10.4 9.8 9.4 11.5 12.8 11.6 12.5 10.9 10.5 9.5
17.6 25.2 20.2 19.2 19.5 24.4 28.8 23.2 22.2 25.2 25.4 21.2
Lithuania 13.2 19.1 18.1 17.2 18.0 23.6 20.2 17.9 16.5 22.9 23.1 21.9
21.9 15.6 15.5 12.3 8.8 19.2 18.4 17.9 17.7 20.0 19.1 20.0
19.8 17.1 23.0 27.7 25.5 29.6 30.4 26.9 26.6 28.1 28.5 26.1
24.6 27.0 26.8 27.2 26.6 29.5 31.9 29.0 28.0 30.2 30.5 28.0
24.5 25.1 23.6 23.1 23.6 31.9 28.9 24.7 23.6 32.3 30.7 26.7
15.8 16.1 17.3 16.3 16.0 19.4 19.7 18.4 18.5 20.0 20.3 19.5
23.4 21.9 22.6 23.0 22.7 31.2 29.7 27.3 27.2 30.4 28.5 24.7
21.2 23.2 21.9 20.4 19.4 20.4 22.7 22.2 22.8 19.7 23.2 22.4
21.9 21.0 19.4 20.2 20.6 25.9 24.1 23.4 23.2 26.0 24.4 23.3
21.6 22.3 22.4 22.7 23.0 27.7 28.7 25.9 25.2 27.5 28.4 25.0
8.9 18.1 20.3 17.2 17.1 19.6 19.4 18.9 19.8 21.6 24.9 25.5
22.1 22.0 22.2 21.7 22.1 28.6 29.1 26.5 27.0 25.4 27.9 26.7
20.0 22.8 24.6 25.2 23.6 27.1 27.7 26.0 26.0 27.4 28.6 28.6
16.1 17.6 20.1 20.0 19.9 24.0 22.0 21.9 22.3 25.6 20.8 21.8
18.5 20.7 22.5 22.6 23.4 24.2 27.8 24.9 23.9 25.4 26.7 25.6
16.8 17.8 18.4 16.1 17.7 23.1 19.8 19.3 20.1 22.6 19.8 17.6
12.5 22.5 21.8 18.3 19.4 24.2 23.0 23.1 23.5 24.6 24.4 24.5
24.1 24.8 23.4 22.9 24.9 28.1 26.6 26.0 26.0 27.7 28.3 26.2
21.4 22.2 22.3 22.4 22.8 27.4 28.1 25.5 25.0 27.2 27.9 24.9
15.5 16.9 13.8 12.9 14.0 22.0 18.7 14.5 13.1 21.5 18.7 13.5
30.3 29.8 28.6 27.9 28.5 36.1 33.7 29.6 28.5 37.6 33.5 27.8
18.8 21.9 21.6 22.6 22.7 31.3 25.6 22.4 21.3 30.5 30.8 21.6
Gross saving, private sector (as a percentage of GDP, 2003-2023)
Autumn 2021 Spring 2021
averages forecast forecast
Malta
Belgium
Germany
Estonia
Ireland
Greece
Spain
France
Italy
Cyprus
Latvia
Luxembourg
Hungary
Netherlands
Austria
Portugal
Slovenia
Slovakia
Finland
Euro area
Bulgaria
Czechia
Denmark
Croatia
United States
Poland
Romania
Sweden
EU
United Kingdom
Japan
Table 44: 25.10.2021
5-year
2003 - 07 2008 - 12 2013 - 17 2018 2019 2020 2021 2022 2023 2020 2021 2022
16.8 16.3 12.7 11.6 12.4 20.2 17.1 12.7 12.2 21.7 16.7 12.1
16.9 17.2 17.4 18.7 18.4 23.3 23.4 19.3 18.8 23.5 24.4 18.9
-2.1 9.2 9.9 12.3 12.7 15.6 8.9 8.3 8.2 16.0 13.5 10.8
8.9 12.4 9.2 11.6 12.2 25.2 18.5 14.6 13.9 23.8 15.5 12.6
: : : : : : : : : : : :
8.3 9.0 6.9 5.6 8.3 15.0 11.7 8.3 6.1 14.8 11.1 7.3
14.1 15.3 13.8 14.1 14.6 21.0 18.6 15.2 14.8 21.1 18.4 14.6
14.5 11.7 10.7 10.1 10.0 17.4 15.2 11.4 10.1 17.5 13.1 10.8
6.1 5.4 -0.2 3.3 5.7 8.0 7.1 6.8 8.1 3.8 3.3 2.1
1.8 6.7 2.8 6.8 8.9 17.0 20.9 14.8 14.7 16.5 15.1 9.2
Lithuania 3.1 4.0 1.1 0.1 3.5 12.2 9.0 7.6 6.3 11.9 9.3 5.6
: : : : : : : : : : : :
: : : : : : : : : : : : :
10.3 14.1 16.4 16.3 17.7 24.0 22.4 18.7 17.7 23.3 22.6 17.8
15.8 15.2 12.8 13.1 13.9 19.7 14.7 12.2 12.0 19.0 16.3 14.1
9.9 9.3 7.3 6.8 7.2 12.8 9.0 7.8 8.0 12.8 9.3 7.7
15.8 12.4 11.8 13.7 13.7 22.6 18.7 14.4 14.1 25.7 20.5 12.9
6.7 7.5 7.6 10.3 9.8 10.9 12.2 9.5 10.1 10.9 12.1 9.6
7.5 8.6 7.2 7.2 8.7 12.8 9.7 7.9 7.0 13.3 9.8 8.3
13.1 12.9 12.3 12.5 12.9 19.7 18.1 14.5 13.7 20.1 18.1 14.0
: : : : : : : : : : : : :
11.7 12.2 11.8 12.2 13.1 21.0 20.1 16.8 16.8 18.8 18.2 15.6
6.0 7.1 9.3 11.2 9.5 11.6 11.4 9.2 9.2 11.9 11.0 9.7
: : : : : : : : : : : : :
10.3 10.6 12.2 15.1 14.9 15.1 17.9 14.6 14.1 14.3 14.0 12.2
6.2 3.6 3.3 1.6 2.9 8.8 5.7 4.3 3.9 8.7 6.7 3.1
: : : : : : : : : : : :
7.7 13.2 15.6 16.2 18.0 19.6 16.7 15.4 15.5 20.1 20.4 17.9
12.7 12.9 12.0 11.8 12.5 18.9 17.3 13.9 13.1 19.4 17.5 13.6
7.4 9.6 7.3 4.8 4.6 13.4 10.6 6.9 6.3 15.7 10.6 5.8
10.7 10.4 8.2 10.5 10.2 17.2 14.8 9.9 8.3 17.2 13.7 7.0
10.1 12.3 12.6 13.4 13.1 23.2 17.6 14.2 13.5 24.4 22.1 16.0
Saving rate of households (2003-2023)
Autumn 2021 Spring 2021
averages forecast forecast
Malta
Belgium
Germany
Estonia
Ireland
Greece
Spain
France
Italy
Cyprus
Latvia
Luxembourg
Hungary
Netherlands
Austria
Portugal
Slovenia
Slovakia
Finland
Euro area
Bulgaria
Czechia
Denmark
Croatia
United States
Poland
Romania
Sweden
EU
United Kingdom
Japan

European Economic Forecast, Autumn 2021
176
Table 45: 25.10.2021
5-year
2003 - 07 2008 - 12 2013 - 17 2018 2019 2020 2021 2022 2023 2020 2021 2022
2.3 -0.2 0.6 1.8 0.8 -6.0 -4.4 -1.7 -1.7 -6.3 -4.5 -1.9
0.7 1.7 3.7 5.1 4.7 -0.7 -2.6 1.1 2.8 -0.5 -3.2 1.6
7.0 3.9 4.8 4.2 4.4 0.1 2.3 3.2 3.3 0.7 0.7 2.8
4.6 -5.6 -0.3 2.6 3.0 -2.4 -0.6 1.1 2.8 -2.0 -2.0 0.1
-2.6 -7.3 0.6 3.6 3.5 -4.2 -5.5 -0.6 2.3 -4.0 -5.7 0.0
5.5 -3.9 -3.0 -0.4 -0.9 -7.3 -5.2 -2.9 -2.0 -7.4 -5.1 -2.7
1.4 -0.4 0.9 1.8 1.2 -4.3 -3.2 -0.2 1.2 -4.4 -3.7 0.0
0.9 0.1 0.6 0.9 1.7 -4.5 -3.6 -1.0 0.0 -4.3 -4.4 -1.1
1.4 0.1 2.3 5.6 5.2 -2.8 -1.9 1.7 2.3 -2.6 -1.5 1.7
3.6 -0.8 2.5 3.9 3.1 0.8 -4.9 0.5 1.4 0.6 -2.9 1.8
Lithuania 2.9 -2.3 2.1 3.4 3.0 -2.8 -0.3 0.4 2.1 -3.2 -4.3 -2.4
6.6 5.9 5.8 7.8 7.2 2.4 5.3 5.5 5.6 2.1 4.8 4.7
-0.9 -1.1 2.3 4.9 3.6 -5.6 -6.7 -1.6 -0.8 -6.0 -6.4 -1.5
2.6 0.5 2.2 4.5 4.9 -0.8 -1.9 1.4 2.5 -1.0 -1.0 1.9
2.0 1.2 2.6 3.7 4.2 -4.2 -1.9 2.0 3.0 -4.7 -3.1 1.2
-1.4 -4.0 -1.0 2.2 2.6 -1.8 -1.6 0.4 0.8 -2.0 -1.8 -0.1
3.3 0.3 1.2 4.4 4.1 -3.6 -2.5 0.0 0.6 -4.4 -3.1 0.5
1.2 -1.8 1.0 2.4 2.1 -1.9 -4.2 -1.5 -0.6 -2.3 -3.3 -1.6
6.8 3.0 1.9 3.2 3.2 -0.9 1.2 2.1 3.0 -1.2 0.0 1.8
1.8 -0.2 1.4 2.8 2.6 -3.1 -3.0 0.0 1.3 -3.1 -3.4 0.2
5.5 1.6 2.4 4.9 5.8 0.1 -0.5 0.6 1.8 1.4 0.6 1.6
4.2 1.6 3.3 4.9 4.6 -0.4 -1.8 0.1 0.5 -1.0 -3.1 -1.2
6.0 2.3 4.4 4.6 7.2 4.0 2.9 5.0 5.0 3.6 2.8 3.3
4.3 0.8 1.7 5.0 5.7 -1.0 1.8 2.8 3.3 -1.0 1.7 2.8
-1.9 -0.6 2.4 4.2 4.3 1.7 -0.1 1.7 3.0 1.9 0.4 2.6
-0.2 -0.5 0.9 3.7 2.8 -2.5 1.4 2.5 2.0 -2.3 0.0 1.9
3.8 -0.3 1.6 0.0 -1.1 -5.2 -3.5 -2.0 -0.7 -5.1 -3.9 -3.0
5.3 4.2 4.2 5.7 5.4 2.3 4.0 5.2 5.7 2.2 1.8 4.5
2.0 0.0 1.6 3.0 2.9 -2.6 -2.3 0.4 1.6 -2.6 -2.9 0.4
0.0 -4.0 -1.0 1.2 1.2 -8.0 -5.0 -0.4 0.6 -8.3 -7.5 -1.1
-0.6 -3.5 -0.9 1.3 1.3 -6.3 -4.6 -0.6 0.4 -8.6 -4.9 0.4
-0.9 -6.2 -2.1 -3.0 -3.3 -12.2 -8.1 -4.6 -3.5 -12.4 -12.5 -3.4
Gross saving, general government (as a percentage of GDP, 2003-2023)
Autumn 2021 Spring 2021
averages forecast forecast
Malta
Belgium
Germany
Estonia
Ireland
Greece
Spain
France
Italy
Cyprus
Latvia
Luxembourg
Hungary
Netherlands
Austria
Portugal
Slovenia
Slovakia
Finland
Euro area
Bulgaria
Czechia
Denmark
Croatia
United States
Poland
Romania
Sweden
EU
United Kingdom
Japan
Table 46: 25.10.2021
5-year
2003 - 07 2008 - 12 2013 - 17 2018 2019 2020 2021 2022 2023 2020 2021 2022
4.9 0.8 4.2 0.6 2.0 -5.5 9.9 3.7 2.7 -4.6 5.9 3.9
8.2 2.2 3.7 2.3 1.1 -9.3 7.8 7.9 5.4 -9.4 10.4 4.8
13.8 5.4 2.7 3.9 6.5 -5.0 11.3 7.6 4.5 -5.5 5.5 5.7
5.0 1.8 13.5 11.5 10.4 9.5 15.2 5.9 5.1 6.2 6.8 4.9
7.2 -1.9 4.6 9.1 4.9 -21.5 16.2 15.0 9.2 -21.7 9.1 14.8
4.4 1.0 4.8 1.7 2.5 -20.1 12.1 10.4 7.1 -20.2 10.4 12.8
3.4 1.2 3.2 4.5 1.6 -15.8 8.4 8.7 7.5 -16.0 10.0 9.6
4.5 -0.9 2.9 2.1 1.6 -14.0 12.8 7.5 5.1 -13.8 10.4 7.9
2.2 1.4 6.9 7.3 7.5 -5.1 6.2 7.4 6.8 -12.4 5.3 7.6
12.3 4.5 4.0 4.5 2.1 -2.2 6.6 4.9 3.8 -2.7 6.5 6.1
Lithuania 10.3 7.3 5.1 6.8 9.9 0.4 11.8 5.3 4.4 0.0 6.5 6.0
7.2 1.6 4.6 3.6 5.8 1.3 10.4 3.9 3.0 2.5 3.0 1.8
5.8 7.4 6.3 -0.1 5.8 -6.3 5.2 6.4 4.1 -7.8 5.2 5.7
5.6 2.0 4.5 4.3 2.0 -4.8 6.9 5.2 2.9 -4.3 6.4 5.2
6.2 1.2 2.9 5.1 3.4 -10.8 8.4 9.0 5.4 -10.4 7.5 7.2
5.5 1.5 6.1 4.1 4.1 -18.6 11.1 9.5 4.0 -18.6 10.3 8.9
11.0 0.6 6.2 6.2 4.5 -8.7 11.9 7.6 6.1 -8.7 9.5 7.5
18.1 4.1 5.0 5.1 0.8 -7.3 11.7 6.5 5.9 -7.5 12.2 5.3
6.6 -1.6 2.3 1.5 6.8 -6.8 8.1 6.6 4.7 -6.6 5.1 7.0
5.9 1.4 4.3 3.6 2.7 -9.1 9.7 7.3 5.2 -9.3 8.7 6.5
13.2 2.9 6.7 1.7 4.0 -12.1 10.0 8.0 5.4 -11.3 7.0 8.3
16.2 4.2 5.3 3.7 1.5 -6.9 8.4 4.5 5.9 -5.9 8.5 6.2
4.6 1.0 3.4 3.4 5.0 -7.0 7.9 6.6 4.4 -7.7 5.4 6.1
6.3 -1.7 6.8 3.7 6.8 -22.7 22.1 15.0 9.0 -25.0 16.3 12.2
14.4 2.1 6.2 5.0 5.4 -5.9 10.9 9.5 8.8 -6.8 10.3 8.8
10.8 5.0 7.8 6.9 5.2 0.1 11.6 6.9 6.2 -0.2 8.8 6.9
12.8 7.0 11.4 5.3 5.4 -9.7 9.6 7.1 5.8 -9.7 9.8 8.7
7.0 0.8 3.1 4.2 6.0 -4.6 6.4 4.7 3.6 -5.2 7.8 4.4
6.4 1.6 4.5 3.8 3.0 -8.5 9.7 7.2 5.3 -8.7 8.7 6.5
5.0 1.0 2.9 2.8 3.4 -14.7 0.5 7.3 1.0 -15.8 0.9 5.8
10.0 -0.6 4.3 3.8 -1.4 -12.3 12.6 5.2 3.2 -12.3 10.7 4.1
7.3 4.1 2.3 2.8 -0.1 -13.6 6.1 7.7 3.8 -13.0 9.1 7.7
Exports of goods and services, volume (percentage change on preceding year, 2003-2023)
Autumn 2021 Spring 2021
averages forecast forecast
Malta
Belgium
Germany
Estonia
Ireland
Greece
Spain
France
Italy
Cyprus
Latvia
Luxembourg
Hungary
Netherlands
Austria
Portugal
Slovenia
Slovakia
Finland
Euro area
Bulgaria
Czechia
Denmark
Croatia
United States
Poland
Romania
Sweden
EU
United Kingdom
Japan
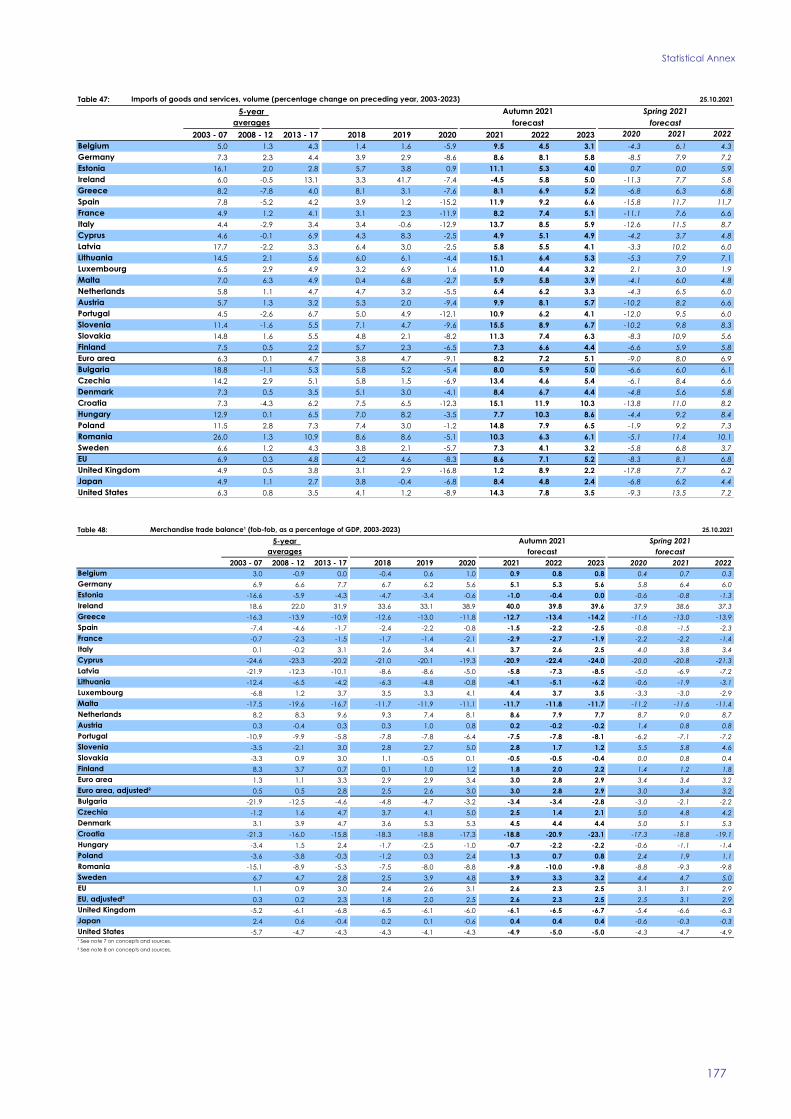
Statistical Annex
177
Table 47: 25.10.2021
5-year
2003 - 07 2008 - 12 2013 - 17 2018 2019 2020 2021 2022 2023 2020 2021 2022
5.0 1.3 4.3 1.4 1.6 -5.9 9.5 4.5 3.1 -4.3 6.1 4.3
7.3 2.3 4.4 3.9 2.9 -8.6 8.6 8.1 5.8 -8.5 7.9 7.2
16.1 2.0 2.8 5.7 3.8 0.9 11.1 5.3 4.0 0.7 0.0 5.9
6.0 -0.5 13.1 3.3 41.7 -7.4 -4.5 5.8 5.0 -11.3 7.7 5.8
8.2 -7.8 4.0 8.1 3.1 -7.6 8.1 6.9 5.2 -6.8 6.3 6.8
7.8 -5.2 4.2 3.9 1.2 -15.2 11.9 9.2 6.6 -15.8 11.7 11.7
4.9 1.2 4.1 3.1 2.3 -11.9 8.2 7.4 5.1 -11.1 7.6 6.6
4.4 -2.9 3.4 3.4 -0.6 -12.9 13.7 8.5 5.9 -12.6 11.5 8.7
4.6 -0.1 6.9 4.3 8.3 -2.5 4.9 5.1 4.9 -4.2 3.7 4.8
17.7 -2.2 3.3 6.4 3.0 -2.5 5.8 5.5 4.1 -3.3 10.2 6.0
Lithuania 14.5 2.1 5.6 6.0 6.1 -4.4 15.1 6.4 5.3 -5.3 7.9 7.1
6.5 2.9 4.9 3.2 6.9 1.6 11.0 4.4 3.2 2.1 3.0 1.9
7.0 6.3 4.9 0.4 6.8 -2.7 5.9 5.8 3.9 -4.1 6.0 4.8
5.8 1.1 4.7 4.7 3.2 -5.5 6.4 6.2 3.3 -4.3 6.5 6.0
5.7 1.3 3.2 5.3 2.0 -9.4 9.9 8.1 5.7 -10.2 8.2 6.6
4.5 -2.6 6.7 5.0 4.9 -12.1 10.9 6.2 4.1 -12.0 9.5 6.0
11.4 -1.6 5.5 7.1 4.7 -9.6 15.5 8.9 6.7 -10.2 9.8 8.3
14.8 1.6 5.5 4.8 2.1 -8.2 11.3 7.4 6.3 -8.3 10.9 5.6
7.5 0.5 2.2 5.7 2.3 -6.5 7.3 6.6 4.4 -6.6 5.9 5.8
6.3 0.1 4.7 3.8 4.7 -9.1 8.2 7.2 5.1 -9.0 8.0 6.9
18.8 -1.1 5.3 5.8 5.2 -5.4 8.0 5.9 5.0 -6.6 6.0 6.1
14.2 2.9 5.1 5.8 1.5 -6.9 13.4 4.6 5.4 -6.1 8.4 6.6
7.3 0.5 3.5 5.1 3.0 -4.1 8.4 6.7 4.4 -4.8 5.6 5.8
7.3 -4.3 6.2 7.5 6.5 -12.3 15.1 11.9 10.3 -13.8 11.0 8.2
12.9 0.1 6.5 7.0 8.2 -3.5 7.7 10.3 8.6 -4.4 9.2 8.4
11.5 2.8 7.3 7.4 3.0 -1.2 14.8 7.9 6.5 -1.9 9.2 7.3
26.0 1.3 10.9 8.6 8.6 -5.1 10.3 6.3 6.1 -5.1 11.4 10.1
6.6 1.2 4.3 3.8 2.1 -5.7 7.3 4.1 3.2 -5.8 6.8 3.7
6.9 0.3 4.8 4.2 4.6 -8.3 8.6 7.1 5.2 -8.3 8.1 6.8
4.9 0.5 3.8 3.1 2.9 -16.8 1.2 8.9 2.2 -17.8 7.7 6.2
4.9 1.1 2.7 3.8 -0.4 -6.8 8.4 4.8 2.4 -6.8 6.2 4.4
6.3 0.8 3.5 4.1 1.2 -8.9 14.3 7.8 3.5 -9.3 13.5 7.2
Imports of goods and services, volume (percentage change on preceding year, 2003-2023)
Autumn 2021 Spring 2021
averages forecast forecast
Malta
Belgium
Germany
Estonia
Ireland
Greece
Spain
France
Italy
Cyprus
Latvia
Luxembourg
Hungary
Netherlands
Austria
Portugal
Slovenia
Slovakia
Finland
Euro area
Bulgaria
Czechia
Denmark
Croatia
United States
Poland
Romania
Sweden
EU
United Kingdom
Japan
Table 48: 25.10.2021
5-year
2003 - 07 2008 - 12 2013 - 17 2018 2019 2020 2021 2022 2023 2020 2021 2022
3.0 -0.9 0.0 -0.4 0.6 1.0 0.9 0.8 0.8 0.4 0.7 0.3
6.9 6.6 7.7 6.7 6.2 5.6 5.1 5.3 5.6 5.8 6.4 6.0
-16.6 -5.9 -4.3 -4.7 -3.4 -0.6 -1.0 -0.4 0.0 -0.6 -0.8 -1.3
18.6 22.0 31.9 33.6 33.1 38.9 40.0 39.8 39.6 37.9 38.6 37.3
-16.3 -13.9 -10.9 -12.6 -13.0 -11.8 -12.7 -13.4 -14.2 -11.6 -13.0 -13.9
-7.4 -4.6 -1.7 -2.4 -2.2 -0.8 -1.5 -2.2 -2.5 -0.8 -1.5 -2.3
-0.7 -2.3 -1.5 -1.7 -1.4 -2.1 -2.9 -2.7 -1.9 -2.2 -2.2 -1.4
0.1 -0.2 3.1 2.6 3.4 4.1 3.7 2.6 2.5 4.0 3.8 3.4
-24.6 -23.3 -20.2 -21.0 -20.1 -19.3 -20.9 -22.4 -24.0 -20.0 -20.8 -21.3
-21.9 -12.3 -10.1 -8.6 -8.6 -5.0 -5.8 -7.3 -8.5 -5.0 -6.9 -7.2
Lithuania -12.4 -6.5 -4.2 -6.3 -4.8 -0.8 -4.1 -5.1 -6.2 -0.6 -1.9 -3.1
-6.8 1.2 3.7 3.5 3.3 4.1 4.4 3.7 3.5 -3.3 -3.0 -2.9
-17.5 -19.6 -16.7 -11.7 -11.9 -11.1 -11.7 -11.8 -11.7 -11.2 -11.6 -11.4
8.2 8.3 9.6 9.3 7.4 8.1 8.6 7.9 7.7 8.7 9.0 8.7
0.3 -0.4 0.3 0.3 1.0 0.8 0.2 -0.2 -0.2 1.4 0.8 0.8
-10.9 -9.9 -5.8 -7.8 -7.8 -6.4 -7.5 -7.8 -8.1 -6.2 -7.1 -7.2
-3.5 -2.1 3.0 2.8 2.7 5.0 2.8 1.7 1.2 5.5 5.8 4.6
-3.3 0.9 3.0 1.1 -0.5 0.1 -0.5 -0.5 -0.4 0.0 0.8 0.4
8.3 3.7 0.7 0.1 1.0 1.2 1.8 2.0 2.2 1.4 1.2 1.8
1.3 1.1 3.3 2.9 2.9 3.4 3.0 2.8 2.9 3.4 3.4 3.2
0.5 0.5 2.8 2.5 2.6 3.0 3.0 2.8 2.9 3.0 3.4 3.2
-21.9 -12.5 -4.6 -4.8 -4.7 -3.2 -3.4 -3.4 -2.8 -3.0 -2.1 -2.2
-1.2 1.6 4.7 3.7 4.1 5.0 2.5 1.4 2.1 5.0 4.8 4.2
3.1 3.9 4.7 3.6 5.3 5.3 4.5 4.4 4.4 5.0 5.1 5.3
-21.3 -16.0 -15.8 -18.3 -18.8 -17.3 -18.8 -20.9 -23.1 -17.3 -18.8 -19.1
-3.4 1.5 2.4 -1.7 -2.5 -1.0 -0.7 -2.2 -2.2 -0.6 -1.1 -1.4
-3.6 -3.8 -0.3 -1.2 0.3 2.4 1.3 0.7 0.8 2.4 1.9 1.1
-15.1 -8.9 -5.3 -7.5 -8.0 -8.8 -9.8 -10.0 -9.8 -8.8 -9.3 -9.8
6.7 4.7 2.8 2.5 3.9 4.8 3.9 3.3 3.2 4.4 4.7 5.0
1.1 0.9 3.0 2.4 2.6 3.1 2.6 2.3 2.5 3.1 3.1 2.9
0.3 0.2 2.3 1.8 2.0 2.5 2.6 2.3 2.5 2.5 3.1 2.9
-5.2 -6.1 -6.8 -6.5 -6.1 -6.0 -6.1 -6.5 -6.7 -5.4 -6.6 -6.3
2.4 0.6 -0.4 0.2 0.1 -0.6 0.4 0.4 0.4 -0.6 -0.3 -0.3
-5.7 -4.7 -4.3 -4.3 -4.1 -4.3 -4.9 -5.0 -5.0 -4.3 -4.7 -4.9
Belgium
Germany
Estonia
Ireland
Greece
Merchandise trade balance¹ (fob-fob, as a percentage of GDP, 2003-2023)
Autumn 2021 Spring 2021
averages forecast forecast
Spain
France
Italy
Cyprus
Latvia
Luxembourg
Malta
Hungary
Poland
Romania
Netherlands
Austria
Portugal
Slovenia
Slovakia
² See note 8 on concepts and sources.
Sweden
EU
Finland
Euro area
Euro area, adjusted²
Bulgaria
Czechia
Denmark
Croatia
EU, adjusted²
United Kingdom
Japan
United States¹ See note 7 on concepts and sources.

European Economic Forecast, Autumn 2021
178
Table 49: 25.10.2021
5-year
2003 - 07 2008 - 12 2013 - 17 2018 2019 2020 2021 2022 2023 2020 2021 2022
4.7 1.4 1.2 -0.8 0.1 0.8 0.8 0.3 0.0 0.1 -0.1 -0.5
4.7 6.2 7.9 8.1 7.6 7.1 6.7 6.8 6.9 7.2 7.8 6.9
-12.7 -1.0 1.2 0.8 2.0 -0.8 -1.1 0.2 0.5 -1.0 1.9 1.7
-3.0 -3.4 0.7 6.0 -11.3 -2.8 15.4 14.4 14.6 4.6 4.5 4.2
-11.4 -10.4 -1.8 -3.5 -2.4 -7.9 -6.3 -4.0 -2.8 -7.8 -7.6 -5.3
-7.0 -3.9 2.3 1.9 2.1 0.8 0.3 0.8 1.0 0.7 -0.1 0.3
0.4 -0.8 -0.8 -0.9 -0.8 -2.6 -2.4 -2.2 -1.0 -2.0 -1.7 -1.2
-1.0 -2.2 1.9 2.5 3.2 3.8 3.5 2.7 2.7 3.5 2.9 3.1
-15.8 -7.7 -3.0 -3.9 -5.7 -10.1 -9.1 -7.3 -5.7 -11.8 -11.0 -8.9
-14.7 -1.9 -0.4 -0.2 -0.7 2.9 1.1 -0.2 -1.1 3.0 -0.4 -0.4
Lithuania -9.6 -3.3 0.4 0.3 3.5 7.3 2.6 1.9 1.2 7.6 6.0 5.8
8.0 2.9 2.7 3.0 -2.4 3.7 5.5 5.2 5.2 6.5 7.9 8.6
-5.5 -3.8 4.6 10.7 7.7 1.6 0.4 1.8 1.9 -1.3 -1.9 0.1
6.1 7.2 9.0 10.8 9.4 7.0 8.4 9.0 8.9 7.8 8.1 8.6
2.3 2.8 2.1 1.0 2.2 1.9 -0.1 -0.2 -0.5 2.7 2.2 2.7
-8.9 -7.8 0.5 0.3 0.1 -1.2 -0.9 -0.4 -0.4 -1.1 -0.8 -0.4
-2.7 -1.7 4.5 6.1 6.1 7.6 5.4 4.8 4.8 5.4 4.3 3.3
-5.4 -2.3 0.4 -0.3 -2.0 -0.8 -1.7 -1.0 -1.1 -1.5 -0.3 -0.4
4.4 0.5 -1.4 -1.8 -0.3 0.8 1.2 1.2 1.5 0.3 0.0 0.5
0.5 0.8 3.3 3.6 3.1 2.6 3.1 3.2 3.4 3.0 3.1 3.1
0.2 -0.4 2.7 2.9 2.3 2.0 3.1 3.2 3.4 2.2 3.1 3.1
-12.8 -6.1 2.9 1.0 1.9 -0.6 0.4 1.2 2.7 4.1 6.0 7.5
-4.1 -4.2 -0.8 -0.6 -0.9 2.2 -1.2 -2.5 -1.7 0.1 -0.3 -0.8
3.1 5.2 8.1 7.3 8.8 8.1 7.4 7.3 7.1 7.8 8.0 8.4
-7.4 -4.5 1.6 1.9 2.8 -0.9 0.8 0.8 0.3 -1.1 -2.0 -0.7
-9.2 -1.6 2.2 0.0 -0.8 -1.6 -1.1 -2.4 -1.9 -0.3 -0.6 -0.5
-4.6 -4.8 -0.7 -1.0 0.8 3.4 2.6 2.6 2.9 3.1 2.8 2.1
-9.6 -6.3 -1.1 -4.4 -5.3 -5.5 -6.5 -6.3 -6.1 -5.0 -4.9 -4.6
6.6 6.0 3.4 2.5 5.2 5.6 5.1 4.8 5.0 5.4 6.0 6.7
0.4 0.7 3.2 3.2 3.0 2.7 3.0 3.0 3.2 3.0 3.1 3.1
0.0 0.4 2.8 2.9 2.4 2.4 3.0 3.0 3.2 2.6 3.1 3.1
-2.4 -3.1 -4.8 -3.9 -2.7 -2.6 -2.8 -3.0 -3.4 -3.5 -5.0 -4.8
3.7 2.5 2.6 3.5 3.7 3.3 3.5 3.4 3.3 2.6 3.3 3.2
-5.3 -3.2 -2.1 -2.1 -2.2 -2.8 -3.6 -3.6 -3.5 -2.9 -3.4 -3.4
Belgium
Germany
Estonia
Ireland
Greece
Current-account balance¹ (as a percentage of GDP, 2003-2023)
Autumn 2021 Spring 2021
averages forecast forecast
Spain
France
Italy
Cyprus
Latvia
Luxembourg
Malta
Hungary
Poland
Romania
Netherlands
Austria
Portugal
Slovenia
Slovakia
² See note 8 on concepts and sources.
Sweden
EU
Finland
Euro area
Euro area, adjusted²
Bulgaria
Czechia
Denmark
Croatia
EU, adjusted²
United Kingdom
Japan
United States¹ See note 7 on concepts and sources.
Table 50: 25.10.2021
5-year
2003 - 07 2008 - 12 2013 - 17 2018 2019 2020 2021 2022 2023 2020 2021 2022
4.6 1.4 1.2 -0.7 0.3 0.8 0.8 0.3 0.0 0.2 0.0 -0.4
4.7 6.1 7.7 7.9 7.5 6.7 6.3 6.4 6.5 6.9 7.4 6.6
-11.6 2.1 2.8 2.2 3.7 1.3 0.4 1.6 1.8 0.3 3.2 2.9
-2.8 -3.3 -2.3 -9.9 -21.2 -6.9 11.1 9.9 9.9 -0.3 2.0 3.9
-9.8 -8.7 0.1 -2.3 -1.1 -5.8 -4.1 -1.7 -0.4 -6.2 -5.9 -3.5
-6.3 -3.5 2.8 2.4 2.4 1.2 1.5 2.3 2.6 1.1 0.4 0.7
0.3 -0.9 -0.8 -0.8 -0.8 -2.5 -2.0 -1.7 -0.6 -2.2 -1.1 -0.6
-0.9 -2.2 2.0 2.5 3.1 3.7 3.4 2.7 2.7 3.5 2.9 3.1
-15.3 -7.4 -2.7 -3.3 -5.6 -10.0 -9.1 -7.2 -5.6 -11.6 -10.9 -8.8
-13.5 0.3 1.7 1.6 0.8 4.7 3.2 2.5 1.9 4.7 1.6 2.3
Lithuania -8.5 0.0 2.7 1.8 5.2 9.1 4.2 3.5 2.8 9.7 8.2 8.2
7.1 1.5 1.8 1.8 -3.3 2.8 4.7 4.4 4.5 5.8 7.3 8.0
-3.7 -2.5 6.0 11.6 8.4 2.2 1.4 2.8 2.9 -0.7 -0.9 1.1
6.2 6.6 8.7 10.8 9.3 6.9 8.4 8.9 8.9 7.8 8.1 8.6
2.2 2.7 1.9 0.4 2.2 1.8 -0.2 -0.3 -0.6 2.6 2.1 2.6
-7.4 -6.4 1.7 1.2 1.0 -0.1 0.3 1.0 1.2 0.1 0.5 1.1
-2.9 -1.1 4.5 5.7 5.8 7.1 5.0 4.4 4.4 5.0 4.0 2.9
-5.3 -1.1 1.2 -0.3 -2.0 -0.8 -1.5 -0.2 1.5 -1.6 -0.4 -0.6
4.5 0.6 -1.3 -1.8 -0.2 0.9 1.3 1.3 1.6 0.4 0.1 0.6
0.7 0.9 3.3 3.2 2.8 2.5 3.1 3.2 3.5 2.8 3.1 3.2
0.3 -0.3 2.7 2.5 2.0 1.8 3.1 3.2 3.5 2.0 3.1 3.2
-12.6 -4.9 4.9 2.0 3.3 0.9 2.4 3.7 5.0 6.0 6.8 8.0
-4.0 -2.7 0.8 0.2 -0.4 3.5 0.0 -0.4 0.4 0.8 0.3 -0.2
3.2 5.2 8.0 7.3 8.8 8.1 7.4 7.2 7.0 7.8 8.0 8.4
-7.3 -4.3 2.4 3.2 4.5 1.3 4.3 5.3 4.8 1.5 0.5 2.8
-8.8 0.3 4.8 2.2 1.0 0.1 0.6 0.2 0.7 1.8 1.5 1.8
-4.2 -3.4 0.8 0.1 2.1 4.6 4.0 4.1 4.6 4.8 5.0 4.9
-8.9 -5.4 1.3 -3.2 -3.8 -3.8 -4.9 -4.7 -4.4 -3.4 -3.2 -3.0
6.4 5.9 3.3 2.6 5.2 5.7 5.2 4.8 5.1 5.4 6.0 6.7
0.5 0.8 3.3 3.0 2.8 2.7 3.1 3.2 3.5 3.0 3.3 3.4
0.2 0.5 3.0 2.6 2.3 2.4 3.1 3.2 3.5 2.6 3.3 3.4
-2.5 -3.1 -4.9 -4.0 -2.7 -2.7 -2.9 -3.1 -3.5 -3.6 -5.0 -4.9
3.7 2.4 2.5 3.5 3.6 3.2 3.4 3.3 3.3 2.6 3.2 3.2
-5.4 -3.2 -2.2 -2.2 -2.3 -2.8 -3.6 -3.6 -3.5 -3.0 -3.4 -3.4
Belgium
Germany
Estonia
Ireland
Greece
Net lending (+) or net borrowing (-) of the nation¹ (as a percentage of GDP, 2003-2023)
Autumn 2021 Spring 2021
averages forecast forecast
Spain
France
Italy
Cyprus
Latvia
Luxembourg
Malta
Hungary
Poland
Romania
Netherlands
Austria
Portugal
Slovenia
Slovakia
² See note 8 on concepts and sources.
Sweden
EU
Finland
Euro area
Euro area, adjusted²
Bulgaria
Czechia
Denmark
Croatia
EU, adjusted²
United Kingdom
Japan
United States¹ See note 7 on concepts and sources.
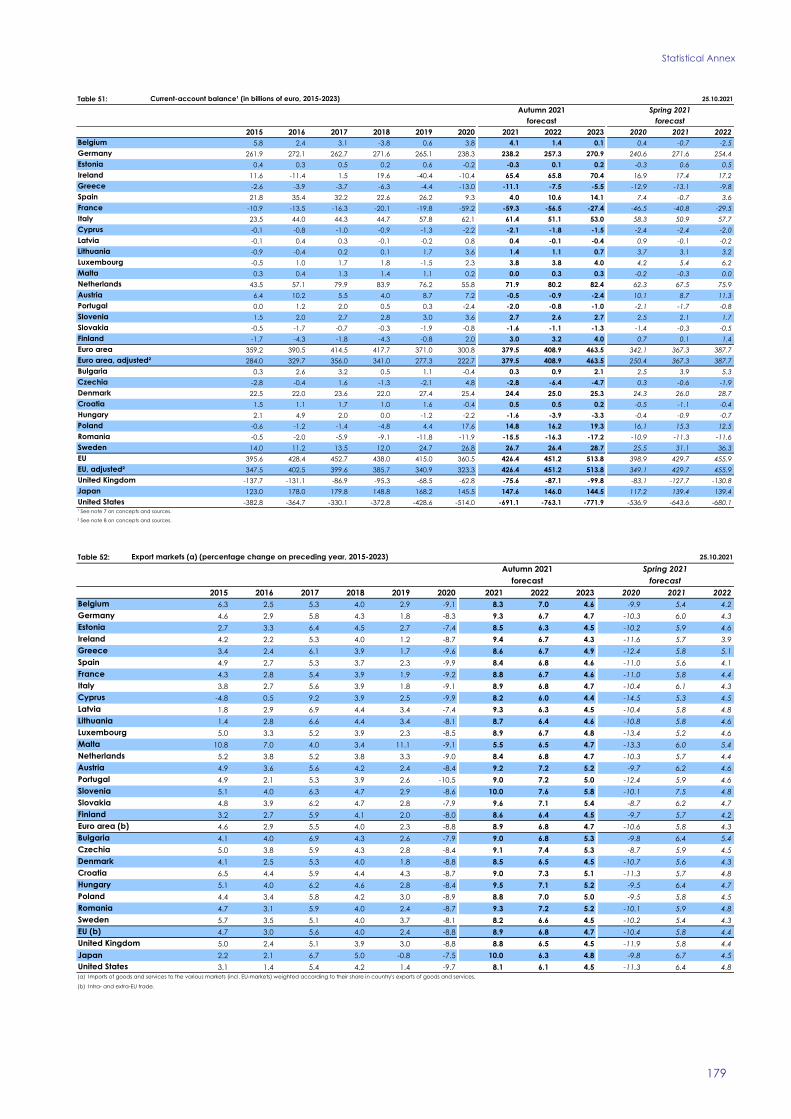
Statistical Annex
179
Table 51: 25.10.2021
2015 2016 2017 2018 2019 2020 2021 2022 2023 2020 2021 2022
5.8 2.4 3.1 -3.8 0.6 3.8 4.1 1.4 0.1 0.4 -0.7 -2.5
261.9 272.1 262.7 271.6 265.1 238.3 238.2 257.3 270.9 240.6 271.6 254.4
0.4 0.3 0.5 0.2 0.6 -0.2 -0.3 0.1 0.2 -0.3 0.6 0.5
11.6 -11.4 1.5 19.6 -40.4 -10.4 65.4 65.8 70.4 16.9 17.4 17.2
-2.6 -3.9 -3.7 -6.3 -4.4 -13.0 -11.1 -7.5 -5.5 -12.9 -13.1 -9.8
21.8 35.4 32.2 22.6 26.2 9.3 4.0 10.6 14.1 7.4 -0.7 3.6
-10.9 -13.5 -16.3 -20.1 -19.8 -59.2 -59.3 -56.5 -27.4 -46.5 -40.8 -29.5
23.5 44.0 44.3 44.7 57.8 62.1 61.4 51.1 53.0 58.3 50.9 57.7
-0.1 -0.8 -1.0 -0.9 -1.3 -2.2 -2.1 -1.8 -1.5 -2.4 -2.4 -2.0
-0.1 0.4 0.3 -0.1 -0.2 0.8 0.4 -0.1 -0.4 0.9 -0.1 -0.2
Lithuania -0.9 -0.4 0.2 0.1 1.7 3.6 1.4 1.1 0.7 3.7 3.1 3.2
-0.5 1.0 1.7 1.8 -1.5 2.3 3.8 3.8 4.0 4.2 5.4 6.2
0.3 0.4 1.3 1.4 1.1 0.2 0.0 0.3 0.3 -0.2 -0.3 0.0
43.5 57.1 79.9 83.9 76.2 55.8 71.9 80.2 82.4 62.3 67.5 75.9
6.4 10.2 5.5 4.0 8.7 7.2 -0.5 -0.9 -2.4 10.1 8.7 11.3
0.0 1.2 2.0 0.5 0.3 -2.4 -2.0 -0.8 -1.0 -2.1 -1.7 -0.8
1.5 2.0 2.7 2.8 3.0 3.6 2.7 2.6 2.7 2.5 2.1 1.7
-0.5 -1.7 -0.7 -0.3 -1.9 -0.8 -1.6 -1.1 -1.3 -1.4 -0.3 -0.5
-1.7 -4.3 -1.8 -4.3 -0.8 2.0 3.0 3.2 4.0 0.7 0.1 1.4
359.2 390.5 414.5 417.7 371.0 300.8 379.5 408.9 463.5 342.1 367.3 387.7
284.0 329.7 356.0 341.0 277.3 222.7 379.5 408.9 463.5 250.4 367.3 387.7
0.3 2.6 3.2 0.5 1.1 -0.4 0.3 0.9 2.1 2.5 3.9 5.3
-2.8 -0.4 1.6 -1.3 -2.1 4.8 -2.8 -6.4 -4.7 0.3 -0.6 -1.9
22.5 22.0 23.6 22.0 27.4 25.4 24.4 25.0 25.3 24.3 26.0 28.7
1.5 1.1 1.7 1.0 1.6 -0.4 0.5 0.5 0.2 -0.5 -1.1 -0.4
2.1 4.9 2.0 0.0 -1.2 -2.2 -1.6 -3.9 -3.3 -0.4 -0.9 -0.7
-0.6 -1.2 -1.4 -4.8 4.4 17.6 14.8 16.2 19.3 16.1 15.3 12.5
-0.5 -2.0 -5.9 -9.1 -11.8 -11.9 -15.5 -16.3 -17.2 -10.9 -11.3 -11.6
14.0 11.2 13.5 12.0 24.7 26.8 26.7 26.4 28.7 25.5 31.1 36.3
395.6 428.4 452.7 438.0 415.0 360.5 426.4 451.2 513.8 398.9 429.7 455.9
347.5 402.5 399.6 385.7 340.9 323.3 426.4 451.2 513.8 349.1 429.7 455.9
-137.7 -131.1 -86.9 -95.3 -68.5 -62.8 -75.6 -87.1 -99.8 -83.1 -127.7 -130.8
123.0 178.0 179.8 148.8 168.2 145.5 147.6 146.0 144.5 117.2 139.4 139.4
-382.8 -364.7 -330.1 -372.8 -428.6 -514.0 -691.1 -763.1 -771.9 -536.9 -643.6 -680.1
Belgium
Germany
Estonia
Ireland
Greece
Current-account balance¹ (in billions of euro, 2015-2023)
Autumn 2021 Spring 2021
forecast forecast
Spain
France
Italy
Cyprus
Latvia
Luxembourg
Malta
Hungary
Poland
Romania
Netherlands
Austria
Portugal
Slovenia
Slovakia
² See note 8 on concepts and sources.
Sweden
EU
Finland
Euro area
Euro area, adjusted²
Bulgaria
Czechia
Denmark
Croatia
EU, adjusted²
United Kingdom
Japan
United States¹ See note 7 on concepts and sources.
Table 52: 25.10.2021
2015 2016 2017 2018 2019 2020 2021 2022 2023 2020 2021 2022
6.3 2.5 5.3 4.0 2.9 -9.1 8.3 7.0 4.6 -9.9 5.4 4.2
4.6 2.9 5.8 4.3 1.8 -8.3 9.3 6.7 4.7 -10.3 6.0 4.3
2.7 3.3 6.4 4.5 2.7 -7.4 8.5 6.3 4.5 -10.2 5.9 4.6
4.2 2.2 5.3 4.0 1.2 -8.7 9.4 6.7 4.3 -11.6 5.7 3.9
3.4 2.4 6.1 3.9 1.7 -9.6 8.6 6.7 4.9 -12.4 5.8 5.1
4.9 2.7 5.3 3.7 2.3 -9.9 8.4 6.8 4.6 -11.0 5.6 4.1
4.3 2.8 5.4 3.9 1.9 -9.2 8.8 6.7 4.6 -11.0 5.8 4.4
3.8 2.7 5.6 3.9 1.8 -9.1 8.9 6.8 4.7 -10.4 6.1 4.3
-4.8 0.5 9.2 3.9 2.5 -9.9 8.2 6.0 4.4 -14.5 5.3 4.5
1.8 2.9 6.9 4.4 3.4 -7.4 9.3 6.3 4.5 -10.4 5.8 4.8
Lithuania 1.4 2.8 6.6 4.4 3.4 -8.1 8.7 6.4 4.6 -10.8 5.8 4.6
5.0 3.3 5.2 3.9 2.3 -8.5 8.9 6.7 4.8 -13.4 5.2 4.6
10.8 7.0 4.0 3.4 11.1 -9.1 5.5 6.5 4.7 -13.3 6.0 5.4
5.2 3.8 5.2 3.8 3.3 -9.0 8.4 6.8 4.7 -10.3 5.7 4.4
4.9 3.6 5.6 4.2 2.4 -8.4 9.2 7.2 5.2 -9.7 6.2 4.6
4.9 2.1 5.3 3.9 2.6 -10.5 9.0 7.2 5.0 -12.4 5.9 4.6
5.1 4.0 6.3 4.7 2.9 -8.6 10.0 7.6 5.8 -10.1 7.5 4.8
4.8 3.9 6.2 4.7 2.8 -7.9 9.6 7.1 5.4 -8.7 6.2 4.7
3.2 2.7 5.9 4.1 2.0 -8.0 8.6 6.4 4.5 -9.7 5.7 4.2
4.6 2.9 5.5 4.0 2.3 -8.8 8.9 6.8 4.7 -10.6 5.8 4.3
4.1 4.0 6.9 4.3 2.6 -7.9 9.0 6.8 5.3 -9.8 6.4 5.4
5.0 3.8 5.9 4.3 2.8 -8.4 9.1 7.4 5.3 -8.7 5.9 4.5
4.1 2.5 5.3 4.0 1.8 -8.8 8.5 6.5 4.5 -10.7 5.6 4.3
6.5 4.4 5.9 4.4 4.3 -8.7 9.0 7.3 5.1 -11.3 5.7 4.8
5.1 4.0 6.2 4.6 2.8 -8.4 9.5 7.1 5.2 -9.5 6.4 4.7
4.4 3.4 5.8 4.2 3.0 -8.9 8.8 7.0 5.0 -9.5 5.8 4.5
4.7 3.1 5.9 4.0 2.4 -8.7 9.3 7.2 5.2 -10.1 5.9 4.8
5.7 3.5 5.1 4.0 3.7 -8.1 8.2 6.6 4.5 -10.2 5.4 4.3
4.7 3.0 5.6 4.0 2.4 -8.8 8.9 6.8 4.7 -10.4 5.8 4.4
5.0 2.4 5.1 3.9 3.0 -8.8 8.8 6.5 4.5 -11.9 5.8 4.4
2.2 2.1 6.7 5.0 -0.8 -7.5 10.0 6.3 4.8 -9.8 6.7 4.5
3.1 1.4 5.4 4.2 1.4 -9.7 8.1 6.1 4.5 -11.3 6.4 4.8
Belgium
Export markets (a) (percentage change on preceding year, 2015-2023)
Autumn 2021 Spring 2021
forecast forecast
Netherlands
Germany
Estonia
Ireland
Greece
Spain
France
Italy
Luxembourg
Malta
Cyprus
Latvia
Poland
Austria
Portugal
Slovenia
Slovakia
Finland
Euro area (b)
Bulgaria
Czechia
Denmark
Croatia
Hungary
(a) Imports of goods and services to the various markets (incl. EU-markets) weighted according to their share in country's exports of goods and services.
(b) Intra- and extra-EU trade.
Romania
Sweden
EU (b)
United Kingdom
Japan
United States
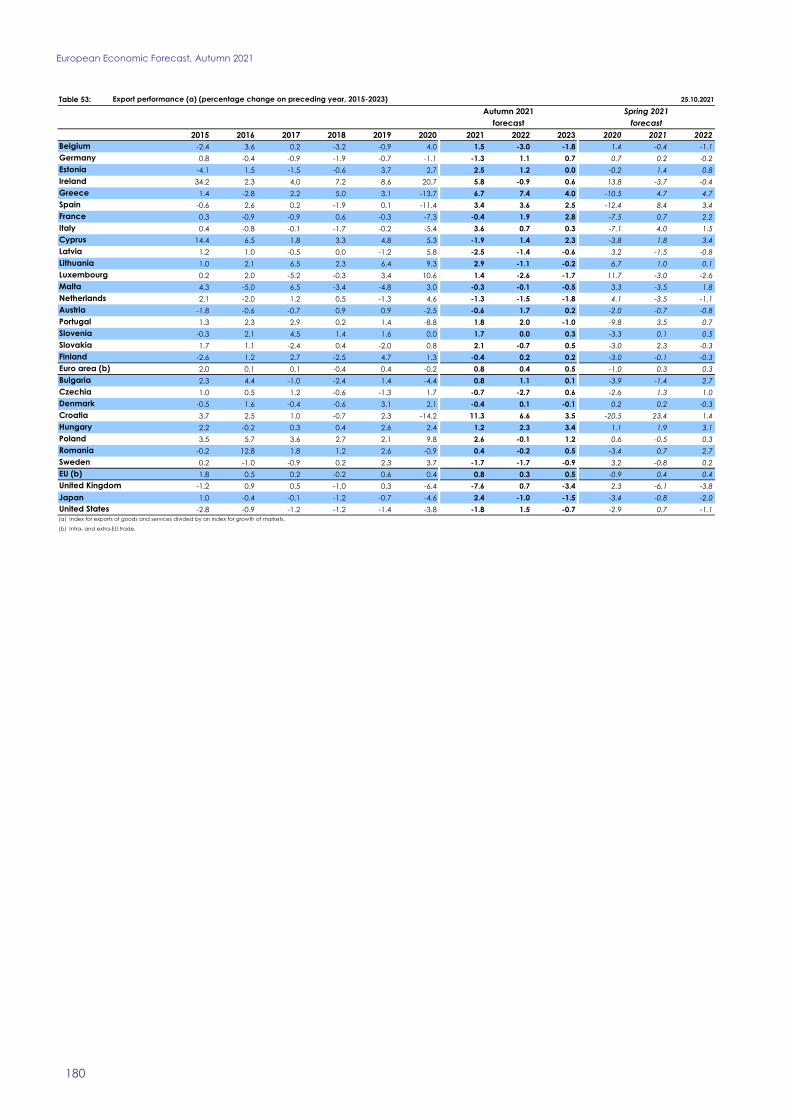
European Economic Forecast, Autumn 2021
180
Table 53: 25.10.2021
2015 2016 2017 2018 2019 2020 2021 2022 2023 2020 2021 2022
-2.4 3.6 0.2 -3.2 -0.9 4.0 1.5 -3.0 -1.8 1.4 -0.4 -1.1
0.8 -0.4 -0.9 -1.9 -0.7 -1.1 -1.3 1.1 0.7 0.7 0.2 -0.2
-4.1 1.5 -1.5 -0.6 3.7 2.7 2.5 1.2 0.0 -0.2 1.4 0.8
34.2 2.3 4.0 7.2 8.6 20.7 5.8 -0.9 0.6 13.8 -3.7 -0.4
1.4 -2.8 2.2 5.0 3.1 -13.7 6.7 7.4 4.0 -10.5 4.7 4.7
-0.6 2.6 0.2 -1.9 0.1 -11.4 3.4 3.6 2.5 -12.4 8.4 3.4
0.3 -0.9 -0.9 0.6 -0.3 -7.3 -0.4 1.9 2.8 -7.5 0.7 2.2
0.4 -0.8 -0.1 -1.7 -0.2 -5.4 3.6 0.7 0.3 -7.1 4.0 1.5
14.4 6.5 1.8 3.3 4.8 5.3 -1.9 1.4 2.3 -3.8 1.8 3.4
1.2 1.0 -0.5 0.0 -1.2 5.8 -2.5 -1.4 -0.6 3.2 -1.5 -0.8
Lithuania 1.0 2.1 6.5 2.3 6.4 9.3 2.9 -1.1 -0.2 6.7 1.0 0.1
0.2 2.0 -5.2 -0.3 3.4 10.6 1.4 -2.6 -1.7 11.7 -3.0 -2.6
4.3 -5.0 6.5 -3.4 -4.8 3.0 -0.3 -0.1 -0.5 3.3 -3.5 1.8
2.1 -2.0 1.2 0.5 -1.3 4.6 -1.3 -1.5 -1.8 4.1 -3.5 -1.1
-1.8 -0.6 -0.7 0.9 0.9 -2.5 -0.6 1.7 0.2 -2.0 -0.7 -0.8
1.3 2.3 2.9 0.2 1.4 -8.8 1.8 2.0 -1.0 -9.8 3.5 0.7
-0.3 2.1 4.5 1.4 1.6 0.0 1.7 0.0 0.3 -3.3 0.1 0.5
1.7 1.1 -2.4 0.4 -2.0 0.8 2.1 -0.7 0.5 -3.0 2.3 -0.3
-2.6 1.2 2.7 -2.5 4.7 1.3 -0.4 0.2 0.2 -3.0 -0.1 -0.3
2.0 0.1 0.1 -0.4 0.4 -0.2 0.8 0.4 0.5 -1.0 0.3 0.3
2.3 4.4 -1.0 -2.4 1.4 -4.4 0.8 1.1 0.1 -3.9 -1.4 2.7
1.0 0.5 1.2 -0.6 -1.3 1.7 -0.7 -2.7 0.6 -2.6 1.3 1.0
-0.5 1.6 -0.4 -0.6 3.1 2.1 -0.4 0.1 -0.1 0.2 0.2 -0.3
3.7 2.5 1.0 -0.7 2.3 -14.2 11.3 6.6 3.5 -20.5 23.4 1.4
2.2 -0.2 0.3 0.4 2.6 2.4 1.2 2.3 3.4 1.1 1.9 3.1
3.5 5.7 3.6 2.7 2.1 9.8 2.6 -0.1 1.2 0.6 -0.5 0.3
-0.2 12.8 1.8 1.2 2.6 -0.9 0.4 -0.2 0.5 -3.4 0.7 2.7
0.2 -1.0 -0.9 0.2 2.3 3.7 -1.7 -1.7 -0.9 3.2 -0.8 0.2
1.8 0.5 0.2 -0.2 0.6 0.4 0.8 0.3 0.5 -0.9 0.4 0.4
-1.2 0.9 0.5 -1.0 0.3 -6.4 -7.6 0.7 -3.4 2.3 -6.1 -3.8
1.0 -0.4 -0.1 -1.2 -0.7 -4.6 2.4 -1.0 -1.5 -3.4 -0.8 -2.0
-2.8 -0.9 -1.2 -1.2 -1.4 -3.8 -1.8 1.5 -0.7 -2.9 0.7 -1.1
Belgium
Export performance (a) (percentage change on preceding year, 2015-2023)
Autumn 2021 Spring 2021
forecast forecast
Netherlands
Germany
Estonia
Ireland
Greece
Spain
France
Italy
Luxembourg
Malta
Cyprus
Latvia
Poland
Austria
Portugal
Slovenia
Slovakia
Finland
Euro area (b)
Bulgaria
Czechia
Denmark
Croatia
Hungary
(a) Index for exports of goods and services divided by an index for growth of markets.
(b) Intra- and extra-EU trade.
Romania
Sweden
EU (b)
United Kingdom
Japan
United States
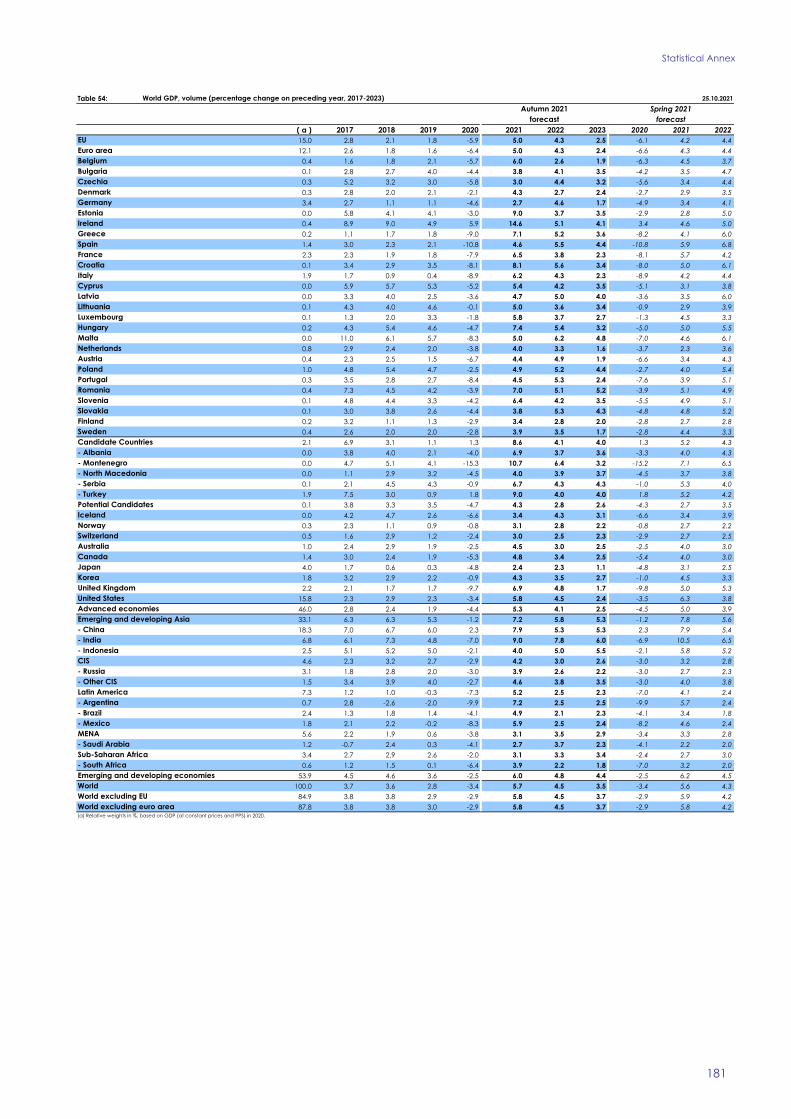
Statistical Annex
181
Table 54: 25.10.2021
( a ) 2017 2018 2019 2020 2021 2022 2023 2020 2021 2022
15.0 2.8 2.1 1.8 -5.9 5.0 4.3 2.5 -6.1 4.2 4.4
12.1 2.6 1.8 1.6 -6.4 5.0 4.3 2.4 -6.6 4.3 4.4
0.4 1.6 1.8 2.1 -5.7 6.0 2.6 1.9 -6.3 4.5 3.7
0.1 2.8 2.7 4.0 -4.4 3.8 4.1 3.5 -4.2 3.5 4.7
0.3 5.2 3.2 3.0 -5.8 3.0 4.4 3.2 -5.6 3.4 4.4
0.3 2.8 2.0 2.1 -2.1 4.3 2.7 2.4 -2.7 2.9 3.5
3.4 2.7 1.1 1.1 -4.6 2.7 4.6 1.7 -4.9 3.4 4.1
0.0 5.8 4.1 4.1 -3.0 9.0 3.7 3.5 -2.9 2.8 5.0
0.4 8.9 9.0 4.9 5.9 14.6 5.1 4.1 3.4 4.6 5.0
0.2 1.1 1.7 1.8 -9.0 7.1 5.2 3.6 -8.2 4.1 6.0
1.4 3.0 2.3 2.1 -10.8 4.6 5.5 4.4 -10.8 5.9 6.8
2.3 2.3 1.9 1.8 -7.9 6.5 3.8 2.3 -8.1 5.7 4.2
0.1 3.4 2.9 3.5 -8.1 8.1 5.6 3.4 -8.0 5.0 6.1
1.9 1.7 0.9 0.4 -8.9 6.2 4.3 2.3 -8.9 4.2 4.4
0.0 5.9 5.7 5.3 -5.2 5.4 4.2 3.5 -5.1 3.1 3.8
0.0 3.3 4.0 2.5 -3.6 4.7 5.0 4.0 -3.6 3.5 6.0
0.1 4.3 4.0 4.6 -0.1 5.0 3.6 3.4 -0.9 2.9 3.9
0.1 1.3 2.0 3.3 -1.8 5.8 3.7 2.7 -1.3 4.5 3.3
0.2 4.3 5.4 4.6 -4.7 7.4 5.4 3.2 -5.0 5.0 5.5
0.0 11.0 6.1 5.7 -8.3 5.0 6.2 4.8 -7.0 4.6 6.1
0.8 2.9 2.4 2.0 -3.8 4.0 3.3 1.6 -3.7 2.3 3.6
0.4 2.3 2.5 1.5 -6.7 4.4 4.9 1.9 -6.6 3.4 4.3
1.0 4.8 5.4 4.7 -2.5 4.9 5.2 4.4 -2.7 4.0 5.4
0.3 3.5 2.8 2.7 -8.4 4.5 5.3 2.4 -7.6 3.9 5.1
0.4 7.3 4.5 4.2 -3.9 7.0 5.1 5.2 -3.9 5.1 4.9
0.1 4.8 4.4 3.3 -4.2 6.4 4.2 3.5 -5.5 4.9 5.1
0.1 3.0 3.8 2.6 -4.4 3.8 5.3 4.3 -4.8 4.8 5.2
0.2 3.2 1.1 1.3 -2.9 3.4 2.8 2.0 -2.8 2.7 2.8
0.4 2.6 2.0 2.0 -2.8 3.9 3.5 1.7 -2.8 4.4 3.3
2.1 6.9 3.1 1.1 1.3 8.6 4.1 4.0 1.3 5.2 4.3
0.0 3.8 4.0 2.1 -4.0 6.9 3.7 3.6 -3.3 4.0 4.3
0.0 4.7 5.1 4.1 -15.3 10.7 6.4 3.2 -15.2 7.1 6.5
0.0 1.1 2.9 3.2 -4.5 4.0 3.9 3.7 -4.5 3.7 3.8
0.1 2.1 4.5 4.3 -0.9 6.7 4.3 4.3 -1.0 5.3 4.0
1.9 7.5 3.0 0.9 1.8 9.0 4.0 4.0 1.8 5.2 4.2
0.1 3.8 3.3 3.5 -4.7 : 4.3 2.8 2.6 -4.3 2.7 3.5
0.0 4.2 4.7 2.6 -6.6 3.4 4.3 3.1 -6.6 3.4 3.9
0.3 2.3 1.1 0.9 -0.8 3.1 2.8 2.2 -0.8 2.7 2.2
0.5 1.6 2.9 1.2 -2.4 3.0 2.5 2.3 -2.9 2.7 2.5
1.0 2.4 2.9 1.9 -2.5 4.5 3.0 2.5 -2.5 4.0 3.0
1.4 3.0 2.4 1.9 -5.3 4.8 3.4 2.5 -5.4 4.0 3.0
4.0 1.7 0.6 0.3 -4.8 2.4 2.3 1.1 -4.8 3.1 2.5
1.8 3.2 2.9 2.2 -0.9 4.3 3.5 2.7 -1.0 4.5 3.3
2.2 2.1 1.7 1.7 -9.7 6.9 4.8 1.7 -9.8 5.0 5.3
15.8 2.3 2.9 2.3 -3.4 5.8 4.5 2.4 -3.5 6.3 3.8
46.0 2.8 2.4 1.9 -4.4 5.3 4.1 2.5 -4.5 5.0 3.9
33.1 6.3 6.3 5.3 -1.2 7.2 5.8 5.3 -1.2 7.8 5.6
18.3 7.0 6.7 6.0 2.3 7.9 5.3 5.3 2.3 7.9 5.4
6.8 6.1 7.3 4.8 -7.0 9.0 7.8 6.0 -6.9 10.5 6.5
2.5 5.1 5.2 5.0 -2.1 4.0 5.0 5.5 -2.1 5.8 5.2
4.6 2.3 3.2 2.7 -2.9 4.2 3.0 2.6 -3.0 3.2 2.8
3.1 1.8 2.8 2.0 -3.0 3.9 2.6 2.2 -3.0 2.7 2.3
1.5 3.4 3.9 4.0 -2.7 4.6 3.8 3.5 -3.0 4.0 3.8
7.3 1.2 1.0 -0.3 -7.3 5.2 2.5 2.3 -7.0 4.1 2.4
- Argentina 0.7 2.8 -2.6 -2.0 -9.9 7.2 2.5 2.5 -9.9 5.7 2.4
2.4 1.3 1.8 1.4 -4.1 4.9 2.1 2.3 -4.1 3.4 1.8
1.8 2.1 2.2 -0.2 -8.3 5.9 2.5 2.4 -8.2 4.6 2.4
MENA 5.6 2.2 1.9 0.6 -3.8 3.1 3.5 2.9 -3.4 3.3 2.8
- Saudi Arabia 1.2 -0.7 2.4 0.3 -4.1 2.7 3.7 2.3 -4.1 2.2 2.0
3.4 2.7 2.9 2.6 -2.0 3.1 3.3 3.4 -2.4 2.7 3.0
- South Africa 0.6 1.2 1.5 0.1 -6.4 3.9 2.2 1.8 -7.0 3.2 2.0
53.9 4.5 4.6 3.6 -2.5 6.0 4.8 4.4 -2.5 6.2 4.5
100.0 3.7 3.6 2.8 -3.4 5.7 4.5 3.5 -3.4 5.6 4.3
84.9 3.8 3.8 2.9 -2.9 5.8 4.5 3.7 -2.9 5.9 4.2
87.8 3.8 3.8 3.0 -2.9 5.8 4.5 3.7 -2.9 5.8 4.2
Denmark
World GDP, volume (percentage change on preceding year, 2017-2023)
Autumn 2021 Spring 2021
forecast forecast
EU
Euro area
Belgium
Bulgaria
Czechia
Luxembourg
Germany
Estonia
Ireland
Greece
Spain
France
Croatia
Italy
Cyprus
Lithuania
Latvia
Portugal
Romania
Slovenia
Slovakia
Finland
Sweden
Switzerland
Australia
Canada
- North Macedonia
Candidate Countries
Hungary
Malta
Netherlands
Austria
Poland
Japan
- Albania
- Montenegro
- Serbia
- Turkey
Potential Candidates
Iceland
Norway
Latin America
Korea
United Kingdom
United States
Advanced economies
Emerging and developing Asia
- China
- India
- Indonesia
CIS
- Russia
- Other CIS
World excluding euro area(a) Relative weights in %, based on GDP (at constant prices and PPS) in 2020.
- Brazil
- Mexico
Sub-Saharan Africa
Emerging and developing economies
World
World excluding EU
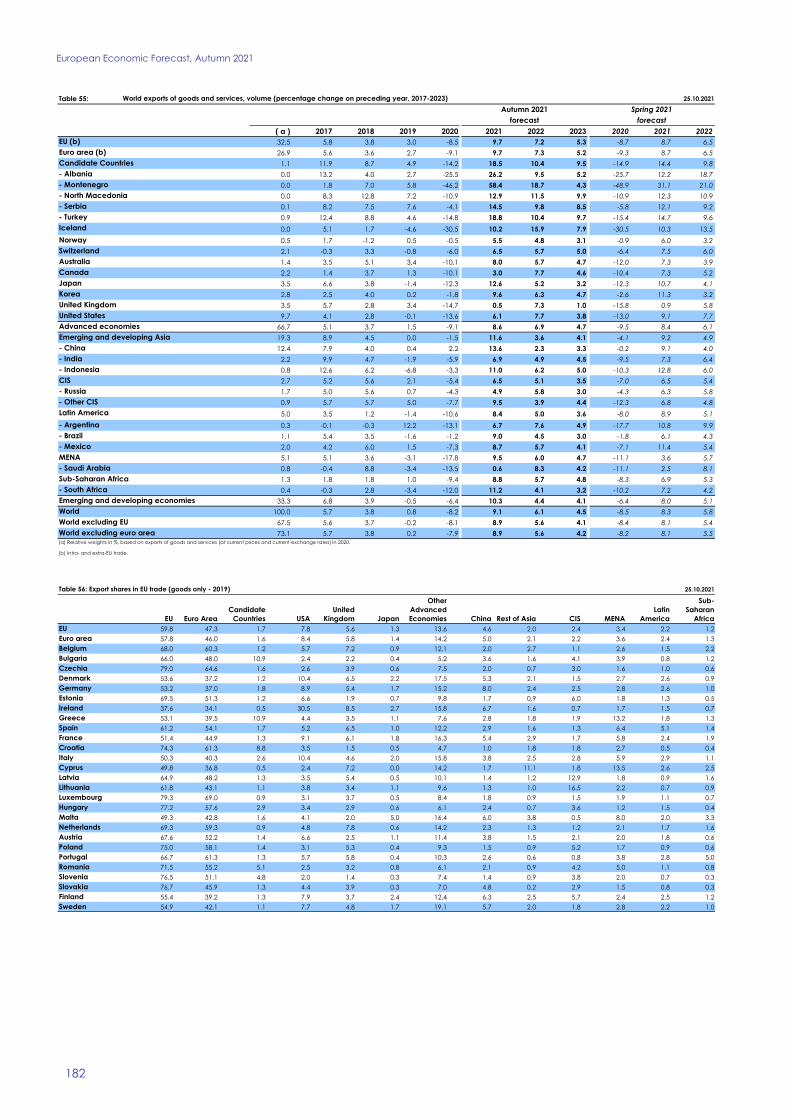
European Economic Forecast, Autumn 2021
182
Table 55: 25.10.2021
( a ) 2017 2018 2019 2020 2021 2022 2023 2020 2021 2022
32.5 5.8 3.8 3.0 -8.5 9.7 7.2 5.3 -8.7 8.7 6.5
26.9 5.6 3.6 2.7 -9.1 9.7 7.3 5.2 -9.3 8.7 6.5
1.1 11.9 8.7 4.9 -14.2 18.5 10.4 9.5 -14.9 14.4 9.8
0.0 13.2 4.0 2.7 -25.5 26.2 9.5 5.2 -25.7 12.2 18.7
0.0 1.8 7.0 5.8 -46.2 58.4 18.7 4.3 -48.9 31.1 21.0
0.0 8.3 12.8 7.2 -10.9 12.9 11.5 9.9 -10.9 12.3 10.9
0.1 8.2 7.5 7.6 -4.1 14.5 9.8 8.5 -5.8 12.1 9.2
0.9 12.4 8.8 4.6 -14.8 18.8 10.4 9.7 -15.4 14.7 9.6
0.0 5.1 1.7 -4.6 -30.5 10.2 15.9 7.9 -30.5 10.3 13.5
0.5 1.7 -1.2 0.5 -0.5 5.5 4.8 3.1 -0.9 6.0 3.2
2.1 -0.3 3.3 -0.8 -6.0 6.5 5.7 5.0 -6.4 7.5 6.0
1.4 3.5 5.1 3.4 -10.1 8.0 5.7 4.7 -12.0 7.3 3.9
2.2 1.4 3.7 1.3 -10.1 3.0 7.7 4.6 -10.4 7.3 5.2
3.5 6.6 3.8 -1.4 -12.3 12.6 5.2 3.2 -12.3 10.7 4.1
2.8 2.5 4.0 0.2 -1.8 9.6 6.3 4.7 -2.6 11.3 3.2
3.5 5.7 2.8 3.4 -14.7 0.5 7.3 1.0 -15.8 0.9 5.8
9.7 4.1 2.8 -0.1 -13.6 6.1 7.7 3.8 -13.0 9.1 7.7
66.7 5.1 3.7 1.5 -9.1 8.6 6.9 4.7 -9.5 8.4 6.1
19.3 8.9 4.5 0.0 -1.5 11.6 3.6 4.1 -4.1 9.2 4.9
12.4 7.9 4.0 0.4 2.2 13.6 2.3 3.3 -0.2 9.1 4.0
2.2 9.9 4.7 -1.9 -5.9 6.9 4.9 4.5 -9.5 7.3 6.4
0.8 12.6 6.2 -6.8 -3.3 11.0 6.2 5.0 -10.3 12.8 6.0
2.7 5.2 5.6 2.1 -5.4 6.5 5.1 3.5 -7.0 6.5 5.4
1.7 5.0 5.6 0.7 -4.3 4.9 5.8 3.0 -4.3 6.3 5.8
0.9 5.7 5.7 5.0 -7.7 9.5 3.9 4.4 -12.3 6.8 4.8
Latin America 5.0 3.5 1.2 -1.4 -10.6 8.4 5.0 3.6 -8.0 8.9 5.1
0.3 -0.1 -0.3 12.2 -13.1 6.7 7.6 4.9 -17.7 10.8 9.9
1.1 5.4 3.5 -1.6 -1.2 9.0 4.5 3.0 -1.8 6.1 4.3
- Mexico 2.0 4.2 6.0 1.5 -7.3 8.7 5.7 4.1 -7.1 11.4 5.4
MENA 5.1 5.1 3.6 -3.1 -17.8 9.5 6.0 4.7 -11.1 3.6 5.7
0.8 -0.4 8.8 -3.4 -13.5 0.6 8.3 4.2 -11.1 2.5 8.1
1.3 1.8 1.8 1.0 -9.4 8.8 5.7 4.8 -8.3 6.9 5.3
- South Africa 0.4 -0.3 2.8 -3.4 -12.0 11.2 4.1 3.2 -10.2 7.2 4.2
33.3 6.8 3.9 -0.5 -6.4 10.3 4.4 4.1 -6.4 8.0 5.1
100.0 5.7 3.8 0.8 -8.2 9.1 6.1 4.5 -8.5 8.3 5.8
67.5 5.6 3.7 -0.2 -8.1 8.9 5.6 4.1 -8.4 8.1 5.4
73.1 5.7 3.8 0.2 -7.9 8.9 5.6 4.2 -8.2 8.1 5.5
EU (b)
Euro area (b)
- Albania
- Montenegro
Candidate Countries
World exports of goods and services, volume (percentage change on preceding year, 2017-2023)
Autumn 2021 Spring 2021
forecast forecast
- North Macedonia
- Serbia
- Turkey
Iceland
Norway
Switzerland
Australia
- Other CIS
- Argentina
- Brazil
Canada
Japan
Korea
United Kingdom
United States
(b) Intra- and extra-EU trade.
- Saudi Arabia
Sub-Saharan Africa
Advanced economies
Emerging and developing Asia
- China
- India
- Indonesia
CIS
- Russia
Emerging and developing economies
World
World excluding EU
World excluding euro area(a) Relative weights in %, based on exports of goods and services (at current prices and current exchange rates) in 2020.
25.10.2021
EU Euro Area
Candidate
Countries USA
United
Kingdom Japan
Other
Advanced
Economies China Rest of Asia CIS MENA
Latin
America
Sub-
Saharan
Africa
EU 59.8 47.3 1.7 7.8 5.6 1.3 13.6 4.6 2.0 2.4 3.4 2.2 1.2
Euro area 57.8 46.0 1.6 8.4 5.8 1.4 14.2 5.0 2.1 2.2 3.6 2.4 1.3
Belgium 68.0 60.3 1.2 5.7 7.2 0.9 12.1 2.0 2.7 1.1 2.6 1.5 2.2
Bulgaria 66.0 48.0 10.9 2.4 2.2 0.4 5.2 3.6 1.6 4.1 3.9 0.8 1.2
Czechia 79.0 64.6 1.6 2.6 3.9 0.6 7.5 2.0 0.7 3.0 1.6 1.0 0.6
Denmark 53.6 37.2 1.2 10.4 6.5 2.2 17.5 5.3 2.1 1.5 2.7 2.6 0.9
Germany 53.2 37.0 1.8 8.9 5.4 1.7 15.2 8.0 2.4 2.5 2.8 2.6 1.0
Estonia 69.5 51.3 1.2 6.6 1.9 0.7 9.8 1.7 0.9 6.0 1.8 1.3 0.5
Ireland 37.6 34.1 0.5 30.5 8.5 2.7 15.8 6.7 1.6 0.7 1.7 1.5 0.7
Greece 53.1 39.5 10.9 4.4 3.5 1.1 7.6 2.8 1.8 1.9 13.2 1.8 1.3
Spain 61.2 54.1 1.7 5.2 6.5 1.0 12.2 2.9 1.6 1.3 6.4 5.1 1.4
France 51.4 44.9 1.3 9.1 6.1 1.8 16.3 5.4 2.9 1.7 5.8 2.4 1.9
Croatia 74.3 61.3 8.8 3.5 1.5 0.5 4.7 1.0 1.8 1.8 2.7 0.5 0.4
Italy 50.3 40.3 2.6 10.4 4.6 2.0 15.8 3.8 2.5 2.8 5.9 2.9 1.1
Cyprus 49.8 36.8 0.5 2.4 7.2 0.0 14.2 1.7 11.1 1.8 13.5 2.6 2.5
Latvia 64.9 48.2 1.3 3.5 5.4 0.5 10.1 1.4 1.2 12.9 1.8 0.9 1.6
Lithuania 61.8 43.1 1.1 3.8 3.4 1.1 9.6 1.3 1.0 16.5 2.2 0.7 0.9
Luxembourg 79.3 69.0 0.9 3.1 3.7 0.5 8.4 1.8 0.9 1.5 1.9 1.1 0.7
Hungary 77.2 57.6 2.9 3.4 2.9 0.6 6.1 2.4 0.7 3.6 1.2 1.5 0.4
Malta 49.3 42.8 1.6 4.1 2.0 5.0 16.4 6.0 3.8 0.5 8.0 2.0 3.3
Netherlands 69.3 59.3 0.9 4.8 7.8 0.6 14.2 2.3 1.3 1.2 2.1 1.7 1.6
Austria 67.6 52.2 1.4 6.6 2.5 1.1 11.4 3.8 1.5 2.1 2.0 1.8 0.6
Poland 75.0 58.1 1.4 3.1 5.3 0.4 9.3 1.5 0.9 5.2 1.7 0.9 0.6
Portugal 66.7 61.3 1.3 5.7 5.8 0.4 10.3 2.6 0.6 0.8 3.8 2.8 5.0
Romania 71.5 55.2 5.1 2.5 3.2 0.8 6.1 2.1 0.9 4.2 5.0 1.1 0.8
Slovenia 76.5 51.1 4.8 2.0 1.4 0.3 7.4 1.4 0.9 3.8 2.0 0.7 0.3
Slovakia 76.7 45.9 1.3 4.4 3.9 0.3 7.0 4.8 0.2 2.9 1.5 0.8 0.3
Finland 55.4 39.2 1.3 7.9 3.7 2.4 12.4 6.3 2.5 5.7 2.4 2.5 1.2
Sweden 54.9 42.1 1.1 7.7 4.8 1.7 19.1 5.7 2.0 1.8 2.8 2.2 1.0
Table 56: Export shares in EU trade (goods only - 2019)

Statistical Annex
183
Table 57: 25.10.2021
( a ) 2017 2018 2019 2020 2021 2022 2023 2020 2021 2022
30.9 5.6 4.2 4.6 -8.3 8.6 7.1 5.2 -8.3 8.1 6.8
25.5 5.2 3.8 4.7 -9.1 8.2 7.2 5.1 -9.0 8.0 6.9
1.3 10.5 -4.0 -3.0 4.7 4.9 5.2 7.0 4.6 5.3 6.7
0.0 8.4 2.4 2.3 -19.3 15.0 6.4 3.3 -19.4 7.5 8.9
0.0 8.4 9.2 2.7 -20.1 14.5 5.0 3.7 -19.5 10.7 4.6
0.0 5.3 10.7 8.9 -10.5 12.0 10.6 8.9 -10.5 10.7 9.9
0.1 11.1 10.8 10.7 -3.6 14.1 8.9 7.6 -3.5 12.6 7.6
1.1 10.6 -6.2 -5.4 7.6 3.1 4.5 7.0 7.4 4.0 6.4
0.0 11.8 0.5 -9.3 -22.0 8.6 12.1 7.2 -22.0 8.1 12.1
0.6 1.9 1.4 4.7 -11.9 5.1 5.1 2.9 -12.2 6.6 3.4
1.9 -0.9 0.7 -0.2 -4.5 5.3 5.0 4.0 -6.5 8.5 5.6
1.2 7.9 4.0 -0.9 -13.4 4.9 8.9 5.8 -16.2 11.2 6.7
2.4 4.6 3.4 0.3 -11.2 7.5 7.4 4.6 -12.7 8.8 6.0
3.9 3.3 3.8 -0.4 -6.8 8.4 4.8 2.4 -6.8 6.2 4.4
2.5 8.9 1.7 -1.9 -3.3 8.6 4.5 3.4 -4.0 8.8 3.8
3.6 2.9 3.1 2.9 -16.8 1.2 8.9 2.2 -17.8 7.7 6.2
13.1 4.4 4.1 1.2 -8.9 14.3 7.8 3.5 -9.3 13.5 7.2
68.1 5.1 3.7 2.1 -8.3 9.1 6.9 4.4 -8.8 9.0 6.4
18.0 9.1 7.0 -3.3 -5.6 9.9 5.8 6.3 -7.2 9.7 5.6
11.1 7.3 7.3 -3.7 -1.4 9.1 5.3 6.3 -1.9 7.8 4.8
2.3 13.2 4.0 -4.1 -13.8 13.2 5.2 6.0 -19.1 12.1 7.0
0.8 10.4 14.1 -9.3 -14.2 10.7 11.2 5.0 -20.1 16.6 5.0
2.4 13.2 4.1 5.7 -10.8 8.3 4.9 4.4 -13.7 5.3 5.1
1.4 17.3 2.7 3.4 -12.0 7.3 4.4 4.0 -12.0 3.6 4.5
1.0 7.3 6.5 9.1 -9.3 9.8 5.5 4.9 -16.0 7.6 5.9
4.9 4.2 4.0 -1.6 -12.7 10.8 4.9 4.2 -13.2 8.9 5.3
0.2 14.2 -5.6 -21.1 -10.7 17.1 5.9 5.4 -18.1 13.0 4.3
1.1 10.2 6.6 5.3 -7.7 10.9 5.4 4.0 -10.0 5.4 4.0
- Mexico 1.9 6.4 6.4 -0.7 -14.6 13.1 5.0 4.4 -15.2 13.3 7.2
MENA 5.1 2.3 0.8 -2.7 -18.2 4.7 5.4 4.0 -10.3 3.5 4.9
0.8 -0.4 2.2 3.0 -17.3 6.7 8.3 5.1 -17.8 5.6 8.4
1.5 1.2 6.2 8.3 -12.8 6.8 3.6 3.4 -11.6 4.7 4.2
- South Africa 0.4 1.5 3.2 0.5 -17.4 13.0 4.6 4.0 -16.6 5.4 4.6
31.9 7.0 5.2 -1.7 -9.6 8.9 5.4 5.4 -9.4 8.0 5.4
100.0 5.7 4.2 0.8 -8.7 9.1 6.4 4.7 -9.0 8.7 6.1
69.1 5.8 4.2 -0.8 -8.9 9.3 6.1 4.5 -9.3 9.0 5.7
74.5 5.9 4.3 -0.5 -8.6 9.4 6.1 4.6 -9.0 8.9 5.8
World imports of goods and services, volume (percentage change on preceding year, 2017-2023)
Autumn 2021 Spring 2021
forecast forecast
Australia
- Serbia
- Turkey
Iceland
Norway
Switzerland
EU (b)
Euro area (b)
Candidate Countries
- Albania
- North Macedonia
- Montenegro
- Russia
Canada
Japan
Korea
United Kingdom
United States
Advanced economies
Emerging and developing Asia
- China
- India
- Indonesia
CIS
(b) Intra- and extra-EU trade.
- Other CIS
Latin America
- Argentina
- Brazil
- Saudi Arabia
Sub-Saharan Africa
Emerging and developing economies
World
World excluding EU
World excluding euro area(a) Relative weights in %, based on imports of goods and services (at current prices and current exchange rates) in 2020.
25.10.2021
EU Euro Area
Candidate
Countries USA
United
Kingdom Japan
Other
Advanced
Economies China Rest of Asia CIS MENA
Latin
America
Sub-
Saharan
Africa
EU 61.6 49.4 1.8 4.8 3.9 1.3 10.4 7.1 3.3 4.3 2.5 1.8 1.2
Euro area 59.7 48.1 1.7 5.4 4.2 1.4 10.9 7.1 3.5 4.0 2.9 2.0 1.4
Belgium 61.0 54.9 1.2 8.1 4.3 2.4 10.5 4.5 3.6 2.2 2.3 2.4 1.9
Bulgaria 62.2 44.1 9.6 1.1 1.3 0.4 4.2 4.3 1.7 12.0 2.8 1.2 0.3
Czechia 75.2 59.4 1.1 1.8 1.9 1.0 6.3 8.5 1.6 3.7 0.3 0.3 0.2
Denmark 67.6 48.3 1.1 3.3 3.6 0.5 11.6 7.0 3.2 2.7 0.7 1.8 0.5
Germany 63.6 45.3 1.8 4.9 3.7 1.6 11.7 6.8 3.3 3.0 0.9 1.5 1.0
Estonia 72.8 54.0 0.6 1.6 1.9 0.7 5.0 4.3 1.4 12.3 0.2 0.3 0.8
Ireland 38.6 34.4 0.7 13.2 32.1 0.9 37.4 3.9 2.2 0.7 0.4 1.6 0.6
Greece 50.1 40.0 4.4 2.2 2.1 0.6 6.5 9.6 2.0 10.1 12.7 1.1 0.6
Spain 55.7 48.8 2.4 4.1 3.8 1.0 8.5 7.4 4.1 2.0 7.2 4.7 2.9
France 64.9 57.7 1.3 5.5 4.4 1.0 10.6 5.3 2.8 2.0 4.1 1.1 1.4
Croatia 77.9 60.2 4.2 1.6 1.0 0.2 3.2 3.9 1.0 5.3 2.0 0.5 0.3
Italy 57.1 47.5 2.8 4.5 2.6 1.0 8.2 7.2 3.6 6.1 6.1 2.1 1.4
Cyprus 63.6 57.6 0.7 1.8 6.1 1.2 13.0 5.3 4.6 5.8 1.3 2.1 0.6
Latvia 65.3 50.2 0.7 1.7 2.4 0.2 6.9 3.9 1.9 18.3 0.1 0.9 0.1
Lithuania 65.9 45.3 0.8 2.1 2.4 0.2 6.2 4.0 0.8 18.5 0.7 0.5 0.2
Luxembourg 81.2 77.5 0.2 5.2 1.2 2.0 3.5 6.3 0.6 0.3 0.2 0.3 0.3
Hungary 73.3 56.8 2.3 1.7 1.6 1.4 6.5 6.3 2.1 5.5 0.5 0.4 0.1
Malta 38.0 34.4 4.9 1.1 13.1 0.8 23.6 5.8 2.8 15.5 4.7 2.3 0.5
Netherlands 41.6 35.3 1.0 8.0 4.9 1.9 13.4 13.7 5.8 6.3 2.5 3.6 2.2
Austria 78.6 64.9 1.2 3.1 1.6 0.7 6.9 2.6 2.8 2.7 0.9 0.3 0.1
Poland 67.4 56.7 1.4 2.2 2.5 0.9 6.9 8.7 2.3 7.4 1.3 1.0 0.4
Portugal 73.3 68.4 1.3 1.9 2.5 0.5 5.8 4.3 2.1 2.3 3.0 2.2 3.3
Romania 73.1 52.9 5.7 1.0 1.8 0.4 4.1 5.0 1.3 7.8 1.0 0.6 0.2
Slovenia 64.3 49.3 8.1 0.9 1.0 0.4 13.2 6.7 2.3 1.6 1.2 1.1 0.3
Slovakia 80.0 44.1 1.2 0.5 1.7 0.2 6.5 3.5 2.0 5.3 0.4 0.2 0.1
Finland 68.5 44.1 0.6 2.3 2.4 0.6 7.1 3.8 1.3 13.9 0.2 1.4 0.4
Sweden 68.5 53.2 1.0 2.9 4.4 0.9 14.3 5.8 2.5 2.2 0.4 0.9 0.5
Table 58: Import shares in EU trade (goods only - 2019)
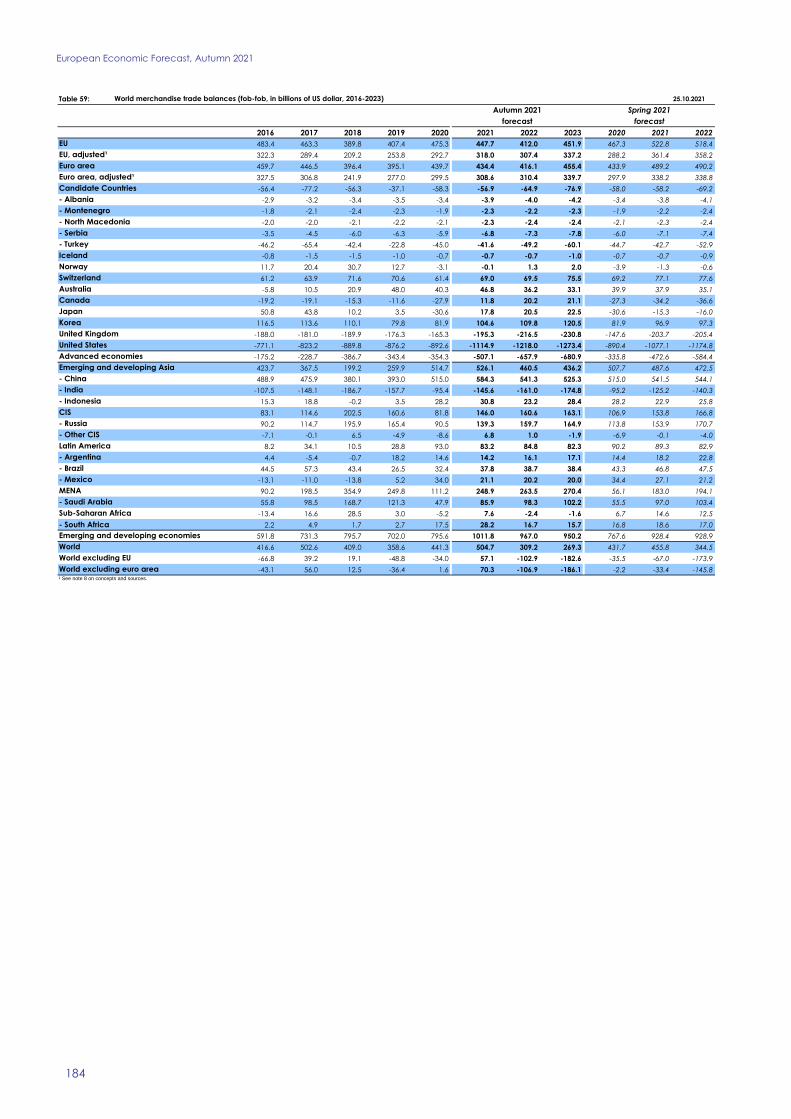
European Economic Forecast, Autumn 2021
184
Table 59: 25.10.2021
2016 2017 2018 2019 2020 2021 2022 2023 2020 2021 2022
483.4 463.3 389.8 407.4 475.3 447.7 412.0 451.9 467.3 522.8 518.4
322.3 289.4 209.2 253.8 292.7 318.0 307.4 337.2 288.2 361.4 358.2
459.7 446.5 396.4 395.1 439.7 434.4 416.1 455.4 433.9 489.2 490.2
327.5 306.8 241.9 277.0 299.5 308.6 310.4 339.7 297.9 338.2 338.8
-56.4 -77.2 -56.3 -37.1 -58.3 -56.9 -64.9 -76.9 -58.0 -58.2 -69.2
-2.9 -3.2 -3.4 -3.5 -3.4 -3.9 -4.0 -4.2 -3.4 -3.8 -4.1
-1.8 -2.1 -2.4 -2.3 -1.9 -2.3 -2.2 -2.3 -1.9 -2.2 -2.4
-2.0 -2.0 -2.1 -2.2 -2.1 -2.3 -2.4 -2.4 -2.1 -2.3 -2.4
-3.5 -4.5 -6.0 -6.3 -5.9 -6.8 -7.3 -7.8 -6.0 -7.1 -7.4
-46.2 -65.4 -42.4 -22.8 -45.0 -41.6 -49.2 -60.1 -44.7 -42.7 -52.9
-0.8 -1.5 -1.5 -1.0 -0.7 -0.7 -0.7 -1.0 -0.7 -0.7 -0.9
11.7 20.4 30.7 12.7 -3.1 -0.1 1.3 2.0 -3.9 -1.3 -0.6
61.2 63.9 71.6 70.6 61.4 69.0 69.5 75.5 69.2 77.1 77.6
-5.8 10.5 20.9 48.0 40.3 46.8 36.2 33.1 39.9 37.9 35.1
-19.2 -19.1 -15.3 -11.6 -27.9 11.8 20.2 21.1 -27.3 -34.2 -36.6
50.8 43.8 10.2 3.5 -30.6 17.8 20.5 22.5 -30.6 -15.3 -16.0
116.5 113.6 110.1 79.8 81.9 104.6 109.8 120.5 81.9 96.9 97.3
-188.0 -181.0 -189.9 -176.3 -165.3 -195.3 -216.5 -230.8 -147.6 -203.7 -205.4
-771.1 -823.2 -889.8 -876.2 -892.6 -1114.9 -1218.0 -1273.4 -890.4 -1077.1 -1174.8
-175.2 -228.7 -386.7 -343.4 -354.3 -507.1 -657.9 -680.9 -335.8 -472.6 -584.4
423.7 367.5 199.2 259.9 514.7 526.1 460.5 436.2 507.7 487.6 472.5
488.9 475.9 380.1 393.0 515.0 584.3 541.3 525.3 515.0 541.5 544.1
-107.5 -148.1 -186.7 -157.7 -95.4 -145.6 -161.0 -174.8 -95.2 -125.2 -140.3
15.3 18.8 -0.2 3.5 28.2 30.8 23.2 28.4 28.2 22.9 25.8
83.1 114.6 202.5 160.6 81.8 146.0 160.6 163.1 106.9 153.8 166.8
90.2 114.7 195.9 165.4 90.5 139.3 159.7 164.9 113.8 153.9 170.7
-7.1 -0.1 6.5 -4.9 -8.6 6.8 1.0 -1.9 -6.9 -0.1 -4.0
8.2 34.1 10.5 28.8 93.0 83.2 84.8 82.3 90.2 89.3 82.9
- Argentina 4.4 -5.4 -0.7 18.2 14.6 14.2 16.1 17.1 14.4 18.2 22.8
44.5 57.3 43.4 26.5 32.4 37.8 38.7 38.4 43.3 46.8 47.5
-13.1 -11.0 -13.8 5.2 34.0 21.1 20.2 20.0 34.4 27.1 21.2
MENA 90.2 198.5 354.9 249.8 111.2 248.9 263.5 270.4 56.1 183.0 194.1
55.8 98.5 168.7 121.3 47.9 85.9 98.3 102.2 55.5 97.0 103.4
-13.4 16.6 28.5 3.0 -5.2 7.6 -2.4 -1.6 6.7 14.6 12.5
2.2 4.9 1.7 2.7 17.5 28.2 16.7 15.7 16.8 18.6 17.0
591.8 731.3 795.7 702.0 795.6 1011.8 967.0 950.2 767.6 928.4 928.9
416.6 502.6 409.0 358.6 441.3 504.7 309.2 269.3 431.7 455.8 344.5
-66.8 39.2 19.1 -48.8 -34.0 57.1 -102.9 -182.6 -35.5 -67.0 -173.9
-43.1 56.0 12.5 -36.4 1.6 70.3 -106.9 -186.1 -2.2 -33.4 -145.8
- Turkey
Norway
- Albania
Iceland
Australia
Switzerland
- North Macedonia
- Serbia
- Montenegro
EU
EU, adjusted¹
Euro area
Euro area, adjusted¹
Candidate Countries
World merchandise trade balances (fob-fob, in billions of US dollar, 2016-2023)
Autumn 2021 Spring 2021
forecast forecast
- Russia
Canada
Japan
Korea
CIS
United Kingdom
United States
Advanced economies
Emerging and developing Asia
- China
- India
- Indonesia
¹ See note 8 on concepts and sources.
- Other CIS
Latin America
- Brazil
- Mexico
- Saudi Arabia
Sub-Saharan Africa
- South Africa
Emerging and developing economies
World
World excluding EU
World excluding euro area
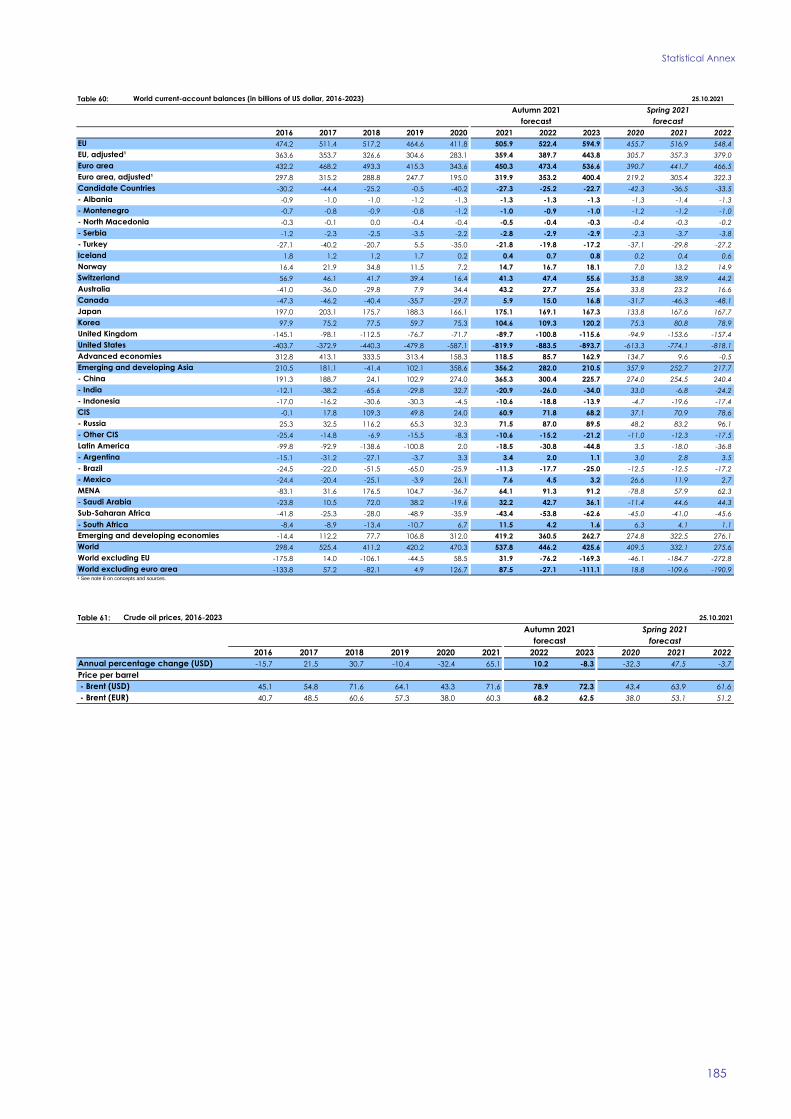
Statistical Annex
185
Table 60: 25.10.2021
2016 2017 2018 2019 2020 2021 2022 2023 2020 2021 2022
474.2 511.4 517.2 464.6 411.8 505.9 522.4 594.9 455.7 516.9 548.4
363.6 353.7 326.6 304.6 283.1 359.4 389.7 443.8 305.7 357.3 379.0
432.2 468.2 493.3 415.3 343.6 450.3 473.4 536.6 390.7 441.7 466.5
297.8 315.2 288.8 247.7 195.0 319.9 353.2 400.4 219.2 305.4 322.3
-30.2 -44.4 -25.2 -0.5 -40.2 -27.3 -25.2 -22.7 -42.3 -36.5 -33.5
-0.9 -1.0 -1.0 -1.2 -1.3 -1.3 -1.3 -1.3 -1.3 -1.4 -1.3
-0.7 -0.8 -0.9 -0.8 -1.2 -1.0 -0.9 -1.0 -1.2 -1.2 -1.0
-0.3 -0.1 0.0 -0.4 -0.4 -0.5 -0.4 -0.3 -0.4 -0.3 -0.2
-1.2 -2.3 -2.5 -3.5 -2.2 -2.8 -2.9 -2.9 -2.3 -3.7 -3.8
-27.1 -40.2 -20.7 5.5 -35.0 -21.8 -19.8 -17.2 -37.1 -29.8 -27.2
1.8 1.2 1.2 1.7 0.2 0.4 0.7 0.8 0.2 0.4 0.6
16.4 21.9 34.8 11.5 7.2 14.7 16.7 18.1 7.0 13.2 14.9
56.9 46.1 41.7 39.4 16.4 41.3 47.4 55.6 35.8 38.9 44.2
-41.0 -36.0 -29.8 7.9 34.4 43.2 27.7 25.6 33.8 23.2 16.6
-47.3 -46.2 -40.4 -35.7 -29.7 5.9 15.0 16.8 -31.7 -46.3 -48.1
197.0 203.1 175.7 188.3 166.1 175.1 169.1 167.3 133.8 167.6 167.7
97.9 75.2 77.5 59.7 75.3 104.6 109.3 120.2 75.3 80.8 78.9
-145.1 -98.1 -112.5 -76.7 -71.7 -89.7 -100.8 -115.6 -94.9 -153.6 -157.4
-403.7 -372.9 -440.3 -479.8 -587.1 -819.9 -883.5 -893.7 -613.3 -774.1 -818.1
312.8 413.1 333.5 313.4 158.3 118.5 85.7 162.9 134.7 9.6 -0.5
210.5 181.1 -41.4 102.1 358.6 356.2 282.0 210.5 357.9 252.7 217.7
191.3 188.7 24.1 102.9 274.0 365.3 300.4 225.7 274.0 254.5 240.4
-12.1 -38.2 -65.6 -29.8 32.7 -20.9 -26.0 -34.0 33.0 -6.8 -24.2
-17.0 -16.2 -30.6 -30.3 -4.5 -10.6 -18.8 -13.9 -4.7 -19.6 -17.4
-0.1 17.8 109.3 49.8 24.0 60.9 71.8 68.2 37.1 70.9 78.6
25.3 32.5 116.2 65.3 32.3 71.5 87.0 89.5 48.2 83.2 96.1
-25.4 -14.8 -6.9 -15.5 -8.3 -10.6 -15.2 -21.2 -11.0 -12.3 -17.5
-99.8 -92.9 -138.6 -100.8 2.0 -18.5 -30.8 -44.8 3.5 -18.0 -36.8
- Argentina -15.1 -31.2 -27.1 -3.7 3.3 3.4 2.0 1.1 3.0 2.8 3.5
-24.5 -22.0 -51.5 -65.0 -25.9 -11.3 -17.7 -25.0 -12.5 -12.5 -17.2
-24.4 -20.4 -25.1 -3.9 26.1 7.6 4.5 3.2 26.6 11.9 2.7
MENA -83.1 31.6 176.5 104.7 -36.7 64.1 91.3 91.2 -78.8 57.9 62.3
-23.8 10.5 72.0 38.2 -19.6 32.2 42.7 36.1 -11.4 44.6 44.3
-41.8 -25.3 -28.0 -48.9 -35.9 -43.4 -53.8 -62.6 -45.0 -41.0 -45.6
-8.4 -8.9 -13.4 -10.7 6.7 11.5 4.2 1.6 6.3 4.1 1.1
-14.4 112.2 77.7 106.8 312.0 419.2 360.5 262.7 274.8 322.5 276.1
298.4 525.4 411.2 420.2 470.3 537.8 446.2 425.6 409.5 332.1 275.6
-175.8 14.0 -106.1 -44.5 58.5 31.9 -76.2 -169.3 -46.1 -184.7 -272.8
-133.8 57.2 -82.1 4.9 126.7 87.5 -27.1 -111.1 18.8 -109.6 -190.9
Australia
United Kingdom
World current-account balances (in billions of US dollar, 2016-2023)
Autumn 2021 Spring 2021
forecast forecast
- North Macedonia
EU
EU, adjusted¹
Euro area
Euro area, adjusted¹
Candidate Countries
- Montenegro
- Albania
- Serbia
- Turkey
Norway
Switzerland
Iceland
- Russia
Canada
Japan
Korea
United States
Advanced economies
Emerging and developing Asia
- China
- India
- Indonesia
CIS
¹ See note 8 on concepts and sources.
- Other CIS
Latin America
- Brazil
- Mexico
- Saudi Arabia
Sub-Saharan Africa
- South Africa
Emerging and developing economies
World
World excluding EU
World excluding euro area
Table 61: 25.10.2021
2016 2017 2018 2019 2020 2021 2022 2023 2020 2021 2022
-15.7 21.5 30.7 -10.4 -32.4 65.1 10.2 -8.3 -32.3 47.5 -3.7
45.1 54.8 71.6 64.1 43.3 71.6 78.9 72.3 43.4 63.9 61.6
40.7 48.5 60.6 57.3 38.0 60.3 68.2 62.5 38.0 53.1 51.2
Annual percentage change (USD)
Price per barrel
- Brent (USD)
- Brent (EUR)
Crude oil prices, 2016-2023
Autumn 2021 Spring 2021
forecast forecast
European Economic Forecast, Autumn 2021
186
1.
2.
9.
10.
3.
11.
4.
5.
6.
Note on concepts and sources
The directorate general for economic and financial affairs (DG ECFIN)
produces, under its own responsibility, short-term fully-fledged economic
forecasts in Spring and Autumn. These forecasts cover the principal
macroeconomic aggregates for the Member States, the candidate
countries, the European Union as a whole, the euro area and the
international environment.
The creation of the internal market in 1993 reduced border controls and
formalities, and accordingly the scope and precision of intra-EU trade
coverage. Typically, intra-EU imports are underestimated compared to
intra-EU exports, leading to an overestimation of the surplus. For the past
the "adjusted" balances are Eurostat estimates for EU and ECB estimates for
the euro area. For the future, they are ECFIN's forecasts based on the
extrapolation of the discrepancies observed in 2019.
EU and euro area aggregates for general government debt are published
on a non-consolidated basis (i.e. not corrected for intergovernmental
loans, including those made through the European Financial Stability
Facility).
Geographical zones are defined as follows :
Euro area :
Tables 5 and 6 on domestic demand and final demand respectively,
present data including inventories.
EA19 (BE, DE, EE, IE, EL, ES, FR, IT, CY, LV, LT, LU, MT, NL, AT, PT, SI,
SK, and FI)
Data for 2021, 2022 and 2023 are forecasts. The source for all tables is the
European Commission, unless otherwise stated. Historical data for the
Member States are based on the European System of Accounts (ESA
2010). US national accounts are based on SNA 2008, whilst the Japanese
accounts use SNA 1993. Due to differences in revision schedules of annual
and quarterly national accounts, annual and quarterly figures may not be
fully consistent for some Member States. Quarterly EU and euro-area GDP growth rates are aggregated using
estimates for 27 Member States, including unpublished quarterly forecasts
for CY, EL, IE and MT.
Potential candidates :
Bosnia-Herzegovina and Kosovo.
Advanced economies :
EU, United Kingdom, candidate countries, Iceland, Norway,
Switzerland, Australia, Canada, Hong Kong, Japan, Korea, New
Zealand, Singapore, Taiwan and the United States.
Employment data used in tables 24 and 26-30 are based on full-time-
equivalents (FTEs), where available. Currently, Spain, France, Italy, and the
Netherlands report FTE data. In the absence of FTE data, employment is
based on numbers of persons. In the calculation of EU and euro-area
aggregates, priority is given to FTE data, as this is regarded as more
representative of diverse patterns of working time.
In Tables 17 and 18, the data are based on the national index for the
United Kingdom, USA and Japan.
EU (EA19, BG, CZ, DK, HR, HU, PL, RO, and SE).
Candidate countries :
Albania, Montenegro, North Macedonia, Serbia and Turkey.
The potential output gap is calculated with reference to potential output
as estimated via a production function, where the increase in the capital
stock and the difference between actual unemployment and the NAWRU
play a key role.
European Union :
8.
Sub-Saharan Africa :
All countries in that region except the African MENA countries.
EU and euro-area data are aggregated using exchange rates. World GDP
is aggregated using Purchasing Power Standards (PPS). In the tables on
world trade and international payments, the aggregation is carried out on
the basis of current exchange rates. Tables 48 - 51, 59 and 60 show also EU
and euro-area "adjusted" balances. Theoretically, balances of EU and
euro area vis-à-vis third countries should be identical to the sum of the
balances of the individual countries in the EU or the euro area. However,
intra-EU or intra-euro-area balances are non-zero because of reporting
errors.
7. Source: National Accounts (ESA 2010), except for US current-account in
tables 49, 51, and 60 (Balance of Payments). Discrepancies with balance
of payments statistics may arise due to methodological differences and
revision schedules.
All countries in that region.
MENA (Middle East and Northern Africa) :
Algeria, Tunisia, Morocco, Egypt, Israel, Jordan, Lebanon, Lybia,
Iraq, Iran, Yemen, Saudi Arabia, Bahrain, Oman, United Arab
Emirates, Kuwait, and Qatar.
Emerging and developing Asia:
All countries in that region except the ones included in the
Advanced economies and the Asian MENA countries.
Latin America :
EUROPEAN ECONOMY INSTITUTIONAL PAPERS SERIES European Economy Institutional Papers series can be accessed and downloaded free of charge from the following address: https://ec.europa.eu/info/publications/economic-and-financial-affairs-publications_en?field_eurovoc_taxonomy_target_id_selective=All&field_core_nal_countries_tid_selective=All&field_core_date_published_value[value][year]=All&field_core_tags_tid_i18n=22621. Titles published before July 2015 can be accessed and downloaded free of charge from: • http://ec.europa.eu/economy_finance/publications/european_economy/index_en.htm
(the main reports, e.g. Economic Forecasts) • http://ec.europa.eu/economy_finance/publications/occasional_paper/index_en.htm
(the Occasional Papers) • http://ec.europa.eu/economy_finance/publications/qr_euro_area/index_en.htm
(the Quarterly Reports on the Euro Area)


GETTING IN TOUCH WITH THE EU In person All over the European Union there are hundreds of Europe Direct Information Centres. You can find the address of the centre nearest you at: http://europa.eu/contact. On the phone or by e-mail Europe Direct is a service that answers your questions about the European Union. You can contact this service:
• by freephone: 00 800 6 7 8 9 10 11 (certain operators may charge for these calls),
• at the following standard number: +32 22999696 or • by electronic mail via: http://europa.eu/contact.
FINDING INFORMATION ABOUT THE EU Online Information about the European Union in all the official languages of the EU is available on the Europa website at: http://europa.eu. EU Publications You can download or order free and priced EU publications from EU Bookshop at: http://publications.europa.eu/bookshop. Multiple copies of free publications may be obtained by contacting Europe Direct or your local information centre (see http://europa.eu/contact). EU law and related documents For access to legal information from the EU, including all EU law since 1951 in all the official language versions, go to EUR-Lex at: http://eur-lex.europa.eu. Open data from the EU The EU Open Data Portal (http://data.europa.eu/euodp/en/data) provides access to datasets from the EU. Data can be downloaded and reused for free, both for commercial and non-commercial purposes.