european economic forecast - spring 2012
TRANSCRIPT

EuropeanEconomic Forecast
EUROPEAN ECONOMY 1|2012
Economic and Financial Aff airs
Spring 2012

The European Economy series contains important reports and communications from the Commission to the Council and the Parliament on the economic situation and developments, such as the European economic forecasts, the annual EU economy review and the Public finances in EMU report. Unless otherwise indicated the texts are published under the responsibility of the Directorate-General for Economic and Financial Affairs of the European Commission, BU24 3/12, B-1049 Brussels, to which enquiries other than those related to sales and subscriptions should be addressed.
Legal notice Neither the European Commission nor any person acting on its behalf may be held responsible for the use which may be made of the information contained in this publication, or for any errors which, despite careful preparation and checking, may appear.
More information on the European Union is available on the Internet (http://europa.eu). ISBN 978-92-79-22818-6 doi: 10.2765/18718 © European Union, 2012 Reproduction is authorised provided the source is acknowledged.

European Commission Directorate-General for Economic and Financial Affairs
COMMISSION STAFF WORKING DOCUMENT
European Economic Forecast Spring 2012
EUROPEAN ECONOMY 1/2012

ABBREVIATIONS
ii
Countries and regions
EU European Union EA euro area BE Belgium BG Bulgaria CZ Czech Republic DK Denmark DE Germany EE Estonia EL Greece ES Spain FR France IE Ireland IT Italy CY Cyprus LV Latvia LT Lithuania LU Luxemburg HU Hungary MT Malta NL The Netherlands AT Austria PL Poland PT Portugal RO Romania SI Slovenia SK Slovakia FI Finland SE Sweden UK United Kingdom HR Croatia JP Japan US United States of America BRICS Brazil, Russia, India, China and South Africa CEE Central and Eastern Europe CIS Commonwealth of Independent States EFTA European Free Trade Association MENA Middle East and North Africa ROW Rest of the World
Economic variables and institutions
BCS Business and Consumer Surveys CDS Credit Default Swaps EDP Excessive Deficit Procedure ESI Economic Sentiment Indicator Euribor European Interbank Offered Rate GDP Gross Domestic Product GNI Gross National Income HICP Harmonised Index of Consumer Prices Libor London Interbank Offered Rate

iii
MTO Medium-Term Objective NAWRU Non-Accelerating Wage Rate of Unemployment OIS Overnight Index Swaps PMI Purchasing Managers' Index REER Real Effective Exchange Rate RWA Risk-Weighted Assets SGP Stability and Growth Pact VAT Value-Added Tax CBR Central Bank of Russia CPB Centraal Planbureau, the Netherlands Bureau for Economic Policy Analysis EBA European Bank Authority ECB European Central Bank EFSF European Financial Stabilisation Facility ESM European Stability Mechanism Fed Federal Reserve, US IMF International Monetary Fund NBR National Bank of Romania NFI Non-financial institutions OBR Office for Budget Responsibility, UK OECD Organisation for Economic Co-operation and Development PBoC People's Bank of China S&P Standard and Poor's
Other abbreviations
BCA Budget Control Act, US BLS Bank Lending Survey COLA Cost-of-living allowance / Cost-of-living adjustment CP Convergence Programme DSGE Dynamic stochastic general equilibrium [model] EERP European Economic Recovery Plan FDI Foreign Direct Investment FX Foreign Exchange LFS Labour Force Survey LTRO Longer-Term Refinancing Operation MRO Main Refinancing Operations PPP Public-Private Partnership QUEST Quarterly Estimation and Simulation Tool, DG ECFIN's DSGE model SOEs State-Owned Enterprises VERP Voluntary Early Retirement Pension, Denmark
Graphs/Tables/Units
a.a. Annual average bbl Barrel bn Billion bps Basis points lhs Left hand scale rhs Right hand scale pp. / pps. Percentage point / points pts Points Q Quarter

iv
q-o-q% Quarter-on-quarter percentage change y-o-y% Year-on-year percentage change SAAR Seasonally-Adjusted Annual Rate
Currencies
EUR Euro ECU European currency unit EMU Economic and Monetary Union BGN Bulgarian lev CNY Chinese yuan, renminbi CZK Czech koruna DKK Danish krone GBP Pound sterling HUF Hungarian forint HRK Croatian kuna ISK Icelandic krona LTL Lithuanian litas LVL Latvian lats MKD Macedonian denar NOK Norwegian krone PLN Polish zloty RON New Romanian leu RSD Serbian dinar SEK Swedish krona CHF Swiss franc JPY Japanese yen TRY Turkish lira USD US dollar

CONTENTS
v
Overview 1
PART I: Economic developments at the aggregated level 7
The EU economy: From recession towards a slow recovery 9 1. Overview 9 2. Putting the forecast into perspective 11 3. The external environment 14 4. Financial markets 18 5. The EU Economy 24 6. Risks 49
PART II: Prospects by individual economy 53
Member States 55 1. Belgium: A narrow path towards growth-friendly consolidation 56 2. Bulgaria: Slow recovery ahead while fiscal position continues to
improve 58 3. The Czech Republic: From a mild recession to a mild recovery 60 4. Denmark: Subdued growth sustained by domestic demand 62 5. Germany: Domestic demand to drive growth over the forecast
horizon 64 6. Estonia: Export subdued, while domestic demand supports
growth 67 7. Ireland: On-going domestic adjustment supported by export
growth 69 8. Greece: An economy longing for the turnaround 71 9. Spain: Difficult times ahead 73 10. France: Resilient economic growth so far, slow recovery ahead 76 11. Italy: A slow exit from the new recession 79 12. Cyprus: The correction of domestic and external imbalances
weighs on economic activity 82 13. Latvia: Recovery remains on track despite external shocks 84 14. Lithuania: Growth set to slow down but remains robust 86 15. Luxembourg: Unfavourable international environment dampens
growth prospects 88 16. Hungary: Muddling through 90 17. Malta: Growth moderates but remains above the euro-area
average 92 18. The Netherlands: Subdued outlook on the back of weak
domestic demand 94 19. Austria: Nascent recovery of confidence still to work its way
through 97 20. Poland: Growth continues, but at a lower pace 99 21. Portugal: Fiscal and external adjustment are underway 102 22. Romania: Recovery continues to be driven by domestic
demand 104 23. Slovenia: Economic growth to continue to underperform the
euro area 106

vi
24. Slovakia: Economy still resilient in 2011 but growth losing pace 108 25. Finland: Balanced budget in sight, exports and labour market
facing structural changes 110 26. Sweden: Subdued recovery with low employment growth 112 27. The United Kingdom: Growth likely to remain subdued this year
but with a brighter outlook 114
Acceding Countries 117 28. Croatia: Remaining in recession 118
Candidate Countries 121 29. The former Yugoslav Republic of Macedonia: Sustained capital
inflows support economic growth 122 30. Iceland: A recovery is taking hold 124 31. Montenegro: Subdued recovery in progress 126 32. Serbia: Growth and fiscal challenges 128 33. Turkey: Engineering a soft landing 130
Other non-EU Countries 133 34. The United States of America: Modest recovery amid increased
fiscal policy uncertainty 134 35. Japan: Recovery after a setback 137 36. China: A benign slowdown amid remaining structural challenges 139 37. EFTA: Signs of resilience despite difficult external conditions 141 38. Russian Federation: Growth stabilises at moderate rates 144
Statistical Annex 149
LIST OF TABLES I.1. Overview - the spring 2012 forecast 10 I.2. International environment 15 I.3. Main features of the spring 2012 forecast - EU 25 I.4. Main features of the spring 2012 forecast - euro area 26 I.5. Composition of growth - EU 29 I.6. Composition of growth - euro area 30 I.7. Labour market outlook - euro area and EU 40 I.8. Inflation outlook - euro area and EU 42 I.9. Euro-area debt dynamics 49
LIST OF GRAPHS I.1. Real GDP, EU 9 I.2. HICP, EU 10 I.3. Comparison of recoveries, the 2009-11 recovery against past
average - GDP, euro area 12 I.4. Real GDP growth in EU, non-EU advanced and emerging
economies 13 I.5. Multi-speed real GDP growth in the EU, annual growth rates
(weighted) 14 I.6. World trade and Global PMI manufacturing output 15

vii
I.7. Commodity-price developments 15 I.8. Ten-year government-bond yields, selected euro-area
Member States 19 I.9. Stock-market indices, euro area 19 I.10. Interbank market spreads 20 I.11. Bank lending to households and non-financial corporations,
euro area 20 I.12. Net changes in credit standards and credit demand for
loans to non-financial corporations, euro area 20 I.13. Bank loan-to-deposit ratios, loans as a percentage of
deposits 21 I.14. Real GDP, euro area 24 I.15. Real GDP, EU without euro area 24 I.16. GDP growth and its components, EU 25 I.17. Industrial new orders and industrial production, EU 25 I.18. Economic Sentiment Indicator and PMI Composite Output
Index, EU 26 I.19. Real GDP growth , EU, contributions by Member States 27 I.20. PMI Manufacturing Output Index, Member States 28 I.21. Economic Sentiment Indicator (ESI) and components - April
2012, difference from long-term average 28 I.22. Equipment investment and capacity utilisation, euro area 29 I.23. Housing investment and building permits, euro area 30 I.24. Private consumption and consumer confidence, euro area 31 I.25. Real gross diposable income and its components, euro area 31 I.26. Retail trade volumes and retail confidence, euro area 32 I.27. Global demand, euro-area exports and new export orders 33 I.28. Current-account balances, euro area and Member States 34 I.29. Employment expectations, DG ECFIN surveys, euro area 39 I.30. Unemployment rates across euro-area population 40 I.31. Industrial producer prices, euro area 41 I.32. PMI manufacturing input prices and output prices, EU 42 I.33. HICP, euro area 42 I.34. Headline, core and constant-tax inflation, EU 43 I.35. Inflation breakdown, EU 43 I.36. Inflation expectations, euro area 44 I.37. Contribution of energy inflation to headline inflation, EU and
Member States (2011) 44 I.38. HICP inflation across euro-area population 44 I.39. Budgetary developments, euro area 47 I.40. General government revenues and expenditure, EU 48 I.41. Euro area GDP forecasts - Uncertainty linked to the balance
of risks 50
LIST OF BOXES I.1. Oil-price increases and their macroeconomic impact on the
EU economy 16 I.2. Impact of the ECB's liquidity provision on credit flows to the
real economy 22 I.3. Rebalancing needs still sizeable 35 I.4. Fiscal consolidation and the economic outlook 45 I.5. Some technical elements behind the forecast 51

viii
LIST OF MAPS I.1. Real GDP per capita in the EU Member States, 2008-12
(cumulated growth rates) 11
EDITORIAL
ix
Marco Buti Director General Economic and Financial Affairs
A recovery is on the horizon, but it will be a long and stony road before the EU economy reaches sustained growth. Following the escalation of the sovereign-debt crisis in the second half of 2011, the EU economy has entered a shallow recession in the fourth quarter. Since then, we have seen tentative signs of stabilisation. Yet, as the outlook for the EU economy is slowly improving, the situation remains extraordinarily fragile, and the risk of a renewed aggravation of the crisis is still present. The ebbing of the greatest financial market stress creates the opportunity for policy-makers to focus on measures to underpin the strength of the expected recovery and the growth potential.
In late 2011, a sharp drop in the supply of credit threatened to turn into an outright credit crunch that would have strangled the real economy. However, this has been avoided, largely thanks to the exceptional liquidity provision by the Eurosystem. By reducing bank funding stress, it has prepared the ground for easing tensions across a broad range of financial market segments in the first months of 2012. Business and consumer sentiment, which deteriorated sharply in the second half of 2011, has stabilised at low levels, but is not trending upwards, yet. A return of confidence is a precondition for the dynamics of recovery to unfold. The recent improvements have been underpinned by a number of complementary policy measures at EU and Member State level. Member States have adopted additional measures to reduce their vulnerabilities. Large firewalls have been agreed to contain possible contagion, and the euro area has strengthened its institutional framework and its surveillance tools. Finally, bank recapitalisation is progressing. However, renewed market volatility in recent weeks is a reminder that the stabilisation cannot be taken for granted yet, and that the pernicious interaction between weak sovereigns, weak banks and weak GDP is still among the biggest risks to the outlook.
Past experience shows that recoveries from financial crises are not only slow and uneven, but also often subject to episodes of renewed weakness and financial market stress. The legacy of the Great Recession in 2008-09 and the sovereign-debt crisis imply a very gradual recovery for the EU economy characterised by growth below potential over most of the forecast horizon, insufficient employment dynamics and persistent growth differentials across Member States.
Major policy challenges remain, in order to consolidate the recent stabilisation, solidify the basis of the recovery and strengthen the growth potential of the EU economy as well as its capacity to resorb imbalances. The crisis is fuelled by concerns about the sustainability of sovereign debt that has been rising faster than GDP. Avoiding a relapse into the crisis therefore requires not only crisis resolution tools and fiscal adjustment, but also bolstering the structural underpinnings of growth. Concretely, the tasks ahead include, but are not limited to: firstly, using the window of opportunity provided by the ECB liquidity injections to further strengthen bank balance sheets and thus allowing the banking sector to underpin the recovery of the real economy; secondly, a combination of fiscal consolidation and structural reforms to safeguard debt sustainability where it is menaced. Budgetary policy should be differentiated according to Member States' fiscal space and financial vulnerabilities, and should be designed and implemented in a way that minimises the short-term negative impact on growth. Moreover, structural reform is needed to help the adjustment of existing internal and external imbalances which has progressed over the past two years and prevent the re-emergence of persistent imbalances in the future. The EU has equipped itself with rich tools for enhanced surveillance and policy response. Now it has to use them.

OVERVIEW
1
Renewed tensions in sovereign-debt markets, high oil prices and decelerating world output growth have all contributed to a sharp loss of confidence towards the end of 2011 and the subsequent output contraction in the EU. Strong policy actions and major advancements in the EU institutional framework have averted a far worse outcome and brought about an easing of financial market tensions as well as a stabilisation in confidence at the beginning of 2012. However, looming uncertainty about economic prospects, re-ignited stress in sovereign-bond markets and concerns about the banking sector are still weighing on economic and financial conditions, albeit with large cross-country divergences.
Financial market conditions in the first months of this year have improved markedly as sovereign- and bank-funding stress have eased and the prospect of a credit crunch has largely diminished, mainly thanks to non-standard monetary policy measures, most notably the Eurosystem's longer-term refinancing operations in December 2011 and February 2012. However, renewed uncertainty about fiscal developments in some Member States amid a worsening growth outlook and still fragile banks have recently again increased the strain on sovereign-bond yields of concerned Member States and affected several other financial market segments. Credit growth to the non-financial private sector is still subdued and is not expected to pick-up in the short term. Credit supply conditions remain tight, in spite of some recent encouraging signs, while credit demand from private households and firms remains limited as both borrowers and lenders are engaged in a process of gradual deleveraging which is expected to continue throughout the forecast horizon.
Outside the EU, global growth has lately shown signs of reacceleration. The US recovery seems to have gained some momentum in the second half of 2011, reflected by stronger consumption growth and milder fiscal consolidation (implying a public debt level of 112% of GDP in 2013), while labour market prospects appear to be more uncertain. In Japan, the post-disaster recovery is set to continue on the back of investment. Overall, growth in emerging market economies is expected to remain robust, notably in China, but to moderate slightly over the forecast horizon. Global trade has decelerated in 2011 driven by single events such as disasters in Japan, but also by geopolitical tensions and the turmoil in sovereign-debt markets in Europe. In line with global GDP, world trade is projected to grow only moderately in 2012, before embarking on a more dynamic growth path in 2013. Increased energy prices are weighing on growth, but going forward, crude-oil prices are assumed to stabilise and gradually decrease over the forecast horizon.
After negative growth rates in the last quarter of 2011, a GDP contraction is forecast also for the beginning of this year in the EU and the euro area. Both zones have thus entered a technical recession. The EU economy is set to register a weak first half year with quarterly growth rates around zero or slightly negative in the majority of Member States. While some leading indicators are suggesting a mild and short-lived recession, recent survey and hard data do not indicate the start of the recovery, yet.
Strong stabilising policy actions, but economic and financial situation still fragile
Global growth is showing signs of re-accelerating
A mild recession with a subdued recovery in the offing …

European Economic Forecast, Spring 2012
2
Projections have been substantially revised downward for 2012 as a whole, and to a lesser extent for 2013, compared with last autumn. However, compared with the February interim forecast, the picture remains unchanged for this year, when GDP in the euro area is expected to undergo a slight contraction of 0.3% and to remain stable in the EU. In 2013, economic activity is projected to increase by 1.0% in the euro area and by 1.3% in the EU. The forecast mild recovery is predicated on a return of confidence, and thus on the assumption that the challenges faced by the euro area, notably the still on-going sovereign-debt crisis and the fragile state of the EU banking system, will be successfully and sustainably overcome.
Overall, domestic demand is unlikely to support GDP growth in 2012, as the process of deleveraging continues across the sectors of the economy. Banks need to further strengthen their balance sheets and tight credit conditions are expected to weigh on consumption and investment. Private investment is currently still contracting and is expected to be a drag on GDP in 2012. It is forecast to rebound gradually and bolster economic growth in 2013 benefiting from the export-led rebound, low financing costs and the fading of uncertainty about business prospects. Private consumption will continue to be restrained by high unemployment, slow growth of real incomes and high precautionary savings as well as high household debt in a number of Member States. With the expected return of confidence, labour market conditions stabilising and real disposable income growth supported by abating inflationary pressures, private consumption is set to reaccelerate gradually from the second half of 2012 on and expand further in 2013. By contrast, public consumption is expected to shrink in 2012 and 2013 against the background of continuing fiscal consolidation needs to ensure public debt sustainability and restore confidence. The necessary fiscal consolidation is set to restrain economic activity in the short run. However, the appropriate choice of fiscal measures and their credibility can limit the adverse short-term impact on growth. Overall, domestic demand is expected to take over from net exports as the main driver of the recovery in 2013, on the back of restored business and consumer confidence and rising real disposable incomes.
Against the backdrop of the expected acceleration in global growth and recent depreciation of the euro effective exchange-rate, an increase in export growth is forecast for the second half of 2012 and in 2013. But the extent to which Member States are likely to benefit from a more dynamic global economy will depend on their regional and product specialisation and their competitiveness positions. By contrast, import growth will be restrained by weak domestic demand in 2012, but is forecast to become more buoyant thereafter, in line with the improving economic situation. On balance, net exports of goods and services are expected to support economic growth over the forecast horizon. The consolidated current-account balance is predicted to gradually improve over the forecast horizon in the euro area and the EU.
At Member State level, the structural adjustment needs resulting from internal and external imbalances that characterised the run-up to the global economic crisis have already triggered a substantial rebalancing of external positions. Initially, the larger part occurred through balance-sheet adjustment in the private sector of deficit countries and there are indications that at least part of the observed rebalancing has been structural rather than merely cyclical. Consolidation in the public sector is contributing to lower net borrowing, while the reassessment of risks and growth perspectives in deficit countries should keep interest rates at elevated levels and exert pressure for
Lingering uncertainty weighing on domestic demand in 2012 …
… but a positive contribution from the external side
External adjustment at Member State level on-going
Overview
3
continuing rebalancing. Changes in relative prices and improvements in competitiveness are supporting the reallocation of productive resources to the tradable sector in deficit countries. Finally, the on-going structural reforms will contribute to the external rebalancing process. Within the euro area, Member States with current-account surpluses have experienced a reduction of these surpluses over the past years. But further gradual adjustment is expected to be uneven across surplus countries over the forecast horizon.
Diverse external positions and structural conditions have contributed to the large cross-country disparities that emerged during the Great Recession. Differentials in fiscal consolidation needs, domestic financing costs, and the banking sector's capacity to extend credit as well as different labour market situations accentuate this heterogeneity.
After a flat first quarter, economic activity in Germany is forecast to gain momentum over the forecast horizon, with domestic demand bolstered by very favourable financing conditions for firms and households and a robust labour market. Output in France is predicted to expand at a moderate pace, as more buoyant private consumption growth is hampered by unfavourable labour market conditions. In Italy, GDP growth is expected to be anaemic over the forecast horizon, as the economy has to cope with structural impediments and related high unemployment and its direct exposure to sovereign and bank funding stress. Spain is projected to remain in recession until the end of 2012 as the Spanish economy faces a still incomplete adjustment of the housing market and in external competitiveness, a fragile banking sector, important fiscal consolidation and very high unemployment. The Dutch economy is forecast to return to slightly positive growth rates only at the end of 2012, as rising external demand is expected to increasingly offset the decrease in private consumption. Among the three euro-area programme countries, the Irish economy is expected to gain momentum over the forecast horizon on the back of gains in competiveness and a slowly stabilising labour market. Reflecting the adjustment process to regain competitiveness and rein in budget imbalances, GDP in Greece is forecast to contract substantially in 2012 and to stabilise in the following year. Output in Portugal is expected to shrink considerably in 2012, followed by moderate growth in 2013.
As regards the largest Member States outside the euro area, the UK economy registered negative growth rates at the end of 2011 and the beginning of 2012, mainly due to weak private consumption. With a pick-up in real wage growth and more robust external demand expected toward the end of 2012, later followed by investment, GDP expansion is set to become increasingly dynamic over the forecast horizon. Poland is set to register the highest economic growth in the EU in 2012 despite a moderate slowdown, and to keep the pace in 2013. Domestic demand is projected to remain the main driver of growth, with private consumption giving more and more way to investment.
Regarding non-euro-area (post-)programme countries, GDP in Romania and Latvia is expected to expand over the forecast horizon. By contrast, economic activity in Hungary, for which no programme has been agreed yet, is forecast to contract in 2012 due to subdued domestic demand, but to pick up in 2013.
Cross-country heterogeneity shapes the outlook
European Economic Forecast, Spring 2012
4
Employment growth has turned negative, bringing up the unemployment rate in the EU to above 10% in early 2012. The overall deterioration masks substantial cross-country differences where increasing employment levels and gradually declining unemployment in some countries sharply contrast with a rapid deterioration in the labour market performance in vulnerable Member States. Leading indicators suggest a weak outlook for the EU labour market, with the recession set to increase unemployment in the near term. Unlike in 2009, strained public budgets and reductions in public sector staffing are likely to weigh further on overall employment prospects. In 2013, the subdued recovery and positive effects of labour market reforms are expected to translate into a slight increase in employment in the EU.
Consumer prices in 2011 were mainly driven by the pass-through of rising global commodity prices and, in some Member States, by increases in indirect taxes and administered prices. HICP inflation temporarily exceeded 3% in 2011, but began to recede in the light of a weakening economic environment. The easing in commodity prices as indicated by commodities futures toward the end of this year and relative weak economic activity should lower consumer-price inflation further. A faster decline in inflation rates is precluded by fiscal measures adopted in several Member States, most notably increases in indirect taxes and administered prices. The return of subdued growth in late 2012 and 2013 is not expected to contribute to price pressures, in particular since output gaps are expected to narrow very slowly in the EU and the euro area. HICP headline inflation is forecast to stay close to 2% in 2013 in the EU and the euro area.
Notwithstanding worsening economic prospects in the course of last year, aggregate public finance conditions in the EU and the euro area improved significantly in 2011. On the back of further fiscal consolidation measures combined with an expected gradual economic recovery, budget deficits are expected to continue to decline throughout 2012 and 2013. The overall deficit in the EU is set to decrease from 4½% of GDP in 2011 to some 3½% in 2012 and, at unchanged policies, further to 3¼% in 2013. The deficit reduction in 2012 is underpinned by sizeable fiscal measures, while the fiscal stance underlying the forecast in 2013 is broadly neutral.
Government debt-to-GDP ratios are forecast to increase in most EU Member States over the forecast horizon. In the euro area, increasing interest payments and low growth are contributing to push up debt ratios. The aggregate debt ratio of the EU is forecast to reach 86% of GDP this year and 87% of GDP in 2013 (slight upward revisions relative to the autumn forecast). The corresponding euro-area figures are 92% and 93%.
The outlook continues to be surrounded by high uncertainty. While some risks identified in earlier forecasts have eventually materialised, such as continued stress in sovereign-debt markets in some countries, entering a recession, or a lower momentum of global growth, the tail risks have been reduced thanks to substantial policy agreements and bold policy measures. On balance, the risks to the growth outlook remain tilted to the downside. The forecast crucially depends on the policy assumption that crisis-related challenges are successfully addressed.
The largest downside risk remains an escalation of the sovereign-debt crisis in the euro area. A resurgence of financial turmoil due to negative confidence shocks would spill over to the real economy and reinforce negative feedback loops between fragile banks and weak sovereigns, while severely
The labour market situation and prospects have deteriorated further
Inflation is expected to abate gradually
Public deficits continue to narrow
The risks to the outlook remain tilted to the downside
Overview
5
constraining access to credit. Moreover, as fiscal sustainability continues to be a major issue within and outside the EU, consolidation measures in 2013 which are not included in the central forecast scenario due to the no-policy-change assumption could have an additional impact on demand. The deleveraging needs of the private sector in some Member States could possibly weigh on growth more strongly than currently envisaged. Finally, a large risk also relates to oil prices as renewed supply or demand tensions in crude-oil markets could produce an oil-price surge, lower real incomes and less consumption than assumed.
On the upside, the policy measures taken to address the sovereign-debt crisis might lift confidence faster and entail an earlier return to recovery than expected. Furthermore, a stronger than expected rebound in the global economy, in particular stronger growth dynamics in emerging market economies, would boost EU exports more than forecast in the central scenario.
Risks to the inflation outlook appear broadly balanced. On the downside, a more profound than expected recession in the EU may put further downward pressure on prices, while any attempt of competitive devaluations outside the EU could constrain import prices. On the upside, a stronger-than-expected rebound of the world economy or intensifying geopolitical tensions could trigger a new oil-price surge and lift inflationary pressures. Higher wage increases than covered by productivity developments, additional consolidation-related tax measures and the large long-term build-up of liquidity may also potentially contribute to somewhat higher consumer-price inflation.


PART I Economic developments at the aggregated level

THE EU ECONOMY: FROM RECESSION TOWARDS A SLOW RECOVERY
9
1. OVERVIEW
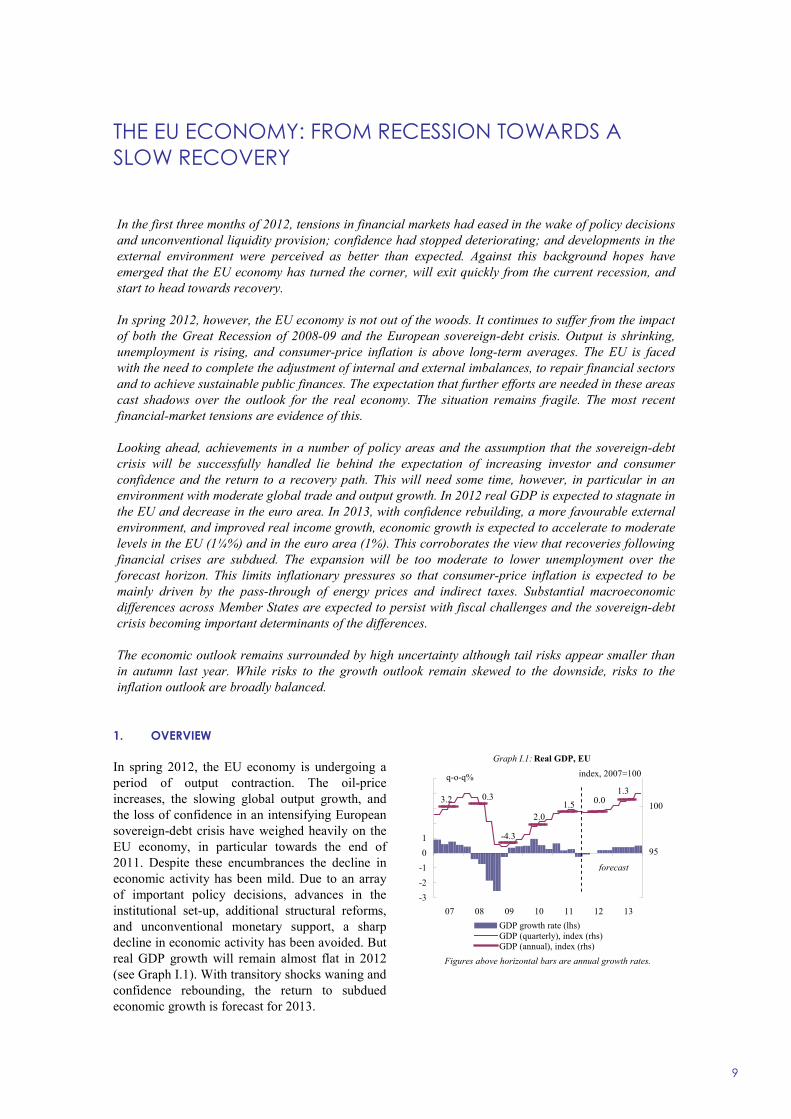
In spring 2012, the EU economy is undergoing a period of output contraction. The oil-price increases, the slowing global output growth, and the loss of confidence in an intensifying European sovereign-debt crisis have weighed heavily on the EU economy, in particular towards the end of 2011. Despite these encumbrances the decline in economic activity has been mild. Due to an array of important policy decisions, advances in the institutional set-up, additional structural reforms, and unconventional monetary support, a sharp decline in economic activity has been avoided. But real GDP growth will remain almost flat in 2012 (see Graph I.1). With transitory shocks waning and confidence rebounding, the return to subdued economic growth is forecast for 2013.
-3-2-1012345
07 08 09 10 11 12 1390
95
100
GDP growth rate (lhs)GDP (quarterly), index (rhs)GDP (annual), index (rhs)
Graph I.1: Real GDP, EU
forecast
q-o-q% index, 2007=100
3.2 0.3
-4.3
2.01.5 0.0
Figures above horizontal bars are annual growth rates.
1.3
In the first three months of 2012, tensions in financial markets had eased in the wake of policy decisions and unconventional liquidity provision; confidence had stopped deteriorating; and developments in the external environment were perceived as better than expected. Against this background hopes have emerged that the EU economy has turned the corner, will exit quickly from the current recession, and start to head towards recovery.
In spring 2012, however, the EU economy is not out of the woods. It continues to suffer from the impact of both the Great Recession of 2008-09 and the European sovereign-debt crisis. Output is shrinking, unemployment is rising, and consumer-price inflation is above long-term averages. The EU is faced with the need to complete the adjustment of internal and external imbalances, to repair financial sectors and to achieve sustainable public finances. The expectation that further efforts are needed in these areas cast shadows over the outlook for the real economy. The situation remains fragile. The most recent financial-market tensions are evidence of this.
Looking ahead, achievements in a number of policy areas and the assumption that the sovereign-debt crisis will be successfully handled lie behind the expectation of increasing investor and consumer confidence and the return to a recovery path. This will need some time, however, in particular in an environment with moderate global trade and output growth. In 2012 real GDP is expected to stagnate in the EU and decrease in the euro area. In 2013, with confidence rebuilding, a more favourable external environment, and improved real income growth, economic growth is expected to accelerate to moderate levels in the EU (1¼%) and in the euro area (1%). This corroborates the view that recoveries following financial crises are subdued. The expansion will be too moderate to lower unemployment over the forecast horizon. This limits inflationary pressures so that consumer-price inflation is expected to be mainly driven by the pass-through of energy prices and indirect taxes. Substantial macroeconomic differences across Member States are expected to persist with fiscal challenges and the sovereign-debt crisis becoming important determinants of the differences.
The economic outlook remains surrounded by high uncertainty although tail risks appear smaller than in autumn last year. While risks to the growth outlook remain skewed to the downside, risks to the inflation outlook are broadly balanced.
European Economic Forecast, Spring 2012
10
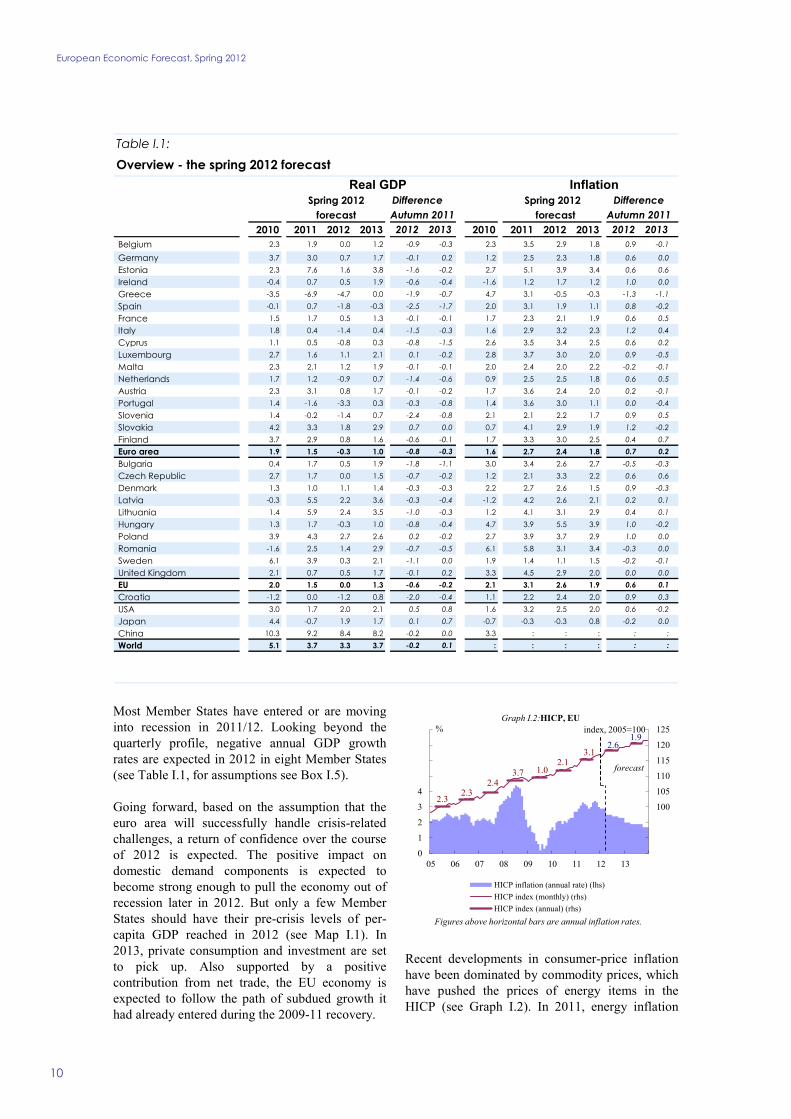
Most Member States have entered or are moving into recession in 2011/12. Looking beyond the quarterly profile, negative annual GDP growth rates are expected in 2012 in eight Member States (see Table I.1, for assumptions see Box I.5).
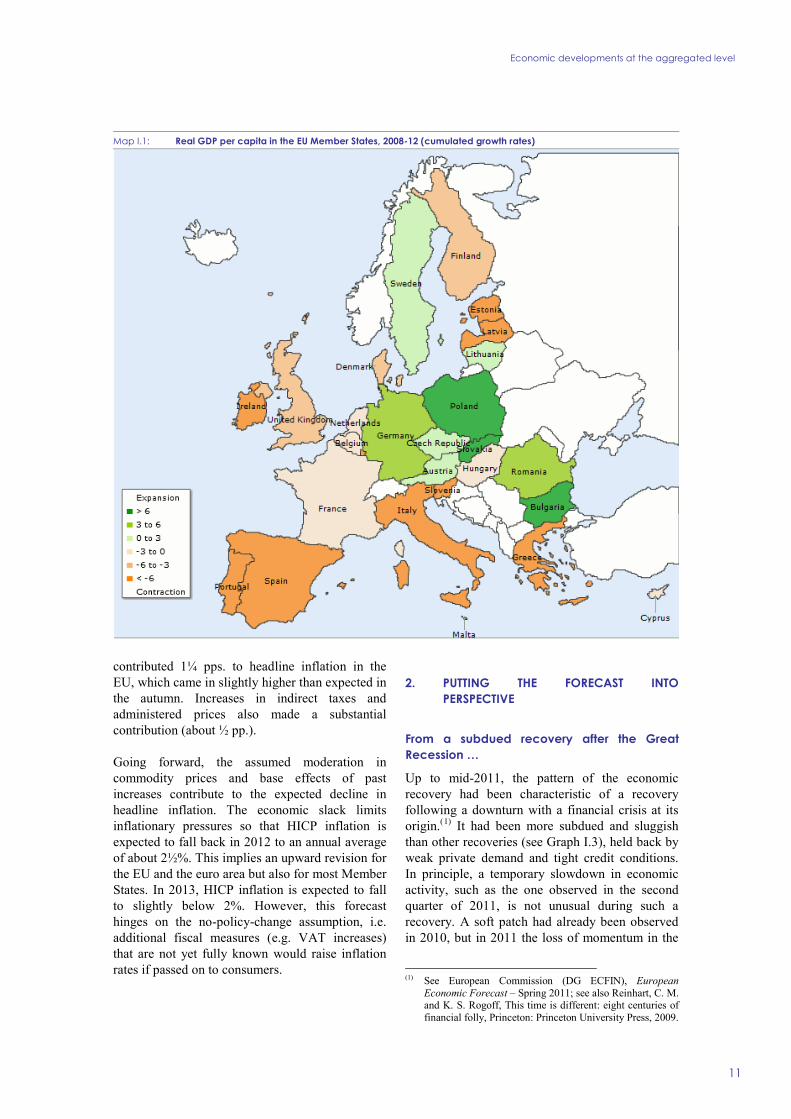
Going forward, based on the assumption that the euro area will successfully handle crisis-related challenges, a return of confidence over the course of 2012 is expected. The positive impact on domestic demand components is expected to become strong enough to pull the economy out of recession later in 2012. But only a few Member States should have their pre-crisis levels of per-capita GDP reached in 2012 (see Map I.1). In 2013, private consumption and investment are set to pick up. Also supported by a positive contribution from net trade, the EU economy is expected to follow the path of subdued growth it had already entered during the 2009-11 recovery.
85
90
95
100
105
110
115
120
125
0
1
2
3
4
5
6
7
8
05 06 07 08 09 10 11 12 13
HICP inflation (annual rate) (lhs)HICP index (monthly) (rhs)HICP index (annual) (rhs)
Graph I.2:HICP, EU
forecast
% index, 2005=100
2.32.4
3.7 1.02.1
3.12.6
2.3
Figures above horizontal bars are annual inflation rates.
1.9
Recent developments in consumer-price inflation have been dominated by commodity prices, which have pushed the prices of energy items in the HICP (see Graph I.2). In 2011, energy inflation
Table I.1:Overview - the spring 2012 forecast
Real GDP InflationSpring 2012 Difference Spring 2012 Difference
forecast Autumn 2011 forecast Autumn 20112010 2011 2012 2013 2012 2013 2010 2011 2012 2013 2012 2013
Belgium 2.3 1.9 0.0 1.2 -0.9 -0.3 2.3 3.5 2.9 1.8 0.9 -0.1
Germany 3.7 3.0 0.7 1.7 -0.1 0.2 1.2 2.5 2.3 1.8 0.6 0.0 Estonia 2.3 7.6 1.6 3.8 -1.6 -0.2 2.7 5.1 3.9 3.4 0.6 0.6 Ireland -0.4 0.7 0.5 1.9 -0.6 -0.4 -1.6 1.2 1.7 1.2 1.0 0.0 Greece -3.5 -6.9 -4.7 0.0 -1.9 -0.7 4.7 3.1 -0.5 -0.3 -1.3 -1.1 Spain -0.1 0.7 -1.8 -0.3 -2.5 -1.7 2.0 3.1 1.9 1.1 0.8 -0.2 France 1.5 1.7 0.5 1.3 -0.1 -0.1 1.7 2.3 2.1 1.9 0.6 0.5 Italy 1.8 0.4 -1.4 0.4 -1.5 -0.3 1.6 2.9 3.2 2.3 1.2 0.4 Cyprus 1.1 0.5 -0.8 0.3 -0.8 -1.5 2.6 3.5 3.4 2.5 0.6 0.2 Luxembourg 2.7 1.6 1.1 2.1 0.1 -0.2 2.8 3.7 3.0 2.0 0.9 -0.5 Malta 2.3 2.1 1.2 1.9 -0.1 -0.1 2.0 2.4 2.0 2.2 -0.2 -0.1 Netherlands 1.7 1.2 -0.9 0.7 -1.4 -0.6 0.9 2.5 2.5 1.8 0.6 0.5 Austria 2.3 3.1 0.8 1.7 -0.1 -0.2 1.7 3.6 2.4 2.0 0.2 -0.1 Portugal 1.4 -1.6 -3.3 0.3 -0.3 -0.8 1.4 3.6 3.0 1.1 0.0 -0.4 Slovenia 1.4 -0.2 -1.4 0.7 -2.4 -0.8 2.1 2.1 2.2 1.7 0.9 0.5 Slovakia 4.2 3.3 1.8 2.9 0.7 0.0 0.7 4.1 2.9 1.9 1.2 -0.2 Finland 3.7 2.9 0.8 1.6 -0.6 -0.1 1.7 3.3 3.0 2.5 0.4 0.7 Euro area 1.9 1.5 -0.3 1.0 -0.8 -0.3 1.6 2.7 2.4 1.8 0.7 0.2 Bulgaria 0.4 1.7 0.5 1.9 -1.8 -1.1 3.0 3.4 2.6 2.7 -0.5 -0.3 Czech Republic 2.7 1.7 0.0 1.5 -0.7 -0.2 1.2 2.1 3.3 2.2 0.6 0.6 Denmark 1.3 1.0 1.1 1.4 -0.3 -0.3 2.2 2.7 2.6 1.5 0.9 -0.3 Latvia -0.3 5.5 2.2 3.6 -0.3 -0.4 -1.2 4.2 2.6 2.1 0.2 0.1 Lithuania 1.4 5.9 2.4 3.5 -1.0 -0.3 1.2 4.1 3.1 2.9 0.4 0.1 Hungary 1.3 1.7 -0.3 1.0 -0.8 -0.4 4.7 3.9 5.5 3.9 1.0 -0.2 Poland 3.9 4.3 2.7 2.6 0.2 -0.2 2.7 3.9 3.7 2.9 1.0 0.0 Romania -1.6 2.5 1.4 2.9 -0.7 -0.5 6.1 5.8 3.1 3.4 -0.3 0.0 Sweden 6.1 3.9 0.3 2.1 -1.1 0.0 1.9 1.4 1.1 1.5 -0.2 -0.1 United Kingdom 2.1 0.7 0.5 1.7 -0.1 0.2 3.3 4.5 2.9 2.0 0.0 0.0 EU 2.0 1.5 0.0 1.3 -0.6 -0.2 2.1 3.1 2.6 1.9 0.6 0.1 Croatia -1.2 0.0 -1.2 0.8 -2.0 -0.4 1.1 2.2 2.4 2.0 0.9 0.3 USA 3.0 1.7 2.0 2.1 0.5 0.8 1.6 3.2 2.5 2.0 0.6 -0.2 Japan 4.4 -0.7 1.9 1.7 0.1 0.7 -0.7 -0.3 -0.3 0.8 -0.2 0.0 China 10.3 9.2 8.4 8.2 -0.2 0.0 3.3 : : : : : World 5.1 3.7 3.3 3.7 -0.2 0.1 : : : : : :
Economic developments at the aggregated level
11
contributed 1¼ pps. to headline inflation in the EU, which came in slightly higher than expected in the autumn. Increases in indirect taxes and administered prices also made a substantial contribution (about ½ pp.).
Going forward, the assumed moderation in commodity prices and base effects of past increases contribute to the expected decline in headline inflation. The economic slack limits inflationary pressures so that HICP inflation is expected to fall back in 2012 to an annual average of about 2½%. This implies an upward revision for the EU and the euro area but also for most Member States. In 2013, HICP inflation is expected to fall to slightly below 2%. However, this forecast hinges on the no-policy-change assumption, i.e. additional fiscal measures (e.g. VAT increases) that are not yet fully known would raise inflation rates if passed on to consumers.
2. PUTTING THE FORECAST INTO PERSPECTIVE
From a subdued recovery after the Great Recession …
Up to mid-2011, the pattern of the economic recovery had been characteristic of a recovery following a downturn with a financial crisis at its origin.(1) It had been more subdued and sluggish than other recoveries (see Graph I.3), held back by weak private demand and tight credit conditions. In principle, a temporary slowdown in economic activity, such as the one observed in the second quarter of 2011, is not unusual during such a recovery. A soft patch had already been observed in 2010, but in 2011 the loss of momentum in the
(1) See European Commission (DG ECFIN), European
Economic Forecast – Spring 2011; see also Reinhart, C. M. and K. S. Rogoff, This time is different: eight centuries of financial folly, Princeton: Princeton University Press, 2009.
Map I.1: Real GDP per capita in the EU Member States, 2008-12 (cumulated growth rates)

European Economic Forecast, Spring 2012
12
EU economy towards the end of the year turned out to be stronger than expected in the autumn of last year. Putting this into perspective usually requires an examination of long historical series. For the EU economy such a massive data-gathering is difficult given the short history of its economic aggregates. Nevertheless, the EU forecast resembles some of the stylised features described in recent crises-oriented research.(2)
100
101
102
103
104
105
106
0 1 2 3 4 5 6 7 8
Graph I.3:Comparison of recoveries, the 2009-11 recovery against past average - GDP, euro area
Past recoveries 2009-11 recovery
Quarters
index
Note: Real GDP following the recessions of the mid 1970s, early 1980s and early 1990s
… to a relatively mild recession as headwinds intensified and the sovereign-debt crisis escalated …
In 2011, there were strong global headwinds, with sharp increases in oil prices (see Box I.1), public finance concerns and the rating downgrade in the US, disruptions to supply chains by Japanese disasters in March and the flooding in Thailand in December, but it was mainly the negative impact of the sovereign-debt crisis in Europe that derailed the recovery. The tightening of fiscal policy also weighed on economic growth. Concerns about public finances, the stability of the banking sector and the functioning of the Economic and Monetary Union (EMU), harmed confidence of consumers and businesses. Sovereign-yield spreads responded increasingly to changes in perceptions about the state of public finances. Bank-funding markets became impaired, raising fears of a banking crisis. The deteriorating economic outlook amplified adverse feedback loops between the financial sector, public finances and the real economy, which further worsened the situation. And concerns spread to a wider range of countries over the second half of the year. Increases in borrowing costs, partial exclusion from foreign capital
(2) For an overview see e.g. Gorton, G. and A. Metrick,
Getting up to speed on the financial crisis: a one-weekend-reader's guide, Journal of Economic Literature, March 2012, Vol. 50, No. 1, pp. 128-150.
markets, and declining foreign trade flows were key channels through which the sovereign-debt crisis affected output.(3) By the end of the year, the EU and the euro area as a whole had entered a period of contraction.
The shift of focus that characterised 2011, from banking sector problems towards sovereign-debt issues, has been identified as a typical feature of deep financial crises.(4) But last year, shortcomings in the institutional set-up of EMU intensified the impact on the real economy. This was the starting point for policy initiatives aiming at a completion of the governance structure in EMU (including for instance the "Six pack" and the "Macroeconomic Imbalance Procedure").
… until decisive policy decisions stopped the decline …
At this crucial crossroad for the EU economy, a multifaceted policy response helped avoiding an imminent credit crunch and contained financial turmoil. In particular, non-standard monetary policy measures in the euro area played a key role in buttressing confidence in the banking sector (see Box I.2). Following policy-rate cuts in November and December, additional liquidity at long maturities enabled euro-area banks to cover the large funding needs that were coming up in early 2012. Banks used some of the liquidity to purchase higher yielding sovereign bonds, driving down yields. Other measures taken at the EU level included the announcement of a fiscal compact, and a strengthening of the crisis facilities (European Stability Mechanism and the European Financial Stability Facility).
The adjustment of imbalances continued in 2011. The bursting of the house price bubble, sharp falls in the value of some financial assets, and the end of the Great Moderation, had led to a re-pricing of credit and put leverage levels into spotlight. Following the rapid build-up of private debt in the decade before the crisis and the continued debt
(3) See e.g. Furceri, D. and A. Zdzienicka, How costly are debt
crises?, Journal of International Money and Finance, June 2012, Vol. 31, No. 4, pp. 726-742.
(4) See e.g. Reinhart, C. M. and K. S. Rogoff, From financial crash to debt crisis, American Economic Review, August 2011, Vol. 101, No. 5, pp. 1676-1706; Mody, A. and D. Sandri, The Eurozone crisis: how banks and sovereigns came to be joined at the hip, Economic Policy, April 2012, Vol. 27, No. 70, pp. 199-230. Acharya, V. V., I. Drechsler and P. Schnabl, A pyrrhic victory? Bank bailouts and sovereign credit risk, CEPR Discussion Paper no. 8679, December 2011.

Economic developments at the aggregated level
13
accumulation in the public sector, readjusting towards lower levels of debt (deleveraging) in the private and the public sector came to the fore. While the link between gross debt and economic growth appears to be ambiguous, a reversal of the increase in net debt has been identified as conducive to economic growth.
In the private sector a deteriorating economic outlook, tighter credit standards and heightened uncertainty speeded up deleveraging.(5) The impact was felt much more strongly in Member States with high debt levels creating headwinds to their economic growth.(6) In countries strongly affected by the crisis, access to long-term debt became more difficult for banks, reflecting their holding of domestic sovereign debt as well as exposure to domestic households and companies.(7) As a result, firms in these countries face tighter credit constraints, which do not bode well for their investment decisions.
As regards public debt, the EU and the euro area debt-to-GDP ratios had approached 90%, which in studies had been identified as a crucial threshold lowering economic growth for rather long periods.(8) The extent to which the necessary fiscal consolidation hampers also growth, can be shown to depend on the composition of measures and the credibility of the adjustment path (see Box I.4).
As regards private consumption, the direct impact of forcing credit-constrained households to reduce their indebtedness is accompanied by an indirect effect via precautionary savings, which unconstrained households make to have a buffer against future shocks. Both effects work together (5) For developments in the euro area, see ECB, Corporate
indebtedness in the euro area, ECB Monthly Bulletin, February 2012, pp. 87-103.
(6) Similar evidence has been presented for the U.S. counties (see Mian, A. and A. Sufi, Household leverage and the recession of 2007-09, IMF Economic Review, March 2010, Vol. 58, No. 1, pp. 74-116) and emerging market economies (see Gourinchas, P.-O. and M. Obstfeld, Stories of the twentieth century for the twenty-first, American Economic Journal: Macroeconomics, January 2012, Vol. 4, No. 1, p. 226-265.
(7) For evidence see ECB, Financial integration in Europe, April 2012 (in particular chapter II.B).
(8) See Reinhart, C. M. and K. S. Rogoff, Growth in a time of debt, American Economic Review, May 2010, Vol. 100, No. 2, pp. 573-578. The impact has been found to last mostly more than a decade, see Reinhart, C. M., V. R. Reinhart and K. S. Rogoff, Debt overhangs: past and present, NBER Working Paper no. 18015, April 2012. For 18 OECD countries a threshold of 85% has been identified, see Cecchetti, S. G., M. S. Mohanty and F. Zampolli, The real effects of debt, BIS Working Paper no. 352, September 2011.
to increase the economy’s net lending and weigh on the growth prospects of the economy.
… and laid the foundations of the path towards a slow recovery …
While the immediate crisis response helped to avert a deep recession, the build-up of confidence among consumers and investors also laid the foundations for an exit from recession and a return to a slow recovery. The fading away of some global headwinds, in particular the stabilisation in commodity prices and its impact on real disposable incomes should help the EU economy to turn the corner. The key role that regaining the confidence of the private sector will play in lifting the economy towards recovery is in line with historical evidence. The limited speed of the expected recovery resembles the experiences of the 2009-11 recovery. It indicates that the intermediation role of the financial sector remains disrupted. What makes the projected 2012-13 recovery different is the intensity of consolidation efforts as well as the strengthened policy framework. On-going deleveraging and consolidation may also contribute to explaining the differences across economic areas (see Graph I.4) in terms of growth speed.
0
1
2
3
4
5
6
7
8
2010 2011 2012 2013
EU Non-EU advanced economies Emerging and developing countries
%
Graph I.4:Real GDP growth in EU, non-EU advanced and emerging economies
forecast
… with substantial cross-country differences.
Although no country had been immune to the Great Recession, recovery paths differed substantially across economies. This is true not only for advanced and emerging economies during the 2009-10 recovery (see Graph I.4), but also for EU Member States.(9) Those more exposed to the
(9) For more details see European Commission (DG ECFIN),
European Economic Forecast – Spring 2011; and IMF,

European Economic Forecast, Spring 2012
14
origins of the crisis, for instance by sharply falling house prices, experienced much slower recoveries than others. Moreover the strong rebound in world trade in 2010 helped more export-oriented countries to recover more quickly. With time passing by and the world trade rebound slowing these initial drivers lost relevance, but at the same time fiscal consolidation measures became an increasingly important factor in short-term growth prospects. Since many of the underperformers also had larger consolidation needs, their economic growth slowed further. Moreover, some of the fast growers, for instance Germany, had more solid fiscal positions and benefited from low financing costs. These differences are aggravated by repercussions of the sovereign-debt crisis on financing conditions in Member States.(10) Overall, the countries that performed rather well during the 2009-11 recovery, in particular as measured by real GDP growth in 2010, are also expected to outperform others going forward (see Graph I.5).
-1.5
-0.5
0.5
1.5
2.5
3.5
2010 2011 2012 2013
Member States with below-average growth in 2010Member States with above-average growth in 2010
%
forecast
Graph I.5:Multi-speed real GDP growth in the EU, annual growth rates (weighted)
Adjustment within the euro area is another key feature of the forecast. The expectation of narrowing imbalances (for an in-depth analysis see Box I.3) is a feature also observed in other regions of the world economy. It has also already been observed in past episodes. Nevertheless, the situation in the EU economy is unique since it mostly involves countries that are tied to each other by the single currency, and thus there is more onus on adjustment of relative costs.
Tensions from the two-speed recovery, World Economic Outlook, April 2011.
(10) See ECB, Financial integration in Europe, April 2012, chapter II.B.3.
3. THE EXTERNAL ENVIRONMENT
An improving global environment …
Although global economic growth has been negatively affected by uncertainties surrounding sovereign-bond markets and weak demand in Europe last year, recent global economic developments reveal some encouraging signals. The US economy continued its solid growth in the last quarter of 2011, supported by improved labour market conditions and rising confidence. Most emerging market and developing economies, though expected to grow slightly more slowly than last year, seem to be more resilient than three years ago, as more robust domestic demand partly offsets weaker export growth. But volatile and elevated oil prices put a strain on the world economy and pose a risk to global growth.
According to preliminary estimates, annual growth of world GDP (excluding the EU) fell to 4.2% in 2011 from 5.7% in 2010. In the third quarter of 2011 global growth rebounded, led by the Japan’s post-disaster recovery and upbeat economic activity in the US. World growth decelerated in the last quarter of 2011 (to 0.5% q-o-q) when positive developments in the US and China contrasted with weaker growth in most other regions, more adversely affected by the euro-area sovereign-debt crisis and growing global stability concerns.
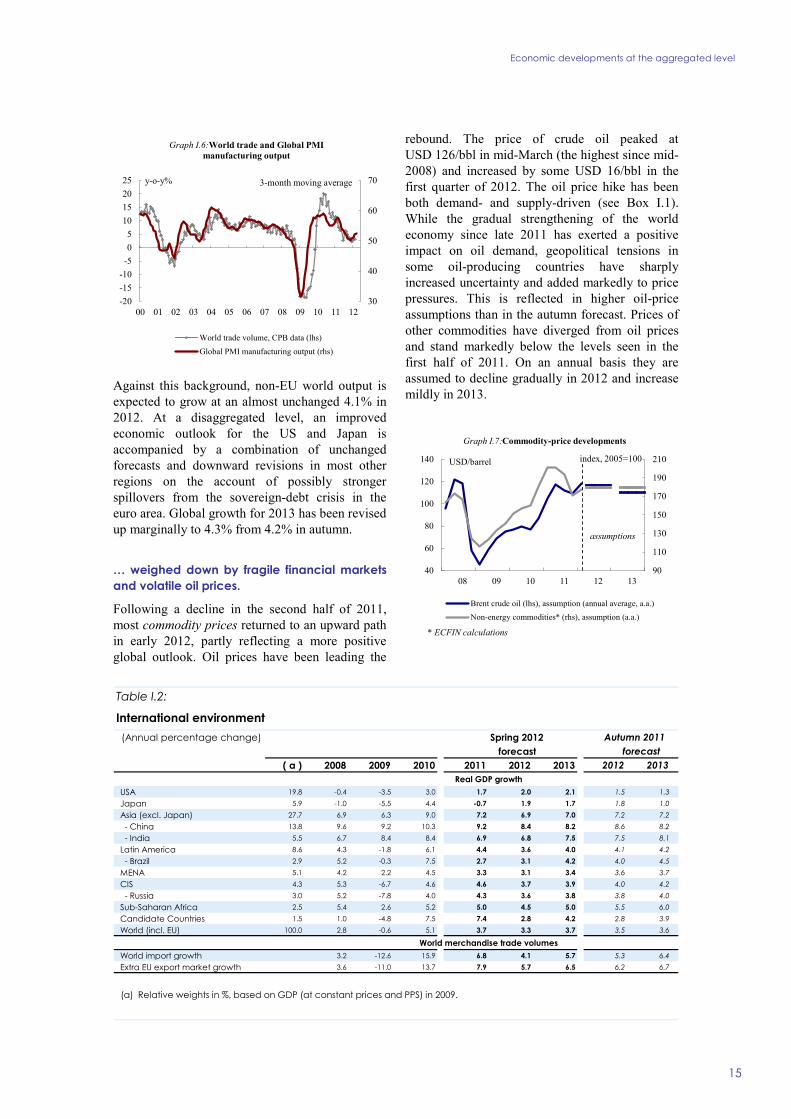
Global trade growth decelerated substantially in 2011 (from 14.9% to 5.6% according to CPB estimates), partly reflecting a return to a long-term growth pattern. Simultaneously, such factors as: weakening economic activity in Europe, disasters in Japan and the flood in Thailand, and, to a lesser extent, geopolitical tensions in the Middle East and North Africa, negatively affected global trade dynamics last year. Most recently trade momentum (3m-on-3m moving average) has been strengthening to 1.4% in February 2012 compared to 0.7% in January 2012.
Looking ahead, high-frequency global indicators are upbeat and suggest that the on-going recovery in the world economy will continue in the nearest future. The global all-industry Purchasing Managers’ Index (PMI) bottomed out in October 2011, but expanded in early 2012. The latest reading points to less buoyant conditions, but the index has remained above the no-growth threshold for both manufacturing and service sectors.
Economic developments at the aggregated level
Table I.2:
International environment (Annual percentage change) Spring 2012 Autumn 2011
forecast forecast( a ) 2008 2009 2010 2011 2012 2013 2012 2013
Real GDP growth USA 19.8 -0.4 -3.5 3.0 1.7 2.0 2.1 1.5 1.3 Japan 5.9 -1.0 -5.5 4.4 -0.7 1.9 1.7 1.8 1.0 Asia (excl. Japan) 27.7 6.9 6.3 9.0 7.2 6.9 7.0 7.2 7.2 - China 13.8 9.6 9.2 10.3 9.2 8.4 8.2 8.6 8.2 - India 5.5 6.7 8.4 8.4 6.9 6.8 7.5 7.5 8.1 Latin America 8.6 4.3 -1.8 6.1 4.4 3.6 4.0 4.1 4.2 - Brazil 2.9 5.2 -0.3 7.5 2.7 3.1 4.2 4.0 4.5 MENA 5.1 4.2 2.2 4.5 3.3 3.1 3.4 3.6 3.7 CIS 4.3 5.3 -6.7 4.6 4.6 3.7 3.9 4.0 4.2 - Russia 3.0 5.2 -7.8 4.0 4.3 3.6 3.8 3.8 4.0 Sub-Saharan Africa 2.5 5.4 2.6 5.2 5.0 4.5 5.0 5.5 6.0 Candidate Countries 1.5 1.0 -4.8 7.5 7.4 2.8 4.2 2.8 3.9 World (incl. EU) 100.0 2.8 -0.6 5.1 3.7 3.3 3.7 3.5 3.6
World merchandise trade volumes World import growth 3.2 -12.6 15.9 6.8 4.1 5.7 5.3 6.4 Extra EU export market growth 3.6 -11.0 13.7 7.9 5.7 6.5 6.2 6.7
(a) Relative weights in %, based on GDP (at constant prices and PPS) in 2009.
15
30
40
50
60
70
-20-15-10-505
10152025
00 01 02 03 04 05 06 07 08 09 10 11 12
Graph I.6:World trade and Global PMI manufacturing output
World trade volume, CPB data (lhs)Global PMI manufacturing output (rhs)
y-o-y% 3-month moving average
Against this background, non-EU world output is expected to grow at an almost unchanged 4.1% in 2012. At a disaggregated level, an improved economic outlook for the US and Japan is accompanied by a combination of unchanged forecasts and downward revisions in most other regions on the account of possibly stronger spillovers from the sovereign-debt crisis in the euro area. Global growth for 2013 has been revised up marginally to 4.3% from 4.2% in autumn.
… weighed down by fragile financial markets and volatile oil prices.
Following a decline in the second half of 2011, most commodity prices returned to an upward path in early 2012, partly reflecting a more positive global outlook. Oil prices have been leading the
rebound. The price of crude oil peaked at USD 126/bbl in mid-March (the highest since mid-2008) and increased by some USD 16/bbl in the first quarter of 2012. The oil price hike has been both demand- and supply-driven (see Box I.1). While the gradual strengthening of the world economy since late 2011 has exerted a positive impact on oil demand, geopolitical tensions in some oil-producing countries have sharply increased uncertainty and added markedly to price pressures. This is reflected in higher oil-price assumptions than in the autumn forecast. Prices of other commodities have diverged from oil prices and stand markedly below the levels seen in the first half of 2011. On an annual basis they are assumed to decline gradually in 2012 and increase mildly in 2013.
90
110
130
150
170
190
210
40
60
80
100
120
140
08 09 10 11 12 13
Brent crude oil (lhs), assumption (annual average, a.a.)Non-energy commodities* (rhs), assumption (a.a.)
Graph I.7:Commodity-price developments
USD/barrel index, 2005=100
* ECFIN calculations
assumptions

European Economic Forecast, Spring 2012
16
Box I.1: Oil-price increases and their macroeconomic impact on the EU economy
The increase in oil prices in the first months of 2012 has emerged as a significant downside risk to the global and the EU economic recovery. Against this background, this box presents the macroeconomic impact of rising oil prices on the basis of model simulations (using the Commission's QUEST model).
The price of crude oil peaked at USD 126/bbl. in mid-March (the highest since mid-2008) and has risen by some USD 16/bbl. in the first quarter of 2012. The assumption on oil prices in 2012 is 12.6% higher in this forecast than in last autumn (in US dollar terms). This increase reflects positive excess demand in 2010 and 2011. Demand rose steadily in the second half of 2011, driven by the US, Japan and most emerging economies. On the supply side, weakness in non-OPEC output coincided with geopolitical tensions in many OPEC producers, including the recent political crisis related to Iran's nuclear programme. This sharply increased uncertainty regarding future supply and added to price pressures. However, the tight situation in oil markets may be easing gradually over the remainder of the year. The International Energy Agency estimates that production in Saudi Arabia, despite running at a 30-year high, can still expand sustainably by about 12% (or roughly 6% of the total OPEC crude oil output) and non-OPEC extraction should recover in the remainder of 2012.(1)
0
20
40
60
80
100
120
140
160
08 09 10 11 12
USD per barrel EUR per barrel
Graph 1:Daily spot crude oil (Brent) prices
Oil-price shocks affect the global economy through the terms-of-trade channel as they shift purchasing power between oil-exporting countries and oil-importing countries. Oil-exporting countries' (1) International Energy Agency, Oil Market Report, 14
March 2012
additional revenue may in turn be invested abroad or lead to an increase in their imports. From the oil-importing country's perspective, an increase in oil prices affects both the demand- and the supply side of the economy. On the demand side, an increase in energy prices leads to a loss in real income, as demand for energy is relatively inelastic in the short run. It also affects consumers' and firms' spending on goods and services other than energy. Supply-side effects arise from the use of oil as an input factor in the production process. With limited short-term substitution possibilities, an increase in the price of oil inputs increases production costs and affects prices and output.
The dependency of the EU economy on imported oil has increased over the last decade. In 2009, net imports covered 84% of EU oil consumption compared to 73% in 1999. Oil production in the EU decreased by 42% in the same period. Oil consumption and imports to the EU have slightly decreased, partially due to energy efficiency measures, but in spite of energy savings, the EU oil-import bill increased considerably in the last decade due to higher oil prices. Net oil imports amounted to EUR 275 bn in 2011, around 2.2% of GDP, but this is significantly higher than the 1.3% average over the period 2000-10, when oil prices were lower overall (see Graph 2).
0.0
0.5
1.0
1.5
2.0
2.5
00 01 02 03 04 05 06 07 08 09 10 11
Graph 2:EU oil net imports
% of GDP
To illustrate the potential effects of any further increase in oil prices over the forecast horizon, Table 1 below shows the impact of an oil-price shock caused by supply disruptions. The simulation is based on a sector-disaggregated version of the Commission’s QUEST model that includes high and low energy-intensive sectors and different
(Continued on the next page)

Economic developments at the aggregated level
17
Non-EU financial markets remain fragile, highly influenced by EU developments. Benchmark yields across major advanced economies remain at low levels. Many Eastern European and candidate countries in particular are experiencing credit tightening as Western European banks reduce exposure to that region. Despite the improved liquidity situation in the euro area, disinvestments of foreign banks, including cutbacks in trade and project financing, repatriation of capital and profits as well as subsidiaries sell-offs, remain an imminent risk for emerging economies.
On the back of renewed concerns related to the European sovereign-debt crisis, capital flows to emerging markets weakened considerably, putting downward pressure on equity and exchange rates in those countries in late 2011. Exchange-rate volatility has remained high since spring 2011 amid a general flight to safety; most currencies in
emerging markets have weakened considerably. On the other hand, excessive demand for the Japanese and Swiss currency has led their respective central banks to respond in order to stem their rapid appreciation.
The US and Japanese economies likely to rebound this year …
Turning to non-EU economies, following the weak performance of the US economy in the first half of 2011, growth accelerated in the second half of the year, reflecting stronger private consumption, rising confidence, improving labour market conditions and positive stock-market developments. As a result, GDP growth for the year as a whole came in at 1.7%. Looking ahead, the central scenario sees growth at 2.0% in 2012, 0.5 pp. higher than in the autumn forecast. The upward revision stems partly from higher-than-
Box (continued)
energy production sectors.(2) The model captures both supply and demand channels as energy serves as an input to the production process and is consumed directly by households. The scenario shows the impact of a severe disruption in oil production that leads to a persistent increase in the price of oil of USD 20/bbl. Overall, demand- and supply driven oil-price increases have different macroeconomic impact. Oil-price changes associated with higher global demand, the main driver behind in the last year, may have choked off some of the additional growth, but they are less adverse than supply-driven oil-price increases.(3)
This supply shock has negative implications for growth in the EU. Output falls by 0.4% in the first year and by a further 0.3% in the second year. Unemployment rises by 0.3 pp. after two years while prices rise as costs of higher oil prices feed through into higher energy prices and raise costs for firms.
This scenario assumes that monetary policy would respond as in "normal times". At the current juncture, with interest rates close to their zero lower bound, monetary policy may be more
(2) In 't Veld, J. and J. Varga, The impact of an increase
in oil prices on economic activity, Quarterly Report on the Euro Area (DG ECFIN), July 2011, Vol. 10, No. 2, pp. 32-36.
(3) The above mentioned article includes a comparison between demand and supply- driven oil price shocks, based on a disaggregated version of the QUEST model with endogenously-driven oil price changes.
Table 1:Impact of $20 oil supply shock (in %)Years 1 2GDP -0.35 -0.65Consumer price inflation 0.61 0.34Consumption -0.60 -0.64Unemployment (pps.) 0.10 0.28Note: % deviations from baseline
Source: European Commission, QUEST simulations
accommodative to inflationary pressures and raise interest rates by less. Another crucial factor is the degree to which higher energy prices lead to a wage-price spiral. While automatic wage indexation schemes were a common feature in past decades, wage setting has become more competitive and the scenario therefore assumes that no wage-price spiral is set in motion.
The economic impact of oil-price increases is likely to be linear in the short run, as, given limited substitution, income losses will be proportional to price changes. But if oil prices were to increase dramatically, they would enter uncharted territory and, if supply disruptions become critical, the effects may turn out to be larger.
While the table shows the average effect on growth in the EU as a whole, the macroeconomic impact of higher oil prices will differ across countries as oil-dependency varies. Oil-producing countries with a smaller net oil-import share in GDP (e.g. the UK), or countries relying more on other energy sources than oil will be less affected than countries with a larger oil-dependency.

European Economic Forecast, Spring 2012
18
expected growth in 2011, particularly in the fourth quarter, and the associated carry-over effect. Moreover, positive risks to confidence, industrial activity and stock market performance in late 2011 materialised, translating into stronger momentum in 2012. Real GDP is set to grow by 2.1% in 2013. This upward revision compared to the autumn forecast can be largely explained by the current assumption of a milder fiscal consolidation.
Following the triple disaster in 2011, in Japan GDP contracted by 0.7% in 2011 as a whole, suffering from supply-chain disruptions and energy shortages caused by the shut-down of nuclear power plants. In 2012, the recovery is projected to be driven by investment supported by favourable financing conditions, and by private consumption. Slowing growth in neighbouring countries is expected to prevent a more robust recovery of Japanese exports within the forecast horizon. Moderate growth is expected to continue in 2013 when somewhat slower expansion in domestic demand should be compensated for to some extent by a more positive growth contribution form net exports.
… but still outpaced by emerging market economies in terms of growth dynamics
BRICS countries (Brazil, Russia, India, China, and South Africa) continue to grow more dynamically than advanced economies, but their macroeconomic developments and growth drivers remain diverse, partially reflecting linkages to advanced economies. Real GDP in China grew by 9.2% in 2011, in line with expectations and confirming the foreseen gradual slowdown of economic activity, which is forecast to continue in 2012 (8.4%) and 2013 (8.2%). Thus, the on-going 'soft landing' of the Chinese economy is expected to continue over the forecast horizon. However, the need for a gradual working out of excesses in property markets remains one of the major economic challenges in the nearest future.
Following a better-than-expected economic performance in 2011, all candidate countries are expected to face a slowdown in 2012. Overall, economic growth in the group as a whole is set to decelerate significantly from nearly 7½% in 2011 to 2¾ in 2012, and to rebound to some 4¼ in 2013. The aggregate figure masks diverse growth dynamics at a country level.
4. FINANCIAL MARKETS
The economic outlook is still largely overshadowed by the fragile state of the EU banking sector. Despite the tentative stabilisation of bank- and sovereign-funding conditions in the first months of 2012, looming uncertainty about EU economic prospects and re-sparked sovereign-funding strains in some vulnerable Member States continue to weigh on financial markets. In the short term, the adverse feedback loop between economic growth and budget consolidation has further taken its toll on sovereign-bond markets and the nexus between sovereign- and bank-funding stress has lingered on.
The Eurosystem's 3-year longer-term refinancing operations (LTROs) in December 2011 and February 2012 have averted the imminent threat of a credit crunch caused by banks' high redemption needs against the backdrop of very thin markets for bank bonds. The LTROs have considerably eased banks' liquidity and funding constraints and somewhat reduced tensions in sovereign-debt markets.
In addition, a more dynamic global economic environment has supported a tentative rebound in asset markets. However, recently flared-up stress in the sovereign-funding markets of some Member States, reinforced by further sovereign downgrades, and the high volatility in global asset markets clearly demonstrate that conditions are still far from normal and that fickle financial markets are still prone to adverse market news and confidence shocks.
Sovereign-bond markets remain strained despite recent stabilisation …
The sovereign-bond yields of most euro-area Member States declined considerably in the first months of 2012, supported to a large extent by the extraordinary liquidity injections by the Eurosystem, which have been partly used by Spanish and Italian banks in particular to increase bank holdings of domestic government bonds. Thus, yields continued the rather uniform decline that set in in late 2011. But investors seem increasingly focused on differences across vulnerable Member States (see Graph I.8).

Economic developments at the aggregated level
19
Graph I.8: Ten-year government-bond yields, selected euro-area Member States
0
4
8
12
16
09 10 11 12
DE IT ESPT IE FR
%
On the one hand, Irish yields started to decline in late-November 2011 and a successful bond swap operation carried out in end-January 2012 together with the favourable troika review, was regarded as a positive sign that Ireland will be able to return to market financing. On the other hand, Spanish sovereign yields have increased markedly over the past weeks on the back of a deteriorating economic outlook and concerns about public finances and the Spanish banking system. Italian sovereign yields have also risen recently, partly influenced by developments in the Spanish bond market. In Portugal, yields peaked in late January 2012 amid speculation that sovereign debt might be subject to restructuring, but tensions have eased considerably since then. In these markets, the recent decline of German benchmark yields towards euro-era record lows contributed to the widening of spreads.
… while the rebound in equity markets has been only relatively short-lived.
Equity and corporate-bond markets have gradually recovered over the last couple of months, supported by several successful sovereign-bond auctions in Europe and an improvement in the international macroeconomic outlook, but the subsequent stock-market rally has proved to be relatively short-lived. Equities rallied from mid-January 2012 to the end of March, with banking shares among the best performers. However, risk sentiment was dented by renewed concerns about euro-area and global prospects, and, as a consequence, global stock indices have lost ground. In Europe, the Eurostoxx50 only slightly exceeds its level at the end of last year, while the financial sub-index is 2% lower (see Graph I.10).
Graph I.9: Stock-market indices, euro area
20
40
60
80
100
120
07 08 09 10 11 12
EuroSTOXX (financials) EuroSTOXX 50
Corporate-bond yields started to edge down at the beginning of this year, with the issuing volume of non-financial corporations increasing at 6.6% y-o-y in February 2012. The favourable developments suggest that firms may at least to some extent be able to substitute bond financing for bank lending. However, default risk has increased recently, as indicated by the renewed rise of the iTraxx indices since mid-March.
Bank funding conditions have eased since the beginning of 2012 …
On the back of the LTROs and other non-standard policy measures interbank market conditions have eased gradually since the start of this year. The three-month Euribor fell below 0.75% from about 1.60% in the autumn of 2011. The implied rate on Euribor futures contracts expiring in June dropped to 0.70%, on the expectation that abundant liquidity is likely to push Euribor rates further down. The 3-month Euribor-OIS (overnight index swaps) spread, a measure of banks' reluctance to lend to each other, narrowed quite significantly, to below 40 bps, down from almost 100 bps at the end of 2011 (see Graph I.10).

European Economic Forecast, Spring 2012
20
Graph I.10: Interbank market spreads
0102030405060708090
100
Jan-11 Jul-11 Jan-12
bps.
3-month Euribor spread over OIS3-month USD Libor spread over OIS
… but credit growth to the private sector remains subdued.
In bank loans to the non-financial sector, improved refinancing conditions have not yet translated into more robust credit growth (see Box I.2). However, recent data on loan developments in the euro area showed signs of stabilisation in January and February, albeit at low levels. The steep decline in lending at the end of 2011 had been mainly driven by a cutback on short-term loans. Loans to the non-financial private sector rebounded in January and decreased only marginally in February, after having plummeted in December 2011. Notwithstanding banks' reduced funding strains, the annual growth rate of loans to non-financial corporations and households has further moderated in the first months of the year (see Graph I.11).
-6
-3
0
3
6
9
12
15
-6
-3
0
3
6
9
12
15
00 01 02 03 04 05 06 07 08 09 10 11 12
Graph I.11:Bank lending to households and non-financial corporations, euro area
GDP (lhs)Loans to households (rhs)Loans to non-financial corporations (rhs)
y-o-y% y-o-y%
Moreover, aggregate figures may mask heterogeneous developments at the country level. Besides the peripheral euro-area Member States, Central and Eastern European (CEE) Member States may also be vulnerable to funding tensions in the euro area. For most countries in the CEE
region the share of credit supply provided by euro-area banking groups is significant, which makes their economies particularly sensitive to deleveraging decisions by parent entities.
A recovery shaped by adverse credit conditions …
The April 2012 ECB Bank Lending Survey (BLS) provided evidence of a substantially decreased net tightening of credit standards in the first quarter of 2012, driven by lower funding pressures and reduced balance-sheet constraints. Credit conditions tend to have improved more for small and medium-sized than for larger companies. European banks expect a further decline in the net tightening of credit conditions in the coming months (see Graph I.12).
Credit standards are expected to be broadly neutral for non-financial corporations in the second quarter at the euro-area aggregate level, but heterogeneity across countries is likely to remain pronounced. Moreover, the uncertainty surrounding the European economic outlook and the EU banking system also seems to have impacted on credit conditions in countries outside the EU and on loans to non-financial corporations with significant exposure to European economies, regardless of the location of the firm.(11)
-40
-20
0
20
40
03 04 05 06 07 08 09 10 11 12-40-20020406080100
Credit standards - past 3 months (lhs)Credit standards - next 3 months (lhs)Demand - past 3 months (rhs)Demand - next 3 months (rhs)
balance
tightening ↑
Graph I.12: Net changes in credit standards and credit demand for loans to non-financial
corporations, euro area
↓ easing
balance
decrease ↓ increase ↑
(11) Board of Governors of the Federal Reserve System,
January 2012 Federal Reserve Senior Loan Officer Opinion survey on bank lending practices; additionally, the survey conducted between December 2011 and January 2012 indicated that foreign banks have tightened their credit standards in contrast to US banks. Furthermore, banks located in the US have tightened credit standards on loans to European banks or their affiliates and subsidiaries.
Economic developments at the aggregated level
21
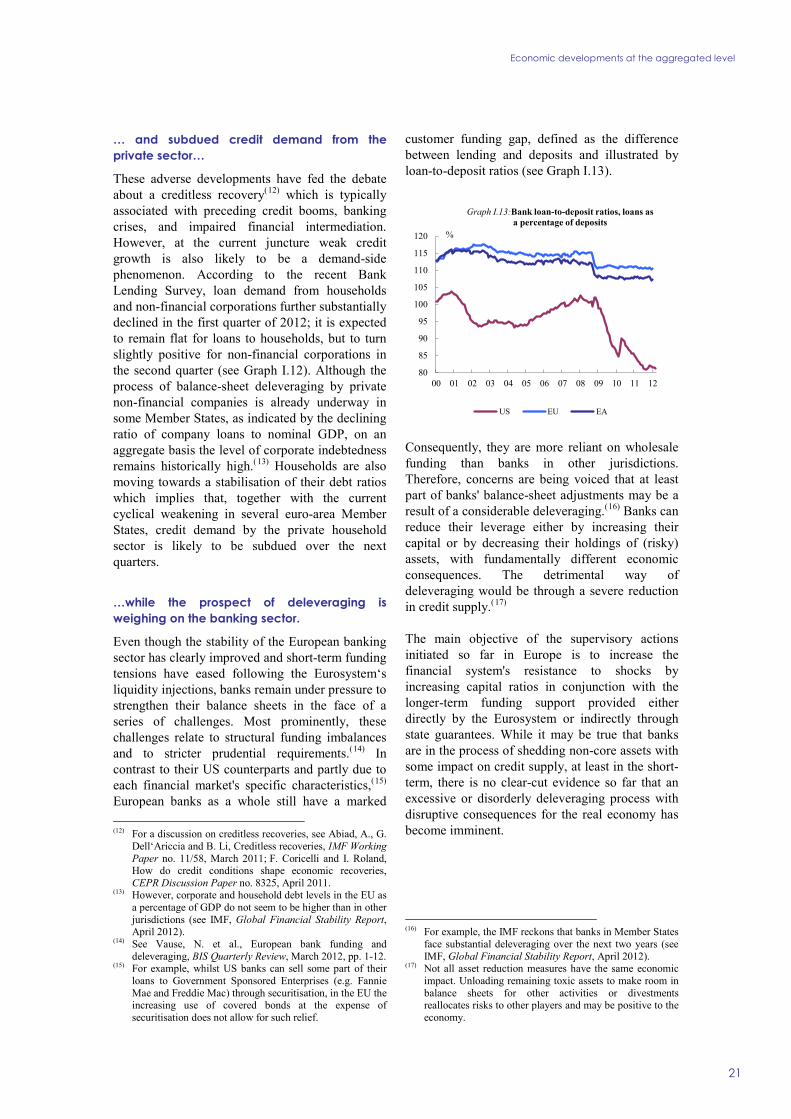
… and subdued credit demand from the private sector…
These adverse developments have fed the debate about a creditless recovery(12) which is typically associated with preceding credit booms, banking crises, and impaired financial intermediation. However, at the current juncture weak credit growth is also likely to be a demand-side phenomenon. According to the recent Bank Lending Survey, loan demand from households and non-financial corporations further substantially declined in the first quarter of 2012; it is expected to remain flat for loans to households, but to turn slightly positive for non-financial corporations in the second quarter (see Graph I.12). Although the process of balance-sheet deleveraging by private non-financial companies is already underway in some Member States, as indicated by the declining ratio of company loans to nominal GDP, on an aggregate basis the level of corporate indebtedness remains historically high.(13) Households are also moving towards a stabilisation of their debt ratios which implies that, together with the current cyclical weakening in several euro-area Member States, credit demand by the private household sector is likely to be subdued over the next quarters.
…while the prospect of deleveraging is weighing on the banking sector.
Even though the stability of the European banking sector has clearly improved and short-term funding tensions have eased following the Eurosystem‘s liquidity injections, banks remain under pressure to strengthen their balance sheets in the face of a series of challenges. Most prominently, these challenges relate to structural funding imbalances and to stricter prudential requirements.(14) In contrast to their US counterparts and partly due to each financial market's specific characteristics,(15) European banks as a whole still have a marked (12) For a discussion on creditless recoveries, see Abiad, A., G.
Dell‘Ariccia and B. Li, Creditless recoveries, IMF Working Paper no. 11/58, March 2011; F. Coricelli and I. Roland, How do credit conditions shape economic recoveries, CEPR Discussion Paper no. 8325, April 2011.
(13) However, corporate and household debt levels in the EU as a percentage of GDP do not seem to be higher than in other jurisdictions (see IMF, Global Financial Stability Report, April 2012).
(14) See Vause, N. et al., European bank funding and deleveraging, BIS Quarterly Review, March 2012, pp. 1-12.
(15) For example, whilst US banks can sell some part of their loans to Government Sponsored Enterprises (e.g. Fannie Mae and Freddie Mac) through securitisation, in the EU the increasing use of covered bonds at the expense of securitisation does not allow for such relief.
customer funding gap, defined as the difference between lending and deposits and illustrated by loan-to-deposit ratios (see Graph I.13).
80
85
90
95
100
105
110
115
120
00 01 02 03 04 05 06 07 08 09 10 11 12
US EU EA
Graph I.13:Bank loan-to-deposit ratios, loans as a percentage of deposits
%
Consequently, they are more reliant on wholesale funding than banks in other jurisdictions. Therefore, concerns are being voiced that at least part of banks' balance-sheet adjustments may be a result of a considerable deleveraging.(16) Banks can reduce their leverage either by increasing their capital or by decreasing their holdings of (risky) assets, with fundamentally different economic consequences. The detrimental way of deleveraging would be through a severe reduction in credit supply.(17)
The main objective of the supervisory actions initiated so far in Europe is to increase the financial system's resistance to shocks by increasing capital ratios in conjunction with the longer-term funding support provided either directly by the Eurosystem or indirectly through state guarantees. While it may be true that banks are in the process of shedding non-core assets with some impact on credit supply, at least in the short-term, there is no clear-cut evidence so far that an excessive or disorderly deleveraging process with disruptive consequences for the real economy has become imminent.
(16) For example, the IMF reckons that banks in Member States
face substantial deleveraging over the next two years (see IMF, Global Financial Stability Report, April 2012).
(17) Not all asset reduction measures have the same economic impact. Unloading remaining toxic assets to make room in balance sheets for other activities or divestments reallocates risks to other players and may be positive to the economy.

European Economic Forecast, Spring 2012
22
Box I.2: Impact of the ECB's liquidity provision on credit flows to the real economy
At the end of 2011, slowing economic growth and adverse feedback loops between sovereign- and bank-funding stress exacerbated vulnerabilities in the EU financial sector, resulting in the closure of term-funding markets and the need for banks to reinforce solvency ratios. As banks were under pressure to strengthen their balance sheets due to high counterparty risk, downgrades, depressed equity values, an uncertain profit outlook and particularly large redemption needs at the beginning of 2012, the risk of disorderly deleveraging leading to a credit crunch in the euro-area banking sector was material.
The large-scale liquidity provision made through the Eurosystem's two three-year longer-term refinancing operations (LTROs), carried out in December 2011 and in February 2012, arguably contributed significantly to averting such an outcome. These policy measures have entailed another significant increase in the Eurosystem's balance sheet, which rose by 160% between January 2007 and the end of March 2012 (compared to an increase of about 300%, 235% and 20% in the balance sheets of the Bank of England, the Federal Reserve and the Bank of Japan respectively, see Graph 1).(1)
0
100
200
300
400
500
07 08 09 10 11 12
FED BoE Eurosystem BoJ
Source: National Central Banks, DG ECFIN calculations.
Graph 1:Central banks' balance sheets
index, 2007=100
The bulk of the Eurosystem's balance-sheet expansion has taken place through enhanced credit support to banks via longer-term refinancing (1) The Eurosystem has also carried out purchases of
covered bonds and government bonds on the secondary market. The latter have been purchased through the Securities Market Programme (SMP), sterilising the accompanying liquidity injections through fixed-term deposits. Further monetary policy measures with positive liquidity effects include the increase in the supply and length of term funding, a broadening of eligible collateral and the set-up of currency swap lines.
operations on a fixed-rate full-allotment basis. The main objective of the non-standard monetary policy measures has been to ensure the proper functioning of the monetary policy transmission channel. The ECB has focused its support on the banking sector, given the central role it plays in financial intermediation and monetary policy transmission in the euro area.
The liquidity provided by the LTROs to the banking sector has induced a significant expansion in bank reserves, which is expected to ultimately improve banks' capacity to provide loans to firms and households. Yet, it is still too early to fully assess the impact of the recent three-year LTROs on credit flows to the real economy in the euro area, given that credit growth tends to respond to liquidity injections with some lag, particularly in a still highly uncertain environment. But the analysis of the various transmission channels through which non-standard measures are likely to affect overall financial conditions (e.g. interest rates and asset prices, risk premia and banks' liquidity conditions and balance-sheet composition), could provide tentative evidence on the positive effects of LTROs.(2)
In fact, several financial indicators suggest that there was a significant improvement in the functioning of some financial market segments following the LTROs. Banks' funding strains eased considerably, as central bank financing compensated for banks' disrupted access to wholesale or interbank markets (liquidity channel). In addition, the LTROs decreased the liquidity premium of holding the safest financial assets and collateral in the face of tightening market funding conditions. They also lowered the risk premium on potential counterparty default (default risk channel) which translated into increases in several financial asset prices and a lower investor risk aversion towards assets issued by banks. The implied volatility of currency and equity options (e.g. VSTOXX) declined, bank credit default swap (CDS) spreads tightened (see Graph 2) and the markets for covered and unsecured bank debt reopened, after being largely closed in the second half of 2011.
(2) For a more detailed description of transmission
channels, see e.g. Borio, C. and P. Disyatat, Unconventional monetary policies: An appraisal, The Manchester School, Vol. 78, September 2010, pp. 53-89, and Krishnamurthy, A. and A. Vissing-Jorgensen, The effects of quantitative easing on interest rates, Brookings Papers on Economic Activity, Fall 2011, pp. 215-65.
(Continued on the next page)

Economic developments at the aggregated level
23
Box (continued)
0
200
400
600
800
1000
08 09 10 11 12
Graph 2:Selected banks' 5-year CDS spreads
Dexia UniCredit SpASantander BNP ParibasDeutsche ING
1st ECB 3-Y LTRO announcement
Asset market valuations might also have been affected by investors' expectations that the ECB would be ready to provide unlimited liquidity over long-term maturities to the banking system (signalling effect). On the money market, the 3-month Euribor fell below the ECB's benchmark rate for main refinancing operations (MRO), along with a narrowing of bid-ask spreads in short-term funding instruments, while the Euribor-OIS spread narrowed substantially. US-dollar bank funding costs also declined markedly from their peak at the end of 2011. In addition, sovereign-bond spreads against the German Bund declined considerably in several euro-area Member States in the first quarter of 2012, particularly at the shorter end of the yield curve, suggesting some carry-trade activity by banks in search of profitability.
By contrast, the bank lending channel is working more slowly. In January and February 2012, the sizeable decrease in loans to the private sector observed in December came to a halt, but M3 growth remained subdued. However, these recent monetary and credit developments are consistent with historical evidence, which suggests that high risk aversion induced by financial crises is often only associated with an expansion of narrow money (and to some extent broad money), while credit growth is likely to be limited in the medium term.(3) According to the ECB's April 2012 Bank Lending Survey (BLS), the net tightening of credit standards by euro-area banks to non-financial corporations and households declined substantially in the first quarter of 2012. Looking ahead, euro-area banks expect a slight further decline in net tightening in credit standards for loans to non-financial corporations and a broadly unchanged level for consumer credit.
(3) ECB, Money and credit growth after economic and
financial crises – a historical global perspective, ECB Monthly Bulletin, February 2012, pp. 69-85.
However, conditions in some euro-area financial market segments have not yet fully normalised. Interbank market trading volumes still remain subdued, with some banks relying exclusively on Eurosystem liquidity. Securitisation markets remain weak, as some segments of sovereign and private bond markets are still impaired. As the recent increases in sovereign-bond spreads in several euro-area Member States and equity market declines have clearly demonstrated, the LTROs are no panacea for the resolution of the sovereign-debt crisis and the structural problems in the banking sector. On the contrary, reducing some banks' dependency on central bank financing and the weakening of the interlinkages between Member States' weak public finances and vulnerable banking sectors will require significant restructuring efforts and public finances that are kept on a sustainable track.
Turning to the policy risks, there are concerns that the ECB's non-standard measures may contribute to reducing the incentive for banks to strengthen their balance sheets, which might support credit flows in the very short-term, but which is likely to imply constrained lending further down the road. The question of the "exit strategy" from the substantial LTRO funding at the three-year horizon (or earlier, thanks to the flexibility foreseen for early repayment) and the return to market financing (also with longer maturities) will need to be addressed. Besides, the current low interest rate environment, a weak business cycle, and depressed collateral values may lead some banks to postpone loss recognition, thus constraining lending potentially even further if interest rates rise or if macroeconomic conditions continue to deteriorate.
Notwithstanding the positive effects of LTROs, bank loan supply to the private non-financial sector depends on a range of factors, including risks and returns, access to market finance and the fulfilment of regulatory requirements. This raises the question of whether recent shifts in banks' funding compositions towards higher dependence on central bank liquidity will impact on the credit supply to the real economy going forward.(4)
(4) Gambacorta, L. and D. Marqués-Ibañez, The bank
lending channel: Lessons from the crisis, Economic Policy, April 2011, Vol. 26, No. 66, pp. 135-182.

European Economic Forecast, Spring 2012
24
On-going deleveraging operations and recapitalisation efforts by banks have already reduced the scope of the necessary balance-sheet adjustment to some extent. In the same vein, recent assessments by the ECB(18) and the European Banking Authority (EBA)(19) suggest that further balance-sheet adjustments will predominantly occur via recapitalisation and that the necessary remaining deleveraging would be rather smooth, with only a limited risk of disruptive cutbacks on loans to the private sector.
Furthermore, the impact on growth will also depend on companies' ability to substitute other sources of financing for bank loans. Several large non-financial corporations still have at their disposal substantial unused credit lines and cash cushions created since the 2008-09 liquidity shortage and they are increasingly able to tap the bond markets directly given that their credit ratings are in some cases even more favourable than those of their lenders. However, the fact that corporate-bond issuance is still a relatively limited source of overall corporate funding in the EU and the strong reliance of small and medium-sized enterprises on bank lending highlight the stability and strength of the banking sector as an important precondition for a self-sustained recovery.
5. THE EU ECONOMY
From a mild recession …
On the back of a number of shocks in 2011, the EU economy entered a period of contraction at the end of 2011. The sharp increase in oil prices, a slowdown in the world economy, and, last but not least, the negative impact of the escalation of the sovereign-debt crisis in several Member States resulted in a sharp deterioration of the economic situation towards the end of 2011. The shocks took their toll in an environment of bank deleveraging and fiscal tightening. With negative real GDP growth rates in both the EU and the euro area (see (18) ECB, Common equity capital, banks' riskiness and required
return on equity, ECB Financial Stability Review, December 2011, pp. 125-31.
(19) The EBA’s preliminary assessment of banks’ capital plans to comply with the 2011 EU Capital Exercise yielded that, in aggregate, the shortfalls are expected to be covered and an additional 26% of the capital surplus will be created primarily through direct capital measures (i.e. capital raising, retained earnings and conversion of hybrids to common equity), while changes to risk-weighted assets account for 23% of the capital improvement. The measures are viewed as having a very marginal negative impact on lending to the real economy.
Graph I.14) in the fourth quarter of 2011 and, according to this forecast, in the first quarter of 2012, both areas met the criteria of a technical recession. By contrast, the group of Member States outside the euro area did not enter recession (see Graph I.15).
-3
-2
-1
0
1
2
3
07 08 09 10 11 12 1385
90
95
100
GDP growth rate (lhs)GDP (quarterly, rhs)GDP (annual, rhs)
Graph I.14: Real GDP, euro area
forecast
q-o-q% index, 2007=1003.0 0.4
-4.31.9
1.5
-0.3
Figures close to horizontal bars are annual growth rates.
1.0
-3
-2
-1
0
1
2
3
07 08 09 10 11 12 1385
90
95
100
GDP growth rate (lhs)GDP (quarterly, rhs)GDP (annual), index (rhs)
q-o-q% index, 2007=100
forecast
3.8 0.2
-4.3
2.41.7
0.71.9
Figures close to horizontal bars are annual growth rates.
Graph I.15: Real GDP, EU without euro area
While the first quarter of 2011 saw by far the strongest economic growth in the EU and the euro area since the downturn in 2008-09, the EU economy slipped closer to recession in the second half of the year and finally GDP finally contracted in the fourth quarter (by 0.3% q-o-q in both areas). It was the first output decline since mid-2009. Since the transition from recovery to recession took place over the course of the year, in 2011 as a whole, real GDP still grew by 1.5% in both the EU and the euro area.
The breakdown of GDP by demand components indicates that the contraction in the fourth quarter was driven by weak domestic demand and changes in inventories, whereas net exports made a positive contribution (see Graph I.16). Domestic demand became a more apparent drag on growth as a result

Economic developments at the aggregated level
Table I.3:
Main features of the spring 2012 forecast - EU (Real annual percentage change Spring 2012 Autumn 2011 unless otherwise stated) forecast forecast
2008 2009 2010 2011 2012 2013 2012 2013 GDP 0.3 -4.3 2.0 1.5 0.0 1.3 0.6 1.5 Private consumption 0.3 -1.8 1.0 0.1 -0.3 0.7 0.4 1.1 Public consumption 2.3 2.1 0.7 -0.1 -0.5 -0.1 -0.2 0.1 Total investment -0.9 -12.5 -0.2 1.3 -0.9 2.2 0.8 3.0 Employment 0.9 -1.9 -0.5 0.2 -0.2 0.2 0.1 0.4 Unemployment rate (a) 7.1 9.0 9.7 9.7 10.3 10.3 9.8 9.6 Inflation (b) 3.7 1.0 2.1 3.1 2.6 1.9 2.0 1.8 Government balance (% GDP) -2.4 -6.9 -6.5 -4.5 -3.6 -3.3 -3.9 -3.2 Government debt (% GDP) 62.5 74.8 80.2 83.0 86.2 87.2 84.9 84.9 Adjusted current-account balance (% GDP) -2.0 -0.8 -0.9 -0.7 -0.4 0.0 -0.4 -0.2
Contribution to change in GDP Domestic demand 0.4 -3.2 0.7 0.3 -0.4 0.8 0.3 1.2 Inventories -0.2 -1.2 0.9 0.2 -0.3 0.0 0.0 0.0 Net exports 0.1 0.0 0.5 1.0 0.7 0.4 0.3 0.3
(a) Percentage of the labour force. (b) Harmonised index of consumer prices, annual percentage change.
25
of the simultaneous contraction of private consumption, public consumption and gross fixed capital formation. In this situation net exports were the main contributor to GDP growth.
Graph I.16: GDP growth and its components, EU
-6-5-4-3-2-1012345
00 01 02 03 04 05 06 07 08 09 10 11 12 13
Private consumption Government consumptionInvestment Net exportsInventories GDP (y-o-y%)
pps.
forecast
… and a weak near-term outlook...
In the first three months of 2012, leading indicators were showing signs of a bottoming-out suggesting that the recession would be mild and short-lived. Releases of hard data looked compatible with this expectation, but the evidence was not clear-cut and a delay in the return to expansion could not be excluded. More recently published indicators have dampened expectations.
85
90
95
100
105
110
115
70
80
90
100
110
120
130
05 06 07 08 09 10 11 12
Industrial new orders (lhs)Industrial production (rhs)
index, 2005=100 index, 2005=100
Graph I.17:Industrial new orders and industrial production, EU
Industrial production surprised on the upside in February, but the strong growth in the Netherlands (13% m-o-m) and weather conditions that were incompletely captured in seasonal adjustments might have affected the figures strongly (see Graph I.17). The three-month moving average growth rate came in at -0.9% in the EU and at -1.1% in the euro area, which sent a less positive signal for overall economic activity in the first quarter.
Indicators acting as a gauge of future activity have been rather weak in the past months. Industrial new orders have been on a downward trend since autumn, standing at about 10% below the 2007 average in February 2012. This limits expectations for a near rebound in industrial production and so does not bode well for overall economic growth in the near term.

European Economic Forecast, Spring 2012
Table I.4:
Main features of the spring 2012 forecast - euro area (Real annual percentage change Spring 2012 Autumn 2011 unless otherwise stated) forecast forecast
2008 2009 2010 2011 2012 2013 2012 2013 GDP 0.4 -4.3 1.9 1.5 -0.3 1.0 0.5 1.3 Private consumption 0.4 -1.2 0.9 0.2 -0.6 0.5 0.4 1.0 Public consumption 2.3 2.5 0.5 -0.1 -0.8 0.0 -0.2 0.3 Total investment -1.1 -12.1 -0.5 1.3 -1.5 1.9 0.5 2.9 Employment 0.7 -2.0 -0.6 0.1 -0.5 0.0 0.0 0.3 Unemployment rate (a) 7.6 9.6 10.1 10.2 11.0 11.0 10.1 10.0 Inflation (b) 3.3 0.3 1.6 2.7 2.4 1.8 1.7 1.6 Government balance (% GDP) -2.1 -6.4 -6.2 -4.1 -3.2 -2.9 -3.4 -3.0 Government debt (% GDP) 70.1 79.9 85.6 88.0 91.8 92.6 90.4 90.9 Adjusted current-account balance (% GDP) -1.6 -0.3 -0.5 -0.3 0.1 0.6 -0.5 -0.3
Contribution to change in GDP Domestic demand 0.4 -2.8 0.5 0.4 -0.8 0.7 0.3 1.2 Inventories -0.1 -1.0 0.7 0.2 -0.3 0.0 -0.1 0.0 Net exports 0.1 -0.6 0.7 1.0 0.8 0.4 0.2 0.2
(a) Percentage of the labour force. (b) Harmonised index of consumer prices, annual percentage change.
26
Survey data in the first quarter of 2012 pointed to some stabilisation in economic activity at a low level, while distinct signs of a recovery were still missing.
− The Economic Sentiment Indicator (ESI) stabilised in the first quarter of 2012, but remained below its long-term average. Up to April, the decline in the ESI unwound gains in the preceding months. In particular, industry sentiment deteriorated in April, declining in the EU and the euro area to the lowest levels since the Great Recession. Services sentiment had been slightly more resilient as the sector is less sensitive to cyclical factors.
− The PMI Composite Output index improved in the first quarter in the EU (from 48.1 to 50.7) and in the euro area (from 47.2 to 49.6), but remained close to the no-growth threshold with substantial differences across countries. And within the first quarter the strongest increase and the highest readings were recorded in January, suggesting that purchasing managers had been slightly overoptimistic about the rebound at the turn of the year. This view was confirmed by the deterioration that followed up to April, signalling deeper contraction in business activity in the second quarter.
− The latest OECD composite leading indicators (February 2012) indicated a potential turning point in the euro area, albeit with diverging assessments for the four largest Member States.
30
40
50
60
60
70
80
90
100
110
120
00 01 02 03 04 05 06 07 08 09 10 11 12
Economic Sentiment Indicator (lhs)
PMI Composite Output Index(rhs)
3-month moving average (ma) 3-month ma
Graph I.18:Economic Sentiment Indicator andPMI Composite Output Index, EU
− In April 2012, the National Bank of Belgium's business barometer, which has in the past anticipated euro-area developments rather well, dipped slightly for the second consecutive month.
Overall and independent of small and mostly temporary differences in indicators, the short-term outlook for domestic demand does not look promising. The most recent readings have attenuated expectations that improvements in early 2012 could start to lift the economy back to recovery. Uncertainty remains high, motivating consumers and investors to postpone spending decisions. In addition, the weak labour market conditions and unfavourable developments in real incomes do not bode well for an expansion. With the quarterly profile of GDP growth in 2011 giving a carry-over of 0.0% in the EU and -0.2% in the

Economic developments at the aggregated level
27
euro there is also no support from last year's economic growth. All in all, EU GDP is expected to stagnate in 2012, while output in the euro area is forecast to shrink (-0.3%).
… heading towards a slow recovery …
In the second half of 2012, important policy decisions in the euro area that have already helped to avoid a sharp decline in economic activity in the past months, should help to further restore consumer and investor confidence. The assumed gradual return of confidence can be expected to exert an increasingly positive impact on private domestic demand. Credible fiscal consolidation measures and structural reforms should support this development. And the moderation in commodity prices, lowering inflationary pressures is forecast to impact positively on real incomes. Investment could benefit from very low long-term interest rates. Given that many spending decisions have been postponed in recent months, these forces should be strong enough to result in a rebound of economic activity in the second half of 2012 in both the EU and the euro area.
… and subpar economic growth in 2013...
Rebounding domestic demand and, to a gradually decreasing extent, support from the external side are expected to stimulate economic activity in the EU and the euro area in late 2012 and 2013. Increased economic confidence and higher real disposable incomes are expected to be the driving forces behind the rebound in private consumption. The improved outlook for demand and increased investor confidence should also push equipment investment. In addition, the realisation of delayed investment projects from times of elevated uncertainty and relatively favourable financing conditions exert positive influence on gross fixed capital formation. Overall, it is expected to grow more strongly in 2013 than in any of the preceding recovery years, while private consumption is forecast to grow nearly as strongly as in 2010, the year with the highest growth rate since 2007.
Once economic activity gets traction, the labour market situation should stabilise, but given the lagged response of job creation to output developments, a more substantial improvement in employment can only be expected for the end of the forecast period. This modest improvement corresponds to the projection of rather subdued economic growth towards the end of the forecast
horizon. In 2013, at growth rates of about 1¼% in the EU and 1% in the euro area, the recovery of GDP is expected to be very similar to the one that followed the recession in 2008-09. The fact that even these moderate growth rates would benefit from a positive carry-over from 2012 (0.3 pp. in the EU, 0.1 in the euro area) illustrates how subdued the growth dynamics are.
Recent experience of failed hopes of broadening and strengthening of the 2009-11 recovery raises the question as to whether the expected recovery will be more sustainable this time. Past evidence suggests that for a recovery to become sustained, a transition is necessary from the actual triggers of the initial upswing into more permanent growth drivers, in particular among the domestic demand components. In that respect, the interaction of strengthening private consumption and recovering gross fixed capital formation is expected to be a key mechanism in the dynamics of the recovery. Its characteristics will depend on the degree of stabilisation and improvement in the labour market, which itself hinges on improvements in the functioning of European labour markets. Recent and planned structural reforms(20) appear to provide more solid foundations for such developments and thus for a more sustainable recovery than three years ago.
… with macroeconomic cross-country differences persisting.
No Member State has been immune to the shocks that hit the EU economy, but some have proven more resilient. And, not surprisingly, most of the countries that had already performed better during the recovery remained the strongest.
-0.5
0.0
0.5
1.0
1.5
2.0
2.5
2010 2011 2012 2013
DE UK FR PL SE AT BE IT Others
pps.
1.3%
0.0%
1.5%
2.0%
forecast
Graph I.19: Real GDP growth , EU, contributions by Member States
(20) See European Commission (DG ECFIN), European
Economic Forecast – Autumn 2011, ch. I.2.

European Economic Forecast, Spring 2012
28
Therefore those countries that had contributed massively to GDP growth in the EU during the upturn, in particular Germany, the UK, Poland and France, are expected to remain key contributors (see Graph I.19), while some, particularly Italy and Spain, are expected to deliver negative contributions in 2012.
Cross-country growth differences were one of the key features of the recovery in 2009-11. They were caused, inter alia, by diverse starting positions in terms of private indebtedness,(21) bursting asset price bubbles (housing market), banking sector health, and the solidity of public finances. But competitiveness and export structures (product composition, export destination) also played a role. And, following the trade collapse of 2008, the strong rebound in world trade impacted differently on countries, allowing those with export-oriented economies and strong competitiveness to grow faster than others. As a result, only the fastest-growing countries, for instance Sweden, Poland and Germany, were able by 2011 to reach output levels above those of the pre-crisis period.
In the near term, substantial differences are expected to persist across Member States. Leading indicators, such as the ESI and the PMI, support this view (see Graph I.20). Most countries recorded declines in the fourth quarter of 2011 and a rebound in the first quarter of 2012. But in the euro area, only a few countries were markedly above the no-growth threshold.
35
40
45
50
55
60
65
DE IE NL IT EA FR AT ES EL DK CZ PL UK EU
11Q3 11Q4 12Q1
Graph I.20:PMI Manufacturing Output Index, Member States
index
(21) On the role of household debt, see also IMF, World
Economic Outlook, April 2012, chapter 3.
The more detailed sectoral information provided by the Commission's Business and Consumer Surveys confirms the weak situation and also indicates that manufacturing and construction are clearly below long-term averages in most economies, whereas retail confidence is more mixed across countries (see Graph I.21).
-30
-20
-10
0
10
20
IT ES* NL PL EA EU FR UK DE
Manufacturing Services Consumers
Construction Retail ESI
Graph I.21: Economic Sentiment Indicator (ESI) and components - April 2012, difference from long-term average
*Sentiment in construction - difference from long-term average: -43
Gross fixed capital formation currently shrinking …
Following a sharp decline during the downturn in 2008-09, gross fixed capital formation recovered gradually in 2010-11, but remained well below pre-crisis levels. The improvement was interrupted as the overall economic situation and outlook deteriorated again in the second half of 2011. Compared to the first half of the year it stagnated in the EU (0.1%) and declined in the euro area (-0.5%). Uncertainty acted as a major drag on investment decisions. Other downside factors were declining capacity utilisation, meagre profit developments, tight credit conditions, and companies' deleveraging. The breakdown of investment indicates that mainly equipment investment weakened in the second half of 2011, whereas construction investment has remained on the weak side already since the onset of the crisis.
… with equipment investment mirroring the overall economic situation …
Equipment investment, which accounts for roughly one third in gross fixed capital formation, had rebounded strongly after the 2008-09 recession, but slowed in 2011 due to weaker current and expected demand. Overall, the investment cycle of the 2009-11 recovery was rather short and moderate.

Economic developments at the aggregated level
29
In early 2012, the near-term outlook for equipment investment is weak since companies have lowered their production expectations in line with falling capacity utilisation (see Graph I.22); uncertainty, albeit at a slightly lower level, remains a substantial drag to investment decisions. Moreover, slowing activity puts pressure on profits and reduces margins, indicated by changes in the ratio of the GDP deflator and unit labour costs. In addition, in several Member States equipment investment is still influenced by tightened financing conditions and companies' deleveraging. The impact of bank deleveraging on companies’ financing of equipment investment depends on the availability of other funding options, such as corporate bonds.(22)
68707274767880828486
-24
-16
-8
0
8
00 01 02 03 04 05 06 07 08 09 10 11 12 13
Equipment investment, forecast (y-o-y%, lhs)
Capacity utilisation rate (rhs)
% %forecast
Graph I.22:Equipment investment and capacity utilisation, euro area
(22) For details, ECB, Corporate indebtedness in the euro area,
ECB Monthly Bulletin, February 2012, pp. 87-103.
Leading indicators, such as new orders of capital goods and the new-orders component in the PMI, suggest that equipment investment will remain weak in the near term. Overall, in 2012 equipment investment is expected to remain almost flat in the EU and to decline in euro area.
… but rebounding over the forecast horizon.
Going forward, in 2013 increasing investor confidence, improved domestic demand prospects, and favourable financing conditions, raise incentives for expanding production capacity. Equipment investment in particular will benefit from the turnaround in private consumption and the expected acceleration in global trade. During periods of elevated uncertainty, companies may have preferred to delay investment decisions until new information became available. Thus, diminishing uncertainty should have large effects on optimal leverage and investment dynamics.
Overall, equipment investment growth is expected to accelerate in 2013 to 4¾% in the EU (4% in the euro area). All large Member States except Spain are expected to see substantial increases in their growth rates.
No impulses from subdued construction investment …
Residential and non-residential construction investment went into decline at the very beginning
Table I.5:
Composition of growth - EU (Real annual percentage change) Spring 2012
forecast2010 2006 2007 2008 2009 2010 2011 2012 2013
bn Euro curr. prices % GDP Real percentage change Private consumption 7039.5 58.1 2.3 2.2 0.3 -1.8 1.0 0.1 -0.3 0.7 Public consumption 2692.7 22.2 2.0 1.8 2.3 2.1 0.7 -0.1 -0.5 -0.1 Gross fixed capital formation 2254.9 18.6 6.4 5.9 -0.9 -12.5 -0.2 1.3 -0.9 2.2 Change in stocks as % of GDP 28.8 0.2 0.5 0.8 0.6 -0.5 0.4 0.5 0.3 0.3 Exports of goods and services 4980.6 41.1 9.7 5.8 1.5 -12.0 10.9 6.3 2.4 4.8 Final demand 16996.5 140.2 5.0 4.0 0.6 -6.6 4.1 2.2 0.2 2.1 Imports of goods and services 4875.9 40.2 9.6 6.0 1.2 -12.2 9.8 3.9 0.9 3.9 GDP 12120.6 100.0 3.3 3.2 0.3 -4.3 2.0 1.5 0.0 1.3 GNI 12118.3 100.0 3.4 3.0 0.1 -4.4 2.2 1.5 -0.1 1.2 p.m. GDP euro area 9158.0 75.6 3.3 3.0 0.4 -4.3 1.9 1.5 -0.3 1.0
Contribution to change in GDP Private consumption 1.3 1.3 0.2 -1.0 0.6 0.1 -0.2 0.4 Public consumption 0.4 0.4 0.5 0.4 0.2 0.0 -0.1 0.0 Investment 1.3 1.2 -0.2 -2.6 0.0 0.2 -0.2 0.4 Inventories 0.2 0.4 -0.2 -1.2 0.9 0.2 -0.3 0.0 Exports 3.6 2.3 0.6 -5.0 4.0 2.6 1.0 2.1 Final demand 6.8 5.5 0.8 -9.3 5.6 3.1 0.3 3.0 Imports (minus) -3.5 -2.3 -0.5 5.0 -3.5 -1.6 -0.4 -1.7 Net exports 0.1 0.0 0.1 0.0 0.5 1.0 0.7 0.4

European Economic Forecast, Spring 2012
30
of the crisis and stabilised somewhat in 2011. Housing, which accounts for about one half of construction investment, remained affected by the legacy of the crisis. In several Member States the stock of unsold housing continued to act as a drag on investment activity. The deterioration in the overall economic situation has now added a cyclical headwind. And financing conditions are difficult in several economies, in particular in terms of credit standards for loans for house purchases.
Graph I.23: Housing investment and building permits, euro area
-12
-8
-4
0
4
8
00 01 02 03 04 05 06 07 08 09 10 11 12 13-40
-30
-20
-10
0
10
20
Housing investment (lhs), forecast (lhs)Building permits (rhs)
y-o-y%y-o-y%
forecast
Note: Forecast figures relate to overall construction investment
Leading supply indicators such as building permits signal some improvements (see Graph I.23) despite deleveraging by EU households. The Commission's Construction confidence indicator fluctuated around a low level throughout 2011 and early 2012. In April 2012 it stood well below its long-term averages in both the EU and the euro
area with substantial differences across countries. While the fastest-growing countries, such as Germany and Austria, reported strong confidence well above the long-term average, economies in recession faced low sentiment. Bad weather conditions only partly captured in seasonal adjustment contributed to the plunge in February.
Overall, housing investment is expected to shrink further in 2012 in the EU and the euro area, before moderate growth sets in in 2013. The positive impact of the improving situation of private households will be partly offset by the negative impact of fiscal consolidation on the government component in construction investment.
… and negative contributions from inventory investment in 2012.
The slowdown in economic activity in the EU in the second half of 2011 also impacted on the warranted levels of companies’ inventories. Until then, the inventory cycle had broadly followed historical patterns. During the 2008-09 recession, inventories had negatively contributed to economic growth since companies lowered stocks amid a deteriorated demand outlook and tighter financing conditions. With the start of the recovery, growth in domestic demand benefitted from a temporary boost of the end of destocking, with firms raising production to replenish inventories. Since mid-2010 the profile of increases was almost steady so that no further contribution to output growth was observed. The implication of past inventory
Table I.6:
Composition of growth - euro area (Real annual percentage change) Spring 2012
forecast2010 2006 2007 2008 2009 2010 2011 2012 2013
bn Euro curr. prices % GDP Real percentage change Private consumption 5262.2 57.5 2.1 1.7 0.4 -1.2 0.9 0.2 -0.6 0.5 Public consumption 2013.4 22.0 2.1 2.2 2.3 2.5 0.5 -0.1 -0.8 0.0 Gross fixed capital formation 1749.7 19.1 5.7 4.7 -1.1 -12.1 -0.5 1.3 -1.5 1.9 Change in stocks as % of GDP 18.5 0.2 0.5 0.8 0.6 -0.3 0.4 0.3 0.1 0.1 Exports of goods and services 3746.1 40.9 8.9 6.6 1.0 -12.7 11.2 6.2 2.1 4.6 Final demand 12789.9 139.7 4.7 3.9 0.6 -6.5 4.0 2.2 -0.1 1.9 Imports of goods and services 3631.9 39.7 8.7 6.2 0.9 -11.7 9.6 3.8 0.4 3.9 GDP 9158.0 100.0 3.3 3.0 0.4 -4.3 1.9 1.5 -0.3 1.0 GNI 9166.4 100.1 3.7 2.6 -0.2 -4.2 2.3 1.3 -0.3 1.0 p.m. GDP EU 12120.6 132.3 3.3 3.2 0.3 -4.3 2.0 1.5 0.0 1.3
Contribution to change in GDP Private consumption 1.2 0.9 0.2 -0.7 0.5 0.1 -0.3 0.3 Public consumption 0.4 0.4 0.5 0.5 0.1 0.0 -0.2 0.0 Investment 1.2 1.0 -0.2 -2.6 -0.1 0.2 -0.3 0.4 Inventories 0.2 0.4 -0.1 -1.0 0.7 0.2 -0.3 0.0 Exports 3.4 2.7 0.4 -5.4 4.1 2.5 0.9 2.1 Final demand 6.4 5.4 0.8 -9.1 5.4 3.1 -0.2 2.7 Imports (minus) -3.2 -2.5 -0.4 4.8 -3.4 -1.5 -0.2 -1.7 Net exports 0.2 0.2 0.1 -0.6 0.7 1.0 0.8 0.4

Economic developments at the aggregated level
31
investment for the current period of weak economic activity is that stocks were already relatively low when growth slowed in mid-2011. The adjustment towards lower warranted levels can therefore be expected to matter mainly for the build-up of stocks. This view is corroborated by results from the Commission surveys. The assessment of stocks in industry rose in the second half of 2011, but has already fallen in the first quarter of 2012. In terms of national account data, the negative contribution of inventories is therefore expected to be rather small in 2012 in both the EU and the euro area.
Private consumption, currently restrained by weak disposable incomes, …
Private consumption, the largest GDP component, had been one of the key drivers in the initial phases of the 2009-11 recovery in the EU and the euro area. In 2010, the annual rate of growth stood at around 1% in both areas, but in 2011 this growth almost came to a standstill (0.2%). With a contraction in the second half of the year, it was mainly the carry-over from 2010 (0.5% in both areas) that kept the annual growth rate in positive territory (see Graph I.24).
-35
-30
-25
-20
-15
-10
-5
0
5
-2
-1
0
1
2
3
4
00 01 02 03 04 05 06 07 08 09 10 11 12 13
Private consumption (lhs), and forecast (lhs) forecast
y-o-y % balance
Graph I.24:Private consumption and consumer confidence, euro area
forecast
A key reason for weak consumption growth has been the large squeeze on real gross disposable incomes (see Graph I.25), attributable to muted growth in compensations alongside high inflation.
− On the nominal side, growth in compensation was held down in 2011 by a slowdown in employment growth. The recent deterioration in labour market conditions resulted in shrinking employment and more moderate increases in compensation per employee than previously expected. Moreover, transfers declined against the background of intensified
fiscal consolidation. Non-labour incomes, which include profit income, continued on their upward trend but growth was less dynamic than at the onset of the recovery.
− The purchasing power of nominal incomes was curtailed by the direct and indirect impact of last year's increases in food and energy prices. This cut out a substantial amount of nominal increases so that real disposable incomes almost stagnated.
-0.7
-0.2
0.3
0.8
1.3
07 08 09 10 11 12
Net taxesNon-labour incomeLabour incomeReal disposable income (q-o-q%)
pps.
Graph I.25:Real gross diposable income and its components, euro area
− Private wealth remained constrained by weak financial and housing market developments after the financial crisis had wiped out a substantial part of the net worth of debtors. This resulted in tight borrowing constraints and lower liquidity, which forced some households to cut back on consumption. This consumption channel of financial crises had particularly strong negative effects in countries with highly leveraged households. The decline in interest rates in the second half of 2011 lowered the costs of servicing this debt, but the willingness of households to take on debt remains limited.
Developments in the saving rates of households are another key determinant of private consumption growth. Increased uncertainty can be expected to have raised precautionary savings by households.(23) Via this channel, the escalation of the euro-area sovereign-debt crisis in 2011 impacted negatively on consumers' spending patterns. Changes in income distribution may have been another factor pushing up the average household saving rate. Recent evidence of a more
(23) Analyses conducted for the Great Recession provided
evidence of this feature, see e.g. Mody, A., F. Ohnsorge and D. Sandri, Precautionary savings in the Great Recession, IMF Economic Review, April 2012, Vol. 60, No. 1, pp. 114-38.

European Economic Forecast, Spring 2012
32
unequal income distribution in the EU(24) could contribute to the explanation of weak consumption growth, since households in the top deciles have below-average propensities to consume. The upside factors are partially offset by relatively low real interest rates that should affect intertemporal substitution in favour of current consumption.
… will start rebounding as the recovery takes ground …
Many of the headwinds to private consumption remained in place in early 2012. The near-term prospects for private consumption remain weak. This is confirmed by recent information from short-term indicators and surveys. Euro-area new passenger car registrations declined in the last three months with available data (December 2011-February 2012), as compared to the three preceding months. Retail trade volumes (see Graph I.26) fall short of the levels recorded one year ago, and both the Commission's Retail trade confidence indicator and the Retail PMI confirm the weakness. In the EU and the euro area, the Commission's Consumer confidence indicator declined steadily in the second half of 2011 before rebounding in the first quarter of 2012, but falling back in April. These readings signal private consumption is flat or will grow only modestly in the near term.(25)
-25
-20
-15
-10
-5
0
5
-6
-4
-2
0
2
4
6
00 01 02 03 04 05 06 07 08 09 10 11 12
Graph I.26:Retail trade volumes and retail confidence, euro area
Retail trade volume, 3mma (lhs)Retail confidence (rhs)
y-o-y % balance
(24) Between the mid-1980s and 2008, the real disposable
income in the EU increased at the highest rates in the top decile; see Bonesmo Frederiksen, K., Income inequality in the European Union, OECD Economics Department Working Papers no. 952, April 2012.
(25) For a recent analyses of the forecast accuracy of the Consumer Confidence Index see European Commission (DG ECFIN), European Business Cycle Indicator, March 2012, pp. 10-14. See also ECB, Recent developments in consumer confidence and the link with private consumption (Box 8), ECB Monthly Bulletin, March 2012, pp. 75-78.
Overall in 2012, private consumption is forecast to fall by 0.3% in the EU and by 0.6% in the euro area.
... and deliver stronger contributions to GDP growth in late 2012 and 2013.
Further on, private consumption is expected to benefit from growing real disposable incomes and consumer confidence. With labour market conditions stabilising and nominal compensation increasing moderately, nominal disposable income growth should return to positive territory in 2013. The moderation in HICP inflation should lift households' purchasing power and real disposable income. To what extent this will translate into a strengthening of private consumption growth depends, among others, on the spending patterns of households engaged in deleveraging processes. Increases in taxes and cuts in public expenditure may slow the reduction of the debt overhang. In 2013, the saving rate is expected to remain broadly unchanged in the EU and the euro area. Thus, the stimulus to spending would mainly come from a moderation in consumer-price inflation and its impact on real incomes. Overall, in 2013, private consumption is expected to rebound moderately.
The weakness in aggregate private consumption in the EU conceals substantial cross-country differences. Among the largest Member States, Germany, France, Poland and the UK are expected to record above-average growth rates in 2012-13, whereas in other countries private consumption is set to shrink (Spain, Italy, and the Netherlands). In 2013, an increase in the growth rate of private consumption is expected in all Member States except Denmark, Estonia and Finland.
… whereas public consumption remains weak.
In line with fiscal consolidation, public consumption is forecast to decrease in most Member States. In 2011, consolidation efforts had already pulled down public consumption to slight contraction in the EU and in the euro area. In the euro area, the three programme countries as well as Cyprus, Slovakia and Spain recorded declines of more than 2 pps.
Over the forecast horizon, enhanced fiscal consolidation efforts are expected to lower government consumption (-0.8% in the euro area and -0.5% in the EU in 2012). In 2013, government consumption is expected to continue

Economic developments at the aggregated level
33
to fall modestly in the EU at an annual rate of 0.1% and to stagnate in the euro area. This forecast for 2013 should be seen against the background of the no-policy-change assumption, which could imply that a number of consolidation measures are not yet factored into this forecast as they do not yet meet the conditions for being fully accounted for. The impact of fiscal retrenchment on economic growth will depend on a number of factors, particularly on the composition of expenditure cuts, their impact on consumer confidence and the response of monetary policy (see Box I.4).(26)
Positive growth contributions from net exports in 2011 and over the forecast horizon …
In 2011, with the growth of exports exceeding that of imports, net trade contributed positively to economic growth in the EU and the euro area. The normalisation of world trade growth after the extraordinary preceding year and the slowing in world output growth lowered export growth, but the deterioration in the economic situation in the EU, in particular the weakening of domestic demand, weighed strongly on imports. Over the forecast horizon, the outlook for the export and import growth of goods and services implies a continuation of positive growth contributions of net trade.
… as exports grow solidly …
In 2011, growth rates of goods and services exports almost halved in both the EU and the euro area. Market shares increased for a second consecutive year, with the weaker euro lending support to price competitiveness of euro-area exporters.
Survey indicators (see Graph I.27) point to improvements in the short-term outlook for EU exports. But continued bank deleveraging puts trade finance at risk.(27) The assessment of
(26) While monetary policy close to the zero bound may
suggest relatively large multipliers (see e.g. Woodford, M., Simple analytics of the government expenditure multiplier, American Economic Journal: Macroeconomics, 2011, Vol. 3, No. 1, pp. 1-35), unconventional monetary policy tools may suggest widening the perspective on central bank options (see e.g. Bullard, J., The death of a theory, Federal Reserve Bank of St. Louis Review, March-April 2012, Vol. 94, No. 2, pp. 83-102).
(27) The health of the banking sector has been a key determinant of exports during the crisis, see e.g. Amiti, M. and D. E. Weinstein, Exports and financial shocks, Quarterly Journal of Economics, November 2011, Vol. 126, No. 4, pp. 1841-77; on trade finance during the downturn see Ahn, J. B., M. Amiti and D. E. Weinstein,
manufacturing export order books from the Commission's surveys and the component for new export orders in the manufacturing PMI have recently dipped back. Looking ahead through the lens of these indicators, only moderately accelerating export growth is expected. Due to the weaker performance seen in late 2011 and early 2012, export growth in 2012 as a whole will be lower than in the preceding year, but in 2013 export growth rates (goods and services) should almost double.
29
36
43
50
57
64
-12
-8
-4
0
4
8
12
00 01 02 03 04 05 06 07 08 09 10 11 12 13
Graph I.27:Global demand, euro-area exports and new export orders
Exports (q-o-q%, lhs), forecast (y-o-y%, lhs)Output index (Global PMI composite, rhs)New export orders (PMI Manuf., euro area, rhs)
%forecast
3-month moving average
To what extent Member States share this development depends on their geographical and product specialisations, as well as on their competitive position. In countries where exports are directed in a large part towards emerging markets, the negative impact of the slowing of world trade had already been less severe given the relatively robust output growth in the emerging economies. These countries are also expected to benefit from the expected rebound in global trade, in particular as their exports of capital goods, usually increase strongly during upturns in destination countries. In addition, those Member States that have recently gained price competitiveness are expected to exhibit relatively strong export growth. A different situation prevails in economies that depend largely on intra-EU and intra-euro-area trade. Export markets of these countries have been massively affected by the worsening of the economic situation in the EU. But in these countries also, changes in relative prices have been a relatively important determinant of exports as intra-euro-area trade flows are
Trade finance and the Great Trade Collapse, American Economic Review, Papers and Proceedings, May 2011, Vol. 101, No. 3, pp. 298-302.
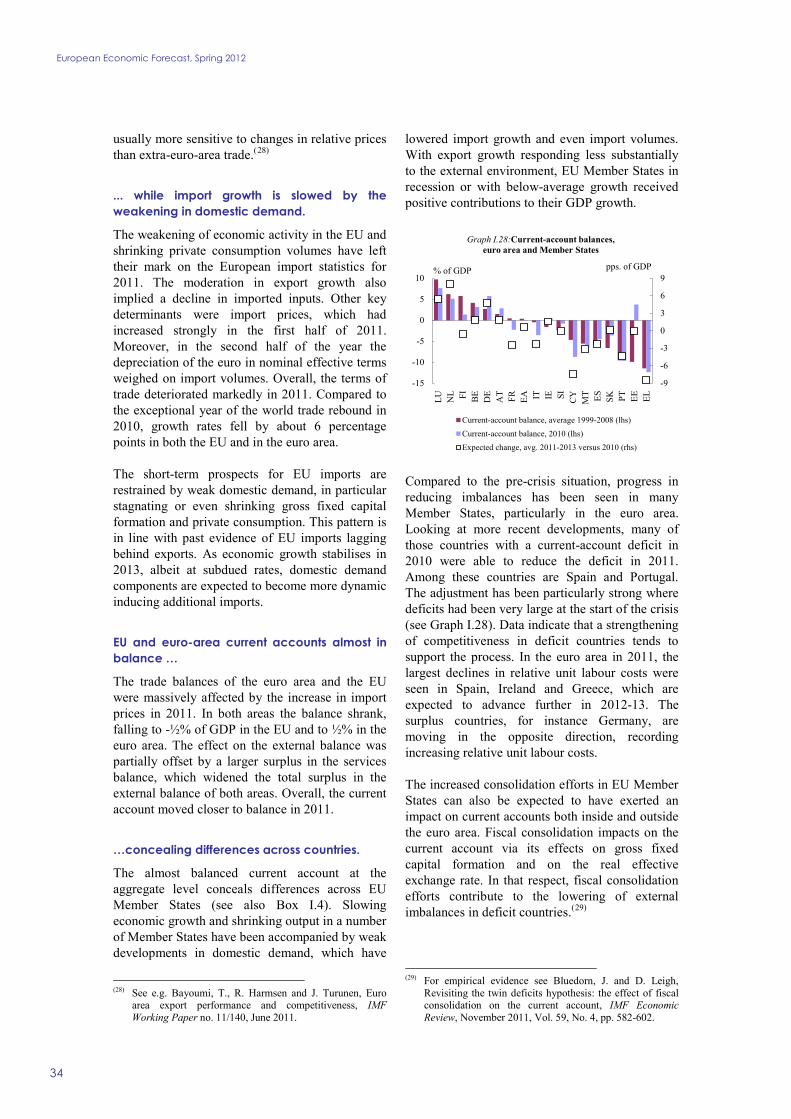
European Economic Forecast, Spring 2012
34
usually more sensitive to changes in relative prices than extra-euro-area trade.(28)
... while import growth is slowed by the weakening in domestic demand.
The weakening of economic activity in the EU and shrinking private consumption volumes have left their mark on the European import statistics for 2011. The moderation in export growth also implied a decline in imported inputs. Other key determinants were import prices, which had increased strongly in the first half of 2011. Moreover, in the second half of the year the depreciation of the euro in nominal effective terms weighed on import volumes. Overall, the terms of trade deteriorated markedly in 2011. Compared to the exceptional year of the world trade rebound in 2010, growth rates fell by about 6 percentage points in both the EU and in the euro area.
The short-term prospects for EU imports are restrained by weak domestic demand, in particular stagnating or even shrinking gross fixed capital formation and private consumption. This pattern is in line with past evidence of EU imports lagging behind exports. As economic growth stabilises in 2013, albeit at subdued rates, domestic demand components are expected to become more dynamic inducing additional imports.
EU and euro-area current accounts almost in balance …
The trade balances of the euro area and the EU were massively affected by the increase in import prices in 2011. In both areas the balance shrank, falling to -½% of GDP in the EU and to ½% in the euro area. The effect on the external balance was partially offset by a larger surplus in the services balance, which widened the total surplus in the external balance of both areas. Overall, the current account moved closer to balance in 2011.
…concealing differences across countries.
The almost balanced current account at the aggregate level conceals differences across EU Member States (see also Box I.4). Slowing economic growth and shrinking output in a number of Member States have been accompanied by weak developments in domestic demand, which have
(28) See e.g. Bayoumi, T., R. Harmsen and J. Turunen, Euro
area export performance and competitiveness, IMF Working Paper no. 11/140, June 2011.
lowered import growth and even import volumes. With export growth responding less substantially to the external environment, EU Member States in recession or with below-average growth received positive contributions to their GDP growth.
-9
-6
-3
0
3
6
9
-15
-10
-5
0
5
10
LU NL FI BE DE
AT FR EA IT IE SI CY MT ES SK PT EE EL
Current-account balance, average 1999-2008 (lhs)Current-account balance, 2010 (lhs)Expected change, avg. 2011-2013 versus 2010 (rhs)
% of GDP pps. of GDP
Graph I.28:Current-account balances, euro area and Member States
Compared to the pre-crisis situation, progress in reducing imbalances has been seen in many Member States, particularly in the euro area. Looking at more recent developments, many of those countries with a current-account deficit in 2010 were able to reduce the deficit in 2011. Among these countries are Spain and Portugal. The adjustment has been particularly strong where deficits had been very large at the start of the crisis (see Graph I.28). Data indicate that a strengthening of competitiveness in deficit countries tends to support the process. In the euro area in 2011, the largest declines in relative unit labour costs were seen in Spain, Ireland and Greece, which are expected to advance further in 2012-13. The surplus countries, for instance Germany, are moving in the opposite direction, recording increasing relative unit labour costs.
The increased consolidation efforts in EU Member States can also be expected to have exerted an impact on current accounts both inside and outside the euro area. Fiscal consolidation impacts on the current account via its effects on gross fixed capital formation and on the real effective exchange rate. In that respect, fiscal consolidation efforts contribute to the lowering of external imbalances in deficit countries.(29)
(29) For empirical evidence see Bluedorn, J. and D. Leigh,
Revisiting the twin deficits hypothesis: the effect of fiscal consolidation on the current account, IMF Economic Review, November 2011, Vol. 59, No. 4, pp. 582-602.

Economic developments at the aggregated level
35
Box I.3: Rebalancing needs still sizeable
Current-account rebalancing to date
The pre-crisis years in the EU and euro area saw diverging trends in the external positions of Member States. Those starting from lower per- capita income levels tended to attract larger net foreign capital inflows, but wider macroeconomic imbalances also emerged that went beyond standard convergence processes. These were driven by low real interest rates, booming credit growth, losses in competitiveness and excessive income expectations. The accumulation of large current-account deficits contributed to an erosion in these countries' net international investment position (IIP), compounded by valuation effects in some cases.(1) The associated external (re-)financing needs increased these Member States' exposure to the global crisis. The divergence in current-account positions within the EU was amplified by the accumulation of large surpluses in a few more advanced economies. This diverging trend was not sustainable and began to reverse in the wake of the crisis.
EU Member States are expected to further rebalance until the end of the forecast horizon (see Graph 1), suggested by the strong negative correlation between an economy's external position in 2007, which for many countries was a peak year in terms of the external balance, and the subsequent change in the deficit or surplus.
BE
BG
CZDK
DE
EE
IEEL ES
FR IT
CY
LV
LT
LU
HU
MTNL
AT
PLPTRO SISK
FISE
UK
y = -0.7333x + 1.2304R² = 0.8499
-10
-5
0
5
10
15
20
25
30
-30 -20 -10 0 10 20
Cur
rent
acc
ount
, 200
7-13
pps
. ch.
Current account, 2007, % GDP
Graph 1:Current-account adjustment, 2007-13, pps. of GDP
Especially large external adjustments are projected for high-deficit countries, notably Bulgaria and the Baltics. (1) Balta, N., Turrini, A. and G. Wolff, Special report –
Competitiveness developments in the euro area, Quarterly Report on the Euro Area, March 2009, No. 8, Vol. 1, pp. 18-48; and European Commission, Alert Mechanism Report, 2012.
Rebalancing needs and prospects
By the end of 2011, one group of countries, the 'early deficit adjusters', for instance Ireland,(2) had already made significant progress towards a balanced current account (see Graph 2). By distinguishing between the 2007-11 period and the forecast horizon 2012-13, a second group, the 'late deficit adjusters' including Greece, Spain and Portugal, can be identified.
-10
-5
0
5
10
15
20
25
30
BG LV EE LT HU EL ES RO IE PT SK SI CY DK
MT CZ UK PL IT NL FR AT BE SE DE FI LU
Graph 2:Phases of external rebalancing: changes in current account
2007-11 2012-13
pps. of GDP
For this group of countries, the rebalancing achieved so far is still sizeable but the process seems more back-loaded, with up to half of the adjustment expected to take place in the forecast years 2012-13. Finally, surplus countries such as Germany to some extent reduced their current-account surpluses until 2011, and some further rebalancing is expected over the forecast horizon.
In order to gauge the required extent of the adjustment, a current-account benchmark that stabilises net external debt (International investment positions—IIP) relative to GDP is estimated (see Graph 3). Compared with projected current-account balances in 2013, benchmark estimates show that, for some 'late deficit adjusters' in particular, rebalancing needs will still be sizeable at the end of the forecast horizon. By contrast, most early deficit adjusters, along with the surplus countries, are projected to reach or exceed their IIP-stabilising current account by 2013.
(2) In order to qualify as an 'early deficit adjuster' an
overall adjustment of at least 4 pps. of GDP has to be achieved, of which more than ¾ must have been completed by end-2011.
(Continued on the next page)

European Economic Forecast, Spring 2012
36
Box (continued)
-8
-6
-4
-2
0
2
4
6
8
CY EL RO PL CZ PT MT
LV FR LT IT UK ES FI EE BG SK SI BE
AT IE HU DE
LU DK SE NL
Graph 3:IIP stabilising current account
CA in 2013 IIP stabilising CA
% of GDP
But given the high level of external liabilities in several Member States, simply stabilising the IIP may not be enough and further current-account improvements may be needed to curb external debt.
External rebalancing and growth
In general, rebalancing processes featuring strong deleveraging in the private sector and fiscal consolidation weigh on growth. Since economic agents are forced to increase savings and cut investment, domestic demand in deficit countries is constrained and thus limits output expansion (see Graph 4). Differing external rebalancing needs, due to divergent pre-crisis current-account developments, have translated into persistent growth differentials across EU Member States, which are expected to continue over the forecast period.
BEBG CZ
DK
DEEE
IE
EL
ES
FR
IT
CY
LVLT
LU
HU
MT
NL
AT
PL
PT
RO
SI
SK
FI
SE
UK
y = 0.0498x + 0.1607R² = 0.211
-3
-2
-1
0
1
2
3
-35 -25 -15 -5 5 15
Av.
ann
ual G
DP
grow
th, 2
008-
13
Current account, 2007, % GDP
Graph 4:External rebalancing and growth
Trade developments
Deficit countries undergoing a rebalancing process need to boost exports and lower imports by reducing domestic demand. When comparing a
country's export market performance(3) in the post-crisis years (including the forecast horizon) with its starting current-account position in 2007, results suggest that countries with a high starting deficit are likely to embark on an adjustment path involving relatively strong export growth (see Graph 5).
BE
BG
CZ
DK
DE
EE
IE
EL
ES
FR
IT
CYLVLT
LU
HU
MT NL
ATPL
PTRO
SI
SK
FI
SEUK
y = -0.3055x + 3.0179R² = 0.3358
-10
-5
0
5
10
15
20
-30 -20 -10 0 10 20
% c
h. in
exp
ort m
arke
t per
form
ance
, 201
0-13
Current account, 2007, % GDP
Graph 5:Export market performance, 2010-13
Import growth typically co-moves with the expansion of domestic demand. But continued trade integration has also tended to increase the relative share of imports in domestic demand.(4) Countries with initially large external deficits might be expected to substitute domestically produced tradables for imports. The substitution may be the result of changes in relative prices or changes in demand patterns related to the adjustment process.
-25-20-15-10-505
10152025
BG EE LT LV RO HU SI SK IE EL CY ES PT BE NL
LU DE
AT FI SE UK
MT PL FR IT DK CZ
Early Late Surplus Others
Graph 6:Changes in ratio of imports to dom. demand, 2010-13 cumulative
Pre-crisis trend 2010-13 excess over trend
pps.
(3) For a given country A, export market performance is
calculated as A's exports of goods and services divided by an index for 35 industrial markets of their imports weighted by the respective bilateral trade weights with country A.
(4) As a rule of thumb, import content typically ranges from 25-50%, depending on the expenditure item.
(Continued on the next page)
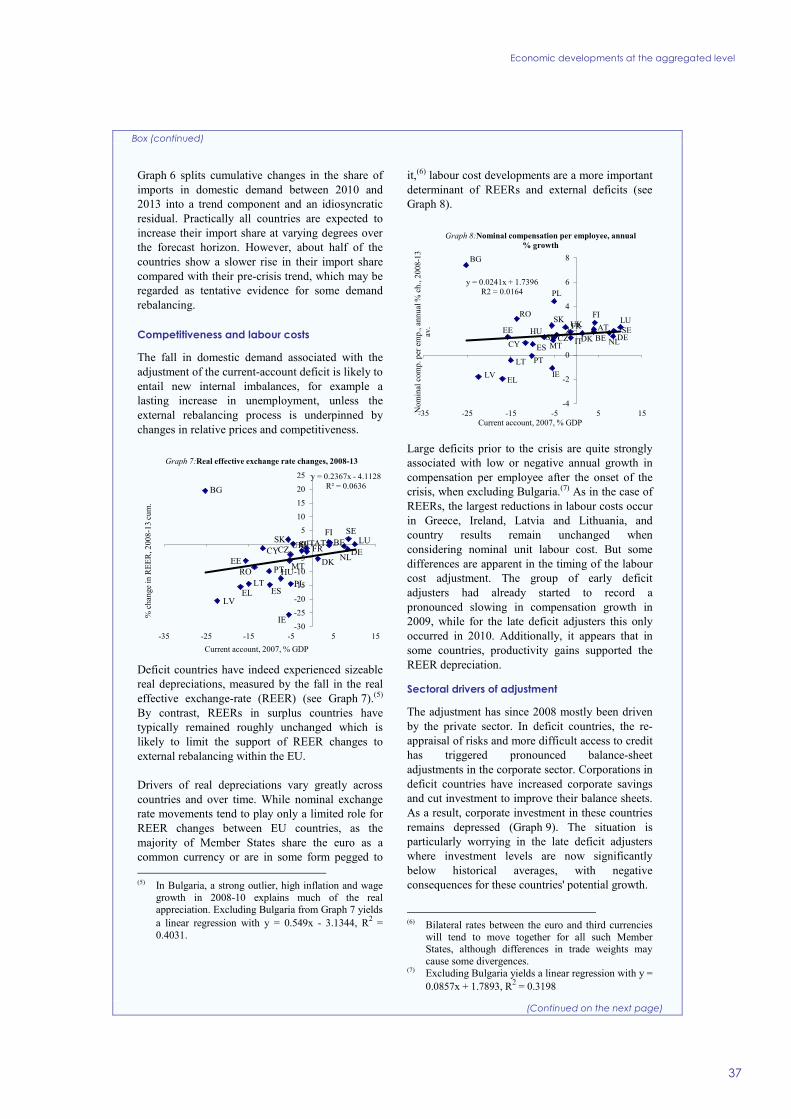
Economic developments at the aggregated level
37
Box (continued)
Graph 6 splits cumulative changes in the share of imports in domestic demand between 2010 and 2013 into a trend component and an idiosyncratic residual. Practically all countries are expected to increase their import share at varying degrees over the forecast horizon. However, about half of the countries show a slower rise in their import share compared with their pre-crisis trend, which may be regarded as tentative evidence for some demand rebalancing.
Competitiveness and labour costs
The fall in domestic demand associated with the adjustment of the current-account deficit is likely to entail new internal imbalances, for example a lasting increase in unemployment, unless the external rebalancing process is underpinned by changes in relative prices and competitiveness.
BE
BG
CZDK
DEEE
IE
EL ES
FRITCY
LV
LT
LU
HUMTNL
AT
PLPTRO
SISKFI SE
UK
y = 0.2367x - 4.1128R² = 0.0636
-30
-25
-20
-15
-10
-5
0
5
10
15
20
25
-35 -25 -15 -5 5 15
% c
hang
e in
REE
R, 2
008-
13 cu
m.
Current account, 2007, % GDP
Graph 7:Real effective exchange rate changes, 2008-13
Deficit countries have indeed experienced sizeable real depreciations, measured by the fall in the real effective exchange-rate (REER) (see Graph 7).(5) By contrast, REERs in surplus countries have typically remained roughly unchanged which is likely to limit the support of REER changes to external rebalancing within the EU.
Drivers of real depreciations vary greatly across countries and over time. While nominal exchange rate movements tend to play only a limited role for REER changes between EU countries, as the majority of Member States share the euro as a common currency or are in some form pegged to (5) In Bulgaria, a strong outlier, high inflation and wage
growth in 2008-10 explains much of the real appreciation. Excluding Bulgaria from Graph 7 yields a linear regression with y = 0.549x - 3.1344, R2 = 0.4031.
it,(6) labour cost developments are a more important determinant of REERs and external deficits (see Graph 8).
BE
BG
CZ DK DEEE
IEEL
ES
FR
ITCY
LVLT
LUHU
MT NL
AT
PL
PT
RO
SI
SK FI
SEUK
y = 0.0241x + 1.7396R2 = 0.0164
-4
-2
0
2
4
6
8
-35 -25 -15 -5 5 15Nom
inal
com
p. p
er e
mp.
, ann
ual %
ch.
, 200
8-13
av
.Current account, 2007, % GDP
Graph 8:Nominal compensation per employee, annual % growth
Large deficits prior to the crisis are quite strongly associated with low or negative annual growth in compensation per employee after the onset of the crisis, when excluding Bulgaria.(7) As in the case of REERs, the largest reductions in labour costs occur in Greece, Ireland, Latvia and Lithuania, and country results remain unchanged when considering nominal unit labour cost. But some differences are apparent in the timing of the labour cost adjustment. The group of early deficit adjusters had already started to record a pronounced slowing in compensation growth in 2009, while for the late deficit adjusters this only occurred in 2010. Additionally, it appears that in some countries, productivity gains supported the REER depreciation.
Sectoral drivers of adjustment
The adjustment has since 2008 mostly been driven by the private sector. In deficit countries, the re-appraisal of risks and more difficult access to credit has triggered pronounced balance-sheet adjustments in the corporate sector. Corporations in deficit countries have increased corporate savings and cut investment to improve their balance sheets. As a result, corporate investment in these countries remains depressed (Graph 9). The situation is particularly worrying in the late deficit adjusters where investment levels are now significantly below historical averages, with negative consequences for these countries' potential growth.
(6) Bilateral rates between the euro and third currencies
will tend to move together for all such Member States, although differences in trade weights may cause some divergences.
(7) Excluding Bulgaria yields a linear regression with y = 0.0857x + 1.7893, R2 = 0.3198
(Continued on the next page)

European Economic Forecast, Spring 2012
38
Box (continued)
8
13
18
23
02 03 04 05 06 07 08 09 10 11 12 13
Graph 9:Corporate sector gross capital formation
Early deficit adjustersLate deficit adjustersSurplus countries
% of GDP
forecast
On the household side, balance-sheet adjustment in deficit countries has been achieved primarily via cuts in investment rather than by rises in savings. Considering that household investment is mainly in housing and that many of these countries went through a period of overshooting in residential investment in pre-crisis years, this development may be seen as positive.
Overall, adjustment in the private sector has been associated with a substantial rise in private sector net lending. For most late deficit adjusters, some additional (though modest) gains in private sector net lending should contribute to reduce current-account deficits further over the forecast horizon. In surplus countries, private sector net lending increased in the early stages of the crisis, but has since eased back moderately, reflecting more limited balance sheet adjustment needs; this trend is forecast to continue in 2012-13, contributing to a reduction in current-account surpluses. Households' net lending in deficit countries is projected to decrease somewhat over the forecast period.
The contribution of the public sector to external rebalancing has so far been modest, starting only after 2010 as a result of a relatively stronger public finance consolidation in deficit countries.
Overall assessment
In summary, the analysis suggests that considerable rebalancing of external positions has taken place in recent years within the EU and that the trend is likely to continue over the forecast horizon, though at an overall moderate pace. In particular, 'late deficit adjusters' are not expected to have their rebalancing process completed at the end of the forecast period. The adjustment of external imbalances was initially driven by the balance-sheet adjustment in the private sector of deficit countries, with a particularly sharp and rapid correction in some Member States, mostly outside
the euro area. There is now evidence that some surplus countries have begun to contribute to the rebalancing as well, although falls in current-account surpluses should remain relatively limited in 2012-13.
Given that current accounts tend to be strongly affected by cyclical fluctuations, it is difficult to disentangle their structural and cyclical drivers. However, a number of factors suggest that at least part of the observed rebalancing is of a more structural nature and therefore relatively persistent.
Firstly, needs in terms of public sector consolidation are generally higher in deficit than in surplus countries. Differentiated consolidation paths will continue to be a bigger constraint on net borrowing in the former than in the latter in the years to come, contributing to the persistence of the rebalancing.
Secondly, the on-going balance-sheet adjustment processes in the private sectors of deficit countries is at least partly driven by a change in risk attitudes and a reassessment of growth prospects in the countries concerned. Given the high level of external liabilities in most of these countries, market pressure for rebalancing should remain high in the years to come and a reversal of the balance-sheet adjustment appears unlikely.
Thirdly, adjustment in deficit countries has been in part achieved by cutting housing investment. To the extent that this cut is a correction to the overshooting in investment observed in pre-crisis years, it is both a welcome and possibly lasting development.
Finally, there is some evidence that the current-account rebalancing is underpinned by changes in relative prices and competitiveness positions as well as gains in export market shares and expenditure switching in deficit countries. These changes are expected to contribute to a rebalancing of supply and demand in the countries concerned and therefore make the external adjustment more sustainable.

Economic developments at the aggregated level
39
Looking ahead, the outlook for moderate economic growth suggests that import demand will remain rather weak in the EU Member States. All Member States with positive import growth in 2011 (except Finland and the UK) are expected to record lower growth rates of imports of goods and services in 2012. This supports countries with external deficits on their path of rebalancing. In that regard, cyclical reasons have become an important driver of rebalancing in the short- to medium term.(30) The current-account forecasts for 2012 and 2013 point to an on-going adjustment of intra-EU current-account imbalances.
In several Member States outside the euro area, exchange rates are the key to rebalancing the economies away from housing and consumption towards industry and exports. However, the structural change that this transition requires is taking time.(31)
The labour market situation has recently deteriorated...
Current labour market developments reflect both the heritage of the 2008-09 recession and the stagnation of 2011-12. Improvements during the early stages of the 2009-11 recovery had been limited, mirroring the exceptional resilience of European labour markets during the downturn in 2008-09. Since companies had adjusted their labour input by reducing the number of hours worked per employee rather than cutting headcounts, the expansion first saw a normalisation in terms of working hours but no or only marginal employment growth. The deviation from the standard relationship between changes in economic growth and unemployment, often referred to as Okun's Law, implied that more economic growth than usual was needed to lower the unemployment rate. Little progress was therefore made in terms of job creation when the economic situation started to deteriorate in the second half of last year.
(30) This current-account dynamics imply a deviation from pre-
crisis patterns as for instance described in Schmitz, B. and J. von Hagen, Current account imbalances and financial integration in the euro area, Journal of International Money and Finance, December 2011, Vol. 30, No. 8, pp. 1676-95.
(31) Moreover, empirical studies suggest that the responsiveness of exports and imports has declined over time, see e.g. Dong, W., The role of expenditure switching in the global imbalance adjustment, Journal of International Economics, March 2012, Vol. 86, No. 2, pp. 237-51.
Employment fell in the third and fourth quarter of 2011, in the EU and in the euro area. In parallel, unemployment has increased. In February 2012 the unemployment rate stood at 10.2% in the EU and 10.8% in the euro area, which was about ¾ pp. higher than a year ago and the highest since the introduction of the euro in 1999.
... and future improvements hinge on the strength and timing of the recovery …
Forward-looking labour market indicators suggest that the near-term outlook for the labour market is rather weak, as the return to recession is exerting significant upward pressure on the unemployment rate. And the uncertainty surrounding the economic outlook is making companies reluctant to reverse layoffs. Accordingly, in the Commission surveys, employment expectations in the EU industry and services sectors declined towards the end of 2011 and remained at low levels in the first quarter of 2012 (see Graph I.29). Consumers' unemployment fears have increased and continue to exceed long-term averages. The PMI employment index, standing below the 50-point threshold in the first three months of 2012, confirms this picture for the EU and the euro area. What further weighs on prospects for employment is the limited scope for the kind of supportive policy measures that upheld the EU labour market during the previous downturn. In addition, public-sector employment may be reduced in some Member States.
-50
-40
-30
-20
-10
0
10
20
07 08 09 10 11 12
-10010203040506070
Employment exp. in industry, next 3 months (lhs)Employment exp. in services, next 3 months (lhs)Consumers' unempl. exp., next 12 months (inverted, rhs)
Graph I.29: Employment expectations, DG ECFIN surveys, euro area
level level
Overall, the deterioration in the economic outlook results in downward revisions to the labour market forecasts for 2012. Employment is now expected to shrink in the EU (-0.2%) and the euro area (-0.5%), while the unemployment rate is expected to increase markedly in both areas (compared with
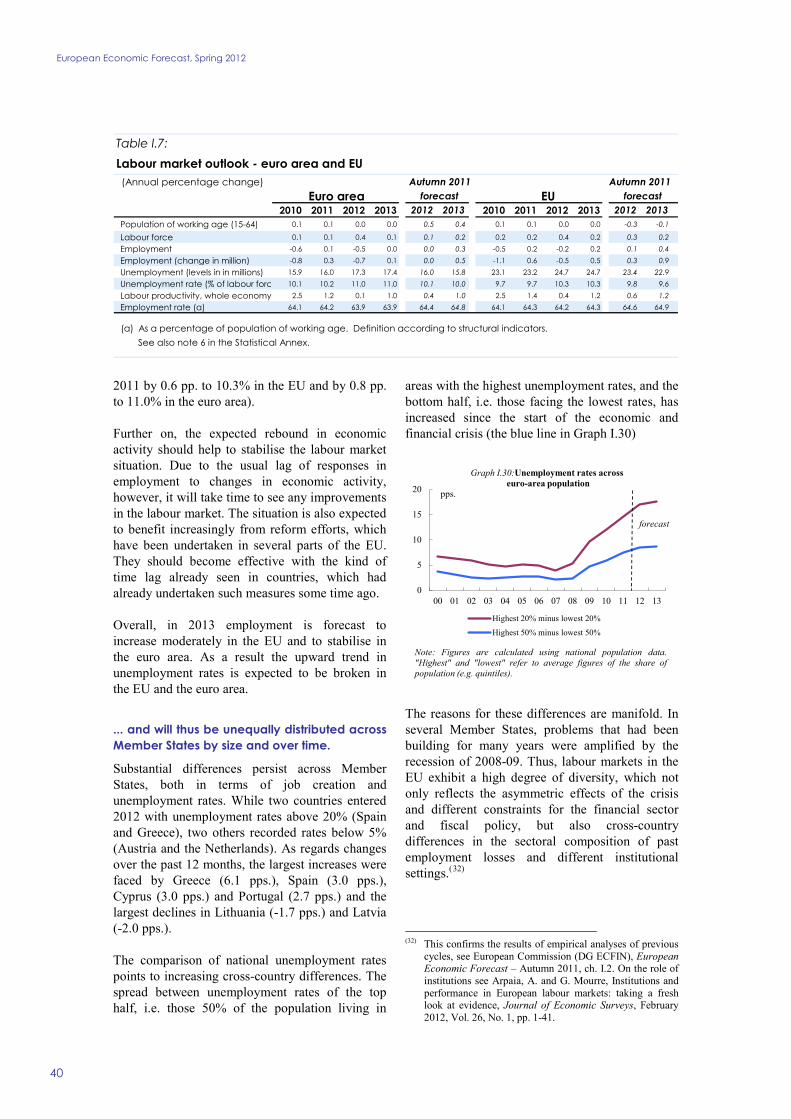
European Economic Forecast, Spring 2012
40
2011 by 0.6 pp. to 10.3% in the EU and by 0.8 pp. to 11.0% in the euro area).
Further on, the expected rebound in economic activity should help to stabilise the labour market situation. Due to the usual lag of responses in employment to changes in economic activity, however, it will take time to see any improvements in the labour market. The situation is also expected to benefit increasingly from reform efforts, which have been undertaken in several parts of the EU. They should become effective with the kind of time lag already seen in countries, which had already undertaken such measures some time ago.
Overall, in 2013 employment is forecast to increase moderately in the EU and to stabilise in the euro area. As a result the upward trend in unemployment rates is expected to be broken in the EU and the euro area.
... and will thus be unequally distributed across Member States by size and over time.
Substantial differences persist across Member States, both in terms of job creation and unemployment rates. While two countries entered 2012 with unemployment rates above 20% (Spain and Greece), two others recorded rates below 5% (Austria and the Netherlands). As regards changes over the past 12 months, the largest increases were faced by Greece (6.1 pps.), Spain (3.0 pps.), Cyprus (3.0 pps.) and Portugal (2.7 pps.) and the largest declines in Lithuania (-1.7 pps.) and Latvia (-2.0 pps.).
The comparison of national unemployment rates points to increasing cross-country differences. The spread between unemployment rates of the top half, i.e. those 50% of the population living in
areas with the highest unemployment rates, and the bottom half, i.e. those facing the lowest rates, has increased since the start of the economic and financial crisis (the blue line in Graph I.30)
0
5
10
15
20
00 01 02 03 04 05 06 07 08 09 10 11 12 13
Highest 20% minus lowest 20%
Highest 50% minus lowest 50%
Graph I.30:Unemployment rates acrosseuro-area population
pps.
Note: Figures are calculated using national population data."Highest" and "lowest" refer to average figures of the share ofpopulation (e.g. quintiles).
forecast
The reasons for these differences are manifold. In several Member States, problems that had been building for many years were amplified by the recession of 2008-09. Thus, labour markets in the EU exhibit a high degree of diversity, which not only reflects the asymmetric effects of the crisis and different constraints for the financial sector and fiscal policy, but also cross-country differences in the sectoral composition of past employment losses and different institutional settings.(32)
(32) This confirms the results of empirical analyses of previous
cycles, see European Commission (DG ECFIN), European Economic Forecast – Autumn 2011, ch. I.2. On the role of institutions see Arpaia, A. and G. Mourre, Institutions and performance in European labour markets: taking a fresh look at evidence, Journal of Economic Surveys, February 2012, Vol. 26, No. 1, pp. 1-41.
Table I.7:Labour market outlook - euro area and EU (Annual percentage change) Autumn 2011 Autumn 2011
Euro area forecast EU forecast2010 2011 2012 2013 2012 2013 2010 2011 2012 2013 2012 2013
Population of working age (15-64) 0.1 0.1 0.0 0.0 0.5 0.4 0.1 0.1 0.0 0.0 -0.3 -0.1
Labour force 0.1 0.1 0.4 0.1 0.1 0.2 0.2 0.2 0.4 0.2 0.3 0.2 Employment -0.6 0.1 -0.5 0.0 0.0 0.3 -0.5 0.2 -0.2 0.2 0.1 0.4 Employment (change in million) -0.8 0.3 -0.7 0.1 0.0 0.5 -1.1 0.6 -0.5 0.5 0.3 0.9 Unemployment (levels in in millions) 15.9 16.0 17.3 17.4 16.0 15.8 23.1 23.2 24.7 24.7 23.4 22.9 Unemployment rate (% of labour forc 10.1 10.2 11.0 11.0 10.1 10.0 9.7 9.7 10.3 10.3 9.8 9.6 Labour productivity, whole economy 2.5 1.2 0.1 1.0 0.4 1.0 2.5 1.4 0.4 1.2 0.6 1.2 Employment rate (a) 64.1 64.2 63.9 63.9 64.4 64.8 64.1 64.3 64.2 64.3 64.6 64.9
(a) As a percentage of population of working age. Definition according to structural indicators. See also note 6 in the Statistical Annex.

Economic developments at the aggregated level
41
In general, the countries hit by the bursting of housing bubbles and/or where adjustment needs are amplified by external and fiscal imbalances are those where job losses were the most severe. The deterioration in labour market conditions caused by the 2008-09 recession had been particularly severe in the Baltic countries, Spain and Ireland, where the construction sector made a significant contribution to peak-to-trough employment losses. In particular, unemployment has persisted in countries facing large structural adjustments associated with a reduction in the size of non-tradable sectors, such as construction, real estate and the financial sector.
The 2009-11 recovery has helped to reduce labour market problems, but due to different recovery speeds there have been substantial differences in unemployment rate falls since the recession. Overall, the recovery has not been vigorous enough to rebuild employment, so that most countries, particularly those with less flexible labour markets,(33) entered the current recession in rather weak shape.
In 2012, the weak economic performance is expected to slow employment growth in all Member States that had recorded expansion in 2011, except Hungary, Romania, and the UK. In more than half of the Member States the unemployment rate is forecast to increase in 2012, with eight Member States recording an increase of more than ½ pp.
Further on, in 2013 all Member States except Greece, Spain, Italy, the Netherlands, Bulgaria, Finland, and Slovenia are expected to achieve positive rates of employment growth. While unemployment rates are expected to fall in 2013 in a majority of Member States, all except Germany, Austria, Malta and Poland will record higher unemployment rates than in 2007.
Import prices and labour costs expected to exert limited pressure on producer prices.
Increases in commodity prices, most notably in the first months of last year, were a major driver of inflationary pressures in the EU economy in 2011. Developments in commodity prices pushed import prices (as measured by the deflator of imports of
(33) See e.g. Bernal-Verdugo, L. E., D. Furceri and D.
Guillaume, Crises, labor market policy, and unemployment, IMF Working Paper no. 12/65, March 2012.
goods and services) to an annual rate of 5.6% in the EU (5.8% in the euro area). Going forward, the assumed stabilisation in commodity prices around current levels should lower import price increases to about 3¾% in 2012 and 1½% in 2013 in the EU (3¼% and 1½% in the euro area).
The stabilisation in labour markets in the first half of 2011 resulted in a moderate increase in labour costs, including wages per employee (2.2% in both the EU and the euro area). The euro-area index of negotiated wages, which captures the main component of wages settled in advance through collective agreements, increased by 2.0% in 2011.
Nominal compensation per employee is expected to grow at annual rates of about 2% in 2012 and 2013 (see Table I.8). With non-wage labour costs growing at almost the same rate, labour-cost pressures should remain well contained over the forecast horizon. After having increased last year by about 1½% in the EU (1¼% in the euro area), labour productivity is expected to increase only modestly this year before rebounding in 2013 in the EU (½% and 1¼% respectively) and in the euro area (0% and 1%). This implies stronger increases in nominal unit labour costs in 2012, whereas real unit labour costs will almost stagnate given price developments. The magnitude of the expected decline in unit labour costs in 2013 will depend on the degree of persistence of slow productivity growth once economic growth gains traction again.
-20
-15
-10
-5
0
5
10
15
20
25
07 08 09 10 11 12
Total Energy
Graph I.31:Industrial producer prices, euro area
y-o-y%
As regards profit margins, corporate profit growth slowed as the economic environment deteriorated towards the end of 2011. In 2012, the combination of only moderate increases in gross value added, higher taxes on products and labour costs is expected to lower the gross operating surplus

European Economic Forecast, Spring 2012
42
before it rebounds in 2013 as economic growth builds up again.
Against the background of easing import prices, moderating energy prices and well-contained labour-cost developments, price pressures on producers have diminished more recently and producer-price inflation has been falling (see Graph I.31).
The future pass-through of previous price pressures, down the supply chain and finally to consumer prices, will depend on the pricing power of manufacturers, which is closely associated with the amount of spare capacity. Going forward, data from the Commission surveys on selling price expectations in manufacturing point to increasing pressures on margins. This reduced pricing power is confirmed by recent changes in the ratio of input and output price components in the PMI (see Graph I.32).
30
40
50
60
70
10
20
30
40
50
60
70
80
90
07 08 09 10 11 12
Graph I.32:PMI manufacturing input prices and output prices, EU
PMI manufacturing input prices (lhs)PMI manufacturing output prices (rhs)
balance balance
A look at PMI data at the Member State level indicates that the pressure on margins has increased in particular in Italy, Spain, Greece and Ireland, where the difference between input and output price components increased rapidly in the
first months of 2012, whereas the increase was less pronounced in Germany and France.
Consumer-price inflation has surprised on the upside in 2011, …
In 2011, consumer prices were strongly affected by volatile but overall rising global commodity prices and, in some Member States, by increases in indirect taxes and administered prices. These factors pushed HICP inflation rates temporarily above 3% and contributed to annual rates of 3.1% in the EU and 2.7% in the euro area (see Graph I.33). In the first quarter of 2012, HICP inflation stood at 2.9% in the EU and 2.7% in the euro area.
859095100105110115120125
-0.50.51.52.53.54.55.56.57.5
05 06 07 08 09 10 11 12 13
HICP inflation (annual rate) (lhs)HICP index (monthly) (rhs)HICP index (annual) (rhs)
Graph I.33:HICP, euro area
forecast
% index, 2005=100
2.22.1
3.3 0.3 1.62.7
2.2
Figures above horizontal bars are annual inflation rates.
1.82.4
The importance of commodity prices, most notably oil, is reflected in the contribution of energy prices to headline inflation, which was about 1.3 pps. in the EU and 1.2 pps. in the euro area (see Graph I.37) in 2011. While initially only those HICP sub-components that are most closely linked to oil prices were affected, other energy subcomponents (e.g. gas and electricity) have followed throughout the year.
Table I.8:
Inflation outlook - euro area and EU (Annual percentage change) Autumn 2011 Autumn 2011
Euro area forecast EU forecast2010 2011 2012 2013 2012 2013 2010 2011 2012 2013 2012 2013
Private consumption deflator 1.7 2.5 2.2 1.7 1.6 1.6 2.2 2.8 2.4 1.8 1.9 1.7
GDP deflator 0.7 1.3 1.6 1.7 1.6 1.6 1.1 1.6 1.8 1.8 1.8 1.8 HICP 1.6 2.7 2.4 1.8 1.7 1.6 2.1 3.1 2.6 1.9 2.0 1.8 Compensation per employee 1.7 2.2 1.9 1.9 2.0 2.0 2.3 2.2 2.1 2.1 2.2 2.3 Unit labour costs -0.8 0.8 1.6 0.8 1.4 0.9 -0.4 0.9 1.8 1.0 1.7 1.2 Import prices of goods 5.7 6.9 3.6 1.3 1.9 1.4 5.2 6.8 3.6 1.3 2.0 1.5

Economic developments at the aggregated level
43
The initial impact of higher international food commodity prices in the first half of 2011 subsided in the second half of the year. But the pass-through continued and food-price inflation in the year as a whole stood at 3.2% in the EU (2.3% in the euro area), with the highest increases in commodity-intensive items such as dairy products, coffee and tea. Due to base effects, the impact of past agricultural commodity price increases should also dissipate over the forecast horizon.
… increasingly affected by fiscal measures, …
Towards the end of 2011, the impact of fiscal consolidation measures became more clearly visible. Increased indirect taxes and administered prices accounted for a measurable part of inflationary pressures, while other domestic inflationary forces remained rather moderate. In the year as a whole, increases in tax rates added about ½ pp. to EU headline inflation. In particular, rises in VAT such as in the UK added to headline inflation. In December 2011 (latest available data) the HICP at constant tax rates (HICP-CT) stood at 2.6% in the EU and 2.5% in the euro area, thus 0.5 pp. and 0.2 pp. below the headline rate (see Graph I.34).
0
1
2
3
4
5
07 08 09 10 11 12
%
HICP HICP-CT* Core inflation
Graph I.34: Headline, core and constant-tax* inflation, EU
* HICP-CT = inflation at constant taxes. The difference betweenHICP and HICP-CT inflation rates points to the theoretical impactof changes in indirect taxes (e.g. VAT and excise duties) on overallHICP inflation, assuming an instantaneous pass-through of tax ratechanges on prices paid by the consumer.
Tax measures impacted on both headline and core inflation. Following the acceleration in core inflation in 2011 to an annual rate of 2.2% in the EU (1.7% in the euro area), annual core inflation remained almost stable in the first quarter of 2012. The expected temporary pick-up in unit labour costs in the EU and the euro area suggests that core inflation will remain more stable over the forecast horizon than headline inflation, which is expected to decline gradually (see Graph I.35).
Graph I.35: Inflation breakdown, EU
-1
0
1
2
3
4
5
07 08 09 10 11 12 13
%
Energy and unprocessed foodOther components (core inflation)HICP, all items
forecast
... but with headwinds fading, inflation is bound to abate gradually over the forecast horizon …
The easing in commodity prices towards the end of this year, in line with the futures-based assumptions (see Box I.5), and relatively weak economic activity, should lower consumer-price inflation. This would be consistent with data from surveys which track price expectations and which point to easing consumer-price inflation. The Commission's Consumer Survey showed that inflation expectations (over the coming 12 months) remained close to their long-term averages, both in the EU and the euro area. Market-based inflation expectations for the medium- to long term point to an easing of inflation going forward. However, in times of continued financial-market turbulences, these indicators should be interpreted with caution.
Further on, headline inflation is expected to decline, owing to the fall in energy inflation, reflecting base effects related to oil price hikes in early 2011. The slowing in economic activity is likely to increase the slack in the economy, constrain wage increases and lower the price-setting power of producers, while the weakness of private consumption will limit the price-setting power of retailers. Therefore, at the current juncture the risk of second-round effects appears to be rather limited.
The return to subdued economic growth in late 2012 and 2013 is not expected to add any substantial inflationary pressure, in particular since output gaps are only closing very slowly in the EU and the euro area. HICP headline inflation is forecast to stay close to 2% in 2013 (1.9% in the EU, 1.8% in the euro area) and thus to be in line with inflation expectations, for instance in the ECB's Survey of Professional Forecasters. In 2013,

European Economic Forecast, Spring 2012
44
core inflation, despite some distortion from increases in indirect taxes and administered prices, will move in parallel.
Graph I.36: Inflation expectations, euro area
-0.5
0.0
0.5
1.0
1.5
2.0
2.5
3.0
07 08 09 10 11 12-18-12-60612182430
Consumer inflation expectations, DG ECFIN (rhs)
Implied inflation expectations (lhs)
y-o-y % balance
Note: Implied expectations derived from inflation-indexedgovernment bonds, 10 -year horizon.
This HICP inflation forecast for 2013, however, is based on the no-policy-change assumption that is applied where measures are not known or sufficiently specified for being taken into account. This could imply that the forecast ignores increases in indirect taxes and administered prices, which might exert temporary effects on headline HICP inflation, and which could then result in higher rates than currently forecast for 2013.
... with slightly less inflation dispersion across Member States.
The EU and euro-area aggregates conceal substantial inflation differences across EU Member States, which were in 2011 sometimes exacerbated by increases in indirect taxes and differences in the impact of higher oil prices (see Graph I.37).
0.0
0.5
1.0
1.5
2.0
2.5
LV LT RO SK LU HU IE DE FI UK DK CZ NL SE
Contribution beyond item weightContribution according to item weight
Graph I.37: Contribution of energy inflation to headline inflation, EU and Member States (2011)
Contribution of energy inflation to EU headline inflation
pps.
BE ES PT CY EL PL SI EE FR BG AT IT MT
The standard deviation of national HICP inflation rates, a measure of inflation dispersion, declined in 2011 in the EU and the euro area and is expected to decline further over the forecast horizon. By contrast, a population-based dispersion measure, the difference between inflation rates faced by different shares of the European population points to increased differences in the euro area in 2012 (see Graph I.38).
0
1
2
3
00 01 02 03 04 05 06 07 08 09 10 11 12 13
Highest 20% minus lowest 20%Highest 50% minus lowest 50%
Graph I.38:HICP inflation across euro-area population
pps.
Note: Figures are calculated using national population data."Highest" and "lowest" refer to average figures of the share ofpopulation (e.g. quintiles) as indicated in the legend.
forecast
Public finances continue to improve …
Public finance developments in the euro area and the EU continue to be characterised by the fiscal exit strategy put in place after the 2008-09 recession. In line with the Council conclusions first issued in 2009 and subsequently reiterated in 2011 and in early 2012, the key objective of the fiscal exit strategy is to bring public finances back to a sustainable path within the context of the EU fiscal rules (see Box I.4). Fiscal consolidation efforts, which started in 2010, intensified in 2011 and led to a significant improvement in public finance conditions in both the euro area and in the EU. The economic cycle, which was still supportive in the first half of 2011, also contributed positively to this improvement.
… mainly on the back of fiscal consolidation measures.
Compared with the 2011 autumn forecast, the outlook for budget balances is broadly unchanged at the aggregate level. Against a backdrop of a temporary weakening in 2012 and a prospective gradual economic recovery in 2013, as well as planned and adopted fiscal consolidation measures across Member States, the declining trend in budget deficits is expected to continue over the forecast horizon (see Graph I.39).
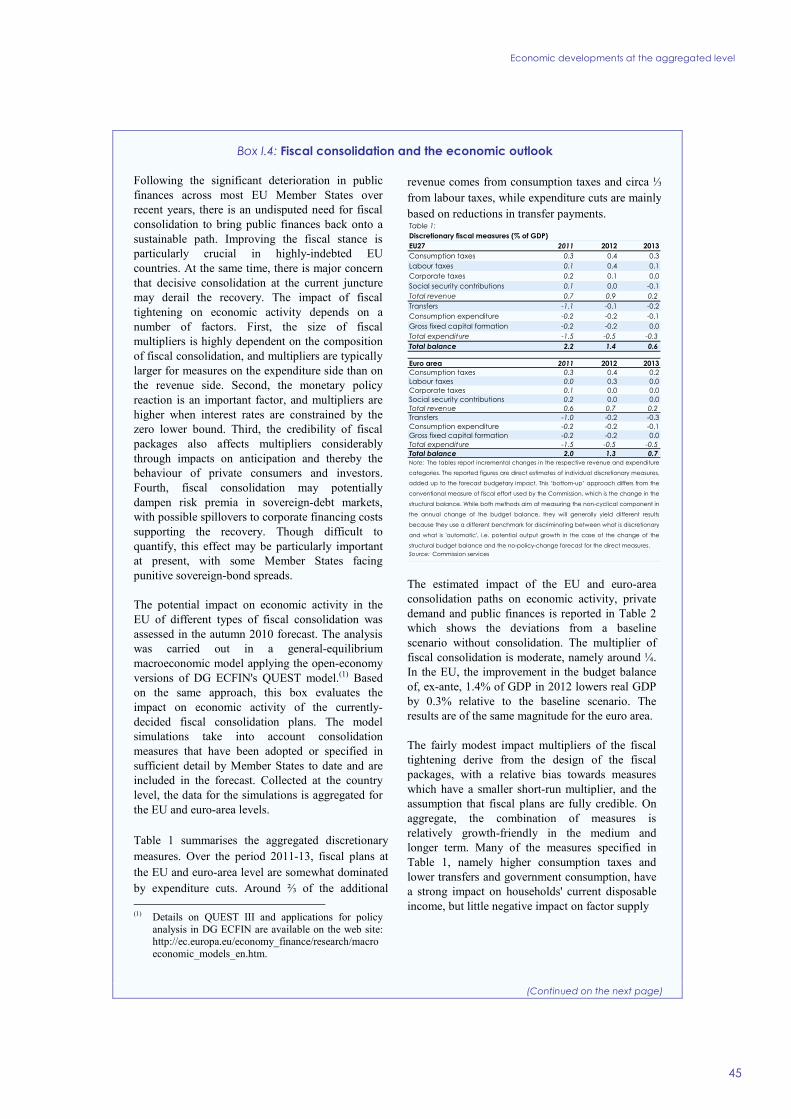
Economic developments at the aggregated level
45
Box I.4: Fiscal consolidation and the economic outlook
Following the significant deterioration in public finances across most EU Member States over recent years, there is an undisputed need for fiscal consolidation to bring public finances back onto a sustainable path. Improving the fiscal stance is particularly crucial in highly-indebted EU countries. At the same time, there is major concern that decisive consolidation at the current juncture may derail the recovery. The impact of fiscal tightening on economic activity depends on a number of factors. First, the size of fiscal multipliers is highly dependent on the composition of fiscal consolidation, and multipliers are typically larger for measures on the expenditure side than on the revenue side. Second, the monetary policy reaction is an important factor, and multipliers are higher when interest rates are constrained by the zero lower bound. Third, the credibility of fiscal packages also affects multipliers considerably through impacts on anticipation and thereby the behaviour of private consumers and investors. Fourth, fiscal consolidation may potentially dampen risk premia in sovereign-debt markets, with possible spillovers to corporate financing costs supporting the recovery. Though difficult to quantify, this effect may be particularly important at present, with some Member States facing punitive sovereign-bond spreads.
The potential impact on economic activity in the EU of different types of fiscal consolidation was assessed in the autumn 2010 forecast. The analysis was carried out in a general-equilibrium macroeconomic model applying the open-economy versions of DG ECFIN's QUEST model.(1) Based on the same approach, this box evaluates the impact on economic activity of the currently-decided fiscal consolidation plans. The model simulations take into account consolidation measures that have been adopted or specified in sufficient detail by Member States to date and are included in the forecast. Collected at the country level, the data for the simulations is aggregated for the EU and euro-area levels.
Table 1 summarises the aggregated discretionary measures. Over the period 2011-13, fiscal plans at the EU and euro-area level are somewhat dominated by expenditure cuts. Around ⅔ of the additional (1) Details on QUEST III and applications for policy
analysis in DG ECFIN are available on the web site: http://ec.europa.eu/economy_finance/research/macroeconomic_models_en.htm.
revenue comes from consumption taxes and circa ⅓ from labour taxes, while expenditure cuts are mainly based on reductions in transfer payments. Table 1:
EU27 2011 2012 2013Consumption taxes 0.3 0.4 0.3Labour taxes 0.1 0.4 0.1Corporate taxes 0.2 0.1 0.0Social security contributions 0.1 0.0 -0.1Total revenue 0.7 0.9 0.2Transfers -1.1 -0.1 -0.2Consumption expenditure -0.2 -0.2 -0.1Gross fixed capital formation -0.2 -0.2 0.0Total expenditure -1.5 -0.5 -0.3Total balance 2.2 1.4 0.6
Euro area 2011 2012 2013Consumption taxes 0.3 0.4 0.2Labour taxes 0.0 0.3 0.0Corporate taxes 0.1 0.0 0.0Social security contributions 0.2 0.0 0.0Total revenue 0.6 0.7 0.2Transfers -1.0 -0.2 -0.3Consumption expenditure -0.2 -0.2 -0.1Gross fixed capital formation -0.2 -0.2 0.0Total expenditure -1.5 -0.5 -0.5Total balance 2.0 1.3 0.7
Source: Commission services
Note: The tables report incremental changes in the respective revenue and expenditure
categories. The reported figures are direct estimates of individual discretionary measures,
added up to the forecast budgetary impact. This ‘bottom-up’ approach differs from the
conventional measure of fiscal effort used by the Commission, which is the change in the
structural balance. While both methods aim at measuring the non-cyclical component in
the annual change of the budget balance, they will generally yield different results
because they use a different benchmark for discriminating between what is discretionary
and what is 'automatic', i.e. potential output growth in the case of the change of the
structural budget balance and the no-policy-change forecast for the direct measures.
Discretionary fiscal measures (% of GDP)
The estimated impact of the EU and euro-area consolidation paths on economic activity, private demand and public finances is reported in Table 2 which shows the deviations from a baseline scenario without consolidation. The multiplier of fiscal consolidation is moderate, namely around ¼. In the EU, the improvement in the budget balance of, ex-ante, 1.4% of GDP in 2012 lowers real GDP by 0.3% relative to the baseline scenario. The results are of the same magnitude for the euro area.
The fairly modest impact multipliers of the fiscal tightening derive from the design of the fiscal packages, with a relative bias towards measures which have a smaller short-run multiplier, and the assumption that fiscal plans are fully credible. On aggregate, the combination of measures is relatively growth-friendly in the medium and longer term. Many of the measures specified in Table 1, namely higher consumption taxes and lower transfers and government consumption, have a strong impact on households' current disposable income, but little negative impact on factor supply
(Continued on the next page)

European Economic Forecast, Spring 2012
46
Box (continued)
Table 2:Impact of fiscal measures 2012-16, deviations from baselineEU27 2012 2013 2014 2015 2016GDP (%) -0.3 -0.6 -0.6 -0.7 -0.8Employment (%) -0.3 -0.5 -0.5 -0.5 -0.6Consumption (%) -0.3 -0.5 -0.7 -0.8 -0.9Investment (%) 0.3 0.7 0.8 0.9 1.0Exports (%) 0.8 0.9 0.8 0.7 0.5Imports (%) -1.1 -1.5 -1.5 -1.5 -1.4Terms of trade (%) -0.8 -0.8 -0.7 -0.6 -0.5Gov. debt/GDP (pp.) -0.5 -1.8 -3.5 -5.2 -6.9Gov. balance/GDP (pp.) 1.2 1.8 1.9 2.0 2.1
Euro area 2012 2013 2014 2015 2016GDP (%) -0.3 -0.5 -0.5 -0.6 -0.6Employment (%) -0.2 -0.4 -0.4 -0.4 -0.4Consumption (%) -0.2 -0.5 -0.6 -0.7 -0.8Investment (%) 0.3 0.6 0.8 1.0 1.1Exports (%) 0.8 0.9 0.9 0.8 0.7Imports (%) -1.1 -1.5 -1.5 -1.5 -1.4Terms of trade (%) -0.8 -0.9 -0.8 -0.7 -0.6Gov. debt/GDP (pp.) -0.5 -1.8 -3.5 -5.2 -7.0Gov. balance/GDP (pp.) 1.1 1.8 1.9 2.0 2.1
Source: Commission services
Note: The simulations assume fiscal plans as specified in Table 1. The plans are assumed to be perfectly credible. % and pp denote percentage and percentage-point deviations from baseline, respectively.
and potential output, compared with, e.g. rising taxes on labour and corporate income or lower government gross fixed capital formation.(2)
In the reference scenario (credibility) fiscal plans for 2012-13 are perfectly credible ex ante. Full credibility of the consolidation plans is crucial for the size of fiscal multipliers, as private households and firms take the fiscal plans and the impact of lower debt on future tax liabilities and disposable income fully into account when making consumption, employment and investment choices, implying a stabilisation in private demand. Furthermore, the intertemporally-optimising consumers bring durable consumption demand forward when consumption taxes are expected to increase.
An additional assumption underlying the small multiplier results is that monetary accommodation cushions the GDP impact of fiscal contraction by stimulating private demand, i.e. that interest rates are not constrained by the zero bound. Introducing a binding zero-bound constraint (ZLB) on nominal interest rates for 2012 more than doubles the impact multiplier of the EU and euro-area consolidation package from ¼ to 0.5-0.6 in the credibility scenario (Graph 1).
Other factors also influence the GDP effect of fiscal consolidation. An alternative scenario (learning), where the credibility assumption has been relaxed, illustrates the importance of (2) In-depth analysis of the specific impact of different
revenue and expenditure items on economic activity can be found in the chapter I.2 "The impact of fiscal consolidation on Europe's economic outlook" of European Commission, European Economic Forecast - Autumn 2010, European Economy 7/2010.
credibility for fiscal multipliers. This scenario assumes that fiscal plans are not credible per se. Rather credibility has to be established by action. More precisely, the scenario assumes that private households and firms in 2012 question the governments' commitment to consolidation and, therefore, consider the fiscal measures in 2012 to be only of temporary nature. The private agents change their beliefs in 2013 as the fiscal measures of 2012 remain in place and new measures are added. Hence, the continuation of the consolidation in 2013 creates political credibility.
Graph 1 shows that in the learning scenario, the lack of political credibility substantially enhances the initial impact of fiscal tightening on economic activity. In the absence of credibility in fiscal plans, the initial multiplier of ½ in the EU and the euro area in 2012 is around twice as large as the multiplier of ¼ in the case of ex-ante credibility without a zero-bound constraint on the interest rate. The larger negative impact of fiscal tightening on activity in the absence of credibility derives mainly from the non-anticipation of the future benefits. Lack of credibility forgoes the positive income effect that derives from the anticipation of lower future tax liabilities, while frontloading of consumption in reaction to expected increases in the consumption tax also disappears if the announcement lacks credibility.(3)
-1.2
-1
-0.8
-0.6
-0.4
-0.2
0
%
Graph 1:Real GDP -deviation from baseline, EU and euro area
Credibility Credibility+ZLB Learning Confidence
2012 20132012
EU EA EU EA
The potential mitigating effect of fiscal consolidation on sovereign-risk premia is illustrated in a fourth scenario (confidence). It (3) A binding zero bound on interest rates would also
increase the multiplier in the learning scenario. The increase would be less pronounced than under full credibility, namely from ½ to 0.6-0.7. The increase is smaller, because in the first year, when the zero bound binds, agents and interest rates under learning do not anticipate/react to fiscal plans beyond 2012 contrary to the case of full credibility.
(Continued on the next page)
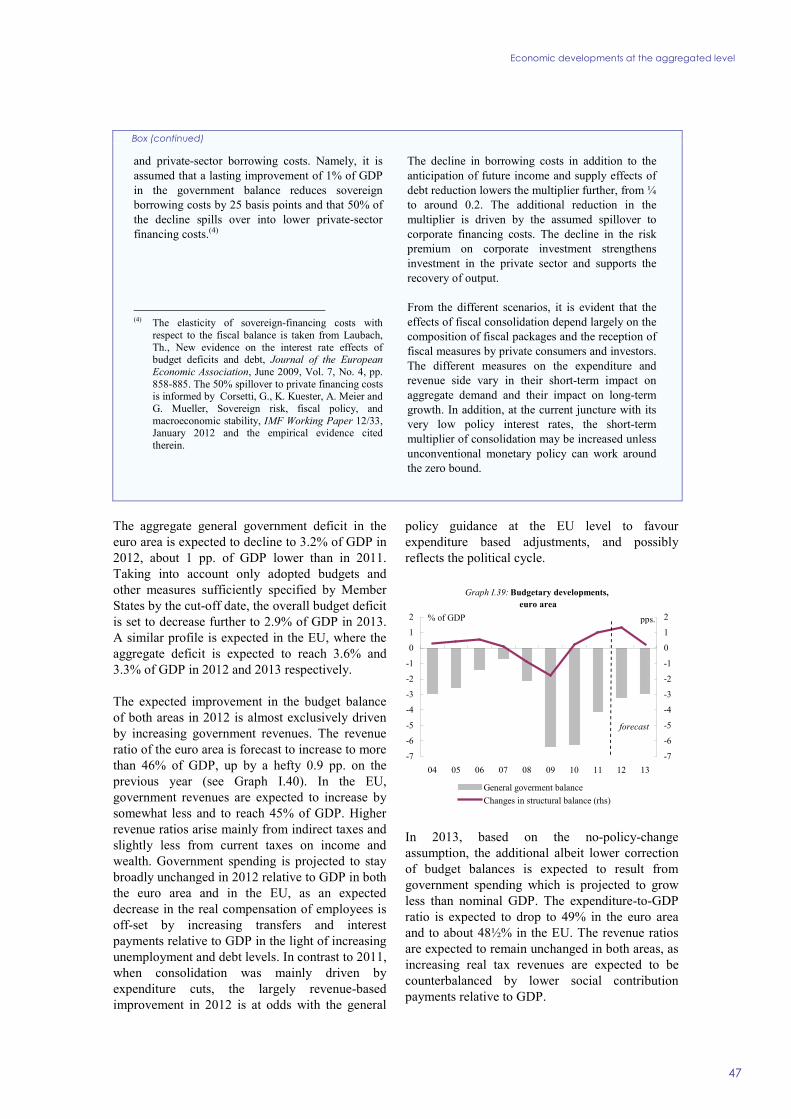
Economic developments at the aggregated level
47
The aggregate general government deficit in the euro area is expected to decline to 3.2% of GDP in 2012, about 1 pp. of GDP lower than in 2011. Taking into account only adopted budgets and other measures sufficiently specified by Member States by the cut-off date, the overall budget deficit is set to decrease further to 2.9% of GDP in 2013. A similar profile is expected in the EU, where the aggregate deficit is expected to reach 3.6% and 3.3% of GDP in 2012 and 2013 respectively.
The expected improvement in the budget balance of both areas in 2012 is almost exclusively driven by increasing government revenues. The revenue ratio of the euro area is forecast to increase to more than 46% of GDP, up by a hefty 0.9 pp. on the previous year (see Graph I.40). In the EU, government revenues are expected to increase by somewhat less and to reach 45% of GDP. Higher revenue ratios arise mainly from indirect taxes and slightly less from current taxes on income and wealth. Government spending is projected to stay broadly unchanged in 2012 relative to GDP in both the euro area and in the EU, as an expected decrease in the real compensation of employees is off-set by increasing transfers and interest payments relative to GDP in the light of increasing unemployment and debt levels. In contrast to 2011, when consolidation was mainly driven by expenditure cuts, the largely revenue-based improvement in 2012 is at odds with the general
policy guidance at the EU level to favour expenditure based adjustments, and possibly reflects the political cycle.
-7
-6
-5
-4
-3
-2
-1
0
1
2
04 05 06 07 08 09 10 11 12 13-7
-6
-5
-4
-3
-2
-1
0
1
2
General goverment balanceChanges in structural balance (rhs)
forecast
% of GDP pps.
Graph I.39: Budgetary developments, euro area
In 2013, based on the no-policy-change assumption, the additional albeit lower correction of budget balances is expected to result from government spending which is projected to grow less than nominal GDP. The expenditure-to-GDP ratio is expected to drop to 49% in the euro area and to about 48½% in the EU. The revenue ratios are expected to remain unchanged in both areas, as increasing real tax revenues are expected to be counterbalanced by lower social contribution payments relative to GDP.
Box (continued)
and private-sector borrowing costs. Namely, it is assumed that a lasting improvement of 1% of GDP in the government balance reduces sovereign borrowing costs by 25 basis points and that 50% of the decline spills over into lower private-sector financing costs.(4)
(4) The elasticity of sovereign-financing costs with
respect to the fiscal balance is taken from Laubach, Th., New evidence on the interest rate effects of budget deficits and debt, Journal of the European Economic Association, June 2009, Vol. 7, No. 4, pp. 858-885. The 50% spillover to private financing costs is informed by Corsetti, G., K. Kuester, A. Meier and G. Mueller, Sovereign risk, fiscal policy, and macroeconomic stability, IMF Working Paper 12/33, January 2012 and the empirical evidence cited therein.
The decline in borrowing costs in addition to the anticipation of future income and supply effects of debt reduction lowers the multiplier further, from ¼ to around 0.2. The additional reduction in the multiplier is driven by the assumed spillover to corporate financing costs. The decline in the risk premium on corporate investment strengthens investment in the private sector and supports the recovery of output.
From the different scenarios, it is evident that the effects of fiscal consolidation depend largely on the composition of fiscal packages and the reception of fiscal measures by private consumers and investors. The different measures on the expenditure and revenue side vary in their short-term impact on aggregate demand and their impact on long-term growth. In addition, at the current juncture with its very low policy interest rates, the short-term multiplier of consolidation may be increased unless unconventional monetary policy can work around the zero bound.

European Economic Forecast, Spring 2012
48
In 2011, the economic recovery supported the fiscal exit strategy and structural and cyclical factors contributed in equal measure to the projected improvement in budget balances. In 2012, however, discretionary consolidation is forecast to be the sole driving force behind the estimated improvement in the headline deficit (see Graph I.39). More specifically, the estimated improvement in the structural balance of 1.3 pps. in the euro area and of 1.1 pps. in the EU, is projected to be partially offset by the budgetary impact from the worsening short-term economic situation.
40
42
44
46
48
50
52
06 07 08 09 10 11 12 13
Total revenues Total expenditure
forecast
Graph I.40: General government revenues and expenditure, EU
% of GDP
In 2013, the fiscal stance is broadly neutral in the euro area. The expected increase in the structural budget balance of 0.2 pp. would account for about half of the overall projected change in the headline deficit in that year. In the EU, the estimated change in the structural budget balance of 0.5 pp. would remain the sole driving force behind the expected improvement in the headline deficit.
The budgetary situation improves across Member States …
The projected improvement in the budgetary situation is broad-based across Member States, yet notable differences persist. Some countries are making rapid and sustained progress on their way towards sustainable fiscal positions. In others, progress is slower or takes place at a variable pace. A number of countries may register increasing headline deficits in one or two of the forecast years. In 2012, Denmark and Estonia are expected to register a marked deterioration in their budget balances. In Denmark, which is still subject to the Excessive Deficit Procedure (EDP), the worsening of public finance conditions reflects the introduction of a stimulus package whose
budgetary effects are assumed to last only during 2012 and the lump-sum reimbursement related to the adoption of the reform of the voluntary early-retirement pension (VERP). In addition, the absence of extraordinary and typically rather volatile pension yield revenues reduces the budget balance compared to 2011. In Estonia, which is one of the few EU Member States currently not subject to the EDP, the budget balance is forecast to return to the red this year. The deterioration in public finances in Estonia is due to the absence of windfall revenues linked to the Kyoto trading system, the social indexation of pensions and the restoration of the payments for the second pillar of the pension system.
As regards EU budgetary surveillance, all Member States except Estonia, Finland, Luxembourg and Sweden are currently subject to the EDP. This results from the combined after-effect of the deep economic recession in 2009 and the discretionary measures implemented at the time with the European Economic Recovery Plan (EERP), aimed at stemming the risk of an economic and financial meltdown. In view of the severity of the 2009 recession and its heavy impact on public finances, the correction period under the EDP was formulated as a multiannual adjustment framework. Most EDP countries have a deadline of either this year or 2013 to correct their excessive general government deficit.(34) Currently all EDPs are in abeyance, with the exception of Greece and Hungary. Furthermore, among the Member States subjected to the EDP, Greece, Portugal, Ireland and Romania benefit from financial assistance, while the Balance of Payment (BoP) programme for Latvia ended in January 2012.
… while debt continues to increase, yet at a slowing pace
Government debt-to-GDP ratios are expected to continue to increase over the forecast horizon in both the euro area and in the EU, albeit at a slowing pace compared with the 2008-10 period. Even though current deficits are being reduced, increasing interest payments, combined with somewhat lower nominal GDP growth, are assumed to push up public debt ratios (see Table I.9). On the whole, in the euro area gross public debt is projected to reach 92½% of GDP in 2013,
(34) For a complete overview see:
http://ec.europa.eu/economy_finance/economic_governance/sgp/deficit/index_en.htm.

Economic developments at the aggregated level
49
while in the EU it is expected to slightly exceed 87% of GDP. Compared with the autumn forecast, the debt ratio of the euro area has been revised upwards in both 2012 and 2013 on account of a downward revision of economic growth as well as a marked worsening of the stock-flow adjustment, comprising technical adjustments and changes in financial assets. In the EU, the upward revision of the aggregate debt ratio over the forecast horizon, and more specifically in 2013, is mainly due to higher expected public debt in the United Kingdom, which is partly caused by an amendment on the treatment of financial sector interventions.
Table I.9:Euro-area debt dynamics
average 2004-08 2009 2010 2011 2012 2013
Gross debt ratio1 (% of GDP) 69.0 79.9 85.6 88.0 91.8 92.6Change in the ratio 0.2 9.8 5.7 2.4 3.8 0.9Contributions to the change in the ratio: 1. Primary balance -1.1 3.5 3.4 1.1 0.0 -0.3 2. “Snow-ball” effect2 0.3 5.4 0.7 0.7 2.1 0.8 Of which: Interest expenditure 3.0 2.9 2.8 3.1 3.2 3.2 Growth effect -1.4 3.1 -1.5 -1.2 0.3 -0.9 Inflation effect -1.3 -0.6 -0.6 -1.1 -1.4 -1.5
3. Stock-flow adjustment 1.0 0.8 1.5 0.6 1.7 0.4
2 The "snow-ball effect" captures the impact of interest expenditure onaccumulated debt, as well as the impact of real GDP growth and inflationon the debt ratio (through the denominator). The stock-flow adjustmentincludes differences in cash and accrual accounting, accumulation offinancial assets and valuation and other residual effects.
1 End of period.
6. RISKS
Overall the balance of risks has improved slightly compared with the autumn 2011 forecast. Tail risks appear smaller than in the autumn of last year when substantial agreements had not yet been achieved (e.g. advances with firewalls, fiscal compact, restructuring in Greece) and non-standard monetary policy measures had not been in place (e.g. the Eurosystem's LTROs). But at the same time new risks have emerged, limiting this relief. Overall, uncertainty remains at high levels as the economic and financial crisis is lasting, the EU economy is in recession and the validity of the policy assumption about the successful handling of the crisis-related challenges remains crucial.
Risks to the growth outlook remain tilted to the downside. As the economic and financial crisis, initiated by the subprime crisis in the US in 2007, enters its sixth year, some of the downside risks from earlier forecasts – such as financial turmoil in some countries, entering a recession, or lower momentum in global growth – have materialised
and therefore entered the central scenario of this forecast. However, other risks have also since come to the fore and some new risks have emerged.
On the downside, the risk of further financial turmoil remains in place, since financial markets remain fragile and are still prone to negative confidence shocks. A renewal of turmoil could re-activate or worsen adverse feedback loops and re-ignite funding stress with detrimental effects on access to credit. The forecast depends crucially on the policy assumption that crisis-related challenges are being successfully addressed. But with improvements in the economic situation, the risk of complacency necessarily rises. Should uncertainty about the implementation of already agreed policy measures occur, or should the response to future challenges lack timeliness, focus or ambition, a more negative development and a longer-lasting period of stagnation cannot be excluded. The more the functioning of financial markets depends on central banks, the larger the risk that doubts about the return to market-based activities may arise. Moreover, fiscal sustainability challenges are yet to be tackled not only within the EU but also outside (e.g. the US). Resulting consolidation measures that are not taken on board in the central scenario due to the no-policy-change assumption may have a more negative impact on domestic demand than currently foreseen. And a sharp increase in oil prices could lower real incomes and consumption more than expected and jeopardise the economic upturn.
On the upside, the policy measures already taken to address the challenges of the euro-area sovereign-debt crisis may have a faster and more sustained impact than currently expected. This would encourage companies to invest and households to consume resulting in an earlier return of confidence and an earlier transition to recovery than currently forecast.
Should global growth turn out more dynamic than assumed in the baseline due to inherent growth dynamics and policy easing in emerging market economies, EU exports would benefit more than expected.
The uncertainty surrounding the euro-area growth outlook is visualised in a fan chart (see Graph I.41) that displays the probabilities associated with various outcomes for euro-area economic growth over the forecast horizon. While the darkest area

European Economic Forecast, Spring 2012
50
indicates the most likely development, the shaded areas represent the different probabilities of future economic growth within the growth ranges depicted on the y-axis. The width of the 90% bands is smaller than in previous forecasts. But as the balance of risks to economic growth is assessed as clearly tilted to the downside, the fan chart remains skewed towards the bottom.
-5
-4
-3
-2
-1
0
1
2
3
4
06 07 08 09 10 11 12 13
%
upper 90%upper 70%upper 40%lower 40%lower 70%lower 90%actualcentral scenario
Graph I.41: Euro area GDP forecasts - Uncertainty linked to the balance of risks
The risks to the inflation outlook for the years 2012 and 2013 remain balanced. While the deterioration in the economic environment has lowered some of the risks, risks related to fiscal retrenchment and developments in the external side environment appear to be more acute than previously assessed.
On the downside, the recession in the EU may be less mild than currently forecast. A further drop in economic activity may constrain price increases more than currently envisaged. Any attempt to competitively devalue outside the EU, e.g. by setting minimum exchange rates vis-à-vis the euro, could reduce import prices and, if passed through via production and retail chains, lower consumer prices in the EU.
On the upside, a stronger-than-expected rebound in global growth or continued unrest or military actions in oil-exporting countries could result in stronger inflationary pressures. Past periods of consumer-price inflation could also result in stronger wage increases than currently expected and trigger second-round effects which could raise inflation rates further. Higher indirect taxes and administrative prices due to additional fiscal consolidation measures could also push inflation rates higher. Moreover, the long-time build-up of liquidity and the non-standard liquidity provision in the EU, most notably in the euro area and the UK, could eventually result in stronger-than-expected consumer-price increases.
Overall, the main risk to the central scenario of the forecast for economic growth and inflation is a revival of the crisis in the EU.

Economic developments at the aggregated level
51
Box I.5: Some technical elements behind the forecast
The cut-off date for taking new information into account in this European Economic Forecast was 26 April. The forecast incorporates validated public finance data from Eurostat's News Release 62/2012, dated 23 April 2012.
External assumptions
This forecast is based on a set of external assumptions, reflecting market expectations at the time of the forecast. To shield the assumptions from possible volatility during any given trading day, averages from a 10-day reference period (between 11 and 24 April) were used for exchange and interest rates, and for oil prices.
Exchange and interest rates
The technical assumption as regards exchange rates was standardised using fixed nominal exchange rates for all currencies. This technical assumption leads to implied average USD/EUR rates of 1.31 in in 2012 and 2013. The average JPY/EUR rates are 105.9 in 2012 and 106.5 in 2013.
Interest-rate assumptions are market-based. Short-term interest rates for the euro area are derived from futures contracts. Long-term interest rates for the euro area, as well as short- and long-term interest rates for other Member States are calculated using implicit forward swap rates, corrected for the current spread between the interest rate and swap rate. In cases where no market instrument is available, the fixed spread vis-à-vis the euro-area interest rate is taken for both short- and long-term rates. As a result, short-term interest rates are expected to be 0.8% on average in 2012 and 2013 in the euro area. Long-term euro-area interest rates are assumed to be 1.8% on average in 2012 and 2.0% in 2013.
Commodity prices
Commodity price assumptions are also, as far as possible, based on market conditions. According to futures markets, prices for Brent oil are projected to be on average 116.8 USD/bl. in 2012 and 110.2 USD/bl. in 2013. This would correspond to an oil price of 89.2 EUR/bl. in 2012 and 84.1 EUR/bl. in 2013.
Budgetary data
Data up to 2011 are based on data notified by Member States to the European Commission on 1 April and validated by Eurostat on 23 April 2012.
Eurostat expressed a specific reservation on the data reported by Ireland, due to the fact that the restructuring plans of Allied Irish Banks and Irish Life & Permanent were not yet finalised. These restructuring plans have been used by the Irish statistical authorities to calculate in the reported figures a (deficit increasing) capital transfer element of 3.7% GDP arising from the July 2011 government injections into the two banks. Eurostat awaits the finalisation of the restructuring plans, including approval by the EU competition authorities, so that the amount of the capital transfer element can be confirmed.
Eurostat also expressed a specific reservation on the data reported by Ireland, due to the statistical classification of National Asset Management Agency Investment Limited (NAMA-IL), which is currently classified outside the general government. Owing to the nationalisation of one of its previously private beneficial owners, whose interest is currently under a process of sale, NAMA-IL has been in majority public ownership since July 2011. Eurostat's decision of 15 July 2009 on public interventions during the financial crisis specifies that majority private ownership is necessary for such an entity to be classified outside the General Government sector.
Eurostat has amended the deficit and debt data notified by the United Kingdom for the years 2008 to 2011 (as well as for financial years 2008/2009 to 2011/2012). This has been done to ensure compliance with the updated financial defeasance chapter of the ESA95 Manual on Government Deficit and Debt, with respect to Bradford & Bingley (B&B) and Northern Rock Asset Management (NRAM). The reported deficit figures have been increased by 360 million GBP (0.03% of GDP) in 2008 (as well as in financial year 2008/2009), by 571 mn GBP (0.04% of GDP) in 2009 (as well as in financial year 2009/2010), by 826 mn GBP (0.06% of GDP) in 2010 (as well as in financial year 2010/2011) and by 787 mn GBP (0.05% of GDP) in 2011 (as well as in financial year 2011/2012). The reported debt figures have been increased by 32 374 mn GBP (2.26% of GDP) in 2008 (as well as in financial year 2008/2009), by 19 969 mn GBP (1.43% of GDP) in 2009 (as well as in financial year 2009/2010), by 56 680 mn GBP (3.87% of GDP) in 2010 (as well as in financial year 2010/2011) and by 42 287 mn GBP (2.81% of GDP) in 2011 (as well as in financial year 2011/2012).
(Continued on the next page)

European Economic Forecast, Spring 2012
52
Box (continued)
For the forecast, measures in support of financial stability have been recorded in line with the Eurostat Decision of 15 July 2009.(1) Unless reported otherwise by the Member State concerned, capital injections known in sufficient detail have been included in the forecast as financial transactions, i.e. increasing the debt, but not the deficit. State guarantees on bank liabilities and deposits are not included as government expenditure, unless there is evidence that they have been called on at the time the forecast was finalised. Note, however, that loans granted to banks by the government, or by other entities classified in the government sector, usually add to government debt.
For 2012, budgets adopted or presented to national parliaments and all other measures known in sufficient detail are taken into consideration. For 2013, the 'no-policy-change' assumption used in the forecasts implies the extrapolation of revenue and expenditure trends and the inclusion of measures that are known in sufficient detail.
The general government balances that are relevant for the Excessive Deficit Procedure may be slightly different from those published in the national accounts. The difference concerns settlements under swaps and forward rate agreements (FRA).
According to ESA95 (amended by regulation No. 2558/2001), swap- and FRA-related flows are financial transactions and therefore excluded from the calculation of the government balance. However, for the purposes of the excessive deficit procedure, such flows are recorded as net interest expenditure.
(1) Eurostat News Release N° 103/2009.
European aggregates for general government debt in the forecast years 2012-13 are published on a non-consolidated basis (i.e. not corrected for intergovernmental loans). To ensure consistency in the time series, historical data are also published on the same basis. For 2011, this implies a debt-to-GDP ratio in the euro area which is 0.7 pp. (0.5 pp. in the EU) higher than the consolidated general government debt ratio published by Eurostat in its news release 62/2012 of 23 April 2012.
General government debt projections for individual Member States in 2012-13 include the impact of guarantees to the EFSF,(2) bilateral loans to other Member States, and the participation in the capital of the ESM as planned on the cut-off date of the forecast (subject to approval).
Calendar effects on GDP growth and output gaps
The number of working days may differ from one year to another. The Commission's annual GDP forecasts are not adjusted for the number of working days, but quarterly forecasts are.
However, the working-day effect in the EU and the euro area is estimated to be limited over the forecast horizon, implying that adjusted and unadjusted growth rates differ only marginally. The calculation of potential growth and the output gap does not adjust for working days. Since the working-day effect is considered as temporary, it should not affect the cyclically-adjusted balances.
(2) In line with the Eurostat decision of 27 January 2011
on the statistical recording of operations undertaken by the European Financial Stability Facility, available at: http://epp.eurostat.ec.europa.eu/cache/ITY_PUBLIC/2-27012011-AP/EN/2-27012011-AP-EN.PDF

PART II Prospects by individual economy


Member States

1. BELGIUM A narrow path towards growth-friendly consolidation
56
The recovery has come to a halt
The export-led recovery that took place from the second part of 2009 came to a halt in the second half of 2011. The slowdown in global activity coupled with a revival of the sovereign-debt crisis and negative confidence effects, resulted in a shallow recession (-0.1% both for the third and fourth quarter). For the year as a whole and thanks to the large carry-over from 2010 (0.9%), GDP increased by 1.9%.
-4
-3
-2
-1
0
1
2
3
4
00 01 02 03 04 05 06 07 08 09 10 11 12 13
pps.
Graph II.1.1:Belgium - GDP growth and contributions
Domestic demandStocksNet exportsGDP growth (y-o-y %)
forecast
GDP is projected to stagnate in 2012, to recover in 2013, growing by 1¼%. According to the most recent available indicators, an economic expansion is not to be expected at the beginning of 2012. In particular in view of the high degree of openness of the Belgian economy, the slowdown in activity in neighbouring countries is likely to exert its toll. In the second half of the year, GDP should increase on the back of a gradual recovery for international trade, while the crisis-related uncertainty will slowly fade away, pushing up business and households' confidence. Moreover the consolidation measures included in both the 2012 budget and complemented by additional measures in January and March are likely to have a limited but still negative impact on this year's growth. Eventually, downward pressure from a fall in real disposable income, stemming from rising unemployment and less dynamic non-labour income, is likely to be partly balanced by a slight fall in the household saving rate in order to sustain the level of consumption. Private consumption is then projected to remain anaemic in 2012 with no real growth, and to progress timidly in 2013.
In contrast with 2011, private investment is set to remain weak over the forecast horizon. Increased uncertainty and a below-long-term average capacity utilisation are expected to result in some postponements of planned investment projects. In 2013, business investment is projected to accelerate progressively, in line with the improvement in confidence. Demand for mortgages is expected to fall in 2012, also in view of the negative developments in household real disposable income, weighing in turn on construction investment. In view of the local elections in the second half of the year, public investment is projected to remain upbeat in 2012 and, on the contrary, to be negative in 2013. On the whole, investment is expected to grow by 0.7% in 2012 and to accelerate to 1.6% in 2013.
External sector and competitiveness
Due to the gradual pickup in world trade expected to materialise only in the second part of the year, export growth would be limited in 2012 but should accelerate slightly in 2013. Net trade contribution is then projected to be a drag on growth in 2012 (-0.2 pp.) and to be still flat in 2013. Relatively high dynamic unit labour costs are projected to hamper competitiveness in 2012 and to a lesser degree in 2013. Furthermore, suboptimal geographical and product specialisation will contribute to the loss in the market share over the forecast horizon. The surplus in the current-account balance is expected to fall further in 2012 and 2013 in view of the projected deficit in trade of goods.
Risks are slightly skewed towards the negative side. Exports might turn out to be lower than projected, should competitiveness deterioration be deeper than expected. On the other hand, private consumption might be more dynamic on the basis of regained households' confidence and a high saving rate.
Inflation still high while labour market weakens
Inflation reached 3.5% in 2011 mainly on account of a surge in oil prices. In line with the further increase in oil prices in the beginning of 2012, coupled with the impact of the consolidation measures in the 2012 budget (estimated around 0.2 pp.), inflation is projected to remain high at 2.9% and decrease to 1.8% in 2013. The unemployment

Member States, Belgium
Table II.1.1:Main features of country forecast - BELGIUM
2010 Annual percentage changebn EUR Curr. prices % GDP 92-07 2008 2009 2010 2011 2012 2013
GDP 354.4 100.0 2.1 1.0 -2.8 2.3 1.9 0.0 1.2 Private consumption 187.5 52.9 1.6 1.9 0.8 2.5 0.7 0.1 1.2 Public consumption 85.8 24.2 1.6 2.4 0.8 0.2 0.8 0.4 0.4 Gross fixed capital formation 71.6 20.2 2.5 2.0 -8.1 -0.7 5.1 0.7 1.6 of which : equipment 28.6 8.1 2.7 3.5 -11.6 -2.7 6.8 1.7 2.0 Exports (goods and services) 283.5 80.0 4.7 1.7 -11.2 9.9 4.8 0.8 4.2 Imports (goods and services) 274.0 77.3 4.5 3.1 -10.7 8.7 4.9 1.1 4.1 GNI (GDP deflator) 360.6 101.8 2.2 1.4 -4.8 4.7 1.9 0.0 1.2 Contribution to GDP growth : Domestic demand 1.7 1.9 -1.2 1.2 1.6 0.3 1.1
Inventories 0.1 0.0 -1.1 -0.1 0.2 -0.1 0.0Net exports 0.3 -1.0 -0.5 1.1 0.0 -0.2 0.1
Employment 0.8 1.8 -0.2 0.8 1.3 0.0 0.4 Unemployment rate (a) 8.4 7.0 7.9 8.3 7.2 7.6 7.9 Compensation of employees/head 2.9 3.6 1.1 1.4 3.3 3.1 2.3 Unit labour costs whole economy 1.6 4.5 3.9 0.0 2.7 3.2 1.4 Real unit labour costs -0.4 2.3 2.6 -1.8 0.5 1.1 -0.7 Saving rate of households (b) 17.8 16.8 18.4 16.2 16.6 16.2 16.1 GDP deflator 2.0 2.2 1.2 1.8 2.2 2.1 2.2 Harmonised index of consumer prices 1.9 4.5 0.0 2.3 3.5 2.9 1.8 Terms of trade of goods -0.3 -2.9 3.5 -2.1 -4.4 -0.5 0.0 Merchandise trade balance (c) 3.0 -1.5 -0.4 0.3 -3.3 -3.9 -4.0 Current-account balance (c) 4.4 1.1 0.7 3.1 2.2 1.5 1.6 Net lending(+) or borrowing(-) vis-à-vis ROW (c) 4.3 0.6 0.3 3.1 2.1 1.7 1.8 General government balance (c) -2.0 -1.0 -5.6 -3.8 -3.7 -3.0 -3.3 Cyclically-adjusted budget balance (c) -2.2 -1.9 -4.3 -3.2 -3.5 -2.2 -2.6 Structural budget balance (c) - -2.0 -3.7 -3.2 -3.4 -2.7 -2.6 General government gross debt (c) 111.2 89.3 95.8 96.0 98.0 100.5 100.8
(a) Eurostat definition. (b) gross saving divided by gross disposable income. (c) as a percentage of GDP.
57
rate fell from 8.5% in July 2010 to 7.1% in December 2011, but edged up in the first two months of 2012 to 7.2%. In 2011, employment growth was supported by a rise in hours worked and an increase in part-time work, partly subsidised by the general government (e.g. service cheque jobs). In view of the weak economic environment, employment is projected to stall in 2012 and increase only slightly in 2013. However, given a still dynamic growth in the labour force, unemployment is seen to increase both in 2012 and 2013.
Public finance: trying to eliminate the excessive deficit
The general government deficit reached 3.7% in 2011 compared to 4.1% in the autumn forecast and 3.8% in 2010. This revision mainly reflects the base effect stemming from a downward revision of the deficit of local authorities in recent years. In 2012, the general government deficit is likely to decrease to 3% of GDP, mainly on account of the consolidation measures in the 2012 budget. In particular, an increase in the tax on dividends and interest, a reform of the "notional interest" system and the introduction of a specific levy on the "nuclear rent" of electricity will help reducing the deficit this year. On the expenditure side, cuts were decided in federal government and social security
spending for about 0.3% and 0.2% of GDP, respectively. In order to cope with the strong downward revision in growth (the budget had initially been based on the assumption of a 0.8% GDP growth in 2012), additional measures were taken in March, during the budgetary monitoring exercise. This, coupled with the base effect stemming from the downward revision of the deficit of local authorities, would push the deficit down to 3% of GDP in 2012. However, in 2013, despite the projected acceleration in growth and some measures already taken for 2013, it should start to rise again, in part explained by the large amount of one-off measures decided for 2012 (about ½% of GDP). In structural terms, the deficit is projected to decline by about 0.7 pp. of GDP (after deteriorating by 0.1 in 2011) and by a further 0.1 pp. of GDP in 2013.
The general government debt reached 98.0% in 2011. Under the current growth and deficit projections, the debt ratio is forecast to continue to rise slightly over the forecast period and it will probably exceed the psychological threshold of 100% of GDP in 2012. Moreover, the large contingent liabilities stemming from the guarantees given by the State to financial institutions represent a risk for public finances.

2. BULGARIA Slow recovery ahead while fiscal position continues to improve
58
Initial recovery phase driven by exports
The Bulgarian economy expanded slowly over 2010-11. As in other converging EU economies, which had undergone a period of economic overheating and a build-up of imbalances, the growth pattern in the recovery over 2010-11 was largely driven by exports, while domestic demand remained stagnant, reflecting imbalances in the private sector. Annual GDP growth reached 1.7% in 2011, with a decelerating trend within the year.
Slow recovery ahead
Compared to the autumn forecast, annual growth has been revised down by 1.8 pps. to 0.5% for the current year and by 1.1 pps. to 1.9% in 2013. These revisions reflect the downward adjustment in EU economic prospects and its spill-over effects to the Bulgarian economy via the trade channel and lower confidence, affecting investment and consumption.
The recovery is mainly restrained by the weaknesses of the labour market, the continued deleveraging of the corporate sector and a downsizing in the construction sector. Additionally, given the regional economic uncertainties, capital inflows and FDI have stabilised at lower levels and have not given a notable boost to growth, unlike in the past decade. On the positive side, the financial sector has remained stable, also providing a modest growth in private sector credit in 2011. The economy also benefits from relatively strong public finances, which do not face major adjustment needs in the medium term.
In line with the expected recovery in the EU, prospects for the exporting sectors would improve from the second half of 2012. The deceleration in export growth compared to 2010-11 is not seen to result in a notable widening in the trade deficit until 2013, as both private consumption and investment are still weak and restrain imports.
Consumer sentiment has remained low in the first months of 2012, still below the long-term average. Household demand is expected to contribute to growth more notably in 2013, especially as the labour market is expected to stabilise and
households are projected to reduce their currently high precautionary savings.
Graph II.2.1: Bulgaria - Inflation and contributions to GDP growth
-20-15-10
-505
1015
03 04 05 06 07 08 09 10 11 12 13
pps.
Net exports Inventories Domestic demand, excl. invent. GDP growth (y-o-y%)Inflation
forecast
Investment has declined substantially for the past three years from the peak reached at the height of the boom. Investment is expected to be supported by public sector projects. Bulgaria plans to increase the absorption of EU structural funds significantly in 2012. However, given the on-going deleveraging of corporate balance sheets, adjustments in the real-estate market and the weak economic environment, investment is expected to contract further in 2012 before moving to positive territory in 2013.
Delayed recovery in the labour market
The effects of the crisis on employment were strong and protracted. Employment declined by a cumulative 12% between 2009 and 2011, which is one of the steepest declines in the EU. The contraction in employment is forecast to level off over 2012 and 2013. Businesses are still cautious in hiring, as indicated by the weak employment expectations in business sentiment surveys. The unemployment rate increased from below 6% of the labour force to over 11% in 2011, with the inactivity rate also rising. Even with weak employment, average wages continued to increase, driven by structural changes in the labour market and the whitening of the economy. The recovery in employment is held back by skill mismatches and a continuous decline in the working age population. This has negative implications for the growth potential of the economy.
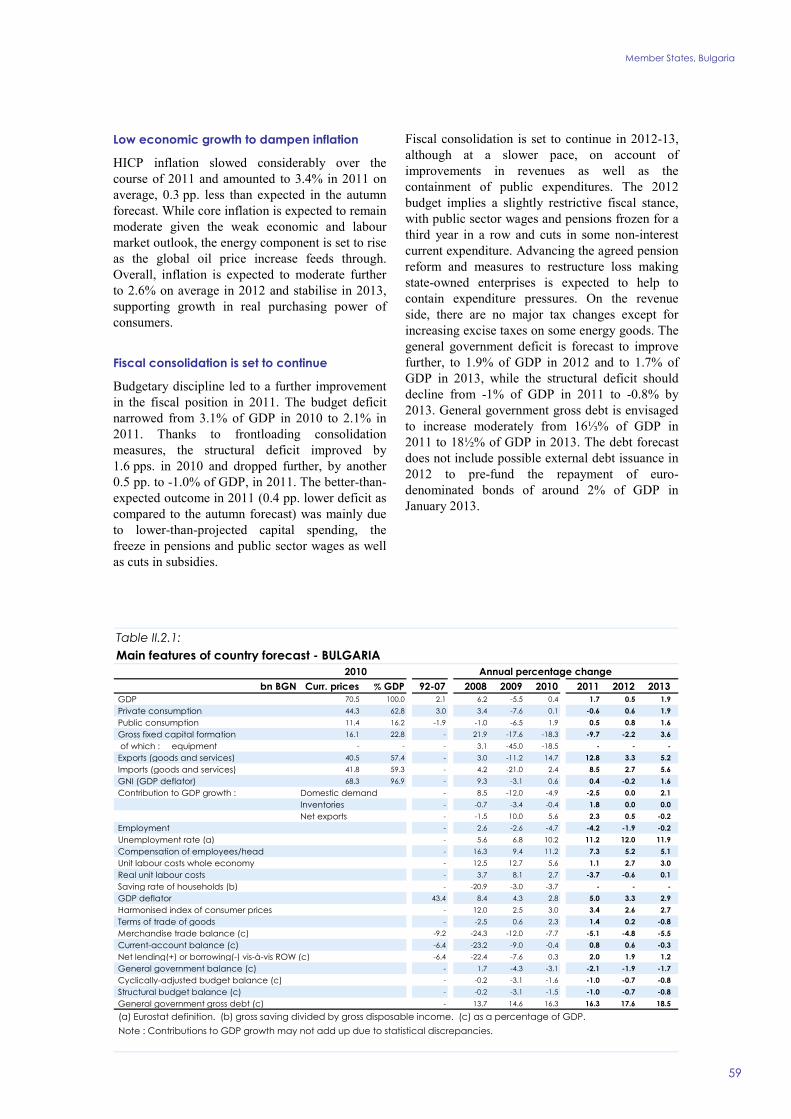
Member States, Bulgaria
Table II.2.1:Main features of country forecast - BULGARIA
2010 Annual percentage changebn BGN Curr. prices % GDP 92-07 2008 2009 2010 2011 2012 2013
GDP 70.5 100.0 2.1 6.2 -5.5 0.4 1.7 0.5 1.9 Private consumption 44.3 62.8 3.0 3.4 -7.6 0.1 -0.6 0.6 1.9 Public consumption 11.4 16.2 -1.9 -1.0 -6.5 1.9 0.5 0.8 1.6 Gross fixed capital formation 16.1 22.8 - 21.9 -17.6 -18.3 -9.7 -2.2 3.6 of which : equipment - - - 3.1 -45.0 -18.5 - - - Exports (goods and services) 40.5 57.4 - 3.0 -11.2 14.7 12.8 3.3 5.2 Imports (goods and services) 41.8 59.3 - 4.2 -21.0 2.4 8.5 2.7 5.6 GNI (GDP deflator) 68.3 96.9 - 9.3 -3.1 0.6 0.4 -0.2 1.6 Contribution to GDP growth : Domestic demand - 8.5 -12.0 -4.9 -2.5 0.0 2.1
Inventories - -0.7 -3.4 -0.4 1.8 0.0 0.0Net exports - -1.5 10.0 5.6 2.3 0.5 -0.2
Employment - 2.6 -2.6 -4.7 -4.2 -1.9 -0.2 Unemployment rate (a) - 5.6 6.8 10.2 11.2 12.0 11.9 Compensation of employees/head - 16.3 9.4 11.2 7.3 5.2 5.1 Unit labour costs whole economy - 12.5 12.7 5.6 1.1 2.7 3.0 Real unit labour costs - 3.7 8.1 2.7 -3.7 -0.6 0.1 Saving rate of households (b) - -20.9 -3.0 -3.7 - - - GDP deflator 43.4 8.4 4.3 2.8 5.0 3.3 2.9 Harmonised index of consumer prices - 12.0 2.5 3.0 3.4 2.6 2.7 Terms of trade of goods - -2.5 0.6 2.3 1.4 0.2 -0.8 Merchandise trade balance (c) -9.2 -24.3 -12.0 -7.7 -5.1 -4.8 -5.5 Current-account balance (c) -6.4 -23.2 -9.0 -0.4 0.8 0.6 -0.3 Net lending(+) or borrowing(-) vis-à-vis ROW (c) -6.4 -22.4 -7.6 0.3 2.0 1.9 1.2 General government balance (c) - 1.7 -4.3 -3.1 -2.1 -1.9 -1.7 Cyclically-adjusted budget balance (c) - -0.2 -3.1 -1.6 -1.0 -0.7 -0.8 Structural budget balance (c) - -0.2 -3.1 -1.5 -1.0 -0.7 -0.8 General government gross debt (c) - 13.7 14.6 16.3 16.3 17.6 18.5
(a) Eurostat definition. (b) gross saving divided by gross disposable income. (c) as a percentage of GDP. Note : Contributions to GDP growth may not add up due to statistical discrepancies.
59
Low economic growth to dampen inflation
HICP inflation slowed considerably over the course of 2011 and amounted to 3.4% in 2011 on average, 0.3 pp. less than expected in the autumn forecast. While core inflation is expected to remain moderate given the weak economic and labour market outlook, the energy component is set to rise as the global oil price increase feeds through. Overall, inflation is expected to moderate further to 2.6% on average in 2012 and stabilise in 2013, supporting growth in real purchasing power of consumers.
Fiscal consolidation is set to continue
Budgetary discipline led to a further improvement in the fiscal position in 2011. The budget deficit narrowed from 3.1% of GDP in 2010 to 2.1% in 2011. Thanks to frontloading consolidation measures, the structural deficit improved by 1.6 pps. in 2010 and dropped further, by another 0.5 pp. to -1.0% of GDP, in 2011. The better-than-expected outcome in 2011 (0.4 pp. lower deficit as compared to the autumn forecast) was mainly due to lower-than-projected capital spending, the freeze in pensions and public sector wages as well as cuts in subsidies.
Fiscal consolidation is set to continue in 2012-13, although at a slower pace, on account of improvements in revenues as well as the containment of public expenditures. The 2012 budget implies a slightly restrictive fiscal stance, with public sector wages and pensions frozen for a third year in a row and cuts in some non-interest current expenditure. Advancing the agreed pension reform and measures to restructure loss making state-owned enterprises is expected to help to contain expenditure pressures. On the revenue side, there are no major tax changes except for increasing excise taxes on some energy goods. The general government deficit is forecast to improve further, to 1.9% of GDP in 2012 and to 1.7% of GDP in 2013, while the structural deficit should decline from -1% of GDP in 2011 to -0.8% by 2013. General government gross debt is envisaged to increase moderately from 16⅓% of GDP in 2011 to 18½% of GDP in 2013. The debt forecast does not include possible external debt issuance in 2012 to pre-fund the repayment of euro-denominated bonds of around 2% of GDP in January 2013.
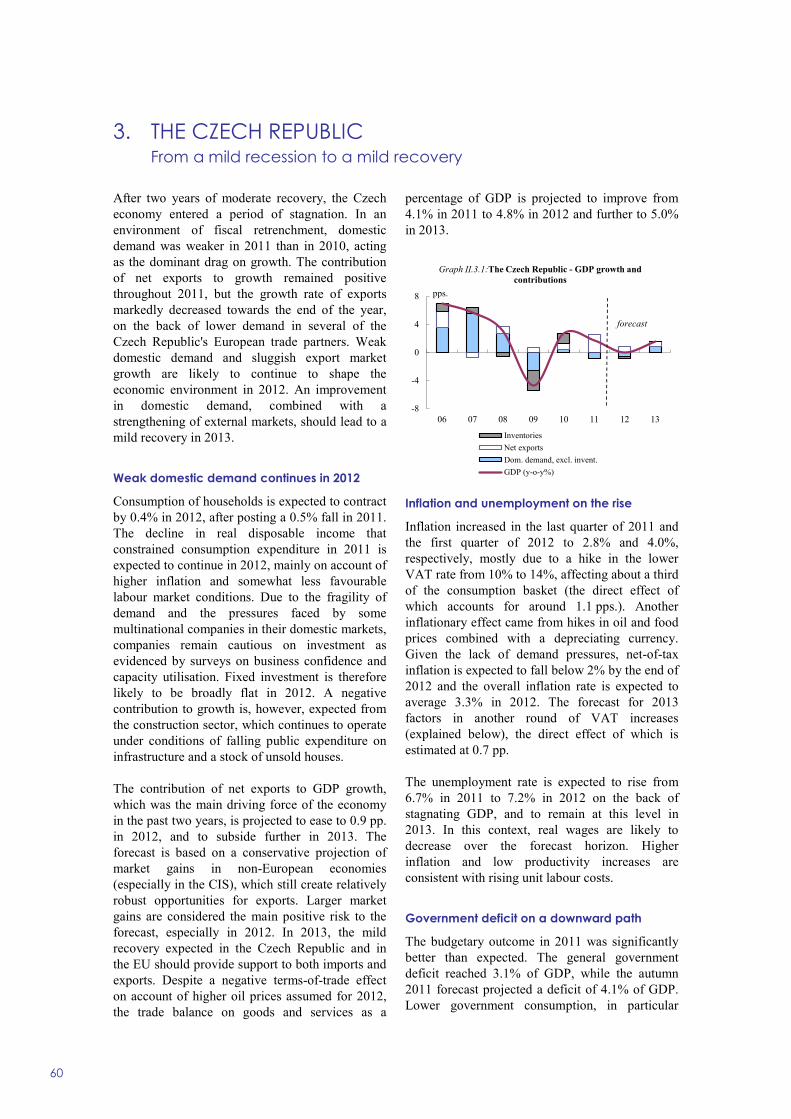
3. THE CZECH REPUBLIC From a mild recession to a mild recovery
60
After two years of moderate recovery, the Czech economy entered a period of stagnation. In an environment of fiscal retrenchment, domestic demand was weaker in 2011 than in 2010, acting as the dominant drag on growth. The contribution of net exports to growth remained positive throughout 2011, but the growth rate of exports markedly decreased towards the end of the year, on the back of lower demand in several of the Czech Republic's European trade partners. Weak domestic demand and sluggish export market growth are likely to continue to shape the economic environment in 2012. An improvement in domestic demand, combined with a strengthening of external markets, should lead to a mild recovery in 2013.
Weak domestic demand continues in 2012
Consumption of households is expected to contract by 0.4% in 2012, after posting a 0.5% fall in 2011. The decline in real disposable income that constrained consumption expenditure in 2011 is expected to continue in 2012, mainly on account of higher inflation and somewhat less favourable labour market conditions. Due to the fragility of demand and the pressures faced by some multinational companies in their domestic markets, companies remain cautious on investment as evidenced by surveys on business confidence and capacity utilisation. Fixed investment is therefore likely to be broadly flat in 2012. A negative contribution to growth is, however, expected from the construction sector, which continues to operate under conditions of falling public expenditure on infrastructure and a stock of unsold houses.
The contribution of net exports to GDP growth, which was the main driving force of the economy in the past two years, is projected to ease to 0.9 pp. in 2012, and to subside further in 2013. The forecast is based on a conservative projection of market gains in non-European economies (especially in the CIS), which still create relatively robust opportunities for exports. Larger market gains are considered the main positive risk to the forecast, especially in 2012. In 2013, the mild recovery expected in the Czech Republic and in the EU should provide support to both imports and exports. Despite a negative terms-of-trade effect on account of higher oil prices assumed for 2012, the trade balance on goods and services as a
percentage of GDP is projected to improve from 4.1% in 2011 to 4.8% in 2012 and further to 5.0% in 2013.
-8
-4
0
4
8
06 07 08 09 10 11 12 13
pps.
Graph II.3.1:The Czech Republic - GDP growth and contributions
InventoriesNet exportsDom. demand, excl. invent.GDP (y-o-y%)
forecast
Inflation and unemployment on the rise
Inflation increased in the last quarter of 2011 and the first quarter of 2012 to 2.8% and 4.0%, respectively, mostly due to a hike in the lower VAT rate from 10% to 14%, affecting about a third of the consumption basket (the direct effect of which accounts for around 1.1 pps.). Another inflationary effect came from hikes in oil and food prices combined with a depreciating currency. Given the lack of demand pressures, net-of-tax inflation is expected to fall below 2% by the end of 2012 and the overall inflation rate is expected to average 3.3% in 2012. The forecast for 2013 factors in another round of VAT increases (explained below), the direct effect of which is estimated at 0.7 pp.
The unemployment rate is expected to rise from 6.7% in 2011 to 7.2% in 2012 on the back of stagnating GDP, and to remain at this level in 2013. In this context, real wages are likely to decrease over the forecast horizon. Higher inflation and low productivity increases are consistent with rising unit labour costs.
Government deficit on a downward path
The budgetary outcome in 2011 was significantly better than expected. The general government deficit reached 3.1% of GDP, while the autumn 2011 forecast projected a deficit of 4.1% of GDP. Lower government consumption, in particular

Member States, The Czech Republic
Table II.3.1:Main features of country forecast - THE CZECH REPUBLIC
2010 Annual percentage changebn CZK Curr. prices % GDP 92-07 2008 2009 2010 2011 2012 2013
GDP 3775.2 100.0 3.1 3.1 -4.7 2.7 1.7 0.0 1.5 Private consumption 1899.6 50.3 3.7 2.8 -0.4 0.6 -0.5 -0.4 0.5 Public consumption 808.0 21.4 0.7 1.2 3.8 0.6 -1.4 -2.0 0.2 Gross fixed capital formation 923.0 24.4 5.3 4.1 -11.5 0.1 -1.2 0.0 2.1 of which : equipment 377.5 10.0 8.9 10.5 -18.3 -1.3 7.5 2.9 3.5 Exports (goods and services) 2561.9 67.9 10.3 4.0 -10.0 16.4 11.0 3.6 5.7 Imports (goods and services) 2441.4 64.7 12.3 2.7 -11.6 16.0 7.5 2.5 5.1 GNI (GDP deflator) 3521.0 93.3 - 5.8 -6.7 2.7 1.6 -0.1 1.3 Contribution to GDP growth : Domestic demand 3.5 2.7 -2.5 0.5 -0.8 -0.6 0.8
Inventories 0.3 -0.5 -3.0 1.4 -0.1 -0.3 0.0Net exports -0.6 0.9 0.8 0.9 2.6 0.9 0.7
Employment - 2.3 -1.2 -1.7 0.3 -0.1 0.2 Unemployment rate (a) - 4.4 6.7 7.3 6.7 7.2 7.2 Compensation of employees/head - 4.2 -1.2 3.7 1.6 2.0 2.1 Unit labour costs whole economy - 3.4 2.4 -0.7 0.2 1.9 0.8 Real unit labour costs - 1.5 0.5 1.0 0.9 -0.1 -0.3 Saving rate of households (b) - 9.4 10.7 10.3 8.9 8.9 8.7 GDP deflator 6.4 1.9 1.9 -1.7 -0.7 1.9 1.1 Harmonised index of consumer prices - 6.3 0.6 1.2 2.1 3.3 2.2 Terms of trade of goods - -1.9 2.9 -2.7 -2.4 -0.5 -0.5 Merchandise trade balance (c) -2.8 0.6 2.3 1.3 2.4 2.8 3.1 Current-account balance (c) -3.2 -2.9 -3.4 -4.4 -3.6 -3.2 -3.2 Net lending(+) or borrowing(-) vis-à-vis ROW (c) -3.3 -2.0 -1.3 -2.3 -1.6 -1.2 -1.3 General government balance (c) - -2.2 -5.8 -4.8 -3.1 -2.9 -2.6 Cyclically-adjusted budget balance (c) - -4.4 -5.2 -4.5 -2.8 -2.1 -1.8 Structural budget balance (c) - -4.4 -5.6 -4.6 -2.6 -1.8 -1.8 General government gross debt (c) - 28.7 34.4 38.1 41.2 43.9 44.9
(a) Eurostat definition. (b) gross saving divided by gross disposable income. (c) as a percentage of GDP.
61
intermediate consumption, which fell by almost 5% (0.4% of GDP), and public investment, which declined by more than 15% y-o-y (0.7% of GDP), were the main factors behind this.
In 2012, the general government balance is projected to improve to -2.9% of GDP. Consolidation measures approved in the 2012 budget include an increase in the lower VAT rate with an estimated fiscal impact of around 0.7% of GDP, a freeze in the central government sector wage bill (0.1% of GDP) and the introduction of a lottery tax (0.1% of GDP). Faced with worsening macroeconomic conditions, the Czech authorities approved additional expenditure cuts amounting to 0.6% of GDP in March 2012. These are expected to further reduce the operational costs of ministries and other central government bodies. A moderate rebound in public investment is projected over the forecast horizon.
Several factors should affect the budgetary outcome in 2013. The planned introduction of the private pension pillar could reduce revenue from the social security contributions by approximately 0.2% of GDP, but this effect would be more than compensated for by the sizeable consolidation package (1.2% of GDP) approved by the Czech government in April 2012. The package, which will form the basis for the 2013 budget proposal
and is taken into account in this forecast, includes a further 1 pp. increase in both VAT rates, lower indexation of pensions, stricter conditions for tax deductibility for the self-employed and an increase in the property transfer tax. The consolidation effort, together with a modest improvement in macroeconomic conditions, will result in a reduction of the general government deficit to 2.6% of GDP, while the structural balance is expected to improve by 0.8 pp. over the forecast horizon. The debt-to-GDP ratio is projected to increase further, reaching around 45% in 2013.
The budgetary projections are subject to two main risks. The first one is related to the co-financing of projects from the European Funds. As payments from the Funds were temporarily suspended due to irregularities, it cannot be excluded that some on-going projects will have to be financed entirely from national sources, which could lead to an increase in the general government deficit. The second risk concerns the financial implications of the law on compensation to churches currently discussed by the Parliament. Its approval would lead to a one-off increase in the general government deficit of approximately 1.5% of GDP.

4. DENMARK Subdued growth sustained by domestic demand
62
GDP growth in Denmark reached 1% in 2011 after stagnating during the second half of the year as the slowdown of the global economy took its toll. The improvement in confidence indicators and readings for exports in the first quarter of 2012 suggests that a gradual pick-up of activity is underway. However, as the external environment has deteriorated since last autumn, real GDP growth is expected to continue at a slow pace, reaching 1.1% in 2012 and 1.4% in 2013. This implies a downward revision of ¼ pp. in both years compared with the autumn forecast.
Driven mainly by domestic demand, and supported by the government's "kick-start" stimulus package as well as the pay-out of voluntary early retirement pension (VERP) contributions, Denmark's economic performance is, nevertheless, projected to be among the best for EU Member States this year. Towards the turn of the year, the recovery is expected to gain momentum slowly in line with a general improvement in the economic situation in the EU. Fiscal consolidation efforts in 2013, on the other hand, will act as a drag on growth.
Public initiatives support domestic demand
Given the high degree of economic uncertainty, the need for deleveraging and the tightening credit conditions, the household saving rate remained high in 2011 and the corporate saving rate even increased. As credit conditions are expected to remain tight over the forecast horizon, gross fixed capital formation will continue to be propped up largely by public initiatives such as the government's investment-driven "kick-start" and large-scale infrastructure projects, while low interest rates and an improving economic environment should gradually support firms' propensity to invest towards the turn of the year and in 2013.
Following the adoption of the retirement reform by Parliament, contributions to the VERP scheme are being reimbursed in 2012. Assuming that part of this reimbursement is consumed rather than reinvested in private pension funds, private consumption is expected to accelerate during the course of this year and to continue to grow at a moderate pace next year as households' real disposable income improves slowly. However, since real wage growth is now foreseen to be
negative this year and the outlook for growth is more subdued – also including a fragile housing market – private consumption growth is now expected to be more moderate throughout the forecast horizon. Nevertheless, the yearly growth rate for 2012 is set to remain at 1.4% as in the autumn forecast due to the higher-than-expected carry-over from 2011.
Elevated inflation in 2012
Real wages are likely to be contained by elevated inflation and a very moderate outcome from the spring round of private sector wage agreements. As a result of the sustained significant increase in energy prices over the past year as well as the effects of tax hikes, HICP is projected to be around 2.6% this year before dropping to 1.5% in 2013.
Moderate outlook for exports
Although moderate wage growth should support Denmark's competitiveness, export growth is projected to be significantly lower in 2012 than in 2011 due to the less favourable external environment. However, the large share of non-cyclical goods, e.g. pharmaceuticals, in Danish exports is likely to sustain export growth to some extent and limit the loss in export market shares. Furthermore, recent figures seem to suggest that Danish companies are beginning to take some advantage of the high growth in emerging markets. If this tendency continues, export performance could turn out better than projected. Due to the resilience of domestic demand, import growth should remain strong and the current-account surplus is set to decline, reflecting lower savings in the private sector, by 2013.
Continued stagnation in the labour market
The subdued growth outlook is unlikely to allow for a pick-up in private employment until next year whereas public employment should already start to head up somewhat this year in line with public consumption. The gradual improvement in economic conditions and employment prospects is likely to encourage more people to enter the labour market thereby lifting labour supply. Consequently, unemployment should remain broadly unchanged over the forecast horizon.

Member States, Denmark
Table II.4.1:Main features of country forecast - DENMARK
2010 Annual percentage changebn DKK Curr. prices % GDP 92-07 2008 2009 2010 2011 2012 2013
GDP 1754.6 100.0 2.2 -0.8 -5.8 1.3 1.0 1.1 1.4 Private consumption 850.9 48.5 2.2 -0.3 -4.2 1.9 -0.5 1.4 1.6 Public consumption 510.2 29.1 2.1 1.9 2.5 0.3 -1.0 1.3 0.3 Gross fixed capital formation 302.4 17.2 4.3 -4.2 -13.4 -3.8 0.4 4.6 3.2 of which : equipment 114.2 6.5 4.5 -2.7 -14.6 2.2 -1.6 6.0 4.6 Exports (goods and services) 883.0 50.3 4.9 3.3 -9.8 3.2 6.8 3.2 4.9 Imports (goods and services) 790.7 45.1 6.2 3.3 -11.6 3.5 5.2 5.0 5.4 GNI (GDP deflator) 1795.6 102.3 2.5 -0.3 -5.8 2.0 1.5 0.7 1.1 Contribution to GDP growth : Domestic demand 2.5 -0.6 -4.2 0.3 -0.5 1.8 1.4
Inventories 0.1 -0.3 -2.3 1.0 0.4 0.0 0.0Net exports -0.3 0.1 0.7 0.0 1.1 -0.7 0.0
Employment 0.6 1.7 -3.3 -2.2 -0.5 0.1 0.3 Unemployment rate (a) 5.7 3.4 6.0 7.5 7.6 7.7 7.6 Compensation of employees/head 3.5 3.5 2.8 2.5 1.7 1.7 1.6 Unit labour costs whole economy 1.9 6.1 5.7 -1.0 0.3 0.6 0.5 Real unit labour costs -0.1 1.8 4.6 -4.7 -0.5 -1.3 -1.0 Saving rate of households (b) 6.5 5.1 8.2 8.0 6.8 7.0 6.4 GDP deflator 1.9 4.2 1.0 3.9 0.8 2.0 1.5 Harmonised index of consumer prices 1.8 3.6 1.1 2.2 2.7 2.6 1.5 Terms of trade of goods 0.9 0.3 4.5 3.3 -1.6 0.1 0.1 Merchandise trade balance (c) 3.5 0.2 2.5 2.8 2.9 2.1 2.0 Current-account balance (c) 2.1 2.9 3.3 5.5 6.5 5.2 4.9 Net lending(+) or borrowing(-) vis-à-vis ROW (c) 2.1 2.9 3.3 5.6 6.7 4.9 4.7 General government balance (c) 0.6 3.2 -2.7 -2.5 -1.8 -4.1 -2.0 Cyclically-adjusted budget balance (c) 0.4 2.4 0.6 0.1 0.2 -2.6 -1.0 Structural budget balance (c) - 2.4 0.6 0.1 0.2 -1.7 -1.0 General government gross debt (c) 55.8 33.4 40.6 42.9 46.5 40.9 42.1
(a) Eurostat definition. (b) gross saving divided by gross disposable income. (c) as a percentage of GDP.
63
Graph II.4.1: Denmark - GDP growth and contributions
-15
-10
-5
0
5
10
15
04 05 06 07 08 09 10 11 12 13
pps.
Imports Domestic demandExports GDP (y-o-y%)
forecast
Budget affected by one-off and "kick-start"
Overall, the deficit for 2012 is revised down by 0.4 pp. compared with the autumn forecast to 4.1% of GDP. The revision implies that the negative budgetary impact of the "kick-start" (0.4% of GDP) and lower-than-anticipated GDP growth will be more than offset by higher tax revenues. In particular, expected revenues from the pension yield tax and North Sea activities, benefiting from a higher oil price, are higher than in the autumn. The widening of the general government deficit from 2011 to 2012 reflects, in addition to the stimulus package, the absence of the type of extraordinary pension yield revenues that affected
the government balance in 2011, as well as the lump sum reimbursement of VERP contributions estimated at almost 1% of GDP. In the absence of this one-off measure and on the back of government consolidation, the budget deficit is projected to fall back to 2.0% of GDP in 2013.
The structural balance is set to deteriorate from 0.2% of GDP in 2011 to -1.0% of GDP in 2013. However, the structural balance includes very volatile revenue items such as pension yield tax and North Sea oil revenues. Furthermore, the low current estimates of potential output growth may overstate the contribution of the economic cycle to the improvement of the budget balance. From a bottom-up perspective, net discretionary measures are estimated to yield a consolidation of around 1½% of GDP over the period 2011-13.
Part of the budget deficits in 2012-13 will be financed by reducing the government's account with Danmarks Nationalbank and will only affect the net and not the gross government debt. Thus, although the country is running deficits, Denmark's gross public debt is projected to fall from 46.5% of GDP in 2011 to 42.1% in 2013.

5. GERMANY Domestic demand to drive growth over the forecast horizon
64
Pick-up in activity after contraction in late 2011
Real GDP expanded by 3.0% in 2011 (after 3.7% in 2010), reflecting the still-strong momentum of activity, especially in the first half of the year. Growth was predominantly driven by domestic demand, which contributed 2.2 pps. to the annual rate. Private consumption saw its largest increase in five years. This was supported by sizeable real income gains and a slight reduction in the saving rate, both on the back of further benign labour market developments, as the number of people employed reached its highest level in 20 years. Gross fixed capital formation also continued to expand markedly, being the largest single contributor to GDP growth. This reflected both unabated investment in machinery and equipment and the strongest increase in construction since the mid-1990s. Net external trade contributed 0.8 pp. to GDP growth as exports remained buoyant, while imports were also robust on the back of strong domestic demand.
The strong annual growth figures mask the fact that growth dynamics slowed markedly in the course of 2011 as the euro-area sovereign-debt crisis deepened. Uncertainty weighed on the sentiment of economic agents, while new industrial orders declined considerably in the second half of 2011. Following a gain of 0.6% q-o-q (seasonally and working-day adjusted) in the third quarter, the growth momentum was temporarily interrupted in the last quarter of the year, with a 0.2% q-o-q decline in real GDP. Exports contracted more strongly than imports and gross fixed capital formation (notably construction) was the only domestic demand component making a positive growth contribution.
Overall, available short-term indicators for the first quarter of 2012 point to stabilisation. In particular, sentiment indicators for firms and households have been improving, although industrial production suffered a setback in February as the harsh weather led to a marked decline in construction activity. GDP is therefore expected to have stagnated in the first quarter. The second quarter is likely to see some technical counter-reaction to the previous quarter's weather-related effects. Moreover, although the trend in new orders – both from domestic sources and from abroad – is still weak, firms' assessment of the business outlook has been
improving over the past months and the crisis-related uncertainty should slowly fade away. Overall, activity is therefore expected to strengthen in the course of the year, with GDP set to expand by 0.7% for 2012 as a whole. On the back of sound economic fundamentals, including strong labour market performance, strong competitiveness and corporate balance-sheet positions, the limited need for household and public balance-sheet adjustments, as well as a noticeable monetary stimulus, domestic demand is set to remain a major growth driver over the forecast horizon. As the effects of the sovereign-debt crisis fade further, the pace of expansion in the second half of 2012 and in 2013 is expected to be broadly in line with the economy's medium-term growth potential. The sovereign-debt crisis and oil prices remain the key risks to the German growth outlook.
Real income growth to support private consumption - inflation permitting
Having recorded a strong rise in 2011, household consumption should be the main contributor to GDP growth in 2012. Steady gains in employment should underpin household confidence, while recent wage agreements also point to sound nominal income growth. Prospects for real income growth and consumption are therefore good, unless oil price increases translate into a more persistent rise in inflation than anticipated in the baseline scenario. Private consumption should continue to expand robustly in 2013, amid still strong nominal income growth and lower inflation.
Graph II.5.1: Germany - GDP growth and contributions
-6
-3
0
3
6
05 06 07 08 09 10 11 12 13Investment Net exportsConsumption InventoriesGDP growth (y-o-y%)
pps. forecast

Member States, Germany
65
Investment: between uncertainty and favourable financing conditions
Overall, gross fixed capital formation is set to expand considerably more slowly this year than last year. Amid the current uncertainty, some plans for investment in machinery and equipment are likely to remain on hold during the first half of the year. However, the monetary environment continues to be supportive, as reflected by favourable financing conditions for German firms and households. This should support machinery and equipment investment as activity and capacity utilisation pick up in the course of the year. While the end of temporary stimulus measures weighs on public investment, available indicators point to continued dynamic private housing investment as activity continues to benefit from low real interest rates, possibly in conjunction with an increase in the perceived risk of investment alternatives.
Net exports to act as a drag on growth
Export prospects are noticeably weaker than in 2011, with 40% of German exports going to euro-area Member States, some of which are likely to see very subdued imports due to weak domestic demand. A gradual recovery of intra-EU export growth is expected as the crisis-related uncertainty dissipates, while exports to emerging economies should prove resilient. In view of the expected noticeable pick-up in unit labour cost this year, no significant market share gains to offset the relatively weak export prospects have been factored in. Exports should regain momentum in the course of 2012 and 2013. Still, imports are expected to expand even more quickly, due to lively domestic demand. Together with a sizeable terms-of-trade deterioration in 2012, reflecting high energy prices, the projected negative external trade contribution to growth should be reflected in a further gradual narrowing of Germany's current-account surplus over the forecast horizon.
Labour market still improving
Employment continued to rise markedly in 2011 (by 1.3%), with the pace even accelerating as activity declined in the fourth quarter. The employment gains resulted in a less than proportional reduction in the unemployment rate (to 5.8%), given an increase in labour supply despite the long-term unfavourable demographic trend. Labour supply benefitted from a further increase in participation, notably among older cohorts, as well as from a stronger-than-expected
net immigration flow, also following the end of restrictions for workers from eight of the Member States that joined the EU in 2004. With a noticeable carry-over from 2011, a further expansion of employment by 0.12 million already in the first two months of 2012 and firms' assessment of the business outlook improving, employment is expected to increase by 1.0% this year and by 0.4% in 2013. The unemployment rate should fall further to an average of 5.3% next year, despite a further increase in labour supply due to further significant net immigration flows and participation increases reflecting the positive developments in the German labour market.
Wage growth and inflation
Amid the increasing tightness of the labour market, trade unions have tabled demands for significant wage increases in several sectors. For the public sector, often a reference for private sector wage negotiations, an agreement was reached for the federal level and municipalities resulting in a 6.3% wage increase over the forecast horizon. Together with wage agreements from 2011, this is projected to result in growth in wages per employee of around 3% this year and next. With subdued productivity developments this year, as firms have held on to their staff amid the winter semester's relatively weak activity given prospects of increasing labour market tightness, this is projected to result in a sizeable increase in unit labour costs.
Wage cost developments should also translate into a slight pick-up in core inflation to around 1¾% on average in 2013. In 2012, inflationary pressures from commodity prices are projected to remain strong, after oil prices already surprised on the upside in late 2011 and the first quarter of this year. Overall, this should result in an average consumer-price inflation rate of 2.3% this year as measured by the HICP. With moderating commodity prices, inflation should then return to below the 2% benchmark in 2013.
Significant consolidation in 2011
The general government deficit declined from 4.3% of GDP in 2010 to 1% of GDP in 2011, benefiting from favourable cyclical conditions, the robust labour market, the phasing-out of stimulus measures, specific fiscal consolidation efforts and the fading-out of the one-off impact of financial sector stabilisation measures on the deficit in 2010.

European Economic Forecast, Spring 2012
Table II.5.1:Main features of country forecast - GERMANY
2010 Annual percentage changebn EUR Curr. prices % GDP 92-07 2008 2009 2010 2011 2012 2013
GDP 2476.8 100.0 1.5 1.1 -5.1 3.7 3.0 0.7 1.7 Private consumption 1423.0 57.5 1.1 0.6 -0.1 0.6 1.5 0.9 1.2 Public consumption 488.8 19.7 1.4 3.1 3.3 1.7 1.4 1.2 1.4 Gross fixed capital formation 433.6 17.5 1.1 1.7 -11.4 5.5 6.4 2.1 4.7 of which : equipment 170.8 6.9 2.4 3.8 -22.8 10.0 7.6 2.7 7.2 Exports (goods and services) 1159.8 46.8 6.5 2.7 -13.6 13.7 8.2 2.9 5.0 Imports (goods and services) 1024.4 41.4 5.6 3.3 -9.2 11.7 7.4 3.8 6.0 GNI (GDP deflator) 2522.8 101.9 1.6 0.6 -4.3 3.4 2.8 0.7 1.7 Contribution to GDP growth : Domestic demand 1.1 1.2 -1.6 1.6 2.2 1.2 1.9
Inventories -0.1 0.0 -0.9 0.6 0.0 -0.2 0.0Net exports 0.5 -0.1 -2.7 1.4 0.8 -0.3 -0.2
Employment 0.2 1.2 0.0 0.5 1.3 1.0 0.4 Unemployment rate (a) 8.9 7.5 7.8 7.1 5.9 5.5 5.3 Compensation of employees/f.t.e. 2.0 2.1 0.0 2.0 3.0 2.7 2.8 Unit labour costs whole economy 0.7 2.3 5.5 -1.1 1.4 3.0 1.5 Real unit labour costs -0.7 1.5 4.2 -1.7 0.6 1.4 -0.4 Saving rate of households (b) 16.2 17.4 17.0 17.0 16.7 16.7 16.7 GDP deflator 1.4 0.8 1.2 0.6 0.8 1.6 1.8 Harmonised index of consumer prices - 2.8 0.2 1.2 2.5 2.3 1.8 Terms of trade of goods 0.3 -1.8 6.0 -2.5 -2.8 -1.0 0.3 Merchandise trade balance (c) 4.4 7.3 5.7 6.4 6.0 5.6 5.4 Current-account balance (c) 1.1 6.2 5.8 5.8 5.3 4.7 4.5 Net lending(+) or borrowing(-) vis-à-vis ROW (c) 1.1 6.2 5.8 5.8 5.3 4.7 4.5 General government balance (c) -2.9 -0.1 -3.2 -4.3 -1.0 -0.9 -0.7 Cyclically-adjusted budget balance (c) -2.9 -1.1 -1.3 -3.5 -1.0 -0.4 -0.3 Structural budget balance (c) - -0.8 -1.3 -2.3 -0.8 -0.4 -0.3 General government gross debt (c) 59.0 66.7 74.4 83.0 81.2 82.2 80.7
(a) Eurostat definition. (b) gross saving divided by gross disposable income. (c) as a percentage of GDP.
66
In particular, the strong growth in tax revenues of 7.1% caused the deficit to fall below the 1.3% of GDP predicted in the autumn forecast. The debt-to-GDP ratio decreased to 81.2% in 2011 after having surged by 8.6 pps. to 83.0% in 2010, notably due the transfer of impaired assets to "bad banks" as part of financial sector stabilisation.
Slight fiscal improvement in 2012 and 2013
In line with the more moderate growth outlook, the deficit is projected to fall only slightly, to 0.9% of GDP in 2012 and to 0.7% of GDP in 2013. In 2012, consolidation should benefit from the phasing-out of the remaining stimulus measures (around 0.4% of GDP). In contrast, the recent wage agreements for the public sector at federal and municipal level are estimated to increase public expenditure by around 0.2% of GDP in 2012 and by a further 0.1% of GDP in 2013. The reduction in the pension contribution rate of 0.3 pp. at the beginning of 2012 and an expected further 0.4 pp. in 2013, reflecting the favourable financial situation of the pension insurance, will lower revenues by about 0.1% of GDP in 2012 and 2013 respectively. The tax reform proposed by the federal government, which aims to reduce fiscal drag and would also lead to revenue losses of around 0.1% of GDP in 2013, is still due for adoption by the Federal Council and has therefore
not been taken into account. The structural general government deficit is estimated to fall from 0.8% of GDP in 2011 to 0.4% of GDP in 2012 and to 0.3% of GDP in 2013. Gross debt is projected to increase to 82.2% of GDP in 2012 as a result of the the euro stabilisation measures and to drop again to 80.7% of GDP in 2013 due to the denominator effect of GDP growth. The expected transfer of a second portfolio of impaired assets from WestLB to its "bad bank" ("Erste Abwicklungsanstalt") has not yet been specified, but is likely to further increase the debt level in 2012. On the other hand, the winding-up of assets accumulated in "bad banks" could potentially reduce the debt stock.
-2
-1
0
1
2
3
4
5
6
99 00 01 02 03 04 05 06 07 08 09 10 11 12 13
% of GDP
50
55
60
65
70
75
80
85
Gross debt (rhs) Deficit (lhs)
forecas t% of GDP
Graph II.5.2: Germany - General government gross debt and deficit
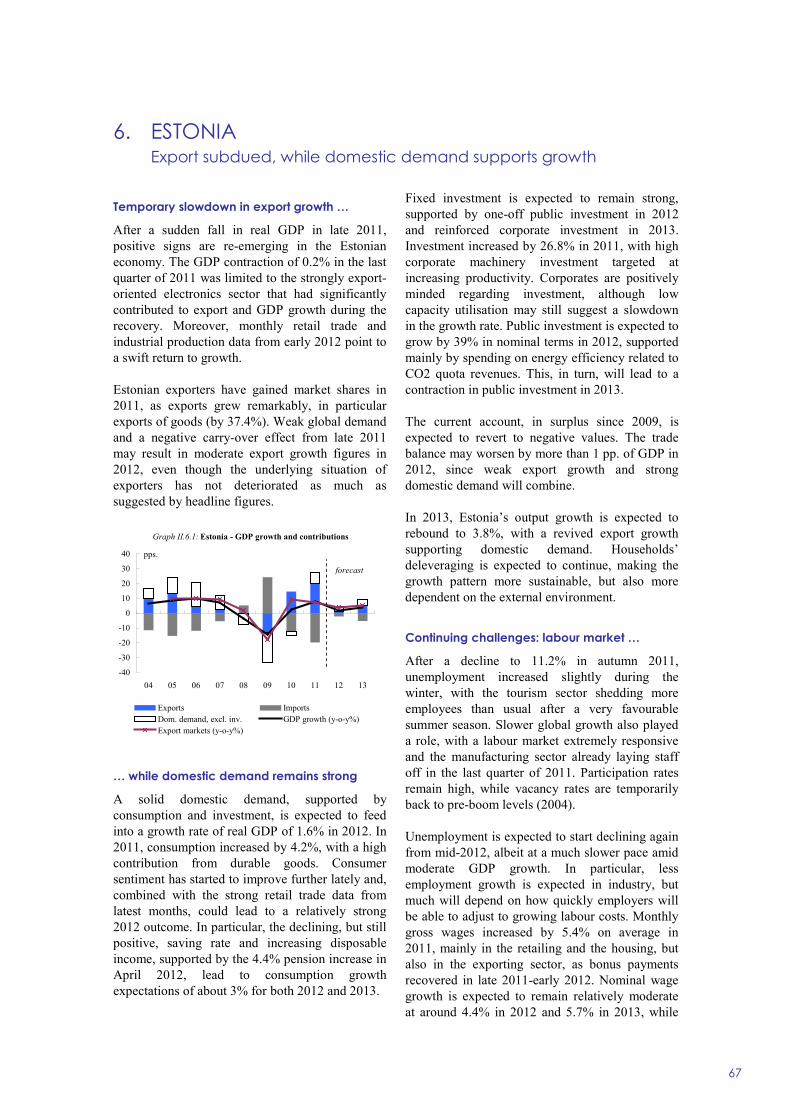
6. ESTONIA Export subdued, while domestic demand supports growth
67
Temporary slowdown in export growth …
After a sudden fall in real GDP in late 2011, positive signs are re-emerging in the Estonian economy. The GDP contraction of 0.2% in the last quarter of 2011 was limited to the strongly export-oriented electronics sector that had significantly contributed to export and GDP growth during the recovery. Moreover, monthly retail trade and industrial production data from early 2012 point to a swift return to growth.
Estonian exporters have gained market shares in 2011, as exports grew remarkably, in particular exports of goods (by 37.4%). Weak global demand and a negative carry-over effect from late 2011 may result in moderate export growth figures in 2012, even though the underlying situation of exporters has not deteriorated as much as suggested by headline figures.
Graph II.6.1: Estonia - GDP growth and contributions
-40
-30
-20
-10
0
10
20
30
40
04 05 06 07 08 09 10 11 12 13
Exports ImportsDom. demand, excl. inv. GDP growth (y-o-y%)Export markets (y-o-y%)
forecast
pps.
… while domestic demand remains strong
A solid domestic demand, supported by consumption and investment, is expected to feed into a growth rate of real GDP of 1.6% in 2012. In 2011, consumption increased by 4.2%, with a high contribution from durable goods. Consumer sentiment has started to improve further lately and, combined with the strong retail trade data from latest months, could lead to a relatively strong 2012 outcome. In particular, the declining, but still positive, saving rate and increasing disposable income, supported by the 4.4% pension increase in April 2012, lead to consumption growth expectations of about 3% for both 2012 and 2013.
Fixed investment is expected to remain strong, supported by one-off public investment in 2012 and reinforced corporate investment in 2013. Investment increased by 26.8% in 2011, with high corporate machinery investment targeted at increasing productivity. Corporates are positively minded regarding investment, although low capacity utilisation may still suggest a slowdown in the growth rate. Public investment is expected to grow by 39% in nominal terms in 2012, supported mainly by spending on energy efficiency related to CO2 quota revenues. This, in turn, will lead to a contraction in public investment in 2013.
The current account, in surplus since 2009, is expected to revert to negative values. The trade balance may worsen by more than 1 pp. of GDP in 2012, since weak export growth and strong domestic demand will combine.
In 2013, Estonia’s output growth is expected to rebound to 3.8%, with a revived export growth supporting domestic demand. Households’ deleveraging is expected to continue, making the growth pattern more sustainable, but also more dependent on the external environment.
Continuing challenges: labour market …
After a decline to 11.2% in autumn 2011, unemployment increased slightly during the winter, with the tourism sector shedding more employees than usual after a very favourable summer season. Slower global growth also played a role, with a labour market extremely responsive and the manufacturing sector already laying staff off in the last quarter of 2011. Participation rates remain high, while vacancy rates are temporarily back to pre-boom levels (2004).
Unemployment is expected to start declining again from mid-2012, albeit at a much slower pace amid moderate GDP growth. In particular, less employment growth is expected in industry, but much will depend on how quickly employers will be able to adjust to growing labour costs. Monthly gross wages increased by 5.4% on average in 2011, mainly in the retailing and the housing, but also in the exporting sector, as bonus payments recovered in late 2011-early 2012. Nominal wage growth is expected to remain relatively moderate at around 4.4% in 2012 and 5.7% in 2013, while

European Economic Forecast, Spring 2012
Table II.6.1:Main features of country forecast - ESTONIA
2010 Annual percentage changebn EUR Curr. prices % GDP 92-07 2008 2009 2010 2011 2012 2013
GDP 14.3 100.0 - -3.7 -14.3 2.3 7.6 1.6 3.8 Private consumption 7.4 52.1 - -6.1 -15.6 -1.7 4.2 2.8 3.0 Public consumption 3.0 20.9 - 5.0 -1.6 -1.1 1.6 1.0 1.7 Gross fixed capital formation 2.7 18.8 - -15.1 -37.9 -9.1 26.8 8.3 8.2 of which : equipment 1.1 7.7 - -17.9 -50.2 26.1 44.7 4.0 15.0 Exports (goods and services) 11.4 79.4 - 0.6 -18.6 22.5 24.9 1.4 5.6 Imports (goods and services) 10.4 72.5 - -6.3 -32.4 20.6 27.0 2.3 5.9 GNI (GDP deflator) 13.6 95.0 - -2.3 -12.0 0.0 7.5 2.2 3.8 Contribution to GDP growth : Domestic demand - -7.9 -20.0 -3.1 7.6 3.4 3.8
Inventories - -2.5 -3.2 3.4 2.6 -1.1 0.1Net exports - 5.3 11.1 2.5 0.1 -0.7 0.0
Employment -1.4 0.2 -10.0 -4.8 7.0 0.6 1.2 Unemployment rate (a) - 5.5 13.8 16.9 12.5 11.6 10.5 Compensation of employees/f.t.e. - 9.7 -3.4 1.4 1.4 4.0 5.4 Unit labour costs whole economy - 14.1 1.4 -5.6 0.8 3.0 2.8 Real unit labour costs - 8.3 2.4 -6.6 -2.8 0.0 -0.2 Saving rate of households (b) - 3.4 11.6 9.6 6.7 4.8 3.8 GDP deflator - 5.3 -1.0 1.1 3.7 2.9 2.9 Harmonised index of consumer prices - 10.6 0.2 2.7 5.1 3.9 3.4 Terms of trade of goods - -0.6 -2.2 -1.4 -2.7 -0.4 0.1 Merchandise trade balance (c) - -12.1 -4.0 -2.3 -3.0 -4.1 -4.1 Current-account balance (c) - -9.1 4.6 3.8 0.6 -0.3 -0.3 Net lending(+) or borrowing(-) vis-à-vis ROW (c) - -7.9 8.1 7.4 5.1 3.4 2.5 General government balance (c) - -2.9 -2.0 0.2 1.0 -2.4 -1.3 Cyclically-adjusted budget balance (c) - -4.6 1.0 2.6 1.5 -1.8 -1.0 Structural budget balance (c) - -4.8 -0.9 -0.5 -0.2 -0.8 -0.5 General government gross debt (c) - 4.5 7.2 6.7 6.0 10.4 11.7
(a) Eurostat definition. (b) gross saving divided by gross disposable income. (c) as a percentage of GDP. Note : Contributions to GDP growth may not add up due to statistical discrepancies.
68
real wage growth should become increasingly positive, at around 0.5% in 2012 and 2.3% in 2013.
… and rising prices
After negative values in the first half of 2010, average annual HICP inflation rapidly rose and reached 5.1% in 2011, spurred by high food and oil prices. However, inflation is expected to slow down to 3.9% in 2012, as food price inflation recedes. Nevertheless, housing costs and energy prices will continue to drive inflation. In 2013, inflation is expected to maintain at around 3.4%, pulled upwards by the completion of the electricity distribution reform on 1 January 2013. In parallel, core inflation is forecast to accelerate again and near headline inflation towards the end of the year.
Public finances under pressure due to weaker economic growth and significant investment obligations
The general government balance recorded a surplus of 1% of GDP in 2011 due to the strong employment growth and the positive one-off effects related to sales of Kyoto units (35) combined
(35) An Assigned Amount (or 'Kyoto' Unit) represents an
allowance to emit greenhouse gases. In 2010-12, the one-
with substantial delays in implementing the corresponding investment projects.
Going forward, a mix of cyclical and one-off factors would exert downward pressure on public finances. The deficit is expected to reach 2.4% and 1.3% of GDP in 2012 and 2013 respectively. Among the most significant measures affecting public finances are a number of one-off projects and the planned pension increases. Moreover, the cessation of the temporary measures introduced in 2009 – a suspension of the contributions to the II pillar pension funds and the temporary limitations to local governments borrowing – will negatively affect the general government position. In 2013, total current expenditure is set to grow by 4.5% due to expected increases in public sector wages and the carry-over of the one-off investment projects.
Net of cyclical factors and one-offs, the general government deficit is estimated at 0.8% and 0.5% of GDP in 2012 and 2013. The general government debt will increase over the forecast horizon, to 11.7% of GDP in 2013.
off revenues related to the quota sales are expected to amount to EUR 373 million, and have to be invested in 2011-13.
7. IRELAND On-going domestic adjustment supported by export growth
69
The Irish economy stabilises in 2011
The Irish economy returned to growth in 2011 after three years of contraction. GDP increased by 0.7% for the year, although the divergence between the export-oriented and domestic sectors continued. While net exports added 4.7 pps. to growth, domestic demand continued to contract, as household balance-sheet adjustment continued, and both fiscal consolidation and contracting employment reduced disposable incomes. The effects of public and private sector deleveraging will continue to weigh on growth in 2012. However this will be offset again by external demand, so that overall real GDP growth of 0.5% is forecast for this year. Growth is then expected to pick up to 1.9% in 2013 as domestic demand stabilises and trading partner growth increases.
Domestic demand to contract again
Domestic demand fell for the fourth successive year in 2011. Private consumption decreased by 2.7%, government consumption by 3.7%, and investment by 10.6%. For 2012, the contribution to growth from domestic demand is set to be negative once again, albeit smaller. In 2013, the contribution to growth from domestic demand will be essentially flat, as investment levels stabilise, household consumption returns to growth (due to a slight decline of the precautionary element of savings) and public consumption continues to be reduced.
Exports set to remain key engine of growth
Irish exports expanded by a healthy 4.1% in 2011, although there was some slowdown in the second half of the year on the back of the weaker pace of activity in trading partners. Export growth was driven by the solid performance of the capital-intensive multinational sector. Gains were also seen by indigenous firms due to competitiveness improvements (unit labour costs continued to fall on the back of productivity improvements and wage moderation). Export growth is expected to slow to 3.2% in 2012. Prospects for demand in Ireland's trading partners are mixed, with the small contraction in the euro area expected to be offset by an upward revision to US growth.
Employment stabilises and inflation stays low
Although employment contracted by 2.1% in 2011 as a whole, it grew by a seasonally adjusted 0.6% in the final quarter of 2011, the first quarter of employment growth since 2007. This growth came from export-oriented sectors such as IT, tourism and manufacturing. While the broader employment situation is improving, agreed reductions in public sector employment and firm-specific developments in the financial sector will lead to a further employment contraction for 2012 as a whole. For 2013, some employment growth, albeit slow, is expected, as the drag on growth from domestic demand slows. This should lead to a small fall in the unemployment rate to 13.6% as participation remains flat and net outward migration continues. Inflation is forecast to rise slightly to 1.7% in 2012. Core inflation will stay low, with upward pressure on the headline figures coming from higher energy prices, indirect taxes and a number of administered price increases throughout 2012. Inflation is expected to decline to 1.2% in 2013 as energy price-related effects fall out of the annual comparison.
Fiscal adjustment on track
The headline government deficit stood at 13.1% of GDP in 2011. Excluding one-off bank support measures of 3.7% of GDP, the underlying deficit was 9.4% of GDP. The better-than-expected outturn reflects expenditure savings achieved through tight expenditure control, prudent design of the budget and higher-than-expected revenues from fees for bank guarantees and government's investment in the banks. These, together with savings on the interest bill (following reductions in margins on EU loans), outweighed the effect of the challenging macroeconomic backdrop.
The general government deficit is projected to decrease to 8.3% of GDP in 2012, below the government's 2012 budget forecast (8.6% of GDP). The budget introduced a fiscal adjustment of 2% of GDP in new measures on top of ¾% of GDP from measures already introduced in 2011. A further improvement comes from lower interest expenditure, higher revenues from both fees for bank guarantees and bank dividends, as well as the stronger-than-expected employment figures since the budget. One-off bank support measures of 1%

European Economic Forecast, Spring 2012
Table II.7.1:Main features of country forecast - IRELAND
2010 Annual percentage changebn EUR Curr. prices % GDP 92-07 2008 2009 2010 2011 2012 2013
GDP 156.0 100.0 6.6 -3.0 -7.0 -0.4 0.7 0.5 1.9 Private consumption 79.3 50.8 5.6 -1.4 -7.2 -0.9 -2.7 -1.7 0.3 Public consumption 29.3 18.8 5.3 1.2 -3.7 -3.1 -3.7 -3.8 -2.7 Gross fixed capital formation 18.0 11.5 7.9 -10.1 -28.8 -25.1 -10.6 -4.0 1.0 of which : equipment 6.1 3.9 8.8 -12.4 -23.5 -16.9 -3.0 2.4 5.7 Exports (goods and services) 157.7 101.1 11.6 -1.1 -4.2 6.3 4.1 3.2 4.2 Imports (goods and services) 127.9 82.0 11.0 -3.0 -9.3 2.7 -0.7 1.2 3.0 GNI (GDP deflator) 129.3 82.9 6.2 -3.0 -10.7 -0.8 -2.7 -1.3 1.4 Contribution to GDP growth : Domestic demand 5.3 -3.0 -10.7 -5.0 -3.3 -1.9 -0.2
Inventories 0.0 -0.9 -0.9 0.9 0.9 0.0 0.0Net exports 1.7 1.2 3.4 3.7 4.7 2.3 2.0
Employment 3.8 -1.1 -8.1 -4.2 -2.1 -0.6 0.7 Unemployment rate (a) 8.0 6.3 11.9 13.7 14.4 14.3 13.6 Compensation of employees/head 5.3 5.4 -1.2 -3.2 -1.4 -0.8 0.1 Unit labour costs whole economy 2.5 7.5 -2.4 -6.9 -4.1 -1.9 -1.2 Real unit labour costs -1.1 10.1 1.7 -4.6 -3.7 -3.1 -2.3 Saving rate of households (b) - 11.1 14.7 13.4 11.2 10.5 11.1 GDP deflator 3.7 -2.3 -4.1 -2.4 -0.4 1.2 1.2 Harmonised index of consumer prices - 3.1 -1.7 -1.6 1.2 1.7 1.2 Terms of trade of goods -0.5 -5.5 6.1 -3.4 -8.1 -2.5 -2.5 Merchandise trade balance (c) 19.6 13.2 20.2 23.4 23.3 24.5 25.4 Current-account balance (c) 0.2 -5.6 -2.9 0.5 0.0 1.6 3.1 Net lending(+) or borrowing(-) vis-à-vis ROW (c) 0.9 -5.6 -3.7 0.1 0.1 1.4 2.7 General government balance (c) 0.6 -7.3 -14.0 -31.2 -13.1 -8.3 -7.5 Cyclically-adjusted budget balance (c) 0.1 -7.3 -11.7 -29.2 -12.0 -7.8 -7.9 Structural budget balance (c) - -7.3 -9.7 -9.6 -8.4 -8.1 -7.9 General government gross debt (c) 52.0 44.2 65.1 92.5 108.2 116.1 120.2
(a) Eurostat definition. (b) gross saving divided by gross disposable income. (c) as a percentage of GDP.
70
of GDP are provisionally treated as financial transactions until it is confirmed by the Irish statistical authorities, in consultation with Eurostat.
Graph II.7.1: Ireland - General government debt and deficit, one-offs and GDP growth
-10-505
101520253035
05 06 07 08 09 10 11 12 13
% of GDPy-o-y%
-40
0
40
80
120
General government debt (rhs)Deficit-increasing one-off measures Government deficit excluding one-offsGDP growth (y-o-y%)
forecast
% of GDP
For 2013, the projected government deficit of 7.5% of GDP includes a planned adjustment of 2.1% of GDP, of which two thirds will fall on expenditure. Estimates of the annual change in the structural balance are smaller due to low potential growth following structural change in the economy.
The debt-to-GDP ratio is projected to peak at 120% of GDP in 2013. The increase in debt is
driven by still-high primary deficits, additional banking support measures, and rising debt servicing costs. The gross debt level is also affected by the substantial precautionary cash balances, which are assumed at 7½% of GDP at the end of 2013.
Risks remain balanced
Risks to the macroeconomic and fiscal outlook remain broadly balanced. Downside risks include the continuing squeeze on disposable incomes as households seek to deleverage in light of the substantial fall in their net wealth since 2008, the bulk of it due to declining property values. Lending to the SME and household sector continues to contract. On the production side, there is potential for a number of drugs falling off-patent this year and thus depressing industrial output. In terms of upside risks, any improvement in trading partner growth may pass through to increased exports and employment. Given the competitiveness improvements achieved since 2008, Ireland may see an increase in its market share of global trade. Finally, the low-interest-rate environment may allow a smaller contraction in private consumption while still supporting the necessary household balance sheet repair.

8. GREECE An economy longing for the turnaround
71
Looking for the turning point in activity …
The contraction in economic activity in the fourth quarter of 2011 was far deeper than expected. The quarterly accounts indicate that real GDP fell by 7.5% in the last three months of 2011, compared with the same quarter of 2010. For the year as a whole, real GDP is estimated to have contracted by 6.9%. In 2012 a further contraction is expected, resulting from both a significant fall in internal demand and less dynamism in exports than expected. Households' disposable income being hit by rising unemployment, cuts in private sector wages and the fiscal measures will keep domestic demand contracting. Also, unfavourable business and consumer sentiment and difficulties in access to credit for firms and households will contribute to their postponing spending decisions. The recovery, which was previously expected for this year, will be further delayed with, at best, an insignificant improvement in activity in 2013.
Employment has taken a heavy blow in the face of contracting economic activity. Total employment declined by almost 7% in 2011 and an additional fall is forecast in 2012, with the unemployment rate projected at 20%. Labour market reforms are expected to provide a significant contribution towards both stabilising the employment level and creating new jobs in the medium-term perspective; however, employment is not expected to stabilise before 2013, and the subsequent recovery in the number of jobs will be slow.
… while internal devaluation gains momentum
Greek net exports are making a positive contribution to GDP and will remain a major source of growth in 2012. But the extent of this positive effect will depend on Greek exporters' ability to secure benefits from the labour market and sectoral reforms through increased productivity, lower production costs, and therefore gains in competitiveness. The gains in market shares that are projected for 2012 and 2013 are only a fraction of the losses seen during the previous decade.
The current-account deficit, although contracting, remains at an unsustainable level. It was still above 10% of GDP in 2011, 2 points better than in 2010 and 4 points below 2009. The slow correction in
the external imbalance will continue in 2012 and in 2013, driven by growing exports and an expected further contraction in imports, reflecting forecast developments in domestic demand, but also shifts in relative prices. The current account should also improve in 2012 in the context of restructuring of government debt and the concomitant reduction of interest paid to the rest of the world.
Graph II.8.1: Greece - Export market shares - Goods and services
75
80
85
90
95
100
105
05 06 07 08 09 10 11 12 13
forecast
index, 2005=100
Inflation inertia remains high for an economy that is entering its fifth year of recession. Both HICP and constant tax inflation have remained persistently positive, in contradiction to the expectation of a fast internal devaluation. However, the low level of economic activity in 2012 and the reduction in private sector wages is expected to moderate prices, with slightly negative inflation rates expected in 2012 and 2013. This is based on the assumption that action to promote competition in the goods and services market will allow the reduction in labour costs to be passed on to consumers.
The closure of the competitiveness gap is expected to accelerate. Following years of continued growth, well in excess of its main trading partners, unit labour costs are now clearly declining. Wages in the business sector have been falling in recent quarters but at a pace that was insufficient to help recover competitiveness, also due to continued wage moderation in Greece’s main trading partners. However, the recent labour market measures are expected to contribute to further significant reductions in labour costs over the next two years. Also, the product and service market reform will have a crucial role in increasing
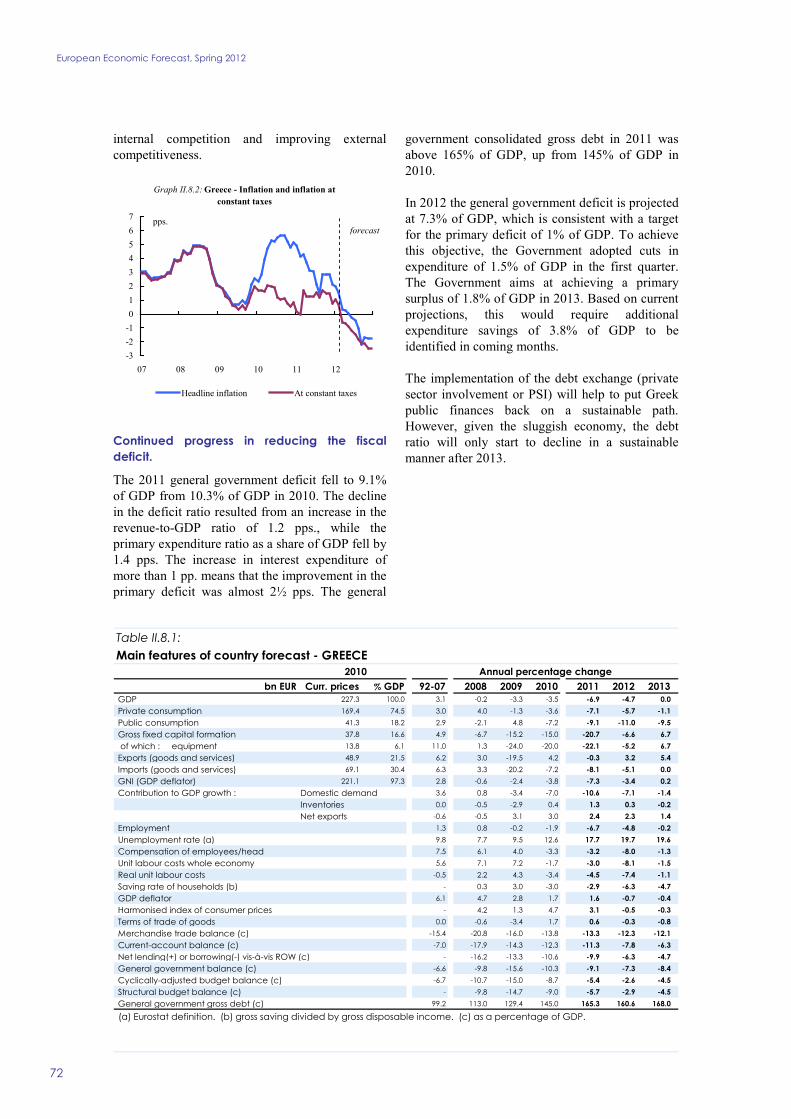
European Economic Forecast, Spring 2012
Table II.8.1:Main features of country forecast - GREECE
2010 Annual percentage changebn EUR Curr. prices % GDP 92-07 2008 2009 2010 2011 2012 2013
GDP 227.3 100.0 3.1 -0.2 -3.3 -3.5 -6.9 -4.7 0.0 Private consumption 169.4 74.5 3.0 4.0 -1.3 -3.6 -7.1 -5.7 -1.1 Public consumption 41.3 18.2 2.9 -2.1 4.8 -7.2 -9.1 -11.0 -9.5 Gross fixed capital formation 37.8 16.6 4.9 -6.7 -15.2 -15.0 -20.7 -6.6 6.7 of which : equipment 13.8 6.1 11.0 1.3 -24.0 -20.0 -22.1 -5.2 6.7 Exports (goods and services) 48.9 21.5 6.2 3.0 -19.5 4.2 -0.3 3.2 5.4 Imports (goods and services) 69.1 30.4 6.3 3.3 -20.2 -7.2 -8.1 -5.1 0.0 GNI (GDP deflator) 221.1 97.3 2.8 -0.6 -2.4 -3.8 -7.3 -3.4 0.2 Contribution to GDP growth : Domestic demand 3.6 0.8 -3.4 -7.0 -10.6 -7.1 -1.4
Inventories 0.0 -0.5 -2.9 0.4 1.3 0.3 -0.2Net exports -0.6 -0.5 3.1 3.0 2.4 2.3 1.4
Employment 1.3 0.8 -0.2 -1.9 -6.7 -4.8 -0.2 Unemployment rate (a) 9.8 7.7 9.5 12.6 17.7 19.7 19.6 Compensation of employees/head 7.5 6.1 4.0 -3.3 -3.2 -8.0 -1.3 Unit labour costs whole economy 5.6 7.1 7.2 -1.7 -3.0 -8.1 -1.5 Real unit labour costs -0.5 2.2 4.3 -3.4 -4.5 -7.4 -1.1 Saving rate of households (b) - 0.3 3.0 -3.0 -2.9 -6.3 -4.7 GDP deflator 6.1 4.7 2.8 1.7 1.6 -0.7 -0.4 Harmonised index of consumer prices - 4.2 1.3 4.7 3.1 -0.5 -0.3 Terms of trade of goods 0.0 -0.6 -3.4 1.7 0.6 -0.3 -0.8 Merchandise trade balance (c) -15.4 -20.8 -16.0 -13.8 -13.3 -12.3 -12.1 Current-account balance (c) -7.0 -17.9 -14.3 -12.3 -11.3 -7.8 -6.3 Net lending(+) or borrowing(-) vis-à-vis ROW (c) - -16.2 -13.3 -10.6 -9.9 -6.3 -4.7 General government balance (c) -6.6 -9.8 -15.6 -10.3 -9.1 -7.3 -8.4 Cyclically-adjusted budget balance (c) -6.7 -10.7 -15.0 -8.7 -5.4 -2.6 -4.5 Structural budget balance (c) - -9.8 -14.7 -9.0 -5.7 -2.9 -4.5 General government gross debt (c) 99.2 113.0 129.4 145.0 165.3 160.6 168.0
(a) Eurostat definition. (b) gross saving divided by gross disposable income. (c) as a percentage of GDP.
72
internal competition and improving external competitiveness.
-3-2-101234567
07 08 09 10 11 12
pps.
Headline inflation At constant taxes
forecast
Graph II.8.2: Greece - Inflation and inflation at constant taxes
Continued progress in reducing the fiscal deficit.
The 2011 general government deficit fell to 9.1% of GDP from 10.3% of GDP in 2010. The decline in the deficit ratio resulted from an increase in the revenue-to-GDP ratio of 1.2 pps., while the primary expenditure ratio as a share of GDP fell by 1.4 pps. The increase in interest expenditure of more than 1 pp. means that the improvement in the primary deficit was almost 2½ pps. The general
government consolidated gross debt in 2011 was above 165% of GDP, up from 145% of GDP in 2010.
In 2012 the general government deficit is projected at 7.3% of GDP, which is consistent with a target for the primary deficit of 1% of GDP. To achieve this objective, the Government adopted cuts in expenditure of 1.5% of GDP in the first quarter. The Government aims at achieving a primary surplus of 1.8% of GDP in 2013. Based on current projections, this would require additional expenditure savings of 3.8% of GDP to be identified in coming months.
The implementation of the debt exchange (private sector involvement or PSI) will help to put Greek public finances back on a sustainable path. However, given the sluggish economy, the debt ratio will only start to decline in a sustainable manner after 2013.

9. SPAIN Difficult times ahead
73
Rebalancing continues as the economy enters into recession
Spain is undergoing a deep structural adjustment following the reversal of the housing and construction boom. The large stock of accumulated private sector debt is prompting deleveraging among households and non-financial corporations. The banking sector, which still has significant exposure to the real estate and construction sector, is undergoing necessary restructuring and recapitalisation. Unemployment is unacceptably high and is likely to increase further. Finally, public finances need to be brought back onto a sustainable path. The correction of these imbalances will affect domestic demand adversely over the forecast horizon, although a gradual improvement is expected in 2013. Resilient exports and weaker imports, implied by subdued domestic demand, should continue to support net exports and, thus, economic growth.
Real GDP is expected to contract by 1.8% in 2012 and by 0.3% in 2013 due to a large negative carry-over. In the last quarter of 2011, Spain entered recession, driven by a larger-than-expected deterioration in the labour market, lower public expenditure, and deteriorating credit conditions, while the euro-area sovereign-debt crisis intensified and external demand weakened. Internal demand is set to act as a drag on growth in 2012, only partially compensated for by external demand. The contraction is expected to be at its strongest in the second half of 2012, reflecting the short-term impact of consolidation efforts. In 2013, quarterly GDP growth is projected to turn positive, but this is subject to the no-policy-change assumption.
Tensions in European wholesale financial markets, with negative spill-over effects on credit supply, were alleviated by the ECB's policy intervention of providing longer-term liquidity. However, the Spanish financial system as a whole remains vulnerable to market tensions given its large exposure to problematic real estate and construction assets, a weak economic outlook and large refinancing needs. In the short term, the necessary adjustment of bank balance sheets will contribute to keeping credit flow to the economy very constrained, which will dampen private consumption and investment.
0
2
4
6
8
10
12
90100110120130140150160170180190
00 01 02 03 04 05 06 07 08 09 10 11 12 13
Graph II.9.1:Spain - Net external borrowing, GDP and GNI
Net external borrowing (rhs) GDP GNI
% of GDP
forecast
index, 2000=100
Note: all variables are in nominal terms.
Weak domestic demand: a drag on economic growth
Private consumption is expected to be very weak in 2012, driven by persistently high and still rising unemployment, large household debt, and a binding credit constraint. Households' disposable income is set to decline significantly due to higher employment destruction, slower wage growth, and an increase in income taxes. In addition, households' wealth will be reduced given an expected further fall in house prices. However, due to forecast lower inflation, the fall in gross disposable income in real terms is likely to be comparable to 2011. The savings rate is expected to decrease to around 11% as households try to smooth their consumption. Nevertheless, households should remain net lenders over the forecast horizon given that they are expected to continue to reduce investment in housing.
Non-financial corporations are expected to increase their gross operating surplus, due to a further decline in labour costs, and their gross saving should grow despite the increase in their direct taxes. Investment, particularly investment in equipment, is set to decline given the unfavourable economic outlook, high corporate indebtedness, excess capacity and difficult access to credit. All in all, corporations are expected to increase their net lending position, thus increasing the potential for a faster reduction of accumulated debt.
Residential investment was weak in 2011. The decline in house prices accelerated to 11% in the last quarter (in year-on-year terms) and prices are expected to continue falling in the short term, paving the way for further adjustment of the

European Economic Forecast, Spring 2012
74
housing sector and possibly a slight reduction in the large stock of unsold houses. Non-residential investment is expected to decline, driven mostly by fiscal consolidation measures and, to a lesser extent, by corporations reducing their investment. Public consumption is also expected to fall, reflecting fiscal consolidation needs, including those addressed in the 2012 budget.
Strong support from exports growth
Exports growth is expected to remain robust over the forecast horizon although the pace of growth should ease. Declining unit labour costs (ULC) and improving product and regional diversification have allowed Spain to increase its export market share – a trend that is expected to continue over the forecast horizon, which is important to further reduce the high external deficit. As a result of relatively strong exports and falling imports, Spain's trade balance has significantly improved. In particular, the non-energy goods balance was close to equilibrium, while the non-tourist services balance moved into a surplus at the end of 2011. This resulted in an accelerated correction of the current-account deficit, which declined to 3.9% of GDP in 2011 and is expected to be close to balance by 2013. However, the high dependence of the Spanish economy on energy imports and the high and increasing interest burden may constrain the necessary improvement of the current account.
Employment set to decrease further
The labour market situation deteriorated further, beyond what was expected in the autumn forecast, and the unemployment rate reached 22.8% in the last quarter of 2011. Looking beyond the overall figures, the composition of the labour market adjustment has also changed. In the last quarter of 2011, permanent employment fell by more (-3.4%) than temporary employment (-2.5%), contrary to the pattern seen in previous quarters. In addition, most of the adjustment took place through a reduction in the number of workers rather than through the reduction in the hours worked, which further increased unemployment.
The recent labour market reform allows firms greater flexibility to adjust wages and employment to their specific economic situation. Given the current weakness of the Spanish economy, this reform is likely to result in more moderate growth (or even a reduction) in wages and some further falls in employment in the short term.
Moderation in wage growth and inflation
Inflation decelerated towards the end of 2011, due to the fading out of temporary effects (VAT and excise duty increases) and some moderation in energy price growth. Over the forecast horizon, weak domestic demand is expected to put downward pressure on core inflation. However, compared to the autumn 2011, the inflation forecast for 2012 has been revised upwards, mainly due to higher expected oil prices. In addition, an increase in some administered prices (including electricity, gas, and public transport) will also put some upward pressure on prices. Wage growth is expected to be moderate and, in combination with the projected continued strong growth in labour productivity, will further reduce ULC. The inflation differential with the euro area is expected to be negative, leading to some improvement in price competitiveness.
Risks to baseline scenario
This forecast is subject to considerable risks. An intensification of the sovereign-debt crisis could significantly increase Spain's risk premium. Also, a further deterioration in bank balance sheets could have negative consequences for lending to the real economy and public finances. Higher-than-expected oil prices would affect the Spanish economy disproportionally given its oil dependence. In addition, the household saving rate could increase due to greater precautionary saving.
Ambitious fiscal consolidation planned
The general government deficit was 8.5% of GDP in 2011, above the government target of 6%. About two thirds of this deviation was due to Autonomous Communities, while slippages at central government and social security were more limited. The deviation was driven mainly by weaker-than-expected revenues, linked to lower-than-foreseen growth and weak tax elasticities. Notably, taxes on production and imports (VAT, taxes on real estate transactions) recorded major shortfalls, affecting both the central and regional governments. Social contributions also came in weaker in line with a stronger-than-expected deterioration in the labour market.
In 2012, the general government deficit is projected to reach 6.4% of GDP. This would imply a reduction of slightly over 2 pps. of GDP compared with 2011. On 30 March 2012, Spain adopted its draft 2012 budget law, which targets a
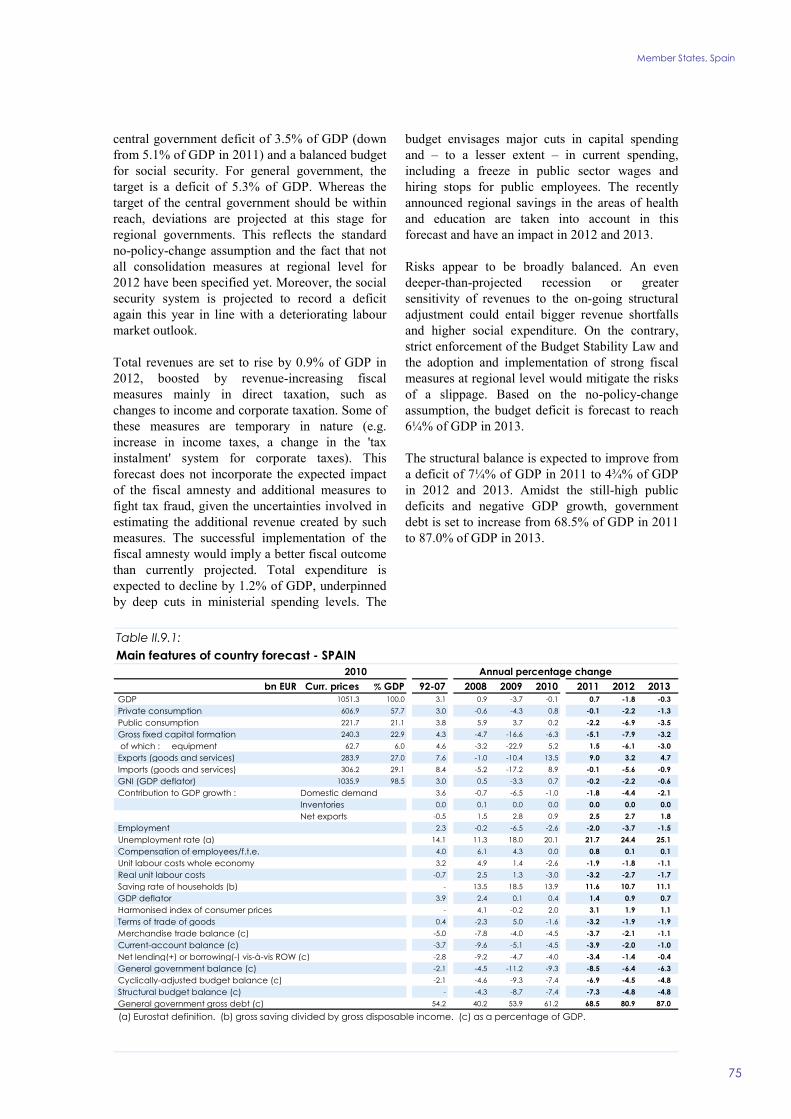
Member States, Spain
Table II.9.1:Main features of country forecast - SPAIN
2010 Annual percentage changebn EUR Curr. prices % GDP 92-07 2008 2009 2010 2011 2012 2013
GDP 1051.3 100.0 3.1 0.9 -3.7 -0.1 0.7 -1.8 -0.3 Private consumption 606.9 57.7 3.0 -0.6 -4.3 0.8 -0.1 -2.2 -1.3 Public consumption 221.7 21.1 3.8 5.9 3.7 0.2 -2.2 -6.9 -3.5 Gross fixed capital formation 240.3 22.9 4.3 -4.7 -16.6 -6.3 -5.1 -7.9 -3.2 of which : equipment 62.7 6.0 4.6 -3.2 -22.9 5.2 1.5 -6.1 -3.0 Exports (goods and services) 283.9 27.0 7.6 -1.0 -10.4 13.5 9.0 3.2 4.7 Imports (goods and services) 306.2 29.1 8.4 -5.2 -17.2 8.9 -0.1 -5.6 -0.9 GNI (GDP deflator) 1035.9 98.5 3.0 0.5 -3.3 0.7 -0.2 -2.2 -0.6 Contribution to GDP growth : Domestic demand 3.6 -0.7 -6.5 -1.0 -1.8 -4.4 -2.1
Inventories 0.0 0.1 0.0 0.0 0.0 0.0 0.0Net exports -0.5 1.5 2.8 0.9 2.5 2.7 1.8
Employment 2.3 -0.2 -6.5 -2.6 -2.0 -3.7 -1.5 Unemployment rate (a) 14.1 11.3 18.0 20.1 21.7 24.4 25.1 Compensation of employees/f.t.e. 4.0 6.1 4.3 0.0 0.8 0.1 0.1 Unit labour costs whole economy 3.2 4.9 1.4 -2.6 -1.9 -1.8 -1.1 Real unit labour costs -0.7 2.5 1.3 -3.0 -3.2 -2.7 -1.7 Saving rate of households (b) - 13.5 18.5 13.9 11.6 10.7 11.1 GDP deflator 3.9 2.4 0.1 0.4 1.4 0.9 0.7 Harmonised index of consumer prices - 4.1 -0.2 2.0 3.1 1.9 1.1 Terms of trade of goods 0.4 -2.3 5.0 -1.6 -3.2 -1.9 -1.9 Merchandise trade balance (c) -5.0 -7.8 -4.0 -4.5 -3.7 -2.1 -1.1 Current-account balance (c) -3.7 -9.6 -5.1 -4.5 -3.9 -2.0 -1.0 Net lending(+) or borrowing(-) vis-à-vis ROW (c) -2.8 -9.2 -4.7 -4.0 -3.4 -1.4 -0.4 General government balance (c) -2.1 -4.5 -11.2 -9.3 -8.5 -6.4 -6.3 Cyclically-adjusted budget balance (c) -2.1 -4.6 -9.3 -7.4 -6.9 -4.5 -4.8 Structural budget balance (c) - -4.3 -8.7 -7.4 -7.3 -4.8 -4.8 General government gross debt (c) 54.2 40.2 53.9 61.2 68.5 80.9 87.0
(a) Eurostat definition. (b) gross saving divided by gross disposable income. (c) as a percentage of GDP.
75
central government deficit of 3.5% of GDP (down from 5.1% of GDP in 2011) and a balanced budget for social security. For general government, the target is a deficit of 5.3% of GDP. Whereas the target of the central government should be within reach, deviations are projected at this stage for regional governments. This reflects the standard no-policy-change assumption and the fact that not all consolidation measures at regional level for 2012 have been specified yet. Moreover, the social security system is projected to record a deficit again this year in line with a deteriorating labour market outlook.
Total revenues are set to rise by 0.9% of GDP in 2012, boosted by revenue-increasing fiscal measures mainly in direct taxation, such as changes to income and corporate taxation. Some of these measures are temporary in nature (e.g. increase in income taxes, a change in the 'tax instalment' system for corporate taxes). This forecast does not incorporate the expected impact of the fiscal amnesty and additional measures to fight tax fraud, given the uncertainties involved in estimating the additional revenue created by such measures. The successful implementation of the fiscal amnesty would imply a better fiscal outcome than currently projected. Total expenditure is expected to decline by 1.2% of GDP, underpinned by deep cuts in ministerial spending levels. The
budget envisages major cuts in capital spending and – to a lesser extent – in current spending, including a freeze in public sector wages and hiring stops for public employees. The recently announced regional savings in the areas of health and education are taken into account in this forecast and have an impact in 2012 and 2013.
Risks appear to be broadly balanced. An even deeper-than-projected recession or greater sensitivity of revenues to the on-going structural adjustment could entail bigger revenue shortfalls and higher social expenditure. On the contrary, strict enforcement of the Budget Stability Law and the adoption and implementation of strong fiscal measures at regional level would mitigate the risks of a slippage. Based on the no-policy-change assumption, the budget deficit is forecast to reach 6¼% of GDP in 2013.
The structural balance is expected to improve from a deficit of 7¼% of GDP in 2011 to 4¾% of GDP in 2012 and 2013. Amidst the still-high public deficits and negative GDP growth, government debt is set to increase from 68.5% of GDP in 2011 to 87.0% of GDP in 2013.

10. FRANCE Resilient economic growth so far, slow recovery ahead
76
A growth pattern blurred by temporary items
After months of uncertainty and a weak economic environment, recent signals seem to point towards a recovery of the French economy in 2012. A stronger-than-expected economic growth in the fourth quarter of 2011 (0.2%), together with a straightening up in the consumption of goods and services in the first few months of 2012, suggest that France is faring better compared with its main peers in the euro area. However, this needs to be put in perspective, as some temporary effects seem to have also played a significant role in these broadly positive developments.
Results in the fourth quarter of 2011 were strongly supported by dynamic investments, particularly by non-financial companies, and by exports. Part of the surge in investment can be linked to the anticipation by firms of the higher taxation of cars which came into force on 1 January, 2012. Exports benefited from exceptional sales in the aeronautical sector. The rise in energy consumption in February 2012, on the back of colder weather than usual, seems to have sustained private consumption. Without these temporary elements the slowdown of the French economy would have been more pronounced.
In 2012, the recovery would therefore be slower than could be expected from the latest economic results. Private consumption would not play its usual role as an engine for growth, although it might be resilient enough as to prevent the country from entering a recession. Instead, investment is to set the pace for the overall economic recovery. With 0.5% annual GDP growth, the French economy is nevertheless forecast to be on a somewhat more dynamic path than most of the other euro-area Member States.
In 2013, this moderately positive trend is expected to gradually gain momentum. Increased confidence of private households is forecast to allow for a decrease in the savings rate, and investment would gradually return to the pace seen in 2011. Overall, real GDP growth is expected to increase to 1.3% in 2013, only marginally below the 1.4% expected in the autumn 2011 forecast, but slightly above the average for the euro area.
Labour market: not yet out of the woods
Employment has fallen in the second semester with the number of employees in the private sector down by 0.3%. The unemployment rate rose by a cumulated 0.3 pp. in the last two quarters of 2011. The statistics provided by the unemployment offices suggest that long-term unemployment and unemployment among senior workers increased most.
The slow economic recovery is expected to be insufficient to stop the deterioration in the job market. After reaching 9.7% in 2011, the unemployment rate is expected to increase to 10.2% in 2012 and to stabilise at 10.3% in 2013.
Labour market prospects to weigh on private consumption and the speed of the recovery
The recovery of private consumption in 2012 and 2013 will be dampened by negative developments in the labour market. The high level of unemployment is likely to weigh on wage negotiations. In a context of relatively high inflation, real wages are set to remain flat in 2012 and 2013.
Graph II.10.1: France - GDP growth and contributions
-4
-3
-2-1
0
1
23
4
5
04 05 06 07 08 09 10 11 12 13
Domestic demand Net exportsGDP growth (y-o-y%)
pps.
forecast
Uncertainties about the labour market should also have a negative impact on the propensity to consume, with savings being maintained at a high level in 2012. In 2013, households should reduce their level of precautionary savings on the back of the foreseen stabilisation in the labour market and a better economic outlook.

Member States, France
77
Gradual pick up in investment
In the second semester of 2011, pessimism among investors, together with concerns about a potential credit crunch, led to high uncertainty. In early 2012, the intervention by the ECB dampened worries on the credit market and contributed to a significant improvement in economic sentiment.
However, the conditions for a rapid pick-up in investment do not yet seem to be met. Sluggish expectations make investors behave cautiously, as the limited demand for credit shows. The operating surplus of French companies, which reached a low point in 2011, is expected to continue to constrain their ability to invest.
Lower investment in the car sector (which was very dynamic in the fourth quarter of 2011) and the impact of low temperatures on the construction sector in February are expected to translate into temporarily negative investment growth in the first quarter of 2012. Increasing confidence is then projected to start to drive a gradual recovery throughout the forecast period, leading to a virtuous cycle in 2013, with increased demand and improved profitability resulting in a partial catch-up in investment.
After the strong destocking observed in the last quarter of 2011, the level of stocks should stabilise over the forecast horizon. Due to a strong carry-over, stocks would make a negative contribution to growth in 2012 and a neutral contribution in 2013.
External trade driven by the modest rebound in external demand
After a dynamic fourth quarter of 2011, driven by steady sales by the aeronautic industry, exports are expected to slow down in 2012 due to sluggish international demand. In 2013, the projected recovery of demand in the EU, together with efforts to curb the losses in export market shares, would result in recovering exports.
Due to the weakness of domestic demand, imports are expected to remain depressed in 2012. Net external trade would therefore contribute positively to growth in 2012. In 2013, the contribution from net exports would be neutral.
Decreasing inflationary pressures
The rapid increase in energy prices in 2011 has contributed to the relatively high level of inflation
despite a gloomy economic context. In 2012, although oil prices are assumed to stabilise, the recent increase is set to gradually feed through and the HICP inflation likely to be broadly unchanged at 2.1%, from 2.3% in 2011.
In 2013, the inflation rate is expected to continue to decrease to 1.9% on the back of high levels of unemployment and weak level of economic growth. The increase in the reduced VAT rate from 5.5% to 7%, the announced rise in the general rate from 19.6% to 21.2% in October 2012 and additional taxes on tobacco are forecast to dampen the impact of expected downward pressures on inflation.
Increasingly balanced risks
Beyond the risks associated with the general economic environment, specific risks relating to the French economy appear more balanced than in the autumn of 2011.
The return of confidence in the private sector in early 2012 after months of continuous deterioration could signal a stronger recovery. In this case, a faster pick-up in investment, together with a possibly lower level of savings rate would improve the growth profile of France.
On the other hand, although a number of uncertainties related to the financial sector have been lifted, the impact of stronger capital requirements of banks could have a stronger than expected adverse impact on credit standards, hence limiting the level of investment by companies.
Improved fiscal position with challenges remaining
In 2011, the general government deficit reached 5.2% of GDP, down from 7.1% in 2010 and below the official target of 5.7% (the target was also overachieved in 2010). While partly due to the phasing out of the remaining stimulus measures, exceptional military equipment expenditure recorded in 2010 and some other exceptional factors (adding up to nearly 1% of GDP), the deficit reduction also stems from new measures on the revenue side (0.7%); growth above potential also played a role (0.2%). The better outcome compared to the autumn 2011 forecast, which projected a deficit of 5.8% of GDP, partly comes from windfall revenues and statistical

European Economic Forecast, Spring 2012
Table II.10.1:Main features of country forecast - FRANCE
2010 Annual percentage changebn EUR Curr. prices % GDP 92-07 2008 2009 2010 2011 2012 2013
GDP 1932.8 100.0 2.0 -0.1 -2.7 1.5 1.7 0.5 1.3 Private consumption 1124.2 58.2 1.9 0.2 0.2 1.4 0.4 0.7 1.5 Public consumption 479.9 24.8 1.5 1.3 2.3 1.2 0.8 0.5 0.5 Gross fixed capital formation 373.3 19.3 2.4 0.3 -9.0 -1.2 2.9 0.5 1.8 of which : equipment 93.6 4.8 3.5 3.5 -9.6 4.1 8.9 0.5 4.9 Exports (goods and services) 492.2 25.5 5.0 -0.3 -12.4 9.7 4.9 2.5 4.8 Imports (goods and services) 537.5 27.8 5.2 0.9 -10.8 8.8 4.6 1.3 4.3 GNI (GDP deflator) 1968.1 101.8 2.1 -0.1 -2.9 1.7 1.8 0.7 1.4 Contribution to GDP growth : Domestic demand 1.9 0.5 -1.3 0.9 1.0 0.6 1.4
Inventories 0.1 -0.2 -1.2 0.6 0.8 -0.4 0.0Net exports 0.0 -0.3 -0.2 0.1 0.0 0.3 0.0
Employment 0.7 0.7 -1.4 0.1 0.7 0.4 0.4 Unemployment rate (a) 9.7 7.8 9.5 9.8 9.7 10.2 10.3 Compensation of employees/f.t.e. 2.6 2.4 1.8 2.1 2.8 2.1 2.0 Unit labour costs whole economy 1.3 3.2 3.2 0.7 1.8 2.1 1.1 Real unit labour costs -0.3 0.6 2.7 -0.1 0.2 0.6 -0.6 Saving rate of households (b) 14.9 15.3 16.2 15.6 15.9 16.4 16.3 GDP deflator 1.6 2.5 0.5 0.8 1.6 1.5 1.8 Harmonised index of consumer prices 1.8 3.2 0.1 1.7 2.3 2.1 1.9 Terms of trade of goods 0.0 -0.7 2.2 -2.6 -2.2 -1.2 0.3 Merchandise trade balance (c) 0.2 -2.7 -2.2 -2.6 -3.4 -3.5 -3.5 Current-account balance (c) 0.8 -1.9 -2.1 -2.2 -2.7 -2.4 -2.1 Net lending(+) or borrowing(-) vis-à-vis ROW (c) 0.8 -1.9 -2.1 -2.2 -2.7 -2.2 -2.0 General government balance (c) -3.4 -3.3 -7.5 -7.1 -5.2 -4.5 -4.2 Cyclically-adjusted budget balance (c) -3.7 -3.8 -6.2 -5.8 -4.1 -3.1 -2.9 Structural budget balance (c) - -3.9 -6.2 -5.7 -4.1 -3.2 -2.9 General government gross debt (c) 57.7 68.2 79.2 82.3 85.8 90.5 92.5
(a) Eurostat definition. (b) gross saving divided by gross disposable income. (c) as a percentage of GDP.
78
reclassifications, implying only a limited base effect for 2012.
Turning to 2012, the deficit is expected to decrease further on the back of the consolidation measures announced in the second half of 2011 and in January 2012 (estimated impact of around 1% of GDP) and adopted as part of the supplementary budget for 2011 as well as the budget and the supplementary budget for 2012. These measures are mainly revenue based (0.8% of GDP). They include a further cut in tax expenditures; no indexation of tax brackets concerning personal income tax and tax on wealth in 2012–13; limiting the possibilities for carrying over losses in the calculation of corporate income tax; an additional temporary tax on top incomes and large companies; higher taxes on capital income and gains; an increase in VAT for several categories of goods and services enjoying a reduced rate (from 5.5% to 7%); and a rise in excise duties on tobacco and alcohol. On the expenditure side, savings come from cuts in central government expenditure; an only partial indexation of some social benefits (e.g. family and housing); and a tighter healthcare spending norm. Furthermore, the 2010 pension reform will start to yield budgetary savings. On the other hand, economic growth below potential will have a negative impact on the headline deficit.
Overall, the 2012 deficit is projected to reach 4½% of GDP.
The deficit is expected to continue to decrease in 2013, albeit only slightly, remaining above 4% of GDP. The rise in social benefits is set to decelerate thanks to the economic recovery and the increasing impact of the pension reform. Already adopted revenue measures of around 0.2% of GDP will also contribute to lowering the deficit. However, under the usual no-policy-change assumption, the expected outcome remains significantly above the official target of 3% of GDP. Projected higher expenditure growth and lower GDP growth prospects are the main drivers explaining the difference.
Overall, this implies a cumulated improvement in the structural balance of around 1¼% of GDP in 2012–13, mainly concentrated in 2012.
The debt ratio is expected to continue to rise over the forecast horizon on the back of still-high expected deficits. The public loan launched in 2010 (the so-called "investissements d'avenir" programme, notably consisting in public investment) is set to have only a marginal impact.

11. ITALY A slow exit from the new recession
79
The sovereign-debt crisis hits the real economy
The Italian economy has been hit hard by the euro-area sovereign-debt crisis. The sharp increase in government-bond yields in the final months of 2011 translated into higher financing costs for Italian banks. As credit conditions for firms tightened and economic agents' confidence deteriorated, domestic demand plunged. In the last quarter of 2011, real GDP contracted by 0.7% q-o-q, after falling by -0.2% in the third quarter, while in 2011 as a whole it rose by only 0.4%.
After incorporating the large GDP decline in the fourth quarter of 2011, economic activity entered 2012 with a negative growth impulse of 0.5 pp. It is set to continue to contract in the first half of 2012, as spending and investment plans of consumers and firms are held back by poor labour market prospects and still-high uncertainty in financial markets. Real GDP is expected to have declined by a further 0.7% q-o-q in the first quarter of 2012 and to fall by 0.4% in the second quarter. Under the assumption of no further worsening in financial market conditions and yields on 10-year Italian sovereign bonds slightly below 6%, output is expected to stabilise in the third quarter of 2012 and to start expanding only mildly as of the last quarter of 2012. As a result, real GDP is set to fall by 1.4% in 2012 and increase by 0.4% in 2013.
Domestic demand is set to fall sharply in 2012
The fall in households' real disposable income – related to a weak labour market and the on-going large fiscal consolidation – affects private consumption, which has been declining since the second quarter of 2011. Consumption is set to continue to fall until the end of 2012 and to stabilise only in 2013. Gross fixed capital formation is being shaped by tight financing conditions and falling demand. Equipment investment declined sharply in the final quarter of 2011 and is set to continue to contract in the first half of 2012. However, firms are expected to resume their investment plans already in the second half of the year, on the back of recovering foreign demand and gradually easing financing conditions. By contrast, construction investment is projected to continue to fall over the entire forecast horizon.
The drop in domestic demand, and particularly in gross capital formation, is expected to lead to a significant fall in imports in 2012, to be followed by a mild recovery in 2013. Driven by the expected sustained demand from extra-EU trade partners, exports are set to expand throughout the forecast horizon, accelerating as of the second half of 2012. Against this background, the contribution of net exports to real GDP growth is expected to remain positive over the forecast horizon due to subdued imports. Still, some moderate loss in export market shares is expected over 2012-13, after the temporary improvement recorded in 2010-11.
Owing to the improved trade balance, the current-account deficit is projected to narrow significantly in 2012. The external deficit is set to also continue to narrow in 2013 thanks to accelerating exports and improving terms of trade.
Graph II.11.1: Italy - Determinants of the current-account position
-4-3-2-101234
98 99 00 01 02 03 04 05 06 07 08 09 10 11 12 13
% of GDP
Balance of current transfersBalance of primary income Balance of goods and servicesCurrent-account balance
forecast
Rising unemployment and wage moderation
On the back of declining economic activity, the gradual recovery in headcount employment which had started at the end of 2010 came to a halt in the last quarter of 2011. The unemployment rate started to rise again in the second half of 2011, driven by a sharp rise in the youth unemployment rate. In 2012, headcount employment developments are projected to be slightly less negative than those for hours worked, thanks to a higher use of the wage supplementation scheme (CIG), whereby employees temporarily suspend or reduce activity, but keep their job and receive income support. In 2013, both measures of employment are expected to remain stable. At the
European Economic Forecast, Spring 2012
80
same time, labour force participation is set to continue to recover, driven by gradually rising employment rates for the older age groups – due to the recently adopted pension reforms – and a return to the labour market of inactive workers who are now impelled to look for jobs by the fall in households' disposable income. As a consequence, over 2012-13 the unemployment rate is projected to rise by more than 1 pp. compared to 2010-11.
Wage increases in the private sector are projected to remain below inflation over the forecast horizon, while public sector wages continue to be frozen. These moderate wage developments are compounded by the stagnation in labour productivity expected over 2012-13, on account of the negative cyclical conditions and some labour hoarding by firms. As a result, nominal unit labour costs are projected to increase by around 1¼% on average in 2012-13. This, together with some exchange rate depreciation, entails some recovery in cost competitiveness vis-à-vis Italy's main trade partners.
Higher oil prices and taxes weigh on inflation
HICP is set to accelerate in 2012, despite falling domestic demand and moderate pressures from labour costs, and to ease thereafter. This is explained by the further rise in oil prices and the effects of fiscal consolidation measures. The standard VAT rate was increased by 1 pp. in September 2011, while excise duties on fuel were raised after the new consolidation package adopted in December 2011. The forecast also incorporates the additional 2 pps. increase in both the 21% standard VAT rate and the 10% reduced rate which is due to enter into force in October 2012. Core HICP inflation – i.e. excluding energy and unprocessed food – is set to go above 3% in the final quarter of 2012 and then to start to decrease to reach 1.5% by end-2013, under the assumption of no second-round effects on wages from the increase in inflation due to higher indirect taxation.
A structural balanced budget in 2013
Italy's public finances continued to improve in 2011, with the general government deficit falling to 3.9% of GDP (from 4.6% in 2010) thanks also to some one-off measures. Interest expenditure grew to 4.9% of GDP, while the primary balance moved to a surplus of 1% of GDP. Primary expenditure fell both in nominal terms – for the
second year in a row – and as a share of GDP. The moderate rise in current primary expenditure was largely due to a decline in compensation of public sector employees, while the significant fall in capital spending is explained by both further reductions in subsidies to investment and the one-off sale of broadband licences, recorded as negative expenditure. Total revenues rose broadly in line with nominal GDP. Income taxes remained flat in nominal terms, also due to the partial postponement to 2012 of the first instalment of self-assessed personal income taxes. Conversely, indirect taxes rose driven by the VAT rate increase of September and higher excise duties. Capital taxes also increased, mainly due to the one-off levy on the revaluation of corporate assets.
In 2012, the general government deficit is projected to further decline, to 2.0% of GDP and the primary surplus to improve to 3.4% of GDP, thanks to the sizeable budgetary consolidation measures adopted in 2010-11. By contrast, interest expenditure is projected to rise further – to 5.4% of GDP – due to higher refinancing rates. In structural terms, the annual adjustment is projected to be around 3 pps. of GDP for the overall balance and 3½ pps. for the primary balance.
In 2012, current primary expenditure is set to rise slightly in nominal terms as social transfers continue to increase, although at a moderate pace thanks to the non-indexation of higher pensions. Expenditure on compensation of employees is projected to continue to fall thanks to both the 4-year freeze in public wages and careers and the continued restriction in recruitment. Intermediate consumption is set to decline slightly due to the savings planned in departmental expenditure and cuts to transfers to subnational governments. The latter also affects capital spending, which is set to continue to decline in 2012. As a result, primary expenditure is expected to increase only marginally in nominal terms and to continue to decline as a share of GDP.
Total revenues are expected to grow by more than 5.5% in 2012, increasing substantially as a share of GDP. Overall, the impact of the adopted consolidation measures is larger on indirect taxes, which are projected to rise by more than 10% through increases in excise duties, stamp duties on financial assets and VAT rates as well as the re-introduction of taxation of owner-occupied dwellings. The tax rate increase on other property is set to boost direct taxes, which are also buoyed

Member States, Italy
Table II.11.1:Main features of country forecast - ITALY
2010 Annual percentage changebn EUR Curr. prices % GDP 92-07 2008 2009 2010 2011 2012 2013
GDP 1553.2 100.0 1.5 -1.2 -5.5 1.8 0.4 -1.4 0.4 Private consumption 941.5 60.6 1.3 -0.8 -1.6 1.2 0.3 -2.3 -0.4 Public consumption 327.4 21.1 0.9 0.6 0.8 -0.6 -0.9 -0.8 -0.4 Gross fixed capital formation 304.5 19.6 1.6 -3.7 -11.7 2.1 -1.9 -3.8 1.3 of which : equipment 130.6 8.4 2.3 -5.2 -16.8 11.9 -0.9 -6.9 3.5 Exports (goods and services) 413.2 26.6 5.0 -2.8 -17.5 11.6 5.6 1.1 4.0 Imports (goods and services) 443.4 28.5 4.3 -3.0 -13.4 12.7 0.4 -4.1 2.3 GNI (GDP deflator) 1545.4 99.5 1.6 -2.2 -4.9 1.8 0.3 -1.5 0.4 Contribution to GDP growth : Domestic demand 1.2 -1.1 -3.2 1.0 -0.4 -2.3 -0.1
Inventories 0.1 0.0 -1.2 1.2 -0.5 -0.7 0.0Net exports 0.2 0.0 -1.1 -0.3 1.4 1.5 0.5
Employment 0.4 -0.4 -2.9 -0.9 0.1 -1.1 -0.1 Unemployment rate (a) 9.3 6.7 7.8 8.4 8.4 9.5 9.7 Compensation of employees/f.t.e. 3.2 3.8 1.7 2.3 1.4 1.5 1.4 Unit labour costs whole economy 2.1 4.7 4.6 -0.4 1.0 1.9 0.9 Real unit labour costs -0.8 2.1 2.4 -0.8 -0.3 -0.2 -1.3 Saving rate of households (b) 18.5 15.2 14.5 12.9 12.2 11.1 11.3 GDP deflator 3.0 2.5 2.1 0.4 1.3 2.1 2.2 Harmonised index of consumer prices 3.0 3.5 0.8 1.6 2.9 3.2 2.3 Terms of trade of goods -0.4 -3.4 7.4 -3.9 -3.6 -1.6 1.8 Merchandise trade balance (c) 1.6 -0.1 0.1 -1.3 -1.0 -0.1 0.9 Current-account balance (c) 0.3 -2.9 -2.0 -3.5 -3.1 -2.2 -1.3 Net lending(+) or borrowing(-) vis-à-vis ROW (c) 0.5 -2.9 -2.0 -3.6 -3.1 -2.2 -1.3 General government balance (c) -4.5 -2.7 -5.4 -4.6 -3.9 -2.0 -1.1 Cyclically-adjusted budget balance (c) -4.8 -3.3 -3.3 -3.4 -2.9 -0.6 0.1 Structural budget balance (c) - -3.5 -4.0 -3.6 -3.6 -0.7 -0.1 General government gross debt (c) 110.7 105.7 116.0 118.6 120.1 123.5 121.8
(a) Eurostat definition. (b) gross saving divided by gross disposable income. (c) as a percentage of GDP.
81
by the postponed payment of the 2011 personal income tax instalment and the rate harmonisation of the personal withholding tax on interests and dividends. Corporate income taxes are projected to rise marginally on account of further increases in the tax rate for large energy companies, partly offset by the new allowance on corporate equity (ACE) and the possibility to deduct part of the regional tax on productive activities (IRAP) paid on labour costs. Social contributions are assumed to grow slightly, thanks also to the increase in contribution rates for self-employed people. By contrast, capital taxes are set to decline sharply, as one-off revenues are much lower than in 2011. No additional revenues from the numerous measures adopted to fight against tax evasion are incorporated in the forecast, as their outcome is difficult to assess in advance.
The measures adopted in 2010-11 produce additional consolidation effects in 2013, entailing a further increase in the primary surplus to 4.5% of GDP and a decline in the headline deficit to 1.1% of GDP. Interest expenditure is projected to continue to rise, albeit at a slower pace. A balanced budgetary position is expected to be achieved in structural terms thanks to the additional adjustment of more than ½ pp. of GDP. The structural primary surplus is set to increase by around 1 pp. and reach 5½% of GDP.
Graph II.11.2: Italy - General government structural balances
-4
-2
0
2
4
6
07 08 09 10 11 12 13
Structural balance Structural primary balance
forecast
% of GDP
In 2013, primary expenditure is expected to increase only marginally in nominal terms, implying a further reduction as a share of GDP. Revenues are set to rise in line with output, with particularly dynamic indirect taxes, largely due to the VAT rate increase timed for October 2012.
The general government gross debt is expected to peak at 123.5% of GDP in 2012, due also to the inclusion of the share attributed to Italy in the euro-area firewalls. Thanks to the high and rising primary surplus, the debt-to-GDP ratio is expected to start to decline in 2013.

12. CYPRUS The correction of domestic and external imbalances weighs on economic activity
82
Tourism exports unable to offset faltering domestic demand
The Cypriot economy grew by a modest 0.5% in 2011. After a stronger first half year, when GDP rose by 1.5% y-o-y thanks to an exceptionally good tourist season, economic activity was badly affected by the accident in July 2011 that destroyed the Vassilikos power station which accounted for half of the island's total electricity generation capacity.
Domestic demand, traditionally the main driver of growth, decreased considerably in 2011. Tightening bank lending conditions, along with a worsening labour market outlook and weakening confidence, weighed on private consumption. In addition, subdued foreign demand for housing and the restructuring of corporate balance sheets kept investment on a correction path for the fourth year in a row. On the other hand, the external sector made a positive contribution to growth. Revenues from tourism increased by 13%, driven by political instability in competing Mediterranean tourist destinations and an increased flow of arrivals from emerging markets such as Russia. In addition, import growth decelerated, in line with the contraction in domestic demand. Nevertheless, with a current-account deficit above 10% of GDP, the external imbalance remained sizeable.
Squeeze on private income and credit growth
GDP is projected to contract by 0.8% in 2012 due to a fall in domestic demand and the weaker external environment, notably including persistent financial market uncertainty. Private consumption will be restrained by the squeeze in disposable income, mainly among public sector employees, exerted by the fiscal restriction incorporated in the Budget Law 2012 adopted on 16 December 2011, as well as by the rise in unemployment to unprecedented levels. The large exposure of the financial sector to Greece and the banks' need of recapitalisation will probably raise the cost of financing and limit private-sector access to it. Demand for housing is also expected to remain sluggish, while other construction investment is likely to benefit from reconstruction work in the destroyed Vassilikos power station and from other infrastructure projects. Leading indicators point to
weak, albeit improving, consumer and business confidence. This suggests that a recovery should set in during the second half of 2012, with the improvement of the external environment and the resumption of private investment as uncertainty slowly dissipates. The contribution of the external sector to growth is set to remain positive. While slowing global trade and worsening economic prospects in Cyprus' main trading partners are likely to weigh on exports of goods, this should be partly offset by healthy performance of business services and tourism. Imports are set to decline against the backdrop of weak domestic demand, allowing the current-account deficit to narrow further to around 7.7% of GDP. Economic activity is projected to recover only gradually in 2013, mainly driven by private investment, while domestic consumption will remain constrained by the need for further correction of economic imbalances.
Moderating price and wage inflation amid rising unemployment
A tentative resumption of employment growth levelled off in the course of 2011, with labour-intensive sectors such as construction and trade suffering job losses. Unemployment remains on a strong upward trend, rising from 7.8% in 2011 to around 9¾% in 2012. Wage growth is expected to moderate given the unfavourable labour market conditions together with public sector wage restraint. Specifically, the cost-of-living adjustment (COLA) in the public sector is suspended for two years. In addition, the government and the social partners have agreed to reform the COLA by mid-2012.
HICP inflation is projected to marginally decline to 3.4% in 2012 from 3.5% in 2011 on the back of easing commodity prices combined with weaker domestic demand. Furthermore, the base effect of the increase in electricity prices is set to dissipate in the last quarter of this year. On the other hand, the increase in VAT may add around ½ percentage point to the annual rate. Core inflation is forecast to remain contained at about 2%. With domestic demand remaining subdued and the effect of the VAT increase fading, headline inflation may abate further to 2½% in 2013.

Member States, Cyprus
Table II.12.1:Main features of country forecast - CYPRUS
2010 Annual percentage changemio EUR Curr. prices % GDP 92-07 2008 2009 2010 2011 2012 2013
GDP 17333.7 100.0 4.4 3.6 -1.9 1.1 0.5 -0.8 0.3 Private consumption 11527.4 66.5 - 7.8 -7.5 1.3 0.2 -2.5 0.3 Public consumption 3482.3 20.1 - 6.1 6.8 0.8 -4.4 -3.0 0.3 Gross fixed capital formation 3382.2 19.5 - 6.0 -9.7 -1.7 -13.8 -1.1 0.8 of which : equipment 1071.4 6.2 - 13.6 -0.3 -5.7 -23.1 4.0 4.0 Exports (goods and services) 7303.4 42.1 - -0.5 -10.7 3.7 3.6 1.4 2.3 Imports (goods and services) 8387.0 48.4 - 8.5 -18.6 4.9 -5.0 -2.2 2.3 GNI (GDP deflator) 16858.7 97.3 4.1 8.6 -5.1 3.0 -5.5 0.5 0.9 Contribution to GDP growth : Domestic demand - 7.6 -6.3 0.7 -3.5 -2.4 0.4
Inventories - 0.9 -1.6 1.3 0.0 0.0 0.0Net exports - -4.9 5.7 -0.8 3.9 1.6 0.0
Employment - 2.1 -0.5 0.0 0.5 -1.5 0.6 Unemployment rate (a) - 3.7 5.3 6.2 7.8 9.8 9.9 Compensation of employees/head - 3.2 5.3 -0.2 2.0 -0.8 -0.3 Unit labour costs whole economy - 1.8 6.7 -1.3 2.0 -1.5 -0.1 Real unit labour costs - -2.7 6.6 -2.9 0.0 -3.7 -2.1 Saving rate of households (b) - - - - - - - GDP deflator 3.3 4.6 0.1 1.7 2.0 2.3 2.0 Harmonised index of consumer prices - 4.4 0.2 2.6 3.5 3.4 2.5 Terms of trade of goods - -2.4 2.7 -0.5 -1.8 -1.9 0.0 Merchandise trade balance (c) - -32.4 -25.5 -26.9 -24.5 -24.1 -24.4 Current-account balance (c) - -12.2 -11.0 -8.7 -11.0 -7.7 -7.2 Net lending(+) or borrowing(-) vis-à-vis ROW (c) - -12.2 -10.9 -8.6 -10.7 -7.8 -7.2 General government balance (c) - 0.9 -6.1 -5.3 -6.3 -3.4 -2.5 Cyclically-adjusted budget balance (c) - -0.2 -5.9 -5.0 -6.0 -2.7 -1.7 Structural budget balance (c) - -0.2 -5.9 -5.0 -5.5 -2.7 -1.7 General government gross debt (c) - 48.9 58.5 61.5 71.6 76.5 78.1
(a) Eurostat definition. (b) gross saving divided by gross disposable income. (c) as a percentage of GDP.
83
Government facing severe financing constraints
The government deficit increased from 5.3% in 2010 to 6.3% in 2011, mainly due to lower revenues in the wake of the slowdown of economic activity and reduced corporate profitability. At the same time, expenditure slippages appear to be related to rising social outlays due to higher unemployment and redundancy payments and the higher cost of financing.
Driven by the recent consolidation efforts, the government deficit is set to narrow to 3.4% of GDP in 2012 and 2.5% GDP in 2013. On this basis, and in view of shrinking economic activity this year, the government debt-to-GDP ratio should remain on a rising trend and reach about 76% in 2012, mainly reflecting the stock-flow adjustment increasing debt due to disbursement in EFSF and ESM.
The financial sector in Cyprus, which is large in size relative to the economy's annual output, has been affected by developments in Greece; domestic banks lost a significant amount of capital following their voluntary participation in the agreed haircut on Greek sovereign debt (PSI). By June 2012, the commercial banks' solvency ratios may well reach the targeted minimum Core Tier 1
ratio of 9%. To this end, banks are currently pursuing capital strengthening plans. Should the Cypriot banking system have to resort to government support for recapitalisation, the government debt ratio could rise to around 85% of GDP, thus further weakening the long-term sustainability of public finances at a time when the sovereign itself is severely constrained in international bond markets.
Graph II.12.1: Cyprus - GDP growth and contributions
-12
-9
-6
-3
0
3
6
9
12
01 02 03 04 05 06 07 08 09 10 11 12 13
Dom. demand, excl. inv. InventoriesNet trade GDP (y-o-y%)
forecast
pps.

13. LATVIA Recovery remains on track despite external shocks
84
Growth slows after strong rebound
Latvia's economy remained largely resilient to adverse external shocks in the second half of 2011 but signs of a slowdown appeared in the beginning of 2012. After a strong rebound of 5.5% in 2011, GDP growth is expected to decelerate to 2.2% in 2012, reflecting the weaker external environment and more cautious investments and private consumption. This is also confirmed by a downturn in economic sentiment in March 2012, although the underlying indicator remains above the 12-month average. With the gradual improvement in the external outlook, Latvia's growth is forecast to pick up again, to 3.6% in 2013. Exports and investments are projected to remain the main growth drivers in the medium run while private consumption is set to rise at a lower rate due to continuous deleveraging in the retail banking segment.
Graph II.13.1: Latvia - GDP growth and contributions
-35
-28
-21
-14
-7
0
7
14
21
04 05 06 07 08 09 10 11 12 13
pps.
Dom. demand, ex. invent. InventoriesNet exports GDP growth (y-o-y%)
forecast
The breakdown of GDP by sector shows that tourism, construction and manufacturing achieved the highest real growth rates of 21.9%, 12.4% and 11.7% in 2011. Construction works were supported by favourable weather conditions towards the end of the year but business surveys in the sector also signal a broadly favourable outlook for 2012. Hard data for the first months of 2012 indicate some slowdown in manufacturing, while hotel occupancy rates continue to demonstrate a rapid expansion in tourism.
New jobs and emigration curb unemployment
While employment increased by 3.4% in 2011, the pace of job creation is set to slow down significantly due to weaker economic growth and
some moderation in business sentiment. Helped also by increased emigration flows, the rate of unemployment dropped substantially in 2011 to a year-average of 16.1% for the age group of 15-74 (from 18.7% in 2010), but remained well above the EU average. Unemployment is expected to decrease further in 2012-13, but the high shares of youth and long-term unemployment remain relevant challenges. Skill mismatches, as well as lack of qualified staff in some business sectors, pose additional concerns on the labour market although the ratio of job vacancies was still low at 0.4% of all job openings at the end of 2011.
Inflation decelerates despite oil shocks
HICP inflation rose by 4.2% in 2011 after a drop of 1.2% in 2010. The index was strongly affected by the increase in VAT rates, as evidenced by the much lower constant-tax price index of 2.7%. Commodity prices of agricultural products and primary energy resources were the other major price movers while core inflation remained very low. Inflation is projected to decelerate to 2.6% in 2012 and 2.1% in 2013 as the impact of the tax hikes weakens substantially. Uncertainties related to crude oil prices pose a significant risk to the inflation forecast due to the high weight of energy in the country's consumer basket.
Current account expectedly shifts to deficit
The current-account balance turned to a deficit of 1.2% of GDP in 2011 from a surplus of 3% of GDP in 2010. Increased domestic demand, driven mainly by the strong rebound in corporate investments, pushed up imports to a real growth of 20.7% in 2011. Exports rose by 12.6% and their share in GDP widened to 59.3% in 2011 from 53.8% in 2010. Export shares in global trade also kept rising, showing further improvement in external competitiveness. In the medium run, imports are projected to grow slightly faster than exports, as demand for investment goods remains high. Therefore, the current-account gap is set to widen further, but to levels that will not pose threats to the sustainability of the country's external position. The external account, calculated as the sum of the current and capital accounts, posted a surplus of 0.9% of GDP in 2011 and is expected to remain broadly balanced in 2012-13,

Member States, Latvia
Table II.13.1:Main features of country forecast - LATVIA
2010 Annual percentage changemio LVL Curr. prices % GDP 92-07 2008 2009 2010 2011 2012 2013
GDP 12738.7 100.0 2.2 -3.3 -17.7 -0.3 5.5 2.2 3.6 Private consumption 8024.1 63.0 - -5.8 -22.6 0.4 4.4 2.2 3.3 Public consumption 2230.6 17.5 - 1.6 -9.4 -9.7 1.3 0.0 0.3 Gross fixed capital formation 2487.2 19.5 - -13.8 -37.4 -12.2 24.6 6.0 10.4 of which : equipment 860.4 6.8 - - - - - - - Exports (goods and services) 6853.4 53.8 - 2.0 -14.1 11.5 12.6 4.5 6.3 Imports (goods and services) 7034.9 55.2 - -10.8 -33.3 11.5 20.7 5.1 7.5 GNI (GDP deflator) 13006.5 102.1 1.9 -1.0 -10.6 -5.5 4.0 1.6 3.4 Contribution to GDP growth : Domestic demand - -9.1 -29.8 -4.4 8.6 3.0 5.1
Inventories - -2.4 -2.5 4.5 2.1 0.0 0.0Net exports - 8.2 14.6 -0.5 -5.2 -0.8 -1.4
Employment -1.4 0.9 -13.2 -4.8 3.4 0.7 1.2 Unemployment rate (a) 12.1 7.5 17.1 18.7 16.1 14.8 13.2 Compensation of employees/head - 15.7 -12.7 -5.5 4.2 1.7 2.2 Unit labour costs whole economy - 20.7 -7.9 -9.8 2.1 0.3 -0.1 Real unit labour costs - 6.9 -6.7 -7.7 -3.1 -1.8 -1.7 Saving rate of households (b) 1.3 4.9 10.3 4.2 0.0 0.7 1.6 GDP deflator 29.7 13.0 -1.2 -2.2 5.4 2.1 1.6 Harmonised index of consumer prices - 15.3 3.3 -1.2 4.2 2.6 2.1 Terms of trade of goods - -1.8 -2.9 1.1 5.8 -0.2 0.1 Merchandise trade balance (c) -14.5 -17.8 -7.1 -7.1 -9.9 -10.6 -11.5 Current-account balance (c) -5.7 -13.1 8.6 3.0 -1.2 -1.8 -2.6 Net lending(+) or borrowing(-) vis-à-vis ROW (c) -3.4 -11.6 11.1 4.9 0.9 0.8 0.1 General government balance (c) - -4.2 -9.8 -8.2 -3.5 -2.1 -2.1 Cyclically-adjusted budget balance (c) - -6.5 -6.9 -5.6 -2.3 -1.2 -1.7 Structural budget balance (c) - -6.5 -6.6 -5.0 -3.2 -2.2 -1.7 General government gross debt (c) - 19.8 36.7 44.7 42.6 43.5 44.7
(a) Eurostat definition. (b) gross saving divided by gross disposable income. (c) as a percentage of GDP.
85
which will keep the external debt ratios on a downward trend.
Public finances continue to improve
The robust economic growth in the second half of 2011 led to a better-than-expected outcome, with a general government deficit of 3.5% of GDP in the year as a whole. Better tax performance – in particular on the side of labour taxes – explained the major part of this over-performance, with savings under some expenditure categories adding to this. The impact of financial support to the state-owned Mortgage and Land Bank and to the state-owned national airline company amounted to 0.8% of GDP, in line with previous expectations.
The 2012 budget law was adopted by the Latvian Parliament on 15 December 2011. On the revenue side, measures in the law include legislative actions to strengthen the tax administration in sectors prone to undeclared activity and to broaden the property tax base, with an overall estimated impact of 0.3% of GDP. On the expenditure side, the budget includes steps to support the nominal freeze in the public wage bill, reducing subsidies and limiting other expenditure while safeguarding the social safety net and investments. The overall impact of the expenditure restraint is estimated at 0.6% of GDP. Moreover, tax increases that took
effect in summer 2011 further contribute to the improving outlook of public finances. Taking into account these measures and the better outcome seen in 2011, the general government deficit is now expected to be 2.1% of GDP in 2012. In 2013, the general government deficit is projected to remain unchanged as the increase in state contributions to the funded pension scheme – as foreseen by legislation in force – offsets the cyclical improvement in tax revenue, while some expenditure items increase under the no-policy-change assumption.
In June 2011, the authorities returned to the international financial markets and a second major international bond issuance took place in February 2012. The debt level increased in 2011 by less than expected due to a buy-back of government bonds from the Deposit Guarantee Fund, while the ratio of debt to GDP declined. Over the forecast horizon, the general government debt is expected to reach 44.7% of GDP by the end of 2013, partly as the authorities pre-fund the repayment of loans under the EU Balance of Payments programme. Following the expiry of the programme in January 2012, these repayments will peak in 2014-15, subsequently reducing the debt.

14. LITHUANIA Growth set to slow down but remains robust
86
After a strong 2011, uncertainty lowers growth going forward
Economic growth picked up significantly in 2011, reaching 5.9%. Lithuania took full advantage of growing export markets as on-going real wage declines and productivity improvements fostered competitiveness. Net exports contributed positively to growth. Subsequently, corporate profits, as well as employment, increased and domestic demand took over as the main driver of economic growth. However, at the end of 2011, Lithuania felt the repercussions of the slowdown in the EU as external demand declined. In addition, turbulences in financial markets and the bankruptcy of the domestic bank Snoras in November 2011 further dampened consumer confidence and business expectations.
Graph II.14.1: Lithuania - GDP growth and contributions, output gap
-30
-20
-10
0
10
20
06 07 08 09 10 11 12 13
pps.
Output gap Dom. demand, excl. invent.
Net exports Inventories
GDP (y-o-y%)
forecast
The economic uncertainty is likely to hold down prospects for the Lithuanian economy in 2012, and a rebound is expected only in 2013. Real GDP growth is forecast to reach 2.4% in 2012 and 3.5% in 2013. Weakening confidence slows down private consumption growth despite some further improvement in the labour market. Unemployment substantially decreased in 2011 but remains high, particularly among young and unskilled workers. Skill mismatches have appeared in some sectors and long-term unemployment has increased. The unemployment rate is projected to decline further but to remain in double digits over the forecast horizon.
The deteriorated global and domestic outlook also affects business confidence and investment decisions. Slowing investment growth in 2012 is
mirrored in decreasing lending since the beginning of 2012. In 2013, both private investment and private consumption are expected to accelerate on the back of a stronger global environment. Public investment will grow over the forecast horizon, supported by EU co-financed projects.
Relatively resilient exports in weak global environment
Lithuania's strong trade performance in 2011 was accompanied by a gain in market shares, when exports grew in real terms by 13.7% and imports by 12.7%. In 2012, export growth is set to moderate because of weaker export demand. Due to a high energy-dependency feeding import demand, net exports are likely to contribute slightly negatively to GDP growth. After a bout of weakness in early 2012, the well-diversified export structure and relatively positive prospects for Lithuania's main export markets (the Baltics, Russia, Germany and Poland) will underpin the trade performance.
The current-account balance turned to a deficit of 1.6% of GDP in 2011. The negative trade and income balance were partially offset by sizeable current transfers, in particular high inflows from the EU funds and strong workers' remittances. The external balance also deteriorated in 2011 but remained positive, reflecting the high capital-account surplus due to the increased absorption of the EU structural funds. The current-account deficit is expected to widen somewhat further, while the external surplus is expected to broadly stabilise in 2012 as the negative impact of weaker external demand is offset by a decrease in domestic demand growth.
Inflation is set to moderate
HICP inflation accelerated in 2011 owing to higher energy and food prices and – to a lesser extent – rising domestic demand narrowing the output gap. Annual average inflation increased from 1.2% in 2010 to 4.1% in 2011. Core inflation also edged up, averaging 2.4% in 2011. In March 2012, 12-month average inflation stood at 4.2%, mainly due to higher energy prices. However, it is projected to decelerate to 3.1% in 2012 for the year as a whole, driven by lower food and commodity inflation and weaker domestic demand. In 2013,

Member States, Lithuania
Table II.14.1:Main features of country forecast - LITHUANIA
2010 Annual percentage changebn LTL Curr. prices % GDP 92-07 2008 2009 2010 2011 2012 2013
GDP 95.1 100.0 1.8 2.9 -14.8 1.4 5.9 2.4 3.5 Private consumption 61.2 64.4 - 4.2 -17.5 -4.9 6.1 3.0 3.4 Public consumption 19.5 20.5 - 0.4 -1.4 -3.3 0.4 -1.6 1.0 Gross fixed capital formation 15.5 16.3 - -5.2 -39.5 1.0 17.1 4.8 8.2 of which : equipment 4.5 4.8 - -17.3 -50.0 19.6 25.3 4.0 8.0 Exports (goods and services) 64.9 68.3 - 11.4 -12.5 17.4 13.7 4.3 6.0 Imports (goods and services) 66.1 69.5 - 10.3 -28.3 17.3 12.7 4.5 6.2 GNI (GDP deflator) 93.9 98.7 - 3.6 -10.2 -2.0 3.2 2.7 3.7 Contribution to GDP growth : Domestic demand - 1.3 -21.8 -3.9 6.8 2.5 3.9
Inventories - 2.3 -5.8 5.6 -1.4 0.2 0.0Net exports - -0.7 12.8 -0.2 0.5 -0.2 -0.4
Employment -0.7 -0.7 -6.8 -5.1 2.0 0.6 0.5 Unemployment rate (a) 9.2 5.8 13.7 17.8 15.4 13.8 12.7 Compensation of employees/head - 14.3 -9.9 -0.9 3.4 2.1 3.3 Unit labour costs whole economy - 10.4 -1.4 -7.3 -0.3 0.4 0.3 Real unit labour costs - 0.6 2.4 -9.1 -5.4 -1.7 -2.7 Saving rate of households (b) - -3.0 4.3 1.2 - - - GDP deflator 37.9 9.8 -3.7 2.0 5.3 2.1 3.0 Harmonised index of consumer prices - 11.1 4.2 1.2 4.1 3.1 2.9 Terms of trade of goods - 3.6 -5.9 1.4 -0.6 -0.5 0.0 Merchandise trade balance (c) - -12.9 -3.2 -4.6 -4.8 -5.5 -5.8 Current-account balance (c) - -13.0 2.8 1.1 -1.6 -2.0 -2.1 Net lending(+) or borrowing(-) vis-à-vis ROW (c) - -11.1 7.1 4.9 0.5 0.5 0.3 General government balance (c) - -3.3 -9.4 -7.2 -5.5 -3.2 -3.0 Cyclically-adjusted budget balance (c) - -5.3 -6.8 -5.0 -4.6 -2.6 -2.6 Structural budget balance (c) - -5.2 -7.2 -5.1 -4.6 -2.9 -2.1 General government gross debt (c) - 15.5 29.4 38.0 38.5 40.4 40.9
(a) Eurostat definition. (b) gross saving divided by gross disposable income. (c) as a percentage of GDP.
87
inflation is forecast to inch down further to 2.9%, as oil prices in particular are assumed to decrease. Overall domestic price pressures are set to remain moderate, inter alia due to a still-high rate of unemployment and limited wage growth. The latter is expected to accelerate in 2013 in line with an increase in labour productivity.
Fiscal consolidation is set to continue
In 2011, Lithuania's general government deficit narrowed to 5.5% of GDP from 7.2% in 2010. The budgetary outturn was somewhat worse than expected in the autumn and above the government's deficit target of 5.3% of GDP; this was mainly due to some unforeseen calls on state guarantees on loans by some companies and a higher-than-planned local government deficit. The adjustment has largely relied on expenditure restraint, as spending on goods and services and social benefits further decreased. The revenue-to-GDP ratio fell further, despite reviving domestic demand and efforts to improve tax compliance.
The 2012 budget includes further substantial cuts in expenditure, in particular by maintaining the public sector wage freeze for a third year. Some temporary measures limiting the growth of social benefits have been made permanent. Social security pensions, cut at the beginning of the crisis,
have been brought back to the pre-crisis level. Additional revenue will mainly be collected from non-tax revenues, including higher dividends from state-owned enterprises and sales of carbon rights. The budget law also includes a contingency provision requiring a supplementary budget should revenue fall short of or the deficit or be above plan. Taking into account these measures and the somewhat worse outcome in 2011, the general government deficit is expected to decrease to 3.2% of GDP in 2012. The structural deficit is estimated to decrease from 5.1% in 2010 to 4.6% in 2011 and further to 2.9% of GDP in 2012.
In 2013, some consolidation measures will expire, including the freeze in government wages. However, overall expenditure increase will be contained by the state budget expenditure rule. The government deficit is therefore expected to decrease to 3.0% of GDP in 2013. The general government debt is set to increase from 38½% of GDP in 2011 to nearly 41% of GDP at the end of the forecast horizon. This is more than expected in the autumn forecast since the government – instead of repaying debt – had to provide a loan to a deposit insurance company for compensation of insured deposits following the bankruptcy of the Snoras bank.

15. LUXEMBOURG Unfavourable international environment dampens growth prospects
88
Weaker performance of financial services and manufacturing weigh on growth …
In 2011, the Luxembourg economy grew by 1.6% according to the first official estimate. A strong third quarter (1% q-o-q) was followed by a rather weak one (0.2% q-o-q in the fourth quarter), but there was no contraction in GDP despite unfavourable international environment.
The turbulence on the financial markets affected the performance of financial services, which faced a decline in added value of more than 5% in 2011. Manufacturing recovered quickly in 2010 after the 2009 global crisis, but has again faced a decline in output since the second quarter of 2011. The relapse was particularly marked towards the end of the year, when a number of important iron and steel plants closed partially. Other sectors, on the other hand, showed some resilience.
Private and public consumption increased moderately in 2011, by 1.8% and 2.5% respectively. Investment has been the most dynamic component of GDP. The big hike was partly due to large purchases of planes and satellites by Luxembourg-based companies. Net exports have contributed negatively to growth since 2008. This was again the case in 2011, not surprisingly given the poor performance of financial services and manufacturing, two important export sectors.
Growth expectations for 2012 are modest. The carry-over from 2011 to 2012 is around 0.5%. GDP is estimated to have remained broadly flat in the first quarter of 2012, given the weak performance of the euro area, Luxembourg's principal export market. Increasing confidence, both in Luxembourg and in the EU as a whole, should support a gradual return of growth from the second quarter onwards, resulting in average growth of slightly above 1% in 2012. Again, growth is exclusively supported by domestic demand while net exports still contribute negatively, although their drag on growth is expected to diminish. Financial services should start to benefit from the progress made to overcome the sovereign-debt crisis, but in the short term this sector is not expected to return to its pre-crisis dynamism.
Only in 2013 is Luxembourg's economic output expected to return to its pre-crisis level. GDP is expected to grow by around 2% in 2013, well below the average rates recorded in the past. The main contribution will again come from domestic demand, while the external balance is also expected to contribute positively, for the first time since the outbreak of the worldwide economic and financial crisis. The main downside risk for this growth scenario lies in the export performance of financial services, which would be heavily affected should further unrest hit financial markets worldwide.
Graph II.15.1: Luxembourg - GDP growth and contributions
-8-6-4-202468
10
00 01 02 03 04 05 06 07 08 09 10 11 12 13
pps.
Private consumption Public consumptionInvestment InventoriesNet exports GDP growth (y-o-y%)
forecast
HICP inflation reached 3.7% in 2011, after 2.8% in 2010. It has been driven upwards by rising oil prices and price increases for other raw materials. Considerable rises in administered prices also contributed. Inflation is expected to slow down to 3% in 2012, higher than foreseen in the February 2012 interim forecast, due to the higher oil-price assumptions. The national index (NICP), which has a lower weight for oil products, is expected to fall from 3.4% in 2011 to 2.7% in 2012. In 2013, both the HICP and the NICP are expected to decelerate to around 2% based on the assumption of moderating oil prices.
… slowing down job creation …
Job creation in Luxembourg was substantial in 2011 despite a slowdown towards the end of the year. However, an employment increase of 2½% has not been sufficient to bring down the unemployment rate. Indeed, unemployment has been rising since March 2011 and accelerated towards the end of the year, reaching 4.8% on average in 2011. Non-resident employment has

Member States, Luxembourg
Table II.15.1:Main features of country forecast - LUXEMBOURG
2010 Annual percentage changemio EUR Curr. prices % GDP 92-07 2008 2009 2010 2011 2012 2013
GDP 40266.9 100.0 4.5 0.8 -5.3 2.7 1.6 1.1 2.1 Private consumption 13493.8 33.5 2.6 3.4 1.1 2.1 1.8 0.7 2.0 Public consumption 6695.7 16.6 4.1 1.4 4.8 2.9 2.5 2.6 2.4 Gross fixed capital formation 7407.3 18.4 5.2 3.2 -13.0 3.0 7.7 6.2 3.9 of which : equipment 2228.7 5.5 4.4 5.8 -32.9 24.9 14.3 12.0 4.0 Exports (goods and services) 66435.8 165.0 7.6 4.0 -10.9 2.8 1.7 0.1 4.2 Imports (goods and services) 53877.1 133.8 7.4 5.6 -12.0 4.6 3.2 0.7 4.8 GNI (GDP deflator) 28633.6 71.1 3.3 -5.6 -15.6 8.7 2.2 0.2 2.6 Contribution to GDP growth : Domestic demand 2.9 2.0 -1.6 1.8 2.7 1.8 1.9
Inventories -0.1 -0.1 -1.8 2.3 0.3 0.0 -0.2Net exports 1.7 -1.1 -1.8 -1.4 -1.5 -0.8 0.4
Employment 3.4 4.7 1.0 1.8 2.7 2.0 1.1 Unemployment rate (a) 3.2 4.9 5.1 4.6 4.8 5.2 5.9 Compensation of employees/head 3.4 2.2 1.8 2.6 2.0 3.2 3.5 Unit labour costs whole economy 2.3 6.2 8.6 1.7 3.2 4.1 2.4 Real unit labour costs -0.7 1.7 8.4 -3.0 -1.4 2.7 -0.6 Saving rate of households (b) - 12.0 13.5 - - - - GDP deflator 3.0 4.4 0.1 4.9 4.7 1.4 3.0 Harmonised index of consumer prices - 4.1 0.0 2.8 3.7 3.0 2.0 Terms of trade of goods -0.2 0.5 0.7 2.3 0.9 -1.7 1.0 Merchandise trade balance (c) -11.0 -10.7 -8.6 -9.5 -11.5 -13.9 -13.6 Current-account balance (c) 11.0 5.1 6.5 7.7 7.1 4.5 4.9 Net lending(+) or borrowing(-) vis-à-vis ROW (c) - 4.4 5.8 7.1 7.1 4.5 4.9 General government balance (c) 2.3 3.0 -0.8 -0.9 -0.6 -1.8 -2.2 Cyclically-adjusted budget balance (c) - 1.7 1.3 0.5 0.5 -0.6 -1.4 Structural budget balance (c) - 1.7 1.3 0.5 0.4 -0.6 -1.4 General government gross debt (c) 6.4 13.7 14.8 19.1 18.2 20.3 21.6
(a) Eurostat definition. (b) gross saving divided by gross disposable income. (c) as a percentage of GDP.
89
grown faster than resident employment, but the difference is much smaller than in the years preceding the crisis. Job creation is expected to slow to around 2% in 2012, moving the unemployment rate to 5.2% on average. With economic growth in 2012 expected to be rather moderate and adjustment of employment in some industries still on-going, slow job growth will continue throughout 2013. As a consequence, unemployment would reach a historic high of 5.9%. The automatic 2.5% indexation of wages, which was due this winter, was postponed by the government to 1 October 2012 in an attempt to temper wage growth. On the whole, wages are now expected to increase by 3.2% on average in 2012. With employment expected to increase more than output in 2012, productivity will further decrease in 2012, as was the case in 2011. This will raise unit labour costs, accelerating to a 4.1% increase in 2012. In 2013, output will again rise more quickly and the increase in unit labour costs will be contained to 2.4%.
… while public finances raise concerns
In line with the autumn 2011 forecast, the general government deficit reached 0.6% of GDP in 2011 (from 0.9% in 2010). However, this small overall figure hides a deficit of 2.4% at the level of the central government, which is mitigated by an
accumulation of pension reserves in the social security subsector. In 2012 and 2013, revenues are likely to be heavily affected by the weak performance of financial sector activities, which contribute to around 25% of the fiscal revenues of the Luxembourg government. On the other hand, expenditure on government consumption is rising autonomously. These two factors will drive a steady increase in the deficit, towards around 1.8% in 2012 and around 2.2% in 2013. For 2013, these figures are based on a no-policy-change assumption and so they do not yet include the consolidation package of around EUR 500 million (1.2% of GDP) that has been announced by the government, but still had to be defined on the cut-off date of the forecast.
With a structural balance of around 0.4% of GDP, Luxembourg almost reached its medium-term objective (a surplus of 0.5% of GDP on the structural balance) in 2011. However, the structural balance is expected to deteriorate again to -0.6% in 2012 and to -1.4% in 2013. The public debt fell from 19.1% of GDP in 2010 to 18.2% in 2011. With a rising central government deficit to finance, the debt-to-GDP ratio is expected to increase again, to 20.3% in 2012 and 21.6% in 2013.
16. HUNGARY Muddling through
90
The Hungarian economy grew by 1.7% in 2011. The main engine of the economy was the export sector, which will continue to drive growth over the forecast horizon.
Domestic demand squeezed further
There is no recovery in sight for domestic demand over the forecast horizon. Real disposable income is expected to fall in 2012, given the softness of the labour market linked to the uncertain economic outlook, tax hikes and higher than previously expected inflation. Furthermore, the recently decided financial transactions tax in particular will weigh on consumption in 2013. The negative impact of these developments on private consumption may be partly compensated for by the exchange rate fixing scheme agreed in December with the Banking Association. However, this increases longer-term risks when the term of the agreement expires in 2016 and loan instalments will be hiked.
Investment is projected to continue to fall, which is particularly worrying since the investment to GDP ratio is now the lowest since 1997. Weak demand conditions persist with the exception of some sectors, most notably in export-oriented manufacturing. Credit supply constraints are biting in the case of corporations, with tight non-price conditions accompanying high interest rates, and the stock of loans is anticipated to decrease further. Most of the negative impact of the financial transactions tax is expected to affect investment, together with other measures introduced in Hungary's Convergence Programme, including sectoral levies. This picture is mediated by sizeable investments scheduled in automobile manufacturing.
The pass-through of the VAT rise into prices at the beginning of 2012 was more complete and immediate than previously expected. This could indicate that the corporate sector is stretched tight, presenting a downside risk for employment. The 19% increase in minimum wages that took effect in January is expected to hit demand for low-skilled labour, which is the segment where employment challenges are the most acute. On the upside, wage compensation schemes which are less restrictive for enterprises than initially discussed have since been specified. Hungary's
public works scheme is sizeable and set to expand further, providing most of the employment growth in 2012-13. However, the funding requirements of this scheme tend to crowd out other active labour market policies, even though increasing employment on the open market is crucial.
Exports are still projected to grow at a healthy rate, thanks in part to a major new car plant having entered production in the second quarter of 2012. Another major automobile plant is scheduled to become operational in 2013, helping Hungary to gain further market shares. Also as a result of lower import projections due to contracting domestic demand, the positive contribution of net exports to growth is expected to be sizeable. The current-account surplus is set to increase further over the forecast horizon. Overall, GDP is projected to contract by 0.3% in 2012, and to recover by a modest 1.0% in 2013.
Inflation was unexpectedly high at the beginning of the year, owing not only to the indirect tax rises, but also to a temporary exchange rate shock which boosted imported inflation. The new tax measures imply that inflation is likely to remain well above the central bank's target rate over the forecast horizon.
Fiscal developments
The 2011 general government budget reached a surplus of 4.3% of GDP, thanks to one-off revenue of 9.7% of GDP stemming from the de facto elimination of the earlier compulsory private pension fund and incorporating a better-than-expected outcome in the local government sector. Excluding one-off factors, however, the budget was in deficit by 5¼% of GDP.
In 2012, the budget deficit is expected to reach 2.5% of GDP. Compared with the autumn 2011 forecast of 2.8% of GDP, this includes further savings adopted in the 2012 budget, as well as the permanent effect of the better-than-expected 2011 budget balance, which improves the fiscal outlook by ¾% of GDP. This is expected to be offset by deteriorating growth prospects, higher interest expenditure and some expenditure slippages compared to the 2011 autumn projections. In addition, recent one-off developments (related to the new round of switches from the private back to

Member States, Hungary
Table II.16.1:Main features of country forecast - HUNGARY
2010 Annual percentage changebn HUF Curr. prices % GDP 92-07 2008 2009 2010 2011 2012 2013
GDP 26747.7 100.0 2.6 0.9 -6.8 1.3 1.7 -0.3 1.0 Private consumption 14246.6 53.3 - -0.7 -6.2 -2.2 0.0 -1.5 0.0 Public consumption 5839.7 21.8 0.4 1.1 -0.6 -2.1 -0.3 -3.1 -0.8 Gross fixed capital formation 4806.3 18.0 4.2 2.9 -11.0 -9.7 -5.4 -2.3 -0.7 of which : equipment 1810.3 6.8 - 1.6 -16.7 -4.2 -4.0 1.0 -2.0 Exports (goods and services) 23148.8 86.5 12.7 5.7 -10.2 14.3 8.4 5.4 8.0 Imports (goods and services) 21409.8 80.0 12.7 5.5 -14.8 12.8 6.3 4.0 7.4 GNI (GDP deflator) 25446.1 95.1 - 1.5 -4.8 0.8 0.3 -0.7 1.0 Contribution to GDP growth : Domestic demand 2.4 0.5 -5.9 -3.7 -1.1 -1.8 -0.3
Inventories 0.2 0.2 -4.5 3.1 0.5 0.0 0.0Net exports 0.0 0.2 3.6 1.8 2.2 1.6 1.3
Employment - -1.4 -2.8 0.3 0.3 1.0 1.4 Unemployment rate (a) - 7.8 10.0 11.2 10.9 10.6 9.6 Compensation of employees/f.t.e. - 6.8 -1.4 -2.3 5.8 3.7 2.9 Unit labour costs whole economy - 4.3 2.9 -3.2 4.4 5.1 3.3 Real unit labour costs - -0.9 -0.6 -6.1 0.8 0.5 -0.3 Saving rate of households (b) - 8.0 9.9 8.1 - - - GDP deflator 12.5 5.3 3.6 3.1 3.5 4.6 3.6 Harmonised index of consumer prices - 6.0 4.0 4.7 3.9 5.5 3.9 Terms of trade of goods - -1.1 1.1 -0.2 -1.7 -0.2 0.5 Merchandise trade balance (c) -4.3 -1.2 2.5 3.2 3.9 5.9 7.2 Current-account balance (c) - -6.9 -0.2 1.0 0.9 2.2 3.7 Net lending(+) or borrowing(-) vis-à-vis ROW (c) - -5.9 1.0 2.8 2.9 5.4 7.0 General government balance (c) - -3.7 -4.6 -4.2 4.3 -2.5 -2.9 Cyclically-adjusted budget balance (c) - -4.8 -2.2 -2.4 5.3 -1.3 -2.0 Structural budget balance (c) - -4.4 -2.2 -3.6 -4.3 -2.1 -2.0 General government gross debt (c) - 73.0 79.8 81.4 80.6 78.5 78.0
(a) Eurostat definition. (b) gross saving divided by gross disposable income. (c) as a percentage of GDP.
91
the public pension pillar, accounting of EU fund absorptions and the public transport sector) will together raise revenues by ¼% of GDP (bringing net total one-off measures to 0.9% of GDP).
In the context of the 2012 update of the convergence programme (CP), the government announced further saving measures with a budgetary impact of 0.3% of GDP in 2012, including a levy on telecommunication services. While the forecast set out in the 2012 CP is calculated with an extraordinary reserve of close to 0.4% of GDP, this forecast currently projects that no further extraordinary reserve will be left. This is on account of expected expenditure slippages of ½% of GDP, mainly related to drug subsidies, the transport sector, and a lack of sufficient detail about cuts in budgetary appropriations.
The 2013 budget deficit is expected to rise to 2.9% of GDP. Compared with the autumn 2011 forecast of 3.7% of GDP for 2013, a positive base effect from 2012 combined with a further substantiation of some elements of the structural reform programme are offset by deficit-increasing effects stemming from the agreement of the government with the banks, the lower economic growth outlook and increased interest expenditure.
However, the 2012 CP contains numerous additional saving measures including tax increases, the introduction of new taxes such as the financial transaction tax, and expenditure cuts, mainly in the area of the budgetary chapters and drug subsidies, altogether with a gross budgetary improving effect of close to 2% of GDP. Taking into account the lack of specifics and implementation risks related mainly to some expenditure cuts, slightly over half of this deficit improving effect has been incorporated in this forecast. Compared with the 2013 deficit target in the CP, this higher forecast mainly reflects the lower economic growth forecast and a more prudent assessment of the saving measures.
The structural balance is expected to decrease from 4¼% of GDP in 2011 to 2.1% of GDP by 2012, following a cumulative deterioration of more than 2% of GDP in 2010 and 2011. In 2013 only a slight improvement is foreseen.
In 2011, the gross public debt declined somewhat, to 80.6% of GDP, in the light of the sizeable primary surplus of 8¼% of GDP, which was to a large extent offset by the depreciation of the forint. Assuming that no public assets will be sold in 2012, the gross public debt is expected to decrease to 78.5% of GDP in 2012 and slightly further in 2013, based on the current deficit outlook.

17. MALTA Growth moderates but remains above the euro-area average
92
Loss of momentum in the second half of 2011 continues into 2012
At 2.1%, real GDP growth in Malta remained relatively robust in 2011, outperforming the average for the euro area (1.5%). Growth was driven mainly by net exports and household consumption. The sharp contraction in investment also reflected a base effect from some relatively substantial one-off projects in 2010.
The moderation in economic growth that became evident in the second half of 2011 is expected to carry over into 2012, when growth is forecast to slow to 1.2%, before rebounding to almost 2% in 2013.
-10
-5
0
5
10
01 02 03 04 05 06 07 08 09 10 11 12 13
pps.
Private consumption Government consumptionGFCF Net exportsChanges in inventories Real GDP (y-o-y%)
forecast
Graph II.17.1: Malta - Contributions to real GDP growth
Compared with 2011, the contribution from external trade is set to moderate in 2012, reflecting a weaker outlook for the tourist sector as well as a faster rebound in imports. Consumer confidence is projected to remain low on the back of rising unemployment and real household consumption is projected to grow at a subdued pace. Fixed investment is forecast to stagnate given below-average levels of capacity utilisation in the beginning of 2012 and increased uncertainty about domestic and international prospects. Overall, domestic demand and net exports are forecast to contribute equally to real GDP growth in 2012.
Business investment and household consumption are forecast to strengthen in 2013, thus becoming the main drivers of growth. After reaching historically low levels in 2011-12, the private investment ratio is projected to start to recover
gradually, supported also by improved global growth prospects. The planned construction of the electricity interconnector pipeline with Sicily provides a further boost. At the same time, stronger employment and average wage growth are projected to increase the disposable income of households, thereby leading to a mild acceleration in private consumption. Given its high import-intensity, stronger domestic demand is set to boost imports but net exports are still forecast to contribute positively to growth given the strengthening of exports.
Inflation and employment growth both moderate compared to 2011
HICP inflation averaged 2.4% in 2011, driven mainly by the food and energy components (the latter mitigated by the government's decision to keep electricity tariffs unchanged). Inflation is forecast to moderate slightly over the forecast horizon. In 2012, lower oil price dynamics and an extension of the freeze in electricity tariffs are behind the slowdown. The slight pick-up in 2013 is mainly on the back of the services component, reflecting the improvement in domestic demand. As in 2011, inflation in Malta is projected to stay slightly below the euro-area average in 2012 before climbing back above it in 2013.
Employment growth averaged 2.3% in 2010-11, outperforming the euro-area average owing in particular to a sizeable improvement in female participation and employment. A continuation of this trend is expected to support employment dynamics over the forecast horizon. Nevertheless, the weakening of economic activity is projected to translate into more moderate job creation over the forecast horizon.
Risks to this scenario are broadly balanced. Aside from risks related to the international environment, a specific factor relevant for Malta is a possibly more resilient labour market, which would lead to higher household consumption. The absence at this stage of credit constraints implies that a possible swifter recovery in investor appetite for new projects could probably be financed easily.

Member States, Malta
Table II.17.1:Main features of country forecast - MALTA
2010 Annual percentage changemio EUR Curr. prices % GDP 92-07 2008 2009 2010 2011 2012 2013
GDP 6123.3 100.0 3.5 4.1 -2.7 2.3 2.1 1.2 1.9 Private consumption 3770.6 61.6 - 5.1 -1.4 -1.7 3.1 0.3 1.0 Public consumption 1292.1 21.1 - 12.3 -1.3 0.6 3.9 1.8 0.0 Gross fixed capital formation 1085.4 17.7 - -21.2 -17.5 9.9 -13.4 0.0 4.5 of which : equipment - - - -27.8 -24.3 27.7 - - - Exports (goods and services) 5834.6 95.3 - 1.6 -10.5 17.7 1.0 2.4 4.4 Imports (goods and services) 5750.0 93.9 - 0.6 -11.3 13.7 -1.0 2.0 4.0 GNI (GDP deflator) 5617.2 91.7 2.8 4.3 -6.9 2.0 1.6 0.9 1.6 Contribution to GDP growth : Domestic demand - 1.1 -4.0 0.4 0.8 0.6 1.2
Inventories - 1.9 0.2 -1.8 -0.9 0.1 0.0Net exports - 1.1 1.1 3.7 2.2 0.6 0.7
Employment 1.1 2.6 -0.3 2.3 2.4 0.6 1.1 Unemployment rate (a) 6.4 6.0 6.9 6.9 6.5 6.6 6.3 Compensation of employees/head 5.1 4.7 3.3 -0.4 0.4 1.5 2.4 Unit labour costs whole economy 2.8 3.2 5.9 -0.4 0.8 0.9 1.6 Real unit labour costs 0.2 0.2 3.3 -3.3 -1.5 -0.8 -1.0 Saving rate of households (b) - - - - - - - GDP deflator 2.6 3.0 2.5 3.0 2.3 1.7 2.6 Harmonised index of consumer prices - 4.7 1.8 2.0 2.4 2.0 2.2 Terms of trade of goods - -7.9 -3.8 1.4 6.8 -0.2 0.2 Merchandise trade balance (c) -18.2 -20.9 -18.0 -17.6 -15.2 -15.8 -15.5 Current-account balance (c) - -5.3 -8.3 -6.4 -3.3 -3.2 -2.8 Net lending(+) or borrowing(-) vis-à-vis ROW (c) - -4.9 -6.6 -4.7 -1.4 -1.3 -1.0 General government balance (c) - -4.6 -3.8 -3.7 -2.7 -2.6 -2.9 Cyclically-adjusted budget balance (c) - -5.1 -2.9 -3.2 -2.6 -2.5 -3.1 Structural budget balance (c) - -5.4 -3.5 -4.4 -3.3 -3.5 -3.3 General government gross debt (c) - 62.3 68.1 69.4 72.0 74.8 75.2
(a) Eurostat definition. (b) gross saving divided by gross disposable income. (c) as a percentage of GDP.
93
Government deficit remains below 3% of GDP
The general government deficit was 2.7% of GDP in 2011, slightly better than estimated in the autumn forecast (3% of GDP), mainly because of higher one-off revenues from the extension of the 2010 tax amnesty.
In 2012, the deficit is projected to narrow slightly, to 2.6% of GDP, while the primary surplus increases to 0.8% of GDP (from 0.4% in 2011). The forecast includes the impact of the measures adopted in the 2012 budget (which was presented after the cut-off date of the autumn forecast) and the January review of spending allocations. The current revenue ratio is projected to increase by 1.1% of GDP compared to 2011, reflecting inter alia measures to improve the efficiency of revenue collection (mainly of a one-off nature) and one-off concession fees from the local lottery operator. Primary current expenditure is forecast to rise by 0.3% of GDP, mainly reflecting a rise in subsidies to the national energy company (Enemalta). The increase in net capital expenditure of 0.4% of GDP is mainly due to the planned equity injection into Air Malta (0.3% of GDP).
In 2013, the deficit is projected to widen to 2.9% of GDP based on the no-policy-change assumption, while the primary surplus declines to
0.5% of GDP. While tax revenue is boosted by the pick-up in economic activity, the disappearance of the one-off revenue projected for 2012 implies that the current revenue ratio returns to its 2011 level. Primary current expenditure is forecast to drop by 0.6% of GDP, reflecting a continuation of the tight recruitment policy in the public sector as well as lower dynamics of social transfers from the gradual impact of the 2006 pension reform. Net capital expenditure (which includes the planned additional equity injection into Air Malta) is expected to fall slightly as a percentage of GDP.
In structural terms, there would be no improvement in the structural balance in 2012, and a marginal one in 2013 on a no-policy-change basis.
General government gross debt increased by almost 10 pps. of GDP between 2008 and 2011, to 72% of GDP, and is forecast to increase to 75.2% by 2013.
The deficit and debt outcomes could be higher, given risks to expenditure from the on-going restructuring of Air Malta, the expected renewal of the public sector wage agreement and the financial situation of Enemalta.

18. THE NETHERLANDS Subdued outlook on the back of weak domestic demand
94
Negative growth in the second half of 2011
In the second half of 2011, the Dutch economy experienced a sharp downturn on the back of a pronounced weakening of both internal and external demand, recording negative quarter-on-quarter growth of 0.4% and 0.6% in the third and fourth quarter, respectively.
The substantial drop in private consumption mirrored negative developments in household disposable income and consumer confidence, which had been hovering near historical lows. Unfavourable wealth effects, which have a relatively large impact on private consumption in the Netherlands, also played a role. House prices, which have been decreasing gradually by around 3% per year since the third quarter of 2008, continued this downward trend. Negative developments in financial markets in 2011 not only led to losses in household financial wealth but also prompted pension funds to increase pension premiums. The net assets position of Dutch households, however, remains firmly positive as financial and non financial assets keep outweighing the liabilities. Business confidence also remained weak: the business climate indicator has stabilised around the low level reached in the summer of 2011. Construction investment was weak mainly on account of lacklustre housing construction. The number of building permits issued in 2011 was down by 9% compared to the previous year, reaching its lowest level since 1953.
On the external side, exports were adversely affected by the slowdown in global trade and, in particular, euro-area trade. This resulted in a fall in export volumes in the second half of 2011, even though exports still grew by 3.8% for the year as a whole.
External demand the sole significant engine of activity, but contraction in 2012
The negative quarterly growth pattern in the second half of 2011 is forecast to extend into the first half of 2012, albeit at a less pronounced pace. This, in combination with the large negative carry-over from 2011, translates into negative real GDP growth of 0.9% over the whole of 2012. Economic growth is expected to return to positive territory in 2013, but only at a modest rate of 0.7%, with net
exports being the sole significant driving force. These projections are based on a no-policy-change assumption. The impact of additional consolidation measures, on which an agreement was reached in Parliament at the end of April, is not included in the baseline forecast.
Graph II.18.1: The Netherlands - GDP growth and contributions
-4-3-2-1012345
07 08 09 10 11 12 13
pps.
Net exportsDomestic DemandGDP (y-o-y%)
forecast
With virtually all determinants of consumption pointing downwards amidst an environment of low consumer confidence and no indication of a rebound in sight, final consumption expenditure of households is expected to record negative growth of 1.5% in 2012, while stabilising in 2013.
Real disposable income dropped for the fourth year in a row in 2011 and is expected to remain negative in 2012. Lower public employment, wage moderation in the public sector and a higher tax burden will all weigh on disposable income. Wage increases in the private sector are also expected to stay well below inflation as the labour market is set to remain weak over the forecast horizon. Household consumption should continue to reflect negative wealth effects, stemming in particular from on-going weakness in the housing market, as well as increases in pension premiums and cuts in second-pillar pension payouts as of 2013, due to the need to restore the buffers of pension funds. As already-agreed consolidation measures from the 2010 Coalition Agreement are concentrated on the expenditure side, government consumption is expected to decrease by 0.8% in 2012 and to increase marginally, by 0.1%, in 2013.
Gross fixed capital formation is forecast to decrease by 3.9% in 2012 and to increase slightly

Member States, The Netherlands
95
by 0.2% in 2013. The projected fall in investment this year is mainly due to declining construction investment, in particular housing construction, which is set to decrease substantially as a result of the expected continued gradual decrease in house prices and the strong rise in the stock of unsold dwellings. In a context of weak expected demand, high uncertainty and capacity utilisation below its pre-crisis level, investment in equipment is also expected to decrease in 2012 and to rebound subsequently in 2013. Finally, gross public investment volumes are set to decrease in both 2012 and 2013 as a result of fiscal consolidation.
Net exports are expected to contribute positively to economic growth throughout the forecast horizon. In 2012 this would reflect falling imports in line with weak domestic demand, rather than buoyant exports. On the one hand, resilient demand from Germany, the Netherlands' main trading partner, should provide a boost. On the other hand, weak conditions in the EU periphery are set to weigh negatively on external demand. The Dutch economy is expected to benefit from a rebound in world trade in 2013.
This macroeconomic scenario is subject to both positive and negative risks. On the negative side, sizeable additional consolidation measures would put downward pressure on growth. On-going uncertainty surrounding housing market developments may weigh more heavily on private consumption and construction investment. On the positive side, more buoyant demand for exports could improve the growth outlook, given the open nature of the Dutch economy.
Inflation driven upwards by energy prices in 2012 and cooling down in 2013
After years of low inflation of around 1%, HICP inflation accelerated to 2.5% in 2011, mainly as a result of increases in energy and processed food prices. In the first quarter of 2012, the HICP grew by 2.8% y-o-y. Over the remainder of the year, weak domestic demand should hold back underlying inflation, but this is expected to be more than offset by a strong rise in energy prices. On average, the HICP is expected to continue to increase by 2.5% in 2012. With oil prices assumed to decrease gradually from the second half of 2012, and persistently weak domestic demand, inflation is forecast to decrease significantly to 1.8% in 2013.
Following a decline in recent years, nominal unit labour costs are expected to increase over the forecast horizon as a result of past wage agreements, which were based on more positive growth assumptions and labour productivity developments. Furthermore, employers' social contributions are expected to increase. In relative terms, however, the Netherlands gains in competitiveness. Combined with the positive performance of the trade balance, this results in a projected rise in the current-account surplus.
Unemployment on the rise
In 2011 as a whole, the unemployment rate decreased marginally to 4.4%. This was mainly the result of a well-performing labour market in the first half of the year, combined with a shrinkage of the labour force caused by the general perception of negative job prospects ('discouraged worker effect'). From the second half of 2011, however, this picture reversed, as job prospects worsened, while the labour force increased substantially and the unemployment rate started to trend upwards.
The substantial increase in the labour force in the second half of 2011 was predominantly due to a significant increase in the availability of women and older workers. As a result of losses in family disposable income, as well as heightened uncertainty over future labour income and pension prospects, the incentive of second-earners to enter the labour market or work more hours increased ('added worker effect'). Due to the high carry-over from the second half of 2011, the labour force is expected to rise by 1.3% in 2012, while for 2013 a more moderate rise of 0.3% is projected.
Employment prospects are forecast to remain dim, in both 2012 and 2013. This partly relates to the government's intention to significantly reduce the number of public sector employees. In addition, developments in the private sector are to remain subdued over 2012 and 2013, in view of weak demand. Overall, unemployment is projected to rise to 5.7% in 2012 and to increase further to 6.2% in 2013. Whilst still relatively low in a European context, these rates would be the highest recorded since the mid-nineties. The projected pronounced rise in unemployment, contrary to earlier crisis years, mainly results from less labour hoarding by the private sector. This is in line with firms' reduced profitability and a less tight labour market, implying lower search costs for qualified personnel.
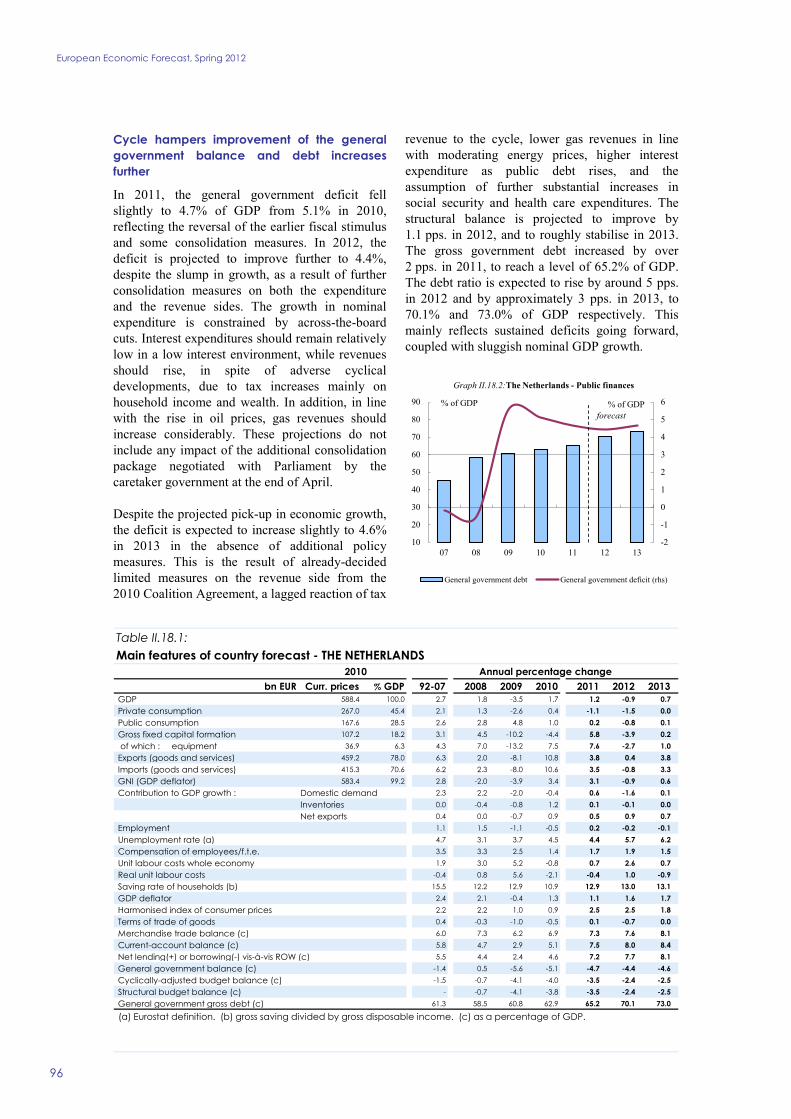
European Economic Forecast, Spring 2012
Table II.18.1:Main features of country forecast - THE NETHERLANDS
2010 Annual percentage changebn EUR Curr. prices % GDP 92-07 2008 2009 2010 2011 2012 2013
GDP 588.4 100.0 2.7 1.8 -3.5 1.7 1.2 -0.9 0.7 Private consumption 267.0 45.4 2.1 1.3 -2.6 0.4 -1.1 -1.5 0.0 Public consumption 167.6 28.5 2.6 2.8 4.8 1.0 0.2 -0.8 0.1 Gross fixed capital formation 107.2 18.2 3.1 4.5 -10.2 -4.4 5.8 -3.9 0.2 of which : equipment 36.9 6.3 4.3 7.0 -13.2 7.5 7.6 -2.7 1.0 Exports (goods and services) 459.2 78.0 6.3 2.0 -8.1 10.8 3.8 0.4 3.8 Imports (goods and services) 415.3 70.6 6.2 2.3 -8.0 10.6 3.5 -0.8 3.3 GNI (GDP deflator) 583.4 99.2 2.8 -2.0 -3.9 3.4 3.1 -0.9 0.6 Contribution to GDP growth : Domestic demand 2.3 2.2 -2.0 -0.4 0.6 -1.6 0.1
Inventories 0.0 -0.4 -0.8 1.2 0.1 -0.1 0.0Net exports 0.4 0.0 -0.7 0.9 0.5 0.9 0.7
Employment 1.1 1.5 -1.1 -0.5 0.2 -0.2 -0.1 Unemployment rate (a) 4.7 3.1 3.7 4.5 4.4 5.7 6.2 Compensation of employees/f.t.e. 3.5 3.3 2.5 1.4 1.7 1.9 1.5 Unit labour costs whole economy 1.9 3.0 5.2 -0.8 0.7 2.6 0.7 Real unit labour costs -0.4 0.8 5.6 -2.1 -0.4 1.0 -0.9 Saving rate of households (b) 15.5 12.2 12.9 10.9 12.9 13.0 13.1 GDP deflator 2.4 2.1 -0.4 1.3 1.1 1.6 1.7 Harmonised index of consumer prices 2.2 2.2 1.0 0.9 2.5 2.5 1.8 Terms of trade of goods 0.4 -0.3 -1.0 -0.5 0.1 -0.7 0.0 Merchandise trade balance (c) 6.0 7.3 6.2 6.9 7.3 7.6 8.1 Current-account balance (c) 5.8 4.7 2.9 5.1 7.5 8.0 8.4 Net lending(+) or borrowing(-) vis-à-vis ROW (c) 5.5 4.4 2.4 4.6 7.2 7.7 8.1 General government balance (c) -1.4 0.5 -5.6 -5.1 -4.7 -4.4 -4.6 Cyclically-adjusted budget balance (c) -1.5 -0.7 -4.1 -4.0 -3.5 -2.4 -2.5 Structural budget balance (c) - -0.7 -4.1 -3.8 -3.5 -2.4 -2.5 General government gross debt (c) 61.3 58.5 60.8 62.9 65.2 70.1 73.0
(a) Eurostat definition. (b) gross saving divided by gross disposable income. (c) as a percentage of GDP.
96
Cycle hampers improvement of the general government balance and debt increases further
In 2011, the general government deficit fell slightly to 4.7% of GDP from 5.1% in 2010, reflecting the reversal of the earlier fiscal stimulus and some consolidation measures. In 2012, the deficit is projected to improve further to 4.4%, despite the slump in growth, as a result of further consolidation measures on both the expenditure and the revenue sides. The growth in nominal expenditure is constrained by across-the-board cuts. Interest expenditures should remain relatively low in a low interest environment, while revenues should rise, in spite of adverse cyclical developments, due to tax increases mainly on household income and wealth. In addition, in line with the rise in oil prices, gas revenues should increase considerably. These projections do not include any impact of the additional consolidation package negotiated with Parliament by the caretaker government at the end of April.
Despite the projected pick-up in economic growth, the deficit is expected to increase slightly to 4.6% in 2013 in the absence of additional policy measures. This is the result of already-decided limited measures on the revenue side from the 2010 Coalition Agreement, a lagged reaction of tax
revenue to the cycle, lower gas revenues in line with moderating energy prices, higher interest expenditure as public debt rises, and the assumption of further substantial increases in social security and health care expenditures. The structural balance is projected to improve by 1.1 pps. in 2012, and to roughly stabilise in 2013. The gross government debt increased by over 2 pps. in 2011, to reach a level of 65.2% of GDP. The debt ratio is expected to rise by around 5 pps. in 2012 and by approximately 3 pps. in 2013, to 70.1% and 73.0% of GDP respectively. This mainly reflects sustained deficits going forward, coupled with sluggish nominal GDP growth.
-2
-1
0
1
2
3
4
5
6
10
20
30
40
50
60
70
80
90
07 08 09 10 11 12 13
% of GDP% of GDP
Graph II.18.2:The Netherlands - Public finances
General government debt General government deficit (rhs)
forecast

19. AUSTRIA Nascent recovery of confidence still to work its way through
97
Strong growth outcome in spite of flagging momentum in 2011
The Austrian economy surpassed its pre-crisis output level in 2011. GDP growth strengthened to 3.1%, significantly outperforming the EU average. In contrast to 2010, domestic demand played a more important role, while the contribution of net exports weakened with the easing of global trade growth. Capital formation contributed 2.4 pps. to growth. This reflects the strong revival in investment activity that had already started in 2010 and was sustained throughout most of 2011, as well as a marked increase in inventory build-up. The latter possibly signals a worsening of growth prospects. Indeed, both export and overall growth tailed off in the course of the year, to slightly negative quarter-on-quarter rates in late 2011. In addition, despite further advances in employment, the growth rate of private consumption was rather modest.
2012 and beyond – the recovery of confidence will take time
Economic activity slackened in late 2011 and is set to remain weak in the coming quarters. Corporations and households remain cautious with regard to investment and consumption spending, setting the stage for rather subdued growth throughout most of 2012. GDP is projected to grow by just 0.8% in 2012 before regaining some momentum in 2013.
Private consumption is likely to stay sluggish as the recovery of household confidence is at a very early stage and employment growth is decelerating. The decline in unemployment came to a halt in August 2011 and unemployment has fluctuated around a rate of 4.2%, with the number of job-seekers still 23% above the pre-crisis trough according to data for February 2012. As a result of the latest wage agreements, the index of negotiated wages has started picking up and the increase reached 3.2% y-o-y in March 2012. This limits the scope for sustaining the pace of employment gains during 2012. The overall impact of these counteracting trends on households' real disposable income is rather uncertain.
Manufacturers' order inflows and backlogs weakened throughout 2011 as did their
expectations for exports. Indeed, firms have boosted their competitiveness by a renewal of capacity and by withholding the compensation productivity gains realised in 2010 and early 2011. Thus, their capacity to accommodate demands for wage increases has strengthened. However, the outcomes of latest wage negotiations may put upward pressure on unit labour costs as the growth of output and productivity are still struggling to recover from the decline in the second half of 2011.
The prospects for weaker export and overall growth, as well as the levelling-off of capacity utilisation rates, will still act as a drag on investment activity in the upcoming quarters. Financing conditions may tighten as banks focus on raising capital buffers and a further clean-up of balance sheets. Credit demand from both companies and households has been weakened by the uncertainty surrounding the economic outlook, while the renewed tightening of credit standards may weigh additionally on credit activity in the coming months.
On the whole, the risks seem balanced. While the downside risks stemming from weaker demand within the EU cannot be discounted, Austria's economy could well benefit from solid import demand outside the EU, including demand fed through its integration in the supply chain of German exporters. Solid sentiment in the construction sector and sound corporate and household balance sheets may yet provide some support for investment activity.
Driven by higher motor and heating fuel prices, as well as rising food prices, headline inflation averaged 3.8% from April to November 2011, but fell to 2.7% by March 2012. Core inflation (HICP excluding energy and unprocessed food) has been affected by spillovers into prices of services, where the annual rate of change accelerated to a peak of 3.9% in August 2011. These effects are expected to disappear gradually, leading to a moderation of inflation in 2012. Wage growth is likely to remain contained, as the pace of economic expansion decelerates, although the translation of wage increases negotiated in various sectors into the effective wage level may well exert upward pressure on producer and consumer prices.

European Economic Forecast, Spring 2012
Table II.19.1:Main features of country forecast - AUSTRIA
2010 Annual percentage changebn EUR Curr. prices % GDP 92-07 2008 2009 2010 2011 2012 2013
GDP 286.2 100.0 2.4 1.4 -3.8 2.3 3.1 0.8 1.7 Private consumption 156.1 54.5 1.7 0.8 -0.3 2.2 0.6 0.8 1.0 Public consumption 55.5 19.4 2.1 4.4 0.2 -0.2 -0.2 0.7 1.2 Gross fixed capital formation 58.6 20.5 1.5 0.7 -8.3 0.1 5.7 1.4 2.3 of which : equipment 22.2 7.8 1.7 -0.7 -9.7 4.3 11.3 2.3 3.4 Exports (goods and services) 154.5 54.0 6.3 1.4 -14.3 8.3 6.7 2.8 5.1 Imports (goods and services) 142.1 49.7 5.2 0.0 -13.8 8.0 7.0 2.2 4.9 GNI (GDP deflator) 285.6 99.8 2.5 2.4 -4.3 2.4 3.0 0.8 1.7 Contribution to GDP growth : Domestic demand 1.7 1.4 -1.9 1.2 2.0 0.9 1.2
Inventories 0.1 -0.6 -0.9 0.7 1.9 -0.5 0.2Net exports 0.6 0.8 -1.1 0.5 0.2 0.4 0.3
Employment 0.5 1.8 -1.4 0.6 1.4 0.4 0.7 Unemployment rate (a) 4.2 3.8 4.8 4.4 4.2 4.3 4.2 Compensation of employees/f.t.e. 2.8 3.1 2.2 1.4 3.0 3.6 1.9 Unit labour costs whole economy 0.8 3.6 4.9 -0.3 1.3 3.2 0.9 Real unit labour costs -0.7 1.8 3.8 -2.0 -0.8 1.2 -0.5 Saving rate of households (b) - 16.3 15.7 13.5 12.7 12.9 12.5 GDP deflator 1.5 1.8 1.0 1.8 2.1 1.9 1.5 Harmonised index of consumer prices 1.9 3.2 0.4 1.7 3.6 2.4 2.0 Terms of trade of goods -0.1 -2.0 0.7 -2.0 -2.9 -0.6 -0.3 Merchandise trade balance (c) -2.0 -0.3 -0.8 -1.1 -2.3 -2.6 -2.8 Current-account balance (c) -0.2 4.9 3.2 2.9 1.9 1.9 1.9 Net lending(+) or borrowing(-) vis-à-vis ROW (c) -0.3 4.8 3.3 3.0 1.8 1.2 1.7 General government balance (c) -2.5 -0.9 -4.1 -4.5 -2.6 -3.0 -1.9 Cyclically-adjusted budget balance (c) -2.5 -1.8 -2.7 -3.6 -2.6 -2.7 -1.8 Structural budget balance (c) - -1.8 -2.7 -3.3 -2.4 -2.1 -1.8 General government gross debt (c) 64.3 63.8 69.5 71.9 72.2 74.2 74.3
(a) Eurostat definition. (b) gross saving divided by gross disposable income. (c) as a percentage of GDP. Note : Contributions to GDP growth may not add up due to statistical discrepancies.
98
Further fiscal consolidation slowed down by bank rescue-related payments
The general government deficit declined from 4.5% of GDP in 2010 to 2.6% of GDP in 2011. The reduction in the deficit was a result of favourable economic conditions and the consolidation measures agreed on at the end of 2010. On the revenue side, they included a bank levy and a rise in the taxes on fuel and cigarettes. The expenditure measures consisted mainly of cuts in family allowances and pension entitlements and reductions in administrative costs. The consolidation effort was partly offset by additional spending on long-term care, education, and R&D. The 2011 deficit turned out significantly lower than the 3.4% of GDP in the autumn 2011 forecast and the 3.6% of GDP notified by the Austrian authorities in autumn 2011. Part of the difference can be explained by the shift of the cancellation of government participation in the "bad bank" KA Finanz from 2011 to 2012, based on the decision by Eurostat (0.3% of GDP). The rest was due to higher-than-expected tax revenue and the lower-than-planned expenditure of the sub-national authorities.
The consolidation effort is expected to continue over the forecast period, based on further effects of the above-mentioned measures and on a new
package adopted by parliament in March 2012. It is estimated in this forecast that the latter will have a deficit-decreasing effect of about 0.1% and 0.5% of GDP in 2012 and 2013 respectively. On the revenue side, they include closing loopholes in VAT collection, taxing gains accrued due to rezoning of land, hikes in income tax for high-earners and rises in social contributions for certain groups. On the expenditure side, the measures consist mainly of cuts in pension allowances, civil service wage freezes and reduction in administrative costs, although these will be partly offset by additional spending on education. However, the consolidation effort in 2012 will be hampered by a slowdown in real GDP growth and by capital transfers due to government participation in two struggling banks, ÖVAG and KA Finanz (0.6% of GDP). Thus, the general government deficit is forecast to widen to about 3% of GDP in 2012, before dropping to just below 2% of GDP in 2013 against the background of accelerating economic activity. In structural terms, the deficit is to gradually fall from 2.4% of GDP in 2011 to 1.8% of GDP in 2013.
The debt ratio is projected to rise steadily throughout the forecast period, from 72.2% of GDP in 2011 to 74.3% of GDP in 2013.

20. POLAND Growth continues, but at a lower pace
99
Impressive performance in 2011
After a sharp rebound in 2010 from the trough of the economic and financial crisis, economic growth strengthened further in 2011, reaching 4.3%. All components of domestic demand supported this performance, but private investment was particularly strong, on the back of growing profitability and easy access to credit. Private consumption was robust, although its growth was somewhat lower than in 2010, while public investment benefited from a hefty inflow of EU structural funds. However, during the second half of 2011, Poland felt the repercussions of the EU slowdown. External demand suffered and consumer and producer confidence waned. At the same time, a considerable depreciation of the zloty partially offset the negative impact of weakening external demand.
Private investment takes over as the main driver of growth
Real GDP growth is projected to slow down considerably to 2.7% in 2012 on the back of deteriorating global demand and continued fiscal consolidation effort. It is set to remain at a similar level in the following year. Domestic demand is projected to remain the main driver of growth, but the focus is expected to continue to shift from consumption to investment. Private gross fixed capital formation is likely to remain strong. Companies are set to benefit from the currency depreciation and use their profits to renew their machinery in preparation for an expected upturn in the cycle. At the same time, growth in private consumption is likely to decelerate. It is set to be constrained by a slowdown in real wage developments and by declining consumer credit, reflecting recent regulatory changes and a shift of credit supply towards corporates.
Both government consumption and investment are planned to stabilise in 2012. However, in 2013 (under the no-policy-change assumption), public consumption is set to rebound. Public investment will reach a peak prior to the European football championship organised in June 2012, and is expected to decrease sharply thereafter in line with the completion of major infrastructure projects by the end of 2012.
Negative trends in foreign trade are expected to continue in 2012, with both exports and imports slowing down in comparison with developments in previous years. However, the contribution of net exports to growth will increase slightly as growth in exports, driven partially by still weak currency, exceeds that in imports. In 2013, the trend is forecast to reverse: imports will grow more strongly than exports as private domestic demand picks up and the net positive effect on growth declines.
-5
-3
-1
1
3
5
7
9
04 05 06 07 08 09 10 11 12 13
External demand Domestic demand Inventories GDP growth (y-o-y%)
Graph II.20.1: Poland - GDP growth and contributions
pps
This scenario is subject to broadly balanced risks. On the upside, a persistently weak currency would further boost exports and enhance import substitution. On the downside, a withdrawal of foreign funding from the region could adversely affect credit markets for private and public borrowers, leading to lower investment and consumption.
Current-account deficit decreases temporarily
Following positive developments in 2011, the current-account balance is forecast to continue to improve in 2012. On the back of a significant but temporary depreciation of zloty, fuelling external demand for exports and a slowdown in domestic consumption, the current-account deficit is set to decrease from 4.3% in 2011 to 3.9% in 2012. It is however expected to deteriorate again in 2013 following a rebound in investment demand and high income transfers abroad linked to increased holdings of sovereign debt by foreign investors.

European Economic Forecast, Spring 2012
100
Financial system remains profitable
Bank lending to both corporate and household sector increased substantially in 2011, in line with high profitability and the improved capital base of the sector. The overall share of non-performing loans (NPLs) is relatively stable, though the relatively low quality of household loans (with NPLs reaching 18.9%) might pose a challenge to private consumption going forward. The main risks to the stability of the financial sector and sustained credit supply to the economy stem from the uncertain international environment through large foreign ownership of the banking sector and continued, but diminishing, reliance on foreign funding for liquidity provision.
Employment growth in spite of economic slowdown
After a significant 1% hike in total employment in 2011, the situation on the labour market is expected to remain relatively robust over 2012 and 2013. However, the economic slowdown will limit total employment growth to a mere 0.3% in 2012 and 0.4% in 2013. The number of unemployed is forecast to stabilise, leading to a temporary increase in the unemployment rate from 9.7% in 2011 to 9.8% in 2012 and a marginal decline to 9.6% thereafter, in line with rebounding employment growth.
Inflation set to decrease after the peak
HICP inflation reached 3.9% in 2011, as a result of the strong depreciation of the zloty in the second half of the year, and consequently high import prices (mainly energy and food). In addition, administered prices were persistently high. On the other hand, with labour market imbalances being adjusted mainly through reductions in real wages, rather than employment changes, pressure on wage increases remained weak over the last year, preventing an even stronger hike in inflation. Over the forecast horizon, the inflation rate is expected to decrease to 3.7% in 2012 and 2.9% in 2013, reflecting a gradual decline in commodity prices and weaker domestic demand. The implementation of the CO2 emission scheme might result in further energy price hikes and present a significant upside risks for inflation.
Fiscal consolidation continues, but at decreasing pace
After rising continuously from 1.9% of GDP in 2007 to 7.8% of GDP in 2010, the general government deficit started decreasing in 2011, when it fell sharply to 5.1%; it is projected to continue falling over the forecast period. In 2012, despite a considerably slower GDP growth, the deficit is expected to decrease to 3.0% of GDP on the back of the 2011 package of structural consolidation measures which will remain in force in 2012 and is supported by additional measures included in 2012 Budget Law. On the revenue side, these measures include a change to the pension system consisting of the retention of part of the pension contribution previously earmarked to the private schemes in the first public pillar, a temporary (3 years) increase in the VAT rate (of 1 pp.) and in excise duty on tobacco (of 4 pps.), the abolition of some VAT and excise duty exemptions and a freeze in Personal Income Tax (PIT) thresholds. Those reforms were complemented in 2012 by an increase of 2 pps. in disability contributions, the introduction of a tax on copper and silver extraction and further minor changes in excise duty regulations. As a result of those measures and additional windfall revenues from dividends of state-owned companies, revenue-to-GDP ratio is projected to increase from 38.5% in 2011 to 40.1% in 2012.
On the expenditure side, structural measures which have remained in force from 2011 include: an expenditure rule limiting growth in all newly enacted and existing discretionary expenditure items to 1 pp. over the inflation rate, a further freeze in the wage fund of public sector employees and some minor cuts in social spending. These measures have been complemented by a decrease in complementary direct payments to farmers in the framework of the Common Agricultural Policy. Moreover, the government is planning to sharply cut public investment expenditure as from the second half of 2012, i.e. as soon as the projects contracted in relation to the European football championship have been completed. Consequently, public investment spending is forecast to grow only moderately in nominal terms and the overall expenditure-to-GDP ratio to decrease from 43.6% in 2011 to 43.1% in 2012.

Member States, Poland
Table II.20.1:Main features of country forecast - POLAND
2010 Annual percentage changebn PLN Curr. prices % GDP 92-07 2008 2009 2010 2011 2012 2013
GDP 1416.4 100.0 4.6 5.1 1.6 3.9 4.3 2.7 2.6 Private consumption 868.6 61.3 4.3 5.7 2.0 3.2 3.1 2.0 2.6 Public consumption 268.3 18.9 3.3 7.4 2.1 4.1 -1.3 0.0 1.2 Gross fixed capital formation 281.2 19.9 7.5 9.6 -1.2 -0.2 8.3 4.7 1.6 of which : equipment 93.6 6.6 - 13.0 -10.8 -5.1 6.6 9.0 11.5 Exports (goods and services) 598.4 42.2 10.9 7.1 -6.8 12.1 7.5 3.4 5.7 Imports (goods and services) 615.5 43.5 11.7 8.0 -12.4 13.9 5.8 1.7 4.9 GNI (GDP deflator) 1355.6 95.7 4.6 6.8 0.1 4.0 4.3 2.9 2.6 Contribution to GDP growth : Domestic demand 4.8 6.9 1.4 2.7 3.3 2.2 2.1
Inventories 0.2 -1.1 -2.5 1.9 0.4 -0.2 0.1Net exports -0.4 -0.6 2.7 -0.7 0.7 0.8 0.3
Employment - 3.9 0.4 0.5 1.0 0.3 0.4 Unemployment rate (a) 14.7 7.1 8.2 9.6 9.7 9.8 9.6 Compensation of employees/head 16.1 8.9 3.5 5.7 5.1 4.7 5.1 Unit labour costs whole economy - 7.5 2.2 2.2 1.7 2.2 2.8 Real unit labour costs - 4.3 -1.4 0.8 -1.4 -0.9 0.5 Saving rate of households (b) - 2.4 9.0 8.5 3.6 2.0 2.9 GDP deflator 12.4 3.1 3.7 1.4 3.2 3.2 2.3 Harmonised index of consumer prices - 4.2 4.0 2.7 3.9 3.7 2.9 Terms of trade of goods 0.3 -2.1 4.4 -1.4 -1.2 -0.5 -1.0 Merchandise trade balance (c) -3.0 -4.9 -1.0 -1.8 -2.1 -1.7 -1.7 Current-account balance (c) -2.2 -4.8 -3.1 -3.7 -4.3 -3.9 -4.2 Net lending(+) or borrowing(-) vis-à-vis ROW (c) -1.4 -4.1 -1.9 -2.1 -2.5 -2.2 -2.9 General government balance (c) - -3.7 -7.4 -7.8 -5.1 -3.0 -2.5 Cyclically-adjusted budget balance (c) - -4.6 -7.1 -7.5 -5.0 -2.7 -1.9 Structural budget balance (c) - -4.6 -7.4 -7.5 -5.0 -2.8 -1.9 General government gross debt (c) - 47.1 50.9 54.8 56.3 55.0 53.7
(a) Eurostat definition. (b) gross saving divided by gross disposable income. (c) as a percentage of GDP.
101
In 2013, the dynamics of the general government deficit reduction is forecast to slow down as some measures (abolition of some VAT exemptions, freeze in the public sector wage fund) implemented in recent years are set to expire and the share of pension contributions retained in the public pillar planned to start decreasing (from 5.0% to 4.5% of gross wages), while no significant new measures have been officially announced. The headline deficit is expected to fall to 2.5% on the back of slowing but still relatively robust GDP growth and further sharp decrease in public investment.
Graph II.20.2: General government finances
36
38
40
42
44
46
48
07 08 09 10 11 12 130
1
2
3
4
5
6
7
8
9
Total expenditure Total revenue Deficit (rhs)
forecast
% of GDP % of GDP
However, given the structural character of most implemented reforms and a negative but relatively stable output gap, the structural deficit is set to follow the path of the headline deficit, falling from 5% in 2011 to 1.9% in 2013.
The general government debt increased notably in 2011, mainly due to a significant depreciation in the Polish currency, raising concerns about exceeding the legally binding threshold of 55% of GDP (according to the national definition of debt) which would have obliged the government to apply counter measures. However, in 2012, thanks to the slight increase in the zloty's exchange rate, further reduction in the headline deficit and prudent government's debt management strategy, the general government debt is expected to start decreasing for the first time since 2007. The debt is projected to fall from 56.3% in 2011 to 55.0% in 2012 and further to 53.7% in 2013. The projected debt figures are, however, subject to considerable uncertainty due to high exchange-rate volatility affecting the debt valuation.

21. PORTUGAL Fiscal and external adjustment are underway
102
The downturn in economic activity in 2011 was milder than expected
Real GDP declined by 1.6% in 2011. This is 0.3 pp. less than anticipated in the autumn forecast and is the result of stronger exports and private consumption, while imports weakened more than projected. The current-account deficit as a share of GDP narrowed further by about 3 pps. in 2011, partly due to a strong decline in imports, in line with the fall in domestic demand. Strong data for the first two months of 2012 confirm that export growth has become more broad-based, with increasing market shares outside the EU partly compensating for the deceleration of exports to the EU. Despite some recent improvements, the loss of external price competitiveness during the past decade has not yet been reversed.
In the last quarter of 2011, the labour market situation worsened significantly, as employment contracted by 2½% compared with the previous quarter and the unemployment rate reached 14%, up from 12.7% in the third quarter of 2011. The jobless rate climbed to 15% in February and is set to increase further this year.
10
14
18
22
26
30
34
38
4
6
8
10
12
14
16
07 08 09 10 11
thousands%
Graph II.21.1:Portugal - Unemployment and labour market flows
Unemployment rate (% of active population)New job matchs during month (rhs)New job offers during month (rhs)
break in unempl. series
Having reached record lows in the last quarter of 2011, confidence indicators have since stabilised and some even reversed their downward trend, but the continued decline in industrial production is giving cause for concern. In February, industrial output was 7% lower than in the same month last year and confidence in this sector has hardly improved in recent months. Moreover, financing conditions remain tight and bank lending to the non-financial private sector has been shrinking since mid-2011.
Deteriorating external environment to weigh on economic activity in 2012
Exports are projected to decelerate to 2.5% in 2012 due to a worsening economic outlook in some of the country's main EU export markets. This is set to have negative second-round effects on private investment, which is expected to decline by 12%. With private consumption expenditure still forecast to contract by some 6%, real GDP is now projected to shrink by 3.3% in 2012, which is a downward revision of 0.3 pp. compared to the autumn forecast. The adjustment of the current-account balance should continue, albeit at a slower pace. Although the economy is expected to regain traction during 2013, annual growth is projected to be rather weak at 0.3%, mainly due to a negative carry-over from 2012. The main driver of growth in 2013 should once again be exports based on the strengthening EU economy and improved price competitiveness due to continued wage restraint.
The weakness of economic activity should continue to counterbalance price pressure from indirect tax increases. High unemployment should keep wage increases in check, while anaemic domestic demand should contain price mark-ups. Nevertheless, HICP inflation is expected to reach 3.0% in 2012 as the dampening forces are projected to dominate the dynamic forces only in 2013 when the effects of the tax hikes dissipate. Unit labour costs are projected to fall by about 3% this year and by ½% in 2013.
Risks to the forecast appear to be balanced. While the exports projection is on the cautious side assuming constant export market shares, there are downside risks to domestic demand related to a stronger-than-expected deterioration of the labour market. On the positive side, continued progress in implementing the Economic Adjustment Programme could boost investor confidence, thereby further lowering sovereign bond yields and attracting foreign investment.
Growth composition unfavourable to fiscal consolidation
The 2011 deficit stood at 4.2% of GDP compared to a target of 5.9% of GDP, driven mainly by the large one-off transaction of the transfer of banks' pension funds to the public social security system,

Member States, Portugal
Table II.21.1:Main features of country forecast - PORTUGAL
2010 Annual percentage changebn EUR Curr. prices % GDP 92-07 2008 2009 2010 2011 2012 2013
GDP 172.7 100.0 2.2 0.0 -2.9 1.4 -1.6 -3.3 0.3 Private consumption 113.9 66.0 2.4 1.3 -2.3 2.1 -3.9 -6.1 -1.0 Public consumption 37.3 21.6 2.4 0.3 4.7 0.9 -3.9 -2.9 -2.6 Gross fixed capital formation 34.1 19.8 2.1 -0.3 -8.6 -4.1 -11.4 -11.8 0.7 of which : equipment 10.3 5.9 3.7 6.9 -13.0 -4.4 -13.3 -14.0 0.5 Exports (goods and services) 53.6 31.0 6.0 -0.1 -10.9 8.8 7.4 2.5 4.7 Imports (goods and services) 65.9 38.2 6.0 2.3 -10.0 5.4 -5.5 -6.9 1.9 GNI (GDP deflator) 167.0 96.7 2.0 -0.4 -3.4 2.3 -1.8 -3.7 -0.1 Contribution to GDP growth : Domestic demand 2.6 0.9 -2.5 0.7 -5.6 -6.8 -1.0
Inventories 0.2 0.0 -1.1 0.1 -0.5 -0.1 0.2Net exports -0.6 -1.0 0.7 0.6 4.4 3.6 1.1
Employment 0.4 0.5 -2.6 -1.5 -1.5 -3.3 0.2 Unemployment rate (a) 6.5 8.5 10.6 12.0 12.9 15.5 15.1 Compensation of employees/head 5.8 3.0 2.8 1.4 -0.8 -3.1 -0.6 Unit labour costs whole economy 4.0 3.5 3.1 -1.5 -0.8 -3.1 -0.6 Real unit labour costs 0.0 1.9 2.2 -2.6 -1.4 -3.8 -1.8 Saving rate of households (b) - 7.1 10.9 10.2 9.4 8.2 8.3 GDP deflator 4.0 1.6 0.9 1.1 0.7 0.7 1.3 Harmonised index of consumer prices 3.6 2.7 -0.9 1.4 3.6 3.0 1.1 Terms of trade of goods 0.4 -3.1 5.0 0.1 -2.0 -0.5 0.2 Merchandise trade balance (c) -10.3 -12.9 -10.0 -10.0 -7.2 -4.2 -3.4 Current-account balance (c) -7.9 -12.6 -10.8 -9.7 -6.5 -3.6 -2.9 Net lending(+) or borrowing(-) vis-à-vis ROW (c) -5.8 -11.4 -9.6 -8.3 -5.0 -2.2 -1.4 General government balance (c) -4.2 -3.6 -10.2 -9.8 -4.2 -4.7 -3.1 Cyclically-adjusted budget balance (c) -4.4 -3.6 -8.9 -9.1 -3.0 -2.6 -1.3 Structural budget balance (c) - -4.7 -8.6 -8.4 -6.2 -3.0 -1.3 General government gross debt (c) 55.9 71.6 83.1 93.3 107.8 113.9 117.1
(a) Eurostat definition. (b) gross saving divided by gross disposable income. (c) as a percentage of GDP.
103
which increased capital revenues by 3½ pps. of GDP on ESA95 basis. However, despite the large one-off transactions and temporary measures, the fiscal consolidation effort implemented in 2011 was large and the improvement in the cyclically-adjusted primary balance, net of one-off measures, amounted to a considerable 3¼ pps. of GDP.
In 2012, Portugal is undertaking consolidation efforts worth over 5% of GDP. Expenditure-reducing measures account for most of the effort, mainly wage and pension cuts, but also expenditure cuts in the health sector. In addition, reductions in public sector employment are to continue and access to some social transfers is to be tightened. On the revenue side, the consolidation plans for 2012 rely mostly on higher indirect taxation, as the VAT structure is set to change, with more goods and services being taxed at the higher intermediate and standard rates. Regarding direct taxation, the focus is mainly on broadening the tax base by reducing deductions and exemptions applicable to personal and corporate income taxation.
The 2012 target for the general government deficit of 4.5% of GDP remains valid. However, downside risks to the fiscal projection related to the macro outlook are starting to materialise, with the growth composition tilting more strongly
towards net exports and away from domestic demand, as is evidenced by the more pronounced fall in private consumption and the substantial worsening of the labour market situation. As a result, the deficit in 2012 is now projected to be 0.2 pp. higher than in the autumn 2011 forecast. However, the government is committed to reaching the 2012 fiscal objectives. A tighter budgetary execution is foreseen.
For 2013, additional consolidation efforts of about 2% of GDP are included in the forecast, in line with the commitments under the Economic Adjustment Programme. They are largely based on the deepening of previously implemented cost-cutting measures and a further broadening of tax bases. The details of the fiscal consolidation plans for 2013 and beyond are set out in the 2012 Fiscal Strategy Document. Considering the planned consolidation measures and the projected GDP path over the period 2011-13, the reduction of the government deficit to 3% of GDP in 2013 from 9.8% in 2010 should largely be the result of a falling expenditure-to-GDP ratio, with a smaller contribution from a rise in the revenue ratio. The improvement in the structural balance over 2011-13 is forecast to amount to about 7 pps. of GDP. Government debt is projected to stabilise at 117% of GDP in 2013, up from 72% of GDP in 2008.

22. ROMANIA Recovery continues to be driven by domestic demand
104
2011 growth exceeds expectations
After two years of negative readings and a cumulated GDP contraction of more than 8%, growth resumed in 2011 with the economy growing slightly above potential by 2.5%. Growth was mainly driven by a robust increase in industrial output and an exceptional agricultural harvest. On the demand side, the main drivers of growth were gross fixed capital formation and, in the second half of the year, a modest recovery in private consumption.
-15
-10
-5
0
5
10
15
20
04 05 06 07 08 09 10 11 12 13
pps.
Graph II.22.1:Romania - GDP growth and contributions
Dom. demand, excl. invent. Net exports
Inventories GDP (y-o-y%)
forecast
Growth in 2012 to slow down but to remain supported by investment
For 2012, real GDP is projected to grow by 1.4%, with domestic demand expected to be the main growth factor. Although households and corporates are expected to continue to adjust their balance sheets during the first half of 2012, the continued improvement in employment, coupled with lower inflation, should support real disposable income. This should also contribute to a revival of private consumption during the second half of 2012. Investment is expected to be an important driver in 2012 given the country's need to modernise its public infrastructure, partly with the co-financing from EU funds. Due to the financial market uncertainty, some of the investments initially planned for early 2012 are likely to be delayed to the second half of 2012 or 2013. As in 2011, credit activity is set for a modest increase in 2012, as households and credit institutions continue to repair their balance sheets.
External demand is expected to continue to contribute negatively in 2012 due to the worsening economic outlook for the EU which accounts for about 70% of Romania's exports. Weaker external demand will slow down export growth, while the slowdown in import growth will be less pronounced as domestic demand keeps up. The resulting increase in the trade deficit will lead the current-account deficit to widen to 5.0%. For 2013, GDP growth is estimated to accelerate to 2.9% as domestic demand recovers. The balance of risks to the 2012 growth baseline scenario remains tilted to the downside although risks become more balanced over the medium term. Downside risks include additional needs to repair household balance sheets, coupled with tighter credit standards for consumer lending that may result in lower-than-currently-forecast private consumption. Upside risks include a stronger contribution of investment from higher EU funds absorption and of domestic demand linked to possible pre-electoral fiscal slippages.
Labour market remained subdued but is expected to improve over forecast horizon
The labour market remained subdued in 2011: according to the Labour Force Survey (LFS), the unemployment rate for the age group 15-74 remained at 7.4% in 2011. Alarmingly, young people remain a particularly vulnerable group as the unemployment rate for employees below 25 years continued to increase and reached its highest level of 25.4% (LFS) in the last quarter of 2011. The overall employment rate remained low in 2011 at 58.5%. Unit labour costs have risen only slightly, by 1.7% in 2011. Labour market conditions are expected to improve over the forecast horizon with unemployment forecast to decrease to 7.2% in 2012 and to 7.1% in 2013.
Inflation to remain within the NBR's target range in 2012 and 2013
Upside risks to the inflation outlook remain, although price pressures receded significantly in 2011. HICP inflation fell sharply to 3.2% in December 2011, close to the mid-point of the national central bank's (NBR's) target range of

Member States, Romania
Table II.22.1:Main features of country forecast - ROMANIA
2010 Annual percentage changebn RON Curr. prices % GDP 92-07 2008 2009 2010 2011 2012 2013
GDP 522.6 100.0 2.6 7.3 -6.6 -1.6 2.5 1.4 2.9 Private consumption 334.4 64.0 5.4 9.0 -10.1 -0.4 1.3 1.3 2.6 Public consumption 85.5 16.4 0.5 7.2 3.1 -4.4 -3.5 0.8 2.5 Gross fixed capital formation 125.2 24.0 9.5 15.6 -28.1 -2.1 6.3 4.7 6.4 of which : equipment 57.9 11.1 10.4 10.9 -27.7 6.0 7.0 4.7 7.5 Exports (goods and services) 185.5 35.5 11.1 8.3 -6.4 14.0 9.9 2.9 5.8 Imports (goods and services) 212.6 40.7 13.8 7.9 -20.5 11.9 10.5 4.0 7.4 GNI (GDP deflator) 516.3 98.8 2.5 8.1 -5.1 -1.5 2.3 1.3 2.8 Contribution to GDP growth : Domestic demand 6.5 11.9 -15.0 -1.6 1.8 2.1 3.6
Inventories -1.5 -3.5 1.4 0.0 1.4 -0.1 0.4Net exports -2.1 -1.0 7.0 0.0 -0.8 -0.6 -1.1
Employment -2.4 0.0 -2.0 -1.4 0.4 0.4 1.1 Unemployment rate (a) - 5.8 6.9 7.3 7.4 7.2 7.1 Compensation of employees/head 61.6 31.9 -1.9 7.6 3.7 3.2 4.2 Unit labour costs whole economy 53.6 22.9 2.9 7.9 1.7 2.3 2.5 Real unit labour costs -1.2 6.6 -1.2 1.8 -5.9 -1.2 -1.3 Saving rate of households (b) - -1.1 -1.3 -2.5 - - - GDP deflator 55.5 15.3 4.2 6.0 8.1 3.5 3.9 Harmonised index of consumer prices - 7.9 5.6 6.1 5.8 3.1 3.4 Terms of trade of goods 1.5 3.2 1.2 2.6 1.7 -0.6 2.8 Merchandise trade balance (c) -7.3 -13.6 -5.8 -4.8 -5.5 -6.4 -6.2 Current-account balance (c) - -11.4 -4.2 -3.9 -4.1 -5.0 -5.0 Net lending(+) or borrowing(-) vis-à-vis ROW (c) -5.4 -11.0 -3.6 -3.7 -4.0 -4.9 -4.9 General government balance (c) - -5.7 -9.0 -6.8 -5.2 -2.8 -2.2 Cyclically-adjusted budget balance (c) - -8.8 -9.1 -5.9 -4.4 -1.7 -1.2 Structural budget balance (c) - -8.3 -9.6 -6.1 -3.3 -1.8 -1.2 General government gross debt (c) - 13.4 23.6 30.5 33.3 34.6 34.6
(a) Eurostat definition. (b) gross saving divided by gross disposable income. (c) as a percentage of GDP.
105
3.0% ± 1 pp. set for end-2011,(36) amid a favourable VAT-related base effect and easing food prices. HICP inflation continued to recede and fell close to the euro-area level in the first quarter of 2012 averaging 2.7%, partly due to a favourable base effect from higher food prices a year ago. As the temporary downward pressure on headline inflation stemming from volatile commodity prices gradually reverses going forward, inflation is projected to increase but to remain within the NBR's range for end-2012. Over the medium term, risks to the inflation outlook are tilted to the upside due to as-yet vague prospects of further increases in administered energy prices. Conversely, a slower-than-expected economic recovery would have disinflationary effects.
Fiscal consolidation to continue
The general government deficit decreased from 6.8% in 2010 to 5.2% of GDP in 2011, but it would have been significantly below 5% without the inclusion of a substantial one-off item, worth 1.1% of GDP, due to payment obligations related to court decisions which became definitive in 2011
(36) The NBR has set the end-year inflation targets at 3.0% ±
1 pp. for both 2011 and 2012 and 2.5% ± 1 pp. for 2013.
and are applied retroactively.(37) The deficit is expected to come down to 2.8% of GDP in 2012. The measures implemented by the authorities to continue fiscal consolidation include: (i) a freeze in public wages and further employment cuts in the public sector; (ii) a pension freeze; (iii) the introduction of a new social assistance code; (iv) excise rate hikes for cigarettes and diesel; and (v) an increase in royalties for the use of resources necessary to produce construction material. For 2013 the budget deficit is expected to fall to 2.2% of GDP under a no-policy-change assumption. The structural balance is expected to improve further over the forecast horizon, from -3.3% of GDP in 2011 to -1.2% of GDP in 2013, as a result of continued fiscal consolidation. The debt-to-GDP ratio is expected to stabilise in 2012-13 at 34.6% after several years of rapid growth due to the economic crisis. (37) The court decisions refer to three types of cases: employees
from specific sectors of the economy asking for bonuses that are given in other sectors, teachers who had contested the fact that they did not receive the 50% increase in wages that was decided in 2008 and that the government did not apply, and individuals contesting the 25% wage cut applied in 2010. The government had passed a law in Parliament which divided the payment of the sum into five yearly tranches from 2012 to 2016, but according to ESA rules the entire amount related to these decisions needs to be recorded in 2011 as that is the year when the decisions became definitive and when the exact amount related to these decisions was determined with certainty.

23. SLOVENIA Economic growth to continue to underperform the euro area
106
Construction and private consumption are a drag on growth throughout the forecast horizon
Slovenia has been underperforming the euro area in terms of real GDP dynamics since 2009. The main drag on growth has come from the on-going sharp retrenchment in investment, with construction output declining by a quarter in 2011 alone. Private consumption also declined in real terms in 2011. Net exports made a large positive contribution to real GDP growth in 2011; while the deterioration in the external environment led to lower export volume growth than in 2010, Slovenia managed to increase its export market shares. Below euro-area average growth is expected to continue throughout the forecast horizon. After a fall by 0.2% in 2011, real GDP is forecast to contract by 1.4% in 2012 before rebounding by 0.7% in 2013.
Given the lack of new large infrastructural projects and a high stock of unsold new housing, construction is forecast to decline again in 2012 and more modestly so in 2013. Equipment investment is projected to continue to expand over the forecast horizon, but at a subdued pace in 2012. The investment outlook is affected by tight financing conditions for the corporate sector, which is one of the most indebted in the euro area, and the on-going deleveraging process in the banking sector. Further job losses and negative real wage growth (driven mainly by developments in the public sector) are projected to entail further drops in real private consumption in 2012 and, to a lesser extent, in 2013.
-30
-25
-20
-15
-10
-5
0
5
09 10 11 12 13
GDP GFCF Construction
forecast
y-o-y%
Graph II.23.1: Slovenia - GDP and GFCF construction growth rates
Export growth is forecast to moderate significantly in 2012 given the further weakening of the euro-area outlook. However, the contribution to growth from net exports is forecast to remain strongly positive (as in 2011) given the weakness of imports growth. In 2013, the projected recovery in investment and exports will boost import growth and thus reduce the positive contribution to growth from net exports.
Employment continues to shrink while inflation remains below the euro-area average
Reflecting more muted activity, average HICP inflation in 2011 was lower than the euro-area average (2.1% versus 2.7%). It is projected to marginally increase in 2012, to 2.2%, as higher services inflation is forecast to be broadly offset by lower food inflation, and to fall to 1.7% in 2013, essentially reflecting a moderation in energy inflation. In both years, inflation would remain below the euro-area average.
Employment growth has been negative since 2009 and this is expected to continue throughout the forecast horizon. Unemployment has doubled to 8.7% in the last quarter of 2011 relative to the trough in mid-2008. Further job losses are expected to occur in construction, where employment has yet to fully adapt to the lower output, and in labour-intensive industries, which are losing competitiveness after the recent minimum wage increases. After a deceleration in 2011, average wage growth is forecast to moderate further in 2012, due to cuts in public sector wages, before picking up slightly in 2013.
Risks to the real GDP growth forecast are related to an intensification of negative feedback loops between deleveraging banks and the credit-constrained real economy, which could bring further bankruptcies and a more severe retrenchment of investment. A sharp fall in house prices, which is possible given the absence of significant adjustment to date, would have wide-ranging effects that are difficult to assess in advance. On the positive side, private consumption could be more resilient if the positive effect on confidence of the roll-out of the fiscal consolidation strategy is stronger than currently anticipated.

Member States, Slovenia
Table II.23.1:Main features of country forecast - SLOVENIA
2010 Annual percentage changebn EUR Curr. prices % GDP 92-07 2008 2009 2010 2011 2012 2013
GDP 35.4 100.0 3.7 3.6 -8.0 1.4 -0.2 -1.4 0.7 Private consumption 19.8 56.0 3.8 3.7 -0.1 -0.7 -0.3 -1.5 -0.4 Public consumption 7.4 20.8 2.9 6.1 2.9 1.5 -0.9 -3.7 -0.9 Gross fixed capital formation 7.7 21.6 7.1 7.8 -23.3 -8.3 -10.7 -4.6 1.2 of which : equipment 3.0 8.3 9.9 3.1 -28.9 4.4 6.3 1.2 3.5 Exports (goods and services) 23.2 65.4 5.3 2.9 -17.2 9.5 6.8 2.2 5.1 Imports (goods and services) 23.0 64.9 7.1 3.7 -19.6 7.2 4.7 0.4 4.1 GNI (GDP deflator) 34.9 98.5 3.6 2.9 -7.3 2.0 -1.2 -1.1 0.6 Contribution to GDP growth : Domestic demand 4.2 5.2 -6.3 -2.0 -2.7 -2.5 -0.2
Inventories 0.5 -1.0 -4.0 1.9 1.0 -0.3 0.0Net exports -1.0 -0.6 2.3 1.5 1.4 1.3 0.8
Employment - 2.6 -1.8 -2.5 -1.7 -1.7 -1.0 Unemployment rate (a) - 4.4 5.9 7.3 8.2 9.1 9.4 Compensation of employees/head - 7.2 1.8 4.3 2.0 0.5 1.0 Unit labour costs whole economy - 6.2 8.7 0.3 0.4 0.2 -0.7 Real unit labour costs - 2.0 5.6 1.4 -0.4 0.0 -2.2 Saving rate of households (b) - 15.2 15.0 15.7 14.9 13.9 14.1 GDP deflator 17.2 4.1 3.0 -1.1 0.8 0.3 1.5 Harmonised index of consumer prices - 5.5 0.9 2.1 2.1 2.2 1.7 Terms of trade of goods 0.8 -1.8 4.7 -4.7 -1.6 -1.5 0.5 Merchandise trade balance (c) -2.9 -7.2 -2.1 -3.5 -3.8 -3.7 -2.7 Current-account balance (c) -0.5 -7.0 -1.3 -0.8 -1.1 -0.4 0.7 Net lending(+) or borrowing(-) vis-à-vis ROW (c) -0.7 -6.9 -1.3 -0.8 -1.4 0.0 1.2 General government balance (c) - -1.9 -6.1 -6.0 -6.4 -4.3 -3.8 Cyclically-adjusted budget balance (c) - -5.1 -4.4 -4.5 -5.0 -2.2 -1.9 Structural budget balance (c) - -5.1 -4.4 -4.5 -3.9 -2.2 -1.9 General government gross debt (c) - 21.9 35.3 38.8 47.6 54.7 58.1
(a) Eurostat definition. (b) gross saving divided by gross disposable income. (c) as a percentage of GDP.
107
Government deficit ratio is forecast to decline, while debt reaches 58% of GDP by 2013
In 2011, the general government deficit was 6.4% of GDP. Without deficit-increasing one-offs from capital support operations, the deficit would have been 5.4% of GDP. The outturn is 0.7 pp. of GDP worse than the estimate in the autumn 2011 forecast, mainly reflecting weaker direct and indirect taxes, with a partial offset coming from lower net capital expenditure.
In 2012, the deficit is forecast to decline to 4.3% of GDP. On the expenditure side, the draft budget for 2012 implements broad-based restraint in compensation of employees and social transfers (including a freeze on indexation arrangements) as well as in intermediate consumption. Also, net capital expenditure is cut compared to 2011. On the revenue side, the positive impact of higher excise duties on tobacco and alcohol is more than offset by direct tax relief (a cut in the corporate income tax rate and more generous investment allowances). Interest expenditure is forecast to increase strongly due to rising debt and the high interest rate spreads on long-term government bonds vis-à-vis Germany. The deficit forecast for 2012 is lower than the 5.3% projected in the autumn forecast mainly because the draft 2012 budget has now been included. The difference with
the deficit target of 3.5% of GDP mainly reflects more cautious revenue projections in conjunction with a more negative macroeconomic scenario.
In 2013, the deficit is projected to decline further, to 3.8% of GDP. This reflects the incorporation of the draft act on balancing public finances, which extends several consolidation measures until after 2012, and the fact that some measures in the 2012 budget will have their full impact only in 2013.
In structural terms, the deficit is projected to improve by around 1¾% and ¼% of GDP in 2012 and 2013 respectively.
Gross government debt stood at 47½% of GDP in 2011. As a result of persisting primary deficits, rising interest rates and low GDP growth, the debt ratio is projected to grow over the forecast horizon to some 58% of GDP in 2013.
The deficit and debt projections are subject to upside risks from possible further capital support operations, including for the largest (majority state-owned) banking group, and the calling of guarantees, while the draft budget and act on balancing public finances were at the cut-off date not yet approved by parliament and subject to negotiations.

24. SLOVAKIA Economy still resilient in 2011 but growth losing pace
108
Growth maintains momentum in 2011
Economic activity remained strong in 2011, with real GDP growing at 3.3%. The robust performance was nearly entirely due to net exports, while inventories posed a substantial drag. Strong export growth, mainly in machinery and transport equipment in the last quarter of 2011 after two preceding negative quarters, suggests that a positive shock led to depletion of stocks, given persisting uncertainty about future developments. Combined with weak demand of households, this resulted in a positive external balance of goods and services of 2.6% of GDP. Financial market conditions continued to remain sound due to banks' generally healthy liquidity and limited exposure to risky securities.
Meanwhile, domestic demand excluding inventories remained almost flat in a context of persistently high unemployment and budgetary consolidation. Household consumption continued to contract, mirroring the drop in real disposable income triggered by stagnating labour market conditions and fiscal measures, in particular the increase in the standard VAT rate and the cut in the public sector wage bill. With the government also slashing its capital expenditure, the solid performance of investment in 2011 was driven by the private sector, especially in the automotive sector, where new production lines were opened.
Graph II.24.1: Slovakia - GDP growth and contributions
-10
-5
0
5
10
15
06 07 08 09 10 11 12 13
pps.
InventoriesNet exportsDom. demand, excl. invent.GDP (y-o-y%)
forecast
Exports to remain engine of growth in 2012-13
Slowing economic activity in Slovakia's main trade partners is expected to be the main drag on growth in 2012, which is projected to decelerate to
1.8%. While the sizeable increase in manufacturing production underpinned a sustained increase in export market shares in 2011, the outlook for 2012 appears less rosy. With four fifths of the total exports directed towards the single European market, where activity remains subdued, exports are expected to grow below their long-term trend in 2012. With the EU economy expected to recover gradually in 2013, export growth and investment should accelerate in 2013, underpinning the pick-up in real GDP to 2.9%.
Domestic demand to pick up only in 2013
Against the background of sluggish labour market conditions in 2012, households' disposable income growth will remain subdued. Average annual growth of gross disposable income, which had been around 10% in nominal terms in the five years preceding the crisis, slowed to 3% in 2009-10 and actually declined in real terms in 2011, depressing households' consumption. The resumption of growth in 2013 should bring about a moderate recovery in consumption along with gradual improvements in the labour market.
Prevailing uncertainty in 2012 suggests a slower pace of private investment in the corporate sector, and investment in residential construction is likely to remain subdued in view of stagnating house prices. However, the profitability of non-financial corporations has remained among the highest in the EU and investment postponed in 2012 is expected to resume in 2013. Public procurement contracts for the construction of major transport infrastructure were finalised in 2011 and are also expected to support capital formation over the forecast horizon.
Inflationary pressures expected to ease
After remaining below 1% for two years, inflation spiked at 4.1% in 2011, driven largely by energy and commodity prices and by the increase in the standard VAT rate and in excise taxes introduced in January 2011. Core inflation stood at 2.7% in 2011. HICP inflation is set to ease to 2.9% in 2012, due to the fading away of the effect of the increase in indirect taxes and lower average increases in administered prices for heating, gas, and electricity. HICP inflation is expected to stabilise at around 2% in 2013 as a quite

Member States, Slovakia
Table II.24.1:Main features of country forecast - SLOVAKIA
2010 Annual percentage changebn EUR Curr. prices % GDP 92-07 2008 2009 2010 2011 2012 2013
GDP 65.7 100.0 - 5.8 -4.9 4.2 3.3 1.8 2.9 Private consumption 38.4 58.5 - 6.1 0.2 -0.7 -0.4 0.2 1.6 Public consumption 12.7 19.4 - 6.1 6.1 1.1 -3.5 1.3 1.3 Gross fixed capital formation 14.6 22.2 - 1.0 -19.7 12.4 5.7 3.2 4.8 of which : equipment 5.8 8.9 - 1.2 -26.6 17.2 12.5 3.6 5.5 Exports (goods and services) 53.4 81.2 - 3.1 -15.9 16.5 10.8 3.1 6.1 Imports (goods and services) 54.3 82.6 - 3.1 -18.1 16.3 4.5 2.7 5.5 GNI (GDP deflator) 64.8 98.6 - 6.9 -4.4 4.4 2.9 1.6 2.4 Contribution to GDP growth : Domestic demand - 4.7 -3.7 2.4 0.4 1.1 2.2
Inventories - 1.1 -3.5 1.8 -1.9 0.3 0.0Net exports - 0.0 2.3 0.0 5.1 0.4 0.6
Employment - 3.2 -2.0 -1.5 1.8 0.5 0.7 Unemployment rate (a) - 9.5 12.0 14.4 13.5 13.2 12.7 Compensation of employees/head - 7.0 3.6 4.4 0.9 2.3 2.6 Unit labour costs whole economy - 4.4 6.9 -1.3 -0.6 1.0 0.4 Real unit labour costs - 1.5 8.2 -1.8 -2.2 -1.0 -1.6 Saving rate of households (b) - 6.1 7.8 11.3 11.0 11.0 11.4 GDP deflator - 2.9 -1.2 0.5 1.6 2.0 2.1 Harmonised index of consumer prices - 3.9 0.9 0.7 4.1 2.9 1.9 Terms of trade of goods - -1.9 -0.7 -0.8 -1.5 -0.4 0.0 Merchandise trade balance (c) - -1.6 1.1 -0.1 3.1 3.3 3.9 Current-account balance (c) - -6.3 -3.6 -3.6 0.1 0.2 0.2 Net lending(+) or borrowing(-) vis-à-vis ROW (c) - -5.4 -2.7 -2.0 2.1 1.6 1.6 General government balance (c) - -2.1 -8.0 -7.7 -4.8 -4.7 -4.9 Cyclically-adjusted budget balance (c) - -4.2 -7.5 -7.4 -4.7 -4.3 -4.6 Structural budget balance (c) - -4.4 -7.7 -7.3 -5.1 -4.4 -4.6 General government gross debt (c) - 27.9 35.6 41.1 43.3 49.7 53.5
(a) Eurostat definition. (b) gross saving divided by gross disposable income. (c) as a percentage of GDP.
109
significant deceleration in energy and regulated prices is expected to be partly offset by a moderate increase in core inflation.
Labour market to remain sluggish
Following a sharp rebound in productivity and hours worked, the crisis-induced process of labour adjustment came to a halt in the last quarter of 2010, when annual employment growth stabilised, after having declined for seven quarters. Consequently, after peaking at 14.4% in 2010, the unemployment rate showed signs of recovery in 2011 when it fell by 1 pp. to 13.5%. Unemployment is however likely to remain high at 13.2% in 2012, as economic growth is set to remain well below potential. Improved cyclical conditions in 2013 should support employment growth above 0.5%, leading to a gradual reduction in the unemployment rate to below 13%.
Public finances consolidation under way
The government achieved a major reduction in the headline deficit in 2011, bringing it down to 4.8% of GDP from 7.7% of GDP a year earlier. The consolidation programme included cuts in the public wage bill, a reduction of intermediate consumption, an increase in the standard VAT rate of 1 pp., and a broadening of the tax base for
personal income tax and social contributions. The final outturn was, however, also influenced by other factors. Tax revenue shortfalls due to less tax-rich growth and increases in non-budgeted expenditure, because of the assumption of debt of hospitals and railway companies, negatively affected the budget balance. On the other hand, EU co-financing, interest payments, social and health care expenditure was lower and the outturn for local governments was better than expected.
For 2012, a limited set of measures has already been approved, focusing on further cuts in the wage bill and in intermediate consumption expenditure on goods and services; on the revenue side, a bank levy will be introduced, coupled with some broadening of the corporate tax base. As some of the measures have proven difficult to fully implement in the past (e.g. cuts in wage bills), they are only partially incorporated in the forecast. The projected deficit is 4.7% of GDP in 2012. In the absence of announced policy measures for 2013, the deficit is forecast to increase slightly to 4.9% of GDP. The projected improvement in the structural balance over the forecast horizon amounts to 0.5 pp. The public debt-to-GDP ratio is expected to reach 53.5% of GDP in 2013.
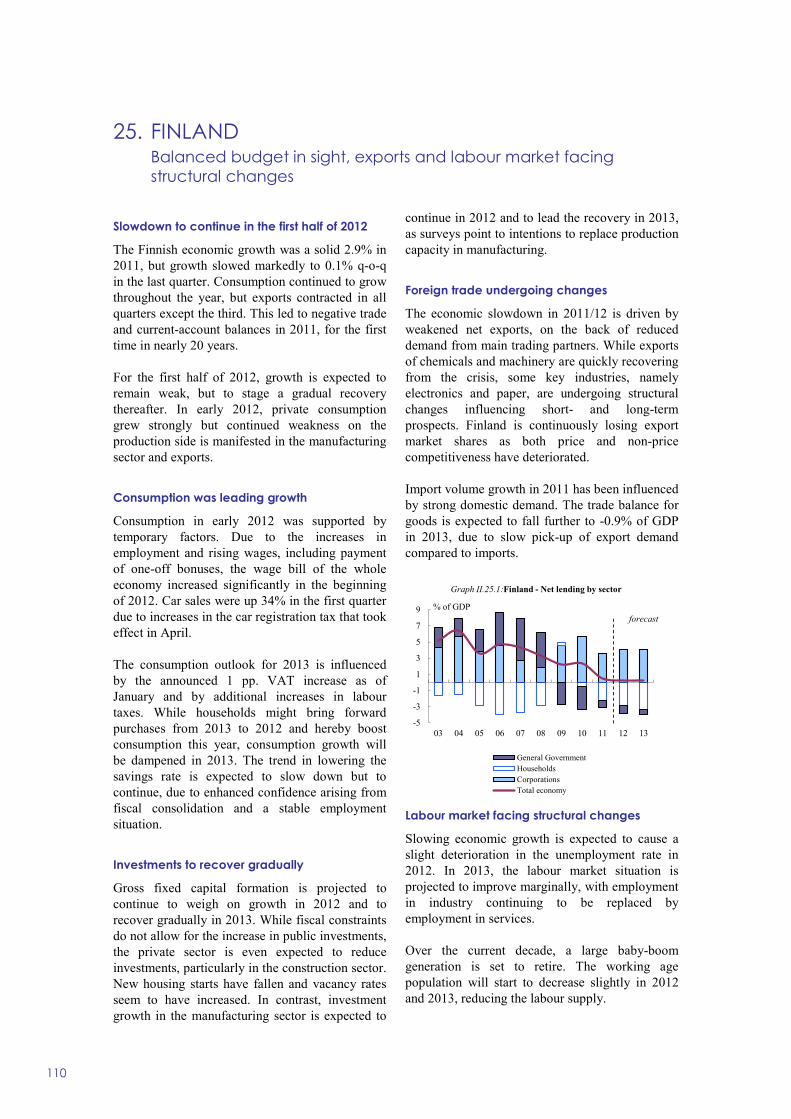
25. FINLAND Balanced budget in sight, exports and labour market facing structural changes
110
Slowdown to continue in the first half of 2012
The Finnish economic growth was a solid 2.9% in 2011, but growth slowed markedly to 0.1% q-o-q in the last quarter. Consumption continued to grow throughout the year, but exports contracted in all quarters except the third. This led to negative trade and current-account balances in 2011, for the first time in nearly 20 years.
For the first half of 2012, growth is expected to remain weak, but to stage a gradual recovery thereafter. In early 2012, private consumption grew strongly but continued weakness on the production side is manifested in the manufacturing sector and exports.
Consumption was leading growth
Consumption in early 2012 was supported by temporary factors. Due to the increases in employment and rising wages, including payment of one-off bonuses, the wage bill of the whole economy increased significantly in the beginning of 2012. Car sales were up 34% in the first quarter due to increases in the car registration tax that took effect in April.
The consumption outlook for 2013 is influenced by the announced 1 pp. VAT increase as of January and by additional increases in labour taxes. While households might bring forward purchases from 2013 to 2012 and hereby boost consumption this year, consumption growth will be dampened in 2013. The trend in lowering the savings rate is expected to slow down but to continue, due to enhanced confidence arising from fiscal consolidation and a stable employment situation.
Investments to recover gradually
Gross fixed capital formation is projected to continue to weigh on growth in 2012 and to recover gradually in 2013. While fiscal constraints do not allow for the increase in public investments, the private sector is even expected to reduce investments, particularly in the construction sector. New housing starts have fallen and vacancy rates seem to have increased. In contrast, investment growth in the manufacturing sector is expected to
continue in 2012 and to lead the recovery in 2013, as surveys point to intentions to replace production capacity in manufacturing.
Foreign trade undergoing changes
The economic slowdown in 2011/12 is driven by weakened net exports, on the back of reduced demand from main trading partners. While exports of chemicals and machinery are quickly recovering from the crisis, some key industries, namely electronics and paper, are undergoing structural changes influencing short- and long-term prospects. Finland is continuously losing export market shares as both price and non-price competitiveness have deteriorated.
Import volume growth in 2011 has been influenced by strong domestic demand. The trade balance for goods is expected to fall further to -0.9% of GDP in 2013, due to slow pick-up of export demand compared to imports.
-5
-3
-1
1
3
5
7
9
03 04 05 06 07 08 09 10 11 12 13
% of GDP
Graph II.25.1:Finland - Net lending by sector
General GovernmentHouseholdsCorporationsTotal economy
forecast
Labour market facing structural changes
Slowing economic growth is expected to cause a slight deterioration in the unemployment rate in 2012. In 2013, the labour market situation is projected to improve marginally, with employment in industry continuing to be replaced by employment in services.
Over the current decade, a large baby-boom generation is set to retire. The working age population will start to decrease slightly in 2012 and 2013, reducing the labour supply.

Member States, Finland
Table II.25.1:Main features of country forecast - FINLAND
2010 Annual percentage changebn EUR Curr. prices % GDP 92-07 2008 2009 2010 2011 2012 2013
GDP 179.7 100.0 3.1 0.3 -8.4 3.7 2.9 0.8 1.6 Private consumption 98.9 55.1 2.5 1.9 -2.7 3.0 3.3 1.7 1.0 Public consumption 44.2 24.6 1.0 1.9 1.1 0.2 0.8 1.0 0.9 Gross fixed capital formation 33.9 18.9 2.7 -0.6 -13.3 2.6 4.6 -1.2 2.8 of which : equipment 8.3 4.6 2.8 1.5 -11.8 -6.0 12.0 -1.1 2.5 Exports (goods and services) 72.1 40.1 8.9 5.8 -21.5 7.8 -0.8 1.9 4.8 Imports (goods and services) 70.5 39.2 7.0 7.5 -16.4 7.7 0.1 2.3 3.9 GNI (GDP deflator) 182.7 101.6 3.4 0.8 -7.4 3.8 2.3 0.6 1.4 Contribution to GDP growth : Domestic demand 2.0 1.2 -4.0 2.2 2.9 0.9 1.3
Inventories 0.3 -0.6 -1.9 0.9 1.3 0.0 0.0Net exports 1.0 -0.4 -3.0 0.2 -0.3 -0.2 0.3
Employment 0.4 2.6 -2.6 -1.2 1.2 -0.1 -0.1 Unemployment rate (a) 11.1 6.4 8.2 8.4 7.8 7.9 7.7 Compensation of employees/head 3.0 4.4 2.3 3.5 2.7 3.3 3.3 Unit labour costs whole economy 0.2 6.7 8.7 -1.3 1.0 2.3 1.6 Real unit labour costs -1.4 3.7 7.2 -1.8 -2.5 -0.3 -0.6 Saving rate of households (b) 9.4 7.8 11.6 11.1 8.9 7.5 7.0 GDP deflator 1.6 2.9 1.4 0.4 3.6 2.7 2.1 Harmonised index of consumer prices 1.6 3.9 1.6 1.7 3.3 3.0 2.5 Terms of trade of goods -0.8 -2.1 2.8 -3.0 -2.8 0.0 -0.8 Merchandise trade balance (c) 7.7 3.7 1.7 1.4 -0.5 -0.7 -0.9 Current-account balance (c) 4.2 3.2 2.0 1.4 -0.4 -0.6 -0.7 Net lending(+) or borrowing(-) vis-à-vis ROW (c) 4.3 3.3 2.1 1.5 -0.3 -0.5 -0.6 General government balance (c) 0.4 4.3 -2.5 -2.5 -0.5 -0.7 -0.4 Cyclically-adjusted budget balance (c) 0.5 2.7 0.7 -0.6 0.5 0.3 0.3 Structural budget balance (c) - 2.7 0.8 -0.5 0.6 0.3 0.3 General government gross debt (c) 46.7 33.9 43.5 48.4 48.6 50.5 51.7
(a) Eurostat definition. (b) gross saving divided by gross disposable income. (c) as a percentage of GDP. Note : Contributions to GDP growth may not add up due to statistical discrepancies.
111
The decision to increase the age from which employees can enter into part-time pension, thus increasing the effective retirement age, will help to mitigate the effects of the diminishing labour force in the coming years. The government is sticking to its ambitious targets of an employment rate of 72% and an unemployment rate of 5% by 2015.
Inflation to remain high in 2012
HICP inflation averaged 3.3% in 2011, ½ pp. of which was estimated to be contributed by tax rises on energy, VAT and excises on alcohol, tobacco and sugar.
In 2012 additional increases in indirect taxes are expected, preventing HICP inflation from abating considerably. In addition, rising world market prices for oil are generating upward pressure, bringing inflation to 3% on average this year.
For 2013, inflation is expected to slightly recede to about 2½%, due to the waning impact of earlier tax rises, but counterbalanced by the announced VAT increase of 1 pp. in 2013. The collective wage agreement for 2012 and 2013 provides for moderate wage growth, with limited inflationary impact.
Additional consolidation measures to bring public finances into balance
In 2011, tax revenues proved to be higher and expenditure somewhat lower than foreseen, although a significant part of these unspent expenditure is expected to be carried over to this year. While the central government deficit was -3.1% of GDP, the general government deficit, which also includes returns of pension funds, was -0.5% of GDP, lower than expected in the autumn forecast.
In March 2012, the government approved additional consolidation measures in order to meet the government's objective to restore balance to the central government finances by 2015. From January 2013, the VAT rate will be increased by 1 pp. Earned income tax will be effectively increased. Municipalities will receive less transfers from the central budget and are expected to respond by increasing local tax rates in 2013.
These additional measures will balance the fiscal impact of the weakening economy, resulting in a broadly stable general government balance over 2012/13. The structural surplus is expected to be 0.3% of GDP in 2012 and 2013.

26. SWEDEN Subdued recovery with low employment growth
112
2011 ended in contraction
The Swedish economy recovered strongly from the 2008/09 recession with annual real GDP growth reaching 6.1% in 2010 and quarterly rates of 0.8% on average in the first three quarters of 2011. In the fourth quarter, however, growth contracted by 1.1% q-o-q, as external demand contracted significantly and retail sales continued to be very subdued. Overall, GDP grew by 3.9% in 2011.
Recovery expected to be subdued
For early 2012, various indicators send mixed signals. On the one hand, both business and consumer confidence have rebounded noticeably in the first months of the year, with the composite indicator hovering slightly above its historical average level in March and April. All business sectors and households have become more optimistic about the outlook, supported by more stable prospects for the labour market and positive developments in the stock markets. Household expectations about future house price developments, which reached a low at the end of 2011, have also recovered strongly, helped by interest rate cuts by the Riksbank. This has led heavily indebted households to start spending again. After the weak second half of 2011, retail sales have rebounded strongly in the first quarter of the year.
On the other hand, the latest industrial production data have been disappointing, with a sizeable contraction in February (-5.2% on the previous month, working-day and seasonally adjusted), reversing the previous promising figures. Similarly, the preliminary monthly figure for new orders showed a significant drop in February (-5.5% on the previous month, working-day and seasonally adjusted), in particular for new orders from abroad (-8.5%). Compared to the preceding three months, industrial production in the period December 2011/February 2012 declined by 1.2% and new orders increased by a meagre 1%. In addition, according to the quarterly service sector indicator published in March by Almega, the employer organisation for the Swedish service sector, the contraction in services production observed in the fourth quarter of 2011 is most likely to have continued in the first quarter of 2012. Reflecting lingering uncertainties about the
strength of the recovery, the major stock index lost a significant share of its previous gains in the month to mid-April.
Taken together, this points to a rather subdued and fragile recovery in 2012, led by consumer spending. With low capacity utilisation, slow demand growth and a stronger krona, corporate investment plans have been put on hold and companies have been revising hiring plans downwards. Export demand is forecast to gain traction only in 2013, reflecting the current slowdown in some trading partners. This is expected to lead to only very limited employment growth over the forecast horizon and the unemployment rate is therefore likely to remain above 7½% in both forecast years.
Monetary policy has already turned more expansionary with two consecutive 25 basis point rate cuts in recent months, bringing the repo rate to 1.5%. There is uncertainty about the future path of the repo rate, as the Riksbank is balancing the need to provide short-term stimulus with a wish to avoid a reacceleration in household borrowing. Overall, GDP growth is forecast to reach only 0.3% in 2012, before accelerating to 2.1% in 2013. Domestic demand is expected to be the main driver of GDP growth in both years, with net trade only turning slightly positive in 2013.
Graph II.26.1: Sweden - GDP growth and contributions
-8
-6
-4
-2
0
2
4
6
8
04 05 06 07 08 09 10 11 12 13Net tradeInventoriesDom. demand, excl. inv.Output gap (% of potential GDP)GDP growth (y-o-y%)
forecast
pps.
Inflationary pressures to remain low
HICP inflation is expected to decrease from 1.4% in 2011 to 1.1% in 2012. This slowdown is mainly
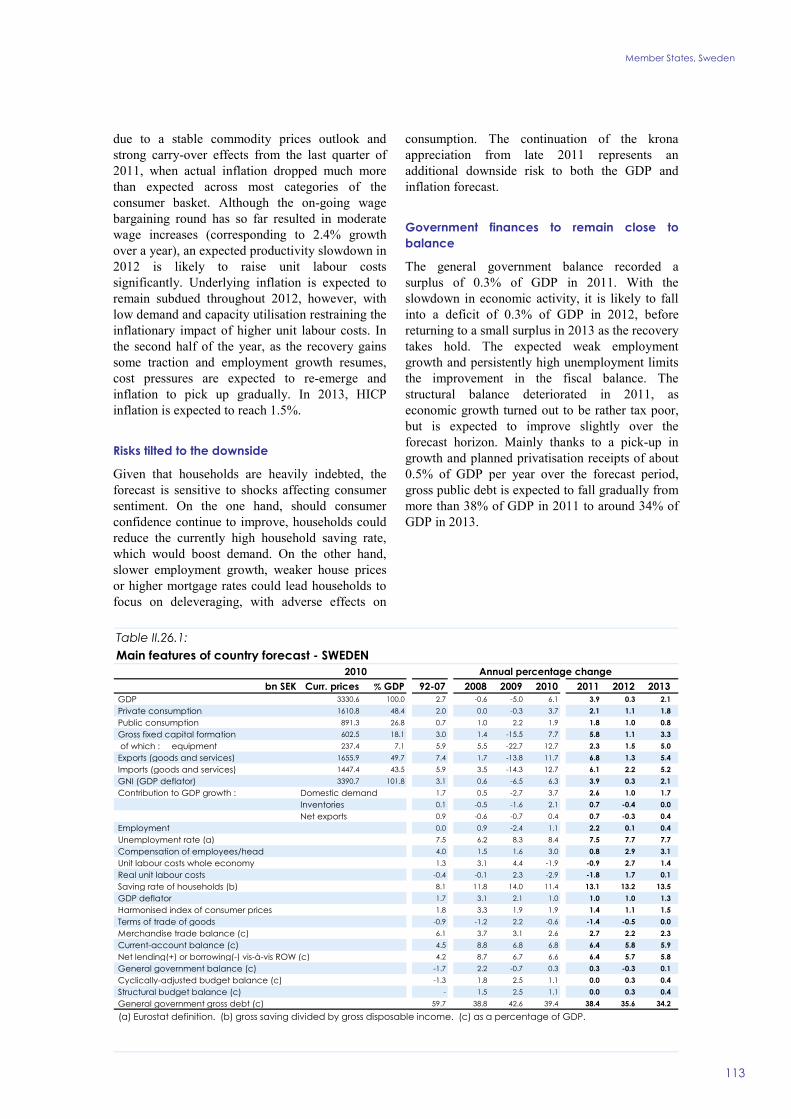
Member States, Sweden
Table II.26.1:Main features of country forecast - SWEDEN
2010 Annual percentage changebn SEK Curr. prices % GDP 92-07 2008 2009 2010 2011 2012 2013
GDP 3330.6 100.0 2.7 -0.6 -5.0 6.1 3.9 0.3 2.1 Private consumption 1610.8 48.4 2.0 0.0 -0.3 3.7 2.1 1.1 1.8 Public consumption 891.3 26.8 0.7 1.0 2.2 1.9 1.8 1.0 0.8 Gross fixed capital formation 602.5 18.1 3.0 1.4 -15.5 7.7 5.8 1.1 3.3 of which : equipment 237.4 7.1 5.9 5.5 -22.7 12.7 2.3 1.5 5.0 Exports (goods and services) 1655.9 49.7 7.4 1.7 -13.8 11.7 6.8 1.3 5.4 Imports (goods and services) 1447.4 43.5 5.9 3.5 -14.3 12.7 6.1 2.2 5.2 GNI (GDP deflator) 3390.7 101.8 3.1 0.6 -6.5 6.3 3.9 0.3 2.1 Contribution to GDP growth : Domestic demand 1.7 0.5 -2.7 3.7 2.6 1.0 1.7
Inventories 0.1 -0.5 -1.6 2.1 0.7 -0.4 0.0Net exports 0.9 -0.6 -0.7 0.4 0.7 -0.3 0.4
Employment 0.0 0.9 -2.4 1.1 2.2 0.1 0.4 Unemployment rate (a) 7.5 6.2 8.3 8.4 7.5 7.7 7.7 Compensation of employees/head 4.0 1.5 1.6 3.0 0.8 2.9 3.1 Unit labour costs whole economy 1.3 3.1 4.4 -1.9 -0.9 2.7 1.4 Real unit labour costs -0.4 -0.1 2.3 -2.9 -1.8 1.7 0.1 Saving rate of households (b) 8.1 11.8 14.0 11.4 13.1 13.2 13.5 GDP deflator 1.7 3.1 2.1 1.0 1.0 1.0 1.3 Harmonised index of consumer prices 1.8 3.3 1.9 1.9 1.4 1.1 1.5 Terms of trade of goods -0.9 -1.2 2.2 -0.6 -1.4 -0.5 0.0 Merchandise trade balance (c) 6.1 3.7 3.1 2.6 2.7 2.2 2.3 Current-account balance (c) 4.5 8.8 6.8 6.8 6.4 5.8 5.9 Net lending(+) or borrowing(-) vis-à-vis ROW (c) 4.2 8.7 6.7 6.6 6.4 5.7 5.8 General government balance (c) -1.7 2.2 -0.7 0.3 0.3 -0.3 0.1 Cyclically-adjusted budget balance (c) -1.3 1.8 2.5 1.1 0.0 0.3 0.4 Structural budget balance (c) - 1.5 2.5 1.1 0.0 0.3 0.4 General government gross debt (c) 59.7 38.8 42.6 39.4 38.4 35.6 34.2
(a) Eurostat definition. (b) gross saving divided by gross disposable income. (c) as a percentage of GDP.
113
due to a stable commodity prices outlook and strong carry-over effects from the last quarter of 2011, when actual inflation dropped much more than expected across most categories of the consumer basket. Although the on-going wage bargaining round has so far resulted in moderate wage increases (corresponding to 2.4% growth over a year), an expected productivity slowdown in 2012 is likely to raise unit labour costs significantly. Underlying inflation is expected to remain subdued throughout 2012, however, with low demand and capacity utilisation restraining the inflationary impact of higher unit labour costs. In the second half of the year, as the recovery gains some traction and employment growth resumes, cost pressures are expected to re-emerge and inflation to pick up gradually. In 2013, HICP inflation is expected to reach 1.5%.
Risks tilted to the downside
Given that households are heavily indebted, the forecast is sensitive to shocks affecting consumer sentiment. On the one hand, should consumer confidence continue to improve, households could reduce the currently high household saving rate, which would boost demand. On the other hand, slower employment growth, weaker house prices or higher mortgage rates could lead households to focus on deleveraging, with adverse effects on
consumption. The continuation of the krona appreciation from late 2011 represents an additional downside risk to both the GDP and inflation forecast.
Government finances to remain close to balance
The general government balance recorded a surplus of 0.3% of GDP in 2011. With the slowdown in economic activity, it is likely to fall into a deficit of 0.3% of GDP in 2012, before returning to a small surplus in 2013 as the recovery takes hold. The expected weak employment growth and persistently high unemployment limits the improvement in the fiscal balance. The structural balance deteriorated in 2011, as economic growth turned out to be rather tax poor, but is expected to improve slightly over the forecast horizon. Mainly thanks to a pick-up in growth and planned privatisation receipts of about 0.5% of GDP per year over the forecast period, gross public debt is expected to fall gradually from more than 38% of GDP in 2011 to around 34% of GDP in 2013.

27. THE UNITED KINGDOM Growth likely to remain subdued this year but with a brighter outlook
114
A poor growth performance in 2011
Economic growth in the UK was weak and uneven in 2011, with GDP growth of 0.7% for the year as a whole. The third quarter saw a surge of 0.6% in growth after a contraction of -0.1% in the second quarter, following the extra bank holiday for the royal wedding. However, this growth proved unsustainable and fizzled out quickly with the final quarter registering a negative growth rate of -0.3%.
The main cause of weakness in 2011 was household consumption, which contracted for four consecutive quarters between the final quarter of 2010 and the third quarter of 2011. Investment, which had been expected to contribute positively to growth, actually fell by 0.6% in the final quarter of 2011 and by 1.2% over the year. Net exports were the main source of growth in 2011, contributing 1% to GDP growth. Output in the production industries fell by 1.2% in 2011, whereas both construction and services output increased, by 2.8% and 1.6%, respectively.
Lending to non-financial corporations fell in 2011 and remained muted for households. The banking sector, while solvent and benefiting from increased stability, remains subject to non-negligible tensions, as reflected in interbank spreads.
Subdued growth outlook in the short term
The preliminary estimate of first quarter GDP growth is -0.2%, which contrasts with the most recent business survey data indicating an expansion across all sectors for each of the first three months of 2012. In March, manufacturing showed four months of continuous expansion and a ten-month high based on improved new orders. In the construction sector, although data are highly volatile and activity is at a low level, new orders increased at the fastest rate seen in more than four years. The services indicator gave the strongest reading since the second quarter of 2010. The first quarter estimate was dragged down by very weak construction data and subdued growth in services. However, given the volatility in the first estimate of construction data, survey results suggest that this number may be revised up somewhat.
Bank lending is unlikely to pick up in 2012 despite a further GBP 50 billion expansion of the
quantitative easing programme in February 2012 (taking the total to GBP 325 billion). In fact, lending spreads, which have increased in the wake of the financial crisis, may edge up in 2012 as banks face higher funding costs. This may further constrain credit availability and subsequently investment growth.
The overall outlook for 2012 remains uncertain but, with an anticipation of stronger real wages improving household consumption growth towards the end of the year and more stability in the UK's export markets, GDP growth is expected to remain positive at 0.5% in 2012 with a further improvement in 2013 to 1.7% as investment rises.
Weak consumption likely to continue
Consumption growth was negative for 2011 as a whole. This was to be expected, with consumers being squeezed by high inflation, the government's consolidation plans, low nominal wage growth and higher unemployment. Surprisingly, consumption turned positive in the final quarter of 2011, probably because of heavy pre-Christmas discounting by retailers. However, this growth is unlikely to have continued into the start of 2012 given the negative growth of first quarter GDP.
The household saving rate increased throughout 2011, standing at 7.7% in the final quarter of 2011 compared to 6.8% in the same quarter of 2010. The rise in the unemployment rate is likely to have made consumers more cautious about spending. Recent results from the Commission's Business and Consumer survey indicate that household consumption is likely to remain weak this year as

Member States, The United Kingdom
115
welfare cuts and high unemployment curtail demand. However, in the second half of 2012 and continuing into 2013, consumption is forecast to increase as the falling inflation rate bolsters real wages, despite continued low nominal wage growth. The initial boost to consumption is likely to come from the London Olympics with more positive growth prospects for 2013 playing a role.
Corporate surplus does not translate into investment growth
Despite the corporate surplus, it appears increasingly unlikely that business investment will be a strong supporter of growth in 2012. Businesses remain cautious given weak and uncertain domestic and external demand, and credit constraints may also be playing a role, especially for smaller businesses, in delaying investment decisions. This is despite the low interest rates (secured by the quantitative easing programme) and the credit easing measures announced by the government. Furthermore, it is not clear which types of companies are guarding their surplus or whether they would invest in the UK in any case.
As household demand increases towards the end of the year, investment is likely to remain weak before picking up in 2013. Continuing low interest rates and improved demand prospects in 2013 should support this growth.
Volatile net exports
Net exports contributed positively to overall growth in 2011, albeit to a lesser extent than expected in the autumn 2011 forecast. The uncertainties in the euro area and on-going restricted credit availability appear to have reduced the stimulus to exports provided by the low value of the pound and the on-going quantitative easing programme. However, a positive factor to emphasise is that, despite the turmoil in the euro area, UK exports there have remained quite robust and goods exports to non-EU countries increased by more than 50% since 2007, albeit from low levels. Additionally, the effects of the depreciation of the pound may continue to feed through for some years, as exporters may have tended to bolster their profit margins before fighting for market share.
Thus, with government expenditure falling, sluggish consumption and business investment
remaining subdued, the main driver of growth in 2012 is likely to be net exports, whose contribution is set to increase in 2013. Sterling's sustained weakness, despite recent small increases, should help protect exporters' price competitiveness.
Employment prospects poor in short term
While having remained quite steady since 2009 despite public sector job cuts and weak growth, unemployment finally rose in the second half of 2011 after public sector employment fell by more than 4% in 2011 as a whole and an apparent revision of firms' labour hoarding decisions. Figures from the final quarter of 2011 showed that the unemployment rate had increased to 8.4%, the highest rate since 1995. Despite private sector employment growth exceeding public sector job losses by some 8,000 in the three months to December 2011, the forward looking indicators imply that private sector employment remains sluggish. The unemployment rate is therefore likely to increase slightly in 2012, to peak at 8.5% before edging back to 8.4% in 2013.
Inflation on a downward slope
After reaching a high of 5.2% in September 2011, the annual inflation rate fell continuously to 3.4% in February 2012. This was due to a number of factors including the VAT hike to 20% in January 2011 falling out of the calculations, falling energy prices and weak nominal wage growth. Inflation expectations have also fallen back significantly. Despite the uptick in inflation to 3.5% in March, the forecast is for inflation to fall almost continuously throughout the next two years to an average of 2.9% in 2012 and 2.0% in 2013. The main risk to this forecast stems from increasing oil prices, which could reduce the rate of decline in inflation, but are unlikely to reverse it.
Fiscal consolidation continues
The UK government is proceeding with its fiscal consolidation plan and has delivered the tax rises and spending reductions planned to date. The government introduced some small changes in its 2011 Autumn Statement, published in November in order to adhere to the two national targets on deficit and debt ratios. This changed neither the pace nor the size of the existing consolidation plans, but altered their timing and composition. The government also extended the planned length of the consolidation effort, as a downward revision

European Economic Forecast, Spring 2012
Table II.27.1:Main features of country forecast - THE UNITED KINGDOM
2010 Annual percentage changebn GBP Curr. prices % GDP 92-07 2008 2009 2010 2011 2012 2013
GDP 1463.7 100.0 3.0 -1.1 -4.4 2.1 0.7 0.5 1.7 Private consumption 942.0 64.4 3.3 -1.5 -3.5 1.2 -1.2 0.3 1.0 Public consumption 337.4 23.0 1.9 1.6 -0.1 1.5 0.1 0.3 -1.1 Gross fixed capital formation 218.2 14.9 4.1 -4.8 -13.4 3.1 -1.2 -0.6 3.2 of which : equipment 69.4 4.7 4.6 -5.1 -16.6 7.5 -1.9 0.0 5.0 Exports (goods and services) 440.9 30.1 5.6 1.3 -9.5 7.4 4.6 3.1 4.7 Imports (goods and services) 477.6 32.6 6.4 -1.2 -12.2 8.6 1.2 1.3 1.8 GNI (GDP deflator) 1472.3 100.6 3.2 -0.3 -5.1 1.1 1.5 0.0 1.2 Contribution to GDP growth : Domestic demand 3.2 -1.4 -4.5 1.6 -0.9 0.2 0.9
Inventories 0.1 -0.4 -1.0 1.3 0.1 -0.3 0.0Net exports -0.3 0.7 1.1 -0.5 1.0 0.5 0.9
Employment 0.7 0.7 -1.6 0.2 0.4 0.4 0.5 Unemployment rate (a) 6.6 5.6 7.6 7.8 8.0 8.5 8.4 Compensation of employees/head 4.3 1.7 2.7 3.6 1.9 2.4 2.6 Unit labour costs whole economy 2.0 3.6 5.7 1.7 1.6 2.3 1.3 Real unit labour costs -0.4 0.5 4.0 -1.2 -0.7 -0.4 -0.9 Saving rate of households (b) 6.7 3.1 7.8 7.2 7.4 7.4 7.3 GDP deflator 2.4 3.1 1.7 2.9 2.3 2.7 2.3 Harmonised index of consumer prices 2.0 3.6 2.2 3.3 4.5 2.9 2.0 Terms of trade of goods 0.0 -0.6 0.1 -0.1 -0.6 1.0 0.1 Merchandise trade balance (c) -3.4 -6.6 -5.9 -6.7 -6.6 -5.9 -5.0 Current-account balance (c) -1.8 -1.4 -1.5 -3.3 -1.9 -1.7 -1.0 Net lending(+) or borrowing(-) vis-à-vis ROW (c) -1.7 -1.2 -1.2 -3.1 -1.7 -1.5 -0.8 General government balance (c) -2.8 -5.0 -11.5 -10.2 -8.3 -6.7 -6.5 Cyclically-adjusted budget balance (c) -3.1 -5.4 -9.6 -8.9 -6.9 -5.1 -5.1 Structural budget balance (c) - -4.9 -9.4 -8.8 -6.9 -6.9 -5.1 General government gross debt (c) 43.7 54.8 69.6 79.6 85.7 91.2 94.6
(a) Eurostat definition. (b) gross saving divided by gross disposable income. (c) as a percentage of GDP.
116
in potential output projections has increased the estimated total structural consolidation effort required. The 2012 Budget, from March, was also fiscally neutral.
In the Autumn Statement, the main measures set out by the government were an increase in the Bank Levy rate from 0.078% to 0.088%, a public sector pay cap after the current pay freeze expires in 2013, a new 'youth contract' to encourage the hiring of young people and a new infrastructure fund worth GBP 6.3 billion. The Budget focused on simplifying the tax system and attracting business investment. The measures included a reduction in the top rate of tax to 45%, a rise in the personal income tax allowance to GBP 9,205, a new 7% Stamp Duty Land Tax on purchasing houses worth more than GBP 2 million, a further reduction in the corporation tax rate to 24% with an offsetting increase in the Bank Levy to 0.105%, increased tax allowances and R&D credits for certain industries. In addition, more funding was set aside for infrastructure investment and national loan scheme to improve credit conditions.
The most recent fiscal data available from March show that the initial undershoot of borrowing in 2011-12 has been reversed, with departments increasing spending in order to exhaust their budgets before the end of the financial year (FY)
on 31 March 2012. The revenue intake also slowed, so overall borrowing is likely to be as originally forecast. The deficit for FY 2011-12 was 8.4% and this is forecast to fall to 6.1% in FY 2012-13. It should be noted, however, that this large decline is mainly due to a one-off measure (1.8 pps.) in which the Royal Mail pension fund, together with its long-term liabilities, is taken over by the government. The structural balance continues to improve, with the deficit falling from 9.6% in 2009-10 to 6.9% in 2011-12. It is forecast to fall further to 5.3% in 2013-14 with the average fiscal effort is estimated at 1.1% since 2009-10.
Gross debt for FY 2011-12 is estimated at 86.8% of GDP after being revised up by Eurostat's amendment on the treatment of financial sector interventions. This is forecast to continue to increase every year until the end of the forecast period, currently FY 2013-14, when it is estimated to be 94.7% of GDP.
Table II.27.1:General government projections on a financial year basis
2009-10 2010-11 2011-12 2012-13 2013-14
General government balance -11.6 -9.5 -8.4 -6.1 -6.5Structural budget balance -9.6 -8.2 -6.9 -6.4 -5.3General government gross debt 72.6 80.3 86.8 91.8 94.7
Actual Forecast

Acceding Countries

28. CROATIA Remaining in recession
118
GDP stagnation in 2011
Real GDP stagnated in 2011 (-0.0%) following two years of declining output. Economic activity started to recover in the second and third quarter of the year, but relapsed into contraction in the final quarter. Final domestic demand continued to contract in the year as a whole, particularly due to a further drop in investment activity. Private consumption was slightly positive, but this was partly offset by reduced public consumption. The level of real GDP was propped up by inventory accumulation, which contributed more than one percentage point to growth. Net exports added slightly to GDP growth, as exports of goods and services expanded faster than imports. Overall, it is fair to say that in 2011, the Croatian economy essentially remained in the recession which had started in 2008.
Reflecting the continuation of suppressed economic activity, employment declined further and underlying inflationary pressures remained low in 2011. The rise in headline inflation, to 2.2%, was mainly a consequence of higher commodity prices, particularly in the food segment. The current-account deficit remained relatively low at around 1% of GDP.
Monthly data suggest that the economy has weakened further in the first quarter of 2012. The downward trend of industrial production and construction activity steepened in January and February. Retail sales data were relatively strong, but they were likely to have been distorted by the prior announcement of a VAT rate hike. The foreign trade data show a significant decline of exports, suggesting that the weakness in some of Croatia's major export markets continues to depress the domestic economy.
Recovery postponed to 2013
The Croatian economy faces strong headwinds in 2012. Contracting economic activity in the euro area, particularly in major trading partners like Italy and Slovenia, is spilling over to Croatia. International competitiveness has proved insufficient to prevent a decline in export market shares in recent years. Weak labour market conditions continue to exert downward pressure on incomes and spending. The high level of
indebtedness of households and companies and their need to deleverage are weighing on domestic demand. Credit conditions are relatively unfavourable. Consumer and business confidence is suffering from the uncertainties originating in the international environment. There has also been little progress in lowering deep-seated structural obstacles to growth. In 2013 the more cyclical headwinds from the external side should lessen. At the same time, the economy should get a boost from infrastructure-related investment by state-owned companies and from investments related to EU accession.
-12
-9
-6
-3
0
3
6
9
05 06 07 08 09 10 11 12 13
pps.
Private consumption Net exportsPublic consumption InvestmentGDP growth (y-o-y%)
forecast
Graph II.28.1: Croatia - GDP growth and contributions
The need for fiscal consolidation restricts the room for government spending. In the present forecast, the projections for public consumption and investment are based on the 'no-policy-change' assumption, i.e. only fiscal measures already enacted or known in sufficient detail can be taken into account. Overall, public consumption will detract from GDP growth, while public investment will only contribute marginally.
Croatia's exports are likely to continue to underperform in the short term. Given suppressed export markets, export volumes are projected to contract in 2012 before returning to modest growth in 2013. In terms of contributions to GDP growth, net exports have provided an offset to faltering domestic demand since the beginning of the recession. This pattern is projected to continue in 2012. But in the following year, when domestic demand, particularly thanks to investment, is projected to increase, imports will accelerate and net exports will again subtract from GDP growth.
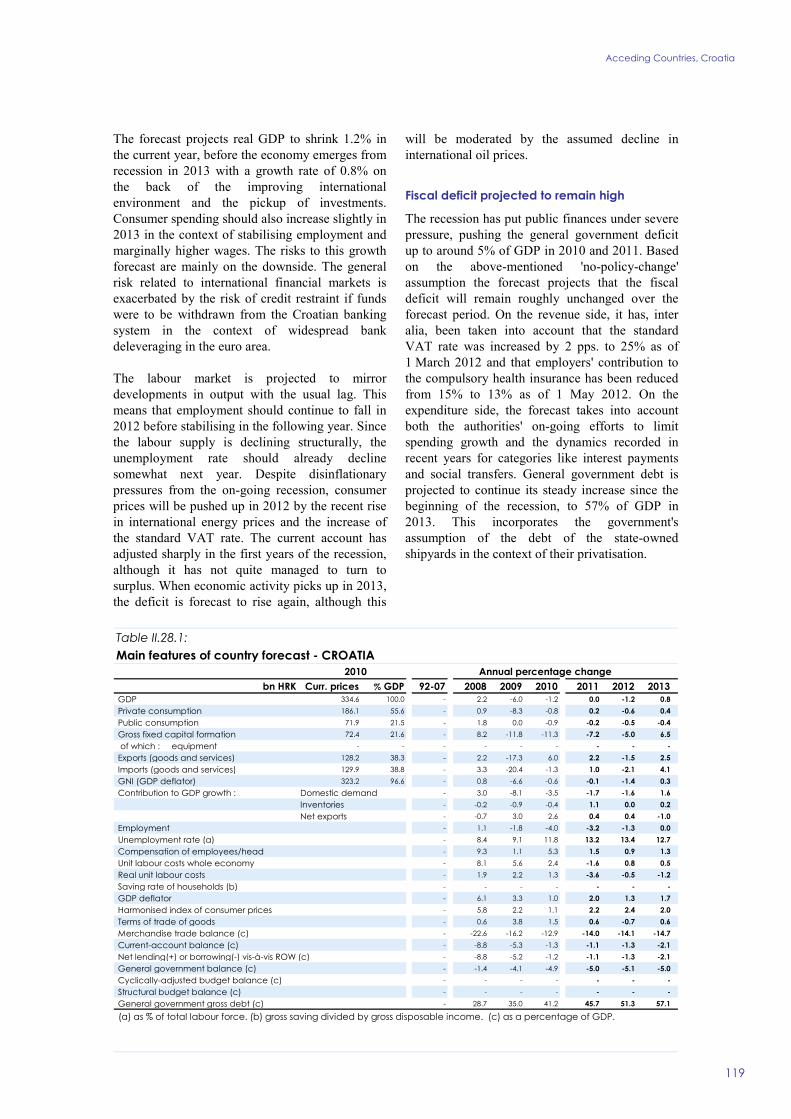
Acceding Countries, Croatia
Table II.28.1:Main features of country forecast - CROATIA
2010 Annual percentage changebn HRK Curr. prices % GDP 92-07 2008 2009 2010 2011 2012 2013
GDP 334.6 100.0 - 2.2 -6.0 -1.2 0.0 -1.2 0.8 Private consumption 186.1 55.6 - 0.9 -8.3 -0.8 0.2 -0.6 0.4 Public consumption 71.9 21.5 - 1.8 0.0 -0.9 -0.2 -0.5 -0.4 Gross fixed capital formation 72.4 21.6 - 8.2 -11.8 -11.3 -7.2 -5.0 6.5 of which : equipment - - - - - - - - - Exports (goods and services) 128.2 38.3 - 2.2 -17.3 6.0 2.2 -1.5 2.5 Imports (goods and services) 129.9 38.8 - 3.3 -20.4 -1.3 1.0 -2.1 4.1 GNI (GDP deflator) 323.2 96.6 - 0.8 -6.6 -0.6 -0.1 -1.4 0.3 Contribution to GDP growth : Domestic demand - 3.0 -8.1 -3.5 -1.7 -1.6 1.6
Inventories - -0.2 -0.9 -0.4 1.1 0.0 0.2Net exports - -0.7 3.0 2.6 0.4 0.4 -1.0
Employment - 1.1 -1.8 -4.0 -3.2 -1.3 0.0 Unemployment rate (a) - 8.4 9.1 11.8 13.2 13.4 12.7 Compensation of employees/head - 9.3 1.1 5.3 1.5 0.9 1.3 Unit labour costs whole economy - 8.1 5.6 2.4 -1.6 0.8 0.5 Real unit labour costs - 1.9 2.2 1.3 -3.6 -0.5 -1.2 Saving rate of households (b) - - - - - - - GDP deflator - 6.1 3.3 1.0 2.0 1.3 1.7 Harmonised index of consumer prices - 5.8 2.2 1.1 2.2 2.4 2.0 Terms of trade of goods - 0.6 3.8 1.5 0.6 -0.7 0.6 Merchandise trade balance (c) - -22.6 -16.2 -12.9 -14.0 -14.1 -14.7 Current-account balance (c) - -8.8 -5.3 -1.3 -1.1 -1.3 -2.1 Net lending(+) or borrowing(-) vis-à-vis ROW (c) - -8.8 -5.2 -1.2 -1.1 -1.3 -2.1 General government balance (c) - -1.4 -4.1 -4.9 -5.0 -5.1 -5.0 Cyclically-adjusted budget balance (c) - - - - - - - Structural budget balance (c) - - - - - - - General government gross debt (c) - 28.7 35.0 41.2 45.7 51.3 57.1
(a) as % of total labour force. (b) gross saving divided by gross disposable income. (c) as a percentage of GDP.
119
The forecast projects real GDP to shrink 1.2% in the current year, before the economy emerges from recession in 2013 with a growth rate of 0.8% on the back of the improving international environment and the pickup of investments. Consumer spending should also increase slightly in 2013 in the context of stabilising employment and marginally higher wages. The risks to this growth forecast are mainly on the downside. The general risk related to international financial markets is exacerbated by the risk of credit restraint if funds were to be withdrawn from the Croatian banking system in the context of widespread bank deleveraging in the euro area.
The labour market is projected to mirror developments in output with the usual lag. This means that employment should continue to fall in 2012 before stabilising in the following year. Since the labour supply is declining structurally, the unemployment rate should already decline somewhat next year. Despite disinflationary pressures from the on-going recession, consumer prices will be pushed up in 2012 by the recent rise in international energy prices and the increase of the standard VAT rate. The current account has adjusted sharply in the first years of the recession, although it has not quite managed to turn to surplus. When economic activity picks up in 2013, the deficit is forecast to rise again, although this
will be moderated by the assumed decline in international oil prices.
Fiscal deficit projected to remain high
The recession has put public finances under severe pressure, pushing the general government deficit up to around 5% of GDP in 2010 and 2011. Based on the above-mentioned 'no-policy-change' assumption the forecast projects that the fiscal deficit will remain roughly unchanged over the forecast period. On the revenue side, it has, inter alia, been taken into account that the standard VAT rate was increased by 2 pps. to 25% as of 1 March 2012 and that employers' contribution to the compulsory health insurance has been reduced from 15% to 13% as of 1 May 2012. On the expenditure side, the forecast takes into account both the authorities' on-going efforts to limit spending growth and the dynamics recorded in recent years for categories like interest payments and social transfers. General government debt is projected to continue its steady increase since the beginning of the recession, to 57% of GDP in 2013. This incorporates the government's assumption of the debt of the state-owned shipyards in the context of their privatisation.


Candidate Countries

29. THE FORMER YUGOSLAV REPUBLIC OF MACEDONIA Sustained capital inflows support economic growth
122
Marked growth deceleration during 2011
Economic activity appears to have decelerated markedly during 2011, in particular towards the end of the year, reflecting not only weakening external demand but also an election-related rise in public spending in the first half of the year. High-frequency data for the first months of 2012 point to continued weak growth. However, sustained capital inflows in the form of workers remittances, income from cross-border trade, foreign loans but also higher FDI inflows provide important support for economic activity.
The main sources of growth in 2011 were probably private consumption and exports, benefiting from the above-mentioned capital inflows and strong demand for some of the country's specialised products, such as steel products and car components. A significant share of strong investment growth seems to reflect inventory building. The forecast assumes that about one percentage point of the currently published growth of 3.0% in 2011 might be due to this "stock building" effect.
Overall, national accounts data for 2011 is still subject to a high degree of uncertainty. As a result of a significant data revision for 2010, current published year-on-year growth rates for 2011 might be revised substantially.
On the back of weakening domestic demand in the second half of 2011, the widening in the current-account deficit remained limited, with an increase in the trade deficit from 21.3% in 2010 to 23.0% in 2011 and a rise in the current-account deficit from 2.2% in 2010 to 2.8% in 2011. Capital inflows, in the form of current private transfers, remained on their high level of around 20% of GDP. Inflows of foreign direct investment were strong in the first and last quarter of 2011, resulting in an increase from 2.3% of GDP in 2010 to 4.2% in 2011. Foreign exchange reserves continued to improve towards the end of 2011, benefitting from higher inflows of current transfers and FDI.
Inflation picked up in 2011, from 1.6% in 2010 to 3.9% in 2011, mainly due to high inflation in the first half of the year. Since then, inflationary pressures have declined, coming down to 1.4% y-o-y in March 2012. The main drivers have been
strong rises in food and rental, but also energy prices.
The labour market benefitted from strong growth in the first half of 2011, which, despite a weak last quarter, resulted in an annual increase in employment of about 1% and a 1.8% decrease in the number of unemployed. This brought the unemployment rate down slightly, from 32% in 2010 to 31.4% in 2011. Youth unemployment appears to have increased significantly, in particular in the last quarter of 2011, reaching close to 50% of the age group's labour force.
The central government deficit remained at 2½% of GDP. However, significantly lower-than-planned revenues meant that the government did not reach its spending targets, in particular in the area of public investment. In September 2011, the government adopted a supplementary budget, mainly reallocating spending in order to meet the 2.5% deficit target. In response to a weak revenue performance in the first months of 2012, the authorities revised the 2012 budget, lowering revenue projections, which will be largely compensated for by reconsidering planned investment.
Sustained capital inflows will support the economy
The deceleration of external demand and declining real wage income could result in real GDP growth around 1¾% in 2012. Private consumption and investment are likely to be the main sources of growth, benefiting from stable private transfers and increased foreign direct investment. In 2012, export market growth is expected to decelerate to some 2½%. However, the completion of some export-oriented FDI projects, should allow market share gains in 2012 and 2013. This should help to bring growth to around 2½% in 2013. Inflation is expected to decelerate in 2012, following the expected slowdown in prices for energy and metals, but – on the back of stronger growth – to accelerate again in 2013.
Employment growth in 2012 will decelerate in line with the growth slowdown and will be constrained by the probably still-difficult international environment in 2012-13. Wage growth is likely to remain subdued, given the need to remain

Candidate Countries, The former Yugoslav Republic of Macedonia
Table II.29.1:Main features of country forecast - THE FORMER YUGOSLAV REPUBLIC OF MACEDONIA
2010 Annual percentage changebn MKD Curr. prices % GDP 92-07 2008 2009 2010 2011 2012 2013
GDP 434.1 100.0 1.0 5.0 -0.9 2.9 3.0 1.7 2.5 Private consumption 321.5 74.1 - 6.6 -4.7 1.3 3.7 2.0 3.0 Public consumption 83.0 19.1 - 10.6 0.5 -2.0 -5.5 -4.5 -4.0 Gross fixed capital formation 83.0 19.1 - 5.4 -4.3 -2.7 15.0 8.0 11.0 of which : equipment - - - -1.1 -17.1 -15.7 - - - Exports (goods and services) 202.2 46.6 - -6.3 -15.8 23.6 11.3 4.0 8.0 Imports (goods and services) 283.3 65.3 - 0.8 -14.3 9.5 12.1 2.6 7.9 GNI (GDP deflator) 421.9 97.2 - 8.7 -0.6 1.9 2.6 1.8 2.6 Contribution to GDP growth : Domestic demand - 7.9 -4.6 0.4 4.6 2.3 4.0
Inventories - 0.3 0.8 -0.6 1.0 -0.9 0.0Net exports - -3.9 2.9 3.4 -2.7 0.2 -1.5
Employment - 3.2 3.4 0.8 1.0 0.6 1.5 Unemployment rate (a) - 33.8 32.2 32.0 31.4 31.0 30.5 Compensation of employees/head - 12.9 6.2 6.0 2.4 3.6 5.0 Unit labour costs whole economy - 11.0 10.9 3.8 0.5 2.5 4.0 Real unit labour costs - 3.3 10.1 1.1 -0.1 -0.4 0.1 Saving rate of households (b) - - - - - - - GDP deflator 43.9 7.5 0.7 2.7 0.6 2.9 3.9 Harmonised index of consumer prices - 8.3 -0.8 1.6 3.9 2.0 2.5 Terms of trade of goods - -3.7 -4.6 -1.4 2.9 0.0 0.0 Merchandise trade balance (c) - -26.2 -23.3 -20.8 -23.0 -23.0 -23.4 Current-account balance (c) - -12.9 -6.8 -2.1 -2.8 -3.0 -3.7 Net lending(+) or borrowing(-) vis-à-vis ROW (c) - -13.1 -6.5 -1.9 0.1 2.4 2.3 General government balance (c) - -0.9 -2.7 -2.4 -2.6 -2.5 -2.5 Cyclically-adjusted budget balance (c) - - - - - - - Structural budget balance (c) - - - - - - - General government gross debt (c) - 20.7 23.8 25.8 29.0 34.0 38.0
(a) as % of total labour force. (b) gross saving divided by gross disposable income. (c) as a percentage of GDP.
123
competitive. Improving the country's labour income strongly depends on raising productivity by modernising and deepening the capital stock.
28
30
32
34
36
38
40
-5-4-3-2-101234567
07 08 09 10 11 12 13
y-o-y%
Graph II.29.1:The former Yugoslav Republic of Macedonia - Labour market
Unemployment rate (rhs) Employment growth
GDP growth
forecast
% of labour force
The trade deficit is likely to remain at about 23% of GDP in 2012 and might rise slightly in 2013. The surplus in private current transfers is expected to decline from its current exceptionally high level of nearly 20% of GDP towards its longer term average. This will contribute to a widening of the current-account deficit, from 2.8% of GDP in 2011 to 3% in 2012 and 3¾% in 2013.
Public finances are likely to remain under control
Based on the country's track record of containing public sector deficits, the forecast expects deficits to remain at 2½% of GDP during the forecast period. In case of spending constraints, the forecast assumes the authorities will reduce capital spending, as has happened in the past on similar occasions.
10
20
30
40
50
60
70
80
90
-5
-4
-3
-2
-1
0
1
2
3
07 08 09 10 11 12 13
% of GDP
Graph II.29.2:The former Yugoslav Republic of Macedonia - Public finances
General government debt (rhs) General government deficit
forecast
% of GDP
In order to realise intended public investment targets, the country will probably have to increase credit-financed public spending, which might lead to a marked increase in public sector debt.

30. ICELAND A recovery is taking hold
124
Economic recovery has taken hold in 2011 ...
The economy expanded by 3.1% in 2011, beating most expectations. GDP growth was mainly driven by private consumption, although private investments and exports also contributed to the recovery. At the same time, public consumption and investments continued to be a drag on growth. Strong domestic demand fuelled buoyant imports and the contribution of net exports to growth remained negative – though to a lesser extent than a year before – at around 1 percentage point.
More recent high-frequency indicators present a mixed picture. While industrial production stagnated in January, statistics on credit and payment card turnover and on retail trade suggest a continuation of relatively strong domestic demand through February. Consumer sentiment rose in February for the fourth months in a row, but dropped considerably in March. Tourism has reached new highs and the prospects are for another record year for the sector.
… but growth is likely to decelerate
The outlook for domestic demand in 2012 remains broadly unchanged compared with the autumn forecast. Private consumption growth is expected to decelerate, as the factors which temporarily supported household incomes (one-off debt relief measures, extraordinary mortgage interest allowances and temporary withdrawals of savings from voluntary pension schemes) start to fade away. On the other hand, pay increases related to wage settlements and the expected increase in employment would prop up disposable income and spending.
Public investments are constrained by the tight fiscal situation and are likely to stagnate before starting to recover at the end of the forecast period. Since total investments are at a historically low level as a share of GDP (13%), there is scope for a revival in investment activity. The forecast assumes that growing demand, especially in some capacity-constraint sectors, will be support relatively robust growth in investment activity. However, risks remain on the downside, as the corporate sector is still marred by high debt and the on-going restructuring of its balance sheets.
Graph II.30.1: Iceland - GDP growth and contributions
-25-20-15-10
-505
1015
06 07 08 09 10 11 12 13
pps.
InventoriesNet exportsDom. demand, excl. invent.GDP (y-o-y%)
forecast
Merchandise exports hinge on the performance of two key sectors (fishing and aluminium) where production limitations and subdued foreign demand would curb growth. Services are expected to continue growing strongly driven by the flourishing tourism industry.
Overall, the forecast projects domestic demand to remain the main driver of growth and foresees a continuation of the recovery with a slight moderation in growth.
Some gains in employment ahead
The growth seen in 2011 was jobless. Unemployment fell mainly due to exits from the labour force, rather than the creation of new jobs. Further increases in economic activity are also likely to lead to some gains in employment. However, the labour market is expected to remain weak, with unemployment remaining high above the usual Icelandic standards.
A tale of inflation worries …
Rising oil, house and food prices, as well as stronger wage pressures, have led annual inflation to accelerate to 5.3% at end-2011. Price pressures continued in early 2012 and inflation rose to 6.4% in March. Inflation expectations have increased as well, with annual inflation not set to fall below the Central Bank's inflation target (2.5%) within the forecast horizon.
... and exchange rate troubles
The exchange rate of the króna vis-à-vis the euro came under pressure during the first quarter of 2012, when it depreciated by around 6.6%. There is a strong pass-through from the exchange rate to

Candidate Countries, Iceland
Table II.30.1:Main features of country forecast - ICELAND
2010 Annual percentage changebn ISK Curr. prices % GDP 92-07 2008 2009 2010 2011 2012 2013
GDP 1534.2 100.0 3.6 1.3 -6.8 -4.0 3.1 2.1 2.4 Private consumption 787.4 51.3 3.8 -7.9 -14.9 -0.4 4.0 2.3 2.1 Public consumption 398.6 26.0 3.0 4.6 -1.7 -3.4 -0.6 -0.3 0.0 Gross fixed capital formation 197.4 12.9 6.4 -20.0 -51.6 -8.1 13.4 10.8 10.1 of which : equipment - - - - - - - - - Exports (goods and services) 861.3 56.1 4.8 7.0 6.6 0.4 3.2 2.2 2.6 Imports (goods and services) 707.0 46.1 6.2 -18.4 -24.0 4.0 6.4 3.7 3.5 GNI (GDP deflator) 1265.8 82.5 3.5 -16.4 -4.4 -1.6 6.5 4.7 4.5 Contribution to GDP growth : Domestic demand 4.5 -9.1 -21.0 -2.2 3.6 2.6 2.6
Inventories 0.0 -0.3 -0.1 -0.2 0.6 0.0 0.0Net exports -0.8 10.8 14.2 -1.5 -1.1 -0.5 -0.2
Employment 1.6 0.8 -6.0 -0.3 0.0 0.5 0.5 Unemployment rate (a) 3.4 3.0 7.2 7.6 7.1 6.4 6.0 Compensation of employees/head 6.5 4.4 -2.2 4.2 7.7 7.3 6.1 Unit labour costs whole economy 4.5 3.9 -1.4 8.3 4.5 5.6 4.2 Real unit labour costs 0.6 -7.1 -9.0 1.3 1.4 0.8 0.5 Saving rate of households (b) - - - - - - - GDP deflator 3.9 11.8 8.3 6.9 3.1 4.8 3.7 General index of consumer prices 3.6 12.4 12.0 5.4 4.0 5.1 3.9 Terms of trade of goods -0.2 -6.3 -12.1 8.5 -3.0 -0.3 -0.1 Merchandise trade balance (c) -2.3 -0.4 6.0 7.8 5.9 5.4 5.0 Current-account balance (c) -6.2 -24.5 -11.7 -8.0 -7.1 -5.6 -4.4 Net lending(+) or borrowing(-) vis-à-vis ROW (c) -6.3 -24.6 -11.8 -8.0 -7.1 -5.7 -4.4 General government balance (c) - -13.5 -10.0 -10.1 -4.4 -2.8 -2.0 Cyclically-adjusted budget balance (c) - - - - - - - Structural budget balance (c) - - - - - - - General government gross debt (c) - 70.3 87.9 93.1 98.8 91.7 88.3
(a) as % of total labour force. (b) gross saving divided by gross disposable income. (c) as a percentage of GDP.
125
inflation and, looking ahead, exchange rate volatility remains a major source of risk for the inflation profile.
Trade surpluses slowly eroding
In 2011, the surplus in trade in goods and services fell to 8.2% of GDP, from 10.1% in 2010. This resulted mainly from a drop in the merchandise trade surplus. The forecast projects this trend to continue, albeit at a slower pace. A large part of the net income balance is accounted for by banks in winding up proceedings. The forecast assumes that related accrued interest on the debt of those banks will gradually be reduced and, therefore, the headline current-account deficit will decline. However, the underlying current account, excluding banks in winding-up proceedings, is likely to remain broadly unchanged, hovering around a zero balance.
Public finance consolidation has slowed …
The process of fiscal consolidation that started in 2009, continued through 2011, albeit amid some relaxation in fiscal discipline compared to initial plans. New government's commitments in the context of the May 2011 collective wage agreements compromised some of the initially envisaged savings on the expenditure side. The general government balance recorded a deficit of 4.4% of GDP in 2011 – significantly lower than
the deficit of 10.1% a year before, but about one percentage point higher than initially planned.
… further fiscal slippages cannot be excluded
The 2012 budget targets a 1.4% of GDP deficit (and a balanced budget by 2013), based on a set of new consolidation measures aimed at raising revenue and slashing predominantly current expenditure. However, with the higher-than-planned 2011 outcome and the fact that the proposed consolidation path increasingly relies on temporary non-tax measures and other unspecified or unlegislated measures, the forecast projects that the deficit will reach 2.8% of GDP in 2012 and 2.0% in 2013. In addition, the risks to this scenario are on the downside, as a number of contingent liabilities could materialise and lead to increased government spending. The envisaged consolidation path, coupled with the prepayments of foreign debt in March 2012, would nevertheless be sufficient to put the general government debt-to-GDP ratio on a declining trajectory, bringing it below 90% in 2013.
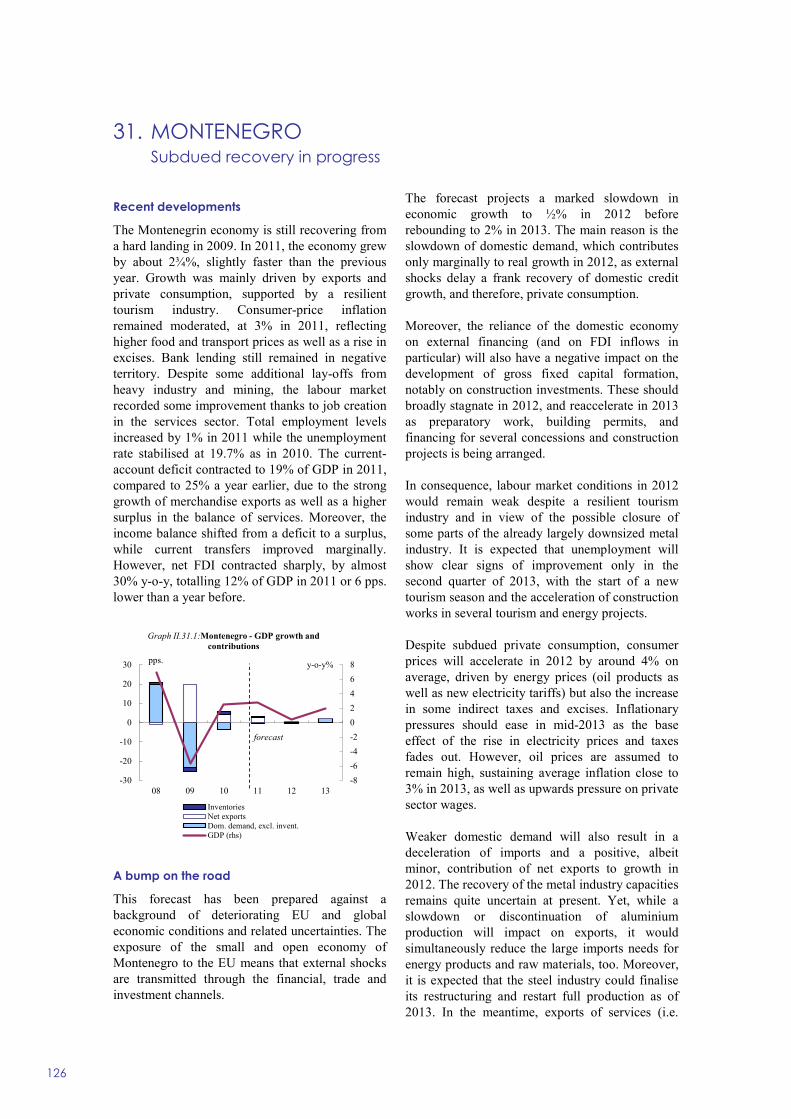
31. MONTENEGRO Subdued recovery in progress
126
Recent developments
The Montenegrin economy is still recovering from a hard landing in 2009. In 2011, the economy grew by about 2¾%, slightly faster than the previous year. Growth was mainly driven by exports and private consumption, supported by a resilient tourism industry. Consumer-price inflation remained moderated, at 3% in 2011, reflecting higher food and transport prices as well as a rise in excises. Bank lending still remained in negative territory. Despite some additional lay-offs from heavy industry and mining, the labour market recorded some improvement thanks to job creation in the services sector. Total employment levels increased by 1% in 2011 while the unemployment rate stabilised at 19.7% as in 2010. The current-account deficit contracted to 19% of GDP in 2011, compared to 25% a year earlier, due to the strong growth of merchandise exports as well as a higher surplus in the balance of services. Moreover, the income balance shifted from a deficit to a surplus, while current transfers improved marginally. However, net FDI contracted sharply, by almost 30% y-o-y, totalling 12% of GDP in 2011 or 6 pps. lower than a year before.
-8-6-4-202468
-30
-20
-10
0
10
20
30
08 09 10 11 12 13
pps.
Graph II.31.1:Montenegro - GDP growth and contributions
InventoriesNet exportsDom. demand, excl. invent.GDP (rhs)
forecast
y-o-y%
A bump on the road
This forecast has been prepared against a background of deteriorating EU and global economic conditions and related uncertainties. The exposure of the small and open economy of Montenegro to the EU means that external shocks are transmitted through the financial, trade and investment channels.
The forecast projects a marked slowdown in economic growth to ½% in 2012 before rebounding to 2% in 2013. The main reason is the slowdown of domestic demand, which contributes only marginally to real growth in 2012, as external shocks delay a frank recovery of domestic credit growth, and therefore, private consumption.
Moreover, the reliance of the domestic economy on external financing (and on FDI inflows in particular) will also have a negative impact on the development of gross fixed capital formation, notably on construction investments. These should broadly stagnate in 2012, and reaccelerate in 2013 as preparatory work, building permits, and financing for several concessions and construction projects is being arranged.
In consequence, labour market conditions in 2012 would remain weak despite a resilient tourism industry and in view of the possible closure of some parts of the already largely downsized metal industry. It is expected that unemployment will show clear signs of improvement only in the second quarter of 2013, with the start of a new tourism season and the acceleration of construction works in several tourism and energy projects.
Despite subdued private consumption, consumer prices will accelerate in 2012 by around 4% on average, driven by energy prices (oil products as well as new electricity tariffs) but also the increase in some indirect taxes and excises. Inflationary pressures should ease in mid-2013 as the base effect of the rise in electricity prices and taxes fades out. However, oil prices are assumed to remain high, sustaining average inflation close to 3% in 2013, as well as upwards pressure on private sector wages.
Weaker domestic demand will also result in a deceleration of imports and a positive, albeit minor, contribution of net exports to growth in 2012. The recovery of the metal industry capacities remains quite uncertain at present. Yet, while a slowdown or discontinuation of aluminium production will impact on exports, it would simultaneously reduce the large imports needs for energy products and raw materials, too. Moreover, it is expected that the steel industry could finalise its restructuring and restart full production as of 2013. In the meantime, exports of services (i.e.

Candidate Countries, Montenegro
Table II.31.1:Main features of country forecast - MONTENEGRO
2010 Annual percentage changemio EUR Curr. prices % GDP 92-07 2008 2009 2010 2011 2012 2013
GDP 3103.9 100.0 - 6.9 -5.7 2.5 2.8 0.4 2.0 Private consumption 2550.7 82.2 - - - - 2.6 0.6 1.6 Public consumption 727.2 23.4 - - - - -4.0 -2.0 1.0 Gross fixed capital formation 655.1 21.1 - - - - -6.5 0.2 1.7 of which : equipment - - - - - - - - - Exports (goods and services) 1077.4 34.7 - - - - 13.7 1.9 3.3 Imports (goods and services) 1958.9 63.1 - - - - 3.8 0.3 1.8 GNI (GDP deflator) 3106.8 100.1 - - - - 2.7 0.4 2.1 Contribution to GDP growth : Domestic demand - 19.6 -23.2 -3.4 -0.2 0.0 1.9
Inventories - 1.5 -2.1 1.4 0.3 -0.2 0.0Net exports - -14.1 19.6 4.5 2.7 0.5 0.1
Employment - 4.5 -3.8 -1.9 0.8 0.2 1.5 Unemployment rate (a) - 16.8 19.1 19.7 19.7 20.0 19.3 Compensation of employees/head - 17.9 -2.9 12.7 1.7 0.6 2.1 Unit labour costs whole economy - 15.3 -1.0 7.9 -0.3 0.4 1.6 Real unit labour costs - 7.0 -3.3 6.1 -3.3 -3.6 -1.5 Saving rate of households (b) - - - - - - - GDP deflator - 7.7 2.4 1.6 3.1 4.1 3.1 General index of consumer prices - 8.5 3.4 0.5 3.1 3.9 2.7 Terms of trade of goods - - - - - - - Merchandise trade balance (c) - -67.5 -46.2 -42.8 -40.2 -40.1 -39.0 Current-account balance (c) - -50.6 -29.6 -24.6 -19.4 -20.5 -20.2 Net lending(+) or borrowing(-) vis-à-vis ROW (c) - - - - - - - General government balance (c) - - -5.7 -4.9 -3.9 -2.6 -1.8 Cyclically-adjusted budget balance (c) - - - - - - - Structural budget balance (c) - - - - - - - General government gross debt (c) - 29.0 38.2 40.9 45.1 50.1 49.7
(a) as % of total labour force. (b) gross saving divided by gross disposable income. (c) as a percentage of GDP.
127
tourism and transport) are projected to maintain in 2012-13 lower growth levels than in 2011. Overall, the current-account deficit would remain broadly at present levels (around 20% of GDP), as the slowdown of exports is roughly balanced by a deceleration of imports.
At the current juncture, the most immediate threat appears to be the still weak capacity of the economy (public and private sectors alike) to refinance debt. Additionally, a cut-back in capital inflows would delay the restructuring of the economy, and some infrastructure projects, but also weaken fiscal performance given the reliance of indirect tax revenue on imports.
Rethinking domestic finances
Consolidation efforts reduced general government expenditure to 43% of GDP in 2011, compared to 47% a year earlier. However, the weak performance of revenues resulted in a consolidated budget deficit of around 4% of GDP in 2011, compared to 5% a year before. Public debt increased to 45% of GDP in 2011, although it remains primarily on concessional terms, with average interest rates and maturity at about 3.9% and 6.7 years, respectively.
In response to the worsening of the macroeconomic environment, the government revised the 2012 budget with additional revenue and expenditure measures adding up to one percentage point of GDP above the original measures. The rebalancing of the fiscal framework aims to deepen fiscal consolidation, move towards fiscal surpluses and reverse debt dynamics. However, there is still a high level of uncertainty concerning the future of the metal sector and its implications on domestic finances. Considering the activation of the aluminium plant's state guarantees in early 2012, the accumulation of tax arrears and the rising costs of debt financing, the present forecast projects the general government balance to reach some -1.8% of GDP in 2012 and 1.1% in 2013, compared to a deficit of 1% and a surplus of 0.5%, respectively, in the government original plans. As a result, the level of public debt would reach 46% of GDP in 2012, falling by 2½ pps. in 2013.

32. SERBIA Growth and fiscal challenges
128
The export-led recovery has lost momentum…
The Serbian economy recovered further in 2011 from the crisis, with real GDP growth reaching 1.6%, up from 1.0% in 2010. However, output growth started to decelerate in mid-2011, as the export-driven recovery began to lose momentum. Real GDP growth slowed to 0.7% y-o-y in the third quarter and to 0.4% y-o-y in the fourth quarter. The contribution of net exports to growth turned negative in the fourth quarter, as export growth decelerated sharply to 1.2% due to more subdued external demand, while imports grew by 16.8%. Import growth was partly the result of stronger private investment, primarily in the construction sector, which was the main driver of growth in the second half of 2011, while private and public consumption continued to decline. Exports, as well as retail trade and industrial production deteriorated further in the first two months of 2012.
... and growth is set to slow sharply in 2012
The forecast projects a significant deceleration in growth to 0.3% in 2012, due to a deterioration in external demand from Serbia's main trading partners. As a result of a marked deceleration in export growth, net exports will contribute only marginally to GDP growth in 2012. The trade deficit would nevertheless mildly narrow, as import growth gradually moderates in tandem with a slower growth of domestic demand. The slight widening in the current-account deficit mainly results from lower transfers from abroad, including remittances, and higher debt service payments.
Domestic demand will remain subdued. As in 2011, private consumption will continue to register a negative growth rate, as real disposable incomes remain constrained by low real wage growth and a further reduction in employment. The scope for public consumption is limited by fiscal constraints. Growth will thus continue to be mainly driven by private investment. However, its pace will decelerate significantly as a result of a more moderate activity in the construction sector after strong growth in the previous year and more broadly as a result of lower capital inflows (including FDI), some worsening in financial conditions of firms and a deterioration in overall business sentiment. Real GDP growth would
accelerate in 2013 to 1.9%, mainly driven by stronger domestic demand, including a pick-up in private investments and a very moderate strengthening in private consumption since prospects for increasing disposable income will only gradually improve.
10
12
14
16
18
20
22
24
-10-8-6-4-202468
07 08 09 10 11 12 13
y-o-y%
Graph II.32.1:Serbia - Labour market
Unemployment rate (rhs) Employment growth
GDP growth
forecast% of labour force
Employment will subsequently continue to fall in 2012, but more moderately than in previous years. Adjustments in the employment level will come to an end in 2013, when the number of employed will slightly increase for the first time in five years. The unemployment rate in 2012 is set to slightly increase, before it falls marginally in 2013, remaining a key concern for the Serbian economy.
While inflation is on a declining path ...
After annual CPI inflation peaked at close to 15% in April 2011, a process of continued disinflation started, supported by an easing in commodity and food prices, subdued private consumption and the limited impact of hikes in administered prices. This brought annual inflation down to 7.0% in December and further to 4.9% in February, within the Central Bank's target range. The disinflation process is projected to continue over 2012-13, underpinned by subdued domestic demand and cautious monetary and exchange rate policies. Average inflation is expected to come down to around 5.0% in 2012, within the Central Banks' target range (2.5-5.5%), and to further decline in 2013.

Candidate Countries, Serbia
Table II.32.1:Main features of country forecast - SERBIA
2010 Annual percentage changebio RSD Curr. prices % GDP 92-07 2008 2009 2010 2011 2012 2013
GDP 2881.9 100.0 - 3.8 -3.5 1.0 1.6 0.3 1.9 Private consumption 2245.9 77.9 - - - - -0.5 -0.2 0.7 Public consumption 591.7 20.5 - - - - -0.9 -0.3 0.3 Gross fixed capital formation 535.6 18.6 - - - - 9.3 2.3 4.3 of which : equipment - - - - - - - - - Exports (goods and services) 1037.7 36.0 - - - - 7.1 3.3 7.5 Imports (goods and services) - - - - - - - - - GNI (GDP deflator) 3115.9 108.1 - 3.1 -2.5 11.3 -0.2 -0.5 1.9 Contribution to GDP growth : Domestic demand - - - - 1.2 0.2 1.5
Inventories - - - - 0.0 0.0 0.0Net exports - - - - 0.4 0.1 0.5
Employment - 6.3 -7.3 -8.4 -6.6 -1.9 0.3 Unemployment rate (a) - 13.6 16.1 19.2 23.1 23.4 22.4 Compensation of employees/head - - - - - - - Unit labour costs whole economy - - - - - - - Real unit labour costs - - - - - - - Saving rate of households (b) - - - - - - - GDP deflator - 12.6 5.9 4.9 9.0 4.9 4.6 General index of consumer prices - 12.4 8.1 6.1 11.2 5.0 4.8 Terms of trade of goods - - - - -1.8 0.0 0.0 Merchandise trade balance (c) - - - - -17.9 -17.4 -16.7 Current-account balance (c) - -21.6 -7.2 -7.4 -10.4 -10.8 -10.0 Net lending(+) or borrowing(-) vis-à-vis ROW (c) - - - - - - - General government balance (c) - - - - -5.0 -5.3 -4.8 Cyclically-adjusted budget balance (c) - - - - - - - Structural budget balance (c) - - - - - - - General government gross debt (c) - - - - 47.4 50.4 52.1
(a) as % of total labour force. (b) gross saving divided by gross disposable income. (c) as a percentage of GDP.
129
... fiscal challenges are persistent and increasing
20
25
30
35
40
45
50
55
60
-7-6-5-4-3-2-10123
07 08 09 10 11 12 13
% of GDP
Graph II.32.2:Serbia - Public finances
General government debt (rhs)General government balance
forecast% of GDP
Public finances are under severe pressure. The budget performance in 2011 was marked by a slowdown in revenue growth which accelerated in the fourth quarter and a tense situation on the expenditure side, as a result of the unfreezing of public sector wages and an increase in transfers and subsidies to alleviate poor economic and social conditions. In spite of the spending cuts implemented by the authorities in the last quarter of 2011 (which contained the increase in total spending at 0.4%), the general government deficit is likely to reach 5% of GDP. The 2012 budget
adopted in December sets a deficit target of 4.3% of GDP, but deviates on some outlays from the initial agreement with the IMF. On 29 March, faced with a rising budget deficit, primarily due to substantially lower than expected revenues in February, the Serbian government adopted consolidation measures amounting to RSD 15.7 billion. However, further consolidation measures are needed to limit increases in the deficit and public debt and to comply with the fiscal responsibility legislation adopted in 2010. The fiscal projections do not anticipate the measures that will be included in the revision of the 2012 budget expected after the general elections of 6 May. Under a no-policy-change assumption, the fiscal deficit could reach 5.3% in 2012 before being reduced to 4.8% in 2013.
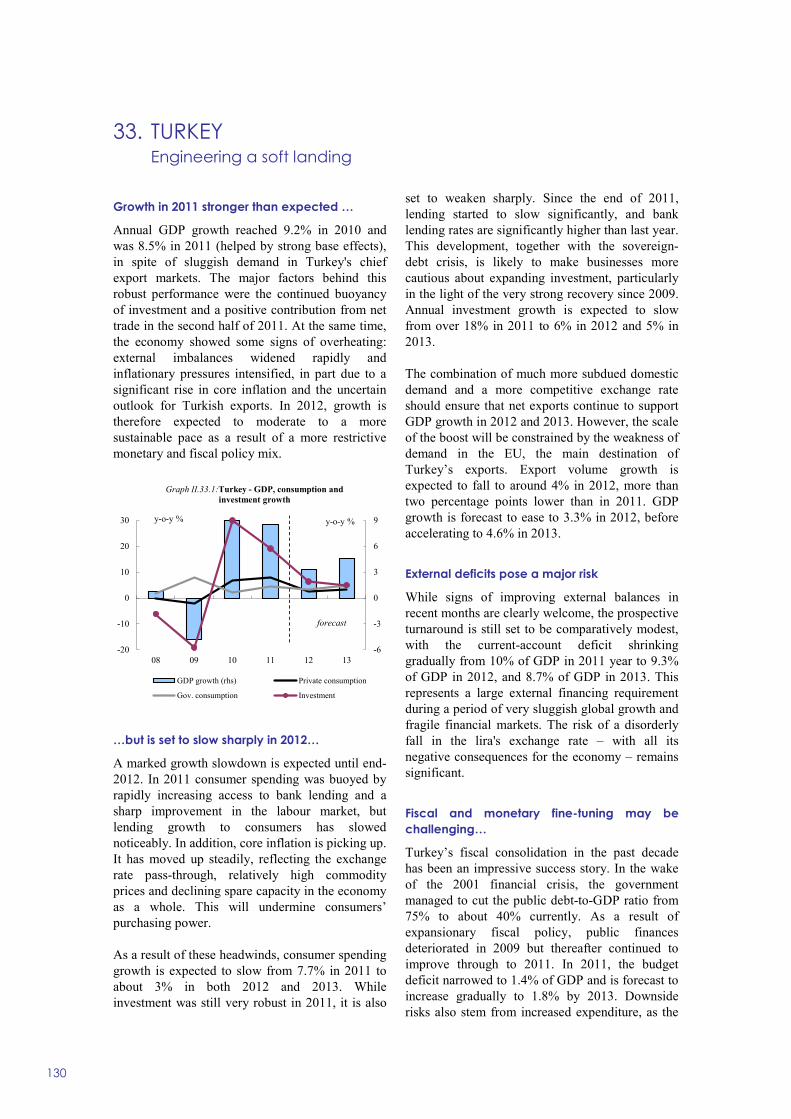
33. TURKEY Engineering a soft landing
130
Growth in 2011 stronger than expected …
Annual GDP growth reached 9.2% in 2010 and was 8.5% in 2011 (helped by strong base effects), in spite of sluggish demand in Turkey's chief export markets. The major factors behind this robust performance were the continued buoyancy of investment and a positive contribution from net trade in the second half of 2011. At the same time, the economy showed some signs of overheating: external imbalances widened rapidly and inflationary pressures intensified, in part due to a significant rise in core inflation and the uncertain outlook for Turkish exports. In 2012, growth is therefore expected to moderate to a more sustainable pace as a result of a more restrictive monetary and fiscal policy mix.
-6
-3
0
3
6
9
-20
-10
0
10
20
30
08 09 10 11 12 13
y-o-y %y-o-y %
Graph II.33.1:Turkey - GDP, consumption and investment growth
GDP growth (rhs) Private consumption
Gov. consumption Investment
forecast
…but is set to slow sharply in 2012…
A marked growth slowdown is expected until end-2012. In 2011 consumer spending was buoyed by rapidly increasing access to bank lending and a sharp improvement in the labour market, but lending growth to consumers has slowed noticeably. In addition, core inflation is picking up. It has moved up steadily, reflecting the exchange rate pass-through, relatively high commodity prices and declining spare capacity in the economy as a whole. This will undermine consumers’ purchasing power.
As a result of these headwinds, consumer spending growth is expected to slow from 7.7% in 2011 to about 3% in both 2012 and 2013. While investment was still very robust in 2011, it is also
set to weaken sharply. Since the end of 2011, lending started to slow significantly, and bank lending rates are significantly higher than last year. This development, together with the sovereign-debt crisis, is likely to make businesses more cautious about expanding investment, particularly in the light of the very strong recovery since 2009. Annual investment growth is expected to slow from over 18% in 2011 to 6% in 2012 and 5% in 2013.
The combination of much more subdued domestic demand and a more competitive exchange rate should ensure that net exports continue to support GDP growth in 2012 and 2013. However, the scale of the boost will be constrained by the weakness of demand in the EU, the main destination of Turkey’s exports. Export volume growth is expected to fall to around 4% in 2012, more than two percentage points lower than in 2011. GDP growth is forecast to ease to 3.3% in 2012, before accelerating to 4.6% in 2013.
External deficits pose a major risk
While signs of improving external balances in recent months are clearly welcome, the prospective turnaround is still set to be comparatively modest, with the current-account deficit shrinking gradually from 10% of GDP in 2011 year to 9.3% of GDP in 2012, and 8.7% of GDP in 2013. This represents a large external financing requirement during a period of very sluggish global growth and fragile financial markets. The risk of a disorderly fall in the lira's exchange rate – with all its negative consequences for the economy – remains significant.
Fiscal and monetary fine-tuning may be challenging…
Turkey’s fiscal consolidation in the past decade has been an impressive success story. In the wake of the 2001 financial crisis, the government managed to cut the public debt-to-GDP ratio from 75% to about 40% currently. As a result of expansionary fiscal policy, public finances deteriorated in 2009 but thereafter continued to improve through to 2011. In 2011, the budget deficit narrowed to 1.4% of GDP and is forecast to increase gradually to 1.8% by 2013. Downside risks also stem from increased expenditure, as the

Candidate Countries, Turkey
Table II.33.1:Main features of country forecast - TURKEY
2010 Annual percentage changebn TRY Curr. prices % GDP 92-07 2008 2009 2010 2011 2012 2013
GDP 1098.8 100.0 4.4 0.7 -4.8 9.2 8.5 3.3 4.6 Private consumption 787.8 71.7 4.4 -0.3 -2.3 6.7 7.7 3.2 3.3 Public consumption 157.5 14.3 4.3 1.7 7.8 2.0 4.5 3.5 4.6 Gross fixed capital formation 207.8 18.9 5.8 -6.2 -19.0 30.5 18.3 6.3 5.0 of which : equipment 146.8 13.4 - -5.6 -22.2 40.5 30.3 12.3 7.0 Exports (goods and services) 233.1 21.2 9.2 2.7 -5.0 3.4 6.5 3.7 8.2 Imports (goods and services) 294.0 26.8 10.4 -4.1 -14.3 20.7 10.6 5.7 4.9 GNI (GDP deflator) 1085.9 98.8 4.4 0.6 -5.0 9.6 8.5 3.4 4.7 Contribution to GDP growth : Domestic demand 4.9 -1.6 -5.5 11.4 10.3 3.8 3.9
Inventories 0.1 0.3 -2.1 2.3 -0.3 0.3 0.3Net exports -0.5 1.9 2.8 -4.5 -1.5 -0.8 0.4
Employment 0.5 2.2 0.4 6.2 6.7 1.1 1.7 Unemployment rate (a) 7.9 9.7 12.5 10.7 8.8 8.4 8.2 Compensation of employees/head 47.2 7.5 4.7 7.0 -3.8 5.7 5.8 Unit labour costs whole economy 41.6 9.2 10.4 4.1 -5.4 3.5 2.8 Real unit labour costs -4.0 -2.5 4.8 -1.5 -12.9 -3.3 -2.4 Saving rate of households (b) - - - - - - - GDP deflator 47.5 12.0 5.3 5.7 7.2 7.0 5.4 Harmonised index of consumer prices - 10.4 6.3 8.6 6.5 5.8 6.6 Terms of trade of goods -0.3 -3.2 2.5 -3.2 -3.9 2.0 0.0 Merchandise trade balance (c) -5.1 -6.8 -3.8 -7.5 -11.3 -11.1 -10.3 Current-account balance (c) -1.8 -5.7 -2.2 -6.4 -10.0 -9.3 -8.7 Net lending(+) or borrowing(-) vis-à-vis ROW (c) - - - - -8.0 -7.3 -6.7 General government balance (c) - -2.8 -6.9 -2.6 -1.4 -1.6 -1.8 Cyclically-adjusted budget balance (c) - - - - - - - Structural budget balance (c) - - - - - - - General government gross debt (c) - 39.5 45.5 39.4 38.4 37.1 35.5
(a) as % of total labour force. (b) gross saving divided by gross disposable income. (c) as a percentage of GDP.
131
Medium-Term Programme (2012-14) appears rather optimistic on medium-term growth.
-60
-40
-20
0
20
40
60
80
-6
-4
-2
0
2
4
6
8
06 07 08 09 10 11 12 13
% of GDPGraph II.33.2:Turkey - Public finances
General government debt (rhs) General government balance
forecast
% of GDP
Tighter policies are required if the 5% inflation target for 2012 and 2013 is to be met. However, given the state of global markets and the scale of Turkish banks’ need for foreign financing, the policy rate currently seems to be of limited importance.
Labour markets will be increasingly affected by the slowdown in growth. Employment growth is expected to fall back to levels of about 1% annually, from about 6½% growth registered in 2010 and 2011. The rapid decrease in the unemployment rate, which came down from 12½% in 2009 to less than 10% in early 2012, is continuing, albeit at a slower pace.


Other non-EU Countries
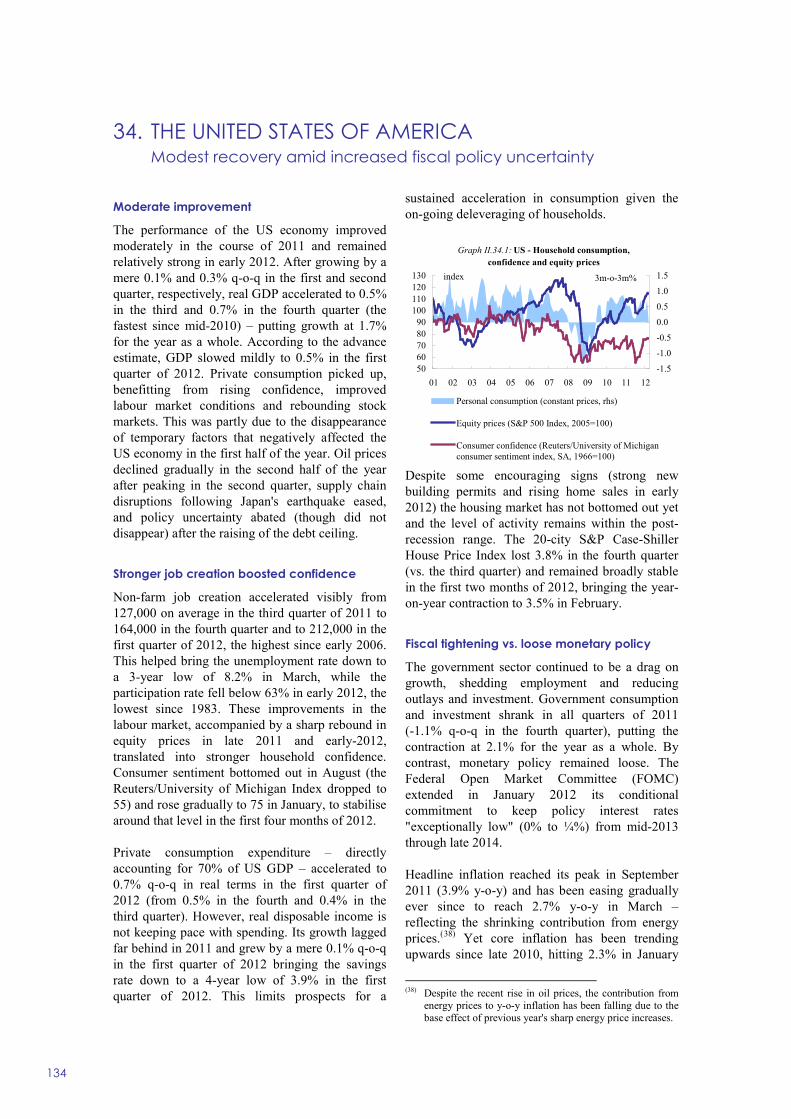
34. THE UNITED STATES OF AMERICA Modest recovery amid increased fiscal policy uncertainty
134
Moderate improvement
The performance of the US economy improved moderately in the course of 2011 and remained relatively strong in early 2012. After growing by a mere 0.1% and 0.3% q-o-q in the first and second quarter, respectively, real GDP accelerated to 0.5% in the third and 0.7% in the fourth quarter (the fastest since mid-2010) – putting growth at 1.7% for the year as a whole. According to the advance estimate, GDP slowed mildly to 0.5% in the first quarter of 2012. Private consumption picked up, benefitting from rising confidence, improved labour market conditions and rebounding stock markets. This was partly due to the disappearance of temporary factors that negatively affected the US economy in the first half of the year. Oil prices declined gradually in the second half of the year after peaking in the second quarter, supply chain disruptions following Japan's earthquake eased, and policy uncertainty abated (though did not disappear) after the raising of the debt ceiling.
Stronger job creation boosted confidence
Non-farm job creation accelerated visibly from 127,000 on average in the third quarter of 2011 to 164,000 in the fourth quarter and to 212,000 in the first quarter of 2012, the highest since early 2006. This helped bring the unemployment rate down to a 3-year low of 8.2% in March, while the participation rate fell below 63% in early 2012, the lowest since 1983. These improvements in the labour market, accompanied by a sharp rebound in equity prices in late 2011 and early-2012, translated into stronger household confidence. Consumer sentiment bottomed out in August (the Reuters/University of Michigan Index dropped to 55) and rose gradually to 75 in January, to stabilise around that level in the first four months of 2012.
Private consumption expenditure – directly accounting for 70% of US GDP – accelerated to 0.7% q-o-q in real terms in the first quarter of 2012 (from 0.5% in the fourth and 0.4% in the third quarter). However, real disposable income is not keeping pace with spending. Its growth lagged far behind in 2011 and grew by a mere 0.1% q-o-q in the first quarter of 2012 bringing the savings rate down to a 4-year low of 3.9% in the first quarter of 2012. This limits prospects for a
sustained acceleration in consumption given the on-going deleveraging of households.
Graph II.34.1: US - Household consumption, confidence and equity prices
5060708090
100110120130
01 02 03 04 05 06 07 08 09 10 11 12-1.5
-1.0
-0.5
0.0
0.5
1.0
1.53m-o-3m%
Personal consumption (constant prices, rhs)
Equity prices (S&P 500 Index, 2005=100)
Consumer confidence (Reuters/University of Michiganconsumer sentiment index, SA, 1966=100)
index
Despite some encouraging signs (strong new building permits and rising home sales in early 2012) the housing market has not bottomed out yet and the level of activity remains within the post-recession range. The 20-city S&P Case-Shiller House Price Index lost 3.8% in the fourth quarter (vs. the third quarter) and remained broadly stable in the first two months of 2012, bringing the year-on-year contraction to 3.5% in February.
Fiscal tightening vs. loose monetary policy
The government sector continued to be a drag on growth, shedding employment and reducing outlays and investment. Government consumption and investment shrank in all quarters of 2011 (-1.1% q-o-q in the fourth quarter), putting the contraction at 2.1% for the year as a whole. By contrast, monetary policy remained loose. The Federal Open Market Committee (FOMC) extended in January 2012 its conditional commitment to keep policy interest rates "exceptionally low" (0% to ¼%) from mid-2013 through late 2014.
Headline inflation reached its peak in September 2011 (3.9% y-o-y) and has been easing gradually ever since to reach 2.7% y-o-y in March – reflecting the shrinking contribution from energy prices.(38) Yet core inflation has been trending upwards since late 2010, hitting 2.3% in January
(38) Despite the recent rise in oil prices, the contribution from
energy prices to y-o-y inflation has been falling due to the base effect of previous year's sharp energy price increases.
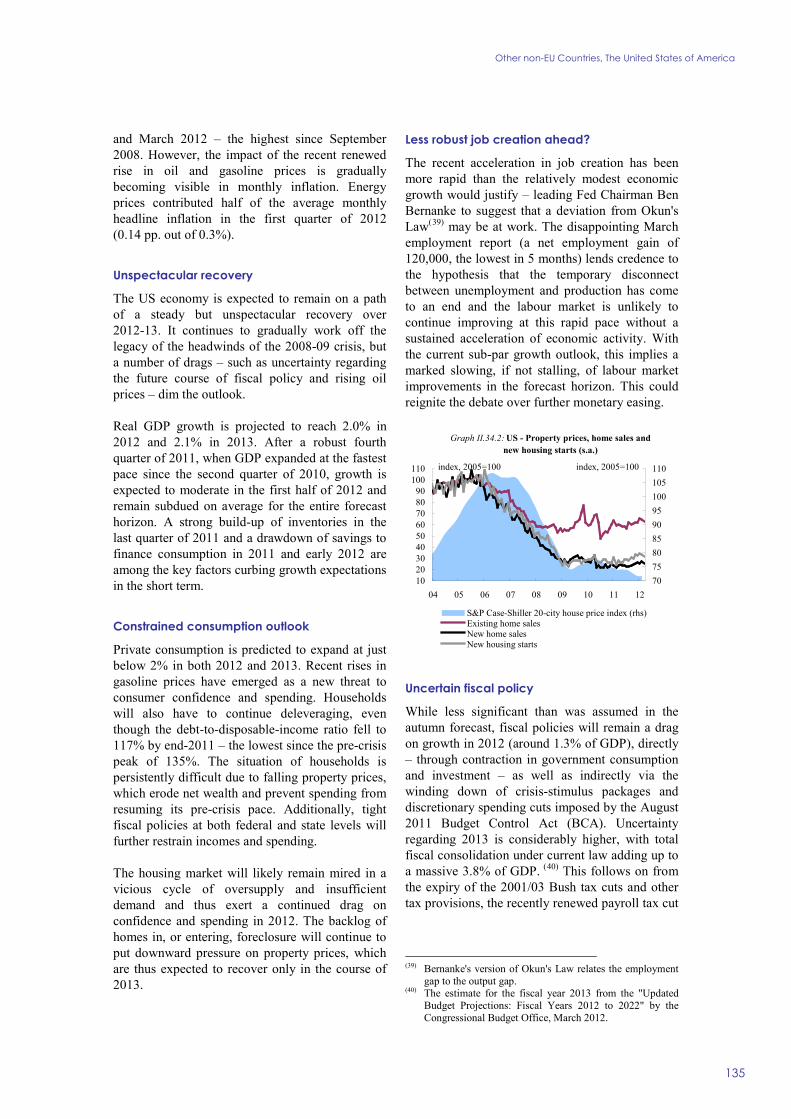
Other non-EU Countries, The United States of America
135
and March 2012 – the highest since September 2008. However, the impact of the recent renewed rise in oil and gasoline prices is gradually becoming visible in monthly inflation. Energy prices contributed half of the average monthly headline inflation in the first quarter of 2012 (0.14 pp. out of 0.3%).
Unspectacular recovery
The US economy is expected to remain on a path of a steady but unspectacular recovery over 2012-13. It continues to gradually work off the legacy of the headwinds of the 2008-09 crisis, but a number of drags – such as uncertainty regarding the future course of fiscal policy and rising oil prices – dim the outlook.
Real GDP growth is projected to reach 2.0% in 2012 and 2.1% in 2013. After a robust fourth quarter of 2011, when GDP expanded at the fastest pace since the second quarter of 2010, growth is expected to moderate in the first half of 2012 and remain subdued on average for the entire forecast horizon. A strong build-up of inventories in the last quarter of 2011 and a drawdown of savings to finance consumption in 2011 and early 2012 are among the key factors curbing growth expectations in the short term.
Constrained consumption outlook
Private consumption is predicted to expand at just below 2% in both 2012 and 2013. Recent rises in gasoline prices have emerged as a new threat to consumer confidence and spending. Households will also have to continue deleveraging, even though the debt-to-disposable-income ratio fell to 117% by end-2011 – the lowest since the pre-crisis peak of 135%. The situation of households is persistently difficult due to falling property prices, which erode net wealth and prevent spending from resuming its pre-crisis pace. Additionally, tight fiscal policies at both federal and state levels will further restrain incomes and spending.
The housing market will likely remain mired in a vicious cycle of oversupply and insufficient demand and thus exert a continued drag on confidence and spending in 2012. The backlog of homes in, or entering, foreclosure will continue to put downward pressure on property prices, which are thus expected to recover only in the course of 2013.
Less robust job creation ahead?
The recent acceleration in job creation has been more rapid than the relatively modest economic growth would justify – leading Fed Chairman Ben Bernanke to suggest that a deviation from Okun's Law(39) may be at work. The disappointing March employment report (a net employment gain of 120,000, the lowest in 5 months) lends credence to the hypothesis that the temporary disconnect between unemployment and production has come to an end and the labour market is unlikely to continue improving at this rapid pace without a sustained acceleration of economic activity. With the current sub-par growth outlook, this implies a marked slowing, if not stalling, of labour market improvements in the forecast horizon. This could reignite the debate over further monetary easing.
Graph II.34.2: US - Property prices, home sales and new housing starts (s.a.)
102030405060708090
100110
04 05 06 07 08 09 10 11 12707580859095100105110
S&P Case-Shiller 20-city house price index (rhs)Existing home salesNew home salesNew housing starts
index, 2005=100 index, 2005=100
Uncertain fiscal policy
While less significant than was assumed in the autumn forecast, fiscal policies will remain a drag on growth in 2012 (around 1.3% of GDP), directly – through contraction in government consumption and investment – as well as indirectly via the winding down of crisis-stimulus packages and discretionary spending cuts imposed by the August 2011 Budget Control Act (BCA). Uncertainty regarding 2013 is considerably higher, with total fiscal consolidation under current law adding up to a massive 3.8% of GDP. (40) This follows on from the expiry of the 2001/03 Bush tax cuts and other tax provisions, the recently renewed payroll tax cut
(39) Bernanke's version of Okun's Law relates the employment
gap to the output gap. (40) The estimate for the fiscal year 2013 from the "Updated
Budget Projections: Fiscal Years 2012 to 2022" by the Congressional Budget Office, March 2012.

European Economic Forecast, Spring 2012
Table II.34.1:Main features of country forecast - THE UNITED STATES
2010 Annual percentage changebn USD Curr. prices % GDP 92-07 2008 2009 2010 2011 2012 2013
GDP 14497.2 100.0 3.2 -0.4 -3.5 3.0 1.7 2.0 2.1 Private consumption 10245.5 70.7 3.5 -0.6 -1.9 2.0 2.2 2.0 1.8 Public consumption 2614.6 18.0 1.5 2.6 2.0 1.0 -1.6 -2.0 -1.5 Gross fixed capital formation 2086.3 14.4 5.0 -5.8 -16.0 1.8 4.8 6.4 6.3 of which : equipment 1086.7 7.5 7.1 -5.4 -18.4 16.9 9.8 8.0 8.2 Exports (goods and services) 1840.8 12.7 5.7 6.1 -9.4 11.3 6.7 4.9 6.6 Imports (goods and services) 2356.9 16.3 7.7 -2.7 -13.6 12.5 4.9 3.7 5.4 GNI (GDP deflator) 14686.6 101.3 3.3 -0.1 -4.2 3.8 2.1 2.1 2.3 Contribution to GDP growth : Domestic demand 3.5 -1.1 -3.8 1.9 2.0 2.1 2.1
Inventories 0.0 -0.5 -0.8 1.7 -0.2 0.1 0.0Net exports -0.4 1.2 1.2 -0.5 0.1 0.0 0.0
Employment (*) 1.3 -0.7 -5.0 -0.6 0.6 1.8 0.8 Unemployment rate (a) 5.3 5.8 9.3 9.6 9.0 8.2 8.0 Compensation of employees/head 3.8 3.3 2.1 2.7 3.2 2.5 4.1 Unit labour costs whole economy 1.9 2.9 0.5 -0.9 2.0 2.3 2.8 Real unit labour costs -0.3 0.7 -0.6 -2.1 -0.1 0.4 0.5 Saving rate of households (b) 8.3 9.9 9.8 9.7 9.0 8.9 8.7 GDP deflator 2.2 2.2 1.1 1.2 2.1 1.9 2.3 General index of consumer prices 2.7 3.8 -0.4 1.6 3.2 2.5 2.0 Terms of trade of goods -0.2 -5.9 6.3 -1.8 -1.3 -1.7 -0.7 Merchandise trade balance (c) -3.9 -6.0 -3.8 -4.6 -5.1 -5.2 -5.2 Current-account balance (c) -3.2 -4.8 -3.3 -3.3 -3.2 -3.1 -3.0 Net lending(+) or borrowing(-) vis-à-vis ROW (c) -3.2 -4.7 -3.3 -3.3 -3.2 -3.1 -3.0 General government balance (c) -2.6 -6.4 -11.5 -10.6 -9.6 -8.3 -7.1 Cyclically-adjusted budget balance (c) - - - - - - - Structural budget balance (c) - - - - - - - General government gross debt (c) 65.9 76.5 90.4 99.1 103.5 108.9 111.8
(a) as % of total labour force. (b) gross saving divided by gross disposable income. (c) as a percentage of GDP. (*) Employment data from the BLS household survey.
136
package and the sequestration set to kick in on 1 January, 2013.(41)
The fiscal consolidation of 3.8% of GDP in 2013 is highly unlikely, since Republicans and Democrats are aware that this would bring the economy back into recession. However they remain far apart on their prescriptions on how to achieve long-term fiscal sustainability. Republicans emphasise cuts to non-defence discretionary and entitlement spending, while Democrats favour revenue increases (e.g. through higher taxes on the wealthy). The eventual changes to expenditure and taxes in the near term as well as the profile and composition of the medium-term consolidation programme will depend on the new post-election balance of political powers. For 2013 our baseline scenario assumes the extension of most expiring tax cuts as well as a significant downsizing of sequestration. This will reduce the fiscal drag to around 1.2% of GDP in 2013.
Balanced risks
Risks to the outlook appear evenly balanced. Downside risks relate to possible further sharp
(41) The BCA-imposed across-the-board cuts to defence and
non-defence spending of USD 1.2 trillion over 10 years beginning Jan. 1, 2013.
increases in oil prices as well as the uncertainties regarding the domestic fiscal and debt outlook. The latter risk may materialise if a damaging political stand-off over fiscal measures is repeated, for example during the next debt ceiling debate, or over the question of which tax cuts should be extended (both expected in late 2012). This may undermine financial markets' confidence in the emergence of the political consensus necessary to put in place and implement medium-term fiscal consolidation. Upside risks include a more sustained decoupling from the global slowdown and greater underlying momentum generated from the recent strengthening of economic activity. This may come through, inter alia, a prompt and successful emergence of the credible medium-term fiscal consolidation, a faster-than-envisaged rebound in the housing market and stronger job creation underpinned by the continuing rise in business confidence. Another source of upside surprise to growth in 2012 could also come from a milder-than-projected rise in oil prices.

35. JAPAN Recovery after a setback
137
GDP contracts due to negative net exports
The effects of the March 2011 earthquake pushed Japan back into recession, following growth of 4.4% in 2010 and a 5.5% decline in 2009. Overall, GDP for 2011 contracted 0.7%, due to a sharp drop (-1.8% q-o-q) in the first quarter and a milder retrenchment (-0.3% q-o-q) in the second quarter. With supply-chain disruptions easing in the third quarter, GDP rebounded (1.7% q-o-q) but was again pushed back into negative territory (-0.2% q-o-q) in the final quarter due to deteriorating world trade, the strong yen and new supply-chain disruptions caused by the flood in Thailand. These factors, and the need to import more oil due to the shutdown of nuclear power plants, caused Japan's first trade deficit in more than three decades, and net exports made a negative net contribution to GDP of 0.7 pp. In addition, the significant appreciation of the yen against the Korean won had a sizeable negative impact on Japanese exports and the profitability of Japanese companies. The structural trade surplus has narrowed rapidly in recent years and might turn to a deficit relatively soon. Non-residential investment grew at 20.7% (SAAR) in the fourth quarter of 2011.
40
60
80
100
120
140
160
180
07 08 09 10 11 12
Japan Exports Korea ExportsJapan REER Korea REER
Graph II.35.1:Japan and Korea exports and Real Effective Exchange Rates
index, 2007=100
Moderate growth likely to be driven by investment in 2012
Japan was the only major country where financing conditions loosened in the final quarter of 2011 according to the BIS. Access to finance is on balance conducive for investment, although real interest rates are not that low for corporations in Japan. Recent business surveys confirm that growth in non-residential investment is currently
driven more by non-manufacturing companies than by manufacturing companies. If world trade recovers, and the yen continues to be weaker than it was in most of 2011, manufacturing companies might also join the recovery trend and increase their investment in the course of 2012. Public investment is expected to grow relatively strongly, with the biggest quarterly growth expected in the second quarter due the supplementary budgets aiming at reconstruction following the March 2011 devastation. It is still not clear when the bulk of the money will be spent, but signs are that from the second quarter onwards, spending related to the supplementary budgets will pick up.
Government consumption will likely grow at a fairly moderate pace in 2012 due to salary cuts for civil servants, pension cuts and a somewhat improving economy. Private consumption was flat in 2011, but above 2007 levels. Real incomes are rising moderately and give some limited support for consumption growth in 2012. The looming social security reform, potential tax rises, as well as purchasing power losses due to higher energy prices, suggest that consumers are likely to remain cautious.
Exports are likely to grow only moderately in 2012, although the special factors that negatively influenced their performance in 2011 are fading. Moderate expectations for world trade growth and trade growth in Asia are likely to prevent a stronger rebound for Japanese exports. A major factor for export growth will be the evolution of the REER, which reached its highest level in several years before the Bank of Japan's decision on 14 February 2012 on its inflation goal and the expansion of the asset purchase programme. Since then, the REER has weakened and in the middle of March 2012 fell slightly below the 2011 average level. Imports are likely to grow due to a higher need for imported fossil fuels as all but one nuclear power plant were shut down as of April 2012 and it appears unlikely that many nuclear power plants will be operational soon given rising local resistance. Mineral fuels account for almost 40% of imports in early 2012 and the volume increase for LPG and LNG (to operate thermal plants) increased the overall import bill by 2.5% compared to early 2011. Despite lower quarter-on-quarter dynamics, imports are likely to outgrow exports due to the higher carry-over.

European Economic Forecast, Spring 2012
Table II.35.1:Main features of country forecast - JAPAN
2010 Annual percentage changebn JPY Curr. prices % GDP 92-07 2008 2009 2010 2011 2012 2013
GDP 481773.3 100.0 1.1 -1.0 -5.5 4.4 -0.7 1.9 1.7 Private consumption 285439.0 59.2 1.2 -0.9 -0.7 2.6 0.0 1.4 0.8 Public consumption 95306.8 19.8 2.4 -0.1 2.3 2.1 2.1 0.8 0.4 Gross fixed capital formation 96776.4 20.1 -0.8 -4.1 -10.6 -0.2 0.5 4.3 1.7 of which : equipment - - - - - - - - - Exports (goods and services) 73181.0 15.2 5.5 1.4 -24.2 24.2 0.1 2.4 4.8 Imports (goods and services) 67419.0 14.0 3.9 0.3 -15.7 11.1 5.7 4.1 3.6 GNI (GDP deflator) 494030.3 102.5 1.3 -1.1 -6.1 4.3 -0.2 2.0 1.7 Contribution to GDP growth : Domestic demand 0.9 -1.5 -2.4 2.0 0.5 1.8 0.9
Inventories 0.0 0.2 -1.6 0.8 -0.4 0.2 0.5Net exports 0.3 0.2 -1.5 1.7 -0.7 -0.2 0.3
Employment -0.1 -0.3 -1.5 -0.4 -0.2 0.1 0.1 Unemployment rate (a) 4.0 4.0 5.1 5.1 4.9 4.8 4.7 Compensation of employees/head -0.1 0.2 -3.8 0.2 1.0 1.2 1.2 Unit labour costs whole economy -1.3 0.9 0.4 -4.4 1.6 -0.6 -0.4 Real unit labour costs -0.7 2.2 0.9 -2.4 3.7 0.6 -1.4 Saving rate of households (b) 14.3 7.6 9.1 8.9 10.9 11.3 12.1 GDP deflator -0.6 -1.3 -0.5 -2.1 -2.1 -1.2 1.0 General index of consumer prices 0.2 1.4 -1.4 -0.7 -0.3 -0.3 0.8 Terms of trade of goods -2.1 -10.7 16.1 -7.1 -8.4 -0.5 -1.4 Merchandise trade balance (c) 2.5 0.8 0.9 1.7 0.3 0.1 0.1 Current-account balance (c) 2.9 3.3 2.8 3.6 2.0 1.7 1.6 Net lending(+) or borrowing(-) vis-à-vis ROW (c) 2.8 3.2 2.7 3.5 1.9 1.6 1.5 General government balance (c) -4.8 -1.9 -8.8 -8.4 -8.2 -8.2 -8.0 Cyclically-adjusted budget balance (c) - - - - - - - Structural budget balance (c) - - - - - - - General government gross debt (c) 124.3 175.2 194.0 197.6 211.4 219.0 221.8
(a) as % of total labour force. (b) gross saving divided by gross disposable income. (c) as a percentage of GDP.
138
Fiscal consolidation remains an urgent need
The very high debt-to-GDP ratio, low structural growth, a narrowing current-account surplus and outstanding government debt that is likely to overtake household net assets in a couple of years all call for a credible fiscal consolidation plan. Since the autumn forecast, fiscal consolidation plans have become more detailed. However, in April 2012 it was still unclear whether a consumption tax hike and other consolidation measures would become law. Delaying the implementation of consolidation measures is risky, as successful consolidation is much more difficult once government-bond yields increase significantly.
Monetary policy loosened
The decision of the Bank of Japan to move from targeting "price stability" to a more outright inflation goal (of 1% for the time being) was a significant step and was followed by a weakening of the yen. At the same time the central bank further expanded its asset purchase programme. If needed, the Bank of Japan is also expected to take further easing measures in the coming months. With headline inflation hovering around 0% and few inflationary pressures, the Bank of Japan will need to take further measures to reach its new goal.
Japan is expected to remain with very mild deflation in 2012 before turning to low (but positive) inflation in 2013.
Outlook for 2013
Moderate growth is expected to continue in 2013. A positive growth contribution from net exports is expected due to lower mineral fuels imports, accompanied by renewed market-share gains. Investment, apart from residential investment, is expected to grow more slowly than in 2012. Both government and private consumption are also expected to grow more slowly than in 2012, as fiscal consolidation becomes more ambitious, consumers have fewer incentives to buy durables, and the effects of higher electricity and import prices lower consumers' purchasing power.
Downside risks are more pronounced
Public investments and exports could be stronger than expected. Downside risks are linked with higher oil prices, energy shortages and to a loss of confidence in the government-bond market.
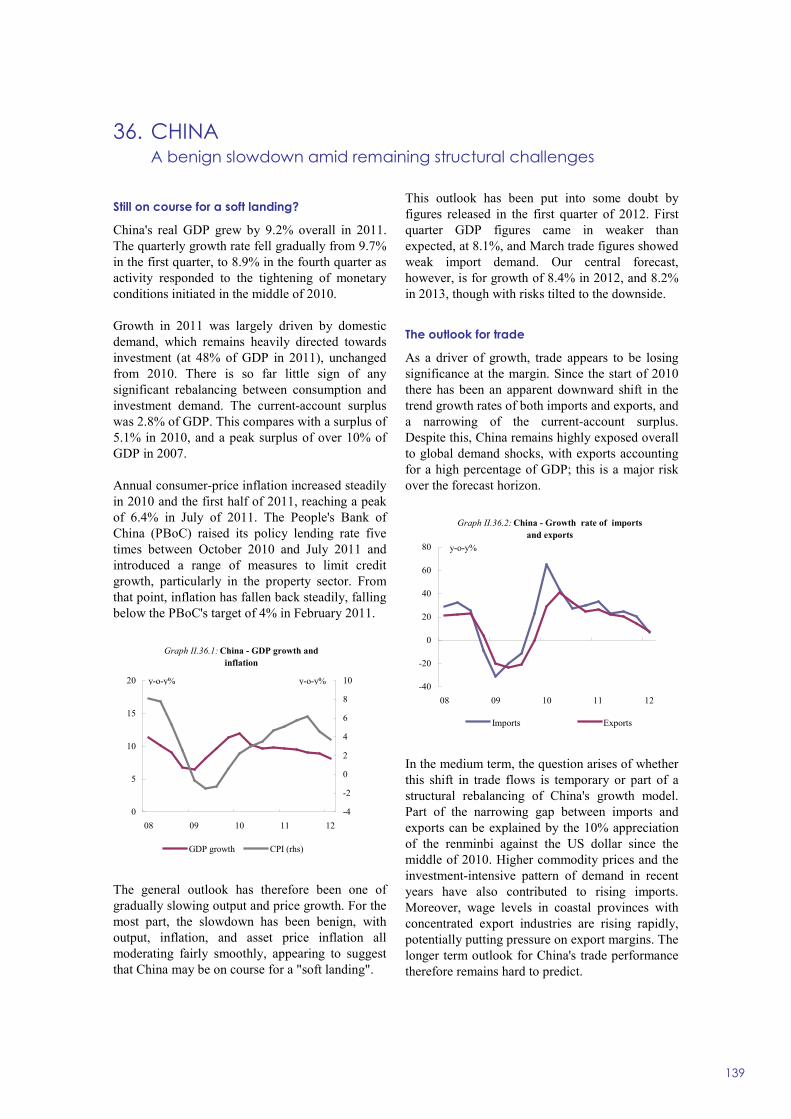
36. CHINA A benign slowdown amid remaining structural challenges
139
Still on course for a soft landing?
China's real GDP grew by 9.2% overall in 2011. The quarterly growth rate fell gradually from 9.7% in the first quarter, to 8.9% in the fourth quarter as activity responded to the tightening of monetary conditions initiated in the middle of 2010.
Growth in 2011 was largely driven by domestic demand, which remains heavily directed towards investment (at 48% of GDP in 2011), unchanged from 2010. There is so far little sign of any significant rebalancing between consumption and investment demand. The current-account surplus was 2.8% of GDP. This compares with a surplus of 5.1% in 2010, and a peak surplus of over 10% of GDP in 2007.
Annual consumer-price inflation increased steadily in 2010 and the first half of 2011, reaching a peak of 6.4% in July of 2011. The People's Bank of China (PBoC) raised its policy lending rate five times between October 2010 and July 2011 and introduced a range of measures to limit credit growth, particularly in the property sector. From that point, inflation has fallen back steadily, falling below the PBoC's target of 4% in February 2011.
0
5
10
15
20
08 09 10 11 12-4
-2
0
2
4
6
8
10
GDP growth CPI (rhs)
y-o-y%
Graph II.36.1: China - GDP growth and inflation
y-o-y%
The general outlook has therefore been one of gradually slowing output and price growth. For the most part, the slowdown has been benign, with output, inflation, and asset price inflation all moderating fairly smoothly, appearing to suggest that China may be on course for a "soft landing".
This outlook has been put into some doubt by figures released in the first quarter of 2012. First quarter GDP figures came in weaker than expected, at 8.1%, and March trade figures showed weak import demand. Our central forecast, however, is for growth of 8.4% in 2012, and 8.2% in 2013, though with risks tilted to the downside.
The outlook for trade
As a driver of growth, trade appears to be losing significance at the margin. Since the start of 2010 there has been an apparent downward shift in the trend growth rates of both imports and exports, and a narrowing of the current-account surplus. Despite this, China remains highly exposed overall to global demand shocks, with exports accounting for a high percentage of GDP; this is a major risk over the forecast horizon.
-40
-20
0
20
40
60
80
08 09 10 11 12
Imports Exports
Graph II.36.2: China - Growth rate of imports and exports
y-o-y%
In the medium term, the question arises of whether this shift in trade flows is temporary or part of a structural rebalancing of China's growth model. Part of the narrowing gap between imports and exports can be explained by the 10% appreciation of the renminbi against the US dollar since the middle of 2010. Higher commodity prices and the investment-intensive pattern of demand in recent years have also contributed to rising imports. Moreover, wage levels in coastal provinces with concentrated export industries are rising rapidly, potentially putting pressure on export margins. The longer term outlook for China's trade performance therefore remains hard to predict.

European Economic Forecast, Spring 2012
Table II.36.1:Main features of country forecast - CHINA
2010 Annual percentage changebn CNY Curr. prices % GDP 92-07 2008 2009 2010 2011 2012 2013
GDP 40151.3 100.0 10.3 9.6 9.2 10.3 9.2 8.4 8.2 Private consumption 13329.1 33.2 14.9 15.7 9.5 10.0 - - - Public consumption 5361.4 13.4 16.2 16.3 9.4 17.3 - - - Gross fixed capital formation 19169.1 47.7 18.6 24.7 18.9 16.6 - - - of which : equipment - - - - - - - - - Change in stocks as % of GDP - - - - - - - - - Exports (goods and services) 15777.5 39.3 16.6 5.4 -11.7 13.4 9.8 8.2 7.6 Final demand - - - - - - - - - Imports (goods and services) 13962.5 34.8 17.6 6.2 1.3 24.2 10.1 7.9 8.4 GNI (GDP deflator) - - - - - - - - - Contribution to GDP growth : Domestic demand - - - - - - -
Stockbuilding - - - - - - -Foreign balance - - - - - - -
Employment 0.9 0.3 0.3 0.4 - - - Unemployment (a) 3.4 4.2 4.3 4.1 - - - Compensation of employees/head - - - - - - - Unit labour costs - - - - - - - Real unit labour costs - - - - - - - Saving rate of households - - - - - - - GDP deflator 5.6 7.8 -0.6 5.8 6.0 5.5 5.0 Private consumption deflator - - - - - - - Index of consumer prices (c) 5.3 5.9 -0.7 3.3 - - - Merchandise trade balance (b) 3.4 8.0 5.0 4.3 2.8 3.2 3.2 Current-account balance (b) 2.9 9.1 5.2 5.2 2.8 3.1 3.1 Net lending(+) or borrowing(-) vis-à-vis ROW (b) - - - - - - - General government balance (b) -1.3 -0.4 -2.3 -1.7 - - - General government gross debt (b) - - - - - - -
(a) urban unemployment, as % of labour force. (b) as a percentage of GDP. (c) national indicator.
140
Internal risks to growth
The major internal risk to growth is a sharper than expected decline in investment spending, particularly in the property sector. In the wake of the 2008 financial crisis, China loosened credit controls substantially and saw a very rapid growth in real estate investment. Residential investment is well over 10% of GDP. Although this level is not sustainable, an overly rapid fall in investment would add to the likelihood of a hard landing.
Property prices have also become a concern at a political level. House price inflation picked up in 2009 and reached almost 10% in 2010, before moderating as monetary policy was tightened. The Chinese premier has pledged to reduce prices to a more "reasonable" level, following concerns about general affordability. The policy challenge is to gradually deflate the property bubble without a sharp dislocation in demand, or excessive spill-over effects to other sectors.
In the short run, the authorities have significant room to react to unexpectedly negative developments. Government debt levels do not constrain fiscal policy at present, even though central government debt (officially 17% of GDP) excludes a range of contingent liabilities. In addition, there is scope to loosen credit controls on banks, to lower required reserve ratios to expand
liquidity, and to cut the floor for bank lending rates if necessary. However, this relatively optimistic assessment has to be qualified in two senses.
Firstly, there is a number of potential political and economic constraints on short-term policy making. For example, on the economic front there is a possibility that inflation could tick back up, in response to higher food prices and rising global commodity prices. Higher inflation is potentially destabilising, given the high percentage of household wealth held in bank deposits. On the political front, constraints on policy may arise from the uncertainty surrounding the change in political leadership towards the end of the year.
Secondly, China has a structural stock-flow problem. Very high levels of investment in recent years have supported short-term demand growth, but have also contributed to a potential decline in capital productivity and a rising stock of bad loans. In the event of a sharp downturn, a loosening of credit would risk perpetuating these longer-term problems. Moreover, a continuing build-up of bad debt in the financial system puts pressure on bank finances, and may create a further obstacle to the liberalisation of interest rates. However, without rate liberalisation it will be hard to achieve a sustainable shift to a more consumption-driven model of growth.

37. EFTA Signs of resilience despite difficult external conditions
141
Due to changing external conditions and, in particular, the euro-area sovereign-debt crisis, the outlook for both Switzerland and Norway has been revised down significantly. However, their sound economic policies, their ability to tap into new markets and solid economic underpinnings are making Norway and Switzerland more resilient to the euro-area debt crisis than one would expect on the basis of their deep links with the euro area.
In particular, yields have shown little sign of contagion, as they have actually fallen amid strong capital inflows in Switzerland and, to a lesser extent, Norway. As a consequence, monetary policy could stay relatively accommodative because exchange rates appreciated, which helped to keep a lid on inflation.
Trade was not as much affected as might have been expected, either. Both Norway and Switzerland benefit from relatively decoupled business cycles in Asia and North America. In the case of Norway, this has led to persistently high prices for its exports of oil and gas. In the case of Switzerland, export fall-out from some euro-area countries was largely substituted by demand from emerging market economies, in particular for its niche products like machinery and watches.
Graph II.37.1: EFTA vs. EU growth
-6
-4
-2
0
2
4
6
06 07 08 09 10 11 12 13
Switzerland Norway EU
y-o-y %
forecast
The effect of the euro-area sovereign-debt crisis may have been felt most in Switzerland through changes in consumer and business confidence. Consumer confidence fell as quickly as it had during the unfolding of the global financial crisis. Consumer and business confidence in Norway is
less affected. The Norwegian state has traditionally offered more of a buffer to external conditions, not least because of the oil fund and the still high oil revenues.
Norway: domestic demand as the main growth engine
The Norwegian economy recovered in 2011, with GDP growth reaching 1.6%. Growth is expected to edge up to around 1.7% in 2012, as mainland real GDP is affected by reduced foreign demand for its on-shore produce and uncertainty from the euro-area recession. However, consumer demand, low interest rates, high natural gas export volumes, high oil prices and robust manufacturing production observed in early 2012 can be expected to continue to support the economy during the rest of the year. Norway’s substantial sovereign oil wealth and the government’s efforts to smooth the economic cycle will provide a further buffer to the economy in times of distress. In 2013 and over the longer term, the trend fall in petroleum output and potentially tighter credit conditions are likely to weaken average growth compared with the decade up to 2008, to around 2%.
Investment takes the lead
Private consumption growth slowed from 3.7% in 2010 to 2.2% in 2011, despite fairly rapid real wage growth (2.6%) and robust employment growth (1.4%). The savings rate is expected to decline somewhat in 2012 and consumption growth to rise slightly, to 2.5% over the year, as part of households' accumulated wealth is used to smooth consumption over the business cycle. Supported by improving labour market conditions, consumption is foreseen to continue rising by around 3% in 2013. After declining for two consecutive years, gross fixed investment grew by 7.2% in 2011, and is forecast to continue growing in 2012, driven by off-shore investment, especially in the Barents Sea. This in turn will support investment by many mainland businesses and help offset the reduced income from exports to the euro area. However, investment is expected to grow slightly more slowly in 2013, mainly because of lower forecast off-shore investment.

European Economic Forecast, Spring 2012
142
Oil prices supportive
Norway's current account will remain comfortably in surplus throughout the forecast period. Oil exports will decline gradually over the forecast period, as production is now past its peak, although gas exports will continue to grow. The growth of traditional exports should pick up during the second half of the forecast period as external demand strengthens. The development of oil prices and of the US dollar will determine whether petroleum export earnings can sustain a large surplus on the goods account despite the decline in oil production. Relatively robust domestic demand should maintain steady import growth at around 5%. The current account will also be supported by surpluses on the services balance.
Benign inflation developments
A strong krone has kept inflation low, despite higher global energy costs. CPI growth is expected to gain momentum along the forecast period, as stronger domestic demand and higher wage settlements should stimulate prices to reach the central bank's 2.5% inflation target in 2015 and 2016.
Switzerland: between a rock and a hard place?
The current situation is exceptional for Switzerland. On the one hand it is perceived as one of the few remaining safe havens for global capital flows and on the other hand it is highly economically integrated with the euro area. The country combines relatively solid financial market institutions with liquidity and the presence of major financial institutions. As a consequence of high and volatile global risk aversion, Switzerland is experiencing high capital inflows – in particular at the short end – and appreciation pressure on its currency.
Low yields, ample liquidity and domestic credit raise the risk of irrational exuberance in real estate. The acceleration of house-price growth over the past quarters is not out of line with historical price developments, but the national figure covers the heterogeneity of house price developments across Switzerland.
Finding new markets while facing appreciation
Uncertainty over income growth in the euro area and reduced price competitiveness due to the
appreciated Swiss franc leads to wavering demand from the euro area. At the same time, Swiss exporters' specialisation in higher value added goods gives Swiss exports some resilience. For instance, the Swiss economy has a competitive edge in the exports of goods in some niche markets and is able to tap into robust demand in those niche markets from the emerging economies. One such niche markets is the watch making industry, which accounted for 10% of all goods exports in 2011. In 2011, the exported value of watches increased by 19.2% y-o-y. More difficulties are being encountered by the paper and chemical industries where price pressures are significant. Exports to Asia grew by 9.6% y-o-y in 2011, with exceptionally strong numbers for China (19.2%), Hong Kong SAR (18.8%), and India (15.5%).
Graph II.37.2: EFTA and euro area - Real Effective Exchange Rates
60
80
100
120
140
160
180
92 94 96 98 00 02 04 06 08 10
Real CHF Real EUR Real NOK
Swiss confidence took a hit
The fall in Swiss confidence resembled the fall from the second quarter of 2008, as the global economic and financial crisis unfolded. This time the impact of the fall in confidence on private consumption and gross fixed capital formation was relatively limited and mostly felt in the third quarter. In the fourth quarter, private consumption showed a robust real growth of 0.4% q-o-q (seasonally adjusted) and gross fixed capital formation grew by 2.5% q-o-q. A large inventory correction caused domestic demand to contract by 1.5% q-o-q instead of the 0.8% q-o-q growth which would have resulted from consumption and investment demand only.
Unemployment has risen mildly in recent months and is expected to rise somewhat further before improved economic conditions lead to stronger employment growth at the beginning of next year. Unemployment is expected to stay at low levels
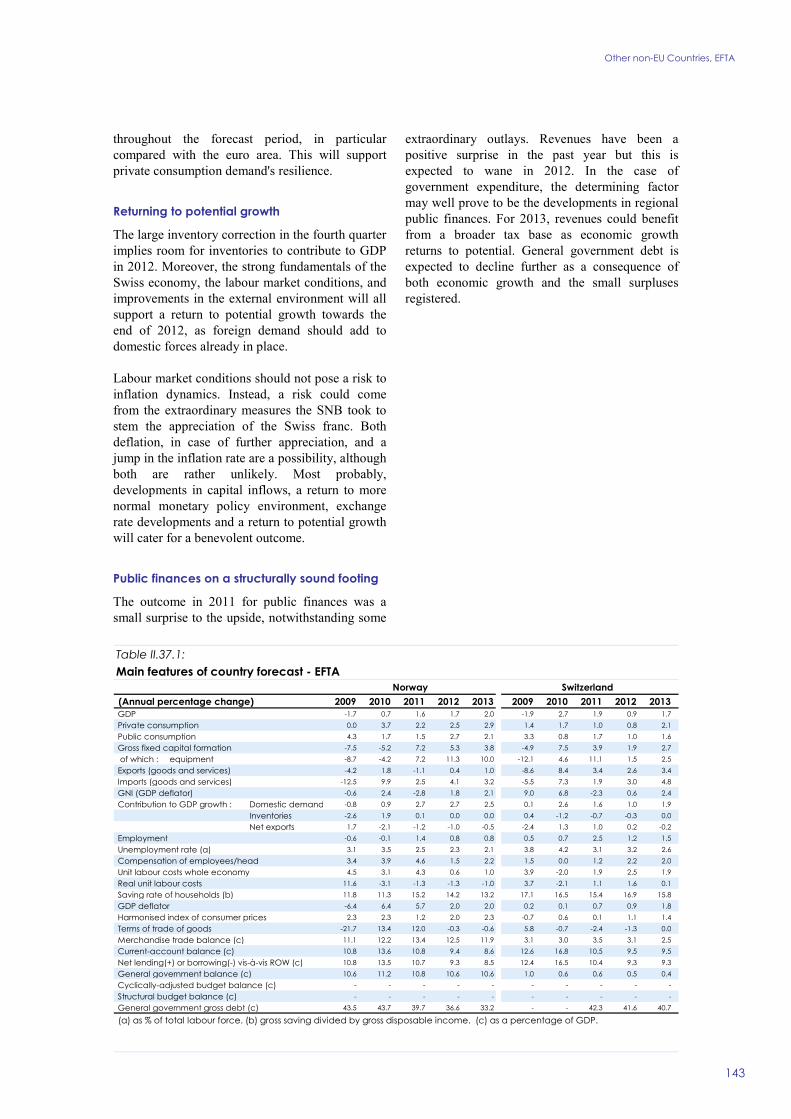
Other non-EU Countries, EFTA
Table II.37.1:Main features of country forecast - EFTA
Norway Switzerland (Annual percentage change) 2009 2010 2011 2012 2013 2009 2010 2011 2012 2013 GDP -1.7 0.7 1.6 1.7 2.0 -1.9 2.7 1.9 0.9 1.7 Private consumption 0.0 3.7 2.2 2.5 2.9 1.4 1.7 1.0 0.8 2.1 Public consumption 4.3 1.7 1.5 2.7 2.1 3.3 0.8 1.7 1.0 1.6 Gross fixed capital formation -7.5 -5.2 7.2 5.3 3.8 -4.9 7.5 3.9 1.9 2.7 of which : equipment -8.7 -4.2 7.2 11.3 10.0 -12.1 4.6 11.1 1.5 2.5 Exports (goods and services) -4.2 1.8 -1.1 0.4 1.0 -8.6 8.4 3.4 2.6 3.4 Imports (goods and services) -12.5 9.9 2.5 4.1 3.2 -5.5 7.3 1.9 3.0 4.8 GNI (GDP deflator) -0.6 2.4 -2.8 1.8 2.1 9.0 6.8 -2.3 0.6 2.4 Contribution to GDP growth : Domestic demand -0.8 0.9 2.7 2.7 2.5 0.1 2.6 1.6 1.0 1.9
Inventories -2.6 1.9 0.1 0.0 0.0 0.4 -1.2 -0.7 -0.3 0.0Net exports 1.7 -2.1 -1.2 -1.0 -0.5 -2.4 1.3 1.0 0.2 -0.2
Employment -0.6 -0.1 1.4 0.8 0.8 0.5 0.7 2.5 1.2 1.5 Unemployment rate (a) 3.1 3.5 2.5 2.3 2.1 3.8 4.2 3.1 3.2 2.6 Compensation of employees/head 3.4 3.9 4.6 1.5 2.2 1.5 0.0 1.2 2.2 2.0 Unit labour costs whole economy 4.5 3.1 4.3 0.6 1.0 3.9 -2.0 1.9 2.5 1.9 Real unit labour costs 11.6 -3.1 -1.3 -1.3 -1.0 3.7 -2.1 1.1 1.6 0.1 Saving rate of households (b) 11.8 11.3 15.2 14.2 13.2 17.1 16.5 15.4 16.9 15.8 GDP deflator -6.4 6.4 5.7 2.0 2.0 0.2 0.1 0.7 0.9 1.8 Harmonised index of consumer prices 2.3 2.3 1.2 2.0 2.3 -0.7 0.6 0.1 1.1 1.4 Terms of trade of goods -21.7 13.4 12.0 -0.3 -0.6 5.8 -0.7 -2.4 -1.3 0.0 Merchandise trade balance (c) 11.1 12.2 13.4 12.5 11.9 3.1 3.0 3.5 3.1 2.5 Current-account balance (c) 10.8 13.6 10.8 9.4 8.6 12.6 16.8 10.5 9.5 9.5 Net lending(+) or borrowing(-) vis-à-vis ROW (c) 10.8 13.5 10.7 9.3 8.5 12.4 16.5 10.4 9.3 9.3 General government balance (c) 10.6 11.2 10.8 10.6 10.6 1.0 0.6 0.6 0.5 0.4 Cyclically-adjusted budget balance (c) - - - - - - - - - - Structural budget balance (c) - - - - - - - - - - General government gross debt (c) 43.5 43.7 39.7 36.6 33.2 - - 42.3 41.6 40.7
(a) as % of total labour force. (b) gross saving divided by gross disposable income. (c) as a percentage of GDP.
143
throughout the forecast period, in particular compared with the euro area. This will support private consumption demand's resilience.
Returning to potential growth
The large inventory correction in the fourth quarter implies room for inventories to contribute to GDP in 2012. Moreover, the strong fundamentals of the Swiss economy, the labour market conditions, and improvements in the external environment will all support a return to potential growth towards the end of 2012, as foreign demand should add to domestic forces already in place.
Labour market conditions should not pose a risk to inflation dynamics. Instead, a risk could come from the extraordinary measures the SNB took to stem the appreciation of the Swiss franc. Both deflation, in case of further appreciation, and a jump in the inflation rate are a possibility, although both are rather unlikely. Most probably, developments in capital inflows, a return to more normal monetary policy environment, exchange rate developments and a return to potential growth will cater for a benevolent outcome.
Public finances on a structurally sound footing
The outcome in 2011 for public finances was a small surprise to the upside, notwithstanding some
extraordinary outlays. Revenues have been a positive surprise in the past year but this is expected to wane in 2012. In the case of government expenditure, the determining factor may well prove to be the developments in regional public finances. For 2013, revenues could benefit from a broader tax base as economic growth returns to potential. General government debt is expected to decline further as a consequence of both economic growth and the small surpluses registered.

38. RUSSIAN FEDERATION Growth stabilises at moderate rates
144
GDP growth in 2011 is estimated at 4.3% y-o-y. Economic growth has been increasingly supported by domestic demand (both consumption and investment), while external demand is slowing. Russia's growth outlook is still strongly dependent on international commodity prices. Economic growth is forecast to decelerate from 4.3% in 2011 to 3.6% in 2012 and to edge up to 3.8% in 2013.
Graph II.38.1: Russia- GDP growth
-10
-5
0
5
10
15
01 02 03 04 05 06 07 08 09 10 11 12 13
y-o-y%
forecast
The expansion of domestic demand was a major driver of economic growth in 2010. Growth in consumer spending and investment activity increased in 2011; both are expected to decelerate slightly in 2012. As a result, and in the absence of a more comprehensive growth strategy, GDP growth will remain relatively subdued. Exports accelerated in 2010, but the sluggish expansion in the oil and gas sector (where some existing fields are almost depleted), combined with the negative demand effects of the euro-area sovereign-debt crisis, are likely to limit export volume growth to around 3.5-4.5% per year in 2012 and 2013. In the second half of 2011 higher agricultural output partially boosted exports. Imports continued to grow strongly due to the strengthening of domestic demand in 2011. A deceleration in the growth of imports is expected in 2012 as domestic demand turns out more weakly. High energy prices for 2011 are the main reason behind the strong current-account surplus (5.7% of GDP). Overall, the current-account surplus is expected to decrease to 4.5% of GDP in 2012 and to 4.1% of GDP in 2013. The labour market situation is improving slightly. The unemployment rate started to edge down in 2010. In 2011 the unemployment rate declined to 6.6% and it is expected to moderate to 6.2% in 2012 and to 6.0% in 2013, returning to
pre-crisis levels on the back of a reduction in the unemployment gap between rural and urban areas and between men and women.
Inflation continues to slow down
Inflation picked up to almost 10% by January 2011, mostly due to higher food prices following widespread damage to crops caused by forest fires in August 2010.(42) CPI moderated to 7.4% on average in the second half of 2011, slowing down from 9.5% on average in the first half of 2011. CPI continued to moderate in the first months of 2012, reaching 4.2% in January, and 3.7% in February and March. This downward trend was largely driven by lower food prices, following a very good harvest in summer 2011.
Graph II.38.2: Russia - Consumer Price Index
2
4
6
8
10
12
14
16
06 07 08 09 10 11 12
y-o-y %
Inflation is expected to remain exceptionally low in the first half of 2012, also because the usual revision in state-regulated energy retail tariffs will take place on 1 July instead of the first day of the year (the recent presidential election played a role in this choice). Therefore, CPI is expected to rise in the second half of 2012, after the revision takes place. Annual average inflation is foreseen to decelerate to 6.5% in 2012 from 8.4% in 2011 and to edge up to 6.8% in 2013.
Widening floating band of the rouble
The Central Bank of Russia (CBR) manages the rouble against a USD/EUR basket made up of 55 cents of a USD and 45 cents of a EUR. The rouble appreciated in the first half of 2011 as a result of (42) Food prices represent about 40% of the CPI basket in
Russia.
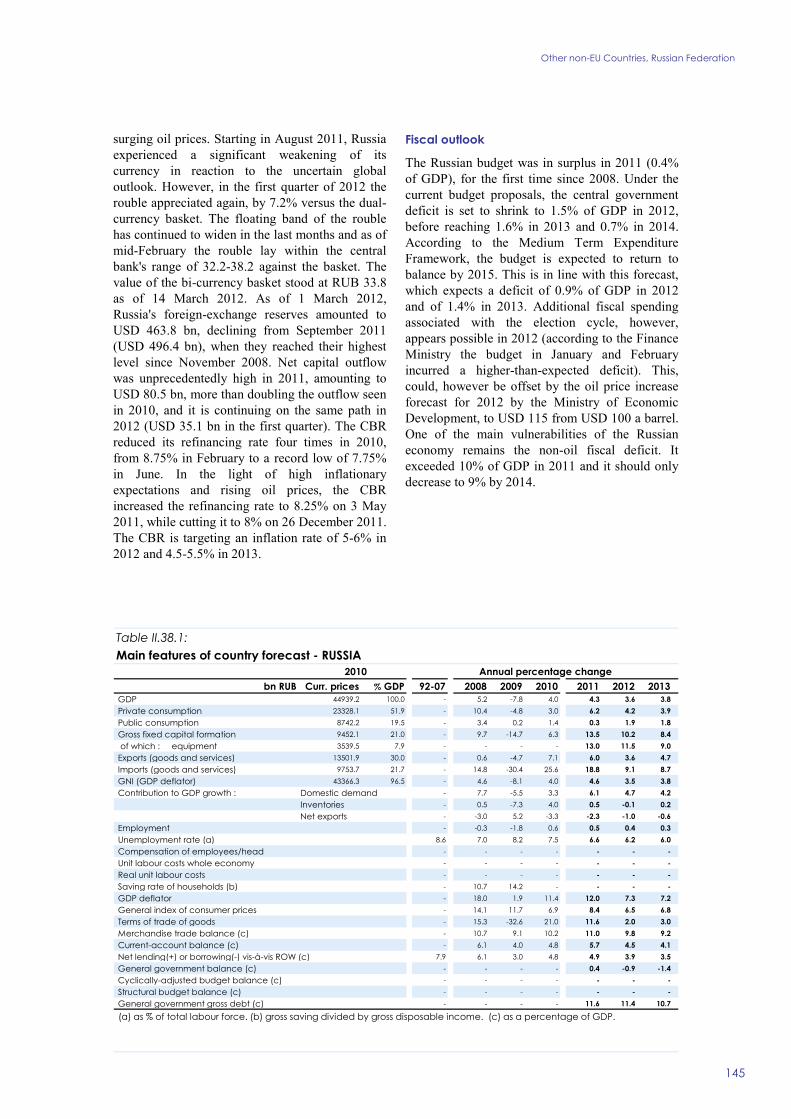
Other non-EU Countries, Russian Federation
Table II.38.1:Main features of country forecast - RUSSIA
2010 Annual percentage changebn RUB Curr. prices % GDP 92-07 2008 2009 2010 2011 2012 2013
GDP 44939.2 100.0 - 5.2 -7.8 4.0 4.3 3.6 3.8 Private consumption 23328.1 51.9 - 10.4 -4.8 3.0 6.2 4.2 3.9 Public consumption 8742.2 19.5 - 3.4 0.2 1.4 0.3 1.9 1.8 Gross fixed capital formation 9452.1 21.0 - 9.7 -14.7 6.3 13.5 10.2 8.4 of which : equipment 3539.5 7.9 - - - - 13.0 11.5 9.0 Exports (goods and services) 13501.9 30.0 - 0.6 -4.7 7.1 6.0 3.6 4.7 Imports (goods and services) 9753.7 21.7 - 14.8 -30.4 25.6 18.8 9.1 8.7 GNI (GDP deflator) 43366.3 96.5 - 4.6 -8.1 4.0 4.6 3.5 3.8 Contribution to GDP growth : Domestic demand - 7.7 -5.5 3.3 6.1 4.7 4.2
Inventories - 0.5 -7.3 4.0 0.5 -0.1 0.2Net exports - -3.0 5.2 -3.3 -2.3 -1.0 -0.6
Employment - -0.3 -1.8 0.6 0.5 0.4 0.3 Unemployment rate (a) 8.6 7.0 8.2 7.5 6.6 6.2 6.0 Compensation of employees/head - - - - - - - Unit labour costs whole economy - - - - - - - Real unit labour costs - - - - - - - Saving rate of households (b) - 10.7 14.2 - - - - GDP deflator - 18.0 1.9 11.4 12.0 7.3 7.2 General index of consumer prices - 14.1 11.7 6.9 8.4 6.5 6.8 Terms of trade of goods - 15.3 -32.6 21.0 11.6 2.0 3.0 Merchandise trade balance (c) - 10.7 9.1 10.2 11.0 9.8 9.2 Current-account balance (c) - 6.1 4.0 4.8 5.7 4.5 4.1 Net lending(+) or borrowing(-) vis-à-vis ROW (c) 7.9 6.1 3.0 4.8 4.9 3.9 3.5 General government balance (c) - - - - 0.4 -0.9 -1.4 Cyclically-adjusted budget balance (c) - - - - - - - Structural budget balance (c) - - - - - - - General government gross debt (c) - - - - 11.6 11.4 10.7
(a) as % of total labour force. (b) gross saving divided by gross disposable income. (c) as a percentage of GDP.
145
surging oil prices. Starting in August 2011, Russia experienced a significant weakening of its currency in reaction to the uncertain global outlook. However, in the first quarter of 2012 the rouble appreciated again, by 7.2% versus the dual-currency basket. The floating band of the rouble has continued to widen in the last months and as of mid-February the rouble lay within the central bank's range of 32.2-38.2 against the basket. The value of the bi-currency basket stood at RUB 33.8 as of 14 March 2012. As of 1 March 2012, Russia's foreign-exchange reserves amounted to USD 463.8 bn, declining from September 2011 (USD 496.4 bn), when they reached their highest level since November 2008. Net capital outflow was unprecedentedly high in 2011, amounting to USD 80.5 bn, more than doubling the outflow seen in 2010, and it is continuing on the same path in 2012 (USD 35.1 bn in the first quarter). The CBR reduced its refinancing rate four times in 2010, from 8.75% in February to a record low of 7.75% in June. In the light of high inflationary expectations and rising oil prices, the CBR increased the refinancing rate to 8.25% on 3 May 2011, while cutting it to 8% on 26 December 2011. The CBR is targeting an inflation rate of 5-6% in 2012 and 4.5-5.5% in 2013.
Fiscal outlook
The Russian budget was in surplus in 2011 (0.4% of GDP), for the first time since 2008. Under the current budget proposals, the central government deficit is set to shrink to 1.5% of GDP in 2012, before reaching 1.6% in 2013 and 0.7% in 2014. According to the Medium Term Expenditure Framework, the budget is expected to return to balance by 2015. This is in line with this forecast, which expects a deficit of 0.9% of GDP in 2012 and of 1.4% in 2013. Additional fiscal spending associated with the election cycle, however, appears possible in 2012 (according to the Finance Ministry the budget in January and February incurred a higher-than-expected deficit). This, could, however be offset by the oil price increase forecast for 2012 by the Ministry of Economic Development, to USD 115 from USD 100 a barrel. One of the main vulnerabilities of the Russian economy remains the non-oil fiscal deficit. It exceeded 10% of GDP in 2011 and it should only decrease to 9% by 2014.


ACKNOWLEDGEMENTS
147
This report was prepared in the Directorate-General for Economic and Financial Affairs under the direction of Marco Buti, Director-General, Servaas Deroose, Deputy Director-General, and Elena Flores Gual, Director "Policy strategy and co-ordination". Executive responsibilities were attached to Björn Döhring, Acting Head of Unit for "Forecasts and economic situation" and the forecast coordinators Laura González Cabanillas and Michał Narożny. The Overview was prepared by Michael Sket. Chapter 1 on "The EU economy: from recession towards a slow recovery" was prepared by Oliver Dieckmann under the responsibility of Elena Flores Gual and Björn Döhring. This chapter benefited from contributions by Paolo Biraschi, Malgorzata Galar, Laura González Cabanillas, Michał Narożny, Daniela Porubská, Michael Sket and Ann-Louise Winther. Boxes were contributed by Gerrit Bethuyne, Luis Fau Sebastian, Jan in 't Veld, Robert Kuenzel, Júlia Lendvai, Werner Röger, Eric Ruscher, Sara Tägtström, János Varga, Lukas Vogel and Przemysław Woźniak. The sections on "Member States" were prepared under the supervision of Jürgen Kröger, Matthias Mors and István Pál Székely, Directors for the "Economies of the Member States". These sections benefited from contributions by Jean-Luc Annaert, Pasquale D'Apice, Davide Balestra, Narcissa Balta, Paolo Battaglia, Barbara Bernardi, Piotr Bogumił, Raphaël Cance, Mateo Capó Servera, Jakob Christensen, Anna Dimitríjevics, Fotini Dionyssopoulou, Christophe Doin, Gatis Eglitis, Shane Enright, Riccardo Ercoli, Leila Fernandez Stembridge, Miroslav Florián, Olivia Galgau, Julien Genet, Michael Grams, Oskar Grevesmühl, Zoltán Gyenes, Peter Harvan, László Jankovics, Alexandra Janovskaia, Javier Jareño Morago, Markita Kamerta, Julda Kielyte, Mitja Košmrl, Bozhil Kostov, Radoslav Krastev, Bettina Kromen, Stefan Kuhnert, Baudouin Lamine, Milan Lisický, Erki Lohmuste, Davide Lombardo, Natalie Lubenets, Mart Maivali, Janis Malzubris, Anton Mangov, Helena Marrez, Renata Mata Dona, Dan Matei, Fabrizio Melcarne, Olivia Mollen, Daniel Monteiro, Marco Montanari, Magdalena Morgese Borys, Manuel Palazuelos Martínez, Christos Paschalides, Presyian Petkov, Nicolas Philiponnet, Bartosz Przywara, Alexandra Putinelu, Vito Ernesto Reitano, An Renckens, Monika Sherwood, Louise Skouby, Peeter Soidla, Vladimír Solanič, Alina Tanasa, Ingrid Toming, Mariana Tomova, Tsvetan Tsalinski, Thomas Usher, Henk Van Noten, Samuel Whittaker, Rafał Wielądek and Pavlína Žáková. Coordination and editorial support was provided by Martin Larch, Head of Unit "Coordination of country-specific policy surveillance" and Jost Angerer, Gerrit Bethuyne, Jörn Griesse, Jakub Koniecki and Barbara Stearns-Bläsing. The sections on "Candidate Countries" and "Other non-EU countries" were prepared under the supervision of Peter Bekx, Director of the "International economic and financial relations, global governance". These sections, and forecasts for all other non-EU economies, benefited from contributions by Bernhard Böhm, Nicola Costa, Hans Feddersen, Oscar Gomez Lacalle, Michael Horgan, Tim Kaiser, Plamen Kaloyanchev, Neil Kay, Willem Kooi, Stefan Kramer, Roberto Paulo Lieto, Antonio Sanchez Pareja, Uwe Stamm, Dirk Verbeken, Rupert Willis and Przemysław Woźniak
Editorial support by Chris Maxwell is gratefully acknowledged. Support on the communication and publication of this report by Lisbeth Ekelöf, Robert Gangl, Dominique Marchalant, Jens Matthiessen, Chris Maxwell, Irena Novakova, Sarka Novotna, Yasmina Quertinmont and Roman Schönwiesner is gratefully acknowledged. IT support was provided by Marius Bold, Françoise Demarliere, Hubert Droulez, Rudy Druine, Jeanette Fokkens, Sylvain Lefin and Frédéric Petre.

148
Follow-up calculations were performed by Cécile Denis, Karel Havik, Kieran Mc Morrow, Fabrice Orlandi, Rafał Raciborski and Werner Röger. Forecast assumptions were prepared by Chris Bosma, Roberta Friz, Sara Tägtström, Przemysław Woźniak and Alexandru Zeana. Statistical and layout assistance was provided by Antoine Avdoulos, Yves Bouquiaux, Myrle Claessens, Eulalia Claros Gimeno, Noël Doyle, Andrzej Erdmann, Julien Genet, Michel Gerday, Justyna Gniadzik, Oscar Gomez Lacalle, Jan Kattevilder, Johann Korner, Adam Kowalski, Anders Lindqvist, Fabrizio Melcarne, Christiaan Muller, Daniela Porubská, Mariola Przygoda, Emilio Rodriguez Castro, Jacek Szelożyński, Alessio Terzi, Windy Vandevyvere, Carmela Zammit and Christos Zavos.
Valuable comments and suggestions by Ronald Albers, Laura Bardone, Moreno Bertoldi, Gerrit Bethuyne, Andreas Breitenfellner, Georg Busch, Oliver Dieckmann, Patrick D'Souza, Malgorzata Galar, Carole Garnier, Gabriele Giudice, Laura González Cabanillas, Peter Grasmann, Heinz Jansen, Barbara Kauffmann, Joost Kuhlmann, Paul Kutos, Sven Langedijk, Martin Larch, Raul de Luzenberger, Mary McCarthy, Michał Narożny, João Nogueira Martins, Lucio Pench, Karl Pichelmann, Elena Reitano, Michael Sket, Michael Stierle, Charlotte Van Hooydonk, Jan in 't Veld, Christian Weise, Ann-Louise Winther, Norbert Wunner and Javier Yaniz Igal are gratefully acknowledged. Secretarial support for the finalisation of this report was provided by Anita Janicka and Els Varblane. Comments on the report would be gratefully received and should be sent to: Directorate-General for Economic and Financial Affairs Unit A4: Forecast and Economic Situation European Commission B-1049 Brussels E-mail: [email protected]

Statistical Annex European Economic Forecast – Spring 2012

Contents
150
Output : GDP and its components 1. Gross domestic product 152 2. Profiles (q-o-q) of quarterly GDP 152 3. Profiles (y-o-y) of quarterly GDP 153 4. GDP per capita 153 5. Final domestic demand 154 6. Final demand 154 7. Private consumption expenditure 155 8. Government consumption expenditure 155 9. Total investment 156 10. Investment in construction 156 11. Investment in equipment 157 12. Public investment 157 13. Output gap relative to potential GDP 158
Prices 14. Deflator of GDP 158 15. Deflator of private consumption 159 16. Consumer prices index 159 17. Consumer prices quarterly profiles 160 18. Deflator of exports of goods 160 19. Deflator of imports of goods 161 20. Terms of trade of goods 161
Wages, population and labour market 21. Total population 162 22. Total employment 162 23. Unemployment rate 163 24. Compensation of employees per head 163 25. Real compensation of employees per head 164 26. Labour productivity 164 27. Unit labour costs, whole economy 165 28. Real unit labour costs 165
Exchange rates 29. Nominal bilateral exchange rates 166 30. Nominal effective exchange rates 166 31. Relative unit labour costs 167 32. Real effective exchange rates 167

Statistical Annex
151
General Government 33. Total expenditure 168 34. Total revenue 168 35. Net lending (+) or net borrowing (-) 169 36. Interest expenditure 169 37. Primary balance 170 38. Cyclically-adjusted net lending (+) or net borrowing (-) 170 39. Cyclically-adjusted primary balance 171 40. Gross debt 171
Saving 41. Gross national saving 172 42. Gross saving of the private sector 172 43. Saving rate of households 173 44. Gross saving of general government 173
Trade and international payments 45. Exports of goods and services 174 46. Imports of goods and services 174 47. Merchandise trade balance (% of GDP) 175 48. Current-account balance (% of GDP) 175 49. Net lending (+) or net borrowing (-) 176 50. Current-account balance (bn EUR) 176 51. Export markets (goods and services) 177 52. Export performance (goods and services) 177
World economy 53. World GDP 178 54. World exports of goods and services 179 55. Export shares (goods) in EU trade 179 56. World imports of goods and services 180 57. Import shares (goods) in EU trade 180 58. World merchandise trade balances (bn USD) 181 59. World current-account balances (bn USD) 181 60. Primary commodity prices 181

European Economic Forecast, Spring 2012
152
TABLE 1 : Gross domestic product, volume (percentage change on preceding year, 1992-2013) 26.04.20125-year Spring 2012 Autumn 2011
averages forecast forecast1992-96 1997-01 2002-06 2007 2008 2009 2010 2011 2012 2013 2012 2013
Belgium 1.5 2.7 2.0 2.9 1.0 -2.8 2.3 1.9 0.0 1.2 0.9 1.5 Germany 1.2 2.0 1.0 3.3 1.1 -5.1 3.7 3.0 0.7 1.7 0.8 1.5 Estonia : 6.8 7.9 7.5 -3.7 -14.3 2.3 7.6 1.6 3.8 3.2 4.0 Ireland 6.5 8.5 5.0 5.2 -3.0 -7.0 -0.4 0.7 0.5 1.9 1.1 2.3 Greece 1.1 3.8 4.3 3.0 -0.2 -3.3 -3.5 -6.9 -4.7 0.0 -2.8 0.7 Spain 1.5 4.4 3.3 3.5 0.9 -3.7 -0.1 0.7 -1.8 -0.3 0.7 1.4 France 1.2 2.9 1.7 2.3 -0.1 -2.7 1.5 1.7 0.5 1.3 0.6 1.4 Italy 1.2 2.1 1.0 1.7 -1.2 -5.5 1.8 0.4 -1.4 0.4 0.1 0.7 Cyprus 5.5 4.2 3.2 5.1 3.6 -1.9 1.1 0.5 -0.8 0.3 0.0 1.8 Luxembourg 2.6 6.3 4.1 6.6 0.8 -5.3 2.7 1.6 1.1 2.1 1.0 2.3 Malta 5.0 3.4 1.8 4.3 4.1 -2.7 2.3 2.1 1.2 1.9 1.3 2.0 Netherlands 2.5 3.7 1.6 3.9 1.8 -3.5 1.7 1.2 -0.9 0.7 0.5 1.3 Austria 2.0 2.8 2.2 3.7 1.4 -3.8 2.3 3.1 0.8 1.7 0.9 1.9 Portugal 2.0 3.9 0.7 2.4 0.0 -2.9 1.4 -1.6 -3.3 0.3 -3.0 1.1 Slovenia 2.0 4.2 4.2 6.9 3.6 -8.0 1.4 -0.2 -1.4 0.7 1.0 1.5 Slovakia : 2.7 5.9 10.5 5.8 -4.9 4.2 3.3 1.8 2.9 1.1 2.9 Finland 1.3 4.5 3.1 5.3 0.3 -8.4 3.7 2.9 0.8 1.6 1.4 1.7 Euro area 1.5 2.8 1.8 3.0 0.4 -4.3 1.9 1.5 -0.3 1.0 0.5 1.3 Bulgaria -2.8 2.5 6.0 6.4 6.2 -5.5 0.4 1.7 0.5 1.9 2.3 3.0 Czech Republic 2.4 1.6 4.9 5.7 3.1 -4.7 2.7 1.7 0.0 1.5 0.7 1.7 Denmark 2.6 2.4 1.8 1.6 -0.8 -5.8 1.3 1.0 1.1 1.4 1.4 1.7 Latvia -8.8 6.0 9.0 9.6 -3.3 -17.7 -0.3 5.5 2.2 3.6 2.5 4.0 Lithuania -8.3 4.8 8.0 9.8 2.9 -14.8 1.4 5.9 2.4 3.5 3.4 3.8 Hungary 0.4 3.7 4.2 0.1 0.9 -6.8 1.3 1.7 -0.3 1.0 0.5 1.4 Poland 4.9 4.4 4.1 6.8 5.1 1.6 3.9 4.3 2.7 2.6 2.5 2.8 Romania 1.3 -0.1 6.2 6.3 7.3 -6.6 -1.6 2.5 1.4 2.9 2.1 3.4 Sweden 1.2 3.4 3.3 3.3 -0.6 -5.0 6.1 3.9 0.3 2.1 1.4 2.1 United Kingdom 2.5 3.7 2.8 3.5 -1.1 -4.4 2.1 0.7 0.5 1.7 0.6 1.5 EU 1.3 3.0 2.1 3.2 0.3 -4.3 2.0 1.5 0.0 1.3 0.6 1.5 Croatia : 2.9 4.7 5.1 2.2 -6.0 -1.2 0.0 -1.2 0.8 0.8 1.2 USA 3.3 3.8 2.7 1.9 -0.4 -3.5 3.0 1.7 2.0 2.1 1.5 1.3 Japan 1.3 0.4 1.5 2.2 -1.0 -5.5 4.4 -0.7 1.9 1.7 1.8 1.0
TABLE 2 : Profiles (qoq) of quarterly GDP, volume (percentage change from previous quarter, 2011-2013)
2011/1 2011/2 2011/3 2011/4 2012/1 2012/2 2012/3 2012/4 2013/1 2013/2 2013/3 2013/4 Belgium 0.9 0.3 -0.1 -0.1 0.0 0.1 0.1 0.3 0.4 0.4 0.4 0.4 Germany 1.3 0.3 0.6 -0.2 0.0 0.3 0.5 0.4 0.4 0.4 0.4 0.4 Estonia 2.8 1.6 0.9 -0.2 0.5 0.0 0.6 0.6 1.0 1.2 1.5 1.5 Ireland 1.1 1.1 -1.1 -0.2 : : : : : : : : Greece : : : : : : : : : : : : Spain 0.4 0.2 0.0 -0.3 -0.3 -0.6 -1.1 -1.1 0.5 0.4 0.4 0.4 France 0.9 0.0 0.3 0.2 0.0 0.0 0.2 0.2 0.4 0.4 0.4 0.5 Italy 0.1 0.3 -0.2 -0.7 -0.7 -0.4 0.0 0.1 0.1 0.2 0.2 0.2 Cyprus 0.2 0.0 -0.8 -0.1 -0.6 -0.8 0.9 1.7 -0.8 -0.6 0.0 0.1 Luxembourg 0.2 -0.6 1.0 0.2 0.0 0.2 0.4 0.5 0.6 0.5 0.5 0.5 Malta 0.1 0.4 0.1 -0.6 : : : : : : : : Netherlands 0.7 0.2 -0.4 -0.6 -0.1 -0.2 0.0 0.2 0.2 0.3 0.3 0.4 Austria 0.8 0.5 0.2 -0.1 0.1 0.1 0.6 0.7 0.5 0.3 0.3 0.3 Portugal -0.7 -0.3 -0.6 -1.3 -1.0 -0.5 -0.6 -0.7 0.6 0.4 0.5 0.5 Slovenia -0.3 -0.1 -0.4 -0.7 -0.5 -0.2 0.1 0.1 0.2 0.3 0.4 0.4 Slovakia 0.8 0.8 0.8 0.9 0.2 0.2 0.2 0.3 0.8 1.0 1.1 1.2 Finland 0.3 -0.1 1.1 0.1 0.0 0.0 0.2 0.5 0.6 0.4 0.2 0.7 Euro area 0.7 0.1 0.1 -0.3 -0.2 -0.1 0.1 0.1 0.4 0.4 0.4 0.4 Bulgaria 0.5 0.5 0.2 0.3 -0.2 0.0 0.4 0.2 0.3 0.7 1.0 0.8 Czech Republic 0.5 0.3 -0.1 -0.1 -0.1 0.1 0.1 0.2 0.4 0.4 0.7 0.8 Denmark 0.3 0.4 -0.1 -0.1 0.3 0.2 0.4 0.5 0.3 0.3 0.4 0.4 Latvia 1.1 2.0 1.5 1.1 0.0 0.1 0.3 0.6 1.1 1.2 1.2 1.3 Lithuania 1.4 1.7 1.3 1.0 0.2 0.1 0.3 0.5 0.9 1.2 1.2 1.2 Hungary 0.7 0.1 0.4 0.3 -0.5 -0.4 -0.2 0.0 0.3 0.3 0.7 1.0 Poland 1.1 1.2 1.0 1.1 0.5 0.4 0.4 0.5 0.7 0.7 0.8 1.0 Romania 1.1 0.2 1.1 -0.2 -0.3 0.1 0.9 0.7 0.5 0.5 1.2 0.7 Sweden 0.4 1.1 0.9 -1.1 0.3 0.5 0.5 0.5 0.5 0.6 0.6 0.6 United Kingdom 0.2 -0.1 0.6 -0.3 -0.2 0.4 0.6 0.4 0.4 0.4 0.5 0.6 EU 0.6 0.2 0.3 -0.3 -0.1 0.0 0.2 0.2 0.4 0.4 0.4 0.5 Croatia : : : : : : : : : : : : USA 0.1 0.3 0.5 0.7 0.5 0.4 0.4 0.5 0.6 0.5 0.5 0.6 Japan -1.8 -0.3 1.7 -0.2 -0.1 0.3 0.2 0.5 0.7 0.4 0.2 0.2

Statistical Annex
153
TABLE 3 : Profiles (yoy) of quarterly GDP, volume (percentage change from corresponding quarter in previous year, 2011-2013) 26.04.2012
2011/1 2011/2 2011/3 2011/4 2012/1 2012/2 2012/3 2012/4 2013/1 2013/2 2013/3 2013/4 Belgium 2.9 2.1 1.6 1.0 0.1 -0.2 0.0 0.4 0.8 1.1 1.5 1.6 Germany 4.6 2.9 2.7 2.0 0.7 0.8 0.7 1.3 1.7 1.8 1.8 1.8 Estonia 9.4 8.2 8.0 5.1 2.8 1.2 0.9 1.7 2.2 3.4 4.3 5.3 Ireland -0.1 1.8 0.1 1.0 : : : : : : : : Greece : : : : : : : : : : : : Spain 0.9 0.8 0.8 0.3 -0.4 -1.3 -2.3 -3.1 -2.3 -1.2 0.3 1.9 France 2.3 1.7 1.6 1.3 0.5 0.6 0.5 0.5 0.9 1.2 1.5 1.8 Italy 1.2 1.0 0.4 -0.4 -1.3 -2.0 -1.7 -1.0 -0.1 0.5 0.7 0.8 Cyprus 1.5 1.4 -0.3 -0.7 -1.5 -2.2 -0.6 1.2 1.0 1.2 0.3 -1.2 Luxembourg 2.8 0.7 1.9 0.8 0.6 1.4 0.8 1.1 1.7 2.0 2.1 2.1 Malta 2.8 3.0 2.5 0.0 : : : : : : : : Netherlands 2.2 1.8 1.2 -0.2 -0.9 -1.3 -1.0 -0.2 0.1 0.6 1.0 1.2 Austria 4.2 3.9 2.6 1.4 0.7 0.3 0.7 1.5 1.9 2.1 1.9 1.5 Portugal -0.6 -1.1 -1.9 -2.8 -3.2 -3.3 -3.3 -2.7 -1.2 -0.4 0.7 1.9 Slovenia 1.8 0.6 -0.2 -1.5 -1.7 -1.8 -1.4 -0.6 0.1 0.6 0.9 1.2 Slovakia 3.4 3.4 3.2 3.4 2.8 2.1 1.5 1.0 1.5 2.4 3.3 4.2 Finland 5.2 1.8 3.2 1.4 1.1 1.1 0.3 0.6 1.2 1.7 1.7 1.9 Euro area 2.4 1.6 1.3 0.7 -0.3 -0.4 -0.4 0.0 0.5 1.0 1.3 1.6 Bulgaria 3.2 2.2 1.6 1.6 0.8 0.3 0.5 0.4 0.9 1.6 2.2 2.8 Czech Republic 2.7 2.1 1.3 0.6 0.0 -0.2 0.0 0.3 0.8 1.1 1.7 2.4 Denmark 2.1 1.4 0.0 0.5 0.5 0.4 0.9 1.5 1.4 1.5 1.4 1.2 Latvia 3.2 5.2 5.9 5.9 4.7 2.7 1.5 1.0 2.1 3.2 4.2 4.9 Lithuania 5.4 6.4 6.7 5.4 4.3 2.6 1.6 1.1 1.9 3.0 4.0 4.7 Hungary 2.1 1.7 1.5 1.5 0.3 -0.2 -0.8 -1.1 -0.4 0.3 1.3 2.2 Poland 4.5 4.5 4.2 4.4 3.8 3.0 2.4 1.7 2.0 2.3 2.7 3.3 Romania 1.6 1.4 3.4 2.2 0.8 0.7 0.5 1.4 2.2 2.6 2.9 2.9 Sweden 5.8 4.8 4.4 1.2 1.2 0.5 0.1 1.8 2.1 2.2 2.2 2.3 United Kingdom 1.5 0.4 0.3 0.5 0.0 0.4 0.4 1.1 1.7 1.7 1.7 1.8 EU 2.4 1.6 1.4 0.8 0.1 -0.1 -0.2 0.3 0.8 1.2 1.4 1.7 Croatia : : : : : : : : : : : : USA 2.2 1.6 1.5 1.6 2.0 2.1 2.0 1.8 1.9 2.1 2.1 2.2 Japan -0.1 -1.7 -0.5 -0.6 1.1 1.7 0.2 0.9 1.7 1.8 1.8 1.6
TABLE 4 : Gross domestic product per capita (percentage change on preceding year, 1992-2013)5-year Spring 2012 Autumn 2011
averages forecast forecast1992-96 1997-01 2002-06 2007 2008 2009 2010 2011 2012 2013 2012 2013
Belgium 1.2 2.5 1.5 2.1 0.1 -3.6 1.4 1.0 -0.8 0.4 0.1 0.7 Germany 0.7 1.9 1.0 3.4 1.3 -4.8 3.8 3.0 0.6 1.6 0.9 1.6 Estonia : 7.7 8.3 7.7 -3.6 -14.2 2.3 7.6 1.7 3.8 3.2 4.0 Ireland 5.9 7.2 3.0 2.7 -4.7 -7.5 -0.6 0.5 0.2 1.2 0.6 1.6 Greece 0.2 3.4 3.9 2.6 -0.5 -3.6 -3.7 -6.9 -5.1 -0.4 -3.0 0.5 Spain 1.3 3.7 1.7 1.6 -0.7 -4.4 -0.4 0.6 -1.7 -0.3 0.7 1.5 France 0.8 2.3 1.0 1.7 -0.6 -3.3 0.9 1.1 -0.1 0.8 0.0 0.9 Italy 1.2 2.0 0.4 0.9 -1.9 -6.1 1.3 0.0 -1.9 0.0 -0.3 0.4 Cyprus 3.3 3.0 1.3 3.6 2.4 -2.7 0.7 -0.3 -1.6 -0.5 -0.6 1.2 Luxembourg 1.2 5.0 2.7 4.9 -1.0 -7.1 0.8 -0.7 -0.7 0.4 -0.5 0.9 Malta 4.1 2.7 1.1 3.6 3.3 -3.1 1.8 1.4 0.7 1.5 0.8 1.5 Netherlands 1.9 3.1 1.2 3.7 1.4 -4.0 1.2 0.7 -1.4 0.2 0.3 1.0 Austria 1.5 2.6 1.7 3.3 1.0 -4.1 2.0 2.8 0.5 1.3 0.6 1.6 Portugal 1.8 3.4 0.2 2.1 -0.1 -3.0 1.4 -1.7 -3.3 0.2 -3.0 1.2 Slovenia 2.1 4.2 4.0 6.3 3.4 -8.9 1.0 -0.4 -1.6 0.5 0.8 1.2 Slovakia : 2.7 5.8 10.4 5.6 -5.1 3.9 3.3 1.7 2.8 1.0 2.8 Finland 0.9 4.3 2.7 4.9 -0.2 -8.8 3.3 2.4 0.3 1.3 0.9 1.2 Euro area 1.1 2.5 1.2 2.4 -0.2 -4.7 1.6 1.2 -0.6 0.8 0.3 1.1 Bulgaria -2.2 3.6 6.5 7.0 6.7 -5.0 1.1 2.7 1.5 3.0 3.1 3.7 Czech Republic 2.4 1.7 4.8 5.2 2.0 -5.3 2.5 1.4 -0.3 1.2 0.3 1.4 Denmark 2.2 2.1 1.5 1.2 -1.4 -6.3 0.9 0.7 0.9 1.1 1.1 1.4 Latvia -7.4 6.9 9.6 10.2 -2.8 -17.3 0.4 6.3 2.9 4.3 3.2 4.7 Lithuania -7.8 5.5 8.6 10.4 3.4 -14.4 3.1 8.0 3.2 4.0 4.2 4.4 Hungary 0.5 3.9 4.4 0.3 1.1 -6.7 1.5 2.0 -0.2 1.1 0.8 1.7 Poland 4.7 4.4 4.2 6.8 5.1 1.5 3.8 4.4 2.8 2.6 2.5 2.8 Romania 1.6 0.1 7.0 6.5 7.5 -6.4 -1.5 2.9 1.6 3.1 2.3 3.6 Sweden 0.7 3.3 2.9 2.6 -1.4 -5.8 5.2 3.2 -0.4 1.4 0.7 1.4 United Kingdom 2.3 3.3 2.3 2.8 -1.8 -5.0 1.3 -0.1 -0.2 1.1 -0.1 0.9 EU 1.1 2.7 1.7 2.7 -0.1 -4.6 1.8 1.3 -0.3 1.0 0.4 1.3 Croatia : 3.5 4.7 5.1 2.2 -5.9 -0.9 0.0 -1.2 0.8 0.8 1.2 USA 2.1 2.6 1.8 0.9 -1.3 -4.4 2.2 1.0 1.2 1.3 0.7 0.5 Japan 1.0 0.2 1.4 2.2 -1.0 -5.4 4.0 -0.6 2.0 1.8 1.9 1.1

European Economic Forecast, Spring 2012
154
TABLE 5 : Domestic demand, volume (percentage change on preceding year, 1992-2013) 26.04.20125-year Spring 2012 Autumn 2011
averages forecast forecast1992-96 1997-01 2002-06 2007 2008 2009 2010 2011 2012 2013 2012 2013
Belgium 1.4 2.2 1.7 3.1 2.0 -2.4 1.2 1.9 0.2 1.1 0.9 1.3 Germany 1.2 1.6 0.2 1.9 1.3 -2.6 2.4 2.3 1.0 2.0 1.5 1.8 Estonia : 6.5 11.4 9.2 -9.5 -22.3 0.3 11.0 2.5 4.0 4.0 4.3 Ireland 4.5 8.1 5.6 4.7 -4.3 -12.7 -4.9 -3.0 -2.5 -0.3 -0.9 0.4 Greece 1.2 4.3 4.1 5.7 0.3 -5.5 -5.9 -8.6 -6.4 -1.6 -5.0 -0.8 Spain 0.8 5.0 4.4 4.1 -0.5 -6.2 -1.0 -1.7 -4.4 -2.1 0.0 1.0 France 0.8 2.9 2.0 3.2 0.3 -2.5 1.4 1.7 0.2 1.3 0.6 1.5 Italy 0.1 2.6 1.3 1.4 -1.2 -4.4 2.1 -0.9 -2.9 -0.1 -0.4 0.4 Cyprus : 3.5 4.4 8.8 8.0 -7.0 1.9 -3.3 -2.4 0.3 0.1 1.2 Luxembourg 1.6 5.9 2.7 5.9 2.8 -5.1 5.9 4.4 2.6 2.3 0.9 2.5 Malta : 1.4 2.8 0.9 3.0 -3.7 -1.4 -0.1 0.7 1.3 0.7 1.5 Netherlands 2.1 3.9 1.2 3.2 2.0 -3.1 0.9 0.8 -1.9 0.0 -0.6 0.8 Austria 2.0 1.8 1.5 2.5 0.9 -3.0 2.0 4.0 0.4 1.4 0.8 1.8 Portugal 2.3 4.7 0.6 2.0 0.8 -3.3 0.8 -5.7 -6.6 -0.8 -6.3 -0.7 Slovenia 5.2 4.2 4.0 8.9 4.1 -10.0 -0.1 -1.6 -2.8 -0.2 0.6 1.6 Slovakia : 2.5 4.8 6.3 5.7 -7.0 4.1 -1.5 1.4 2.3 0.4 1.9 Finland 0.2 3.7 3.0 4.7 0.7 -6.1 3.1 4.3 0.9 1.3 1.4 1.7 Euro area 1.1 2.8 1.7 2.8 0.3 -3.8 1.2 0.5 -1.1 0.7 0.3 1.2 Bulgaria : 6.4 8.2 8.8 6.5 -12.8 -4.8 -0.6 0.0 2.2 2.2 3.2 Czech Republic 6.2 0.9 3.6 6.6 2.2 -5.6 1.9 -1.0 -1.0 0.9 0.0 1.5 Denmark 2.9 2.2 2.9 2.3 -0.9 -6.7 1.3 -0.1 1.9 1.5 1.7 2.2 Latvia : 6.6 11.2 12.9 -9.1 -27.4 0.1 10.2 2.8 4.6 3.4 5.1 Lithuania : 5.4 9.6 13.9 3.2 -24.7 1.6 5.3 2.6 3.8 3.4 4.3 Hungary 0.4 4.1 4.0 -1.4 0.7 -10.5 -0.5 -0.5 -2.0 -0.3 -0.8 0.7 Poland 5.4 4.5 3.9 8.7 5.6 -1.1 4.6 3.7 1.9 2.2 1.8 2.6 Romania 1.1 1.5 9.0 14.2 7.3 -12.0 -1.5 3.1 1.9 3.8 2.2 4.6 Sweden 0.1 2.8 2.5 4.6 0.0 -4.6 6.2 3.4 0.6 1.8 1.1 1.8 United Kingdom 2.3 4.4 3.0 3.5 -1.7 -5.4 2.9 -0.8 -0.1 0.8 -0.3 0.5 EU 1.4 3.0 2.1 3.3 0.2 -4.4 1.6 0.5 -0.7 0.8 0.3 1.2 Croatia : 2.9 6.2 6.2 2.6 -8.3 -3.8 -0.6 -1.5 1.6 0.2 1.6 USA 3.5 4.4 3.0 1.2 -1.5 -4.5 3.5 1.7 2.2 2.0 1.6 1.6 Japan 1.5 0.2 0.8 1.1 -1.3 -4.0 2.7 0.1 2.1 1.4 1.6 0.8
TABLE 6 : Final demand, volume (percentage change on preceding year, 1992-2013)5-year Spring 2012 Autumn 2011
averages forecast forecast1992-96 1997-01 2002-06 2007 2008 2009 2010 2011 2012 2013 2012 2013
Belgium 2.5 3.8 2.5 4.0 1.9 -6.2 4.9 3.2 0.5 2.6 1.7 2.9 Germany 1.6 3.1 2.3 3.9 1.7 -6.4 6.0 4.3 1.6 3.1 2.3 3.3 Estonia : 9.3 10.2 7.0 -5.6 -20.8 9.3 17.4 2.0 4.8 3.9 5.1 Ireland 8.3 12.0 5.0 6.7 -2.5 -8.3 0.9 0.9 0.8 2.3 1.8 2.7 Greece 1.6 5.3 3.9 5.9 0.8 -8.0 -4.4 -7.2 -4.7 -0.2 -2.9 0.7 Spain 2.3 5.8 4.3 4.6 -0.6 -7.0 1.8 0.5 -2.7 -0.5 0.8 1.8 France 1.5 3.8 2.2 3.0 0.1 -4.5 3.0 2.3 0.7 2.0 1.2 2.2 Italy 1.3 2.9 1.6 2.5 -1.6 -7.3 4.0 0.5 -2.0 0.9 0.2 1.3 Cyprus : 4.4 3.4 7.9 5.4 -8.1 2.4 -1.4 -1.3 0.9 0.8 2.0 Luxembourg 3.1 8.8 5.8 8.2 3.6 -9.3 3.7 2.5 0.9 3.6 -0.1 4.9 Malta : 2.4 3.8 5.3 2.3 -7.1 7.9 0.5 1.6 3.0 2.4 3.4 Netherlands 3.3 5.5 2.6 4.6 2.0 -5.3 5.2 2.1 -0.8 1.8 1.2 2.5 Austria 2.3 3.9 3.1 4.9 1.1 -7.4 4.2 5.0 1.3 2.8 1.9 3.5 Portugal 3.2 5.0 1.4 3.3 0.6 -5.1 2.5 -2.7 -4.3 0.7 -3.6 1.1 Slovenia 2.7 5.4 5.8 10.8 3.6 -12.8 3.5 1.7 -0.7 2.1 2.1 3.4 Slovakia : 5.5 7.7 9.9 4.5 -11.0 9.3 4.0 2.2 4.1 1.3 4.0 Finland 2.4 5.7 3.9 5.9 2.5 -11.8 4.7 2.6 1.2 2.3 2.0 2.6 Euro area 2.0 4.0 2.6 3.9 0.6 -6.5 4.0 2.2 -0.1 1.9 1.2 2.5 Bulgaria : 5.6 9.1 7.8 5.3 -12.3 1.1 4.2 1.4 3.4 3.2 4.3 Czech Republic 7.4 4.3 6.0 8.5 2.9 -7.4 7.5 4.0 1.0 3.1 1.7 3.9 Denmark 3.1 3.7 3.5 2.5 0.6 -7.8 2.0 2.3 2.4 2.7 2.3 3.1 Latvia : 6.4 10.7 12.1 -6.3 -23.7 3.7 11.0 3.4 5.2 4.2 5.5 Lithuania : 5.9 10.4 10.1 5.9 -20.5 7.1 8.7 3.3 4.7 4.6 5.2 Hungary : 8.2 6.7 5.7 2.9 -10.4 6.1 3.7 1.7 4.0 3.2 4.5 Poland 6.4 5.5 5.6 8.8 6.0 -2.7 6.7 4.8 2.4 3.3 2.8 3.5 Romania 0.8 3.5 9.6 12.8 7.5 -10.8 2.0 4.8 2.2 4.3 2.8 4.9 Sweden 2.4 4.4 3.8 5.0 0.6 -8.0 8.0 4.6 0.9 3.0 1.9 2.9 United Kingdom 3.3 4.7 3.6 2.4 -1.1 -6.3 3.8 0.4 0.6 1.8 0.6 1.5 EU 2.2 4.2 3.0 4.0 0.6 -6.6 4.1 2.2 0.2 2.1 1.3 2.5 Croatia : 3.8 6.0 5.4 2.5 -10.9 -1.2 0.2 -1.5 1.9 0.9 2.4 USA 3.9 4.4 3.2 2.0 -0.7 -5.0 4.2 2.3 2.5 2.5 2.1 2.3 Japan 1.7 0.5 1.7 2.2 -0.8 -7.0 5.2 0.1 2.1 1.9 1.8 1.4

Statistical Annex
155
TABLE 7 : Private consumption expenditure, volume (percentage change on preceding year, 1992-2013) 26.04.20125-year Spring 2012 Autumn 2011
averages forecast forecast1992-96 1997-01 2002-06 2007 2008 2009 2010 2011 2012 2013 2012 2013
Belgium 1.5 2.1 1.2 1.7 1.9 0.8 2.5 0.7 0.1 1.2 0.8 1.3 Germany 1.7 1.5 0.3 -0.2 0.6 -0.1 0.6 1.5 0.9 1.2 1.1 1.1 Estonia : 6.5 9.9 8.8 -6.1 -15.6 -1.7 4.2 2.8 3.0 2.9 3.6 Ireland 4.2 7.8 4.7 6.3 -1.4 -7.2 -0.9 -2.7 -1.7 0.3 -1.1 0.5 Greece 1.8 3.1 4.1 3.7 4.0 -1.3 -3.6 -7.1 -5.7 -1.1 -4.3 -0.9 Spain 1.1 4.3 3.6 3.5 -0.6 -4.3 0.8 -0.1 -2.2 -1.3 0.9 1.1 France 1.1 2.6 2.0 2.4 0.2 0.2 1.4 0.4 0.7 1.5 0.9 1.6 Italy 0.5 2.5 0.9 1.1 -0.8 -1.6 1.2 0.3 -2.3 -0.4 0.1 0.4 Cyprus : 4.3 3.7 10.2 7.8 -7.5 1.3 0.2 -2.5 0.3 -0.4 0.7 Luxembourg 1.7 4.3 1.6 3.3 3.4 1.1 2.1 1.8 0.7 2.0 1.6 2.7 Malta : 3.6 2.4 0.6 5.1 -1.4 -1.7 3.1 0.3 1.0 0.6 1.0 Netherlands 2.1 3.9 0.5 1.8 1.3 -2.6 0.4 -1.1 -1.5 0.0 -0.4 0.2 Austria 1.9 1.7 1.7 0.9 0.8 -0.3 2.2 0.6 0.8 1.0 1.0 1.4 Portugal 2.0 3.8 1.4 2.5 1.3 -2.3 2.1 -3.9 -6.1 -1.0 -5.9 -0.4 Slovenia 5.1 3.1 2.8 6.1 3.7 -0.1 -0.7 -0.3 -1.5 -0.4 0.6 1.5 Slovakia : 3.8 4.9 6.8 6.1 0.2 -0.7 -0.4 0.2 1.6 0.4 1.3 Finland 0.6 3.2 3.6 3.5 1.9 -2.7 3.0 3.3 1.7 1.0 1.4 1.9 Euro area 1.3 2.5 1.5 1.7 0.4 -1.2 0.9 0.2 -0.6 0.5 0.4 1.0 Bulgaria -1.4 2.8 6.7 9.0 3.4 -7.6 0.1 -0.6 0.6 1.9 2.1 3.0 Czech Republic 6.0 1.3 3.8 4.2 2.8 -0.4 0.6 -0.5 -0.4 0.5 0.3 1.5 Denmark 2.4 1.0 2.9 3.0 -0.3 -4.2 1.9 -0.5 1.4 1.6 1.4 2.3 Latvia : 4.8 11.3 14.3 -5.8 -22.6 0.4 4.4 2.2 3.3 2.4 3.3 Lithuania : 5.3 10.0 11.3 4.2 -17.5 -4.9 6.1 3.0 3.4 2.8 3.2 Hungary : 4.3 4.4 1.1 -0.7 -6.2 -2.2 0.0 -1.5 0.0 -0.8 0.3 Poland 4.8 4.6 3.4 4.9 5.7 2.0 3.2 3.1 2.0 2.6 2.6 2.9 Romania 3.1 1.6 10.6 11.9 9.0 -10.1 -0.4 1.3 1.3 2.6 1.9 3.4 Sweden 0.0 3.2 2.6 3.7 0.0 -0.3 3.7 2.1 1.1 1.8 1.2 1.6 United Kingdom 2.4 4.7 2.9 2.7 -1.5 -3.5 1.2 -1.2 0.3 1.0 -0.5 0.8 EU 1.7 2.9 2.0 2.2 0.3 -1.8 1.0 0.1 -0.3 0.7 0.4 1.1 Croatia : 2.8 4.6 6.5 0.9 -8.3 -0.8 0.2 -0.6 0.4 0.3 1.0 USA 3.4 4.4 3.0 2.3 -0.6 -1.9 2.0 2.2 2.0 1.8 1.3 1.6 Japan 1.9 0.7 1.1 0.9 -0.9 -0.7 2.6 0.0 1.4 0.8 0.6 0.6
TABLE 8 : Government consumption expenditure, volume (percentage change on preceding year, 1992-2013)5-year Spring 2012 Autumn 2011
averages forecast forecast1992-96 1997-01 2002-06 2007 2008 2009 2010 2011 2012 2013 2012 2013
Belgium 1.2 2.0 1.6 2.0 2.4 0.8 0.2 0.8 0.4 0.4 1.3 1.4 Germany 2.6 1.1 0.4 1.4 3.1 3.3 1.7 1.4 1.2 1.4 1.0 1.1 Estonia : 0.1 3.8 6.6 5.0 -1.6 -1.1 1.6 1.0 1.7 1.4 1.0 Ireland 3.7 7.6 4.3 7.0 1.2 -3.7 -3.1 -3.7 -3.8 -2.7 -1.0 -2.1 Greece 1.0 4.3 2.6 7.6 -2.1 4.8 -7.2 -9.1 -11.0 -9.5 -9.0 -7.0 Spain 2.1 3.8 5.1 5.6 5.9 3.7 0.2 -2.2 -6.9 -3.5 -2.6 0.3 France 1.8 1.0 1.7 1.5 1.3 2.3 1.2 0.8 0.5 0.5 0.4 0.3 Italy -1.0 1.7 1.9 1.0 0.6 0.8 -0.6 -0.9 -0.8 -0.4 -0.3 -0.2 Cyprus : 5.2 3.4 1.3 6.1 6.8 0.8 -4.4 -3.0 0.3 -3.0 1.4 Luxembourg 4.1 4.8 3.6 2.8 1.4 4.8 2.9 4.1 2.6 2.4 3.5 2.5 Malta : 0.0 2.5 0.6 12.3 -1.3 0.6 3.9 1.8 0.0 1.3 1.1 Netherlands 1.7 2.9 3.2 3.5 2.8 4.8 1.0 0.2 -0.8 0.1 -0.9 -0.6 Austria 2.7 2.0 1.4 2.1 4.4 0.2 -0.2 -0.2 0.7 1.2 1.0 1.2 Portugal 1.8 4.2 1.5 0.5 0.3 4.7 0.9 -3.9 -2.9 -2.6 -6.2 -3.8 Slovenia 2.2 3.7 3.3 0.6 6.1 2.9 1.5 -0.9 -3.7 -0.9 0.6 0.9 Slovakia : 1.6 3.4 -0.2 6.1 6.1 1.1 -3.5 1.3 1.3 0.6 1.7 Finland -0.4 1.8 1.7 1.1 1.9 1.1 0.2 0.8 1.0 0.9 0.6 0.6 Euro area 1.5 1.8 1.9 2.2 2.3 2.5 0.5 -0.1 -0.8 0.0 -0.2 0.3 Bulgaria -15.4 7.3 3.4 0.3 -1.0 -6.5 1.9 0.5 0.8 1.6 0.5 0.5 Czech Republic -1.7 1.7 2.3 0.4 1.2 3.8 0.6 -1.4 -2.0 0.2 0.3 1.2 Denmark 2.6 2.2 1.7 1.3 1.9 2.5 0.3 -1.0 1.3 0.3 0.4 -0.2 Latvia : 2.8 2.9 4.9 1.6 -9.4 -9.7 1.3 0.0 0.3 0.0 0.5 Lithuania : 1.5 3.0 1.6 0.4 -1.4 -3.3 0.4 -1.6 1.0 -0.2 2.1 Hungary -1.8 0.9 3.6 -7.2 1.1 -0.6 -2.1 -0.3 -3.1 -0.8 -0.7 0.9 Poland 3.3 2.4 4.1 3.7 7.4 2.1 4.1 -1.3 0.0 1.2 1.2 2.3 Romania 2.8 -0.2 -0.9 -0.1 7.2 3.1 -4.4 -3.5 0.8 2.5 1.5 3.5 Sweden 0.3 0.8 0.9 0.7 1.0 2.2 1.9 1.8 1.0 0.8 0.9 1.0 United Kingdom 0.6 2.2 3.1 0.6 1.6 -0.1 1.5 0.1 0.3 -1.1 -1.0 -1.6 EU 0.7 1.8 2.1 1.8 2.3 2.1 0.7 -0.1 -0.5 -0.1 -0.2 0.1 Croatia : 0.7 3.5 5.0 1.8 0.0 -0.9 -0.2 -0.5 -0.4 0.2 0.2 USA -0.1 2.4 2.2 1.4 2.6 2.0 1.0 -1.6 -2.0 -1.5 0.0 -1.3 Japan 3.4 2.9 1.4 1.1 -0.1 2.3 2.1 2.1 0.8 0.4 0.9 0.5
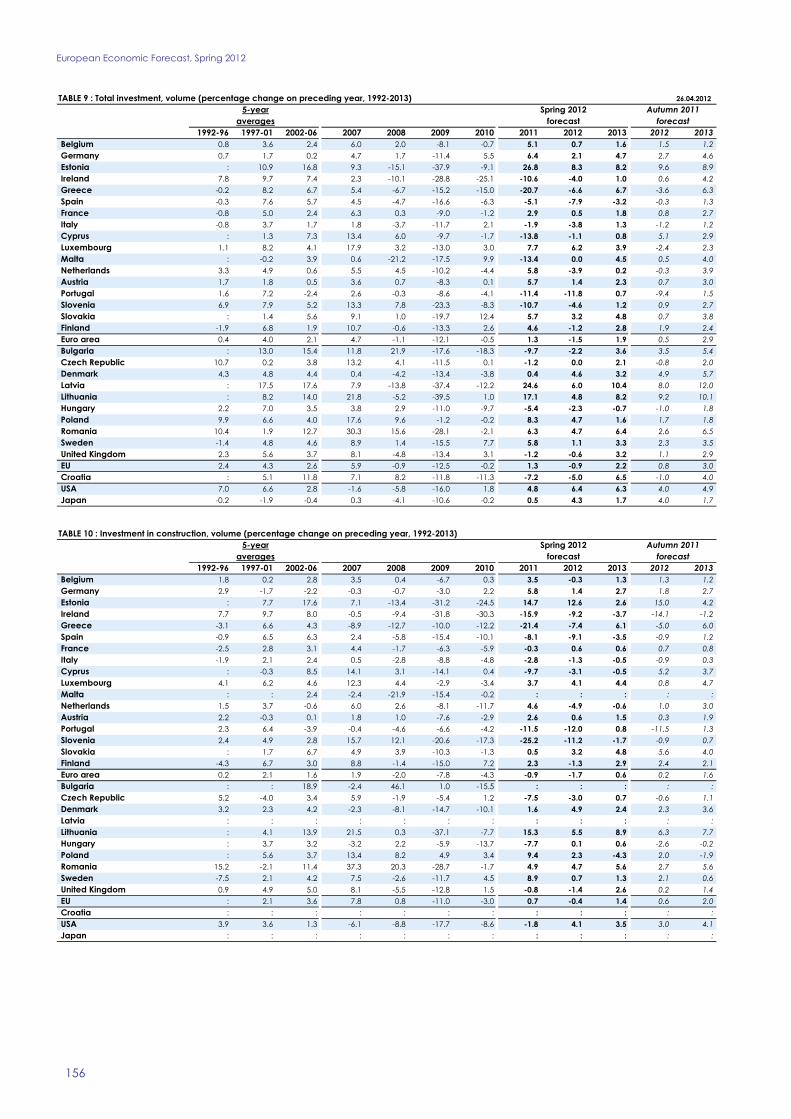
European Economic Forecast, Spring 2012
156
TABLE 9 : Total investment, volume (percentage change on preceding year, 1992-2013) 26.04.20125-year Spring 2012 Autumn 2011
averages forecast forecast1992-96 1997-01 2002-06 2007 2008 2009 2010 2011 2012 2013 2012 2013
Belgium 0.8 3.6 2.4 6.0 2.0 -8.1 -0.7 5.1 0.7 1.6 1.5 1.2 Germany 0.7 1.7 0.2 4.7 1.7 -11.4 5.5 6.4 2.1 4.7 2.7 4.6 Estonia : 10.9 16.8 9.3 -15.1 -37.9 -9.1 26.8 8.3 8.2 9.6 8.9 Ireland 7.8 9.7 7.4 2.3 -10.1 -28.8 -25.1 -10.6 -4.0 1.0 0.6 4.2 Greece -0.2 8.2 6.7 5.4 -6.7 -15.2 -15.0 -20.7 -6.6 6.7 -3.6 6.3 Spain -0.3 7.6 5.7 4.5 -4.7 -16.6 -6.3 -5.1 -7.9 -3.2 -0.3 1.3 France -0.8 5.0 2.4 6.3 0.3 -9.0 -1.2 2.9 0.5 1.8 0.8 2.7 Italy -0.8 3.7 1.7 1.8 -3.7 -11.7 2.1 -1.9 -3.8 1.3 -1.2 1.2 Cyprus : 1.3 7.3 13.4 6.0 -9.7 -1.7 -13.8 -1.1 0.8 5.1 2.9 Luxembourg 1.1 8.2 4.1 17.9 3.2 -13.0 3.0 7.7 6.2 3.9 -2.4 2.3 Malta : -0.2 3.9 0.6 -21.2 -17.5 9.9 -13.4 0.0 4.5 0.5 4.0 Netherlands 3.3 4.9 0.6 5.5 4.5 -10.2 -4.4 5.8 -3.9 0.2 -0.3 3.9 Austria 1.7 1.8 0.5 3.6 0.7 -8.3 0.1 5.7 1.4 2.3 0.7 3.0 Portugal 1.6 7.2 -2.4 2.6 -0.3 -8.6 -4.1 -11.4 -11.8 0.7 -9.4 1.5 Slovenia 6.9 7.9 5.2 13.3 7.8 -23.3 -8.3 -10.7 -4.6 1.2 0.9 2.7 Slovakia : 1.4 5.6 9.1 1.0 -19.7 12.4 5.7 3.2 4.8 0.7 3.8 Finland -1.9 6.8 1.9 10.7 -0.6 -13.3 2.6 4.6 -1.2 2.8 1.9 2.4 Euro area 0.4 4.0 2.1 4.7 -1.1 -12.1 -0.5 1.3 -1.5 1.9 0.5 2.9 Bulgaria : 13.0 15.4 11.8 21.9 -17.6 -18.3 -9.7 -2.2 3.6 3.5 5.4 Czech Republic 10.7 0.2 3.8 13.2 4.1 -11.5 0.1 -1.2 0.0 2.1 -0.8 2.0 Denmark 4.3 4.8 4.4 0.4 -4.2 -13.4 -3.8 0.4 4.6 3.2 4.9 5.7 Latvia : 17.5 17.6 7.9 -13.8 -37.4 -12.2 24.6 6.0 10.4 8.0 12.0 Lithuania : 8.2 14.0 21.8 -5.2 -39.5 1.0 17.1 4.8 8.2 9.2 10.1 Hungary 2.2 7.0 3.5 3.8 2.9 -11.0 -9.7 -5.4 -2.3 -0.7 -1.0 1.8 Poland 9.9 6.6 4.0 17.6 9.6 -1.2 -0.2 8.3 4.7 1.6 1.7 1.8 Romania 10.4 1.9 12.7 30.3 15.6 -28.1 -2.1 6.3 4.7 6.4 2.6 6.5 Sweden -1.4 4.8 4.6 8.9 1.4 -15.5 7.7 5.8 1.1 3.3 2.3 3.5 United Kingdom 2.3 5.6 3.7 8.1 -4.8 -13.4 3.1 -1.2 -0.6 3.2 1.1 2.9 EU 2.4 4.3 2.6 5.9 -0.9 -12.5 -0.2 1.3 -0.9 2.2 0.8 3.0 Croatia : 5.1 11.8 7.1 8.2 -11.8 -11.3 -7.2 -5.0 6.5 -1.0 4.0 USA 7.0 6.6 2.8 -1.6 -5.8 -16.0 1.8 4.8 6.4 6.3 4.0 4.9 Japan -0.2 -1.9 -0.4 0.3 -4.1 -10.6 -0.2 0.5 4.3 1.7 4.0 1.7
TABLE 10 : Investment in construction, volume (percentage change on preceding year, 1992-2013)5-year Spring 2012 Autumn 2011
averages forecast forecast1992-96 1997-01 2002-06 2007 2008 2009 2010 2011 2012 2013 2012 2013
Belgium 1.8 0.2 2.8 3.5 0.4 -6.7 0.3 3.5 -0.3 1.3 1.3 1.2 Germany 2.9 -1.7 -2.2 -0.3 -0.7 -3.0 2.2 5.8 1.4 2.7 1.8 2.7 Estonia : 7.7 17.6 7.1 -13.4 -31.2 -24.5 14.7 12.6 2.6 15.0 4.2 Ireland 7.7 9.7 8.0 -0.5 -9.4 -31.8 -30.3 -15.9 -9.2 -3.7 -14.1 -1.2 Greece -3.1 6.6 4.3 -8.9 -12.7 -10.0 -12.2 -21.4 -7.4 6.1 -5.0 6.0 Spain -0.9 6.5 6.3 2.4 -5.8 -15.4 -10.1 -8.1 -9.1 -3.5 -0.9 1.2 France -2.5 2.8 3.1 4.4 -1.7 -6.3 -5.9 -0.3 0.6 0.6 0.7 0.8 Italy -1.9 2.1 2.4 0.5 -2.8 -8.8 -4.8 -2.8 -1.3 -0.5 -0.9 0.3 Cyprus : -0.3 8.5 14.1 3.1 -14.1 0.4 -9.7 -3.1 -0.5 5.2 3.7 Luxembourg 4.1 6.2 4.6 12.3 4.4 -2.9 -3.4 3.7 4.1 4.4 0.8 4.7 Malta : : 2.4 -2.4 -21.9 -15.4 -0.2 : : : : : Netherlands 1.5 3.7 -0.6 6.0 2.6 -8.1 -11.7 4.6 -4.9 -0.6 1.0 3.0 Austria 2.2 -0.3 0.1 1.8 1.0 -7.6 -2.9 2.6 0.6 1.5 0.3 1.9 Portugal 2.3 6.4 -3.9 -0.4 -4.6 -6.6 -4.2 -11.5 -12.0 0.8 -11.5 1.3 Slovenia 2.4 4.9 2.8 15.7 12.1 -20.6 -17.3 -25.2 -11.2 -1.7 -0.9 0.7 Slovakia : 1.7 6.7 4.9 3.9 -10.3 -1.3 0.5 3.2 4.8 5.6 4.0 Finland -4.3 6.7 3.0 8.8 -1.4 -15.0 7.2 2.3 -1.3 2.9 2.4 2.1 Euro area 0.2 2.1 1.6 1.9 -2.0 -7.8 -4.3 -0.9 -1.7 0.6 0.2 1.6 Bulgaria : : 18.9 -2.4 46.1 1.0 -15.5 : : : : : Czech Republic 5.2 -4.0 3.4 5.9 -1.9 -5.4 1.2 -7.5 -3.0 0.7 -0.6 1.1 Denmark 3.2 2.3 4.2 -2.3 -8.1 -14.7 -10.1 1.6 4.9 2.4 2.3 3.6 Latvia : : : : : : : : : : : : Lithuania : 4.1 13.9 21.5 0.3 -37.1 -7.7 15.3 5.5 8.9 6.3 7.7 Hungary : 3.7 3.2 -3.2 2.2 -5.9 -13.7 -7.7 0.1 0.6 -2.6 -0.2 Poland : 5.6 3.7 13.4 8.2 4.9 3.4 9.4 2.3 -4.3 2.0 -1.9 Romania 15.2 -2.1 11.4 37.3 20.3 -28.7 -1.7 4.9 4.7 5.6 2.7 5.6 Sweden -7.5 2.1 4.2 7.5 -2.6 -11.7 4.5 8.9 0.7 1.3 2.1 0.6 United Kingdom 0.9 4.9 5.0 8.1 -5.5 -12.8 1.5 -0.8 -1.4 2.6 0.2 1.4 EU : 2.1 3.6 7.8 0.8 -11.0 -3.0 0.7 -0.4 1.4 0.6 2.0 Croatia : : : : : : : : : : : : USA 3.9 3.6 1.3 -6.1 -8.8 -17.7 -8.6 -1.8 4.1 3.5 3.0 4.1 Japan : : : : : : : : : : : :

Statistical Annex
157
TABLE 11 : Investment in equipment, volume (percentage change on preceding year, 1992-2013) 26.04.20125-year Spring 2012 Autumn 2011
averages forecast forecast1992-96 1997-01 2002-06 2007 2008 2009 2010 2011 2012 2013 2012 2013
Belgium -0.9 6.9 1.1 9.3 3.5 -11.6 -2.7 6.8 1.7 2.0 1.6 1.3 Germany -3.2 6.4 2.7 10.5 3.8 -22.8 10.0 7.6 2.7 7.2 3.5 7.1 Estonia : 14.8 16.0 12.1 -17.9 -50.2 26.1 44.7 4.0 15.0 3.0 16.0 Ireland 9.3 9.1 6.3 17.9 -12.4 -23.5 -16.9 -3.0 2.4 5.7 15.0 8.0 Greece 7.4 10.9 10.0 37.0 1.3 -24.0 -20.0 -22.1 -5.2 6.7 -3.3 6.8 Spain -0.1 8.9 4.3 9.6 -3.2 -22.9 5.2 1.5 -6.1 -3.0 0.9 1.4 France 0.8 7.6 1.1 9.1 3.5 -9.6 4.1 8.9 0.5 4.9 1.2 5.8 Italy 0.0 5.3 1.4 3.2 -5.2 -16.8 11.9 -0.9 -6.9 3.5 -1.8 2.2 Cyprus : 5.0 4.7 11.7 13.6 -0.3 -5.7 -23.1 4.0 4.0 5.0 1.0 Luxembourg -4.3 10.9 3.4 25.4 5.8 -32.9 24.9 14.3 12.0 4.0 -8.0 -4.0 Malta : : 5.5 -4.5 -27.8 -24.3 27.7 : : : : : Netherlands 4.5 5.9 1.9 8.3 7.0 -13.2 7.5 7.6 -2.7 1.0 -1.9 5.4 Austria 0.7 3.0 0.4 6.6 -0.7 -9.7 4.3 11.3 2.3 3.4 0.9 4.7 Portugal 1.3 9.2 -0.1 7.9 6.9 -13.0 -4.4 -13.3 -14.0 0.5 -8.0 1.7 Slovenia 9.6 11.7 8.7 9.2 3.1 -28.9 4.4 6.3 1.2 3.5 2.8 5.0 Slovakia : 2.2 4.2 4.5 1.2 -26.6 17.2 12.5 3.6 5.5 -4.4 4.0 Finland 1.0 6.0 -1.3 17.8 1.5 -11.8 -6.0 12.0 -1.1 2.5 1.0 3.0 Euro area 0.1 6.9 2.3 9.4 1.1 -17.2 6.0 4.3 -1.4 3.9 0.9 4.6 Bulgaria : : 12.8 28.8 3.1 -45.0 -18.5 : : : : : Czech Republic 16.2 4.8 3.6 23.0 10.5 -18.3 -1.3 7.5 2.9 3.5 -1.0 3.0 Denmark 3.4 6.2 3.8 4.9 -2.7 -14.6 2.2 -1.6 6.0 4.6 8.9 4.5 Latvia : : : : : : : : : : : : Lithuania : 13.5 15.1 23.4 -17.3 -50.0 19.6 25.3 4.0 8.0 15.0 15.0 Hungary : 10.0 4.1 11.6 1.6 -16.7 -4.2 -4.0 1.0 -2.0 1.0 4.5 Poland : 7.1 4.8 22.3 13.0 -10.8 -5.1 6.6 9.0 11.5 1.1 8.7 Romania 7.3 5.9 14.9 28.3 10.9 -27.7 6.0 7.0 4.7 7.5 2.3 7.5 Sweden 5.1 6.1 5.2 12.9 5.5 -22.7 12.7 2.3 1.5 5.0 2.5 6.0 United Kingdom 4.5 7.0 1.5 9.4 -5.1 -16.6 7.5 -1.9 0.0 5.0 3.4 6.1 EU : 6.9 4.2 12.5 2.1 -18.5 5.8 4.1 0.2 4.7 1.7 5.4 Croatia : : : : : : : : : : : : USA 9.8 8.0 4.3 3.0 -5.4 -18.4 16.9 9.8 8.0 8.2 4.6 5.5 Japan : : : : : : : : : : : :
TABLE 12 : Public investment (as a percentage of GDP, 1992-2013)5-year Spring 2012 Autumn 2011
averages forecast forecast1992-96 1997-01 2002-06 2007 2008 2009 2010 2011 2012 2013 2012 2013
Belgium 1.6 1.8 1.6 1.6 1.5 1.7 1.6 1.7 1.8 1.6 1.9 1.5 Germany 2.4 1.9 1.6 1.5 1.6 1.7 1.6 1.6 1.5 1.5 1.6 1.6 Estonia : 4.2 4.4 5.1 5.2 5.1 3.9 4.2 5.5 4.7 5.1 4.4 Ireland 2.2 3.1 3.7 4.6 5.2 4.0 3.9 3.3 2.7 2.3 2.7 2.4 Greece 2.9 3.3 3.3 3.4 3.7 3.1 2.2 1.6 2.5 2.6 2.7 2.7 Spain 3.7 3.3 3.6 4.0 4.0 4.5 3.8 2.8 1.9 1.8 2.4 2.4 France 3.2 2.9 3.1 3.3 3.2 3.4 3.1 3.1 3.1 3.2 3.2 3.2 Italy 2.4 2.3 2.3 2.3 2.2 2.5 2.1 2.0 1.8 1.5 1.4 1.3 Cyprus : 2.9 3.3 3.0 3.1 4.2 3.8 3.4 3.1 3.1 3.5 3.5 Luxembourg 4.2 4.0 4.4 3.3 3.2 3.7 4.0 4.0 3.9 3.9 4.2 4.2 Malta : 4.0 4.3 3.8 2.4 2.2 2.2 2.5 2.6 2.6 2.3 2.3 Netherlands 2.5 3.1 3.4 3.3 3.5 3.8 3.6 3.5 3.5 3.4 3.5 3.4 Austria 3.1 1.7 1.2 1.1 1.1 1.2 1.1 1.0 1.0 1.0 1.0 1.0 Portugal 3.8 4.6 3.6 2.7 2.9 3.0 3.6 2.6 2.0 1.8 2.1 1.8 Slovenia : 3.1 3.3 4.2 4.4 4.6 4.3 3.6 3.2 3.2 3.9 3.9 Slovakia : 3.6 2.5 1.9 2.0 2.3 2.6 2.3 2.1 2.1 1.8 1.6 Finland 2.9 2.7 2.6 2.4 2.5 2.8 2.5 2.5 2.5 2.5 2.7 2.7 Euro area 2.8 2.5 2.5 2.6 2.6 2.8 2.5 2.3 2.2 2.1 2.1 2.1 Bulgaria : 3.2 3.3 5.2 5.6 4.9 4.6 3.2 3.3 3.6 4.4 4.5 Czech Republic : 3.6 4.6 4.2 4.6 5.1 4.3 3.6 3.7 3.7 4.2 4.2 Denmark 1.8 1.7 1.8 1.9 1.9 2.0 2.1 2.1 2.4 1.9 2.2 2.0 Latvia : 1.3 2.9 5.7 4.9 4.3 3.7 4.2 4.2 3.8 3.4 3.4 Lithuania : 2.4 3.4 5.2 4.9 3.9 4.6 4.2 4.3 4.6 4.7 5.1 Hungary : 3.1 4.1 3.7 2.9 3.1 3.4 2.9 4.4 4.6 4.2 4.4 Poland : 3.4 3.5 4.2 4.6 5.2 5.6 5.8 5.6 4.9 6.1 5.4 Romania : 2.5 3.8 6.2 6.6 5.9 5.7 5.2 5.5 5.2 5.6 5.2 Sweden 2.7 3.0 3.0 3.1 3.3 3.5 3.5 3.4 3.5 3.5 3.3 3.4 United Kingdom 1.8 1.3 1.5 1.9 2.3 2.7 2.5 2.2 2.2 2.1 1.9 1.8 EU : 2.4 2.4 2.6 2.7 2.9 2.7 2.5 2.4 2.3 2.3 2.3 Croatia : : : 3.7 2.0 1.8 1.3 1.4 1.5 1.5 1.8 2.0 USA 2.4 2.4 2.5 2.4 2.6 2.6 2.5 2.3 2.2 2.1 2.3 2.2 Japan 6.1 5.4 3.9 3.1 3.0 3.4 3.3 3.3 3.6 3.6 3.5 3.6
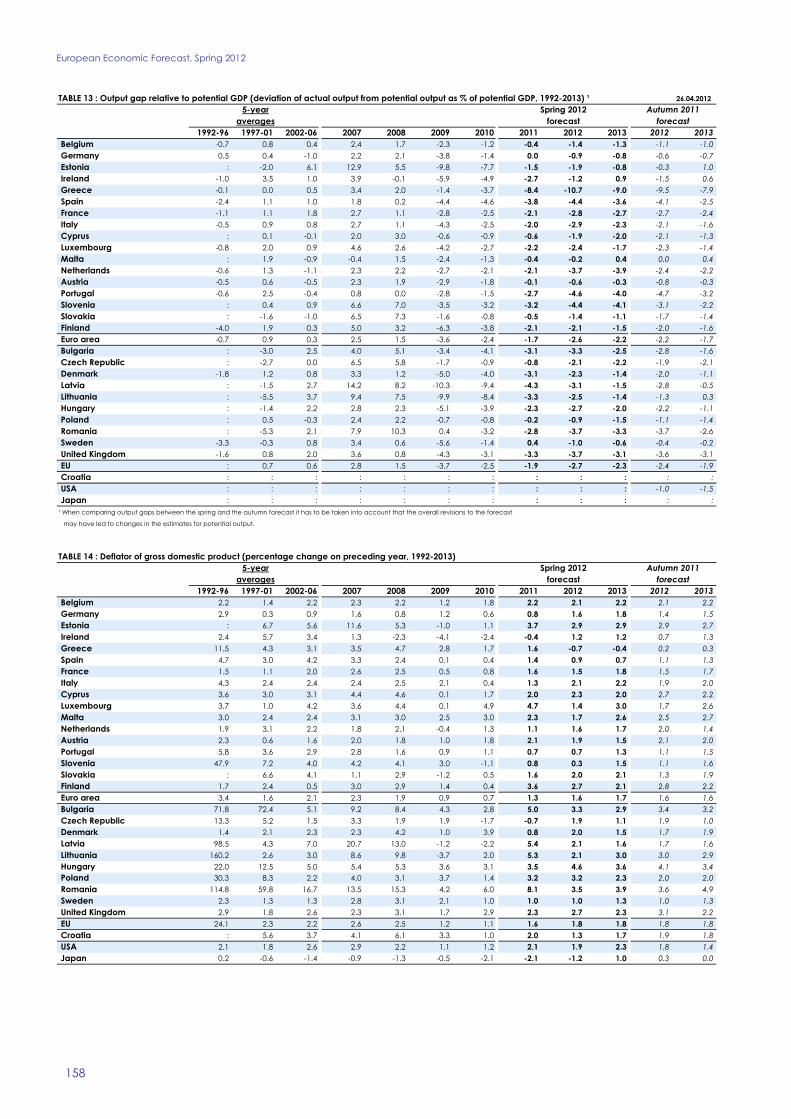
European Economic Forecast, Spring 2012
158
TABLE 13 : Output gap relative to potential GDP (deviation of actual output from potential output as % of potential GDP, 1992-2013) ¹ 26.04.20125-year Spring 2012 Autumn 2011
averages forecast forecast1992-96 1997-01 2002-06 2007 2008 2009 2010 2011 2012 2013 2012 2013
Belgium -0.7 0.8 0.4 2.4 1.7 -2.3 -1.2 -0.4 -1.4 -1.3 -1.1 -1.0 Germany 0.5 0.4 -1.0 2.2 2.1 -3.8 -1.4 0.0 -0.9 -0.8 -0.6 -0.7 Estonia : -2.0 6.1 12.9 5.5 -9.8 -7.7 -1.5 -1.9 -0.8 -0.3 1.0 Ireland -1.0 3.5 1.0 3.9 -0.1 -5.9 -4.9 -2.7 -1.2 0.9 -1.5 0.6 Greece -0.1 0.0 0.5 3.4 2.0 -1.4 -3.7 -8.4 -10.7 -9.0 -9.5 -7.9 Spain -2.4 1.1 1.0 1.8 0.2 -4.4 -4.6 -3.8 -4.4 -3.6 -4.1 -2.5 France -1.1 1.1 1.8 2.7 1.1 -2.8 -2.5 -2.1 -2.8 -2.7 -2.7 -2.4 Italy -0.5 0.9 0.8 2.7 1.1 -4.3 -2.5 -2.0 -2.9 -2.3 -2.1 -1.6 Cyprus : 0.1 -0.1 2.0 3.0 -0.6 -0.9 -0.6 -1.9 -2.0 -2.1 -1.3 Luxembourg -0.8 2.0 0.9 4.6 2.6 -4.2 -2.7 -2.2 -2.4 -1.7 -2.3 -1.4 Malta : 1.9 -0.9 -0.4 1.5 -2.4 -1.3 -0.4 -0.2 0.4 0.0 0.4 Netherlands -0.6 1.3 -1.1 2.3 2.2 -2.7 -2.1 -2.1 -3.7 -3.9 -2.4 -2.2 Austria -0.5 0.6 -0.5 2.3 1.9 -2.9 -1.8 -0.1 -0.6 -0.3 -0.8 -0.3 Portugal -0.6 2.5 -0.4 0.8 0.0 -2.8 -1.5 -2.7 -4.6 -4.0 -4.7 -3.2 Slovenia : 0.4 0.9 6.6 7.0 -3.5 -3.2 -3.2 -4.4 -4.1 -3.1 -2.2 Slovakia : -1.6 -1.0 6.5 7.3 -1.6 -0.8 -0.5 -1.4 -1.1 -1.7 -1.4 Finland -4.0 1.9 0.3 5.0 3.2 -6.3 -3.8 -2.1 -2.1 -1.5 -2.0 -1.6 Euro area -0.7 0.9 0.3 2.5 1.5 -3.6 -2.4 -1.7 -2.6 -2.2 -2.2 -1.7 Bulgaria : -3.0 2.5 4.0 5.1 -3.4 -4.1 -3.1 -3.3 -2.5 -2.8 -1.6 Czech Republic : -2.7 0.0 6.5 5.8 -1.7 -0.9 -0.8 -2.1 -2.2 -1.9 -2.1 Denmark -1.8 1.2 0.8 3.3 1.2 -5.0 -4.0 -3.1 -2.3 -1.4 -2.0 -1.1 Latvia : -1.5 2.7 14.2 8.2 -10.3 -9.4 -4.3 -3.1 -1.5 -2.8 -0.5 Lithuania : -5.5 3.7 9.4 7.5 -9.9 -8.4 -3.3 -2.5 -1.4 -1.3 0.3 Hungary : -1.4 2.2 2.8 2.3 -5.1 -3.9 -2.3 -2.7 -2.0 -2.2 -1.1 Poland : 0.5 -0.3 2.4 2.2 -0.7 -0.8 -0.2 -0.9 -1.5 -1.1 -1.4 Romania : -5.3 2.1 7.9 10.3 0.4 -3.2 -2.8 -3.7 -3.3 -3.7 -2.6 Sweden -3.3 -0.3 0.8 3.4 0.6 -5.6 -1.4 0.4 -1.0 -0.6 -0.4 -0.2 United Kingdom -1.6 0.8 2.0 3.6 0.8 -4.3 -3.1 -3.3 -3.7 -3.1 -3.6 -3.1 EU : 0.7 0.6 2.8 1.5 -3.7 -2.5 -1.9 -2.7 -2.3 -2.4 -1.9 Croatia : : : : : : : : : : : : USA : : : : : : : : : : -1.0 -1.5 Japan : : : : : : : : : : : :¹ When comparing output gaps between the spring and the autumn forecast it has to be taken into account that the overall revisions to the forecast
may have led to changes in the estimates for potential output.
TABLE 14 : Deflator of gross domestic product (percentage change on preceding year, 1992-2013)5-year Spring 2012 Autumn 2011
averages forecast forecast1992-96 1997-01 2002-06 2007 2008 2009 2010 2011 2012 2013 2012 2013
Belgium 2.2 1.4 2.2 2.3 2.2 1.2 1.8 2.2 2.1 2.2 2.1 2.2 Germany 2.9 0.3 0.9 1.6 0.8 1.2 0.6 0.8 1.6 1.8 1.4 1.5 Estonia : 6.7 5.6 11.6 5.3 -1.0 1.1 3.7 2.9 2.9 2.9 2.7 Ireland 2.4 5.7 3.4 1.3 -2.3 -4.1 -2.4 -0.4 1.2 1.2 0.7 1.3 Greece 11.5 4.3 3.1 3.5 4.7 2.8 1.7 1.6 -0.7 -0.4 0.2 0.3 Spain 4.7 3.0 4.2 3.3 2.4 0.1 0.4 1.4 0.9 0.7 1.1 1.3 France 1.5 1.1 2.0 2.6 2.5 0.5 0.8 1.6 1.5 1.8 1.5 1.7 Italy 4.3 2.4 2.4 2.4 2.5 2.1 0.4 1.3 2.1 2.2 1.9 2.0 Cyprus 3.6 3.0 3.1 4.4 4.6 0.1 1.7 2.0 2.3 2.0 2.7 2.2 Luxembourg 3.7 1.0 4.2 3.6 4.4 0.1 4.9 4.7 1.4 3.0 1.7 2.6 Malta 3.0 2.4 2.4 3.1 3.0 2.5 3.0 2.3 1.7 2.6 2.5 2.7 Netherlands 1.9 3.1 2.2 1.8 2.1 -0.4 1.3 1.1 1.6 1.7 2.0 1.4 Austria 2.3 0.6 1.6 2.0 1.8 1.0 1.8 2.1 1.9 1.5 2.1 2.0 Portugal 5.8 3.6 2.9 2.8 1.6 0.9 1.1 0.7 0.7 1.3 1.1 1.5 Slovenia 47.9 7.2 4.0 4.2 4.1 3.0 -1.1 0.8 0.3 1.5 1.1 1.6 Slovakia : 6.6 4.1 1.1 2.9 -1.2 0.5 1.6 2.0 2.1 1.3 1.9 Finland 1.7 2.4 0.5 3.0 2.9 1.4 0.4 3.6 2.7 2.1 2.8 2.2 Euro area 3.4 1.6 2.1 2.3 1.9 0.9 0.7 1.3 1.6 1.7 1.6 1.6 Bulgaria 71.8 72.4 5.1 9.2 8.4 4.3 2.8 5.0 3.3 2.9 3.4 3.2 Czech Republic 13.3 5.2 1.5 3.3 1.9 1.9 -1.7 -0.7 1.9 1.1 1.9 1.0 Denmark 1.4 2.1 2.3 2.3 4.2 1.0 3.9 0.8 2.0 1.5 1.7 1.9 Latvia 98.5 4.3 7.0 20.7 13.0 -1.2 -2.2 5.4 2.1 1.6 1.7 1.6 Lithuania 160.2 2.6 3.0 8.6 9.8 -3.7 2.0 5.3 2.1 3.0 3.0 2.9 Hungary 22.0 12.5 5.0 5.4 5.3 3.6 3.1 3.5 4.6 3.6 4.1 3.4 Poland 30.3 8.3 2.2 4.0 3.1 3.7 1.4 3.2 3.2 2.3 2.0 2.0 Romania 114.8 59.8 16.7 13.5 15.3 4.2 6.0 8.1 3.5 3.9 3.6 4.9 Sweden 2.3 1.3 1.3 2.8 3.1 2.1 1.0 1.0 1.0 1.3 1.0 1.3 United Kingdom 2.9 1.8 2.6 2.3 3.1 1.7 2.9 2.3 2.7 2.3 3.1 2.2 EU 24.1 2.3 2.2 2.6 2.5 1.2 1.1 1.6 1.8 1.8 1.8 1.8 Croatia : 5.6 3.7 4.1 6.1 3.3 1.0 2.0 1.3 1.7 1.9 1.8 USA 2.1 1.8 2.6 2.9 2.2 1.1 1.2 2.1 1.9 2.3 1.8 1.4 Japan 0.2 -0.6 -1.4 -0.9 -1.3 -0.5 -2.1 -2.1 -1.2 1.0 0.3 0.0

Statistical Annex
159
TABLE 15 : Price deflator of private consumption (percentage change on preceding year, 1992-2013) 26.04.20125-year Spring 2012 Autumn 2011
averages forecast forecast1992-96 1997-01 2002-06 2007 2008 2009 2010 2011 2012 2013 2012 2013
Belgium 1.8 1.6 2.1 2.9 3.3 -0.9 1.8 3.4 2.8 2.0 2.0 1.9 Germany 2.6 1.0 1.3 1.5 1.7 0.1 1.9 2.1 2.1 1.7 1.6 1.7 Estonia : 6.1 3.5 7.9 8.5 -0.9 2.3 4.8 3.6 3.2 2.7 2.7 Ireland 2.5 3.8 3.1 3.2 3.0 -4.3 -2.2 0.9 1.7 1.2 0.7 1.4 Greece 11.6 4.5 3.1 3.3 4.4 0.7 4.5 3.2 -0.4 -0.3 0.8 0.6 Spain 4.9 2.8 3.4 3.2 3.6 -1.2 2.4 3.2 1.8 1.1 0.9 1.5 France 1.6 1.1 1.8 2.1 2.9 -0.5 1.2 2.0 1.6 1.5 1.3 1.2 Italy 5.1 2.4 2.6 2.2 3.1 -0.1 1.5 2.7 3.2 2.3 2.0 1.9 Cyprus : 2.4 2.8 3.3 4.4 0.7 2.1 3.1 2.9 2.3 2.8 2.3 Luxembourg 2.8 2.3 2.1 2.2 2.8 1.0 1.4 3.9 2.7 2.1 2.1 1.9 Malta : 1.7 1.8 2.0 3.3 2.6 3.1 1.0 2.0 2.2 2.2 2.3 Netherlands 2.4 2.9 2.1 1.8 1.1 -0.5 1.5 2.3 2.2 1.8 1.9 1.5 Austria 2.5 1.4 1.8 2.4 2.1 0.6 2.1 2.9 2.4 1.8 2.2 1.9 Portugal 5.6 2.9 2.8 3.0 2.6 -2.2 1.6 3.7 3.1 1.3 2.9 1.9 Slovenia 45.8 7.3 4.0 4.1 5.4 -0.4 1.4 2.2 2.2 1.7 1.3 1.2 Slovakia : 7.4 4.8 2.6 4.5 0.1 1.0 3.7 2.5 1.9 2.2 2.9 Finland 1.9 2.4 0.8 2.2 3.5 1.3 2.0 3.0 3.0 2.3 2.8 1.8 Euro area 3.6 1.8 2.1 2.2 2.7 -0.4 1.7 2.5 2.2 1.7 1.6 1.6 Bulgaria 80.5 69.8 3.5 9.0 7.2 1.5 2.4 3.8 3.0 3.2 3.0 3.0 Czech Republic 11.2 5.3 1.4 2.9 4.8 0.2 0.4 1.8 3.2 2.0 2.4 1.0 Denmark 1.7 2.1 1.5 1.2 2.7 1.3 2.5 2.5 2.6 1.5 1.8 1.8 Latvia : 4.0 5.6 9.9 16.2 3.2 -0.5 4.9 2.6 1.8 2.4 1.8 Lithuania : 2.5 0.9 5.9 10.9 4.5 1.3 4.0 3.2 3.0 3.5 2.7 Hungary : 12.2 4.5 6.9 5.3 3.7 4.2 4.4 5.5 3.9 4.6 4.0 Poland 31.6 9.0 2.0 2.4 4.3 2.5 2.5 4.3 3.7 3.0 2.7 2.9 Romania 118.0 55.6 12.0 4.8 10.0 3.7 7.9 5.8 3.4 3.3 3.6 3.8 Sweden 3.1 1.3 1.3 1.4 3.1 2.1 1.4 1.3 1.1 1.3 1.1 1.3 United Kingdom 3.4 1.4 1.9 2.6 3.4 1.4 4.1 4.0 2.9 1.9 2.9 1.9 EU 24.8 2.4 2.1 2.3 3.1 0.2 2.2 2.8 2.4 1.8 1.9 1.7 Croatia : 5.0 2.7 2.9 6.1 2.5 1.1 2.5 1.8 1.8 1.7 1.7 USA 2.3 1.8 2.3 2.7 3.3 0.2 1.8 2.5 2.0 2.6 1.7 1.6 Japan 0.6 -0.3 -0.8 -0.7 0.2 -2.5 -1.7 -1.1 -0.3 0.0 0.5 0.0
TABLE 16 : Harmonised index of consumer prices (national index if not available), (percentage change on preceding year, 1992-2013)5-year Spring 2012 Autumn 2011
averages forecast forecast1992-96 1997-01 2002-06 2007 2008 2009 2010 2011 2012 2013 2012 2013
Belgium 2.2 1.7 2.0 1.8 4.5 0.0 2.3 3.5 2.9 1.8 2.0 1.9 Germany 3.1 1.2 1.6 2.3 2.8 0.2 1.2 2.5 2.3 1.8 1.7 1.8 Estonia 120.7 6.1 3.3 6.7 10.6 0.2 2.7 5.1 3.9 3.4 3.3 2.8 Ireland 2.2 3.0 3.2 2.9 3.1 -1.7 -1.6 1.2 1.7 1.2 0.7 1.2 Greece 11.6 3.7 3.4 3.0 4.2 1.3 4.7 3.1 -0.5 -0.3 0.8 0.8 Spain 4.7 2.4 3.3 2.8 4.1 -0.2 2.0 3.1 1.9 1.1 1.1 1.3 France 2.0 1.2 2.1 1.6 3.2 0.1 1.7 2.3 2.1 1.9 1.5 1.4 Italy 4.6 2.1 2.4 2.0 3.5 0.8 1.6 2.9 3.2 2.3 2.0 1.9 Cyprus 4.3 2.7 2.6 2.2 4.4 0.2 2.6 3.5 3.4 2.5 2.8 2.3 Luxembourg 1.8 1.9 2.9 2.7 4.1 0.0 2.8 3.7 3.0 2.0 2.1 2.5 Malta 3.3 3.1 2.5 0.7 4.7 1.8 2.0 2.4 2.0 2.2 2.2 2.3 Netherlands 2.5 2.6 2.1 1.6 2.2 1.0 0.9 2.5 2.5 1.8 1.9 1.3 Austria 2.9 1.3 1.7 2.2 3.2 0.4 1.7 3.6 2.4 2.0 2.2 2.1 Portugal 5.6 2.7 2.9 2.4 2.7 -0.9 1.4 3.6 3.0 1.1 3.0 1.5 Slovenia : 8.0 4.3 3.8 5.5 0.9 2.1 2.1 2.2 1.7 1.3 1.2 Slovakia : 8.5 5.3 1.9 3.9 0.9 0.7 4.1 2.9 1.9 1.7 2.1 Finland 1.5 1.9 1.1 1.6 3.9 1.6 1.7 3.3 3.0 2.5 2.6 1.8 Euro area 3.8 1.7 2.2 2.1 3.3 0.3 1.6 2.7 2.4 1.8 1.7 1.6 Bulgaria 87.7 : 5.5 7.6 12.0 2.5 3.0 3.4 2.6 2.7 3.1 3.0 Czech Republic : 5.6 1.5 3.0 6.3 0.6 1.2 2.1 3.3 2.2 2.7 1.6 Denmark 1.9 2.1 1.8 1.7 3.6 1.1 2.2 2.7 2.6 1.5 1.7 1.8 Latvia 70.3 3.9 4.9 10.1 15.3 3.3 -1.2 4.2 2.6 2.1 2.4 2.0 Lithuania 179.8 3.9 1.4 5.8 11.1 4.2 1.2 4.1 3.1 2.9 2.7 2.8 Hungary 23.2 12.3 4.8 7.9 6.0 4.0 4.7 3.9 5.5 3.9 4.5 4.1 Poland 31.4 9.8 1.9 2.6 4.2 4.0 2.7 3.9 3.7 2.9 2.7 2.9 Romania 116.9 63.2 12.9 4.9 7.9 5.6 6.1 5.8 3.1 3.4 3.4 3.4 Sweden 2.4 1.5 1.5 1.7 3.3 1.9 1.9 1.4 1.1 1.5 1.3 1.6 United Kingdom 2.8 1.3 1.7 2.3 3.6 2.2 3.3 4.5 2.9 2.0 2.9 2.0 EU 25.8 4.3 2.3 2.4 3.7 1.0 2.1 3.1 2.6 1.9 2.0 1.8 Croatia 204.3 4.3 2.7 2.7 5.8 2.2 1.1 2.2 2.4 2.0 1.5 1.7 USA 2.9 2.5 2.6 2.8 3.8 -0.4 1.6 3.2 2.5 2.0 1.9 2.2 Japan 0.7 0.1 -0.2 0.0 1.4 -1.4 -0.7 -0.3 -0.3 0.8 -0.1 0.8

European Economic Forecast, Spring 2012
160
TABLE 17 : Profiles of quarterly harmonised index of consumer prices (percentage change on corresponding quarter in previous year, 2011-2013) 26.04.2012 2011/1 2011/2 2011/3 2011/4 2012/1 2012/2 2012/3 2012/4 2013/1 2013/2 2013/3 2013/4
Belgium 3.6 3.4 3.6 3.4 3.2 3.1 2.8 2.3 2.2 1.8 1.7 1.7 Germany 2.2 2.5 2.6 2.6 2.4 2.3 2.5 2.1 2.0 1.8 1.8 1.7 Estonia 5.2 5.3 5.4 4.4 4.6 4.3 3.5 3.3 3.9 3.0 3.4 3.4 Ireland 0.8 1.3 1.1 1.5 1.7 1.8 1.6 1.6 1.6 1.3 1.1 1.0 Greece 4.5 3.3 2.1 2.6 1.7 0.4 -1.3 -2.6 -2.2 -1.1 0.4 1.5 Spain 3.2 3.3 2.9 2.7 1.9 2.0 1.9 1.7 1.1 0.9 1.2 1.3 France 2.0 2.2 2.3 2.6 2.6 2.0 2.0 1.9 1.8 1.9 2.1 1.7 Italy 2.3 2.9 2.7 3.7 3.6 2.9 2.7 3.7 2.9 2.6 2.4 1.3 Cyprus 3.1 4.1 2.9 3.8 3.2 3.8 3.4 3.0 2.9 2.5 2.3 2.2 Luxembourg 3.8 3.9 3.6 3.7 3.1 2.9 3.0 2.9 2.4 1.9 1.9 1.9 Malta 2.9 2.7 2.4 1.7 2.1 2.2 2.1 1.8 2.1 2.2 2.2 2.2 Netherlands 1.9 2.2 3.1 2.6 2.8 2.5 2.2 2.3 1.8 1.6 1.8 2.0 Austria 3.0 3.7 3.8 3.7 2.7 2.3 2.3 2.3 2.1 1.9 2.0 2.0 Portugal 3.7 3.7 3.1 3.8 3.3 3.1 3.2 2.5 1.2 1.1 1.0 1.0 Slovenia 2.2 2.0 1.5 2.6 2.5 2.3 2.1 2.1 1.8 1.7 1.6 1.6 Slovakia 3.5 4.1 4.1 4.7 4.0 2.8 2.8 2.1 1.7 1.9 2.0 2.0 Finland 3.4 3.4 3.5 3.0 3.0 3.1 3.1 2.8 2.7 2.5 2.5 2.5 Euro area 2.5 2.8 2.7 2.9 2.7 2.3 2.2 2.2 1.9 1.8 1.8 1.6 Bulgaria 4.5 3.4 3.1 2.5 1.8 2.7 2.9 2.7 2.7 2.7 2.6 2.5 Czech Republic 1.9 1.8 2.0 2.8 4.0 3.6 3.0 2.4 2.0 2.2 2.4 2.1 Denmark 2.6 2.9 2.6 2.5 2.8 2.3 2.8 2.6 1.6 1.4 1.2 1.6 Latvia 3.8 4.7 4.4 4.1 3.3 2.6 2.5 2.2 2.1 2.0 2.1 2.1 Lithuania 3.2 4.7 4.6 4.1 3.6 2.8 2.9 3.2 3.4 2.9 2.8 2.6 Hungary 4.3 3.9 3.4 4.1 5.6 5.6 5.8 5.0 4.2 3.8 4.0 3.7 Poland 3.6 4.0 3.7 4.2 4.2 3.8 3.6 3.2 3.0 3.1 2.9 2.7 Romania 7.5 8.3 4.2 3.4 2.7 2.3 3.8 3.5 3.5 3.4 3.2 3.3 Sweden 1.3 1.7 1.6 0.9 0.9 1.1 1.2 1.5 1.3 1.4 1.5 1.7 United Kingdom 4.1 4.4 4.7 4.7 3.5 3.1 2.8 2.2 2.1 1.9 1.8 2.0 EU 2.9 3.2 3.1 3.2 2.9 2.5 2.4 2.3 2.0 1.9 1.9 1.7 Croatia : : : : : : : : : : : : USA 2.1 3.3 3.8 3.3 2.8 2.5 2.2 2.3 2.2 1.9 1.9 2.0 Japan -0.5 -0.4 0.1 -0.1 -0.4 -0.5 -0.3 0.0 0.9 1.0 0.8 0.6
TABLE 18 : Price deflator of exports of goods in national currency (percentage change on preceding year, 1992-2013)5-year Spring 2012 Autumn 2011
averages forecast forecast1992-96 1997-01 2002-06 2007 2008 2009 2010 2011 2012 2013 2012 2013
Belgium -0.7 1.3 1.2 2.0 3.3 -6.4 4.9 5.2 2.4 1.8 2.2 1.9 Germany 0.4 0.5 0.0 0.7 0.9 -2.4 2.5 3.0 2.9 1.6 1.8 1.6 Estonia : 3.9 2.3 7.0 5.1 -5.3 4.9 4.2 3.1 2.0 1.1 1.7 Ireland 0.9 3.3 -2.5 -2.7 -3.3 1.3 1.1 -0.6 -1.3 -1.3 0.9 1.0 Greece 7.5 4.1 2.2 2.4 5.4 -5.0 7.9 8.6 -0.3 -0.2 0.4 0.5 Spain 3.5 2.1 1.7 2.0 2.0 -4.8 3.1 5.6 2.0 1.0 2.0 0.5 France -0.8 0.0 -0.2 2.0 3.4 -4.2 1.8 3.5 1.3 1.2 2.1 2.0 Italy 4.7 2.0 1.1 2.5 2.8 -3.1 2.8 4.4 4.1 1.8 3.0 2.5 Cyprus : 3.7 0.6 2.7 1.7 0.3 1.5 2.1 1.6 2.1 2.7 2.1 Luxembourg -0.2 0.5 2.4 2.7 5.9 -4.2 2.5 8.0 1.5 2.5 3.0 2.5 Malta : 2.4 -1.1 -1.0 -2.0 -4.1 4.2 12.9 5.2 1.9 4.1 1.9 Netherlands -0.9 0.9 0.5 1.6 4.6 -8.2 6.8 5.1 2.0 1.0 0.8 0.8 Austria 0.3 0.5 0.9 1.4 2.0 -4.1 3.5 3.9 3.0 1.6 1.9 1.7 Portugal 1.2 1.8 0.9 1.4 2.2 -6.1 5.3 6.7 2.3 1.6 1.6 1.7 Slovenia 39.9 5.3 2.8 2.1 0.7 -1.5 2.4 4.4 2.6 1.8 1.9 1.9 Slovakia : 5.0 1.7 0.5 0.9 -5.4 3.1 3.9 3.6 1.8 0.4 1.3 Finland 3.7 -1.6 -0.6 0.5 -1.5 -8.5 4.8 5.7 1.5 2.1 1.5 2.1 Euro area 1.6 1.0 0.4 1.4 2.1 -4.2 3.3 4.0 2.5 1.4 1.9 1.6 Bulgaria : : 4.8 5.9 8.1 -13.2 11.0 11.1 6.0 1.2 1.8 3.2 Czech Republic : 2.1 -1.7 0.2 -4.8 0.2 -1.1 0.8 4.0 0.5 -0.2 0.3 Denmark 0.2 1.3 1.7 2.2 5.4 -6.2 5.4 5.1 1.0 2.2 2.1 2.3 Latvia : -0.2 8.8 13.4 7.7 -9.4 8.7 12.2 2.2 2.0 1.4 2.0 Lithuania : 0.8 2.9 5.6 13.2 -16.7 12.4 13.5 5.5 2.5 2.0 2.0 Hungary : 8.8 -0.3 -4.5 0.6 2.1 1.7 3.4 7.6 1.9 7.9 1.9 Poland 21.1 6.5 3.8 2.8 -1.8 13.5 0.4 6.7 4.5 1.0 3.4 1.0 Romania 114.5 50.8 9.8 0.5 21.0 3.4 6.3 9.5 6.9 5.0 3.3 5.0 Sweden 2.1 0.0 0.2 1.9 3.1 1.2 -0.8 -1.8 1.0 1.5 1.0 1.5 United Kingdom 3.1 -2.5 0.5 -1.0 12.2 2.9 5.1 7.1 3.7 0.9 0.8 1.4 EU : 7.1 0.5 1.1 3.0 -2.7 3.3 4.2 2.8 1.4 1.9 1.6 Croatia : 6.9 2.2 5.9 5.6 -0.3 1.9 8.1 2.4 2.0 2.0 1.6 USA -0.3 -1.3 2.3 3.4 5.0 -6.8 4.9 7.3 2.0 0.7 3.2 2.2 Japan -2.6 -1.9 -0.4 2.1 -4.1 -10.9 -1.6 -2.4 -0.3 -0.7 -0.7 -0.7
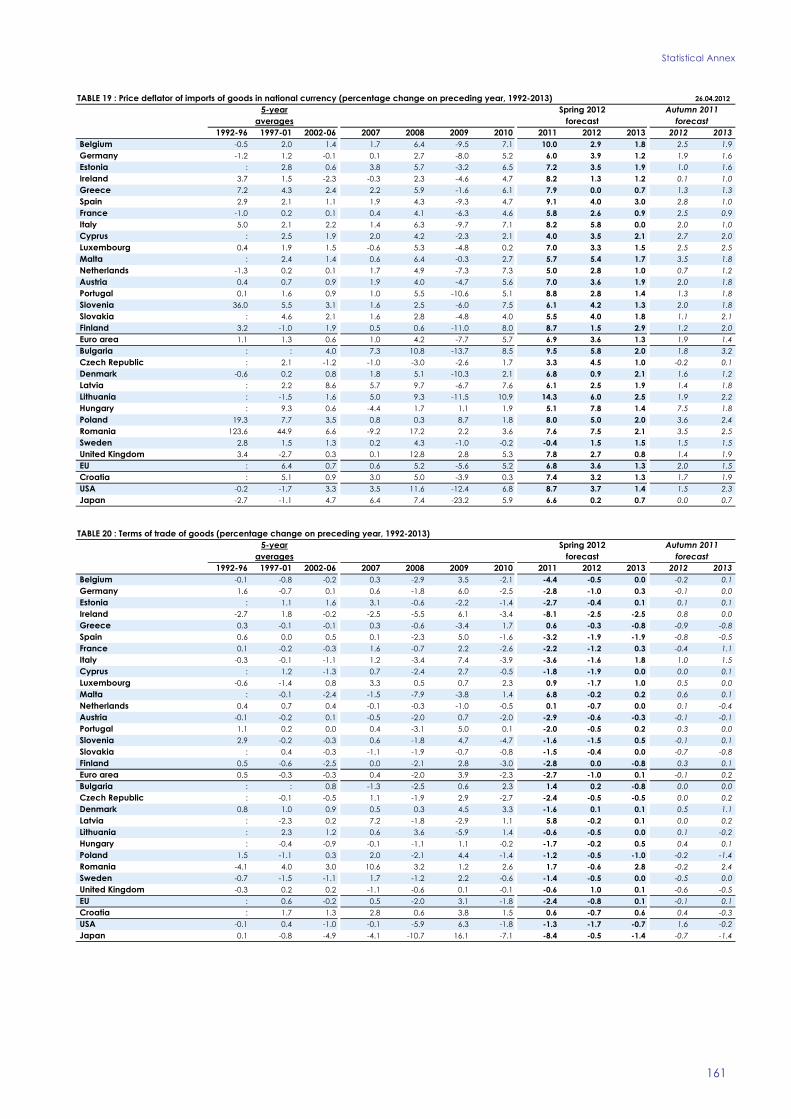
Statistical Annex
161
TABLE 19 : Price deflator of imports of goods in national currency (percentage change on preceding year, 1992-2013) 26.04.20125-year Spring 2012 Autumn 2011
averages forecast forecast1992-96 1997-01 2002-06 2007 2008 2009 2010 2011 2012 2013 2012 2013
Belgium -0.5 2.0 1.4 1.7 6.4 -9.5 7.1 10.0 2.9 1.8 2.5 1.9 Germany -1.2 1.2 -0.1 0.1 2.7 -8.0 5.2 6.0 3.9 1.2 1.9 1.6 Estonia : 2.8 0.6 3.8 5.7 -3.2 6.5 7.2 3.5 1.9 1.0 1.6 Ireland 3.7 1.5 -2.3 -0.3 2.3 -4.6 4.7 8.2 1.3 1.2 0.1 1.0 Greece 7.2 4.3 2.4 2.2 5.9 -1.6 6.1 7.9 0.0 0.7 1.3 1.3 Spain 2.9 2.1 1.1 1.9 4.3 -9.3 4.7 9.1 4.0 3.0 2.8 1.0 France -1.0 0.2 0.1 0.4 4.1 -6.3 4.6 5.8 2.6 0.9 2.5 0.9 Italy 5.0 2.1 2.2 1.4 6.3 -9.7 7.1 8.2 5.8 0.0 2.0 1.0 Cyprus : 2.5 1.9 2.0 4.2 -2.3 2.1 4.0 3.5 2.1 2.7 2.0 Luxembourg 0.4 1.9 1.5 -0.6 5.3 -4.8 0.2 7.0 3.3 1.5 2.5 2.5 Malta : 2.4 1.4 0.6 6.4 -0.3 2.7 5.7 5.4 1.7 3.5 1.8 Netherlands -1.3 0.2 0.1 1.7 4.9 -7.3 7.3 5.0 2.8 1.0 0.7 1.2 Austria 0.4 0.7 0.9 1.9 4.0 -4.7 5.6 7.0 3.6 1.9 2.0 1.8 Portugal 0.1 1.6 0.9 1.0 5.5 -10.6 5.1 8.8 2.8 1.4 1.3 1.8 Slovenia 36.0 5.5 3.1 1.6 2.5 -6.0 7.5 6.1 4.2 1.3 2.0 1.8 Slovakia : 4.6 2.1 1.6 2.8 -4.8 4.0 5.5 4.0 1.8 1.1 2.1 Finland 3.2 -1.0 1.9 0.5 0.6 -11.0 8.0 8.7 1.5 2.9 1.2 2.0 Euro area 1.1 1.3 0.6 1.0 4.2 -7.7 5.7 6.9 3.6 1.3 1.9 1.4 Bulgaria : : 4.0 7.3 10.8 -13.7 8.5 9.5 5.8 2.0 1.8 3.2 Czech Republic : 2.1 -1.2 -1.0 -3.0 -2.6 1.7 3.3 4.5 1.0 -0.2 0.1 Denmark -0.6 0.2 0.8 1.8 5.1 -10.3 2.1 6.8 0.9 2.1 1.6 1.2 Latvia : 2.2 8.6 5.7 9.7 -6.7 7.6 6.1 2.5 1.9 1.4 1.8 Lithuania : -1.5 1.6 5.0 9.3 -11.5 10.9 14.3 6.0 2.5 1.9 2.2 Hungary : 9.3 0.6 -4.4 1.7 1.1 1.9 5.1 7.8 1.4 7.5 1.8 Poland 19.3 7.7 3.5 0.8 0.3 8.7 1.8 8.0 5.0 2.0 3.6 2.4 Romania 123.6 44.9 6.6 -9.2 17.2 2.2 3.6 7.6 7.5 2.1 3.5 2.5 Sweden 2.8 1.5 1.3 0.2 4.3 -1.0 -0.2 -0.4 1.5 1.5 1.5 1.5 United Kingdom 3.4 -2.7 0.3 0.1 12.8 2.8 5.3 7.8 2.7 0.8 1.4 1.9 EU : 6.4 0.7 0.6 5.2 -5.6 5.2 6.8 3.6 1.3 2.0 1.5 Croatia : 5.1 0.9 3.0 5.0 -3.9 0.3 7.4 3.2 1.3 1.7 1.9 USA -0.2 -1.7 3.3 3.5 11.6 -12.4 6.8 8.7 3.7 1.4 1.5 2.3 Japan -2.7 -1.1 4.7 6.4 7.4 -23.2 5.9 6.6 0.2 0.7 0.0 0.7
TABLE 20 : Terms of trade of goods (percentage change on preceding year, 1992-2013)5-year Spring 2012 Autumn 2011
averages forecast forecast1992-96 1997-01 2002-06 2007 2008 2009 2010 2011 2012 2013 2012 2013
Belgium -0.1 -0.8 -0.2 0.3 -2.9 3.5 -2.1 -4.4 -0.5 0.0 -0.2 0.1 Germany 1.6 -0.7 0.1 0.6 -1.8 6.0 -2.5 -2.8 -1.0 0.3 -0.1 0.0 Estonia : 1.1 1.6 3.1 -0.6 -2.2 -1.4 -2.7 -0.4 0.1 0.1 0.1 Ireland -2.7 1.8 -0.2 -2.5 -5.5 6.1 -3.4 -8.1 -2.5 -2.5 0.8 0.0 Greece 0.3 -0.1 -0.1 0.3 -0.6 -3.4 1.7 0.6 -0.3 -0.8 -0.9 -0.8 Spain 0.6 0.0 0.5 0.1 -2.3 5.0 -1.6 -3.2 -1.9 -1.9 -0.8 -0.5 France 0.1 -0.2 -0.3 1.6 -0.7 2.2 -2.6 -2.2 -1.2 0.3 -0.4 1.1 Italy -0.3 -0.1 -1.1 1.2 -3.4 7.4 -3.9 -3.6 -1.6 1.8 1.0 1.5 Cyprus : 1.2 -1.3 0.7 -2.4 2.7 -0.5 -1.8 -1.9 0.0 0.0 0.1 Luxembourg -0.6 -1.4 0.8 3.3 0.5 0.7 2.3 0.9 -1.7 1.0 0.5 0.0 Malta : -0.1 -2.4 -1.5 -7.9 -3.8 1.4 6.8 -0.2 0.2 0.6 0.1 Netherlands 0.4 0.7 0.4 -0.1 -0.3 -1.0 -0.5 0.1 -0.7 0.0 0.1 -0.4 Austria -0.1 -0.2 0.1 -0.5 -2.0 0.7 -2.0 -2.9 -0.6 -0.3 -0.1 -0.1 Portugal 1.1 0.2 0.0 0.4 -3.1 5.0 0.1 -2.0 -0.5 0.2 0.3 0.0 Slovenia 2.9 -0.2 -0.3 0.6 -1.8 4.7 -4.7 -1.6 -1.5 0.5 -0.1 0.1 Slovakia : 0.4 -0.3 -1.1 -1.9 -0.7 -0.8 -1.5 -0.4 0.0 -0.7 -0.8 Finland 0.5 -0.6 -2.5 0.0 -2.1 2.8 -3.0 -2.8 0.0 -0.8 0.3 0.1 Euro area 0.5 -0.3 -0.3 0.4 -2.0 3.9 -2.3 -2.7 -1.0 0.1 -0.1 0.2 Bulgaria : : 0.8 -1.3 -2.5 0.6 2.3 1.4 0.2 -0.8 0.0 0.0 Czech Republic : -0.1 -0.5 1.1 -1.9 2.9 -2.7 -2.4 -0.5 -0.5 0.0 0.2 Denmark 0.8 1.0 0.9 0.5 0.3 4.5 3.3 -1.6 0.1 0.1 0.5 1.1 Latvia : -2.3 0.2 7.2 -1.8 -2.9 1.1 5.8 -0.2 0.1 0.0 0.2 Lithuania : 2.3 1.2 0.6 3.6 -5.9 1.4 -0.6 -0.5 0.0 0.1 -0.2 Hungary : -0.4 -0.9 -0.1 -1.1 1.1 -0.2 -1.7 -0.2 0.5 0.4 0.1 Poland 1.5 -1.1 0.3 2.0 -2.1 4.4 -1.4 -1.2 -0.5 -1.0 -0.2 -1.4 Romania -4.1 4.0 3.0 10.6 3.2 1.2 2.6 1.7 -0.6 2.8 -0.2 2.4 Sweden -0.7 -1.5 -1.1 1.7 -1.2 2.2 -0.6 -1.4 -0.5 0.0 -0.5 0.0 United Kingdom -0.3 0.2 0.2 -1.1 -0.6 0.1 -0.1 -0.6 1.0 0.1 -0.6 -0.5 EU : 0.6 -0.2 0.5 -2.0 3.1 -1.8 -2.4 -0.8 0.1 -0.1 0.1 Croatia : 1.7 1.3 2.8 0.6 3.8 1.5 0.6 -0.7 0.6 0.4 -0.3 USA -0.1 0.4 -1.0 -0.1 -5.9 6.3 -1.8 -1.3 -1.7 -0.7 1.6 -0.2 Japan 0.1 -0.8 -4.9 -4.1 -10.7 16.1 -7.1 -8.4 -0.5 -1.4 -0.7 -1.4

European Economic Forecast, Spring 2012
162
TABLE 21 : Total population (percentage change on preceding year, 1992-2013) 26.04.20125-year Spring 2012 Autumn 2011
averages forecast forecast1992-96 1997-01 2002-06 2007 2008 2009 2010 2011 2012 2013 2012 2013
Belgium 0.3 0.2 0.5 0.7 0.8 0.8 0.9 0.9 0.8 0.8 0.8 0.8 Germany 0.5 0.1 0.0 -0.1 -0.2 -0.3 -0.1 0.0 0.0 0.0 -0.1 -0.1 Estonia -2.0 -0.8 -0.3 -0.2 -0.1 0.0 0.0 0.0 0.0 0.0 0.0 0.0 Ireland 0.6 1.3 2.0 2.4 1.8 0.6 0.2 0.2 0.4 0.7 0.5 0.6 Greece 0.9 0.4 0.4 0.4 0.4 0.4 0.2 0.0 0.3 0.4 0.2 0.2 Spain 0.2 0.6 1.6 1.8 1.6 0.7 0.3 0.1 -0.1 -0.1 -0.1 -0.1 France 0.4 0.5 0.7 0.6 0.6 0.6 0.5 0.6 0.5 0.6 0.5 0.6 Italy 0.0 0.0 0.7 0.7 0.8 0.6 0.5 0.5 0.5 0.4 0.3 0.3 Cyprus 2.1 1.2 1.9 1.5 1.2 0.9 0.5 0.8 0.8 0.8 0.6 0.7 Luxembourg 1.3 1.3 1.4 1.6 1.7 1.9 1.8 2.3 1.8 1.7 1.5 1.4 Malta 0.9 0.7 0.7 0.7 0.8 0.4 0.5 0.7 0.5 0.4 0.5 0.5 Netherlands 0.6 0.7 0.4 0.2 0.4 0.5 0.5 0.5 0.5 0.5 0.2 0.3 Austria 0.5 0.2 0.6 0.4 0.4 0.3 0.3 0.3 0.3 0.3 0.3 0.3 Portugal 0.2 0.5 0.6 0.2 0.1 0.1 0.0 0.1 0.0 0.1 0.0 0.0 Slovenia -0.1 0.0 0.2 0.5 0.2 1.0 0.4 0.2 0.2 0.2 0.2 0.3 Slovakia 0.3 0.0 0.0 0.1 0.2 0.2 0.2 0.1 0.1 0.1 0.1 0.1 Finland 0.4 0.2 0.3 0.4 0.5 0.5 0.5 0.4 0.5 0.2 0.5 0.5 Euro area 0.3 0.3 0.6 0.6 0.5 0.4 0.3 0.3 0.3 0.3 0.2 0.2 Bulgaria -0.6 -1.1 -0.5 -0.5 -0.5 -0.5 -0.7 -1.0 -1.0 -1.0 -0.7 -0.7 Czech Republic 0.0 -0.2 0.1 0.5 1.0 0.6 0.2 0.2 0.3 0.3 0.3 0.3 Denmark 0.4 0.4 0.3 0.4 0.6 0.5 0.4 0.3 0.3 0.3 0.3 0.3 Latvia -1.5 -0.8 -0.6 -0.5 -0.4 -0.5 -0.7 -0.8 -0.7 -0.6 -0.7 -0.6 Lithuania -0.6 -0.7 -0.5 -0.5 -0.5 -0.6 -1.6 -2.0 -0.8 -0.5 -0.8 -0.5 Hungary -0.1 -0.2 -0.2 -0.2 -0.2 -0.2 -0.2 -0.3 -0.1 -0.1 -0.3 -0.3 Poland 0.2 0.0 -0.1 0.0 0.0 0.1 0.1 0.0 0.0 0.0 0.0 0.0 Romania -0.3 -0.2 -0.7 -0.2 -0.2 -0.2 -0.2 -0.4 -0.2 -0.2 -0.2 -0.2 Sweden 0.5 0.1 0.4 0.7 0.8 0.9 0.8 0.7 0.7 0.7 0.7 0.7 United Kingdom 0.3 0.3 0.5 0.7 0.7 0.6 0.8 0.7 0.7 0.7 0.7 0.7 EU 0.2 0.2 0.4 0.5 0.5 0.3 0.3 0.3 0.3 0.3 0.2 0.2 Croatia -0.6 -0.5 0.0 -0.1 -0.1 -0.1 -0.3 0.0 0.0 0.0 0.0 0.0 USA 1.2 1.1 0.9 1.0 0.9 0.9 0.8 0.7 0.8 0.8 0.8 0.8 Japan 0.3 0.2 0.1 0.0 -0.1 -0.1 0.4 -0.1 -0.1 -0.1 -0.1 -0.1
TABLE 22 : Total employment (percentage change on preceding year, 1992-2013)5-year Spring 2012 Autumn 2011
averages forecast forecast1992-96 1997-01 2002-06 2007 2008 2009 2010 2011 2012 2013 2012 2013
Belgium 0.1 1.4 0.7 1.6 1.8 -0.2 0.8 1.3 0.0 0.4 0.4 0.5 Germany -0.5 0.9 -0.1 1.7 1.2 0.0 0.5 1.3 1.0 0.4 0.4 0.2 Estonia -5.2 -1.4 2.0 0.8 0.2 -10.0 -4.8 7.0 0.6 1.2 1.2 1.2 Ireland 2.5 5.6 3.2 3.6 -1.1 -8.1 -4.2 -2.1 -0.6 0.7 -0.6 0.6 Greece 0.9 0.7 2.1 1.6 0.8 -0.2 -1.9 -6.7 -4.8 -0.2 -2.8 0.4 Spain -0.3 4.2 2.9 3.0 -0.2 -6.5 -2.6 -2.0 -3.7 -1.5 -0.4 0.5 France -0.4 1.7 0.6 1.4 0.7 -1.4 0.1 0.7 0.4 0.4 0.4 0.4 Italy -0.9 1.1 0.8 1.0 -0.4 -2.9 -0.9 0.1 -1.1 -0.1 -0.2 0.3 Cyprus : 1.6 3.0 3.2 2.1 -0.5 0.0 0.5 -1.5 0.6 -0.2 0.4 Luxembourg 2.5 4.7 2.7 4.5 4.7 1.0 1.8 2.7 2.0 1.1 1.7 2.2 Malta 1.5 0.8 0.7 3.2 2.6 -0.3 2.3 2.4 0.6 1.1 0.8 1.4 Netherlands 1.0 2.4 -0.2 2.2 1.5 -1.1 -0.5 0.2 -0.2 -0.1 -0.1 0.0 Austria 0.0 0.6 0.5 1.7 1.8 -1.4 0.6 1.4 0.4 0.7 0.2 0.8 Portugal -0.8 2.1 0.0 0.0 0.5 -2.6 -1.5 -1.5 -3.3 0.2 -1.4 0.2 Slovenia : 0.3 0.5 3.3 2.6 -1.8 -2.5 -1.7 -1.7 -1.0 -0.1 0.2 Slovakia : -1.1 0.9 2.1 3.2 -2.0 -1.5 1.8 0.5 0.7 0.1 1.1 Finland -2.3 2.2 0.9 2.2 2.6 -2.6 -1.2 1.2 -0.1 -0.1 0.3 0.2 Euro area -0.3 1.6 0.8 1.7 0.7 -2.0 -0.6 0.1 -0.5 0.0 0.0 0.3 Bulgaria : -2.3 2.4 3.2 2.6 -2.6 -4.7 -4.2 -1.9 -0.2 0.1 0.9 Czech Republic : -1.2 0.6 2.1 2.3 -1.2 -1.7 0.3 -0.1 0.2 -0.1 0.3 Denmark 0.1 1.0 0.3 2.8 1.7 -3.3 -2.2 -0.5 0.1 0.3 0.3 0.3 Latvia -7.4 0.0 2.5 3.6 0.9 -13.2 -4.8 3.4 0.7 1.2 0.7 1.3 Lithuania -2.7 -2.1 2.0 2.8 -0.7 -6.8 -5.1 2.0 0.6 0.5 2.0 1.9 Hungary : 1.1 -0.2 0.0 -1.4 -2.8 0.3 0.3 1.0 1.4 1.1 0.0 Poland : -1.1 0.4 4.5 3.9 0.4 0.5 1.0 0.3 0.4 0.2 0.4 Romania -2.8 -2.5 -2.6 0.4 0.0 -2.0 -1.4 0.4 0.4 1.1 0.6 0.6 Sweden -1.9 1.4 0.1 2.3 0.9 -2.4 1.1 2.2 0.1 0.4 0.2 0.4 United Kingdom 0.0 1.2 0.9 0.7 0.7 -1.6 0.2 0.4 0.4 0.5 0.5 0.5 EU : 0.9 0.6 1.7 0.9 -1.9 -0.5 0.2 -0.2 0.2 0.1 0.4 Croatia : -1.2 2.1 3.5 1.1 -1.8 -4.0 -3.2 -1.3 0.0 -0.1 0.6 USA 1.8 1.7 0.7 0.9 -0.7 -5.0 -0.6 0.6 1.8 0.8 0.4 0.7 Japan 0.4 -0.6 -0.2 0.4 -0.3 -1.5 -0.4 -0.2 0.1 0.1 0.1 0.1Note : See note 6 on concepts and sources where countries using full time equivalents are listed.

Statistical Annex
163
TABLE 23 : Unemployment rate (number of unemployed as a percentage of total labour force, 1992-2013) ¹ 26.04.20125-year Spring 2012 Autumn 2011
averages forecast forecast1992-96 1997-01 2002-06 2007 2008 2009 2010 2011 2012 2013 2012 2013
Belgium 8.9 8.1 8.2 7.5 7.0 7.9 8.3 7.2 7.6 7.9 7.7 7.9 Germany 8.0 8.7 10.1 8.7 7.5 7.8 7.1 5.9 5.5 5.3 5.9 5.8 Estonia : 11.3 8.8 4.7 5.5 13.8 16.9 12.5 11.6 10.5 11.2 10.1 Ireland 13.9 6.2 4.5 4.6 6.3 11.9 13.7 14.4 14.3 13.6 14.3 13.6 Greece 8.8 11.0 9.9 8.3 7.7 9.5 12.6 17.7 19.7 19.6 18.4 18.4 Spain 19.3 13.8 10.3 8.3 11.3 18.0 20.1 21.7 24.4 25.1 20.9 20.3 France 10.5 9.9 9.0 8.4 7.8 9.5 9.8 9.7 10.2 10.3 10.0 10.1 Italy 10.3 10.5 7.9 6.1 6.7 7.8 8.4 8.4 9.5 9.7 8.2 8.2 Cyprus : 3.8 4.4 3.9 3.7 5.3 6.2 7.8 9.8 9.9 7.5 7.1 Luxembourg 2.7 2.4 4.1 4.2 4.9 5.1 4.6 4.8 5.2 5.9 4.8 4.7 Malta 5.2 6.8 7.3 6.5 6.0 6.9 6.9 6.5 6.6 6.3 6.8 6.6 Netherlands 6.0 3.8 4.4 3.6 3.1 3.7 4.5 4.4 5.7 6.2 4.7 4.8 Austria 3.9 4.0 4.7 4.4 3.8 4.8 4.4 4.2 4.3 4.2 4.5 4.2 Portugal 6.2 5.3 7.5 8.9 8.5 10.6 12.0 12.9 15.5 15.1 13.6 13.7 Slovenia : 6.9 6.4 4.9 4.4 5.9 7.3 8.2 9.1 9.4 8.4 8.2 Slovakia : 15.8 16.8 11.1 9.5 12.0 14.4 13.5 13.2 12.7 13.2 12.3 Finland 14.9 10.6 8.6 6.9 6.4 8.2 8.4 7.8 7.9 7.7 7.7 7.4 Euro area 10.3 9.5 8.9 7.6 7.6 9.6 10.1 10.2 11.0 11.0 10.1 10.0 Bulgaria : 15.7 12.6 6.9 5.6 6.8 10.2 11.2 12.0 11.9 12.1 11.3 Czech Republic : 7.3 7.7 5.3 4.4 6.7 7.3 6.7 7.2 7.2 7.0 6.7 Denmark 7.8 4.8 4.8 3.8 3.4 6.0 7.5 7.6 7.7 7.6 7.3 7.1 Latvia 13.8 14.0 9.8 6.0 7.5 17.1 18.7 16.1 14.8 13.2 15.0 13.5 Lithuania 5.0 13.3 10.3 4.3 5.8 13.7 17.8 15.4 13.8 12.7 13.3 11.6 Hungary : 7.3 6.5 7.4 7.8 10.0 11.2 10.9 10.6 9.6 11.0 11.3 Poland 13.4 13.8 18.1 9.6 7.1 8.2 9.6 9.7 9.8 9.6 9.2 8.6 Romania : 6.1 7.4 6.4 5.8 6.9 7.3 7.4 7.2 7.1 7.8 7.4 Sweden 8.5 7.2 7.0 6.1 6.2 8.3 8.4 7.5 7.7 7.7 7.4 7.3 United Kingdom 9.1 5.8 5.0 5.3 5.6 7.6 7.8 8.0 8.5 8.4 8.6 8.5 EU : 8.9 8.9 7.2 7.1 9.0 9.7 9.7 10.3 10.3 9.8 9.6 Croatia : 12.5 13.3 9.0 8.4 9.1 11.8 13.2 13.4 12.7 13.2 12.4 USA 6.3 4.5 5.4 4.6 5.8 9.3 9.6 9.0 8.2 8.0 9.0 8.8 Japan 2.8 4.4 4.8 3.9 4.0 5.1 5.1 4.9 4.8 4.7 4.8 4.7¹ Series following Eurostat definition, based on the labour force survey.
TABLE 24 : Compensation of employees per head (percentage change on preceding year, 1992-2013)5-year Spring 2012 Autumn 2011
averages forecast forecast1992-96 1997-01 2002-06 2007 2008 2009 2010 2011 2012 2013 2012 2013
Belgium 3.4 2.8 2.5 3.4 3.6 1.1 1.4 3.3 3.1 2.3 2.9 2.4 Germany 4.3 1.2 0.8 0.8 2.1 0.0 2.0 3.0 2.7 2.8 2.5 2.6 Estonia : 13.2 11.6 25.0 9.7 -3.4 1.4 1.4 4.0 5.4 4.3 4.8 Ireland 4.5 5.9 5.4 5.8 5.4 -1.2 -3.2 -1.4 -0.8 0.1 0.4 0.9 Greece 10.8 7.0 5.1 5.0 6.1 4.0 -3.3 -3.2 -8.0 -1.3 -2.8 -1.2 Spain 6.0 2.5 3.4 4.7 6.1 4.3 0.0 0.8 0.1 0.1 1.1 1.0 France 2.6 2.1 3.1 2.5 2.4 1.8 2.1 2.8 2.1 2.0 2.1 2.1 Italy 4.8 2.0 3.1 2.3 3.8 1.7 2.3 1.4 1.5 1.4 1.5 1.4 Cyprus : 4.5 4.0 3.0 3.2 5.3 -0.2 2.0 -0.8 -0.3 1.9 1.8 Luxembourg 3.9 3.2 2.9 3.7 2.2 1.8 2.6 2.0 3.2 3.5 4.5 3.4 Malta 7.8 4.9 3.5 1.8 4.7 3.3 -0.4 0.4 1.5 2.4 2.4 2.3 Netherlands 2.9 4.1 3.4 3.4 3.3 2.5 1.4 1.7 1.9 1.5 2.3 2.1 Austria 3.9 2.2 2.3 2.6 3.1 2.2 1.4 3.0 3.6 1.9 1.9 1.8 Portugal 9.4 5.4 3.2 3.6 3.0 2.8 1.4 -0.8 -3.1 -0.6 -2.3 0.8 Slovenia : 10.2 7.0 6.2 7.2 1.8 4.3 2.0 0.5 1.0 2.1 2.8 Slovakia : 10.7 8.4 8.7 7.0 3.6 4.4 0.9 2.3 2.6 2.8 2.9 Finland 2.5 3.3 2.9 3.7 4.4 2.3 3.5 2.7 3.3 3.3 3.2 3.2 Euro area 4.3 2.2 2.4 2.6 3.3 1.7 1.7 2.2 1.9 1.9 2.0 2.0 Bulgaria : 83.1 6.4 12.7 16.3 9.4 11.2 7.3 5.2 5.1 7.2 7.1 Czech Republic : 8.3 6.7 6.3 4.2 -1.2 3.7 1.6 2.0 2.1 2.3 1.9 Denmark 3.2 3.8 3.6 3.6 3.5 2.8 2.5 1.7 1.7 1.6 2.1 2.0 Latvia : 7.7 15.0 35.1 15.7 -12.7 -5.5 4.2 1.7 2.2 2.8 3.2 Lithuania : 9.1 10.5 13.9 14.3 -9.9 -0.9 3.4 2.1 3.3 3.0 4.5 Hungary : 14.5 9.3 6.4 6.8 -1.4 -2.3 5.8 3.7 2.9 3.2 3.8 Poland 37.8 13.8 1.9 4.9 8.9 3.5 5.7 5.1 4.7 5.1 4.8 6.6 Romania 118.0 71.2 19.7 22.0 31.9 -1.9 7.6 3.7 3.2 4.2 6.4 8.5 Sweden 4.8 4.0 3.0 5.2 1.5 1.6 3.0 0.8 2.9 3.1 2.7 2.7 United Kingdom 3.6 5.1 4.0 4.9 1.7 2.7 3.6 1.9 2.4 2.6 2.5 3.0 EU : 3.9 2.8 3.2 3.2 1.8 2.3 2.2 2.1 2.1 2.2 2.3 Croatia : 10.8 5.9 5.7 9.3 1.1 5.3 1.5 0.9 1.3 0.4 0.8 USA 3.0 4.4 3.9 3.9 3.3 2.1 2.7 3.2 2.5 4.1 2.5 2.5 Japan 1.2 0.0 -1.3 -1.0 0.2 -3.8 0.2 1.0 1.2 1.2 1.2 1.2Note : See note 6 on concepts and sources where countries using full time equivalents are listed.
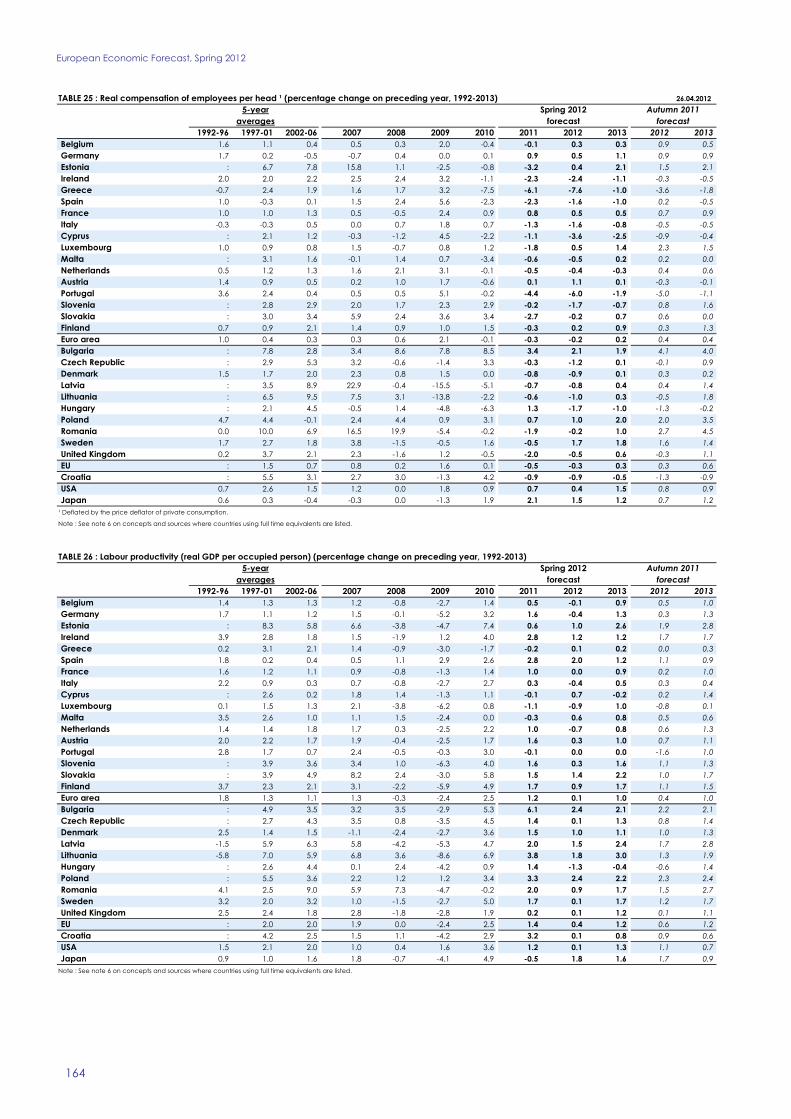
European Economic Forecast, Spring 2012
164
TABLE 25 : Real compensation of employees per head ¹ (percentage change on preceding year, 1992-2013) 26.04.20125-year Spring 2012 Autumn 2011
averages forecast forecast1992-96 1997-01 2002-06 2007 2008 2009 2010 2011 2012 2013 2012 2013
Belgium 1.6 1.1 0.4 0.5 0.3 2.0 -0.4 -0.1 0.3 0.3 0.9 0.5 Germany 1.7 0.2 -0.5 -0.7 0.4 0.0 0.1 0.9 0.5 1.1 0.9 0.9 Estonia : 6.7 7.8 15.8 1.1 -2.5 -0.8 -3.2 0.4 2.1 1.5 2.1 Ireland 2.0 2.0 2.2 2.5 2.4 3.2 -1.1 -2.3 -2.4 -1.1 -0.3 -0.5 Greece -0.7 2.4 1.9 1.6 1.7 3.2 -7.5 -6.1 -7.6 -1.0 -3.6 -1.8 Spain 1.0 -0.3 0.1 1.5 2.4 5.6 -2.3 -2.3 -1.6 -1.0 0.2 -0.5 France 1.0 1.0 1.3 0.5 -0.5 2.4 0.9 0.8 0.5 0.5 0.7 0.9 Italy -0.3 -0.3 0.5 0.0 0.7 1.8 0.7 -1.3 -1.6 -0.8 -0.5 -0.5 Cyprus : 2.1 1.2 -0.3 -1.2 4.5 -2.2 -1.1 -3.6 -2.5 -0.9 -0.4 Luxembourg 1.0 0.9 0.8 1.5 -0.7 0.8 1.2 -1.8 0.5 1.4 2.3 1.5 Malta : 3.1 1.6 -0.1 1.4 0.7 -3.4 -0.6 -0.5 0.2 0.2 0.0 Netherlands 0.5 1.2 1.3 1.6 2.1 3.1 -0.1 -0.5 -0.4 -0.3 0.4 0.6 Austria 1.4 0.9 0.5 0.2 1.0 1.7 -0.6 0.1 1.1 0.1 -0.3 -0.1 Portugal 3.6 2.4 0.4 0.5 0.5 5.1 -0.2 -4.4 -6.0 -1.9 -5.0 -1.1 Slovenia : 2.8 2.9 2.0 1.7 2.3 2.9 -0.2 -1.7 -0.7 0.8 1.6 Slovakia : 3.0 3.4 5.9 2.4 3.6 3.4 -2.7 -0.2 0.7 0.6 0.0 Finland 0.7 0.9 2.1 1.4 0.9 1.0 1.5 -0.3 0.2 0.9 0.3 1.3 Euro area 1.0 0.4 0.3 0.3 0.6 2.1 -0.1 -0.3 -0.2 0.2 0.4 0.4 Bulgaria : 7.8 2.8 3.4 8.6 7.8 8.5 3.4 2.1 1.9 4.1 4.0 Czech Republic : 2.9 5.3 3.2 -0.6 -1.4 3.3 -0.3 -1.2 0.1 -0.1 0.9 Denmark 1.5 1.7 2.0 2.3 0.8 1.5 0.0 -0.8 -0.9 0.1 0.3 0.2 Latvia : 3.5 8.9 22.9 -0.4 -15.5 -5.1 -0.7 -0.8 0.4 0.4 1.4 Lithuania : 6.5 9.5 7.5 3.1 -13.8 -2.2 -0.6 -1.0 0.3 -0.5 1.8 Hungary : 2.1 4.5 -0.5 1.4 -4.8 -6.3 1.3 -1.7 -1.0 -1.3 -0.2 Poland 4.7 4.4 -0.1 2.4 4.4 0.9 3.1 0.7 1.0 2.0 2.0 3.5 Romania 0.0 10.0 6.9 16.5 19.9 -5.4 -0.2 -1.9 -0.2 1.0 2.7 4.5 Sweden 1.7 2.7 1.8 3.8 -1.5 -0.5 1.6 -0.5 1.7 1.8 1.6 1.4 United Kingdom 0.2 3.7 2.1 2.3 -1.6 1.2 -0.5 -2.0 -0.5 0.6 -0.3 1.1 EU : 1.5 0.7 0.8 0.2 1.6 0.1 -0.5 -0.3 0.3 0.3 0.6 Croatia : 5.5 3.1 2.7 3.0 -1.3 4.2 -0.9 -0.9 -0.5 -1.3 -0.9 USA 0.7 2.6 1.5 1.2 0.0 1.8 0.9 0.7 0.4 1.5 0.8 0.9 Japan 0.6 0.3 -0.4 -0.3 0.0 -1.3 1.9 2.1 1.5 1.2 0.7 1.2¹ Deflated by the price deflator of private consumption.
Note : See note 6 on concepts and sources where countries using full time equivalents are listed.
TABLE 26 : Labour productivity (real GDP per occupied person) (percentage change on preceding year, 1992-2013)5-year Spring 2012 Autumn 2011
averages forecast forecast1992-96 1997-01 2002-06 2007 2008 2009 2010 2011 2012 2013 2012 2013
Belgium 1.4 1.3 1.3 1.2 -0.8 -2.7 1.4 0.5 -0.1 0.9 0.5 1.0 Germany 1.7 1.1 1.2 1.5 -0.1 -5.2 3.2 1.6 -0.4 1.3 0.3 1.3 Estonia : 8.3 5.8 6.6 -3.8 -4.7 7.4 0.6 1.0 2.6 1.9 2.8 Ireland 3.9 2.8 1.8 1.5 -1.9 1.2 4.0 2.8 1.2 1.2 1.7 1.7 Greece 0.2 3.1 2.1 1.4 -0.9 -3.0 -1.7 -0.2 0.1 0.2 0.0 0.3 Spain 1.8 0.2 0.4 0.5 1.1 2.9 2.6 2.8 2.0 1.2 1.1 0.9 France 1.6 1.2 1.1 0.9 -0.8 -1.3 1.4 1.0 0.0 0.9 0.2 1.0 Italy 2.2 0.9 0.3 0.7 -0.8 -2.7 2.7 0.3 -0.4 0.5 0.3 0.4 Cyprus : 2.6 0.2 1.8 1.4 -1.3 1.1 -0.1 0.7 -0.2 0.2 1.4 Luxembourg 0.1 1.5 1.3 2.1 -3.8 -6.2 0.8 -1.1 -0.9 1.0 -0.8 0.1 Malta 3.5 2.6 1.0 1.1 1.5 -2.4 0.0 -0.3 0.6 0.8 0.5 0.6 Netherlands 1.4 1.4 1.8 1.7 0.3 -2.5 2.2 1.0 -0.7 0.8 0.6 1.3 Austria 2.0 2.2 1.7 1.9 -0.4 -2.5 1.7 1.6 0.3 1.0 0.7 1.1 Portugal 2.8 1.7 0.7 2.4 -0.5 -0.3 3.0 -0.1 0.0 0.0 -1.6 1.0 Slovenia : 3.9 3.6 3.4 1.0 -6.3 4.0 1.6 0.3 1.6 1.1 1.3 Slovakia : 3.9 4.9 8.2 2.4 -3.0 5.8 1.5 1.4 2.2 1.0 1.7 Finland 3.7 2.3 2.1 3.1 -2.2 -5.9 4.9 1.7 0.9 1.7 1.1 1.5 Euro area 1.8 1.3 1.1 1.3 -0.3 -2.4 2.5 1.2 0.1 1.0 0.4 1.0 Bulgaria : 4.9 3.5 3.2 3.5 -2.9 5.3 6.1 2.4 2.1 2.2 2.1 Czech Republic : 2.7 4.3 3.5 0.8 -3.5 4.5 1.4 0.1 1.3 0.8 1.4 Denmark 2.5 1.4 1.5 -1.1 -2.4 -2.7 3.6 1.5 1.0 1.1 1.0 1.3 Latvia -1.5 5.9 6.3 5.8 -4.2 -5.3 4.7 2.0 1.5 2.4 1.7 2.8 Lithuania -5.8 7.0 5.9 6.8 3.6 -8.6 6.9 3.8 1.8 3.0 1.3 1.9 Hungary : 2.6 4.4 0.1 2.4 -4.2 0.9 1.4 -1.3 -0.4 -0.6 1.4 Poland : 5.5 3.6 2.2 1.2 1.2 3.4 3.3 2.4 2.2 2.3 2.4 Romania 4.1 2.5 9.0 5.9 7.3 -4.7 -0.2 2.0 0.9 1.7 1.5 2.7 Sweden 3.2 2.0 3.2 1.0 -1.5 -2.7 5.0 1.7 0.1 1.7 1.2 1.7 United Kingdom 2.5 2.4 1.8 2.8 -1.8 -2.8 1.9 0.2 0.1 1.2 0.1 1.1 EU : 2.0 2.0 1.9 0.0 -2.4 2.5 1.4 0.4 1.2 0.6 1.2 Croatia : 4.2 2.5 1.5 1.1 -4.2 2.9 3.2 0.1 0.8 0.9 0.6 USA 1.5 2.1 2.0 1.0 0.4 1.6 3.6 1.2 0.1 1.3 1.1 0.7 Japan 0.9 1.0 1.6 1.8 -0.7 -4.1 4.9 -0.5 1.8 1.6 1.7 0.9Note : See note 6 on concepts and sources where countries using full time equivalents are listed.

Statistical Annex
165
TABLE 27 : Unit labour costs, whole economy ¹ (percentage change on preceding year, 1992-2013) 26.04.20125-year Spring 2012 Autumn 2011
averages forecast forecast1992-96 1997-01 2002-06 2007 2008 2009 2010 2011 2012 2013 2012 2013
Belgium 2.0 1.5 1.2 2.1 4.5 3.9 0.0 2.7 3.2 1.4 2.4 1.4 Germany 2.6 0.1 -0.4 -0.8 2.3 5.5 -1.1 1.4 3.0 1.5 2.1 1.3 Estonia : 4.6 5.5 17.2 14.1 1.4 -5.6 0.8 3.0 2.8 2.3 1.9 Ireland 0.6 3.1 3.6 4.3 7.5 -2.4 -6.9 -4.1 -1.9 -1.2 -1.2 -0.8 Greece 10.6 3.8 2.9 3.6 7.1 7.2 -1.7 -3.0 -8.1 -1.5 -2.8 -1.5 Spain 4.1 2.3 3.0 4.2 4.9 1.4 -2.6 -1.9 -1.8 -1.1 0.1 0.1 France 1.0 0.9 1.9 1.6 3.2 3.2 0.7 1.8 2.1 1.1 1.9 1.1 Italy 2.6 1.1 2.8 1.5 4.7 4.6 -0.4 1.0 1.9 0.9 1.2 1.0 Cyprus : 1.9 3.7 1.2 1.8 6.7 -1.3 2.0 -1.5 -0.1 1.7 0.4 Luxembourg 3.8 1.7 1.6 1.6 6.2 8.6 1.7 3.2 4.1 2.4 5.3 3.3 Malta 4.2 2.3 2.4 0.7 3.2 5.9 -0.4 0.8 0.9 1.6 1.8 1.7 Netherlands 1.5 2.7 1.6 1.7 3.0 5.2 -0.8 0.7 2.6 0.7 1.7 0.8 Austria 1.9 0.1 0.5 0.7 3.6 4.9 -0.3 1.3 3.2 0.9 1.2 0.7 Portugal 6.5 3.6 2.5 1.1 3.5 3.1 -1.5 -0.8 -3.1 -0.6 -0.6 -0.2 Slovenia : 6.1 3.3 2.6 6.2 8.7 0.3 0.4 0.2 -0.7 1.0 1.5 Slovakia : 6.6 3.3 0.5 4.4 6.9 -1.3 -0.6 1.0 0.4 1.7 1.2 Finland -1.2 1.0 0.8 0.5 6.7 8.7 -1.3 1.0 2.3 1.6 2.1 1.7 Euro area 2.5 1.1 1.5 1.4 3.8 4.2 -0.8 0.8 1.6 0.8 1.4 0.9 Bulgaria : 74.5 2.8 9.3 12.5 12.7 5.6 1.1 2.7 3.0 4.9 4.9 Czech Republic : 5.4 2.4 2.6 3.4 2.4 -0.7 0.2 1.9 0.8 1.5 0.5 Denmark 0.6 2.3 2.1 4.8 6.1 5.7 -1.0 0.3 0.6 0.5 1.1 0.6 Latvia : 1.6 8.2 27.7 20.7 -7.9 -9.8 2.1 0.3 -0.1 1.1 0.5 Lithuania : 2.0 4.4 6.6 10.4 -1.4 -7.3 -0.3 0.4 0.3 1.7 2.6 Hungary : 11.7 4.7 6.3 4.3 2.9 -3.2 4.4 5.1 3.3 3.9 2.4 Poland : 7.9 -1.7 2.6 7.5 2.2 2.2 1.7 2.2 2.8 2.4 4.1 Romania 109.4 67.1 9.8 15.2 22.9 2.9 7.9 1.7 2.3 2.5 4.9 5.6 Sweden 1.6 2.0 -0.1 4.2 3.1 4.4 -1.9 -0.9 2.7 1.4 1.5 1.0 United Kingdom 1.1 2.6 2.2 2.1 3.6 5.7 1.7 1.6 2.3 1.3 2.5 2.0 EU : 2.1 1.6 1.9 4.1 4.3 -0.4 0.9 1.8 1.0 1.7 1.2 Croatia : 6.3 3.3 4.1 8.1 5.6 2.4 -1.6 0.8 0.5 -0.5 0.2 USA 1.5 2.3 1.8 2.9 2.9 0.5 -0.9 2.0 2.3 2.8 1.4 1.8 Japan 0.3 -1.0 -2.9 -2.7 0.9 0.4 -4.4 1.6 -0.6 -0.4 -0.5 0.2¹ Compensation of employees per head divided by labour productivity per head, defined as GDP in volume divided by total employment.
Note : See note 6 on concepts and sources where countries using full time equivalents are listed.
TABLE 28 : Real unit labour costs ¹ (percentage change on preceding year, 1992-2013)5-year Spring 2012 Autumn 2011
averages forecast forecast1992-96 1997-01 2002-06 2007 2008 2009 2010 2011 2012 2013 2012 2013
Belgium -0.2 0.1 -0.9 -0.2 2.3 2.6 -1.8 0.5 1.1 -0.7 0.3 -0.8 Germany -0.3 -0.2 -1.3 -2.3 1.5 4.2 -1.7 0.6 1.4 -0.4 0.7 -0.2 Estonia : -2.0 -0.1 5.0 8.3 2.4 -6.6 -2.8 0.0 -0.2 -0.6 -0.7 Ireland -1.7 -2.5 0.2 2.9 10.1 1.7 -4.6 -3.7 -3.1 -2.3 -1.9 -2.0 Greece -0.8 -0.5 -0.2 0.0 2.2 4.3 -3.4 -4.5 -7.4 -1.1 -3.0 -1.8 Spain -0.6 -0.7 -1.1 0.9 2.5 1.3 -3.0 -3.2 -2.7 -1.7 -1.0 -1.2 France -0.5 -0.2 -0.1 -0.9 0.6 2.7 -0.1 0.2 0.6 -0.6 0.4 -0.6 Italy -1.7 -1.2 0.4 -0.8 2.1 2.4 -0.8 -0.3 -0.2 -1.3 -0.7 -0.9 Cyprus : -1.1 0.6 -3.0 -2.7 6.6 -2.9 0.0 -3.7 -2.1 -0.9 -1.8 Luxembourg 0.1 0.7 -2.5 -2.0 1.7 8.4 -3.0 -1.4 2.7 -0.6 3.5 0.6 Malta 1.2 -0.1 0.0 -2.3 0.2 3.3 -3.3 -1.5 -0.8 -1.0 -0.7 -1.0 Netherlands -0.4 -0.4 -0.6 -0.1 0.8 5.6 -2.1 -0.4 1.0 -0.9 -0.3 -0.6 Austria -0.4 -0.6 -1.0 -1.3 1.8 3.8 -2.0 -0.8 1.2 -0.5 -0.9 -1.2 Portugal 0.6 0.0 -0.4 -1.6 1.9 2.2 -2.6 -1.4 -3.8 -1.8 -1.7 -1.6 Slovenia : -1.0 -0.7 -1.5 2.0 5.6 1.4 -0.4 0.0 -2.2 -0.1 -0.1 Slovakia : 0.0 -0.7 -0.6 1.5 8.2 -1.8 -2.2 -1.0 -1.6 0.5 -0.8 Finland -2.8 -1.3 0.3 -2.4 3.7 7.2 -1.8 -2.5 -0.3 -0.6 -0.7 -0.5 Euro area -0.7 -0.6 -0.7 -1.0 1.7 3.3 -1.5 -0.5 0.2 -0.8 0.0 -0.7 Bulgaria : 1.2 -2.2 0.1 3.7 8.1 2.7 -3.7 -0.6 0.1 1.5 1.7 Czech Republic : 0.2 0.8 -0.7 1.5 0.5 1.0 0.9 -0.1 -0.3 -0.3 -0.6 Denmark -0.8 0.3 -0.2 2.4 1.8 4.6 -4.7 -0.5 -1.3 -1.0 -0.6 -1.3 Latvia : -2.6 1.1 5.8 6.9 -6.7 -7.7 -3.1 -1.8 -1.7 -0.6 -1.1 Lithuania : -0.6 1.4 -1.9 0.6 2.4 -9.1 -5.4 -1.7 -2.7 -1.3 -0.3 Hungary : -0.7 -0.3 0.8 -0.9 -0.6 -6.1 0.8 0.5 -0.3 -0.2 -1.0 Poland : -0.4 -3.8 -1.3 4.3 -1.4 0.8 -1.4 -0.9 0.5 0.4 2.1 Romania -2.5 4.6 -6.0 1.5 6.6 -1.2 1.8 -5.9 -1.2 -1.3 1.2 0.7 Sweden -0.6 0.6 -1.4 1.4 -0.1 2.3 -2.9 -1.8 1.7 0.1 0.5 -0.3 United Kingdom -1.7 0.9 -0.4 -0.2 0.5 4.0 -1.2 -0.7 -0.4 -0.9 -0.6 -0.2 EU : -0.4 -1.0 -0.8 1.4 3.2 -1.4 -0.6 0.0 -0.8 -0.1 -0.5 Croatia : 0.7 -0.5 0.0 1.9 2.2 1.3 -3.6 -0.5 -1.2 -2.3 -1.5 USA -0.6 0.4 -0.8 0.0 0.7 -0.6 -2.1 -0.1 0.4 0.5 -0.4 0.4 Japan 0.1 -0.4 -1.5 -1.8 2.2 0.9 -2.4 3.7 0.6 -1.4 -0.8 0.2¹ Nominal unit labour costs divided by GDP price deflator.
Note : See note 6 on concepts and sources where countries using full time equivalents are listed.
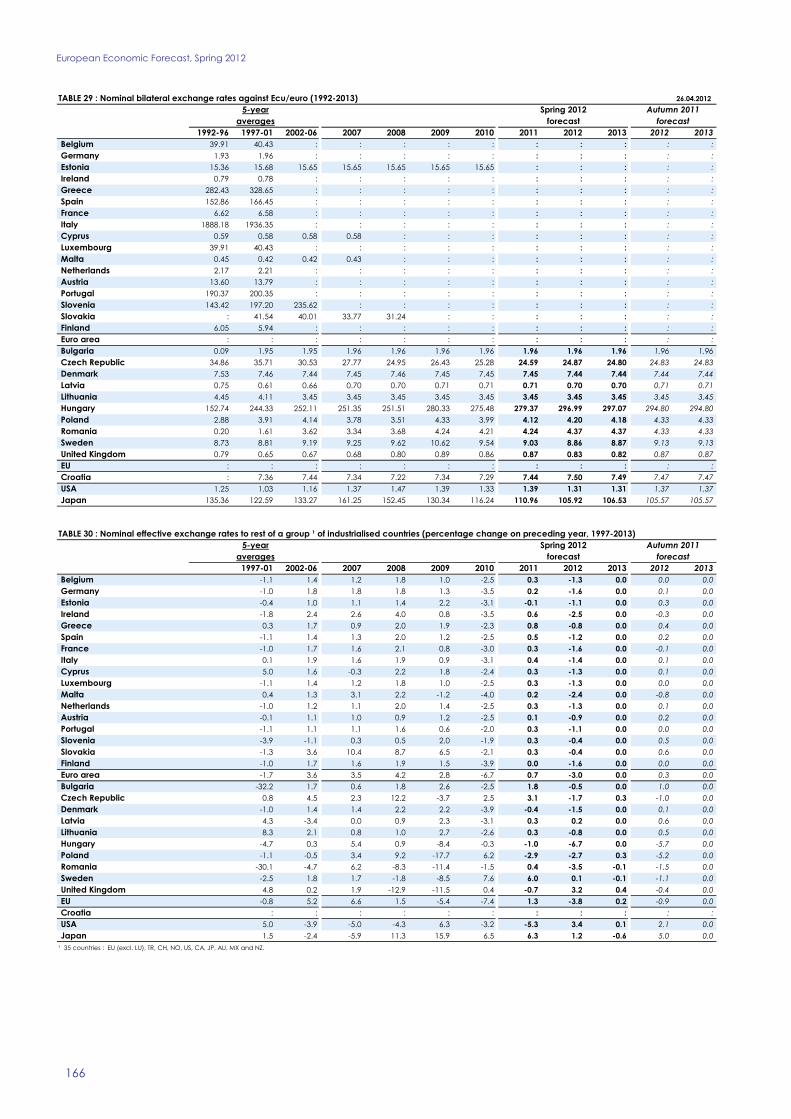
European Economic Forecast, Spring 2012
166
TABLE 29 : Nominal bilateral exchange rates against Ecu/euro (1992-2013) 26.04.20125-year Spring 2012 Autumn 2011
averages forecast forecast1992-96 1997-01 2002-06 2007 2008 2009 2010 2011 2012 2013 2012 2013
Belgium 39.91 40.43 : : : : : : : : : : Germany 1.93 1.96 : : : : : : : : : : Estonia 15.36 15.68 15.65 15.65 15.65 15.65 15.65 : : : : : Ireland 0.79 0.78 : : : : : : : : : : Greece 282.43 328.65 : : : : : : : : : : Spain 152.86 166.45 : : : : : : : : : : France 6.62 6.58 : : : : : : : : : : Italy 1888.18 1936.35 : : : : : : : : : : Cyprus 0.59 0.58 0.58 0.58 : : : : : : : : Luxembourg 39.91 40.43 : : : : : : : : : : Malta 0.45 0.42 0.42 0.43 : : : : : : : : Netherlands 2.17 2.21 : : : : : : : : : : Austria 13.60 13.79 : : : : : : : : : : Portugal 190.37 200.35 : : : : : : : : : : Slovenia 143.42 197.20 235.62 : : : : : : : : : Slovakia : 41.54 40.01 33.77 31.24 : : : : : : : Finland 6.05 5.94 : : : : : : : : : : Euro area : : : : : : : : : : : : Bulgaria 0.09 1.95 1.95 1.96 1.96 1.96 1.96 1.96 1.96 1.96 1.96 1.96 Czech Republic 34.86 35.71 30.53 27.77 24.95 26.43 25.28 24.59 24.87 24.80 24.83 24.83 Denmark 7.53 7.46 7.44 7.45 7.46 7.45 7.45 7.45 7.44 7.44 7.44 7.44 Latvia 0.75 0.61 0.66 0.70 0.70 0.71 0.71 0.71 0.70 0.70 0.71 0.71 Lithuania 4.45 4.11 3.45 3.45 3.45 3.45 3.45 3.45 3.45 3.45 3.45 3.45 Hungary 152.74 244.33 252.11 251.35 251.51 280.33 275.48 279.37 296.99 297.07 294.80 294.80 Poland 2.88 3.91 4.14 3.78 3.51 4.33 3.99 4.12 4.20 4.18 4.33 4.33 Romania 0.20 1.61 3.62 3.34 3.68 4.24 4.21 4.24 4.37 4.37 4.33 4.33 Sweden 8.73 8.81 9.19 9.25 9.62 10.62 9.54 9.03 8.86 8.87 9.13 9.13 United Kingdom 0.79 0.65 0.67 0.68 0.80 0.89 0.86 0.87 0.83 0.82 0.87 0.87 EU : : : : : : : : : : : : Croatia : 7.36 7.44 7.34 7.22 7.34 7.29 7.44 7.50 7.49 7.47 7.47 USA 1.25 1.03 1.16 1.37 1.47 1.39 1.33 1.39 1.31 1.31 1.37 1.37 Japan 135.36 122.59 133.27 161.25 152.45 130.34 116.24 110.96 105.92 106.53 105.57 105.57
TABLE 30 : Nominal effective exchange rates to rest of a group ¹ of industrialised countries (percentage change on preceding year, 1997-2013)5-year Spring 2012 Autumn 2011
averages forecast forecast1997-01 2002-06 2007 2008 2009 2010 2011 2012 2013 2012 2013
Belgium -1.1 1.4 1.2 1.8 1.0 -2.5 0.3 -1.3 0.0 0.0 0.0 Germany -1.0 1.8 1.8 1.8 1.3 -3.5 0.2 -1.6 0.0 0.1 0.0 Estonia -0.4 1.0 1.1 1.4 2.2 -3.1 -0.1 -1.1 0.0 0.3 0.0 Ireland -1.8 2.4 2.6 4.0 0.8 -3.5 0.6 -2.5 0.0 -0.3 0.0 Greece 0.3 1.7 0.9 2.0 1.9 -2.3 0.8 -0.8 0.0 0.4 0.0 Spain -1.1 1.4 1.3 2.0 1.2 -2.5 0.5 -1.2 0.0 0.2 0.0 France -1.0 1.7 1.6 2.1 0.8 -3.0 0.3 -1.6 0.0 -0.1 0.0 Italy 0.1 1.9 1.6 1.9 0.9 -3.1 0.4 -1.4 0.0 0.1 0.0 Cyprus 5.0 1.6 -0.3 2.2 1.8 -2.4 0.3 -1.3 0.0 0.1 0.0 Luxembourg -1.1 1.4 1.2 1.8 1.0 -2.5 0.3 -1.3 0.0 0.0 0.0 Malta 0.4 1.3 3.1 2.2 -1.2 -4.0 0.2 -2.4 0.0 -0.8 0.0 Netherlands -1.0 1.2 1.1 2.0 1.4 -2.5 0.3 -1.3 0.0 0.1 0.0 Austria -0.1 1.1 1.0 0.9 1.2 -2.5 0.1 -0.9 0.0 0.2 0.0 Portugal -1.1 1.1 1.1 1.6 0.6 -2.0 0.3 -1.1 0.0 0.0 0.0 Slovenia -3.9 -1.1 0.3 0.5 2.0 -1.9 0.3 -0.4 0.0 0.5 0.0 Slovakia -1.3 3.6 10.4 8.7 6.5 -2.1 0.3 -0.4 0.0 0.6 0.0 Finland -1.0 1.7 1.6 1.9 1.5 -3.9 0.0 -1.6 0.0 0.0 0.0 Euro area -1.7 3.6 3.5 4.2 2.8 -6.7 0.7 -3.0 0.0 0.3 0.0 Bulgaria -32.2 1.7 0.6 1.8 2.6 -2.5 1.8 -0.5 0.0 1.0 0.0 Czech Republic 0.8 4.5 2.3 12.2 -3.7 2.5 3.1 -1.7 0.3 -1.0 0.0 Denmark -1.0 1.4 1.4 2.2 2.2 -3.9 -0.4 -1.5 0.0 0.1 0.0 Latvia 4.3 -3.4 0.0 0.9 2.3 -3.1 0.3 0.2 0.0 0.6 0.0 Lithuania 8.3 2.1 0.8 1.0 2.7 -2.6 0.3 -0.8 0.0 0.5 0.0 Hungary -4.7 0.3 5.4 0.9 -8.4 -0.3 -1.0 -6.7 0.0 -5.7 0.0 Poland -1.1 -0.5 3.4 9.2 -17.7 6.2 -2.9 -2.7 0.3 -5.2 0.0 Romania -30.1 -4.7 6.2 -8.3 -11.4 -1.5 0.4 -3.5 -0.1 -1.5 0.0 Sweden -2.5 1.8 1.7 -1.8 -8.5 7.6 6.0 0.1 -0.1 -1.1 0.0 United Kingdom 4.8 0.2 1.9 -12.9 -11.5 0.4 -0.7 3.2 0.4 -0.4 0.0 EU -0.8 5.2 6.6 1.5 -5.4 -7.4 1.3 -3.8 0.2 -0.9 0.0 Croatia : : : : : : : : : : : USA 5.0 -3.9 -5.0 -4.3 6.3 -3.2 -5.3 3.4 0.1 2.1 0.0 Japan 1.5 -2.4 -5.9 11.3 15.9 6.5 6.3 1.2 -0.6 5.0 0.0¹ 35 countries : EU (excl. LU), TR, CH, NO, US, CA, JP, AU, MX and NZ.
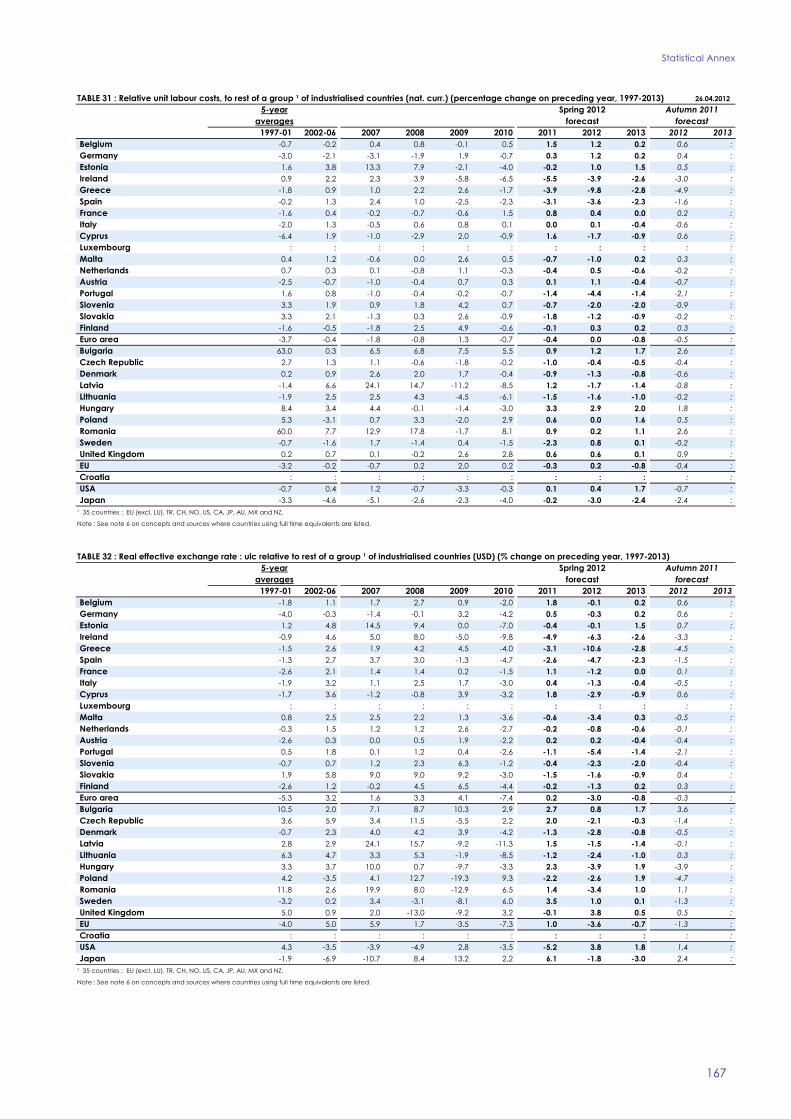
Statistical Annex
167
TABLE 31 : Relative unit labour costs, to rest of a group ¹ of industrialised countries (nat. curr.) (percentage change on preceding year, 1997-2013) 26.04.20125-year Spring 2012 Autumn 2011
averages forecast forecast1997-01 2002-06 2007 2008 2009 2010 2011 2012 2013 2012 2013
Belgium -0.7 -0.2 0.4 0.8 -0.1 0.5 1.5 1.2 0.2 0.6 : Germany -3.0 -2.1 -3.1 -1.9 1.9 -0.7 0.3 1.2 0.2 0.4 : Estonia 1.6 3.8 13.3 7.9 -2.1 -4.0 -0.2 1.0 1.5 0.5 : Ireland 0.9 2.2 2.3 3.9 -5.8 -6.5 -5.5 -3.9 -2.6 -3.0 : Greece -1.8 0.9 1.0 2.2 2.6 -1.7 -3.9 -9.8 -2.8 -4.9 : Spain -0.2 1.3 2.4 1.0 -2.5 -2.3 -3.1 -3.6 -2.3 -1.6 : France -1.6 0.4 -0.2 -0.7 -0.6 1.5 0.8 0.4 0.0 0.2 : Italy -2.0 1.3 -0.5 0.6 0.8 0.1 0.0 0.1 -0.4 -0.6 : Cyprus -6.4 1.9 -1.0 -2.9 2.0 -0.9 1.6 -1.7 -0.9 0.6 : Luxembourg : : : : : : : : : : : Malta 0.4 1.2 -0.6 0.0 2.6 0.5 -0.7 -1.0 0.2 0.3 : Netherlands 0.7 0.3 0.1 -0.8 1.1 -0.3 -0.4 0.5 -0.6 -0.2 : Austria -2.5 -0.7 -1.0 -0.4 0.7 0.3 0.1 1.1 -0.4 -0.7 : Portugal 1.6 0.8 -1.0 -0.4 -0.2 -0.7 -1.4 -4.4 -1.4 -2.1 : Slovenia 3.3 1.9 0.9 1.8 4.2 0.7 -0.7 -2.0 -2.0 -0.9 : Slovakia 3.3 2.1 -1.3 0.3 2.6 -0.9 -1.8 -1.2 -0.9 -0.2 : Finland -1.6 -0.5 -1.8 2.5 4.9 -0.6 -0.1 0.3 0.2 0.3 : Euro area -3.7 -0.4 -1.8 -0.8 1.3 -0.7 -0.4 0.0 -0.8 -0.5 : Bulgaria 63.0 0.3 6.5 6.8 7.5 5.5 0.9 1.2 1.7 2.6 : Czech Republic 2.7 1.3 1.1 -0.6 -1.8 -0.2 -1.0 -0.4 -0.5 -0.4 : Denmark 0.2 0.9 2.6 2.0 1.7 -0.4 -0.9 -1.3 -0.8 -0.6 : Latvia -1.4 6.6 24.1 14.7 -11.2 -8.5 1.2 -1.7 -1.4 -0.8 : Lithuania -1.9 2.5 2.5 4.3 -4.5 -6.1 -1.5 -1.6 -1.0 -0.2 : Hungary 8.4 3.4 4.4 -0.1 -1.4 -3.0 3.3 2.9 2.0 1.8 : Poland 5.3 -3.1 0.7 3.3 -2.0 2.9 0.6 0.0 1.6 0.5 : Romania 60.0 7.7 12.9 17.8 -1.7 8.1 0.9 0.2 1.1 2.6 : Sweden -0.7 -1.6 1.7 -1.4 0.4 -1.5 -2.3 0.8 0.1 -0.2 : United Kingdom 0.2 0.7 0.1 -0.2 2.6 2.8 0.6 0.6 0.1 0.9 : EU -3.2 -0.2 -0.7 0.2 2.0 0.2 -0.3 0.2 -0.8 -0.4 : Croatia : : : : : : : : : : : USA -0.7 0.4 1.2 -0.7 -3.3 -0.3 0.1 0.4 1.7 -0.7 : Japan -3.3 -4.6 -5.1 -2.6 -2.3 -4.0 -0.2 -3.0 -2.4 -2.4 :¹ 35 countries : EU (excl. LU), TR, CH, NO, US, CA, JP, AU, MX and NZ.
Note : See note 6 on concepts and sources where countries using full time equivalents are listed.
TABLE 32 : Real effective exchange rate : ulc relative to rest of a group ¹ of industrialised countries (USD) (% change on preceding year, 1997-2013)5-year Spring 2012 Autumn 2011
averages forecast forecast1997-01 2002-06 2007 2008 2009 2010 2011 2012 2013 2012 2013
Belgium -1.8 1.1 1.7 2.7 0.9 -2.0 1.8 -0.1 0.2 0.6 : Germany -4.0 -0.3 -1.4 -0.1 3.2 -4.2 0.5 -0.3 0.2 0.6 : Estonia 1.2 4.8 14.5 9.4 0.0 -7.0 -0.4 -0.1 1.5 0.7 : Ireland -0.9 4.6 5.0 8.0 -5.0 -9.8 -4.9 -6.3 -2.6 -3.3 : Greece -1.5 2.6 1.9 4.2 4.5 -4.0 -3.1 -10.6 -2.8 -4.5 : Spain -1.3 2.7 3.7 3.0 -1.3 -4.7 -2.6 -4.7 -2.3 -1.5 : France -2.6 2.1 1.4 1.4 0.2 -1.5 1.1 -1.2 0.0 0.1 : Italy -1.9 3.2 1.1 2.5 1.7 -3.0 0.4 -1.3 -0.4 -0.5 : Cyprus -1.7 3.6 -1.2 -0.8 3.9 -3.2 1.8 -2.9 -0.9 0.6 : Luxembourg : : : : : : : : : : : Malta 0.8 2.5 2.5 2.2 1.3 -3.6 -0.6 -3.4 0.3 -0.5 : Netherlands -0.3 1.5 1.2 1.2 2.6 -2.7 -0.2 -0.8 -0.6 -0.1 : Austria -2.6 0.3 0.0 0.5 1.9 -2.2 0.2 0.2 -0.4 -0.4 : Portugal 0.5 1.8 0.1 1.2 0.4 -2.6 -1.1 -5.4 -1.4 -2.1 : Slovenia -0.7 0.7 1.2 2.3 6.3 -1.2 -0.4 -2.3 -2.0 -0.4 : Slovakia 1.9 5.8 9.0 9.0 9.2 -3.0 -1.5 -1.6 -0.9 0.4 : Finland -2.6 1.2 -0.2 4.5 6.5 -4.4 -0.2 -1.3 0.2 0.3 : Euro area -5.3 3.2 1.6 3.3 4.1 -7.4 0.2 -3.0 -0.8 -0.3 : Bulgaria 10.5 2.0 7.1 8.7 10.3 2.9 2.7 0.8 1.7 3.6 : Czech Republic 3.6 5.9 3.4 11.5 -5.5 2.2 2.0 -2.1 -0.3 -1.4 : Denmark -0.7 2.3 4.0 4.2 3.9 -4.2 -1.3 -2.8 -0.8 -0.5 : Latvia 2.8 2.9 24.1 15.7 -9.2 -11.3 1.5 -1.5 -1.4 -0.1 : Lithuania 6.3 4.7 3.3 5.3 -1.9 -8.5 -1.2 -2.4 -1.0 0.3 : Hungary 3.3 3.7 10.0 0.7 -9.7 -3.3 2.3 -3.9 1.9 -3.9 : Poland 4.2 -3.5 4.1 12.7 -19.3 9.3 -2.2 -2.6 1.9 -4.7 : Romania 11.8 2.6 19.9 8.0 -12.9 6.5 1.4 -3.4 1.0 1.1 : Sweden -3.2 0.2 3.4 -3.1 -8.1 6.0 3.5 1.0 0.1 -1.3 : United Kingdom 5.0 0.9 2.0 -13.0 -9.2 3.2 -0.1 3.8 0.5 0.5 : EU -4.0 5.0 5.9 1.7 -3.5 -7.3 1.0 -3.6 -0.7 -1.3 : Croatia : : : : : : : : : : : USA 4.3 -3.5 -3.9 -4.9 2.8 -3.5 -5.2 3.8 1.8 1.4 : Japan -1.9 -6.9 -10.7 8.4 13.2 2.2 6.1 -1.8 -3.0 2.4 :¹ 35 countries : EU (excl. LU), TR, CH, NO, US, CA, JP, AU, MX and NZ.
Note : See note 6 on concepts and sources where countries using full time equivalents are listed.

European Economic Forecast, Spring 2012
168
TABLE 33 : Total expenditure, general government (as a percentage of GDP, 1992-2013) ¹ 26.04.20125-year Spring 2012 Autumn 2011
averages forecast forecast1992-96 1997-01 2002-06 2007 2008 2009 2010 2011 2012 2013 2012 2013
Belgium 52.8 49.9 50.0 48.2 49.8 53.7 52.7 53.2 53.9 53.7 53.1 53.0 Germany 49.0 47.4 47.1 43.5 44.0 48.1 47.9 45.7 45.6 45.2 45.5 45.0 Estonia : 37.5 34.4 34.0 39.5 45.2 40.6 38.2 41.2 39.3 40.4 38.9 Ireland 39.0 33.8 33.6 36.6 42.8 48.8 66.8 48.8 44.1 43.1 43.9 42.9 Greece 43.8 45.5 45.2 47.3 50.5 53.8 50.0 50.0 49.7 50.6 49.5 49.4 Spain 44.6 40.1 38.6 39.2 41.5 46.3 45.6 43.6 42.4 42.0 42.3 41.9 France 53.2 52.6 53.2 52.6 53.3 56.8 56.5 55.9 56.3 56.2 57.1 56.9 Italy 53.0 48.0 47.8 47.7 48.6 52.0 50.6 50.0 50.4 49.5 49.2 48.6 Cyprus : 37.0 42.5 41.3 42.1 46.2 46.4 47.3 46.0 45.3 45.1 44.8 Luxembourg : 39.3 41.2 36.3 37.1 43.0 42.4 42.0 43.6 44.0 44.6 44.9 Malta : 42.3 44.7 42.8 44.1 43.5 43.3 43.0 44.4 43.8 42.7 42.4 Netherlands 52.0 45.9 45.9 45.2 46.2 51.6 51.3 50.2 50.8 50.8 49.9 50.0 Austria 53.7 52.6 50.8 48.5 49.3 52.9 52.6 50.5 51.4 50.6 51.4 51.0 Portugal 40.0 41.8 45.0 44.3 44.7 49.7 51.2 48.9 47.7 46.1 47.2 45.4 Slovenia : 46.0 45.6 42.5 44.2 49.3 50.3 50.9 48.7 47.9 50.5 50.9 Slovakia : 47.9 39.5 34.2 34.9 41.5 40.0 37.4 37.7 37.3 38.5 37.7 Finland 59.9 51.6 49.7 47.4 49.3 55.9 55.2 53.7 54.3 54.7 54.4 54.7 Euro area 50.3 47.6 47.4 46.0 47.1 51.2 51.0 49.4 49.4 49.0 49.2 48.8 Bulgaria : 38.8 37.8 39.8 38.3 40.7 37.4 35.2 35.2 35.3 36.1 35.4 Czech Republic : 42.7 44.8 41.0 41.2 44.9 44.2 43.4 43.3 43.1 43.7 43.7 Denmark 59.0 55.2 53.5 50.8 51.6 57.8 57.6 57.8 58.6 56.6 58.5 56.7 Latvia : 38.2 36.2 36.0 39.1 44.5 43.9 39.1 38.1 37.0 40.4 38.5 Lithuania : 40.9 33.5 34.6 37.2 43.8 40.9 37.5 36.8 36.1 37.1 37.3 Hungary : 49.4 50.5 50.7 49.2 51.5 49.4 48.6 48.6 47.6 48.8 48.6 Poland : 43.7 43.8 42.2 43.2 44.5 45.4 43.6 43.1 42.4 44.8 44.0 Romania : 36.8 34.2 38.2 39.3 41.1 40.2 37.7 36.2 35.4 38.4 37.9 Sweden 64.4 57.4 54.2 50.9 51.7 54.7 52.2 51.1 52.1 51.8 51.4 51.1 United Kingdom 42.2 39.2 42.9 43.8 47.9 51.6 50.4 49.1 47.4 47.2 48.6 47.2 EU : 46.6 46.7 45.6 47.1 51.1 50.6 49.1 48.9 48.4 49.0 48.4 Croatia : : : : 40.4 40.5 39.9 38.9 39.2 38.6 38.6 38.1 USA 36.7 34.6 36.1 36.8 39.1 42.7 42.5 41.7 40.4 39.2 41.2 39.3 Japan 34.0 38.3 37.0 35.8 37.0 41.9 40.8 43.0 43.9 44.0 43.4 44.2¹ ESA 79 up to 1994, ESA 95 from 1995 onwards.
TABLE 34 : Total revenue, general government (as a percentage of GDP, 1992-2013) ¹5-year Spring 2012 Autumn 2011
averages forecast forecast1992-96 1997-01 2002-06 2007 2008 2009 2010 2011 2012 2013 2012 2013
Belgium 47.4 49.2 49.5 48.2 48.8 48.1 48.9 49.4 50.9 50.4 48.6 48.5 Germany 44.8 45.7 43.8 43.7 44.0 44.9 43.6 44.7 44.7 44.4 44.5 44.3 Estonia : 37.1 35.9 36.4 36.5 43.2 40.9 39.2 38.9 38.1 38.7 38.1 Ireland 37.4 36.2 34.8 36.7 35.5 34.8 35.6 35.7 35.8 35.5 35.3 35.0 Greece 34.1 41.3 39.3 40.8 40.7 38.2 39.7 40.9 42.4 42.2 42.5 42.6 Spain 38.8 38.2 39.2 41.1 37.0 35.1 36.3 35.1 36.0 35.7 36.3 36.6 France 48.4 50.4 49.9 49.9 49.9 49.2 49.5 50.7 51.8 52.0 51.8 51.8 Italy 44.7 45.7 44.2 46.0 45.9 46.5 46.0 46.1 48.4 48.4 46.9 47.4 Cyprus : 33.3 38.8 44.8 43.1 40.1 41.1 41.0 42.6 42.8 40.2 40.2 Luxembourg : 43.8 41.8 39.9 40.1 42.2 41.6 41.4 41.9 41.8 43.6 44.0 Malta : 34.8 39.6 40.5 39.5 39.7 39.5 40.2 41.9 40.8 39.2 38.8 Netherlands 48.7 46.0 44.6 45.4 46.7 46.0 46.2 45.5 46.3 46.1 46.8 47.3 Austria 49.6 51.0 48.9 47.6 48.3 48.7 48.1 47.9 48.4 48.6 48.3 48.1 Portugal 35.3 38.1 40.5 41.1 41.1 39.6 41.4 44.7 43.0 43.1 42.7 42.2 Slovenia : 42.9 43.6 42.4 42.4 43.2 44.2 44.5 44.4 44.0 45.2 45.2 Slovakia : 40.3 35.6 32.4 32.8 33.5 32.4 32.6 33.0 32.5 33.5 32.7 Finland 54.1 54.4 52.9 52.7 53.6 53.4 52.7 53.2 53.6 54.3 53.6 54.0 Euro area 45.0 45.9 44.9 45.3 45.0 44.8 44.7 45.3 46.2 46.1 45.8 45.9 Bulgaria : 39.4 38.4 40.9 40.0 36.3 34.3 33.1 33.3 33.6 34.4 34.1 Czech Republic : 38.4 40.4 40.3 38.9 39.1 39.3 40.3 40.4 40.5 40.0 39.8 Denmark 56.5 56.1 56.1 55.6 54.8 55.2 55.1 56.0 54.5 54.7 54.0 54.6 Latvia : 36.8 35.0 35.6 34.9 34.7 35.7 35.6 36.0 34.9 37.1 35.3 Lithuania : 36.0 32.4 33.6 33.9 34.3 33.7 32.0 33.5 33.1 34.1 33.9 Hungary : 44.1 42.5 45.6 45.5 46.9 45.2 52.9 46.1 44.6 46.0 44.9 Poland : 39.8 38.9 40.3 39.5 37.2 37.5 38.5 40.1 39.8 40.8 41.0 Romania : 32.8 32.6 35.3 33.6 32.1 33.4 32.5 33.4 33.2 34.7 34.9 Sweden 56.7 58.5 54.8 54.5 53.9 54.0 52.4 51.4 51.8 51.8 52.1 52.1 United Kingdom 36.2 39.7 39.9 41.1 42.9 40.1 40.2 40.8 40.8 40.8 40.8 41.4 EU : 45.2 44.2 44.7 44.7 44.2 44.1 44.6 45.2 45.2 45.0 45.2 Croatia : : : : 39.1 36.4 35.0 33.8 34.1 33.6 33.2 32.8 USA 32.4 34.9 32.4 34.1 32.7 31.1 31.8 32.0 32.1 32.1 32.7 34.3 Japan 31.6 31.2 31.5 33.7 35.1 33.1 32.5 34.8 35.7 36.0 36.0 36.9¹ ESA 79 up to 1994, ESA 95 from 1995 onwards.

Statistical Annex
169
TABLE 35 : Net lending (+) or net borrowing (-), general government (as a percentage of GDP, 1992-2013) ¹ 26.04.20125-year Spring 2012 Autumn 2011
averages forecast forecast1992-96 1997-01 2002-06 2007 2008 2009 2010 2011 2012 2013 2012 2013
Belgium -5.4 -0.7 -0.5 -0.1 -1.0 -5.6 -3.8 -3.7 -3.0 -3.3 -4.6 -4.5 Germany -4.3 -1.7 -3.3 0.2 -0.1 -3.2 -4.3 -1.0 -0.9 -0.7 -1.0 -0.7 Estonia : -0.5 1.5 2.4 -2.9 -2.0 0.2 1.0 -2.4 -1.3 -1.8 -0.8 Ireland -1.7 2.4 1.2 0.1 -7.3 -14.0 -31.2 -13.1 -8.3 -7.5 -8.6 -7.8 Greece -9.7 -4.2 -5.9 -6.5 -9.8 -15.6 -10.3 -9.1 -7.3 -8.4 -7.0 -6.8 Spain -5.8 -1.9 0.6 1.9 -4.5 -11.2 -9.3 -8.5 -6.4 -6.3 -5.9 -5.3 France -4.9 -2.2 -3.2 -2.7 -3.3 -7.5 -7.1 -5.2 -4.5 -4.2 -5.3 -5.1 Italy -8.3 -2.3 -3.6 -1.6 -2.7 -5.4 -4.6 -3.9 -2.0 -1.1 -2.3 -1.2 Cyprus : -3.6 -3.7 3.5 0.9 -6.1 -5.3 -6.3 -3.4 -2.5 -4.9 -4.7 Luxembourg 1.6 4.5 0.6 3.7 3.0 -0.8 -0.9 -0.6 -1.8 -2.2 -1.1 -0.9 Malta : -7.5 -5.1 -2.4 -4.6 -3.8 -3.7 -2.7 -2.6 -2.9 -3.5 -3.6 Netherlands -3.3 0.0 -1.3 0.2 0.5 -5.6 -5.1 -4.7 -4.4 -4.6 -3.1 -2.7 Austria -4.1 -1.6 -2.0 -0.9 -0.9 -4.1 -4.5 -2.6 -3.0 -1.9 -3.1 -2.9 Portugal -4.7 -3.7 -4.4 -3.1 -3.6 -10.2 -9.8 -4.2 -4.7 -3.1 -4.5 -3.2 Slovenia : -3.1 -2.0 0.0 -1.9 -6.1 -6.0 -6.4 -4.3 -3.8 -5.3 -5.7 Slovakia : -7.6 -3.9 -1.8 -2.1 -8.0 -7.7 -4.8 -4.7 -4.9 -4.9 -5.0 Finland -5.8 2.8 3.2 5.3 4.3 -2.5 -2.5 -0.5 -0.7 -0.4 -0.7 -0.7 Euro area -5.3 -1.7 -2.5 -0.7 -2.1 -6.4 -6.2 -4.1 -3.2 -2.9 -3.4 -3.0 Bulgaria : 0.5 0.6 1.2 1.7 -4.3 -3.1 -2.1 -1.9 -1.7 -1.7 -1.3 Czech Republic : -4.2 -4.3 -0.7 -2.2 -5.8 -4.8 -3.1 -2.9 -2.6 -3.8 -4.0 Denmark -2.5 0.9 2.6 4.8 3.2 -2.7 -2.5 -1.8 -4.1 -2.0 -4.5 -2.1 Latvia : -1.4 -1.2 -0.4 -4.2 -9.8 -8.2 -3.5 -2.1 -2.1 -3.3 -3.2 Lithuania : -4.8 -1.1 -1.0 -3.3 -9.4 -7.2 -5.5 -3.2 -3.0 -3.0 -3.4 Hungary : -5.3 -8.0 -5.1 -3.7 -4.6 -4.2 4.3 -2.5 -2.9 -2.8 -3.7 Poland : -3.9 -4.9 -1.9 -3.7 -7.4 -7.8 -5.1 -3.0 -2.5 -4.0 -3.1 Romania : -4.0 -1.6 -2.9 -5.7 -9.0 -6.8 -5.2 -2.8 -2.2 -3.7 -2.9 Sweden -7.7 1.0 0.6 3.6 2.2 -0.7 0.3 0.3 -0.3 0.1 0.7 0.9 United Kingdom -6.1 0.5 -3.0 -2.7 -5.0 -11.5 -10.2 -8.3 -6.7 -6.5 -7.8 -5.8 EU : -1.4 -2.5 -0.9 -2.4 -6.9 -6.5 -4.5 -3.6 -3.3 -3.9 -3.2 Croatia : : : -2.4 -1.4 -4.1 -4.9 -5.0 -5.1 -5.0 -5.4 -5.2 USA -4.2 0.3 -3.7 -2.8 -6.4 -11.5 -10.6 -9.6 -8.3 -7.1 -8.5 -5.0 Japan -2.4 -7.2 -5.5 -2.1 -1.9 -8.8 -8.4 -8.2 -8.2 -8.0 -7.4 -7.2¹ ESA 79 up to 1994, ESA 95 from 1995 onwards.
TABLE 36 : Interest expenditure, general government (as a percentage of GDP, 1992-2013) ¹5-year Spring 2012 Autumn 2011
averages forecast forecast1992-96 1997-01 2002-06 2007 2008 2009 2010 2011 2012 2013 2012 2013
Belgium 9.5 7.0 4.7 3.9 3.8 3.6 3.4 3.3 3.3 3.3 3.3 3.3 Germany 3.3 3.2 2.9 2.8 2.8 2.7 2.5 2.7 2.6 2.4 2.3 2.3 Estonia : 0.3 0.2 0.2 0.2 0.2 0.1 0.1 0.1 0.1 0.2 0.2 Ireland 5.6 2.6 1.2 1.0 1.4 2.0 3.1 3.4 4.0 5.5 4.3 5.9 Greece 11.2 7.8 4.9 4.5 5.0 5.2 5.7 6.9 6.3 6.4 8.0 8.9 Spain 4.8 3.7 2.1 1.6 1.6 1.8 1.9 2.4 3.2 3.3 2.4 2.6 France 3.4 3.1 2.7 2.7 2.9 2.4 2.4 2.6 2.6 2.6 2.8 3.0 Italy 11.2 7.2 4.9 5.0 5.2 4.7 4.6 4.9 5.4 5.6 5.4 5.6 Cyprus : 3.1 3.4 3.0 2.8 2.6 2.3 2.5 3.2 3.2 2.7 2.7 Luxembourg 0.3 0.4 0.2 0.2 0.3 0.4 0.4 0.5 0.5 0.6 0.5 0.6 Malta : 3.3 3.5 3.3 3.2 3.2 3.0 3.1 3.3 3.4 3.3 3.3 Netherlands 5.7 4.1 2.5 2.2 2.2 2.2 2.0 2.0 2.1 2.2 1.9 2.1 Austria 4.0 3.5 2.9 2.7 2.6 2.8 2.7 2.6 2.7 2.7 2.8 2.9 Portugal 5.6 3.1 2.7 2.9 3.0 2.8 2.9 3.9 4.8 4.9 5.2 5.5 Slovenia : 2.3 1.8 1.3 1.1 1.4 1.6 2.0 2.5 2.6 2.1 2.2 Slovakia : 3.3 2.3 1.4 1.2 1.4 1.3 1.6 1.9 2.0 1.5 1.6 Finland 4.0 3.2 1.7 1.5 1.4 1.1 1.1 1.1 1.2 1.2 1.2 1.4 Euro area 5.5 4.3 3.1 3.0 3.0 2.9 2.8 3.1 3.2 3.2 3.1 3.3 Bulgaria : 4.7 1.9 1.2 0.9 0.8 0.6 0.6 0.8 1.0 0.7 0.8 Czech Republic : 1.0 1.1 1.1 1.1 1.3 1.4 1.4 1.4 1.5 1.5 1.5 Denmark 6.4 4.1 2.3 1.6 1.4 1.8 1.7 1.8 1.5 1.5 1.8 1.9 Latvia : 0.8 0.6 0.4 0.6 1.5 1.4 1.5 1.7 1.8 2.0 2.3 Lithuania : 1.3 1.0 0.7 0.7 1.3 1.8 1.8 2.1 2.0 2.0 2.1 Hungary : 6.7 4.1 4.2 4.2 4.7 4.1 4.1 4.1 4.2 3.9 3.8 Poland : 3.5 2.8 2.3 2.2 2.6 2.7 2.7 2.7 2.7 3.0 3.0 Romania : 4.2 1.5 0.7 0.7 1.5 1.5 1.6 1.7 1.7 1.8 1.8 Sweden 5.5 4.0 1.9 1.7 1.7 1.0 0.8 1.0 1.1 1.1 0.8 0.8 United Kingdom 3.1 3.0 2.0 2.2 2.3 2.0 2.9 3.2 3.4 3.5 3.2 3.2 EU : 4.0 2.9 2.7 2.8 2.6 2.7 2.9 3.1 3.1 3.0 3.1 Croatia : : : 1.8 1.5 1.7 2.0 0.0 0.0 0.0 0.0 0.0 USA 4.7 3.8 2.7 2.9 2.7 2.5 2.6 2.9 2.8 2.9 3.1 3.3 Japan 3.5 3.3 1.9 1.9 2.0 2.0 2.0 2.1 2.1 2.1 2.7 2.7¹ ESA 79 up to 1994, ESA 95 from 1995 onwards.

European Economic Forecast, Spring 2012
170
TABLE 37 : Primary balance, general government (as a percentage of GDP, 1992-2013) ¹ ² 26.04.20125-year Spring 2012 Autumn 2011
averages forecast forecast1992-96 1997-01 2002-06 2007 2008 2009 2010 2011 2012 2013 2012 2013
Belgium 4.1 6.3 4.3 3.8 2.8 -2.0 -0.4 -0.4 0.4 0.0 -1.3 -1.1 Germany -1.0 1.5 -0.4 3.0 2.7 -0.5 -1.8 1.6 1.7 1.6 1.3 1.5 Estonia : -0.2 1.7 2.6 -2.7 -1.8 0.4 1.1 -2.2 -1.1 -1.6 -0.6 Ireland 3.9 5.0 2.4 1.1 -6.0 -12.0 -28.0 -9.7 -4.3 -2.0 -4.3 -2.0 Greece 1.6 3.6 -1.0 -2.0 -4.8 -10.4 -4.7 -2.2 -1.0 -2.0 1.0 2.1 Spain -1.0 1.8 2.7 3.5 -2.9 -9.4 -7.4 -6.1 -3.3 -3.1 -3.5 -2.7 France -1.5 0.9 -0.5 0.0 -0.4 -5.1 -4.7 -2.6 -1.9 -1.6 -2.5 -2.1 Italy 2.9 5.0 1.3 3.4 2.5 -0.8 0.0 1.0 3.4 4.5 3.1 4.4 Cyprus : -0.6 -0.4 6.5 3.8 -3.6 -3.1 -3.8 -0.2 0.7 -2.2 -1.9 Luxembourg 1.9 4.9 0.8 3.9 3.3 -0.4 -0.4 -0.1 -1.2 -1.6 -0.5 -0.4 Malta : -4.2 -1.6 1.0 -1.4 -0.6 -0.7 0.4 0.8 0.5 -0.2 -0.4 Netherlands 2.4 4.1 1.1 2.4 2.7 -3.4 -3.1 -2.6 -2.3 -2.5 -1.2 -0.6 Austria -0.1 1.8 0.9 1.9 1.7 -1.3 -1.8 0.0 -0.3 0.8 -0.3 0.0 Portugal 0.9 -0.6 -1.8 -0.2 -0.6 -7.3 -7.0 -0.4 0.1 1.9 0.8 2.3 Slovenia : -0.8 -0.3 1.2 -0.7 -4.7 -4.4 -4.5 -1.7 -1.2 -3.1 -3.5 Slovakia : -4.3 -1.6 -0.4 -0.8 -6.6 -6.3 -3.2 -2.8 -2.9 -3.4 -3.4 Finland -1.8 6.0 4.9 6.8 5.7 -1.3 -1.5 0.6 0.5 0.8 0.5 0.7 Euro area 0.2 2.5 0.6 2.3 0.9 -3.5 -3.4 -1.1 0.0 0.3 -0.3 0.3 Bulgaria : 5.2 2.5 2.3 2.5 -3.6 -2.5 -1.5 -1.1 -0.7 -1.0 -0.5 Czech Republic : -3.3 -3.2 0.4 -1.2 -4.5 -3.4 -1.7 -1.4 -1.1 -2.3 -2.4 Denmark 3.9 5.0 4.9 6.4 4.7 -0.9 -0.8 -0.1 -2.6 -0.5 -2.7 -0.2 Latvia : -0.6 -0.5 0.0 -3.6 -8.3 -6.8 -2.0 -0.4 -0.3 -1.2 -0.9 Lithuania : -3.5 -0.1 -0.3 -2.6 -8.2 -5.4 -3.7 -1.2 -0.9 -1.0 -1.3 Hungary : 1.4 -3.9 -1.0 0.5 0.1 -0.1 8.3 1.5 1.2 1.2 0.1 Poland : -0.4 -2.0 0.4 -1.5 -4.7 -5.2 -2.4 -0.3 0.2 -1.1 -0.1 Romania : 0.1 -0.1 -2.2 -5.0 -7.5 -5.3 -3.7 -1.1 -0.4 -1.9 -1.2 Sweden -2.2 5.0 2.5 5.3 3.8 0.2 1.1 1.3 0.8 1.2 1.5 1.8 United Kingdom -2.9 3.5 -1.0 -0.5 -2.7 -9.5 -7.3 -5.1 -3.3 -3.0 -4.6 -2.6 EU : 2.6 0.4 1.8 0.4 -4.2 -3.8 -1.5 -0.5 -0.2 -0.9 -0.1 Croatia : : : -0.7 0.1 -2.4 -2.9 -5.0 -5.1 -5.0 -5.4 -5.2 USA 0.5 4.1 -1.0 0.1 -3.7 -9.0 -8.0 -6.8 -5.5 -4.2 -5.4 -1.7 Japan 1.1 -3.9 -3.5 -0.2 0.1 -6.8 -6.4 -6.1 -6.1 -5.9 -4.7 -4.5¹ ESA 79 up to 1994, ESA 95 from 1995 onwards.
² Net lending/borrowing excluding interest expenditure.
TABLE 38 : Cyclically-adjusted net lending (+) or net borrowing (-), general government (as a percentage of GDP, 1992-2013)5-year Spring 2012 Autumn 2011
averages forecast forecast1992-96 1997-01 2002-06 2007 2008 2009 2010 2011 2012 2013 2012 2013
Belgium -5.0 -1.1 -0.7 -1.4 -1.9 -4.3 -3.2 -3.5 -2.2 -2.6 -4.0 -4.0 Germany -4.5 -1.9 -2.8 -0.9 -1.1 -1.3 -3.5 -1.0 -0.4 -0.3 -0.7 -0.4 Estonia : 0.2 -0.3 -1.5 -4.6 1.0 2.6 1.5 -1.8 -1.0 -1.7 -1.1 Ireland -1.2 0.9 0.8 -1.5 -7.3 -11.7 -29.2 -12.0 -7.8 -7.9 -8.0 -8.1 Greece -9.6 -4.2 -6.1 -8.0 -10.7 -15.0 -8.7 -5.4 -2.6 -4.5 -2.9 -3.4 Spain -4.8 -2.4 0.2 1.2 -4.6 -9.3 -7.4 -6.9 -4.5 -4.8 -4.2 -4.3 France -4.3 -2.7 -4.1 -4.1 -3.8 -6.2 -5.8 -4.1 -3.1 -2.9 -4.0 -3.9 Italy -8.0 -2.7 -4.0 -3.0 -3.3 -3.3 -3.4 -2.9 -0.6 0.1 -1.3 -0.4 Cyprus : -3.7 -3.7 2.7 -0.2 -5.9 -5.0 -6.0 -2.7 -1.7 -4.1 -4.2 Luxembourg : 3.5 0.1 1.4 1.7 1.3 0.5 0.5 -0.6 -1.4 0.0 -0.2 Malta : -8.1 -4.8 -2.2 -5.1 -2.9 -3.2 -2.6 -2.5 -3.1 -3.5 -3.8 Netherlands -3.0 -0.7 -0.7 -1.1 -0.7 -4.1 -4.0 -3.5 -2.4 -2.5 -1.8 -1.4 Austria -3.9 -1.9 -1.7 -2.0 -1.8 -2.7 -3.6 -2.6 -2.7 -1.8 -2.7 -2.8 Portugal -4.5 -4.7 -4.3 -3.5 -3.6 -8.9 -9.1 -3.0 -2.6 -1.3 -2.4 -1.8 Slovenia : -3.3 -2.5 -3.1 -5.1 -4.4 -4.5 -5.0 -2.2 -1.9 -3.8 -4.7 Slovakia : -7.1 -3.6 -3.7 -4.2 -7.5 -7.4 -4.7 -4.3 -4.6 -4.4 -4.6 Finland -3.7 1.8 3.1 2.8 2.7 0.7 -0.6 0.5 0.3 0.3 0.3 0.1 Euro area -5.1 -2.2 -2.6 -1.9 -2.9 -4.6 -5.1 -3.3 -2.0 -1.8 -2.4 -2.1 Bulgaria : : -0.3 -0.3 -0.2 -3.1 -1.6 -1.0 -0.7 -0.8 -0.7 -0.7 Czech Republic : -3.3 -4.3 -3.1 -4.4 -5.2 -4.5 -2.8 -2.1 -1.8 -3.1 -3.2 Denmark -1.4 0.1 2.1 2.7 2.4 0.6 0.1 0.2 -2.6 -1.0 -3.2 -1.4 Latvia : -1.0 -1.9 -4.3 -6.5 -6.9 -5.6 -2.3 -1.2 -1.7 -2.5 -3.1 Lithuania : -3.3 -2.1 -3.5 -5.3 -6.8 -5.0 -4.6 -2.6 -2.6 -2.7 -3.5 Hungary : -4.7 -9.0 -6.4 -4.8 -2.2 -2.4 5.3 -1.3 -2.0 -1.8 -3.2 Poland : -4.1 -4.7 -2.8 -4.6 -7.1 -7.5 -5.0 -2.7 -1.9 -3.6 -2.5 Romania : -2.3 -2.2 -5.3 -8.8 -9.1 -5.9 -4.4 -1.7 -1.2 -2.6 -2.2 Sweden -5.8 1.2 0.1 1.7 1.8 2.5 1.1 0.0 0.3 0.4 0.9 1.0 United Kingdom -5.5 0.2 -3.8 -4.2 -5.4 -9.6 -8.9 -6.9 -5.1 -5.1 -6.3 -4.5 EU : -1.8 -2.8 -2.2 -3.2 -5.1 -5.4 -3.6 -2.4 -2.2 -2.9 -2.4 Croatia : : : : : : : : : : : :

Statistical Annex
171
TABLE 39 : Cyclically-adjusted primary balance, general government (as a percentage of GDP, 1992-2013) 26.04.20125-year Spring 2012 Autumn 2011
averages forecast forecast1992-96 1997-01 2002-06 2007 2008 2009 2010 2011 2012 2013 2012 2013
Belgium 4.5 5.9 4.0 2.5 1.9 -0.7 0.2 -0.2 1.1 0.7 -0.7 -0.6 Germany -1.2 1.3 0.1 1.9 1.6 1.4 -1.1 1.6 2.1 2.0 1.6 1.9 Estonia : 0.5 -0.1 -1.4 -4.4 1.2 2.7 1.6 -1.7 -0.9 -1.5 -0.9 Ireland 4.4 3.5 2.0 -0.5 -5.9 -9.6 -26.1 -8.6 -3.8 -2.4 -3.7 -2.2 Greece 1.6 3.6 -1.2 -3.5 -5.7 -9.8 -3.1 1.5 3.7 1.9 5.1 5.5 Spain 0.0 1.3 2.3 2.8 -3.0 -7.5 -5.4 -4.5 -1.4 -1.5 -1.7 -1.6 France -1.0 0.4 -1.4 -1.4 -0.9 -3.7 -3.4 -1.5 -0.5 -0.2 -1.2 -0.9 Italy 3.2 4.5 0.9 2.0 1.9 1.4 1.2 2.0 4.8 5.6 4.1 5.2 Cyprus : -0.6 -0.3 5.8 2.6 -3.3 -2.7 -3.6 0.5 1.6 -1.3 -1.4 Luxembourg : 3.9 0.3 1.7 2.1 1.6 0.9 1.0 0.0 -0.8 0.6 0.3 Malta : -4.8 -1.2 1.1 -1.9 0.3 -0.2 0.5 0.8 0.3 -0.2 -0.5 Netherlands 2.7 3.4 1.7 1.1 1.5 -1.9 -1.9 -1.5 -0.3 -0.3 0.1 0.6 Austria 0.1 1.5 1.2 0.8 0.8 0.0 -1.0 0.0 0.0 0.9 0.1 0.2 Portugal 1.1 -1.6 -1.6 -0.6 -0.6 -6.1 -6.3 0.9 2.2 3.7 2.8 3.8 Slovenia : -0.9 -0.7 -1.9 -4.0 -3.1 -2.9 -3.0 0.3 0.7 -1.7 -2.5 Slovakia : -3.8 -1.3 -2.3 -3.0 -6.1 -6.1 -3.1 -2.4 -2.5 -2.9 -2.9 Finland 0.3 5.0 4.7 4.2 4.1 1.9 0.5 1.6 1.5 1.6 1.5 1.5 Euro area 0.5 2.1 0.5 1.1 0.2 -1.8 -2.3 -0.2 1.2 1.4 0.8 1.2 Bulgaria : : 1.6 0.9 0.7 -2.3 -1.0 -0.4 0.1 0.2 0.0 0.1 Czech Republic : -2.3 -3.3 -2.0 -3.3 -3.9 -3.1 -1.4 -0.7 -0.3 -1.6 -1.7 Denmark 5.0 4.2 4.4 4.2 3.9 2.4 1.8 1.9 -1.1 0.4 -1.4 0.5 Latvia : -0.1 -1.3 -3.9 -5.9 -5.4 -4.2 -0.8 0.4 0.1 -0.4 -0.8 Lithuania : -2.0 -1.1 -2.8 -4.6 -5.5 -3.2 -2.8 -0.5 -0.5 -0.6 -1.4 Hungary : 2.0 -4.9 -2.3 -0.6 2.5 1.7 9.4 2.8 2.1 2.1 0.6 Poland : -0.6 -1.9 -0.5 -2.3 -4.5 -4.8 -2.3 0.0 0.8 -0.6 0.5 Romania : 1.8 -0.7 -4.6 -8.0 -7.6 -4.3 -2.8 0.0 0.6 -0.8 -0.4 Sweden -0.3 5.2 2.0 3.4 3.5 3.5 1.9 1.1 1.4 1.5 1.7 1.9 United Kingdom -2.3 3.2 -1.8 -2.0 -3.1 -7.6 -6.0 -3.7 -1.7 -1.6 -3.1 -1.3 EU : 2.2 0.1 0.5 -0.4 -2.5 -2.7 -0.7 0.7 0.9 0.1 0.7 Croatia : : : : : : : : : : : :
TABLE 40 : Gross debt, general government (as a percentage of GDP, 2004-2013) Spring 2012 Autumn 2011 forecast forecast
2004 2005 2006 2007 2008 2009 2010 2011 2012 2013 2012 2013 Belgium 94.0 92.0 88.0 84.1 89.3 95.8 96.0 98.0 100.5 100.8 99.2 100.3 Germany 66.3 68.6 68.1 65.2 66.7 74.4 83.0 81.2 82.2 80.7 81.2 79.9 Estonia 5.0 4.6 4.4 3.7 4.5 7.2 6.7 6.0 10.4 11.7 6.0 6.1 Ireland 29.4 27.2 24.7 24.8 44.2 65.1 92.5 108.2 116.1 120.2 117.5 121.1 Greece 99.8 101.2 107.3 107.4 113.0 129.4 145.0 165.3 160.6 168.0 198.3 198.5 Spain 46.3 43.1 39.6 36.2 40.2 53.9 61.2 68.5 80.9 87.0 73.8 78.0 France 65.0 66.7 64.0 64.2 68.2 79.2 82.3 85.8 90.5 92.5 89.2 91.7 Italy 103.4 105.4 106.1 103.1 105.7 116.0 118.6 120.1 123.5 121.8 120.5 118.7 Cyprus 70.9 69.4 64.7 58.8 48.9 58.5 61.5 71.6 76.5 78.1 68.4 70.9 Luxembourg 6.3 6.1 6.7 6.7 13.7 14.8 19.1 18.2 20.3 21.6 20.2 20.3 Malta 71.7 69.7 64.4 62.3 62.3 68.1 69.4 72.0 74.8 75.2 70.8 71.5 Netherlands 52.4 51.8 47.4 45.3 58.5 60.8 62.9 65.2 70.1 73.0 64.9 66.0 Austria 64.7 64.2 62.3 60.2 63.8 69.5 71.9 72.2 74.2 74.3 73.3 73.7 Portugal 57.5 62.5 63.7 68.3 71.6 83.1 93.3 107.8 113.9 117.1 111.0 112.1 Slovenia 27.3 26.7 26.4 23.1 21.9 35.3 38.8 47.6 54.7 58.1 50.1 54.6 Slovakia 41.5 34.2 30.5 29.6 27.9 35.6 41.1 43.3 49.7 53.5 47.5 51.1 Finland 44.4 41.7 39.6 35.2 33.9 43.5 48.4 48.6 50.5 51.7 51.8 53.5 Euro area 69.6 70.2 68.6 66.3 70.1 79.9 85.6 88.0 91.8 92.6 90.4 90.9 Bulgaria 37.0 27.5 21.6 17.2 13.7 14.6 16.3 16.3 17.6 18.5 18.3 18.5 Czech Republic 28.9 28.4 28.3 27.9 28.7 34.4 38.1 41.2 43.9 44.9 41.9 44.0 Denmark 45.1 37.8 32.1 27.5 33.4 40.6 42.9 46.5 40.9 42.1 44.6 44.8 Latvia 15.0 12.5 10.7 9.0 19.8 36.7 44.7 42.6 43.5 44.7 45.1 47.1 Lithuania 19.3 18.3 17.9 16.8 15.5 29.4 38.0 38.5 40.4 40.9 38.5 39.4 Hungary 59.5 61.7 65.9 67.1 73.0 79.8 81.4 80.6 78.5 78.0 76.5 76.7 Poland 45.7 47.1 47.7 45.0 47.1 50.9 54.8 56.3 55.0 53.7 57.1 57.5 Romania 18.7 15.8 12.4 12.8 13.4 23.6 30.5 33.3 34.6 34.6 35.8 35.9 Sweden 50.3 50.4 45.3 40.2 38.8 42.6 39.4 38.4 35.6 34.2 34.6 32.4 United Kingdom 40.9 42.5 43.4 44.4 54.8 69.6 79.6 85.7 91.2 94.6 88.8 85.9 EU 62.3 62.9 61.6 59.0 62.5 74.8 80.2 83.0 86.2 87.2 84.9 84.9 Croatia 37.5 37.9 34.9 32.5 28.7 35.0 41.2 45.7 51.3 57.1 50.0 53.8
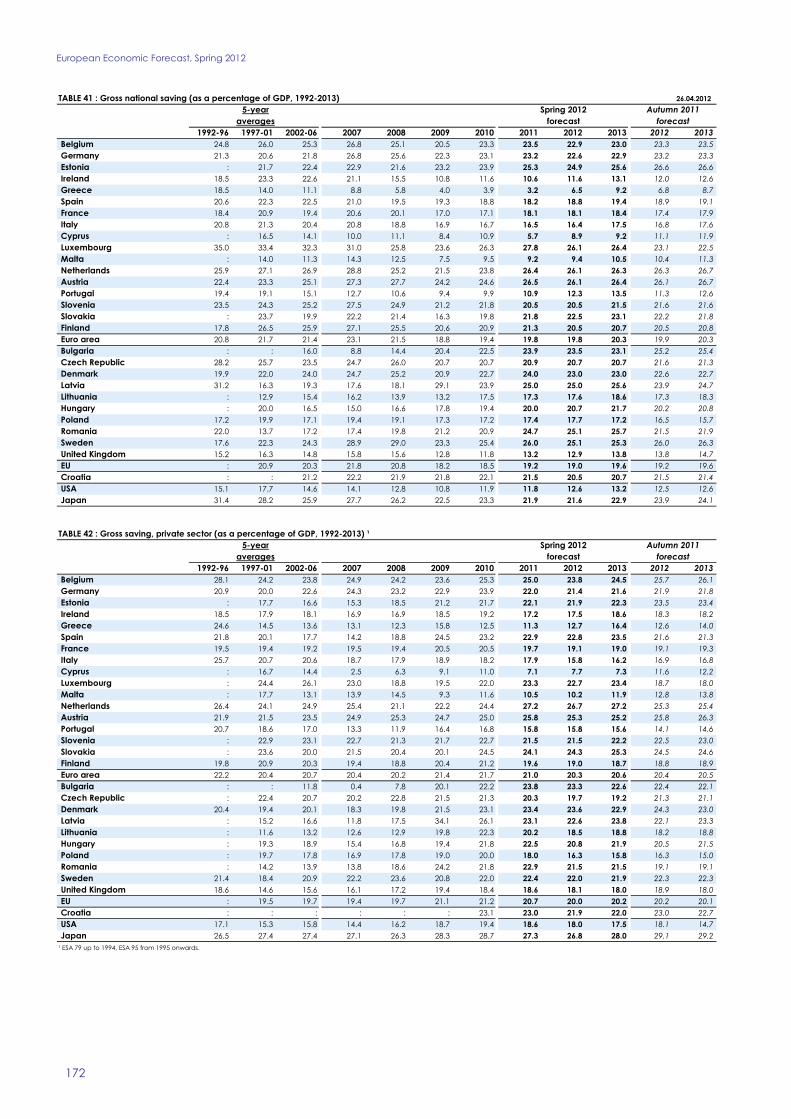
European Economic Forecast, Spring 2012
172
TABLE 41 : Gross national saving (as a percentage of GDP, 1992-2013) 26.04.20125-year Spring 2012 Autumn 2011
averages forecast forecast1992-96 1997-01 2002-06 2007 2008 2009 2010 2011 2012 2013 2012 2013
Belgium 24.8 26.0 25.3 26.8 25.1 20.5 23.3 23.5 22.9 23.0 23.3 23.5 Germany 21.3 20.6 21.8 26.8 25.6 22.3 23.1 23.2 22.6 22.9 23.2 23.3 Estonia : 21.7 22.4 22.9 21.6 23.2 23.9 25.3 24.9 25.6 26.6 26.6 Ireland 18.5 23.3 22.6 21.1 15.5 10.8 11.6 10.6 11.6 13.1 12.0 12.6 Greece 18.5 14.0 11.1 8.8 5.8 4.0 3.9 3.2 6.5 9.2 6.8 8.7 Spain 20.6 22.3 22.5 21.0 19.5 19.3 18.8 18.2 18.8 19.4 18.9 19.1 France 18.4 20.9 19.4 20.6 20.1 17.0 17.1 18.1 18.1 18.4 17.4 17.9 Italy 20.8 21.3 20.4 20.8 18.8 16.9 16.7 16.5 16.4 17.5 16.8 17.6 Cyprus : 16.5 14.1 10.0 11.1 8.4 10.9 5.7 8.9 9.2 11.1 11.9 Luxembourg 35.0 33.4 32.3 31.0 25.8 23.6 26.3 27.8 26.1 26.4 23.1 22.5 Malta : 14.0 11.3 14.3 12.5 7.5 9.5 9.2 9.4 10.5 10.4 11.3 Netherlands 25.9 27.1 26.9 28.8 25.2 21.5 23.8 26.4 26.1 26.3 26.3 26.7 Austria 22.4 23.3 25.1 27.3 27.7 24.2 24.6 26.5 26.1 26.4 26.1 26.7 Portugal 19.4 19.1 15.1 12.7 10.6 9.4 9.9 10.9 12.3 13.5 11.3 12.6 Slovenia 23.5 24.3 25.2 27.5 24.9 21.2 21.8 20.5 20.5 21.5 21.6 21.6 Slovakia : 23.7 19.9 22.2 21.4 16.3 19.8 21.8 22.5 23.1 22.2 21.8 Finland 17.8 26.5 25.9 27.1 25.5 20.6 20.9 21.3 20.5 20.7 20.5 20.8 Euro area 20.8 21.7 21.4 23.1 21.5 18.8 19.4 19.8 19.8 20.3 19.9 20.3 Bulgaria : : 16.0 8.8 14.4 20.4 22.5 23.9 23.5 23.1 25.2 25.4 Czech Republic 28.2 25.7 23.5 24.7 26.0 20.7 20.7 20.9 20.7 20.7 21.6 21.3 Denmark 19.9 22.0 24.0 24.7 25.2 20.9 22.7 24.0 23.0 23.0 22.6 22.7 Latvia 31.2 16.3 19.3 17.6 18.1 29.1 23.9 25.0 25.0 25.6 23.9 24.7 Lithuania : 12.9 15.4 16.2 13.9 13.2 17.5 17.3 17.6 18.6 17.3 18.3 Hungary : 20.0 16.5 15.0 16.6 17.8 19.4 20.0 20.7 21.7 20.2 20.8 Poland 17.2 19.9 17.1 19.4 19.1 17.3 17.2 17.4 17.7 17.2 16.5 15.7 Romania 22.0 13.7 17.2 17.4 19.8 21.2 20.9 24.7 25.1 25.7 21.5 21.9 Sweden 17.6 22.3 24.3 28.9 29.0 23.3 25.4 26.0 25.1 25.3 26.0 26.3 United Kingdom 15.2 16.3 14.8 15.8 15.6 12.8 11.8 13.2 12.9 13.8 13.8 14.7 EU : 20.9 20.3 21.8 20.8 18.2 18.5 19.2 19.0 19.6 19.2 19.6 Croatia : : 21.2 22.2 21.9 21.8 22.1 21.5 20.5 20.7 21.5 21.4 USA 15.1 17.7 14.6 14.1 12.8 10.8 11.9 11.8 12.6 13.2 12.5 12.6 Japan 31.4 28.2 25.9 27.7 26.2 22.5 23.3 21.9 21.6 22.9 23.9 24.1
TABLE 42 : Gross saving, private sector (as a percentage of GDP, 1992-2013) ¹5-year Spring 2012 Autumn 2011
averages forecast forecast1992-96 1997-01 2002-06 2007 2008 2009 2010 2011 2012 2013 2012 2013
Belgium 28.1 24.2 23.8 24.9 24.2 23.6 25.3 25.0 23.8 24.5 25.7 26.1 Germany 20.9 20.0 22.6 24.3 23.2 22.9 23.9 22.0 21.4 21.6 21.9 21.8 Estonia : 17.7 16.6 15.3 18.5 21.2 21.7 22.1 21.9 22.3 23.5 23.4 Ireland 18.5 17.9 18.1 16.9 16.9 18.5 19.2 17.2 17.5 18.6 18.3 18.2 Greece 24.6 14.5 13.6 13.1 12.3 15.8 12.5 11.3 12.7 16.4 12.6 14.0 Spain 21.8 20.1 17.7 14.2 18.8 24.5 23.2 22.9 22.8 23.5 21.6 21.3 France 19.5 19.4 19.2 19.5 19.4 20.5 20.5 19.7 19.1 19.0 19.1 19.3 Italy 25.7 20.7 20.6 18.7 17.9 18.9 18.2 17.9 15.8 16.2 16.9 16.8 Cyprus : 16.7 14.4 2.5 6.3 9.1 11.0 7.1 7.7 7.3 11.6 12.2 Luxembourg : 24.4 26.1 23.0 18.8 19.5 22.0 23.3 22.7 23.4 18.7 18.0 Malta : 17.7 13.1 13.9 14.5 9.3 11.6 10.5 10.2 11.9 12.8 13.8 Netherlands 26.4 24.1 24.9 25.4 21.1 22.2 24.4 27.2 26.7 27.2 25.3 25.4 Austria 21.9 21.5 23.5 24.9 25.3 24.7 25.0 25.8 25.3 25.2 25.8 26.3 Portugal 20.7 18.6 17.0 13.3 11.9 16.4 16.8 15.8 15.8 15.6 14.1 14.6 Slovenia : 22.9 23.1 22.7 21.3 21.7 22.7 21.5 21.5 22.2 22.5 23.0 Slovakia : 23.6 20.0 21.5 20.4 20.1 24.5 24.1 24.3 25.3 24.5 24.6 Finland 19.8 20.9 20.3 19.4 18.8 20.4 21.2 19.6 19.0 18.7 18.8 18.9 Euro area 22.2 20.4 20.7 20.4 20.2 21.4 21.7 21.0 20.3 20.6 20.4 20.5 Bulgaria : : 11.8 0.4 7.8 20.1 22.2 23.8 23.3 22.6 22.4 22.1 Czech Republic : 22.4 20.7 20.2 22.8 21.5 21.3 20.3 19.7 19.2 21.3 21.1 Denmark 20.4 19.4 20.1 18.3 19.8 21.5 23.1 23.4 23.6 22.9 24.3 23.0 Latvia : 15.2 16.6 11.8 17.5 34.1 26.1 23.1 22.6 23.8 22.1 23.3 Lithuania : 11.6 13.2 12.6 12.9 19.8 22.3 20.2 18.5 18.8 18.2 18.8 Hungary : 19.3 18.9 15.4 16.8 19.4 21.8 22.5 20.8 21.9 20.5 21.5 Poland : 19.7 17.8 16.9 17.8 19.0 20.0 18.0 16.3 15.8 16.3 15.0 Romania : 14.2 13.9 13.8 18.6 24.2 21.8 22.9 21.5 21.5 19.1 19.1 Sweden 21.4 18.4 20.9 22.2 23.6 20.8 22.0 22.4 22.0 21.9 22.3 22.3 United Kingdom 18.6 14.6 15.6 16.1 17.2 19.4 18.4 18.6 18.1 18.0 18.9 18.0 EU : 19.5 19.7 19.4 19.7 21.1 21.2 20.7 20.0 20.2 20.2 20.1 Croatia : : : : : : 23.1 23.0 21.9 22.0 23.0 22.7 USA 17.1 15.3 15.8 14.4 16.2 18.7 19.4 18.6 18.0 17.5 18.1 14.7 Japan 26.5 27.4 27.4 27.1 26.3 28.3 28.7 27.3 26.8 28.0 29.1 29.2¹ ESA 79 up to 1994, ESA 95 from 1995 onwards.

Statistical Annex
173
TABLE 43 : Saving rate of households (1992-2013) ¹ 26.04.20125-year Spring 2012 Autumn 2011
averages forecast forecast1992-96 1997-01 2002-06 2007 2008 2009 2010 2011 2012 2013 2012 2013
Belgium 20.1 17.4 16.1 16.4 16.8 18.4 16.2 16.6 16.2 16.1 16.9 16.8 Germany 17.0 15.5 16.1 16.8 17.4 17.0 17.0 16.7 16.7 16.7 16.7 16.6 Estonia : 4.1 -3.2 -1.8 3.4 11.6 9.6 6.7 4.8 3.8 6.9 6.2 Ireland : : 8.0 7.6 11.1 14.7 13.4 11.2 10.5 11.1 12.8 11.4 Greece : 9.1 1.9 8.1 0.3 3.0 -3.0 -2.9 -6.3 -4.7 1.3 2.3 Spain : 11.9 11.1 10.4 13.5 18.5 13.9 11.6 10.7 11.1 11.7 11.2 France 14.8 14.7 15.1 15.1 15.3 16.2 15.6 15.9 16.4 16.3 15.6 15.5 Italy 23.2 16.4 16.4 15.5 15.2 14.5 12.9 12.2 11.1 11.3 11.9 11.7 Cyprus : 10.6 10.4 6.9 4.9 11.4 11.6 6.1 4.5 3.3 : : Luxembourg : : : 10.9 12.0 13.5 : : : : : : Malta : : : : : : : : : : : : Netherlands 18.9 15.1 12.9 13.0 12.2 12.9 10.9 12.9 13.0 13.1 12.0 12.5 Austria : 13.5 14.0 16.3 16.3 15.7 13.5 12.7 12.9 12.5 12.4 12.4 Portugal : 10.6 9.8 7.0 7.1 10.9 10.2 9.4 8.2 8.3 9.5 9.6 Slovenia : 14.2 16.2 16.2 15.2 15.0 15.7 14.9 13.9 14.1 15.6 15.6 Slovakia : 11.4 6.7 7.2 6.1 7.8 11.3 11.0 11.0 11.4 10.6 10.4 Finland 11.6 8.6 8.3 7.2 7.8 11.6 11.1 8.9 7.5 7.0 7.3 7.1 Euro area : : 14.2 14.4 14.7 15.7 14.3 13.9 13.6 13.7 13.8 13.7 Bulgaria : -15.8 : -32.4 -20.9 -3.0 -3.7 : : : : : Czech Republic : 10.7 9.4 10.3 9.4 10.7 10.3 8.9 8.9 8.7 11.4 11.4 Denmark 7.3 5.6 7.0 4.2 5.1 8.2 8.0 6.8 7.0 6.4 8.7 6.6 Latvia 5.4 -1.1 1.0 -5.7 4.9 10.3 4.2 0.0 0.7 1.6 3.1 2.8 Lithuania : 4.9 1.9 -4.2 -3.0 4.3 1.2 : : : : : Hungary : 14.1 10.3 8.4 8.0 9.9 8.1 : : : : : Poland : 13.5 9.1 7.1 2.4 9.0 8.5 3.6 2.0 2.9 7.2 7.5 Romania : 0.3 -8.7 -11.5 -1.1 -1.3 -2.5 : : : : : Sweden 9.8 5.8 8.1 10.1 11.8 14.0 11.4 13.1 13.2 13.5 14.9 15.0 United Kingdom 10.3 6.6 4.0 2.7 3.1 7.8 7.2 7.4 7.4 7.3 7.3 7.6 EU : : 11.6 11.0 11.4 13.4 12.8 12.4 12.1 12.2 12.6 12.5 Croatia : : : : : : : : : : : : USA 9.9 7.8 7.3 7.1 9.9 9.8 9.7 9.0 8.9 8.7 9.3 9.1 Japan 19.5 15.4 9.1 8.0 7.6 9.1 8.9 10.9 11.3 12.1 13.7 14.5¹ ESA 79 up to 1994, ESA 95 from 1995 onwards.
TABLE 44 : Gross saving, general government (as a percentage of GDP, 1992-2013) ¹5-year Spring 2012 Autumn 2011
averages forecast forecast1992-96 1997-01 2002-06 2007 2008 2009 2010 2011 2012 2013 2012 2013
Belgium -3.3 1.7 1.5 1.9 0.9 -3.0 -1.9 -1.6 -0.9 -1.4 -2.3 -2.6 Germany 0.5 0.6 -0.7 2.5 2.4 -0.6 -0.8 1.2 1.3 1.3 1.3 1.6 Estonia : 4.0 5.8 7.6 3.2 1.9 2.2 3.2 3.0 3.4 3.1 3.1 Ireland 0.0 5.4 4.5 4.1 -1.4 -7.7 -7.6 -6.6 -6.0 -5.5 -6.3 -5.6 Greece -6.1 -0.5 -2.5 -4.4 -6.5 -11.8 -8.7 -8.1 -6.2 -7.2 -5.8 -5.3 Spain -1.1 2.1 4.8 6.8 0.7 -5.3 -4.3 -4.7 -4.0 -4.0 -2.7 -2.2 France -1.1 1.4 0.2 1.1 0.6 -3.4 -3.4 -1.6 -1.0 -0.6 -1.7 -1.4 Italy -5.0 0.6 -0.2 2.1 0.8 -2.0 -1.5 -1.5 0.7 1.3 0.0 0.9 Cyprus : -0.2 -0.3 7.4 4.9 -0.7 -0.1 -1.4 1.2 1.9 -0.5 -0.3 Luxembourg : 9.0 6.2 8.0 7.1 4.1 4.3 4.5 3.5 3.0 4.4 4.5 Malta : -3.7 -1.7 0.4 -2.0 -1.8 -2.0 -1.3 -0.8 -1.4 -2.4 -2.5 Netherlands -0.4 3.0 2.0 3.4 4.1 -0.7 -0.6 -0.8 -0.6 -0.9 1.0 1.2 Austria 0.5 1.8 1.6 2.5 2.3 -0.5 -0.4 0.8 0.8 1.2 0.3 0.3 Portugal -1.2 0.4 -1.9 -0.7 -1.3 -6.9 -6.9 -4.9 -3.4 -2.1 -2.8 -2.0 Slovenia : 1.4 2.1 4.7 3.6 -0.5 -0.9 -0.9 -1.0 -0.7 -0.9 -1.3 Slovakia : 0.2 -0.1 0.7 1.0 -3.7 -4.7 -2.3 -1.8 -2.2 -2.3 -2.7 Finland -2.0 5.6 5.6 7.7 6.6 0.2 -0.4 1.6 1.5 1.9 1.7 1.8 Euro area -1.4 1.3 0.7 2.6 1.3 -2.6 -2.3 -1.2 -0.5 -0.3 -0.6 -0.2 Bulgaria : 4.1 4.1 8.4 6.6 0.3 0.3 0.1 0.2 0.5 2.8 3.3 Czech Republic : 3.2 2.8 4.5 3.2 -0.9 -0.6 0.6 1.0 1.5 0.3 0.2 Denmark -0.6 2.6 3.9 6.5 5.5 -0.7 -0.4 0.6 -0.6 0.1 -1.7 -0.4 Latvia : 1.1 2.8 5.7 0.5 -4.9 -2.2 1.9 2.4 1.8 1.8 1.4 Lithuania : 1.4 2.2 3.6 1.0 -6.6 -4.9 -2.9 -0.9 -0.2 -0.8 -0.5 Hungary : 0.6 -2.4 -0.4 -0.2 -1.6 -2.4 -2.5 -0.1 -0.2 -0.2 -0.7 Poland : 0.2 -0.8 2.5 1.3 -1.8 -2.8 -0.6 1.4 1.4 0.2 0.7 Romania : -0.5 3.4 3.6 1.2 -3.0 -0.9 1.8 3.6 4.2 2.4 2.9 Sweden -3.8 3.9 3.4 6.7 5.4 2.5 3.4 3.6 3.1 3.5 3.8 4.0 United Kingdom -3.4 1.7 -0.8 -0.3 -1.6 -6.6 -6.6 -5.4 -5.2 -4.3 -5.1 -3.4 EU : 1.5 0.6 2.3 1.1 -2.9 -2.7 -1.5 -1.0 -0.6 -1.0 -0.4 Croatia : : : : : : -1.0 -1.5 -1.4 -1.3 -1.5 -1.3 USA -2.0 2.4 -1.3 -0.2 -3.4 -7.9 -7.6 -6.7 -5.4 -4.3 -5.6 -2.1 Japan 4.9 0.8 -1.4 0.6 -0.1 -5.8 -5.4 -5.4 -5.2 -5.1 -5.1 -5.1¹ ESA 79 up to 1994, ESA 95 from 1995 onwards.

European Economic Forecast, Spring 2012
174
TABLE 45 : Exports of goods and services, volume (percentage change on preceding year, 1992-2013) 26.04.20125-year Spring 2012 Autumn 2011
averages forecast forecast1992-96 1997-01 2002-06 2007 2008 2009 2010 2011 2012 2013 2012 2013
Belgium 4.0 6.3 3.7 5.2 1.7 -11.2 9.9 4.8 0.8 4.2 2.6 4.7 Germany 2.7 8.9 7.6 8.0 2.7 -13.6 13.7 8.2 2.9 5.0 3.9 6.2 Estonia : 13.8 8.6 3.7 0.6 -18.6 22.5 24.9 1.4 5.6 3.8 6.0 Ireland 14.3 17.0 4.5 8.4 -1.1 -4.2 6.3 4.1 3.2 4.2 3.8 4.3 Greece 4.2 11.2 3.2 6.9 3.0 -19.5 4.2 -0.3 3.2 5.4 6.5 6.5 Spain 10.3 8.9 3.8 6.7 -1.0 -10.4 13.5 9.0 3.2 4.7 3.8 4.5 France 5.1 8.0 2.6 2.3 -0.3 -12.4 9.7 4.9 2.5 4.8 3.5 4.9 Italy 7.9 4.1 2.7 6.2 -2.8 -17.5 11.6 5.6 1.1 4.0 2.3 4.5 Cyprus : 6.1 1.7 6.2 -0.5 -10.7 3.7 3.6 1.4 2.3 2.5 4.0 Luxembourg 4.4 10.7 7.4 9.1 4.0 -10.9 2.8 1.7 0.1 4.2 -0.6 5.9 Malta : 4.0 4.8 9.9 1.6 -10.5 17.7 1.0 2.4 4.4 3.9 5.2 Netherlands 5.8 8.3 4.7 6.4 2.0 -8.1 10.8 3.8 0.4 3.8 3.2 4.3 Austria 3.2 9.1 6.1 8.9 1.4 -14.3 8.3 6.7 2.8 5.1 3.8 6.4 Portugal 7.5 5.9 4.4 7.5 -0.1 -10.9 8.8 7.4 2.5 4.7 4.2 6.1 Slovenia -2.1 7.9 9.0 13.7 2.9 -17.2 9.5 6.8 2.2 5.1 4.2 5.9 Slovakia : 10.8 11.7 14.3 3.1 -15.9 16.5 10.8 3.1 6.1 2.4 6.3 Finland 10.8 10.5 5.6 8.2 5.8 -21.5 7.8 -0.8 1.9 4.8 3.4 5.0 Euro area 5.8 8.1 5.0 6.6 1.0 -12.7 11.2 6.2 2.1 4.6 3.4 5.3 Bulgaria : 3.3 11.0 6.1 3.0 -11.2 14.7 12.8 3.3 5.2 4.7 5.9 Czech Republic 9.9 11.1 9.7 11.2 4.0 -10.0 16.4 11.0 3.6 5.7 3.8 7.0 Denmark 3.4 7.2 4.5 2.8 3.3 -9.8 3.2 6.8 3.2 4.9 3.4 4.8 Latvia : 5.8 9.2 10.0 2.0 -14.1 11.5 12.6 4.5 6.3 5.8 6.2 Lithuania : 6.7 12.0 3.1 11.4 -12.5 17.4 13.7 4.3 6.0 6.3 6.5 Hungary 11.5 15.2 10.9 15.0 5.7 -10.2 14.3 8.4 5.4 8.0 7.2 7.9 Poland 12.2 9.7 11.0 9.1 7.1 -6.8 12.1 7.5 3.4 5.7 5.1 5.6 Romania 11.2 11.1 11.6 7.8 8.3 -6.4 14.0 9.9 2.9 5.8 4.3 5.9 Sweden 7.8 8.3 6.3 5.7 1.7 -13.8 11.7 6.8 1.3 5.4 3.3 5.0 United Kingdom 7.2 5.6 5.6 -1.3 1.3 -9.5 7.4 4.6 3.1 4.7 3.4 4.8 EU 7.0 7.9 5.4 5.8 1.5 -12.0 10.9 6.3 2.4 4.8 3.6 5.3 Croatia : 6.2 5.4 3.7 2.2 -17.3 6.0 2.2 -1.5 2.5 2.5 4.5 USA 7.4 4.1 4.9 9.3 6.1 -9.4 11.3 6.7 4.9 6.6 5.9 7.7 Japan 3.7 2.9 9.5 8.7 1.4 -24.2 24.2 0.1 2.4 4.8 3.2 4.9
TABLE 46 : Imports of goods and services, volume (percentage change on preceding year, 1992-2013)5-year Spring 2012 Autumn 2011
averages forecast forecast1992-96 1997-01 2002-06 2007 2008 2009 2010 2011 2012 2013 2012 2013
Belgium 4.0 5.8 3.4 5.5 3.1 -10.7 8.7 4.9 1.1 4.1 2.6 4.5 Germany 3.1 7.6 6.0 5.4 3.3 -9.2 11.7 7.4 3.8 6.0 5.8 7.2 Estonia : 12.7 13.1 6.3 -6.3 -32.4 20.6 27.0 2.3 5.9 4.7 6.4 Ireland 12.0 16.9 5.0 7.9 -3.0 -9.3 2.7 -0.7 1.2 3.0 2.6 3.1 Greece 3.8 10.8 2.8 14.6 3.3 -20.2 -7.2 -8.1 -5.1 0.0 -3.2 0.7 Spain 6.4 11.4 7.5 8.0 -5.2 -17.2 8.9 -0.1 -5.6 -0.9 1.5 3.2 France 3.2 8.6 3.8 5.5 0.9 -10.8 8.8 4.6 1.3 4.3 3.3 4.6 Italy 2.3 6.9 3.7 5.2 -3.0 -13.4 12.7 0.4 -4.1 2.3 0.6 3.4 Cyprus : 4.7 4.0 13.4 8.5 -18.6 4.9 -5.0 -2.2 2.3 2.3 2.5 Luxembourg 3.6 11.1 7.2 9.3 5.6 -12.0 4.6 3.2 0.7 4.8 -0.9 6.8 Malta : 1.7 5.8 6.1 0.6 -11.3 13.7 -1.0 2.0 4.0 3.5 4.9 Netherlands 5.5 8.9 4.4 5.6 2.3 -8.0 10.6 3.5 -0.8 3.3 2.2 4.1 Austria 3.3 6.7 5.0 7.1 0.0 -13.8 8.0 7.0 2.2 4.9 3.7 6.4 Portugal 7.0 8.0 3.2 5.5 2.3 -10.0 5.4 -5.5 -6.9 1.9 -5.2 1.2 Slovenia 3.1 7.7 8.7 16.7 3.7 -19.6 7.2 4.7 0.4 4.1 3.7 6.1 Slovakia : 9.6 10.0 9.2 3.1 -18.1 16.3 4.5 2.7 5.5 1.6 5.2 Finland 6.0 8.4 6.6 7.0 7.5 -16.4 7.7 0.1 2.3 3.9 3.5 4.8 Euro area 3.9 8.3 5.0 6.2 0.9 -11.7 9.6 3.8 0.4 3.9 3.0 5.0 Bulgaria : 11.6 14.1 9.6 4.2 -21.0 2.4 8.5 2.7 5.6 4.5 6.2 Czech Republic 20.1 9.3 7.7 12.8 2.7 -11.6 16.0 7.5 2.5 5.1 3.1 7.1 Denmark 4.3 7.2 7.5 4.3 3.3 -11.6 3.5 5.2 5.0 5.4 4.4 6.1 Latvia : 7.3 13.6 16.1 -10.8 -33.3 11.5 20.7 5.1 7.5 7.0 7.7 Lithuania : 7.5 14.6 10.6 10.3 -28.3 17.3 12.7 4.5 6.2 6.2 7.0 Hungary 11.9 16.0 10.4 12.8 5.5 -14.8 12.8 6.3 4.0 7.4 6.4 7.9 Poland 15.3 9.7 9.9 13.7 8.0 -12.4 13.9 5.8 1.7 4.9 3.5 5.1 Romania 8.1 13.1 17.8 27.3 7.9 -20.5 11.9 10.5 4.0 7.4 4.5 8.5 Sweden 4.5 7.6 5.0 9.0 3.5 -14.3 12.7 6.1 2.2 5.2 2.9 4.8 United Kingdom 6.2 8.2 6.3 -0.9 -1.2 -12.2 8.6 1.2 1.3 1.8 0.5 1.4 EU 5.5 8.4 5.6 6.0 1.2 -12.2 9.8 3.9 0.9 3.9 2.9 4.8 Croatia : 5.7 8.6 6.2 3.3 -20.4 -1.3 1.0 -2.1 4.1 1.0 5.0 USA 8.8 9.2 6.2 2.4 -2.7 -13.6 12.5 4.9 3.7 5.4 5.5 8.0 Japan 6.1 1.7 4.2 2.3 0.3 -15.7 11.1 5.7 4.1 3.6 2.5 4.1
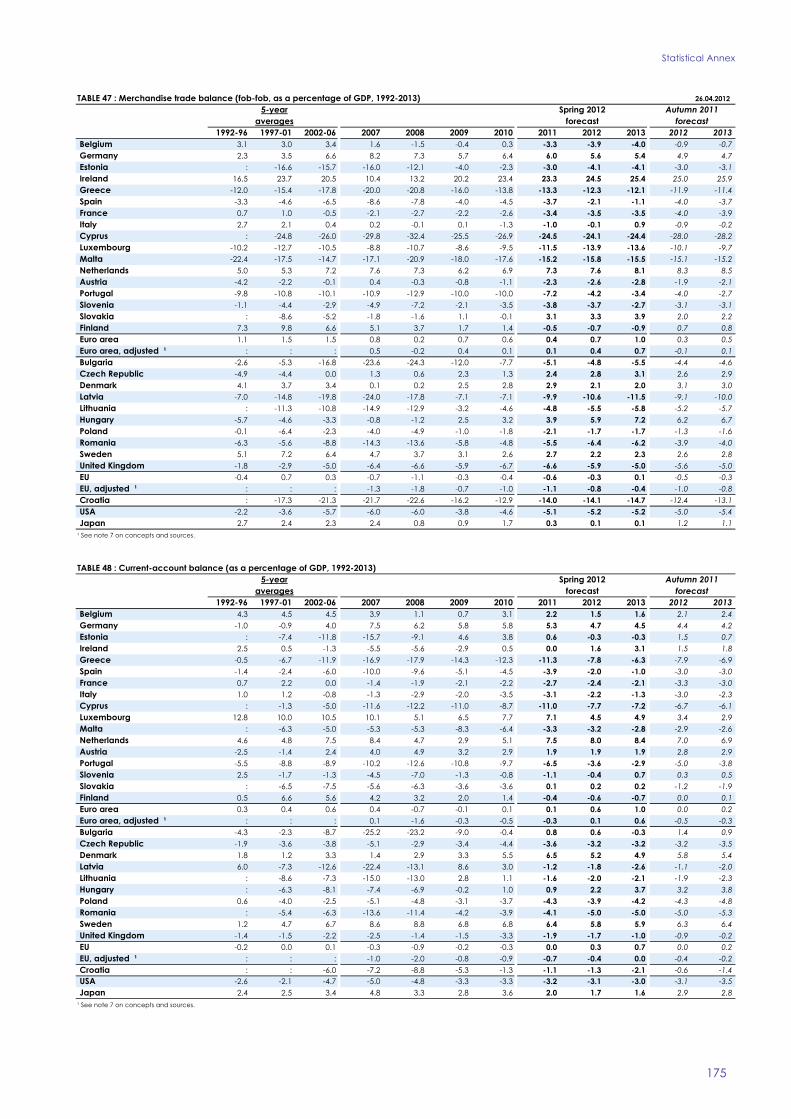
Statistical Annex
175
TABLE 47 : Merchandise trade balance (fob-fob, as a percentage of GDP, 1992-2013) 26.04.20125-year Spring 2012 Autumn 2011
averages forecast forecast1992-96 1997-01 2002-06 2007 2008 2009 2010 2011 2012 2013 2012 2013
Belgium 3.1 3.0 3.4 1.6 -1.5 -0.4 0.3 -3.3 -3.9 -4.0 -0.9 -0.7 Germany 2.3 3.5 6.6 8.2 7.3 5.7 6.4 6.0 5.6 5.4 4.9 4.7 Estonia : -16.6 -15.7 -16.0 -12.1 -4.0 -2.3 -3.0 -4.1 -4.1 -3.0 -3.1 Ireland 16.5 23.7 20.5 10.4 13.2 20.2 23.4 23.3 24.5 25.4 25.0 25.9 Greece -12.0 -15.4 -17.8 -20.0 -20.8 -16.0 -13.8 -13.3 -12.3 -12.1 -11.9 -11.4 Spain -3.3 -4.6 -6.5 -8.6 -7.8 -4.0 -4.5 -3.7 -2.1 -1.1 -4.0 -3.7 France 0.7 1.0 -0.5 -2.1 -2.7 -2.2 -2.6 -3.4 -3.5 -3.5 -4.0 -3.9 Italy 2.7 2.1 0.4 0.2 -0.1 0.1 -1.3 -1.0 -0.1 0.9 -0.9 -0.2 Cyprus : -24.8 -26.0 -29.8 -32.4 -25.5 -26.9 -24.5 -24.1 -24.4 -28.0 -28.2 Luxembourg -10.2 -12.7 -10.5 -8.8 -10.7 -8.6 -9.5 -11.5 -13.9 -13.6 -10.1 -9.7 Malta -22.4 -17.5 -14.7 -17.1 -20.9 -18.0 -17.6 -15.2 -15.8 -15.5 -15.1 -15.2 Netherlands 5.0 5.3 7.2 7.6 7.3 6.2 6.9 7.3 7.6 8.1 8.3 8.5 Austria -4.2 -2.2 -0.1 0.4 -0.3 -0.8 -1.1 -2.3 -2.6 -2.8 -1.9 -2.1 Portugal -9.8 -10.8 -10.1 -10.9 -12.9 -10.0 -10.0 -7.2 -4.2 -3.4 -4.0 -2.7 Slovenia -1.1 -4.4 -2.9 -4.9 -7.2 -2.1 -3.5 -3.8 -3.7 -2.7 -3.1 -3.1 Slovakia : -8.6 -5.2 -1.8 -1.6 1.1 -0.1 3.1 3.3 3.9 2.0 2.2 Finland 7.3 9.8 6.6 5.1 3.7 1.7 1.4 -0.5 -0.7 -0.9 0.7 0.8 Euro area 1.1 1.5 1.5 0.8 0.2 0.7 0.6 0.4 0.7 1.0 0.3 0.5 Euro area, adjusted ¹ : : : 0.5 -0.2 0.4 0.1 0.1 0.4 0.7 -0.1 0.1 Bulgaria -2.6 -5.3 -16.8 -23.6 -24.3 -12.0 -7.7 -5.1 -4.8 -5.5 -4.4 -4.6 Czech Republic -4.9 -4.4 0.0 1.3 0.6 2.3 1.3 2.4 2.8 3.1 2.6 2.9 Denmark 4.1 3.7 3.4 0.1 0.2 2.5 2.8 2.9 2.1 2.0 3.1 3.0 Latvia -7.0 -14.8 -19.8 -24.0 -17.8 -7.1 -7.1 -9.9 -10.6 -11.5 -9.1 -10.0 Lithuania : -11.3 -10.8 -14.9 -12.9 -3.2 -4.6 -4.8 -5.5 -5.8 -5.2 -5.7 Hungary -5.7 -4.6 -3.3 -0.8 -1.2 2.5 3.2 3.9 5.9 7.2 6.2 6.7 Poland -0.1 -6.4 -2.3 -4.0 -4.9 -1.0 -1.8 -2.1 -1.7 -1.7 -1.3 -1.6 Romania -6.3 -5.6 -8.8 -14.3 -13.6 -5.8 -4.8 -5.5 -6.4 -6.2 -3.9 -4.0 Sweden 5.1 7.2 6.4 4.7 3.7 3.1 2.6 2.7 2.2 2.3 2.6 2.8 United Kingdom -1.8 -2.9 -5.0 -6.4 -6.6 -5.9 -6.7 -6.6 -5.9 -5.0 -5.6 -5.0 EU -0.4 0.7 0.3 -0.7 -1.1 -0.3 -0.4 -0.6 -0.3 0.1 -0.5 -0.3 EU, adjusted ¹ : : : -1.3 -1.8 -0.7 -1.0 -1.1 -0.8 -0.4 -1.0 -0.8 Croatia : -17.3 -21.3 -21.7 -22.6 -16.2 -12.9 -14.0 -14.1 -14.7 -12.4 -13.1 USA -2.2 -3.6 -5.7 -6.0 -6.0 -3.8 -4.6 -5.1 -5.2 -5.2 -5.0 -5.4 Japan 2.7 2.4 2.3 2.4 0.8 0.9 1.7 0.3 0.1 0.1 1.2 1.1¹ See note 7 on concepts and sources.
TABLE 48 : Current-account balance (as a percentage of GDP, 1992-2013)5-year Spring 2012 Autumn 2011
averages forecast forecast1992-96 1997-01 2002-06 2007 2008 2009 2010 2011 2012 2013 2012 2013
Belgium 4.3 4.5 4.5 3.9 1.1 0.7 3.1 2.2 1.5 1.6 2.1 2.4 Germany -1.0 -0.9 4.0 7.5 6.2 5.8 5.8 5.3 4.7 4.5 4.4 4.2 Estonia : -7.4 -11.8 -15.7 -9.1 4.6 3.8 0.6 -0.3 -0.3 1.5 0.7 Ireland 2.5 0.5 -1.3 -5.5 -5.6 -2.9 0.5 0.0 1.6 3.1 1.5 1.8 Greece -0.5 -6.7 -11.9 -16.9 -17.9 -14.3 -12.3 -11.3 -7.8 -6.3 -7.9 -6.9 Spain -1.4 -2.4 -6.0 -10.0 -9.6 -5.1 -4.5 -3.9 -2.0 -1.0 -3.0 -3.0 France 0.7 2.2 0.0 -1.4 -1.9 -2.1 -2.2 -2.7 -2.4 -2.1 -3.3 -3.0 Italy 1.0 1.2 -0.8 -1.3 -2.9 -2.0 -3.5 -3.1 -2.2 -1.3 -3.0 -2.3 Cyprus : -1.3 -5.0 -11.6 -12.2 -11.0 -8.7 -11.0 -7.7 -7.2 -6.7 -6.1 Luxembourg 12.8 10.0 10.5 10.1 5.1 6.5 7.7 7.1 4.5 4.9 3.4 2.9 Malta : -6.3 -5.0 -5.3 -5.3 -8.3 -6.4 -3.3 -3.2 -2.8 -2.9 -2.6 Netherlands 4.6 4.8 7.5 8.4 4.7 2.9 5.1 7.5 8.0 8.4 7.0 6.9 Austria -2.5 -1.4 2.4 4.0 4.9 3.2 2.9 1.9 1.9 1.9 2.8 2.9 Portugal -5.5 -8.8 -8.9 -10.2 -12.6 -10.8 -9.7 -6.5 -3.6 -2.9 -5.0 -3.8 Slovenia 2.5 -1.7 -1.3 -4.5 -7.0 -1.3 -0.8 -1.1 -0.4 0.7 0.3 0.5 Slovakia : -6.5 -7.5 -5.6 -6.3 -3.6 -3.6 0.1 0.2 0.2 -1.2 -1.9 Finland 0.5 6.6 5.6 4.2 3.2 2.0 1.4 -0.4 -0.6 -0.7 0.0 0.1 Euro area 0.3 0.4 0.6 0.4 -0.7 -0.1 0.1 0.1 0.6 1.0 0.0 0.2 Euro area, adjusted ¹ : : : 0.1 -1.6 -0.3 -0.5 -0.3 0.1 0.6 -0.5 -0.3 Bulgaria -4.3 -2.3 -8.7 -25.2 -23.2 -9.0 -0.4 0.8 0.6 -0.3 1.4 0.9 Czech Republic -1.9 -3.6 -3.8 -5.1 -2.9 -3.4 -4.4 -3.6 -3.2 -3.2 -3.2 -3.5 Denmark 1.8 1.2 3.3 1.4 2.9 3.3 5.5 6.5 5.2 4.9 5.8 5.4 Latvia 6.0 -7.3 -12.6 -22.4 -13.1 8.6 3.0 -1.2 -1.8 -2.6 -1.1 -2.0 Lithuania : -8.6 -7.3 -15.0 -13.0 2.8 1.1 -1.6 -2.0 -2.1 -1.9 -2.3 Hungary : -6.3 -8.1 -7.4 -6.9 -0.2 1.0 0.9 2.2 3.7 3.2 3.8 Poland 0.6 -4.0 -2.5 -5.1 -4.8 -3.1 -3.7 -4.3 -3.9 -4.2 -4.3 -4.8 Romania : -5.4 -6.3 -13.6 -11.4 -4.2 -3.9 -4.1 -5.0 -5.0 -5.0 -5.3 Sweden 1.2 4.7 6.7 8.6 8.8 6.8 6.8 6.4 5.8 5.9 6.3 6.4 United Kingdom -1.4 -1.5 -2.2 -2.5 -1.4 -1.5 -3.3 -1.9 -1.7 -1.0 -0.9 -0.2 EU -0.2 0.0 0.1 -0.3 -0.9 -0.2 -0.3 0.0 0.3 0.7 0.0 0.2 EU, adjusted ¹ : : : -1.0 -2.0 -0.8 -0.9 -0.7 -0.4 0.0 -0.4 -0.2 Croatia : : -6.0 -7.2 -8.8 -5.3 -1.3 -1.1 -1.3 -2.1 -0.6 -1.4 USA -2.6 -2.1 -4.7 -5.0 -4.8 -3.3 -3.3 -3.2 -3.1 -3.0 -3.1 -3.5 Japan 2.4 2.5 3.4 4.8 3.3 2.8 3.6 2.0 1.7 1.6 2.9 2.8¹ See note 7 on concepts and sources.
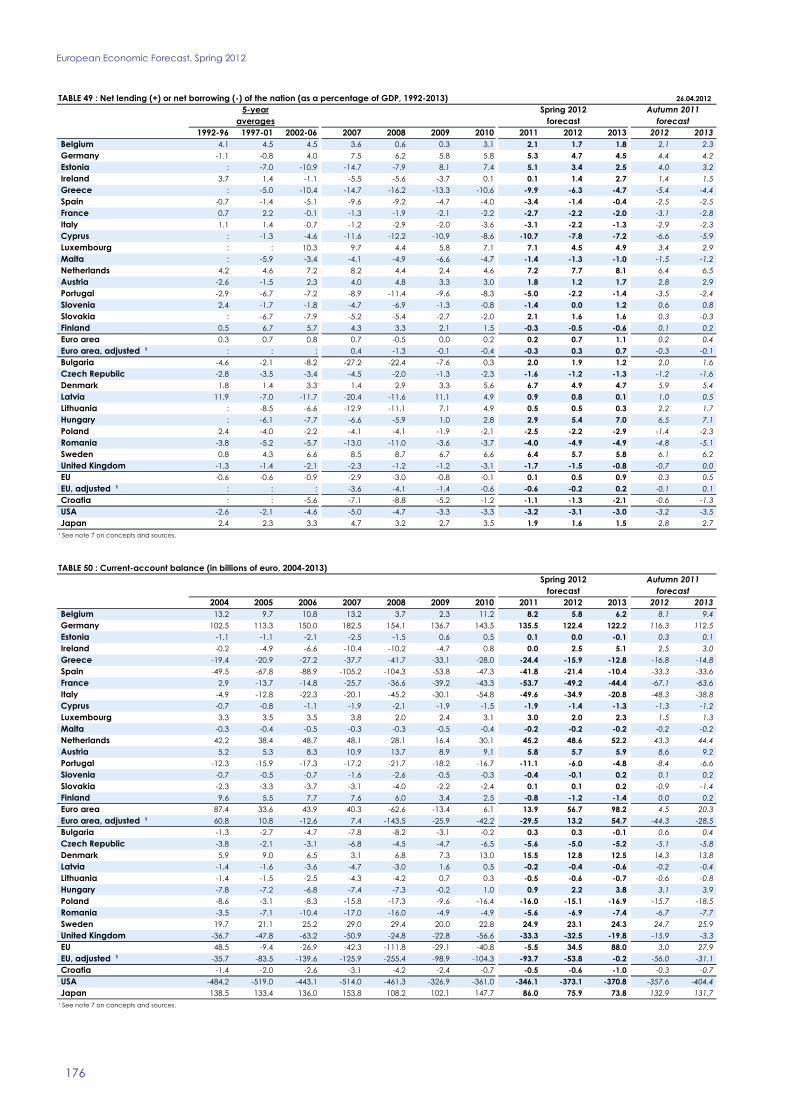
European Economic Forecast, Spring 2012
176
TABLE 49 : Net lending (+) or net borrowing (-) of the nation (as a percentage of GDP, 1992-2013) 26.04.20125-year Spring 2012 Autumn 2011
averages forecast forecast1992-96 1997-01 2002-06 2007 2008 2009 2010 2011 2012 2013 2012 2013
Belgium 4.1 4.5 4.5 3.6 0.6 0.3 3.1 2.1 1.7 1.8 2.1 2.3 Germany -1.1 -0.8 4.0 7.5 6.2 5.8 5.8 5.3 4.7 4.5 4.4 4.2 Estonia : -7.0 -10.9 -14.7 -7.9 8.1 7.4 5.1 3.4 2.5 4.0 3.2 Ireland 3.7 1.4 -1.1 -5.5 -5.6 -3.7 0.1 0.1 1.4 2.7 1.4 1.5 Greece : -5.0 -10.4 -14.7 -16.2 -13.3 -10.6 -9.9 -6.3 -4.7 -5.4 -4.4 Spain -0.7 -1.4 -5.1 -9.6 -9.2 -4.7 -4.0 -3.4 -1.4 -0.4 -2.5 -2.5 France 0.7 2.2 -0.1 -1.3 -1.9 -2.1 -2.2 -2.7 -2.2 -2.0 -3.1 -2.8 Italy 1.1 1.4 -0.7 -1.2 -2.9 -2.0 -3.6 -3.1 -2.2 -1.3 -2.9 -2.3 Cyprus : -1.3 -4.6 -11.6 -12.2 -10.9 -8.6 -10.7 -7.8 -7.2 -6.6 -5.9 Luxembourg : : 10.3 9.7 4.4 5.8 7.1 7.1 4.5 4.9 3.4 2.9 Malta : -5.9 -3.4 -4.1 -4.9 -6.6 -4.7 -1.4 -1.3 -1.0 -1.5 -1.2 Netherlands 4.2 4.6 7.2 8.2 4.4 2.4 4.6 7.2 7.7 8.1 6.4 6.5 Austria -2.6 -1.5 2.3 4.0 4.8 3.3 3.0 1.8 1.2 1.7 2.8 2.9 Portugal -2.9 -6.7 -7.2 -8.9 -11.4 -9.6 -8.3 -5.0 -2.2 -1.4 -3.5 -2.4 Slovenia 2.4 -1.7 -1.8 -4.7 -6.9 -1.3 -0.8 -1.4 0.0 1.2 0.6 0.8 Slovakia : -6.7 -7.9 -5.2 -5.4 -2.7 -2.0 2.1 1.6 1.6 0.3 -0.3 Finland 0.5 6.7 5.7 4.3 3.3 2.1 1.5 -0.3 -0.5 -0.6 0.1 0.2 Euro area 0.3 0.7 0.8 0.7 -0.5 0.0 0.2 0.2 0.7 1.1 0.2 0.4 Euro area, adjusted ¹ : : : 0.4 -1.3 -0.1 -0.4 -0.3 0.3 0.7 -0.3 -0.1 Bulgaria -4.6 -2.1 -8.2 -27.2 -22.4 -7.6 0.3 2.0 1.9 1.2 2.0 1.6 Czech Republic -2.8 -3.5 -3.4 -4.5 -2.0 -1.3 -2.3 -1.6 -1.2 -1.3 -1.2 -1.6 Denmark 1.8 1.4 3.3 1.4 2.9 3.3 5.6 6.7 4.9 4.7 5.9 5.4 Latvia 11.9 -7.0 -11.7 -20.4 -11.6 11.1 4.9 0.9 0.8 0.1 1.0 0.5 Lithuania : -8.5 -6.6 -12.9 -11.1 7.1 4.9 0.5 0.5 0.3 2.2 1.7 Hungary : -6.1 -7.7 -6.6 -5.9 1.0 2.8 2.9 5.4 7.0 6.5 7.1 Poland 2.4 -4.0 -2.2 -4.1 -4.1 -1.9 -2.1 -2.5 -2.2 -2.9 -1.4 -2.3 Romania -3.8 -5.2 -5.7 -13.0 -11.0 -3.6 -3.7 -4.0 -4.9 -4.9 -4.8 -5.1 Sweden 0.8 4.3 6.6 8.5 8.7 6.7 6.6 6.4 5.7 5.8 6.1 6.2 United Kingdom -1.3 -1.4 -2.1 -2.3 -1.2 -1.2 -3.1 -1.7 -1.5 -0.8 -0.7 0.0 EU -0.6 -0.6 -0.9 -2.9 -3.0 -0.8 -0.1 0.1 0.5 0.9 0.3 0.5 EU, adjusted ¹ : : : -3.6 -4.1 -1.4 -0.6 -0.6 -0.2 0.2 -0.1 0.1 Croatia : : -5.6 -7.1 -8.8 -5.2 -1.2 -1.1 -1.3 -2.1 -0.6 -1.3 USA -2.6 -2.1 -4.6 -5.0 -4.7 -3.3 -3.3 -3.2 -3.1 -3.0 -3.2 -3.5 Japan 2.4 2.3 3.3 4.7 3.2 2.7 3.5 1.9 1.6 1.5 2.8 2.7¹ See note 7 on concepts and sources.
TABLE 50 : Current-account balance (in billions of euro, 2004-2013) Spring 2012 Autumn 2011 forecast forecast
2004 2005 2006 2007 2008 2009 2010 2011 2012 2013 2012 2013 Belgium 13.2 9.7 10.8 13.2 3.7 2.3 11.2 8.2 5.8 6.2 8.1 9.4 Germany 102.5 113.3 150.0 182.5 154.1 136.7 143.5 135.5 122.4 122.2 116.3 112.5 Estonia -1.1 -1.1 -2.1 -2.5 -1.5 0.6 0.5 0.1 0.0 -0.1 0.3 0.1 Ireland -0.2 -4.9 -6.6 -10.4 -10.2 -4.7 0.8 0.0 2.5 5.1 2.5 3.0 Greece -19.4 -20.9 -27.2 -37.7 -41.7 -33.1 -28.0 -24.4 -15.9 -12.8 -16.8 -14.8 Spain -49.5 -67.8 -88.9 -105.2 -104.3 -53.8 -47.3 -41.8 -21.4 -10.4 -33.3 -33.6 France 2.9 -13.7 -14.8 -25.7 -36.6 -39.2 -43.3 -53.7 -49.2 -44.4 -67.1 -63.6 Italy -4.9 -12.8 -22.3 -20.1 -45.2 -30.1 -54.8 -49.6 -34.9 -20.8 -48.3 -38.8 Cyprus -0.7 -0.8 -1.1 -1.9 -2.1 -1.9 -1.5 -1.9 -1.4 -1.3 -1.3 -1.2 Luxembourg 3.3 3.5 3.5 3.8 2.0 2.4 3.1 3.0 2.0 2.3 1.5 1.3 Malta -0.3 -0.4 -0.5 -0.3 -0.3 -0.5 -0.4 -0.2 -0.2 -0.2 -0.2 -0.2 Netherlands 42.2 38.4 48.7 48.1 28.1 16.4 30.1 45.2 48.6 52.2 43.3 44.4 Austria 5.2 5.3 8.3 10.9 13.7 8.9 9.1 5.8 5.7 5.9 8.6 9.2 Portugal -12.3 -15.9 -17.3 -17.2 -21.7 -18.2 -16.7 -11.1 -6.0 -4.8 -8.4 -6.6 Slovenia -0.7 -0.5 -0.7 -1.6 -2.6 -0.5 -0.3 -0.4 -0.1 0.2 0.1 0.2 Slovakia -2.3 -3.3 -3.7 -3.1 -4.0 -2.2 -2.4 0.1 0.1 0.2 -0.9 -1.4 Finland 9.6 5.5 7.7 7.6 6.0 3.4 2.5 -0.8 -1.2 -1.4 0.0 0.2 Euro area 87.4 33.6 43.9 40.3 -62.6 -13.4 6.1 13.9 56.7 98.2 4.5 20.3 Euro area, adjusted ¹ 60.8 10.8 -12.6 7.4 -143.5 -25.9 -42.2 -29.5 13.2 54.7 -44.3 -28.5 Bulgaria -1.3 -2.7 -4.7 -7.8 -8.2 -3.1 -0.2 0.3 0.3 -0.1 0.6 0.4 Czech Republic -3.8 -2.1 -3.1 -6.8 -4.5 -4.7 -6.5 -5.6 -5.0 -5.2 -5.1 -5.8 Denmark 5.9 9.0 6.5 3.1 6.8 7.3 13.0 15.5 12.8 12.5 14.3 13.8 Latvia -1.4 -1.6 -3.6 -4.7 -3.0 1.6 0.5 -0.2 -0.4 -0.6 -0.2 -0.4 Lithuania -1.4 -1.5 -2.5 -4.3 -4.2 0.7 0.3 -0.5 -0.6 -0.7 -0.6 -0.8 Hungary -7.8 -7.2 -6.8 -7.4 -7.3 -0.2 1.0 0.9 2.2 3.8 3.1 3.9 Poland -8.6 -3.1 -8.3 -15.8 -17.3 -9.6 -16.4 -16.0 -15.1 -16.9 -15.7 -18.5 Romania -3.5 -7.1 -10.4 -17.0 -16.0 -4.9 -4.9 -5.6 -6.9 -7.4 -6.7 -7.7 Sweden 19.7 21.1 25.2 29.0 29.4 20.0 22.8 24.9 23.1 24.3 24.7 25.9 United Kingdom -36.7 -47.8 -63.2 -50.9 -24.8 -22.8 -56.6 -33.3 -32.5 -19.8 -15.9 -3.3 EU 48.5 -9.4 -26.9 -42.3 -111.8 -29.1 -40.8 -5.5 34.5 88.0 3.0 27.9 EU, adjusted ¹ -35.7 -83.5 -139.6 -125.9 -255.4 -98.9 -104.3 -93.7 -53.8 -0.2 -56.0 -31.1 Croatia -1.4 -2.0 -2.6 -3.1 -4.2 -2.4 -0.7 -0.5 -0.6 -1.0 -0.3 -0.7 USA -484.2 -519.0 -443.1 -514.0 -461.3 -326.9 -361.0 -346.1 -373.1 -370.8 -357.6 -404.4 Japan 138.5 133.4 136.0 153.8 108.2 102.1 147.7 86.0 75.9 73.8 132.9 131.7¹ See note 7 on concepts and sources.

Statistical Annex
177
TABLE 51 : Export markets (a) (percentage change on preceding year, 2004-2013) 26.04.2012 Spring 2012 Autumn 2011 forecast forecast
2004 2005 2006 2007 2008 2009 2010 2011 2012 2013 2012 2013 Belgium : 6.1 8.8 5.3 2.1 -10.6 10.3 5.0 2.2 4.6 3.7 5.3 Germany : 6.2 8.7 6.8 2.2 -11.7 10.5 5.2 2.6 4.8 3.9 5.3 Estonia : 9.7 10.0 9.3 1.8 -17.7 9.6 7.4 3.8 5.5 5.2 5.6 Ireland : 5.7 8.3 4.1 1.2 -11.5 10.7 4.6 2.4 4.5 3.8 5.4 Greece : 6.5 8.7 5.7 1.7 -12.4 10.4 4.9 2.5 4.7 3.9 5.4 Spain : 5.6 8.3 5.0 1.9 -10.6 9.8 4.2 2.0 4.6 3.2 4.9 France : 6.0 8.6 5.9 1.8 -11.1 10.3 4.9 2.5 4.7 3.9 5.4 Italy : 6.7 9.2 6.6 2.7 -11.0 9.9 5.4 3.0 5.0 4.3 5.5 Cyprus : 8.3 10.8 6.7 2.2 -13.6 8.1 7.4 4.0 5.5 5.0 5.4 Luxembourg : 5.3 7.9 4.9 1.6 -11.2 10.1 4.2 1.9 4.4 3.6 5.0 Malta : 6.4 8.6 5.2 1.8 -11.7 10.3 4.4 2.4 4.5 3.7 5.0 Netherlands : 5.8 8.8 5.5 2.3 -11.2 10.4 5.2 2.6 4.8 4.0 5.5 Austria : 6.0 10.0 6.8 2.8 -11.5 11.3 5.9 2.9 5.3 4.6 6.0 Portugal : 6.2 8.7 5.5 0.9 -12.6 9.7 3.9 0.9 3.7 3.4 5.0 Slovenia : 5.5 9.3 7.3 2.7 -13.1 9.8 5.5 1.9 4.9 3.9 5.6 Slovakia : 5.9 10.8 8.3 3.2 -12.3 11.7 6.2 2.5 5.1 4.1 6.0 Finland : 8.4 10.6 8.7 3.6 -12.2 11.9 7.7 3.9 5.5 4.8 5.8 Euro area (b) : 6.1 8.8 6.1 2.2 -11.3 10.4 5.1 2.5 4.8 3.9 5.4 Bulgaria : 6.6 9.4 8.5 2.4 -12.8 9.4 5.6 2.3 4.9 3.6 5.0 Czech Republic : 6.5 10.8 7.0 3.2 -12.3 11.2 5.9 2.7 5.1 4.3 5.7 Denmark : 7.0 8.8 6.4 2.4 -11.4 11.4 5.4 3.2 5.0 4.2 5.5 Latvia : 9.1 11.8 8.9 3.8 -17.0 12.5 10.4 3.9 5.6 5.5 5.7 Lithuania : 10.2 12.0 11.1 2.5 -16.6 11.2 9.8 3.9 5.7 6.2 5.4 Hungary : 6.2 10.2 7.8 3.5 -12.5 11.0 6.1 2.7 5.1 4.3 5.7 Poland : 7.3 10.5 8.0 3.5 -12.4 11.4 6.2 2.7 5.0 4.6 5.5 Romania : 5.6 8.4 7.0 1.7 -12.4 10.2 5.4 2.1 4.7 3.8 5.0 Sweden : 7.5 9.0 5.9 2.3 -11.9 9.7 5.0 3.3 4.8 4.1 5.3 United Kingdom : 6.5 7.8 6.2 1.6 -11.1 10.5 5.0 2.8 4.9 4.3 5.7 EU (b) : 6.3 8.8 6.2 2.2 -11.5 10.5 5.2 2.6 4.8 4.0 5.4 Croatia : 4.9 8.8 6.9 1.5 -12.7 10.4 5.3 1.7 4.7 3.8 5.7 USA : 6.7 8.2 7.2 3.5 -11.2 13.1 6.6 5.2 6.0 5.9 6.4 Japan : 7.2 8.8 7.7 3.7 -9.0 14.8 7.0 5.5 6.4 6.2 6.9(a) Imports of goods and services to the various markets (incl. EU-markets) weighted according to their share in country's exports of goods and services.
(b) Intra- and extra-EU trade.
TABLE 52 : Export performance (a) (percentage change on preceding year, 2004-2013) Spring 2012 Autumn 2011 forecast forecast
2004 2005 2006 2007 2008 2009 2010 2011 2012 2013 2012 2013 Belgium : -1.4 -3.4 -0.1 -0.4 -0.7 -0.3 -0.2 -1.4 -0.4 -1.1 -0.6 Germany : 1.4 4.0 1.1 0.5 -2.2 2.9 2.9 0.3 0.2 0.0 0.9 Estonia : 8.1 -3.0 -5.2 -1.1 -1.1 11.8 16.1 -2.3 0.1 -1.3 0.4 Ireland : -0.5 -3.2 4.1 -2.3 8.3 -4.0 -0.5 0.8 -0.2 0.0 -1.0 Greece : -3.8 -3.1 1.2 1.3 -8.1 -5.6 -5.0 0.7 0.7 2.5 1.0 Spain : -2.9 -1.5 1.6 -2.9 0.2 3.3 4.5 1.2 0.0 0.6 -0.5 France : -2.7 -3.5 -3.4 -2.1 -1.5 -0.5 0.0 0.0 0.1 -0.4 -0.5 Italy : -5.3 -2.7 -0.3 -5.4 -7.3 1.5 0.2 -1.8 -1.0 -1.9 -1.0 Cyprus : -3.2 -6.6 -0.5 -2.7 3.4 -4.1 -3.4 -2.5 -3.0 -2.4 -1.3 Luxembourg : -0.8 4.7 4.0 2.3 0.4 -6.6 -2.4 -1.8 -0.2 -4.1 0.9 Malta : -5.5 0.7 4.5 -0.2 1.4 6.7 -3.3 0.0 -0.1 0.2 0.2 Netherlands : 0.2 -1.4 0.8 -0.3 3.5 0.4 -1.3 -2.1 -1.0 -0.8 -1.1 Austria : 1.3 -2.1 1.9 -1.4 -3.2 -2.7 0.8 -0.1 -0.2 -0.8 0.3 Portugal : -4.0 2.7 1.9 -1.0 1.9 -0.8 3.4 1.6 1.0 0.8 1.0 Slovenia : 4.8 3.0 6.0 0.2 -4.7 -0.2 1.2 0.3 0.2 0.3 0.3 Slovakia : 3.8 9.2 5.5 -0.1 -4.2 4.3 4.3 0.6 1.0 -1.6 0.3 Finland : -1.3 1.4 -0.5 2.1 -10.6 -3.6 -8.0 -1.9 -0.7 -1.3 -0.8 Euro area (b) : -1.0 -0.2 0.5 -1.1 -1.6 0.8 1.0 -0.4 -0.2 -0.5 -0.1 Bulgaria : 1.8 37.7 -2.2 0.6 1.8 4.9 6.5 1.0 0.2 1.1 0.9 Czech Republic : 4.8 4.5 3.9 0.7 2.6 4.7 4.7 0.9 0.6 -0.5 1.2 Denmark : 1.0 0.2 -3.4 0.9 1.8 -7.3 1.2 0.1 -0.1 -0.8 -0.7 Latvia : 10.2 -4.7 1.0 -1.7 3.5 -0.9 2.0 0.6 0.7 0.3 0.5 Lithuania : 6.8 0.0 -7.2 8.7 4.9 5.5 3.6 0.3 0.2 0.1 0.9 Hungary : 4.8 7.7 6.6 2.1 2.6 3.0 2.2 2.6 2.8 2.8 2.1 Poland : 0.6 3.7 1.0 3.4 6.4 0.6 1.2 0.7 0.7 0.5 0.1 Romania : 1.9 1.9 0.8 6.5 6.8 3.5 4.3 0.8 1.0 0.5 0.9 Sweden : -0.8 0.0 -0.2 -0.5 -2.2 1.9 1.7 -1.9 0.6 -0.8 -0.3 United Kingdom : 1.3 3.0 -7.1 -0.3 1.9 -2.8 -0.4 0.3 -0.2 -0.9 -0.9 EU (b) : -0.4 0.6 -0.4 -0.7 -0.6 0.4 1.0 -0.2 0.0 -0.4 -0.1 Croatia : -1.3 -2.7 -3.0 0.7 -5.3 -4.0 -2.9 -3.1 -2.1 -1.3 -1.1 USA : 0.0 0.7 2.0 2.5 2.0 -1.6 0.1 -0.3 0.6 0.0 1.2 Japan : -0.2 0.8 0.9 -2.2 -16.7 8.2 -6.4 -2.9 -1.5 -2.8 -1.9(a) Index for exports of goods and services divided by an index for growth of markets.
(b) Intra- and extra-EU trade.

European Economic Forecast, Spring 2012
178
TABLE 53 : World GDP, volume (percentage change on preceding year, 2006-2013) 26.04.2012 Spring 2012 Autumn 2011 forecast forecast
( a ) 2006 2007 2008 2009 2010 2011 2012 2013 2012 2013 EU 20.7 3.3 3.2 0.3 -4.3 2.0 1.5 0.0 1.3 0.6 1.5 Euro area 14.8 3.3 3.0 0.4 -4.3 1.9 1.5 -0.3 1.0 0.5 1.3 Belgium 0.6 2.7 2.9 1.0 -2.8 2.3 1.9 0.0 1.2 0.9 1.5 Bulgaria 0.1 6.5 6.4 6.2 -5.5 0.4 1.7 0.5 1.9 2.3 3.0 Czech Republic 0.3 7.0 5.7 3.1 -4.7 2.7 1.7 0.0 1.5 0.7 1.7 Denmark 0.4 3.4 1.6 -0.8 -5.8 1.3 1.0 1.1 1.4 1.4 1.7 Germany 4.2 3.7 3.3 1.1 -5.1 3.7 3.0 0.7 1.7 0.8 1.5 Estonia 0.0 10.1 7.5 -3.7 -14.3 2.3 7.6 1.6 3.8 3.2 4.0 Ireland 0.3 5.3 5.2 -3.0 -7.0 -0.4 0.7 0.5 1.9 1.1 2.3 Greece 0.4 5.5 3.0 -0.2 -3.3 -3.5 -6.9 -4.7 0.0 -2.8 0.7 Spain 1.8 4.1 3.5 0.9 -3.7 -0.1 0.7 -1.8 -0.3 0.7 1.4 France 3.3 2.5 2.3 -0.1 -2.7 1.5 1.7 0.5 1.3 0.6 1.4 Italy 2.6 2.2 1.7 -1.2 -5.5 1.8 0.4 -1.4 0.4 0.1 0.7 Cyprus 0.0 4.1 5.1 3.6 -1.9 1.1 0.5 -0.8 0.3 0.0 1.8 Latvia 0.0 11.2 9.6 -3.3 -17.7 -0.3 5.5 2.2 3.6 2.5 4.0 Lithuania 0.0 7.8 9.8 2.9 -14.8 1.4 5.9 2.4 3.5 3.4 3.8 Luxembourg 0.1 5.0 6.6 0.8 -5.3 2.7 1.6 1.1 2.1 1.0 2.3 Hungary 0.2 3.9 0.1 0.9 -6.8 1.3 1.7 -0.3 1.0 0.5 1.4 Malta 0.0 2.9 4.3 4.1 -2.7 2.3 2.1 1.2 1.9 1.3 2.0 Netherlands 1.0 3.4 3.9 1.8 -3.5 1.7 1.2 -0.9 0.7 0.5 1.3 Austria 0.5 3.7 3.7 1.4 -3.8 2.3 3.1 0.8 1.7 0.9 1.9 Poland 0.6 6.2 6.8 5.1 1.6 3.9 4.3 2.7 2.6 2.5 2.8 Portugal 0.3 1.4 2.4 0.0 -2.9 1.4 -1.6 -3.3 0.3 -3.0 1.1 Romania 0.2 7.9 6.3 7.3 -6.6 -1.6 2.5 1.4 2.9 2.1 3.4 Slovenia 0.1 5.8 6.9 3.6 -8.0 1.4 -0.2 -1.4 0.7 1.0 1.5 Slovakia 0.1 8.3 10.5 5.8 -4.9 4.2 3.3 1.8 2.9 1.1 2.9 Finland 0.3 4.4 5.3 0.3 -8.4 3.7 2.9 0.8 1.6 1.4 1.7 Sweden 0.6 4.3 3.3 -0.6 -5.0 6.1 3.9 0.3 2.1 1.4 2.1 United Kingdom 2.9 2.6 3.5 -1.1 -4.4 2.1 0.7 0.5 1.7 0.6 1.5 Acc/Candidate countries 1.5 6.5 4.8 1.0 -4.8 7.5 7.4 2.8 4.2 2.8 3.9 - Croatia 0.1 4.9 5.1 2.2 -6.0 -1.2 0.0 -1.2 0.8 0.8 1.2 - Turkey 1.3 6.9 4.7 0.7 -4.8 9.2 8.5 3.3 4.6 3.0 4.1 - The former Yugoslav Republic of Macedonia 0.0 5.0 6.1 5.0 -0.9 2.9 3.0 1.7 2.5 2.5 3.5 - Iceland 0.0 4.7 6.0 1.3 -6.8 -4.0 3.1 2.1 2.4 1.5 2.7 - Montenegro 0.0 8.6 10.7 6.9 -5.7 2.5 2.8 0.4 2.0 2.2 3.2 - Serbia 0.1 3.6 5.4 3.8 -3.5 1.0 1.6 0.3 1.9 : : Potential candidates 0.1 5.4 6.1 6.6 0.2 2.4 2.3 1.7 2.3 3.2 3.7 USA 19.8 2.7 1.9 -0.4 -3.5 3.0 1.7 2.0 2.1 1.5 1.3 Japan 5.9 1.7 2.2 -1.0 -5.5 4.4 -0.7 1.9 1.7 1.8 1.0 Canada 1.8 2.8 2.2 0.7 -2.8 3.2 2.4 2.0 2.3 1.8 2.3 Norway 0.3 2.5 2.7 0.0 -1.7 0.7 1.6 1.7 2.0 2.7 2.9 Switzerland 0.4 3.6 3.6 2.1 -1.9 2.7 1.9 0.9 1.7 1.9 1.8 Australia 1.2 2.6 4.9 2.3 1.5 2.4 2.3 3.0 2.9 3.3 3.0 New Zealand 0.2 0.9 2.9 -1.4 -0.4 2.6 1.3 2.9 3.2 3.2 2.9 Advanced economies 51.9 2.9 2.6 0.0 -3.9 2.9 1.6 1.2 1.8 1.3 1.5 CIS 4.3 8.7 8.9 5.3 -6.7 4.6 4.6 3.7 3.9 4.0 4.2 - Russia 3.0 8.2 8.5 5.2 -7.8 4.0 4.3 3.6 3.8 3.8 4.0 - Other 1.2 10.2 9.8 5.5 -4.0 6.0 5.5 4.0 4.2 4.3 4.5 MENA 5.1 5.5 5.4 4.2 2.2 4.5 3.3 3.1 3.4 3.6 3.7 Asia 27.7 9.6 10.3 6.9 6.3 9.0 7.2 6.9 7.0 7.2 7.2 - China 13.8 12.7 14.2 9.6 9.2 10.3 9.2 8.4 8.2 8.6 8.2 - India 5.5 9.6 9.3 6.7 8.4 8.4 6.9 6.8 7.5 7.5 8.1 - Hong Kong 0.4 7.0 6.4 2.3 -2.6 7.0 4.9 4.2 4.1 4.3 4.2 - Korea 2.0 5.2 5.1 2.3 0.3 6.2 3.6 3.3 3.6 3.6 3.6 - Indonesia 1.4 5.5 6.3 6.0 4.6 6.1 6.5 5.8 6.4 6.1 6.4 Latin America 8.6 5.6 5.7 4.3 -1.8 6.1 4.4 3.6 4.0 4.1 4.2 - Brazil 2.9 4.0 6.1 5.2 -0.3 7.5 2.7 3.1 4.2 4.0 4.5 - Mexico 2.1 5.1 3.4 1.5 -6.4 5.3 3.9 3.3 3.5 3.9 3.7 Sub-Saharan Africa 2.5 6.7 7.1 5.4 2.6 5.2 5.0 4.5 5.0 5.5 6.0 Emerging and developing economies 48.1 8.2 8.7 5.9 3.1 7.4 5.9 5.5 5.7 5.9 5.9 World 100.0 5.5 5.6 2.8 -0.6 5.1 3.7 3.3 3.7 3.5 3.6 World excluding EU 79.3 6.0 6.2 3.5 0.4 5.9 4.2 4.1 4.3 4.2 4.2 World excluding euro area 85.2 5.9 6.0 3.3 0.1 5.7 4.1 3.9 4.2 4.0 4.1(a) Relative weights in %, based on GDP (at constant prices and PPS) in 2010.

Statistical Annex
179
TABLE 54 : World exports of goods and services, volume (percentage change on preceding year, 2006-2013) 26.04.2012 Spring 2012 Autumn 2011 forecast forecast
( a ) 2006 2007 2008 2009 2010 2011 2012 2013 2012 2013 EU (b) 35.6 9.7 5.8 1.5 -12.0 10.9 6.3 2.4 4.8 3.6 5.3 Euro area (b) 26.8 8.9 6.6 1.0 -12.7 11.2 6.2 2.1 4.6 3.4 5.3 Acc/Candidate countries 1.1 6.2 7.3 2.6 -6.4 4.1 6.0 3.0 7.4 4.5 7.8 - Croatia 0.1 5.8 3.7 2.2 -17.3 6.0 2.2 -1.5 2.5 2.5 4.5 - Turkey 0.8 6.6 7.3 2.7 -5.0 3.4 6.5 3.7 8.3 4.9 8.5 - The former Yugoslav Republic of Macedonia 0.0 8.2 11.8 -6.3 -15.8 23.6 11.3 4.0 8.0 6.0 6.5 - Iceland 0.0 -4.6 17.7 7.0 6.6 0.4 3.4 2.3 2.6 2.2 3.0 - Montenegro 0.0 : : : : : 13.7 1.9 3.3 9.2 10.2 - Serbia 0.1 : : : : : 7.1 3.3 7.5 : : USA 9.9 9.0 9.3 6.1 -9.4 11.3 6.7 4.9 6.6 5.9 7.7 Japan 4.5 9.9 8.7 1.4 -24.2 24.2 0.1 2.4 4.8 3.2 4.9 Canada 2.5 0.6 1.2 -4.7 -13.8 6.4 5.0 5.4 6.0 6.1 6.3 Norway 0.9 -0.8 1.4 0.1 -4.2 1.8 -1.1 0.4 1.0 1.1 1.6 Switzerland 1.5 10.3 9.6 3.1 -8.6 8.4 3.4 2.6 3.4 3.8 3.3 Australia 1.6 2.2 2.9 6.1 -5.2 12.9 3.7 4.9 5.3 4.9 5.3 New Zealand 0.2 2.5 3.4 -1.4 4.2 -2.9 4.4 4.3 5.3 5.2 5.2 Advanced economies 57.8 8.8 6.4 2.2 -12.0 11.5 5.6 3.0 5.1 4.1 5.7 CIS 3.5 6.7 5.2 9.7 -15.1 10.3 6.5 3.9 4.7 6.5 6.3 - Russia 2.4 7.3 6.3 0.6 -4.7 7.1 6.0 3.6 4.7 5.5 5.4 - Other 1.1 5.2 2.8 29.1 -37.1 17.1 7.5 4.3 4.8 8.5 8.4 MENA 5.6 5.9 7.0 9.6 -10.5 4.5 4.7 4.2 4.4 4.3 4.3 Asia 25.7 12.6 19.6 5.9 -10.5 16.8 9.0 6.8 6.6 7.2 6.6 - China 9.4 17.1 36.5 5.4 -11.7 13.4 9.8 8.2 7.6 8.6 7.6 - India 1.9 20.6 7.5 18.2 -8.0 20.2 15.0 8.0 6.2 5.8 6.2 - Hong Kong 2.7 9.1 7.9 3.0 -12.2 18.3 7.4 6.8 6.8 6.8 6.8 - Korea 3.3 12.6 12.0 13.2 0.9 13.1 9.5 4.3 5.0 6.7 5.0 - Indonesia 0.9 7.2 6.6 12.3 -17.5 22.0 13.9 5.4 7.0 5.8 7.0 Latin America 5.4 7.6 6.7 11.9 -12.7 12.5 6.9 5.3 5.9 6.6 6.9 - Brazil 1.3 5.9 7.8 3.2 -3.6 10.9 4.6 3.4 6.7 7.2 7.7 - Mexico 1.7 11.1 5.6 1.3 -10.3 25.0 6.6 5.2 6.1 6.0 8.1 Sub-Saharan Africa 1.9 0.9 6.3 16.6 -32.5 15.6 6.3 2.2 5.2 5.2 6.9 Emerging and developing economies 42.2 10.0 14.4 8.0 -12.2 14.0 7.8 5.8 6.0 6.6 6.3 World 100.0 9.3 9.8 4.6 -12.1 12.6 6.5 4.2 5.5 5.1 5.9 World excluding EU 64.4 9.1 12.0 6.3 -12.1 13.5 6.6 5.2 5.9 6.0 6.3 World excluding euro area 73.2 9.5 11.0 5.9 -11.9 13.0 6.6 4.9 5.8 5.8 6.2(a) Relative weights in %, based on exports of goods and services (at current prices and current exchange rates) in 2010.
(b) Intra- and extra-EU trade.
TABLE 55 : Export shares in EU trade (goods only - 2010)Other Sub
Euro Acc/Cand advanced Rest Latin SaharanEU area countries USA Japan economies China Asia CIS MENA America Africa
EU 66.5 50.1 1.9 6.0 1.2 5.4 3.0 4.5 3.2 4.4 2.3 1.6 Euro area 66.2 49.8 1.9 5.9 1.2 5.2 3.3 4.6 2.9 4.7 2.6 1.6 Belgium 75.8 62.6 1.2 4.9 0.8 2.8 1.8 4.7 1.6 3.4 1.5 1.5 Bulgaria 66.3 48.6 12.1 1.5 0.2 1.2 1.5 3.5 7.2 4.6 0.7 1.3 Czech Republic 84.0 66.9 1.3 1.8 0.4 2.6 1.1 1.6 4.0 1.8 0.9 0.5 Denmark 66.8 40.5 1.2 6.3 2.2 9.2 2.6 4.2 2.2 2.7 1.8 0.7 Germany 61.6 41.8 1.9 6.1 1.3 6.9 5.4 5.3 3.8 3.6 2.8 1.2 Estonia 70.0 32.1 1.6 3.5 0.6 4.9 1.3 1.7 14.6 0.8 0.6 0.4 Ireland 58.3 39.8 0.7 22.9 2.6 6.8 2.1 3.2 0.5 1.2 1.2 0.6 Greece 67.4 46.5 9.2 4.0 0.2 2.6 1.4 2.4 2.8 7.3 1.4 1.2 Spain 69.6 58.1 2.2 3.5 0.9 3.7 2.0 2.7 1.4 6.9 5.5 1.6 France 60.8 48.4 1.7 6.3 1.7 5.1 3.0 5.7 2.0 8.1 2.8 2.9 Italy 57.0 43.5 3.1 6.3 1.4 6.8 2.9 5.3 3.6 8.9 3.4 1.4 Cyprus 75.7 57.0 0.2 0.8 0.0 1.1 0.9 5.6 2.8 11.1 0.2 1.6 Latvia 66.9 32.6 0.9 1.7 0.5 3.0 0.4 2.3 19.9 3.6 0.4 0.4 Lithuania 61.1 31.9 0.9 3.1 0.1 4.4 0.2 1.0 27.2 0.8 0.4 0.7 Luxembourg 83.7 70.5 1.0 2.1 0.3 3.5 1.1 1.7 2.0 2.4 1.6 0.6 Hungary 77.2 56.1 2.8 2.5 0.8 2.1 2.0 2.5 6.5 2.2 0.8 0.6 Malta 53.9 43.7 4.7 6.1 2.4 1.8 9.8 13.8 0.3 4.8 1.3 1.0 Netherlands 78.2 62.7 1.1 3.8 0.7 2.8 1.2 3.8 2.0 2.6 1.8 2.1 Austria 72.1 55.0 1.9 4.1 0.9 6.5 2.5 3.5 3.8 2.3 1.8 0.6 Poland 80.3 56.9 2.0 1.7 0.3 2.6 1.1 1.1 8.4 1.2 0.7 0.5 Portugal 74.4 64.3 1.0 4.2 0.5 2.2 1.1 1.1 0.5 3.3 3.7 8.1 Romania 72.5 54.8 8.0 1.9 0.5 1.6 1.2 2.0 6.0 4.8 0.6 0.9 Slovenia 75.5 57.6 8.5 1.7 0.1 1.8 0.6 1.6 6.0 3.2 0.7 0.4 Slovakia 87.2 49.7 2.0 1.3 0.1 1.7 1.7 0.6 4.0 0.6 0.6 0.2 Finland 55.4 32.5 1.9 6.3 1.9 6.3 5.3 5.8 10.0 3.1 2.6 1.3 Sweden 60.1 40.9 1.5 6.7 1.3 11.9 3.4 4.9 2.1 3.9 2.6 1.6 United Kingdom 57.6 50.9 1.4 12.3 1.5 6.9 2.5 7.0 1.5 4.6 2.0 2.6
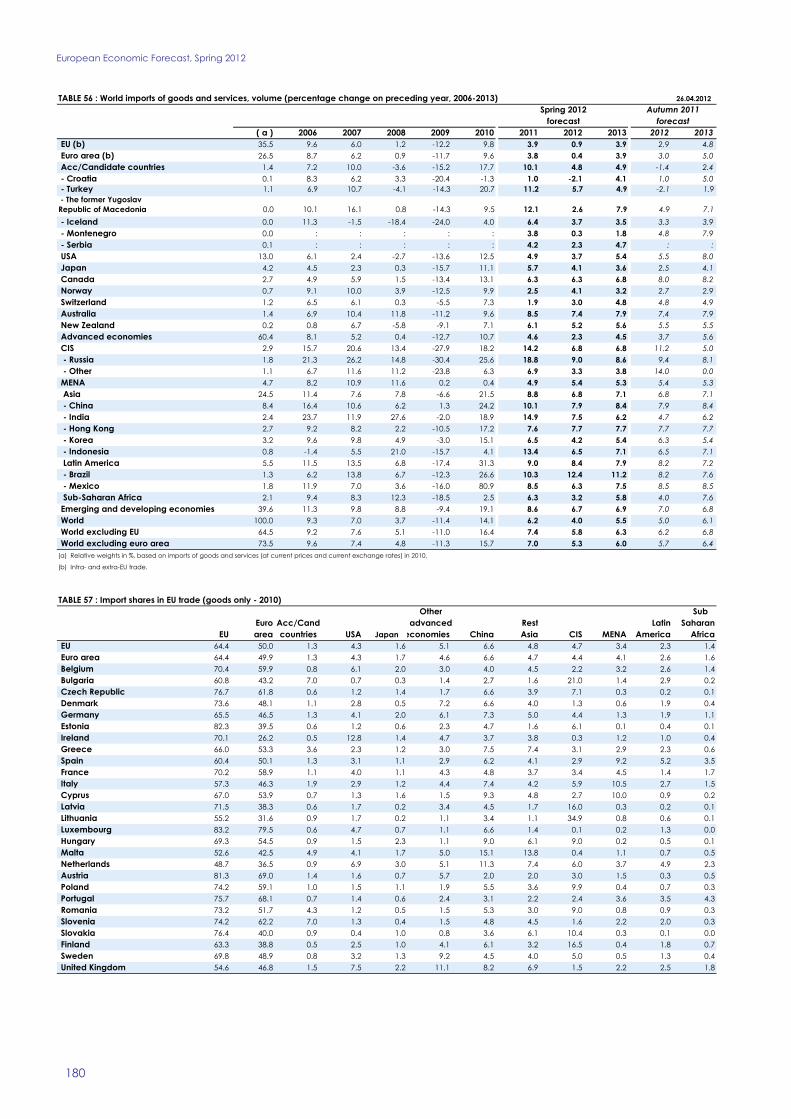
European Economic Forecast, Spring 2012
180
TABLE 56 : World imports of goods and services, volume (percentage change on preceding year, 2006-2013) 26.04.2012 Spring 2012 Autumn 2011 forecast forecast
( a ) 2006 2007 2008 2009 2010 2011 2012 2013 2012 2013 EU (b) 35.5 9.6 6.0 1.2 -12.2 9.8 3.9 0.9 3.9 2.9 4.8 Euro area (b) 26.5 8.7 6.2 0.9 -11.7 9.6 3.8 0.4 3.9 3.0 5.0 Acc/Candidate countries 1.4 7.2 10.0 -3.6 -15.2 17.7 10.1 4.8 4.9 -1.4 2.4 - Croatia 0.1 8.3 6.2 3.3 -20.4 -1.3 1.0 -2.1 4.1 1.0 5.0 - Turkey 1.1 6.9 10.7 -4.1 -14.3 20.7 11.2 5.7 4.9 -2.1 1.9 - The former Yugoslav Republic of Macedonia 0.0 10.1 16.1 0.8 -14.3 9.5 12.1 2.6 7.9 4.9 7.1 - Iceland 0.0 11.3 -1.5 -18.4 -24.0 4.0 6.4 3.7 3.5 3.3 3.9 - Montenegro 0.0 : : : : : 3.8 0.3 1.8 4.8 7.9 - Serbia 0.1 : : : : : 4.2 2.3 4.7 : : USA 13.0 6.1 2.4 -2.7 -13.6 12.5 4.9 3.7 5.4 5.5 8.0 Japan 4.2 4.5 2.3 0.3 -15.7 11.1 5.7 4.1 3.6 2.5 4.1 Canada 2.7 4.9 5.9 1.5 -13.4 13.1 6.3 6.3 6.8 8.0 8.2 Norway 0.7 9.1 10.0 3.9 -12.5 9.9 2.5 4.1 3.2 2.7 2.9 Switzerland 1.2 6.5 6.1 0.3 -5.5 7.3 1.9 3.0 4.8 4.8 4.9 Australia 1.4 6.9 10.4 11.8 -11.2 9.6 8.5 7.4 7.9 7.4 7.9 New Zealand 0.2 0.8 6.7 -5.8 -9.1 7.1 6.1 5.2 5.6 5.5 5.5 Advanced economies 60.4 8.1 5.2 0.4 -12.7 10.7 4.6 2.3 4.5 3.7 5.6 CIS 2.9 15.7 20.6 13.4 -27.9 18.2 14.2 6.8 6.8 11.2 5.0 - Russia 1.8 21.3 26.2 14.8 -30.4 25.6 18.8 9.0 8.6 9.4 8.1 - Other 1.1 6.7 11.6 11.2 -23.8 6.3 6.9 3.3 3.8 14.0 0.0 MENA 4.7 8.2 10.9 11.6 0.2 0.4 4.9 5.4 5.3 5.4 5.3 Asia 24.5 11.4 7.6 7.8 -6.6 21.5 8.8 6.8 7.1 6.8 7.1 - China 8.4 16.4 10.6 6.2 1.3 24.2 10.1 7.9 8.4 7.9 8.4 - India 2.4 23.7 11.9 27.6 -2.0 18.9 14.9 7.5 6.2 4.7 6.2 - Hong Kong 2.7 9.2 8.2 2.2 -10.5 17.2 7.6 7.7 7.7 7.7 7.7 - Korea 3.2 9.6 9.8 4.9 -3.0 15.1 6.5 4.2 5.4 6.3 5.4 - Indonesia 0.8 -1.4 5.5 21.0 -15.7 4.1 13.4 6.5 7.1 6.5 7.1 Latin America 5.5 11.5 13.5 6.8 -17.4 31.3 9.0 8.4 7.9 8.2 7.2 - Brazil 1.3 6.2 13.8 6.7 -12.3 26.6 10.3 12.4 11.2 8.2 7.6 - Mexico 1.8 11.9 7.0 3.6 -16.0 80.9 8.5 6.3 7.5 8.5 8.5 Sub-Saharan Africa 2.1 9.4 8.3 12.3 -18.5 2.5 6.3 3.2 5.8 4.0 7.6 Emerging and developing economies 39.6 11.3 9.8 8.8 -9.4 19.1 8.6 6.7 6.9 7.0 6.8 World 100.0 9.3 7.0 3.7 -11.4 14.1 6.2 4.0 5.5 5.0 6.1 World excluding EU 64.5 9.2 7.6 5.1 -11.0 16.4 7.4 5.8 6.3 6.2 6.8 World excluding euro area 73.5 9.6 7.4 4.8 -11.3 15.7 7.0 5.3 6.0 5.7 6.4(a) Relative weights in %, based on imports of goods and services (at current prices and current exchange rates) in 2010.
(b) Intra- and extra-EU trade.
TABLE 57 : Import shares in EU trade (goods only - 2010)Other Sub
Euro Acc/Cand advanced Rest Latin SaharanEU area countries USA Japan economies China Asia CIS MENA America Africa
EU 64.4 50.0 1.3 4.3 1.6 5.1 6.6 4.8 4.7 3.4 2.3 1.4 Euro area 64.4 49.9 1.3 4.3 1.7 4.6 6.6 4.7 4.4 4.1 2.6 1.6 Belgium 70.4 59.9 0.8 6.1 2.0 3.0 4.0 4.5 2.2 3.2 2.6 1.4 Bulgaria 60.8 43.2 7.0 0.7 0.3 1.4 2.7 1.6 21.0 1.4 2.9 0.2 Czech Republic 76.7 61.8 0.6 1.2 1.4 1.7 6.6 3.9 7.1 0.3 0.2 0.1 Denmark 73.6 48.1 1.1 2.8 0.5 7.2 6.6 4.0 1.3 0.6 1.9 0.4 Germany 65.5 46.5 1.3 4.1 2.0 6.1 7.3 5.0 4.4 1.3 1.9 1.1 Estonia 82.3 39.5 0.6 1.2 0.6 2.3 4.7 1.6 6.1 0.1 0.4 0.1 Ireland 70.1 26.2 0.5 12.8 1.4 4.7 3.7 3.8 0.3 1.2 1.0 0.4 Greece 66.0 53.3 3.6 2.3 1.2 3.0 7.5 7.4 3.1 2.9 2.3 0.6 Spain 60.4 50.1 1.3 3.1 1.1 2.9 6.2 4.1 2.9 9.2 5.2 3.5 France 70.2 58.9 1.1 4.0 1.1 4.3 4.8 3.7 3.4 4.5 1.4 1.7 Italy 57.3 46.3 1.9 2.9 1.2 4.4 7.4 4.2 5.9 10.5 2.7 1.5 Cyprus 67.0 53.9 0.7 1.3 1.6 1.5 9.3 4.8 2.7 10.0 0.9 0.2 Latvia 71.5 38.3 0.6 1.7 0.2 3.4 4.5 1.7 16.0 0.3 0.2 0.1 Lithuania 55.2 31.6 0.9 1.7 0.2 1.1 3.4 1.1 34.9 0.8 0.6 0.1 Luxembourg 83.2 79.5 0.6 4.7 0.7 1.1 6.6 1.4 0.1 0.2 1.3 0.0 Hungary 69.3 54.5 0.9 1.5 2.3 1.1 9.0 6.1 9.0 0.2 0.5 0.1 Malta 52.6 42.5 4.9 4.1 1.7 5.0 15.1 13.8 0.4 1.1 0.7 0.5 Netherlands 48.7 36.5 0.9 6.9 3.0 5.1 11.3 7.4 6.0 3.7 4.9 2.3 Austria 81.3 69.0 1.4 1.6 0.7 5.7 2.0 2.0 3.0 1.5 0.3 0.5 Poland 74.2 59.1 1.0 1.5 1.1 1.9 5.5 3.6 9.9 0.4 0.7 0.3 Portugal 75.7 68.1 0.7 1.4 0.6 2.4 3.1 2.2 2.4 3.6 3.5 4.3 Romania 73.2 51.7 4.3 1.2 0.5 1.5 5.3 3.0 9.0 0.8 0.9 0.3 Slovenia 74.2 62.2 7.0 1.3 0.4 1.5 4.8 4.5 1.6 2.2 2.0 0.3 Slovakia 76.4 40.0 0.9 0.4 1.0 0.8 3.6 6.1 10.4 0.3 0.1 0.0 Finland 63.3 38.8 0.5 2.5 1.0 4.1 6.1 3.2 16.5 0.4 1.8 0.7 Sweden 69.8 48.9 0.8 3.2 1.3 9.2 4.5 4.0 5.0 0.5 1.3 0.4 United Kingdom 54.6 46.8 1.5 7.5 2.2 11.1 8.2 6.9 1.5 2.2 2.5 1.8
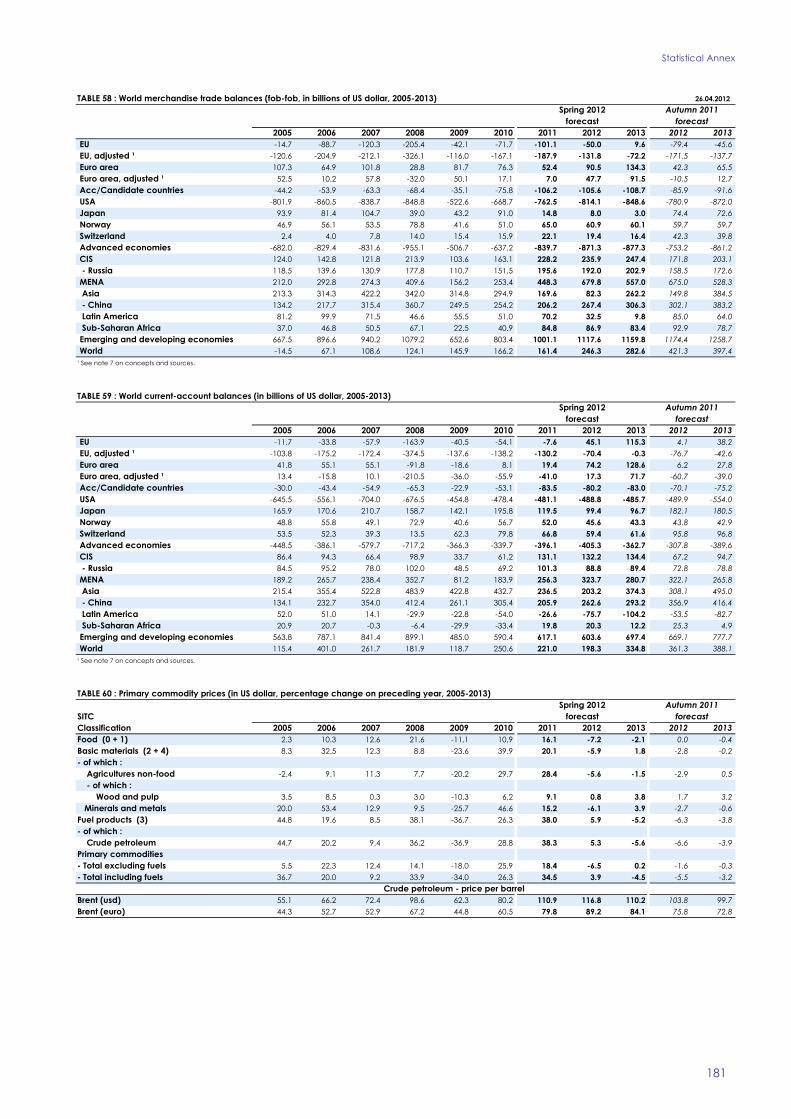
Statistical Annex
181
TABLE 58 : World merchandise trade balances (fob-fob, in billions of US dollar, 2005-2013) 26.04.2012 Spring 2012 Autumn 2011 forecast forecast
2005 2006 2007 2008 2009 2010 2011 2012 2013 2012 2013 EU -14.7 -88.7 -120.3 -205.4 -42.1 -71.7 -101.1 -50.0 9.6 -79.4 -45.6 EU, adjusted ¹ -120.6 -204.9 -212.1 -326.1 -116.0 -167.1 -187.9 -131.8 -72.2 -171.5 -137.7 Euro area 107.3 64.9 101.8 28.8 81.7 76.3 52.4 90.5 134.3 42.3 65.5 Euro area, adjusted ¹ 52.5 10.2 57.8 -32.0 50.1 17.1 7.0 47.7 91.5 -10.5 12.7 Acc/Candidate countries -44.2 -53.9 -63.3 -68.4 -35.1 -75.8 -106.2 -105.6 -108.7 -85.9 -91.6 USA -801.9 -860.5 -838.7 -848.8 -522.6 -668.7 -762.5 -814.1 -848.6 -780.9 -872.0 Japan 93.9 81.4 104.7 39.0 43.2 91.0 14.8 8.0 3.0 74.4 72.6 Norway 46.9 56.1 53.5 78.8 41.6 51.0 65.0 60.9 60.1 59.7 59.7 Switzerland 2.4 4.0 7.8 14.0 15.4 15.9 22.1 19.4 16.4 42.3 39.8 Advanced economies -682.0 -829.4 -831.6 -955.1 -506.7 -637.2 -839.7 -871.3 -877.3 -753.2 -861.2 CIS 124.0 142.8 121.8 213.9 103.6 163.1 228.2 235.9 247.4 171.8 203.1 - Russia 118.5 139.6 130.9 177.8 110.7 151.5 195.6 192.0 202.9 158.5 172.6 MENA 212.0 292.8 274.3 409.6 156.2 253.4 448.3 679.8 557.0 675.0 528.3 Asia 213.3 314.3 422.2 342.0 314.8 294.9 169.6 82.3 262.2 149.8 384.5 - China 134.2 217.7 315.4 360.7 249.5 254.2 206.2 267.4 306.3 302.1 383.2 Latin America 81.2 99.9 71.5 46.6 55.5 51.0 70.2 32.5 9.8 85.0 64.0 Sub-Saharan Africa 37.0 46.8 50.5 67.1 22.5 40.9 84.8 86.9 83.4 92.9 78.7 Emerging and developing economies 667.5 896.6 940.2 1079.2 652.6 803.4 1001.1 1117.6 1159.8 1174.4 1258.7 World -14.5 67.1 108.6 124.1 145.9 166.2 161.4 246.3 282.6 421.3 397.4¹ See note 7 on concepts and sources.
TABLE 59 : World current-account balances (in billions of US dollar, 2005-2013) Spring 2012 Autumn 2011 forecast forecast
2005 2006 2007 2008 2009 2010 2011 2012 2013 2012 2013 EU -11.7 -33.8 -57.9 -163.9 -40.5 -54.1 -7.6 45.1 115.3 4.1 38.2 EU, adjusted ¹ -103.8 -175.2 -172.4 -374.5 -137.6 -138.2 -130.2 -70.4 -0.3 -76.7 -42.6 Euro area 41.8 55.1 55.1 -91.8 -18.6 8.1 19.4 74.2 128.6 6.2 27.8 Euro area, adjusted ¹ 13.4 -15.8 10.1 -210.5 -36.0 -55.9 -41.0 17.3 71.7 -60.7 -39.0 Acc/Candidate countries -30.0 -43.4 -54.9 -65.3 -22.9 -53.1 -83.5 -80.2 -83.0 -70.1 -75.2 USA -645.5 -556.1 -704.0 -676.5 -454.8 -478.4 -481.1 -488.8 -485.7 -489.9 -554.0 Japan 165.9 170.6 210.7 158.7 142.1 195.8 119.5 99.4 96.7 182.1 180.5 Norway 48.8 55.8 49.1 72.9 40.6 56.7 52.0 45.6 43.3 43.8 42.9 Switzerland 53.5 52.3 39.3 13.5 62.3 79.8 66.8 59.4 61.6 95.8 96.8 Advanced economies -448.5 -386.1 -579.7 -717.2 -366.3 -339.7 -396.1 -405.3 -362.7 -307.8 -389.6 CIS 86.4 94.3 66.4 98.9 33.7 61.2 131.1 132.2 134.4 67.2 94.7 - Russia 84.5 95.2 78.0 102.0 48.5 69.2 101.3 88.8 89.4 72.8 78.8 MENA 189.2 265.7 238.4 352.7 81.2 183.9 256.3 323.7 280.7 322.1 265.8 Asia 215.4 355.4 522.8 483.9 422.8 432.7 236.5 203.2 374.3 308.1 495.0 - China 134.1 232.7 354.0 412.4 261.1 305.4 205.9 262.6 293.2 356.9 416.4 Latin America 52.0 51.0 14.1 -29.9 -22.8 -54.0 -26.6 -75.7 -104.2 -53.5 -82.7 Sub-Saharan Africa 20.9 20.7 -0.3 -6.4 -29.9 -33.4 19.8 20.3 12.2 25.3 4.9 Emerging and developing economies 563.8 787.1 841.4 899.1 485.0 590.4 617.1 603.6 697.4 669.1 777.7 World 115.4 401.0 261.7 181.9 118.7 250.6 221.0 198.3 334.8 361.3 388.1¹ See note 7 on concepts and sources.
TABLE 60 : Primary commodity prices (in US dollar, percentage change on preceding year, 2005-2013) Spring 2012 Autumn 2011
SITC forecast forecastClassification 2005 2006 2007 2008 2009 2010 2011 2012 2013 2012 2013Food (0 + 1) 2.3 10.3 12.6 21.6 -11.1 10.9 16.1 -7.2 -2.1 0.0 -0.4Basic materials (2 + 4) 8.3 32.5 12.3 8.8 -23.6 39.9 20.1 -5.9 1.8 -2.8 -0.2- of which : Agricultures non-food -2.4 9.1 11.3 7.7 -20.2 29.7 28.4 -5.6 -1.5 -2.9 0.5 - of which : Wood and pulp 3.5 8.5 0.3 3.0 -10.3 6.2 9.1 0.8 3.8 1.7 3.2 Minerals and metals 20.0 53.4 12.9 9.5 -25.7 46.6 15.2 -6.1 3.9 -2.7 -0.6Fuel products (3) 44.8 19.6 8.5 38.1 -36.7 26.3 38.0 5.9 -5.2 -6.3 -3.8- of which : Crude petroleum 44.7 20.2 9.4 36.2 -36.9 28.8 38.3 5.3 -5.6 -6.6 -3.9Primary commodities- Total excluding fuels 5.5 22.3 12.4 14.1 -18.0 25.9 18.4 -6.5 0.2 -1.6 -0.3- Total including fuels 36.7 20.0 9.2 33.9 -34.0 26.3 34.5 3.9 -4.5 -5.5 -3.2
Crude petroleum - price per barrelBrent (usd) 55.1 66.2 72.4 98.6 62.3 80.2 110.9 116.8 110.2 103.8 99.7Brent (euro) 44.3 52.7 52.9 67.2 44.8 60.5 79.8 89.2 84.1 75.8 72.8
European Economic Forecast, Spring 2012
182
Note on concepts and sources
1. The directorate general for economic and financial affairs (DG Tables 47 - 50, 58 and 59 show also EU and euro-area "adjusted" ECFIN) produces, under its own responsibility, short-term fully- balances. Theoret ically, balances of EU and euro area vis-à-vis fledged economic forecasts twice a year : in the spring and in third countries should be identical to the sum of the balances of the autumn. These forecasts cover the principal macroeconomic the individual countries in the EU or the euro area. However, aggregates for the Member States, the candidate countries, intra-EU or intra-euro-area balances are non-zero because of the European Union as a whole, the euro area and the report ing errors. The creation of the internal market in 1993 international environment. Interim forecasts, updating the outlook reduced border controls and formalit ies, and accordingly the for the seven largest Member States, EU and the euro area, scope and precision of intra-EU trade coverage. Typically, are presented in between the fully-fledged forecasts. intra-EU imports are underest imated compared to intra-EU exports, leading to an overest imation of the surplus. For the past the 2. Data for 2010, 2011 and 2012 are forecasts. "adjusted" balances are Eurostat est imates for EU and ECB The source for all tables is the European Commission, est imates for the euro area. For the future, they are ECFIN's unless otherwise stated. forecasts based on the extrapolat ion of the discrepancies Historical data for the Member States are based on the European observed in 2009. System of Accounting (ESA 1995). Most Member States have now introduced chain-linking in their national accounts to measure 8. With respect to the 12 RAMS (recently-acceded Member States), the development of economic aggregates in volume terms. which are current ly in a transit ion phase, the quality of stat ist ical For the USA and Japan the definit ions are as in the SNA. data may not always be directly comparable to most EU15
Member States.3. Tables 5 and 6 on domest ic demand and final demand respectively, present data including inventories. 9. Geographical zones are defined as follows :
Euro area : 4. In Tables 16 and 17, the data are based on the national index for USA EA17 (BE,DE,EE,IE,EL,ES,FR,IT,CY,LU,MT,NL,AT,PT,SI,SK,FI) and Japan, and for EU Member States and aggregates prior to 1996. Acceding countries :
Croatia.5. The potential output gap is calculated with reference to potential Candidate countries : output as est imated via a production function, where the increase in Turkey, the former Yugoslav Republic of Macedonia the capital stock and the difference between actual unemployment Iceland, Montenegro and Serbia. and the NAWRU play a key role. Potential candidates : Albania, Bosnia-Herzegovina and Kosovo. 6. Employment data used in tables 21-25, 27 and 31-32 are based on Advanced economies : full-t ime-equivalents (FTEs), where available. Current ly, Germany, EU, candidate countries, USA, Japan, Canada, Norway, Estonia, Spain, France, Italy, Hungary and the Netherlands Switzerland, Australia and New Zealand. report FTE data (taken together, these countries represent MENA (Middle East and Northern Africa) : over 80% of euro-area GDP and more than 60% of EU GDP). In the Algeria, Bahrain, Egypt, Iran, Iraq, Israel, Jordan, Kuwait, absence of FTE data, employment is based on numbers of persons. Lebanon, Libya, Morocco, Oman, Qatar, Saudi Arabia, Syria, In the calculat ion of EU and euro-area aggregates, priority is given to Tunisia, and the United Arab Emirates. FTE data, as this is regarded as more representative of diverse Asia : patterns of working t ime. All countries in that region except Japan and
the Asian MENA countries.7. EU and euro-area data are aggregated using exchange rates. Lat in America : World GDP is aggregated using Purchasing Power Standards (PPS). All countries in that region. In the tables on world trade and international payments, the Sub-Saharan Africa : aggregation is carried out on the basis of current exchange rates. All countries in that region except the African MENA countries.

EUROPEAN ECONOMY SERIES
Previous titles in the European Economy series can be accessed and downloaded
free of charge from the following address:
ec.europa.eu/economy_finance/publications/
2011
1-2011 • EuropeanEconomicForecast–Spring2011
2-2011 • Labourmarketdevelopments–2011
3-2011 • PublicfinancesinEMU–2011
4-2011 • The2012AgeingReport:UnderlyingAssumptionsandProjection
Methodologies
5-2011 • TaxreformsinEUMemberStates–2011–Taxpolicychallengesfor
economicgrowthandfiscalsustainability
6-2011 • EuropeanEconomicForecast–Autumn2011
2012
1-2012 • EuropeanEconomicForecast–Spring2012


European Commission
European Economy – 1/2012 – European Economic Forecast Spring 2012 Luxembourg: Publications Office of the European Union 2012 — pp 182. — 21 x 29.7 cm ISBN 978-92-79-22818-6 doi: 10.2765/18718 Price (excluding VAT) in Luxembourg: 15 EUR
