european commission. - case · grzegorz poniatowski is a senior economist at case and a phd...
TRANSCRIPT


This report was commissioned by the Directorate General for Taxation and Customs Union
(TAXUD) of the European Commission under framework contract FWC No.
TAXUD/2010/CC/104, and prepared by CASE under the leader CPB. It remains the property
of TAXUD.
The report is also available at: The views and opinions expressed in this report are not necessarily shared by the European Commission or CASE Network, nor does the report anticipate decisions taken by the European Commission.
Keywords: Optimal Taxation, Efficiency, Incidence, Externalities, Redistributive Effects, Environmental Taxes and Subsidies, Personal Income and Other Nonbusiness Taxes and Subsidies, Business Taxes and Subsidies, Tax Evasion, Other Sources of Revenue, Other JEL Codes: H20, H24, H25, H26, H62
© CASE – Center for Social and Economic Research, Warsaw, 2015 Graphic Design: Agnieszka Natalia Bury
EAN: 9788371786297
Publisher:
CASE-Center for Social and Economic Research on behalf of CASE Network
al. Jana Pawla II 61, office 212, 01-031 Warsaw, Poland
tel.: (48 22) 206 29 00, 828 61 33, fax: (48 22) 206 29 01
e-mail: [email protected]
http://www.case-research.eu

This report is one of the last research works of Luca Barbone, former CASE President
and CASE Fellow, who passed away unexpectedly on 1 September 2015
1
Luca Barbone, Mikhail Bonch-Osmolovskiy, Grzegorz Poniatowski
CASE Network Reports No. 124
Contents
The authors ............................................................................................................................................ 5
Executive summary ................................................................................................................................6
1. Background: Economic and Policy Context in 2013 ...................................................................... 8
1.1. Introduction ................................................................................................................................. 8
1.2. Economic Conditions in the EU during 2013 ............................................................................. 8
1.3. VAT Regime Changes ............................................................................................................... 11
2. The VAT Gap in 2013 ...................................................................................................................... 12
2.1. Methodological Observations .................................................................................................... 12
2.2 VAT Gap: Overall Results for 2013 ............................................................................................ 14
2.3 Policy Gap .................................................................................................................................. 18
3. Individual Country Results ............................................................................................................ 24
Appendix A - Derivation of Policy Gaps ........................................................................................... 54
Appendix B - Statistical Appendix ..................................................................................................... 55
References ............................................................................................................................................ 61

2
STUDY TO QUANTIFY AND ANALYSE THE VAT GAP IN THE EU MEMBER STATES
CASE Network Reports No. 124
List of igures
Figure 1.1. GDP growth in the EU, 2012-2013 ..................................................................................... 10
Figure 1.2. VAT Revenue/GDP .............................................................................................................. 10
Figure 2.1. VAT Gap in the EU-26 countries, 2012-2013 .................................................................... 14
Figure 2.2. VAT Gap in the EU-26 countries, 2009-2013 ...................................................................... 15
Figure A.1. Policy Gap, VAT Collections and VAT Gap ........................................................................ 51
List of tables
Table 1.1. Real and Nominal Growth in the EU-28 in 2013 ................................................................... 9
Table 1.2. VAT Rate Structure as of 31 December 2013, and Changes during 2013 ............................ 11
Table 2.1. VAT Gap Estimates, 2012-2013 (million Euros) .................................................................. 16
Table 2.2. Decomposition of Changes in VTTL .................................................................................... 17
Table 2.3. Policy Gap, Rate Gap, Exemption Gap (2013) ..................................................................... 22
Table 3.1. Austria: VAT receipts, VTTL, composition of VTTL and GAP 2009-2013 (EUR
million) ................................................................................................................................................... 25
Table 3.2. Belgium: VAT receipts, VTTL, composition of VTTL and GAP 2009-2013 (EUR
million) ................................................................................................................................................. 26
Table 3.3. Bulgaria: VAT receipts, VTTL, composition of VTTL and GAP 2009-2013 (EUR
million) .................................................................................................................................................. 27
Table 3.4. Czech Republic: VAT receipts, VTTL, composition of VTTL and GAP 2009-2013 (EUR
million) .................................................................................................................................................. 28
Table 3.5. Denmark: VAT receipts, VTTL, composition of VTTL and GAP 2009-2013 (EUR
million) .................................................................................................................................................. 29
Table 3.6. Estonia: VAT receipts, VTTL, composition of VTTL and GAP 2009-2013 (EUR
million) .................................................................................................................................................. 30
Table 3.7. Finland: VAT receipts, VTTL, composition of VTTL and GAP 2009-2013 (EUR
million) .................................................................................................................................................. 31
Table 3.8. France: VAT receipts, VTTL, composition of VTTL and GAP 2009-2013 (EUR
million) .................................................................................................................................................. 32
Table 3.9. Germany: VAT receipts, VTTL, composition of VTTL and GAP 2009-2013 (EUR
million) .................................................................................................................................................. 32
Table 3.10. Greece: VAT receipts, VTTL, composition of VTTL and GAP 2009-2013 (EUR
million) .................................................................................................................................................. 34
Table 3.11. Hungary: VAT receipts, VTTL, composition of VTTL and GAP 2009-2013 (EUR
million) .................................................................................................................................................. 35
Table 3.12. Ireland: VAT receipts, VTTL, composition of VTTL and GAP 2009-2013 (EUR
million) .................................................................................................................................................. 36
Table 3.13. Italy: VAT receipts, VTTL, composition of VTTL and GAP 2009-2013 (EUR
million) .................................................................................................................................................. 37
Table 3.14. Latvia: VAT receipts, VTTL, composition of VTTL and GAP 2009-2013 (EUR
million) .................................................................................................................................................. 38
Table 3.15. Lithuania: VAT receipts, VTTL, composition of VTTL and GAP 2009-2013 (EUR
million) .................................................................................................................................................. 39

3
Luca Barbone, Mikhail Bonch-Osmolovskiy, Grzegorz Poniatowski
CASE Network Reports No. 124
Table 3.16. Luxembourg: VAT receipts, VTTL, composition of VTTL and GAP 2009-2013 (EUR
million) .................................................................................................................................................. 40
Table 3.17. Malta: VAT receipts, VTTL, composition of VTTL and GAP 2009-2013 (EUR
million) .................................................................................................................................................. 41
Table 3.18. Netherlands: VAT receipts, VTTL, composition of VTTL and GAP 2009-2013 (EUR
million) .................................................................................................................................................. 42
Table 3.19. Poland: VAT receipts, VTTL, composition of VTTL and GAP 2009-2013 (EUR
million) .................................................................................................................................................. 43
Table 3.20. Portugal: VAT receipts, VTTL, composition of VTTL and GAP 2009-2013 (EUR
million) .................................................................................................................................................. 44
Table 3.21. Romania: VAT receipts, VTTL, composition of VTTL and GAP 2009-2013 (EUR
million) .................................................................................................................................................. 45
Table 3.22. Slovakia: VAT receipts, VTTL, composition of VTTL and GAP 2009-2013 (EUR
million) .................................................................................................................................................. 46
Table 3.23. Slovenia: VAT receipts, VTTL, composition of VTTL and GAP 2009-2013 (EUR
million) .................................................................................................................................................. 47
Table 3.24. Spain: VAT receipts, VTTL, composition of VTTL and GAP 2009-2013 (EUR
million) .................................................................................................................................................. 48
Table 3.25. Sweden: VAT receipts, VTTL, composition of VTTL and GAP 2009-2013 (EUR
million) .................................................................................................................................................. 29
Table 3.26. United Kingdom: VAT receipts, VTTL, composition of VTTL and GAP 2009-2013 (EUR
million) .................................................................................................................................................. 50
Table B.1. VTTL (Euro millions) .......................................................................................................... 54
Table B.2. Household VAT Liability (Euro millions) ............................................................................ 55
Table B.3. Intermediate Consumption VAT Liability (Euro millions) ................................................... 56
Table B.4. GFCF VAT Liability (Euro millions) ................................................................................... 57
Table B.5. VAT Revenues (Euro millions) ............................................................................................. 58
Table B.6. VAT Gap (Euro millions) ..................................................................................................... 59
Table B.7. VAT Gap (percent of VTTL) ................................................................................................ 60

4
STUDY TO QUANTIFY AND ANALYSE THE VAT GAP IN THE EU MEMBER STATES
CASE Network Reports No. 124
List of Acronyms and Abbreviations
CASE Center for Social and Economic Research (Warsaw)
CPA Statistical Classiication of Products by Activity in accordance with Regulation (EC) No 451/2008
of the European Parliament and of the Council of 23
April 2008 establishing a new statistical classiication of products by activity
CPB Netherlands Bureau for Economic Policy Analysis
(Central Planning Bureau)
ESA95 European System of Accounts 1995 in accordance
with Council Regulation (EC) No 2223/96 of 25
June 1996 on the European system of national
nd regional accounts in the Community
ESA10 European System of Accounts 2010
in accordance with Regulation (EU) No 549/2013
of the European Parliament and of the Council
of 21 May 2013 on the European system
of national and regional accounts in the European
Union
EU-26 Current Member States of the European Union except
for Croatia and Cyprus
EU-28 Current Member States of the European Union
GDP Gross Domestic Product
GFCF Gross Fixed Capital Formation
HMRC Her Majesty’s Revenue and Customs
MS Member States
NACE Rev. 2 Statistical Classiication of Economic Activities in the European Community in accordance
with Regulation (EC) No 1893/2006 of the European
Parliament and of the Council of 20 December 2006
establishing the statistical classiication of economic activities NACE Revision 2 (also referred to as NACE-
2 or NACE2)
NPISH Non-Proit Institutions Serving HouseholdsOECD Organisation for Economic Cooperation
and Development
o/w Of which
TAXUD Taxation and Customs Union Directorate-General
of the European Commission
UK United Kingdom
VAT Value Added Tax
VTTL VAT Total Tax Liability
VTL VAT Tax Liability
VRR VAT Revenue Ratio

5
Luca Barbone, Mikhail Bonch-Osmolovskiy, Grzegorz Poniatowski
CASE Network Reports No. 124
The authors
Luca Barbone (born 13.08.1953, died 1.09.2015) was President of the CASE Management Board
between September 2011 and September 2013. He joined CASE in January 2011 upon his retirement
from the World Bank, where he had worked since 1988, holding various leadership posts,
among others Director in the Poverty Reduction and Economic Policy Unit in the Europe and Central Asia
Regional Ofice (2007-2011), World Bank Director for Poverty Reduction (2004-2007), and Regional Director for Ukraine, Moldova and Belarus (2000-2004). Prior to the World Bank, Mr. Barbone worked
for the Organisation for Cooperation and Development (Paris), the International Monetary Fund,
The Planning Institute of Jamaica, and the Bank of Italy. He held a Ph.D. in Economics
from the Massachusetts Institute of Technology. He published a number of articles in professional
journal and books. Main areas of his personal interest ncluded: (i) economic crisis and growth
prospects; (ii) economic consequence of long-term demographic trends; (iii) migration
and development; (iv) iscal institutions, iscal consolidation (v) social cohesion and political economy of reforms in Europe and Central Asia.
Mikhail Bonch-Osmolovskiy is a senior statistician expert with an in-depth knowledge of labour
market and migration economics and statistics. He holds a PhD from the University of North Carolina
at Chapel Hill for his dissertation “Work-related Migration and its Effect on Poverty Reduction
and Educational Attainment in Nepal” (2009). He obtained both Master degree in Mathematics
from the Moscow State University and Master degree in Economics from the New Economic School
in Moscow.
Grzegorz Poniatowski is a Senior Economist at CASE and a PhD candidate at the Warsaw
School of Economics. He holds a joint Master’s degree in Economics from the University of Paris 1 –
Pantheon-Sorbonne and the Autonomous University of Barcelona. He also completed an MA and BA
in Quantitative Methods in Economic and Information Systems at the Warsaw School of Economics.
His research interests include mathematical modeling, macroeconomics and mechanism design.
6
STUDY TO QUANTIFY AND ANALYSE THE VAT GAP IN THE EU MEMBER STATES
CASE Network Reports No. 124
Executive summary
This report provides estimates of the VAT Gap for 26 EU Member States for 2013, as well as revised
estimates for the period 2009-2012. It is a follow-up to the report “Study to quantify and analyse
the VAT Gap in the EU-27 Member States”1, published in September 2013 (hereafter: 2013 Report),
and to the report “2012 Update Report to the Study to Quantify and Analyse the VAT Gap in the EU-27
Member States” 2, published in October 2014 (hereafter: 2014 Report). As in previous reports, it was not
possible to include estimates for Croatia and Cyprus, due to as-yet-incomplete national account statistics
for the two countries.
The VAT Gap is an indicator of the effectiveness of VAT enforcement and compliance measures,
as it provides an estimate of revenue loss due to fraud and evasion, tax avoidance, bankruptcies,
inancial insolvencies as well as miscalculations. As the VAT Gap in this study is based on a top-down approach, it does not readily lend itself to be deconstructed according to industrial sectors or other
criteria (territorial, professional), and can be best used as a diagnostic tool in the context of its evolution
over time.
As discussed in previous reports, the VAT Gap is deined as the difference between the amount of VAT actually collected and the VAT Total Tax Liability (VTTL), in absolute or percentage terms.
The VTTL is an estimated amount of VAT that is theoretically collectable based on the VAT legislation
and ancillary regulations. This report calculates, for each country the VTTL on the basis of national
accounts, by mapping information on standard, reduced rates and exemptions onto data available
on inal and intermediate consumption, as well as gross ixed capital formation, from national accounts and use tables. Thus, the quality of the VAT Gap estimates depends on the accuracy and completeness
of national accounts data and use tables.
The year 2013 saw a continuing overall unfavourable economic environment, as the GDP
of the European Union was nearly stagnant. This contributed to a slowdown of nominal inal consumption and of other economic aggregates that form the basis of the Value Added Tax.
Six countries applied changes to standard or reduced rates in 2013, marking a relatively stable policy
environment.
During 2013, the overall VAT Total Tax Liability (VTTL) for the EU-26 Member States grew
by about 1.2 percent, while collected VAT revenues rose by 1.1 percent. As a result, the overall VAT Gap
in the EU-26 saw an increase in absolute values of about Euro 2.8 billion, to reach Euro 168 billion3.
As a percentage, the overall VAT Gap stayed constant at 15.2 percent. The median VAT Gap rose by 1.6
1 http://ec.europa.eu/taxation_customs/resources/documents/common/publications/studies/vat-gap.pdf2 http://ec.europa.eu/taxation_customs/resources/documents/common/publications/studies/vat_gap2012.pdf3 The 2009-2012 estimates were revised from those in the 2014 Report, as discussed in Box 2.2.

7
Luca Barbone, Mikhail Bonch-Osmolovskiy, Grzegorz Poniatowski
CASE Network Reports No. 124
percentage point, to reach 13.9 percent.4
In 2013, Member States’ estimated VAT Gaps ranged from the low of 4 percent in Finland,
the Netherlands and Sweden, to the high of 41 percent in Romania. Overall, 15 Member States decreased
their VAT Gap, with the largest improvements noted in Latvia, Malta and Slovakia. 11 Member States
saw an increase in the VAT Gap, generally of small magnitudes, with the largest deteriorations in Estonia
and Italy.
This report also provides new and expanded evidence on the Policy Gap for the EU-26. The Policy
Gap is an indicator of the additional VAT revenue that a Member State could theoretically collect
if it applied standard rate to all consumption of goods and services supplied for consideration. We
provide here estimates of the Policy Gap adjusted to take into account items that could not easily
be taxed even in an “ideal” system (imputed rents, public goods, inancial services). The results moderate views of the relative importance of reduced rates and exemptions in reducing the revenue potential
of VAT, and suggest that better enforcement remains a key component of any strategy of improvement
of the VAT system.
The results of this report and the underlying data were presented to Member States in advance
of publication and discussed on several occasions with the representatives of Member States. Deviating
approaches and views of Member States are noted in the relevant country section in Chapter 3.
The authors are grateful for the constructive cooperation and helpful input of Member States.
4 For 2012, the VAT Gap in absolute terms is estimated at Euro 165 billion against Euro 177 billion in the 2014 Report, and in percentage terms, at 15.2 percent in contrast to 16 percent. The reasons for the revisions in the estimates are discussed in Box 2.2.

8
STUDY TO QUANTIFY AND ANALYSE THE VAT GAP IN THE EU MEMBER STATES
CASE Network Reports No. 124
1. Background: Economic and Policy Context in 2013
1.1. Introduction
Studies have shown that the behaviour of the VAT Gap (the difference between the VAT revenues
theoretically established by legislation, or VTTL, and actual collections) is inluenced by a number of economic variables as well as by policy actions, through the inluence that these factors have on both the growth of the theoretical VAT revenue on the one hand, and the capacity and willingness to pay
by taxpayers on the other hand. The VAT Gap is sensitive to the economic cycle (as declines in real GDP
make it more dificult for some taxpayers to pay VAT obligations), to growth of nominal consumption (which is the most important base of the VAT), as well as to rate changes (which correspondingly
change the VTTL, but may also affect incentives not to pay) and other parameters (such as changes
in exemptions or shifts in the applicability of reduced rates). These elements are briely discussed in this Chapter.
1.2. Economic Conditions in the EU during 2013
During 2013, the European Union (EU-28) experienced a minimal growth rate in GDP (0.1 percent),
with a much differentiated performance across countries (see Figure 1.1 and Table 1.1).
Seventeen Member States saw negative GDP growth, while the rest saw a positive but sometimes
sharply reduced rate of growth. As was the case in 2012, Latvia registered the highest growth rate
in the EU, at 4.2 percent, while Cyprus marked the sharpest decline in GDP, at -5.4 percent.
Growth of nominal inal consumption was positive in most countries, except for Bulgaria, Cyprus, Greece, Italy, Portugal, Slovenia, and Spain (see Table 1.1). For these countries this development
tended to result in lower estimated VAT liability, when not counteracted by policy changes, as discussed
in Section 1.3 below and in Chapter 3.
Overall, VAT revenues as a percentage of GDP remained virtually constant, at 7 percent of GDP
for the EU-26. However, the behavior of this ratio was split evenly, with half of the countries experiencing
an increase and half a decline (see Figure 1.2). For the EU-26 in this report, the VAT/GDP ratio in 2013
ranged from 9.6 percent in Denmark to 5.8 percent in Italy and Spain.

9
Luca Barbone, Mikhail Bonch-Osmolovskiy, Grzegorz Poniatowski
CASE Network Reports No. 124
Table 1.1. Real and Nominal Growth in the EU-28 in 2013
Real GDP
Growth (%)
Nominal Growth (%)
GDPFinal
ConsumptionGFCF (Total)
Intermediate
Consumption
Austria 0.2 1.7 2.2 0.04 1.0
Belgium 0.3 1.8 2.3 -1.1 0.0
Bulgaria 1.1 0.3 -1.6 -0.8 -3.3
Croatia -0.9 -0.9 0.4 -2.4 -1.0
Cyprus -5.4 -6.7 -6.8 -17.4 -7.0
Czech Republic -0.7 -2.3 1.4 -6.5 -3.7
Denmark -0.5 0.9 1.1 1.0 0.7
Estonia 1.6 6.3 8.3 7.3 7.1
Finland -1.3 1.1 1.5 -4.0 -1.1
France 0.3 1.1 1.3 -0.6 0.7
Germany 0.1 2.2 2.7 0.8 0.4
Greece -3.9 -6.1 -7.4 -10.1 -6.2
Hungary 1.5 1.9 2.6 6.2 0.5
Ireland 0.1 1.2 2.0 -1.8 0.8
Italy -1.7 -0.4 -1.2 -5.3 -3.1
Latvia 4.2 4.7 5.7 -3.2 2.9
Lithuania 3.3 4.9 4.7 10.1 -1.0
Luxembourg 2.1 3.4 4.3 -3.9 10.3
Malta 2.8 4.8 3.0 4.8 1.8
Netherlands -0.8 0.3 0.0 -3.9 -1.2
Poland 1.7 2.6 2.0 -0.7 0.4
Portugal -1.6 0.6 -0.1 -7.4 0.9
Romania 3.4 7.8 5.7 -6.8 1.5
Slovakia 1.4 2.0 1.6 -2.3 -1.3
Slovenia -1.0 0.4 -2.0 2.9 -1.6
Spain -1.2 -0.6 -0.8 -6.7 -3.2
Sweden 1.3 3.1 3.4 0.6 3.2
United Kingdom 1.7 -1.2 3.6 0.2 -1.3
EU-28 0.1 0.7 0.6 -1.7 0.7
Source: Eurostat. For Ireland, Croatia, Portugal, Sweden and UK, the growth of Intermediate Consumption
is estimated through the growth in gross value added.

10
STUDY TO QUANTIFY AND ANALYSE THE VAT GAP IN THE EU MEMBER STATES
CASE Network Reports No. 124
Figure 1.1. GDP growth in the EU, 2012-2013
Figure 1.2. VAT Revenue/GDP

11
Luca Barbone, Mikhail Bonch-Osmolovskiy, Grzegorz Poniatowski
CASE Network Reports No. 124
1.3. VAT Regime Changes
The year 2013 saw very limited changes to the VAT rates of Member States, with six of the 28
Member States implementing changes to the VAT rates: Croatia, Cyprus, Czech Republic, Finland, Italy
and Slovenia (see Table 1.2). Luxembourg remains the Member State with the lowest standard rate (15
percent), and Hungary the highest at 27 percent. The median standard rate is 21 percent.
Table 1.2. VAT Rate Structure as of 31 December 2013, and Changes during 2013
EU Member StateStandard
Rate (SR)
Reduced
Rate(s) (RR)
Super
Reduced Rate
Parking
RateChanges during 2012
Austria 20 10 - 12 ..
Belgium 21 6 / 12 - 12 ..
Bulgaria 20 9 - - ..
Croatia 25 5/10 RR 0/10 to 5/10
Cyprus 18 5 / 8 - - SR 17 to 18
Czech Republic 21 15 - - SR 20 to 21, RR 14 to 15
Denmark 25 - - - ..
Estonia 20 9 - - ..
Finland 24 10 / 14 - - SR 23 to 24, RRs 9/13 to 10/14
France 19.6 5.5 / 7 2.1 - ..
Germany 19 7 - - ..
Greece 23 6.5 / 13 - - ..
Hungary 27 5 / 18 - - ..
Ireland 23 9 / 13.5 4.8 13.5 ..
Italy 22 10 4 - SR 21 to 22
Latvia 20 12 - - ..
Lithuania 21 5 / 9 - - ..
Luxembourg 15 6 / 12 3 12 ..
Malta 18 5 / 7 - - ..
Netherlands 21 6 - - ..
Poland 23 5 / 8 - - ..
Portugal 23 6 / 13 - 13 ..
Romania 24 5 / 9 - - ..
Slovakia 20 10 - - ..
Slovenia 22 9.5 - - SR 21 to 22, RR 8.5 to 9.5
Spain 21 10 4 - ..
Sweden 25 6 / 12 - - ..
United Kingdom 20 5 - - ..
Source: TAXUD 2014.

12
STUDY TO QUANTIFY AND ANALYSE THE VAT GAP IN THE EU MEMBER STATES
CASE Network Reports No. 124
2. The VAT Gap in 2013
2.1. Methodological Observations
As discussed in previous reports, the VAT Gap is deined as the difference between the amount of VAT actually collected and the VAT Total Tax Liability (VTTL), in absolute or percentage terms.
The VTTL is an estimated amount of VAT that is theoretically collectable based on the VAT legislation
and ancillary regulations. The VTTL is calculated with a “top-down” methodology, based on national
accounting. It maps information on standard, reduced rates and exemptions onto data available on inal and intermediate consumption, as well as gross ixed capital formation, from national accounts and use tables. In Box 2.1 we review a number of methodological objections that have been voiced in recent
past with regard to the top-down approach utilized in our calculations.
The “top-down” approach underlying the calculations of the VTTL is sometimes contrasted
with (or complemented by) the so-called “bottom-up” approach, which is based on detailed examination
of individual tax returns and audits, to ascertain the extent of non-compliance. This approach, which
can have tremendous diagnostic value for the tax administration, is much more time- and resources-
consuming, and is not immune from shortcomings (for instance, dealing with unregistered taxpayers).
Ideally, both approaches could be used to complement each-other’s indications.
For more details on the methodology, see the 2013 Report and the 2014 Report.
During 2014, EU Member States began the transition of their national accounts to ESA10 standards
(see Eurostat 2013). The transition is ongoing, and it will result in several changes to estimates
of consumption, investment and GDP for most or all EU countries. As the transition is not yet complete,
and Use tables according to ESA10 standards have not yet been produced for most Member States,
this update used the ESA95-based national accounts published by Eurostat. Publication of ESA95 data
is to be discontinued starting with 2014 data, and hence any future updates will need to reconcile
the ESA95 and ESA10 databases.

13
Luca Barbone, Mikhail Bonch-Osmolovskiy, Grzegorz Poniatowski
CASE Network Reports No. 124
Box 2.1. Methodological Objections to the Top-down Approach
A number of methodological objections have been voiced with regards to the Top-down approach
methodology used in this report and elsewhere. Their common root stems from the fact that National accounts data
are not produced for tax monitoring purposes, and hence a degree of approximation is necessary to calculate
the VTTL. Here we review three objections: (i) the size of the informal economy and its impact on the estimated
liability; (ii) certain kinds of National Accounts conventions vs tax laws, particularly in the construction sector;
(iii) the accuracy of estimates of accrued VAT revenues as reported by Eurostat.
Informal Economy. Conceptually, the non-observed economy, which must be included in GDP estimates
in the European Union, is composed of four distinct categories: underground, informal (including those undertaken
by households for their own inal use), illegal, and other activities omitted due to deiciencies in the basic data
collection programme. Underground activities are legal but conceived in order to avoid taxation (including
VAT). Informal activities are legal but of small scale and mostly involving little capital. Illegal activities
are those explicitly prohibited by the law (and will be incorporated in national accounts under ESA2010). Other
activities omitted are “unknown unknowns”, the results of deiciencies in sampling methods and procedures. All
EU Member States adjust their National Account statistics to capture some elements of the informal economy,
and with the adoption of ESA 2010 standards currently underway, illegal activities will also be included in
statistics. However, the methodology followed by each Member State varies depending on the estimation
procedures used in each country, so it is not possible to strictly ensure that all countries capture all informal
activities in equal proportions. This might affect the comparability of VAT Gap estimates. While this issue cannot
be solved empirically at present, we tend to regard the criticism as unfounded, as it would imply that countries
with the lowest VAT Gaps somehow systematically underestimate the informal economy, and the opposite
for countries with the highest VAT Gaps. Inspection of the results in this and other reports does not seem to
support such a contention.
Accounting conventions. Because tax laws and statistical conventions are not necessarily harmonized, there
may be (important) discrepancies in the recording of sales of goods or services to particular time periods, leading
to bias in the estimation of the liability. This appears to have been the case, for instance, in Spain with regards
to the construction industry, where the taxable moment for VAT purposes is different from the time at which
construction is recorded in the national accounts. In normal times, these differences would even themselves
out over time, but for instance during the post-2008 construction collapse, important differences remained
as stocks of unsold housing continued as such over time. We have adjusted Spain’s estimates, given the availability
of accurate corrections. We cannot exclude that this might apply to other countries, and to other items possibly
of importance.
Accrued Revenues. Eurostat conventions correct net VAT cash collections with a lag of about 2 months
in order to approximate accrued revenues, the relevant concept for national accounting purposes. Yet, this method
is very crude, and several countries have made efforts to construct better data series that more closely approximate
accrued revenues. The net effect of these corrections over time is generally very small or zero, but the allocation
of revenues across years may be changed, leading to possibly different time proiles of VAT gap estimates.
In this update, we have provided alternative estimates for Italy and Spain, for which the phenomenon has been
particularly relevant.

14
STUDY TO QUANTIFY AND ANALYSE THE VAT GAP IN THE EU MEMBER STATES
CASE Network Reports No. 124
2.2 VAT Gap: Overall Results for 2013
During 2013, the overall VAT Total Tax Liability (VTTL) for the EU-26 Member States grew
by about 1.2 percent, while collected VAT revenues rose by 1.1 percent. As a result, the overall VAT Gap
in the EU-26 saw an increase in absolute values of about Euro 2.8 billion, to reach Euro 168 billion.
As a percentage, the overall VAT Gap stayed constant at 15.2 percent. The median VAT Gap rose by 1.6
percentage point and was 13.9 percent.
These overall developments were in line with general economic conditions. As mentioned in Chapter
1, the EU economy was essentially stagnant in 2013, while nominal inal consumption rose marginally by 0.6 percent. In the absence of policy (and enforcement practices) changes, revenues and VTTL tend
to follow the nominal growth of the economic base, although revenues relect a greater sensitivity to the business cycle (real GDP growth), as discussed in the 2013 Report.
Figure 2.1. VAT Gap in the EU-26 countries, 2012-2013
In 2013, the VAT Gap in individual Member States ranged from the low of 4 percent of Finland,
the Netherlands and Sweden, to the high of 41 percent in Romania. Fig. 2.1 and Table 2.1 provide
an overview of the results of the VAT Gap estimates for 2012 and 2013.
Overall, 15 Member States decreased their VAT Gap, with the largest improvements noted
in Latvia, Malta and Slovakia. Eleven Member States saw an increase in the VAT Gap, generally
of small magnitudes, with the highest deteriorations in Estonia and Italy.
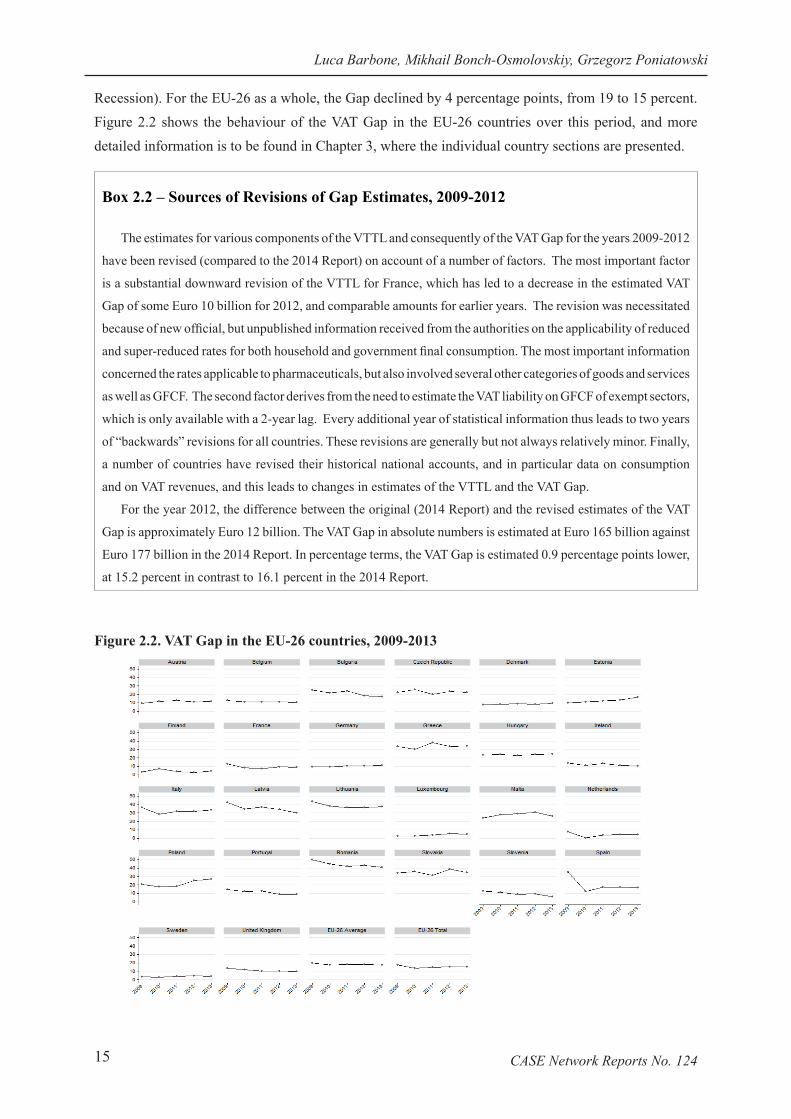
The trend of the VAT Gap over the period 2009-2013 is shown in Fig. 2.2. Member States have
tended to slightly reduce their gap compared to the beginning of the period (at the depth of the Great
15
Luca Barbone, Mikhail Bonch-Osmolovskiy, Grzegorz Poniatowski
CASE Network Reports No. 124
Recession). For the EU-26 as a whole, the Gap declined by 4 percentage points, from 19 to 15 percent.
Figure 2.2 shows the behaviour of the VAT Gap in the EU-26 countries over this period, and more
detailed information is to be found in Chapter 3, where the individual country sections are presented.
Figure 2.2. VAT Gap in the EU-26 countries, 2009-2013
Box 2.2 – Sources of Revisions of Gap Estimates, 2009-2012
The estimates for various components of the VTTL and consequently of the VAT Gap for the years 2009-2012
have been revised (compared to the 2014 Report) on account of a number of factors. The most important factor
is a substantial downward revision of the VTTL for France, which has led to a decrease in the estimated VAT
Gap of some Euro 10 billion for 2012, and comparable amounts for earlier years. The revision was necessitated
because of new oficial, but unpublished information received from the authorities on the applicability of reduced
and super-reduced rates for both household and government inal consumption. The most important information
concerned the rates applicable to pharmaceuticals, but also involved several other categories of goods and services
as well as GFCF. The second factor derives from the need to estimate the VAT liability on GFCF of exempt sectors,
which is only available with a 2-year lag. Every additional year of statistical information thus leads to two years
of “backwards” revisions for all countries. These revisions are generally but not always relatively minor. Finally,
a number of countries have revised their historical national accounts, and in particular data on consumption
and on VAT revenues, and this leads to changes in estimates of the VTTL and the VAT Gap.
For the year 2012, the difference between the original (2014 Report) and the revised estimates of the VAT
Gap is approximately Euro 12 billion. The VAT Gap in absolute numbers is estimated at Euro 165 billion against
Euro 177 billion in the 2014 Report. In percentage terms, the VAT Gap is estimated 0.9 percentage points lower,
at 15.2 percent in contrast to 16.1 percent in the 2014 Report.

16
STUDY TO QUANTIFY AND ANALYSE THE VAT GAP IN THE EU MEMBER STATES
CASE Network Reports No. 124
Table 2.1. VAT Gap Estimates, 2012-2013 (million Euros)
2012 2013
Country Revenues VTTLVAT
Gap
VAT Gap
%Revenues VTTL VAT Gap
VAT Gap
%
Austria 24,563 27,629 3,066 11.1% 24,953 28,170 3,217 11.4%
Belgium 26,896 30,272 3,376 11.2% 27,226 30,412 3,186 10.5%
Bulgaria 3,828 4,697 869 18.5% 3,775 4,560 785 17.2%
Czech
Republic11,377 14,883 3,506 23.6% 11,694 15,070 3,375 22.4%
Denmark 24,296 26,563 2,267 8.5% 24,360 26,850 2,489 9.3%
Estonia 1,508 1,740 232 13.3% 1,558 1,873 315 16.8%
Finland 17,987 18,524 537 2.9% 18,848 19,660 812 4.1%
France 142,526 157,360 14,834 9.4% 144,414 158,510 14,096 8.9%
Germany 194,034 216,984 22,950 10.6% 197,005 221,878 24,873 11.2%
Greece 13,712 20,595 6,883 33.4% 12,593 19,090 6,497 34.0%
Hungary 9,084 11,963 2,879 24.1% 9,073 12,003 2,930 24.4%
Ireland 10,219 11,508 1,289 11.2% 10,371 11,596 1,225 10.6%
Italy 96,170 141,332 45,162 32.0% 93,921 141,437 47,516 33.6%
Latvia 1,583 2,391 808 33.8% 1,693 2,414 721 29.9%
Lithuania 2,521 3,971 1,450 36.5% 2,611 4,192 1,580 37.7%
Luxembourg 3,093 3,269 176 5.4% 3,485 3,672 187 5.1%
Malta 536 777 241 31.0% 586 796 210 26.4%
Netherlands 41,699 43,598 1,899 4.4% 42,424 44,276 1,852 4.2%
Poland 27,783 37,175 9,391 25.3% 27,780 37,911 10,131 26.7%
Portugal 13,995 15,330 1,335 8.7% 13,710 15,068 1,358 9.0%
Romania 11,212 19,634 8,422 42.9% 11,913 20,209 8,296 41.1%
Slovakia 4,328 7,054 2,726 38.6% 4,696 7,209 2,513 34.9%
Slovenia 2,889 3,180 291 9.1% 3,045 3,232 186 5.8%
Spain 56,652 68,262 11,610 17.0% 61,350 73,444 12,094 16.5%
Sweden 37,834 39,762 1,928 4.8% 39,091 40,867 1,776 4.3%
United
Kingdom142,943 159,695 16,752 10.5% 141,668 157,099 15,431 9.8%
Total EU-26 923,269 1,088,147 164,879 15.2% 933,843 1,101,498 167,654 15.2%
Median 12.3% 13.9%
Sources: Eurostat (revenues); Own calculations. Figures in million Euros unless otherwise indicated. National
currency igures for countries not using the Euro converted at the average Euro exchange rate (source: Eurostat).
Explaining Changes in VTTL
Table 2.2 presents further details on changes in the VTTL in 2013, which are useful to understand
the performance of individual countries discussed in Chapter 3. The change in VTTL is decomposed
into the change in its base (inal consumption and other components) and the change in the “effective rate”, i.e. the weighted average VAT rate by commodity group. The latter can represent modiications

17
Luca Barbone, Mikhail Bonch-Osmolovskiy, Grzegorz Poniatowski
CASE Network Reports No. 124
in the classiication of goods and services for the purposes of the applicable VAT rate (e.g., reclassiication from standard to reduced rate, or vice-versa), or shift in consumption patterns across sub-categories.
Finally, for those countries where a rate change was implemented (either in 2013 or during 2012),
the last column captures the effect of such statutory changes on the VTTL.
Table 2.2. Decomposition of Changes in VTTL
Change in VTTL Change in BaseChange in
Effective Rate
Change
in Statutory Rates
Austria 2.3% 2.0% 0.2% ..
Belgium 2.1% 1.7% 0.4% ..
Bulgaria -2.9% -1.5% -1.4% ..
Czech Republic 4.6% 0.4% 0.1% 4.0%
Denmark 1.3% 1.2% 0.1% ..
Estonia 7.7% 8.1% -0.4% ..
Finland 5.9% 0.7% 0.7% 4.4%
France 0.7% 1.2% -0.5% ..
Germany 2.3% 2.8% -0.5% ..
Greece -7.4% -7.6% 0.2% ..
Hungary 3.4% 2.9% 0.4% ..
Ireland 0.9% 0.0% 0.8% ..
Italy 0.1% -1.3% 0.3% 1.2%
Latvia 1.6% 5.0% -1.6% -1.6%
Lithuania 5.5% 3.8% 1.6% ..
Luxembourg 3.5% 4.9% -1.4% ..
Malta 2.3% 2.2% 0.1% ..
Netherlands 1.6% -0.7% -2.3% 4.7%
Poland 2.4% 1.3% 1.0% ..
Portugal -1.6% -0.4% -1.2% ..
Romania 2.7% 4.6% -1.8% ..
Slovakia 2.3% 1.1% 1.2% ..
Slovenia 1.8% -1.8% -0.3% 4.0%
Spain 9.2% -1.6% 1.2% 9.7%
Sweden 2.1% 2.9% -0.7% ..
United Kingdom 3.2% 2.2% 1.0% ..
Source: Own Calculations.
As can be seen from the table, the largest component of the change in the VTTL is generally represented
by the change in the base. In some cases, however, changes within the commodity classiication have resulted in noticeable decreases in liability, for instance in the cases of the Netherlands, Romania, Latvia,
Bulgaria and Luxembourg, and, in the opposite direction, Lithuania, Slovakia and Spain. Statutory rate
changes have of course a powerful effect on liability (but not necessarily on collections), as shown
in the last column, and the magnitude of the effect depends among other things on the timing

18
STUDY TO QUANTIFY AND ANALYSE THE VAT GAP IN THE EU MEMBER STATES
CASE Network Reports No. 124
of the change in rate(s). Thus for instance in the case of Spain, which implemented substantial increases
in standard and reduced rates in late 2012 (from 18 to 21 percent for the standard rate, and from 4/8
to 4/10 for the reduced rates), and whose effect carried over to 2013, leading to an increase in liability
of more than 9 percent. At the other end of the spectrum, Latvia implemented a reduction of the VAT
rates in July 2012, and the full effect was felt in 2013, leading to a reduction of the liability by 1.6
percent.
2.3 Policy Gap
In this section we present a new series of estimates of the Policy Gap for the EU-26, which modiies and extends the work done in the 2013 Report and the 2014 Report.
As discussed in the above mentioned reports and elsewhere in the literature, the Policy Gap tries
to capture the effects of discretionary decisions regarding multiple rates and exemptions on the revenue
that could be generated by a given VAT system. The Policy Gap is deined as the ratio between the VTTL and an “ideal” VAT Revenue, in turn deined and estimated by applying, for each country, the standard rate of VAT to inal consumption (thereby eliminating the effects of reduced rates and exemptions). Thus, the Policy Gap is an indicator of the additional VAT revenue that a Member State could theoretically
collect if it applied uniform taxation to all consumption of goods and services. The concept is a static
one, since it does not take into account what would be consumer reactions to changes in prices brought
upon by VAT increases, but it is one that has been popularized in the literature.
Rate Gap, Exemption Gap and “Actionable Exemption Gap”
The Policy Gap as deined above can in turn be decomposed into two separable effects, namely the Rate Gap and the Exemption Gap. As the terminology suggests, the Rate Gap represents
the potential revenue loss due to the existence of reduced rates, whereas the Exemptions Gap represents
the potential revenue loss due to the existence of exempted supplies of goods and services (see Box 2.3
for a brief discussion of EU rules on VAT rates, exemptions and right to deduct input VAT). Using our
database of rates and exempt goods and services, we are able to provide a fully decomposable deinition of the Exemption and Rate Gaps as summing to the Policy Gap (see Appendix A for the methodology).
We also address the issue of the extent to which the “ideal base”, and consequently the “ideal
VAT revenue”, is a relevant concept for policymakers. We note that in the national accounting
of inal consumption, “imputed rents” (the notional value of home occupancy by homeowners) amount to a considerable portion of inal consumption (typically 10 percent or more). It seems unlikely that even in an ideal world a workable method could be found to assess and collect VAT on such items,
as they do not involve any monetary transaction (let alone the political feasibility of such a measure).
Similarly, the provision of public goods or free goods on the part of government also presents a great

19
Luca Barbone, Mikhail Bonch-Osmolovskiy, Grzegorz Poniatowski
CASE Network Reports No. 124
problem, since any attempt to impose VAT on, say, police services would be impractical, and attempts
to tax services such as primary education which are currently free would require changing the nature
of the public provision of the service itself, or EU directives (e.g., art. 132 of the VAT Directive).
Finally, with respect to inancial sector services the imposition of VAT may be both impractical and/or beyond the control of national authorities, as many aspect of taxation in this area are beyond
national legislation purview (art. 135 of the VAT Directive).
In order to provide an estimate of the Policy Gap and its components that takes into account
the practical problems relating to the exemptions for imputed rents, public goods and inancial services just discussed, we have thus produced a new index, called the index of “Actionable Exemption Gap”,
which is more likely to represent actual policy choices that could be seized by the legislator if it chose
to do so. This index is obtained by calculating separate exemption gaps for the three sectors concerned,
and subtracting them from the overall Exemption Gap. An “Actionable Policy Gap” is then obtained
by adding to the Rate Gap the “Actionable Exemption Gap”. In formulas:
Policy Gap = Rate Gap + Exemptions Gap
Exemptions Gap = Imputed Rents Gap + Public Goods Gap + Financial Services Gap + “Actionable
Exemption Gap”
“Actionable” Policy Gap = Rate Gap + “Actionable” Exemption Gap
Box 2.3 – Summary of EU legislation on rates, exemptions, and rights to deduct
In this Box we briely recall essential elements of the EU legislation with regard to VAT rates, exempted
goods or services, and right of deductibility of VAT on inputs. For more information, see http://europa.eu/
legislation_summaries/taxation/l31057_en.htm
Rates of VAT
Taxable transactions are taxed at the rates and under the conditions set by the EU country where they take
place. The standard rate of VAT is set as a percentage of the taxable amount which, until 31 December 2015,
may not be less than 15%.
EU countries may apply one or two reduced rates of not less than 5 %. The reduced rates may only be applied
to supplies of goods and services in the categories listed in Annex III to the VAT Directive (as last amended
by Directive 2009/47/EC).
The EU countries may also, after consultation of the VAT Committee, apply a reduced rate to supplies
of natural gas, electricity and district heating.
Finally, by way of derogation from the normal rules, certain EU countries have been authorised to maintain
reduced rates, including those lower than the minimum, or zero rates, in certain areas.
Some of these derogations provided for in the act of accession of the ten countries which joined the EU
on 1 May 2004 only applied until 31 December 2010. Others have been extended or incorporated
into the general rules by Directive 2009/47/EC.

20
STUDY TO QUANTIFY AND ANALYSE THE VAT GAP IN THE EU MEMBER STATES
CASE Network Reports No. 124
Results for 2013
The results of the estimates for the various gaps just discussed are shown in Table 2.3
for the year 2013. As can be seen, Column B displays the Policy Gap calculated according to the classic
deinition. As customary, the Policy Gap is generally higher than the VAT Gap, a result well-established
Exemptions
Goods and services which are exempt from VAT are sold to the inal consumer without VAT applying
to the sale. However, where the supply of goods or services is exempt, the supplier may not deduct the VAT
on purchases. Such exemption without a right to deduct means that ‘hidden’ VAT remains included in the price paid
by the consumer. This exemption should be clearly distinguished from a zero rate of VAT which certain EU
countries have a derogation to retain and which means that the inal price to the consumer includes no residual
VAT.
There are also exemptions with a right to deduct whose main aim is to take into account the place where
the goods or services are deemed to have been consumed and so taxed: these transactions are relieved of all VAT
in their EU country of origin because they will be taxed in the country of destination.
Exemptions without a right to deduct
For socio-economic reasons, the following are exempted:
• certain activities of general interest (such as hospital and medical care, goods and services linked
to welfare and social security work, school and university education and certain cultural services);
• certain transactions including insurance, the granting of credit, certain banking services, supplies
of postage stamps, lotteries and gambling and certain supplies of immovable property.
To facilitate trade, certain importations of goods from outside the EU are exempt. These include
the inal importation of goods the supply of which is exempt in the EU country of importation and goods
the inal importation of which is governed by Directives 2007/74/EC (goods carried in travellers’ luggage),
2009/132/EC (goods imported for non-commercial purposes) and 2006/79/EC (small consignments of goods
of a non-commercial character).
Exemptions with a right to deduct
To take account of the place where goods and services are deemed to have been consumed and hence taxed,
the following transactions are exempt with a right to deduct:
• intra-EU supplies of goods, including new means of transport and products subject to excise duty
dispatched from one EU country to another;
• exports of goods from the EU to a third territory or a non-EU country;
• certain transactions relating to international transport or treated as exports;
• supplies of services by intermediaries when they take part in transactions relating to exports;
• certain transactions relating to international trade, such as those concerning customs warehouses
and other warehouses.
Source: TAXUD website.

21
Luca Barbone, Mikhail Bonch-Osmolovskiy, Grzegorz Poniatowski
CASE Network Reports No. 124
in the literature. For the year 2013, the Policy Gap ranges from the low of 27 percent in Slovakia
and Bulgaria, to the high of 54 percent for Spain and Belgium. The EU-26 average Policy Gap is 42
percent, the median 43 percent.
The Policy Gap, in turn, is decomposed into the Rate Gap and the Exemption Gap (Columns C
and D). The latter, in all countries, is the larger of the two, ranging from the high of 43 percent
for Finland, to the low of 22 percent for Lithuania. The EU-26 average Exemption Gap is 33 percent,
as is the median. The Rate Gap, on the other hand, ranges from the low of 1 percent in the case
of Denmark, to the high of 19 percent in Portugal. The average is 10 percent, and the median is 11
percent.
From these results, it could be argued that the largest revenue losses induced by the legislation,
compared to a single-rate, non-exemption regime, are attributable in all countries to exemption rather
than multiple rates.

STUDY TO QUANTIFY AND ANALYSE THE VAT GAP IN THE EU MEMBER STATES
CASE Network Reports No. 124 22
Table 2.3. Policy Gap, Rate Gap, Exemption Gap (2013)
A B C D E F G H I
VAT Gap Policy Gap Rate GapExemption
Gap
o/w Imputed
Rents
o/w
Financial
Services
o/w Public
Goods
"Actionable"
Exemption
Gap (D-E-F-
G)
"Actionable"
Policy Gap
(C+H)
Austria 11.4% 40.7% 12.0% 28.7% 7.6% 1.8% 18.0% 1.4% 13.4%
Belgium 10.5% 53.8% 11.7% 42.1% 8.8% 2.5% 29.5% 1.3% 13.0%
Bulgaria 17.2% 26.7% 1.9% 24.8% 9.0% -0.2% 13.8% 2.2% 4.1%
Czech Republic 22.4% 33.0% 6.3% 26.8% 9.3% 0.5% 17.8% -0.9% 5.4%
Denmark 9.3% 42.7% 0.6% 42.0% 7.9% 3.3% 29.7% 1.2% 1.8%
Estonia 16.8% 30.5% 2.7% 27.8% 8.6% 1.3% 15.2% 2.7% 5.3%
Finland 4,1% 50.2% 7.7% 42.5% 9.5% 1.3% 26.1% 5.6% 13.4%
France 8.9% 53.4% 14.2% 39.2% 9.9% 1.2% 24.1% 3.9% 18.1%
Germany 11.2% 42.6% 8.4% 34.2% 6.7% 2.0% 22.3% 3.2% 11.6%
Greece 34.0% 50.8% 13.6% 37.1% 10.6% 1.2% 19.0% 6.3% 19.9%
Hungary 24.4% 36.2% 5.2% 31.0% 8.5% 2.1% 17.6% 2.8% 8.0%
Ireland 10.6% 52.5% 16.9% 35.6% 8.6% 1.0% 23.0% 2.9% 19.8%
Italy 33.7% 45.6% 13.3% 32.3% 10.5% -0.8% 19.3% 3.4% 16.7%
Latvia 29.9% 33.3% 3.4% 29.8% 10.8% 0.6% 17.3% 1.2% 4.6%
Lithuania 37.7% 25.5% 3.3% 22.2% 5.2% 0.8% 14.5% 1.7% 5.0%
Luxembourg 5.1% 53.2% 12.5% 40.8% 10.2% 2.5% 23.9% 4.1% 16.6%
Malta 26.4% 41.5% 18.0% 23.6% 5.0% -0.5% 18.0% 1.2% 19.1%
Netherlands 4.2% 52.0% 11.0% 41.1% 5.5% 2.8% 29.0% 3.8% 14.8%
Poland 26.7% 43.1% 18.5% 24.6% 4.4% 2.8% 14.1% 3.3% 21.7%
Portugal 9.0% 51.9% 19.0% 32.9% 6.5% 2.6% 21.4% 2.3% 21.3%
Romania 41.1% 17.0% 4.0% 13.0% 10.8% -0.9% 9.4% -6.4% -2.4%
Slovakia 34.9% 27.3% 1.8% 25.5% 5.4% 3.0% 15.9% 1.2% 3.0%
Slovenia 5.8% 43.3% 11.7% 31.6% 8.2% 2.0% 18.8% 2.6% 14.3%
Spain 16.5% 53.9% 15.7% 38.2% 8.9% 1.8% 20.4% 7.0% 22.7%
Sweden 4.3% 48.8% 7.8% 40.9% 6.2% 1.4% 28.1% 5.3% 13.1%
United Kingdom 9.8% 51.4% 12.8% 38.6% 11.1% 1.4% 20.8% 5.3% 18.1%
Average 18.5% 42.3% 9.8% 32.6% 8.2% 1.4% 20.3% 2.6% 12.4%
Median 13.9% 43.2% 11.3% 32.6% 8.6% 1.4% 19.2% 2.7% 13.4%
Table 2.3 - Policy Gap, Rate Gap, Exemption Gap (2013)
23
Luca Barbone, Mikhail Bonch-Osmolovskiy, Grzegorz Poniatowski
CASE Network Reports No. 124
However, if we deduct from the Exemption Gap three elements that either might not belong
in an “Ideal” VAT system, or that would be extremely hard to tax (public goods, inancial services, and imputed rents, as displayed in columns E, G and F), we can observe an interesting reversal:
• The individual “Exemption Gaps” for imputed rents, public goods and inancial services have a similar ordering across countries, with public goods being the largest item (ranging from 29.5 percent
in Belgium to 10 percent in Romania), followed by imputed rents and then inancial services.
• The “actionable” Exemption Gap (the Exemption Gap net of imputed rents, inancial services and public goods; Column H) is consequently of a much smaller magnitude than the original Exemption
Gap, relecting the importance of the three items in inal consumption, particularly imputed rents and public goods. In some cases (Czech Republic and Romania5), this measure is actually negative, as
the sum of the “non-actionable” sectors is greater than the gap itself. The “actionable” Exemption
Gap can be less than zero if the “non-actionable” sectors have a suficiently large share of GFCF. Due to the large share of non-deductible VAT on GFCF expenditures in the exempt sectors in that
particular year, removing the exemptions would lead to a revenue loss for the Treasury if the GFCF
expenditures are larger than the value added by the sector (i.e. VAT on GFCF expenditures would
become deductible) 6.
• Consequently, the “actionable” Policy gap (deined as the sum of the Rate gap and the “actionable” Exemption Gap; Column I) is actually, in a number of cases, smaller
than the VAT Gap. Thus, the “actionable” Policy Gap ranges from the negative 2 percent
for Romania (again, negative because the negative “actionable” Exemption Gap is greater
than the Rate Gap), to 3 percent in the case of Slovakia, to 23 percent in the case of Spain,
and it is lower than the VAT in the cases of Bulgaria, Czech Republic, Denmark, Estonia, Greece,
Hungary, Italy, Latvia, Lithuania, Malta, Poland, Romania and Slovakia.
The above results should not of course be interpreted as an indication that the scope for increased
revenues from less distortive VAT systems is insigniicant, but rather that, in the balance of considerations, for most of the EU-26 countries a better-functioning collection system has to remain a priority for public
action.
5 In the case of Romania, the inancial sector also had an overall negative value added.6 See Appendix A for a formal discussion.
24
STUDY TO QUANTIFY AND ANALYSE THE VAT GAP IN THE EU MEMBER STATES
CASE Network Reports No. 124
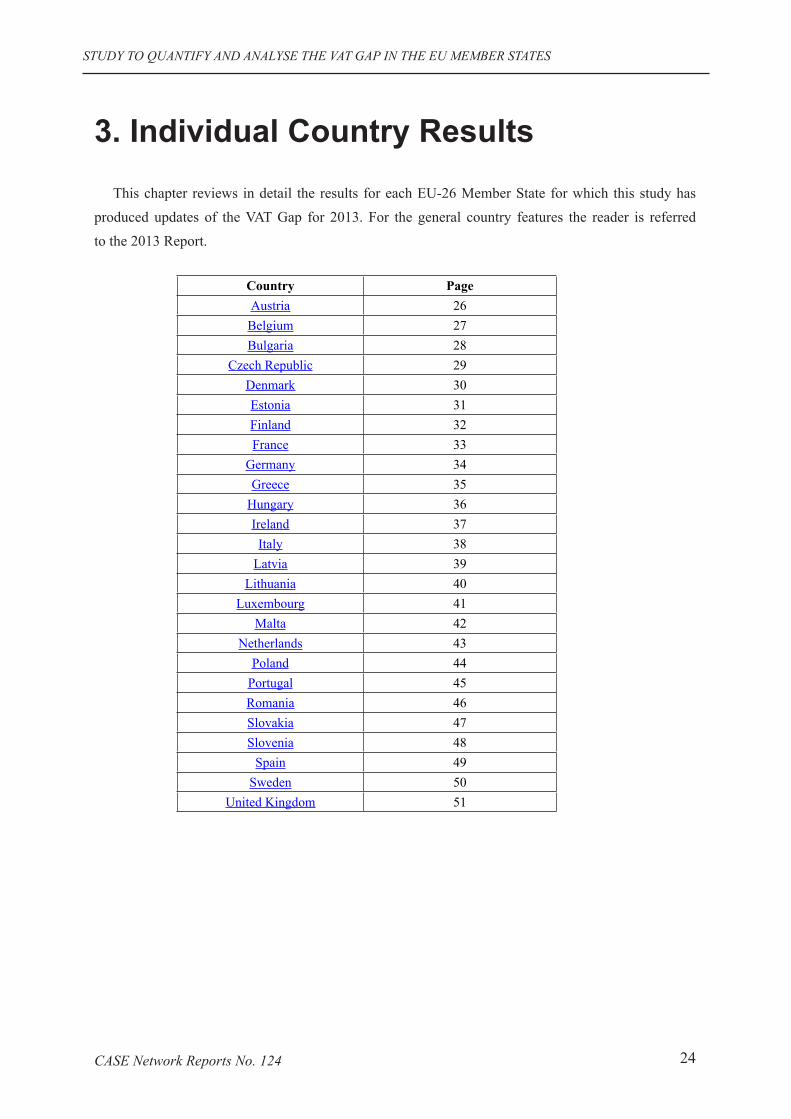
3. Individual Country Results
This chapter reviews in detail the results for each EU-26 Member State for which this study has
produced updates of the VAT Gap for 2013. For the general country features the reader is referred
to the 2013 Report.
Country Page
Austria 26
Belgium 27
Bulgaria 28
Czech Republic 29
Denmark 30
Estonia 31
Finland 32
France 33
Germany 34
Greece 35
Hungary 36
Ireland 37
Italy 38
Latvia 39
Lithuania 40
Luxembourg 41
Malta 42
Netherlands 43
Poland 44
Portugal 45
Romania 46
Slovakia 47
Slovenia 48
Spain 49
Sweden 50
United Kingdom 51

Luca Barbone, Mikhail Bonch-Osmolovskiy, Grzegorz Poniatowski
CASE Network Reports No. 12425
Table 3.1 Austria: VAT receipts, VTTL, composition of VTTL and Gap, 2009–2013 (EUR million)
2009 2010 2011 2012 2013
VTTL 24,447 25,681 26,838 27,629 28,170
Liability on Household Consumption 16,280 17,230 17,980 18,524 18,986
Unrecoverable input liability on Intermediate
consumption, Government and NPISH 4,751 4,795 4,900 5,067 5,184
Unrecoverable input liability on GFCF of exempt
industries 2,191 2,387 2,477 2,568 2,586
Net Adjustments 1,225 1,269 1,481 1,469 1,414
VAT Revenues (Eurostat) 22,158 22,735 23,447 24,563 24,953
VAT Gap 2,289 2,945 3,392 3,066 3,217
VAT Gap as % of liability 9% 11% 13% 11% 11%
0%
2%
4%
6%
8%
10%
12%
14%
0
5,000
10,000
15,000
20,000
25,000
30,000
2009 2010 2011 2012 2013
VTTL VAT Revenues (Eurostat)
VAT Gap VAT Gap as % of liability
Highlights for 2013
The VAT Gap in Austria was virtually stationary during 2013, compared to the previous year. With the economy experiencing virtually no growth in real GDP, and with nominal final consumption advancing barely by 2 percent, the VTTL rose by slightly less than 2 percent, just slightly ahead of the 1.6 percent growth in VAT revenues. As a ratio to total liability, the gap remained at 11 percent.
No significant changes were made to the VAT system during the year.

STUDY TO QUANTIFY AND ANALYSE THE VAT GAP IN THE EU MEMBER STATES
CASE Network Reports No. 124 26
Table 3.2 Belgium: VAT receipts, VTTL, composition of VTTL and Gap, 2009–2013 (EUR million)
2009 2010 2011 2012 2013
VTTL 27,150 28,473 29,255 30,272 30,412
Liability on Household Consumption 15,763 16,281 16,847 17,240 17,656
Unrecoverable input liability on Intermediate
consumption, Government and NPISH 6,057 6,593 7,053 7,198 7,467
Unrecoverable input liability on GFCF of exempt
industries 4,039 4,126 4,007 4,262 4,173
Net Adjustments 1,290 1,473 1,348 1,572 1,116
VAT Revenues (Eurostat) 23,600 25,230 26,019 26,896 27,226
VAT Gap 3,549 3,243 3,236 3,376 3,186
VAT Gap as % of liability 13% 11% 11% 11% 10%
0%
2%
4%
6%
8%
10%
12%
14%
0
5,000
10,000
15,000
20,000
25,000
30,000
35,000
2009 2010 2011 2012 2013
VTTL VAT Revenues (Eurostat)
VAT Gap VAT Gap as % of liability
Highlights for 2013
Belgium's total VAT liability (VTTL) rose very slightly in 2013, reflecting the sluggish behavior of the economy (real GDP growth: 0.1 percent, final consumption nominal growth: 2.3 percent). Revenues increased a modest 1.2 percent, thus overall leading to a decreased estimated VAT gap (Euro 3.2 billion, or 10 percent of liability, down from 11 percent in 2012).
No systemic changes were introduced to the VAT system parameters.

Luca Barbone, Mikhail Bonch-Osmolovskiy, Grzegorz Poniatowski
CASE Network Reports No. 12427
Table 3.3 Bulgaria: VAT receipts, VTTL, composition of VTTL and Gap, 2009–2013 (EUR million)
2009 2010 2011 2012 2013
VTTL 4,208 4,229 4,434 4,697 4,560
Liability on Household Consumption 3,016 3,177 3,351 3,664 3,529
Unrecoverable input liability on Intermediate
consumption, Government and NPISH 652 579 613 575 588
Unrecoverable input liability on GFCF of exempt
industries 459 422 399 397 384
Net Adjustments 80 51 70 61 59
VAT Revenues (Eurostat) 3,156 3,299 3,362 3,828 3,775
VAT Gap 1,052 930 1,072 869 785
VAT Gap as % of liability 25% 22% 24% 18% 17%
0%
5%
10%
15%
20%
25%
30%
0
500
1,000
1,500
2,000
2,500
3,000
3,500
4,000
4,500
5,000
2009 2010 2011 2012 2013
VTTL VAT Revenues (Eurostat)
VAT Gap VAT Gap as % of liability
Highlights for 2013
Bulgaria's VAT gap continued in a welcome downward trajectory already remarked in 2012. Despite registering an overall slight increase in real GDP, nominal final consumption declined in absolute terms, and this contributed to an almost 3 percent reduction in the VTTL. Revenues, on the other hand, were virtually unchanged after the substantial increase registered in 2012, and this allowed the gap to decline to 17 percent, a 1/3 improvement over the 2009 high.
No changes were introduced to the VAT system in 2013..

STUDY TO QUANTIFY AND ANALYSE THE VAT GAP IN THE EU MEMBER STATES
CASE Network Reports No. 124 28
Table 3.4 Czech Republic: VAT receipts, VTTL, composition of VTTL and Gap, 2009–2013 (EUR million)
2009 2010 2011 2012 2013
VTTL 12,636 13,991 14,122 14,883 15,070
Liability on Household Consumption 7,509 8,428 8,659 9,304 9,531
Unrecoverable input liability on Intermediate
consumption, Government and NPISH 3,246 3,692 3,809 3,869 3,954
Unrecoverable input liability on GFCF of exempt
industries 1,654 1,793 1,574 1,632 1,502
Net Adjustments 226 78 79 77 83
VAT Revenues (Eurostat) 9,784 10,420 11,246 11,377 11,694
VAT Gap 2,852 3,571 2,876 3,506 3,375
VAT Gap as % of liability 23% 26% 20% 24% 22%
0%
5%
10%
15%
20%
25%
30%
0
2,000
4,000
6,000
8,000
10,000
12,000
14,000
16,000
2009 2010 2011 2012 2013
VTTL VAT Revenues (Eurostat)
VAT Gap VAT Gap as % of liability
Highlights for 2013
The VAT Gap for the Czech Republic registered a small decline in 2013 compared to 2012, although at 22 percent it placed the country in the top tier in the EU-26 Member States. The VTTL rose by a robust 4.6 percent, outpacing nominal final consumption growth on account of an increase in both the Standard and the Reduced rates (from 20 to 21 percent, and 14 to 15 percent, respectively). Revenue collection growth was even more pronounced, thus resulting in the small decline in the gap.

Luca Barbone, Mikhail Bonch-Osmolovskiy, Grzegorz Poniatowski
CASE Network Reports No. 12429
Table 3.5 Denmark: VAT receipts, VTTL, composition of VTTL and Gap, 2009–2013 (EUR million)
2009 2010 2011 2012 2013
VTTL 24,390 25,107 25,916 26,563 26,850
Liability on Household Consumption 13,716 14,271 14,549 14,961 15,108
Unrecoverable input liability on Intermediate
consumption, Government and NPISH 6,861 7,117 7,310 7,620 7,745
Unrecoverable input liability on GFCF of exempt
industries 3,139 3,022 3,293 3,178 3,179
Net Adjustments 674 697 765 804 818
VAT Revenues (Eurostat) 22,499 23,040 23,682 24,296 24,360
VAT Gap 1,892 2,067 2,234 2,267 2,489
VAT Gap as % of liability 8% 8% 9% 9% 9%
2%
3%
4%
5%
6%
7%
8%
9%
10%
11%
12%
0
5,000
10,000
15,000
20,000
25,000
30,000
2009 2010 2011 2012 2013
VTTL VAT Revenues (Eurostat)
VAT Gap VAT Gap as % of liability
Highlights for 2013
The VAT Gap registered a small uptick in Denmark during 2013 compared to the previous year. The VAT liability (VTTL) rose by about 1.5 percent, reflecting the anemic growth of final consumption, while VAT collections stagnated, at 0.5 percent growth, resulting in a wider gap of about Euro 1.7 billion. As a ratio to total liability, the gap was unchanged at 9 percent.
No changes of significance were made to the VAT system during 2013.

STUDY TO QUANTIFY AND ANALYSE THE VAT GAP IN THE EU MEMBER STATES
CASE Network Reports No. 124 30
Table 3.6 Estonia: VAT receipts, VTTL, composition of VTTL and Gap, 2009–2013 (EUR million)
2009 2010 2011 2012 2013
VTTL 1,357 1,413 1,550 1,740 1,873
Liability on Household Consumption 925 989 1,067 1,163 1,257
Unrecoverable input liability on Intermediate
consumption, Government and NPISH 215 230 258 287 308
Unrecoverable input liability on GFCF of exempt
industries 208 186 214 280 299
Net Adjustments 8 8 11 10 10
VAT Revenues (Eurostat) 1,224 1,257 1,363 1,508 1,558
VAT Gap 133 156 187 232 315
VAT Gap as % of liability 10% 11% 12% 13% 17%
0%
2%
4%
6%
8%
10%
12%
14%
16%
18%
0
200
400
600
800
1,000
1,200
1,400
1,600
1,800
2,000
2009 2010 2011 2012 2013
VTTL VAT Revenues (Eurostat)
VAT Gap VAT Gap as % of liability
Highlights for 2013
The VAT gap for Estonia marked a noticeable increase in 2013 over 2012, as a result of the continuing erosion in collections relative to VTTL, which has led to the doubling of the Gap in Euro terms since 2009. Despite modest real GDP growth recorded for the year (1.6 percent), nominal final consumption rose instead by 8 percent, and overall VTTL by 7.6 percent. Revenue growth was a more modest 3.3 percent, hence the increase in the Gap to 17 percent.
No systemic changes were made to the VAT system in the course of the year.

Luca Barbone, Mikhail Bonch-Osmolovskiy, Grzegorz Poniatowski
CASE Network Reports No. 12431
Table 3.7 Finland: VAT receipts, VTTL, composition of VTTL and Gap, 2009–2013 (EUR million)
2009 2010 2011 2012 2013
VTTL 15,673 16,691 17,955 18,524 19,660
Liability on Household Consumption 8,961 9,243 9,859 10,265 10,953
Unrecoverable input liability on Intermediate
consumption, Government and NPISH 3,987 4,198 4,514 4,730 4,991
Unrecoverable input liability on GFCF of exempt
industries 2,251 2,729 3,037 3,063 3,175
Net Adjustments 474 521 545 466 542
VAT Revenues (Eurostat) 15,176 15,533 17,315 17,987 18,848
VAT Gap 497 1,158 640 537 812
VAT Gap as % of liability 3% 7% 4% 3% 4%
0%
1%
2%
3%
4%
5%
6%
7%
8%
0
5,000
10,000
15,000
20,000
25,000
2009 2010 2011 2012 2013
VTTL VAT Revenues (Eurostat)
VAT Gap VAT Gap as % of liability
Highlights for 2013
Finland continues to have one of the EU-26 Member States lowest VAT Gap, despite a slight increase in its value in 2013. During the year, the overall economy experienced a slight recession, and the growth of nominal final consumption was an anemic 1.5 percent.
A rate increase by 1 percentage point in both the Standard and the Reduced rates resulted in a VTTL surge of 6.2 percent, but revenue growth lagged, at 4.7 percent. Hence the increase in the overall VAR gap from 3 to 4 percent of liability.
STUDY TO QUANTIFY AND ANALYSE THE VAT GAP IN THE EU MEMBER STATES
CASE Network Reports No. 124 32
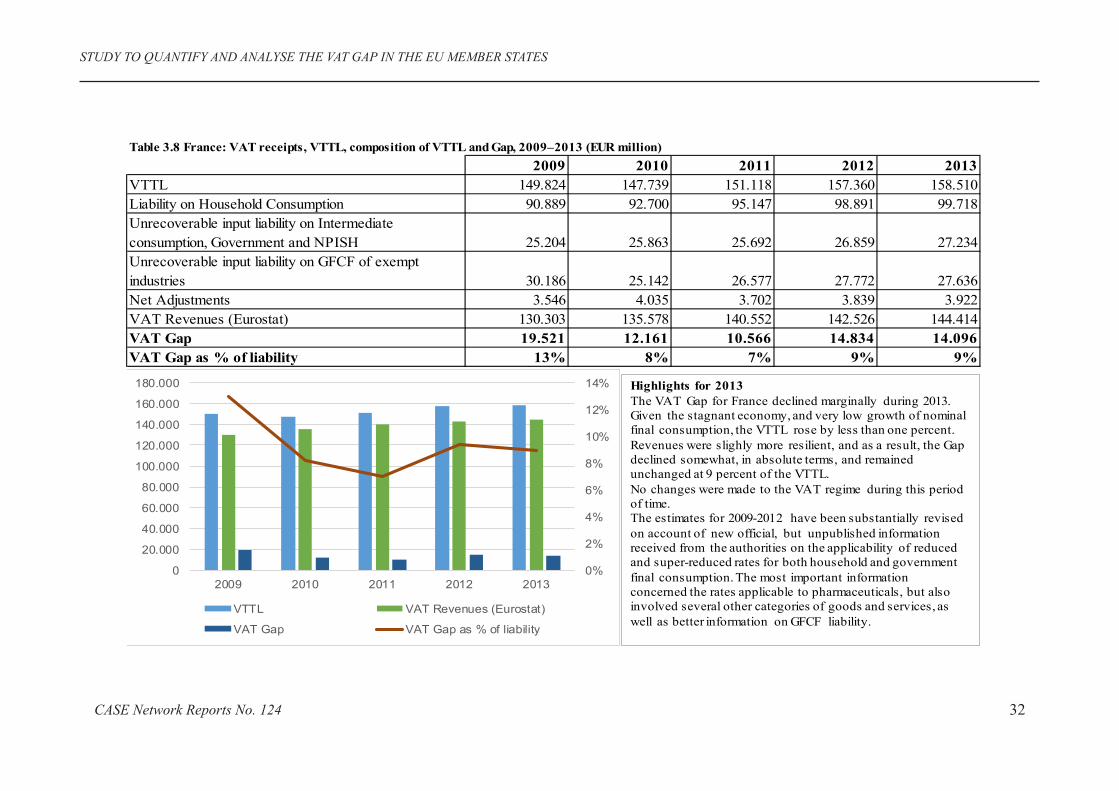
Table 3.8 France: VAT receipts, VTTL, composition of VTTL and Gap, 2009–2013 (EUR million)
2009 2010 2011 2012 2013
VTTL 149.824 147.739 151.118 157.360 158.510
Liability on Household Consumption 90.889 92.700 95.147 98.891 99.718
Unrecoverable input liability on Intermediate
consumption, Government and NPISH 25.204 25.863 25.692 26.859 27.234
Unrecoverable input liability on GFCF of exempt
industries 30.186 25.142 26.577 27.772 27.636
Net Adjustments 3.546 4.035 3.702 3.839 3.922
VAT Revenues (Eurostat) 130.303 135.578 140.552 142.526 144.414
VAT Gap 19.521 12.161 10.566 14.834 14.096
VAT Gap as % of liability 13% 8% 7% 9% 9%
0%
2%
4%
6%
8%
10%
12%
14%
0
20.000
40.000
60.000
80.000
100.000
120.000
140.000
160.000
180.000
2009 2010 2011 2012 2013
VTTL VAT Revenues (Eurostat)
VAT Gap VAT Gap as % of liability
Highlights for 2013
The VAT Gap for France declined marginally during 2013.
Given the stagnant economy, and very low growth of nominal
final consumption, the VTTL rose by less than one percent.
Revenues were slighly more resilient, and as a result, the Gap
declined somewhat, in absolute terms, and remained
unchanged at 9 percent of the VTTL.
No changes were made to the VAT regime during this period
of time.
The estimates for 2009-2012 have been substantially revised
on account of new official, but unpublished information
received from the authorities on the applicability of reduced
and super-reduced rates for both household and government
final consumption. The most important information
concerned the rates applicable to pharmaceuticals, but also
involved several other categories of goods and services, as
well as better information on GFCF liability.

Luca Barbone, Mikhail Bonch-Osmolovskiy, Grzegorz Poniatowski
CASE Network Reports No. 12433
Table 3.9 Germany: VAT receipts, VTTL, composition of VTTL and Gap, 2009–2013 (EUR million)
2009 2010 2011 2012 2013
VTTL 196,095 199,283 212,245 216,984 221,878
Liability on Household Consumption 124,984 124,549 132,667 135,841 139,315
Unrecoverable input liability on Intermediate
consumption, Government and NPISH 42,269 43,786 45,569 46,789 47,971
Unrecoverable input liability on GFCF of exempt
industries 27,413 29,400 32,277 32,602 32,830
Net Adjustments 1,429 1,548 1,731 1,752 1,763
VAT Revenues (Eurostat) 177,701 180,213 189,910 194,034 197,005
VAT Gap 18,394 19,070 22,335 22,950 24,873
VAT Gap as % of liability 9% 10% 11% 11% 11%
0%
2%
4%
6%
8%
10%
12%
0
50,000
100,000
150,000
200,000
250,000
2009 2010 2011 2012 2013
VTTL VAT Revenues (Eurostat)
VAT Gap VAT Gap as % of liability
Highlights for 2013
The VAT Gap for Germany for 2013, while increasing in absolute terms by almost Euro 2 billion, remained at the level of 11 percent of liability, as in 2012.
The underlying reasons for these developments are the slightly diverging behaviour of the VTTL and revenues. The former grew by some 2.6 percent, in line with final consumption nominal growth. The latter grew by a more restrained 1.5 percent, despite an overall modest GDP growth of 0.4 percent.
No changes to the VAT system were registered during the period.

STUDY TO QUANTIFY AND ANALYSE THE VAT GAP IN THE EU MEMBER STATES
CASE Network Reports No. 124 34
Table 3.10 Greece: VAT receipts, VTTL, composition of VTTL and Gap, 2009–2013 (EUR million)
2009 2010 2011 2012 2013
VTTL 22,453 22,885 24,181 20,595 19,090
Liability on Household Consumption 14,763 16,033 18,031 15,607 14,571
Unrecoverable input liability on Intermediate
consumption, Government and NPISH 2,570 2,379 2,113 1,868 1,761
Unrecoverable input liability on GFCF of exempt
industries 4,745 4,058 3,494 2,717 2,358
Net Adjustments 376 416 543 403 400
VAT Revenues (Eurostat) 14,876 15,958 15,021 13,712 12,593
VAT Gap 7,577 6,927 9,160 6,883 6,497
VAT Gap as % of liability 34% 30% 38% 33% 34%
0%
5%
10%
15%
20%
25%
30%
35%
40%
0
5,000
10,000
15,000
20,000
25,000
30,000
2009 2010 2011 2012 2013
VTTL VAT Revenues (Eurostat)
VAT Gap VAT Gap as % of liability
Highlights for 2013
The VAT Gap in Greece increased slightly during 2013, as a percent of VTTL. In an economic environment showing continuing albeit slowing decline, and with strong compression of final consumption, the VTTL declined by little more than 7 percent, but revenues took an even steeper fall, by over 8 percent, this leading to the increase in the percentage Gap to 34 percent.
Greece did not modify the VAT regime during 2013.

Luca Barbone, Mikhail Bonch-Osmolovskiy, Grzegorz Poniatowski
CASE Network Reports No. 12435
Table 3.11 Hungary: VAT receipts, VTTL, composition of VTTL and Gap, 2009–2013 (EUR million)
2009 2010 2011 2012 2013
VTTL 10,244 11,102 11,066 11,866 12,003
Liability on Household Consumption 6,834 7,468 7,676 8,180 8,127
Unrecoverable input liability on Intermediate
consumption, Government and NPISH 2,075 2,263 2,220 2,279 2,283
Unrecoverable input liability on GFCF of exempt
industries 1,278 1,292 1,074 1,269 1,410
Net Adjustments 57 78 97 235 183
VAT Revenues (Eurostat) 7,820 8,442 8,516 9,084 9,073
VAT Gap 2,424 2,660 2,550 2,879 2,930
VAT Gap as % of liability 24% 24% 23% 24% 24%
8%
13%
18%
23%
28%
33%
38%
0
2,000
4,000
6,000
8,000
10,000
12,000
14,000
2009 2010 2011 2012 2013
VTTL VAT Revenues (Eurostat)
VAT Gap VAT Gap as % of liability
Highlights for 2013
The VAT Gap in Hungary in 2013 was virtually unchanged from the 2012 value.
The VTTL rose by about 3 percent in Forint terms, along the lines of nominal final consumption, but was virtually unchanged in Euro terms. Revenue growth was similar, at 2.6 percent in forint and zero in Euro, hence the virtually unchanged VAT Gap, equivalent to 24 percent of VAT liability.
No changes were made to the VAT regime during the period under consideration.
STUDY TO QUANTIFY AND ANALYSE THE VAT GAP IN THE EU MEMBER STATES
CASE Network Reports No. 124 36
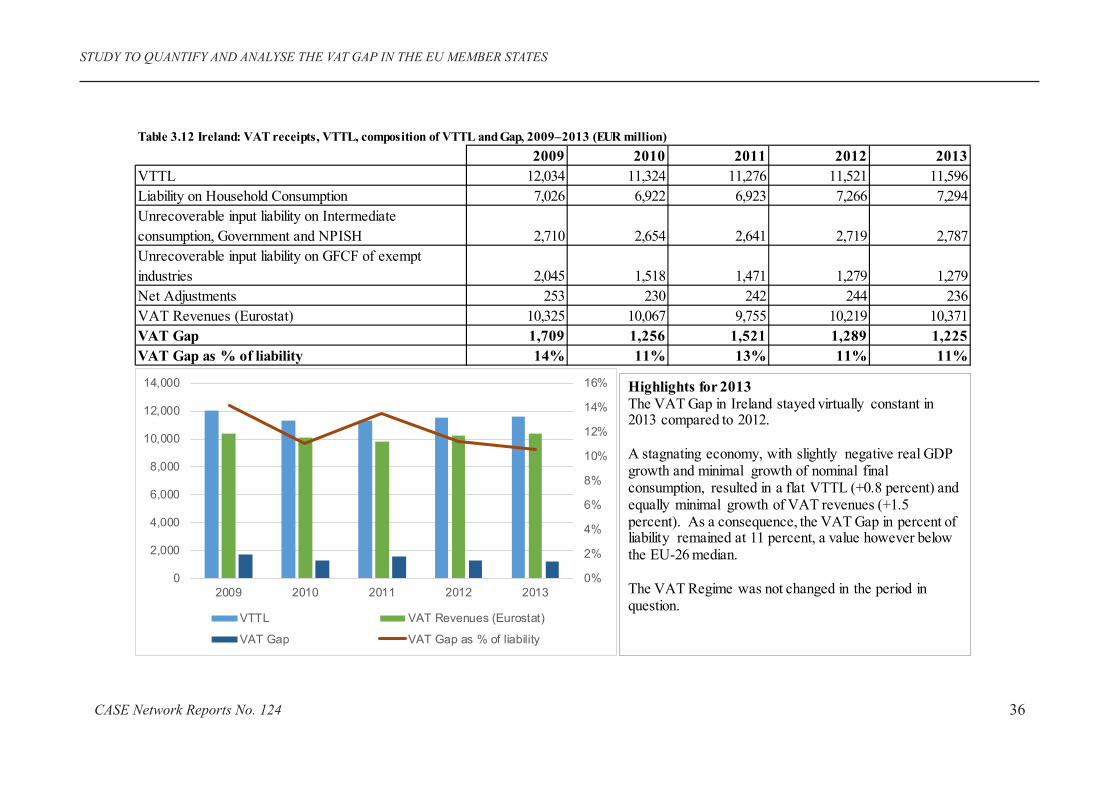
Table 3.12 Ireland: VAT receipts, VTTL, composition of VTTL and Gap, 2009–2013 (EUR million)
2009 2010 2011 2012 2013
VTTL 12,034 11,324 11,276 11,521 11,596
Liability on Household Consumption 7,026 6,922 6,923 7,266 7,294
Unrecoverable input liability on Intermediate
consumption, Government and NPISH 2,710 2,654 2,641 2,719 2,787
Unrecoverable input liability on GFCF of exempt
industries 2,045 1,518 1,471 1,279 1,279
Net Adjustments 253 230 242 244 236
VAT Revenues (Eurostat) 10,325 10,067 9,755 10,219 10,371
VAT Gap 1,709 1,256 1,521 1,289 1,225
VAT Gap as % of liability 14% 11% 13% 11% 11%
0%
2%
4%
6%
8%
10%
12%
14%
16%
0
2,000
4,000
6,000
8,000
10,000
12,000
14,000
2009 2010 2011 2012 2013
VTTL VAT Revenues (Eurostat)
VAT Gap VAT Gap as % of liability
Highlights for 2013
The VAT Gap in Ireland stayed virtually constant in 2013 compared to 2012.
A stagnating economy, with slightly negative real GDP growth and minimal growth of nominal final consumption, resulted in a flat VTTL (+0.8 percent) and equally minimal growth of VAT revenues (+1.5 percent). As a consequence, the VAT Gap in percent of liability remained at 11 percent, a value however below the EU-26 median.
The VAT Regime was not changed in the period in question.

Luca Barbone, Mikhail Bonch-Osmolovskiy, Grzegorz Poniatowski
CASE Network Reports No. 12437
Table 3.13 Italy: VAT receipts, VTTL, composition of VTTL and Gap, 2009–2013 (EUR million)
2009 2010 2011 2012 2013
VTTL 135,805 136,817 144,425 141,332 141,437
Liability on Household Consumption 93,213 95,191 101,338 100,141 99,750
Unrecoverable input liability on Intermediate consumption,
Government and NPISH 22,824 22,827 23,291 22,546 23,144
Unrecoverable input liability on GFCF of exempt industries 15,790 15,173 15,035 14,204 14,186
Net Adjustments 3,977 3,626 4,761 4,441 4,357
VAT Revenues (Eurostat) 86,544 97,586 98,650 96,170 93,921
VAT Gap 49,261 39,231 45,775 45,162 47,516
VAT Gap as % of liability 36% 29% 32% 32% 34%
Pro-Memoria: VAT Gap Including Net Refunds 42,993 40,137 46,673 43,338 43,902
Pro-Memoria: VAT Gap Including Net Refunds, % 32% 29% 32% 31% 31%
0%
5%
10%
15%
20%
25%
30%
35%
40%
0
20,000
40,000
60,000
80,000
100,000
120,000
140,000
160,000
2009 2010 2011 2012 2013
VTTL VAT Revenues (Eurostat)
VAT Gap VAT Gap as % of liability
Highlights for 2013
Italy's VAT Gap rose somewhat during 2013, and remains at
a very high level among the EU-26. As the country
experienced another year of recession, and growth of nominal
final consumption was also negative, the total VTTL rose
marginally on account of a VAT rate increase (see table 2.2).
Despite the rate increase, Eurostat revenues declined, thus
leading to an increase of the gap to 34 percent.
Adjusting Eurostat-reported revenues for the changes in
outstanding stocks of net reimbursement claims (to better
approximate accrued revenues, as discussed in Box 2.1)
yields a somewhat more stable picture. As taxpayers have
accelerated requests for reimbursements, that has impacted
revenue collection. Purging this element yelds a substantially
unchanged Gap at 31 percent.

STUDY TO QUANTIFY AND ANALYSE THE VAT GAP IN THE EU MEMBER STATES
CASE Network Reports No. 124 38
Table 3.14 Latvia: VAT receipts, VTTL, composition of VTTL and Gap, 2009–2013 (EUR million)
2009 2010 2011 2012 2013
VTTL 1,946 1,841 2,189 2,391 2,414
Liability on Household Consumption 1,355 1,342 1,581 1,726 1,772
Unrecoverable input liability on Intermediate
consumption, Government and NPISH 340 333 398 422 430
Unrecoverable input liability on GFCF of exempt
industries 235 151 196 223 192
Net Adjustments 16 16 14 20 20
VAT Revenues (Eurostat) 1,109 1,192 1,368 1,583 1,693
VAT Gap 837 649 821 808 721
VAT Gap as % of liability 43% 35% 37% 34% 30%
0%
5%
10%
15%
20%
25%
30%
35%
40%
45%
50%
0
500
1,000
1,500
2,000
2,500
3,000
2009 2010 2011 2012 2013
VTTL VAT Revenues (Eurostat)
VAT Gap VAT Gap as % of liability
Highlights for 2013
Latvia marked a considerable reduction in its (high) VAT Gap during 2013, in a context of generally good economic performances.
The VTTL rose only moderately (1 percent), despite robust growth in final consumption, on account of the full phasing in of the 2012 reduction in VAT rates. On the other hand, revenues saw another strong growth (+7.0 percent), hence the decline in the Gap to 30 percent.
The VAT regime was not substantially modified during the period under consideration.

Luca Barbone, Mikhail Bonch-Osmolovskiy, Grzegorz Poniatowski
CASE Network Reports No. 12439
Table 3.15 Lithuania: VAT receipts, VTTL, composition of VTTL and Gap, 2009–2013 (EUR million)
2009 2010 2011 2012 2013
VTTL 3,480 3,539 3,848 3,985 4,192
Liability on Household Consumption 2,696 2,779 3,045 3,219 3,436
Unrecoverable input liability on Intermediate
consumption, Government and NPISH 418 442 419 407 392
Unrecoverable input liability on GFCF of exempt
industries 366 307 368 331 347
Net Adjustments -1 10 16 14 18
VAT Revenues (Eurostat) 1,961 2,180 2,444 2,521 2,611
VAT Gap 1,519 1,358 1,404 1,450 1,580
VAT Gap as % of liability 44% 38% 36% 37% 38%
32%
34%
36%
38%
40%
42%
44%
46%
0
500
1,000
1,500
2,000
2,500
3,000
3,500
4,000
4,500
2009 2010 2011 2012 2013
VTTL VAT Revenues (Eurostat)
VAT Gap VAT Gap as % of liability
Highlights for 2013
Lithuania's VAT Gap in 2013 remained one of the highest in the EU-26 Member Countries surveyed in this report.
The estimated VTTLgrew by 5.6 percent, in line with the nominal growth in final consumption. Revenue growth, despite a robust overall real GDP increase, was more moderate at 3.6 percent. As a result, the VAT Gap rose to 38 percent.
No changes were made to the VAT regime during the period under consideration.

STUDY TO QUANTIFY AND ANALYSE THE VAT GAP IN THE EU MEMBER STATES
CASE Network Reports No. 124 40
Table 3.16 Luxembourg: VAT receipts, VTTL, composition of VTTL and Gap, 2009–2013 (EUR million)
2009 2010 2011 2012 2013
VTTL 2,525 2,635 2,939 3,270 3,672
Liability on Household Consumption 958 1,010 1,094 1,127 1,166
Unrecoverable input liability on Intermediate
consumption, Government and NPISH 544 548 586 615 657
Unrecoverable input liability on GFCF of exempt
industries 282 283 291 298 288
Net Adjustments 741 794 968 1,228 1,561
VAT Revenues (Eurostat) 2,457 2,562 2,824 3,093 3,485
VAT Gap 68 73 115 176 187
VAT Gap as % of liability 3% 3% 4% 5% 5%
0%
1%
2%
3%
4%
5%
6%
0
500
1,000
1,500
2,000
2,500
3,000
3,500
4,000
2009 2010 2011 2012 2013
VTTL VAT Revenues (Eurostat)
VAT Gap VAT Gap as % of liability
Highlights for 2013
The VAT Gap for Luxembourg held constant at 5 percent of liability in 2013. Whereas domestic sources of liability reflected the limited recovery in the pace of economic activity, the growth of VTTL was dominated, as in previous years, by other sources of income, including e-commerce, petrol trade and other items, which rose by an estimated 27 percent, continuing a trend observed in the recent past. With revenues consequently showing a strong performance (+12.6 percent), the overall gap remained constant at 5 percent of VTTL.
No changes to the VAT regime were registered during the year.
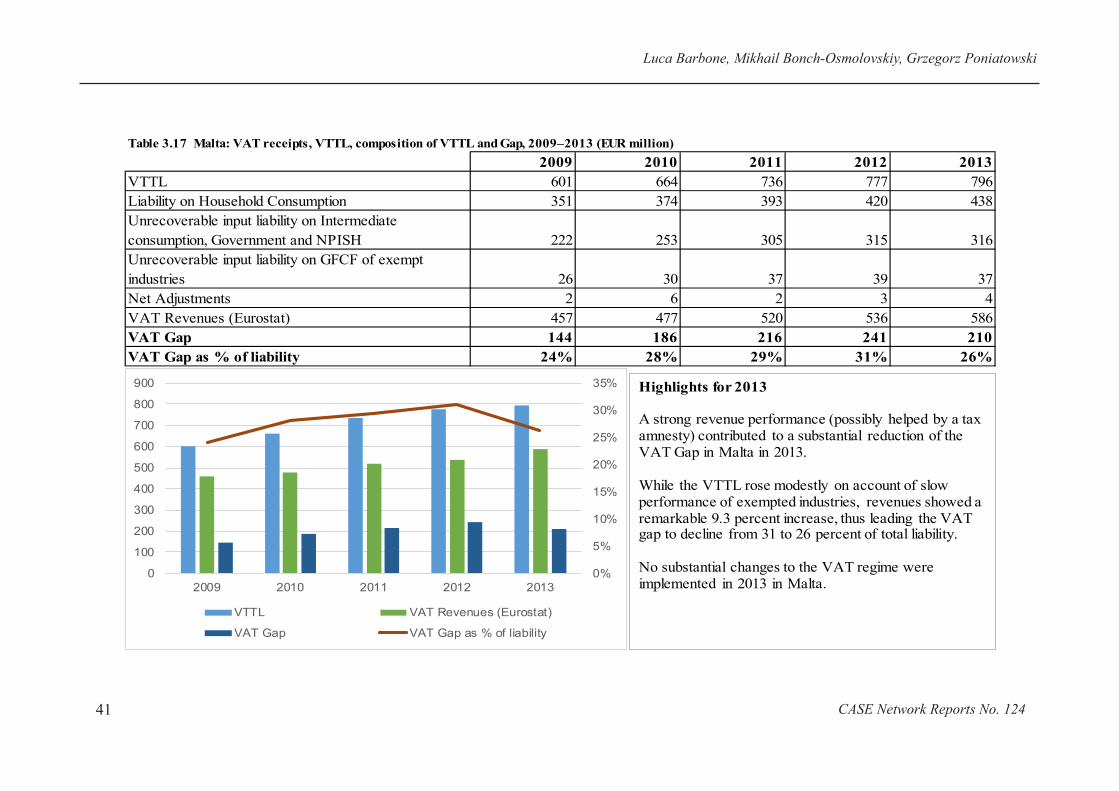
Luca Barbone, Mikhail Bonch-Osmolovskiy, Grzegorz Poniatowski
CASE Network Reports No. 12441
Table 3.17 Malta: VAT receipts, VTTL, composition of VTTL and Gap, 2009–2013 (EUR million)
2009 2010 2011 2012 2013
VTTL 601 664 736 777 796
Liability on Household Consumption 351 374 393 420 438
Unrecoverable input liability on Intermediate
consumption, Government and NPISH 222 253 305 315 316
Unrecoverable input liability on GFCF of exempt
industries 26 30 37 39 37
Net Adjustments 2 6 2 3 4
VAT Revenues (Eurostat) 457 477 520 536 586
VAT Gap 144 186 216 241 210
VAT Gap as % of liability 24% 28% 29% 31% 26%
0%
5%
10%
15%
20%
25%
30%
35%
0
100
200
300
400
500
600
700
800
900
2009 2010 2011 2012 2013
VTTL VAT Revenues (Eurostat)
VAT Gap VAT Gap as % of liability
Highlights for 2013
A strong revenue performance (possibly helped by a tax amnesty) contributed to a substantial reduction of the VAT Gap in Malta in 2013.
While the VTTL rose modestly on account of slow performance of exempted industries, revenues showed a remarkable 9.3 percent increase, thus leading the VAT gap to decline from 31 to 26 percent of total liability.
No substantial changes to the VAT regime were implemented in 2013 in Malta.

STUDY TO QUANTIFY AND ANALYSE THE VAT GAP IN THE EU MEMBER STATES
CASE Network Reports No. 124 42
Table 3.18 Netherlands: VAT receipts, VTTL, composition of VTTL and Gap, 2009–2013 (EUR million)
2009 2010 2011 2012 2013
VTTL 43,504 42,855 43,359 43,598 44,276
Liability on Household Consumption 22,398 22,769 23,122 23,719 24,793
Unrecoverable input liability on Intermediate
consumption, Government and NPISH 11,156 11,020 10,805 11,217 11,284
Unrecoverable input liability on GFCF of exempt
industries 9,312 8,400 8,750 7,992 7,502
Net Adjustments 637 666 683 671 696
VAT Revenues (Eurostat) 40,086 42,654 41,610 41,699 42,424
VAT Gap 3,418 201 1,749 1,899 1,852
VAT Gap as % of liability 8% 0% 4% 4% 4%
0%
1%
2%
3%
4%
5%
6%
7%
8%
9%
0
5,000
10,000
15,000
20,000
25,000
30,000
35,000
40,000
45,000
50,000
2009 2010 2011 2012 2013
VTTL VAT Revenues (Eurostat)
VAT Gap VAT Gap as % of liability
Highlights for 2013
The Netherlands recorded one of the lowest VAT Gap in the EU-26 Member States in 2013.
The estimated VTTL rose slightly (1.5 percent), on account of the carryover from the 2012 increase in the VAT rates. Despite GDP contracting for the second year in a row, the authorities were able to increase VAT collections by 1.7 percent. As a result, the estimated VAT Gap fell marginally in absolute terms, and stayed at 4 percent of VTTL.
No other changes to the VAT regime were instrumented in 2013.

Luca Barbone, Mikhail Bonch-Osmolovskiy, Grzegorz Poniatowski
CASE Network Reports No. 12443
Table 3.19 Poland: VAT receipts, VTTL, composition of VTTL and Gap, 2009–2013 (EUR million)
2009 2010 2011 2012 2013
VTTL 29,094 33,517 36,602 37,175 37,911
Liability on Household Consumption 19,139 21,881 24,014 25,015 25,764
Unrecoverable input liability on Intermediate
consumption, Government and NPISH 5,729 6,667 7,026 7,049 7,369
Unrecoverable input liability on GFCF of exempt
industries 3,612 4,242 4,585 4,098 3,771
Net Adjustments 614 726 977 1,013 1,007
VAT Revenues (Eurostat) 23,056 27,466 29,764 27,783 27,780
VAT Gap 6,038 6,051 6,837 9,391 10,131
VAT Gap as % of liability 21% 18% 19% 25% 27%
0%
5%
10%
15%
20%
25%
30%
0
5,000
10,000
15,000
20,000
25,000
30,000
35,000
40,000
2009 2010 2011 2012 2013
VTTL VAT Revenues (Eurostat)
VAT Gap VAT Gap as % of liability
Highlights for 2013
Poland has continued to struggle with its capacity to collect VAT at a pace compatible with the pace of economic growth.
With real GDP and nominal final consumption registering modest increments (1.6 and 2 percent, respectively), the VTTL rose by 2 percent, but collections declined slightly in Euro terms.
As a result, the VAT Gap rose by 2 percentage points to 27%, placing Poland in the upper quintile of the EU-26 Member States by this performance.
No changes were made to the VAT Regime in 2013.

STUDY TO QUANTIFY AND ANALYSE THE VAT GAP IN THE EU MEMBER STATES
CASE Network Reports No. 124 44
Table 3.20 Portugal: VAT receipts, VTTL, composition of VTTL and Gap, 2009–2013 (EUR million)
2009 2010 2011 2012 2013
VTTL 13,993 15,392 16,359 15,330 15,068
Liability on Household Consumption 9,499 10,404 11,169 10,738 10,583
Unrecoverable input liability on Intermediate
consumption, Government and NPISH 2,893 3,094 3,173 3,040 3,063
Unrecoverable input liability on GFCF of exempt
industries 1,293 1,485 1,653 1,190 1,085
Net Adjustments 308 409 363 361 337
VAT Revenues (Eurostat) 11,971 13,527 14,265 13,995 13,710
VAT Gap 2,022 1,865 2,094 1,335 1,358
VAT Gap as % of liability 14% 12% 13% 9% 9%
0%
2%
4%
6%
8%
10%
12%
14%
16%
0
2,000
4,000
6,000
8,000
10,000
12,000
14,000
16,000
18,000
2009 2010 2011 2012 2013
VTTL VAT Revenues (Eurostat)
VAT Gap VAT Gap as % of liability
Highlights for 2013
The VAT Gap for Portugal was virtually unchanged between 2012 and 2013.
As the economy continued in a recession, and nominal final consumption growth was negative, the VTTL declined by some 1.7 percent.
Revenues also declined by some 2 percent, and as a result the overall Gap increased marginally in absolute terms, but remained at the level of 9 percent as in 2012.
No changes were made to the VAT system during the year.
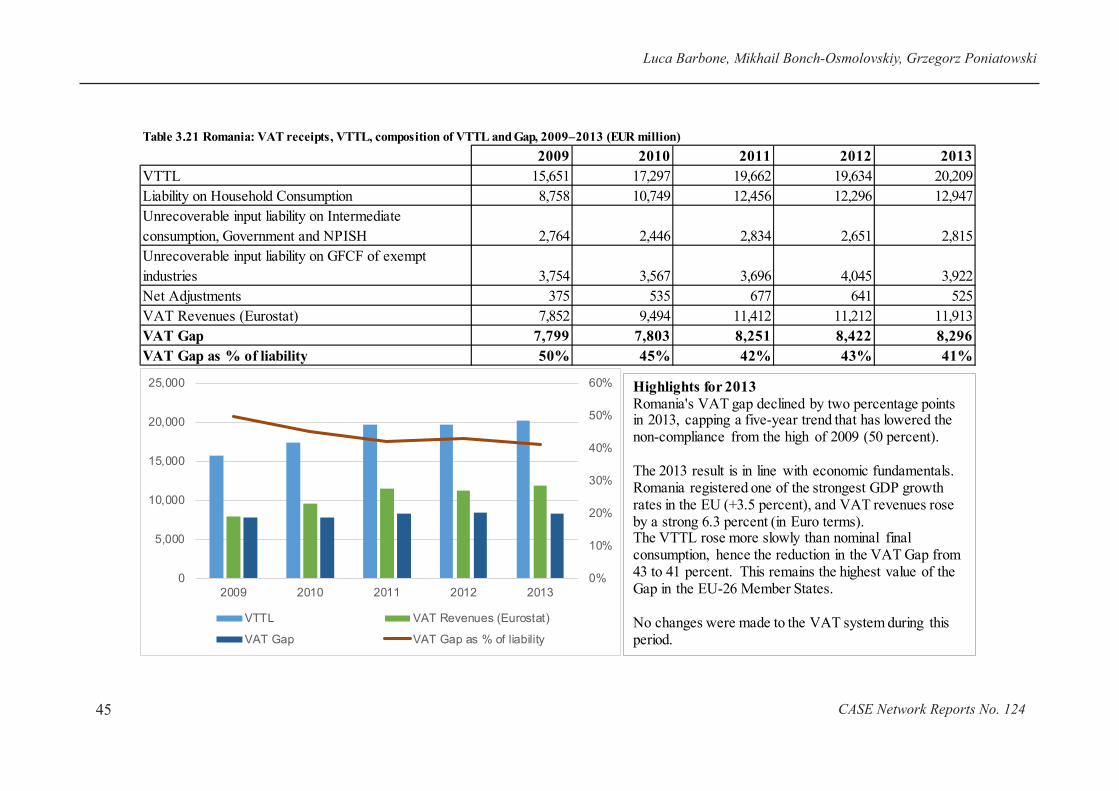
Luca Barbone, Mikhail Bonch-Osmolovskiy, Grzegorz Poniatowski
CASE Network Reports No. 12445
Table 3.21 Romania: VAT receipts, VTTL, composition of VTTL and Gap, 2009–2013 (EUR million)
2009 2010 2011 2012 2013
VTTL 15,651 17,297 19,662 19,634 20,209
Liability on Household Consumption 8,758 10,749 12,456 12,296 12,947
Unrecoverable input liability on Intermediate
consumption, Government and NPISH 2,764 2,446 2,834 2,651 2,815
Unrecoverable input liability on GFCF of exempt
industries 3,754 3,567 3,696 4,045 3,922
Net Adjustments 375 535 677 641 525
VAT Revenues (Eurostat) 7,852 9,494 11,412 11,212 11,913
VAT Gap 7,799 7,803 8,251 8,422 8,296
VAT Gap as % of liability 50% 45% 42% 43% 41%
0%
10%
20%
30%
40%
50%
60%
0
5,000
10,000
15,000
20,000
25,000
2009 2010 2011 2012 2013
VTTL VAT Revenues (Eurostat)
VAT Gap VAT Gap as % of liability
Highlights for 2013
Romania's VAT gap declined by two percentage points in 2013, capping a five-year trend that has lowered the non-compliance from the high of 2009 (50 percent).
The 2013 result is in line with economic fundamentals. Romania registered one of the strongest GDP growth rates in the EU (+3.5 percent), and VAT revenues rose by a strong 6.3 percent (in Euro terms). The VTTL rose more slowly than nominal final consumption, hence the reduction in the VAT Gap from 43 to 41 percent. This remains the highest value of the Gap in the EU-26 Member States.
No changes were made to the VAT system during this period.

STUDY TO QUANTIFY AND ANALYSE THE VAT GAP IN THE EU MEMBER STATES
CASE Network Reports No. 124 46
Table 3.22 Slovakia: VAT receipts, VTTL, composition of VTTL and Gap, 2009–2013 (EUR million)
2009 2010 2011 2012 2013
VTTL 6,438 6,516 6,844 6,963 7,209
Liability on Household Consumption 4,606 4,756 5,070 5,243 5,385
Unrecoverable input liability on Intermediate
consumption, Government and NPISH 1,133 1,104 1,162 1,181 1,205
Unrecoverable input liability on GFCF of exempt
industries 703 670 607 628 620
Net Adjustments -4 -14 5 2 -2
VAT Revenues (Eurostat) 4,221 4,182 4,711 4,328 4,696
VAT Gap 2,217 2,334 2,133 2,726 2,513
VAT Gap as % of liability 34% 36% 31% 39% 35%
0%
5%
10%
15%
20%
25%
30%
35%
40%
45%
0
1,000
2,000
3,000
4,000
5,000
6,000
7,000
8,000
2009 2010 2011 2012 2013
VTTL VAT Revenues (Eurostat)
VAT Gap VAT Gap as % of liability
Highlights for 2013
The VAT Gap in Slovakia in 2013 saw an important reduction from the extremely high value reached in 2012. Overall economic conditions were not particularly strong, with GDP growth positive but cut in half, and a very slow growth of nominal final consumption.
The VTTL rose by 2.2 percent, while revenues had a considerably more robust performance, at 8.5 percent growth. As a result, the VAT Gap declined by 4 percentage points, but, at 35%, it places Slovakia in the top tier of Member States in the EU-26 by this indicator.
No major changes to the VAT regime were registered during this period.

Luca Barbone, Mikhail Bonch-Osmolovskiy, Grzegorz Poniatowski
CASE Network Reports No. 12447
Table 3.23 Slovenia: VAT receipts, VTTL, composition of VTTL and Gap, 2009–2013 (EUR million)
2009 2010 2011 2012 2013
VTTL 3,272 3,282 3,279 3,174 3,232
Liability on Household Consumption 2,176 2,257 2,309 2,243 2,280
Unrecoverable input liability on Intermediate
consumption, Government and NPISH 527 542 533 520 520
Unrecoverable input liability on GFCF of exempt
industries 453 376 322 309 328
Net Adjustments 116 107 115 108 103
VAT Revenues (Eurostat) 2,851 2,926 2,996 2,889 3,045
VAT Gap 421 356 283 291 186
VAT Gap as % of liability 13% 11% 9% 9% 6%
0%
2%
4%
6%
8%
10%
12%
14%
0
500
1,000
1,500
2,000
2,500
3,000
3,500
2009 2010 2011 2012 2013
VTTL VAT Revenues (Eurostat)
VAT Gap VAT Gap as % of liability
Highlights for 2013
Thanks to a good revenue performance, Slovenia was able to reduce its VAT Gap by one-third over the course of 2013. VAT revenues rose by 5.4 percent, thanks in large part to the increase by one percentage point in the Standard and Reduced rates, and despite the fact that the economy saw a contraction for the second year in a row.
A greater efficiency of collection is shown by the fact that the VTTL rose by less than 1 percent, thus leading to the substantial reduction in the Gap (from 9 to 6 percent). This favorable trend has reduced the Gap by over half since 2009.

STUDY TO QUANTIFY AND ANALYSE THE VAT GAP IN THE EU MEMBER STATES
CASE Network Reports No. 124 48
Table 3.24 Spain: VAT receipts, VTTL, composition of VTTL and Gap, 2009–2013 (EUR million)
2009 2010 2011 2012 2013
VTTL 63,214 65,796 67,677 68,262 73,444
Liability on Household Consumption 41,533 44,472 47,244 49,751 54,937
Unrecoverable input liability on Intermediate consumption,
Government and NPISH 12,233 11,768 12,037 12,404 13,444
Unrecoverable input liability on GFCF of exempt industries 8,493 8,596 7,425 5,127 4,061
Net Adjustments 955 959 971 979 1,003
VAT Revenues (Eurostat) 41,045 57,649 55,904 56,652 61,350
VAT Gap 22,169 8,147 11,773 11,610 12,094
VAT Gap as % of liability 35% 12% 17% 17% 16%
Pro-Memoria: VAT Gap Including Net Refunds 8,858 7,674 10,715 10,574 10,742
Pro-Memoria: VAT Gap Including Net Refunds, % 14% 12% 16% 15.5% 14.6%
0%
5%
10%
15%
20%
25%
30%
35%
40%
0
10,000
20,000
30,000
40,000
50,000
60,000
70,000
80,000
2009 2010 2011 2012 2013
VTTL VAT Revenues (Eurostat)
VAT Gap VAT Gap as % of liability
Highlights for 2013
The VAT Gap in Spain decreased during 2013 on the basis of
revenue data reported to Eurostat. With the economy in a
continuing recession, and growth of nominal final
consumption also negative, the VTTL grew strongly (+7.6
percent) on account of full effect of the VAT rate increase
introduced in late 2012. Revenues rose somewhat more (8.3
percent), thus leading to a decrease in the Gap to 16 percent.
Adjusting revenues for the continuing reduction in the stock
of claims for refunds that has been ongoing since 2009, in
order to better approximate accrued revenues (see Box 2.1),
the picture is essentially similar, with a very slight reduction
in the Gap (which also has a lower level), from 15.5 to 14.6
percent.
These estimates correct the VTTL for the difference between
national accounting and tax conventions in the construction
sector (Box 2.1).

Luca Barbone, Mikhail Bonch-Osmolovskiy, Grzegorz Poniatowski
CASE Network Reports No. 12449
Table 3.25 Sweden: VAT receipts, VTTL, composition of VTTL and Gap, 2009–2013 (EUR million)
2009 2010 2011 2012 2013
VTTL 29,188 34,908 38,123 39,762 40,867
Liability on Household Consumption 15,806 18,823 20,343 21,098 21,803
Unrecoverable input liability on Intermediate
consumption, Government and NPISH 8,573 10,101 10,936 11,571 11,994
Unrecoverable input liability on GFCF of exempt
industries 4,230 5,297 6,055 6,489 6,442
Net Adjustments 578 687 790 603 628
VAT Revenues (Eurostat) 28,199 33,825 36,631 37,834 39,091
VAT Gap 989 1,082 1,492 1,928 1,776
VAT Gap as % of liability 3% 3% 4% 5% 4%
0%
1%
2%
3%
4%
5%
6%
0
5,000
10,000
15,000
20,000
25,000
30,000
35,000
40,000
45,000
2009 2010 2011 2012 2013
VTTL VAT Revenues (Eurostat)
VAT Gap VAT Gap as % of liability
Highlights for 2013
The VAT Gap in Sweden declined in the course of 2013, to one of the lowest levels of the EU-26 countries.
With the economy experiencing a mild recovery, and nominal final consumption growing by some 2.2 percent, the VTTL rose by some 2 percent, and VAT revenues registered even stronger growth (2.7 percent), thus leading to a decline in the Gap in absolute and relative terms, to 4 percent of liability.
No changes were made to the VAT regime during 2013.

STUDY TO QUANTIFY AND ANALYSE THE VAT GAP IN THE EU MEMBER STATES
CASE Network Reports No. 124 50
Table 3.26 United Kingdom: VAT receipts, VTTL, composition of VTTL and Gap, 2009–2013 (EUR million)
2009 2010 2011 2012 2013
VTTL 105,393 128,822 145,410 159,695 157,099
Liability on Household Consumption 66,953 82,615 94,035 103,683 103,776
Unrecoverable input liability on Intermediate
consumption, Government and NPISH 28,532 35,434 39,464 42,053 40,034
Unrecoverable input liability on GFCF of exempt
industries 8,499 9,475 9,884 10,901 10,497
Net Adjustments 1,408 1,298 2,027 3,058 2,791
VAT Revenues (Eurostat) 91,229 113,687 130,679 142,943 141,668
VAT Gap 14,163 15,135 14,731 16,752 15,431
VAT Gap as % of liability 13% 12% 10% 10% 10%
0%
2%
4%
6%
8%
10%
12%
14%
16%
0
20,000
40,000
60,000
80,000
100,000
120,000
140,000
160,000
180,000
2009 2010 2011 2012 2013
VTTL VAT Revenues (Eurostat)
VAT Gap VAT Gap as % of liability
Highlights for 2013
The VAT Gap in the United Kingdom remained stable as a percentage of VTTL during 2013.
With nominal final consumption growing by a healthy 3.6 percent (and overall real GDP growth at 1.7 percent) the VTTL (in pound terms) rose by 3 percent. Revenue growth was also buoyant at 3.8 percent, leading to a reduction of the gap in pound terms, and stability in percentage terms at 10 percent.
The VAT regime was not substantially changed during 2013.

51
Luca Barbone, Mikhail Bonch-Osmolovskiy, Grzegorz Poniatowski
CASE Network Reports No. 124
Appendix A – Derivation of Policy Gaps
In this appendix, we deine the concepts used in Section 2.2 (Policy Gaps), and discuss some of the methodological choices made.
VRR, Notional Ideal Revenue and Policy Gap
We start from the deinition of the VAT Revenue Ratio (VRR), as in OECD 2014: VRR = (Actual Revenue) / (Notional Ideal Revenue)
where the Notional Ideal Revenue is deined as the standard rate of VAT times the aggregate net consumption
of the household, non-proit, and government sectors, as recorded in the national accounts.
This is shown in the following identity:
VRR = [(Actual Revenues)/VTTL]*(VTTL/Notional Ideal Revenue)
= [1-VAT Gap]*[1-Policy Gap]
where
Policy Gap = (Notional Ideal Revenue – VTTL)/Notional Ideal Revenue.
Here the Policy Gap is deined as one minus the ratio of the “legal” tax liability (the VTTL) to an ideal tax liability without reduced rates or exemptions. The Policy Gap can then be obtained
with the following formula:
Policy Gap = [(1-VRR) – VAT Gap]/[1 – VAT Gap].
Figure A.1. Policy Gap, VAT Collections and VAT Gap
52
STUDY TO QUANTIFY AND ANALYSE THE VAT GAP IN THE EU MEMBER STATES
CASE Network Reports No. 124
Crucial for the calculation of the VRR is the notion of “ideal base”. National accounts for most
countries report inal consumption on a gross (i.e., VAT-inclusive) basis. Of the EU-26, only Lithuania reports pre-VAT values for the use tables. For the other countries, net consumption is estimated
on the basis of gross consumption recorded in the use tables, from which VAT revenues (minus the share
of VTTL resulting from GFCF liability of exempt sectors) are subtracted.
The interdependence among the various concepts presented is shown in Figure A.1.
Exemption Gaps and Rate Gaps
In this section we supplement the deinition of Policy Gap by deining and discussing its two components, the Rate Gap and the Exemption Gap, which capture the loss in VAT liability due
to the application of reduced rates, and the loss in liability due to the implementation of exemptions.
The Rate Gap is deined as the difference between the VTTL and what would obtain in a counterfactual situation, in which the standard rate, instead of the reduced, parking, and zero rates, is applied to inal consumption. Thus, the Rate Gap captures the loss in revenue that the legislator in a particular country
incurs into by adopting multiple VAT rates instead of a single standard rate.
The Exemption gap is deined as the difference between the VTTL and what would obtain in a counterfactual situation, in which the standard rate is applied to exempt products and services,
and these goods and services are given the right to deduct VAT on inputs.7 Thus, the Exemption Gap
captures the amount of revenue that might be lost on account of exempted goods and services. Note that
the Exemption Gap is composed of the loss in the VAT on value added of exempt sectors, minus the VAT
on their inputs, minus the VAT on GFCF inputs for these sectors. Thus, in principle, the Exemption Gap
might be positive or negative (if the particular sector had negative value added, or if it had large GFCF
expenditures relative to inal consumption).
In algebraic terms, we have the following:
Deinitions: – effective rate for group i of products in case standard rate instead of zero rate, parking rate
and reduced rates is applied (for inal consumption), – liability from inal consumption of group i of products in case standard rate instead of zero rate,
parking rate and reduced rates is applied, actual liability from intermediate consumption, gfcf and net
adjustments,
– effective rate for group i of products in case exempt products within the group are taxed
at standard rate,
7 The additive decomposition of the Policy gap into the Exemption and Rate gap presented in this report differs from that in Keen (2013). Keen (2013) deines the Rate gap as the loss from applying reduced and zero rates to the inal consumption liability, measured as a percentage of the Notional Ideal Revenue. The Exemption gap measures unrecovered VAT accumulated in the production process as a percentage, on the contrary, of inal consumption liability. Due to these deinitions, the Policy gap can be split multiplicatively into gaps attributable to reduced rates and exemptions. Since the numerator of the “[1 - Rate gap]” and denominator of the “[1 - Exemption gap]” are equal, multiplication of these two components yields – VAT revenue as a percentage Notional Ideal Revenue, which equals “[1 - Policy gap]”.

53
Luca Barbone, Mikhail Bonch-Osmolovskiy, Grzegorz Poniatowski
CASE Network Reports No. 124
– liability from inal consumption of group i when exempt products within the group are taxed at standard rate.
Policy gap:
Exemption gap:
Rate gap:
By deinition we have:
Thus:

54
STUDY TO QUANTIFY AND ANALYSE THE VAT GAP IN THE EU MEMBER STATES
CASE Network Reports No. 124
Appendix B - Statistical Appendix
Table B.1. VTTL (Euro millions)
2009 2010 2011 2012 2013
Austria 24,447 25,681 26,838 27,629 28,170
Belgium 27,150 28,473 29,255 30,272 30,412
Bulgaria 4,208 4,229 4,434 4,697 4,560
Czech Republic 12,636 13,991 14,122 14,883 15,070
Denmark 24,390 25,107 25,916 26,563 26,850
Estonia 1,357 1,413 1,550 1,740 1,873
Finland 15,673 16,691 17,955 18,524 19,660
France 149,824 147,739 151,118 157,360 158,510
Germany 196,095 199,283 212,245 216,984 221,878
Greece 22,453 22,885 24,181 20,595 19,090
Hungary 10,244 11,102 11,066 11,963 12,003
Ireland 12,034 11,324 11,276 11,508 11,596
Italy 135,805 136,817 144,425 141,332 141,437
Latvia 1,946 1,841 2,189 2,391 2,414
Lithuania 3,480 3,539 3,848 3,971 4,192
Luxembourg 2,525 2,635 2,939 3,269 3,672
Malta 601 664 736 777 796
Netherlands 43,504 42,855 43,359 43,598 44,276
Poland 29,094 33,517 36,602 37,175 37,911
Portugal 13,993 15,392 16,359 15,330 15,068
Romania 15,651 17,297 19,662 19,634 20,209
Slovakia 6,438 6,516 6,844 7,054 7,209
Slovenia 3,272 3,282 3,279 3,180 3,232
Spain 63,214 65,796 67,677 68,262 73,444
Sweden 29,188 34,908 38,123 39,762 40,867
United Kingdom 105,393 128,822 145,410 159,695 157,099
EU-26 954,614 1,001,797 1,061,409 1,088,147 1,101,498
Source: Own Calculations.
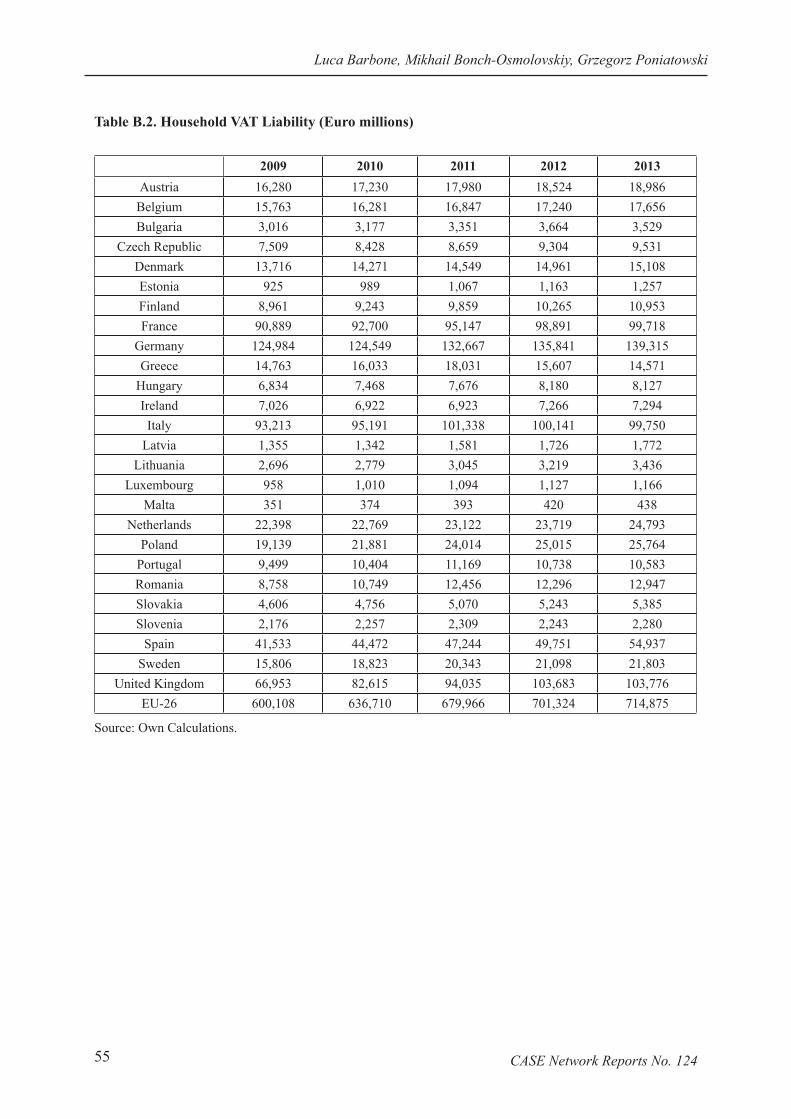
55
Luca Barbone, Mikhail Bonch-Osmolovskiy, Grzegorz Poniatowski
CASE Network Reports No. 124
Table B.2. Household VAT Liability (Euro millions)
2009 2010 2011 2012 2013
Austria 16,280 17,230 17,980 18,524 18,986
Belgium 15,763 16,281 16,847 17,240 17,656
Bulgaria 3,016 3,177 3,351 3,664 3,529
Czech Republic 7,509 8,428 8,659 9,304 9,531
Denmark 13,716 14,271 14,549 14,961 15,108
Estonia 925 989 1,067 1,163 1,257
Finland 8,961 9,243 9,859 10,265 10,953
France 90,889 92,700 95,147 98,891 99,718
Germany 124,984 124,549 132,667 135,841 139,315
Greece 14,763 16,033 18,031 15,607 14,571
Hungary 6,834 7,468 7,676 8,180 8,127
Ireland 7,026 6,922 6,923 7,266 7,294
Italy 93,213 95,191 101,338 100,141 99,750
Latvia 1,355 1,342 1,581 1,726 1,772
Lithuania 2,696 2,779 3,045 3,219 3,436
Luxembourg 958 1,010 1,094 1,127 1,166
Malta 351 374 393 420 438
Netherlands 22,398 22,769 23,122 23,719 24,793
Poland 19,139 21,881 24,014 25,015 25,764
Portugal 9,499 10,404 11,169 10,738 10,583
Romania 8,758 10,749 12,456 12,296 12,947
Slovakia 4,606 4,756 5,070 5,243 5,385
Slovenia 2,176 2,257 2,309 2,243 2,280
Spain 41,533 44,472 47,244 49,751 54,937
Sweden 15,806 18,823 20,343 21,098 21,803
United Kingdom 66,953 82,615 94,035 103,683 103,776
EU-26 600,108 636,710 679,966 701,324 714,875
Source: Own Calculations.
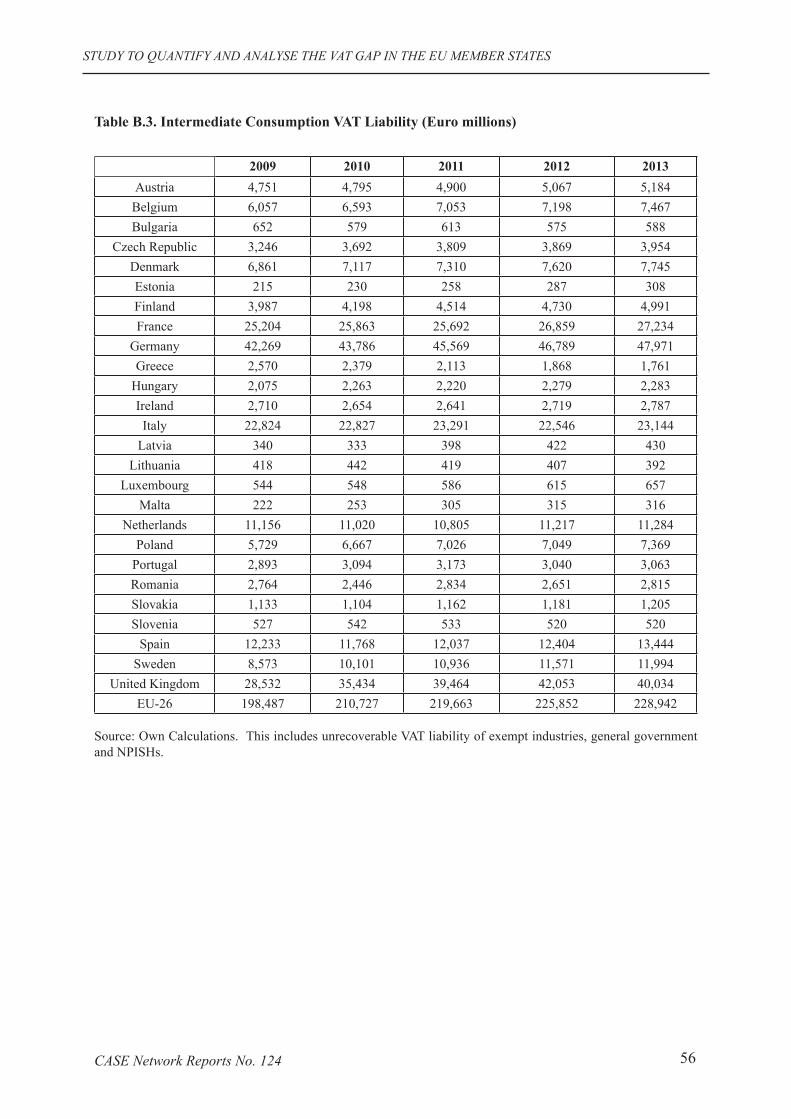
56
STUDY TO QUANTIFY AND ANALYSE THE VAT GAP IN THE EU MEMBER STATES
CASE Network Reports No. 124
Table B.3. Intermediate Consumption VAT Liability (Euro millions)
2009 2010 2011 2012 2013
Austria 4,751 4,795 4,900 5,067 5,184
Belgium 6,057 6,593 7,053 7,198 7,467
Bulgaria 652 579 613 575 588
Czech Republic 3,246 3,692 3,809 3,869 3,954
Denmark 6,861 7,117 7,310 7,620 7,745
Estonia 215 230 258 287 308
Finland 3,987 4,198 4,514 4,730 4,991
France 25,204 25,863 25,692 26,859 27,234
Germany 42,269 43,786 45,569 46,789 47,971
Greece 2,570 2,379 2,113 1,868 1,761
Hungary 2,075 2,263 2,220 2,279 2,283
Ireland 2,710 2,654 2,641 2,719 2,787
Italy 22,824 22,827 23,291 22,546 23,144
Latvia 340 333 398 422 430
Lithuania 418 442 419 407 392
Luxembourg 544 548 586 615 657
Malta 222 253 305 315 316
Netherlands 11,156 11,020 10,805 11,217 11,284
Poland 5,729 6,667 7,026 7,049 7,369
Portugal 2,893 3,094 3,173 3,040 3,063
Romania 2,764 2,446 2,834 2,651 2,815
Slovakia 1,133 1,104 1,162 1,181 1,205
Slovenia 527 542 533 520 520
Spain 12,233 11,768 12,037 12,404 13,444
Sweden 8,573 10,101 10,936 11,571 11,994
United Kingdom 28,532 35,434 39,464 42,053 40,034
EU-26 198,487 210,727 219,663 225,852 228,942
Source: Own Calculations. This includes unrecoverable VAT liability of exempt industries, general government
and NPISHs.

57
Luca Barbone, Mikhail Bonch-Osmolovskiy, Grzegorz Poniatowski
CASE Network Reports No. 124
Table B.4. GFCF VAT Liability (Euro millions)
2009 2010 2011 2012 2013
Austria 2,191 2,387 2,477 2,568 2,586
Belgium 4,039 4,126 4,007 4,262 4,173
Bulgaria 459 422 399 397 384
Czech Republic 1,654 1,793 1,574 1,632 1,502
Denmark 3,139 3,022 3,292 3,178 3,179
Estonia 208 186 214 280 299
Finland 2,251 2,729 3,037 3,063 3,175
France 30,186 25,142 26,577 27,772 27,636
Germany 27,413 29,400 32,277 32,602 32,830
Greece 4,745 4,058 3,494 2,717 2,358
Hungary 1,278 1,292 1,074 1,269 1,410
Ireland 2,045 1,518 1,471 1,279 1,279
Italy 15,790 15,173 15,035 14,204 14,186
Latvia 235 151 196 223 192
Lithuania 366 307 368 331 347
Luxembourg 282 283 291 298 288
Malta 26 30 37 39 37
Netherlands 9,312 8,400 8,750 7,992 7,502
Poland 3,612 4,242 4,585 4,098 3,771
Portugal 1,293 1,485 1,653 1,190 1,085
Romania 3,754 3,567 3,696 4,045 3,922
Slovakia 703 670 607 628 620
Slovenia 453 376 322 309 328
Spain 8,493 8,596 7,425 5,127 4,061
Sweden 4,230 5,297 6,055 6,489 6,442
United Kingdom 8,499 9,475 9,884 10,901 10,497
EU-26 136,657 134,126 138,797 136,895 134,088
Source: Own Calculations. This includes unrecoverable VAT liability on investments of exempt sectors, incl.
General Govt. and NPISHs.

58
STUDY TO QUANTIFY AND ANALYSE THE VAT GAP IN THE EU MEMBER STATES
CASE Network Reports No. 124
Table B.5. VAT Revenues (Euro millions)
2009 2010 2011 2012 2013
Austria 22,158 22,735 23,447 24,563 24,953
Belgium 23,600 25,230 26,019 26,896 27,226
Bulgaria 3,156 3,299 3,362 3,828 3,775
Czech Republic 9,784 10,420 11,246 11,377 11,694
Denmark 22,499 23,040 23,682 24,296 24,360
Estonia 1,224 1,257 1,363 1,508 1,558
Finland 15,176 15,533 17,315 17,987 18,848
France 130,303 135,578 140,552 142,526 144,414
Germany 177,701 180,213 189,910 194,034 197,005
Greece 14,876 15,958 15,021 13,712 12,593
Hungary 7,820 8,442 8,516 9,084 9,073
Ireland 10,325 10,067 9,755 10,219 10,371
Italy 86,544 97,586 98,650 96,170 93,921
Latvia 1,109 1,192 1,367 1,582 1,693
Lithuania 1,961 2,180 2,444 2,521 2,611
Luxembourg 2,457 2,562 2,824 3,093 3,485
Malta 457 477 520 536 586
Netherlands 40,086 42,654 41,610 41,699 42,424
Poland 23,056 27,466 29,764 27,783 27,780
Portugal 11,971 13,527 14,265 13,995 13,710
Romania 7,852 9,494 11,412 11,212 11,913
Slovakia 4,221 4,182 4,711 4,328 4,696
Slovenia 2,851 2,926 2,996 2,889 3,045
Spain 41,045 57,649 55,904 56,652 61,350
Sweden 28,199 33,825 36,631 37,834 39,091
United Kingdom 91,229 113,687 130,679 142,943 141,668
EU-26 781,660 861,179 903,965 923,267 933,843
Source: Eurostat.
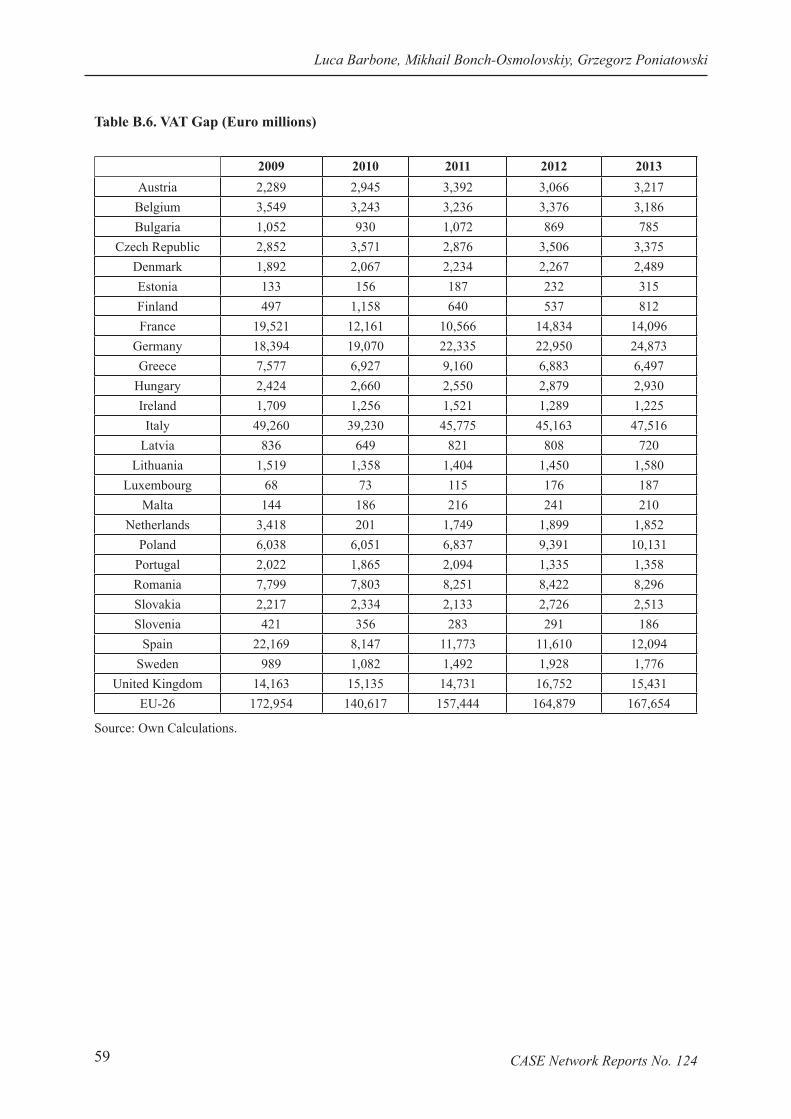
59
Luca Barbone, Mikhail Bonch-Osmolovskiy, Grzegorz Poniatowski
CASE Network Reports No. 124
Table B.6. VAT Gap (Euro millions)
2009 2010 2011 2012 2013
Austria 2,289 2,945 3,392 3,066 3,217
Belgium 3,549 3,243 3,236 3,376 3,186
Bulgaria 1,052 930 1,072 869 785
Czech Republic 2,852 3,571 2,876 3,506 3,375
Denmark 1,892 2,067 2,234 2,267 2,489
Estonia 133 156 187 232 315
Finland 497 1,158 640 537 812
France 19,521 12,161 10,566 14,834 14,096
Germany 18,394 19,070 22,335 22,950 24,873
Greece 7,577 6,927 9,160 6,883 6,497
Hungary 2,424 2,660 2,550 2,879 2,930
Ireland 1,709 1,256 1,521 1,289 1,225
Italy 49,260 39,230 45,775 45,163 47,516
Latvia 836 649 821 808 720
Lithuania 1,519 1,358 1,404 1,450 1,580
Luxembourg 68 73 115 176 187
Malta 144 186 216 241 210
Netherlands 3,418 201 1,749 1,899 1,852
Poland 6,038 6,051 6,837 9,391 10,131
Portugal 2,022 1,865 2,094 1,335 1,358
Romania 7,799 7,803 8,251 8,422 8,296
Slovakia 2,217 2,334 2,133 2,726 2,513
Slovenia 421 356 283 291 186
Spain 22,169 8,147 11,773 11,610 12,094
Sweden 989 1,082 1,492 1,928 1,776
United Kingdom 14,163 15,135 14,731 16,752 15,431
EU-26 172,954 140,617 157,444 164,879 167,654
Source: Own Calculations.

60
STUDY TO QUANTIFY AND ANALYSE THE VAT GAP IN THE EU MEMBER STATES
CASE Network Reports No. 124
Table B.7. VAT Gap (percent of VTTL)
2009 2010 2011 2012 2013
Austria 9.4 11.5 12.6 11.1 11.4
Belgium 13.1 11.4 11.1 11.2 10.5
Bulgaria 25.0 22.0 24.2 18.5 17.2
Czech Republic 22.6 25.5 20.4 23.6 22.4
Denmark 7.8 8.2 8.6 8.5 9.3
Estonia 9.8 11.0 12.1 13.3 16.8
Finland 3.2 6.9 3.6 2.9 4.1
France 13.0 8.2 7.0 9.4 8.9
Germany 9.4 9.6 10.5 10.6 11.2
Greece 33.7 30.3 37.9 33.4 34.0
Hungary 23.7 24.0 23.0 24.1 24.4
Ireland 14.2 11.1 13.5 11.2 10.6
Italy 36.3 28.7 31.7 32.0 33.6
Latvia 43.0 35.2 37.5 33.8 29.8
Lithuania 43.7 38.4 36.5 36.5 37.7
Luxembourg 2.7 2.8 3.9 5.4 5.1
Malta 24.0 28.1 29.4 31.0 26.4
Netherlands 7.9 0.5 4.0 4.4 4.2
Poland 20.8 18.1 18.7 25.3 26.7
Portugal 14.5 12.1 12.8 8.7 9.0
Romania 49.8 45.1 42.0 42.9 41.1
Slovakia 34.4 35.8 31.2 38.6 34.9
Slovenia 12.9 10.8 8.6 9.1 5.8
Spain 35.1 12.4 17.4 17.0 16.5
Sweden 3.4 3.1 3.9 4.8 4.3
United Kingdom 13.4 11.7 10.1 10.5 9.8
EU-26 18.1 14.0 14.8 15.2 15.2
Source: Own Calculations.

61
Luca Barbone, Mikhail Bonch-Osmolovskiy, Grzegorz Poniatowski
CASE Network Reports No. 124
References
Eurostat. “NACE Rev. 2 – Statistical classiication of economic activities in the European Union”, Methodologies and Working Papers, 2008, http://epp.eurostat.ec.europa.eu/cache/ITY_OFFPUB/KS-
RA-07-015/EN/KS-RA-07-015-EN.PDF.
Eurostat. “European System of Accounts – ESA 2010”, 2014, http://ec.europa.eu/eurostat/
documents/3859598/5925693/KS-02-13-269-EN.PDF.
Eurostat. “Study to quantify and analyse the VAT Gap in the EU-27 Member States”, September, 2013,
http://ec.europa.eu/taxation_customs/resources/documents/common/publications/studies/vat-gap.pdf.
Eurostat. “2012 Update to the Study to quantify and analyse the VAT Gap in the EU-27 Member
States”, 2014, http://ec.europa.eu/taxation_customs/resources/documents/common/publications/
studies/vat_gap2012.pdf.
EU. “COUNCIL DIRECTIVE 2006/112/EC of 28 November 2006 on the common system of value
added tax”, 2006, http://eur-lex.europa.eu/legal-content/EN/ALL/?uri=CELEX:32006L0112.
HM Revenue and Customs. “Second estimate of the VAT gap for 2012-13”, London, March 19,
2014, https://www.gov.uk/government/uploads/system/uploads/attachment_data/ile/292860/Second_estimate_of_the_VAT_gap_for_2012-13.pdf.
Keen, Michael. “The Anatomy of the VAT”, IMF Working Paper, WP/13/111, May, 2014.
OECD. “Consumption Tax Trends”, Paris, 2014.
TAXUD. “Tax reforms in EU Member States 2013 - Tax policy challenges for economic growth and
iscal sustainability”, Taxation Papers, Working Paper n. 38, 2013, http://ec.europa.eu/taxation_customs/resources/documents/taxation/gen_info/economic_analysis/tax_papers/taxation_paper_38.pdf.
TAXUD. “VAT Rates Applied in the Member States of the European Union” (and prior issues),
2014, http://ec.europa.eu/taxation_customs/resources/documents/taxation/vat/how_vat_works/rates/
vat_rates_en.pdf.