ethylene, propylene, and 1,3-butadiene pipeline emissions · pdf file ·...
TRANSCRIPT

ETHYLENE, PROPYLENE, AND 1,3-BUTADIENE PIPELINE EMISSIONS INVENTORY Final Prepared for: Texas Commission on Environmental Quality Air Quality Division MC-164, P.O. Box 13087 Austin, TX 78711-3087 August 16, 2010
Eastern Research Group, Inc.

ERG No. 0231.03.002.001 TCEQ Contract No. 582-07-83984 Work Order No. 582-07-83984-FY10-02
ETHYLENE, PROPYLENE, AND 1,3-BUTADIENE PIPELINE EMISSIONS INVENTORY
Final
Prepared for:
Texas Commission on Environmental Quality Air Quality Division
MC-164, P.O. Box 13087 Austin, TX 78711-3087 Attn: Mr. Cody McLain
Prepared by:
Eastern Research Group, Inc. 10860 Gold Center Drive, Suite 275
Rancho Cordova, CA 95670
August 16, 2010

TCEQ, Pipeline Inventory Final, August 16, 2010
i
TABLE OF CONTENTS Section Page ES.0 EXECUTIVE SUMMARY .................................................................................................1 1.0 INTRODUCTION ...............................................................................................................1 2.0 FACILITY RESEARCH .....................................................................................................2 3.0 ESTIMATION METHODOLOGIES..................................................................................8 4.0 SURVEY QUESTIONNAIRE DEVELOPMENT............................................................13 5.0 SURVEY RESULTS .........................................................................................................14 6.0 EMISSION CALCULATIONS AND INVENTORY RESULTS.....................................16 7.0 DATA FORMATTING .....................................................................................................24 8.0 POTENTIAL IDEAS FOR FUTURE WORK ..................................................................25 9.0 REFERENCES ..................................................................................................................26 Tables Page Table ES-1. Overall Emissions Inventory for HGB Nonattainment Area ...................................... 1 Table 2-1. Potential Pipeline Operators/Owners Located in the HGB Ozone Nonattainment
Area ............................................................................................................................. 7 Table 3-1. SOCMI TOC Average Emission Factors .................................................................. 10 Table 5-1. Survey Responses from Pipeline Operators/Owners Located in the HGB Ozone
Nonattainment Area .................................................................................................. 14 Table 5-2. Comparison of RRC GIS Mileage and Survey Response Mileage ........................... 16 Table 6-1. Uncontrolled Emissions for Survey Respondents ..................................................... 18 Table 6-2. Uncontrolled Emissions for Chemical Grade Propylene Survey Respondents......... 20 Table 6-3. Commodity Profiles .................................................................................................. 21 Table 6-4. Extrapolated Emissions Estimates for Survey Non-Respondents ............................. 22 Table 6-5. Controlled and Uncontrolled Emissions for Survey Respondents ............................ 23 Table 6-6. Overall Emissions Inventory for HGB Nonattainment Area .................................... 23 Table 7-1. Overall Emissions Inventory for HGB Nonattainment Area (Annual and Ozone
Season Daily) ............................................................................................................ 25 Figures Page Figure 2-1. Ethylene Pipelines Located in Houston-Galveston-Brazoria Ozone Nonattainment
Area............................................................................................................................ 4 Figure 2-2. Propylene Pipelines Located in Houston-Galveston-Brazoria Ozone Nonattainment
Area............................................................................................................................ 5 Figure 2-3. 1,3-Butadiene Pipelines Located in Houston-Galveston-Brazoria Ozone
Nonattainment Area ................................................................................................... 6 APPENDIX A: SAMPLE SURVEY QUESTIONNAIRE (P5 #033898)

TCEQ, Pipeline Inventory Final, August 16, 2010
ii
ACRONYMS CH4 methane
C2H6 ethane
ERG Eastern Research Group, Inc.
GIS geographical information system
HGB Houston-Galveston-Brazoria
HON Hazardous Organic NESHAP
HRVOC highly reactive volatile organic compound
LDAR Leak Detection and Repair
NEI National Emissions Inventory
NESHAP National Emission Standard for Hazardous Air Pollutants
NIF National Emissions Inventory Input Format
NSPS New Source Performance Standard
P5 RRC ID number assigned to each pipeline owner/operator
ppm parts per million
ppmv parts per million-volume
QA quality assurance
QC quality control
RRC Railroad Commission of Texas
SCC Standard Classification Codes
SOCMI synthetic organic chemical manufacturing industry
T4 RRC ID number assigned for each owner, jurisdiction, and commodity group
TCEQ Texas Commission on Environmental Quality
TOC total organic compound
TPA Texas Pipeline Association
U.S. EPA U.S. Environmental Protection Agency
VOC volatile organic compound
TCEQ, Pipeline Inventory Final, August 16, 2010
1
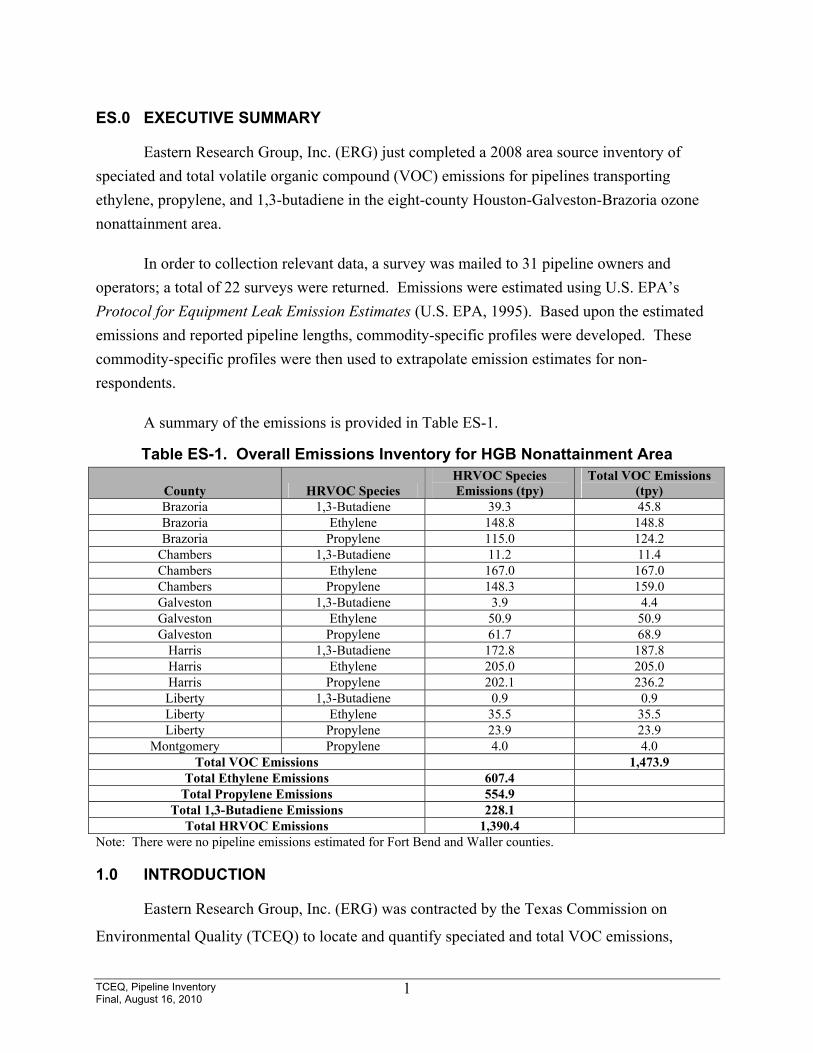
ES.0 EXECUTIVE SUMMARY
Eastern Research Group, Inc. (ERG) just completed a 2008 area source inventory of speciated and total volatile organic compound (VOC) emissions for pipelines transporting ethylene, propylene, and 1,3-butadiene in the eight-county Houston-Galveston-Brazoria ozone nonattainment area.
In order to collection relevant data, a survey was mailed to 31 pipeline owners and operators; a total of 22 surveys were returned. Emissions were estimated using U.S. EPA’s Protocol for Equipment Leak Emission Estimates (U.S. EPA, 1995). Based upon the estimated emissions and reported pipeline lengths, commodity-specific profiles were developed. These commodity-specific profiles were then used to extrapolate emission estimates for non-respondents.
A summary of the emissions is provided in Table ES-1.
Table ES-1. Overall Emissions Inventory for HGB Nonattainment Area
County HRVOC Species HRVOC Species Emissions (tpy)
Total VOC Emissions (tpy)
Brazoria 1,3-Butadiene 39.3 45.8 Brazoria Ethylene 148.8 148.8 Brazoria Propylene 115.0 124.2
Chambers 1,3-Butadiene 11.2 11.4 Chambers Ethylene 167.0 167.0 Chambers Propylene 148.3 159.0 Galveston 1,3-Butadiene 3.9 4.4 Galveston Ethylene 50.9 50.9 Galveston Propylene 61.7 68.9
Harris 1,3-Butadiene 172.8 187.8 Harris Ethylene 205.0 205.0 Harris Propylene 202.1 236.2 Liberty 1,3-Butadiene 0.9 0.9 Liberty Ethylene 35.5 35.5 Liberty Propylene 23.9 23.9
Montgomery Propylene 4.0 4.0 Total VOC Emissions 1,473.9
Total Ethylene Emissions 607.4 Total Propylene Emissions 554.9
Total 1,3-Butadiene Emissions 228.1 Total HRVOC Emissions 1,390.4
Note: There were no pipeline emissions estimated for Fort Bend and Waller counties.
1.0 INTRODUCTION
Eastern Research Group, Inc. (ERG) was contracted by the Texas Commission on
Environmental Quality (TCEQ) to locate and quantify speciated and total VOC emissions,

TCEQ, Pipeline Inventory Final, August 16, 2010
2
specifically highly reactive volatile organic compounds (HRVOCs) emissions, from pipelines
transporting ethylene, propylene, and 1,3-butadiene in the Houston-Galveston-Brazoria (HGB)
ozone nonattainment area (i.e., Brazoria, Chambers, Fort Bend, Galveston, Harris, Liberty,
Montgomery, and Waller counties). Information from this project was used to develop a 2008
area source inventory for HRVOC pipelines. The project focused on fugitive emissions from
metering stations, valve stations, pumps, and other related components along the pipeline routes.
Since emissions from ethylene, propylene, and 1,3-butadiene pipelines had not previously been
inventoried by TCEQ, a mail-out survey was mailed to pipeline owners and operators. The
survey results were compiled and then used to estimate emissions based upon the most
appropriate U.S. Environmental Protection Agency (U.S. EPA) fugitive emissions guidance.
The remainder of this report describes in detail the steps involved during the development
of the ethylene, propylene, and 1,3-butadiene pipeline emissions inventory for the HGB ozone
nonattainment area.
The remainder of the report is presented in the following sections:
• Section 2.0 describes the facility research process used to identify potential pipeline owners and operators;
• Section 3.0 provides a description of the determination of the most appropriate VOC emission estimation methodologies;
• Section 4.0 briefly explains the survey questionnaire development process; • Section 5.0 summarizes the survey results; • Section 6.0 describes the emission calculations and inventory results; • Section 7.0 briefly explains the data formatting associated with the project; • Section 8.0 presents some potential ideas for future work associated with ethylene,
propylene, and 1,3-butadiene pipelines. • Section 9.0 lists all references used in the development of the emissions inventory and
associated report; and • Appendix A includes a sample survey questionnaire.
2.0 FACILITY RESEARCH
The first step of developing the 2008 area source inventory of ethylene, propylene, and
1,3-butadiene pipeline emissions was to identify potential pipeline owners and operators located
in the Houston-Galveston-Brazoria nonattainment area. Two potential sources of information
regarding pipeline owners and operators were considered: Penwell data (including maps) and
Railroad Commission of Texas (RRC) geographical information systems (GIS) data for

TCEQ, Pipeline Inventory Final, August 16, 2010
3
pipelines. After review of these two sources of information, it was decided to use the RRC GIS
data because the data were available at the county level, whereas Penwell data were only
available at the state level. In addition, operator contact information contained in the Penwell
data was obtained from business directories, while the contact information from the RRC data
were obtained from operator/owner permits.
After purchase of the RRC GIS data for pipelines within the 8-county HGB
nonattainment area, a total of 235,169 records were extracted. These data were then filtered
based upon the specific commodities transported. Irrelevant commodities (e.g., crude oil, natural
gas, etc.) were eliminated from further consideration; only the following 13 commodities (as
defined by the RRC GIS data) were retained for further analysis:
• Ethylene; • Ethylene Gas; • Propylene; • Chemical Grade Propylene; • Polymer Grade Propylene; • Propylene Dilute; • Propylene Polymer; • Butane/Propylene; • Propane/Propylene; • Propylene/Ethane/Propane; • Propane/Propylene Mix/Butane; • Butadiene; and • Crude Butadiene.
Filtering for these commodities reduced the number of relevant records from 235,169
down to 67,689 records. The remaining records were then further filtered by pipeline status.
The RRC data indicated each pipeline system’s operating status (i.e., in service, abandoned, or
retired). Only those records that indicated an in service pipeline operating status were retained;
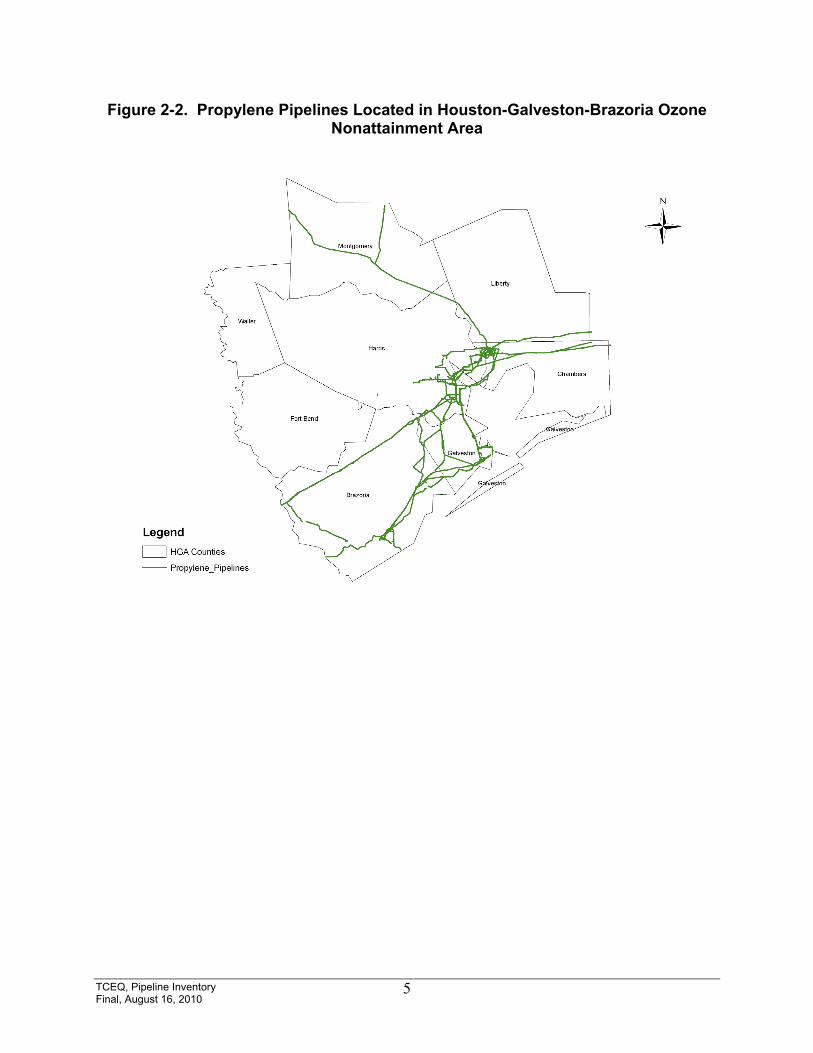
the abandoned and retired records were dropped from further analysis. For illustration purposes,
the in service ethylene, propylene, and 1,3-butadiene pipelines in the 8-county HGB
nonattainment area are presented in Figures 2-1, 2-2, and 2-3.

TCEQ, Pipeline Inventory Final, August 16, 2010
4
Figure 2-1. Ethylene Pipelines Located in Houston-Galveston-Brazoria Ozone Nonattainment Area
TCEQ, Pipeline Inventory Final, August 16, 2010
5
Figure 2-2. Propylene Pipelines Located in Houston-Galveston-Brazoria Ozone Nonattainment Area

TCEQ, Pipeline Inventory Final, August 16, 2010
6
Figure 2-3. 1,3-Butadiene Pipelines Located in Houston-Galveston-Brazoria
Ozone Nonattainment Area

TCEQ, Pipeline Inventory Final, August 16, 2010
7
After applying the commodity and pipeline status filters described above, a total of 31
pipeline operators/owners located in the HGB ozone nonattainment area were identified as
transporting at least one of the commodities of interest. These 31 pipeline operators/owners are
shown in Table 2-1, along with their respective P5 permit numbers (i.e., RRC organization ID
numbers).
Table 2-1. Potential Pipeline Operators/Owners Located in the HGB Ozone Nonattainment Area
P5 Number Operator Name 033898 Ascend Performance Materials LLC 054130 BASF Corporation 085368 BP Pipelines (North America), Inc. 105972 Buckeye Gulf Coast Pipelines LP 105988 Buckeye Products Pipeline LP 148100 Chevron Pipe Line Company 172232 ConocoPhillips Company 172240 ConocoPhillips Pipe Line Company 227525 Dow Chemical Company 227528 Dow Pipeline Company 253316 Equistar Chemicals LP 253368 Enterprise Products Operating LLC 257129 ExxonMobil Pipeline Company 257155 ExxonMobile Oil Corporation 402711 Houston Hydrocarbons, Inc. 403715 Houston Oil & Minerals Corp. 424816 Intercontinental Terminal Co. LLC 473732 Koch Pipeline Company LP 525390 Marathon Pipe Line LLC 561824 Mesa Operating Co. 597145 Mustang Pipeline Company 630152 OXEA Corporation 761550 Seadrift Pipeline Corporation 774710 Shell Pipeline Company LP 840745 TE Products Pipeline Company LLC 845725 Texas Eastman Div, Eastman Chemco 863639 TPC Group LLC 875642 Ultramar Oil and Gas Limited 875645 UCAR Pipeline Incorporated 876320 Union Carbide Corp. 881250 Valero Refining – Texas LP
Addresses and contact information for these 31 pipeline operators/owners were obtained
from the RRC’s listing of active pipeline operators. The RRC website also contained an Oil &
Gas directory. In general, the addresses from the active pipeline operator listing were considered
to be local addresses, while the Oil & Gas directory typically included corporate contact

TCEQ, Pipeline Inventory Final, August 16, 2010
8
information. In many cases, the addresses from the active pipeline operator listing matched the
Oil & Gas directory. For those cases where the addresses did not match, preference was given to
the active pipeline operator listing since these were considered to be more local. After
researching the active pipeline operator listing and the Oil & Gas directory, it was determined
that address and contact information was still missing for four pipeline operators/owners (i.e.,
Houston Hydrocarbons, Inc.; Houston Oil & Minerals Corp.; Mesa Operating Co.; and Ultramar
Oil and Gas Limited). Additional Internet research was conducted to obtain this missing
information.
3.0 ESTIMATION METHODOLOGIES
After identifying potential pipeline owners and operators located in the Houston-
Galveston-Brazoria nonattainment area, the next step performed was the determination of the
most appropriate VOC emission estimation methodologies for estimating fugitive emissions
from pipelines. This determination is outlined below.
Based upon ERG’s previous experience and internal expertise, the methodology
contained in U.S. EPA’s Protocol for Equipment Leak Emission Estimates (U.S. EPA, 1995)
(hereafter referred to as the Protocol) was selected. The Protocol is a standard U.S. EPA
methodology and ERG has familiarity with it from working on numerous regulatory standards
and other projects with U.S. EPA. In addition, the Protocol has also been cited in TCEQ’s own
point source inventory guidance (TCEQ, 2009).
The Protocol defines four general methods for estimating total organic compound (TOC)
emissions from leaking equipment. These four methods, listed in descending order of accuracy
are:
• Unit-specific correlation equation approach; • U.S. EPA correlation equation approach; • Screening ranges approach; and • Average emission factor approach.
In general, the more refined approaches provide more accurate emission estimates; however,
these approaches also require more data.

TCEQ, Pipeline Inventory Final, August 16, 2010
9
For the unit-specific correlation equation approach, screening and leak rate data are first
measured for a select set of individual equipment components. These measurements are then
used to develop unit-specific correlations. Emissions are then estimated by combining these
unit-specific correlations with screening values for all applicable components.
The U.S. EPA correlation equation approach is somewhat less accurate than the unit-
specific correlation equation approach; however, it does not require the initial development of
unit-specific correlations. Screening values, however, are utilized. Screening values are
collected using a portable monitoring instrument to sample air from potential leak interfaces on
individual pieces of equipment and to provide a measure of the concentration of leaking
compounds in the ambient air. Screening values provide an indication of the leak rate from an
equipment piece and are measured in units of parts per million-volume (ppmv). In the U.S. EPA
correlation equation approach, screening values are entered into general correlation equations
developed by U.S. EPA that relate the measured concentrations to emission rates for the
component. Separate correlation equations are available for gas valves, light liquid valves, light
liquid pumps, and connectors used in the synthetic organic chemical manufacturing industry
(SOCMI). In addition, the correlation equation for light liquid pumps can also be applied to
compressor seals, pressure relief valves, agitator seals, and heavy liquid pumps. The equipment
covered by the U.S. EPA correlation equations would include all of the primary sources of
emissions from pipelines transporting ethylene, propylene, and 1,3-butadiene. The emission
results calculated using either the unit-specific or U.S. EPA correlation equation approach are
emission rates (in units of kg/hr) and need to be multiplied by the annual hours of operation of
the component to calculate a yearly emission rate.
Ideally, the unit-specific and U.S. EPA correlation equation approaches are the preferred
methodologies for estimating emissions from leaking equipment. However, screening values are
not always available for each component. In such cases, the Protocol provides average emission
factors that can be applied to specific equipment types (e.g., valves, pumps, etc.). In general,
estimates calculated using average emission factors are not as refined as those estimated using
the correlation equations. In addition, the average emission factors can significantly
overestimate emissions. Average emission factors are available for gas valves, light liquid
valves, heavy liquid valves, light liquid pumps, heavy liquid pumps, compressor seals, pressure

TCEQ, Pipeline Inventory Final, August 16, 2010
10
relief valves, connectors, open-ended lines, and sampling connections. The SOCMI average
emission factors from the Protocol were utilized in this project and are presented in Table 3-1
(U.S. EPA, 1995). These emission factors are in units of kg/hour/source.
Table 3-1. SOCMI TOC Average Emission Factors Service Type (kg/hour/source)
Equipment Type Gas Light Liquid Heavy Liquid Valves 0.00597 0.00403 0.00023 Pump Seals 0.0199 0.00862 Compressor Seals 0.228 Pressure Relief Valves 0.104 Connectors 0.00183 Open-Ended Lines 0.0017 Sampling Connections 0.0150
Note: Emission factors from U.S. EPA, 1995 (Table 2-1).
In order to use the SOCMI average emission factors in Table 3-1, the following data
must be collected:
• Number of each type of component; • Service of each component (i.e., gas, light liquid, or heavy liquid); • TOC concentration of the pipeline material; • Percent of components that are leaking (if known); and • Time period each component was used annually.
To estimate TOC emissions for a specific component type, the following equation
(Equation 3-1) is used:
H L WF N EF E TOCcomponentTOC ××××= Equation 3-1
Where: ETOC = Emissions of TOC from a particular component (lbs/year); EFcomponent = Component-specific emission factor (lbs/hour); N = Number of components; WFTOC = Average weight fraction of TOC in the stream; L = Percent of components leaking; and H = Hours of operation per year.
The percent of components leaking may not be known. For sources subject to equipment
leak regulations (i.e., 40 CFR part 60 Subpart VV), the regulations specify a maximum percent

TCEQ, Pipeline Inventory Final, August 16, 2010
11
of leaking components for many component types. This maximum value can be used in the
equation above, because these components would be subject to the limit. If there are no
regulatory requirements concerning the maximum percent of leaking components and no data are
available to make reasonable assumptions, then it will be assumed that all components are
leaking. However, it is likely that this assumption will overestimate actual emissions.
One additional refinement to the average emission factor approach is to incorporate the
effect of any applicable regulations on the emissions, including the Hazardous Organic National
Emission Standard for Hazardous Air Pollutants (NESHAP) (HON), the SOCMI New Source
Performance Standard (NSPS), Leak Detection and Repair (LDAR), etc. For instance, the
Protocol estimates reduction efficiencies for any equipment that are modified (e.g., vented
through a closed vent system to a control device or using leakless equipment, etc.) or are part of
a LDAR program. Two factors that affect the reduction are the concentration of TOC that
defines a leak and the monitoring frequency of the components. In general, equipment affected
by an LDAR program include gas valves, light liquid valves, light liquid pumps, and
compressors. The Protocol provides control efficiencies for these components monitored
monthly and quarterly at 10,000 parts per million (ppm) leak definition, or monitored using the
leak definition in the HON (i.e., 500 ppm, with performance specifications). In order to
incorporate the effect of equipment leak requirements, the number of equipment with
modifications or subject to equipment leak regulations, as well as the type of regulation, need to
be known.
Based upon previous industry experience, it was expected that the VOC content of the
commodities containing the three compounds of interest (i.e., ethylene, propylene, and 1,3-
butadiene) will likely be 100 percent (i.e., WFTOC = 1). In addition, there was expected to be
virtually no LDAR data available from survey respondents (i.e., the ‘L’ term will be dropped
from the equation). However, information regarding LDAR regulations was requested on the
survey questionnaire. Finally, annual hours of operation were assumed to be 8760 if no hours of
operation were indicated by survey respondents.
Using the assumptions described above, Equation 3-2 (i.e., the simplified version of
Equation 3-1) is presented below:

TCEQ, Pipeline Inventory Final, August 16, 2010
12
H N EF E componentTOC ××= Equation 3-2
Where: ETOC = Emissions of TOC from a particular component (lbs/year); EFcomponent = Component-specific emission factor (lbs/hour); N = Number of components; and H = Hours of operation per year.
If a particular pipeline commodity contains methane (CH4) or ethane (C2H6), then it is
likely that the VOC content of the pipelines will not be 100 percent. In these instances,
additional weight fraction information will be obtained from the pipeline operators/owners. This
weight fraction information will then be incorporated into the speciation equation shown in
Equation 3-3 in order to calculate emissions of chemical c (i.e., ethylene, propylene, or 1,3-
butadiene).
⎟⎟⎠
⎞⎜⎜⎝
⎛×=
TOC
cTOCc WP
WP E E Equation 3-3
Where: Ec = Emissions of chemical c from a particular component (lbs/year); ETOC = Emissions of TOC from a particular component (lbs/year); WPc = Concentration of chemical c in a particular component (wt %); and WPTOC = Concentration of TOC in a particular component (wt %).
The Protocol indicates that Equation 3-3 assumes that the weight percent of chemicals in
the mixture contained in the equipment will equal the weight percent of the chemicals in the
leaking material. This assumption is accurate for single-phase streams contain any gas/vapor
material or liquid mixtures containing constituents of similar volatilities.
Due to project resource limitations and expected screening data availability, the average
emission factor approach was used to estimate emissions. Although oil and gas liquids typically
maintain screening value and leak rate data, RRC staff indicated that pipeline operators carrying
non-oil and gas liquids are not as likely to maintain such data (Vaughn and Daniel, 2010).

TCEQ, Pipeline Inventory Final, August 16, 2010
13
4.0 SURVEY QUESTIONNAIRE DEVELOPMENT
Following identification of the survey population of potential pipeline owners and
operators located in the HGB nonattainment area and the determination that the average emission
factor approach from the Protocol was the most appropriate methodology for estimating pipeline
emissions of ethylene, propylene, and 1,3-butadiene, the next step conducted for the project was
the development of the survey questionnaire.
The survey questionnaire was developed in consultation with TCEQ staff. A key
consideration during the survey questionnaire development process was the balance between
obtaining necessary data and minimizing the reporting burden on the pipeline owners and
operators. The survey questionnaire was customized for each individual owner/operator based
upon individual P5 permit numbers obtained from RRC. A sample survey questionnaire is
provided in Appendix A (P5 permit #033898 [Ascend Performance Materials LLC]). In addition
to a cover letter presented on TCEQ letterhead, the survey questionnaire consisted of six pages.
These six pages are briefly explained below:
• Page 1 – Instructions for completing the survey including a number of general definitions (e.g., P5 permit number, T4 permit number, commodity, etc.), as well as some definitions specific to certain survey tables.
• Page 2 – General questions associated with the commodity pipelines including confirmation of P5 and T4 permit numbers; confirmation of ethylene-, propylene-, or 1,3-butadiene-containing commodities; identification of pipeline system names; potential applicability of rules and regulations; and contact information.
• Page 3 – Table 1 which requested the identification of the counties and commodities associated with each pipeline system.
• Page 4 – Table 2 which requested the pipeline length (overall total and 8-county length), diameter, length, and any unaccounted for commodity for each pipeline system.
• Page 5 – Table 3 which requested site information (i.e., name, description, location, county) for each site, as well as component information (i.e., component counts, service type, and time in service) for each site.
• Page 6 – Customized information for each P5 permit number including a list of applicable T4 permit numbers (Table A) and applicable pipeline system names (Table B).
The survey questionnaires were mailed out to the 31 owners/operators on June 18, 2010.
Survey responses were requested by July 16, 2010.
TCEQ, Pipeline Inventory Final, August 16, 2010
14
5.0 SURVEY RESULTS
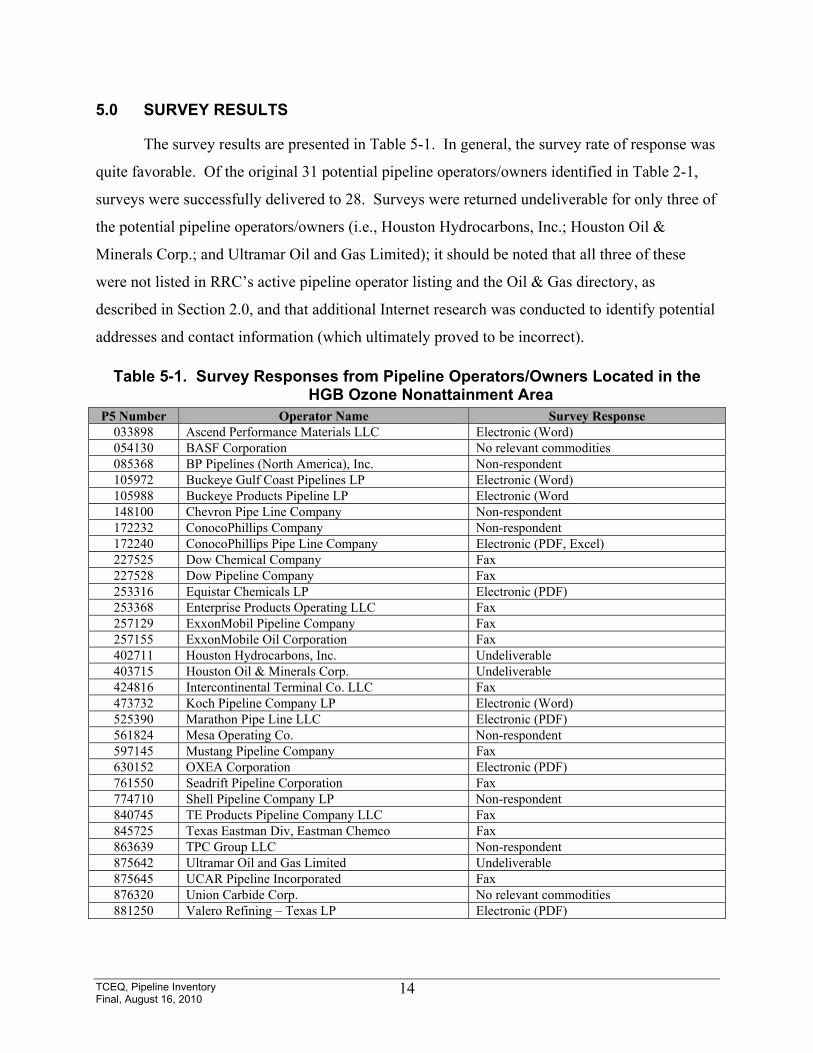
The survey results are presented in Table 5-1. In general, the survey rate of response was
quite favorable. Of the original 31 potential pipeline operators/owners identified in Table 2-1,
surveys were successfully delivered to 28. Surveys were returned undeliverable for only three of
the potential pipeline operators/owners (i.e., Houston Hydrocarbons, Inc.; Houston Oil &
Minerals Corp.; and Ultramar Oil and Gas Limited); it should be noted that all three of these
were not listed in RRC’s active pipeline operator listing and the Oil & Gas directory, as
described in Section 2.0, and that additional Internet research was conducted to identify potential
addresses and contact information (which ultimately proved to be incorrect).
Table 5-1. Survey Responses from Pipeline Operators/Owners Located in the HGB Ozone Nonattainment Area
P5 Number Operator Name Survey Response 033898 Ascend Performance Materials LLC Electronic (Word) 054130 BASF Corporation No relevant commodities 085368 BP Pipelines (North America), Inc. Non-respondent 105972 Buckeye Gulf Coast Pipelines LP Electronic (Word) 105988 Buckeye Products Pipeline LP Electronic (Word 148100 Chevron Pipe Line Company Non-respondent 172232 ConocoPhillips Company Non-respondent 172240 ConocoPhillips Pipe Line Company Electronic (PDF, Excel) 227525 Dow Chemical Company Fax 227528 Dow Pipeline Company Fax 253316 Equistar Chemicals LP Electronic (PDF) 253368 Enterprise Products Operating LLC Fax 257129 ExxonMobil Pipeline Company Fax 257155 ExxonMobile Oil Corporation Fax 402711 Houston Hydrocarbons, Inc. Undeliverable 403715 Houston Oil & Minerals Corp. Undeliverable 424816 Intercontinental Terminal Co. LLC Fax 473732 Koch Pipeline Company LP Electronic (Word) 525390 Marathon Pipe Line LLC Electronic (PDF) 561824 Mesa Operating Co. Non-respondent 597145 Mustang Pipeline Company Fax 630152 OXEA Corporation Electronic (PDF) 761550 Seadrift Pipeline Corporation Fax 774710 Shell Pipeline Company LP Non-respondent 840745 TE Products Pipeline Company LLC Fax 845725 Texas Eastman Div, Eastman Chemco Fax 863639 TPC Group LLC Non-respondent 875642 Ultramar Oil and Gas Limited Undeliverable 875645 UCAR Pipeline Incorporated Fax 876320 Union Carbide Corp. No relevant commodities 881250 Valero Refining – Texas LP Electronic (PDF)
TCEQ, Pipeline Inventory Final, August 16, 2010
15
Of the 28 delivered surveys, responses were provided by 22 pipeline operators/owners
(i.e., a survey return rate of nearly 79 percent). The responses were provided in a variety of
formats: 11 respondents faxed in their survey responses, while 9 respondents provided their
survey information in electronic format (i.e., Word, Excel, or PDF format). An additional two
respondents (i.e., BASF Corporation and Union Carbide Corp.) indicated that they did not
transport any ethylene-, propylene-, or 1,3-butadiene-containing commodities, even though the
RRC data indicated that they did so. The response rate of nearly 79 percent was quite high for a
voluntary survey without any regulatory driver. This high response rate can likely be attributed
to a number of factors, such as: TCEQ staff’s advanced contact with the Texas Pipeline
Association (TPA), TCEQ staff’s telephone follow-up calls, and a deadline extension to July 23,
2010. Several attempts were made to elicit survey responses from the six remaining non-
respondents. For three of these non-respondents (i.e., Chevron Pipe Line Company,
ConocoPhillips Company, and Shell Pipeline Company LP), some sort of contact (direct
conversation or voice mail message) was established. For the other three non-respondents (i.e.,
BP Pipelines North America, Inc.; Mesa Operating Co.; and Texas Petrochemicals LP), no
contact was actually established due to a constant busy signal, constant telephone ringing with no
answer, and no available contact information. It is possible that these pipeline entities no longer
exist.
All survey data were entered into a flat file format Excel spreadsheet that was convenient
for application of the equipment leak emission factors from U.S. EPA’s Protocol. A total of 397
records were input into the spreadsheet. If site information was provided by the respondent, then
each record represents one site. If site information was not provided by the respondent, then
each record represents one pipeline system disaggregated by county and commodity. As part of
the project quality assurance/quality control (QA/QC), all input data were checked by an ERG
staff member who did not perform data entry of the survey data.
For comparison purposes, the pipeline mileages from the RRC GIS data set and from the
survey data are presented in Table 5-2.
TCEQ, Pipeline Inventory Final, August 16, 2010
16
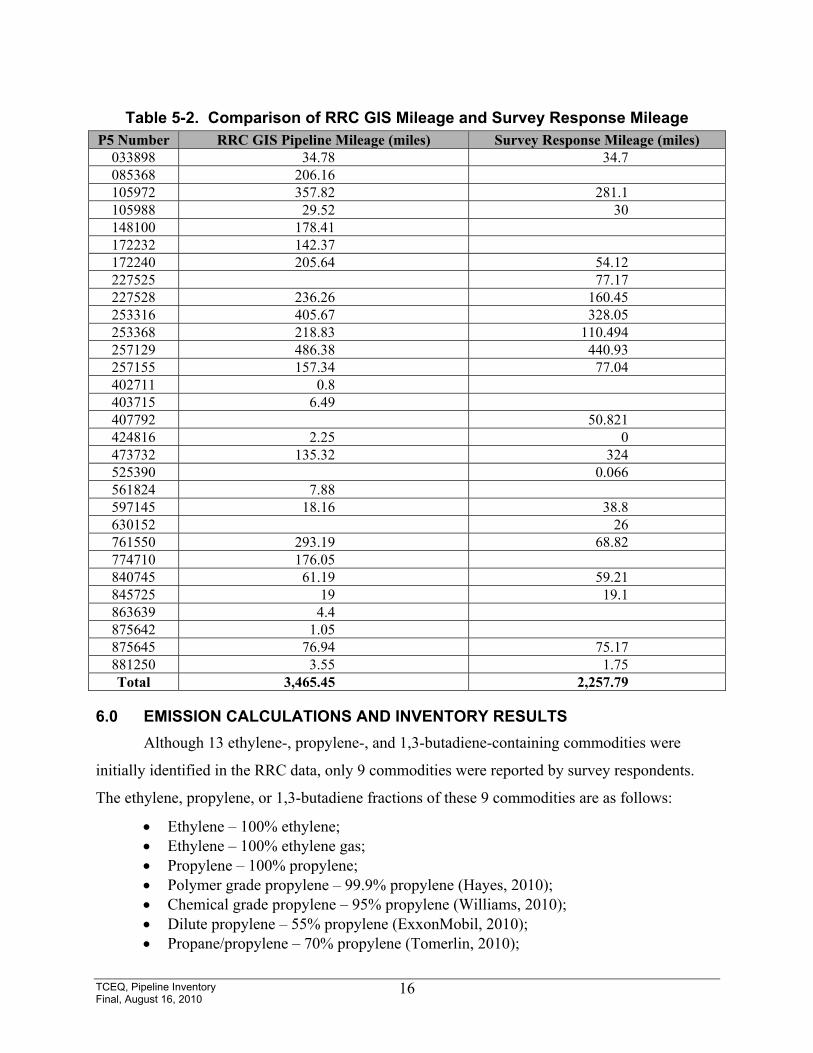
Table 5-2. Comparison of RRC GIS Mileage and Survey Response Mileage P5 Number RRC GIS Pipeline Mileage (miles) Survey Response Mileage (miles)
033898 34.78 34.7 085368 206.16 105972 357.82 281.1 105988 29.52 30 148100 178.41 172232 142.37 172240 205.64 54.12 227525 77.17 227528 236.26 160.45 253316 405.67 328.05 253368 218.83 110.494 257129 486.38 440.93 257155 157.34 77.04 402711 0.8 403715 6.49 407792 50.821 424816 2.25 0 473732 135.32 324 525390 0.066 561824 7.88 597145 18.16 38.8 630152 26 761550 293.19 68.82 774710 176.05 840745 61.19 59.21 845725 19 19.1 863639 4.4 875642 1.05 875645 76.94 75.17 881250 3.55 1.75 Total 3,465.45 2,257.79
6.0 EMISSION CALCULATIONS AND INVENTORY RESULTS Although 13 ethylene-, propylene-, and 1,3-butadiene-containing commodities were
initially identified in the RRC data, only 9 commodities were reported by survey respondents.
The ethylene, propylene, or 1,3-butadiene fractions of these 9 commodities are as follows:
• Ethylene – 100% ethylene; • Ethylene – 100% ethylene gas; • Propylene – 100% propylene; • Polymer grade propylene – 99.9% propylene (Hayes, 2010); • Chemical grade propylene – 95% propylene (Williams, 2010); • Dilute propylene – 55% propylene (ExxonMobil, 2010); • Propane/propylene – 70% propylene (Tomerlin, 2010);

TCEQ, Pipeline Inventory Final, August 16, 2010
17
• 1,3-butadiene – 100% 1,3-butadiene; and • Crude butadiene – 80% 1,3-butadiene (Hayes, 2010).
In addition, several irrelevant commodities were also reported by survey respondents.
These included butylene, propane/butane/natural gas, ethane/propane mix, ethane/propane
mix/natural gas, and refined products. Since these commodities do not contain ethylene,
propylene, or 1,3-butadiene, they were excluded from further analysis.
The U.S. EPA SOCMI average emission factor method from the Protocol was used to
generate emissions estimates from various components (e.g., valves, pumps, flanges, etc.) (U.S.
EPA, 1995). The following assumptions were used to develop emissions estimates:
• The Protocol does not include an emission factor for flanges. Therefore, it was assumed that the connector emission factor was appropriate for use with flanges.
• The Protocol does not include an emission factor for liquid service pressure relief devices. Therefore, it was assumed that the gas service pressure relief device emission factor was appropriate for use with liquid service pressure relief devices.
• Some survey respondents reported unique components (e.g., needle valves, gauges, trap doors, etc.). The Protocol does not include emission factors for these components, so they were excluded from the emission estimates. Since these unusual components consisted of less than 10 percent of the total component records, they were assumed to be insignificant.
• It was assumed that all fugitive component emissions leak at a constant rate. It was also assumed that all emissions are independent of temperature (i.e., there is not seasonal variability of emissions).
Emissions were calculated as described in Section 3.0. It was assumed that the fraction
of each commodity that was not ethylene, propylene, or 1,3-butadiene was VOC. For example,
chemical grade propylene was identified as typically containing 95 percent propylene; the
remaining 5 percent was assumed to be other VOC (i.e., not ethylene, propylene, or 1,3-
butadiene). The uncontrolled VOC (i.e., summation of ethylene, propylene, 1,3-butadiene, and
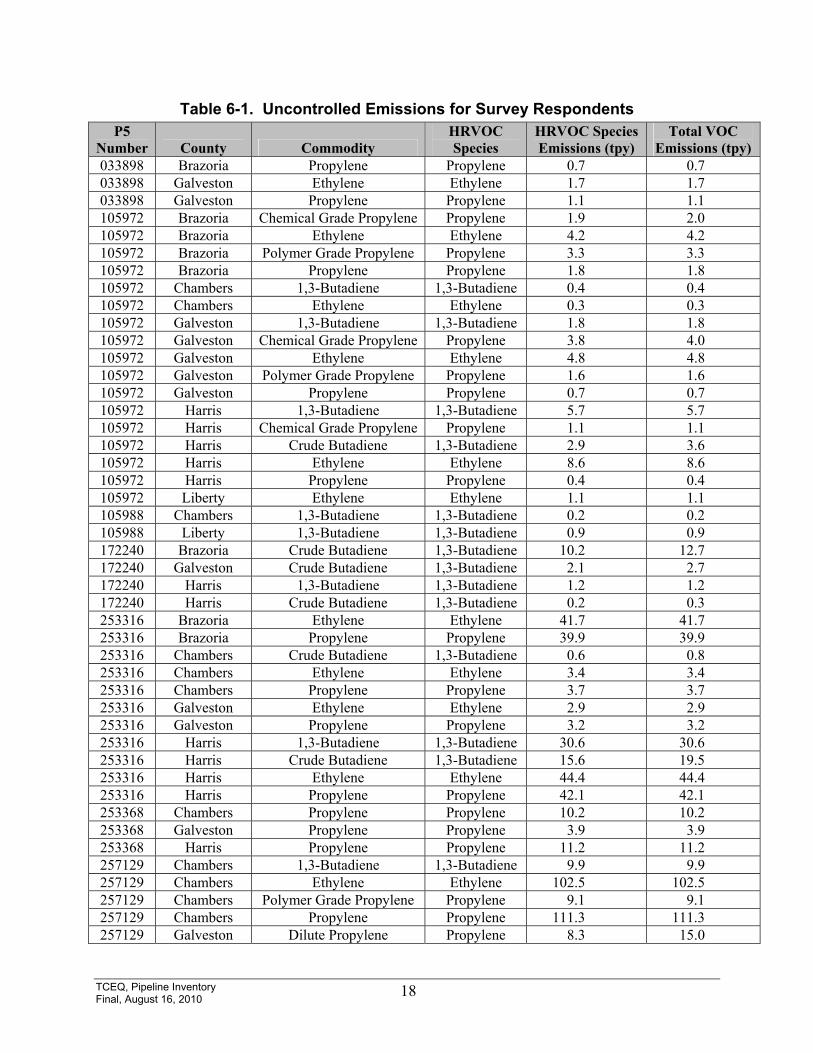
other VOC) and individual species emissions are presented in Table 6-1 for each P5 number. It
should be noted that emissions were not estimated for a number of P5/commodity combinations
because component counts were not reported for that particular commodity. A sample
calculation for the estimation of 1,3-butadiene emissions in Liberty County is presented below.
Only one survey respondent identified pipelines in Liberty County (P5 permit # 105988)
carrying 1,3-butadiene. The total component count from this survey was 24 flanges and 12
TCEQ, Pipeline Inventory Final, August 16, 2010 18
Table 6-1. Uncontrolled Emissions for Survey Respondents P5
Number County Commodity HRVOC Species
HRVOC Species Emissions (tpy)
Total VOC Emissions (tpy)
033898 Brazoria Propylene Propylene 0.7 0.7 033898 Galveston Ethylene Ethylene 1.7 1.7 033898 Galveston Propylene Propylene 1.1 1.1 105972 Brazoria Chemical Grade Propylene Propylene 1.9 2.0 105972 Brazoria Ethylene Ethylene 4.2 4.2 105972 Brazoria Polymer Grade Propylene Propylene 3.3 3.3 105972 Brazoria Propylene Propylene 1.8 1.8 105972 Chambers 1,3-Butadiene 1,3-Butadiene 0.4 0.4 105972 Chambers Ethylene Ethylene 0.3 0.3 105972 Galveston 1,3-Butadiene 1,3-Butadiene 1.8 1.8 105972 Galveston Chemical Grade Propylene Propylene 3.8 4.0 105972 Galveston Ethylene Ethylene 4.8 4.8 105972 Galveston Polymer Grade Propylene Propylene 1.6 1.6 105972 Galveston Propylene Propylene 0.7 0.7 105972 Harris 1,3-Butadiene 1,3-Butadiene 5.7 5.7 105972 Harris Chemical Grade Propylene Propylene 1.1 1.1 105972 Harris Crude Butadiene 1,3-Butadiene 2.9 3.6 105972 Harris Ethylene Ethylene 8.6 8.6 105972 Harris Propylene Propylene 0.4 0.4 105972 Liberty Ethylene Ethylene 1.1 1.1 105988 Chambers 1,3-Butadiene 1,3-Butadiene 0.2 0.2 105988 Liberty 1,3-Butadiene 1,3-Butadiene 0.9 0.9 172240 Brazoria Crude Butadiene 1,3-Butadiene 10.2 12.7 172240 Galveston Crude Butadiene 1,3-Butadiene 2.1 2.7 172240 Harris 1,3-Butadiene 1,3-Butadiene 1.2 1.2 172240 Harris Crude Butadiene 1,3-Butadiene 0.2 0.3 253316 Brazoria Ethylene Ethylene 41.7 41.7 253316 Brazoria Propylene Propylene 39.9 39.9 253316 Chambers Crude Butadiene 1,3-Butadiene 0.6 0.8 253316 Chambers Ethylene Ethylene 3.4 3.4 253316 Chambers Propylene Propylene 3.7 3.7 253316 Galveston Ethylene Ethylene 2.9 2.9 253316 Galveston Propylene Propylene 3.2 3.2 253316 Harris 1,3-Butadiene 1,3-Butadiene 30.6 30.6 253316 Harris Crude Butadiene 1,3-Butadiene 15.6 19.5 253316 Harris Ethylene Ethylene 44.4 44.4 253316 Harris Propylene Propylene 42.1 42.1 253368 Chambers Propylene Propylene 10.2 10.2 253368 Galveston Propylene Propylene 3.9 3.9 253368 Harris Propylene Propylene 11.2 11.2 257129 Chambers 1,3-Butadiene 1,3-Butadiene 9.9 9.9 257129 Chambers Ethylene Ethylene 102.5 102.5 257129 Chambers Polymer Grade Propylene Propylene 9.1 9.1 257129 Chambers Propylene Propylene 111.3 111.3 257129 Galveston Dilute Propylene Propylene 8.3 15.0

Table 6-1. Continued
TCEQ, Pipeline Inventory Final, August 16, 2010
19
P5 Number County Commodity
HRVOC Species
HRVOC Species Emissions (tpy)
Total VOC Emissions (tpy)
257129 Harris 1,3-Butadiene 1,3-Butadiene 71.7 71.7 257129 Harris Chemical Grade Propylene Propylene 11.9 12.6 257129 Harris Crude Butadiene 1,3-Butadiene 34.3 42.8 257129 Harris Dilute Propylene Propylene 20.5 37.4 257129 Harris Ethylene Ethylene 46.8 46.8 257129 Harris Polymer Grade Propylene Propylene 15.8 15.9 257155 Harris Propylene Propylene 4.3 4.3 257155 Liberty Ethylene Ethylene 0.3 0.3
407792 Harris Propane/
Propylene Propylene 38.0 54.3 525390 Galveston Propylene Propylene 0.0 0.0 597145 Chambers Propylene Propylene 3.2 3.2 597145 Harris Propylene Propylene 1.4 1.4 597145 Montgomery Propylene Propylene 1.6 1.6 630152 Brazoria Polymer Grade Propylene Propylene 3.4 3.4 840745 Chambers Ethylene Ethylene 11.2 11.2 840745 Chambers Propylene Propylene 11.5 11.5 845725 Montgomery Propylene Propylene 2.4 2.4 875645 Chambers Ethylene Gas Ethylene 15.9 15.9 881250 Galveston Propylene Propylene 2.7 2.7 881250 Harris Propylene Propylene 3.5 3.5
Total VOC Emissions 915.0 Total Ethylene Emissions 289.7
Total Propylene Emissions 379.5 Total 1,3-Butadiene Emissions 188.3
Total HRVOC Emissions 857.5

TCEQ, Pipeline Inventory Final, August 16, 2010
20
valves in light liquid service for 8,760 hours per year. Using Equation 3-2, the total TOC
emissions were calculated as follows:
ETOC = (EFflange × Nflange × H) + (EFvalve × Nvalve × H)
ETOC = (0.00183 kg TOC/hour × 24 flanges × 8760 hours) + (0.00403 kg TOC/hour × 12 valves × 8760 hours) = 384.74 kg TOC + 423.63 kg TOC = 808.37 kg TOC = 0.891 tons TOC/year
Since the 1,3-butadiene commodity is assumed to be 100% 1,3-butadiene, then the uncontrolled
1,3-butadiene emissions in Liberty County were also 0.891 tons/year.
After uncontrolled emissions estimates for the survey data were developed, ERG developed
commodity-specific profiles that could be used to extrapolate emissions for other pipeline
systems. These profiles were developed by dividing the commodity-specific VOC and species
emissions by the commodity-specific pipeline length. Only those commodity-specific pipeline
lengths for which component counts were reported (i.e., survey Table 3’s were completed) were
used to develop the commodity-specific profiles. The development steps are shown below for
chemical grade propylene.
All chemical grade propylene line items from Table 6-1 were extracted and are presented
in Table 6-2. The species and VOC emissions were summed and then divided by the total
pipeline miles associated with chemical grade propylene.
Table 6-2. Uncontrolled Emissions for Chemical Grade Propylene Survey Respondents
P5 Number County Commodity
HRVOC Species
HRVOC Species
Emissions (tpy)
Total VOC Emissions
(tpy) Pipeline
Miles 105972 Brazoria Chemical Grade Propylene Propylene 1.9 2.0 105972 Galveston Chemical Grade Propylene Propylene 3.8 4.0 105972 Harris Chemical Grade Propylene Propylene 1.1 1.1
47.6
257129 Harris Chemical Grade Propylene Propylene 11.9 12.6 119.6 Total Chemical Grade Propylene Propylene 18.7 19.7 167.2
Commodity HRVOC Species
HRVOC Species/Mile
(tpy/mile)
Total VOC/Mile (tpy/mile)
Profile Chemical Grade Propylene Propylene 0.11 0.12
TCEQ, Pipeline Inventory Final, August 16, 2010
21
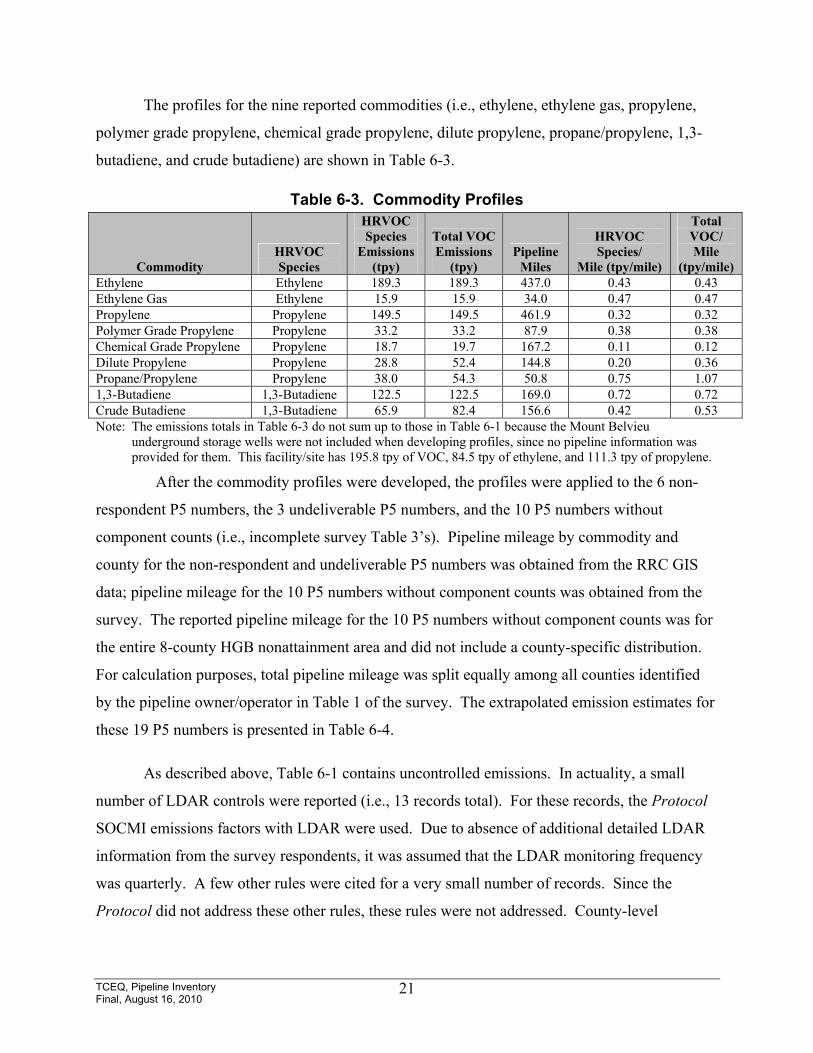
The profiles for the nine reported commodities (i.e., ethylene, ethylene gas, propylene,
polymer grade propylene, chemical grade propylene, dilute propylene, propane/propylene, 1,3-
butadiene, and crude butadiene) are shown in Table 6-3.
Table 6-3. Commodity Profiles
Commodity HRVOC Species
HRVOC Species
Emissions (tpy)
Total VOC Emissions
(tpy) Pipeline
Miles
HRVOC Species/
Mile (tpy/mile)
Total VOC/ Mile
(tpy/mile) Ethylene Ethylene 189.3 189.3 437.0 0.43 0.43 Ethylene Gas Ethylene 15.9 15.9 34.0 0.47 0.47 Propylene Propylene 149.5 149.5 461.9 0.32 0.32 Polymer Grade Propylene Propylene 33.2 33.2 87.9 0.38 0.38 Chemical Grade Propylene Propylene 18.7 19.7 167.2 0.11 0.12 Dilute Propylene Propylene 28.8 52.4 144.8 0.20 0.36 Propane/Propylene Propylene 38.0 54.3 50.8 0.75 1.07 1,3-Butadiene 1,3-Butadiene 122.5 122.5 169.0 0.72 0.72 Crude Butadiene 1,3-Butadiene 65.9 82.4 156.6 0.42 0.53 Note: The emissions totals in Table 6-3 do not sum up to those in Table 6-1 because the Mount Belvieu
underground storage wells were not included when developing profiles, since no pipeline information was provided for them. This facility/site has 195.8 tpy of VOC, 84.5 tpy of ethylene, and 111.3 tpy of propylene.
After the commodity profiles were developed, the profiles were applied to the 6 non-
respondent P5 numbers, the 3 undeliverable P5 numbers, and the 10 P5 numbers without
component counts (i.e., incomplete survey Table 3’s). Pipeline mileage by commodity and
county for the non-respondent and undeliverable P5 numbers was obtained from the RRC GIS
data; pipeline mileage for the 10 P5 numbers without component counts was obtained from the
survey. The reported pipeline mileage for the 10 P5 numbers without component counts was for
the entire 8-county HGB nonattainment area and did not include a county-specific distribution.
For calculation purposes, total pipeline mileage was split equally among all counties identified
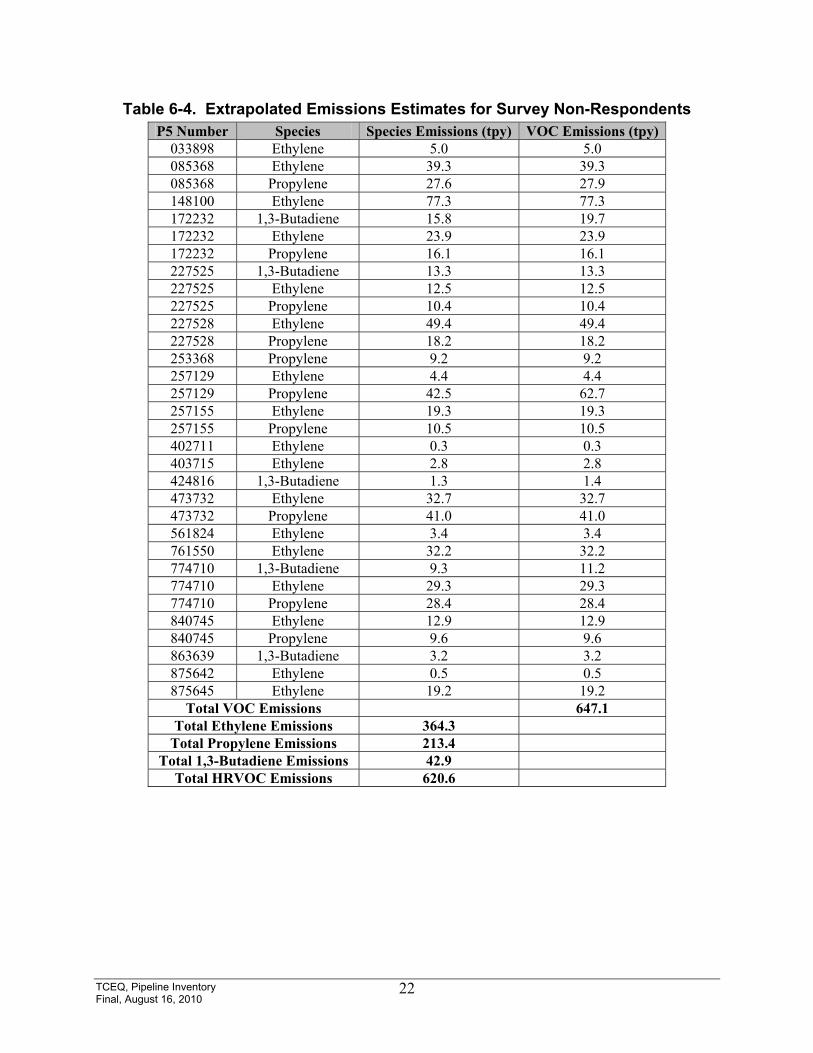
by the pipeline owner/operator in Table 1 of the survey. The extrapolated emission estimates for
these 19 P5 numbers is presented in Table 6-4.
As described above, Table 6-1 contains uncontrolled emissions. In actuality, a small
number of LDAR controls were reported (i.e., 13 records total). For these records, the Protocol
SOCMI emissions factors with LDAR were used. Due to absence of additional detailed LDAR
information from the survey respondents, it was assumed that the LDAR monitoring frequency
was quarterly. A few other rules were cited for a very small number of records. Since the
Protocol did not address these other rules, these rules were not addressed. County-level
TCEQ, Pipeline Inventory Final, August 16, 2010
22
Table 6-4. Extrapolated Emissions Estimates for Survey Non-Respondents P5 Number Species Species Emissions (tpy) VOC Emissions (tpy)
033898 Ethylene 5.0 5.0 085368 Ethylene 39.3 39.3 085368 Propylene 27.6 27.9 148100 Ethylene 77.3 77.3 172232 1,3-Butadiene 15.8 19.7 172232 Ethylene 23.9 23.9 172232 Propylene 16.1 16.1 227525 1,3-Butadiene 13.3 13.3 227525 Ethylene 12.5 12.5 227525 Propylene 10.4 10.4 227528 Ethylene 49.4 49.4 227528 Propylene 18.2 18.2 253368 Propylene 9.2 9.2 257129 Ethylene 4.4 4.4 257129 Propylene 42.5 62.7 257155 Ethylene 19.3 19.3 257155 Propylene 10.5 10.5 402711 Ethylene 0.3 0.3 403715 Ethylene 2.8 2.8 424816 1,3-Butadiene 1.3 1.4 473732 Ethylene 32.7 32.7 473732 Propylene 41.0 41.0 561824 Ethylene 3.4 3.4 761550 Ethylene 32.2 32.2 774710 1,3-Butadiene 9.3 11.2 774710 Ethylene 29.3 29.3 774710 Propylene 28.4 28.4 840745 Ethylene 12.9 12.9 840745 Propylene 9.6 9.6 863639 1,3-Butadiene 3.2 3.2 875642 Ethylene 0.5 0.5 875645 Ethylene 19.2 19.2
Total VOC Emissions 647.1 Total Ethylene Emissions 364.3
Total Propylene Emissions 213.4 Total 1,3-Butadiene Emissions 42.9
Total HRVOC Emissions 620.6
TCEQ, Pipeline Inventory Final, August 16, 2010
23
Table 6-5. Controlled and Uncontrolled Emissions for Survey Respondents Controlled Emissions (with LDAR) Uncontrolled Emissions
County HRVOC Species HRVOC Species Emissions (tpy)
Total VOC Emissions (tpy)
HRVOC Species Emissions (tpy)
Total VOC Emissions (tpy)
Brazoria 1,3-Butadiene 10.2 12.7 10.2 12.7 Brazoria Ethylene 38.7 38.7 45.9 45.9 Brazoria Propylene 50.9 51.0 50.9 51.0 Chambers 1,3-Butadiene 11.2 11.4 11.2 11.4 Chambers Ethylene 104.1 104.1 133.3 133.3 Chambers Propylene 110.9 110.9 149.0 149.0 Galveston 1,3-Butadiene 3.9 4.4 3.9 4.4 Galveston Ethylene 9.4 9.4 9.4 9.4 Galveston Propylene 25.3 32.2 25.3 32.2 Harris 1,3-Butadiene 159.0 171.9 162.1 175.4 Harris Ethylene 89.5 89.5 99.8 99.8 Harris Propylene 150.4 184.2 150.4 184.2 Liberty 1,3-Butadiene 0.9 0.9 0.9 0.9 Liberty Ethylene 1.4 1.4 1.4 1.4 Montgomery Propylene 4.0 4.0 4.0 4.0
Total VOC Emissions 826.8 915.0 Total Ethylene Emissions 243.1 289.7
Total Propylene Emissions 341.5 379.5 Total 1,3-Butadiene Emissions 185.2 188.3
Total HRVOC Emissions 769.8 857.5
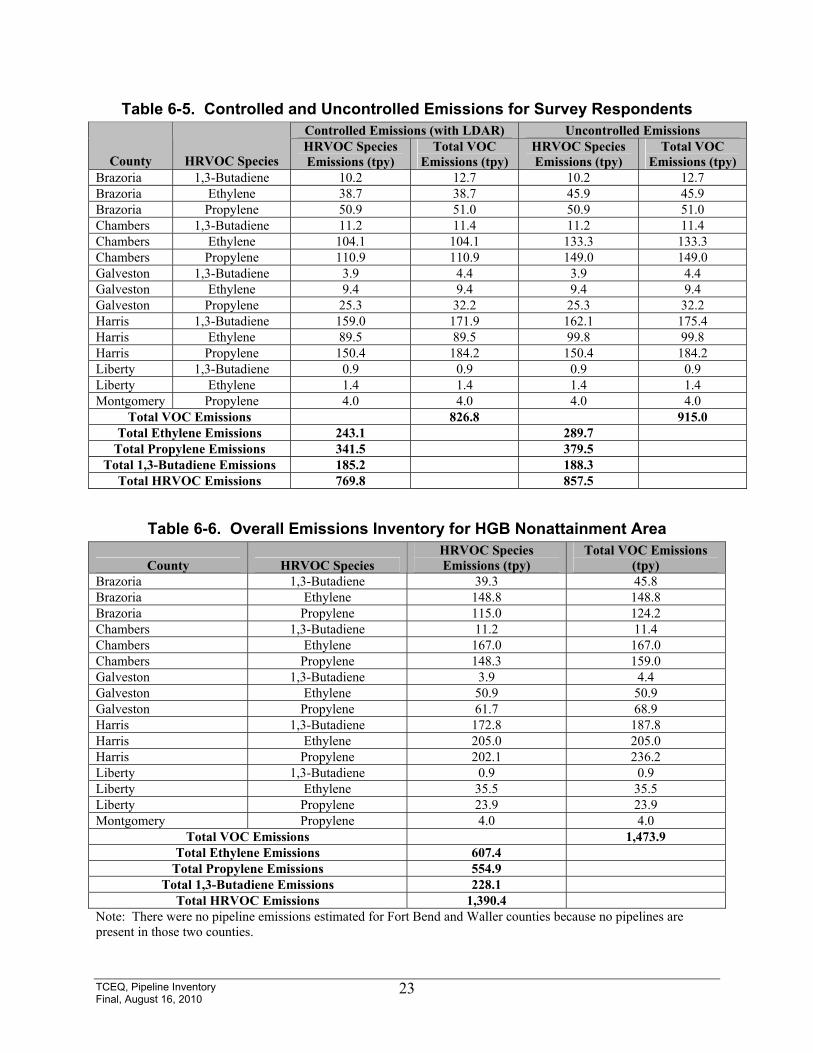
Table 6-6. Overall Emissions Inventory for HGB Nonattainment Area
County HRVOC Species HRVOC Species Emissions (tpy)
Total VOC Emissions (tpy)
Brazoria 1,3-Butadiene 39.3 45.8 Brazoria Ethylene 148.8 148.8 Brazoria Propylene 115.0 124.2 Chambers 1,3-Butadiene 11.2 11.4 Chambers Ethylene 167.0 167.0 Chambers Propylene 148.3 159.0 Galveston 1,3-Butadiene 3.9 4.4 Galveston Ethylene 50.9 50.9 Galveston Propylene 61.7 68.9 Harris 1,3-Butadiene 172.8 187.8 Harris Ethylene 205.0 205.0 Harris Propylene 202.1 236.2 Liberty 1,3-Butadiene 0.9 0.9 Liberty Ethylene 35.5 35.5 Liberty Propylene 23.9 23.9 Montgomery Propylene 4.0 4.0
Total VOC Emissions 1,473.9 Total Ethylene Emissions 607.4
Total Propylene Emissions 554.9 Total 1,3-Butadiene Emissions 228.1
Total HRVOC Emissions 1,390.4 Note: There were no pipeline emissions estimated for Fort Bend and Waller counties because no pipelines are present in those two counties.
TCEQ, Pipeline Inventory Final, August 16, 2010
24
controlled emissions including the effects of LDAR are presented in Table 6-5; uncontrolled
emissions are also included for comparison purposes.
The overall inventory contains both the extrapolated emission estimates from Table 6-4 and
the controlled emissions estimates from Table 6-5. This overall inventory is presented in Table 6-6.
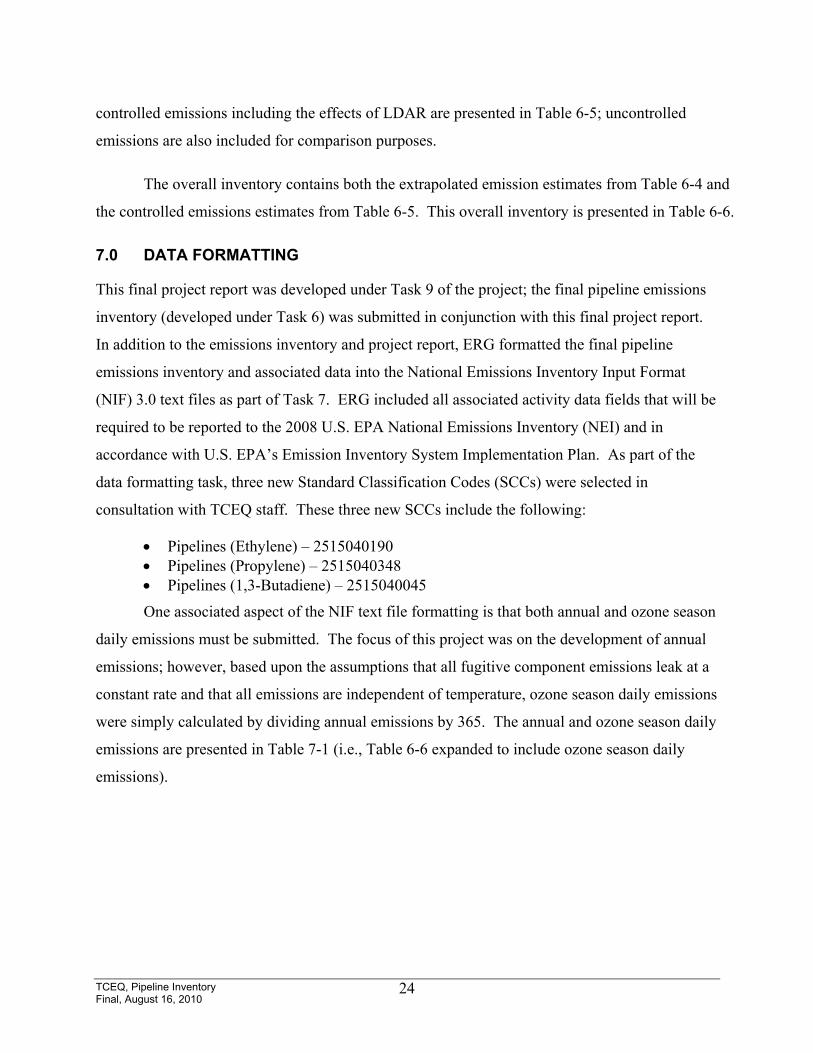
7.0 DATA FORMATTING
This final project report was developed under Task 9 of the project; the final pipeline emissions
inventory (developed under Task 6) was submitted in conjunction with this final project report.
In addition to the emissions inventory and project report, ERG formatted the final pipeline
emissions inventory and associated data into the National Emissions Inventory Input Format
(NIF) 3.0 text files as part of Task 7. ERG included all associated activity data fields that will be
required to be reported to the 2008 U.S. EPA National Emissions Inventory (NEI) and in
accordance with U.S. EPA’s Emission Inventory System Implementation Plan. As part of the
data formatting task, three new Standard Classification Codes (SCCs) were selected in
consultation with TCEQ staff. These three new SCCs include the following:
• Pipelines (Ethylene) – 2515040190 • Pipelines (Propylene) – 2515040348 • Pipelines (1,3-Butadiene) – 2515040045
One associated aspect of the NIF text file formatting is that both annual and ozone season
daily emissions must be submitted. The focus of this project was on the development of annual
emissions; however, based upon the assumptions that all fugitive component emissions leak at a
constant rate and that all emissions are independent of temperature, ozone season daily emissions
were simply calculated by dividing annual emissions by 365. The annual and ozone season daily
emissions are presented in Table 7-1 (i.e., Table 6-6 expanded to include ozone season daily
emissions).

TCEQ, Pipeline Inventory Final, August 16, 2010
25
Table 7-1. Overall Emissions Inventory for HGB Nonattainment Area (Annual and Ozone Season Daily)
County HRVOC Species
Annual HRVOC Species Emissions
(tpy)
Annual Total VOC Emissions
(tpy)
Ozone Season Daily HRVOC Species Emissions (tpd)
Ozone Season Daily Total VOC Emissions (tpy)
Brazoria 1,3-Butadiene 39.3 45.8 0.107 0.126 Brazoria Ethylene 148.8 148.8 0.408 0.408 Brazoria Propylene 115.0 124.2 0.315 0.340 Chambers 1,3-Butadiene 11.2 11.4 0.031 0.031 Chambers Ethylene 167.0 167.0 0.458 0.458 Chambers Propylene 148.3 159.0 0.406 0.436 Galveston 1,3-Butadiene 3.9 4.4 0.011 0.012 Galveston Ethylene 50.9 50.9 0.139 0.139 Galveston Propylene 61.7 68.9 0.169 0.189 Harris 1,3-Butadiene 172.8 187.8 0.473 0.515 Harris Ethylene 205.0 205.0 0.562 0.562 Harris Propylene 202.1 236.2 0.554 0.647 Liberty 1,3-Butadiene 0.9 0.9 0.002 0.002 Liberty Ethylene 35.5 35.5 0.097 0.097 Liberty Propylene 23.9 23.9 0.065 0.065 Montgomery Propylene 4.0 4.0 0.011 0.011
Total VOC Emissions 1,473.9 4.038 Total Ethylene Emissions 607.4 1.664
Total Propylene Emissions 554.9 1.520 Total 1,3-Butadiene
Emissions 228.1 0.625
Total HRVOC Emissions 1,390.4 3.809 Note: There were no pipeline emissions estimated for Fort Bend and Waller counties because no pipelines are present in those
two counties.
8.0 POTENTIAL IDEAS FOR FUTURE WORK
Although this final project report and the associated emissions inventory signify the
completion of this project, this project also represents the first step in quantifying emissions from
a source category that was previously uninventoried. Through the course of the project, a
number of suggestions were identified for potential future work associated with this source
category. These suggestions are included below:
• Expanded geographic area – This project was limited to the eight-county HGB ozone nonattainment area. Based upon survey responses, it is clear that total pipeline length is greater than the eight-county pipeline length. This is supported by Figures 2-1 through 2-3, which show pipelines extending out of the HGB ozone nonattainment area from Brazoria, Chambers, Liberty, and Montgomery counties. Expansion of the survey to other areas would be useful. The Beaumont-Port Arthur nonattainment area (i.e., Hardin, Jefferson, and Orange counties) would be of particular interest, as well as the Victoria and Corpus Christi near nonattainment areas.

TCEQ, Pipeline Inventory Final, August 16, 2010
26
• Expanded pollutants – Based upon §115.10(18)(A,B), HRVOCs include ethylene and propylene in the eight-county HGB ozone nonattainment area, as well as 1,3-butadiene in Harris County, only. In addition, HRVOCs also include all isomers of butene (i.e., isobutene [2-methylpropene or isobutylene], alpha-butylene [ethylethylene], and beta-butylene [dimethylethylene, including both cis- and trans-isomers]) in Harris County. Butene is identified as a pipeline commodity by the RRC database. Therefore, it may make sense to try to quantify butene emissions. In addition, expansion of the survey to pipelines with other important commodities that are not crude oil or natural gas (e.g., toluene, xylenes, etc.) may be appropriate.
• Unique components – As indicated in Section 6.0, several unique components (e.g., needle valves, gauges, trap doors, etc.) were identified in the survey, but emissions could not be estimated due to a lack of emission factors in the Protocol. Future work might include better characterization in order to assess emissions potential.
• Recontacting of non-respondents – As presented in Table 6-4, emission estimates were extrapolated for 20 P5 numbers. The existence of some of these still has not been positively established. In addition, at least one non-respondent indicated that they could not complete the survey within the allotted time and would need until September 2010 to complete the survey. Finally, emissions for 11 P5 numbers were extrapolated because component counts were not provided Table 3 of the survey. Continued work to complete and/or improve Table 3 component counts would reduce the need for extrapolation and decrease the overall inventory uncertainty.
• Refinement of pipeline locations – All survey respondents provided pipeline lengths, but only some provided geographic coordinates for site locations. Although these site location coordinates are not provided in this report, these may be useful to TCEQ in the future. Additional follow-up to increase the quality and quantity of these geographic coordinates may be appropriate.
9.0 REFERENCES
ExxonMobil, 2010. ExxonMobil Dilute Propylene Tariff. Internet address: http://www.exxonmobil.com/Files/EMPCo/ET149.pdf
Hayes, 2010. Personal communication between Kelly Hayes (ConocoPhillips) and Gopi Manne (ERG). August 2.
TCEQ, 2009. 2009 Emissions Inventory Guidelines (Appendix A, Technical Supplement 3: Equipment Leak Fugitives). RG-360A/09. Texas Commission on Environmental Quality, Air Quality Division. Internet address: http://www.tceq.state.tx.us/comm_exec/forms_pubs/pubs/rg/ rg-360_09/index.html.
Tomerlin, 2010. Personal communication between Mike Tomerlin (HSC Pipeline Partnership) and Gopi Manne (ERG). August 10.
U.S. EPA, 1995. 1995 Protocol for Equipment Leak Emission Estimates. EPA-453/R-95-017. U.S. Environmental Protection Agency, Office of Air Quality Planning and Standards, Emission Standards Division, Research Triangle Park, NC. November 1995. Internet address: http://www.epa.gov/ttnchie1/efdocs/equiplks.pdf.

TCEQ, Pipeline Inventory Final, August 16, 2010
27
Vaughn and Daniel, 2010. Personal communication between Randy Vaughn and Ricky Daniel (Railroad Commission of Texas, District 3 Office [Houston]) and Gopi Manne (ERG). June 1, 2010.
Williams, 2010. Personal communication between Terry Williams (Buckeye Gulf Coast Pipeline) and Gopi Manne (ERG). August 2.
APPENDIX A
SAMPLE SURVEY QUESTIONNAIRE (P5 #033898)
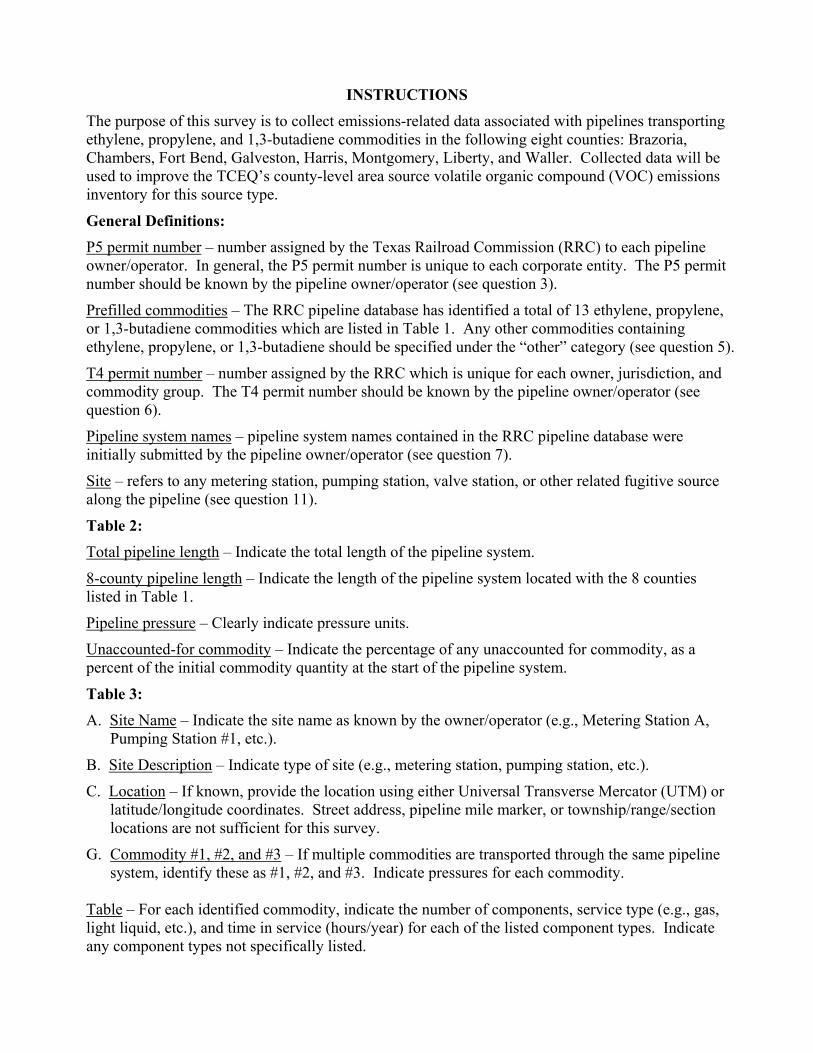
INSTRUCTIONS
The purpose of this survey is to collect emissions-related data associated with pipelines transporting ethylene, propylene, and 1,3-butadiene commodities in the following eight counties: Brazoria, Chambers, Fort Bend, Galveston, Harris, Montgomery, Liberty, and Waller. Collected data will be used to improve the TCEQ’s county-level area source volatile organic compound (VOC) emissions inventory for this source type.
General Definitions:
P5 permit number – number assigned by the Texas Railroad Commission (RRC) to each pipeline owner/operator. In general, the P5 permit number is unique to each corporate entity. The P5 permit number should be known by the pipeline owner/operator (see question 3).
Prefilled commodities – The RRC pipeline database has identified a total of 13 ethylene, propylene, or 1,3-butadiene commodities which are listed in Table 1. Any other commodities containing ethylene, propylene, or 1,3-butadiene should be specified under the “other” category (see question 5).
T4 permit number – number assigned by the RRC which is unique for each owner, jurisdiction, and commodity group. The T4 permit number should be known by the pipeline owner/operator (see question 6).
Pipeline system names – pipeline system names contained in the RRC pipeline database were initially submitted by the pipeline owner/operator (see question 7).
Site – refers to any metering station, pumping station, valve station, or other related fugitive source along the pipeline (see question 11).
Table 2:
Total pipeline length – Indicate the total length of the pipeline system.
8-county pipeline length – Indicate the length of the pipeline system located with the 8 counties listed in Table 1.
Pipeline pressure – Clearly indicate pressure units.
Unaccounted-for commodity – Indicate the percentage of any unaccounted for commodity, as a percent of the initial commodity quantity at the start of the pipeline system.
Table 3: A. Site Name – Indicate the site name as known by the owner/operator (e.g., Metering Station A,
Pumping Station #1, etc.).
B. Site Description – Indicate type of site (e.g., metering station, pumping station, etc.).
C. Location – If known, provide the location using either Universal Transverse Mercator (UTM) or latitude/longitude coordinates. Street address, pipeline mile marker, or township/range/section locations are not sufficient for this survey.
G. Commodity #1, #2, and #3 – If multiple commodities are transported through the same pipeline system, identify these as #1, #2, and #3. Indicate pressures for each commodity.
Table – For each identified commodity, indicate the number of components, service type (e.g., gas, light liquid, etc.), and time in service (hours/year) for each of the listed component types. Indicate any component types not specifically listed.

P5 = 033898 TCEQ Pipeline Survey – General Questions
1) Company name of pipeline operator: __________________________________________ 2) Are you the pipeline owner (Y/N)?: ____ If no, identify the owner: ________________
3) Is the P5 permit number in the top right corner of this page correct (Y/N)?: ____
If incorrect, please specify the correct P5 number: ______________________
4) Are any of the pipelines under this P5 permit number located in one or more of the 8 counties listed in Table 1 (Y/N)?: ___
If no, skip Questions 5 through 12, complete Questions 13 through 17, and return the survey. If yes, proceed to Question 5. 5) Do any of the pipelines under this P5 permit number transport any of the 13 commodities
listed in Table 1 (Y/N)?: _____ If no, skip Questions 6 through 12, complete Questions 13 through 17, and return the survey. If yes, proceed to Question 6.
6) Does Table A contain all relevant T4 permit numbers under this P5 permit (Y/N)?: ____
If not, list additional T4 permit numbers:_______________________________________
7) Does Table B contain all relevant pipeline system names under this P5 permit (Y/N)?:__ If not, list additional pipeline system names (new T4 permit numbers listed under Question 6 will require a response):___________________________________________ ________________________________________________________________________
8) For all pipeline systems under this P5 permit (Table B plus response to Question 7), indicate in Table 1 counties where each pipeline is located.
9) For all pipeline systems under this P5 permit (Table B plus response to Question 7), indicate
in Table 1 commodities transported by each pipeline.
10) For all pipeline systems under this P5 permit (Table B plus response to Question 7), complete Table 2.
11) For each site located on a pipeline system in one of the counties listed in Table 1, fill out
Table 3. Use additional sheets if necessary.
12) Is your pipeline/site subject to any of the following rules: A) Hazardous Organic NESHAPS (HON):___ B) SOCMI/NSPS:__ C) LDAR:__ D) Other Rule (specify:___________________):__
13) Contact Name: ___________________________________________________ 14) Contact Title: ____________________________________________________ 15) Operator mailing address:_________________________________________________ 16) Contact Phone: _________________ 17) Contact E-mail: ____________________
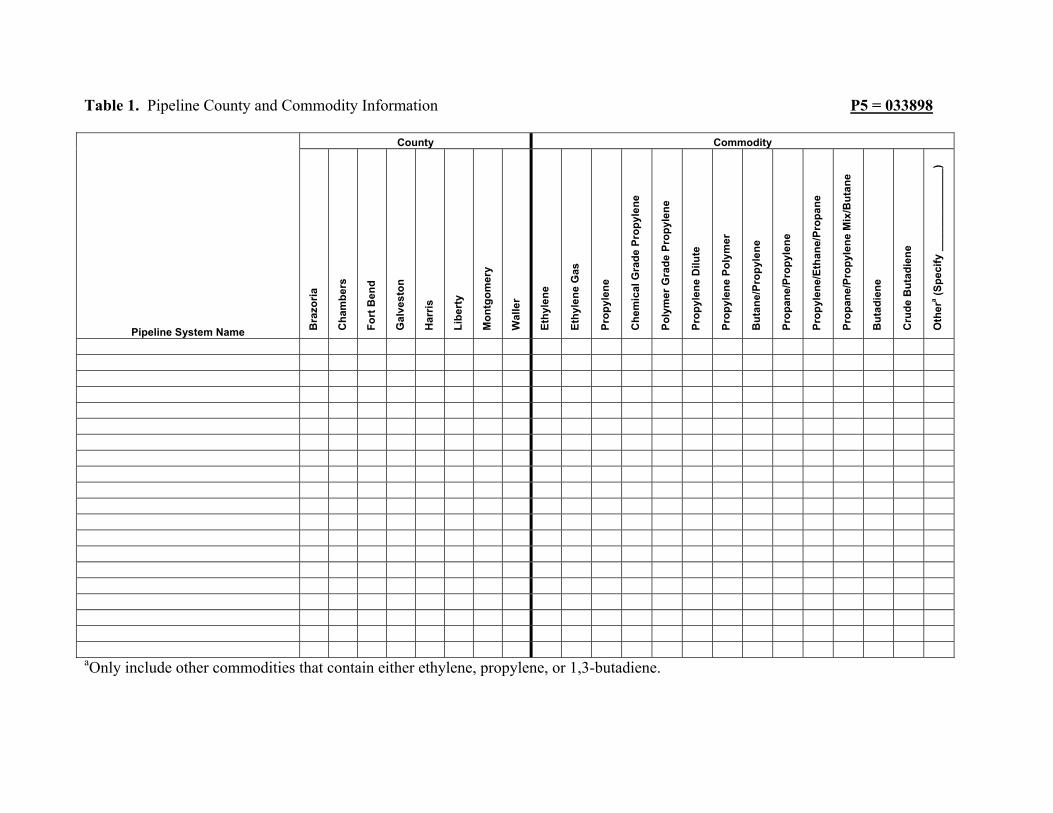
Table 1. Pipeline County and Commodity Information P5 = 033898
County Commodity
Pipeline System Name Bra
zoria
Cha
mbe
rs
Fort
Ben
d
Gal
vest
on
Har
ris
Libe
rty
Mon
tgom
ery
Wal
ler
Ethy
lene
Ethy
lene
Gas
Prop
ylen
e
Che
mic
al G
rade
Pro
pyle
ne
Poly
mer
Gra
de P
ropy
lene
Prop
ylen
e D
ilute
Prop
ylen
e Po
lym
er
But
ane/
Prop
ylen
e
Prop
ane/
Prop
ylen
e
Prop
ylen
e/Et
hane
/Pro
pane
Prop
ane/
Prop
ylen
e M
ix/B
utan
e
But
adie
ne
Cru
de B
utad
iene
Oth
era (S
peci
fy _
____
____
____
_)
aOnly include other commodities that contain either ethylene, propylene, or 1,3-butadiene.
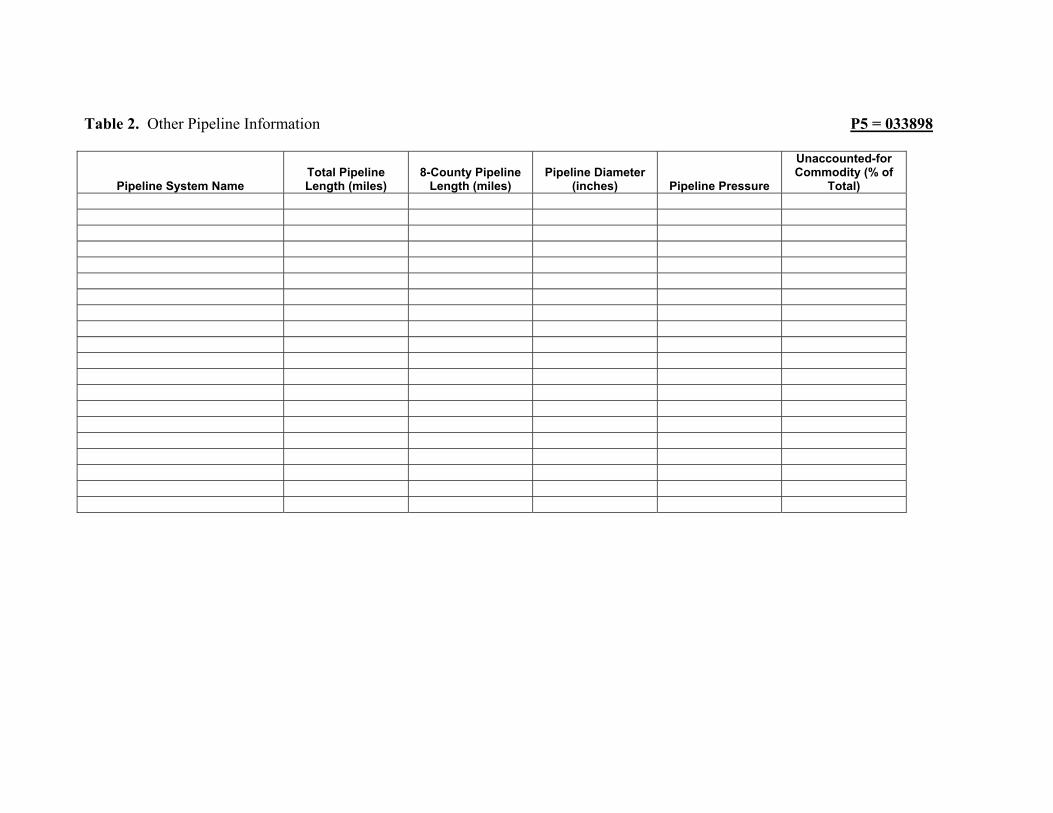
Table 2. Other Pipeline Information P5 = 033898
Pipeline System Name Total Pipeline Length (miles)
8-County Pipeline Length (miles)
Pipeline Diameter (inches) Pipeline Pressure
Unaccounted-for Commodity (% of
Total)

Table 3: Site Information. Fill out the following table for each site. P5 = 033898
A. Site Name: G. Commodity #1: Pressure #1: B. Site Description: Commodity #2: Pressure #2: C. Site Location (UTM or Lat/Lon Coordinates): Commodity #3: Pressure #3: D. T4 Permit Number: E. Pipeline System Name: F. County:
H. Is site under a Leak Detection and tagged Repair (LDAR) program (Y/N)?____ If yes, please submit LDAR documentation
Commodity #1 Commodity #2 Commodity #3
Component Type # of
components Service
Type
Time in Service (hrs/yr)
# of components
Service Type
Time in Service (hrs/yr)
# of components
Service Type
Time in Service (hrs/yr)
Pumps Valves Compressor (seals) Pressure Relief Devices Connectors Flanges Agitators Open-ended Lines Sampling Connections Other (specify)______________
Other (specify)______________
Other (specify)______________
For questions or concerns regarding this survey, contact Cody McLain (TCEQ) at 572-239-1144 or [email protected].
For technical questions regarding the survey, contact Marty Wolf (ERG) at 916-361-6752 or [email protected].
Please fax the completed survey forms to 916-361-6759 or e-mail to [email protected]. Please return the completed survey no later than July 16, 2010

Table A. List of Applicable T4 Permit Numbers for Operator (P5 Permit # 033898)
Probable T4 Permit Numbers 01047
Table B. List of Applicable Pipeline System Names for Operator (P5 Permit #033898)
Pipeline System Names Pipeline System IDs
ETHYLENE 550456 PROPYLENE 551196
The Table A and Table B data were obtained from a database maintained by the Railroad Commission of Texas (RRC). However, it is possible that the T4 permit numbers, pipeline system names (system IDs), and/or commodities might have changed.