establishing a baseline: public reception, understanding
TRANSCRIPT

Establishing a Baseline: Public Reception, Understanding, and Responses to Severe Weather Forecasts and Warnings in the
Contiguous United States
Reference Report
Carol Silva, Joseph Ripberger, Hank Jenkins-Smith, and Makenzie Krocak
Center for Risk and Crisis Management
University of Oklahoma
August 24, 2017 This report describes the results of a nationwide survey on severe weather in the United States. The Severe Weather and Society Survey (WX17) was designed and administered by the Center for Risk and Crisis Management (CRCM) at the University of Oklahoma. WX17 was fielded in June 2017 using an online questionnaire that was completed by 2,009 U.S. adults (age 18+) that were recruited from an Internet panel that matches the characteristics of the U.S. population as estimated in the U.S. Census. The survey was designed to establish baseline measures of the extent to which U.S. adults receive, understand, and respond to severe weather forecasts and warnings. Additionally, the survey measured public preferences about tradeoffs during the forecast process (e.g., lead time vs. accuracy/precision of warnings), trust in the National Weather Service (NWS), hazard risk literacy, the relative importance of probability and intensity in risk characterization, and the value of geographically specific and continuous severe weather warnings, such as those envisioned by the Forecasting a Continuum of Environmental Threats (FACETs) framework. This report presents an overview of methodology of the survey data collection, data weighting, and a reproduction of the survey instrument with weighted means and frequencies for the questions that elicited numeric responses. The University of Oklahoma provided funding for all data collection. NOAA’s Office of Weather and Air Quality through the U.S. Weather Research Program provided funding for survey design and data analysis.

1
1. INTRODUCTION 1.1. Background The mission of the National Weather Service (NWS) is to provide weather, water, and climate data, forecasts, and warnings for the protection of life and property and enhancement of the national economy. Currently, the NWS uses warning verification statistics (such as probability of detection, false alarm ratio, and warning lead time) to measure the extent to which they are achieving this mission. This measurement strategy assumes that increasing the accuracy and timeliness of forecasts and warnings will generate increases in the protection of life and property. While necessary, improvements to forecasts and warnings are not always sufficient to generate this outcome. Rather, there are many social conditions that must be met. For example, members of the public must receive, understand, and respond to the forecasts and warnings that the NWS issues. If one or more of these conditions are not met, improvements to forecast and warning technology will not necessarily advance the mission of the NWS. As such, we recommend that the NWS consider these and other social conditions when measuring performance before, during, and after policy changes. Accomplishing this task will require at least three things:
1. Valid and reliable indicators of social conditions (such as forecast and warning reception, understanding, and response);
2. Baseline measures of these indicators under the current forecast and warning system; 3. A protocol that will allow the NWS to track these indicators over time and space so that
program managers can empirically detect changes that occur as, when, and where the NWS implements new policies.
In Year 1 of this project, the University of Oklahoma Center for Risk & Crisis Management (CRCM), began working on item one (valid and reliable indicators) by systematically reviewing previous research on forecast and warning reception, understanding, and response. In this review, we identified indicators that currently exist in the literature and gaps in our understanding. Following this review, we used the Oklahoma M-SISNet (Jenkins-Smith et al. 2017), a panel survey of approximately 2,000 residents of Oklahoma, to validate indicators of new concepts that are not yet addressed in the literature. Select results from this research are highlighted in the following conference posters, presentations, and papers (available upon request):
• Krocak, M., and J. Ripberger, 2017: Establishing a Baseline: What We Know about Tornado Warning Reception, Comprehension and Response. 7th Conf. on Research to Operations, Seattle, WA, Amer. Meteor. Soc.
• Ripberger, J., C. Silva, and H. Jenkins-Smith, 2017: Thinking Outside the Polygon: Using Signal Detection Theory to Study Tornado Warning Reception. 7th Conf. on Research to Operations, Seattle, WA, Amer. Meteor. Soc.
• Allen, J., J. Ripberger, V. Ybarra, and E. Cokely, 2017: The Oklahoma Warning Awareness Scale: A Psychometric Analysis of a Brief Self-Report Survey Instrument. Proceedings of the Human Factors and Ergonomics Society Annual Meeting.
• Allen, J., J. Ripberger, V. Ybarra, and E. Cokely, 2017: Tornado Risk Literacy: Beliefs, Biases, and Vulnerability. Proceedings of the International Conference on Naturalistic Decision Making.

2
• Robinson, S., J. Pudlo, and W. Wehde, 2017: Threat Intensity and the Public Use of Warning Information: A Quasi-Experimental Assessment of the New Ecology of Weather Information. Working Paper.
In Year 2 of the project, CRCM designed and fielded a nationwide survey on severe weather in the United States. The Severe Weather and Society Survey (WX17) was fielded June 20-22, 2017 using an online questionnaire that was completed by 2,009 U.S. adults (age 18+) that were recruited from an Internet panel that matches the characteristics of the U.S. population as estimated in the U.S. Census. Pursuant to item two (above), WX17 was designed to establish baseline measures of the extent to which U.S. adults receive, understand, and respond to severe weather forecasts and warnings under the current watch, warning, and advisory (WWA) system. In addition to this set of baseline measures, WX17 measured other social and behavioral factors that the NWS might consider when evaluating performance, including public preferences about tradeoffs during the forecast process (i.e., lead time vs. accuracy/precision of warnings), trust in the NWS (relative to other groups), hazard risk literacy, the relative importance of probability and intensity in risk characterization, and the value of geographically specific and continuous weather warnings, such as those envisioned by the FACETs framework. This report presents an overview of the WX17 sampling and weighting methodology and a reproduction of the survey instrument with weighted frequencies (or means) for the questions that elicited numeric responses. Before that, we provide a brief overview of survey research via the Internet. 1.2. Survey Research via the Internet Technological developments and telecommunication trends, such as the declining number of land-line phones, the increasing use of cellular phones, and the continuing expansion of high speed Internet services, have made probabilistic (often referred to as “random”) sampling of the U.S. national population for the administration of lengthy surveys on complex issues infeasible for several reasons:
• The total universe of households without phone service of any kind is unknown; • Wired phone lines are no longer maintained in a sufficient fraction of U.S. households to
represent the national population, and members of households that do have land-line phone services differ systematically from households without wired phones;
• The number of households with wired phones that are exclusively used for purposes other than routine phone calls, such as home alarms or medical alert services, is unknown;
• The numbers of individuals and households having both a wired phone and a cell phone or those having more than one cell phone are unknown;
• The numbers of households and individuals having access to Internet services suitable for taking web-based surveys is unknown;
• The numbers of individuals who have access to Internet services from their workplace is unknown, and of those, the number of individuals who can take surveys while at work is unknown;
• Cell phones may be unsuitable for lengthy surveys, especially for respondents who are otherwise occupied, and surveys conducted using cell phones may incur costs to prospective respondents that might ultimately discourage survey participation or reduce the quality of data collected; and
3
• Face-to-face interviews or printed postal surveys of the U.S. public require long collection periods, often with low response rates, and are prohibitively expensive for many research projects.
Increasingly, academic quality surveys of the U.S. public on complex subjects, such as severe weather, are being conducted via the Internet. The factors listed above present special challenges for probabilistic sampling due to incomplete information about rapidly evolving telecommunication patterns, Internet accessibility, and the demographic composition of those who have suitable Internet access. With increasing Internet access, the demographics of the online population are becoming more representative of the U.S. population, but samples recruited to participate in Internet surveys cannot be truly random samples of the U.S. public. All surveys, regardless of collection methods, include an element of self-selection bias because even if a perfectly random sample could be constructed, the final decision to participate must be made voluntarily by each respondent, and thus some degree of self-selection is unavoidable. This means that, even when derived from a theoretically perfect random sample, the demographic characteristics of survey respondents may not perfectly reflect U.S. population parameters. Non-probabilistic samples, such as those used to administer surveys of the public via the Internet, involve greater degrees of self-selection because participants first voluntarily agree to enter a pool or stream of U.S. residents willing to take surveys online, and then each member of that group must decide whether to participate in a survey opportunity. This requires the administration of Internet surveys that are as demographically representative as possible, and it warrants caution in presenting findings as statistically representative of views of the entire adult U.S. population. 2. SAMPLING, DEMOGRAPHICS, AND DATA COLLECTION The sample of survey participants for WX17 was provided by Survey Sampling International (SSI), a research and marketing company that maintains a diverse panel of Internet users in the U.S. who have agreed to participate in online surveys. SSI recruits these panelists in multiple ways, including advertisements on web pages, social media, and contact with various online communities. They also utilize affiliate programs and partnerships to recruit participants. For WX17, SSI used a dynamic sampling process (called “Dynamix”) to identify eligible panelists (U.S. resident, age 18+, lives in the contiguous U.S.) and invited them to participate in the survey (by email). To begin, invitations were sent to an anonymous group of panelists that match the demographic characteristics of the target population. As the first group of panelists completed the survey, SSI sent additional invitations to panelists based on demographic targets. If a given group was underrepresented (relative to U.S. Census estimates), SSI sent more invitations to that group; if the group was overrepresented, they sent fewer invitations. This resulted in a diverse sample of survey participants that is generally representative of the U.S. adult population. Table 2.1 demonstrates this representativeness by comparing key national and regional population estimates from the U.S. Census to the demographic characteristics of WX17 respondents.
4
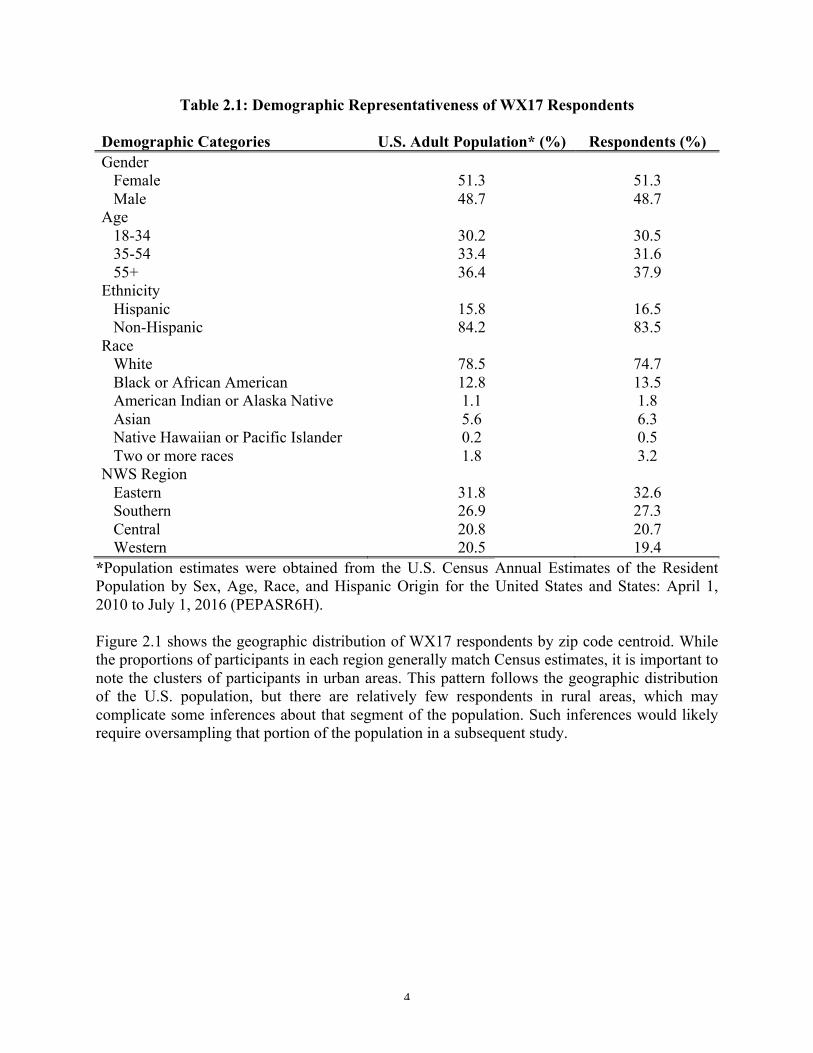
Table 2.1: Demographic Representativeness of WX17 Respondents Demographic Categories U.S. Adult Population* (%) Respondents (%) Gender Female 51.3 51.3 Male 48.7 48.7 Age 18-34 30.2 30.5 35-54 33.4 31.6 55+ 36.4 37.9 Ethnicity Hispanic 15.8 16.5 Non-Hispanic 84.2 83.5 Race White 78.5 74.7 Black or African American 12.8 13.5 American Indian or Alaska Native 1.1 1.8 Asian 5.6 6.3 Native Hawaiian or Pacific Islander 0.2 0.5 Two or more races 1.8 3.2 NWS Region Eastern 31.8 32.6 Southern 26.9 27.3 Central 20.8 20.7 Western 20.5 19.4
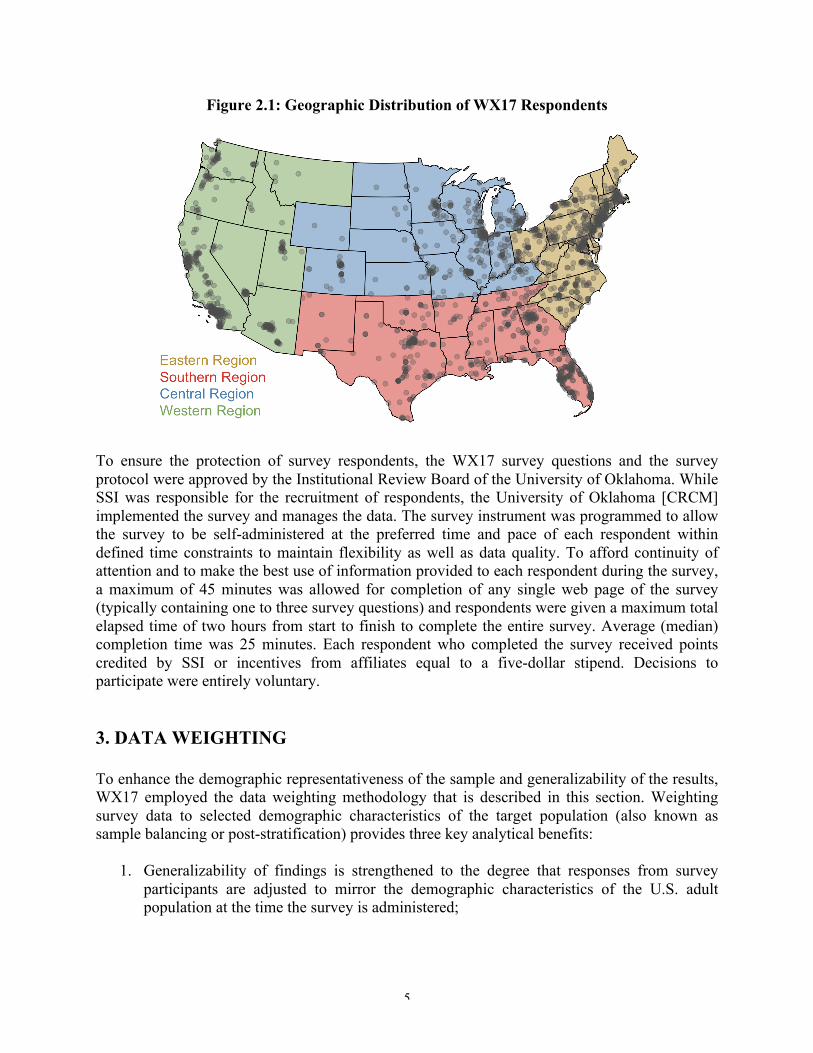
*Population estimates were obtained from the U.S. Census Annual Estimates of the Resident Population by Sex, Age, Race, and Hispanic Origin for the United States and States: April 1, 2010 to July 1, 2016 (PEPASR6H). Figure 2.1 shows the geographic distribution of WX17 respondents by zip code centroid. While the proportions of participants in each region generally match Census estimates, it is important to note the clusters of participants in urban areas. This pattern follows the geographic distribution of the U.S. population, but there are relatively few respondents in rural areas, which may complicate some inferences about that segment of the population. Such inferences would likely require oversampling that portion of the population in a subsequent study.
5
Figure 2.1: Geographic Distribution of WX17 Respondents
To ensure the protection of survey respondents, the WX17 survey questions and the survey protocol were approved by the Institutional Review Board of the University of Oklahoma. While SSI was responsible for the recruitment of respondents, the University of Oklahoma [CRCM] implemented the survey and manages the data. The survey instrument was programmed to allow the survey to be self-administered at the preferred time and pace of each respondent within defined time constraints to maintain flexibility as well as data quality. To afford continuity of attention and to make the best use of information provided to each respondent during the survey, a maximum of 45 minutes was allowed for completion of any single web page of the survey (typically containing one to three survey questions) and respondents were given a maximum total elapsed time of two hours from start to finish to complete the entire survey. Average (median) completion time was 25 minutes. Each respondent who completed the survey received points credited by SSI or incentives from affiliates equal to a five-dollar stipend. Decisions to participate were entirely voluntary. 3. DATA WEIGHTING To enhance the demographic representativeness of the sample and generalizability of the results, WX17 employed the data weighting methodology that is described in this section. Weighting survey data to selected demographic characteristics of the target population (also known as sample balancing or post-stratification) provides three key analytical benefits:
1. Generalizability of findings is strengthened to the degree that responses from survey participants are adjusted to mirror the demographic characteristics of the U.S. adult population at the time the survey is administered;

6
2. Comparability to other studies is strengthened because data weighting minimizes the demographic differences that may arise between this and other samples that match the demographic characteristics of the U.S. adult population;
3. Reliability of trends over time is strengthened because survey data are adjusted to represent continually evolving demographics of the U.S. population, such as the growth of ethnic and racial minority groups. This is especially important for understanding measures that may be influenced by shifts in national demographic characteristics.
To access these benefits, CRCM calculated a weight for each WX17 respondent that accounts for imbalances in gender, age, race, and Hispanic ethnicity within each of the four NWS regions that divide the contiguous U.S. (CONUS)—the Eastern, Southern, Central, and Western regions. The weighting process involved three steps:
1. Calculate the proportion of the U.S. population that shares the demographic characteristics of each respondent (the population proportion);
2. Calculate the proportion of the sample that shares the demographic characteristics of each respondent (the sample proportion);
3. Divide the population proportion by the sample proportion to calculate a weight for each respondent.
This process resulted in a weight factor that indicates how much each case will “count” in weighted analyses. A weight factor of one means that responses from a specified participant are used without adjustment. A weight factor greater than one means that a participant with a given set of demographic attributes is underrepresented in the survey sample (relative to the national population), and responses from that participant receive greater statistical emphasis than responses from survey participants who are represented in direct proportion to the adult population. Conversely, a weight factor smaller than one means that a respondent having a given set of demographic attributes is overrepresented in the survey sample (relative to the adult population), and responses from that participant receive less emphasis than fellow respondents who are represented in direct proportion to the adult population. Weight factors were calculated within NWS regions to facilitate generalization within and comparison across the regions. 4. SURVEY INSTRUMENT, WEIGHTED RESPONSE FREQUENCIES, AND CENTRAL TENDENCIES This section provides a reproduction of the WX17 survey instrument with weighted frequencies or central tendencies for the questions that elicited numeric responses [shown in blue]. This survey involves real policy choices about important issues, and we will provide information that we want you to consider when choosing responses. This means that we need to avoid lengthy interruptions during the survey pro-cess. As previously noted, the survey should take only about 20-25 minutes to complete, but if you exceed 45 minutes on any one survey page, or if you exceed two hours elapsed time from start to finish, your survey will be invalidated and you will not receive compensation. Thank you in advance for your valuable participation. ------------------------End Web pg-----------------------

7
agequalify: How old are you? 0 - Under 18: Thank you for participating. [EXIT] [0.00%] 1 - 18 or older [100.00%] ------------------------End Web pg----------------------- This survey is about extreme weather and involves the analysis of differences among states, regions, and residential settings such as urban, suburban, and rural. It would be very helpful if we could relate your survey to a general loca-tion. We will not use any location information to identify you. You can continue with the survey whether you allow or disallow that information to be provided. location: Can we know your location? 1 - Yes [93.86%] 0 - No [6.14%] ------------------------End Web pg----------------------- [POP UP WINDOW. SHOW IF location = 1] Please select the option in your browser that allows your location to be shared then press next. ------------------------End Web pg----------------------- age: How old are you? [VERBATIM] [Median = 45] edu: What is the highest level of education you have COMPLETED? 1 - Less than high school [4.57%] 2 - High school / GED [31.14%] 3 - Vocational or Technical Training [4.82%] 4 - Some College; NO degree [19.60%] 5 - 2-year College / Associate’s degree [8.49%] 6 - Bachelor’s Degree [18.67%] 7 - Master’s Degree [10.26%] 8 - PhD / JD (Law) / MD [2.45%] gend: Are you male or female? 0 - Female [50.21%] 1 - Male [49.79%] ------------------------End Web pg----------------------- hisp: Do you consider yourself to be Hispanic, Latino, or Spanish or to have Hispanic, Latino, or Spanish origins? 0 - No [84.35%] 1 - Yes [15.65%] race: Which of the following best describes your race? 1 - White [80.35%] 2 - Black or African American [11.35%] 3 - American Indian or Alaska Native [0.23%] 4 - Asian [4.14%] 5 - Native Hawaiian or Pacific Islander [0.02%] 6 - Two or more races [0.68%] 7 - Some other race (please specify) [3.03%] race_spec: [VERBATIM] ------------------------End Web pg-----------------------

8
state: Using the dropdown list, please select the state or district where your primary residence is located. Approximately how long have you resided at your current address or any other address within the same zip code area? long_years: [VERBATIM; REQUIRE NUMERIC] [Median=9] long_months: [VERBATIM, REQUIRE NUMERIC <12] [Median=4] ------------------------End Web pg----------------------- [SHOW IF long_years < 5] last_state: Using the dropdown list, please select the state or district where your previous residence was located. ------------------------End Web pg----------------------- now: Please indicate which of the following statements applies to you. 0 - I am completing this survey from my current primary residence. [79.88%] 1 - I am completing this survey from a location that is not my current primary residence. [20.12%] ------------------------End Web pg----------------------- rural: Which of the following categories best describes the location of your current primary residence? 1 - Urban lot in a densely populated area [26.59%] 2 - Suburban lot in a neighborhood that is near a densely populated area [53.92%] 3 - Rural lot in a sparsely populated area [19.49%] home: Which of the following categories best describes the nature of your current primary residence? 1 - Stand-alone (detached) permanent structure such as a house [68.42%] 2 - Condominium, town-house, or duplex that is attached to another structure [9.84%] 3 - Apartment or dormitory room that is part of a larger residential complex [15.40%] 4 - Mobile home (whether placed on a permanent foundation or not) [5.55%] 5 - Boat, boathouse, ship, dock, or other floating structure [0.00%] 6 - Other type (please specify) [0.80%] home_spec: [VERBATIM] rent: Which of the following categories best describes your living arrangements at your current primary residence? 1 - Live with family or friends and do not pay rent [17.28%] 2 - Pay to rent or lease your primary residence (includes college or other dormitory rooms) [9.84%] 3 - Own your primary residence (includes making mortgage payments or outright ownership with no mortgage pay-ments) [53.63%] ------------------------End Web pg----------------------- adults: Including yourself, How many ADULTS AGE 18 AND OLDER live in your current primary residence? [VERBATIM; REQUIRE NON-ZERO NUMERIC RESPONSE] adults [Median=2] children: How many CHILDREN AGE 17 AND YOUNGER live in your current primary residence? [VERBATIM; REQUIRE NUMERIC RESPONSE] children [Median=0] Do you have any of the following pets at your current primary residence? Please select all that apply. pet_dog: One or more dogs [49.74%] pet_cat: One or more cats [29.19%] pet_bird: One or more birds [3.88%] pet_spec: Something else (please specify) [VERBATIM] ------------------------End Web pg-----------------------
9
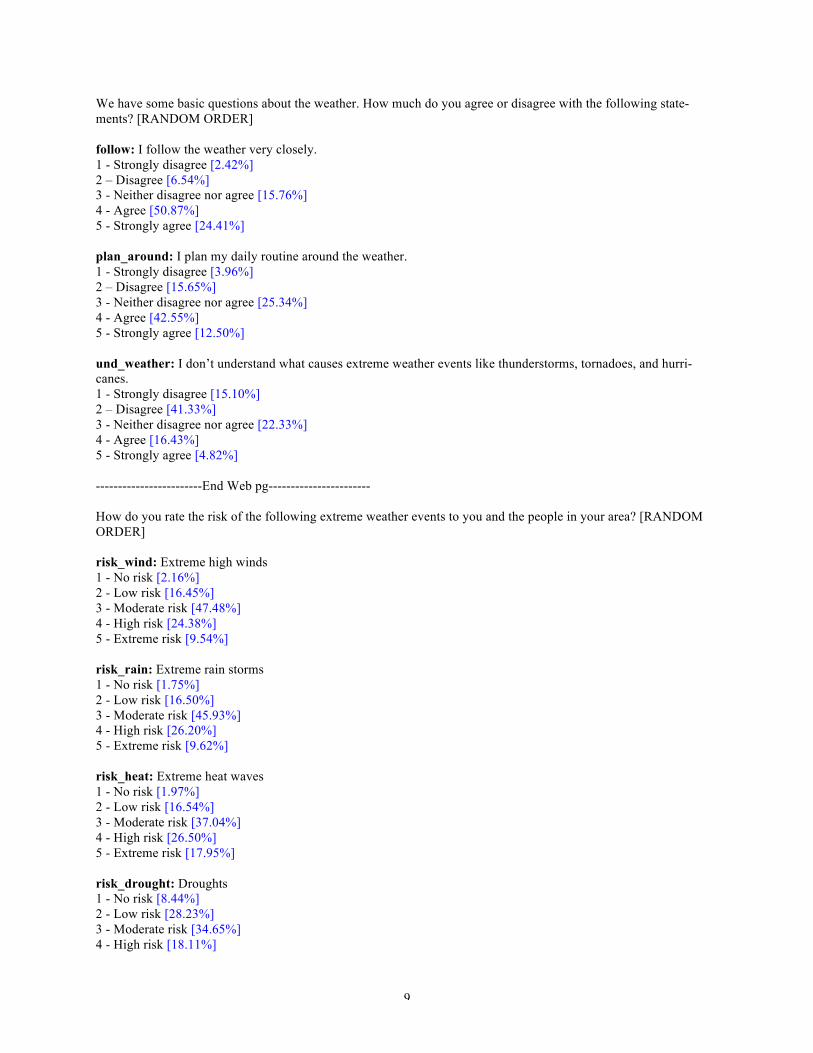
We have some basic questions about the weather. How much do you agree or disagree with the following state-ments? [RANDOM ORDER] follow: I follow the weather very closely. 1 - Strongly disagree [2.42%] 2 – Disagree [6.54%] 3 - Neither disagree nor agree [15.76%] 4 - Agree [50.87%] 5 - Strongly agree [24.41%] plan_around: I plan my daily routine around the weather. 1 - Strongly disagree [3.96%] 2 – Disagree [15.65%] 3 - Neither disagree nor agree [25.34%] 4 - Agree [42.55%] 5 - Strongly agree [12.50%] und_weather: I don’t understand what causes extreme weather events like thunderstorms, tornadoes, and hurri-canes. 1 - Strongly disagree [15.10%] 2 – Disagree [41.33%] 3 - Neither disagree nor agree [22.33%] 4 - Agree [16.43%] 5 - Strongly agree [4.82%] ------------------------End Web pg----------------------- How do you rate the risk of the following extreme weather events to you and the people in your area? [RANDOM ORDER] risk_wind: Extreme high winds 1 - No risk [2.16%] 2 - Low risk [16.45%] 3 - Moderate risk [47.48%] 4 - High risk [24.38%] 5 - Extreme risk [9.54%] risk_rain: Extreme rain storms 1 - No risk [1.75%] 2 - Low risk [16.50%] 3 - Moderate risk [45.93%] 4 - High risk [26.20%] 5 - Extreme risk [9.62%] risk_heat: Extreme heat waves 1 - No risk [1.97%] 2 - Low risk [16.54%] 3 - Moderate risk [37.04%] 4 - High risk [26.50%] 5 - Extreme risk [17.95%] risk_drought: Droughts 1 - No risk [8.44%] 2 - Low risk [28.23%] 3 - Moderate risk [34.65%] 4 - High risk [18.11%]

10
5 - Extreme risk [10.58%] risk_cold: Extreme cold temperatures 1 - No risk [17.23%] 2 - Low risk [27.30%] 3 - Moderate risk [29.28%] 4 - High risk [17.75%] 5 - Extreme risk [8.43%] risk_snow: Extreme snow (or ice) storms 1 - No risk [27.52%] 2 - Low risk [19.24%] 3 - Moderate risk [24.45%] 4 - High risk [18.84%] 5 - Extreme risk [9.94%] risk_tor: Tornadoes 1 - No risk [14.62%] 2 - Low risk [34.14%] 3 - Moderate risk [27.33%] 4 - High risk [13.97%] 5 - Extreme risk [9.95%] risk_flood: Floods 1 - No risk [9.72%] 2 - Low risk [33.49%] 3 - Moderate risk [33.77%] 4 - High risk [15.69%] 5 - Extreme risk [7.33%] risk_hur: Hurricanes 1 - No risk [41.76%] 2 - Low risk [22.87%] 3 - Moderate risk [14.80%] 4 - High risk [9.40%] 5 - Extreme risk [11.17%] risk_fire: Wildfires 1 - No risk [21.26%] 2 - Low risk [33.53%] 3 - Moderate risk [21.02%] 4 - High risk [13.05%] 5 - Extreme risk [11.15%] ------------------------End Web pg----------------------- risk_tie: It looks like you gave these extreme weather events the same rating. Please indicate which type of event poses the biggest risk to you and the people in your area. [CHECK BOX OF TOP RISKS; RANDOM ORDER; 1 = SELECTED] ------------------------End Web pg----------------------- Now we have some questions about the National Weather Service (NWS), an agency of the United States govern-ment that issues weather forecasts and different kinds of alerts to the public about hazardous weather, including [RANDOM SPLIT: alert_type: watches, warnings, and advisories | watches and warnings].

11
alert_und: In general, do you understand the difference between alert_type? alert_type: watches, warnings, and advisories alert_type: watches and warnings 1 - Definitely no [0.33%] [0.89%] 2 - Probably no [4.26%] [4.57%] 3 - Not sure [11.64%] [9.92%] 4 - Probably yes [47.99%] [34.75%] 5 - Definitely yes [35.78%] [49.87%]
------------------------End Web pg----------------------- The next few questions focus on severe thunderstorms and tornadoes. They may be relatively rare in your area, but severe thunderstorms and tornadoes can happen in every state. To the best of your knowledge, is the following alert considered a tornado watch or a warning? [RANDOM SPLIT; 50% get torwatch; 50% get torwarn] torwatch: This alert is issued when severe thunderstorms and tornadoes are possible in and near the area. It does not mean that they will occur. It only means they are possible. 1 - Tornado WATCH [77.04%] 2 - Tornado WARNING [19.55%] 3 - Don’t know [3.41%] torwarn: This alert is used when a tornado is imminent. When this alert is issued, seek safe shelter immediately. 1 - Tornado WATCH [15.02%] 2 - Tornado WARNING [82.08%] 3 - Don’t know [2.90%] ------------------------End Web pg----------------------- warn_prob_area: If the National Weather Service issues a tornado WARNING for your area, what is the probabil-ity that a tornado will occur in the warning area? Please indicate the probability as a percent that ranges from 0 to 100, where 0 means there is no chance of a tornado and 100 means that a tornado is certain. [VERBATIM, RE-QUIRED NUMERIC <= 100] percent [Mean=54.95] warn_prob_house: If the National Weather Service issues a tornado WARNING for your area, what is the proba-bility that a tornado will occur within [RANDOM SPLIT: prob_dist: 1 mile | 5 miles | 10 miles | 15 miles] of your location at the time of the storm? Please indicate the probability as a percent that ranges from 0 to 100, where 0 means there is no chance of a tornado and 100 means that a tornado is certain. [VERBATIM, REQUIRED NUMER-IC <= 100] percent
prob_dist: 1 mile prob_dist: 5 miles prob_dist: 10 miles prob_dist: 15 miles Mean [46.84] [50.26] [51.56] [54.55]
warn_cons: If the National Weather Service issues a tornado WARNING for your area, what is the probability that someone in the warning area will be injured or killed? Please indicate the probability as a percent that ranges from 0 to 100, where 0 means there is no chance of an injury or fatality and 100 means that an injury or fatality is certain. [VERBATIM, REQUIRED NUMERIC <= 100] percent [Mean=37.15] warn_time: If the National Weather Service issues a tornado WARNING for your area, how much time do you have before the tornado arrives? 1 - Less than 1 hour [58.38%] 2 - 1 to 24 hours [34.71%] 3 - 1 to 3 days [4.61%] 4 - More than 3 days [2.30%] warn_size: Approximately how large is the area included an average tornado WARNING? 1 - Around the size of a city [32.17%] 2 - Around the size of a county [34.84%]
12
3 - Around the size of multiple counties [29.65%] 4 - Around the size of a state [2.41%] 5 - Around the size of multiple states [0.92%] ------------------------End Web pg----------------------- [SHOW ONLY IF warn_time = 1] warn_time_minutes: You indicated that there is less than 1 hour between when tornado WARNINGS are issued and when tornadoes arrive. To the best of your knowledge, how many minutes are there between when tornado WARNINGS are issued and when tornadoes arrive? [VERBATIM, REQUIRED NUMERIC <= 60] minutes [Mean=27.72] ------------------------End Web pg----------------------- [SHOW ONLY IF warn_time = 2] warn_time_hours: You indicated that there is 1 to 24 hours between when tornado WARNINGS are issued and when tornadoes arrive. To the best of your knowledge, how many hours are there between when tornado WARN-INGS are issued and when tornadoes arrive? [VERBATIM, REQUIRED NUMERIC <=24] hours [Mean=6.35] ------------------------End Web pg----------------------- watch_prob_area: If the National Weather Service issues a tornado WATCH for your area, what is the probability that a tornado will occur in the watch area? Please indicate the probability as a percent that ranges from 0 to 100, where 0 means there is no chance of a tornado and 100 means that a tornado is certain. [VERBATIM, REQUIRED NUMERIC <= 100] percent [Mean=36.02] wach_prob_house: If the National Weather Service issues a tornado WATCH for your area, what is the probability that a tornado will occur within [RANDOM SPLIT: prob_dist: 1 mile | 5 miles | 10 miles | 15 miles] of your loca-tion at the time of the storm? Please indicate the probability as a percent that ranges from 0 to 100, where 0 means there is no chance of a tornado and 100 means that a tornado is certain. [VERBATIM, REQUIRED NUMER-IC <=100] percent
prob_dist: 1 mile prob_dist: 5 miles prob_dist: 10 miles prob_dist: 15 miles Mean [31.46] [32.85] [32.96] [36.73]
watch_cons: If the National Weather Service issues a tornado WATCH for your area, what is the probability that someone in the watch area will be injured or killed? Please indicate the probability as a percent that ranges from 0 to 100, where 0 means there is no chance of an injury or fatality and 100 means that an injury or fatality is certain. [VERBATIM, REQUIRED NUMERIC <=100] percent [Mean=37.15] watch_time: If the National Weather Service issues a tornado WATCH for your area, how much time do you have before the tornado arrives? 1 - Less than 1 hour [23.01%] 2 - 1 to 24 hours [63.10%] 3 - 1 to 3 days [10.31%] 4 - More than 3 days [3.25%] watch_size: Approximately how large is the area included an average tornado WATCH? 1 - Around the size of a city [21.93%] 2 - Around the size of a county [31.94%] 3 - Around the size of multiple counties [40.63%] 4 - Around the size of a state [4.02%] 5 - Around the size of multiple states [1.48%] ------------------------End Web pg----------------------- [SHOW ONLY IF watch_time = 1]

13
watch_time_minutes: You indicated that there is less than 1 hour between when tornado WATCHES are issued and when tornadoes arrive. To the best of your knowledge, how many minutes are there between when tornado WATCHES are issued and when tornadoes arrive? [VERBATIM, REQUIRED NUMERIC <=60] minutes [Mean=30.12] ------------------------End Web pg----------------------- [SHOW ONLY IF watch_time = 1] watch_time_hours: You indicated that there is 1 to 24 hours between when tornado WATCHES are issued and when tornadoes arrive. To the best of your knowledge, how many hours are there between when tornado WATCH-ES are issued and when tornadoes arrive? [VERBATIM, REQUIRED NUMERIC <=24] hours [Mean=6.73] ------------------------End Web pg----------------------- In addition to tornadoes, the National Weather Service issues alerts for severe thunderstorms. To the best of your knowledge, which of the following hazards does the National Weather Service consider when issuing SEVERE THUNDERSTORM WARNINGS? Please indicate all that apply. [CHECK BOX: RANDOM ORDER; 1 = SE-LECTED] svr_hail: Large hail [63.14%] svr_wind: High winds [85.35%] svr_lightning: Lightning [80.37%] svr_flood: Flooding [69.34%] svr_rain: Extreme rainfall [79.29%] ------------------------End Web pg----------------------- Please tell us how strongly you agree with the following statements about tornado WARNINGS: [RANDOM OR-DER] rec_all: I receive all tornado WARNINGS that are issued for my area. 1 - Strongly disagree [3.72%] 2 - Disagree [6.65%] 3 - Somewhat disagree [8.61%] 4 - Neither agree nor disagree [17.49%] 5 - Somewhat agree [16.35%] 6 - Agree [28.99%] 7 - Strongly agree [18.19%] rec_soon: I receive tornado WARNINGS as soon as they are issued for my area. 1 - Strongly disagree [3.49%] 2 - Disagree [5.04%] 3 - Somewhat disagree [8.28%] 4 - Neither agree nor disagree [18.39%] 5 - Somewhat agree [19.19%] 6 - Agree [27.47%] 7 - Strongly agree [18.15%] rec_miss: Sometimes I miss tornado WARNINGS that are issued for my area. 1 - Strongly disagree [16.57%] 2 - Disagree [22.01%] 3 - Somewhat disagree [13.13%] 4 - Neither agree nor disagree [19.62%] 5 - Somewhat agree [15.70%] 6 - Agree [9.67%] 7 - Strongly agree [3.30%] rec_area: Sometimes I am not sure if a tornado WARNING is for my area or a different area.

14
1 - Strongly disagree [17.04%] 2 - Disagree [26.44%] 3 - Somewhat disagree [13.20%] 4 - Neither agree nor disagree [19.02%] 5 - Somewhat agree [14.68%] 6 - Agree [7.15%] 7 - Strongly agree [2.47%] rec_time: Sometimes I am not sure what time tornado WARNINGS begin and end for my area. 1 - Strongly disagree [12.28%] 2 - Disagree [20.11%] 3 - Somewhat disagree [12.82%] 4 - Neither agree nor disagree [18.74%] 5 - Somewhat agree [20.24%] 6 - Agree [12.37%] 7 - Strongly agree [3.45%] ------------------------End Web pg----------------------- warn_hist: Do you recall having ever received a tornado WARNING for your area? 0 - No [34.99%] 1 - Yes [65.01%] ------------------------End Web pg----------------------- [SHOW IF warn_hist = 1] Think about the most recent tornado WARNING that you remember receiving. warn_when: When did you receive the tornado WARNING? 1 - less than 1 month ago [16.18%] 2 - between 1 and 3 months ago [19.92%] 3 - between 3 and 12 months ago [21.73%] 4 - between 1 and 3 years ago [19.10%] 5 - more than 3 years ago [11.40%] 6 - I don’t recall [11.67%] How did you learn about the tornado WARNING? Please select all that apply. warn_how_br_rad: Broadcast radio [17.31%] warn_how_wx_rad: Weather radio (National Weather Service radio) [15.69%] warn_how_tv: Television [65.10%] warn_how_siren: Siren or other alarm [22.45%] warn_how_int: Internet [15.88%] warn_how_soc: Social media such as Twitter or Facebook [9.10%] warn_how_word: Word-of-mouth (including telephone or text messages, email, etc.) from family, friends, neigh-bors, employers, co-workers, etc. [10.66%] warn_how_phone: Automated text or phone notification [36.66%] warn_how_oth: Other source (please specify) [1.85%] warn_how_dk: I don’t recall [2.11%] warn_how_spec: [VERBATIM] warn_timercv: What time was it when you received the tornado WARNING? 1 - Between 6am and noon [5.17%] 2 - Between noon and 6pm [36.12%] 3 - Between 6pm and midnight [31.69%] 4 - Between midnight and 6am [2.42%] 5 - I don’t recall [24.59%]
15
warn_where: Where were you when you received the tornado WARNING? 1 - At home [77.37%] 2 - At work [8.49%] 3 - At school [1.97%] 4 - At a business (such as a store or restaurant) [1.61%] 5 - In a vehicle (such as a car, truck, or bus) [3.42%] 6 - Somewhere else (please specify) [2.06%] 7 - I don’t recall [24.59%] warn_where_specify: [VERBATIM] warn_iss: Did you receive the tornado WARNING as soon as it was issued? 0 - No [5.44%] 1 - Yes [69.36%] 2 - I don’t recall [25.20%] warn_sure: Were you sure that the tornado WARNING was for your area and not a different area? 0 - No [4.78%] 1 - Yes [83.46%] 2 - I don’t recall [11.76%] ------------------------End Web pg----------------------- [SHOW IF warn_where = 1, 2, 3, or 4] last_act: What did you do when you got the most recent tornado WARNING that you remember receiving? 0 - Nothing; continued my daily activities [13.11%] 1 - Monitored the situation, but did not move to shelter [59.01%] 2 - Moved to the most sheltered part of the building, but did not leave the building [18.27%] 3 - Moved to a specially constructed storm shelter in the building [2.14%] 4 - Moved to a nearby location or building that provided safer shelter [2.89%] 5 - Left the building and drove away from the tornado warning area [0.90%] 6 - Something else (please specify) [1.54%] 7 - I don’t recall [2.14%] last_act_spec: [VERBATIM] ------------------------End Web pg----------------------- Now we want you to think about the NEXT TIME you receive a tornado WARNING from the National Weather Service. next_act_day: If you are at home during daylight hours and you receive a tornado WARNING for your area, what do you plan to do? 0 - Nothing; continue my daily activities [5.83%] 1 - Monitor the situation, but not move to shelter [46.70%] 2 - Move to the most sheltered part of my residence, but not leave the building [31.30%] 3 - Move to a specially constructed storm shelter in the building [4.05%] 4 - Move to a nearby location or building that provides safer shelter [5.62%] 5 - Leave the building and drive away from the tornado warning area [1.80%] 6 - Something else (please specify) [VERBATIM] [1.10%] 7 - Not sure [3.60%] next_act_day_spec: [VERBATIM] next_act_night: If you are at home in the middle of the night and you receive a tornado WARNING for your area, what do you plan to do? 0 - Nothing; continue my daily activities [7.06%] 1 - Monitor the situation, but not move to shelter [35.80%]

16
2 - Move to the most sheltered part of my residence, but not leave the building [39.90%] 3 - Move to a specially constructed storm shelter in the building [5.27%] 4 - Move to a nearby location or building that provides safer shelter [4.71%] 5 - Leave the building and drive away from the tornado warning area [2.10%] 6 - Something else (please specify) [VERBATIM] [1.17%] 7 - Not sure [4.00%] next_act_night_spec: [VERBATIM] next_act_car: If you are in a car and you receive a tornado WARNING for your area, what do you plan to do? [VERBATIM] ------------------------End Web pg----------------------- Please tell us how strongly you agree with the following statements about tornado WARNINGS. If you have never received a tornado WARNING, please tell us how you think you would respond if you receive a WARNING in the future: [RANDOM ORDER] resp_ignore: Sometimes I ignore tornado WARNINGS that are issued for my area. 1 - Strongly disagree [23.74%] 2 - Disagree [25.01%] 3 - Somewhat disagree [12.30%] 4 - Neither agree nor disagree [18.36%] 5 - Somewhat agree [12.19%] 6 - Agree [5.59%] 7 - Strongly agree [2.81%] resp_prot: I always take protective action when tornado WARNINGS are issued for my area. 1 - Strongly disagree [2.81%] 2 - Disagree [6.93%] 3 - Somewhat disagree [12.41%] 4 - Neither agree nor disagree [23.48%] 5 - Somewhat agree [21.23%] 6 - Agree [20.49%] 7 - Strongly agree [12.65%] resp_busy: Sometimes I am too busy to take protective action when tornado WARNINGS are issued for my area. 1 - Strongly disagree [22.85%] 2 - Disagree [27.54%] 3 - Somewhat disagree [13.57%] 4 - Neither agree nor disagree [19.26%] 5 - Somewhat agree [9.98%] 6 - Agree [4.65%] 7 - Strongly agree [2.14%] resp_unsure: I am not sure what to do when tornado WARNINGS are issued for my area. 1 - Strongly disagree [19.22%] 2 - Disagree [25.49%] 3 - Somewhat disagree [16.11%] 4 - Neither agree nor disagree [15.84%] 5 - Somewhat agree [13.55%] 6 - Agree [6.04%] 7 - Strongly agree [3.75%] ------------------------End Web pg----------------------- Forecasters at the National Weather Service consider many factors when making decisions about when to issue tor-nado WARNINGS. For instance, they must decide when they have enough evidence to say that a tornado is likely.

17
Some forecasters issue warnings with moderate evidence; this can increase the possibility of “false alarms” but de-crease the possibility that a tornado will occur without a warning. Other forecasters prefer strong evidence before they alert the public; this can decrease the possibility of “false alarms” but increase the possibility that a tornado will occur without a warning.
mi_fa_should: In your opinion, how SHOULD forecasters in your area balance the possibility of false alarms vs. the possibility that a tornado will occur without a warning? 1 - Minimize the possibility that a tornado will occur without a warning [24.81%] 2 - Lean towards limiting the possibility that a tornado will occur without a warning [33.71%] 3 - Lean towards limiting the possibility of false alarms [20.93%] 4 - Minimize the possibility of false alarms [20.55%] mi_fa_do: In your opinion, how DO forecasters in your area currently balance the possibility of false alarms vs. the possibility that a tornado will occur without a warning? 1 - Minimize the possibility that a tornado will occur without a warning [24.41%] 2 - Lean towards limiting the possibility that a tornado will occur without a warning [38.31%] 3 - Lean towards limiting the possibility of false alarms [21.40%] 4 - Minimize the possibility of false alarms [15.88%] ------------------------End Web pg----------------------- Forecasters must consider time as well. Some forecasters issue tornado WARNINGS as soon as possible, which can increase the amount of “lead time” that people have to make decisions, but decrease the precision and accuracy of the warning. Other forecasters wait for more evidence to come in before they issue warnings, which can decrease the amount of “lead time” that people have to make decisions, but increase the precision and accuracy of the warn-ing. leadtime_should: In your opinion, how SHOULD forecasters in your area balance considerations of lead time vs. accuracy? 1 - Maximize lead time [20.16%] 2 - Lean towards more lead time [33.87%] 3 - Lean towards more precision/accuracy [32.50%] 4 - Maximize precision/accuracy [13.47%] leadtime_do: In your opinion, how DO forecasters in your area currently balance considerations of lead time vs. accuracy? 1 - Maximize lead time [19.87%] 2 - Lean towards more lead time [41.12%] 3 - Lean towards more precision/accuracy [28.25%] 4 - Maximize precision/accuracy [10.77%] ------------------------End Web pg----------------------- Finally, forecasters must consider uncertainty. In most instances, forecasters are not 100% sure where and when a tornado will (or will not) happen. They are also not sure how damaging a tornado will (or will not) be if it happens. In these instances, some forecasters use their “best guess” to issue relatively simple warnings, which can decrease the amount of information that people have to make decisions and take protective actions, but increase the simplici-ty of the information. Other forecasters give people a range of possibilities and/or probabilities in more complex warnings, which can increase the amount of information that people have to make decisions and take protective ac-tions, but decrease the simplicity of the information. uncert_should: In your opinion, how SHOULD forecasters in your area balance considerations of simplicity vs. more information? 1 - Maximize simplicity [11.55%] 2 - Lean towards simplicity [24.67%] 3 - Lean towards more information [43.06%]

18
4 - Maximize information [20.72%] uncert_do: In your opinion, how DO forecasters in your area currently balance considerations of simplicity vs. more information? 1 - Maximize simplicity [8.73%] 2 - Lean towards simplicity [28.31%] 3 - Lean towards more information [44.81%] 4 - Maximize information [18.15%] ------------------------End Web pg----------------------- Severe weather can be dangerous and technically complex, so getting information you can trust is important. Please indicate your level of trust in information about severe weather from each of the following organizations and groups. [RANDOM ORDER] nws_trust: The National Weather Service 1 - No trust [0.48%] 2 - Low trust [2.52%] 3 - Moderate trust [22.22%] 4 - High trust [47.49%] 5 - Complete trust [27.29%] lotv_trust: Regional or local TV stations 1 - No trust [1.36%] 2 - Low trust [5.31%] 3 - Moderate trust [37.38%] 4 - High trust [41.91%] 5 - Complete trust [14.04%] natv_trust: National TV stations (like the Weather Channel) 1 - No trust [1.36%] 2 - Low trust [4.94%] 3 - Moderate trust [33.31%] 4 - High trust [43.00%] 5 - Complete trust [17.40%] em_trust: State or local emergency managers 1 - No trust [0.94%] 2 - Low trust [4.09%] 3 - Moderate trust [34.68%] 4 - High trust [43.31%] 5 - Complete trust [16.99%] fam_trust: Family, friends, neighbors, employers, co-workers, etc. 1 - No trust [2.85%] 2 - Low trust [19.43%] 3 - Moderate trust [48.29%] 4 - High trust [21.70%] 5 - Complete trust [7.74%] ------------------------End Web pg----------------------- Warnings and information about severe weather are available from multiple sources. How much do you, personally, rely on each of the following sources of information about severe weather? [RANDOM ORDER] wx_info1: Broadcast radio

19
1 - Not much [13.28%] 2 - Little [13.84%] 3 - Somewhat [31.73%] 4 - Much [26.26%] 5 - A great deal [14.89%] wx_info2: Weather radio (National Weather Service radio) 1 - Not much [19.42%] 2 - Little [11.07%] 3 - Somewhat [25.12%] 4 - Much [24.00%] 5 - A great deal [20.39%] wx_info3: Television 1 - Not much [4.40%] 2 - Little [6.40%] 3 - Somewhat [25.13%] 4 - Much [32.95%] 5 - A great deal [31.12%] wx_info4: Internet web pages focused on weather forecasts, such as those provided by the National Weather Service 1 - Not much [11.58%] 2 - Little [12.23%] 3 - Somewhat [33.23%] 4 - Much [27.19%] 5 - A great deal [15.77%] wx_info5: Social media, such as Twitter or Facebook 1 - Not much [34.93%] 2 - Little [18.95%] 3 - Somewhat [27.19%] 4 - Much [12.81%] 5 - A great deal [6.12%] wx_info6: Word-of-mouth (including telephone calls or texts) from family, friends, neighbors, employers, co-workers, etc. 1 - Not much [14.52%] 2 - Little [20.89%] 3 - Somewhat [39.28%] 4 - Much [17.11%] 5 - A great deal [8.20%] wx_info7: Automated text or phone notifications 1 - Not much [12.23%] 2 - Little [8.46%] 3 - Somewhat [26.79%] 4 - Much [27.85%] 5 - A great deal [24.68%] wx_info8: Outdoor warning sirens 1 - Not much [17.31%] 2 - Little [10.12%] 3 - Somewhat [21.91%] 4 - Much [21.31%] 5 - A great deal [29.34%]

20
------------------------End Web pg----------------------- wx_info_tie: It looks like you gave these sources the same rating. Please indicate which source you rely on the most for information about severe weather. [CHECK BOX OF TOP SOURCES; RANDOM ORDER; 1 = SELECTED] ------------------------End Web pg----------------------- As you may know, the National Weather Service uses the following categories to rate the intensity of tor-nadoes.
Description Wind (mph) Characteristic Damages Illustration Light (EF-0)
65–85 Some damage to chimneys; branches broken off trees; shallow-rooted trees pushed over; sign boards damaged Picture
Moderate (EF-1)
86–110 Roof shingles peeled off; mobile homes pushed off foundations or overturned; moving cars pushed off roads; attached carports/garages destroyed Picture
Significant (EF-2)
111–135 Roofs torn off frame houses; mobile homes heavily damaged or destroyed; boxcars overturned; large trees snapped or uprooted; high-rise windows broken or blown in; light-object projectiles generated
Picture
Severe (EF-3)
136–165 Roofs and some walls torn off well-constructed houses; mobile homes demol-ished; trains overturned; most trees in forest uprooted; heavy cars lifted off the ground and thrown
Picture
Devastating (EF-4)
166–200 Well-constructed houses leveled; structures with weak foundations blown away some distance; cars thrown and large projectiles generated Picture
Incredible (EF-5)
Over 200 Strong frame houses lifted off foundations and carried considerable distances to disintegrate; car-sized projectiles fly through the air for 100 yards; trees debarked; steel reinforced concrete structures badly damaged
Picture
tor_damage: If you had to guess, how intense are most tornadoes in [state]? 0 - Light (EF-0) [34.16%] 1 - Moderate(EF-1) [32.40%] 2 - Significant (EF-2) [18.04%] 3 - Severe (EF-3) [9.82%] 4 - Devastating (EF-4) [3.77%] 5 - Incredible (EF-5) [1.80%] ------------------------End Web pg----------------------- We have a few more questions about tornadoes in [state]. It is ok if you don’t know the answer to a question; please provide your best guess. tor_number: On average, how many tornadoes does [state] get each year? 1 - Less than 5 [47.75%] 2 - Between 5 and 24 [34.02%] 3 - Between 25 and 49 [11.31%] 4 - Between 50 and 100 [3.78%] 5 - More than 100 [1.80%] tor_time: Please use the slider below to indicate the 4-hour timeframe when most tornadoes occur in [state]. Peri-ods will appear when you move the slider. [4-HOUR SLIDER] 1 - 12AM-4AM [2.01%] 7- 6AM-10AM [1.28%] 13 - 12PM-4PM [6.49%] 19 - 6PM-10PM [6.16%] 2 - 1AM-5AM [0.46%] 8 - 7AM-11AM [2.31%] 14 - 1PM-5PM [9.36%] 20 - 7PM-11PM [2.22%] 3 - 2AM-6AM [0.88%] 9 - 8AM-12PM [1.72%] 15 - 2PM-6PM [12.37%] 21 - 8PM-12AM [2.06%] 4 - 3AM-7AM [0.55%] 10 - 9AM-1PM [2.06%] 16 - 3PM-7PM [15.56%] 22 - 9PM-1AM [0.91%] 5 - 4AM-8AM [1.95%] 11 - 10AM-2PM [3.77%] 17 - 4PM-8PM [12.39%] 23 - 10PM-2AM [0.97%] 6 - 5AM-9AM [1.06%] 12 - 11AM-3PM [3.45%] 18 - 5PM-9PM [8.82%] 24 - 11PM-3AM [1.26%]
21
tor_ssn: Please use the slider below to indicate the 3-month timeframe when most tornadoes occur in [state]. Peri-ods will appear when you move the slider. [3-MONTH SLIDER] 1 - JAN-MAR [2.01%] 7- JUL-SEP [14.34%] 2 - FEB-APR [2.32%] 8 - AUG-OCT [13.13%] 3 - MAR-MAY [8.50%] 9 - SEP-NOV [5.91%] 4 - APR-JUN [11.94%] 10 - OCT-DEC [2.44%] 5 - MAY-JUL [13.73%] 11 - NOV-JAN [1.11%] 6 - JUN-AUG [23.55%] 12 - DEC-FEB [1.02%] ------------------------End Web pg----------------------- To the best of your knowledge, are the following statements about tornadoes true or false? [RANDOM ORDER] myth_under: You must be underground or in an aboveground tornado shelter to survive a devastating (EF-4) or incredible (EF-5) tornado 0 - False [22.44%] 1 - True [77.56%] myth_tall: Tall buildings protect large cities from tornadoes 0 - False [79.91%] 1 - True [20.09%]
myth_mtns: Mountains, rivers, and lakes do not protect nearby areas from tornadoes 0 - False [35.99%] 1 - True [64.01%] myth_brdge: When driving, you should not take shelter from tornadoes under a bridge or overpass 0 - False [46.11%] 1 - True [53.89%] myth_open: When sheltering in a house from a tornado, you should open all the windows to equalize the pressure inside and outside to prevent the house from exploding 0 - False [64.39%] 1 - True [35.61%] ------------------------End Web pg----------------------- Forecasters might consider the probability and intensity of extreme weather events when communicating infor-mation and risk. For example, a 1% chance of a severe (EF-3) tornado may be less risky than a 10% chance of a moderate (EF-2) tornado. Or, a 2% chance of a devastating (EF-4) tornado may be more risky than a 90% chance of a light (EF-0) tornado. We would like to know how YOU weigh the probability and intensity of extreme weather events. Please rate the risk of the following tornado scenarios: extprob_a: A [extprob_a_prob: 5:100]% chance of a [RANDOM SPLIT: extprob_a_int: Light (EF-0), Moderate (EF-1), Significant (EF-2), Severe (EF-3), Devastating (EF-4), Incredible (EF-5)] tornado.
extprob_a_prob: 5-25 extprob_a_prob: 26-50 extprob_a_prob: 51-75 extprob_a_prob: 76-100
1 - No risk EF0-EF1 [8.30%] EF2-EF3 [6.55%] EF4-EF5 [8.44%]
EF0-EF1 [9.58%] EF2-EF3 [4.67%] EF4-EF5 [8.62%]
EF0-EF1 [2.95%] EF2-EF3 [2.99%] EF4-EF5 [8.13%]
EF0-EF1 [4.07%] EF2-EF3 [5.75%] EF4-EF5 [5.32%]
2 - Low risk EF0-EF1 [53.48%] EF2-EF3 [40.72%] EF4-EF5 [31.42%]
EF0-EF1 [32.69%] EF2-EF3 [18.91%] EF4-EF5 [17.85%]
EF0-EF1 [23.14%] EF2-EF3 [22.20%] EF4-EF5 [17.90%]
EF0-EF1 [20.76%] EF2-EF3 [14.53%] EF4-EF5 [13.12%]
3 - Moderate risk
EF0-EF1 [30.85%] EF2-EF3 [45.56%] EF4-EF5 [31.00%]
EF0-EF1 [47.84%] EF2-EF3 [52.43%] EF4-EF5 [30.95%]
EF0-EF1 [54.96%] EF2-EF3 [33.52%] EF4-EF5 [15.33%]
EF0-EF1 [41.75%] EF2-EF3 [29.95%] EF4-EF5 [16.20%]

22
4 - High risk EF0-EF1 [7.36%] EF2-EF3 [6.35%]
EF4-EF5 [23.39%] EF0-EF1 [8.44%]
EF2-EF3 [17.73%] EF4-EF5 [27.89%]
EF0-EF1 [18.79%] EF2-EF3 [27.77%] EF4-EF5 [26.84%]
EF0-EF1 [29.61%] EF2-EF3 [29.03%] EF4-EF5 [24.82%]
5 - Extreme risk
EF0-EF1 [0.00%] EF2-EF3 [0.82%] EF4-EF5 [5.75%]
EF0-EF1 [1.44%] EF2-EF3 [6.26%]
EF4-EF5 [14.68%] EF0-EF1 [0.16%]
EF2-EF3 [13.51%] EF4-EF5 [31.80%]
EF0-EF1 [3.82%] EF2-EF3 [20.73%] EF4-EF5 [40.54%]
extprob_b: A [extprob_b_prob: 5:100]% chance of a [RANDOM SPLIT: extprob_b_int: Light (EF-0), Moderate (EF-1), Significant (EF-2), Severe (EF-3), Devastating (EF-4), Incredible (EF-5)] tornado.
extprob_b_prob: 5-25 extprob_b_prob: 26-50 extprob_b_prob: 51-75 extprob_b_prob: 76-100
1 - No risk EF0-EF1 [6.82%] EF2-EF3 [5.75%]
EF4-EF5 [10.62%] EF0-EF1 [6.63%]
EF2-EF3 [10.65%] EF4-EF5 [6.60%]
EF0-EF1 [6.48%] EF2-EF3 [5.88%] EF4-EF5 [5.75%]
EF0-EF1 [3.76%] EF2-EF3 [4.88%] EF4-EF5 [9.12%]
2 - Low risk EF0-EF1 [52.33%] EF2-EF3 [42.94%] EF4-EF5 [29.94%]
EF0-EF1 [30.25%] EF2-EF3 [18.42%] EF4-EF5 [20.95%]
EF0-EF1 [22.58%] EF2-EF3 [20.57%] EF4-EF5 [15.54%]
EF0-EF1 [25.78%] EF2-EF3 [13.27%] EF4-EF5 [17.68%]
3 - Moderate risk
EF0-EF1 [26.11%] EF2-EF3 [38.02%] EF4-EF5 [30.91%]
EF0-EF1 [43.71%] EF2-EF3 [42.33%] EF4-EF5 [28.83%]
EF0-EF1 [44.50%] EF2-EF3 [32.13%] EF4-EF5 [12.43%]
EF0-EF1 [31.73%] EF2-EF3 [14.20%] EF4-EF5 [12.68%]
4 - High risk EF0-EF1 [12.41%] EF2-EF3 [10.58%] EF4-EF5 [24.50%]
EF0-EF1 [14.88%] EF2-EF3 [25.77%] EF4-EF5 [35.49%]
EF0-EF1 [21.81%] EF2-EF3 [29.02%] EF4-EF5 [35.37%]
EF0-EF1 [27.73%] EF2-EF3 [34.87%] EF4-EF5 [13.64%]
5 - Extreme risk
EF0-EF1 [2.33%] EF2-EF3 [2.70%] EF4-EF5 [4.04%]
EF0-EF1 [4.54%] EF2-EF3 [2.82%] EF4-EF5 [8.13%]
EF0-EF1 [4.63%] EF2-EF3 [12.40%] EF4-EF5 [30.91%]
EF0-EF1 [11.00%] EF2-EF3 [32.78%] EF4-EF5 [46.87%]
extprob_c: A [extprob_c_prob: 5:100]% chance of a [RANDOM SPLIT: extprob_c_int: Light (EF-0), Moderate (EF-1), Significant (EF-2), Severe (EF-3), Devastating (EF-4), Incredible (EF-5)] tornado.
extprob_c_prob: 5-25 extprob_c_prob: 26-50 extprob_c_prob: 51-75 extprob_c_prob: 76-100
1 - No risk EF0-EF1 [11.11%] EF2-EF3 [7.72%]
EF4-EF5 [11.49%] EF0-EF1 [5.58%] EF2-EF3 [6.59%]
EF4-EF5 [10.05%] EF0-EF1 [12.44%] EF2-EF3 [4.04%] EF4-EF5 [6.03%]
EF0-EF1 [8.09%] EF2-EF3 [11.18%] EF4-EF5 [13.87%]
2 - Low risk EF0-EF1 [56.94%] EF2-EF3 [39.62%] EF4-EF5 [36.67%]
EF0-EF1 [44.25%] EF2-EF3 [20.75%] EF4-EF5 [14.95%]
EF0-EF1 [15.31%] EF2-EF3 [19.29%] EF4-EF5 [14.12%]
EF0-EF1 [14.00%] EF2-EF3 [10.88%] EF4-EF5 [12.90%]
3 - Moderate risk
EF0-EF1 [18.87%] EF2-EF3 [45.02%] EF4-EF5 [27.01%]
EF0-EF1 [39.77%] EF2-EF3 [44.96%] EF4-EF5 [27.17%]
EF0-EF1 [33.81%] EF2-EF3 [32.34%] EF4-EF5 [11.14%]
EF0-EF1 [28.01%] EF2-EF3 [19.56%] EF4-EF5 [6.72%]
4 - High risk EF0-EF1 [6.45%] EF2-EF3 [5.14%]
EF4-EF5 [16.13%] EF0-EF1 [7.60%]
EF2-EF3 [20.91%] EF4-EF5 [25.90%]
EF0-EF1 [31.14%] EF2-EF3 [33.48%] EF4-EF5 [28.11%]
EF0-EF1 [33.55%] EF2-EF3 [29.07%] EF4-EF5 [11.55%]
5 - Extreme risk
EF0-EF1 [6.64%] EF2-EF3 [2.50%] EF4-EF5 [8.70%]
EF0-EF1 [2.80%] EF2-EF3 [6.78%]
EF4-EF5 [21.93%] EF0-EF1 [7.30%]
EF2-EF3 [10.84%] EF4-EF5 [40.61%]
EF0-EF1 [16.36%] EF2-EF3 [29.31%] EF4-EF5 [54.96%]
------------------------End Web pg----------------------- probintens: When thinking about the risk of tornadoes, is probability (the likelihood that a tornado will occur) more important than intensity (the strength and size of the tornado)? Or, is intensity more important than probability? 1 - Probability is much more important than intensity [11.97%] 2 - Probability is a little more important than intensity [12.71%] 3 - Probability and intensity are equality important [42.19%] 4 - Intensity is a little more important than probability [19.29%] 5 - Intensity is much more important than probability [13.84%] ------------------------End Web pg----------------------- Some people get weather information on their phone. mob_down: Have you ever downloaded an application (mobile app) of any kind for a smart phone (such as an An-droid or iPhone)? 0 - No [31.20%] 1 - Yes [68.80%]
23
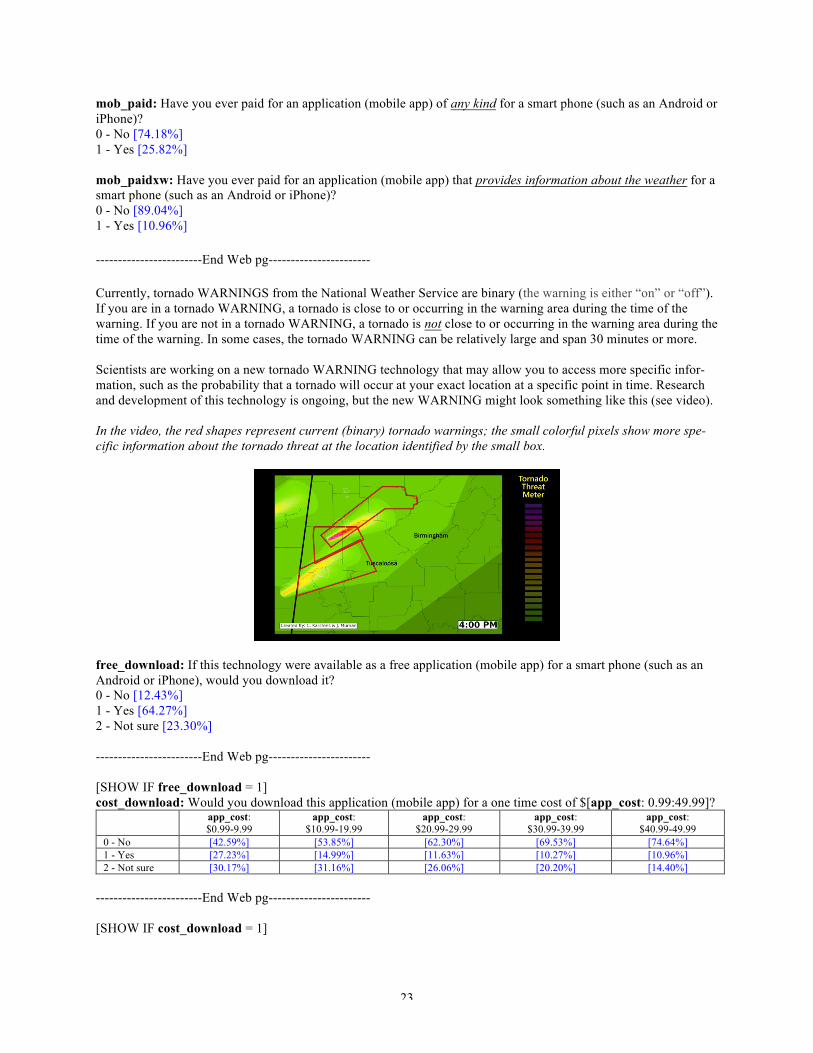
mob_paid: Have you ever paid for an application (mobile app) of any kind for a smart phone (such as an Android or iPhone)? 0 - No [74.18%] 1 - Yes [25.82%] mob_paidxw: Have you ever paid for an application (mobile app) that provides information about the weather for a smart phone (such as an Android or iPhone)? 0 - No [89.04%] 1 - Yes [10.96%] ------------------------End Web pg----------------------- Currently, tornado WARNINGS from the National Weather Service are binary (the warning is either “on” or “off”). If you are in a tornado WARNING, a tornado is close to or occurring in the warning area during the time of the warning. If you are not in a tornado WARNING, a tornado is not close to or occurring in the warning area during the time of the warning. In some cases, the tornado WARNING can be relatively large and span 30 minutes or more. Scientists are working on a new tornado WARNING technology that may allow you to access more specific infor-mation, such as the probability that a tornado will occur at your exact location at a specific point in time. Research and development of this technology is ongoing, but the new WARNING might look something like this (see video). In the video, the red shapes represent current (binary) tornado warnings; the small colorful pixels show more spe-cific information about the tornado threat at the location identified by the small box.
free_download: If this technology were available as a free application (mobile app) for a smart phone (such as an Android or iPhone), would you download it? 0 - No [12.43%] 1 - Yes [64.27%] 2 - Not sure [23.30%] ------------------------End Web pg----------------------- [SHOW IF free_download = 1] cost_download: Would you download this application (mobile app) for a one time cost of $[app_cost: 0.99:49.99]?
app_cost: $0.99-9.99
app_cost: $10.99-19.99
app_cost: $20.99-29.99
app_cost: $30.99-39.99
app_cost: $40.99-49.99
0 - No [42.59%] [53.85%] [62.30%] [69.53%] [74.64%] 1 - Yes [27.23%] [14.99%] [11.63%] [10.27%] [10.96%] 2 - Not sure [30.17%] [31.16%] [26.06%] [20.20%] [14.40%]
------------------------End Web pg----------------------- [SHOW IF cost_download = 1]

24
cost_download_conf: On a scale from zero to ten, where zero means not at all certain and ten means completely certain, how certain are you that you would download this smart phone application (mobile app) for a one time cost of $[app_cost: 0.99:99.99]?
app_cost: $0.99-9.99
app_cost: $10.99-19.99
app_cost: $20.99-29.99
app_cost: $30.99-39.99
app_cost: $40.99-49.99
0 - Not at all certain [2.63%] [5.34%] [1.35%] [4.55%] [4.47%] 1 [0.00%] [0.00%] [2.75%] [0.00%] [0.00%] 2 [1.86%] [0.00%] [0.00%] [5.05%] [3.32%] 3 [0.00%] [0.00%] [0.00%] [2.97%] [0.00%] 4 [3.87%] [0.00%] [0.00%] [2.61%] [1.78%] 5 [10.31%] [7.70%] [8.03%] [12.32%] [3.35%] 6 [4.92%] [8.69%] [24.54%] [20.69%] [7.30%] 7 [8.82%] [7.53%] [2.18%] [9.39%] [7.29%] 8 [20.96%] [34.32%] [20.08%] [16.53%] [15.19%] 9 [17.45%] [11.96%] [12.19%] [0.00%] [8.88%] 10 - Completely certain [29.18%] [24.45%] [28.88%] [25.88%] [48.43%]
------------------------End Web pg----------------------- [SHOW IF free_download = 0 or cost_download = 0] We would like to know why you would not download or purchase this application. Please select all that apply. [RANDOM ORDER] no_phone: I don’t have a smart phone (such as an Android or iPhone) [8.44%] no_satis: I am satisfied with the information that I currently receive [43.20%] no_worry: I am not worried about tornadoes in my area [26.15%] no_afford: I can’t afford it [29.42%] no_worth: It is not worth it to me [30.95%] no_info: I need more information [8.11%] no_other: Other reason (please specify) [VERBATIM] ------------------------End Web pg----------------------- Do you currently have any of the following at your residence? Please select all that apply. prep_plan: A disaster response plan for you and your family [25.74%] prep_kit: An emergency preparedness kit containing such things as first-aid supplies, flashlights, batteries, etc. [41.00%] prep_water: Supplies of water and food specially packaged or designated for use in emergencies [35.58%] prep_gen: A generator (either mobile or fixed) to provide electricity in emergencies [19.44%] prep_room: A designated place within your home that you consider to provide the most shelter from tornadoes [47.58%] prep_shelt: A specially constructed room or other facility on your property designed to provide shelter from torna-does (may be above or below ground) [6.50%] ------------------------End Web pg----------------------- Feelings and emotions can influence the way that people prepare for and respond to extreme weather events. Imag-ine, for the moment, that you have just received a warning for your area for severe thunderstorms, tornadoes, hurri-canes, or wildfires. How would getting that warning make you feel? [RANDOM ORDER] aff_int: Interested 1 - Not at all [7.02%] 2 - A little [15.01%] 3 - Moderately [23.01%] 4 - Quite a bit [29.95%] 5 - Extremely [25.02%] aff_dis: Distressed 1 - Not at all [22.35%] 2 - A little [30.25%]
25
3 - Moderately [26.78%] 4 - Quite a bit [13.97%] 5 - Extremely [6.66%] aff_ecx: Excited 1 - Not at all [39.75%] 2 - A little [24.22%] 3 - Moderately [21.61%] 4 - Quite a bit [9.94%] 5 - Extremely [4.47%] aff_ups: Upset 1 - Not at all [32.90%] 2 - A little [28.21%] 3 - Moderately [22.06%] 4 - Quite a bit [11.42%] 5 - Extremely [5.41%] aff_sca: Scared 1 - Not at all [18.49%] 2 - A little [33.40%] 3 - Moderately [21.60%] 4 - Quite a bit [16.52%] 5 - Extremely [9.99%] aff_ent: Enthusiastic 1 - Not at all [53.88%] 2 - A little [16.90%] 3 - Moderately [18.09%] 4 - Quite a bit [7.37%] 5 - Extremely [3.77%] aff_ale: Alert 1 - Not at all [2.22%] 2 - A little [8.65%] 3 - Moderately [20.79%] 4 - Quite a bit [32.67%] 5 - Extremely [35.67%] aff_ner: Nervous 1 - Not at all [11.17%] 2 - A little [31.84%] 3 - Moderately [26.07%] 4 - Quite a bit [17.60%] 5 - Extremely [13.31%] aff_att: Attentive 1 - Not at all [3.73%] 2 - A little [9.48%] 3 - Moderately [23.29%] 4 - Quite a bit [33.82%] 5 - Extremely [29.68%] aff_jit: Jittery 1 - Not at all [22.94%] 2 - A little [31.56%]

26
3 - Moderately [22.31%] 4 - Quite a bit [14.58%] 5 - Extremely [8.61%] aff_act: Active 1 - Not at all [9.15%] 2 - A little [20.48%] 3 - Moderately [33.14%] 4 - Quite a bit [24.50%] 5 - Extremely [12.73%] aff_afr: Afraid 1 - Not at all [17.75%] 2 - A little [35.84%] 3 - Moderately [21.63%] 4 - Quite a bit [15.52%] 5 - Extremely [9.26%] ------------------------End Web pg----------------------- Have you or members of your family, neighbors, friends, or associates ever experienced property damage, personal injury, or loss of life from a TORNADO? Please select all that apply. tor_exp_no: No [69.91%] tor_exp_per: Yes, for you personally [8.83%] tor_exp_fam: Yes, for family [14.62%] tor_exp_neighbors: Yes, for neighbors [9.17%] tor_exp_friends: Yes, for close friends or associates [8.87%] Have you or members of your family, neighbors, friends, or associates ever experienced property damage, personal injury, or loss of life from a SEVERE THUNDERSTORM? Please select all that apply. svr_exp_no: No [53.57%] svr_exp_per: Yes, for you personally [20.71%] svr_exp_fam: Yes, for family [21.52%] svr_exp_neighbors: Yes, for neighbors [15.95%] svr_exp_friends: Yes, for close friends or associates [13.85%] ------------------------End Web pg----------------------- Now, we have some basic questions about how you assess various probabilities and risks. For the next few ques-tions, please do not use a calculator but feel free to make notes or use paper if needed. cointoss: Imagine that we flip a fair coin 1,000 times. What is your best guess about how many times the coin would come up heads in 1,000 flips? [VERBATIM; REQUIRED NUMERIC, ALLOW DECIMAL] [Answer = 500] [Cor-rect=64.14%] bigbucks: In the BIG BUCKS LOTTERY, the chance of winning a $10 prize is 1%. What is your best guess about how many people would win a $10 prize if 1,000 people each buy a single ticket to BIG BUCKS? [VERBATIM; REQUIRED NUMERIC] [Answer = 10] [Correct=54.23%] acme_pub: In ACME PUBLISHING SWEEPSTAKES, the chance of winning a car is 1 in 1,000. What percent of tickets to ACME PUBLISHING SWEEPSTAKES win a car? [VERBATIM; REQUIRED NUMERIC, ALLOW DECIMAL] percent [Answer = 0.1] [Correct=21.51%] ------------------------End Web pg----------------------- [SHOW ONLY IF TWO OR MORE OF cointoss, bigbucks, OR acme_pub ARE CORRECT]

27
choir: Out of 1,000 people in a small town 500 are members of a choir. Out of these 500 members in a choir 100 are men. Out of the 500 inhabitants that are not in a choir 300 are men. What is the probability that a randomly drawn man is a member of the choir? Please indicate the probability as a percent. [VERBATIM; REQUIRED NUMERIC] percent [Answer = 25] [Correct=10.66%] ------------------------End Web pg----------------------- [SHOW ONLY IF choir ≠ 25] fiveside: Imagine we are throwing a five-sided die 50 times. On average, out of these 50 throws how many times would this five-sided die show an odd number (1, 3 or 5)? [VERBATIM; REQUIRED NUMERIC] [Answer = 30] [Correct=11.85%] ------------------------End Web pg----------------------- [SHOW ONLY IF choir = 25] sixside: Imagine we are throwing a loaded die (6 sides). The probability that the die shows a 6 is twice as high as the probability of each of the other numbers. On average, out of these 70 throws how many times would the die show the number 6? [VERBATIM; REQUIRED NUMERIC] [Answer = 20] [Correct=38.43%] ------------------------End Web pg----------------------- [SHOW ONLY IF sixside ≠ 20] mushroom: In a forest, 20% of the mushrooms are red, 50% are brown, and 30% are white. A red mushroom is poisonous with a probability of 20%. A mushroom that is not red is poisonous with a probability of 5%. What is the probability that a poisonous mushroom in the forest is red? Please indicate the probability as a per-cent. [VERBATIM; REQUIRED NUMERIC] percent [Answer = 50] [Correct=0.94%] ------------------------End Web pg----------------------- Before you finish, we have a few questions about your views on government. do_right: On a scale from zero to ten, where zero means none of the time and ten means all of the time, how much of the time do you trust the federal government in Washington to do what is right for the American people? 0 - None of the time [9.49%] 1 [7.88%] 2 [11.64%] 3 [14.54%] 4 [10.73%] 5 [20.19%] 6 [9.25%] 7 [8.01%] 8 [5.42%] 9 [1.41%] 10 - All of the time [1.44%] state_gov: On the same scale from zero to ten, how much of the time do you trust state government to do what is right for the people in [state]? 0 - None of the time [8.26%] 1 [5.66%] 2 [9.55%] 3 [9.12%] 4 [11.40%] 5 [19.60%] 6 [11.89%] 7 [11.09%] 8 [8.59%]

28
9 [2.29%] 10 - All of the time [2.55%] loc_gov: Again, on the same scale, how much of the time do you trust your county and local governments to do what is right for you and your fellow citizens in your local area? 0 - None of the time [5.50%] 1 [3.64%] 2 [6.39%] 3 [9.15%] 4 [10.22%] 5 [20.56%] 6 [12.71%] 7 [14.59%] 8 [10.82%] 9 [3.51%] 10 - All of the time [2.90%] ------------------------End Web pg----------------------- pol_party: With which political party do you most identify? 1 - Democratic party [38.55%] 2 - Republican party (or GOP) [29.58%] 3 - Independent [28.74%] 4 - Other party (please specify) [3.13%] ------------------------End Web pg----------------------- [SHOW IF pol_party = 1 OR 2] party_iden: Do you completely, somewhat, or slightly identify with the pol_party? 3 - Completely [9.33%] 2 - Somewhat [47.38%] 1 - Slightly [43.29%] ------------------------End Web pg----------------------- pol_ideol: On a scale of political ideology, individuals can be arranged from strongly liberal to strongly conserva-tive. Which of the following categories best describes your views? 1 - Strongly liberal [8.61%] 2 - Liberal [13.32%] 3 - Slightly liberal [9.38%] 4 - Middle of the road [33.89%] 5 - Slightly conservative [11.88%] 6 - Conservative [14.53%] 7 - Strongly conservative [8.40%] ------------------------End Web pg----------------------- income: Was the estimated annual income for your household in 2016: 1 - Less than $50,000 [go to inc50] [38.01%] 2 - At least $50,000 but less than $100,000 [go to inc100] [34.81%] 3 - At least $100,000 but less than $150,000 [go to inc150] [17.83%] 4 - $150,000 or more [go to inc200] [9.35%] ------------------------End Web pg----------------------- inc_50: Was the estimated annual income for your household in 2016:

29
1 - Less than $10,000 [21.60%] 2 - $10,000 to less than $20,000 [23.93%] 3 - $20,000 to less than $30,000 [20.35%] 4 - $30,000 to less than $40,000 [21.40%] 5 - $40,000 to less than $50,000 [12.72%] ------------------------End Web pg----------------------- inc_100: Was the estimated annual income for your household in 2016: 6 - $50,000 to less than $60,000 [30.30%] 7 - $60,000 to less than $70,000 [24.43%] 8 - $70,000 to less than $80,000 [19.23%] 9 - $80,000 to less than $90,000 [14.08%] 10 - $90,000 to less than $100,000 [11.96%] ------------------------End Web pg----------------------- inc_150: Was the estimated annual income for your household in 2016: 11 - $100,000 to less than $110,000 [28.35%] 12 - $110,000 to less than $120,000 [22.46%] 13 - $120,000 to less than $130,000 [16.73%] 14 - $130,000 to less than $140,000 [17.92%] 15 - $140,000 to less than $150,000 [14.53%] ------------------------End Web pg----------------------- inc_200: Was the estimated annual income for your household in 2016: 16 - $150,000 to less than $160,000 [18.23%] 17 - $160,000 to less than $170,000 [12.34%] 18 - $170,000 to less than $180,000 [11.52%] 19 - $180,000 to less than $190,000 [3.58%] 20 - $190,000 to less than $200,000 [15.38%] 21 - $200,000 or more [38.96%] ------------------------End Web pg----------------------- oft_twit: About how often do you use Twitter? 0 - Never [58.89%] 1- Less than once a month [10.55%] 2 - Several times a month [5.62%] 3 - About once a week [4.25%] 4 - Several times a week [8.24%] 5 - Once or twice most days [5.50%] 6 - Several times almost every day [6.96%] oft_FB: About how often do you use Facebook? 0 - Never [14.26%] 1 - Less than once a month [4.49%] 2 - Several times a month [6.65%] 3 - About once a week [5.99%] 4 - Several times a week [11.09%] 5 - Once or twice most days [18.23%] 6 - Several times almost every day [39.29%] ------------------------End Web pg-----------------------

30
Research shows that information can influence the way that people answer survey questions. We would like to know if you generally read the information that comes before survey questions. To demonstrate that you have read this text, please ignore the question below and click on the blue dot. ign_instruct: Which of the following devices do you typically use to answer surveys on the Internet? 1 - A computer [37.36%] 2 - A tablet (such as an iPad) [9.66%] 3 - A smart phone (such as an Android or iPhone) [31.38%] is_bluedot: Clicked on the blue dot [15.05%]