esmartmoney · provided through personal, face-to-face advice. our range of services is extensive,...
TRANSCRIPT
JANUARY / FEBRUARY 2017
INVESTMENTOUTLOOK
Taking advantage of opportunities in 2017
ESMARTMONEY
TOP TRUMP 2016/17 YEAR END PLANNING DELEGATING POWERWinners and losers
from the seismic US election result
Keeping your taxes as low as possible – what you may wish to consider sooner rather than later
When you are unable to make your own decisions

COULD YOUR MONEY WORK HARDER?We focus on achieving and maintaining a thorough understanding of your financial needs and aspirations.We believe passionately that the best service is provided through personal, face-to-face advice. Our range of services is extensive, supported by a distinctive approach to investment management, enabling you to create financial plans that can adapt to your changing needs and circumstances.
CONTACT US TO DISCUSS YOUR REQUIREMENTS.
COULD YOUR MONEY WORK HARDER?
CONTENT S
03
05 DELEGATING POWER When you are unable to make your own decisions
06 TOP TRUMP Winners and losers from the seismic US election result
08 2016/17 YEAR END PLANNING Keeping your taxes as low as possible – what you may wish to consider sooner rather than later
09 MONEY PURCHASE ANNUAL ALLOWANCE Reduction to prevent inappropriate double tax relief
10 INVESTMENT OUTLOOK Taking advantage of opportunities in 2017
11 LIFETIME INDIVIDUAL SAVINGS ACCOUNTS Make your next move to saving flexibly for a first home and retirement
12 FINANCIAL FUTURES Building a nest egg for when children need it
13 GENDER SAVINGS GAP WIDENS Report findings suggest this trend is set to continue
CONTENTS
05
11
13
12
06

The content of the articles featured in this publication is for your general information and use only and is not intended to address your particular requirements. Articles should not be relied upon in their entirety and shall not be deemed to be, or constitute, advice. Although endeavours have been made to provide accurate and timely information, there can be no guarantee that such information is accurate as of the date it is received or that it will continue to be accurate in the future. No individual or company should act upon such information without receiving appropriate professional advice after a thorough examination of their particular situation. We cannot accept responsibility for any loss as a result of acts or omissions taken in respect of any articles. Thresholds, percentage rates and tax legislation may change in subsequent Finance Acts. Levels and bases of, and reliefs from, taxation are subject to change and their value depends on the individual circumstances of the investor. The value of your investments can go down as well as up and you may get back less than you invested. Past performance is not a reliable indicator of future results.
INSIDE THIS ISSUE
14 INCOME MATTERS Providing the foundation for an exciting new chapter in your life
16 DON’T PUT ALL OF YOUR EGGS IN ONE BASKET Holding a blend of assets to help you navigate the volatility of markets
18 FORGOTTEN PENSIONS Out of sight, out of mind
20 PORTFOLIO PROTECTION Are we seeing the return of inflation?
22 SUSTAINABLE INVESTING Strategies to meet some of the most pressing global challenges ahead
24 TAKING A LONG-TERM VIEW Getting the right balance between shares, bonds and other investments
Welcome to our first issue of 2017. Did you make any resolutions concerning your personal finances last January? If so, how did you do? If it didn’t all go according to plan, now is the perfect time to start again and reassess your position by considering ways to improve your financial well-being for today and your future.
Last year was the year of seismic election results, both in the UK and the US, which will determine the national and international political and financial landscape for decades to come. After a long and brutal US presidential election campaign, Donald Trump emerged victorious as the surprise victor. His inauguration is scheduled for Friday 20 January when he’ll become the 45th President of the United States. On page 06, we consider who are likely to be the winners and losers.
The 2016/17 Year End for tax planning purposes is now only a matter of months away with the deadline approaching on 5 April. Effective tax planning is about knowing the personal and business taxes you are liable to pay and acting to legally minimise them. It is also about maximising your net income and creating opportunities to invest and save tax-efficiently for the current and future needs of your business, your family and yourself. Turn to page 08 to read the full article.
After a game-changing 2016, the investment environment was not only mixed but characterised by uneven global growth. On page 10, we look ahead to this year’s gradual repair of the global economy and greater political clarity in the USA which should allow investors to take advantage of opportunities in 2017.
The full list of the articles featured in this issue appears on pages 03 and 04.
To discuss any of the articles featured in this issue, please contact us.
04
INFORMATION IS BASED ON OUR CURRENT UNDERSTANDING OF TAXATION LEGISLATION AND REGULATIONS. ANY LEVELS AND BASES OF, AND RELIEFS FROM, TAXATION ARE SUBJECT TO CHANGE.
THE VALUE OF INVESTMENTS AND INCOME FROM THEM MAY GO DOWN. YOU MAY NOT GET BACK THE ORIGINAL AMOUNT INVESTED.
PAST PERFORMANCE IS NOT A RELIABLE INDICATOR OF FUTURE PERFORMANCE.
CONTENTS
JANUARY / FERUARY 2017
14 18
2220

05
ESTATE PLANNING
DELEGATING POWERWhen you are unable to make your own decisions
The figures from the Office of the Public Guardian (OPG) were disclosed through a Freedom of Information
request by Old Mutual Wealth.
TRUSTED FRIEND An LPA is used to delegate power to someone to manage an individual’s personal and/or welfare affairs in the event that they become mentally incapacitated.
There are two types: Property & Financial Lasting Power of Attorney (P&F LPA) and Health & Welfare Lasting Power of Attorney (H&W LPA). Registering an LPA covering either or both of these areas means that someone gives a trusted friend, family member, solicitor or other individual the responsibility for managing their affairs if they become mentally incapacitated.
OWN DECISIONS Not having an LPA in place can cause problems for both individuals and their families if they become unable to make their own decisions. LPAs were introduced in 2007 following concerns around potential ‘abuse’ of the existing Enduring Powers of Attorney process.
The average age of those registering an LPA (known as ‘donors’) has fallen from 79 in 2008 to 75 in 2015. It suggests that as awareness of mental health conditions increases, people are becoming increasingly inclined to prepare earlier in life.
LIFE PLANNING Building a financial plan does not have to be only about investing for the future. The most detailed financial planning goes hand in hand with your life planning, and appointing an
attorney through a Lasting Power of Attorney is a way to ensure management of your personal affairs is factored into your financial preparations for retirement and later life.
The data shows that hundreds of thousands of people every year are now putting in place a Power of Attorney, delegating responsibility for their health or financial decisions to a trusted friend or relative in case they become mentally incapacitated in later life. t
MORE THAN TWO MILLION LASTING POWER OF ATTORNEY (LPA) REGISTRATIONS WILL HAVE BEEN FILED BY THE END OF 2016, WITH THE NUMBER OF APPOINTMENTS MORE THAN TREBLING BETWEEN 2010 AND 2015.
CERTAINTY OVER THE FUTURE MANAGEMENT OF YOUR FINANCIAL AFFAIRS Talking to your parents or other family members about this is a delicate issue. And it is all too easy to take it for granted that you will always be in a position to manage your own affairs. But mental incapacity is something that affects millions of people, and by planning ahead it is possible to confront the matter head-on, giving both you and your family some certainty over the future management of your financial affairs, welfare decisions, or both.
THE AVERAGE AGE OF THOSE REGISTERING A LPA (KNOWN AS ‘DONORS’) HAS FALLEN FROM 79 IN 2008 TO 75 IN 2015. IT SUGGESTS THAT AS AWARENESS OF MENTAL HEALTH CONDITIONS INCREASES, PEOPLE ARE BECOMING INCREASINGLY INCLINED TO PREPARE EARLIER IN LIFE.

INVESTMENT
AFTER A LONG AND BRUTAL US PRESIDENTIAL ELECTION CAMPAIGN, DONALD TRUMP EMERGED VICTORIOUS, WINNING 279 ELECTORAL VOTES
AND 47.5% OF THE POPULAR VOTE. REPUBLICANS ALSO MAINTAINED MAJORITIES IN THE HOUSE AND THE SENATE.
Winners and losers from the seismic US election result
TOP TRUMP
06
INVESTMENT
His inauguration is scheduled for Friday 20 January. Trump will be sworn in as the 45th President of the
United States on the steps of the US Capitol at noon, when current president Barack Obama’s term expires.
WHO ARE THE CLEAR WINNERS? Initially, the clear winners of this seismic election result appear to be US infrastructure and business. Trump has pledged to rebuild roads, rail, hospitals and schools, and promised US corporations will pay no more than 15% tax on profits: the biggest concession since Reagan’s tenure.
Fossil fuel companies could benefit given Trump’s disbelief in global warming and promotion of US energy independence. Pharmaceuticals could benefit too, with price controls less of a concern than if Clinton had won. Finally, banks could flourish as regulations are potentially relaxed.
GREATEST IMPACT FOR THE US ECONOMYAreas of greatest impact for the US economy are increased fiscal spending, an issue with clear bipartisan support and the more negative uncertainty associated with Trump’s trade policy. On international trade, there is potentially greater uncertainty as a result of Trump’s ability to act unilaterally on tariffs without Congressional approval. This is as far-ranging as withdrawals from trade agreements such as the North Atlantic Free Trade Agreement (NAFTA) or as tactical as his much talked-about China tariffs.
The UK, European and Asian markets initially fell on news of America’s election result, but markets then largely recovered. The short-term market reaction reflected this uncertainty, but for investors the long-term outlook is more important.
KEY POINTS TO CONSIDERFirst, the US economy that President Trump inherits is in relatively good shape. Economic growth picked up in 2016, while the unemployment rate is close to any economist’s definition of full employment.
Profits of companies in the S&P 500 rebounded smartly from the oil-and-dollar-induced slump of 2015, and inflation is still moderate. Moreover, the global economy is also showing signs of life, with the global manufacturing purchasing managers’ index – a survey of activity in the manufacturing sector – hitting a two-year high towards the end of last year. All of this, absent political uncertainty, would be positive for share prices and negative for bonds.
Second, the uncertainty and volatility following the election will (for now) reduce the probability of US interest rate rises, although the Federal Reserve will want to leave its options open until it can assess the market and economic fallout from the election result.
Third, while the results represented a Republican sweep, actual policy change may be far less dramatic than was proposed by Trump during the campaign. It should be noted that there is a wide gulf between Trump’s agenda and that of many ‘establishment’ Republicans, and the latter may well balk at unfunded tax cuts or spending increases. In addition, both the new president and Congress will likely act more slowly on dismantling the Affordable Care Act or trade agreements until some better alternatives can be found.
VOTERS CHOOSE CHANGE OVER CAUTION It should also be noted that, as was the case elsewhere in the world last year, voters have chosen change over caution – and politicians tend to respond to what voters want rather than what they need. While the Trump agenda is unlikely to be implemented in full, members of Congress may be willing to go along with some proposals to increase spending, lower taxes, reduce illegal
immigration and increase tariffs. If they do so, they may well further stoke inflation in an economy that is already heating up. Longer term, increasing government debt to fund these initiatives has obvious dangers.
In the medium term, a warming economy – further stoked by expansionary fiscal policy – could favour equities over government bonds. In the long term, maintaining a diversified portfolio of investments may be more important than ever. In light of the Brexit vote and the US elections, 2016 proved decisively that populism is a good political strategy – whether it proves to be good for long-term economic fortunes is another question entirely. t
INFORMATION IS BASED ON OUR CURRENT UNDERSTANDING OF TAXATION
LEGISLATION AND REGULATIONS. ANY LEVELS AND BASES OF, AND RELIEFS FROM,
TAXATION ARE SUBJECT TO CHANGE.
THE VALUE OF INVESTMENTS AND INCOME FROM THEM MAY GO DOWN. YOU MAY NOT
GET BACK THE ORIGINAL AMOUNT INVESTED.
PAST PERFORMANCE IS NOT A RELIABLE INDICATOR OF FUTURE PERFORMANCE.
INVESTMENTS BASED UPON YOUR UNIQUE NEEDS Political challenges in the USA and Europe are going to characterise investment throughout 2017 and beyond. If you would like to discuss how to navigate your way through these challenges, we provide access to a variety of investment products to help you select the investments based upon your unique needs. To review your current situation, please contact us – we look forward to hearing from you.
THE UK, EUROPEAN AND ASIAN MARKETS INITIALLY FELL ON NEWS OF AMERICA’S ELECTION RESULT, BUT MARKETS THEN LARGELY RECOVERED. THE SHORT-TERM MARKET REACTION
REFLECTED THIS UNCERTAINTY, BUT FOR INVESTORS THE LONG-TERM OUTLOOK IS MORE IMPORTANT.
07

08
While there is no doubt that the tax system is complex, you should not let complexity deter you from
a simple goal: keeping your taxes as low as possible. We have provided some of the key areas you may wish to consider, if applicable to your particular situation.
PERSONAL ALLOWANCE Aim to ensure each spouse uses their full Personal Allowance for Income Tax purposes where possible. Annual income of less than currently £11,000 is not liable to tax. Spouses and registered civil partners should consider the possible transfer of income-producing assets to ensure that Personal Allowances are not wasted.
PERSONAL ALLOWANCE FOR HIGH EARNERSYour Personal Allowance goes down by £1 for every £2 that your adjusted net income is above £100,000. This means your allowance is zero if your income is £122,000 or above. If appropriate to your particular situation, making charitable donations that qualify for Gift Aid could reduce total income. In addition, annual gross personal pension contributions may be deducted from total annual-earned income for the calculation of adjusted income, and certain other investment structures may qualify for significant tax rebates which could be used to offset the reduction. Also, moving investments that generate income from taxed to tax-efficient environments could also reduce an individual’s ‘net adjusted annual income’.
TAX-RELIEVABLE PENSION CONTRIBUTIONS The Annual Allowance for making tax-relievable pension contributions is £40,000, so consideration should be made to utilising the full Annual Allowance for 2016/17 by 5 April 2017. ‘Tax-relievable pension contributions’ relates to personal contributions and the availability of the Annual Allowance, and any carry forward relief is subject to 100% Net Relevant Earnings (NRE). It is possible to carry forward unused Annual Allowances from the previous three tax years, so it may be possible to receive tax relief in the current tax year on contributions in excess of £40,000 with a little planning.
TAX-RELIEVABLE PENSION FOR HIGH EARNERSFor high earners, the Annual Allowance definition is more complicated, but those with an annual ‘adjusted income’ of more than £150,000 will be reduced to as little as £10,000 for 2016/17. There are two triggers for a reduction in the annual allowance, both of which must apply for the allowance to be reduced. The first is that the individual’s adjusted income for the year is more than £150,000. The second is that the individual’s `threshold income’ for the year is more than £150,000 less the standard annual allowance for the year. Thus the threshold income limit is £110,000 for 2016/17 (£150,000 less the standard annual allowance of £40,000).
Essentially, ‘adjusted income’ is all income including pension contributions (both individual and employer contributions), whereas threshold income excludes pension contributions.
Where the individual has both adjusted income of more than £150,000 and threshold income of more than £110,000 for 2016/17, the annual allowance of £40,000 is reduced by £1 for every £2 by which adjusted income exceeds £150,000. The maximum reduction is £30,000, meaning that the minimum allowance for 2016/17 is £10,000. This will apply to anyone with adjusted income of more than £210,000 (and threshold income of more than £110,000).
PENSION LIFETIME ALLOWANCEThe pension Lifetime Allowance – the total amount of UK pension savings each individual is allowed to build up in their lifetime – is currently £1 million. An individual is able to accumulate more than the Lifetime Allowance, but the sum in excess of the Lifetime Allowance will be subject to a 55% tax charge. The ‘flexible drawdown’ pension rules now in place from 6 April 2015 onwards allow individuals the opportunity to plan their affairs to manage the level of the money they take from their pension pot to both minimise annual Income Tax liabilities and keep within the Lifetime Allowance. A review of what you could draw down as income from your pension funds before 6 April 2017 could prove worthwhile.
TAX-FAVOURABLE INVESTMENTS If appropriate to your particular situation, the use of tax-favourable investments such as Individual Savings Accounts (ISAs), Enterprise Investment Schemes (EISs), Seed Enterprise Investment Schemes (SEISs) and Venture Capital Trusts (VCTs) should be reviewed in conjunction with your financial adviser. Up to £15,240 per person (so up to £30,480 for a married couple) can be invested in an ISA for the 2016/17 year. EISs, SEISs and VCTs are generally considered high risk investments and may not be considered suitable for all types of investors.
THE 2016/17 YEAR END FOR TAX PLANNING PURPOSES IS NOW ONLY A MATTER OF MONTHS AWAY, WITH THE DEADLINE APPROACHING ON 5 APRIL. EFFECTIVE TAX PLANNING IS ABOUT KNOWING THE PERSONAL AND BUSINESS TAXES YOU ARE LIABLE TO PAY AND ACTING TO LEGALLY MINIMISE THEM. IT IS ALSO ABOUT MAXIMISING YOUR NET INCOME AND CREATING OPPORTUNITIES TO INVEST AND SAVE TAX-EFFICIENTLY FOR THE CURRENT AND FUTURE NEEDS OF YOUR BUSINESS, YOUR FAMILY AND YOURSELF.
TAX
Keeping your taxes as low as possible – what you may wish to consider sooner rather than later
2016/17 YEAR END PLANNING
09
LEVELS AND BASES OF, AND RELIEFS FROM, TAXATION ARE SUBJECT TO CHANGE AND THE VALUE DEPENDS ON THE INDIVIDUAL CIRCUMSTANCES OF THE INVESTOR.
THE VALUE OF INVESTMENTS AND INCOME FROM THEM MAY GO DOWN. YOU MAY NOT GET BACK THE ORIGINAL AMOUNT INVESTED.
COMPANY DIVIDENDS From 6 April 2016, company dividends are still treated as the top slice of income but will no longer be grossed up, and will be taxed at 7.5% in the basic rate band, 32.5% in the higher rate band and 38.1% in the additional rate band. However, the first £5,000 of dividends will be tax-free to the recipient, no matter which tax band you fall in.
CAPITAL GAINS TAX It’s important to consider utilising your tax-free Capital Gains Tax Annual Exemption, currently £11,100. Each spouse or registered civil partner is entitled to the exemption each year, so gifts between spouses prior to sales of assets may be tax-effective. It may be worth crystallising capital losses where gains in excess of the Annual Exemption have been made. The deferral of sales until after 5 April may see tax paid at lower rates and provide significant cash flow benefits in terms of when tax needs to be paid.
INHERITANCE TAX The use of and the carrying forward of the £3,000 annual exemption should be reviewed, together with other possible exemptions such as those for small gifts of up to £250 per individual, regular gifts out of normal annual income and tax-free gifts in consideration of marriage, which can range between £1,000 and £5,000 depending on the relationship with the person getting married. t
LEVELS AND BASES OF, AND RELIEFS FROM, TAXATION ARE SUBJECT TO CHANGE.
RETIREMENT
WANT TO EXPLORE THE OPTIONS AVAILABLE TO YOU?We all have to pay our taxes, but within the legal framework there are numerous ways of saving tax and making sure you do not pay more than is absolutely necessary. If you would like to explore the options available to you in preparation for the 2016/17 year end, please contact us sooner rather than later.
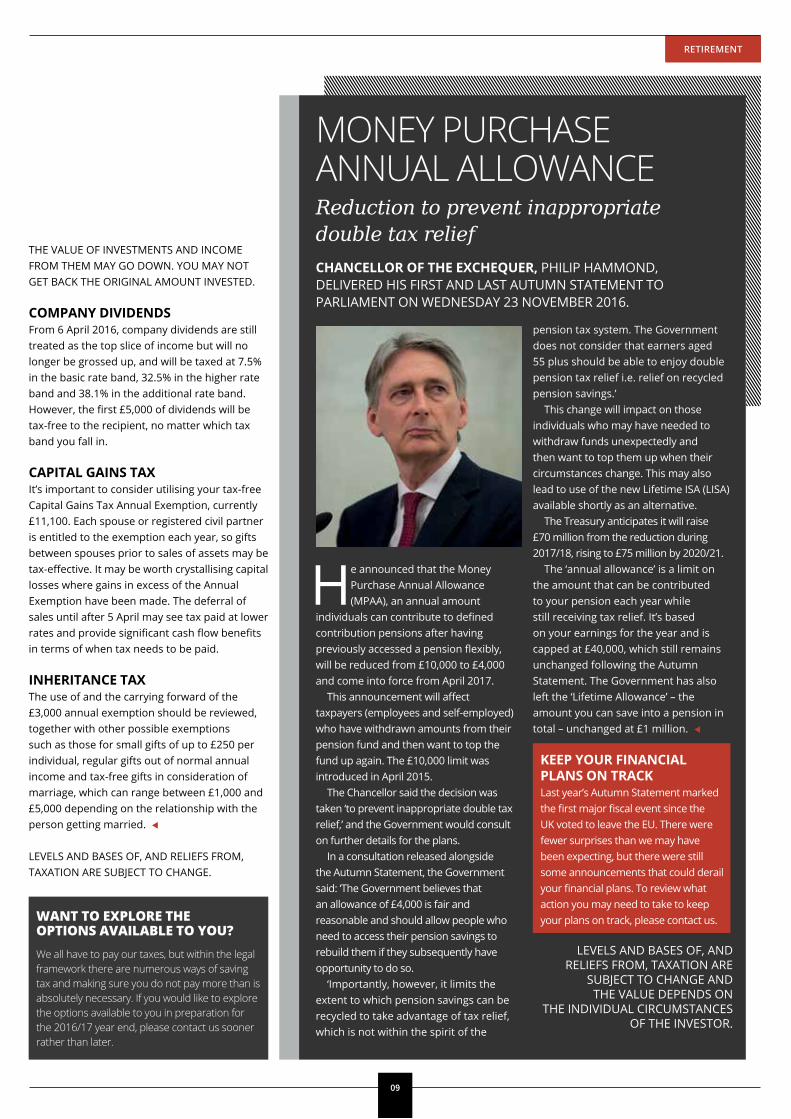
MONEY PURCHASE ANNUAL ALLOWANCEReduction to prevent inappropriatedouble tax reliefCHANCELLOR OF THE EXCHEQUER, PHILIP HAMMOND, DELIVERED HIS FIRST AND LAST AUTUMN STATEMENT TO PARLIAMENT ON WEDNESDAY 23 NOVEMBER 2016.
He announced that the Money Purchase Annual Allowance (MPAA), an annual amount
individuals can contribute to defined contribution pensions after having previously accessed a pension flexibly, will be reduced from £10,000 to £4,000 and come into force from April 2017.
This announcement will affect taxpayers (employees and self-employed) who have withdrawn amounts from their pension fund and then want to top the fund up again. The £10,000 limit was introduced in April 2015.
The Chancellor said the decision was taken ‘to prevent inappropriate double tax relief,’ and the Government would consult on further details for the plans.
In a consultation released alongside the Autumn Statement, the Government said: ‘The Government believes that an allowance of £4,000 is fair and reasonable and should allow people who need to access their pension savings to rebuild them if they subsequently have opportunity to do so.
‘Importantly, however, it limits the extent to which pension savings can be recycled to take advantage of tax relief, which is not within the spirit of the
pension tax system. The Government does not consider that earners aged 55 plus should be able to enjoy double pension tax relief i.e. relief on recycled pension savings.’
This change will impact on those individuals who may have needed to withdraw funds unexpectedly and then want to top them up when their circumstances change. This may also lead to use of the new Lifetime ISA (LISA) available shortly as an alternative.
The Treasury anticipates it will raise £70 million from the reduction during 2017/18, rising to £75 million by 2020/21.
The ‘annual allowance’ is a limit on the amount that can be contributed to your pension each year while still receiving tax relief. It’s based on your earnings for the year and is capped at £40,000, which still remains unchanged following the Autumn Statement. The Government has also left the ‘Lifetime Allowance’ – the amount you can save into a pension in total – unchanged at £1 million. t
KEEP YOUR FINANCIAL PLANS ON TRACK Last year’s Autumn Statement marked the first major fiscal event since the UK voted to leave the EU. There were fewer surprises than we may have been expecting, but there were still some announcements that could derail your financial plans. To review what action you may need to take to keep your plans on track, please contact us.
LEVELS AND BASES OF, AND RELIEFS FROM, TAXATION ARE
SUBJECT TO CHANGE AND THE VALUE DEPENDS ON
THE INDIVIDUAL CIRCUMSTANCES OF THE INVESTOR.
10
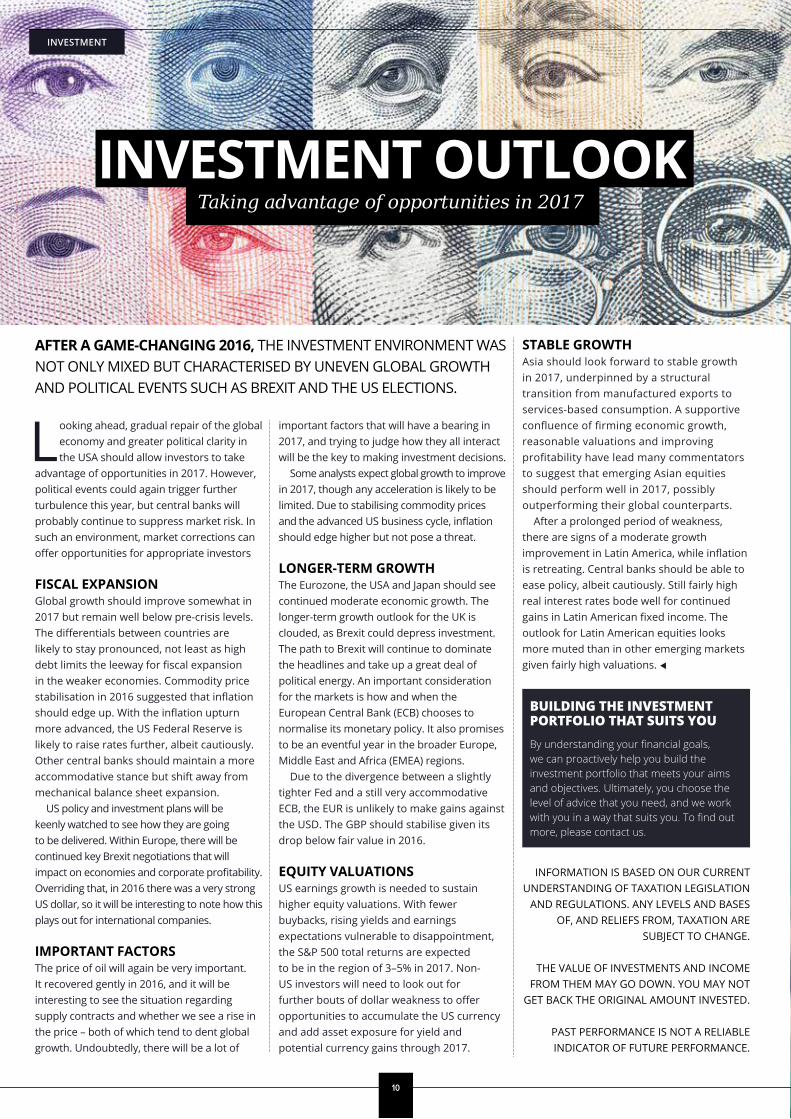
Looking ahead, gradual repair of the global economy and greater political clarity in the USA should allow investors to take
advantage of opportunities in 2017. However, political events could again trigger further turbulence this year, but central banks will probably continue to suppress market risk. In such an environment, market corrections can offer opportunities for appropriate investors
FISCAL EXPANSION Global growth should improve somewhat in 2017 but remain well below pre-crisis levels. The differentials between countries are likely to stay pronounced, not least as high debt limits the leeway for fiscal expansion in the weaker economies. Commodity price stabilisation in 2016 suggested that inflation should edge up. With the inflation upturn more advanced, the US Federal Reserve is likely to raise rates further, albeit cautiously. Other central banks should maintain a more accommodative stance but shift away from mechanical balance sheet expansion.
US policy and investment plans will be keenly watched to see how they are going to be delivered. Within Europe, there will be continued key Brexit negotiations that will impact on economies and corporate profitability. Overriding that, in 2016 there was a very strong US dollar, so it will be interesting to note how this plays out for international companies.
IMPORTANT FACTORSThe price of oil will again be very important. It recovered gently in 2016, and it will be interesting to see the situation regarding supply contracts and whether we see a rise in the price – both of which tend to dent global growth. Undoubtedly, there will be a lot of
important factors that will have a bearing in 2017, and trying to judge how they all interact will be the key to making investment decisions.
Some analysts expect global growth to improve in 2017, though any acceleration is likely to be limited. Due to stabilising commodity prices and the advanced US business cycle, inflation should edge higher but not pose a threat.
LONGER-TERM GROWTH The Eurozone, the USA and Japan should see continued moderate economic growth. The longer-term growth outlook for the UK is clouded, as Brexit could depress investment. The path to Brexit will continue to dominate the headlines and take up a great deal of political energy. An important consideration for the markets is how and when the European Central Bank (ECB) chooses to normalise its monetary policy. It also promises to be an eventful year in the broader Europe, Middle East and Africa (EMEA) regions.
Due to the divergence between a slightly tighter Fed and a still very accommodative ECB, the EUR is unlikely to make gains against the USD. The GBP should stabilise given its drop below fair value in 2016.
EQUITY VALUATIONS US earnings growth is needed to sustain higher equity valuations. With fewer buybacks, rising yields and earnings expectations vulnerable to disappointment, the S&P 500 total returns are expected to be in the region of 3–5% in 2017. Non-US investors will need to look out for further bouts of dollar weakness to offer opportunities to accumulate the US currency and add asset exposure for yield and potential currency gains through 2017.
STABLE GROWTH Asia should look forward to stable growth in 2017, underpinned by a structural transition from manufactured exports to services-based consumption. A supportive confluence of firming economic growth, reasonable valuations and improving profitability have lead many commentators to suggest that emerging Asian equities should perform well in 2017, possibly outperforming their global counterparts.
After a prolonged period of weakness, there are signs of a moderate growth improvement in Latin America, while inflation is retreating. Central banks should be able to ease policy, albeit cautiously. Still fairly high real interest rates bode well for continued gains in Latin American fixed income. The outlook for Latin American equities looks more muted than in other emerging markets given fairly high valuations. t
INFORMATION IS BASED ON OUR CURRENT UNDERSTANDING OF TAXATION LEGISLATION
AND REGULATIONS. ANY LEVELS AND BASES OF, AND RELIEFS FROM, TAXATION ARE
SUBJECT TO CHANGE.
THE VALUE OF INVESTMENTS AND INCOME FROM THEM MAY GO DOWN. YOU MAY NOT
GET BACK THE ORIGINAL AMOUNT INVESTED.
PAST PERFORMANCE IS NOT A RELIABLE INDICATOR OF FUTURE PERFORMANCE.
AFTER A GAME-CHANGING 2016, THE INVESTMENT ENVIRONMENT WAS NOT ONLY MIXED BUT CHARACTERISED BY UNEVEN GLOBAL GROWTH AND POLITICAL EVENTS SUCH AS BREXIT AND THE US ELECTIONS.
BUILDING THE INVESTMENT PORTFOLIO THAT SUITS YOUBy understanding your financial goals, we can proactively help you build the investment portfolio that meets your aims and objectives. Ultimately, you choose the level of advice that you need, and we work with you in a way that suits you. To find out more, please contact us.
INVESTMENT
INVESTMENT OUTLOOKTaking advantage of opportunities in 2017

11
LIFETIME INDIVIDUAL SAVINGS ACCOUNTS
Make your next move to saving flexibly for a first home and retirement
They can use some or all of the money to buy their first home or keep it until they’re 60. Similar to normal
Individual Savings Accounts, they won’t have to pay any Capital Gains Tax or further Income Tax on profits taken.
GOVERNMENT BONUS Individuals can save and invest up to £4,000 each year and receive a government bonus of 25% – that’s a bonus of up to £1,000 a year, and they can use some or all of the money to buy their first home or keep it until they’re 60 – it’s up to them.
Lifetime ISA accounts will be available from 6 April 2017 and can be opened between the ages of 18 and 40, and any savings put in before their 50th birthday will receive an added 25% bonus from the Government.
There is no maximum monthly contribution – someone can save as little or as much as they want each month (up to £4,000 a year), with the total amount they can save each year into all Individual Savings Accounts
being increased from the current £15,240 to £20,000 from 6 April 2017. The £20,000 ISA allowance excludes contributions to any Junior ISAs, which have their own distinct allowance applying to each child.
SAVING FOR A FIRST HOMEAny time from 12 months after opening a Lifetime ISA, individuals will be able to use their savings and bonus from one of the accounts towards a deposit on their first home worth up to £450,000 in the UK.
If they have a Help to Buy Individual Savings Account, they can transfer those savings into a Lifetime ISA in 2017 or continue saving in both, but they will only be able to use the bonus from one of the accounts to buy a house.
SAVING FOR RETIREMENTAfter their 60th birthday, they can take out all the savings tax-efficiently. If they withdraw the money before they turn 60, they will lose the government bonus (and any interest or growth on this). They will also have to pay a 5% charge. t
INFORMATION IS BASED ON OUR CURRENT UNDERSTANDING OF TAXATION LEGISLATION
AND REGULATIONS. ANY LEVELS AND BASES OF, AND RELIEFS FROM, TAXATION ARE
SUBJECT TO CHANGE.
THE VALUE OF INVESTMENTS AND INCOME FROM THEM MAY GO DOWN. YOU MAY NOT
GET BACK THE ORIGINAL AMOUNT INVESTED.
PAST PERFORMANCE IS NOT A RELIABLE INDICATOR OF FUTURE PERFORMANCE.
LIFETIME INDIVIDUAL SAVINGS ACCOUNTS ARE BEING LAUNCHED BY THE GOVERNMENT TO HELP 18–40-YEAR-OLDS TO SAVE AND INVEST FLEXIBLY FOR THE LONG TERM. THE AIM IS THAT PEOPLE WILL NOT
HAVE TO CHOOSE BETWEEN SAVING FOR THEIR FIRST HOME AND RETIREMENT.
QUALITY PROFESSIONAL FINANCIAL ADVICECreating and maintaining the right investment strategy plays a vital role in securing your financial future. We can provide the quality professional financial advice, comprehensive investment solutions and ongoing service to help you achieve your financial goals. To find out more, please contact us.
SAVING

12
When you consider the rising costs associated with your child growing up, there’s no doubt it makes
sense to consider saving to give them a head start with their future. Whether this is with university tuition fees in mind or simply to help with the costs of buying a first car or home, saving regularly can help to build a nest egg for them when they need it.
HIGHER SAVINGSIn a survey of 2,000 UK adults conducted for M&G in October 2016, almost half (48%) said they had saved or invested money for a child or grandchild under the age of 18 in the last five years. The most common form of saving, according to the survey, has been into children’s bank savings accounts, despite interest rates on cash savings being near record lows.
14% of parents and grandparents reported that they had used another vehicle for child savings: the Junior Individual Savings Account (ISA). The advantage of ISAs is that any returns will be exempt from personal taxation. This will not necessarily be the case for other types of account.
LONGER TERMJunior ISAs can hold stocks and shares as well as cash savings. Given that the money is tied up until their 18th birthday, taking a long-term approach – and potentially accepting some degree of investment risk – could allow the child’s money to grow more than it could if kept in cash.
Given the large costs young adults can face – from university to buying a home, or even getting married – any additional returns that you could generate on your children’s savings will be valuable.
FURTHER EDUCATIONTwo in five (40%) of those who have saved or invested for their child or grandchild said they don’t mind how the money is ultimately spent, but most would prefer it to be spent in a certain way. More than one in three (35%) said they hoped it would help cover the costs of further education.
However, once children reach 18, they’ll usually be able to draw on their savings and be able to use them as they see fit – a disconcerting prospect for any parents and grandparents who fear their hard-earned money will be frittered away.
FINANCIAL RESPONSIBILITY Confidence in the financial responsibility of young adults could certainly be greater. One in three of our survey respondents (32%) said they would be more likely to save for their child or grandchild if they knew the child understood how to manage money responsibly.
Others take a harder line: 17% said they would be more inclined to save for a child if they decided how it’s spent, and 22% would if the money could only be tapped at 21, not 18.
SAVE OR INVEST For grandparents, a simple change in government policy could help. Currently, only parents or guardians can open a Junior ISA for a child. The survey found that 31% of grandparents would be more likely to save or invest for their grandchildren if they could open an account such as a Junior ISA themselves.
When you’re thinking about investing through an ISA, it’s important to remember that ISA tax rules may change in the future. The tax advantages of investing through an ISA will also depend on your personal circumstances. t
Source data:Opinium survey of 2,000 UK adults, conducted for M&G October 2016
STOCKS AND SHARES WITHIN A JUNIOR ISA DO NOT INCLUDE THE SAME SECURITY OF CAPITAL WHICH IS AFFORDED WITH CASH
WITHIN A JUNIOR ISA.
INFORMATION IS BASED ON OUR CURRENT UNDERSTANDING OF TAXATION LEGISLATION
AND REGULATIONS. ANY LEVELS AND BASES OF, AND RELIEFS FROM, TAXATION ARE
SUBJECT TO CHANGE.
THE VALUE OF INVESTMENTS AND INCOME FROM THEM MAY GO DOWN. YOU MAY NOT
GET BACK THE ORIGINAL AMOUNT INVESTED.
PAST PERFORMANCE IS NOT A RELIABLE INDICATOR OF FUTURE PERFORMANCE.
Building a nest egg for when children need it
FINANCIAL FUTURESTHE PROSPECT OF A CHILD LEAVING HOME IS SCARY ENOUGH FOR PARENTS – AND THEN THERE’S MONEY TO THINK ABOUT. EVEN IF THEY GET A STUDENT LOAN OR FIND WORK, HOW WILL THEY BE ABLE TO AFFORD THEIR FIRST CAR OR HOME? PARENTS AND FAMILY OFTEN DO WHAT THEY CAN TO HELP GIVE CHILDREN A FINANCIAL LEG-UP, WITH MANY CHOOSING TO SET ASIDE MONEY FOR THEIR FUTURE DURING THEIR CHILDHOOD.
WONDERFUL GIFT FOR THE FUTURE Saving for a child today is a wonderful gift for their future. Not only can they start their adult lives with some savings in hand, but getting them involved early with saving also helps them learn important lessons about money. If you would like to look at the options available, please contact us.
INVESTMENT
13
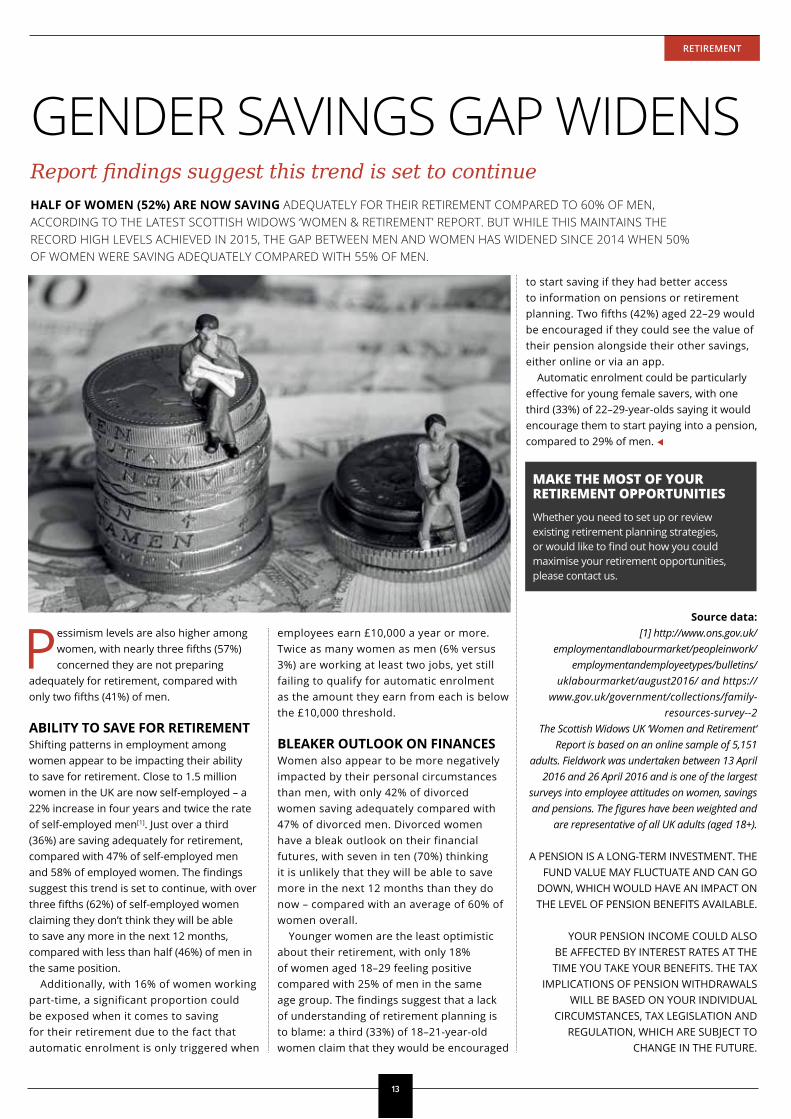
GENDER SAVINGS GAP WIDENS Report findings suggest this trend is set to continueHALF OF WOMEN (52%) ARE NOW SAVING ADEQUATELY FOR THEIR RETIREMENT COMPARED TO 60% OF MEN, ACCORDING TO THE LATEST SCOTTISH WIDOWS ‘WOMEN & RETIREMENT’ REPORT. BUT WHILE THIS MAINTAINS THE RECORD HIGH LEVELS ACHIEVED IN 2015, THE GAP BETWEEN MEN AND WOMEN HAS WIDENED SINCE 2014 WHEN 50% OF WOMEN WERE SAVING ADEQUATELY COMPARED WITH 55% OF MEN.
Pessimism levels are also higher among women, with nearly three fifths (57%) concerned they are not preparing
adequately for retirement, compared with only two fifths (41%) of men.
ABILITY TO SAVE FOR RETIREMENTShifting patterns in employment among women appear to be impacting their ability to save for retirement. Close to 1.5 million women in the UK are now self-employed – a 22% increase in four years and twice the rate of self-employed men[1]. Just over a third (36%) are saving adequately for retirement, compared with 47% of self-employed men and 58% of employed women. The findings suggest this trend is set to continue, with over three fifths (62%) of self-employed women claiming they don’t think they will be able to save any more in the next 12 months, compared with less than half (46%) of men in the same position.
Additionally, with 16% of women working part-time, a significant proportion could be exposed when it comes to saving for their retirement due to the fact that automatic enrolment is only triggered when
employees earn £10,000 a year or more. Twice as many women as men (6% versus 3%) are working at least two jobs, yet still failing to qualify for automatic enrolment as the amount they earn from each is below the £10,000 threshold.
BLEAKER OUTLOOK ON FINANCESWomen also appear to be more negatively impacted by their personal circumstances than men, with only 42% of divorced women saving adequately compared with 47% of divorced men. Divorced women have a bleak outlook on their financial futures, with seven in ten (70%) thinking it is unlikely that they will be able to save more in the next 12 months than they do now – compared with an average of 60% of women overall.
Younger women are the least optimistic about their retirement, with only 18% of women aged 18–29 feeling positive compared with 25% of men in the same age group. The findings suggest that a lack of understanding of retirement planning is to blame: a third (33%) of 18–21-year-old women claim that they would be encouraged
to start saving if they had better access to information on pensions or retirement planning. Two fifths (42%) aged 22–29 would be encouraged if they could see the value of their pension alongside their other savings, either online or via an app.
Automatic enrolment could be particularly effective for young female savers, with one third (33%) of 22–29-year-olds saying it would encourage them to start paying into a pension, compared to 29% of men. t
Source data:[1] http://www.ons.gov.uk/
employmentandlabourmarket/peopleinwork/employmentandemployeetypes/bulletins/
uklabourmarket/august2016/ and https://www.gov.uk/government/collections/family-
resources-survey--2The Scottish Widows UK ‘Women and Retirement‘
Report is based on an online sample of 5,151 adults. Fieldwork was undertaken between 13 April
2016 and 26 April 2016 and is one of the largest surveys into employee attitudes on women, savings and pensions. The figures have been weighted and
are representative of all UK adults (aged 18+).
A PENSION IS A LONG-TERM INVESTMENT. THE FUND VALUE MAY FLUCTUATE AND CAN GO
DOWN, WHICH WOULD HAVE AN IMPACT ON THE LEVEL OF PENSION BENEFITS AVAILABLE.
YOUR PENSION INCOME COULD ALSO BE AFFECTED BY INTEREST RATES AT THE TIME YOU TAKE YOUR BENEFITS. THE TAX
IMPLICATIONS OF PENSION WITHDRAWALS WILL BE BASED ON YOUR INDIVIDUAL
CIRCUMSTANCES, TAX LEGISLATION AND REGULATION, WHICH ARE SUBJECT TO
CHANGE IN THE FUTURE.
RETIREMENT
MAKE THE MOST OF YOUR RETIREMENT OPPORTUNITIES Whether you need to set up or review existing retirement planning strategies, or would like to find out how you could maximise your retirement opportunities, please contact us.

INVESTMENT
14
The bad news is we have to find ways of funding that retirement and longevity. But low interest rates and
bond yields – the traditional sources of income – aren’t sufficient to sustain a proper living.
VARYING INCOME Changing life plans and priorities will mean we encounter varying income needs and goals throughout our life, and, when investing, certain innate behavioural traits will influence our decision-making.
With interest rates at historic lows, investors need to consider diversifying across asset classes and internationally to obtain the desired levels of income. Equities, emerging market (EM) debt and high-yield corporate bonds could help generate a real yield, albeit at some risk to capital.
ATTRACTIVE INCOMEWeak domestic growth and unorthodox monetary policies have pushed down core bond yields and kept bank account cash rates low. Investors are likely to find it difficult to generate a ‘decent’ real income from many sources previously considered reliable and ‘safe’. Dividends from equity holdings provide a stable and consistent source of income.
ALTERNATIVE INCOMEEmerging market debt provides a high yield. Many EM economies have lower
government debt levels than G7 countries but offer higher yields, providing attractive opportunities for investors.
The investable universe of EM debt has grown significantly in recent years. Active management is key to seeking out the attractive opportunities and avoiding those that are most at risk.
Flows into EM debt also dramatically changed over the course of 2016, with macroeconomic data appearing stronger now than in the first few months of the year.
HIGHER-YIELDING DEBT Given the yields available from both the US and European high-yield sector, and the current low level of defaults, some investors may prefer high yield over investment-grade bonds.
While there are concerns over the high-yield energy sector, the US high-yield market is highly diversified by sector and includes access to many other quality names. Most companies can still comfortably afford their interest payments.
INVESTMENT IMPLICATIONSIn this current environment, investors need to think beyond traditional sources of income to beat inflation, and if appropriate consider multi-asset investing. This may mean taking on more risk, but a well-diversified portfolio can help reduce volatility.
Equity dividends can be an important source of income and have historically been very stable, so it may be worth thinking about EM and high-yield debt as part of a portfolio as they can offer attractive yields relative to core bonds. t
INFORMATION IS BASED ON OUR CURRENT UNDERSTANDING OF TAXATION LEGISLATION
AND REGULATIONS. ANY LEVELS AND BASES OF, AND RELIEFS FROM, TAXATION ARE
SUBJECT TO CHANGE.
THE VALUE OF INVESTMENTS AND INCOME FROM THEM MAY GO DOWN. YOU MAY NOT
GET BACK THE ORIGINAL AMOUNT INVESTED.
PAST PERFORMANCE IS NOT A RELIABLE INDICATOR OF FUTURE PERFORMANCE.
Providing the foundation for an exciting new chapter in your life
INCOME MATTERSNOBODY KNOWS QUITE WHAT THE FUTURE HOLDS. THE GOOD NEWS IS WE ARE ALL LIVING LONGER. ADVANCES IN MEDICINE AND HEALTHIER LIFESTYLES HAVE LED TO AN INCREASE IN THE AVERAGE LIFE EXPECTANCY OF BOTH MALES AND FEMALES.
FORMULATING THE RIGHT APPROACH TO GENERATING INCOMEInvesting for income can play an important role in helping you to achieve your goals at any stage of your life. Having in place an income strategy can provide the foundation for an exciting new chapter in your life. When you’re thinking about helping to fund your retirement, formulating the right approach to generating income plays an important role. Want to assess your options? Please contact us today.

YOU’VE PROTECTED YOUR MOST VALUABLE ASSETS.But how financially secure are your dependants?Timely decisions on how jointly owned assets are held, the mitigation of Inheritance Tax, the preparation of a will and the creation of trusts can all help ensure your dependants are financially secure.
CONTACT US TO DISCUSS HOW TO SAFEGUARD YOUR DEPENDANTS, WEALTH AND ASSETS – DON’T LEAVE IT UNTIL IT’S TOO LATE.
Holding a blend of assets to help you navigate the volatility of markets
DON’T PUT ALL OF YOUR EGGS IN ONE BASKETONE OF THE MOST EFFECTIVE WAYS TO MANAGE INVESTMENT RISK IS TO SPREAD YOUR MONEY ACROSS A RANGE OF ASSETS THAT, HISTORICALLY, HAVE TENDED TO PERFORM DIFFERENTLY IN THE SAME CIRCUMSTANCES. THIS IS CALLED ‘DIVERSIFICATION’.
INVESTMENT
16
In the most general sense, it can be summed up with this phrase: ‘Don’t put all of your eggs in one basket’.
While that sentiment certainly captures the essence of the issue, it provides little guidance on the practical implications of the role diversification plays in a portfolio.
MINIMISING RISK While it cannot guarantee against losses, diversifying your portfolio effectively – holding a blend of assets to help you navigate the volatility of markets – is vital to achieving your long-term financial goals whilst minimising risk.
Although you can diversify within one asset class – for instance, by holding shares (or equities) in several companies that operate in different sectors – this will fail to insulate you from systemic risks, such as an international stock market volatility.
FURTHER DIVERSIFICATION As well as investing across asset classes, you can further diversify by spreading your investments within asset classes. For instance, corporate bonds and government bonds can offer very different propositions, with the former tending to offer higher possible returns but with a higher risk of defaults, or bond repayments not being met by the issuer.
Similarly, the risk and return profiles of shares in younger companies in growth sectors like technology, for example, contrast with those of established, dividend-paying companies.
PORTFOLIO INSULATION Effective diversification is likely to also allocate investments across different countries and regions in order to help
insulate your portfolio from local market crises or downturns. Markets around the world tend to perform differently day to day, reflecting short-term sentiment and long-term trends.
There is, however, the added danger of currency risk when investing in different countries, as the value of international currencies relative to each other changes all the time. Diversifying across assets valued in different currencies, or investing in so-called ‘hedged’ assets that look to minimise the impact from currency swings, should reduce the weakness of any one currency significantly decreasing the total value of your portfolio.
INDIVIDUAL INVESTORS Achieving effective diversification across and within asset classes, regions and currencies can be difficult, however, and typically beyond the means of individual investors. For this reason, some people choose to invest in professionally managed funds that package up several assets, rather than building their own portfolio of individual investments.
Individual funds often focus on one asset class, and sometimes even one region, and therefore typically only offer limited diversification on their own. By investing in several funds, which between them cover a breadth of underlying assets, investors can create a more effectively diversified portfolio.
MULTI-ASSET FUNDOne alternative is to invest in a multi-asset fund, which will hold a blend of different types of assets designed to offer immediate diversification with one single investment. Broadly speaking, their aim is to offer investors the prospect of less volatile returns
by not relying on the fortunes of just one asset class.
Multi-asset funds are not all the same, however. Some aim for higher returns in exchange for assuming higher risk in their investments, while others are more defensive, and some focus on delivering an income rather than capital growth. Each fund will have its own objective and risk-return profile, and these will be reflected in the allocation of its investments – for instance, whether the fund is weighted more towards bonds or equities. t
INFORMATION IS BASED ON OUR CURRENT UNDERSTANDING OF TAXATION LEGISLATION AND REGULATIONS. ANY LEVELS AND BASES OF, AND RELIEFS FROM, TAXATION ARE SUBJECT TO CHANGE.
THE VALUE OF INVESTMENTS AND INCOME FROM THEM MAY GO DOWN. YOU MAY NOT GET BACK THE ORIGINAL AMOUNT INVESTED.
PAST PERFORMANCE IS NOT A RELIABLE INDICATOR OF FUTURE PERFORMANCE.
TIME TO TAKE STOCK OF YOUR PARTICULAR SITUATION? As with all investments, investors should always check whether the strategy and underlying investments of any fund, or combination of funds, match their own attitude towards risk and return. Whatever phase of investment you are in, from capital accumulation to drawing upon your savings, there is always a valuable role for effective diversification. If you would like to take stock of your particular situation at the start of this New Year, please contact us.
INVESTMENT
17

FORGOTTEN PENSIONSOut of sight, out of mind
Among those with a forgotten pension, the majority believe they have misplaced one pot (77%), although 17% think they
have forgotten about two and 6% have forgotten three or more.
According to government figures, there is an estimated £400 million in unclaimed pension savings[3]. At the same time, almost three in five (59%) UK adults are worried about not having enough money to last them in retirement[4].
ANNUAL STATEMENTMost pension schemes of which you’ve been a member must send you a statement each year. These statements include an estimate of the retirement income that the pension pot may generate when you reach retirement.
If you’re no longer receiving these statements – perhaps because of changes of address – then to track down the pension there are three bodies to contact: the pension provider, your former employer if it was a workplace pension, or the Pension Tracing Service.
BOOST TO RETIREMENT Although tracking down a lost pension can provide a valuable boost to retirement income, those who delay could receive a smaller amount than expected. A forgotten pension may have been subject to charges and not invested in the best way suited to the policyholder, making it worth less than it would have been if it had been actively managed.
The research revealed the lack of engagement around pensions. More than a quarter of savers (28%) admitted to never reviewing their retirement savings, while almost a fifth (19%) of those with a pension said they review it less than once every five years[5].
FUND CHOICES Since the introduction of the Pensions Act 2008, every employer in the UK must put certain staff
into a pension and contribute to it – this is called ‘automatic enrolment’. Since the introduction of automatic enrolment, the number of pension savers who are unaware of their fund choices or have never reviewed them has risen to almost 1.5 million people or 15% of private sector employees, up from 9% at the start of 2013[6].
It’s also important to be aware of the potential consequences of having a number of different pension pots with small amounts of money in each. It’s likely that there will still be charges taken out of those pots for their management and administration and that can have implications if you are no longer contributing into them. t
A PENSION IS A LONG-TERM INVESTMENT. THE FUND VALUE MAY FLUCTUATE AND CAN GO DOWN, WHICH WOULD HAVE AN IMPACT ON THE LEVEL OF PENSION BENEFITS AVAILABLE.
YOUR PENSION INCOME COULD ALSO BE AFFECTED BY INTEREST RATES AT THE TIME YOU TAKE BENEFITS. TAX IMPLICATIONS OF PENSION WITHDRAWALS WILL BE BASED ON YOUR INDIVIDUAL CIRCUMSTANCES, TAX LEGISLATION AND REGULATIONS WHICH ARE SUBJECT TO CHANGE IN THE FUTURE.
Source data:[1] YouGov survey of 9,910 people in the UK
(Jan–Dec 2015) who hold a pension carried out on behalf of Friends Life, now part of the Aviva group
[2] ABI Key Facts 2015 says there are 20.8m individual pension policies in force. 13% of 20.8m = 2.7m
[3] DWP: https://www.gov.uk/government/news/new-pension-tracing-service-website-launched
[4] Research conducted for Aviva by Censuswide, with 2002 General Consumers aged 18+ in GB between 30 September and 5 October 2016. The survey was
conducted from a random sample of UK adults.[5] YouGov survey of 9,498 people in the UK carried out on behalf of Friends Life,
now part of the Aviva Group[6] Aviva’s latest ‘Working Lives’ Report and analysis of
data from the Office for National Statistics (ONS).
THE EXTENT TO WHICH PENSION POLICIES ARE BEING FORGOTTEN HAS BEEN REVEALED IN RESEARCH FROM AVIVA. A SURVEY OF ALMOST TEN THOUSAND PEOPLE WHO HOLD A PENSION HAS REVEALED THAT JUST UNDER ONE IN EIGHT
(13%) ADMITTED THEY HAVE AT LEAST ONE PENSION THAT THEY HAD FORGOTTEN ABOUT[1]. THIS IS EQUAL TO MORE THAN 2.5 MILLION PENSION POLICIES CURRENTLY SITTING IN THE BACK OF PEOPLE’S MINDS[2].
ACHIEVE YOUR RETIREMENT GOALS Regardless of the life stage you have arrived at, it is important to receive expert and professional advice on your pension plans and requirements. For more information about how we could help you achieve your retirement goals, please speak to us.
RETIREMENT
18

LOOKING FOR AN EXPERT, FLEXIBLE APPROACH TO MANAGING YOUR WEALTH?Trust, tax and insurance solutions to ensure your financial goals can be achieved.Whether your wealth comes from building a business, successful investments or family inheritance, robust family and estate planning is essential for protecting your wealth.We’ll work to understand your requirements and bring them together as part of a coordinated financial approach. CONTACT US TO DISCUSS YOUR REQUIREMENTS.

Are we seeing the return of inflation?
PORTFOLIOPROTECTION
IT HAS BEEN EASY TO GROW COMPLACENT ABOUT INFLATION IN RECENT YEARS. THE RATE OF INFLATION HAS REMAINED STUBBORNLY LOW, BUT COULD INFLATION BE FINALLY RETURNING TO
WESTERN ECONOMIES, AIDED BY THE ‘TRUMPFLATION EFFECT’?
INVESTMENT
20

Concerns about inflation were already on the rise, and Donald Trump’s victory in the US election last year has further
stoked expectations that price pressure, absent in most Western economies since the financial crisis, may make a return in 2017 and beyond.
PRICE RISESOpinions differ as to the level it will reach and whether it can be sustained, but investors should be planning to hold the right assets to guard against any havoc caused by rising prices. There are two central explanations as to why prices rise at different speeds over time.
The first is that of ‘money supply’, which influences the likely level of prices. This is the view of the monetarists who believe that inflation can be controlled by changing the level of money that circulates in the economy, for instance, overcoming low inflation by adding more money via programmes such as quantitative easing (QE).
Another view is held by Keynesian economists, who treasure the beliefs of the British economist John Maynard Keynes. They believe that demand is the central reason for a change in prices.
CURRENCY VALUES Western economies such as the UK and US have experienced similar levels of inflation in the last few decades, and in more recent years lower commodity and labour prices along with strong domestic currency values have kept inflation to record lows, which have been welcomed by Western households as their cost of living remains lower.
A number of Western economies are now growing steadily following the turbulence of the post-financial crisis years, and this is creating modest inflationary pressure. It could be that QE programmes – the electronic
creation of money by central banks – has helped, although this is open to debate. Some argue that QE may have stored up inflationary pressures for the future that are yet to be felt.
EXCEED INFLATION The aim of investors is to grow their money at a rate that will meet their goals and comfortably exceed inflation. Although more volatile, stock market investments have historically performed well, benefiting from the earnings of companies usually rising along with inflation and when dividends are reinvested. It is these dividends that help in the battle to beat inflation, particularly when returns compound.
When interest rates lag behind inflation, savers can struggle to maintain the real value of their money. Naturally, investors have to be aware that volatility is par for the course, but, even after downturns such as the dotcom crash and financial crisis, equity returns still comfortably outperformed cash savings.
ASSET MIXThe role of bonds is also worth considering. Investors often hold a mix of assets to diversify on the hope that when one asset lags or falls, another picks up the slack. Bonds are IOUs issued by companies and governments: you lend them money for a fixed period and they pay you regular ‘coupon’ payments.
High inflation is bad for bonds. As prices rise, the spending power of the bond owner’s income reduces. This also affects their value. To make matters worse, higher inflation is normally accompanied with higher central bank rates, which leads to increased rates on newly issued bonds. Yesterday’s promise of 3% on a bond looks unattractive when new bonds are offering 5%. Again, this affects bond values.
COUPON PAYMENTSSome governments, and some companies, offer inflation-linked bonds. The coupon payments are linked to a particular inflation rate and so may rise. The pay-off is that the payments tend to be lower than would be available on traditional bonds. Examples of this include ‘TIPS’ in the US (Treasury Inflation Protected Securities) or index-linked gilts in the UK, often called ‘linkers’.
Some investors believe gold offers protection from inflation. This is partly because gold is regarded a store of value. Its supply is limited, unlike cash which can be created by central banks; the creation of cash can lead to the creation of inflation. t
INFORMATION IS BASED ON OUR CURRENT UNDERSTANDING OF TAXATION LEGISLATION
AND REGULATIONS. ANY LEVELS AND BASES OF, AND RELIEFS FROM, TAXATION ARE
SUBJECT TO CHANGE.
THE VALUE OF INVESTMENTS AND INCOME FROM THEM MAY GO DOWN. YOU MAY NOT
GET BACK THE ORIGINAL AMOUNT INVESTED.
PAST PERFORMANCE IS NOT A RELIABLE INDICATOR OF FUTURE PERFORMANCE.
OPPORTUNITIES OPEN TO INVESTORS Should inflation continue to rise, there could be a number of opportunities open to investors. Asset allocation will, as always, play a large part in generating returns. If you would like further information, please contact us.
INVESTMENT
21
Strategies to meet some of the most pressing global challenges ahead
SUSTAINABLEINVESTING
SUSTAINABLE INVESTING HAS GATHERED MOMENTUM ACROSS THE WORLD IN THE PAST DECADE AS INVESTORS
LOOK FOR FINANCIAL RETURNS WHILE HELPING TO ACHIEVE A POSITIVE IMPACT ON THE WORLD AROUND THEM.
INVESTMENT
22

Long viewed as a niche asset class catering to wealthy individuals and institutions that wanted to avoid controversial
industries, the phrase ‘sin stocks’ emerged to describe firms linked to industries perceived by some to be unethical, such as tobacco, alcohol or gambling. Such funds will exclude these stocks or screen them out, but each investor has views on what is and isn’t ethical.
CLOSE EVALUATIONRather than merely screening out certain stocks, sustainable investing is about closely evaluating a range of environmental, social and governance issues, known as ‘ESG’. This could be analysing a company’s track record on pollution from its factories, or how socially responsible it is in the communities it operates.
On corporate governance issues, it is a matter of judging how well the interests of shareholders, customers and staff are managed. Well-managed companies that care about the sustainability of the world in which they operate should have a better long-term future. Sustainable investment is really about integrating ESG considerations into the investment decision-making process, with a view to enhancing returns.
ENHANCED PERFORMANCEStudies by Friede, Busch & Bassen (2015) and Morgan Stanley, to name but two, found that companies focused on ESG had, on average, enhanced financial performance.
A study by Empirical Research, which has been evaluating and monitoring 60 ESG factors since November 2014 for US stocks, found that those companies with better ESG scores outperformed those with lower.
BETTER UNDERSTANDINGBy examining ESG issues, investors gain a better understanding of not just what
companies do but how they do it. ESG analysis puts companies into a wider global context and helps to identify which ones have the most resilient models.
Investors can choose investments based on moral beliefs and personal values, but that would be ethical investing rather than sustainable investing.
ENVIRONMENTAL ISSUESIt would be easy to assume that the ‘E’ of ESG dominates the other two. Many of the thematic investment funds in the space focus on environmental issues, from water shortage to new environmental technologies. And environmental issues, especially in the wake of the COP 21 Climate Change talks in Paris in 2015, are high up on investors’ minds. However, social and governance issues are of increasing importance.
Rising inequality and strapped governments has led to the introduction of Living Wages in a number of regions, putting pressure on costs. Changing consumer tastes and new regulation has seen the introduction of sugar taxes and ongoing declines in sugary drink consumptions. CEO pay and boards are rarely out of the headlines.
HOLISTIC LOOKSuccessful ESG investment processes take a holistic look at the changing world companies have to navigate and assess the performance of their investment across a number of factors. They engage where performance is lacking, pushing companies to improve their performance in ESG factors across the board and accepting the need for continual improvement in these areas.
The bulk of ESG data that we have is disclosed by large companies operating in developed markets. This does not mean that ESG considerations are not pressing for those in emerging markets.
LOWER VOLATILITYA 2013 report by UBS, analysing the World Economic Forum (WEF) Corporate Governance Index and emerging market equities valuations, concluded that companies that score well on governance are valued more highly and have lower volatility. Evaluating how companies manage stakeholders and environmental and social change is relevant whatever the market. With emerging markets, it may just take more investigation.
We tend to think mostly about equities, but it doesn’t end there. With bonds, for instance, ESG analysis helps identify risks to a borrower’s ability and willingness to repay debts. A well-managed company should be less likely to stumble into value-destroying disasters and be better positioned to repay investors who lend them money. t
INFORMATION IS BASED ON OUR CURRENT UNDERSTANDING OF TAXATION LEGISLATION AND REGULATIONS. ANY LEVELS AND BASES OF, AND RELIEFS FROM, TAXATION ARE SUBJECT TO CHANGE.
THE VALUE OF INVESTMENTS AND INCOME FROM THEM MAY GO DOWN. YOU MAY NOT GET BACK THE ORIGINAL AMOUNT INVESTED.
PAST PERFORMANCE IS NOT A RELIABLE INDICATOR OF FUTURE PERFORMANCE.
DO YOU HAVE AN APPETITE FOR SUSTAINABLE INVESTING?The gap between the values of companies on the right or wrong sides of those trends may grow ever wider as a result. By investing in sustainable businesses, investors may increase their chances of success. To find out more, please contact us.
INVESTMENT
23
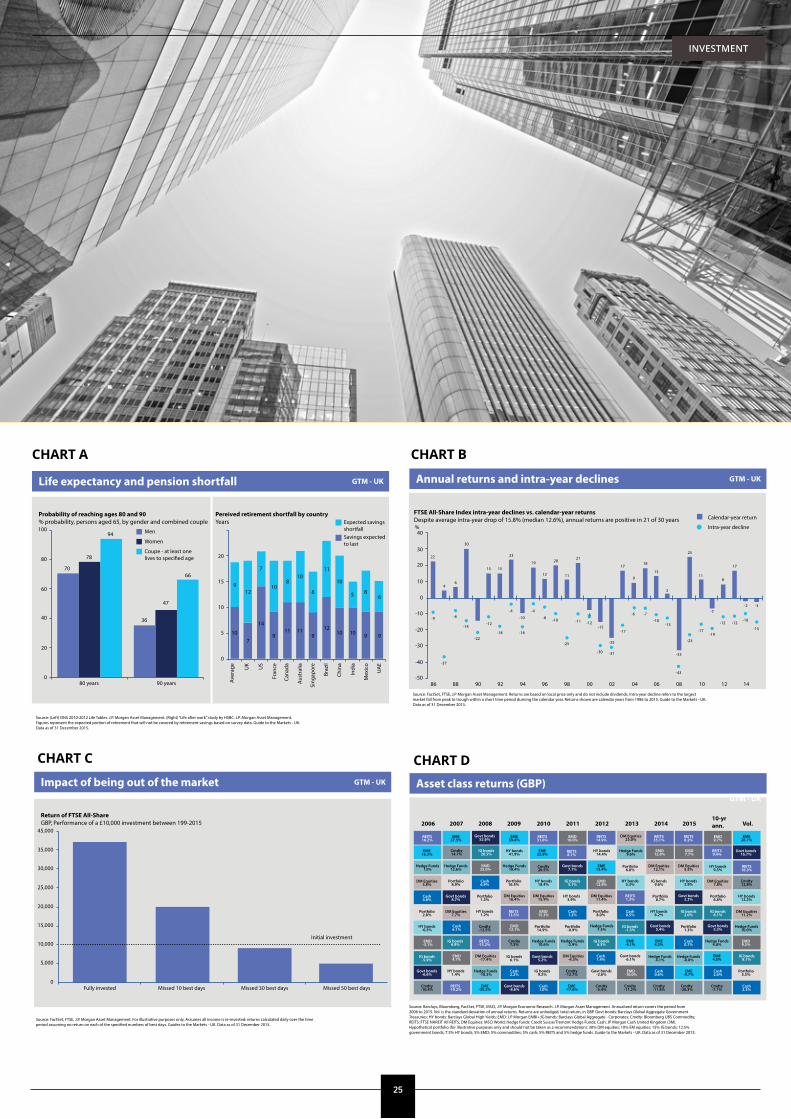
INVESTING FOR THE FUTUREThanks to advances in medicine and healthier lifestyles, people are living longer lives. The chart A shows the probability of reaching ages 80 or 90 for someone who is 65 today. A 65-year-old couple might be surprised to learn that there is a 66% probability that at least one of them will live another 25 years, reaching age 90.
Studies reveal that individuals do not feel financially prepared for retirement. It’s essential to develop a financial plan for the future, investing early and often and in a disciplined way.
CASH IS RARELY KINGSome investors may believe that cash is a safe haven in volatile times, or even as a source of income. But the ongoing era of ultra-low interest rates has depressed the return available on cash to near-zero – leaving cash savings vulnerable to erosion by inflation over time. With interest rates expected to remain low, investors should be sure an allocation to cash does not undermine their long-term investment objectives.
Cash left on the sidelines earns very little over the long run. Investors who deposited their cash in the bank have missed out on the long-term performance of equities and fixed income.
COMPOUNDING WORKS MIRACLESCompound interest even if missed out on a few years of saving and growth can make an enormous difference to eventual returns. Starting at age 25 and investing £5,000 per year in an investment that grows at 6% a year would leave you with over £400,000 more by the age of 65 than if you started at 35, even though overall you would only have invested an extra £50,000.
You can make even better use of compounding if you reinvest the income from your investments to grow the starting value
even more each year. The difference between reinvesting the income from your investments and not over the long term can be enormous.
VOLATILITY IS NORMALThe ups and downs of markets are something investors come to expect. The blue dots on chart B represent the maximum intra-year equity decline in every calendar year, or the difference between the highest and lowest point reached by the market in those 12 months. It is hard to predict these pullbacks, but double-digit pullbacks in markets are a fact of life most years. Investors should expect them.
It’s important to have a plan for when the going gets tough instead of reacting emotionally. The grey bars represent the full-year market index returns from 1 January to 31 December. They show that, despite the pullbacks every year, the equity market has gone on to deliver positive returns in most calendar years.
The message is to not panic: more often than not, a stock market pullback is an opportunity, not a reason to sell.
STAYING INVESTED MATTERSMarket timing can be a dangerous habit. Pullbacks are hard to time, and strong returns often follow the worst returns. But some investors may think they can outsmart the market – or they let emotions like fear and greed push them into investment decisions they later regret.
Chart C is a sobering reminder of the potential costs of trying to time the market. Even missing a handful of days in the market can have a devastating effect on an investor’s total returns.
While markets can always have a bad day, week, month or even a bad year, history suggests investors are much less likely to suffer losses over longer periods, so it’s important to keep a long-term perspective.
DIVERSIFICATION WORKSThe last ten years have been a volatile and tumultuous ride for investors, with natural disasters, geopolitical conflicts and a major financial crisis.
Yet despite these difficulties, the worst-performing asset classes of those shown in chart D were cash and commodities. Meanwhile, a well-diversified portfolio including stocks, bonds and some other asset classes returned 6.8% per year over this time period. The diversified portfolio also provided a much smoother ride for investors than investing in just equities. t
Source data:JPMorgan Chase & Co. 2016.
INFORMATION IS BASED ON OUR CURRENT UNDERSTANDING OF TAXATION LEGISLATION AND REGULATIONS. ANY LEVELS AND BASES OF, AND RELIEFS FROM, TAXATION ARE SUBJECT TO CHANGE.
THE VALUE OF INVESTMENTS AND INCOME FROM THEM MAY GO DOWN. YOU MAY NOT GET BACK THE ORIGINAL AMOUNT INVESTED.
PAST PERFORMANCE IS NOT A RELIABLE INDICATOR OF FUTURE PERFORMANCE.
Getting the right balance between shares, bonds and other investments
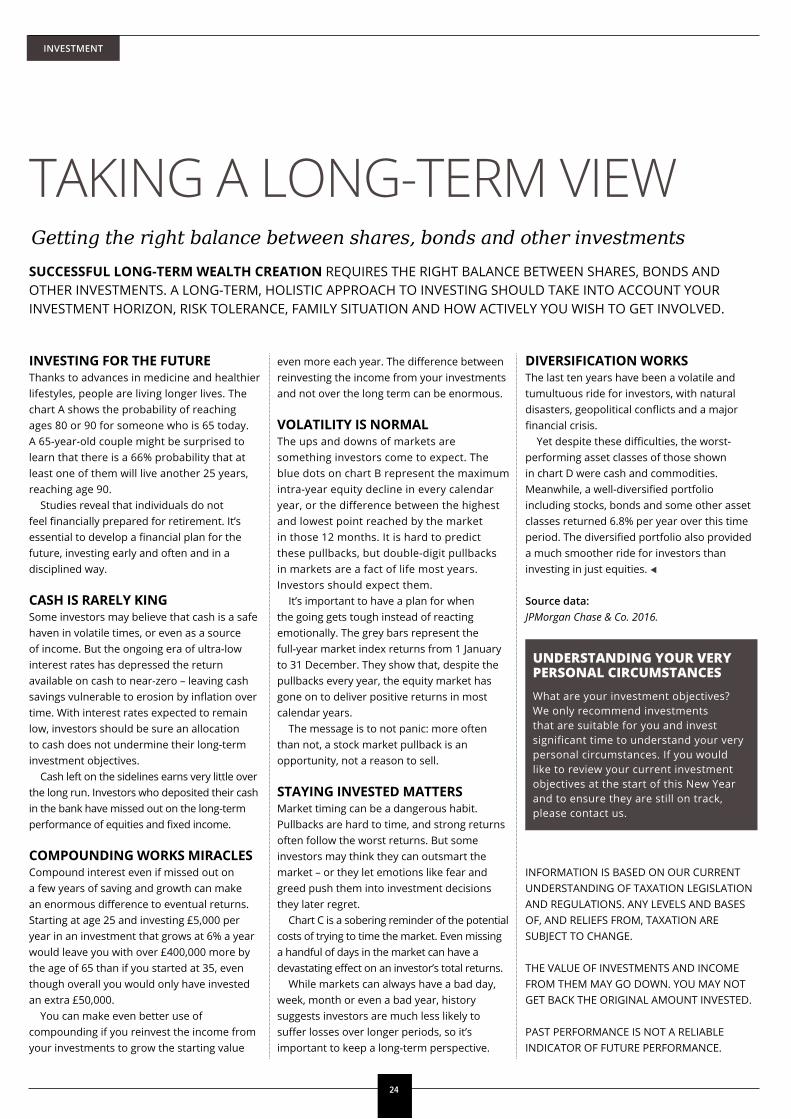
TAKING A LONG-TERM VIEWSUCCESSFUL LONG-TERM WEALTH CREATION REQUIRES THE RIGHT BALANCE BETWEEN SHARES, BONDS AND OTHER INVESTMENTS. A LONG-TERM, HOLISTIC APPROACH TO INVESTING SHOULD TAKE INTO ACCOUNT YOUR INVESTMENT HORIZON, RISK TOLERANCE, FAMILY SITUATION AND HOW ACTIVELY YOU WISH TO GET INVOLVED.
UNDERSTANDING YOUR VERY PERSONAL CIRCUMSTANCES What are your investment objectives? We only recommend investments that are suitable for you and invest significant time to understand your very personal circumstances. If you would like to review your current investment objectives at the start of this New Year and to ensure they are still on track, please contact us.
INVESTMENT
24
INVESTMENT
25
2,000
Source: (Left) Bloomberg. ONS, J.P. Morgan Asset Management. (Right) Dimson. Marsh and Staunton ABM AMRO/LBS Global Investment Returns Yearbook 2008.FactSet, J.P. Morgan Asset Management J.P. Morgan estimnates from 2008. Equities: FTSE 100; Bond: JPMorgan GBP Governement Bond Index; Cash: three-monthGBP Libor (prior to 2008 cash is short dated Treasury bills). Guide to the Markets - UK. Data as of 31 December 2015.
4,000
6,000
Cash investments GTM - UK
Total return of £1 in real termsGBP, log scale for total returns
Income In�ation (y/y)
2007: £6,0006 1,000
100
1899 1919 1939 1959 1979 1999
10 Bonds: £6
Equities: £340
Equities
Annualised real returns
1899-2015 2000-2015
5.1% 1.0%
1.5% 3.1%
0.8% -0.3%
Bonds
Cash
Cash: £3
1
0
4
2015:£575
2
0001 02 03 04 05 06 07 08 09 10 11 12 13 14 15
The power of compounding GTM - UK
900,000
800,000
700,000
600,000
Age
500,000
400,000
300,000
200,000
100,000
900,000
800,000 - With dividends reinvested£75,400£825,238
£424,008
- Starting at age 35
- Starting at age 25
£24,857
- Without dividends reinvested700,000
600,000
500,000
400,000
300,000
200,000
100,000
085 87 89 91 93 93 97 99 01 03 05 07 09 11 13 15
025 30 35 40 45 50 55 60 65
Income generated by £100,000 in a three-month bank depositGBP (LHS); % Change year on year (RHS)
£5,000 invested annually with 6% growth per yearGBP
A one-o� £5,000 investment with/without income reinvestedGBP
Source: (Left) J.P. Morgan Asset Management. For illustrative purposes only, assumes all income re-invested, actual investments may incur higher or lower growthrates and charges. (Right) Bloomberg, FTSE, J.P. Morgan Asset Management. Based on FTSE All-Share index and assumes no charges.Guide to the Markets - UK. Data as of 31 December 2015.
Life expectancy and pension shortfall GTM - UK
Annual returns and intra-year declines GTM - UK Asset class returns (GBP)GTM - UK
Impact of being out of the market GTM - UK
Probability of reaching ages 80 and 90% probability, persons aged 65, by gender and combined couple
FTSE All-Share Index intra-year declines vs. calendar-year returnsDespite average intra-year drop of 15.8% (median 12.6%), annual returns are positive in 21 of 30 years 2006 2007 2008 2009 2010 2011 2012 2013 2014 2015
10-yrann. Vol.
Return of FTSE All-ShareGBP, Performance of a £10,000 investment between 199-2015
Pereived retirement shortfall by countryYears
94
78
Men
Expected savingsshortfallSavings expectedto last
Aver
age
UK US
Fran
ce
Cana
da
Aust
ralia
Sing
apor
e
Braz
il
Chin
a
Indi
a
Mex
ico
UA
E
Women
Coupe - at least onelives to speci�ed age
70
100
0
5,000
Fully invested Missed 10 best days Missed 30 best days Missed 50 best days
Initial investment10,000
15,000
20,000
25,000
30,000
35,000
45,000
80
60
40
20
40
22
30
15 15
232019
17
9
2
18
13
8
-7
-33
-25
-15
-10 -10 -11 -12
-30 -31
-17
-6 -7
-10-13
-43
-23
-17-19
-12 -12-10
-15
REITS18.2%
REITS31.6%
EMD10.0%
EMD9.7%
EMD12.8%
EMD7.7%
EMD12.9%
EMD25.0%
EMD15.3%
EMD12.1%
EMD4.7%
EMD-10.0%
EMD9.3%
EMD-3.1%
REITS8.1%
REITS14.9%
DM Equities25.0%
DM Equities12.1%
DM Equities11.4%
DM Equities15.9%
DM Equities16.4%
DM Equities5.8%
DM Equities7.7%
DM Equities-17.4%
DM Equities-4.3%
DM Equities5.5%
DM Equities7.8%
DM Equities11.2%
REITS13.5%
REITS-13.2%
REITS-19.2%
REITS1.3%
REITS35.1%
REITS8.2%
REITS9.4%
REITS16.3%
EME37.5%
Portfolio8.9%
Cash6.9%
Cash4.8%
Cash6.1%
Cash1.2%
Cash0.5%
Cash0.7%
Cash1.4%
Cash1.0%
Cash2.2%
Cash0.6%
Cash2.6%
Cash2.3%
Portfolio1.3%
Portfolio2.8%
Portfolio6.0%
Portfolio8.7%
Portfolio1.3%
Portfolio5.5%
Portfolio8.0%
Portfolio-0.9%
Portfolio14.9%
Portfolio6.8%
Portfolio16.5%
Cmdty14.7%
IG bonds26.5%
IG bonds5.1%
IG bonds9.6%
IG bonds2.0%
IG bonds6.1%
IG bonds8.1%
IG bonds-1.5%
IG bonds6.3%
IG bonds4.9%
IG bonds-5.9%
IG bonds6.1%
IG bonds9.2%
Cmdty20.5%
Cmdty12.8%
Cmdty-7.1%
Cmdty-20.3%
Cmdty-11.8%
Cmdty-11.2%
Cmdty-5.4%
Cmdty-10.4%
Cmdty-12.7%
Cmdty7.3%
Cmdty-12.5%
EME16.3%
Hedge Funds13%
Hedge Funds12.6%
Hedge Funds18.4%
Hedge Funds9.6%
Hedge Funds10.0%
Hedge Funds4.8%
Hedge Funds4.1%
Hedge Funds7.5%
Hedge Funds-2.9%
Hedge Funds10.6%
Hedge Funds-18.3%
Hedge Funds-0.8%
EME13.4%
EME-4.1%
EME-17.6%
EME-35.2%
EME4.3%
EME4.5%
EME-9.7%
EME22.9%
Govt bonds52.6%
Govt bonds7.1%
Govt bonds16.7%
Govt bonds2.3%
Govt bonds5.3%
Govt bonds5.4%
Govt bonds-6.1%
Govt bonds-2.6%
Govt bonds5.2%
Govt bonds-8.6%
Govt bonds-6.6%
Govt bonds8.7%
EME59.4%
HY bonds41.9%
HY bonds14.4%
HY bonds18.4%
HY bonds5.3%
HY bonds2.9%
HY bonds9.3%
HY bonds12.2%
HY bonds6.2%
HY bonds3.9%
HY bonds1.2%
HY bonds-0.3%
HY bonds1.4%
EME26.1%
-2 -3
17
25
1112 11
21
4
-9
-37
-8 -8
-14
-22-25
-12
-4 -4
-18 -18
6
%
30
20
10
86 88 90 92 94 96 98 00 02 04 06 08 10
Intra-year decline
Calendar-year return
12 14
-10
-20
-30
-40
-50
0
80 years 90 years0
36
47
66
20
15
10
5
0
9
9 9 9 9
7
7
8
8 865
10
10 10 10
1010
11
111114
12
12
Source: (Left) ONS 2010-2012 Life Tables. J.P. Morgan Asset Management. (Right) “Life after work” study by HSBC. J.P. Morgan Asset Management.Figures represent the expected portion of retirement that will not be covered by retirement savings based on survey data. Guide to the Markets - UK.Data as of 31 December 2015.
Source: FactSet, FTSE, J.P Morgan Asset Management. Returns are based on local price only and do not include dividends. Intra-year decline refers to the largestmarket fall from peak to trough within a short time period durning the calendar year. Returns shown are calendar years from 1986 to 2015. Guide to the Markets - UK.Data as of 31 December 2015.
Source: Barclays, Bloomberg, FactSet, FTSE, MSCI, J.P. Morgan Economic Research. J.P. Morgan Asset Management. Annualised return covers the period from2006 to 2015. Vol. is the standard deviation of annual returns. Returns are unhedged, total return, in GBP. Govt bonds: Barclays Global Aggregate GovernmentTreasuries; HY bonds: Barclays Global High Yields; EMD: J.P Morgan EMBI+;IG bonds: Barclays Global Aggregate - Corporates; Cmdty: Bloomberg UBS Commodity;REITS: FTSE NAREIT All REITS; DM Equities: MSCI World; Hedge funds: Credit Suisse/Tremont Hedge Funds; Cash: JP Morgan Cash United Kingdom (3M).Hypothetical portfolio (for illustrative purposes only and should not be taken as a recommendation): 30% DM equities; 10% EM equities; 15% IG bonds; 12.5%government bonds; 7.5% HY bonds; 5% EMD; 5% commodities; 5% cash; 5% REITS and 5% hedge funds. Guide to the Markets - UK. Data as of 31 December 2015.
Source: FactSet, FTSE, J.P. Morgan Asset Management. For illustrative purposes only. Assumes all income is re-invested: returns calculated daily over the timeperiod assuming no return on each of the speci�ed numbers of best days. Guides to the Markets - UK. Data as of 31 December 2015.
-8
CHART A
CHART C
CHART B
CHART D

FINANCIAL ADVICE IS OUR BUSINESS.We’re passionate about making sure your finances are in good shape.Our range of financial planning services is extensive, covering areas from pensions to inheritance matters and tax-efficient investments.
CONTACT US TO DISCUSS YOUR REQUIREMENTS. OUR DETAILS APPEAR ON THE FRONT COVER.
Published by Goldmine Media LimitedBasepoint Innovation Centre, 110 Butterfield, Great Marlings, Luton, Bedfordshire LU2 8DLArticles are copyright protected by Goldmine Media Limited 2017. Unauthorised duplication or distribution is strictly forbidden.