esci 452: final project(s)
TRANSCRIPT

Canyon Lake Gorge
MAPPING HIGH-FREQUENCY SEQUENCES, FOSSILS, FAULTS

Backstory July 2002 devastated Canyon Lake
A gorge as deep as 9-10m was excavated from what used to be ground level in <1 week
Exposed a large extent of the Glen Rose formation, in addition to Hidden Valley Fault
Tons of fossils, in addition to a dinosaur footprint

Lithology

Initial Idea Note locations, and map the lithologies of as many of the rock layers as I could when we went to Canyon Lake Gorge for ESCI 506 field trip
Point feature class for all fossils seen
Line feature class for the Hidden Valley fault

Problems with initial idea Some of the rock layers are quite thin, and would not be worth turning into a feature
Other lithologies are not expressed on the gorge’s floor (would not be viewable from satellite)
Phone (which I was using as a GPS) kept losing connectivity in the gorge, so had to guesstimate extent of some of the strata.
Solution: Map only the high-frequency sequences (six) which are detailed in the paper; demarcate when I can find a maximum flooding surface.
Ended up with a single shapefile for the HFS; a point shapefile for fossils / other interesting biomarkers; a polyline for the Hidden Valley fault traces; polygons for lakes in gorge.

Lithology

Worse problem: Apparently everything worth doing in Canyon Lake Gorge has already been done before.
Tons of literature; and when I looked at Southwest Research Institute’s papers about geologic extent for the strata Bill Ward mentioned, some of my guesstimations didn’t align with theirs.
Assessments have already been made of rock layer where fossils are most abundant (the Salenia interval), least abundant (the Corbula interval), how long the Gorge is (3,800ft), and what volume of material is estimated to have been washed away during the big flood.
…So that sucked.

Sources

PIVOT

There’s no place like home.CRIME RATES AND LOCATIONS IN BEAT 10H40

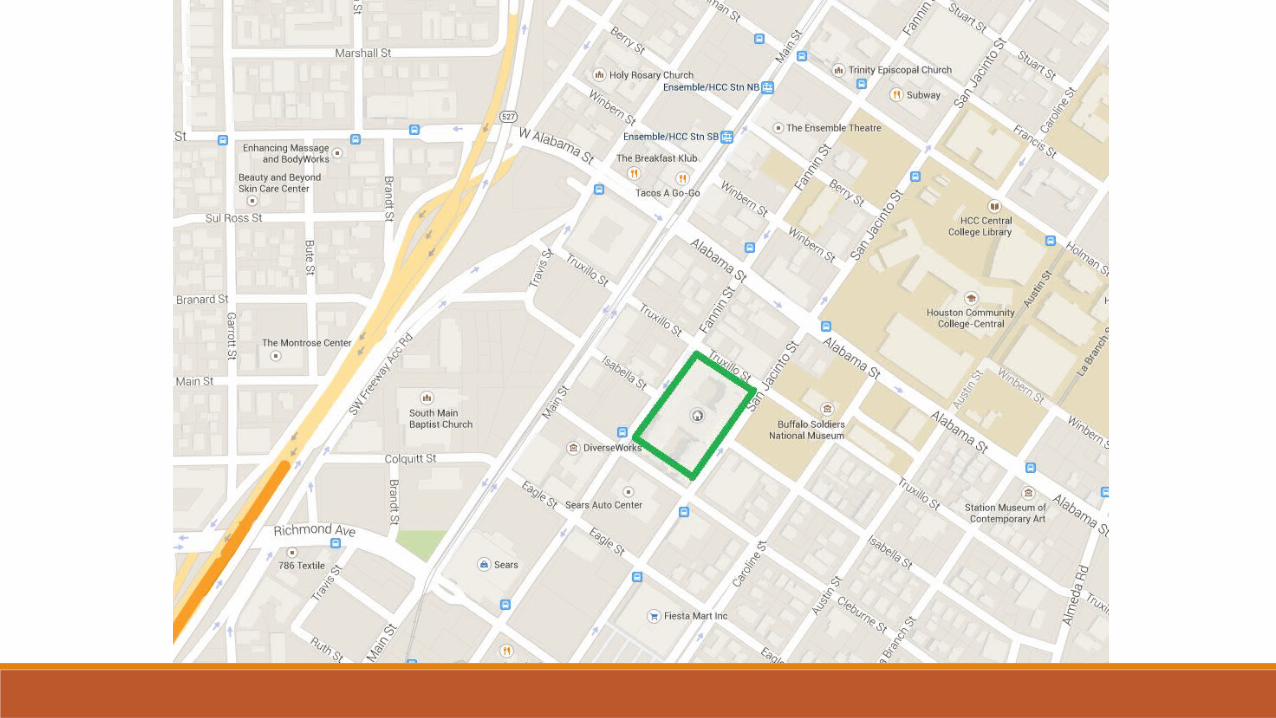
Ventana at Midtown Built in 2002
282 Units
Price Range: ◦ $980 (600 sqft) - $4450 (2630 sqft)◦ Which is low for midtown, but more than the
typical Houston housing costs
Most of the residents rent single or double bedroom apartments or townhouses
Made out of concrete
Security: RFID key fob; key card; apartment key; clicker to enter into the parking garage; tag needed in order to park in the garage; cameras everywhere; gate code


“If you park your car outside, make sure only to park it on Fannin or Truxillo.”
-- Security Guard

???HOW CAN ONE SIDE OF A BUILDING BE MORE SECURE THAN ANOTHER SIDE?

Obtaining the Data Houston Police Department’s Neighborhood (Police Beat) Crime Statistics
◦ http://www.houstontx.gov/police/cs/beatpages/beat_stats.htmAlso used the City of Houston’s “ROADS” shapefile, obtainable via the Open Data Portal◦ http://data.ohouston.org/dataset/city-roads

Data for 10H40 7,445 entries since June 2009
Averages out to ~108 crimes per month (3-4 per day)
Zip codes included:◦ 77002◦ 77003◦ 77004◦ 77006

Attribute data per crime Date
Hour (0 – midnight, 23 – 11:00pm)
Offense Type ◦ Murder◦ Rape◦ Robbery◦ Aggravated Assault◦ Burglary ◦ Theft◦ Auto Theft
Beat
Premise Code
Block Range
Street Name
# of Offenses
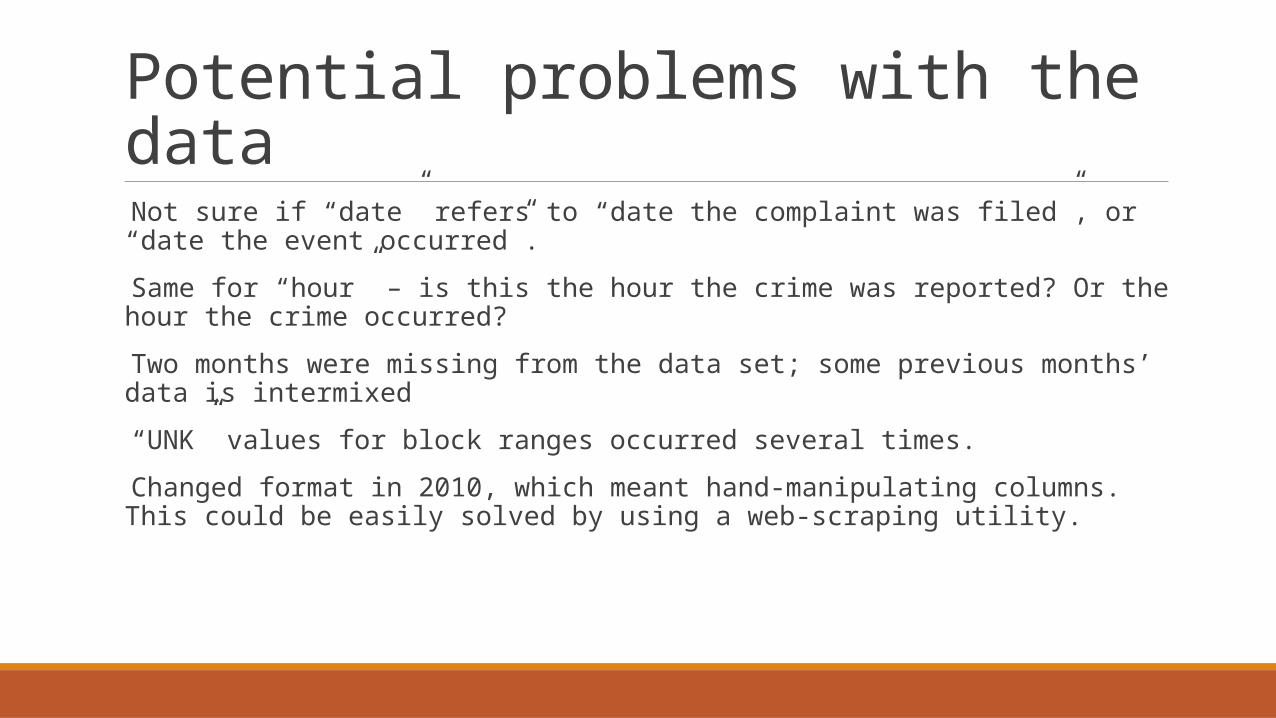
Potential problems with the data Not sure if “date” refers to “date the complaint was filed”, or “date the event occurred”.
Same for “hour” – is this the hour the crime was reported? Or the hour the crime occurred?
Two months were missing from the data set; some previous months’ data is intermixed
“UNK” values for block ranges occurred several times.
Changed format in 2010, which meant hand-manipulating columns. This could be easily solved by using a web-scraping utility.

What are the most common crimes committed?
10H40 seems to get everything…◦ Aggravated Assault – 511◦ Auto Theft – 427◦ Burglary – 554◦ Murder – 4◦ Rape – 45◦ Robbery – 632◦ Theft – 5,272
What the heck. Murder??

When are those crimes most likely to happen?
Using “Statistics”, I was able to see that most crimes occur around midnight and between 4:00 – 6:00pm.
The least number of crimes occur between 3:00am and 6:00am.
Not quite sure why there would be such a spike between 4:00 – 6:00pm – maybe because so many people are headed home from work and away from school?

Where are crimes most likely to happen?
Merged the “BLOCK RANGE” and “STREET NAME” attributes in order to make a single attribute called “Block_Street”
Did a “Summarize” on Block_Street to get the count of crimes for each
Top instances (>100 crimes committed):◦ 4200 – 4299 San Jacinto: 864◦ 4200 – 4299 Main St: 566◦ 2100 – 2199 Main St: 245◦ 2400 – 2499 San Jacinto: 224◦ 1000 – 1099 Elgin St: 147◦ 2900 – 2999 Travis St: 114◦ 4600 – 4699 Main St: 101

So how close is that to me? Three of the most high-crime areas are located fairly close to my apartment complex:
◦ 4200 – 4299 San Jacinto St - 864◦ 4200 – 4299 Main St – 566 ◦ 4600 – 4699 Main St – 101
This makes up 20.6% of the crimes that occur in the 10H40 police beat – which is a ton, considering how many city blocks the area covers.

Police Beat 10H40 Most of the crime appears to be occurring along the MetroRail
Other areas close to the McGowen street station would also be terrible places to live.
The Greyhound Station appears to have a very high crime rate, as well.
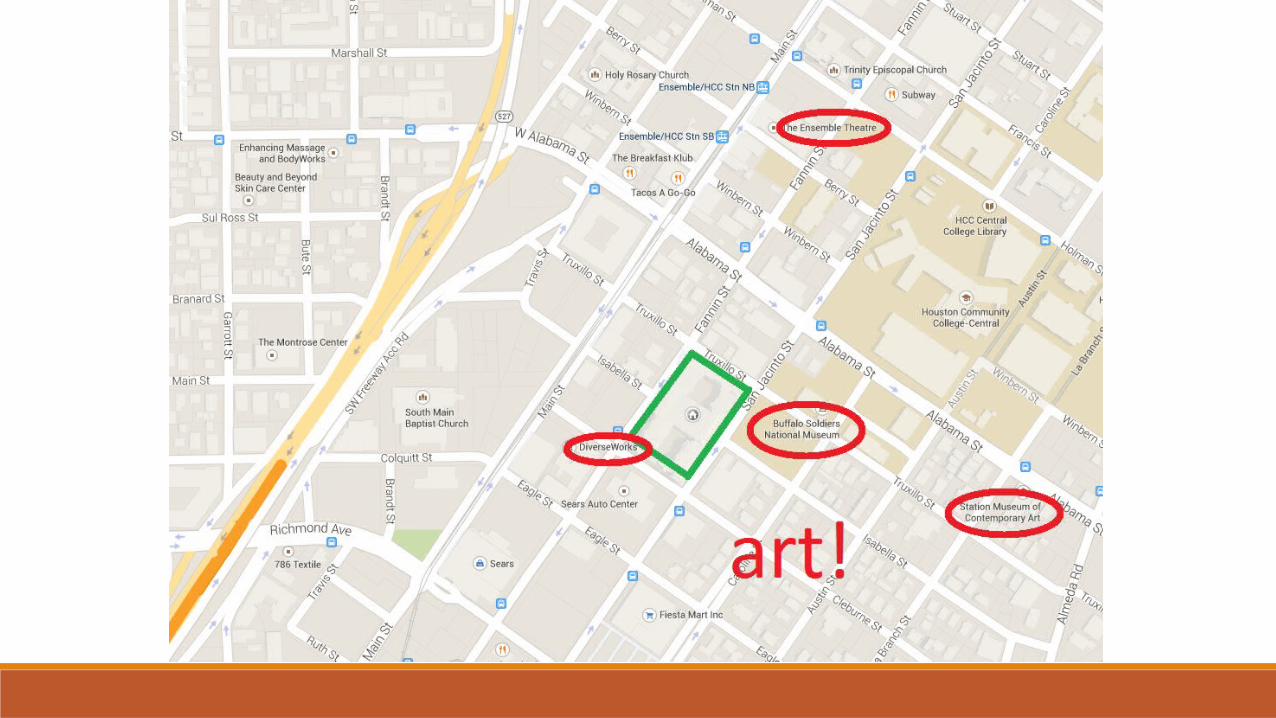
In terms of safety, of the three MetroRail stops in my vicinity, the HCC/Ensemble Theatre stop has a lower crime rate than the Wheeler Station stop or the McGowen Street station stop.
Which MetroRail stop is the safest?
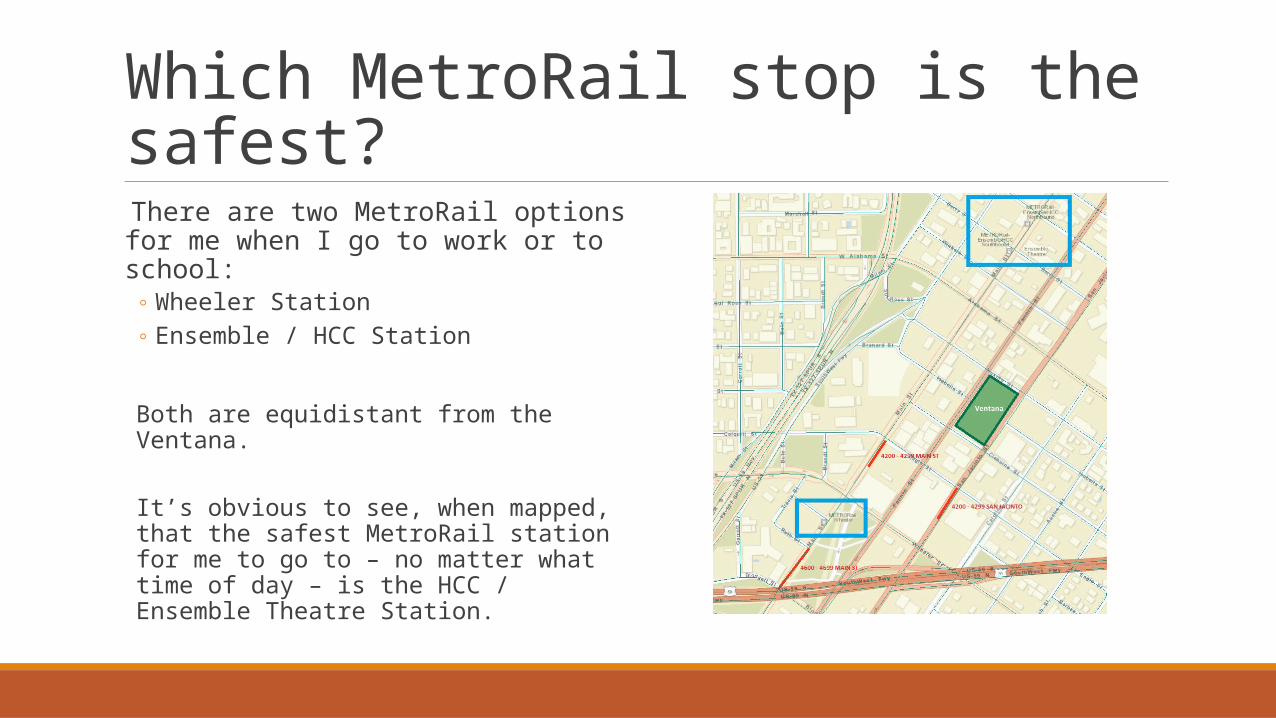
There are two MetroRail options for me when I go to work or to school:
◦ Wheeler Station◦ Ensemble / HCC Station
Both are equidistant from the Ventana.
It’s obvious to see, when mapped, that the safest MetroRail station for me to go to – no matter what time of day – is the HCC / Ensemble Theatre Station.

Which route is the safest to walk to work? When is the safest time?
Current route to work (as recommended by Google Maps transportation routing):
◦ 4000 Fannin to 3800 Fannin◦ 1100 Alabama to 1000 Alabama◦ 3700 Main St to 3500 Main St
Crimes along this route: 160 (2.15%)
Safest Route – 104 crimes (1.4%)◦ 4000 Fannin St to 3600 Fannin St◦ 1100 Berry St to HCC Station
Which route is the safest to walk to work? When is the safest time?
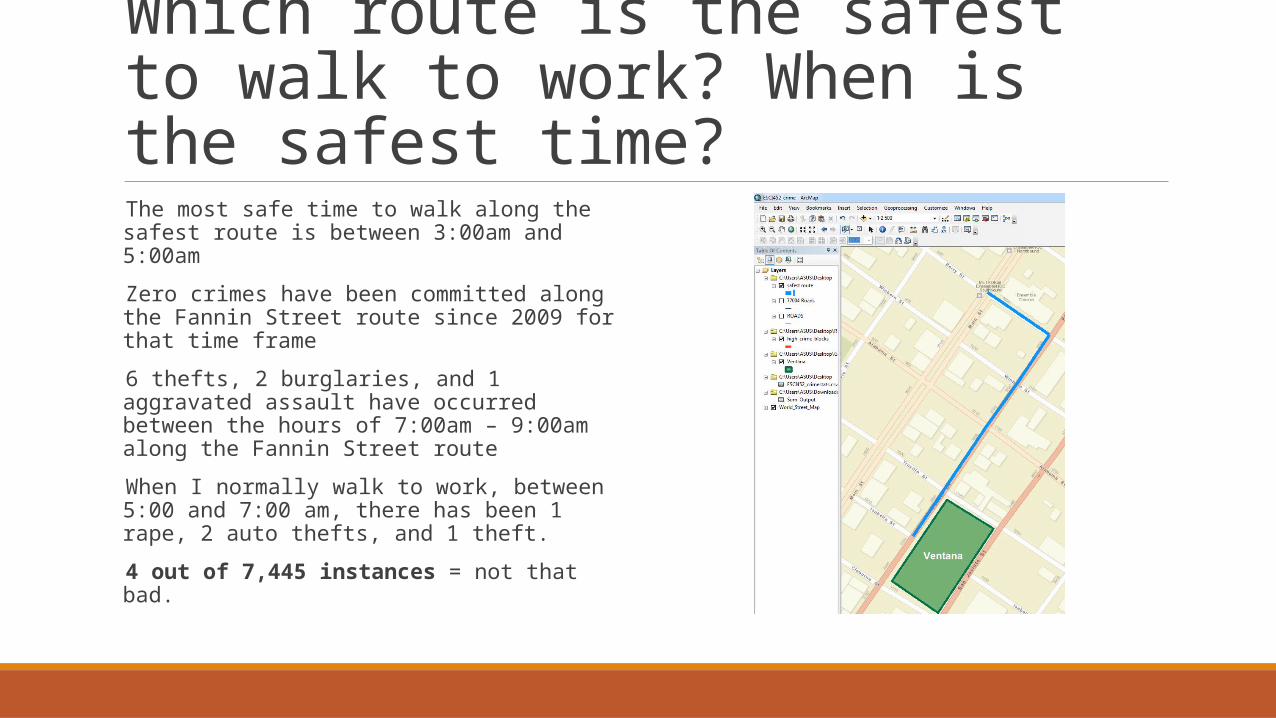
The most safe time to walk along the safest route is between 3:00am and 5:00am
Zero crimes have been committed along the Fannin Street route since 2009 for that time frame
6 thefts, 2 burglaries, and 1 aggravated assault have occurred between the hours of 7:00am – 9:00am along the Fannin Street route
When I normally walk to work, between 5:00 and 7:00 am, there has been 1 rape, 2 auto thefts, and 1 theft.
4 out of 7,445 instances = not that bad.

Does that apply for coming back from school and from work, as well?
The Fannin Street route is still the safest route, even when coming back home from school or from work.
Only 5 crimes have been committed from 8:00 – 10:00pm along that route in the last 6 years (thefts, auto thefts, and burglary).

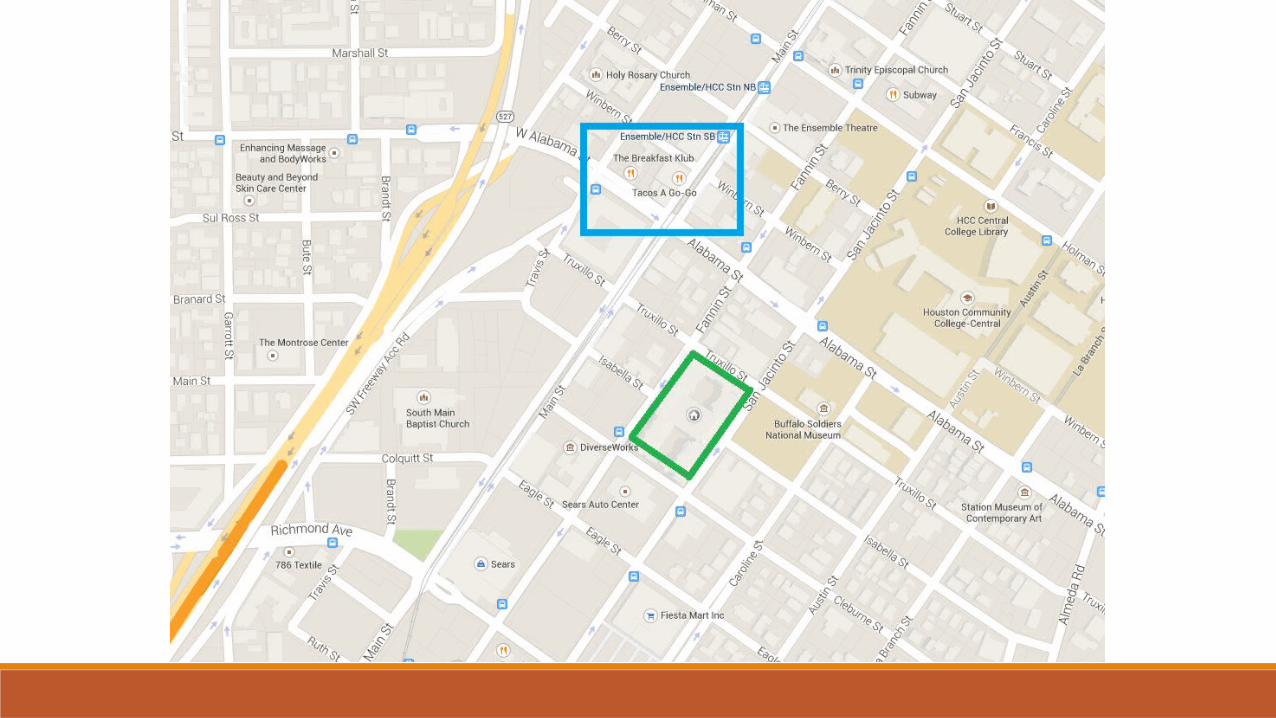
What time is most safe to buy groceries?
Never, really.

What time is most safe to buy groceries?
98.4% of the offenses occur when Fiesta is open.
The offenses are concentrated all along the perimeter of Fiesta’s parking lot – which makes me think that folks are likely watching how people pay for their groceries, then lifting wallets.

Which side of the Ventana is most dangerous? Least dangerous?
Four sides of the Ventana apartment complex:◦ 3900 – 4000 Fannin Street◦ 3900 – 4000 San Jacinto Street◦ 1000 – 1200 Truxillo Street◦ 1000 – 1200 Cleburne Street
The most dangerous side of the Ventana is on San Jacinto Street and Cleburne Street (like the guard said)
The least dangerous sides are on Fannin Street and Truxillo Street.
Next Steps Would love to have Google Maps incorporate this into their transit recommendations
◦ Pull the crime rates for given blocks from local police departments◦ Assess time of day that the person wants to travel◦ Route them around potentially dangerous areas
Would also like to have this done for the Rice University area, and the area around my current workplace (1500 Louisiana St).
This would also be incredibly valuable for bicyclists, and for folks who participate in Critical Mass each month. There was a problem recently with airsoft guns being shot at passing cyclists…
Which types of premises are the most susceptible to crime in this area?