e.o. ita - aquatic commonsaquaticcommons.org/794/1/no_8.cv.pdf · · 2010-12-09weight of fish...
TRANSCRIPT


ISSN O331-6734
KAINJI. LAKE RESEARCH INSTITUTETECHNICAL REPORT SERIES NO.8
BIOLOGICAL INDICES OF OVEFIISHING IN KAINJI
LAt<E AND THE MANAGEMENT PROPOSAL FOR THE
LAKE FISHERY
By
E.O. ITAKainji Lake Research Institute
Kainji. Lake Research InstituteNew Bussa, 982


Contents
Abstract .. .. .. .. ..1. Introduction .. .. .. ..2, Evidences of overfishing .. ..
2.1 Observed decline in the experimental catchper unit effort., commercial landings andthe relative constancy in the concentrationof fishing boats .. ..
2.2 Decline of catches in larger mesh nets andconsistently higher catches in small mesh nets
2.3 The effect of low productivity of thelittoral zones on recruitment ..
2.4 The effect of high concentration offishermen on catch per unit effort
2.5 The observed rise in the cost of catchiflga unit weight of fish associated withincrease in effort without relative increasein the catch .. .. ..
3. Conclusion .. .. .. ..
4. The management proposal .. ,.
4.1 Free registration of fishing boats andissue of free fishing licences
4.2 Expansion of the revolving loan scheme toother states bordering the lake
4.3 Establishment of supply and servicing. unitstogether with the processing units
4.4 Minimum mesh-size regulation ..
5. Request for technical assistance ..
6. Feasibility study .. .. .. ..
7. References .. .. .. .. ..
Tables .. .. .. .. .. ..
Figures .. .. .. .. .. ..
1
1
2
2
2
5
5
6
7
7
7
9
10
• . .. 11
12
12
13
15
21


Abstract
The paper presents evidences to show that Kainji Lake has beenoverfished, among these are:—
Ci) The general decline in catch per unit effort andthe observation that increase in fishing effortçloes not result in a proportional increase inthe catch.
(ii) The decline of catches in larger mesh nets andconsistently high catches in sifiall mesh nets.
(iii) Low productivity of the littoral zones.
(iv) High concentration of fishermen (density offishing effort) per unit length of shdre lineor surface area of the lake; and
(v) Rise in the cost of catching a unit weight offish associated with increase in effort withoutrelative increase in the catch.
The general objectives of fishery management are outlined withsuggested remedies appropriate for the Kainji situation. Finally, thepaper discusses the general and specific problems to be anticipated inthe course of effecting the management proposal.
INTRODUCTI ON
Fishery management has been defind as everything done to maintainor improve fisheries resources and their utilization (Calender 1969).This may include fisheries development; (e.g. exploratory fishing, gear,harbour and fleet development; processing; marketing and establishmentof aquatic reserves, parks etc.). For the purposes of this paper,however, the definition will be limited to that aspect of managementintended to maintain the resource at a sustainable yield basis since thisis the backbone to rational fishery development.
It has been observed that in an unmanaged fishery, the cost ofcatching a unit weight of fish will tend to rise until they are equal toor even higher than the value of the catch. While this may not be trueof the artisanal fishermen with unmechanized boats and with little or norecurrent cost, it is highly applicable to those with mechanized boats,particularly in areas with relatively high cost of fuel. Therefore, iffishery development is to be encouraged with high capital investment,the elementary problems-of management must be tackled in order tosafeguard the future of the investment and the fishery in general.

—2—
The fishery biologist is faced with the problem of undertakingrecommendations when in actual fact he is helpless with regards toeffecting his recommendations. The latter aspect is purely an admini—strative matter which could only be successfully tackle4 by admini-strators in conjuction with fishery extension services of therespective State departments and other agencies involved 'in fisherieswork. However, because fishery management: must be based on a soundunderstanding of the dynamics of the fish stocks and the effects on theabundance of the fishand on the total catch and pattern and intensityof fishing, management studies have been dominated by biologicalscientists.
The objective of this paper, therefore, is to'advance convincingscientific evidence to prove beyond reasonable doubts that Kainjilake has been overfished and suggest possible ways and means ofr'emedying the situation.
2, EVIDENCES. OF. OVERFISHING
2.1. Theobserved decline in the experimental catch per' unit effort,Commercial. landings and the relative constancy in the concentrationof fishing boats
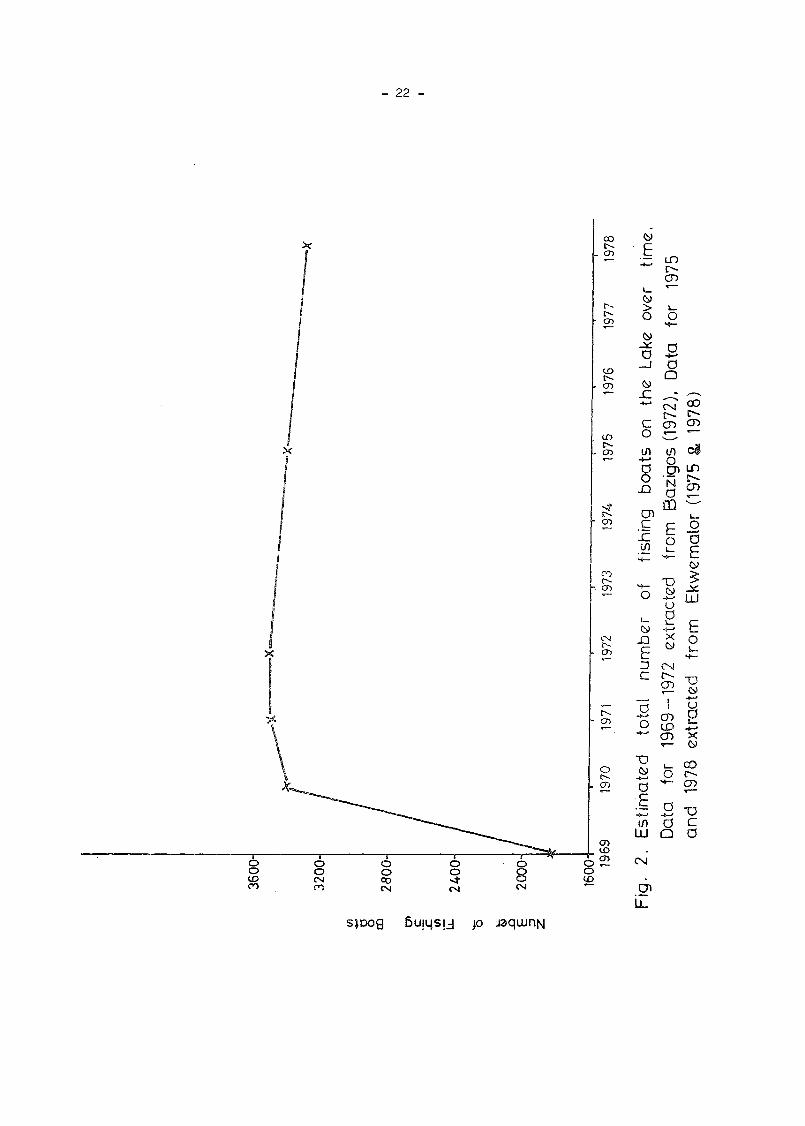
The trends in experimental catch per unit effort and commerciallandings with time are shown on Figure 1. The variations in theobserved pattern of change within the first couple of years could beattributed to the observed increase in the total number of fishingboats (Fig. 2) whereas the experimental catches merely representindices of population abundance.
Figure 2 shows that between 1970 and 1978 the concentration offishing boats remained fairly constant inspite of the fact that theCatch rate continued to fall (Fig. 1). Table 1 shows the extrapolateddata from Figures 1 and 2 summarizing the mean catch per boat per yearin metric tonnes from .1969 to 1978. The data shows a definite down-ward trend in the annual landings per fishing boat, The pattern ofchange for the mean catch per boat per year shows a similar trend withthe experimental ,catch per unit effort (Fig. 1).
2.2 Decline of catches in larger mesh nets and consistently higher catchesin small mesh nets
Figure 3 shows the relative frequency of. occurrence of fish invarious mesh sizes (5 — 18cm) with time. Between 1969 and 1971 itwas possible to catch big fishes with larger mesh sizes of gill-netse.g. (10 — 18cm) in fairly commercial quantities. There was drasticdrop in the catch of larger fish in 1972 caused apparently by thesharp decline in the population of Citharinus species which sustained

-3—
the catch in larger mesh nets up to 1971. Figure 4 shows the relativefrequency distribution of gill—net mesh sizes used by commercialfishermen in. 1970/71.and 1972. There was highconcentration of largermesh nets (10 — 23cm) on the lake between 1970 and 1971 (with a peakat 18cm) and by 1972 there was a sudden shift in emphasis from largeto small mesh nets with the highest peak on 5cm mesh nets. Theexplanation for this is illustrated on Figure 5 showing the relativeweight of fish landed by commercial fishermen on the lake in 1970/71and in 1972. In 1970/71 Citharinus made up about 90% by weight ofthe total landings by commercial fishermen and by 1972 the catch ofCit,harinus dropped to 34% by weight of the total landings.
The biological explanation for the sudden change or drop in thepopulation of Citharinus can be obtained from Figure 6 which showsthe trends in mean weight and log of population abundance for Citharinuscitharus (the most abundant species of Citharinus in the lake. The year—class that was spawned in 1968, soon after the filling of the lake,continued to grow and reached a peak in 1971 when the exploitationby commercial fishermen was also at its peak (Fig. 5), The year—classwhich dominated the catch between 1969 and 1971 succeeded in spawningin 1971 thUs giving rise to a new year—class which depressed the meanweight of the fish drastically in 1972. From 1972 onwards, the fishnever succeeded in recovering back to its 1971 level of mean weight.The nearest peak to that was observed in 1977 with the 1975—77 year--class.
The following questions could well be asked:- Is Citharinus theonly big fish in Kainji lake that could be caught in larger gill—netmesh sizes? If not, why then are the others not creating any impactin the absence of Citharinus?
Table 2 shows a list of the major commercial species in Kainjilake and their relevant statistics. The observed maximum weight inkilogrames attained by each fish is shown in the first column followedby the density and standing crop per hectare estimated by rotenonesampling in shallow waters between 1975 and .1976. The last column ofthis table reveals that about 79% of the major commercial species thatgrow to reasonable sizes are susceptible to capture in 5cm (2 inch)mesh before their first reproductive cycle. Also about fiveout of the seven species capable of reproduction before being capturedin 5cm mesh nets only attain a maximum weight of less than 2kg.
Figure 7 reveals that although a greater percentage of CitharinuscaptuPed in experimental gill-nets came from larger mesh sizes e.g.(10.and 12.5cm meshes) the mean lengths of fish caught even with thesemeshes were still those of immature fish specimens. As indicated inTable 2 column 4 the mean standard length of Citharinus at firstmaturity is 345mm. Similarly the mean weightt whithey are caught

—4—
in 10 and 12.5cm nets (approx. 500gm) is far below: the observedmaximum weight of 3.0kg. Their occurrence, therefore, in largermesh sizes of gill—nets even prior to maturity can be attributed totheir laterally compressed width and high dorso—ventral length whichrender them susceptible to capture in relatively large mesh sizes ofgill—nets even at an early age (Table 3). This same adaptive featuremay account for the extreme success of the juvenile of this fish sinceany predator on them must possess an extremely wide mouth in order tobe able to swallow them.
Table 3 also reveals that majority of the other larger species inthe lake e.g. (Bagrus, Lates, Tilapia and Synodontis) possess negative.adaptive features such as hooks, knobs and thorns on bodies and finrays which render them easily susceptible to capture in small mesh netsbecause of difficulty in escaping through meshes. Other factors such asinadequate adaptation of the larger species to the lacustrine environ-ment and low fecundity rates may also account for their observed.scarcity (Table A). Whereas a single Citharinus can lay over 500,000eggs, Lates can only lay an average of 30,000 while the three speciesof Tilapia can lay an average of over 3,000 eggs each. However, becausethe tilapia are prolific breeders, capable of spawning more than once ayear, they have succeeded in dominating other species in the lake bothin density and standing crop per hectare (Table 2). Other species withan estimated average density of over 100 uish/hectare but with relativelylow standing crop are:- Lates niloticus (116.7, 2.8); Auchenoglanisoccidentalis (144.2, 5.8); Alestes marcrolepidotus (201.3, 6.2); Labeosenegalensis (279.9, 9.0); Alestes dentex (144,8, 5.4); and Alestesbaremose (371.0, 5.4) with their respective density per hectare andstanding crop in kg/ha (in parenthesis) respectively. The most likelyexplanation for the pbserved high density but low biomas is that thesespecies are being exploited at a very early age with relatively smallmesh nets e.g. (2.3 and 3.5cm mesh) long before they attain sexualmaturity, as indicated in Table 2 column 6.
Table 5 shows the relationship between age and standard lengthin mm for the major commercial species in the lake. A comparison ofthe figures in Table 5 to those of' Table 2 column 4 reveals thatwhereas all the three species of' Tilapia attain sexual maturitywithin their first year of life, other species become ripe much laterin life e.g. (Citharinus citharus after 3 years; Citharinus distich—odoides after 5 years; Bagrus bayad after 4 years; Bagrus ocmac —after 3 years; Hydrocynus spp. within the second year of life; etc.)Lates after 2 years. This factor may also contribute to the apparentscarcity of these species, since they are susceptible to capture insmall mesh nets in their first and second year of' life prior toattainment of sexual maturity. As a result of this premature exploi-tation, only very few individuals, which escape capture by fishermen,sucdeed in spawning and subsequent growth to adult sizes.

—5—
2.3. The effect of low productivity of thelittoral zones on recruitment
Spot poisoning or rotenone sampling of unit areas of thelittoral zone was used in estimating the standing crop or biomassof fish per hectare in Kainji lake. Standing crop estimates althoughnot direct estimates of production,give the highest approximation tot. The standing crop estimated between 1975 and 1976 varied from24 kg/hectare to 787 kg/hectare within the 21 stations sampled. The
mean standing crop for all stations was about 240 kg/hectare. The
mean standing crop of coves (inlets an bays) was 372 kg/hectare whilethat of exposed shore—line was 88 kg/hectare. Coves provide breedingand nursery ground for fishes but because of the presence of relativelyfew coves along the shore.-iine of Kain.ji lake, the productivity of thelittoral zone is low and hence the recruitment of fishable stock intothe lake is bound to be low.
Secondly, the extensive seasonal drawdown area during low waterseason exposes majority of juvenile fishes, hitherto hidden amidstvegetation along the littoral zone, to Intensive exploitation in snailmesh nets. The few mature adults that escape capture during this periodsucceed in migrating back to the littoral coves and swamps to breedduring the flood season. This is the only natural phenomenon that ishelping to sustain the fishery of the lake at its present low level ofproduction thus preventing total depletion of the stock.
2.4.. The effect of high concentration of fishermenon catch per unit effort
Henderson and Welcome (1974) have observed that the concentrationof fishermen per unit surface area of a lake can have a mar<ed effect onthe tOtal catch of fish from the lake or on the catch per unit effortof commercial fishermen. From a study of several African Lakes, theauthors have shown that the catch per fisherman increases with incrasein the nuiiibers of fishermen up to a level of about 1.5 fishermen/kmThereafter, the catch shows a decline (Fig. 8). Henderson (1977) alsoobserved that whereas the density of fishermen per square kilometer inLake Volta (which is about 6.6 times the sie of Kainji Lake) is one,Kainji lake has a density of 5 fishermen/km *
Assuming that there is only one fisherman/boat in Kainji lake,Figure 2 shows that from 1970 to date the number of fishing boats in thelake has remained relatively coflstant at approximately 3,300 boats.Estimated at one fisherman per boat the concentration coefficient stillstands at 2.6 fishermen per square kilometer of the lake area.Similarly, Figure 9 shows the relationship between atch per unit area(catch in kgha) and effort (number of fishermen/km ). With about 2fishermen/km a maximal catch of 100 kg per hectare can be attained

— 6. —
subsequently the catch per hectare shOws a decline with increaàe inthe number of fishermen per square kilometer;
As a result of unregulated fishing, the annual mean catch perboat has dropped from 9,4 metric tonnes in 1969 to:1.4 metric tonnesin 1978 {Table1).. Like the catch per unit effort of experimentalfishing (Fig,1), there was a sharp decrease in catch per boat betweeh1969 and 1971 from 9.4 to 3.2 metric tonnes respectively, before thegradual decrease to a seemingly equilibrium level of 1.4 metric tOnnesin 1977 and 1978.
Between 1971 and 1973 the catch per boat fluctuated slightlybetween 3.2 and 2.1 metric tonnes showing that with a bit of controlby the government it would have been possible to maintain the yieldCi'om the lake at the predicted pre-.impoundment estimate of 10,000metric tonnes,
2.5. The observed rise in the cost of catching a unit weight of fishaszociated with increase in effort without relative increase in thecatch
In a system where there are both mechanized and unmechanizedboats the former is more advantageous if increase in effort iproportional to increase in the catch. A mechanized boat can travel todistant fishing grounds and operate larger fishing fleets of nets thanwould be possible in an unmechanized boat,
Also if the open water pelagic production is high, a mechanizedboat can venture out into rougher waters than unmechanized boats.However, in Kainji lake where the pelagic production is poor andincrease In effort does not yield proportionate increase in the catch(Table 6), mechanization in most cases is not advantageous since thefish caught could sometime be less in value than the fuel copsumedand the effort expended, Mechanization on the other hand can be ofgreat advantage during the boom season of certain fishes e.g. Lateboom during the black flood period (November to early March), ilapiaboom during the low water season between May and August and SyiIntisboom between March and June. During such periods mechanized boats caexploit several distant fishing grounds and return to base in good time.
Recent observation has proved that exclusive dependence on data
from experimental fishing at fixed stations could be misleading indeciding whether or not to give mechanized boats to fishermen on loan.This is because experienced fishermen have no fixed stations but migrate
with the fish and change their mesh sizes to suit the current fisherieshence their catch per unit effort is bound to be higher than that ofexperimental fishing at fixed stations. Such sudden change in meshsizes from larger to smaller mesh nets (Figs. 4 and 5) can result inoverfishing.

— .7. —
3 CONCLUSION
The evidences presented show clearly that Kainji lake has beenoverfished It. has been shown too that the lake has attained naturalequilibrium with a catch rate ranging between 4,000 and 6,000 metrictonnes of fish per annum This natural equilibrium has been sustainedbecause of' the annual fluctuation in water level giving ri.e to highcatches during low water level and low catches during the flood seasonwhen most of' the fishes including the juveniles take cover within theflooded bushes.' The significance of a managed system lies in the factthat the fish production.. of' such a system can be increased far above the
natural equilibrium level, thus providing more protein diet for thepeople.
Although there' has been no immediate sign of national consciousnesstowards the management of aquatic ecosystems for increased fish production in Nigeria as is the case in most developed countries of the world,there is, however, a general consciousness towards self sufficiency infood production in general. With increase in the number' of irrigation
reservoirs constructed by the River Basin Development Authorities in thecountry, it is hoped that the need for increasing fish production beyondthe natural unmanaged level will gradually become apparent if our targetof self reliance is to be met. An attempt will be made here bo proposesome of the possible ways of tackling the problem of overfishing inKainji lake to serve as an example for the management of other reservoirs.
4, THE MANAGE€NT PROPOSAL
4.1. Free registration of fishing boats and issue of freefishing licences
.In his observation on fishery management in Africa, Calender (1966)states that the catch per fisherman in Africa is usually small, but in'some localities, the number of fishermen is so high as to harvest allthe fish that could be taken with more efficient gear. He believes thatthe yield might be increased if there were less intens±ve harvest butnotes that it. is 'difficult to limit the fishing pressure because there• is no other profitable employment available for the displaced fishermen.
The above observation applies to Kainji lake. With a currentestimate of 4867 professional fishermen and 3331 fishing boats on thelake, it will be premature and inhuman to advocate for a reduction inthe numberof fishermen since these men have no other source oflivelihood. However, in order to bring all the fishermen under oneumbrella and facilitate the implementation of management regulations,a free licencing system is being advocated under the auspices of theNiger River Basin Development Authority (NHBDA) and other development
agencies using the following guidelines:

—8—
Figure 10 shows a map dividing the lake into 3 major strata and6 sub—strata, Strata 1, 3, and 5 are located on the western. zônof the lake bounded by Kwara State while Strata 2, 4.and6 arelocated on the.eastern zone bounded by Niger State (2) and Sokoto
State (4 and 6) respectively. The number of fishing boats and theconcentration coefficient of fishing boats per square kilometer (kmof lake surface area is shown in Table 6. A sunimary of the table for
1978 shows that there are:—
1770 fishing boats within Kwara State boundary
1119 " " " Sokoto State " and
364 " " Niger State
Figure 11 shows the location and code numbers of all the fishingvillages along the Western and Eastern shores. With these code numbersthe following information can be obtained about the fishing villages e.g.
(a) name of fishing village
('o) number of fishing boats with or withoutengines and type of fishing gears used bythe local fishermen
(Bazigos 1971 and Ekwemalor 1979). The field assistants of theInstitute's Statistical Section are in frequent contacts with fishermenin all these villages and with their assistance and more labour force,the free registration exercise could be completed within 3 months.
It is therefore. proposed that the NRBDA in conjuction with eitherthe Kai.nji jake Research Institute or State Department of Fisheriesshould prepare licences in the form of badges with National colours(Green, White and Green) to be awarded free to all registered fishermenfor conspicuous display on their shirts. This will be a fit'st step ofbringing all the fishermen operating on the lake under a unified system.Subsequently, all registered boats would be expected to show the nationalcolours (that is, should be painted green, white and green).
Some of the advantages of free registration are:-
(i) Easy control of fishermen for implementation ofscientific findings
(11) Control of the number of fishermen allowed to fish inany newly impounded reservoir
(iii) Provision of easy basis for cooperative formationand organisation of educational programmes.

—9—
4.2. Exparsion of the Revolving Loan Scheme toother States bordering the Lake
The NEBDA currently operates a revolving loan scheme (Ita 1978)from their base at the western shore close to the dam. However, pastrecords (Bazigos 1972) have shown that this station, located inStratum I (Fig. 10) is the least productive with only 17.5% of thetotal fish catch from the lake even though it comprises 20% of thetotal surface area of' the lake. Table 7 shows a breakdown of the areaand relative catch by per cent after Bazigos (1972).
Table 7 - Estimated percentage surface area and totalcatch by strata in Kainji lake.
Stratum % Surface Area % Total Fish Catch
I
II
III
20
70
10
17.5
62.4
20.1
The above table shows clearly that the NRBDA can carry out amore lucrative business within strata II and III with higher catchrecords. The low catch records for stratum I is not unconnected withthe fact that the deepest regions of the lake are located within thisstratum with a mean depth of 18.5 meters compared with 10.8 metersand 8.Q meters for strata II and III respectively.
The location of processing units .under the supervision ofFishery Officers or Superintendents at.the centres indicated inTable 8 and Figure 11 is being proposed. Although some fishermen whohave benefitted from the NRBDA loan scheme do land their catches atthe NRBDA beach, the number of boats is not indicated in the table sincethe station was not a permanent fishing camp prior to the initiation ofthe NRBDA scheme.
The first problem to be tackled before this expansion scheme couldtake off will be the establishment of suitable habitable quarters, forthe officers concerned, at the various centres, The number of fishermento benefit from .the programme should be dependent on the catch per boatat the various centres and the capacity of the installed processingunits. The experience gained at the present centre could be utilizedin setting up other centres. The operational details of the scheme,
evident from recent exPeriments, has been reported in Ita and Eyo (1981).

— 10 —
Table 8: — Proposed.cèntres for the introduction of.revolving loan scheme.
Locality State Stratum Substratum•
Total No.. ofBoats counted
NRBDA beach .
(present site) Kwara I 1 • —
Molale Kwara : 1 91
Shagunu Kwara II 3 11
Bukuolubo Kwara Ii 3 42
Garafini Niger I • 2 87
Wara Sokoto II .4 38
Samare Sokoto III 6 207
Yauri Sokoto III 6 123
4.3. Establishment of supply and servicing unitstogether with the processing units
Neither of the first two proposals given above is intended toserve as control or regulatory measures and hence help in raising thelevel of fish catch in the lake. The first proposal is of no directbenefit to the fishermen while only a few fishermen can benefitdirectly from the second proposal. The establishment of supply andservicing units is intended to serve more fishermen than couldbenefit directly from the loan scheme. The NRBDA can stock suitablemesh sizes of nets purchased directly from net factories, or from anyother agent or agents at controlled prices and sell to fishermen atreasonable prices. Other items to be stocked include: (a) boat enginesof popular specifications and spare parts (b) petrol and engine oil.
The current inflated prices of fish could be attributed to thedifficulty the fishermen encounter in obtaining the above items.Instances have been reported where fishermen are compelled to payvery high prices, up to three Naira (N3.OO) for.a gallon of petrol inorder to be able to operate.
In order to avoid hoarding of fuel, each fisherman should besold a maximum of 45 litres (10 gallons) of fuel a week in motor boatjerry—cans. The quota system will help minimize the demand andfacilitate supply to many fishermen. The NRBDA may experience someproblems, particularly, in connection with regular supply of fuel by
tankers to the depot. Such difficulties could, however, be overcomewith time.

— 11 —.
A small mechanical workshop for servicing and generalmaintenance of engines should form an indispensable addition toeach of the processing units. Experience has shown that mostfishermen damage their new engines through ignorance in'mixing theright quantity of engine oil to their fuel. In a desperate attempt toconserve fuel, on account of' high cOst, the men deliberately increasethe quan.tity of engine oil added to the fuel thus causing prematuredamage to the engine. The mechanical unit could help greatly ineducating the fishermen on the care and maintenance of their engines.
If the above proposal is sUccessf'iilly implemented, the NRBDA willsucceed in generating confidence between th authority and the fishermento the extent that subsequent regulatory measures for stepping up theharvest of catch per unit effort could be readily accepted without much
suspicicri.
4.4. Minimum Mesh—size. regulation
:Mesh—5ize regulation is one of the Olassical methods of fisherymanagement aimed at preventing the over—exploitation of' young fishbefore they attain sexual maturity. All evidences point to the fact thatonly small fishes are the commonest in the lake. Recent trends indicatethat the mean sizes of' fish caught in graded fleetsof gill nets during1978/79 were much smaller than those caught in the same fleets in1977/78 (Otubusin 1978).
Detailed analysis of mesh size selection of some commerciallyimportant species revealed that only 7 out of 30 species of fish couldbe captured with 5 cm mesh net after they hare attained sexual maturity(Table. 2). The remaining 23 species were still immature at. the time of'capture in 5 cm net.
By increasing the mesh size from 5 cm to 7.5 cm, about 14 out ofthe 30 commercially important species would be allowed to reproduce at.least once before they are captured. On the basis of the above findingsit was recommended in 1976 that a minimum mesh size of 7.5cm be used inthe open water while the inshore areas should be sampled with 12.5cmmesh and above in order to protect the population of Citharinus.
Because of the problems of enforcement and the fact thatCitharinus do not attain sexual maturity until they are over 3 yearsof age, it was necessary to review the previous recommendations.Recent investigations have shown that Tilapia which are limited indistribution to the shallow inshore waters attain sexual maturity longbefore they grow into 7.5cm net. This usually happens within theirfirst year of life. Besides, Tilapia comprises 49% of the standingcrop of economically important species in the lake (Table 2). It would

— 12 -
therefore be more realistic to manage the fishery for this very import-
ant topical primary consumer rather than for Citharinus.
It is recommended therefore that a minimum mesh size of 7.5cm be.enforced irrespective of the locality of habitat fished.
Fishermen should be given a maximum of 6 months within which to
fish out all nets below this mesh size after which time all such netsfound on the lake by the NRBDA water guards could be confiscated.
A time lag of 6 months to one year will be required for most ofthe species to grow into 7.5cm net and within this period the NRBDAcould increase the buying price of fish from the fishermen in order tohelp sustain them during the difficult period. The price would againdecrease when the boom in 7.5cm mesh starts.
A catch assessment survey should be carried out before and afterthe boom in order to assess the relative increase in fish landings onthe lake. This will be the first step toward increasing fish production and yield in the lake.
It is estimated that the fish yield in the lake could be increasedfrom the present 5,000 metric tonnes to 10,000 metric tonnes if the abovemesh size regulation is enforced.
5. REQUEST FOR TECHNICAL ASSISTANCE
In view of the extreme manpower limitation in the Fishery Sectorin the country, ±t is proposed that an International Agency such as theFood and Agricultural Organization of the United Nations (FAO) berequested to participate in the scheme under a project arrangement withthe NEBDA for a periodof five years. During this period suitableNigerian staff should be trained to take over the project.
6. FEASIBILITY STUDY
Finally, it is proposed that a comprehensive feasibility study beconducted prior to the execution of the fishery management and develop.ment scheme. A pre—feasibility study has been conducted for therevolving loan scheme to fishermen using 20 fishermen for the rodel(Ita & Eyo, 1981) and 100 fishermen for the financial analysis.

— 13 —
REFERENCES
Ajayi, 0. (1972) Biological studies on the Family Bagridae(Pisces Siluroidae) in Kainji Lake, Nigeria. M, Phil. Thesis,University of Ife, Nigeria.
Akintunde, E.A. (1976) The Biology of' Tilapia and Sarotherodon speciesof Lake Kainji, Nigeria, with special reference to Sarotherodongalilaeus. N. Phil. Thesis, University of Ife, Nigeria.
Arawomo, G.O. (1972) The Ecology of the Fish Genera Citharinus andDistichodus in Lake Kainji, Nigeria. M. PhiI, Thesis, Universityof Ife, Nigeria.
Bazigos, G.P. (1971) Frame survey at Kainji Lake (Nigeria)..FAO/FI;SF/NIR.24, Stat.
Bazigos, G.P. (1972) The yield pattern at Kainji Lake, Nigeria.FAO/UNDP/SF/NIR.2Lf. Stat. Stud.2: 26p.
Carlander, K.D, (1966) Observations on Fishery Management in Africa.Iowa. Acad. Sci. 73: 145—151.
Carlander, K,D. (1969) An operational functional classification offishery management techniques. Verh. Internat. Verein. Limnol.17: 636—640.
Ekwemalor, A.I. (1979) Frame survey of Kainji Lake (Nigeria).Unpublished report to Kainji Lake Research Institute, New Bussa.
Henderson, H.F. (1979) The Significance of limnology in thedevelopment of Fisheries in man—made lakes and river basins.In: Proceedings of the International Conference on Kain.ji Lakeand River Basins Development in Africa. I: 135—143.
Henderson, H.F. & Welcomme, R.L, (1974) The Relationship of yieldto morpho—edaphic index and numbers of fishermen in AfricanInland Fisheries. F.A.O., Rome (CIFA Occassional Paper 1).
Ita, E.O. (1978) An analysis of fish distribution in Kainji Lake,Nigeria. Hydrobiologia. 58(3): 233—244.
Ita, E.O. (1980) Contribution to the dynamics of mean—sizestatistics in a changing fishery: 1. Family Citharinidae inin Kainji Lake, Nigeria. Hydrobiologia. 68(3): 269-277.

.Ita, E.O. & Eyo, A.A. (1981) A preliminary report of operationaltechniques for a small—scale experimental revolving loan schemeto fishermen in Kainji Lake, Nigeria and a proposed ideal modelr large scale fisheries development in the lake. Unpublishedreport to Kainji Lake Research Institute, New Bussa,
Motwani, M.P,P. (1970) Fishery investigations on the Niger andBenue Rivers in the Northern Region and development of a programmeof riverine fishery management and training. FAO Rep. TA 2771,
Otubusin, S.0. (1978) Gill—net monitoring analysis: Catch effortstatistics. Kainji Lake Research Institute Annual Report 1978/79.pp 32—33.
Willoughby, N.G. (1974) The ecology of the genus Synodontis(Pisces: Siluroidei) in Lake Kainji, Nigeria. Ph.D. Thesis,University of Southampton 288p.

Table 1:
Estimated total catch per boat per year by commercial fishermen
in Kainji Lake and rield in kg. per 1,000 sq. m. of experimental
gill—net between 1969 and 1978.
Ui
YEAR
1969
1970
1971
1972
1973
1974
1975
1976
1977
1978
Landings in
metric tonnes
17000
28639
11037
10905
7320
6048
6000
5000
4500
.
4500
Num
ber
offishing boats
,
1800
3400
35Q0
3500
3500
3400
3400
3400
3300
3300
Mean catch per
boat in metric
tonnes
9.4
8.4
3.2
3.1
2.1
1.8
1.8
1.5
1.4
L4
Yield in Kg.
per 1,000 Sq. m,
of experimental
gill—net
46.6
16.6
13.9
6.2
4.4
5.2
6.5
3.5
5.6
4.5

16
Table 2: — Observed maximum weights denaity, atanding crop perhectare etc., for the major commercial species in Kainji Lake.
Observed Density Standing Approx. Mean Susce..Maximum per Crop per Standard Standard ptible
.Fish ..Species Wt. (kg) hectare hectare(kg)
Length(mm) atMaturity
Length(mm) atentryinto 2
inch net
to
capturebefore>latu—rity
Lates niloticus 100.0 116.7 2.8 240 184 Yes
Melapterurue electricus 20.0 42.1 5.9 — — —
Hydrocynus vittatus 15.0 0.3 0.02 210 230 No
Bagrus docmac 12.5 5.5 1.0 300 165 Yes
Clarotes laticeps 10.0 45.5 1.9 300 165 Yes
Hormyrops deliciocus 10.0 11.4 0.4 420 (TL) 240 Yes
Clarias anguillaris 7,0 16.0 3.5 500 (TL) — Yes
Clarias lazero 7.0 15.5 1.9 500 — Yes
Mormyrus rume 5.0 12.7 1.7 369 240 Yes
Citharinus distichodoides 4.6 7.5 0.4 535 120 Yes
Bagrusbayad 3.5 71.0 15.6 412 165 Yes
Citharinus citharus 3.0 184,4 33.1 345 221 Yes
Labeo coubie 3.0 32.6 3.0 546 190 Yes
Labeo pseudocoubie 3.0 8.7 0.5 546 190 YGs
uchenolanis occideritalis 2.0 144.2 5.8 200 165 Yes
Hydrocynus forskahlii 2.0 7.9 2.0 210 240 No
Sarotherodon niloticus 2.0 324.3 35.2 135 135 Yes
Distichodus rostratus 2.0 37.8 2.0 300 159 YeS
Auchenoglanis biscutatus 2.0 7.1 1.5 200 165 Yes
lestes macrolepidotus 2.0 201.3 6.2 200 190 Yes
Labeo senegalensis 1.5 279.9 9.0 310 182 Yes
Sarotherodon galileaus 1.5 1470.0 42.4 126 185 No
Synodontis membranaceus 1.5 18.7 0.4 245 186 Yes
Chrysichthys nigrodigitatus 1.5 38.9 0.7 171 192 No
Channa obscurus 1.0 4.2 0.4 — 280 —
Hyperopisus bebe 1.0 1.9 0.1 307 240 Yes
Syiodontis vermiculatus 1.0 0.4 0.01 170 155 Yes
Hepsetusodoe 0.8 0.2 0.1 — 256 —
Alestos dentex 0.6 144.8 5.4 230 205 Yes
Synodontis gambiensis 0.5 33.7 1.3 171 155 Yes
Ti.lapia zulu 0.3 559.2 25.0 88 135 No
Alestes baremose 0.25 371.0 5.4 180—250 203 No
Schilbe mystus 0.25 18.6 0.2 130—160 183 No

Table 3: —
Ada
ptiv
efeatures of some Kainji Lake fish species and their
significance and negative role under intensive exploitation.
biological
—1
Adaptive Features
.
Biological Significance
Negative role under
fishing conditions
No. of Spp. in Kainji
Lake
Knobs, hooks and
thorns on fish
bodies, thorny
rays in fins
Protection of fish,
especially young from
predators
Tangling in nets
and difficulty in
escaping through
meshes
Synodontis,
Bagrids
Lates, Schilbeids,
Tilapia
Laterally
Compressed width
and high
dorsoventrally
Lower predatory
effect on young
fishes
••
Enmeshing in nets
with relatively
large meshes
Citharinus,
Distichodus
Shoaling
.
Lower predatory
effect
Susceptible to
mass capture in
nets
Citharinus, Schilbeids,
Alestes, Hydrocynus
High speed of
movement
Chasing for prey and
escape from predators
Covers extensive
area of fishing
grounds
Hydrocynus, Lates,
Citharinus, Alestes

Table 4: —
Com
paris
onof fecundity rates of some larger fish species
in Kainji Lake.
.S
peci
esTotal Length
range
Standard:
Leng(mm)
'W
eigh
t(gin)
Ovary wt.
(g.
Fec
undi
tyR
ange
Mean No.
of
eggs
Source of
information
Cith
arin
us la
tus
—34
5—38
5 (3
)15
00—
2370
—16
1,84
O—
3O5,
25O
244,
680
Ara
wom
o (1
972)
Cith
arin
us d
istic
hodi
des
—535—(2)
4500—4600
—32
5,20
0—68
4,50
051
9,85
0"
Lat
es n
ilotic
us59
0—79
0(3
)4.
0—12
.314
,700
— 1
5,60
030,033
Motwani (1970)
Hydrocynus forskahlii..
290—350
(2)
150— 250
3.7—11.7
10,300— 17,300
9,20
0
Synodontis rnembranaceus
—29
0—31
9 (8
)—
—33,700—179,000
106,350
Willoughby (1974)
Synodontis gambiensis
—171—267 (10)
——
1,390— 84,300
42,845
"
Auchenoglanis occidentalis
5,300— 16,000
Ajayi (1972)
Tilapia galilaea
1,120—
7,110
3,406
Akintunde (1976)
Tilapia nilotica
250—
5,020
3,315
"
,Tilapia zillii
1,300—
8,050
3,842
11
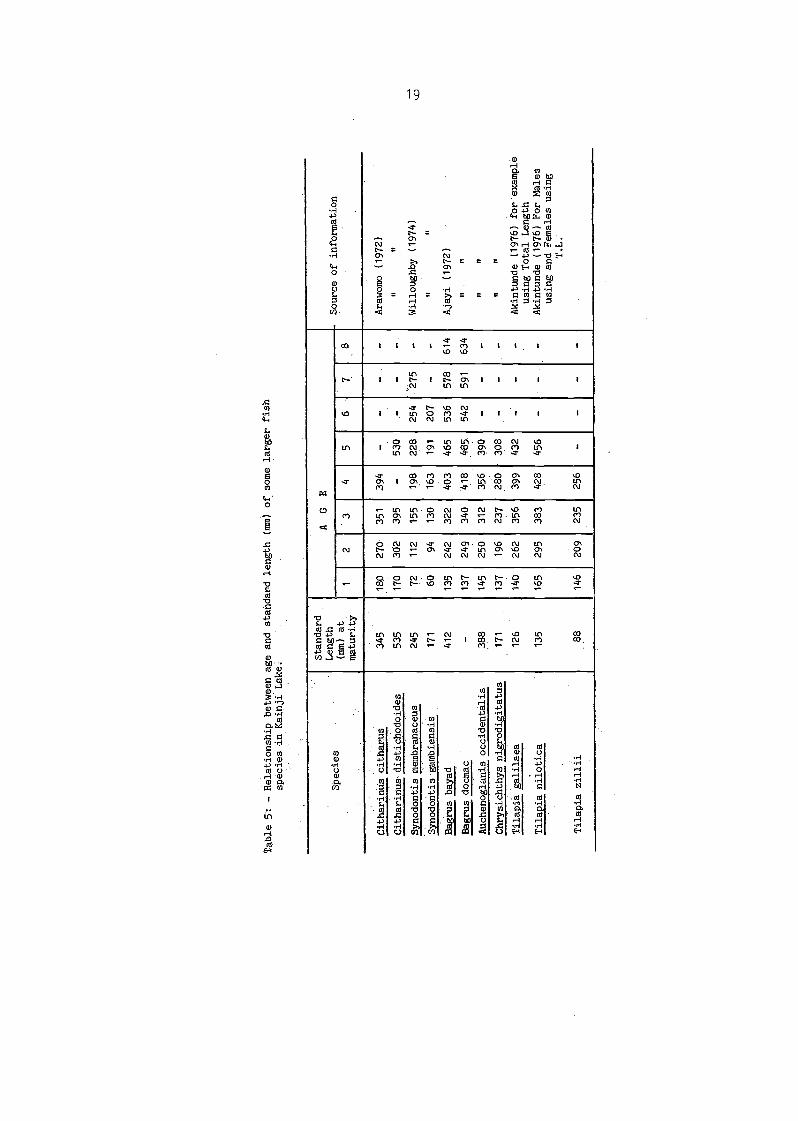
Table 5: —
Rel
atio
nshi
pbetween age and standard length (ma) of some larger fish
species in Kainji Lake.
•
Spe
cies
Standard
()
atmaturity
AG
E
——
——
—Source of information
12
34
56
78
Citharinus citharus
345
180
270
351
394
——
——
Arawomo (1972)
Cith
arin
us d
istiç
hodo
ides
535
170
302
395
—530
.——
—I
U
Syno
dont
is m
embr
ance
usSy
nodo
ntis
ganibiensis
245
171
412
72 60 135
112 94
242
155
130
322
198
163
403
228
191
465
254
207
536
275 —
578
— — 614
Will
ough
by (
1974
)
"
Aja
yi(1972)
Bag
rus
baya
dB
agru
s do
cmac
—137
249
340
418
465
542
591
634
"
Auc
heno
glan
is o
ccid
enta
lis38
814
525
0312
356
390
——
—U
U
Chr
ysic
hthy
s ni
grod
igita
tus
171
137
196
237
280
308
——
—
Tilapià galilasa
Tila
pia
nilotica
.
126
135
140
165
262
295
356
383
399
428
432
456
— —
— —
— —
Aki
ntun
de (
1976
) fo
r ex
ampl
eus
ing
Tot
al L
engt
hA
kint
unde
(19
76)
For
Mal
esus
ing
and Females using
7.L.
Tila
pia
zilli
i88
146
209
235
256
——
——
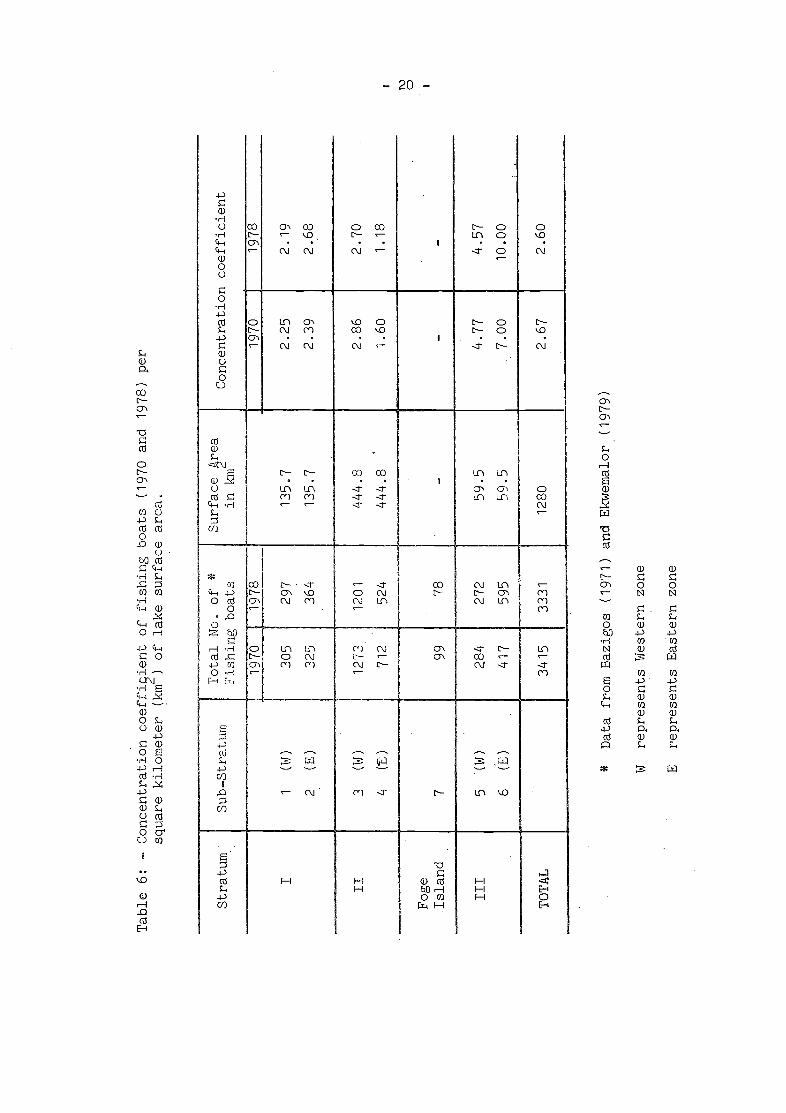
Table 6:
Concentration coeffiient of fishing boats (1970 and 1978) per
square kilometer (km
)of lake surface area.
*D
ata
from Bazigos (1971) and Ekwemalor (1979)
Wrepresents Western zone
Erepresents Eastern zone
I'-) Q
Stratum
Sub—Stratum
Total No. of *
,. Fis
ning
boats
Surface Area
. nkm
.
Con
cent
ratio
ncoefficient
I1
(W)
2(B
)
]970
1978
135.7
135.7
1970
1978
2.25
2.39
2.19
2.68
305
325
297
364
II
3(W)
4(1)
1273
.
712
1201
524
444.
8
444.
8
2.86
1.60
2.70
1.18
Foge
Island
799
78
——
—
III
5(W)
6(E)
284
417
272
595
59,5
59.5
4.77
7.00
4.57
10.00
TOTAL
3415
3331
1280
2.67
2.60

U) C C E L. ID.
E 0 0 0 S.- C -c U ci 0
50 60•
30 20 10
05
'—
Com
mer
icci
Land
ings
S
30
0
25
U) C C 0 0 E C
15
C •0 c ci
10
ci E
-5
E 0 0
I')
1969
1970
1971
1972
1973
1974
1975
1976
1977
catch
Fig
. 1. T
he v
aria
tions
inex
perim
enta
l,, p
erun
it ef
fort
(K
g/l0
00sq
. rn-
ofgi
Ll-n
et)
and
com
mer
cial
land
ings
inK
ainj
iLa
ke b
etw
een
1969
—19
77. T
h do
tted
line
repr
esen
tsth
e eq
ulU
briu
m p
oint
.
C tn IL '6 E z
361
3200
U)
m28
(
2 2000
T\)
Fig
. 2. E
stim
ated
Dat
afo
ran
d 19
78
1969
1970
1971
1972
1973
1974
1975
1976
1977
1978
totu
Enu
mbe
rof
fishi
ngbo
ats
on th
e La
ke o
ver
time.
1969
—19
72 e
xtra
cted
from
Baz
igos
(19
72),
Dat
afo
r19
75ex
trac
ted
from
Ekw
emat
or (
1975
& 1
976)

50-8 535 162(2') [2V2) (3")
MESH
— 23 —
100•
7
U-
0
LU
zUI
L)(I0
7C
\U-
7UIC-,
LUa
25-
\\.\ 15'4
—
0
88-9)3V2
—-
iw-s 270(4:')
)77.87-')
SIZE iN mm and inches
Fig. 3. Mean Percentage Occurrence of Fish in DifferentMesh Nets. Between 1969 and 1977.

— 24 —
Fig. 4(u) Retuti frequency distribution of the qiU nets fished onthe Lake by mesh size (inches) fishing year 1970171
1 01'. 10
50
1:5 2. 3. '. . . j;,.
Fig. 4.(b) Relative frequency distribution of the giU nets fished onthe Lake by mesh size (inches) 1972 (from Bazigos 1972)
.1*1104
15 7.
40
30
20
10
9. (Mesh size)

— 25 —
Fig. 5. Estimated relative icthyomas of Cithurinusspp. in the fish catch, 1970/71 and 1972
(from Bazigos 1972)

E I— I LU z Lii
Fig. 6.
Trends in mean weight and log of population
abundance in Githariñus citharus.
(From Ita, 1980)
____
___o
ME
AN
WE
IGH
T
X—
X A
BU
ND
AN
CE
\ \ \ \
1600
1400
1200
1000
800
600
400
200 0
3.4
30
Li! C) z
).L:
0 z cc 0
1•4
1969
1970
1971
1972
1973
1974
1975
1976
1977

a:LU
ZBU
>-
I4U
— 27
— MEAN WEIGHT
br
9 CATCH
— — —x ,MEAN LENGTH
N0OF FISH = 289
EE
u-i
C
zUiUa:LU
20
=CzU-i-J
E
I—ICLU
z4LU
-1180
-1000
-820
-640
.460
• 280
z4LU
MESH SIZE IN mm
220
Fig. 7. Variation in mean length/weight and percentage catchby number in relation to gill—net mesh size forCitharinus citharus.
(From Ita, 1980)

5
4
2
— 28 -
3
e (No. of fsherm€n
Fig. 8. The relationship between catch per unit effor (catch perfisherman) and effort (number of fisherman/km ) for31 African lakes.
(From Henderson & Welcomme, 1974)
13
12
11
y. B784-1 58xO 531
7
c0E
£
-c-S0U
• ''S
c.-J
3 S
1a
a
I 2 4 5 6.
'km Z

— 29 —
Fig. 9. Variations i recorded catch at different numbers of.fishermen/km in 31 African lakes.
(From Henderson and Welcomme, 1974)
99
CU
U
Va
I
01 2
number of43
fishr mn/7km2

— 30 —
10. Map of Kainji Lake, Nigeria, showing differentstrata and sub-strata.
MAP OP/Ut1J RESERVOU?.
0 HLES Q
Jo
STRATUI1 II
TRATUM I
LEGNO
— H'J'wt— 4
.i
Fig.

(4


PUBLISHED AND PBINTED BY KAINJI LAKE PESEAIH INSTrWTF, NEW I3USSA, NIGERTh.