environmental monitoring report - asian development bank · evn genco 3 thermal power projects...
TRANSCRIPT

Environmental Monitoring Report __________________________________________ Semestral Report January-June 2013
VIE: Mong Duong 1 Thermal Power Plant Prepared by Electricity of Vietnam and Thermal Power Projects Management Unit 1 for the Government of Viet Nam and the Asian Development Bank.
EVN GENCO 3
Thermal Power Projects Management Board 1 (TPMB1)
MONG DUONG (2 x 500MW) THERMAL POWER PLANT PROJECT
1st SEMI-ANNUAL
ENVIRONMENTAL MONITORING REPORT 2013
Period 01st January – 30
th June 2013
Contract No: TPMB1-EVN/ADB-2610L2MFF-Consulting-002
Page 2 of 68
CONTENTS
EXECUTIVE SUMMARY ................................................................................................... 5
1. INTRODUCTION...................................................................................................... 10
1.1 The project ............................................................................................................................... 10
1.2 Incorporation of Environmental Requirements into Project Contractual Arrangements ......... 10
1.3 Project Implementation Progress ............................................................................................. 11
1.4 Report Purpose ......................................................................................................................... 13
2. ENVIRONMENT COMPLIANCE INSPECTIONS .............................................. 13
2.1 Environment Compliance Inspections at the Construction Site ............................................... 13
2.2 Health, Safety & Environment (HES) Aspects ........................................................................ 14 2.2.1 Health, Safety & Environmental Management Plan (EMP) ............................................. 14 2.2.2 HSE Management Organization (EPC Contractor Hyundai E&C) .................................. 14 2.2.3 Total Man hours of the EPC Contractor and its Subcontractors ....................................... 14 2.2.4 Accident Free Man hours of the EPC Contractor and its Subcontractors ......................... 15 2.2.5 Health, Safety and Environmental Training ..................................................................... 15 2.2.6 Health Check .................................................................................................................... 16 2.2.7 Health, Safety & Environment Inspection and Result ...................................................... 20 2.2.8 Personal Protective Equipment (PPE) .............................................................................. 22 2.2.9 Security Status .................................................................................................................. 22 2.2.10 Social Aspects and Gender issues ..................................................................................... 22
2.3 Conclusions and Recommendations ........................................................................................ 22
3. ENVIRONMENTAL QUALITY MONITORING ................................................. 24
3.1 Air quality, Noise and Vibration Monitoring ........................................................................... 24 3.1.1 Monitoring of Air quality ................................................................................................. 24 3.1.2 Noise Monitoring .............................................................................................................. 27 3.1.3 Vibration Monitoring ........................................................................................................ 30 3.1.4 Overall Assessment Air & Noise and Vibration ............................................................... 32
3.2 Water Quality Monitoring ........................................................................................................ 33 3.2.1 Monitoring parameters and procedures ............................................................................ 33 3.2.2 Inspection Activities ......................................................................................................... 34 3.2.3 Monitoring results and assessment ................................................................................... 35 3.2.4 Overall Assessment Water Quality ................................................................................... 48 3.2.5 Recommendation .............................................................................................................. 49

Page 3 of 68
4. AQUACULTURE & FISHERY ............................................................................... 50
4.1 Overview .................................................................................................................................. 50
4.2 Inspection Activities ................................................................................................................ 50
4.3 Overall Assessment Aquaculture and Fishery ......................................................................... 51
5. MANGROVE REFORESTATION MONITORING ............................................. 52
5.1 Overview .................................................................................................................................. 52
5.2 Inspection Activities ................................................................................................................ 52
5.3 Overall Assessment Mangrove Reforestation .......................................................................... 54
6. OVERALL CONCLUSIONS AND RECOMMENDATIONS .............................. 55
6.1 Health, Safety & Waste Disposal Management ....................................................................... 55
6.2 Environmental Quality Monitoring .......................................................................................... 56 6.2.1 Air & Noise and Vibration Monitoring ............................................................................ 56 6.2.2 Water quality Monitoring ................................................................................................. 57 6.2.3 Aquaculture and Fishery Monitoring ................................................................................ 57 6.2.4 Mangrove Reforestation Monitoring ................................................................................ 58
Page 4 of 68
TABLES Table 1 Institutional Responsibilities for EMP Implementation (extended version) .......................................... 10 Table 2 The accident hours against cumulative total man-hours during the period January to June, 2013 ........ 14 Table 3 Health, Safety & Environment Training ............................................................................................... 17 Table 4 Safety & Environment Inspections and Result ...................................................................................... 21 Table 5 The monitoring location, monitoring parameters and monitoring equipment and analyzed methods for
air quality monitoring ................................................................................................................................. 24 Table 6 Monitoring results of TSP and PM10 .................................................................................................... 24 Table 7 The monitoring location, monitoring parameters and monitoring equipment and analyzed methods for
noise monitoring ......................................................................................................................................... 27 Table 8 Monitoring results for Noise at Residential sites ................................................................................... 27 Table 9 Monitoring result for noise at the working site ..................................................................................... 29 Table 10 The monitoring location, monitoring parameters and monitoring equipment and analyzed methods for
Vibration monitoring .................................................................................................................................. 30 Table 11 Monitoring results for Vibration at Residential sites ........................................................................... 31 Table 12 Monitoring and analyzing results of surface water .............................................................................. 36 Table 13 The coordinates of coastal water samples ........................................................................................... 38 Table 14 Monitoring and analyzing results of coastal water .............................................................................. 39 Table 15 The coordinates of underground water (Existing wells) samples ........................................................ 41 Table 16 Monitoring and analyzing results of underground water (Existing wells)........................................... 42 Table 17 The coordinates of underground water (Drilled wells) samples .......................................................... 44 Table 18 Monitoring and analyzing results of underground water (Drilled wells)............................................. 45 Table 19 Monitoring and analyzing results ........................................................................................................ 53
GRAPHICS Graphic 1 Results of 6 monitoring times of air quality. ..................................................................................... 26 Graphic 2 Result of 6 monitoring times of noise level at site ............................................................................. 28 Graphic 3 Result of 6 monitoring times for noise at site .................................................................................... 29 Graphic 4 Result of 6 monitoring times of vibration at residential site .............................................................. 32
FIGURES Figure 1 Accident situations during the period January to June, 2013 ............................................................... 15 Figure 2 Water quality environmental monitoring procedure ............................................................................ 34 Figure 3 Water quality monitoring site .............................................................................................................. 35 Figure 4 The coordinates of surface water samples............................................................................................ 35 Figure 5 Method for selection of sample ............................................................................................................ 52
APPENDIXS Appendix 1 Environmental Team Organization Chart ....................................................................................... 59 Appendix 2 HSE Organization Chart ................................................................................................................. 61 Appendix 3 Pictures of Air quality and Noise .................................................................................................... 62 Appendix 4 Pictures of Water Quality ............................................................................................................... 63 Appendix 5 Pictures of Aquaculture and fishery ................................................................................................ 64 Appendix 6 Pictures of Mangrove Reforestation ............................................................................................... 65 Appendix 7 Picture of HSE ................................................................................................................................ 66 Appendix 8 Picture of Gender ............................................................................................................................ 68

1st Semi-annual Environmental Monitoring Report 2013
Mong Duong (2 x 500MW) Thermal Power Plant Project
Page 5 of 68
EXECUTIVE SUMMARY
The Mong Duong 1 Thermal Power Plant project has been classified as category A1 in
accordance with ADB’s Environmental Assessment Guidelines (2003). The Project EMP was
developed as an integral part of the Environmental Impact Assessment (EIA) process of the
Project that was completed and approved by ADB in 2006.
To ensure that negative environmental health and safety impacts are minimized and addressed
effectively throughout the project implementation and operational phase, an environmental
management plan (EMP) has been formulated detailing mitigation measures and a monitoring
program during various project phases of the Mong Duong 1 Thermal Power Plant project,
located in the northern province of Quang Ninh (Vietnam)
The report is highlighting on the environmental monitoring tasks and quality observations
performed by the various project entities on air & noise, vibration, water quality, aqua culture
and fishery development and a chapter on mangrove reforestation. It is further reporting on
health & safety issues at site as well as on social impacts on the affected communities including
gender issues related to man and women working together on the same project and sharing
common camp facilities.
It covers the works implemented during the period January to July 2013 and provides a summary
of current problems, conclusions and recommendations how to best mitigate the impacts on
affected parties and the environment.
The following environmental aspects were looked at for environmental compliance and
monitored for environmental quality during the reporting period
Air and noise quality
Water quality
Aquaculture and fisheries status
Mangrove reforestation
Health, Safety and Environment (HES)
Social impacts and Gender issues
Problem areas inspected for environmental compliance and monitored for environmental quality
during the reporting period relating to Air & Noise, Vibrations, Water quality and Aqua culture
were more affected in the current reporting period compared to the last 6 months period, mainly
due to the increased level of activities at the construction site or nearby locations serving the
Mong Duong project.
Air & Noise and Vibration Issues Regarding Air Quality comparing the monitoring results (dust) of affected areas between the last
6 months of 2012 and the first 6 months in 2013, it shows that the first 6 months of 2013 has a
higher concentration of air pollutants than the 6 months before, especially in the 3 months April,
May and June 2013 when the weather was dry, sunny and hot. The increase is mostly due to
increased traffic on the new no.18 and old 18A road likewise.
On the new no.18 road near the entrance of Mong Duong 1 and 3 2 power plants, heavy vehicles
travel a lot so the road is very dirty and dusty. The road needs regular water spraying to improve
the conditions, especially in the dry season. The appearance of construction waste in nearby
vacant land (along the new no.18 road such as concrete from bored piles and other construction
debris needs to be removed and kept neat and tidy at all times. Wheels of construction vehicles
leaving the site need to be cleaned before entering the public road. Excavated areas and heaps of

1st Semi-annual Environmental Monitoring Report 2013
Mong Duong (2 x 500MW) Thermal Power Plant Project,
Page 6 of 68
backfill on the site shall be sprayed with water or covered with plastic sheeting to limit dust
migration to nearby residential areas.
Through 6 monitoring times of noise quality at the working site during 2 days each in the period
February to June 2013, the results show that the noise level monitored in 1 hour at the turbine
and boiler area is about 73,4 – 82,1 dB(A). Compared with the allowable noise level for the
working place they are lower than the allowable limit value in TCVN 3985:1999 (85 dB). And
the noise level during daytime from 7AM to 8AM and 5PM to 6PM are 0,7–2,6 dBA higher than
the allowable limited value in QCVN 26:2010/BTNMT. At nighttime the noise level is between
10PM and 11PM monitored at a point about 7m away from the road are also higher by 7,1-12,4
dBA than the allowable limited value in QCVN 26:2010/BTNMT
The increase in noise level at the various locations and times are mainly caused by increased
construction activities at site and material transports from and to the construction site on the old
18A road
Noticeable environmental impact during the reporting period has not only been caused by pile
driving activities, foundation digging, construction and soil conveying, but also due to social
environment changes caused by the gathering of the large work force in the Mong Duong
precinct which causes all sort of problems including increased traffic, particularly in the early
morning and evening time, when a large contingent of the labor force for both projects enter the
work space
In order to limit the noise level at Residential areas, particularly at night time, the Contractor
shall be requested to keep heavy construction works to day times and limit vehicle movements
after 10PM to a minimum required.
Through 6 monitoring times during 2 days each in the period February to June 2013, the
monitoring results for vibration levels at two (2) locations during the period 6AM to 9PM are
lower than the limited value permitted in QCVN 27:2011/BTNMT – National Technical
Regulations on vibration.
No issues at present. Furthermore since heavy construction activities are almost entirely
implemented during day time, no vibrations are experienced at nighttime
Water quality
Water quality is monitored for underground water and coastal water and results are
Almost all tested items of underground water at the sampling sites are within the limits of
the National technical regulation on underground water quality QCVN09/2008/BTNMT
except for (Cd) and (Cl-) content and content of micro-organisms (Coliform)
Concentration of microorganisms (Coliform) beyond permissible limits of the National
technical regulation on underground water quality were found at the sampling points of
PW-01, PW-02, PW-03, PW-04, PW-05, PW-06, PW-08, PW-09. This is explained by
the fact that water in existing wells are not usually utilized thus the water is not rotated
and easy to create conditions for microbial growing.
Concentrations of chloride (Cl-) beyond permissible limits of the National technical
regulation on underground water quality were found at the sampling points of PW-03,
GW-01-D, GW-08, GW-09 and GW-11. This is explained by the fact that the sampling
sites are located in the coastal areas, thus may be lightly saline

1st Semi-annual Environmental Monitoring Report 2013
Mong Duong (2 x 500MW) Thermal Power Plant Project,
Page 7 of 68
Impact of obstacle removal activities in coastal surface water is monitored by coastal
surface water sampling sites. Parameters of them are all within limit in comparison with
QCVN 10: 2008/BTNMT
Impact of Mong Duong river alignment activities in coastal surface water is monitored by
coastal surface water sampling sites. Parameters of them are almost within the limit in
comparison with QCVN 08: 2008/BTNMT
Impact of transport activities in coastal surface water is monitored by coastal surface
water sampling sites. Parameters of them are within limit in comparison with QCVN 10:
2008/BTNMT
Two of the heavy water pollution sources are water discharged from coal mining areas
via the Mong Duong river and barges transporting coal in the nearby waterway. Spilled
coal from barges will dilute elements and compound to coastal waters.
In order to compensate for the two wells which were covered during the initial site fill activities,
the contractor should be requested to drill two additional wells with a depth of 25 to 30m to
ensure water quality sampling can be done at lower aquifers. Currently this is restricted to a
depth of 15m.
Contractor must maintain all current measures to avoid pollution of surface and underground
water resources by strict control on solid and liquid waste dumping and/or accidental spillage of
oil and chemicals.
To offset the problem of the polluted water discharge from coal mining activities, treatment of
discharged water from the coal mining process and a reduction in coal smuggling activity would
greatly improve the quality in the water way, but this may be difficult to achieve.
Aquaculture and Fisheries
Based on the results of the two surveys on fishing and aquaculture activities in Thac Thay, De
Dach and Mong Duong rivers and along the coastal line of Cam Hai commune during the first
half of 2013, it may be concluded that the construction phase of Mong Duong 1 power plant has
minor impacts on the aquatic resources in the inspected areas. There were no fishing activities in
De Dach and Mong Duong rivers due to heavy industrial pollution from mining and coal trading.
Number of aquatic species and their components in these areas are very limited. Some fishing
activities were observed in the Thac Thay river and Luong Gac areas, but there are no shrimp
activities along Cam Hai coastal line due to loss from shrimp diseases outbreak and flooding.
Normal fishing activities and aquaculture species are observed in the Thac Thay River and along
the coastal line of Cam Hai commune.
To reduce impacts of pollution from mining and coal trading, Contractor is strictly enforced to
execute the solid and liquid waste disposal management plan and prohibited dumping of
hazardous substances into nearby rivers and coastal water.
Mangrove Reforestation Program
To compensate for the loss of mangrove forest taken by the Mong Duong Project, 52ha of
mangrove has been re-planted in Dong Rui Commune, (Tien Yen district, Quang Ninh province)
Inspection result shows that mangrove quality develops well, branching off well, in the allocated
area of 52 ha of mangrove forest which was replanted, there is 95% survival rate of plants.
With the current results, the Mangrove planting project has met the requirement of ADB’s EIA.

1st Semi-annual Environmental Monitoring Report 2013
Mong Duong (2 x 500MW) Thermal Power Plant Project,
Page 8 of 68
To sustain the good results, continuous protection and feeding of the mangrove is a must to
ensure their good development and branching off. Activities such as tree clearing, weeding and
replanting of failed areas must also be maintained
Dumping of waste in mangrove and forestry areas and resource extraction from mangroves and
plantation forestry areas must be prohibited
Health & Safety and Environment
Monitoring consists of daily observation and inspections of environmental pollution, soil
contamination, fire hazards, labor and site safety and other health or safety hazards. This topic
does not belong to the monitoring scheme of the assigned environmental experts of the
Consultant, but is observed and monitored by the Owner’s Consultant Site supervision staff
during their daily work activities and by the Consultant’s Occupational Health and Safety expert.
Current results show
Good overall performance of the EPC contractor’s appointed HSE team with the
Environmental Officer (OE) appointed as per the Contractor’s EMP
Good site safety management of the EPC contractor with regards to fire safety, plant and
equipment safety, labor safety, worker training before and access gate checks before
entering Site.
No fatality and No Lost Time accident occurred until now with the accumulated total
man-hours of 5’200’000 as of July 2013
No serious soil issues happened at site until now besides some small oil spillages which
were treated immediately as per the Contractor’s EMP
Waste management follows the contractor’s EMP by separating waste into different
groups and collected and disposed as per the EMP requirements.
All required permits are in place ie. Permit To Work, Confined Space Entry Permits, Gas
Test Certificates etc.
First Aid service is available 24/7
In order to maintain the good standard the EPC contractor must strictly enforce the site safety,
warn offenders and in repeat cases dismiss them from site (some recent incidents shown in the
attached pictures need to be corrected)
Newly legislated and/or revised environmental laws must be carefully examined in order to
determine whether or not they are required to be implemented during the project execution
Contractor has to ensure at all times that it complies with the EIA and the requirements specified
in chapter VI of the ADB environmental assessment guidelines, 2003. Contractor should once
every 6 months organize exercises based on likely accident scenarios at site in which the
contractor’s assigned key site personnel assumes their emergency response roles and periodically
evaluate the efficiency of the Project EMP in place.
Social and Gender Aspects
Most current results show that both men and women are well informed of potential health and
safety risks: HIV/AIDS control and prevention activities for both camp workers and offices were
carried out by the EPC contractor to educate awareness on personal hygiene and sexually
transmitted diseases. Drug education for construction and office workers are implemented and
1st Semi-annual Environmental Monitoring Report 2013
Mong Duong (2 x 500MW) Thermal Power Plant Project,
Page 9 of 68
undergo test screenings every 6 months for early detection and manage health issues. Camp
workers and construction office workers are vaccinated and regularly checked for diseases by
healthcare provider taking care of construction workers and local villages.
A recent audit at one of the contractor’s labor camp (LLM 69.1) showed excellent results. The
rooms for women are in good condition and include bath room and toilet inside. Television and
Air conditioner are also provided. Water supply is from underground well treated by RO system
before using. Water is tested frequently for its safe use.
The condition of the site toilets is good with separate toilets available for both men and women.
Currently 76 toilets are provided at the Mong Duong 1 site for some 3’000 workers. They are
cleaned daily. As per the EPC contractor’s information the percentage of female workers is
approximately 15% split in field and office staff.
It is suggested that the Owner’s Consultant will continue to perform regular audits at the
contractor’s labor camps, especially with regards to gender issues, at the contractor’s offices and
at the construction site itself, to ensure the good standard regarding sanitary conditions is
maintained throughout the project construction phase.

1st Semi-annual Environmental Monitoring Report 2013
Mong Duong (2 x 500MW) Thermal Power Plant Project,
Page 10 of 68
1. INTRODUCTION
1.1 The project
The Government of Viet Nam has requested assistance from the Asian Development Bank
(ADB) to part finance the construction of the Mong Duong 1 Thermal Power Plant (under Loan
No.2350, and 2610). The Project is a coal-fired, thermal power electricity generation project with
a generation capacity of 1,000 MW. The overall project comprises of two power plants on the
same plot of land with an ultimate generation capacity of 2’200 MW. The Mong Duong 1 power
plant will comprise of two 500 MW generating units, and associated supporting infrastructure
whereas the Mong Duong 2 power plant built under a BOT scheme comprises of two 600 MW
generating units.
The MD1 project has been classified as category A1 in accordance with ADB’s Environmental
Assessment Guidelines (2003). The EMP was developed as an integral part of the Environmental
Impact Assessment (EIA) process of the Project that was completed in 2006.
The Mong Duong 2 power plant project is not part of this report, although it may contribute to
the overall impact on the environment as the two plants are back to back located on the same
piece of land.
1.2 Incorporation of Environmental Requirements into Project Contractual
Arrangements
To ensure that any possible negative environmental impacts are minimized and addressed
effectively, an environmental management plan (EMP) has been formulated detailing mitigation
measures and a monitoring program during various project phases. The individual monitoring
tasks and its frequencies are determined by the EIA and the approved staffing plan of the Project
Owner of the Consultant’s experts conducting the monitoring tasks together with EVN appointed
environmental monitoring agencies of Quang Ninh province
Key organizations in the implementation of the EMP and their corresponding responsibilities are
presented in Table 1
Table 1 Institutional Responsibilities for EMP Implementation (extended version)
EMP Responsibilities Mong Duong 1 Responsibility
- Submit Government EIA/EMP to MONRE
- Successfully implement EMP
- Provide funds for EMP implementation
EVN/GENCO3 (Project owner)
- Coordinate and manage overall project
implementation and operation including
guiding and supervision of EMP
implementation during pre-construction,
construction, and operation phases
- Manage and coordinate environmental
monitoring
- Coordinate with other parties in relation to
environmental management activities
- Supervise civil work contractor during
construction, including implementation of
environmental management activities under
EMP
TPMB1

1st Semi-annual Environmental Monitoring Report 2013
Mong Duong (2 x 500MW) Thermal Power Plant Project,
Page 11 of 68
EMP Responsibilities Mong Duong 1 Responsibility
- Manage EMP budget
- Integrate EMP specifications in contract
documents
- Prepare detailed design activities
incorporating relevant EMP requirements Detail design consultant
(PECC1)
- Implement environmental specifications
detailed in the construction contract Construction contractor
- Monitor EMP implementation during the
construction phase Environmental monitoring
consultant team
- Conduct periodic monitoring of compliance
to EIA/EMP provisions Quang Ninh DONRE
1.3 Project Implementation Progress
During the first half of 2013 of the construction phase of the Mong Duong 1 thermal power plant
project, construction activities increased commensurately with the ongoing progress of the
project.
Some of the main civil construction works carried out at the construction site during this period:
January 2013
Bored piles for the turbine building were completed.
Bored piles for the stack #1 were completed.
Bored piles for the cooling water pump house were completed
Foundation for boiler unit #1A/B area was completed
Structural steel erection commenced on boiler #1A
Tank erection commenced in water treatment area
February 2013
Pile head cutting for foundation of stack #1 was completed.
Foundation for stack #2 was completed.
Concrete pedestals and backfilling of boiler #1A/B area was completed.
Foundation for boiler #2A/B was completed.
Precast pile driving for fuel oil tank area was completed
CW supply pipeline excavation and installation commenced in block A
March 2013
Foundation for stack #1 was completed.
Foundation for waste water treatment plant area was completed.
Foundation for auxiliary boiler was completed.
Foundation for fuel oil tanks was completed
Precast pile driving for coal stock yard area was completed.
Precast pile driving for bottom ash silos #1A/B was completed.
Precast pile driving for condensate tanks #1/2 was completed.
Excavation work for ESP #1A/B was completed.
Structural steel erection commenced on boiler #1B

1st Semi-annual Environmental Monitoring Report 2013
Mong Duong (2 x 500MW) Thermal Power Plant Project,
Page 12 of 68
Electrical equipment installation commenced in 110/500kV switchyard
April 2013
Backfill work for stack #1 foundation was completed.
Backfill work for boiler #2 foundation was completed
Concrete walls for waste water treatment plant were completed
Backfill for fuel oil tanks #1/2 was completed.
Excavation work for ESP #2A/B was completed.
Backfill for auxiliary boiler foundation was completed.
May 2013
Pre-stressed anchor installation for CW intake walls was completed.
Bottom slab foundation for CW intake facility was completed.
Foundation and backfill work for ESP #2A/B was completed
Asphalt topping for Fuel oil tank #1 and #2 and Diesel oil tank was completed.
Precast pile driving for water treatment clarifiers was completed.
Precast pile driving for seal pits #1/2 was completed.
Precast pile driving for main transformer #1 was completed.
Structural steel erection commenced on boiler #2A
June 2013
Backfill for waste water treatment plant area was completed
Backfill for 100/500kV switch yard was completed
Excavation for C.W pipe line block A/B was completed
Foundation for main transformer #2 was completed
Excavation for main transformer #1 was completed
Excavation for fly ash silo #1/2 was completed
Excavation for limestone grinding house and limestone storage shed was completed
Construction of the cofferdam for the limestone unloading jetty was completed
Boiler pressure part erection commenced on boiler #1A
Equipment erection commenced for water treatment plant
July 2013
Precast pile driving for CHP/AHP /LHP was completed
Foundation and concrete pavement for coal stock yard buildings was completed
Turbine pedestal for STG#1 was completed
Foundation and backfill for fly ash silos #1/2 was completed
Structural works for administration building, common service building, central control
building and switchyard control building was completed
Foundation and backfill for water treatment building was completed
Foundation for Coal handling control building and coal crusher tower was completed
Backfill for CW supply pipelines in block A and C was completed
Structural works for fuel oil pump house and fire water pump house was completed
Stack #1 windshield construction was completed
Precast pile driving for fuel oil unloading pump house and jetty was completed.
Structural steel erection commenced on boiler #2B
1st Semi-annual Environmental Monitoring Report 2013
Mong Duong (2 x 500MW) Thermal Power Plant Project,
Page 13 of 68
1.4 Report Purpose
This report intends to describe the progress regarding implementation of the project EMP and
compliance issues and corrective actions for the first half of 2013 of the construction phase of
the Mong Duong 1 thermal power plant project.
The following environmental aspects were inspected for environmental compliance and
monitored for environmental quality:
Air, noise quality and vibration
Water quality
Health Safety and Environment (HES) aspects
Aquaculture and fisheries
Mangrove reforestation
2. ENVIRONMENT COMPLIANCE INSPECTIONS
2.1 Environment Compliance Inspections at the Construction Site
- Air quality impact:
Dust resulting from theremoval of vegetation and heavy earthmoving activities
The large number of construction equipment and heavy vehicles cause considerable dust
emissions
- Mitigation measures:
Spraying bare soil and heaps of excavation materials with water to minimize dust
generation during dry periods
Minimizing disturbance to vegetation and terrain features and providing cleared areas and
stockpiles with vegetative cover to serve as buffers between the Project and the
population
Fencing off construction areas to contain dust,
Covering trucks during transport of materials and impose speed limits
Avoid burning of domestic wastes
Contractors will be required to properly maintain equipment to minimize emissions
Ensuring the commitment of contractors and/or suppliers to undertake applicable
measures above
All trucks before leaving the construction site are required to clean the wheels
- Noise quality impact:
Noise impact and ground vibration during construction can disturb nearby communities
- Mitigation measures:
Construction schedules must optimize daytime working hours and scale down activities
at night.
Extensive earthmoving and movement of heavy equipment should be conducted only
during regular working hours

1st Semi-annual Environmental Monitoring Report 2013
Mong Duong (2 x 500MW) Thermal Power Plant Project,
Page 14 of 68
2.2 Health, Safety & Environment (HES) Aspects
The following Health & Safety and Environment (HES) aspects were inspected / monitored
during the reporting period for compliance
Site safety issues
Site waste disposal management
Pollutants Spillage
Worker Camp and Sanitation issues
Social impacts and Gender issues
Health aspects
2.2.1 Health, Safety & Environmental Management Plan (EMP)
The EPC contractor’s Environmental Management Plan (Rev B) was issued to the Project Owner
on 30th
Nov 2012 under Doc No. MD1-0-T-070-01-00021 and approved as such.
2.2.2 HSE Management Organization (EPC Contractor Hyundai E&C)
The EPC contractor’s HSE organization structure is in line with their own EMP (refer to
Appendix 2)
Safety Engineers/Officers have Certificate of OHS and show good working experience.
Contractor’s Environmental Officer (OE) is appointed as per the EMP and portrays
excellent knowledge of the environmental management system (EMS) and the applicable
approved environmental impact assessment report (EIA)
2.2.3 Total Man hours of the EPC Contractor and its Subcontractors
Table 2 shows the accident hours against cumulative total man-hours during the period of
January and June, 2013
Table 2 The accident hours against cumulative total man-hours during the period January to June, 2013
Description Total (Cumulative)
Month Jan 13 Feb 13 Mar 13 Apr 13 May 13 Jun 13
Cumulative
total man-
hours
1,451,680 1,884,010 2,870,610 3,577,400 4,318,720 5,115,410
This month
total man-
hours
346,830 432,430 637,130 706,790 741,330 796,690
Lost time
accidents
(LTA)
- - - - - -
Fatality - - - - - -
Non-injurious 1 4 5 5 5 5
1st Semi-annual Environmental Monitoring Report 2013
Mong Duong (2 x 500MW) Thermal Power Plant Project,
Page 15 of 68
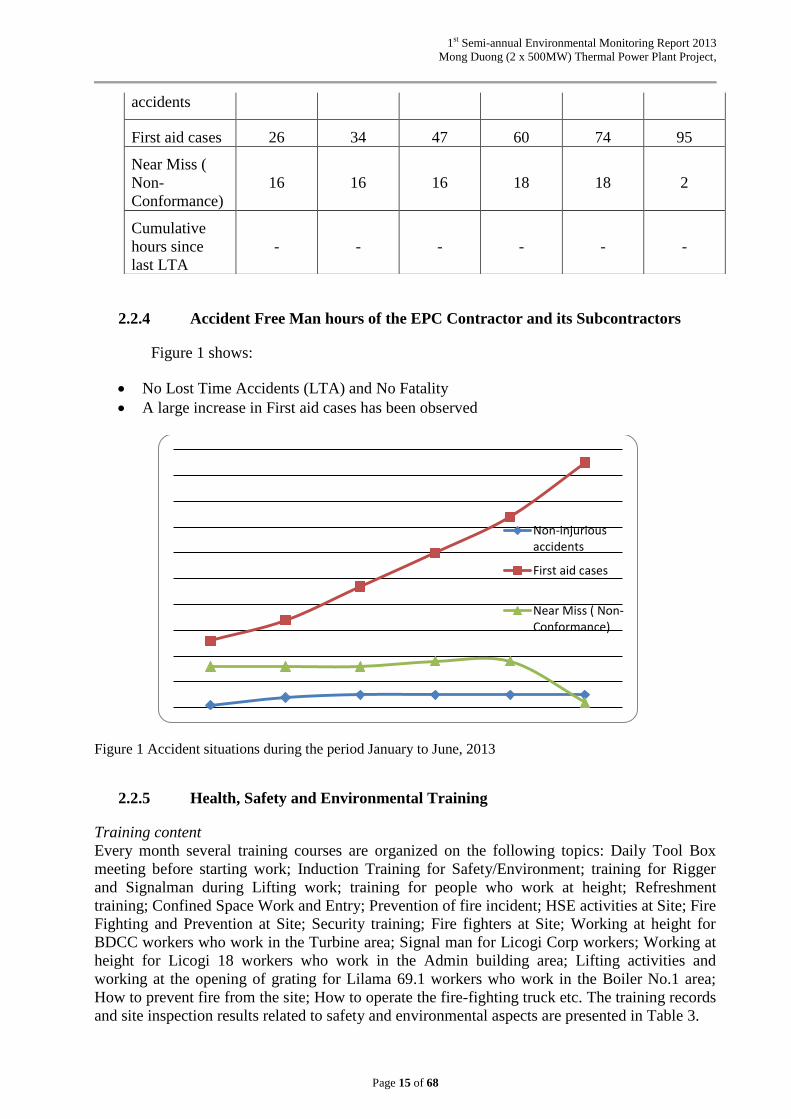
2.2.4 Accident Free Man hours of the EPC Contractor and its Subcontractors
Figure 1 shows:
No Lost Time Accidents (LTA) and No Fatality
A large increase in First aid cases has been observed
Figure 1 Accident situations during the period January to June, 2013
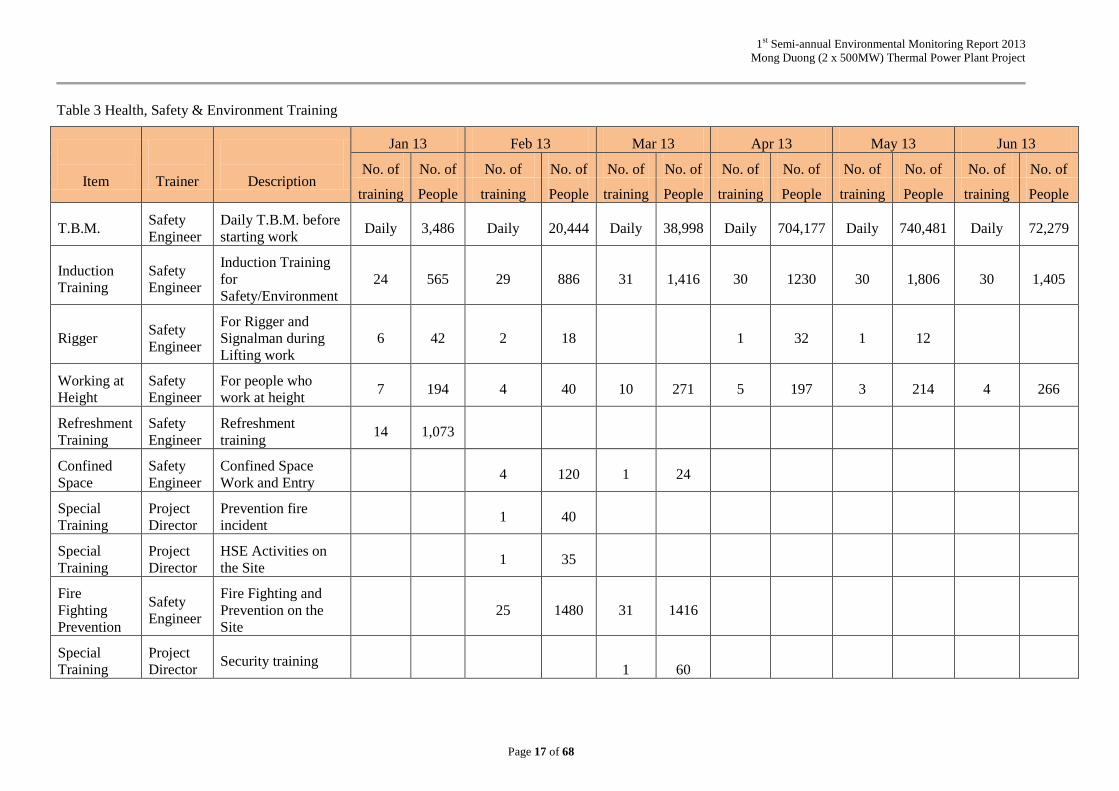
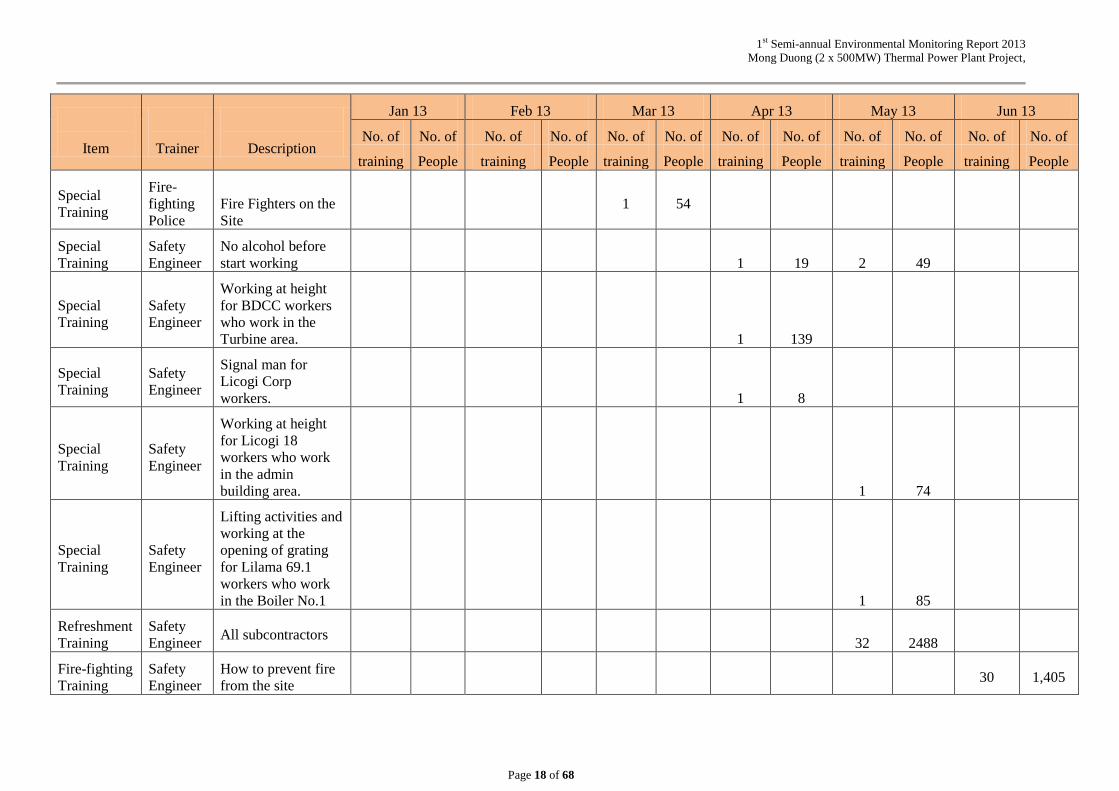
2.2.5 Health, Safety and Environmental Training
Training content
Every month several training courses are organized on the following topics: Daily Tool Box
meeting before starting work; Induction Training for Safety/Environment; training for Rigger
and Signalman during Lifting work; training for people who work at height; Refreshment
training; Confined Space Work and Entry; Prevention of fire incident; HSE activities at Site; Fire
Fighting and Prevention at Site; Security training; Fire fighters at Site; Working at height for
BDCC workers who work in the Turbine area; Signal man for Licogi Corp workers; Working at
height for Licogi 18 workers who work in the Admin building area; Lifting activities and
working at the opening of grating for Lilama 69.1 workers who work in the Boiler No.1 area;
How to prevent fire from the site; How to operate the fire-fighting truck etc. The training records
and site inspection results related to safety and environmental aspects are presented in Table 3.
Non-injuriousaccidents
First aid cases
Near Miss ( Non-Conformance)
accidents
First aid cases 26 34 47 60 74 95
Near Miss (
Non-
Conformance)
16 16 16 18 18 2
Cumulative
hours since
last LTA
- - - - - -

1st Semi-annual Environmental Monitoring Report 2013
Mong Duong (2 x 500MW) Thermal Power Plant Project,
Page 16 of 68
Training methodology
Power Point presentation for site safety training in both languages English and Vietnamese are
available and taught at Hyundai’s Site Safety office
All new employees/visitors need to pass the safety training before admission to site.
In case of an accident occurrence, involved persons are sent back to repeat training to
avoid incidents of similar nature
2.2.6 Health Check
All new employees are required to submit health certificate to the contractor at the time
of hiring
Regular health checks are conducted by Cam Pha hospital for contractors employees
1st Semi-annual Environmental Monitoring Report 2013
Mong Duong (2 x 500MW) Thermal Power Plant Project
Page 17 of 68
Table 3 Health, Safety & Environment Training
Item
Trainer
Description
Jan 13 Feb 13 Mar 13 Apr 13 May 13 Jun 13
No. of No. of No. of No. of No. of No. of No. of No. of No. of No. of No. of No. of
training People training People training People training People training People training People
T.B.M. Safety
Engineer
Daily T.B.M. before
starting work Daily 3,486 Daily 20,444 Daily 38,998 Daily 704,177 Daily 740,481 Daily 72,279
Induction
Training
Safety
Engineer
Induction Training
for
Safety/Environment
24 565 29 886 31 1,416 30 1230 30 1,806 30 1,405
Rigger Safety
Engineer
For Rigger and
Signalman during
Lifting work
6 42 2 18 1 32 1 12
Working at
Height
Safety
Engineer
For people who
work at height 7 194 4 40 10 271 5 197 3 214 4 266
Refreshment
Training
Safety
Engineer
Refreshment
training 14 1,073
Confined
Space
Safety
Engineer
Confined Space
Work and Entry 4 120 1 24
Special
Training
Project
Director
Prevention fire
incident 1 40
Special
Training
Project
Director
HSE Activities on
the Site 1 35
Fire
Fighting
Prevention
Safety
Engineer
Fire Fighting and
Prevention on the
Site
25 1480 31 1416
Special
Training
Project
Director Security training
1 60
1st Semi-annual Environmental Monitoring Report 2013
Mong Duong (2 x 500MW) Thermal Power Plant Project,
Page 18 of 68
Item
Trainer
Description
Jan 13 Feb 13 Mar 13 Apr 13 May 13 Jun 13
No. of No. of No. of No. of No. of No. of No. of No. of No. of No. of No. of No. of
training People training People training People training People training People training People
Special
Training
Fire-
fighting
Police
Fire Fighters on the
Site
1 54
Special
Training
Safety
Engineer
No alcohol before
start working 1 19 2 49
Special
Training
Safety
Engineer
Working at height
for BDCC workers
who work in the
Turbine area. 1 139
Special
Training
Safety
Engineer
Signal man for
Licogi Corp
workers. 1 8
Special
Training
Safety
Engineer
Working at height
for Licogi 18
workers who work
in the admin
building area. 1 74
Special
Training
Safety
Engineer
Lifting activities and
working at the
opening of grating
for Lilama 69.1
workers who work
in the Boiler No.1 1 85
Refreshment
Training
Safety
Engineer All subcontractors
32 2488
Fire-fighting
Training
Safety
Engineer
How to prevent fire
from the site 30 1,405

1st Semi-annual Environmental Monitoring Report 2013
Mong Duong (2 x 500MW) Thermal Power Plant Project,
Page 19 of 68
Item
Trainer
Description
Jan 13 Feb 13 Mar 13 Apr 13 May 13 Jun 13
No. of No. of No. of No. of No. of No. of No. of No. of No. of No. of No. of No. of
training People training People training People training People training People training People
Fire-fighting
Training
Safety
Office
How to operate fire-
fighting truck 1 14

1st Semi-annual Environmental Monitoring Report 2013
Mong Duong (2 x 500MW) Thermal Power Plant Project
Page 20 of 68
2.2.7 Health, Safety & Environment Inspection and Result
Current audit results show that both men and women are well informed of potential health and
safety risks: HIV/AIDS control and prevention activities for both camp workers and offices are
carried out by the EPC contractor to educate and promote awareness on personal hygiene and
sexually transmitted diseases. Moreover, drug education and awareness for construction worker
and office workers are implemented and have regular test screenings every 6 months to early
detect and manage health issues. Camp workers and construction office workers are vaccinated
and regularly checked for diseases by healthcare provider services taking care of construction
workers and local villages.
A recent audit at one of the contractor’s labor camp (LLM 69.1) showed good results. The rooms
for women are in good condition and include bath room and toilet inside. Television and Air
conditioner are also provided. Water supply is from underground well treated by RO system
before using. Water is tested frequently for its safe use.
The condition of the site toilets is good with separate toilets available for both men and women.
Currently 76 toilets are provided at site for 3’000 workers. They are cleaned daily. As per the
EPC contractor’s information the percentage of female workers is approximately 15% overall
split in field and office staff.
HDEC’s Health, Safety & Environment Inspection and Findings are presented in Table 4

1st Semi-annual Environmental Monitoring Report 2013
Mong Duong (2 x 500MW) Thermal Power Plant Project
Page 21 of 68
Table 4 Safety & Environment Inspections and Result
Location Jan 13 Feb 13 Mar 13 Apr 13 May 13 Jun 13 Description
STG Daily Daily Improper working at height such as scaffolding
Boiler Daily Daily Daily Daily Daily Daily Working at height, lifting activities,…
Switch Yard Daily Daily Improper access and no guardrails
Admin Building Daily Daily Daily Daily Daily Daily Working at height, scaffolding condition, access etc.
Intake Daily
Poor management of gas cylinder and instruction for use of a
trolley.
Whole area Weekly Weekly Weekly Weekly Weekly Visual inspection of all cranes.
Field Tank Daily Daily Daily Daily
Electric condition (welding and panel board), scaffolding
condition, confined space condition
STB Daily Daily Daily Daily Working at height, scaffolding condition, access etc.
Whole area Daily (Vehicle’s speed, emergency lighting etc)
Chimney Daily Daily Daily Checking slipform, working at height, lifting activities.
Main Pipe Rack Daily
One small truck of Licogi Corp. was fallen down into an
excavated trench while it was unloading soil
1st Semi-annual Environmental Monitoring Report 2013
Mong Duong (2 x 500MW) Thermal Power Plant Project
Page 22 of 68
2.2.8 Personal Protective Equipment (PPE)
All employees of the EPC contractor and all its subcontractors working, or anyone visiting the
work area, are required to wear hard hats (with exception of office, cafeteria, accommodation
and vehicles), safety shoes, high visibility vests and fluorescent gathers coverring the ankles
above the safety shoes. The use of safety harness is compulsory when working at heights greater
than 2 meters above ground. Safety harness to have double clip arrangement so the wearer is
always secure.
2.2.9 Security Status
EPC contractor has placed security guards 24/7 at all the access gates. (Main gate, CW
intake and material laydown area)
All gates implement inspections for workers and vehicles to prevent theft.
EPC contractor has prepared PPE for visitors at the main gate and check all workers and
vehicles if they have valid ID’s and/or vehicle cards
2.2.10 Social Aspects and Gender issues
This needs be reported regularly as a major concern for women and men throughout the
construction phase. The health issue of the labor force is one of the topics that requires close
monitoring as part of the health and safety management plan.
Current results show that both men and women are well informed of potential health and safety
risks: HIV/AIDS control and prevention activities for both camp workers and offices were carried
out by the EPC contractor to educate and promote awareness on personal hygiene and sexually
transmitted diseases. Moreover, drug education and awareness for construction worker and office
workers alike are implemented and have regular test screenings every 6 months to detect early
and manage health issues. Camp workers and construction office workers are vaccinated and
regularly checked for diseases by healthcare provider services taking care of construction
workers and local villages.
2.3 Conclusions and Recommendations
Conclusion
Good performance of the EPC contractor’s OHS.
Good site safety management of the EPC contractor in having all required permits in
place ie. Permit To Work, Confined Space Entry Permits, Gas Test Certificates etc.
Check list available for environmental performance monitoring program done weekly by
EPC contractor
First aid service available 24/7
Monthly and semi-annual reports issued to the Department of Labor Quang Ninh
province
A recent audit by Owner/ Consultant’s representative in the contractor’s labor camps and
the conditions of the toilet facilities at site are in good order and commensurate with the
regards to gender issues

1st Semi-annual Environmental Monitoring Report 2013
Mong Duong (2 x 500MW) Thermal Power Plant Project
Page 23 of 68
Recommendations
EPC contractor needs to submit environmental monitoring report to Project Owner on a
regular basis (monthly)
Newly legislated and/or revised environmental laws shall be examined carefully in order
to determine whether they are required to be implemented during the project execution
Contractor needs to comply with the EIA and the requirements specified in chapter VI of
the ADB environmental assessment guidelines, 2003.
Contractor needs to comply with all relevant local regulations to the project
Contractor shall once every 6 months organize exercises based on likely site accident
scenarios in which the key site personnel assigned to emergency cases shall show their
capabilities to attend such incidents in their leading roles.
Contractor shall periodically review and evaluate the efficiency of the Project EMP in
their working place
It is recommended to repeat these Audits at regular intervals throughout the project
construction phase as the labor quota will further increase over time

1st Semi-annual Environmental Monitoring Report 2013
Mong Duong (2 x 500MW) Thermal Power Plant Project
Page 24 of 68
3. ENVIRONMENTAL QUALITY MONITORING
3.1 Air quality, Noise and Vibration Monitoring
3.1.1 Monitoring of Air quality
The monitoring location, monitoring parameters, monitoring equipment and analyzed methods
for air quality monitoring are presented in Table 5.
Table 5 The monitoring location, monitoring parameters and monitoring equipment and analyzed methods
for air quality monitoring
Monitoring
Location
Monitoring
parameter
Equipment for
monitoring
Monitoring and
Analyzed Method
At two
residential
sites selected
in EMP.
Sampling and
analysis for:
+ TSP (1 hr
and 24 hrs)
+ PM10 (1 hr
and 24 hrs)
Compared to
QCVN
05:2009/BTN
MT – National
technical
Regulations on
Ambient Air
Quality.
+ Air Sampler
SL-20 –
SIBATA/Japan
+ Air Sampler
SL- 15P –
SIBATA/Japan
+ Air Sampler
MinivolTM
TAS –
Metrics/ USA
- Follow the validity Viet
Nam Standard for
environment in TCVN
5067:1995 – Air quality –
Weigh Method for
determination of
suspended dusts content.
Monitoring results of Air quality and analysis are presented in Table 6
Table 6 Monitoring results of TSP and PM10
Monitored Points
Results (unit: g/m3)
TSP 1hr
(17h00÷18h00)
TSP 24hr
PM10 1hr
(17h00÷ 18h00)
PM10 24hr
The 1st mobilization: from 4
th to 5
th Feb 2013:
KK1 272 195 107 76
KK2 226 173 88 67
The 2nd
mobilization: from 28th
to 1st of February 2013.
KK1 258 214 127 109

1st Semi-annual Environmental Monitoring Report 2013
Mong Duong (2 x 500MW) Thermal Power Plant Project
Page 25 of 68
Monitored Points
Results (unit: g/m3)
TSP 1hr
(17h00÷18h00)
TSP 24hr
PM10 1hr
(17h00÷ 18h00)
PM10 24hr
KK2 239 195 112 98
The 3rd
mobilization: from 22nd
to 23rd
of March 2013.
KK1 421 296 207 167
KK2 389 274 184 158
The 4th
mobilization: from 11th
to 12th
April 2013:
KK1 327 283 164 142
KK2 351 265 171 154
The 5th
mobilization: from 13th
to 14th
May 2013:
KK1 391 261 215 178
KK2 368 247 194 161
The 6th
mobilization: from 13th
to 14th
June 2013:
KK1 415 296 225 192
KK2 387 269 213 173
QCVN
05:2009/BTNMT
300 20
0
- 150
0
50
100
150
200
250
300
350
400
450
The 1st The 2nd The 3rd The 4th The 5th The 6th
KK1
KK2
0
50
100
150
200
250
300
350
The 1st The 2nd The 3rd The 4th The 5th The 6th
KK1
KK2
QCVN 05:2009/BTNMT QCVN 05:2009/BTNMT
TSP 1hr (17h00-18h00) TSP 24hr
µg/m3

1st Semi-annual Environmental Monitoring Report 2013
Mong Duong (2 x 500MW) Thermal Power Plant Project
Page 26 of 68
Graphic 1 Results of 6 monitoring times of air quality.
Assessment of the monitoring results:
Through 6 monitoring times during 2 days each in February (two times), March, April, May and
June 2013, the results show that:
The monitoring results for average 1 hr TSP at 2 monitoring points KK1 and KK2 in four
monitoring times (March, April, May and June) are higher than the limited value in
QCVN05:2009/BTNMT – National Technical Regulations on Ambient Air
Quality(higher than 1,09 – 1,93 times). Especially the 22th of March and 13th of June
monitoring times, the monitoring results for average 1 hr TSP at 2 monitoring points KK1
and KK2 are higher than the limited value in QCVN05:2009/BTNMT – National
Technical Regulations on Ambient Air Quality (higher than 1,29 – 1,4 times).
The monitoring results for average 24 hr TSP at 2 monitoring points KK1 and KK2 in all
four monitoring times (point KK1) and three mobilizations (point KK2) are higher than
the limited value in QCVN05:2009/BTNMT – National Technical Regulations on
Ambient Air Quality (higher than 1,135 – 1,71 times). Especially the 22th of March and
13th of June mobilization at monitoring point KK1, the monitoring results for average 24
hr TSP at 01 monitoring point KK1 are higher than the limited value (1,475 times).
The monitoring results for average 24 hr PM10 at monitoring points KK1 and KK2 in all
six monitoring times are approximations and higher than the limited value in
QCVN05:2009/BTNMT – National Technical Regulations on Ambient Air Quality
(higher than 0,975 – 1,48 times).
Comparison of monitoring results between KK1and KK2 shows that KK1 has higher
concentrations of air pollutants than those at KK2, because the population density at KK1
is higher than that at KK2.
The time that concentrations of average 1 hr TSP and average 1 hr PM10 at 2 monitoring
points reach maximum is the rush hour when traffic activities are the highest (17h00 ÷
18h00).
The weather in Mong Duong: During the first 6 monitoring times in 2013 because it`s
mostly sunny and hot ( especially in the four months: March, April, May and June), dry
roads, vehicles transport more, so the monitoring results for average TSP are high and
exceed the limits.
0
50
100
150
200
250
The 1st The 2nd The 3rd The 4th The 5th The 6th
KK1
KK2
0
50
100
150
200
250
The 1st The 2nd The 3rd The 4th The 5th The 6th
KK1
KK2
µg/m3
QCVN 05:2009/BTNMT
PM10 1hr (17h00-18h00) PM10 24hr

1st Semi-annual Environmental Monitoring Report 2013
Mong Duong (2 x 500MW) Thermal Power Plant Project
Page 27 of 68
3.1.2 Noise Monitoring
The monitoring location, monitoring parameters, monitoring equipment and analyzed methods
for noise monitoring are presented in Table 7
Table 7 The monitoring location, monitoring parameters and monitoring equipment and analyzed methods
for noise monitoring
Monitoring
Location
Monitoring
parameter
Equipment for
monitoring
Monitoring and Analytic
Method
At two
residential sites
selected in EMP.
Compared with
QCVN
26:2010/BTNMT
– National
technical
Regulations on
Noise.
+ At 01
construction site
where workers
are impacted
Equivalent
acoustic
level A,
LeqdBA.
Integrating-
Averaging
Sound level
meter, Type
6226 –
ACO/Japan.
Follow the Viet Nam
Standard for environment
TCVN 7878-1: 2008 (ISO
1996-1: 2003); TCVN
7878-2: 2010 (ISO 1996-
2: 2003).
Monitoring results for noise level at residential sites are presented in Table 8
Table 8 Monitoring results for Noise at Residential sites
Monitored Points Results LAeq (1h) (dBA)
7h – 8h 17h – 18h 22h – 23h
The 1st mobilization: from 4
th to 5
th Feb 2013:
KK1 68,1 71,6 67,4
KK2 62,9 61,5 56,2
The 2nd
mobilization: from 28th
of Feb to 1st of March, 2013:
KK1 70,7 71,5 65,1
KK2 61,6 63,1 57,3
The 3rd
mobilization: from 22nd
to 23rd
of March 2013:

1st Semi-annual Environmental Monitoring Report 2013
Mong Duong (2 x 500MW) Thermal Power Plant Project
Page 28 of 68
Monitored Points Results LAeq (1h) (dBA)
7h – 8h 17h – 18h 22h – 23h
KK1 71,5 72,6 64,7
KK2 62,4 65,8 59,5
The 4th
mobilization: from 11th
to 12th
April 2013:
KK1 68.2 71.7 62.1
KK2 57.3 62.7 49.9
The 5th
mobilization: from 13th
to 14th
May 2013:
KK1 68.9 70.8 63.2
KK2 59.3 58.7 51.3
The 6th
mobilization: from 13th
to 14th
June 2013:
KK1 68.5 71.5 64.6
KK2 62.3 61.7 55.8
QCVN
26:2010/BTNMT
70 70 55
Graphic 2 Result of 6 monitoring times of noise level at site
0
10
20
30
40
50
60
70
80
The 1st The 2nd The 3rd The 4th The 5th The 6th
KK1(7h-8h) KK2(7h-8h) KK1(17h-18h) KK2(17h-18h)
0
10
20
30
40
50
60
70
80
The 1st The 2nd The 3rd The 4th The 5th The 6th
KK1 KK2
QCVN 26:2010/BTNMT
QCVN 26:2010/BTNMT
LAeq 1hr (7h-8h) và (17h-18h) LAeq 1hr (22h-23h)
dBA

1st Semi-annual Environmental Monitoring Report 2013
Mong Duong (2 x 500MW) Thermal Power Plant Project
Page 29 of 68
The monitoring results for noise level at working sites are presented in Table 9.
Table 9 Monitoring result for noise at the working site
Monitored Points Results LAeq (1h) dB(A)
9h – 10h
The 1st mobilization: from 4
th to 5
th Feb 2013:
KK3 78,5
The 2nd
mobilization: from 28th
of Feb to 1st of March, 2013:
KK3 79,3
The 3rd
mobilization: from 22nd
to 23rd
of March 2013:
KK3 82,1
The 4th
mobilization: from 11th
to 12th
April 2013:
KK3 77,3
The 5th
mobilization: from 13th
to 14th
May 2013:
KK3 73,4
The 6th
mobilization: from 13th
to 14th
June 2013:
KK3 74,2
Graphic 3 Result of 6 monitoring times for noise at site
68
70
72
74
76
78
80
82
84
The 1st The 2nd The 3rd The 4th The 5th The 6th
dBA
LAeq 1hr (9h-10h)

1st Semi-annual Environmental Monitoring Report 2013
Mong Duong (2 x 500MW) Thermal Power Plant Project
Page 30 of 68
Assessment of Noise monitoring results:
Through 6 monitoring times during 2 days each in February (two times), March, April, May and
June 2013, the results show that:
The monitoring results for noise in the daytime of 7h - 8h and 17h - 18h during the period
of 6h - 21h at KK1 are approximate but higher than (about 0,7–2,6 dBA) the limited value
in QCVN 26:2010/BTNMT – National Technical Regulations on Noise; at KK2 are lower
than the limited value in QCVN 26:2010/BTNMT.
The monitoring results for noise in the nighttime of 22h – 23h during the period of 21h-
6h, at KK1, monitored point about 7m from the road are higher than (about 7,1-12,4 dBA)
the limited value in QCVN 26:2010/BTNMT – National Technical Regulations on Noise;
at KK2, monitored point about 20 m from the road, are higher than (about 0,8-4,5 dBA)
the limited value in QCVN 26:2010/BTNMT – National Technical Regulations on Noise.
Caused by transport activities increased on the old 18A road at night, such as: carrying
coal, materials when the weather in Mong Duong is sunny, hot and dry.
At the Working site:
Through 6 monitoring times during 2 days each in February (two times), March, April, May and
June 2013, the results show that:
The monitoring results for noise at the working site at all 6 monitoring times, the noise level
monitored in 1 hour at the turbine and boiler area is about 73,4 – 82,1 dB(A). If compared with
the allowable noise level for the working place, then they are lower than the limited value in
TCVN 3985:1999 (85 dB).
3.1.3 Vibration Monitoring
The monitoring location, monitoring parameters, monitoring equipment and analyzed methods
for vibration are presented in Table 10
Table 10 The monitoring location, monitoring parameters and monitoring equipment and analyzed
methods for Vibration monitoring
Monitoring Location Monitoring
parameter
Equipment for
monitoring
Monitoring and
Analyst Method
At two residential
sites selected in
EMP.
Vibration
Acceleration
(dB).
Compared with
QCVN
27:2010/BTNMT
– National
technical
Regulations on
Vibration.
Vibration meter
TYPE 3233 –
ACO/Japan.
Follow the validity
Viet Nam Standard
for environment in
TCVN 6963:2001
– Vibration and
shock – Vibration
emitted by
construction works
and factories –
Method of
measurement.
1st Semi-annual Environmental Monitoring Report 2013
Mong Duong (2 x 500MW) Thermal Power Plant Project
Page 31 of 68
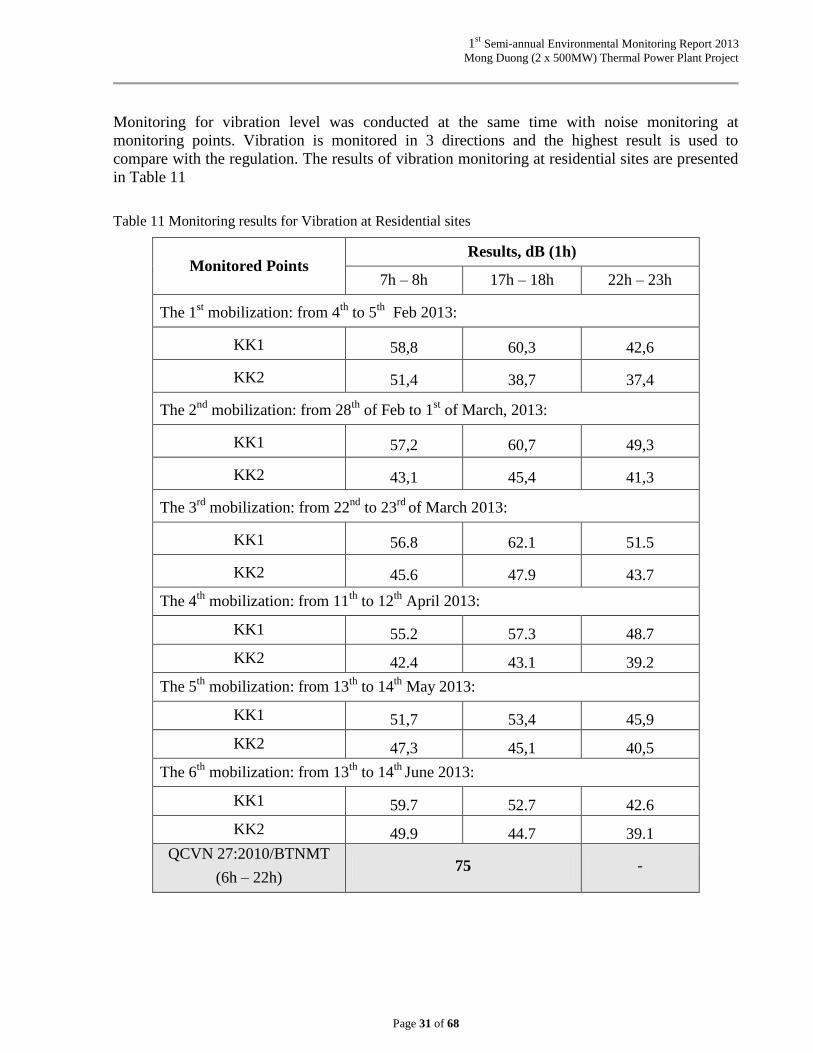
Monitoring for vibration level was conducted at the same time with noise monitoring at
monitoring points. Vibration is monitored in 3 directions and the highest result is used to
compare with the regulation. The results of vibration monitoring at residential sites are presented
in Table 11
Table 11 Monitoring results for Vibration at Residential sites
Monitored Points Results, dB (1h)
7h – 8h 17h – 18h 22h – 23h
The 1st mobilization: from 4
th to 5
th Feb 2013:
KK1 58,8 60,3 42,6
KK2 51,4 38,7 37,4
The 2nd
mobilization: from 28th
of Feb to 1st of March, 2013:
KK1 57,2 60,7 49,3
KK2 43,1 45,4 41,3
The 3rd
mobilization: from 22nd
to 23rd
of March 2013:
KK1 56.8 62.1 51.5
KK2 45.6 47.9 43.7
The 4th
mobilization: from 11th
to 12th
April 2013:
KK1 55.2 57.3 48.7
KK2 42.4 43.1 39.2
The 5th
mobilization: from 13th
to 14th
May 2013:
KK1 51,7 53,4 45,9
KK2 47,3 45,1 40,5
The 6th
mobilization: from 13th
to 14th
June 2013:
KK1 59.7 52.7 42.6
KK2 49.9 44.7 39.1
QCVN 27:2010/BTNMT
(6h – 22h) 75 -
1st Semi-annual Environmental Monitoring Report 2013
Mong Duong (2 x 500MW) Thermal Power Plant Project
Page 32 of 68
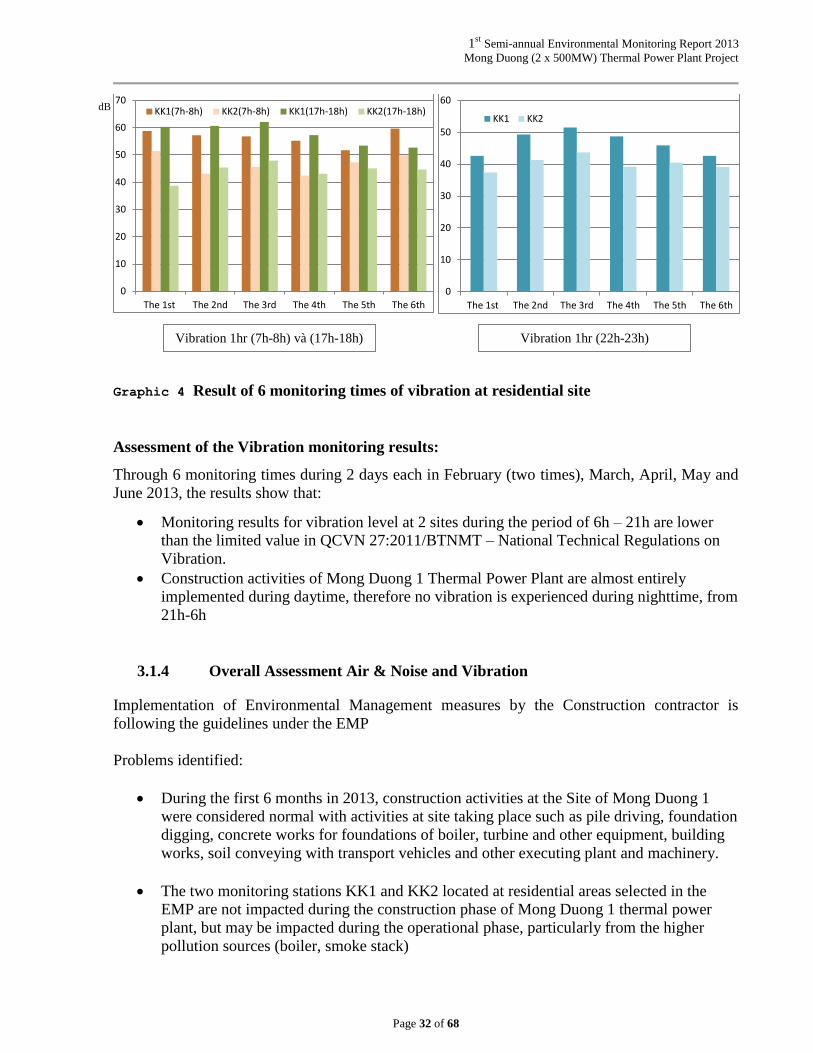
Graphic 4 Result of 6 monitoring times of vibration at residential site
Assessment of the Vibration monitoring results:
Through 6 monitoring times during 2 days each in February (two times), March, April, May and
June 2013, the results show that:
Monitoring results for vibration level at 2 sites during the period of 6h – 21h are lower
than the limited value in QCVN 27:2011/BTNMT – National Technical Regulations on
Vibration.
Construction activities of Mong Duong 1 Thermal Power Plant are almost entirely
implemented during daytime, therefore no vibration is experienced during nighttime, from
21h-6h
3.1.4 Overall Assessment Air & Noise and Vibration
Implementation of Environmental Management measures by the Construction contractor is
following the guidelines under the EMP
Problems identified:
During the first 6 months in 2013, construction activities at the Site of Mong Duong 1
were considered normal with activities at site taking place such as pile driving, foundation
digging, concrete works for foundations of boiler, turbine and other equipment, building
works, soil conveying with transport vehicles and other executing plant and machinery.
The two monitoring stations KK1 and KK2 located at residential areas selected in the
EMP are not impacted during the construction phase of Mong Duong 1 thermal power
plant, but may be impacted during the operational phase, particularly from the higher
pollution sources (boiler, smoke stack)
0
10
20
30
40
50
60
70
The 1st The 2nd The 3rd The 4th The 5th The 6th
KK1(7h-8h) KK2(7h-8h) KK1(17h-18h) KK2(17h-18h)
0
10
20
30
40
50
60
The 1st The 2nd The 3rd The 4th The 5th The 6th
KK1 KK2
Vibration 1hr (7h-8h) và (17h-18h) Vibration 1hr (22h-23h)
dB

1st Semi-annual Environmental Monitoring Report 2013
Mong Duong (2 x 500MW) Thermal Power Plant Project
Page 33 of 68
Air pollution sources (mainly dust) to the dense residential areas of Mong Duong Ward,
which is near the two sides of the old no.18A road are mainly caused by transport
activities (carrying coal, materials, car, motorcycles…); sorting out coal plant (near KK2),
coal discharge area (especially when the wind blows from south-east direction)
Air pollution (dust and other pollution) is also increasing on the new no.18 road due to
increased transport activities over the 6 months
Comparing monitoring results (dust) between the last 6 months of 2012 and the first 6
months of construction phase in 2013 shows that the first 6 months of 2013 has higher
concentrations of air pollutants than the 6 months before. Especially in the 3 months
(April, May and June) in 2013) when the weather was dry and hot.
3.2 Water Quality Monitoring
3.2.1 Monitoring parameters and procedures
Monitoring parameters
Ambient surface water: Temperature, pH, TSS, DO, COD, BOD5, Cl-, NH4+, heavy
metal (As, Cr, Cd, Cu, Pb, Zn, Ni, Hg, Fe, Mn, Se), oil and grease, Coliform, T-N, T-P.
Underground water: Temperature, pH, TSS, COD, Cl-, NH4+, NO3-, SO42-, heavy
metals (As, Cr, Cd, Cu, Pb, Zn, Ni, Hg, Fe, Mn, Se), VOC, SVOC, TPH, oil and grease
and Coliform
Monitoring procedure
Collecting information relating to the project.
Investigating scene and monitoring.
Analyzing in laboratory
Summarize and handle analytical data.
Assessing monitoring results.
Promoting treatment measures to minimize water environment pollutant
Preparing report of water environment condition

1st Semi-annual Environmental Monitoring Report 2013
Mong Duong (2 x 500MW) Thermal Power Plant Project
Page 34 of 68
The Water quality environmental monitoring procedure are presented in Figure 2
Figure 2 Water quality environmental monitoring procedure
3.2.2 Inspection Activities
Water quality monitoring sites
The monitoring site and co-ordinates of sensitive sites are shown in Figure 3
Water Environment
monitoring
Measure at site
Synthesize and handle
data
Promote treatment measures to
minimize pollutant.
Assess monitoring results
Sampling, analyzing in
laboratory
Preparing the report

1st Semi-annual Environmental Monitoring Report 2013
Mong Duong (2 x 500MW) Thermal Power Plant Project
Page 35 of 68
Figure 3 Water quality monitoring site
Environmental condition at monitoring time
No rain
No significant even at coastal water sampling time
No significant even at underground water sampling time
Drilling well no. 1, 2, 3, 4, 6, 8 were covered at sampling time
3.2.3 Monitoring results and assessment
A. Surface water quality
Water samples were collected from surface water bodies at the project site and its surrounding
area to establish the baseline database for the surface water quality. Eight water samples were
collected at selected locations. The locations of surface water sampling are shown in Figure 3.
The coordinates of the surface water samples are shown in Table 4.8
Figure 4 The coordinates of surface water samples
No. Item Co-ordinate
Description X Y
Surface water
1 SW-01 107021’00 E 21
004’10 N
2 SW-02 107021’01 E 21
004’29 N
3 SW-03a 107021’08 E 21
004’08 N
4 SW-06 107021’25 E 21
005’12 N
5 SW-07 107021’47 E 21
005’04 N
6 MD-1 107020.170 E 21
003.800 N
7 DD-1 107020.934 E 21
004.273 N
1st Semi-annual Environmental Monitoring Report 2013
Mong Duong (2 x 500MW) Thermal Power Plant Project
Page 36 of 68
No. Item Co-ordinate
Description X Y
8 DD-4 107022.013 E 21
005.147 N
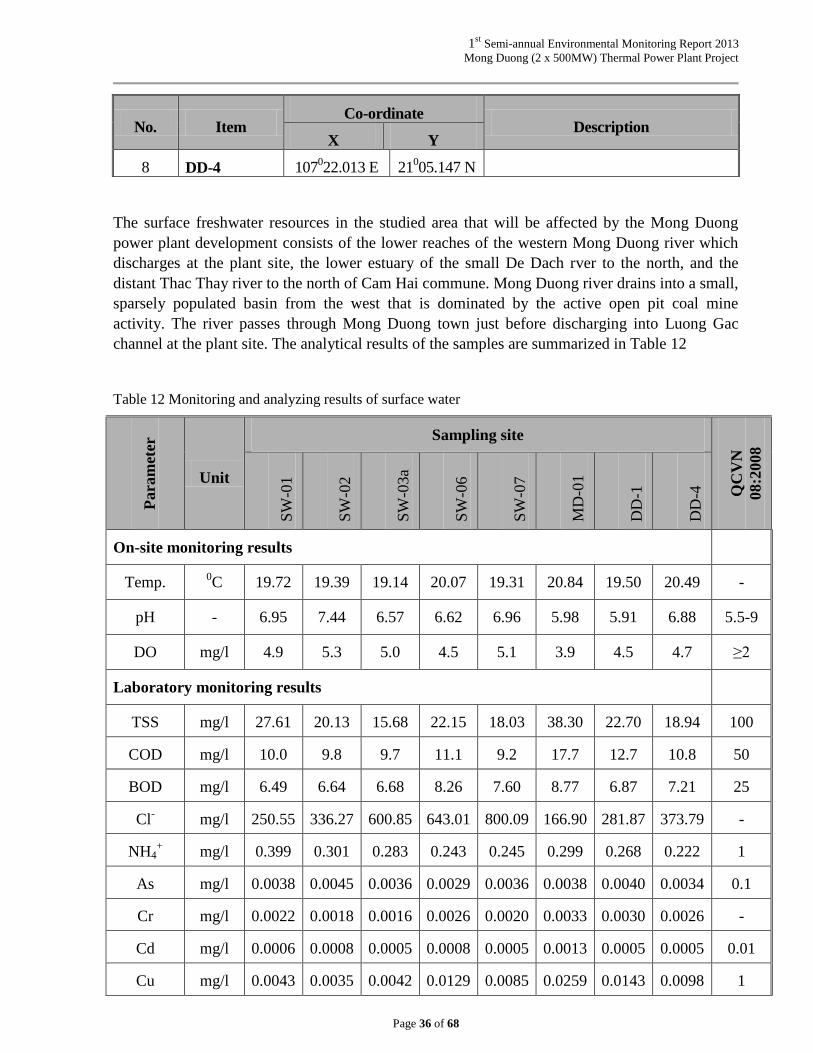
The surface freshwater resources in the studied area that will be affected by the Mong Duong
power plant development consists of the lower reaches of the western Mong Duong river which
discharges at the plant site, the lower estuary of the small De Dach rver to the north, and the
distant Thac Thay river to the north of Cam Hai commune. Mong Duong river drains into a small,
sparsely populated basin from the west that is dominated by the active open pit coal mine
activity. The river passes through Mong Duong town just before discharging into Luong Gac
channel at the plant site. The analytical results of the samples are summarized in Table 12
Table 12 Monitoring and analyzing results of surface water
Para
met
er
Unit
Sampling site
QC
VN
08:2
008
BT
NM
T
(B
2)
SW
-01
SW
-02
SW
-03a
SW
-06
SW
-07
MD
-01
DD
-1
DD
-4
On-site monitoring results
Temp. 0C 19.72 19.39 19.14 20.07 19.31 20.84 19.50 20.49 -
pH - 6.95 7.44 6.57 6.62 6.96 5.98 5.91 6.88 5.5-9
DO mg/l 4.9 5.3 5.0 4.5 5.1 3.9 4.5 4.7 ≥2
Laboratory monitoring results
TSS mg/l 27.61 20.13 15.68 22.15 18.03 38.30 22.70 18.94 100
COD mg/l 10.0 9.8 9.7 11.1 9.2 17.7 12.7 10.8 50
BOD mg/l 6.49 6.64 6.68 8.26 7.60 8.77 6.87 7.21 25
Cl- mg/l 250.55 336.27 600.85 643.01 800.09 166.90 281.87 373.79 -
NH4+ mg/l 0.399 0.301 0.283 0.243 0.245 0.299 0.268 0.222 1
As mg/l 0.0038 0.0045 0.0036 0.0029 0.0036 0.0038 0.0040 0.0034 0.1
Cr mg/l 0.0022 0.0018 0.0016 0.0026 0.0020 0.0033 0.0030 0.0026 -
Cd mg/l 0.0006 0.0008 0.0005 0.0008 0.0005 0.0013 0.0005 0.0005 0.01
Cu mg/l 0.0043 0.0035 0.0042 0.0129 0.0085 0.0259 0.0143 0.0098 1

1st Semi-annual Environmental Monitoring Report 2013
Mong Duong (2 x 500MW) Thermal Power Plant Project
Page 37 of 68
Para
met
er
Unit
Sampling site
QC
VN
08:2
008
BT
NM
T
(B
2)
SW
-01
SW
-02
SW
-03a
SW
-06
SW
-07
MD
-01
DD
-1
DD
-4
Pb mg/l 0.0070 0.0068 0.0060 0.0073 0.0066 0.0080 0.0067 0.0051 0.05
Zn mg/l 0.0564 0.0506 0.0376 0.0548 0.0616 0.0710 0.0656 0.0591 2
Ni mg/l 0.0029 0.0023 0.0018 0.0019 0.0016 0.0028 0.0023 0.0015 0,1
Hg mg/l 0.0009 0.0006 0.0005 0.0013 0.0010 0.0015 0.0010 0.0007 0,002
Fe mg/l 0.8953 0.7600 0.4977 0.6566 0.5999 1.6098 0.7742 0.5789 2
Mn mg/l 0.2518 0.2217 0.1509 0.2565 0.1912 0.6281 0.3304 0.1584 -
Se mg/l 0.0010 0.0006 0.0007 0.0005 0.0071 0.0006 0.0007 0.0004 -
Oil and
Grease mg/l 0.276 0.136 0.050 0.146 0.100 0.269 0.163 0.090 0.3
Coliform
MPN/
100ml 559 468 592 704 593 851 693 584 10000
T-N mg/l 0.005 0.003 0.007 0.007 0.005 0.009 0.009 0.008 -
T-P mg/l 1.60 0.82 0.53 2.13 0.21 3.20 1.73 1.31 -
According to the analytical results for collected surface water samples all heavy metals, oils, total
suspended solids, ammonia, chloride, coliform, nitrogen and phosphor are lower than QCVN
08:2008/BTNMT, category B2– Water for Transport and other purposes with the requirements of low water
quality
B. Coastal water quality
The Mong Duong thermal power plant is situated in north western Bai Tu Long in northern
Vietnam. The coastal zone in this area is typical of Vietnam, being dominated by vast sandy
sediment deposits that extend from well above the high water mark to beyond 5km offshore.
Coastal water samples were collected from the following four zones that potentially would be
affected in different ways by the power plant development: (i) Near shore area of Cam Hai
commune; (ii) at the Ash pond; (iii) in the Van Don district (island group) far away about 1km
East of the project site and (vi) Luong Gac channel from Cam Hai commune south to Cua Ong.
At the three points (LG-1; LG-3; LG-4) for impact assessment of transportation activities to
coastal water environment, eight (8) coastal water samples were collected at selected locations.
1st Semi-annual Environmental Monitoring Report 2013
Mong Duong (2 x 500MW) Thermal Power Plant Project
Page 38 of 68
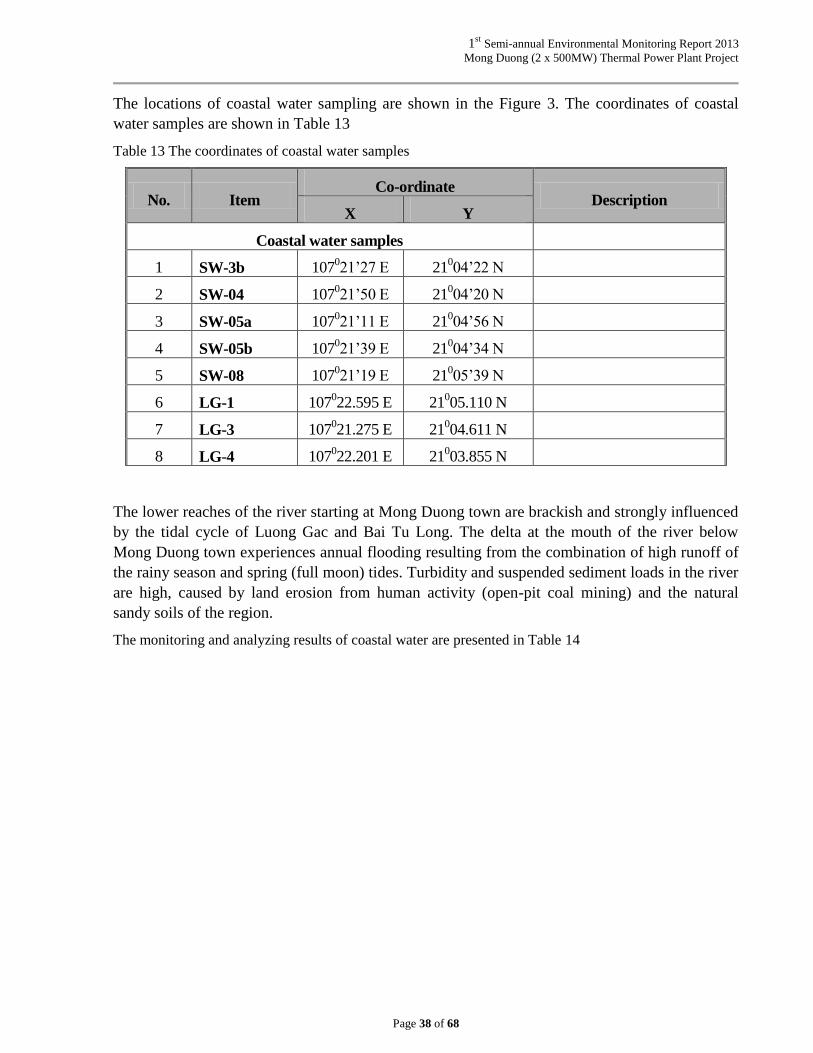
The locations of coastal water sampling are shown in the Figure 3. The coordinates of coastal
water samples are shown in Table 13
Table 13 The coordinates of coastal water samples
No. Item Co-ordinate
Description X Y
Coastal water samples
1 SW-3b 107021’27 E 21
004’22 N
2 SW-04 107021’50 E 21
004’20 N
3 SW-05a 107021’11 E 21
004’56 N
4 SW-05b 107021’39 E 21
004’34 N
5 SW-08 107021’19 E 21
005’39 N
6 LG-1 107022.595 E 21
005.110 N
7 LG-3 107021.275 E 21
004.611 N
8 LG-4 107022.201 E 21
003.855 N
The lower reaches of the river starting at Mong Duong town are brackish and strongly influenced
by the tidal cycle of Luong Gac and Bai Tu Long. The delta at the mouth of the river below
Mong Duong town experiences annual flooding resulting from the combination of high runoff of
the rainy season and spring (full moon) tides. Turbidity and suspended sediment loads in the river
are high, caused by land erosion from human activity (open-pit coal mining) and the natural
sandy soils of the region.
The monitoring and analyzing results of coastal water are presented in Table 14

1st Semi-annual Environmental Monitoring Report 2013
Mong Duong (2 x 500MW) Thermal Power Plant Project
Page 39 of 68
Table 14 Monitoring and analyzing results of coastal water
No.
Para
met
er
Unit
Sampling site
QC
VN
10:2
008/
BT
NM
T
(Oth
er)
SW
-3b
SW
-04
SW
-05a
SW
-05b
SW
-08
LG
-1
LG
-3
LG
-4
On-site monitoring result
1. Temp. 0C 18.68 18.71 18.57 18.99 18.42 18.12 18.56 18.85 -
2. pH - 8.43 8.10 7.86 8.28 8.10 8.22 8.21 8.10 6.5-8.5
3. DO mg/l 5.5 5.5 5.1 5.5 5.9 5.6 6.4 5.7 -
Laboratory result assessment of coastal water
4. TSS mg/l 9.76 9.54 10.70 10.08 8.07 9.03 7.92 12.41 -
5. COD mg/l 8.3 7.8 8.6 9.4 6.6 8.2 8.2 8.9 -
6. BOD mg/l 5.32 5.29 6.70 6.34 4.21 5.78 6.85 6.55 -
7. Cl- mg/l 1159.46 1222.21 1260.98 12117.84 1269.28 1218.26 1205.92 1216.97 -
8. NH4+ mg/l 0.213 0.196 0.179 0.168 0.182 0.157 0.152 0.176 0.5
9. As mg/l 0.0031 0.0031 0.0034 0.0036 0.0034 0.0039 0.0042 0.0028 0.05
10. Cr mg/l 0.0022 0.0018 0.0020 0.0013 0.0019 0.0024 0.0018 0.0014 -
11. Cd mg/l 0.0005 0.0006 0.0003 0.0006 0.0004 0.0004 0.0004 0.0004 0.005

1st Semi-annual Environmental Monitoring Report 2013
Mong Duong (2 x 500MW) Thermal Power Plant Project
Page 40 of 68
No.
Para
met
er
Unit
Sampling site
QC
VN
10:2
008/
BT
NM
T
(Oth
er)
SW
-3b
SW
-04
SW
-05a
SW
-05b
SW
-08
LG
-1
LG
-3
LG
-4
12. Cu mg/l 0.0039 0.0046 0.0032 0.0029 0.0045 0.0052 0.0043 0.0044 1
13. Pb mg/l 0.0060 0.0056 0.0053 0.0047 0.0064 0.0055 0.0050 0.0066 0.1
14. Zn mg/l 0.0398 0.0504 0.0374 0.0340 0.0435 0.0363 0.0472 0.0402 2
15. Ni mg/l 0.0017 ND 0.0013 ND ND ND ND ND -
16. Hg mg/l 0.0006 0.0004 0.0009 0.0012 0.0006 0.0005 0.0007 0.0003 0.005
17. Fe mg/l 0.0427 0.0397 0.0356 0.0370 0.0325 0.0464 0.0504 0.0403 0.3
18. Mn mg/l 0.1656 0.0919 0.0788 0.0653 0.0536 0.0246 0.0207 0.0240 0.1
19. Se mg/l 0.0004 0.0007 0.0008 0.0004 ND ND ND ND -
20. Oil and
Grease mg/l 0.056 0.048 0.060 0.040 0.010 0.050 0.060 0.035 0.2
21.
Coliform
MPN
/100ml 410 410 377 360 411 332 375 550 1000
22. T-N mg/l 0.002 0.003 0.004 0.006 0.003 0.005 0.011 0.004 -
23. T-P mg/l 0.40 0.62 0.31 0.23 0.03 0.07 0.10 0.93 -

1st Semi-annual Environmental Monitoring Report 2013
Mong Duong (2 x 500MW) Thermal Power Plant Project
Page 41 of 68
Recorded Mn concentrations at SW-3b exceed the QCVN standard for other uses. The indicators
of organic pollution of BOD show relatively clean conditions, which are consistent with the
sparsely populated basin. The presence of coliform in coastal water indicates the presence of
nearby Mong Duong town. The presence of oil reflects the observed heavy small-boat traffic in
the river. Heavy metal concentrations meet Vietnamese standards.
C. Underground water quality at Existing wells
Nine (9) groundwater samples from existing wells were collected at Cam Y, Cam Hai,
Van Don, Mong Duong. The locations of underground sampling points at existing wells are
shown in the Figure 3. The coordinates of the groundwater sampling points are shown more
detail in table15
Table 15 The coordinates of underground water (Existing wells) samples
No. Item Co-ordinate
Description X Y
Underground water (Existing wells)
1 PW-1 107o21’00E 21º05’03N
Mr Tan (replaced by Mrs Nguyen
Thi Muon), group 148, Cam Y
2 PW-2 107o20’59E 21º05’05N
Mr Phung Van Goong, Group 146,
Area 8
3 PW-3 107o20’19E 21º04’33N
Mr Ngo Van Tan, Group 146, Area
8
4 PW-4 107o19’28E 21º03’50N
Mr Pha (replaced by Mr Le Van
Cung) Group 17, Mong Duong Dist.
5 PW-5 107o23’58E 21º04’31N
Mr Tu Van Hiep, Trang Huong,
Doan Ket, Van Don.
6 PW-6 107o23’25E 21º03’54N
Mr Diep Van Son, Trang Huong,
Doan Ket, Van Don.
7 PW-7 107o20’52E 21º03’40N
Tran Van Bao (Group 3, Area I),
replaced by Nguyen Thi Thuy
Group 204 Area 11, Mong Duong
Dist.
8 PW-8 107o19’26E 21º03’59N
Mrs. Nguyen Thi Nhuy, Group 108,
Area 6, Mong Duong Dist.
9 PW-9 107o22’02E 21º05’30N
Mr Khong Minh Hoi, Hamlet 4,
Cam Hai. Dist.
Based on the analytical results, detected contaminants exceeding the referenced standards are
indicated in Table 16

1st Semi-annual Environmental Monitoring Report 2013
Mong Duong (2 x 500MW) Thermal Power Plant Project
Page 42 of 68
Table 16 Monitoring and analyzing results of underground water (Existing wells)
No
Para
met
er
Unit
Sampling site
QC
VN
09
PW
-01
PW
-02
PW
-03
PW
-04
PW
-05
PW
-06
PW
-07
PW
-08
PW
-09
On-site monitoring result
1. Temp. 0C 24.6 25.9 25.3 24.6 23 25.3 23.7 23,4 26,3 -
2. pH - 6.82 6.73 6.37 6.63 5.97 5.86 5.82 6,61 6,58 5,5-8,5
Laboratory result assessment of underground water (existing wells)
3. TSS mg/l 3.21 3.89 4.34 2.90 2.46 2.92 5.60 3,36 4,29 -
4. COD mg/l 4.5 3.9 3.8 4.8 4.3 4.6 4.5 5,6 4,7 4
5. Cl- mg/l 236.22 85.75 439.76 430.72 86.18 87.06 268.10 207,89 416,27 250
6. NH4+ mg/l 0.054 0.099 0.075 0.164 0.042 0.034 0.076 0,084 0,065 0,1
7. NO3- mg/l 0.14 0.16 0.09 0.10 0.07 0.08 0.05 0,10 0,04 15
8.
SO42-
mg/l ND ND 137.691 98.901 46.053 42.834
135.80
9 101,648
231,74
8 400
9. As mg/l 0.0044 0.0038 0.0071 0.0080 0.0036 0.0051 0.0065 0,0057 0,0041 0,05
10. Cr mg/l 0.0024 0.0022 0.0033 0.0035 0.0017 0.0025 0.0020 0,0029 0,0033 -
11. Cd mg/l 0.0028 0.0024 0.0023 0.0035 0.0031 0.0038 0.0036 0,0035 0,0025 0,005
12. Cu mg/l 0.0408 0.0502 0.0303 0.0468 0.0330 0.0417 0.0472 0,0580 0,0639 1
13. Pb mg/l 0.0065 0.0072 0.0058 0.0044 0.0059 0.0067 0.0062 0,0056 0,0043 0,01
14. Zn mg/l 0.0090 0.0084 0.0134 0.0082 0.0071 0.0028 0.0445 0,0833 0,0926 3
15. Ni mg/l 0.0032 0.0036 0.0033 0.0039 0.0034 0.0023 0.0029 0,0019 0,0042 -
16. Hg mg/l 0.0007 0.0010 0.0005 0.0005 0.0007 0.0005 0.0005 ND 0,0005 0,001
17. Fe mg/l 0.0050 0.0055 0.0068 0.0042 0.0056 0.0065 0.0056 0,0044 0,0040 5
18. Mn mg/l 0.0073 0.0020 0.0064 0.0106 0.0031 0.0031 0.0078 0,0095 0,0036 0,5
19. Se mg/l 0.0007 0.0006 0.0008 0.0007 0.0005 0.0010 0.0008 ND 0,0006 0,01

1st Semi-annual Environmental Monitoring Report 2013
Mong Duong (2 x 500MW) Thermal Power Plant Project
Page 43 of 68
No
Para
met
er
Unit
Sampling site
QC
VN
09
PW
-01
PW
-02
PW
-03
PW
-04
PW
-05
PW
-06
PW
-07
PW
-08
PW
-09
20. Clorof
orm μg/l ND ND ND ND ND ND ND ND ND -
21. Phenol μg/l ND ND ND ND ND ND ND ND ND -
22. Fluore
nce μg/l ND ND ND ND ND ND ND ND ND
23. TPH mg/l ND ND ND ND ND ND ND ND ND -
24. Oil
and
Grease mg/l 0.004 0.006 0.007 0.010 0.004 0.003 0.007 0,008 0,004 -
25.
Colifor
m
MPN/1
00ml 20 527 130 926 10 13 1109 13 15 3
Results of the groundwater sampling as in Table 16 show that:
COD concentration in most sampling points were relatively higher than the reference
standard
Cl- was relatively high in PW-03, PW-04, PW-07, PW-09 with concentration above the
reference standard QCVN09
NH4+ was detected higher than the reference standard at PW-04
Coliform at most stations were measured at levels above the reference standard
QCVN09:2008
D. Underground water quality in water of drilled Wells
The groundwater monitoring locations at the construction site of the MD1-TPP have been
backfilled during the process of ground backfill and leveling. The average backfilled depth from
the well’s bottom to ground surface is now in the range of 11,0 – 35,0 m. These wells have been
constructed and designed for monitoring the ground water quality inside the MD1-TPP’s
boundary following the EIA of ADB.
Eleven underground water samples of drilled wells were collected at the selected locations. The
locations of coastal water sampling are shown in the Figure 3. The coordinates of coastal water
samples are shown in Table 17.

1st Semi-annual Environmental Monitoring Report 2013
Mong Duong (2 x 500MW) Thermal Power Plant Project
Page 44 of 68
Table 17 The coordinates of underground water (Drilled wells) samples
No. Item Co-ordinate Description
Underground water (Drilled wells) Depth (m)
1 GW – 01 – D 107o20’36E 21º04’36N 33.66
2 GW – 02 107o20’36E 21º04’43N 16.16
3 GW – 03 – D 107º20’45E 21º04’45N 35.33
4 GW – 04 107º20’54E 21º04’46N 13.63
5 GW – 05 107º21’18E 21º04’43N 15.88
6 GW – 06 107º21’19E 21º04’54N 22.00
7 GW – 07 – D 107º21’29E 21º05’12N 30.00
8 GW – 08 107º21’48E 21º04’48N 18.00
9 GW – 09 107º22’06E 21º04’35N 10.00
10 GW – 10 – D 107º22’10E 21º04’11N 30.00
11 GW – 11 107º22’04E 21º04’27N 11.00
It noted that that during the survey time at the construction site in March, 2013, two of the
underground water wells GW-08 and GW-06 have been filled by sand due to filling internal road
for slag dump area. To solve this problem, the Contractor has drilled new wells but the depth is
only 9m, so the Contractor should be requested to drill new wells to the depth of 22m and 18m as
shown in Table 17.
The monitoring and analyzing results of underground water (Drilled wells) are presented in Table
18

1st Semi-annual Environmental Monitoring Report 2013
Mong Duong (2 x 500MW) Thermal Power Plant Project
Page 45 of 68
Table 18 Monitoring and analyzing results of underground water (Drilled wells)
No.
Para
met
er
Unit
Sampling site
QC
VN
09
GW
-01-D
GW
-02
GW
-03-D
GW
-04
GW
-05
GW
-06
GW
-07-D
GW
-08
GW
- 09
GW
-10-D
GW
- 11
On-site monitoring results
1. Temp. 0C - - - - 20.20 - 20.20 - 20.01 20,21 20,01 -
2. pH - - - - - 7.39 - 7.21 - 6.60 8,14 7,37 5,5-8,5
Laboratory result assessment of underground water (drilled wells)
TSS mg/l - - - - 2.08 - 3.17 - 2.11 2,04 1,56 -
3. COD mg/l - - - - 2.7 - 4.2 - 3.0 2,7 2,4 4
4. Cl- mg/l - - - - 422.79 - 840.75 - 7829.50 4073,17 4031,15 250
5. NH4+ mg/l - - - - 0.066 - 0.074 - 0.051 0,061 0,037 0,1
6. NO3- mg/l - - - - 0.62 - 0.93 - 0.32 0,15 0,12 15
7. SO42-
mg/l - - - - 124.740 - 88.573 - 69.911 83,331 76,661 400
8. As mg/l - - - - 0.0049 - 0.0074 - 0.0054 0,0063 0,0060 0,05
9. Cr mg/l - - - - 0.0025 - 0.0027 - 0.0036 0,0042 0,0033 -
10. Cd mg/l - - - - 0.0033 - 0.0043 - 0.0035 0,0054 0,0043 0,005

1st Semi-annual Environmental Monitoring Report 2013
Mong Duong (2 x 500MW) Thermal Power Plant Project
Page 46 of 68
No.
Para
met
er
Unit
Sampling site
QC
VN
09
GW
-01-D
GW
-02
GW
-03-D
GW
-04
GW
-05
GW
-06
GW
-07-D
GW
-08
GW
- 09
GW
-10-D
GW
- 11
11. Cu mg/l - - - - 0.0354 - 0.0471 - 0.0662 0,0440 0,0400 1
12. Pb mg/l - - - - 0.0065 - 0.0067 - 0.0054 0,0064 0,0064 0,01
13. Zn mg/l - - - - 0.0088 - 0.0459 - 0.0941 0,0802 0,0792 3
14. Ni mg/l - - - - 0.0043 - 0.0039 - 0.0050 0,0060 0,0057 -
15. Hg mg/l - - - - 0.0009 - 0.0008 - 0.0007 0,0013 0,0008 0,001
16. Fe mg/l - - - - 0.0055 - 0.0058 - 0.0046 0,0062 0,0053 5
17. Mn mg/l - - - - 0.0146 - 0.0200 - 0.0150 0,0049 0,0094 0,5
18. Se mg/l - - - - 0.0013 - 0.0015 - 0.0011 0,0018 0,0013 0,01
19. Cloroform μg/l - - - - ND - ND - ND ND ND -
20. Phenol μg/l - - - - ND - ND - ND ND ND -
21. Fluorence μg/l - - - - ND - ND - ND ND ND -
22. TPH mg/l - - - - 0.006 - 0.006 - ND ND ND -
23. Oil and
Grease mg/l - - - - 0.004 - 0.004 - ND ND ND -
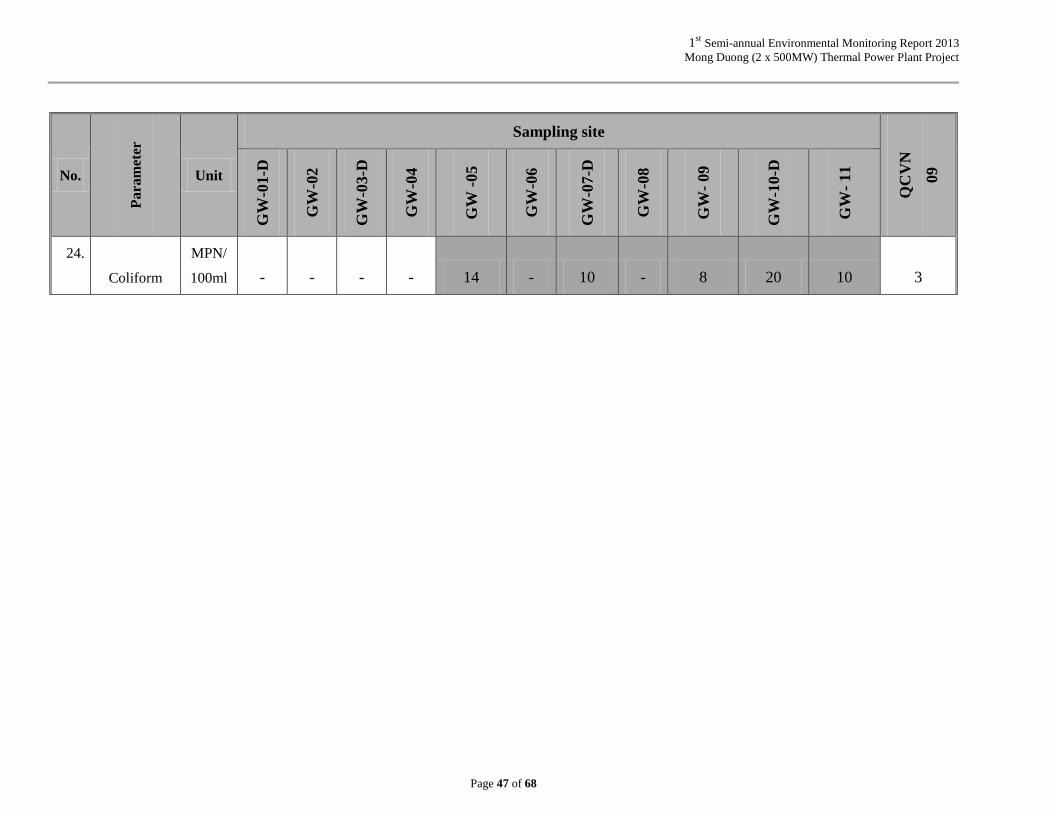
1st Semi-annual Environmental Monitoring Report 2013
Mong Duong (2 x 500MW) Thermal Power Plant Project
Page 47 of 68
No.
Para
met
er
Unit
Sampling site
QC
VN
09
GW
-01-D
GW
-02
GW
-03-D
GW
-04
GW
-05
GW
-06
GW
-07-D
GW
-08
GW
- 09
GW
-10-D
GW
- 11
24.
Coliform
MPN/
100ml - - - - 14 - 10 - 8 20 10 3
1st Semi-annual Environmental Monitoring Report 2013
Mong Duong (2 x 500MW) Thermal Power Plant Project
Page 48 of 68
According to the Monitoring and analyzing results for collected underground water (drilled
wells) samples:
Chloride and coliform was relatively high in GW-05, GW-06, GW-07-D, GW-08, GW-
09; GW-10-D, GW-11, with concentrations above the referenced standard
Cd and Hg were also detected in concentrations above reference standards in GW-10-D
3.2.4 Overall Assessment Water Quality
Through the results of monitoring and analyzing of surface water and groundwater at Mong
Duong 1 thermal power plant project, we have following comments:
At the time of the survey from January to June, 2013, obstacle removal and Mong Duong river
alignment activities were finished and construction activities under implementation
Drilled wells labeled GW-01, GW-02, GW-03, GW-04, GW-05 and GW-08 were covered during
site clearance and building. They are important ground water monitoring points. The
environmental consultant for water quality recommends that investor should drill new wells
which replace the covered wells.
Impact of obstacle remove activities in coastal surface water is monitored by coastal surface
water sampling sites labeled SW-3a, DD-1, SW-06, SW-07, SW-5a, SW-5b, DD-04, SW-08.
Parameters of them are within limit in comparison with QCVN 10: 2008/BTNMT, (others
column)
Impact of Mong Duong river alignment activities in coastal surface water is monitored by coastal
surface water sampling sites labeled SW-01, SW-03b, SW-04. Parameters of them are almost
within limit in comparison with QCVN 08: 2008/BTNMT, (B2 column.)
Impact of transport activities in coastal surface water is monitored by coastal surface water
sampling sites labeled LG-1, LG-3, LG-4. Parameters of them are within limit in comparison
with QCVN 10: 2008/BTNMT, (others column.)
Change of parameter’s concentration through surveys trend to decrease
Two of water pollution sources are water discharge from coal mining via Mong Duong river and
ships transport coal in the waterway. Spilled coal from ships will dilute element and compound to
coastal water (such as: Fe and Mn). So, decreasing trend may be the result of management and
treatment improving of water discharge from coal mining and the improvement of coal smuggle
management in the waterway.
Almost all tested items of underground water at sampling sites are within limit of the National
technical regulation on underground water quality QCVN09/2008/BTNMT except Cd, Cl-
content and content of microorganisms (Coliform).
Concentrations of chloride (Cl-) beyond permissible limits of National technical regulation on
underground water quality QCVN09:2008/BTNMT at the site PW-03, GW-01-D, GW-08, GW-
09 and GW-11. This is explained that sampling sites are located in the coastal and islands areas
thus they may be saline lightly.

1st Semi-annual Environmental Monitoring Report 2013
Mong Duong (2 x 500MW) Thermal Power Plant Project
Page 49 of 68
Concentration of microorganisms (Coliform) beyond permissible limits of the National technical
regulation on underground water quality QCVN09/2008/BTNMT at the site PW-01, PW-02,
PW-03, PW-04, PW-05, PW-06, PW-08, PW-09. This is explained that water in existing wells
are not usually utilized thus water is not rotated and easy to make condition for microbial
growing.
Following surveys, change of underground water parameters at sampling sites are low and
relative stable.
3.2.5 Recommendation
From the above mentioned results at the monitoring times from January to June 2013, it may be
concluded that the impact of obstacle removal, Mong Duong river alignment and construction
activities to the coastal surface water and underground water is minor.
Contractor should be requested to drill new wells with the depth of 25 - 30m
Maintain the implementation of present measures to minimize environmental pollution.

1st Semi-annual Environmental Monitoring Report 2013
Mong Duong (2 x 500MW) Thermal Power Plant Project
Page 50 of 68
4. AQUACULTURE & FISHERY
4.1 Overview
During the first half of 2013, the Environment Monitoring and Analyzing Centre (EMAC) of
Quang Ninh province carried out two surveys to monitor the aquaculture and fisheries activities
surrounding the project sites such as Thac Thay, De Dach and Mong Duong river and the coastal
area of Cam Hai. A number of methods to collect data and information were applied to assess the
implementation of the EMP requirements and project EIA through fishing activities and aquatic
resources monitoring. The methods included: fact-finding survey, direct interview, interview
through prepared questionnaire, reference method and statistic and comparison methods. In
addition, several meetings and site visits were conducted to gather the data contained in this
report. During the site visits photographs were taken to serve as proof of compliance or non-
compliance and reference documents were copied or photographs of these were also taken.
4.2 Inspection Activities
The inspection team conducted two surveys on aquatic resources and fisheries and aquaculture
activities in Thac Thay, De Dach and Mong Duong rivers and the coastal area of Cam Hai. The
first survey was done on the 22nd March, 2013 and the second one on 9st May, 2013.
Aquatic resources in term of species composition and abundant were poor in Mong Duong and
De Dach rivers. During the surveys, the inspection team observed some small pelagic fish such as
rabbit fish, mullet in De Dach and Mong Duong river at high tide, however there have not been
any large fish or other aquatic species at Mong Duong river at low tide (see pictures). Thus, there
were no fishing activities in these rivers. In both surveys water quality in these rivers was poor
due to the high turbidity of coal debris and clay in the river water. The Mong Duong stream was
narrow and water depth was very low. Thus, the changing of Mong Duong river at the
construction phase have impacted on the water speed and aquatic resources. It is concluded that
Mong Duong and Thac Thay river are environmentally impacted by of coal mining activities.
There were some fishing activities in the river mouth of De Dach and Mong Duong river.
Fishermen collected bivalves and small fish at mangrove forests. Fishing activities in these areas
are stable in capture production and species composition. That is because these areas are not
major fishing grounds and catching methods are simple. In addition, the construction of Mong
Duong 1 power plant may have little impact on the aquatic resources. Number of fishing boats
anchored at De Dach and Mong Duong river mouths were higher in the first survey than in the
second one. The second survey was in the capture season for fishermen, therefore almost every
fishing boat went to Vandon and Co To island for fishing. In addition, the equipment shipments
to the Mong Duong power plant project may have impact on fishing activities, especially by
anchoring the vessels nearby the project site.
Fishing activities were observed in the Thac Thay river, Luonggac and coastal line of Cam Hai
commune in both surveys. In the first survey, it was observed that fishermen are catching fish,
crustacean and mollusc in the Luonggac area. They use small boats to exploit fish or collect

1st Semi-annual Environmental Monitoring Report 2013
Mong Duong (2 x 500MW) Thermal Power Plant Project
Page 51 of 68
mollusk and/or small fish at mangrove forests. In the second survey, we did not observe any
fishing activities in the Luong giac area. It is reported that fishermen went offshore for the South
marine fish exploitation season. The species composition and their abundance were naturally
stable during the surveys due to these areas are quite far away from the Mong Duong power
plant. There were no shrimp culture activities at Cam Hai commune due to loss from the shrimp
disease outbreaks and natural disaster (flooding).
4.3 Overall Assessment Aquaculture and Fishery
Based on the results of the two surveys on the fishing and aquaculture activities in Thac Thay, De
dach and Mong Duong river and along the coastal line of Cam Hai commune from January to
June 2013, it is concluded that:
The Construction phase of Mong Duong 1 power plant has minor impact on the aquatic
resources in the inspected areas
There were no fishing activities in De Dach and Mong Duong river due to heavy
industrial pollution from mining and coal trading. Number of aquatic species and their
components in these areas are limited.
Some fishing activities in the Thac Thay river and Luonggac areas were observed, but
there are no shrimp activities in Cam Hai coastal line due to loss from shrimp disease
outbreak and flooding.

1st Semi-annual Environmental Monitoring Report 2013
Mong Duong (2 x 500MW) Thermal Power Plant Project
Page 52 of 68
Tow
ard
the
ba
nk
5. MANGROVE REFORESTATION MONITORING
5.1 Overview
To compensate the loss of mangrove forest taken by the Project, 52ha of mangrove has been re-
planted in Dong Rui Commune, Tien Yen District, Quang Ninh Province.
5.2 Inspection Activities
A. Content of Inspection:
Inspection of Mangrove development progress (diameter, height, branching off status,
number of leaves, survival rate of mangrove)
Inspection of environment condition for mangrove (climate, hydrography, irrigation
status)
Evaluate the Mangrove’s quality for Acceptance.
B. Methodology:
Sample Selecting Method:
Vertical divide from the mangrove bank toward the coastal with the distance of 300 m.
Select standard pilot 10m x 10m vertical, each standard cell has 300m distance.
Counting the number of mangrove survival to calculate density of plant; measuring the
height and diameter to calculate the average height.
300mToward the
coastal
300m
Figure 5 Method for selection of sample
Standard pilot
10m x 10m

1st Semi-annual Environmental Monitoring Report 2013
Mong Duong (2 x 500MW) Thermal Power Plant Project
Page 53 of 68
C. Inspection Results:
In area of 52ha of mangrove forest which was replanted, there is 95% of plants survival.
Mangroves start branching off.
In Inspection in May, one tree has 12-15 leaves. Mangrove’s distance is 1m x 1m with the
height is about 55 cm.
In Inspection in July, one tree has 13 – 17 leaves with the average height is about 55cm –
65cm
In Inspection in November , we found that each one has 14 – 19 leaves with the average
height is about 55cm – 80cm
Measured Results in July 2013:
The smallest mangrove:
1. Base Diameter: 0.85cm
2. Diameter to branching off point: 0.5cm
The highest mangrove:
1. Base Diameter: 1.3cm
2. Diameter to branching off point: 0.6cm
The average height: 65cm – 90cm
The average of mangrove branching off is 3-4 branches
Number of leaves: average 20 – 25
Average density of plant: 95 mangrove/100m2, 95% of plants survival
The Monitoring and Analyzing results during a period form May 2012 to July 2013 are presented
in Table 19
Table 19 Monitoring and analyzing results
Inspection time Height Leaves Base Diameter:
May 55cm 12-15 0.8 cm
July 55cm-65cm 13-17 1.1 cm
November 65cm-80cm 14-19 1.2 cm
July 2013 65cm- 90cm 20-25 1.3cm
D. Condition of Nature and Environment.
Soil condition: Alluvial soil deposit, the flat topography support the mangrove’s
development.
Water condition: irrigation canal with the distance of 500m, the average depth is 0.8m –
1.0m, and the average width is 1.8m. These conditions will create the moisture to support
mangrove develops well.

1st Semi-annual Environmental Monitoring Report 2013
Mong Duong (2 x 500MW) Thermal Power Plant Project
Page 54 of 68
5.3 Overall Assessment Mangrove Reforestation
Mangrove quality develops well, branching off well.
The natural and environmental conditions support the mangrove’s development.
With the results above, the Mangrove planting project has met the requirement of the EIA
EPC contractor’s construction workers need to be educated during the course of the
safety and environmental trainings on the need to avoid direct and/or indirect disturbance
of the mangroves.
Prohibit dumping of waste in mangrove and forestry areas

1st Semi-annual Environmental Monitoring Report 2013
Mong Duong (2 x 500MW) Thermal Power Plant Project
Page 55 of 68
6. OVERALL CONCLUSIONS AND RECOMMENDATIONS
This chapter is providing the Overall Conclusions and Recommendations of the
Owner/Consultant regarding all health & safety and environmental aspects required to be
implemented by the EPC contractor.
6.1 Health, Safety & Waste Disposal Management
Conclusion
This topic covers Health and Social aspects, Site Safety and Security, Site Waste management
and Soil contamination issues
Generally good overall performance of the EPC contractor’s appointed HSE team with
responsible Environmental Officer (OE) in place
Good site safety management of the EPC contractor with regards to fire safety, plant and
equipment safety, labor safety, worker training before entering site, access gate checks
before entering site etc.
Until now No fatality and No Lost Time accident occurred with an accumulated total
man-hours reaching 5’200’000 as of July 2013
Until now no serious soil issues happened at site. Some small oil spillage occurred but
were treated immediately as per the Contractor’s EMS
Waste management follows the contractor’s EMS by separating waste into different
groups and collected and disposed as per the EMS requirements. Until now there is very
little hazardous waste at site such as oil and chemicals, but in time to come there will be
more of these materials to dispose of
All required permits are in place ie. Permit To Work, Confined Space Entry Permits, Gas
Test Certificates etc.
Checklist are submitted regularly to Project Owner for environmental performance
monitoring program done weekly by EPC contractor
First Aid service available 24/7
Monthly report issued to the Department of Labor Quang Ninh province for labor
movements
The health issue of the labor force is one of the topics that requires close monitoring as
part of the health and safety management plan
Current audit results show that both men and women are well informed of potential
health and safety risks: HIV/AIDS control and prevention activities for both camp
workers and offices
Recommendations:
EPC contractor to submit environmental monitoring reports and check lists to Project
Owner on a regular basis (monthly)
Contractor to inform Project Owner immediately of any incidence occurrence at site
whether it is concerning a vehicle accident, labor accident, fire accident, soil
contamination or other incident not further specified here.
EPC contractor to strictly enforce site safety and warn offenders or in repeat cases
dismiss from site (some recent incidents as shown in the attached pictures do not give a
good impression and need to be corrected)
Newly legislated and/or revised environmental laws shall be examined carefully in order
to determine whether they are required to be implemented during the project execution

1st Semi-annual Environmental Monitoring Report 2013
Mong Duong (2 x 500MW) Thermal Power Plant Project
Page 56 of 68
Contractor to ensure that it complies with the EIA and the requirements specified in
chapter VI of the ADB environmental assessment guidelines, 2003.
Contractor to comply with all relevant local regulations to the project
Contractor shall once every 6 months organize exercises based on likely site scenarios in
which the key site personnel work through their emergency response roles.
Contractor shall periodically review and evaluate the efficiency of the Project EMS in
place
Number of site toilets to be increased as labor force increases
Owner/Consultant to perform regular audits at the contractor’s labor camps especially
with regards to gender issues. (next audit proposed at Licogi’s labor camp)
6.2 Environmental Quality Monitoring
This topic covers Air & Noise and Vibration, Water quality, Aqua culture and Fisheries and
Mangrove reforestation
6.2.1 Air & Noise and Vibration Monitoring
Conclusion
Construction activities at the site of Mong Duong 1 increased over time compared to the
last reporting period commensurate with ongoing progress in the first half of 2013.
Therefore construction activities impacted more on the air environment (dust) and noise
to nearby residential areas then in previous months
The two monitoring stations KK1 and KK2 located at residential areas selected in the
EMP are hardly impacted during the construction phase of Mong Duong 1 thermal power
plant, but may show an impact during the operation phase, particularly from the high
pollution sources (boiler, stack etc.).
Comparing the monitoring results (dust) between the last 6 months of 2012 and the first 6
months of construction phase in 2013, it shows that the first 6 months of 2013 has higher
concentrations of air pollutants than the 6 months before, especially in the 3 months
April, May and June 2013 when the weather was dry, sunny and hot. The increase is
mostly due to increased traffic on the new no.18 and old 18A road likewise.
Recommendations:
On the new no.18 road near the entrance of Mong Duong 1 and Mong Duong 2 power
plants, heavy vehicles travel a lot, so the road is very dirty and dusty. The road needs
regular water spraying to improve the conditions, especially in the dry season. The
appearance of construction waste in nearby vacant land (along the new no.18 road such
as concrete from bored piles and other construction debris needs to be removed and kept
neat and tidy at all times.
Noticeable environmental impact during the reporting period has not only been caused by
pile driving activities, foundation digging, construction and soil conveying, but also due
to social environment changes caused by the gathering of the large work force in the
Mong Duong precinct which causes all sort of problems ie. regarding to services, food
provision etc. These and related problems need to be evaluated in addition and mitigated
as much as possible.

1st Semi-annual Environmental Monitoring Report 2013
Mong Duong (2 x 500MW) Thermal Power Plant Project
Page 57 of 68
6.2.2 Water quality Monitoring
Conclusion
Impact of obstacle removal activities in coastal surface water is monitored by coastal
surface water sampling sites named SW-3a, DD-1, SW-06, SW-07, SW-5a, SW-5b, DD-
04, SW-08. Parameters of them are within limit in comparing with QCVN 10:
2008/BTNMT, (Others column)
Impact of Mong Duong river alignment activities in coastal surface water is monitored by
coastal surface water sampling sites named SW-01, SW-03b, SW-04. Parameters of them
are almost within limit in comparing with QCVN 08: 2008/BTNMT, (B2 column)
Impact of transport activities in coastal surface water is monitored by coastal surface
water sampling sites named LG-1, LG-3, LG-4. Parameters of them are within limit in
comparing with QCVN 10: 2008/BTNMT, (Others column)
Change of parameter’s concentration through surveys trend to decrease
Two of the water pollution sources are water discharged from coal mining via Mong
Duong river and ships transport coal in the waterway. Spilled coal from ships will dilute
elements and compound to coastal waters (such as: Fe and Mn). So, decreasing trend may
be resulted of management and treatment improving of water discharge from coal mining
and the improvement of coal smuggle management in waterway.
Almost all tested items of underground water at the sampling sites are within the limits of
the National technical regulation on underground water quality QCVN09/2008/BTNMT
except Cd, Cl- content and content of microorganisms (Coliform).
Concentrations of chloride (Cl-) beyond permissible limits of the National technical
regulation on underground water quality QCVN09:2008/BTNMT are found at the site
PW-03, GW-01-D, GW-08, GW-09 and GW-11. This is explained by the fact that the
sampling sites are located in the coastal and islands areas, thus they may be saline lightly.
Concentration of microorganisms (Coliform) beyond permissible limits of the National
technical regulation on underground water quality QCVN09/2008/BTNMT are found at
the site PW-01, PW-02, PW-03, PW-04, PW-05, PW-06, PW-08, PW-09. This is
explained by the fact that water in existing wells are not usually utilized thus the water is
not rotated and easy to make condition for microbial growing.
Following surveys, change of underground water parameters at sampling sites are low
and relative stableness.
Recommendations
Contractor should drill two additional wells with a depth of 25 -30m to compensate for
the two that are now covered after the land backfill activity
Maintain implementation of all current measures to minimize environmental pollution of
all surface and underground water resources.
6.2.3 Aquaculture and Fishery Monitoring
Conclusion
Based on the results of the two surveys on fishing and aquaculture activities in Thac Thay, De
Dach and Mong Duong rivers and along the coastal line of Cam Hai commune during the first
half of 2013, it may be concluded that:
The construction phase of Mong Duong 1 power plant has minor impacts on the aquatic
resources in the inspected areas.
1st Semi-annual Environmental Monitoring Report 2013
Mong Duong (2 x 500MW) Thermal Power Plant Project
Page 58 of 68
There were no fishing activities in De Dach and Mong Duong rivers due to heavy
industrial pollution from mining and coal trading. Number of aquatic species and their
components in these areas are very limited.
Some fishing activities in the Thac Thay river and Luong Gac areas were observed but
there are no shrimp activities along Cam Hai coastal line due to loss from shrimp diseases
outbreak and flooding.
Normal fishing activities and aquaculture are observed in the Thac Thay river and along
the coastal line of Cam Hai commune.
Recommendations
Contractor to strictly enforce his solid waste and waste water disposal management plan
and do not permit dumping of any hazardous substances into nearby rivers or sea.
6.2.4 Mangrove Reforestation Monitoring
Conclusion
Mangrove quality develops well, branching off well.
In the allocated area of 52 ha of mangrove forest which was replanted, there is 95%
survival rate of plants
The survey and inspection results of the mangrove reforestation shows that the mangrove
is developing well under the present environmental conditions at the project areas..
The advantage natural and environmental condition support for mangrove’s development.
With the current results, the Mangrove planting project has met the requirement of
ADB’s EIA
Recommendations
Keep protecting and feeding the mangrove to ensure of their good development and
branching off.
Continue with maintenance activities such as tree clearing, weeding and replanting of
failed areas (Using local labors for replanting and protecting mangrove area)
Educate construction workers on the need to avoid direct and indirect disturbance of the
mangroves
Prohibit dumping of waste in mangrove and forestry areas and resource extraction from
mangroves and plantation forestry areas.
Treat the mangrove forest in Dong Rui and Tien Yen as a special use forest, as this needs
4 years taking care (tree clearing, weeding , replanting of failed areas) and protecting.
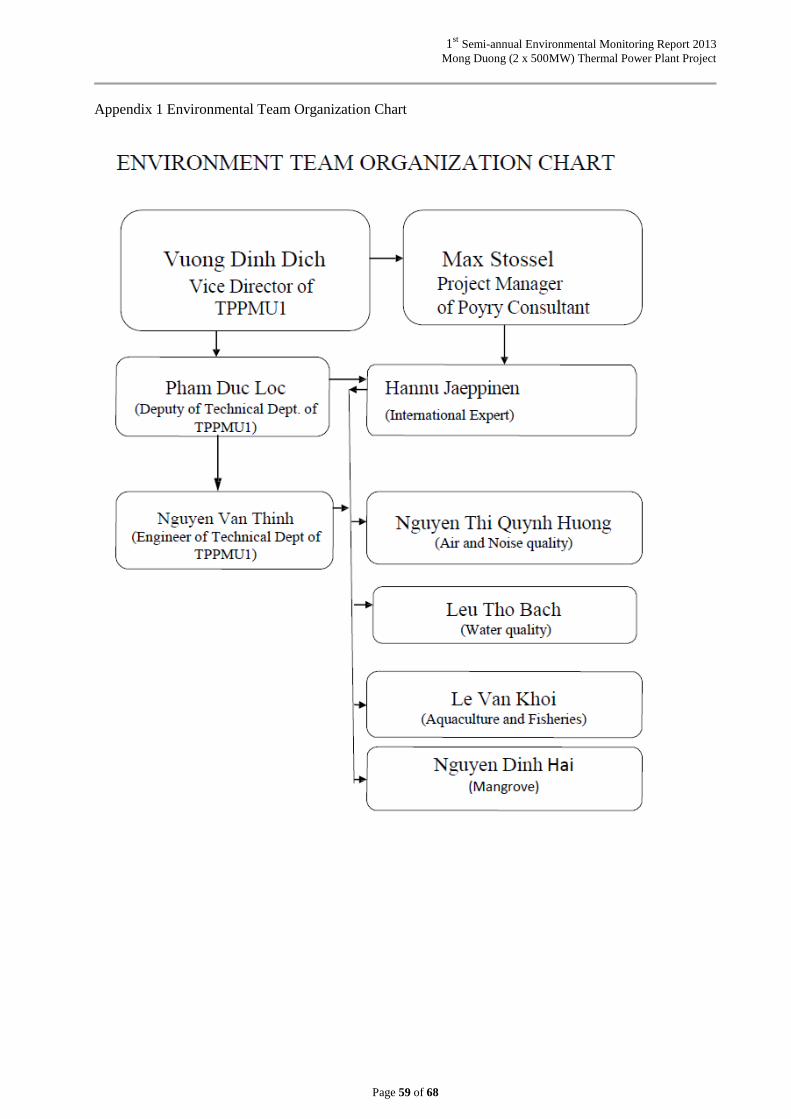
1st Semi-annual Environmental Monitoring Report 2013
Mong Duong (2 x 500MW) Thermal Power Plant Project
Page 59 of 68
Appendix 1 Environmental Team Organization Chart

1st Semi-annual Environmental Monitoring Report 2013
Mong Duong (2 x 500MW) Thermal Power Plant Project
Page 60 of 68

1st Semi-annual Environmental Monitoring Report 2013
Mong Duong (2 x 500MW) Thermal Power Plant Project
Page 61 of 68
Appendix 2 HSE Organization Chart
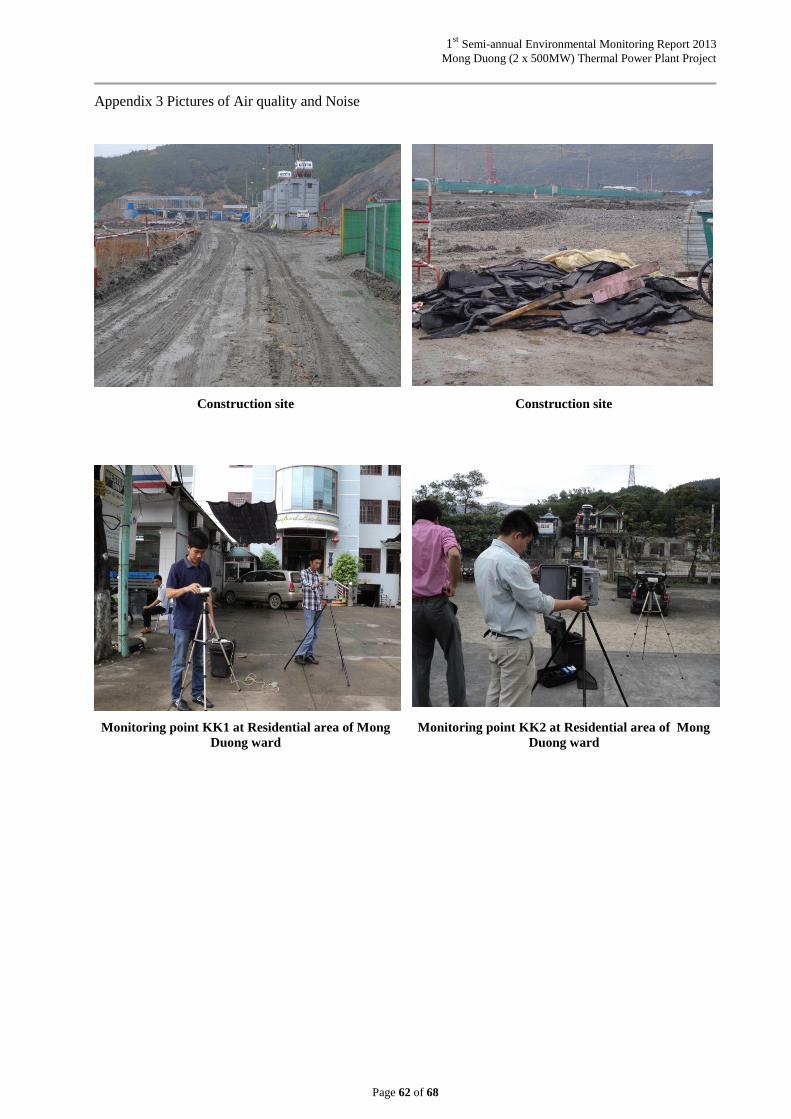
1st Semi-annual Environmental Monitoring Report 2013
Mong Duong (2 x 500MW) Thermal Power Plant Project
Page 62 of 68
Appendix 3 Pictures of Air quality and Noise
Construction site Construction site
Monitoring point KK1 at Residential area of Mong
Duong ward
Monitoring point KK2 at Residential area of Mong
Duong ward

1st Semi-annual Environmental Monitoring Report 2013
Mong Duong (2 x 500MW) Thermal Power Plant Project
Page 63 of 68
Appendix 4 Pictures of Water Quality
Monitoring water quality on the River Monitoring water at Residential area

1st Semi-annual Environmental Monitoring Report 2013
Mong Duong (2 x 500MW) Thermal Power Plant Project
Page 64 of 68
Appendix 5 Pictures of Aquaculture and fishery
Collecting coal in Mong Duong River
(The picture is taken from Mong Duong bridge)
Mong Duong river at low tide

1st Semi-annual Environmental Monitoring Report 2013
Mong Duong (2 x 500MW) Thermal Power Plant Project
Page 65 of 68
Appendix 6 Pictures of Mangrove Reforestation
Mangrove Area 1 Mangrove Area 2

1st Semi-annual Environmental Monitoring Report 2013
Mong Duong (2 x 500MW) Thermal Power Plant Project
Page 66 of 68
Appendix 7 Picture of HSE
Traffic control at Mong Duong 1 and 2 Site Entrance Point
Security check at Mong Duong 1 Main gate
Site Safety Training
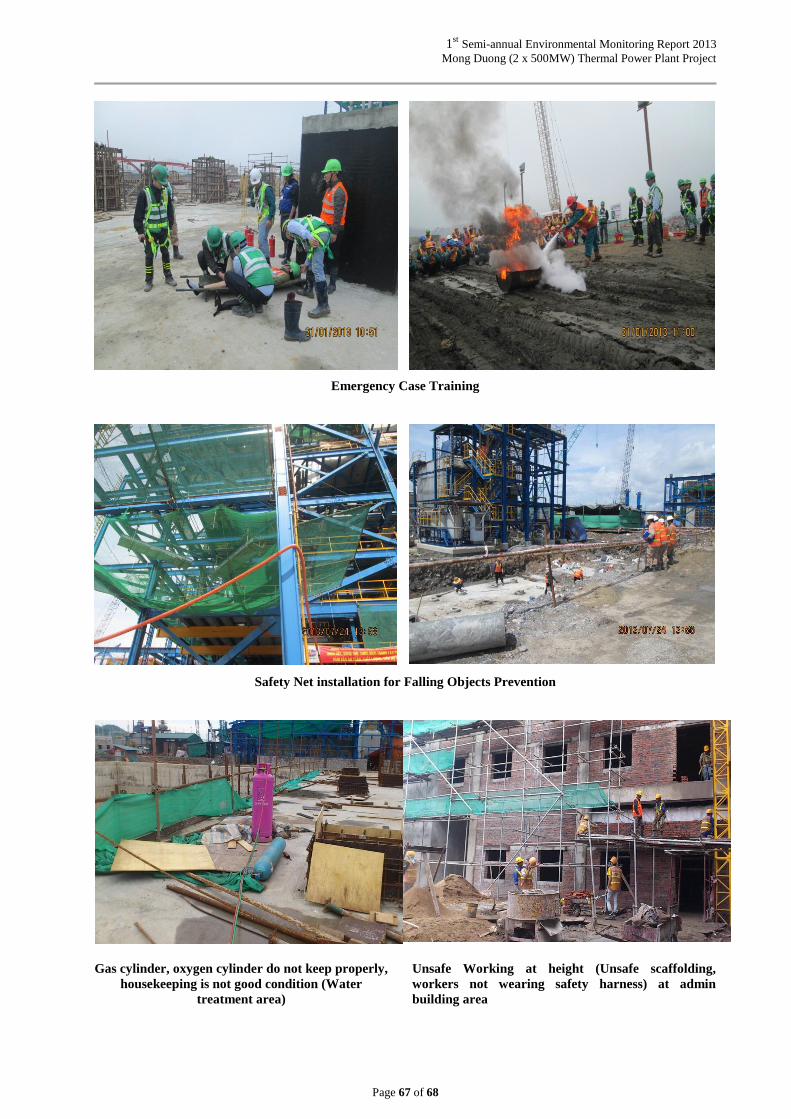
1st Semi-annual Environmental Monitoring Report 2013
Mong Duong (2 x 500MW) Thermal Power Plant Project
Page 67 of 68
Emergency Case Training
Safety Net installation for Falling Objects Prevention
Gas cylinder, oxygen cylinder do not keep properly,
housekeeping is not good condition (Water
treatment area)
Unsafe Working at height (Unsafe scaffolding,
workers not wearing safety harness) at admin
building area

1st Semi-annual Environmental Monitoring Report 2013
Mong Duong (2 x 500MW) Thermal Power Plant Project
Page 68 of 68
Appendix 8 Picture of Gender
Mess room in LILAMA worker camp Woman employee in construction site office
Health Checkup for employee Toilet for worker in construction site