environmental innovations and firm's boundaries: evidence from two ecological ... ·...
TRANSCRIPT

Paper to be presented at the
DRUID Society Conference 2014, CBS, Copenhagen, June 16-18
Environmental innovations and firm's boundaries: evidence from two
ecological industries in North--East ItalyRiccardo LeonciniUniversity of Bologna
Department of [email protected]
Sandro Montresor
University of BolognaDepartment of Economics
Francesco RentocchiniUniversity of Southampton
Southampton Management [email protected]
AbstractThe paper investigates the eco--innovation (EI) impact of firms' outsourcing in ecological industries. Differently from?dirty industries?, where outsourcing is typically driven by the search of cost--savings and is not respectful ofenvironmental issues (e.g. the search for ?pollution heavens? in offshoring strategies), in ecological ones it could/shouldbe functional to the sustainability mission of their firms. This argument is tested with respect to a sample of firmsoperating in two ecological sectors (sustainable building and photovoltaics) in North--East Italy. The results of theempirical investigation support an ?EI?friendly? use of outsourcing by ecological industries only limitedly. Externalisinghigh value--added activities significantly decreases the firm's EIs, while a positive effect emerges only from outsourcingof ancillary activities. Agglomeration economies, which could potentially attenuate transaction costs, have only a limitedrole. An impact on firm's EIs appears also from its knowledge relationships with research organisations as well as fromthe production relationships with business partners that do not originate from an outsourcing decision. All this points tothe role of the firm's capabilities for the sake of EIs and to the transactional problems that their externalisation couldpose to the firm's environmental sustainability
Jelcodes:Q55,O32

Environmental innovations and firm’s boundaries:
evidence from two ecological industries in
North–East Italy
Abstract
The paper investigates the eco–innovation (EI) impact of firms’ out-sourcing in ecological industries. Differently from “dirty industries”, whereoutsourcing is typically driven by the search of cost–savings and is not re-spectful of environmental issues (e.g. the search for “pollution heavens”in offshoring strategies), in ecological ones it could/should be functionalto the sustainability mission of their firms. This argument is tested withrespect to a sample of firms operating in two ecological sectors (sustain-able building and photovoltaics) in North–East Italy. The results of theempirical investigation support an “EI–friendly” use of outsourcing by eco-logical industries only limitedly. Externalising high value–added activitiessignificantly decreases the firm’s EIs, while a positive effect emerges onlyfrom outsourcing of ancillary activities. Agglomeration economies, whichcould potentially attenuate transaction costs, have only a limited role. Animpact on firm’s EIs appears also from its knowledge relationships withresearch organisations as well as from the production relationships withbusiness partners that do not originate from an outsourcing decision. Allthis points to the role of the firm’s capabilities for the sake of EIs andto the transactional problems that their externalisation could pose to thefirm’s environmental sustainability.
Keywords: environmental innovations; outsourcing; agglomeration.
JEL codes: Q55, 032, L23, L24.
1
1 Introduction
The interplay of globalisation and ICT advancements has made outsourcing apervasive business strategy in the current economic scenario. “The procurementof products or services from sources that are external to the organisation” (Lank-ford and Parsa, 1999, p.310) is driven by several motivations, among which thesearch of cost–savings is dominant (Abraham and Taylor, 1996). Its impact isalso manifold. Outsourcing can increase the firm’s productivity and profitabil-ity, although its positive effect is conditional on an wide set of elements (e.g.firm’s size internationalisation, own sector and that of the provider) (Olsen,2006). The switch from “make” to “buy”, and the ensuing decrease of thefirm’s vertical integration, also affects its innovativeness, through a combina-tion of positive and negative effects (e.g. competence upgrading vs. knowledgeleakages) that have attracted a lot of attention in economic and managementstudies. Overall, from different theoretical perspectives, the expected impact isnegative, but the actual one is still dependent on the relevant context (e.g. onthe kind of outsourced activity) (Mazzanti et al., 2007).
In this stream of research, the relationships between the firm’s boundariesand its environmental performances have received rather little attention. An im-portant exception is represented by the so called “pollution–heaven hypothesis”(PHH) (Mani and Wheeler, 1998): firms in “dirty industries” use internationaloutsourcing (i.e. offshoring) to exploit cross–region/country asymmetries in en-vironmental regulations and turn around the costs of a sustainable performance.
No evidence can instead be found on whether outsourcing affects the firm’scapacity of introducing/adopting new environmental solutions in ecological in-dustries (like, for example, sustainable building and photovoltaics), where thesearch for pollution heavens, or more in general of environmental cop outs, is notan issue. This is to us quite surprising, given the important role of “interactivedrivers” in stimulating the firm’s environmental innovations (EIs). Innovationco–operation with business partners and research organisations emerged as asignificant driver (De Marchi, 2012; Cainelli et al., 2012). More in general, sig-nificant traces of an “open innovation” mode (Chesbrough, 2003) have beenfound, as the firm’s knowledge sourcing and absorptive capacity seem to impacton EIs, although with important specifications (Ghisetti et al., 2013). Theseinteractive drivers are strictly related with the firm’s boundaries and with itsorganisation, as evolutionary and resource/competence based views of the firmhave widely shown (Mahnke, 2001). Accordingly, outsourcing is a sensitive issuefor the analysis of EI, and its neglect is thus quite unfortunate.
In this paper we try to fill this gap, by investigating the outsourcing decisionsof firms in ecological industries and their impact on EI. In doing that, we testwhether these firms make an “EI–friendly” use of their externalisation strategies,or whether the obstacles stressed by outsourcing theories bind their activities.
The test is performed on an original sample of 140 surveyed firms operatingin two ecological sectors (sustainable building and photovoltaics) in 4 North–East Italy regions (Emilia Romagna, Friuli Venezia Giulia, Trentino Alto Adigeand Veneto). This empirical setting, characterised by some of the most notable
2

local production systems (i.e. industrial districts) of Italy, enables us to considerthe role of agglomeration economies that regional and urban studies have foundin investigating the drivers and the impact of outsourcing at the local level(Taymaz and Kilicaslan, 2005).
The rest of the paper is organised as follows. In Section 2 we review theliterature on outsourcing and innovation and try to extend its results to thecase of EI, by putting forward our research hypotheses. In Section 3 we presentthe characteristics of our sample, the empirical application and the economet-ric strategy. Section 4 illustrates the results. Section 5 concludes with somecomments on the relevance and on the possible future extension of our results.
2 Theoretical background
To the best of our knowledge, the only case of an environmental impact ofoutsourcing that received attention is represented by the PHH. In brief, throughoutsourcing, firms in “dirty industries” (e.g. with intense waste production)relocate production and/or trade of pollution–intensive goods from their “home”country to relatively less regulated ones (Jeppesen et al., 2002).1 However, ata closer scrutiny, the PHH is not about the impact of outsourcing as such.But rather of the so–called “regulatory–drivers” of environmental performancesand innovations (e.g. Horbach et al., 2012), and of their asymmetries acrossgeographical zones with different levels of development (Dasgupta et al., 2000;Mani and Wheeler, 1998).
When outsourcing (and offhsoring, in particular) is more directly addressed,its role in transmitting environmental practices and green–knowledge spillovers(from the global to the local level, in particular) also emerges and tends toturn the PHH argument upside down (Christmann and Taylor, 2001). This isparticularly so in “non–dirty” industries and in ecological (or “green”) ones,whose technologies and production processes are inspired by the “decoupling”of the economic performance of their activities from their environmental impact(UNIDO, 2013).2 In these cases, the PHH does not provide sensible insightsabout the role of outsourcing for the firms’ objective of creating new ways ofimproving their environmental performance, in particular through their EIs.Other approaches need to be considered, which the extant literature of ecologicaland environmental (management) economics however does not directly provide.
At first sight, the nature of EIs themselves would seem to suggest thatoutsourcing is indeed an issue for their adoption. EIs are systemic innovations,not confined to the technological sphere, but also encompassing organisational
1In spite of the consistent debate it is attracting at the policy–level, the hypothesis hasnot found consistent empirical support yet (Brunnermeier and Levinson, 2004; Levinson andTaylor, 2008; Wagner and Timmins, 2009).
2Although this ecological/green character could in principle be pursued by any industry,nowadays the circle of those which accomplish with it encompasses, among the others, greenbuilding materials, water resources conservation, photovoltaics, and geothermal energy, justto mention the most relevant.
3

and service–based aspects.3 The multi–faceted nature of EIs and the limitedarray of competencies firms have to deal with them, make external interactionsparticularly important for their introduction. In particular, innovative orientedindustrial linkages and inter–firm networking can be as important drivers of EIsas of other innovations (e.g. technological and organisational).
However, the research on the “interactive drivers” of EIs is still scanty andmainly focused on research co–operation and knowledge sourcing, whose pos-itive impact generally emerges in spite of some important qualifications andexceptions.4 A specific analysis of the impact of outsourcing is instead missing,and calls for an eclectic review of the literature on outsourcing and technologicalinnovations.
The standard paradigm in investigating this relationship points to contrac-tual incompleteness (Grossman and Helpman, 2002), ownership allocation andefficient investments (Grossman and Hart, 1986), formal versus real authority(Aghion and Tirole, 1997) and, in general, the incentive conflicts entailed bycontractual relationships (Foss, 2000). The most popular of these approaches isrepresented by transaction costs economics (TCE) (Williamson, 1975), accord-ing to which vertically integrated firms are generally superior to disintegratedones in dealing with innovation (Robertson and Langlois, 1995). In brief, tech-nological change usually relies on highly specific assets and is very uncertain.In the presence of opportunistic contractual relationships (e.g. outsourcing), itthus stimulates rent–seeking behaviours that hamper the efficiency level of thenecessary investments. Furthermore, vertically integrated firms are also betterequipped in managing the complementary assets and in coordinating the newand unrelated information entailed by innovation (Teece, 1986, 1980).5
In principle, nothing would prevent that TCE holds true also with respect toEIs, as outsourcing might be an obstacle for EIs. Investments with an environ-mental aim are very often location–specific (such as in the case of energy andraw materials reducing EIs) and can even be “dedicated” (in the TCE sense) tospecific clients, who enter in the design of the new product and/or process withan environmental impact. In this way, EIs generate “quasi–rents” that evensustainable firms could be tempted to appropriate. However, in green sectors,business partners are generally committed towards environmental sustainabilityand, accordingly, often adopt voluntary and systemic corporate social respon-sibility practices (Cetindamar, 2007). This could somehow attenuate oppor-
3This appears evident from the most standard definition of EI as “the production, assim-ilation or exploitation of a product, production process, service or management or businessmethods that is novel to the firm [or organisation] and which results, throughout its life cycle,in a reduction of environmental risk, pollution and other negative impacts of resources use(including energy use) compared to relevant alternatives” (Kemp and Pontoglio, 2007, p.10).
4Among the few contributions, see Mazzanti and Zoboli (2009); De Marchi and Grandinetti(2013); De Marchi (2012); Cainelli et al. (2012); Ghisetti et al. (2013). More abundant isinstead the literature on such standard drivers of EIs as “market–pull”, “technology–push”and, above all, “regulation” effects (e.g. Horbach, 2008; Rehfeld et al., 2007; Rennings et al.,2006).
5To be sure, a positive correlation between innovativeness and outsourcing can be putforward by incorporating “governance inseparability” into TCE, in the way suggested byArgyres and Liebeskind (1999). On this issue, see Mazzanti et al. (2007).
4

tunistic behaviours by the firms and make outsourcing less exposed to hold–upproblems. Further obstacles to the extension of TCE to EIs emerge by look-ing at the technological regimes of the green sectors, as represented by theirconditions of innovation opportunities, appropriability, learning cumulativenessand nature of the relevant knowledge base (Malerba and Orsenigo, 1993). Ina number of cases, these sectors actually operate in a Schumpeterian “Mark I”regime of creative destruction, in which knowledge and capabilities upgrading,also through outsourcing, become crucial, even at the risk of a certain knowl-edge leakage (Mahnke, 2001). Overall, even by sticking to the TCE logic, an“EI–friendly” use of outsourcing cannot be ruled out in ecological sectors.
In this last respect, more supportive insights come from a different theo-retical perspective, represented by those resource–based and evolutionary ap-proaches addressing the implications of outsourcing for the firms’ capabilitiesand competences (Mahnke, 2001) and set the contractual analysis in ‘real time’(Argyres and Liebeskind, 1999; Langlois, 1992). In this research stream, out-sourcing is retained also as a channel through which firms can try to solve thetrade–off between the “exploration” of new capabilities and the “exploitation”of their present ones (Leonard-Barton, 1992). By contracting out some of itseconomic activities, the firm can increase the number of its knowledge inter-faces, thus increasing the opportunities of learning–by–interacting. In turn, thiscan have a positive impact on the solution of the “competence traps” that thepath–dependence of its economic activities entails (Levinthal and March, 1993).
As we anticipated above, in the case of EIs, this cognitive role of outsourc-ing is possibly even more important.6 The introduction of an EI requires thefirm to deal with different techno–economic problems, whose solution is oftencontracted out to a different and/or more competent external provider.7 In thislast respect, the production relationships that firms establish with their busi-ness suppliers, especially in ecological industries organised into clusters (e.g.industrial districts), is as important as those of innovation co–operation theyestablish with research organisations (De Marchi, 2012; Cainelli et al., 2012).
According to a resource/competence–based view, environmental innovatorsthus seem to have margins for making an “EI–friendly” use of outsourcing.However, this is not guaranteed either. Also EIs, like standard technologicalinnovations, can in fact be hampered if the outsourcer looses the capacity tomanage the relationships between internal and external activities (Windrumet al., 2009). Along the same line, the outsourcer could be unable to undertakeinternal activities complementary to the outsourced ones, which are necessaryfor their innovative exploitation (McIvor, 2005).8
6The resource–based view of the firm has also been extended to the analysis of the firm’senvironmental performance — the so–called “natural resource–based view” (e.g. Hart, 1995;Russo and Fouts, 1997). However, the cognitive role of outsourcing to which we refer here hasbeen hardly addressed within it.
7Carrillo-Hermosilla et al. (2010), for example, argue that EIs require knowledge pertain-ing to the “design”, the “users’ involvement”, the “product–service”, and the “governance”dimensions, that the firm rarely posses in a full–package.
8The former case often occurs in the case of long–term contracts of “total outsourcing”,in which the control of the outsourced activities is entirely passed over to the provider.The
5

Although with these caveats, the research hypotheses that we put forwardis that outsourcing has a positive impact on EIs in ecological sectors. However,a number of factors could affect it (e.g. specific sector of externalised andof actual EI activity) and need to be controlled for in the empirical analysis.First of all, as said above, this is the case of the explicit transfer of green–knowledge that occurs through the relationships that the focal firm entertainswith research organisations producing basic and applied knowledge in the field,like universities and research institutes (De Marchi, 2012). Extremely importantare also the interactions that the firm establishes with other business partners(Cainelli et al., 2012). Indeed, irrespective of an eventual shift from “make”(in–house) to “buy” (externally) — like the one captured by outsourcing —the firm can actually have relationships with other business players based onthe division of labour in production — e.g. subcontracting — or based onco–operation agreements in specific phases of the production process. Also inthese cases, EI–functional knowledge, embodied in the underlying productionexchanges, can reach the focal firm. Furthermore, as the resource–based viewof the firm has shown, knowledge exchange differs, whether firms are part ofthe same business group or not, as ownership ties can make the knowledgetransmission more effective.
The geographical context in which the firms operate is also very important,because of agglomeration economies. As far as outsourcing is concerned, thepresence of Marshallian externalities (Beaudry and Schiffauerova, 2009), hasbeen found to positively moderate its economic impact in two ways. On theone hand, the manifold proximity — e.g. geographical and cognitive (Boschma,2005) — implied by local specialisation economies reduces transportation costs,while the price of the externalised activities is lowered by local competition(Holl, 2008). On the other hand, the problems of opportunistic behaviours thatprevent outsourcing from yielding its expected results in atomistic relationshipscan be attenuated, as Marshallian economies also entail a social proximity thatinduces trust among the business partners (Becattini, 1990). Also the role ofJacobs externalities, based on variety, has been found crucial (Beaudry andSchiffauerova, 2009). In particular, the presence of agglomerated firms that areactive in different sectors has been found to increase their innovativeness —possibly more than Marshallian ones (Duranton and Puga, 2001) — as it allowsfor the cross–fertilisation of ideas and favours the recombination of existingknowledge (Frenken et al., 2007a).
While these ideas have been largely investigated in the case of technologicalinnovations, their analysis in the case of EIs is nearly absent, and represents afurther element of originality of the paper.
latter instead is relevant in the opposite case of “partial outsourcing”, when the control of theoutsourced activity remains with the outsourcer. Both of them, have been found responsibleof the so–called “productivity paradox” of outsourcing, in which its short–term advantagestranslate into disadvantages in the long run.
6

3 Empirical application
In order to investigate the relationship between outsourcing and EI we buildupon a unique database comprising information for companies located in a lim-ited area and being part of two ecological industries.
As for the geographical area, we focus on four administrative regions (NUTS2) of the North–East of Italy: Emilia Romagna, Friuli Venezia Giulia, TrentinoAlto Adige and Veneto. These regions constitute one of the most dynamic ar-eas in the country, with levels and rates of growth of GDP above the nationalaverage, where agglomeration economies in the form of industrial districts haveflourished since the period immediately after the Second World War (Brusco,1982; Becattini, 2002). The focus on this group of regions is suitable to testour research hypotheses for three reasons. First, the area is characterized by aflexible specialisation system with a widespread presence of SMEs, where out-sourcing of production stages is the norm (Brusco, 1982). Second, the areais characterized by the active integration of communities of people and popu-lations of industrial firms, that make of social capital an important deterrentto opportunistic behaviours (Putnam et al., 1994). Third, the environmentalperformances of the North–East of Italy, although with some exceptions, areamong the highest in the country.
In these 4 regions, we concentrate on sustainable building and photovoltaicindustries: two ecological/green sectors that are also suitable for testing ourresearch hypothesis (see Section 2). Sustainable building (also known as greenconstruction) expands and complements the classical concerns of constructionindustry relative to economy, utility, durability, and comfort of buildings. Inparticular, sustainable building concentrates on structures and processes thatare environmentally responsible and resource–efficient throughout the building’slife–cycle: siting, design, construction, maintenance, renovation, and demolition(Anink et al., 1996). The photovoltaic industry instead belongs to the second–generation technologies of the renewable energy industry. It mainly consists ofthe production of solar cells that convert light into electricity. Photovoltaicsindustry in Italy has undergone through an impressive process of growth. Solarphotovoltaic installations and capacity grew respectively of an impressive 123%and 185% in the 2007-2012 period (GSE, 2012).
3.1 Data
The sample used in this paper was extracted from an original database devel-oped in 2011 by the joint effort of the Departments of Economics of the Uni-versities of Bologna and Trento (Italy) within the OPENLOC research project(http://www.openloc.eu/). A survey was launched to collect information onthe regional industries described in Section 3, by administering a structuredquestionnaire to the owners–managers of the relative firms. The questions con-cerned information on firms’ structural characteristics — like sales and em-ployees — on a number of dimensions of both their production and innovationprocesses (technological and non–technological), and on the relative outcomes.
7

In particular, a focus was placed on their interactions, by distinguishing theirdifferent typologies — e.g. production vs. knowledge exchanges — and theirdifferent partners — e.g. business players and research organisations.
Given the absence of a clear-cut definition industrial classification for sus-tainable building and photovoltaic industries, the firms’ population has beenidentified by using different sources, in particular: (i) the registers of Ital-ian chambers of commerce (CCIAA): (ii) the online Bureau Van Djik AIDAdatabase: (iii) lists of participants to professional “green” exhibitions (Legnoe Edilizia in Verona (17-20 March 2011), Ecocasa Expo in Reggio Emilia (3-6March 2011), Impianti solari Expo in Parma (25-27 March 2011)) and (iv) alist of firms registered in industrial “green” associations (GIFI, ISES, APER,Habitech and GBC).
The resulting population included 931 companies. From it, a subset of 213target firms was extracted. This subset was stratified according to the ad-ministrative region (the second level in the Nomenclature of Territorial Unitsfor Statistics codes) of firm location and industry segment (mainly 16 and 27NACE rev. 2 codes). The relative importance of these two industries from anecological point of view can be gauged by the share of employment pertainingto “green” occupations within them. Although not available for the Statisticalclassification of economic activities in the European Community (NACE), theBureau of Labor and Statistics provides the green goods and services privatesector employment for the corresponding classes in the 2012 North AmericanClassification System (NAICS).9 We build a cross-walk between the two indus-trial classifications (from the four digit NAICS 2012 to the two digit NACE rev.2 industrial classifications) and compute the share of total employment due to“green” occupations for the two relevant classes and compare it to the averageshare of employment for the overall manufacturing industry. While the over-all manufacturing sector is characterised by a share of employment “green” inthe order of 4.3%, biomaterials and photovoltaics have a share of 9% and 7.9%respectively.10 Between October and December 2010, the owner–managers ofthe 213 target firms were contacted and were available for a telephone interviewbased on the questionnaire described earlier.
Full information was finally obtained for 140 out of these 213 firms. This finalsample is representative of the overall population of the 931 companies by regionand industry segment (χ2[3] = 0.21 and χ2[1] = 2.6, respectively). With respectto them, three sets of information are available for the period 2006-2010. First,information on their performance in terms of EIs, with a disaggregation of theirtypologies (e.g. pollution reducing vs. energy saving). Second, and cruciallyto our study, information on specific aspects of vertical organisation of firms’production — namely, their outsourcing decisions in the different activities oftheir value chain (e.g. cleaning services vs. human resource management).Finally, the database includes further useful information to control for the firms’availability of both direct (e.g. technology transfer) and indirect (e.g. co–
9Available at http://www.bls.gov/green/.10Further details on the analyiss carried out to gauge the “green” weight of the two industries
are available from the authors upon request.
8

operation in production) knowledge sources, for the agglomeration economiesthat can accrue from their geographical concentration and from the industry–variety of their local environment, as well as for their structural characteristics(e.g. size, age, etc.).
3.2 Econometric model and dependent variables
The dependent variable of our empirical exercise is the introduction of new (orsignificantly improved) environmental innovations (EIs). With respect to themthe respondents of the OPENLOC survey were asked CIS–like (Community In-novation Survey) questions, addressing a set of different environmental benefitscoming from product, process, service, organisational and marketing innova-tions.11 More precisely, following the CIS 2006-2008, which for the first timecomprehends a special environmental session, firms were asked about their EIsaccording to a definition consistent with that provided in Section 2 (footnote 3)and encompassing as many as 9 typologies of them, that is: (i) reduced materialuse per unit of output; (ii) reduced energy use per unit of output; (iii) reducedCO2 ‘footprint’ (total CO2 production); (iv) replaced materials with less pol-luting or hazardous substitutes; (v) reduced soil, water, noise, or air pollution;(vi) recycled waste, water, or materials; (vii) reduced energy use; (viii) reducedair, water, soil or noise pollution; (ix) improved recycling of product after use.
We define EcoInn, as a dummy variable equal to 1 if the focal firm introducedany of these 9 types of EIs during the 2006-2010 period, and to 0 otherwise.Following the extant literature, we also distinguish among the 9 typologies thosethat can be treated as product rather than process EIs. With the dummyEcoInn Prod, we identify whether the firm has obtained environmental benefitsthat can be referred to the after–sales use of its goods or services, that is EIsfrom (vii) to (ix). On the same token, we create the variable EcoInn Proc,which takes value 1 if the firm has introduced environmental benefits during theproduction of goods or services, that is EIs from (i) to (vi), and takes value 0otherwise.
The relationship between outsourcing and EIs is investigated by pluggingthe former among the factors that influence the probability of obtaining thelatter, through the estimation of the following logit models:
P (Yi = 1|Xi, Zi) = Λ(X ′iβ + Z ′
iδ)
where Λ(z) = ez/(1 + ez) is the logistic function. Yi is one of the three mea-sures of innovation performance presented above (i.e., EcoInn, EcoInn Prod andEcoInn Proc), Xi is a vector of variables including measures of outsourcingactivities carried out by firm i in the 2006-2010 period (see Section 3.3); Zi
indicates a series of firm–specific control variables.As a robustness check, since product and process environmental innovations
are not likely to be independent of each other, we conducted a bivariate probit
11For a review on innovation surveys, see Mairesse and Mohnen (2010)
9

analysis to capture the possible interdependence between these two outputs.
3.3 Independent and control variables
Our main independent variables are the firm’s outsourcing decisions with respectto the 17 different activities that the OPENLOC survey distinguishes. Follow-ing previous work on outsourcing at the local level (Mazzanti et al., 2009), webuild up three measures of outsourcing by grouping these 17 activities into 3classes: (i) ancillary; (ii) production; and (iii) production supporting activities.The first one, Out Anc, is a dummy variable taking value 1 if the firm out-sourced any of the following “ancillary activities”, which are accessory to theactual production process: inventories management, internal logistics, distribu-tion logistics, cleaning services, plants maintenance, machinery maintenance,and data processing. The second outsourcing variable, Out OutProd, measures(still with a dummy) the outsourcing decision of any of the retained “produc-tion activities”, encompassing the supply of intermediate products, productionstages, products & trademarks and other production activities. Finally, thedummy Out SupProd refers to the externalisation decision of “production sup-porting activities”, which are not primarily productive, but that contribute moredirectly to the production process than the former: marketing, engineering, re-search & development, labour consultancy, human resource management, andquality control.
As can be immediately appreciated, these 3 groups of activities have a dif-ferent contribution to the firm’s value added and their externalisation can thusbe expected to have a different impact on its capabilities of innovating, and ofeco–innovating in particular.
A set of other co–variates refers to the nature of the knowledge and produc-tion relationships that the firms in our sample establish with external agents.As we said, these have been recently found important in accounting for an openmode of eco–innovation. At first, we retain their explicit Knowledge Technol-ogy Transfers, by distinguishing with two dummies whether they benefited fromthem with respect to public organisations (like, universities and research insti-tutes), KTTPub, and private business partners (suppliers, customers, and com-petitors), KTTBus, respectively. Secondly, we consider whether the firms inthe sample established other production relationships than “pure outsourcing”— such as co–operation agreements on certain production stages, or subcon-tracting contracts with their providers — either with other independent marketplayers, ProdMkt, or with players linked with them by some property rela-tionship, ProdPropr, or with a mix of the two, ProdMixed. We then furthersegment the previous five types of relationships by assessing whether firms main-tained them with only one external agent (unilateral relationship) or with twoor more (multilateral relationship). Accordingly, we have created the following9 dummies: unilateral public knowledge relationship (KTTPub Uni), multilat-eral public knowledge relationship (KTTPub Multi), unilateral business knowl-edge relationship (KTTBus Uni), multilateral business knowledge relationship(KTTBus Multi), unilateral market production relationship (ProdMkt Uni),
10

multilateral market production relationship (ProdMkt Multi), unilateral pro-prietary production relationship (ProdPropr Uni),12 unilateral mixed produc-tion relationship (ProdMixed Uni) and multilateral mixed production relation-ship (ProdMixed Multi). This last distinction is an important one, given thehigher opportunities of rent–seeking behaviours that the presence of few part-ners naturally induces.
While the difference between the Out variables and the KTT ones appearsevident, that between the former and the variables about the production re-lationships of the firms (Prod) deserves some comments. While the kind ofknowledge transfer that occurs in the two cases can be substantially similar— and to a large extent related, if not even embodied, in the underlying pro-duction exchange — the production relationships of the second group do notinvolve any change in the firm’s vertical scope and in its boundaries with respectto the market. In this last respect, the firm’s outsourcing can be taken to beboth more enabling — allowing the firm to substitute internal assets with moreviable/efficient external ones — and more problematic — involving a loss ofcontrol on previously owned activities. On this basis, their distinction appearsan important one to retain. Moreover, by including these variables we try tocontrol for a potential problem of omitted variable bias, as the relationship be-tween outsourcing and eco-innovation is likely to be influenced by productionand knowledge relationships.
In order to consider the role of agglomeration economies, we have built uptwo sets of proxies. First of all, we included a set of variables (Num2km,Num2 15km and Num15 22km), which refer to the natural logarithm (plusone) of the number of sample firms that are located within a certain distancefrom firm i (within 2 km, in-between 2 and 15 km, and in-between 15 and 22km, respectively).13 Given the pervasive presence of industrial districts in theNorth–East of Italy, we take this geographical proximity as sufficient evidenceof the Marshallian economies that characterise them. As for the presence ofJacobs externalities, instead, and of their eventual role in spurring EIs throughthe firm’s variety, we have extended Frenken et al. (2007b) approach and, foreach industry–province, is, we calculated the entropy of the workers shares heldby the j sectors of the same province (s) other than i. Entropyis is definedas −
∑j 6=i pjslog2(pjs) where pjs is the share of employment in industry j 6= i
and province s. In both cases, should the relative agglomerations economiesbe significant in favouring the firm’s EIs, their role in attenuating the trans-actional problems that outsourcing is expected to have in atomistic businessenvironments, and their moderation of the EI impact of outsourcing should becontrolled.
In addition to our key explanatory variables, we have included a number ofcontrols on firms’ characteristics. First, we inserted a variable measuring the
12As no firm entertains a multilateral proprietary production relationship, the relative vari-able is not present.
13These distances have been selected by crossing previous studies on the same geographicalarea (Cainelli and Iacobucci, 2010), with the direct observation of its specific firm density.Robustness checks on alternative distances are available from the authors at request.
11

R&D intensity of the firm, which is defined as the logarithm of R&D share ofsales (plus one) in the 2006-2010 period (ShareRD Exp). Second, a variablerelated to firm size measured as the natural logarithm of the total turnover (plusone) in the 2006-2010 period (LTurnover) is inserted. We also included a vari-able representing the international orientation of the firm (LSalesShareExp),defined as the logarithm of the shares of exports in sales (plus one) in the 2006-2010 period. LAge represents the logarithm of firm age (plus one) in 2010.Finally, as we hypothesise that the resource endowment of a firm would beimportant in determining the firm’s ability to eco–innovate, we also controlledfor the enterprise physical capital. We thus define LGrossInvExpXEmpl asthe logarithm of gross investment expenditure per employee (plus one) in the2006-2010 period.
Finally, a set of variables to control for the effect of industrial and geograph-ical specificities has been included. The sectoral dummy Sector takes value 1when firm i belongs to sustainable building industry and 0 when it belongs tophotovoltaic industry. The geographical dummies have been defined taking intoaccount the location of companies in the four regions: Emilia Romagna (Geo1),Friuli Venezia Giulia (Geo2), Trentino Alto Adige (Geo3) and Veneto (Geo4).
Table 1 provides the descriptive statistics of the variables defined above.Table 2 reports the correlation matrix for the independent regressors, fromwhich it can be inferred, since the correlation across the independent variablesis low, the absence of any relevant problems of multi–collinearity.
4 Results
Table 3 contains the results on the firm’s propensity of eco-innovating in generalterms (specificatin [1]), product eco-innovation (specification [2]) and processeco-innovation (specification [3]). Overall, our research hypothesis about an“EI–friendly” use of outsourcing does not seem to be confirmed. On the con-trary, the externalisation of the activities with the highest value–added for thefirm, that is Out SupProd, has a significant negative impact on its EIs in all themodel specifications. Taking the decision to externalise “production supportingactivities” brings a reduction of 36.8% in the likelihood of carrying out eco-innovation (29.3% and 34.5% for product and process EIs respectively). Thissuggests that, even in ecological industries, the outsourcing of the relative assetscould be exposed to problems of hold–up (following the TCE logic) and/or, fol-lowing a competence perspective, that their externalisation could entail a lossof control on resources that are pivotal for the firm’s EI. The only traces of apositive impact emerges, though weakly, from the outsourcing of ancillary ac-tivities (Out Anc) and in the case of product eco-innovation (specification [2]).With respect to these, firms could benefit from an internal re–skilling of theirworkforce on more EI sensitive tasks, being their externalisation less exposedto opportunistic behaviours, given their generic nature. All in all, the strategicrecommendation for increasing the firm’s eco–innovative profile in (these two)green sectors is to stay vertically integrated.
12

The only relevant differences among the three specifications of Table 3 seemto refer to the role of different outsourcing activities on product EIs. Indeed, notonly is the externalisation of production supporting activities (Out SupProd)problematic for their adoption, as in the general case, but this is also truefor the outsourcing of production activities as such, although less significantly(Out OutProd). In other words, when the firm aims at introducing an EI whoseimpact can be deemed more tangible in the market, its degree of vertical inte-gration appears even more binding. The loss of control on production stages(such as the supply of intermediary goods) could also entail a loss of competen-cies that are crucial for the implementation of a new green–product. From adifferent perspective, the accomplishment of such a product could increase thedegree of specificity of the relative investments along its whole value–chain.
The analysis of the other production–based relationships reveals that theshift from “make” to “buy” is actually what makes their EI impact problem-atic. Indeed, when the firm interacts with other business players by keeping itsvertical scope unaltered, adding new production–embodied/linked knowledge toits existing one, rather than substituting between the two, its EI capacity sig-nificantly increases. In other words, entering into the value–chain of the localsystem, by keeping the coherence of the internal value–chain, is a plus in termsof EIs. To be sure, this is so when the production relationships occur unilat-erally with an independent market player (ProdMkt Uni), while multilateralones do not have a significant impact, possibly because of the firm’s incapac-ity of making an effective use of the too diverse production experiences of itspartners. Still, when they occur with a unique firm, which is linked to the fo-cal one by ownership ties (ProdPror Uni), and thus part of the same businessgroup, these production relationships can even create redundant informationsignals, whose EI impact, also in the presence of higher administration costs,turns out to be negative. In brief, the network of production relationships inwhich firms are typically embedded in the investigated regions acts as vehicleof learning–by–interacting in the green realm. However, that occurs providingthese production relationships do not substitute the ones the firm manages in-ternally and providing they are maintained with individual (possibly dedicated)partners, whose ownership independence generates actual sources of brand–newknowledge.
The relevance of univocal, and thus possibly dedicated, relationships emergesalso with respect to the standard forms of knowledge transfer that the firmsreceive from public research organisations (KTTPub Uni). With this specifi-cation, the evidence recently obtained at the European level (mainly from CISdata) about the positive EI impact of research co–operation gets confirmed inthe present context too. Conversely, explicit knowledge transfer from businesspartners do not impact on the receiving firm’s EIs (KTTBus), suggesting thatan underlying production relationship is necessary for green knowledge to beeffectively transferred in the business realm.
Coming to the role of agglomeration economies, quite surprisingly, whenwe think of the case of technological innovations, the variety of the industrialcontext in which the firms operate does not help per se in eco–innovating. Ja-
13

cobs externalities are (weakly) negative in the two sectors at stake (Entropy),suggesting that a green–related kind of variety could be necessary for the cross–fertilisation of knowledge among sectors not to be an obstacle for eco–innovating:variety, in general, is not a green asset. Marshallian externalities also emergelike diseconomies, when firms are agglomerated in the immediate neighbours ofthe focal one (Num2km) and quite apart from it (Num15 22km): in the formercase, a congestion on the local factors of production/innovation can be the ex-planation, while in the latter the advantages of proximity could fade away andbe more than compensated by a competition effect. In between these two ex-tremes, however, co–location makes the firm in the sample more eco–innovative,providing a qualified kind of support to the case of the green clusters.
It is also interesting to notice that the more eco–innovative firms are theyounger of the sample (LAge significantly negative), but also the larger (LTurnoversignificantly positive). In (these two) ecological sectors, the so–called “liabilityof newness” does not appear to be an obstacle to EI, while there are tracesof a “liability of smallness” in the same respect. With respect to firms in thephotovoltaic industries, those in sustainable building (Sector1) seem to have adisadvantage in EI. On the contrary, the firms located in Veneto (Geo4) showan advantage when Emilia Romagna (Geo1) is considered a benchmark.
Tables 4, 5 and 6 report the results containing the interaction effects be-tween OutSupProd and our measures of diversity (Entropy) and agglomera-tion (Num2km, Num2 15km and Num15 22). It is extremely interesting tonotice that, with the exception of one of the 3 distances, the physical proxim-ity to other firms seems to bring in other forms of proximities (in particular,social and institutional), which remedy the problems of outsourcing productionsupporting activities (Out SupProd). It seems that, even when the problemsof too little (Num15 22km) and too much (Num2km) proximity can be ruledout, the co–location with other firms neither helps nor damages the introduc-tion of new green–products.14 In this latter case, the relevant knowledge mightbe of more codified nature and thus be conveyed to the firm by more explicitforms of knowledge transfer. Indeed, this is also confirmed by the replication ofthe results we have obtained from the general impact of the green–knowledgeproduced by public research organisations (KTTPub Uni).
As the interpretation of interaction effects in non-linear models can be prob-lematic, we follow previous studies (Ai and Norton, 2003; Buis, 2010) and com-pute the interaction effects for each observation in our sample. Figures 1 and2 show the statistical significance of the interaction effects by plotting the z-statistic for each observation against the predicted value (according to speci-fication [2] and [4] in table 4). Graphs show that the portion of observationswith a fitted probability of carrying out eco-innovation ranging between 0.4 to0.8 present statistically significant interaction terms.15 We interpret this as aconfirmation of the results presented in the above paragraph.
14This result requires us to be cautious in retaining the significant impact of their interactionwith Out SupProd.
15Similar results are obtained of product and process EIs. These are available from theauthors upon request.
14

As we said in Section 3.2, as a robustness exercise we have also used abivariate probit procedure, in order to capture the possible interdependencebetween product and process EIs, as they are not likely to be independent ofeach other.16
The bivariate probit estimation (Table A1 in the appendix) confirms theoverall results of our previous regressions, with a particular emphasis on the neg-ative effects of outsourcing, that is now confirmed for both product and processEIs wit respect to production supporting activities (Out SupProd), while thatof production activities as such (Out Prod) appears only in the case of productones. Interesting confirmations emerge also for the knowledge exchanges withpublic organisations, for the role of (non externalised) production relationships,and for the characteristics of the eco–innovative firms (young and big). Less sig-nificant, but still consistent in sign, appear the results regarding agglomerationexternalities.
5 Concluding remarks
Even when PHH is not taken into account, and only eco–sustainable sectorsare considered, outsourcing does not appear to have a fully supportive rolein spurring environmental innovation. On the contrary, the externalisation ofactivities that can be deemed core for the adoption of EIs — such as R&D,training and human resource management — even decrease the firm’s propensityof eco–innovating, and the same occurs for that of production activities in thecase of product EIs. Finally, even the effects of a possible EI re–skilling of thefirm’s workforce in consequence of the outsourcing of ancillary activities appearscanty, and disappear in the case of process EIs.
It appears that firms in ecological sectors are not able to make an EI–friendlyuse of their outsourcing practices, unless these are carried out in the presence ofa qualified form of agglomeration economies (i.e., of Marshallian economies witha certain degree of co–location). This latter consideration suggests that, out ofthe two possible explanations of the result, rooted in TCE and in the resource–based view of the firm, respectively, the former could have a higher explicativerole. While outsourcing could break up the complementarity between the firm’scompetencies, the risks of opportunistic behaviours induced by specific green–assets could have an even greater damping effect on the firm’s EI.
Indeed, deverticalisation appears in our case problematic, as production re-lationships between business partners have a positive impact, providing theydo not change the firm’s vertical scope. As we pointed out, in order to benefitfrom the division of labour prevailing within these particular local labour sys-tems, firms need to stay vertically integrated. This last insight is particularlyimportant when we think of the advantages that larger firms have shown in theadoption of EIs.
16This lack of independence is confirmed statistically by the extemely high value of thecorrelation coefficient between the error terms in the two equations (rho = 0.92).
15
Another key element to stress is related to the fact that in these local con-texts, knowledge transfer with public research organisations emerges as impor-tant for EIs as elsewhere, providing it is not bothered by an excessive numberof external sources. This is also the case of production–based relationships thatspur EIs as long as they are univocal and between independent business units.The need of dedicated knowledge exchanges thus seems to emerge as anothergeneral result of our empirical application.
A last conclusive remark is due for the role of agglomeration economies withrespect to EIs. Quite surprisingly, variety by itself does not represent a plusfor eco–innovation, but rather turns out to be a possible source of redundancyin information flows. Similarly, the co–location (and possible co–specialisation)of the firms in a limited portion of the territory does not help them in eco–innovating, unless the problems of a too little and too much proximity are ruledout.
16

Table 1: Descriptive statisticsVariable Mean SD Min MaxEcoInn 0.36 0.48 0 1EcoInn Prod 0.32 0.47 0 1EcoInn Proc 0.34 0.48 0 1Out Anc 0.04 0.20 0 1Out Prod 0.12 0.33 0 1Out SupProd 0.06 0.23 0 1KTTBus Uni 0.13 0.34 0 1KTTBus Multi 0.11 0.32 0 1KTTPub Uni 0.15 0.36 0 1KTTPub Multi 0.05 0.22 0 1ProdMkt Uni 0.04 0.19 0 1ProdMkt Multi 0.06 0.23 0 1ProdPropr Uni 0.03 0.17 0 1ProdMixed Uni 0.02 0.15 0 1ProdMixed Multi 0.05 0.22 0 1ShareRD Exp 0.25 1.02 0 8.58LAge 2.69 0.76 0.69 4.80LGrossInvExpXEmpl 3.88 1.44 0 9.09LTurnover 14.49 1.17 11.51 18.15LSalesShareExp 0.93 1.46 0 4.56Entropy 4.99 0.12 4.50 5.13Num2km 0.93 0.38 0.69 2.08Num2 15km 0.68 0.64 0 2.08Num15 22km 2.16 0.86 0 3.43Sector1 0.91 0.28 0 1Geo1 0.24 0.43 0 1Geo2 0.14 0.34 0 1Geo3 0.19 0.39 0 1Geo4 0.44 0.50 0 1
17

Table 2: Correlational table(1) (2) (3) (4) (5) (6) (7) (8) (9) (10) (11) (12) (13) (14) (15) (16) (17) (18) (19) (20) (21) (22) (23) (24) (25) (26)
(1) Out Anc 1(2) Out Prod 0.25 1(3) Out SupProd 0.40 0.38 1(4) KTTBus Uni 0.02 0.25 0.18 1(5) KTTBus Multi -0.08 -0.06 0.01 -0.14 1(6) KTTPub Uni 0.11 0.15 0.24 0.14 0.10 1(7) KTTPub Multi -0.05 0.22 -0.06 0.11 0.23 -0.10 1(8) ProdMkt Uni 0.15 0.05 0.28 -0.07 -0.07 -0.08 -0.04 1(9) ProdMkt Multi -0.05 0.10 -0.06 -0.09 0.20 0.07 0.08 -0.05 1(10) ProdPropr Uni -0.04 0.07 0.14 0.06 -0.06 0.17 -0.04 0.43 0.14 1(11) ProdMixed Uni 0.46 0.10 0.18 0.09 -0.05 0.21 -0.03 -0.03 -0.04 -0.03 1(12) ProdMixed Multi -0.05 0.22 0.08 -0.09 0.12 0.09 0.10 -0.04 0.51 0.16 -0.03 1(13) ShareRD Exp -0.02 -0.06 -0.03 0.00 -0.03 0.24 0.01 -0.05 -0.06 -0.04 0.01 -0.05 1(14) LAge -0.01 0.15 -0.11 -0.12 -0.05 0.05 0.02 -0.13 0.09 -0.19 -0.04 0.00 -0.13 1(15) LGrossInvExpxEmpl -0.05 -0.04 0.05 -0.12 0.09 0.13 0.07 0.01 0.07 0.01 0.00 -0.02 0.03 0.12 1(16) LTurnover 0.10 0.20 0.08 -0.13 -0.07 0.15 0.09 0.06 0.16 0.10 -0.02 0.07 -0.14 0.34 0.12 1(17) LSalesShareExp -0.05 -0.14 -0.05 -0.08 0.07 0.01 -0.02 0.03 0.10 -0.04 0.00 0.08 0.27 -0.02 0.07 0.22 1(18) Entropy -0.03 0.21 0.05 0.22 -0.08 -0.12 0.04 -0.04 -0.14 -0.11 0.06 -0.07 -0.19 -0.05 -0.01 -0.19 -0.08 1(19) Num2km 0.06 0.06 -0.07 -0.12 -0.06 -0.07 0.00 -0.12 0.10 -0.11 0.17 -0.02 -0.01 -0.02 0.00 -0.11 0.05 0.22 1(20) Num15km -0.01 0.03 0.10 -0.01 -0.13 -0.07 -0.03 0.14 0.04 0.02 -0.02 0.04 0.02 0.10 -0.05 0.07 0.03 0.12 -0.15 1(21) Num22km -0.07 -0.06 0.00 -0.12 -0.17 -0.29 -0.11 0.04 -0.03 -0.12 0.00 0.03 -0.01 0.00 -0.04 -0.17 -0.02 0.24 0.35 0.41 1(22) Sector1 -0.06 0.04 -0.14 -0.11 -0.13 -0.16 -0.16 -0.22 0.08 -0.25 0.05 0.07 -0.08 0.33 -0.12 0.03 -0.09 -0.10 0.01 0.05 0.12 1(23) Sector2 0.06 -0.04 0.14 0.11 0.13 0.16 0.16 0.22 -0.08 0.25 -0.05 -0.07 0.08 -0.33 0.12 -0.03 0.09 0.10 -0.01 -0.05 -0.12 -1 1(24) Geo1 -0.03 0.00 0.08 0.04 0.07 0.10 0.10 0.17 0.01 0.11 0.03 0.10 0.08 -0.12 -0.07 0.02 -0.01 -0.06 -0.28 -0.22 -0.35 -0.19 0.19 1(25) Geo2 -0.08 -0.08 -0.10 -0.03 -0.01 -0.17 0.10 -0.08 -0.10 -0.07 -0.06 -0.09 -0.03 -0.04 -0.01 -0.02 0.20 -0.12 0.08 0.10 0.07 -0.03 0.03 -0.22 1(26) Geo3 -0.01 -0.12 -0.12 -0.13 0.23 0.21 -0.11 -0.09 0.12 0.03 -0.07 -0.03 0.07 0.03 0.24 0.09 0.01 -0.38 -0.10 -0.10 -0.36 0.02 -0.02 -0.27 -0.19 1(27) Geo4 0.10 0.15 0.09 0.09 -0.23 -0.13 -0.07 -0.02 -0.03 -0.07 0.07 -0.01 -0.10 0.11 -0.13 -0.07 -0.14 0.43 0.26 0.20 0.54 0.17 -0.17 -0.50 -0.35 -0.43
18

Table 3: Probability of introducing an eco-innovation(1) (2) (3)
EcoInn EcoInn Prod EcoInn ProcOut Acc 1.747 2.061* 1.877
[1.254] [1.242] [1.253]Out OutProd -0.503 -1.884* -1.121
[0.726] [0.972] [0.755]Out SupProd -6.269*** -5.974*** -6.295***
[1.638] [1.803] [1.637]KTTBus Uni 0.947 0.718 0.537
[0.665] [0.680] [0.658]KTTBus Multi 0.206 -0.526 0.235
[0.819] [0.952] [0.860]KTTPub Uni 3.043*** 3.166*** 3.234***
[0.860] [0.973] [0.848]KTTPub Multi 0.153 -0.216 -0.932
[0.888] [1.087] [0.996]ProdMkt Uni 5.549*** 6.641*** 6.134***
[1.797] [2.009] [1.833]ProdMkt Multi 0.760 1.166 0.822
[0.930] [0.957] [0.919]ProdPropr Uni -5.723*** -6.505*** -6.034***
[1.546] [1.848] [1.592]ProdMixed Uni 1.182 1.554 1.431
[1.473] [1.616] [1.540]ProdMixed Multi 1.000 2.036* 1.627
[0.966] [1.077] [1.012]ShareRD Exp 0.276 0.084 0.093
[0.283] [0.205] [0.192]LAge -1.389*** -1.413*** -1.305***
[0.453] [0.483] [0.435]LGrossInvExpXEmpl 0.175 0.372* 0.232
[0.182] [0.190] [0.195]LTurnover 0.784*** 0.823*** 0.885***
[0.240] [0.261] [0.266]LSalesShareExp 0.105 0.034 0.001
[0.181] [0.184] [0.179]Entropy -4.936** -4.105* -4.004*
[2.234] [2.266] [2.194]Num2km -1.660** -1.601* -1.666*
[0.837] [0.933] [0.884]Num2 15km 0.944** 0.627 0.741*
[0.451] [0.397] [0.426]Num15 22km -1.070** -0.763* -0.849*
[0.505] [0.431] [0.484]DSector1 -3.179*** -3.962*** -3.594***
[0.950] [1.111] [0.968]DGeo2 -0.630 -1.128 -0.261
[1.467] [1.670] [1.417]DGeo3 -1.108 -0.660 -1.033
[0.815] [0.875] [0.826]DGeo4 2.065*** 2.274*** 2.085***
[0.793] [0.857] [0.803]Constant 18.712 13.852 12.600
[11.700] [11.589] [11.582]χ2[25] 39.616** 38.851** 42.400**Log-likelihood -56.972 -52.520 -55.759Mc Fadden’s R2 0.376 0.403 0.381Observations 140 140 140
Robust standard errors and degrees of freedom are in parentheses.∗ p < 0.1, ∗∗ p < 0.05, ∗∗∗ p < 0.01
19

Table 4: Probability of introducing an eco-innovation (in general terms): Inter-action effects
(1) (2) (3) (4)Out Acc 1.205 1.847 2.139* 2.288**
[1.534] [1.159] [1.232] [1.151]Out OutProd -0.481 -0.774 -0.689 -0.689
[0.785] [0.797] [0.798] [0.761]Out SupProd -149.438 -13.947*** -7.699*** -9.097***
[152.223] [3.554] [2.379] [2.605]KTTBus Uni 0.912 1.088* 1.006 1.024
[0.676] [0.662] [0.660] [0.660]KTTBus Multi 0.220 0.134 0.164 0.129
[0.823] [0.836] [0.840] [0.830]KTTPub Uni 2.926*** 3.017*** 3.159*** 3.121***
[0.881] [0.866] [0.917] [0.885]KTTPub Multi 0.115 0.098 0.183 0.144
[0.874] [0.894] [0.905] [0.902]ProdMkt Uni 6.572*** 6.449*** 5.469*** 5.730***
[1.988] [1.830] [1.794] [1.759]ProdMkt Multi 0.743 0.763 0.751 0.805
[0.951] [0.929] [0.932] [0.893]ProdPropr Uni -5.904*** -6.002*** -5.867*** -5.867***
[1.610] [1.532] [1.570] [1.534]ProdMixed Uni 1.753 -0.280 0.360 -0.124
[1.840] [1.296] [1.559] [1.377]ProdMixed Multi 1.076 1.215 1.103 1.067
[0.997] [0.976] [0.989] [0.924]ShareRD Exp 0.303 0.227 0.237 0.231
[0.294] [0.273] [0.276] [0.275]LAge -1.334*** -1.300*** -1.382*** -1.360***
[0.466] [0.445] [0.453] [0.439]LGrossInvExpXEmpl 0.154 0.200 0.199 0.204
[0.187] [0.189] [0.192] [0.189]LTurnover 0.786*** 0.763*** 0.775*** 0.771***
[0.241] [0.240] [0.240] [0.240]LSalesShareExp 0.086 0.104 0.117 0.113
[0.184] [0.181] [0.184] [0.181]Entropy -5.172** -4.904** -4.773** -4.743**
[2.281] [2.233] [2.219] [2.227]Num2km -1.646** -1.592* -1.623* -1.628*
[0.835] [0.847] [0.856] [0.844]Num2 15km 0.931** 0.884** 0.911** 0.902**
[0.447] [0.448] [0.456] [0.446]Num15 22km -1.056** -1.103** -1.076** -1.103**
[0.500] [0.497] [0.508] [0.502]Out SupProd*Entropy 28.389
[30.152]Out SupProd*Num2km 9.405***
[3.128]Out SupProd*Num2 15km 0.949
[0.971]Out SupProd*Num15 22km 2.515*
[1.341]Industry dummy Inc. Inc. Inc. Inc.Geographical dummies Inc. Inc. Inc. Inc.Constant 19.852* 18.898 17.950 17.969
[11.921] [11.727] [11.648] [11.701]χ2[26] 41.238** 45.019** 42.450** 43.381**Log-likelihood -56.723 -55.985 -56.766 -56.390Mc Fadden’s R2 0.378 0.386 0.378 0.382Observations 140 140 140 140
Robust standard errors and degrees of freedom are in parentheses.∗ p < 0.10, ∗∗ p < 0.05, ∗∗∗ p < 0.01
20

Table 5: Probability of introducing a product eco-innovation: Interaction Effects(1) (2) (3) (4)
Out Acc 1.274 1.954 2.677** 2.366*[1.451] [1.241] [1.239] [1.238]
Out OutProd -2.190* -2.428** -2.402* -2.261**[1.209] [1.239] [1.235] [1.090]
Out SupProd -167.840 -18.870*** -10.184*** -12.364***[107.516] [4.588] [3.619] [3.823]
KTTBus Uni 0.821 0.958 0.891 0.899[0.706] [0.678] [0.692] [0.676]
KTTBus Multi -0.562 -0.638 -0.622 -0.695[0.982] [0.981] [0.988] [0.971]
KTTPub Uni 3.156*** 3.160*** 3.388*** 3.247***[1.002] [0.974] [1.035] [0.981]
KTTPub Multi -0.255 -0.343 -0.124 -0.288[1.067] [1.115] [1.119] [1.127]
ProdMkt Uni 8.323*** 8.615*** 6.912*** 7.645***[2.294] [2.182] [2.139] [2.120]
ProdMkt Multi 1.127 1.157 1.152 1.280[0.992] [0.989] [0.990] [0.939]
ProdPropr Uni -7.294*** -7.256*** -7.005*** -7.069***[2.076] [1.925] [2.009] [1.953]
ProdMixed Uni 2.110 -0.131 0.170 0.100[1.843] [1.390] [1.522] [1.365]
ProdMixed Multi 2.432** 2.587** 2.393** 2.268**[1.218] [1.191] [1.194] [1.052]
ShareRD Exp 0.078 0.027 0.022 0.033[0.209] [0.195] [0.203] [0.201]
LAge -1.351*** -1.270*** -1.395*** -1.375***[0.496] [0.455] [0.476] [0.455]
LGrossInvExpXEmpl 0.362* 0.404** 0.413** 0.423**[0.197] [0.191] [0.201] [0.195]
LTurnover 0.827*** 0.802*** 0.811*** 0.816***[0.262] [0.264] [0.262] [0.266]
LSalesShareExp 0.008 0.024 0.054 0.026[0.189] [0.190] [0.191] [0.186]
Entropy -4.434* -4.187* -3.910* -4.116*[2.337] [2.339] [2.322] [2.363]
Num2km -1.579* -1.552 -1.571 -1.595*[0.949] [0.977] [0.981] [0.966]
Num2 15km 0.626 0.555 0.573 0.589[0.398] [0.405] [0.410] [0.398]
Num15 22km -0.755* -0.828* -0.786* -0.834*[0.430] [0.424] [0.434] [0.430]
Industry dummy Inc. Inc. Inc. Inc.Geographical dummies Inc. Inc. Inc. Inc.Out SupProd*Entropy 32.243
[21.373]Out SupProd*Num2km 14.835***
[4.093]Out SupProd*Num2 15km 2.365
[1.581]Out SupProd*Num15 22km 4.754**
[2.085]Constant 15.471 14.711 13.033 14.294
[11.882] [12.015] [11.873] [12.122]χ2[26] 38.653** 40.143** 38.107** 39.216**Log-likelihood -52.041 -50.615 -51.816 -51.286McFadden’s R2 0.408 0.424 0.411 0.417Observations 140 140 140 140
Robust standard errors and degrees of freedom are in parentheses.∗ p < 0.10, ∗∗ p < 0.05, ∗∗∗ p < 0.01
21

Table 6: Probability of introducing a process eco-innovation: Interaction Effects(1) (2) (3) (4)
Out Acc 1.288 1.901 2.417** 2.417**[1.487] [1.175] [1.217] [1.180]
Out OutProd -1.202 -1.497* -1.425 -1.344*[0.838] [0.866] [0.869] [0.798]
Out SupProd -150.175 -15.833*** -8.333*** -9.932***[131.855] [3.733] [2.466] [3.000]
KTTBus Uni 0.557 0.737 0.643 0.665[0.665] [0.647] [0.650] [0.652]
KTTBus Multi 0.245 0.152 0.189 0.126[0.871] [0.890] [0.894] [0.879]
KTTPub Uni 3.138*** 3.219*** 3.389*** 3.309***[0.867] [0.860] [0.912] [0.874]
KTTPub Multi -0.969 -1.039 -0.880 -0.977[0.970] [1.011] [1.009] [1.016]
ProdMkt Uni 7.427*** 7.326*** 6.047*** 6.462***[2.067] [1.894] [1.874] [1.842]
ProdMkt Multi 0.788 0.811 0.799 0.915[0.952] [0.939] [0.941] [0.884]
ProdPropr Uni -6.446*** -6.455*** -6.232*** -6.250***[1.679] [1.610] [1.636] [1.617]
ProdMixed Uni 1.954 -0.135 0.321 0.031[1.825] [1.315] [1.539] [1.361]
ProdMixed Multi 1.824* 1.975* 1.814* 1.690*[1.066] [1.048] [1.060] [0.969]
ShareRD Exp 0.106 0.049 0.055 0.057[0.198] [0.188] [0.194] [0.190]
LAge -1.238*** -1.192*** -1.288*** -1.272***[0.453] [0.426] [0.435] [0.418]
LGrossInvExpXEmpl 0.209 0.261 0.260 0.268[0.204] [0.203] [0.205] [0.204]
LTurnover 0.884*** 0.861*** 0.873*** 0.872***[0.267] [0.267] [0.265] [0.266]
LSalesShareExp -0.019 -0.002 0.019 0.003[0.183] [0.181] [0.183] [0.177]
Entropy -4.263* -4.037* -3.769* -3.846*[2.230] [2.214] [2.193] [2.213]
Num2km -1.639* -1.601* -1.628* -1.649*[0.884] [0.910] [0.915] [0.902]
Num2 15km 0.732* 0.670 0.693 0.700*[0.423] [0.424] [0.433] [0.421]
Num15 22km -0.834* -0.894* -0.857* -0.899*[0.480] [0.476] [0.489] [0.482]
Industry dummy Inc. Inc. Inc. Inc.Geographical dummies Inc. Inc. Inc. Inc.Out SupProd*Entropy 28.582
[26.136]Out SupProd*Num2km 11.631***
[3.282]Out SupProd*Num2 10km 1.348
[1.052]Out SupProd*Num10 30km 3.056*
[1.628]Constant 13.852 13.152 11.502 12.098
[11.740] [11.680] [11.594] [11.686]χ2[26] 44.548** 46.138*** 43.947** 43.543**Log-likelihood -55.422 -54.411 -55.379 -54.972McFadden’s R2 0.384 0.395 0.385 0.389Observations 140 140 140 140
Robust standard errors and degrees of freedom are in parentheses.∗ p < 0.10, ∗∗ p < 0.05, ∗∗∗ p < 0.01
22
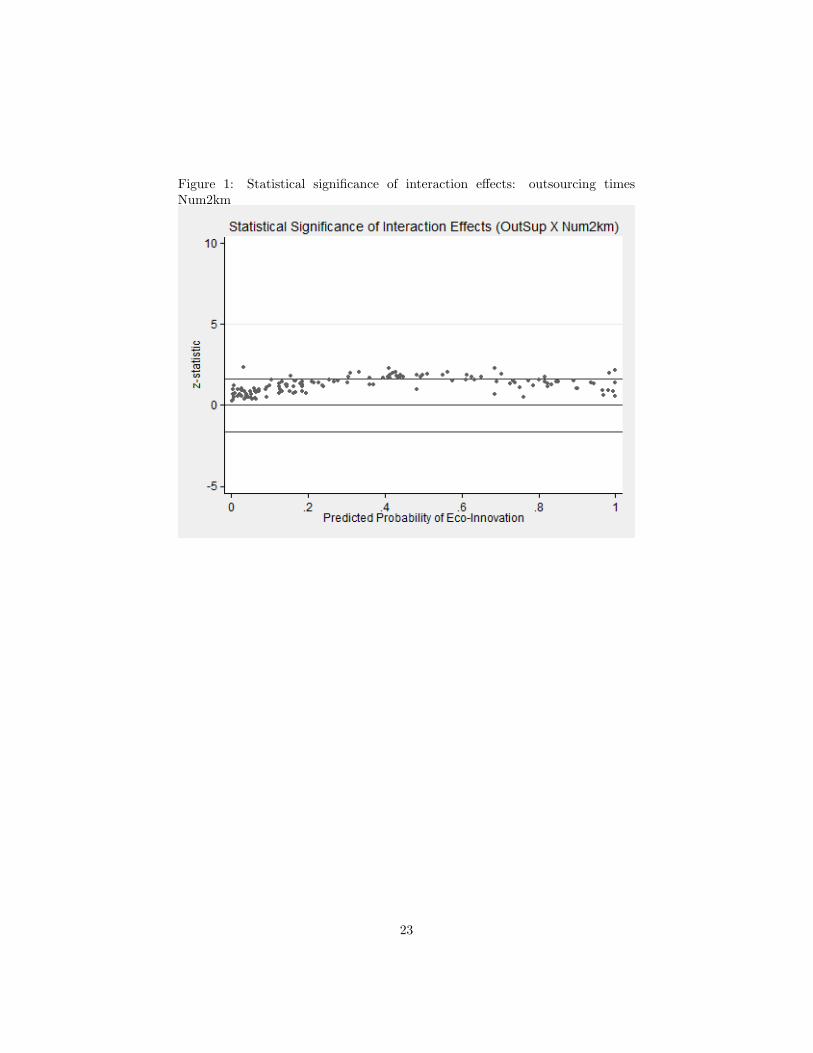
Figure 1: Statistical significance of interaction effects: outsourcing timesNum2km
23

Figure 2: Statistical significance of interaction effects: outsourcing timesNum15 22km
24
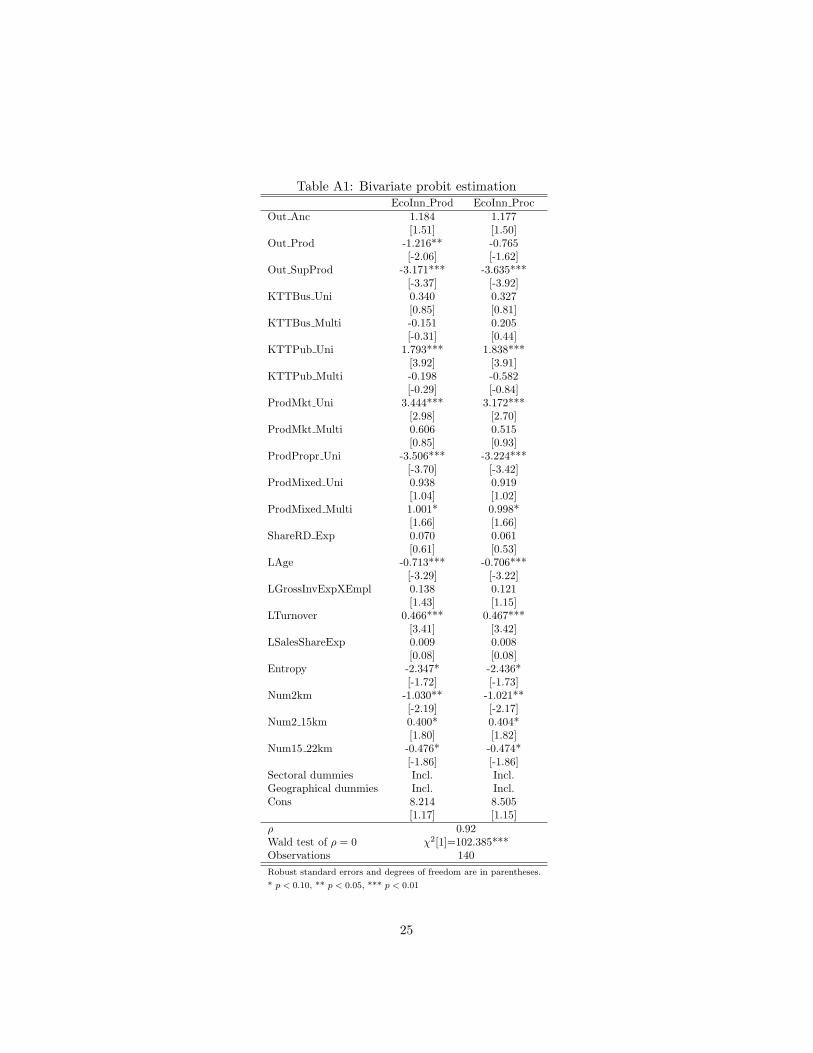
Table A1: Bivariate probit estimationEcoInn Prod EcoInn Proc
Out Anc 1.184 1.177[1.51] [1.50]
Out Prod -1.216** -0.765[-2.06] [-1.62]
Out SupProd -3.171*** -3.635***[-3.37] [-3.92]
KTTBus Uni 0.340 0.327[0.85] [0.81]
KTTBus Multi -0.151 0.205[-0.31] [0.44]
KTTPub Uni 1.793*** 1.838***[3.92] [3.91]
KTTPub Multi -0.198 -0.582[-0.29] [-0.84]
ProdMkt Uni 3.444*** 3.172***[2.98] [2.70]
ProdMkt Multi 0.606 0.515[0.85] [0.93]
ProdPropr Uni -3.506*** -3.224***[-3.70] [-3.42]
ProdMixed Uni 0.938 0.919[1.04] [1.02]
ProdMixed Multi 1.001* 0.998*[1.66] [1.66]
ShareRD Exp 0.070 0.061[0.61] [0.53]
LAge -0.713*** -0.706***[-3.29] [-3.22]
LGrossInvExpXEmpl 0.138 0.121[1.43] [1.15]
LTurnover 0.466*** 0.467***[3.41] [3.42]
LSalesShareExp 0.009 0.008[0.08] [0.08]
Entropy -2.347* -2.436*[-1.72] [-1.73]
Num2km -1.030** -1.021**[-2.19] [-2.17]
Num2 15km 0.400* 0.404*[1.80] [1.82]
Num15 22km -0.476* -0.474*[-1.86] [-1.86]
Sectoral dummies Incl. Incl.Geographical dummies Incl. Incl.Cons 8.214 8.505
[1.17] [1.15]ρ 0.92Wald test of ρ = 0 χ2[1]=102.385***Observations 140
Robust standard errors and degrees of freedom are in parentheses.
* p < 0.10, ** p < 0.05, *** p < 0.01
25

References
Abraham, K. and S. Taylor (1996). Firms’ use of outside contractors: theoryand evidence. Journal of Labor Economics 14 (3), 394–424.
Aghion, P. and J. Tirole (1997). Formal and real authority in organizations.Journal of Political Economy 105 (1), 1–29.
Ai, C. and E. C. Norton (2003). Interaction terms in logit and probit models.Economics letters 80 (1), 123–129.
Anink, D., C. Boonstra, and J. Mak (1996). Handbook of sustainable build-ing: an environmental preference method for selection of materials for use inconstruction and refurbishment. Earthscan.
Argyres, N. S. and J. P. Liebeskind (1999). Contractual commitments, bargain-ing power, and governance inseparability: Incorporating history into transac-tion cost theory. Academy of Management Review 24 (1), 49–63.
Beaudry, C. and A. Schiffauerova (2009). Who’s right, Marshall or Jacobs? Thelocalization versus urbanization debate. Research Policy 38 (2), 318–337.
Becattini, G. (1990). The Marshallian industrial district as a socio-economicnotion. In G. Pyke, G. Becattini, and S. W (Eds.), Industrial Districts andInter-firm Co-operation in Italy. Geneva: International Institute for LabourStudies.
Becattini, G. (2002). From marshalls to the italian industrial districts. a briefcritical reconstruction. In Complexity and Industrial Clusters, pp. 83–106.Springer.
Boschma, R. (2005). Proximity and innovation: a critical assessment. RegionalStudies 39 (1), 61–74.
Brunnermeier, S. B. and A. Levinson (2004). Examining the evidence on envi-ronmental regulations and industry location. The Journal of Environment &Development 13 (1), 6–41.
Brusco, S. (1982). The emilian model: productive decentralisation and socialintegration. Cambridge journal of economics 6 (2), 167–184.
Buis, M. L. (2010). Stata tip 87: Interpretation of interactions in non-linearmodels. The Stata Journal 10 (2), 305–308.
Cainelli, G. and D. Iacobucci (2010). Does spatial proximity matter? micro-evidence from italy. In R. Leoncini and N. D. Liso (Eds.), Internationaliza-tion, Technological Change and the Theory of the Firm. Routledge, London,forthcoming.
26

Cainelli, G., M. Mazzanti, and S. Montresor (2012). Environmental innovations,local networks and internationalization. Industry and Innovation 19 (8), 697–734.
Carrillo-Hermosilla, J., P. Del Rıo, and T. Konnola (2010). Diversity of eco-innovations: Reflections from selected case studies. Journal of Cleaner Pro-duction 18 (10), 1073–1083.
Cetindamar, D. (2007). Corporate social responsibility practices and environ-mentally responsible behavior: The case of the United Nations Global Com-pact. Journal of Business Ethics 76 (2), 163–176.
Chesbrough, H. W. (2003). Open Innovation: The New Imperative for Creatingand Profiting from Technology. Harvard Business Press.
Christmann, P. and G. Taylor (2001). Globalization and the environment: De-terminants of firm self-regulation in China. Journal of International BusinessStudies 32 (3), 439–458.
Dasgupta, S., H. Hettige, and D. Wheeler (2000). What improves environmentalcompliance? Evidence from Mexican industry. Journal of EnvironmentalEconomics and Management 39 (1), 39–66.
De Marchi, V. (2012). Environmental innovation and R&D cooperation: Em-pirical evidence from Spanish manufacturing firms. Research Policy 41 (3),614–623.
De Marchi, V. and R. Grandinetti (2013). Knowledge strategies for environmen-tal innovations: the case of Italian manufacturing firms. Journal of KnowledgeManagement 17 (4), 5–5.
Duranton, G. and D. Puga (2001). Nursery cities: Urban diversity, processinnovation, and the life cycle of products. American Economic Review 91 (5),1454–1477.
Foss, N. (2000). The theory of the firm: an introduction to themes and contri-butions. In N. Foss (Ed.), The Theory of the Firm: Critical Perspectives inEconomic Organization. London: Routledge.
Frenken, K., F. Van Oort, and T. Verburg (2007a). Related variety, unrelatedvariety and regional economic growth. Regional Studies 41 (5), 685–697.
Frenken, K., F. Van Oort, and T. Verburg (2007b). Related variety, unrelatedvariety and regional economic growth. Regional studies 41 (5), 685–697.
Ghisetti, C., A. Marzucchi, and S. Montresor (2013). Does external knowl-edge affect environmental innovations? An empirical investigation of elevenEuropean countries. Working Paper 2013/01, INGENIO Working Paper.
Grossman, G. M. and E. Helpman (2002). Integration versus outsourcing inindustry equilibrium. The Quarterly Journal of Economics 117 (1), 85–120.
27

Grossman, S. J. and O. D. Hart (1986). The costs and benefits of ownership:A theory of vertical and lateral integration. The Journal of Political Econ-omy 94 (4), 691–719.
GSE (2012). Rapporto statistico 2012: Solare fotovoltaico. Technical report, Ge-store Servizi Energetici (GSE). Available at http://tinyurl.com/cesvh9g.
Hart, S. L. (1995). A natural-resource-based view of the firm. Academy ofManagement Review 20 (4), 986–1014.
Holl, A. (2008). Production subcontracting and location. Regional Science andUrban Economics 38 (3), 299–309.
Horbach, J. (2008). Determinants of environmental innovation: New evidencefrom German panel data sources. Research policy 37 (1), 163–173.
Horbach, J., C. Rammer, and K. Rennings (2012). Determinants of eco-innovations by type of environmental impact. The role of regulatorypush/pull, technology push and market pull. Ecological Economics 78, 112–122.
Jeppesen, T., J. A. List, and H. Folmer (2002). Environmental regulationsand new plant location decisions: Evidence from a meta-analysis. Journal ofRegional Science 42 (1), 19–49.
Kemp, R. and S. Pontoglio (2007). Workshop conclusions on typology andframework. Measuring Eco-innovation (MEI) Project. In R. Kemp andP. Pearson (Eds.), Final Report of the MEI Project Measuring Eco-innovation.UN-MERIT, Maastricht.
Langlois, R. N. (1992). Transaction-cost economics in real time. Industrial andCorporate Change 1 (1), 99–127.
Lankford, W. M. and F. Parsa (1999). Outsourcing: a primer. ManagementDecision 37 (4), 310–316.
Leonard-Barton, D. (1992). Core capabilities and core rigidities: A paradox inmanaging new product development. Strategic Management Journal 13 (S1),111–125.
Levinson, A. and M. S. Taylor (2008). Unmasking the pollution heaven effect.International Economic Review 49 (1), 223–254.
Levinthal, D. A. and J. G. March (1993). The myopia of learning. StrategicManagement Journal 14 (S2), 95–112.
Mahnke, V. (2001). The process of vertical dis-integration: an evolutionaryperspective on outsourcing. Journal of Management and Governance 5, 353–379.
28

Mairesse, J. and P. Mohnen (2010). Using innovations surveys for econometricanalysis. Technical report, National Bureau of Economic Research.
Malerba, F. and L. Orsenigo (1993). Technological regimes and firm bebavior.Industrial and Corporate Change 2 (1), 45–71.
Mani, M. and D. Wheeler (1998). In search of pollution havens? Dirty in-dustry in the world economy, 1960 to 1995. The Journal of Environment &Development 7 (3), 215–247.
Mazzanti, M., S. Montresor, and P. Pini (2007). Outsourcing and innovation:Evidence for a local production system of Emilia-Romagna. Innovation: Man-agement, Policy & Practice 10 (3-4), 324–342.
Mazzanti, M., S. Montresor, and P. Pini (2009). What drives (or hampers) out-sourcing? evidence for a local production system in emilia romagna. Industryand Innovation 16 (3), 331–365.
Mazzanti, M. and R. Zoboli (2009). Embedding environmental innovation in lo-cal production systems: SME strategies, networking and industrial relations:evidence on innovation drivers in industrial districts. International Review ofApplied Economics 23 (2), 169–195.
McIvor, R. (2005). The Outsourcing Process: Strategies for Evaluation andManagement. Cambridge: Cambridge University Press.
Olsen, K. B. (2006). Productivity impacts of offshoring and outsourcing: Areview. OECD Technology and Industry Working Papers (2006/1).
Putnam, R. D., R. Leonardi, and R. Y. Nanetti (1994). Making democracywork: Civic traditions in modern Italy. Princeton university press.
Rehfeld, K.-M., K. Rennings, and A. Ziegler (2007). Integrated product policyand environmental product innovations: an empirical analysis. EcologicalEconomics 61 (1), 91–100.
Rennings, K., A. Ziegler, K. Ankele, and E. Hoffmann (2006). The influence ofdifferent characteristics of the EU environmental management and auditingscheme on technical environmental innovations and economic performance.Ecological Economics 57 (1), 45–59.
Robertson, P. L. and R. N. Langlois (1995). Innovation, networks, and verticalintegration. Research Policy 24 (4), 543–562.
Russo, M. V. and P. A. Fouts (1997). A resource-based perspective on corpo-rate environmental performance and profitability. Academy of ManagementJournal 40 (3), 534–559.
Taymaz, E. and Y. Kilicaslan (2005). Determinants of subcontracting and re-gional development: an empirical study on Turkish textile and engineeringindustries. Regional Studies 39 (5), 633–645.
29

Teece, D. J. (1980). Economies of scope and the scope of the enterprise. Journalof Economic Behavior & Organization 1 (3), 223–247.
Teece, D. J. (1986). Profiting from technological innovation: Implications forintegration, collaboration, licensing and public policy. Research Policy 15 (6),285–305.
UNIDO (2013). UNIDO Green Industry. Policies for supporting Green Industry.Technical Report 2013/01, United Nations, Industrial Development Organi-zation.
Wagner, U. J. and C. D. Timmins (2009). Agglomeration effects in foreign directinvestment and the pollution haven hypothesis. Environmental and ResourceEconomics 43 (2), 231–256.
Williamson, O. E. (1975). Markets and Hierarchies. New York: Free Press.
Windrum, P., A. Reinstaller, and C. Bull (2009). The outsourcing productivityparadox: total outsourcing, organisational innovation, and long run produc-tivity growth. Journal of Evolutionary Economics 19 (2), 197–229.
30