enrollment plans and demographic update nate johnson executive director, planning and analysis march...
TRANSCRIPT

Enrollment Plans and Demographic Update
Nate JohnsonExecutive Director, Planning and Analysis
March 27, 2008

Enrollment Plans: Balancing Capacity and Demand
2
• Population projections for Florida have been revised downward
• Demand for SUS enrollment will continue to grow, but not as fast
• The impact of changing race/ethnic mix in Florida is uncertain
• Funded capacity is the limiting constraint on growth
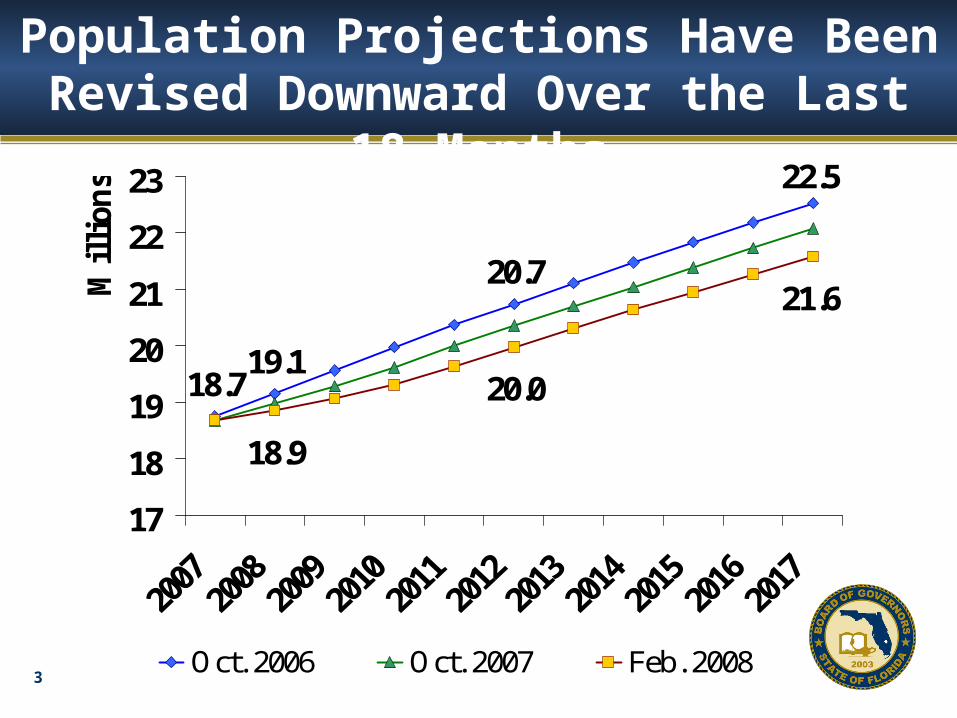
Population Projections Have Been Revised Downward Over the Last
18 Months
3
18.719.1
22.5
20.7
18.9
21.6
20.0
17
18
19
20
21
22
23
Million
s
Oct. 2006 Oct. 2007 Feb. 2008

Impact on Enrollment Demand
4
• ~ 3.8% lower growth than originally predicted for 2012
• ~ 4.4% lower growth by 2017

Moderate Growth Still Likely in Key Feeder Populations
5
Projected Growth in Key Populations
90%
100%
110%
120%New BrightFutures Students
Public HSGraduates
Lower (18-19)
Upper (20-24)
Beg Grad (20-34)
Adv Grad (25-44)

School District Enrollments Suggest Varying Impacts by
Region
6
Shrinking K-12 enrollments, forecasts down: Dade, Broward, Orange, Palm Beach, Duval, Pinellas, Seminole, Volusia, Collier, Escambia
Still steady or growing K-12 but not as fast as forecast: Hillsborough, Lee, Pasco, Osceola, Sarasota, Manatee, Lake
Steady or growing K-12, forecasts steady or up: Polk, St. Lucie, Many Rural/Suburban N. Florida Counties

Projected Enrollment Based on Revised Population Projections
7
2007 2012 2027
Lower 94,000
96,000
110,00
0
Upper
139,00
0
149,00
0
164,00
0
Beginning Grad 43,000
46,000
52,000
Advanced Grad 12,000
13,000
15,000
Unclassified 13,000
14,000
16,000
Total
301,00
0
317,00
0
357,00
0

Some Higher Education Analysts Suggest Race/Ethnicity Will Have
Major Impact
8
Ratios of 2007 SUS Enrollment to 2007 Florida Black/Hispanic Population
Total Black HispanicLower Division Students per
1000 18-19 Year Olds
196
149 169 Upper Division Students per
1000 20-24 Year Olds
116
73 92 Beginning Grad Students
Per 1000 20-34 Year Olds
12
7 6
Advanced Grad Students Per 1000 25-44 Year Olds
3
1 1
Unclassified Students per 1000 20-44 Year Olds
2
1 2
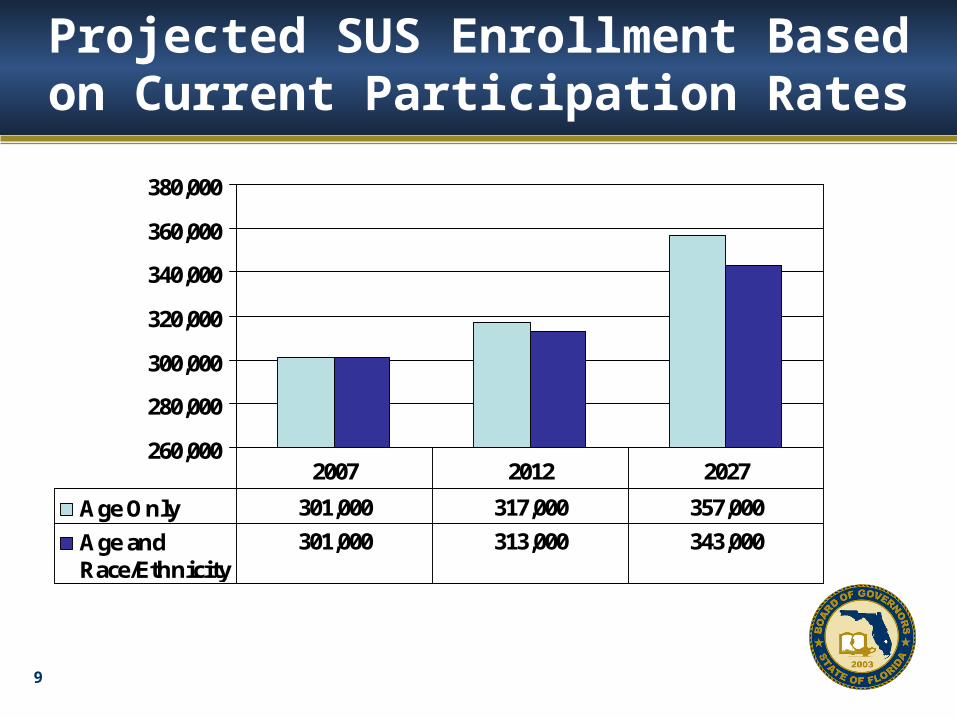
Projected SUS Enrollment Based on Current Participation Rates
9
260,000
280,000
300,000
320,000
340,000
360,000
380,000
Age Only 301,000 317,000 357,000
Age andRace/Ethnicity
301,000 313,000 343,000
2007 2012 2027

Demographics Alone May Not Determine Growth Rates
10
237,000 220,000
301,000
What Would2007 Enrollmentbe at 1990 Age
GroupParticipation
Rates?
What Would2007 Enrollment
be at 1990ParticipationRates by AgeGroup and
Race/Ethnicity?
Actual Fall 2007Enrollment
Other Factors Could Drive Demand Higher
11
• Improvements in K-14 pipeline
• Increasing proportion of HS graduates with Bright Futures
• Weak economy (student demand for graduate and professional programs)
• Strong economy (need for highly educated population)
• Improvements in retention rates– 2/3 of enrollments are retained students– 1/3 are new each year

Funded Capacity is the Limiting Constraint
12
• Assuming . . .
– 0% state funds increases
– 3% inflation
– 7% tuition increases
• Enrollment would have to decline 1% annually to maintain constant dollar funding per student

Amended Enrollment Plan for 2008-09
13
• Assumes no funding available for growth in the short term
• Universities expected to manage enrollments based on that assumption
• Can be revisited as situation warrants
• Long-term approach to growth funding to be recommended as part of appropriate and predictable funding